UNITED STATES
SECURITIES AND EXCHANGE COMMISSION
Washington, D.C. 20549
FORM N-CSR
CERTIFIED SHAREHOLDER REPORT OF REGISTERED
MANAGEMENT INVESTMENT COMPANIES
Investment Company Act file number: 811-04041
GE INVESTMENTS FUNDS, INC.
(Exact name of registrant as specified in charter)
1600 Summer Street
Stamford, Connecticut 06905
(Address of principal executive offices)(Zip code)
GE Asset Management
1600 Summer Street
Stamford, Connecticut 06905
(Name and Address of Agent for Service)
Registrant’s telephone number, including area code: 800-242-0134
Date of fiscal year end: 12/31
Date of reporting period: 12/31/13
| Item 1. | Reports to Stockholders. |
GE Investments Funds, Inc.
U.S. Equity Fund
Annual Report
December 31, 2013

GE Investments Funds, Inc.
| | |
| |
| U.S. Equity Fund | | Contents |
This report is prepared for Policyholders of certain variable contracts and may be distributed to others only if preceded or accompanied by the variable contract’s current prospectus and the current prospectus and/or summary prospectus of the Fund available for investments thereunder.
| | |
| Notes to Performance | | December 31, 2013 (Unaudited) |
The information provided on the performance pages relates to the GE Investments U.S. Equity Fund (the “Fund”).
Total return performance shown in this report for the Fund takes into account changes in share price and assumes reinvestment of dividends and capital gains distributions, if any. Total returns shown are net of Fund fees and expenses but do not reflect fees and charges associated with the variable contracts such as administrative fees, account charges and surrender charges, which, if reflected, would reduce the Fund’s total returns for all periods shown.
The performance data quoted represents past performance; past performance does not guarantee future results. Investment return and principal value will fluctuate so your shares, when redeemed, may be worth more or less than their original cost. Current performance may be higher or lower than the performance data quoted. Periods less than one year are not annualized. Please call 800-493-3042 or visit the Fund’s website at http://www.geam.com for the most recent month-end performance data.
An investment in the Fund is not a deposit of any bank and is not insured or guaranteed by the Federal Deposit Insurance Corporation (FDIC) or any other government agency. An investment in the Fund is subject to risk, including possible loss of principal invested.
The Standard & Poor’s (“S&P”) 500® Composite Price Index of stocks (“S&P 500 Index”) is an unmanaged, market
capitalization-weighted index of stocks of 500 large U.S. companies, which is widely used as a measure of large-cap U.S. stock market performance. The results shown for the foregoing index assume the reinvestment of net dividends or interest and do not reflect fees, expenses, or taxes. As such, the index returns do not reflect the actual cost of investing in the instruments that comprise the index.
The peer universe of the underlying annuity funds used for the peer group average annual total return calculation is based on a blend of Morningstar peer categories, as shown. Morningstar is an independent mutual fund rating service. A Fund’s performance may be compared to or ranked within a universe of mutual funds with investment objectives and policies similar but not necessarily identical to that of the Fund.
©2014 Morningstar, Inc. All Rights Reserved. The Morningstar information contained herein: (1) is proprietary to Morningstar and/or its content providers; (2) may not be copied or distributed; and (3) is not warranted to be accurate, complete or timely. Neither Morningstar nor its content providers are responsible for any damage or losses relating from any use of this information. Past performance is no guarantee of future results.
The views expressed in this document reflect our judgment as of the publication date and are subject to change at any time without notice.
GE Investment Distributors, Inc., Member of FINRA & SIPC, is the principal underwriter and distributor of the GE Investments Funds, Inc. and a wholly owned subsidiary of GE Asset Management Incorporated, the investment adviser of the Fund.
1
| | |
| U.S. Equity Fund | | (Unaudited) |

David B. Carlson
Chief Investment Officer — U.S. Equities

Stephen V. Gelhaus
Senior Vice President

Paul C. Reinhardt
Senior Vice President
The U.S. Equity Fund is managed by a team of portfolio managers that includes David B. Carlson, Stephen V. Gelhaus, and Paul C. Reinhardt. Each of the foregoing portfolio managers manages one of three sub-portfolios, which comprise the Fund. A sub-portfolio refers to the portion of the Fund’s assets that are allocated to, and managed by, a particular portfolio manager on the Fund’s portfolio management team. The three sub-portfolios are managed independently of each other and the portfolio managers have full discretion over their sub-portfolio. However, as lead portfolio manager for the Fund, Mr. Carlson is vested with the authority to adjust the allocation of assets to each sub-portfolio.
David B. Carlson is Chief Investment Officer — U.S. Equities at GE Asset Management. He manages the overall U.S. equity investments for GE Asset Management. Mr. Carlson has served as a portfolio manager for the U.S. Equity Fund since May 2011. Mr. Carlson joined GE Asset Management in 1982 as a securities analyst for investment operations. He became a Vice President for Mutual Fund Portfolios in 1987, a Senior Vice President in 1989 and an Executive Vice President in 2003.
Stephen V. Gelhaus is a Senior Vice President of GE Asset Management. He has been a member of the portfolio management team for the Fund since January 2002. Mr. Gelhaus joined GE Asset Management in June 1991 and was a research analyst in the U.S. Equities group from 1995 through 2001.
Paul C. Reinhardt is a Senior Vice President of GE Asset Management. He has been a portfolio manager for the Fund since January 2001. Mr. Reinhardt joined GE Asset Management in 1982 as an equity analyst and has been a portfolio manager since 1987.
| Q. | How did the GE Investments U.S. Equity Fund perform compared to its benchmark and Morningstar peer group for the twelve-month period ended December 31, 2013? |
| A. | For the twelve-month period ended December 31, 2013, the GE Investments U.S. Equity Fund returned 33.91%. The S&P 500® Index (S&P 500), the Fund’s benchmark, returned 32.39% and the Fund’s Morningstar peer group of 362 U.S. Insurance Large Growth Funds returned an average of 35.26% over the same period. |
| Q. | What market factors affected the Fund’s performance? |
| A. | As economic data — from manufacturing to employment, housing, autos and consumer confidence — improved, the S&P 500 rose 32.4% in 2013, achieving its best single-year total return since 1997. The massive advance astonished many investors, as the size of the market rally dwarfed the pace of single-digit GDP and corporate earnings growth. In other words, the market rally was fueled by expanding valuations. At the beginning of 2013 S&P 500 stocks sold at 13x forward-earnings, and ended the year at a forward P/E of 15.4x — neither particularly cheap nor expensive by historical standards. The market’s ability to climb higher as the Federal Reserve announced its intention to taper government debt purchases, signaled investor confidence that growth could be sustained absent heroic Fed intervention. As economic confidence improved, the S&P 500 cyclical sectors outperformed, led by consumer discretionary (+43%), health care (+41.5%) led by strength in biotechnology stocks) and industrials (+41%). The higher-yielding, defensive stocks lagged on concerns that rising bond yields could cut demand for equity income in sectors like telecommunications (+11.5%) and utilities (+13%). The energy sector also underperformed as commodity prices stalled. During the year, small cap stocks outperformed large cap stocks, while the growth style of investing generally beat value. |
2

| Q. | What were the primary drivers of Fund performance? |
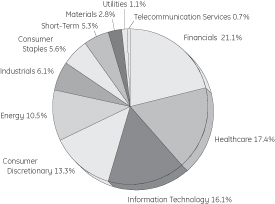
| A. | Stock selection was strong across the Fund, and it was well positioned to take advantage of the cyclical leadership. The Fund benefited both from underweight exposure to the defensive consumer staples, telecommunications and utilities sectors, as well as positive overweights relative to the S&P 500 financials, health care and consumer discretionary sectors. |
| | Rising interest rates and more robust capital markets activity in part led to outperformance among the Fund’s financials sector holdings, with the greatest contributions coming from capital markets companies enjoying higher volumes of business and better profit prospects. Asset managers saw increased fund flows, while life insurance companies got a lift from higher interest income and stronger pricing trends. The Fund’s bank and consumer finance holdings rallied amid rising interest rates, a relatively benign regulatory environment and improving credit trends. Underweighting REITs as investor appetite for equity yield declined also helped the Fund’s performance. |
| | The Fund’s consumer staples holdings significantly outperformed the S&P 500 benchmark sector and the market. The Fund holds several attractively valued companies that have outperformed modest earnings growth expectations, while avoiding richly-valued consumer stocks also bolstered the Fund’s relative performance. The Fund successfully navigated a volatile environment for commodities during the year, investing in chemicals companies that benefited from falling input costs, while underweighting struggling integrated oil companies as energy prices ailed. |
| | In an otherwise strong year, there were some key detractors to performance. As a group, the technology sector holdings trimmed the Fund’s relative returns. In general, companies perceived as “newer technology” outperformed, including internet software and cloud services companies. While the Fund held some internet search and ecommerce companies, it also held several technology stocks that lagged in the relatively defensive communications equipment, software and data storage industries. These “steady growers” mitigated the positive effect of owning some of the “newer technology” names. While the Fund was generally positioned to benefit from an improving economy, it was underweighted in the industrials sector, which weighed on returns. |
| Q. | Were there any significant changes in the Fund during the period? |
| A. | During the twelve-month period, the Fund reversed its overweight exposure to the information technology sector and was underweight by December 31, 2013. As several technology holdings suffered from increased competitive dynamics and investor concerns about obsolescence risk, we reduced positions leveraged to the declining personal computer market, and those suffering from anemic enterprise spending. We took profits in the consumer discretionary and industrials sectors. Coupled with the reduced technology exposure, the Fund softened the cyclical tilt it had in the beginning of the period. |
| | At year-end 2013, the Fund’s largest overweight exposures were within the financials and health care sectors. We continued to build the Fund’s health care sector holdings with several new positions and increased positions of other holdings in which we have conviction. We funded these purchases in part with proceeds from eliminations of other health care holdings with, according to our analysis, lesser appreciation potential. During the period we initiated some new positions in insurance and capital markets companies and bolstered the Fund’s position in other financials holdings. Despite these changes in positioning, the Fund maintained its bottom-up stock selection approach with a focus on the long-term investment horizon. We believe the Fund is well-positioned going into the next year. |
3
| | |
| U.S. Equity Fund | | (Unaudited) |
Understanding Your Fund’s Expenses
As a shareholder of the Fund you incur ongoing costs. Ongoing costs include portfolio management fees, professional fees, administrative fees and other Fund expenses. The following example is intended to help you understand your ongoing costs (in dollars) of investing in the Fund and to compare these costs with the ongoing costs of investing in other mutual funds.
To illustrate these ongoing costs, we have provided an example and calculated the expenses paid by investors in the Fund during the period. The information in the following table is based on an investment of $1,000, which is invested at the beginning of the period and held for the entire six-month period ended December 31, 2013.
Actual Expenses
The first section of the table provides information about actual account values and actual expenses. You may use the information in this section, together with the amount you invested, to estimate the expenses that you paid over the period. To do so, simply divide your account value by $1,000 (for example, an $8,600 account value divided by $1,000 = 8.6), then multiply the result by the number given under the heading “Expenses paid during the period” to estimate the expenses you paid on your account during the period.
Hypothetical Example for Comparison Purposes
The second section of the table provides information about hypothetical account values and hypothetical expenses based on the Fund’s actual expense ratio and an assumed rate of return of 5% per year before expenses, which is not the Fund’s actual return. The hypothetical account values and expenses may not be used to estimate the actual ending account balance or expenses you paid for the period. You may use this information to compare the ongoing costs of investing in the Fund and other funds. To do so, compare this 5% hypothetical example with the 5% hypothetical examples that appear in the shareholders reports of other funds.
Please note that the expenses shown in the table are meant to highlight and help you compare ongoing costs only and do not reflect transaction costs, such as sales charges or redemption fees, if any. Therefore, the second section of the table is useful in comparing ongoing costs only, and will not help you determine the relative total costs of owning different funds. Additionally, the expenses shown do not reflect the fees or charges associated with variable contracts through which shares of the Fund are offered.
July 1, 2013 – December 31, 2013
| | | | | | | | | | | | |
| | | Account value at the
beginning of the period ($) | | | Account value at the
end of the period ($) | | | Expenses paid
during the period ($)* |
Actual Fund Return | | | 1,000.00 | | | | 1,163.00 | | | 4.20 |
Hypothetical 5% Return (2.5% for the period) | | | 1,000.00 | | | | 1,021.32 | | | 3.92 |
| * | Expenses are equal to the Fund’s annualized net expense ratio of 0.77% (for the period July 1, 2013 - December 31, 2013), multiplied by the average account value over the period, multiplied by 184/365 (to reflect the one-half year period). |
4
| | |
| U.S. Equity Fund | | (Unaudited) |
A mutual fund designed for investors who seek long-term growth of capital. The Fund seeks to achieve its objective by investing at least 80% of its net assets under normal circumstances in equity securities of U.S. companies, such as common and preferred stocks.
| | | | | | | | | | |
Morningstar Performance Comparison |
Based on average annual returns for periods ended 12/31/13
| | | | | | | | | | | | | | | | | | | | |
| | | | | One Year | | Five Year | | Ten Year |
Number of funds in peer group | | | | | | 362 | | | | | 341 | | | | | 292 | |
Peer group average annual total return | | | | | | 35.26% | | | | | 19.57% | | | | | 7.35% | |
Morningstar Category in peer group: U.S. Insurance Large Growth | |
as a % of Fair Value of $34,274 (in thousands) on December 31, 2013 (b)(c)
as of December 31, 2013 (as a % of Fair Value) (b)(c)
| | | | | | |
Comcast Corp., Class A | | | 2.56% | |
EMC Corp. | | | 2.46% | |
Express Scripts Holding Co. | | | 2.38% | |
Pfizer Inc. | | | 2.34% | |
Amgen Inc. | | | 2.21% | |
QUALCOMM Inc. | | | 2.19% | |
Citigroup Inc. | | | 2.04% | |
Apple Inc. | | | 2.00% | |
Schlumberger Ltd. | | | 1.84% | |
Chevron Corp. | | | 1.82% | |
|
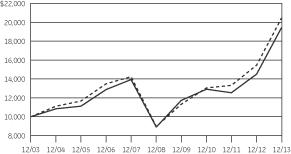
| Change in Value of a $10,000 Investment(a) |
Class 1 Shares

| | | | | | | | | | |
| Average Annual Total Return |
for the Periods Ended December 31, 2013
Class 1 Shares (Inception date: 1/3/95)
| | | | | | | | | | | | | | | | | | | | |
| | | One Year | | Five Year | | Ten
Year | | Ending Value of a
$10,000 Investment (a) |
U.S. Equity Fund | | | | 33.91% | | | | | 16.92% | | | | | 6.87% | | | | $ | 19,432 | |
S&P 500 Index | | | | 32.39% | | | | | 17.94% | | | | | 7.40% | | | | $ | 20,429 | |
| (a) | Ending value of a $10,000 investment for the ten-year period or since inception, whichever is less. |
| (b) | The securities information regarding holdings, allocations and other characteristics is presented to illustrate examples of securities that the Fund has bought and the diversity of areas in which the Fund may invest as of a particular date. It may not be representative of the Fund’s current or future investments and should not be construed as a recommendation to purchase or sell a particular security. |
| (c) | Fair Value basis is inclusive of short-term investment in GE Institutional Money Market Fund Investment Class. |
See Notes to Performance on page 1 for further information, including an explanation of Morningstar peer categories.
Past performance does not predict future performance. The performance shown in the graph and table does not reflect the deduction of taxes that a shareholder would pay on Fund distributions or the redemption of Fund shares and does not reflect the fees or charges that would be associated with variable contracts through which shares of the Fund are offered.
5
U.S. Equity Fund
| | |
| Schedule of Investments | | December 31, 2013 |
| | | | | | | | | | |
| | | |
| | | Number of
Shares | | | Fair Value | | | |
| | | | | | | | | | |
Common Stock — 93.3%† | | | | | | | | | | |
| |
Advertising — 0.3% | | | |
| | | |
The Interpublic Group of Companies Inc. | | | 5,086 | | | $ | 90,023 | | | |
| |
Aerospace & Defense — 1.9% | | | |
| | | |
General Dynamics Corp. | | | 318 | | | | 30,385 | | | |
Honeywell International Inc. | | | 4,896 | | | | 447,347 | | | |
The Boeing Co. | | | 1,351 | | | | 184,398 | | | |
| | | | | | | 662,130 | | | |
| |
Agricultural Products — 1.0% | | | |
| | | |
Archer-Daniels-Midland Co. | | | 7,630 | | | | 331,142 | | | |
| |
Air Freight & Logistics — 0.8% | | | |
| | | |
United Parcel Service Inc. | | | 2,639 | | | | 277,306 | | | |
| |
Airlines — 0.2% | | | |
| | | |
Delta Air Lines Inc. | | | 2,988 | | | | 82,080 | | | |
| |
Application Software — 0.7% | | | |
| | | |
Intuit Inc. | | | 3,115 | | | | 237,737 | | | |
| |
Asset Management & Custody Banks —3.9% | | | |
| | | |
Ameriprise Financial Inc. | | | 4,816 | | | | 554,081 | | | |
Invesco Ltd. | | | 13,145 | | | | 478,478 | | | |
State Street Corp. | | | 4,323 | | | | 317,265 | | | (a) |
| | | | | | | 1,349,824 | | | |
| |
Auto Parts & Equipment — 0.5% | | | |
| | | |
TRW Automotive Holdings Corp. | | | 2,146 | | | | 159,641 | | | (b) |
| |
Automobile Manufacturers — 1.3% | | | |
| | | |
Ford Motor Co. | | | 21,776 | | | | 336,003 | | | |
General Motors Co. | | | 2,702 | | | | 110,431 | | | (b) |
| | | | | | | 446,434 | | | |
| |
Automotive Retail — 0.6% | | | |
AutoZone Inc. | | | 461 | | | | 220,330 | | | (b) |
| |
Biotechnology — 3.9% | | | |
| | | |
Alexion Pharmaceuticals Inc. | | | 890 | | | | 118,423 | | | (b) |
Amgen Inc. | | | 6,628 | | | | 756,653 | | | |
Gilead Sciences Inc. | | | 5,945 | | | | 446,767 | | | (b) |
| | | | | | | 1,321,843 | | | |
| |
Broadcasting — 0.9% | | | |
| | | |
CBS Corp. | | | 1,590 | | | | 101,347 | | | |
Discovery Communications Inc. | | | 2,448 | | | | 205,289 | | | (b) |
| | | | | | | 306,636 | | | |
| | | | | | | | | | |
| | | |
| | | Number of
Shares | | | Fair Value | | | |
| |
Cable & Satellite — 3.5% | | | |
| | | |
Comcast Corp., Class A | | | 11,762 | | | $ | 611,212 | | | |
Comcast Corp., Special Class A | | | 5,341 | | | | 266,409 | | | |
Liberty Global PLC | | | 3,974 | | | | 335,088 | | | (b) |
| | | | | | | 1,212,709 | | | |
| |
Casinos & Gaming — 0.7% | | | |
| | | |
Las Vegas Sands Corp. | | | 2,861 | | | | 225,647 | | | |
| |
Commodity Chemicals — 1.5% | | | |
| | | |
LyondellBasell Industries N.V. | | | 6,199 | | | | 497,656 | | | |
| |
Communications Equipment — 3.8% | | | |
| | | |
Cisco Systems Inc. | | | 24,319 | | | | 545,962 | | | |
QUALCOMM Inc. | | | 10,125 | | | | 751,781 | | | |
| | | | | | | 1,297,743 | | | |
| |
Computer Hardware — 2.9% | | | |
| | | |
Apple Inc. | | | 1,224 | | | | 686,799 | | | (c) |
Hewlett-Packard Co. | | | 10,332 | | | | 289,089 | | | |
| | | | | | | 975,888 | | | |
| |
Computer Storage & Peripherals — 2.5% | | | |
| | | |
EMC Corp. | | | 33,539 | | | | 843,506 | | | |
| |
Construction & Farm Machinery — 0.1% | | | |
| | | |
Cummins Inc. | | | 254 | | | | 35,806 | | | |
| |
Consumer Finance — 1.2% | | | |
| | | |
American Express Co. | | | 4,610 | | | | 418,265 | | | |
| |
Data Processing & Outsourced Services — 0.9% | | | |
| | | |
Visa Inc. | | | 1,431 | | | | 318,655 | | | |
| |
Department Stores — 0.4% | | | |
| | | |
Macy’s Inc. | | | 2,384 | | | | 127,306 | | | |
| |
Diversified Financial Services — 5.9% | | | |
| | | |
Bank of America Corp. | | | 13,193 | | | | 205,415 | | | |
Citigroup Inc. | | | 13,431 | | | | 699,890 | | | |
JPMorgan Chase & Co. | | | 9,775 | | | | 571,642 | | | |
Wells Fargo & Co. | | | 12,176 | | | | 552,790 | | | |
| | | | | | | 2,029,737 | | | |
| |
Drug Retail — 0.8% | | | |
| | | |
CVS Caremark Corp. | | | 3,926 | | | | 280,984 | | | |
| |
Electric Utilities — 0.4% | | | |
| | | |
NextEra Energy Inc. | | | 1,431 | | | | 122,522 | | | |
| |
Electrical Components & Equipment — 0.3% | | | |
| | | |
Eaton Corp. PLC | | | 1,351 | | | | 102,838 | | | |
See Notes to Schedules of Investments and Notes to Financial Statements.
6
U.S. Equity Fund
| | |
| Schedule of Investments | | December 31, 2013 |
| | | | | | | | | | |
| | | |
| | | Number of
Shares | | | Fair Value | | | |
| |
Fertilizers & Agricultural Chemicals — 1.1% | | | |
| | | |
Monsanto Co. | | | 3,338 | | | $ | 389,044 | | | |
| |
General Merchandise Stores — 0.5% | | | |
| | | |
Dollar General Corp. | | | 2,702 | | | | 162,985 | | | (b) |
| |
Healthcare Distributors — 0.5% | | | |
| | | |
Cardinal Health Inc. | | | 2,639 | | | | 176,312 | | | |
| |
Healthcare Equipment — 2.3% | | | |
| | | |
Abbott Laboratories | | | 3,815 | | | | 146,229 | | | |
Covidien PLC | | | 8,011 | | | | 545,549 | | | |
Medtronic Inc. | | | 252 | | | | 14,462 | | | |
Stryker Corp. | | | 954 | | | | 71,684 | | | |
| | | | | | | 777,924 | | | |
| |
Healthcare Services — 2.4% | | | |
| | | |
Express Scripts Holding Co. | | | 11,635 | | | | 817,242 | | | (b) |
| |
Healthcare Supplies — 0.5% | | | |
| | | |
DENTSPLY International Inc. | | | 3,656 | | | | 177,243 | | | |
| |
Home Improvement Retail — 1.3% | | | |
| | | |
Lowe’s Companies Inc. | | | 9,268 | | | | 459,229 | | | |
| |
Household Products — 0.3% | | | |
| | | |
Energizer Holdings Inc. | | | 795 | | | | 86,051 | | | |
| |
Independent Power Producers & Energy Traders — 0.7% | | | |
| | | |
AES Corp. | | | 7,153 | | | | 103,790 | | | |
Calpine Corp. | | | 3,179 | | | | 62,022 | | | (b) |
NRG Energy Inc. | | | 2,702 | | | | 77,602 | | | |
| | | | | | | 243,414 | | | |
| |
Industrial Machinery — 0.9% | | | |
| | | |
Dover Corp. | | | 3,338 | | | | 322,250 | | | |
| |
Integrated Oil & Gas — 5.1% | | | |
| | | |
Chevron Corp. | | | 4,991 | | | | 623,426 | | | |
Exxon Mobil Corp. | | | 4,768 | | | | 482,522 | | | |
Hess Corp. | | | 2,305 | | | | 191,315 | | | |
Occidental Petroleum Corp. | | | 4,753 | | | | 452,010 | | | |
| | | | | | | 1,749,273 | | | |
| |
Integrated Telecommunication Services — 0.7% | | | |
| | | |
Verizon Communications Inc. | | | 4,896 | | | | 240,589 | | | |
| |
Internet Retail — 0.5% | | | |
| | | |
Amazon.com Inc. | | | 445 | | | | 177,462 | | | (b) |
| |
Internet Software & Services — 3.6% | | | |
| | | |
Baidu Inc. ADR | | | 2,130 | | | | 378,884 | | | (b) |
eBay Inc. | | | 5,881 | | | | 322,808 | | | (b) |
Google Inc. | | | 483 | | | | 541,303 | | | (b) |
| | | | | | | 1,242,995 | | | |
| | | | | | | | | | |
| | | |
| | | Number of
Shares | | | Fair Value | | | |
| |
Investment Banking & Brokerage — 1.4% | | | |
| | | |
The Charles Schwab Corp. | | | 4,133 | | | $ | 107,458 | | | |
The Goldman Sachs Group Inc. | | | 2,003 | | | | 355,052 | | | |
| | | | | | | 462,510 | | | |
| |
Life & Health Insurance — 0.4% | | | |
| | | |
Prudential Financial Inc. | | | 1,431 | | | | 131,967 | | | |
| |
Life Sciences Tools & Services — 0.3% | | | |
| | | |
PerkinElmer Inc. | | | 2,066 | | | | 85,181 | | | |
| |
Managed Healthcare — 1.0% | | | |
| | | |
UnitedHealth Group Inc. | | | 4,610 | | | | 347,133 | | | |
| |
Movies & Entertainment — 2.0% | | | |
| | | |
The Walt Disney Co. | | | 1,685 | | | | 128,734 | | | |
Time Warner Inc. | | | 8,027 | | | | 559,642 | | | |
| | | | | | | 688,376 | | | |
| | | |
Multi-Line Insurance — 2.8% | | | | | | | | | | |
| | | |
American International Group Inc. | | | 11,333 | | | | 578,549 | | | |
Hartford Financial Services Group Inc. | | | 10,808 | | | | 391,574 | | | |
| | | | | | | 970,123 | | | |
| | | |
Oil & Gas Equipment & Services — 3.8% | | | | | | | | | | |
| | | |
Cameron International Corp. | | | 2,623 | | | | 156,147 | | | (b) |
Halliburton Co. | | | 9,982 | | | | 506,587 | | | |
Schlumberger Ltd. | | | 6,994 | | | | 630,229 | | | |
| | | | | | | 1,292,963 | | | |
|
Oil & Gas Exploration & Production — 1.6% |
| | | |
Anadarko Petroleum Corp. | | | 4,546 | | | | 360,589 | | | |
Marathon Oil Corp. | | | 5,722 | | | | 201,986 | | | |
| | | | | | | 562,575 | | | |
| | | |
Packaged Foods & Meats — 0.8% | | | | | | | | | | |
| | | |
Mondelez International Inc. | | | 7,312 | | | | 258,114 | | | |
| | | |
Pharmaceuticals — 6.6% | | | | | | | | | | |
| | | |
Actavis PLC | | | 1,860 | | | | 312,480 | | | (b) |
GlaxoSmithKline PLC ADR | | | 1,669 | | | | 89,108 | | | |
Johnson & Johnson | | | 6,278 | | | | 575,002 | | | |
Merck & Company Inc. | | | 9,219 | | | | 461,411 | | | |
Pfizer Inc. | | | 26,227 | | | | 803,333 | | | |
| | | | | | | 2,241,334 | | | |
| | | |
Property & Casualty Insurance — 1.2% | | | | | | | | | | |
| | | |
ACE Ltd. | | | 3,862 | | | | 399,833 | | | |
| | | |
Railroads — 0.4% | | | | | | | | | | |
| | | |
CSX Corp. | | | 5,245 | | | | 150,899 | | | |
| | | |
Regional Banks — 1.1% | | | | | | | | | | |
| | | |
Regions Financial Corp. | | | 38,466 | | | | 380,429 | | | |
See Notes to Schedules of Investments and Notes to Financial Statements.
7
U.S. Equity Fund
| | |
| Schedule of Investments | | December 31, 2013 |
| | | | | | | | | | |
| | | |
| | | Number of
Shares | | | Fair Value | | | |
| | | |
Research & Consulting Services — 0.1% | | | | | | | | | | |
| | | |
Nielsen Holdings N.V. | | | 795 | | | $ | 36,483 | | | |
| | | |
Semiconductor Equipment — 0.2% | | | | | | | | | | |
| | | |
Applied Materials Inc. | | | 4,292 | | | | 75,925 | | | |
| | | |
Semiconductors — 0.3% | | | | | | | | | | |
| | | |
Analog Devices Inc. | | | 1,971 | | | | 100,383 | | | |
| | | |
Soft Drinks — 2.8% | | | | | | | | | | |
| | | |
Coca-Cola Enterprises Inc. | | | 8,583 | | | | 378,768 | | | |
PepsiCo Inc. | | | 7,105 | | | | 589,288 | | | |
| | | | | | | 968,056 | | | |
| | | |
Specialized Finance — 1.4% | | | | | | | | | | |
| | | |
CME Group Inc. | | | 4,610 | | | | 361,701 | | | |
McGraw Hill Financial Inc. | | | 1,526 | | | | 119,333 | | | |
| | | | | | | 481,034 | | | |
| | | |
Specialized REITs — 1.5% | | | | | | | | | | |
| | | |
American Tower Corp. | | | 6,358 | | | | 507,496 | | | |
| | | |
Specialty Chemicals — 0.2% | | | | | | | | | | |
| | | |
PPG Industries Inc. | | | 286 | | | | 54,243 | | | |
Rockwood Holdings Inc. | | | 318 | | | | 22,870 | | | |
| | | | | | | 77,113 | | | |
| | | |
Specialty Stores — 0.8% | | | | | | | | | | |
| | | |
Dick’s Sporting Goods Inc. | | | 4,927 | | | | 286,259 | | | |
| | | |
Systems Software — 1.3% | | | | | | | | | | |
| | | |
Microsoft Corp. | | | 2,782 | | | | 104,130 | | | |
Oracle Corp. | | | 8,742 | | | | 334,469 | | | |
| | | | | | | 438,599 | | | |
| | | |
Total Common Stock
(Cost $23,908,436) | | | | | | | 31,939,186 | | | |
| | | | | | | | | | |
Exchange Traded Funds — 1.5% | | | | | | | | | | |
Financial Select Sector SPDR Fund | | | 4,725 | | | | 103,288 | | | (d) |
Industrial Select Sector SPDR Fund | | | 8,072 | | | | 421,843 | | | (d) |
| | | |
Total Exchange Traded Funds
(Cost $315,165) | | | | | | | 525,131 | | | |
| | | |
Total Investments in Securities
(Cost $24,223,601) | | | | | | | 32,464,317 | | | |
| | | | | | | | | | |
| | | | | | | | |
| | | |
| | | | | Fair
Value | | | |
Short-Term Investments — 5.3% | | | | | | | | |
GE Institutional Money Market Fund — Investment Class 0.00%
(Cost $1,809,284) | | | | $ | 1,809,284 | | | (e,f) |
| | | |
Total Investments
(Cost $26,032,885) | | | | | 34,273,601 | | | |
| | | |
Liabilities in Excess of Other Assets,
net — (0.1)% | | | | | (39,258 | ) | | |
| | | | | | | | |
| | | |
NET ASSETS — 100.0% | | | | $ | 34,234,343 | | | |
| | | | | | | | |
| | | | | | | | |
Other Information: |
The Fund had the following long futures contracts open at December 31, 2013:
| | | | | | | | | | | | | | | | | | | | |
| Description | | Expiration
date | | Number
of
Contracts | | Current
Notional
Value | | Unrealized
Appreciation |
S&P 500 Emini
Index Futures | | March 2014 | | | | 12 | | | | $ | 1,104,660 | | | | $ | 40,016 | |
See Notes to Schedules of Investments and Notes to Financial Statements.
8
| | |
| Notes to Schedule of Investments | | December 31, 2013 |
The views expressed in this document reflect our judgment as of the publication date and are subject to change at any time without notice. The securities cited may not be representative of the Fund’s future investments and should not be construed as a recommendation to purchase or sell a particular security. See the Fund’s summary prospectus and statutory prospectus for complete descriptions of investment objectives, policies, risks and permissible investments.
| (a) | State Street Corp. is the parent company of State Street Bank & Trust Co., the Fund’s custodian and accounting agent. |
| (b) | Non-income producing security. |
| (c) | At December 31, 2013, all or a portion of this security was pledged to cover collateral requirements for futures. |
| (d) | Sponsored by SSgA Funds Management, Inc., an affiliate of State Street Bank & Trust Co., the Fund’s custodian and accounting agent. |
| (e) | Coupon amount represents effective yield. |
| (f) | GE Asset Management Incorporated (“GEAM”), the investment adviser of the Fund, also serves as investment adviser of the GE Institutional Money Market Fund. |
| † | Percentages are based on net assets as of December 31, 2013. |
Abbreviations:
| | |
| |
ADR | | American Depository Receipt |
| |
REIT | | Real Estate Investment Trust |
| |
SPDR | | Standard and Poor’s Depository Receipts |
9
Financial Highlights
Selected data based on a share outstanding throughout the fiscal years indicated
| | | | | | | | | | | | | | | | | | | | |
| | | 12/31/13 | | | 12/31/12 | | | 12/31/11 | | | 12/31/10 | | | 12/31/09 | |
| Inception date | | | — | | | | — | | | | — | | | | — | | | | 1/3/95 | |
Net asset value, beginning of period | | $ | 35.14 | | | $ | 30.74 | | | $ | 31.92 | | | $ | 29.23 | | | $ | 22.44 | |
Income/(loss) from investment operations: | | | | | | | | | | | | | | | | | | | | |
Net investment income | | | 0.42 | | | | 0.45 | | | | 0.24 | | | | 0.28 | * | | | 0.30 | |
Net realized and unrealized gains/(losses) on investments | | | 11.49 | | | | 4.40 | | | | (1.17) | | | | 2.72 | | | | 6.80 | |
Total income/(loss) from investment operations | | | 11.91 | | | | 4.85 | | | | (0.93) | | | | 3.00 | | | | 7.10 | |
Less distributions from: | | | | | | | | | | | | | | | | | | | | |
Net investment income | | | 0.42 | | | | 0.45 | | | | 0.25 | | | | 0.31 | | | | 0.31 | |
Total distributions | | | 0.42 | | | | 0.45 | | | | 0.25 | | | | 0.31 | | | | 0.31 | |
Net asset value, end of period | | $ | 46.63 | | | $ | 35.14 | | | $ | 30.74 | | | $ | 31.92 | | | $ | 29.23 | |
TOTAL RETURN(a) | | | 33.91% | | | | 15.80% | | | | (2.91)% | | | | 10.26% | | | | 31.63% | |
| | | | | |
RATIOS/SUPPLEMENTAL DATA: | | | | | | | | | | | | | | | | | | | | |
Net assets, end of period (in thousands) | | $ | 34,234 | | | $ | 29,924 | | | $ | 30,940 | | | $ | 38,305 | | | $ | 41,792 | |
Ratios to average net assets: | | | | | | | | | | | | | | | | | | | | |
Net investment income | | | 0.95% | | | | 1.22% | | | | 0.70% | | | | 0.96% | | | | 1.11% | |
Net expenses | | | 0.80% | (b) | | | 0.80% | (b) | | | 0.89% | (b) | | | 0.69% | (b) | | | 0.86% | (b) |
Gross expenses | | | 0.80% | | | | 0.81% | | | | 0.90% | | | | 0.69% | | | | 0.86% | |
Portfolio turnover rate | | | 40% | | | | 66% | | | | 39% | | | | 42% | | | | 46% | |
Notes to Financial Highlights
| (a) | Total returns are historical and assume changes in share price, reinvestment of dividends and capital gains distributions and do not include the effect of insurance contract charges. Past performance does not guarantee future results. |
| (b) | Reflects GEAM’s waiver of a portion of the Fund’s advisory and administrative fee (“management fee”) in an amount equal to the management fee earned by GEAM with respect to the Fund’s investment in an affiliated money market fund managed by GEAM. |
| * | Per share values have been calculated using the average share method. |
The accompanying Notes are an integral part of these financial statements.
10
| | | | |
Statement of Assets and Liabilities December 31, 2013 | | | |
| |
ASSETS | | | | |
Investments in securities, at Fair Value (cost $24,223,601) | | $ | 32,464,317 | |
Short-term affiliated investments (at amortized cost) | | | 1,809,284 | |
Cash | | | 24 | |
Income receivables | | | 40,309 | |
Receivable for fund shares sold | | | 421 | |
Variation margin receivable | | | 4,177 | |
Other assets | | | 256 | |
Total assets | | | 34,318,788 | |
| |
LIABILITIES | | | | |
Payable for fund shares redeemed | | | 22,719 | |
Payable to GEAM | | | 15,660 | |
Accrued other expenses | | | 46,066 | |
Total liabilities | | | 84,445 | |
NET ASSETS | | $ | 34,234,343 | |
| |
NET ASSETS CONSIST OF: | | | | |
Capital paid in | | $ | 26,968,233 | |
Undistributed (distributions in excess of) net investment income | | | 562 | |
Accumulated net realized loss | | | (1,015,184 | ) |
Net unrealized appreciation (depreciation) on: | | | | |
Investments | | | 8,240,716 | |
Futures | | | 40,016 | |
NET ASSETS | | $ | 34,234,343 | |
Shares outstanding ($0.01 par value; unlimited shares authorized) | | | 734,137 | |
Net asset value per share | | | $46.63 | |
The accompanying Notes are an integral part of these financial statements.
11
| | | | |
Statement of Operations For the year ended December 31, 2013 | | | |
| |
INVESTMENT INCOME | | | | |
Income | | | | |
Dividend | | $ | 563,409 | |
Interest | | | 5,025 | |
Income from affiliated investments | | | 147 | |
Less: Foreign taxes withheld | | | (1,151 | ) |
Total income | | | 567,430 | |
| |
Expenses | | | | |
Advisory and administration fees | | | 179,038 | |
Directors’ fees | | | 1,428 | |
Custody and accounting expenses | | | 41,445 | |
Professional fees | | | 18,821 | |
Other expenses | | | 18,016 | |
Total expenses before waivers | | | 258,748 | |
Less: Fees waived by the adviser | | | (891 | ) |
Net expenses | | | 257,857 | |
Net investment income | | | 309,573 | |
| |
NET REALIZED AND UNREALIZED GAIN (LOSS) ON INVESTMENTS | | | | |
| |
Realized gain (loss) on: | | | | |
Investments | | | 4,094,649 | |
Futures | | | 94,375 | |
| |
Increase (decrease) in unrealized appreciation/depreciation on: | | | | |
Investments | | | 4,881,314 | |
Futures | | | 41,297 | |
Net realized and unrealized gain on investments | | | 9,111,635 | |
Net increase in net assets resulting from operations | | $ | 9,421,208 | |
The accompanying Notes are an integral part of these financial statements.
12
| | | | | | | | |
| Statements of Changes in Net Assets | | | | | | |
| | | Year Ended
December 31,
2013 | | | Year Ended
December 31,
2012 | |
| | |
INCREASE (DECREASE) IN NET ASSETS | | | | | | | | |
Operations: | | | | | | | | |
Net investment income | | $ | 309,573 | | | $ | 382,422 | |
Net realized gain (loss) on investments and futures | | | 4,189,024 | | | | 3,020,134 | |
Net increase (decrease) in unrealized appreciation/depreciation on investments and futures | | | 4,922,611 | | | | 1,246,483 | |
Net increase (decrease) from operations | | | 9,421,208 | | | | 4,649,039 | |
Distributions to shareholders from: | | | | | | | | |
Net investment income | | | (309,011 | ) | | | (382,902 | ) |
Total distributions | | | (309,011 | ) | | | (382,902 | ) |
Increase (decrease) in assets from operations and distributions | | | 9,112,197 | | | | 4,266,137 | |
Share transactions: | | | | | | | | |
Proceeds from sale of shares | | | 922,198 | | | | 326,239 | |
Value of distributions reinvested | | | 309,011 | | | | 382,902 | |
Cost of shares redeemed | | | (6,033,289 | ) | | | (5,990,950 | ) |
Net increase (decrease) from share transactions | | | (4,802,080 | ) | | | (5,281,809 | ) |
Total increase (decrease) in net assets | | | 4,310,117 | | | | (1,015,672 | ) |
| | |
NET ASSETS | | | | | | | | |
Beginning of year | | | 29,924,226 | | | | 30,939,898 | |
End of year | | $ | 34,234,343 | | | $ | 29,924,226 | |
Undistributed (distributions in excess of) net investment income, end of period | | $ | 562 | | | $ | – | |
| | |
CHANGES IN FUND SHARES | | | | | | | | |
Shares sold | | | 22,085 | | | | 9,536 | |
Issued for distributions reinvested | | | 6,658 | | | | (175,613 | ) |
Shares redeemed | | | (146,111 | ) | | | 10,962 | |
Net decrease in fund shares | | | (117,368 | ) | | | (155,115 | ) |
The accompanying Notes are an integral part of these financial statements.
13
| | |
| Notes to Financial Statements | | December 31, 2013 |
| 1. | Organization of the Company |
GE Investments Funds, Inc. (the “Company”) was incorporated under the laws of the Commonwealth of Virginia on May 14, 1984 and is registered under the Investment Company Act of 1940, as amended (the “1940 Act”), as an open-end management investment company. The Company is composed of eleven investment portfolios (collectively the “Funds”), although only the following eight are currently being offered: U.S. Equity Fund (the “Fund”), S&P 500 Index Fund, Premier Growth Equity Fund, Core Value Equity Fund, Small-Cap Equity Fund, Total Return Fund, Income Fund and Real Estate Securities Fund.
Shares of the Funds of the Company are offered only to insurance company separate accounts that fund certain variable life insurance contracts and variable annuity contracts. GE Asset Management Incorporated (“GEAM”) is the investment adviser and administrator of each of the Funds.
The Company currently offers one share class (Class 1) of the Fund as an investment option for variable life insurance and variable annuity contracts.
| 2. | Summary of Significant Accounting Policies |
The preparation of financial statements in conformity with U.S. generally accepted accounting principles (“GAAP”) requires management to make estimates and assumptions that affect the reported amounts of assets and liabilities and disclosure of contingent assets and liabilities at the date of the financial statements and the reported amounts of increases and decreases in net assets from operations during the reporting period. Actual results may differ from those estimates.
Subsequent events after the balance sheet date through the date the financial statements were issued have been evaluated in the preparation of the financial statements. There are no items to report.
The following summarizes the significant accounting policies of the Company:
Securities Valuation and Transactions All investments in securities are recorded at their estimated fair value, as described in Note 3.
Securities transactions are accounted for as of the trade date. Realized gains and losses on investments sold are recorded on the basis of identified cost for both financial statement and federal tax purposes.
Derivatives The Fund is subject to equity price risk in the normal course of pursuing its investment objective. The
Fund may enter into derivative transactions (such as options, futures, and options on futures) to gain market exposure to a certain type of broad-based index as an alternative to investing directly in the securities representing such index.
Futures Contracts A futures contract represents a commitment for the future purchase or sale of an asset at a specified price on a specified date. During the year ended December 31, 2013, the Fund invested in stock index future contracts to gain equity exposure for accumulating and residual cash positions. Buying futures tends to increase a Fund’s exposure to the underlying instrument while selling futures tends to decrease a Fund’s exposure to the underlying instrument, or hedge other Fund investments. The Fund will not enter into a transaction involving futures for speculative purposes. With futures contracts, there is minimal counterparty credit risk to the Fund since futures contracts are exchange traded and the exchange’s clearinghouse, as counterparty to all traded futures, guarantees the futures against default. The Fund’s risks in using these contracts include changes in the value of the underlying instruments, non-performance of the counterparties under the contracts’ terms and changes in the liquidity of the secondary market for the contracts. Futures contracts are valued at the settlement price established each day by the board of trade or exchange on which they principally trade.
Upon entering into a financial futures contract, the Fund is required to pledge to the broker an amount of cash and/or other assets equal to a certain percentage of the contract amount, known as initial margin deposit. Subsequent payments, known as variation margin, are made or received by the Fund each day, depending on the daily fluctuation in the fair value of the underlying security. The Fund records an unrealized gain or loss equal to the daily variation margin. Should market conditions move unexpectedly, the Fund may not achieve the anticipated benefits of the futures contracts and may incur a loss. The Fund recognizes a realized gain or loss on the expiration or closing of a futures contract.
Investment Income Corporate actions (including cash dividends) are recorded on the ex-dividend date, net of applicable withholding taxes, except for certain foreign corporate actions which are recorded as soon after the ex-dividend date as such information becomes available. Withholding taxes in foreign dividends have been provided for in accordance with the Fund’s understanding of the applicable country’s tax rules and rates.
14
| | |
| Notes to Financial Statements | | December 31, 2013 |
Interest income is recorded on the accrual basis. Accretion of discounts and amortization of premiums on taxable bonds are to the call or maturity date, whichever is shorter, using the effective yield method.
Expenses Fund specific expenses are charged to the Fund that incurs such expenses. Such expenses may include custodial fees, legal and accounting fees, printing costs and registration fees. Expenses that are not fund specific are allocated pro rata across the Funds. Expenses of the Fund are generally paid directly by the Fund, however, expenses may be paid by GEAM and reimbursed by the Fund.
Federal Income Taxes The Fund intends to comply with all sections of the Internal Revenue Code applicable to regulated investment companies including the distribution of substantially all of its taxable net investment income and net realized capital gains to its shareholders. Therefore, no provision for federal income tax has been made. The Fund is treated as a separate taxpayer for federal income tax purposes.
The Fund utilizes various methods to measure the fair value of most of its investments on a recurring basis. GAAP establishes a framework for measuring fair value and providing related disclosures. Broadly, the framework requires fair value to be determined based on the exchange price that would be received for an asset or paid to transfer a liability (an exit price) in the principal or most advantageous market for the asset or liability in an orderly transaction between market participants at the measurement date. In the absence of active markets for the identical assets or liabilities, such measurements involve developing assumptions based on market observable data and, in the absence of such data, internal information that is consistent with what market participants would use in a hypothetical transaction that occurs at the measurement date. It also establishes a three-level valuation hierarchy based upon observable and non-observable inputs.
Observable inputs reflect market data obtained from independent sources, while unobservable inputs reflect our market assumptions. Preference is given to observable inputs. These two types of inputs create the following fair value hierarchy:
Level 1 — Quoted prices for identical investments in active markets.
Level 2 — Quoted prices for similar investments in active markets; quoted prices for identical or similar
investments in markets that are not active; and model-derived valuations whose inputs are observable or whose significant value drivers are observable.
Level 3 — Significant inputs to the valuation model are unobservable.
Policies and procedures are maintained to value investments using the best and most relevant data available. In addition, pricing vendors are utilized to assist in valuing investments. GEAM performs periodic reviews of the methodologies used by independent pricing services including price validation of individual securities.
Fair Value Measurement The following section describes the valuation methodologies the Fund uses to measure different financial investments at fair value.
The Fund’s portfolio securities are valued generally on the basis of market quotations. Equity securities generally are valued at the last reported sale price on the primary market in which they are traded. Portfolio securities listed on NASDAQ are valued using the NASDAQ Official Closing Price, Level 1 securities primarily include publicly-traded equity securities. If no sales occurred on the exchange or NASDAQ that day, the portfolio security generally is valued using the last reported bid price. In those circumstances the Fund classifies the investment securities in Level 2.
Short-term investments of sufficient credit quality with remaining maturities of sixty days or less at the time of purchase are typically valued on the basis of amortized cost which approximates fair value and these are included in Level 2. If it is determined that amortized cost does not approximate fair value, securities may be valued based on dealer supplied valuations or quotations. In these infrequent circumstances, pricing services may provide the Fund with valuations that are based on significant unobservable inputs, and in those circumstances the investment securities are classified in Level 3.
If prices are not readily available for a portfolio security, or if it is believed that a price for a portfolio security does not represent its fair value, the security may be valued using procedures approved by the Fund’s Board of Directors that are designed to establish its “fair” value. These securities are typically classified in Level 3. Those procedures require that the fair value of a security be established by a valuation committee of GEAM. The valuation committee follows different protocols for different types of investments and circumstances. The fair value procedures may be used to value any investment of the Fund in the appropriate circumstances.
15
| | |
| Notes to Financial Statements | | December 31, 2013 |
Fair value determinations generally are used for securities whose value is affected by a significant event that will materially affect the value of a security and which occurs subsequent to the time of the close of the principal market on which such security trades but prior to the calculation of the Fund’s NAV.
The value established for such a portfolio security may be different than what would be produced through the use of market quotations or another methodology. Portfolio securities that are valued using techniques other than market quotations, including “fair valued” securities, may be subject to greater fluctuation in their value from one day to the next than would be the case if market quotations were used. In addition, there is no assurance that the Fund could sell a portfolio security for the value established for it at any time and it is possible that the Fund would incur a loss because a portfolio security is sold at a discount to its established value.
Other financial investments are derivative instruments that are not reflected in total investments, such as futures, forwards, swaps, and written options contracts, which are valued based on fair value as discussed above.
The Fund uses closing prices for derivatives included in Level 1, which are traded either on exchanges or liquid over-the-counter markets. Derivative assets and liabilities included in Level 2 primarily represent interest rate swaps, cross-currency swaps and foreign currency and commodity forward and option contracts. Derivative assets and liabilities included in Level 3 primarily represent interest rate products that contain embedded optionality or prepayment features.
The inputs or methodology used for valuing securities are not an indication of the risk associated with investing in those securities.
The following table presents the Fund’s investments measured at fair value on a recurring basis at December 31, 2013:
| | | | | | | | | | | | | | | | | | | | |
| Investments | | Level 1 | | Level 2 | | Level 3 | | Total |
Investments in Securities† | | | | | | | | | | | | | | | | | | | | |
Common Stock | | | $ | 31,939,186 | | | | $ | — | | | | $ | — | | | | $ | 31,939,186 | |
Exchange Traded Funds | | | | 525,131 | | | | | — | | | | | — | | | | | 525,131 | |
Short-Term Investments | | | | 1,809,284 | | | | | — | | | | | — | | | | | 1,809,284 | |
| | | | | | | | | | | | | | | | | | | | |
Total Investments in Securities | | | $ | 34,273,601 | | | | $ | — | | | | $ | — | | | | $ | 34,273,601 | |
| | | | | | | | | | | | | | | | | | | | |
Other Financial Instruments* | | | | | | | | | | | | | | | | | | | | |
Futures Contracts—Unrealized Appreciation | | | $ | 40,016 | | | | $ | — | | | | $ | — | | | | $ | 40,016 | |
| | | | | | | | | | | | | | | | | | | | |
| † | See Schedule of Investments for industry classification. |
| * | Other financial instruments include derivative instruments such as futures contracts. Amounts shown represent unrealized appreciation (depreciation), at period end. |
There were no transfers between fair value levels. Transfers between fair value levels are considered to occur at the beginning of the period.
| 4. | Derivatives Transactions |
Shown below are the derivative contracts entered into by the Fund, summarized by primary risk exposure as they appear on the Statement of Assets and Liabilities, all of which are not accounted for as hedging instruments under FASB Accounting Standards Codification (“ASC”) No. 815 Derivatives and Hedging as of December 31, 2013.
| | | | | | | | | | | | |
| | | Asset Derivatives December 31, 2013 | | | Liability Derivatives December 31, 2013 | |
Derivatives not accounted for as hedging
instruments under ASC 815 | | Location in the Statements
of Assets and Liabilities | | Fair
Value ($) | | | Location in the Statements
of Assets and Liabilities | | Fair
Value ($) | |
Equity Contracts | | Assets, Net Assets — Net Unrealized Appreciation/ (Depreciation) on Futures | | | 40,016* | | | Liabilities, Net Assets — Net Unrealized Appreciation/ (Depreciation) on Futures | | | – | |
| * | Includes cumulative unrealized appreciation/(depreciation) of futures contracts as reported in the Schedule of Investments and within the components of the net assets section of the Statement of Assets and Liabilities. Only the current day’s variation margin is reported within the Assets and/or Liabilities section on the Statement of Assets and Liabilities. |
16
| | |
| Notes to Financial Statements | | December 31, 2013 |
Shown below are the effects of derivative instruments on the Fund’s Statement of Operation, summarized by primary risk exposure all of which are not accounted for as hedging instruments under ASC 815.
| | | | | | | | | | | | | | |
Derivatives not accounted for as
hedging instruments under ASC 815 | | Location in the Statements
of Operations | | Total Notional Amount
of Futures Contracts
Purchased/(Sold) ($) | | | Realized Gain
(Loss) on
Derivatives
Recognized
inIncome ($) | | | Change in
Unrealized
Appreciation
(Depreciation)
on Derivatives
Recognized in
Income ($) | |
Equity Contracts | | Realized gain/(loss) on futures, Increase/(decrease) in unrealized appreciation/ (depreciation) on Futures | |
| 8,477,442/
(7,111,914) |
| | | 94,375 | | | | 41,297 | |
The Company shares a revolving credit facility of up to $150 million with a number of its affiliates. The credit facility is with its custodian bank, State Street Bank and Trust Company (“State Street”). The revolving credit facility requires the payment of a commitment fee equal to 0.10% per annum on the daily unused portion of the credit facility, payable quarterly. The portion borne by the Funds generally is borne proportionally based upon net assets. In addition, the Company has a $100 million uncommitted, unsecured line of credit with State Street. Generally, borrowings under the credit facilities would accrue interest at the Federal Funds Rate plus 50 basis points and would be borne by the borrowing fund. The maximum amount allowed to be borrowed by any one fund is the lesser of (i) 33.33% of its total assets or (ii) 20% of its net assets. The credit facilities were not utilized by the Fund during the year ended December 31, 2013.
| 6. | Compensation and Fees Paid to Affiliates |
GEAM, a registered investment adviser, was retained by the Company’s Board of Directors effective November 17, 1997 to act as investment adviser and administrator of the Fund. GEAM’s compensation for investment advisory and administrative services (“management fee”) is paid monthly based on the average daily net assets of the Fund at an annualized rate of 0.55%.
GEAM has a contractual arrangement with the Fund to waive a portion of the Fund’s management fee in the amount equal to the management fee earned by GEAM with respect to the Fund’s investment in the GE Institutional Money Market Fund, if any.
Directors’ Compensation The Fund pays no compensation to its directors who are officers or employees of GEAM or its affiliates. Directors who are not
such officers or employees also serve in a similar capacity for other funds advised by GEAM. Compensation paid to non-interested Directors are reflected on the Statement of Operations. These fees are allocated pro rata across all of the mutual fund platforms served by the Directors, including the Fund, and are based upon the relative net assets of each fund within such platforms.
| 7. | Investment Transactions |
Purchases and Sales of Securities The cost of purchases and the proceeds from sales of investments, other than short-term securities, for the year ended December 31, 2013, were as follows:
| | | | | | |
| Non-U.S. Government Securities | |
| Purchases | | | Sales | |
| $ | 12,382,853 | | | $ | 18,561,142 | |
The Fund is subject to ASC 740, Income Taxes. ASC 740 provides guidance for financial accounting and reporting for the effects of income taxes that result from an entity’s activities during the year. ASC 740 also provides guidance regarding how certain uncertain tax positions should be recognized, measured, presented and disclosed in the financial statements. ASC 740 requires evaluation of tax positions taken or expected to be taken in the course of preparing the Fund’s tax returns to determine whether the tax positions are “more likely than not” of being sustained by the applicable tax authority. There are no adjustments to the Fund’s net assets required under ASC 740. The Fund’s 2010, 2011, 2012, and 2013 fiscal years tax returns are still open to examination by the Federal and applicable state tax authorities.
17
| | |
| Notes to Financial Statements | | December 31, 2013 |
At December 31, 2013, information on the tax cost of investments and distributable earnings on a tax basis was as follows:
| | | | | | | | | | | | | | | | | | | | | | | | | | | | | | |
Cost of
Investments For
Tax Purposes | | | Gross Tax | | | Net Tax Appreciation/
(Depreciation) | | | Undistributed | | | | |
| | Appreciation | | | Depreciation | | | Investments | | | Derivatives/
Currency | | | Income | | | Accum.
Capital
Gain/(Loss) | | | Late-Year
Losses | |
| $ | 26,178,389 | | | $ | 8,247,215 | | | $ | (152,003 | ) | | $ | 8,095,212 | | | $ | 40,016 | | | $ | 562 | | | $ | (829,665 | ) | | $ | — | |
As of December 31, 2013, the Fund had capital loss carryovers as indicated below. Capital loss carryovers are available to offset future realized capital gains to the extent provided in the Internal Revenue Code and regulations thereunder. To the extent that these carryover losses are used to offset future capital gains, it is probable that gains offset will not be distributed to shareholders because they would be taxable as ordinary income.
| | | | | | | | | | |
| Amount | | | | |
| Short-Term | | | Long-Term | | | Expires | |
| $ | 417,001 | | | $ | — | | | | 12/31/2017 | |
| | 412,664 | | | $ | — | | | | 12/31/2018 | |
These amounts will be available to offset future taxable capital gains. Under the recently enacted Regulated Investment Company Modernization Act of 2010, the Fund will be permitted to carry forward capital losses incurred in taxable years beginning after December 22, 2010 for an unlimited period. However, any losses incurred during those future years will be required to be utilized prior to the losses incurred in pre-enactment tax years. As a result of this ordering rule, pre-enactment capital loss carryforwards may be more likely to expire unused. Additionally, post-enactment capital losses that are carried forward will retain their character as either short term or long-term capital losses rather than being considered all short-term as under previous law.
During the year ended December 31, 2013, the Fund utilized $4,045,524 of prior year capital loss carryovers.
Any qualified late-year loss is deemed to arise on the first day of the Fund’s next tax year (if the Fund elects to defer such loss). Under this regime, generally, the Fund can elect to defer any post-October capital loss and/or any late-year ordinary loss as defined by the Internal Revenue Code.
The Fund incurred no such losses for the year ended December 31, 2013.
The tax character of distributions paid during the years ended December 31, 2013 and December 31, 2012 were as follows:
| | | | | | | | | | | | | | | |
| Year | | Ordinary
Income | | Long-Term
Capital Gains | | Total |
2013 | | | $ | 309,011 | | | | $ | — | | | | $ | 309,011 | |
2012 | | | | 382,902 | | | | | — | | | | | 382,902 | |
Distributions to Shareholders The Fund declares and pays any dividends from net investment income annually. The Fund declares and pays any net realized capital gains in excess of capital loss carryforwards distributions annually. The character of income and gains to be distributed is determined in accordance with income tax regulations which may differ from generally accepted accounting principles. These differences include (but are not limited to) investments in futures and losses deferred due to wash sale transactions. Reclassifications due to permanent book/tax differences are made to the Fund’s capital accounts to reflect income and gains available for distribution (or available capital loss carryovers) under income tax regulations. These reclassifications have no impact on net investment income, realized gains or losses, or the net asset value of the Fund. The calculation of net investment income per share in the Financial Highlights table excludes these adjustments.
The reclassifications for the year ended December 31, 2013 were as follows:
| | | | | | | | | | |
Undistributed
Net Investment
Income | | | Accumulated
Net Realized
Gain (Loss) | | | Capital
Paid In | |
| $ | — | | | $ | 42,881 | | | $ | (42,881 | ) |
18
Report of Independent Registered Public Accounting Firm
The Shareholders and Board of Directors
GE Investments Funds, Inc.
We have audited the accompanying statement of assets and liabilities, including the schedule of investments, of the U.S. Equity Fund (the “Fund”), a series of GE Investments Funds, Inc., as of December 31, 2013 and the related statement of operations for the year then ended, statements of changes in net assets for each of the years in the two-year period then ended, and the financial highlights for each of the years in the five-year period then ended. These financial statements and financial highlights are the responsibility of the Fund’s management. Our responsibility is to express an opinion on these financial statements and financial highlights based on our audits.
We conducted our audits in accordance with the standards of the Public Company Accounting Oversight Board (United States). Those standards require that we plan and perform the audit to obtain reasonable assurance about whether the financial statements are free of material misstatement. An audit includes examining, on a test basis, evidence supporting the amounts and disclosures in the financial statements. Our procedures included confirmation of securities owned as of December 31, 2013 by correspondence with the custodian and brokers. An audit also includes assessing the accounting principles used and significant estimates made by management, as well as evaluating the overall financial statement presentation. We believe that our audits provide a reasonable basis for our opinion.
In our opinion, the financial statements and financial highlights referred to above present fairly, in all material respects, the financial position of the U.S. Equity Fund as of December 31, 2013, the results of its operations, changes in its net assets and financial highlights for each of the years described above, in conformity with U.S. generally accepted accounting principles.

Boston, Massachusetts
February 17, 2014
19
| | |
| Advisory and Administrative Agreement Renewal | | (Unaudited) |
The Board of Directors of the GE Investments Funds, Inc. (the “Board”), including the independent Board members, considered and unanimously approved the continuance for an additional year of the Fund’s Investment Advisory and Administration Agreement with GE Asset Management Incorporated (“GEAM”) at meetings held on December 11 and December 13, 2013.
In considering whether to approve the Fund’s investment advisory agreement, the Board members considered and discussed a substantial amount of information and analysis provided, at the Board’s request, by GEAM. The Board members also considered detailed information regarding performance and expenses of other investment companies, including those with similar investment strategies and sizes, which was prepared by independent third party provider Morningstar, Inc. (“Morningstar”). The Board members reviewed the fees charged by GEAM for other mutual funds and investment products other than mutual funds that employ the same investment strategy as the Fund. The Board had the opportunity to ask questions and request additional information in connection with its considerations.
Before approving the Fund’s investment advisory agreement, the independent Board members reviewed the information provided with management of GEAM and with their independent legal counsel. The Board members also reviewed a memorandum prepared by independent legal counsel discussing the legal standards for the consideration of the proposed continuance. The independent Board members discussed the proposed continuance in detail during a private session with their independent legal counsel at which no representatives of GEAM were present. The independent Board members and their independent legal counsel requested, received and considered additional information from GEAM following these sessions.
In advance of the meetings, and in response to their request, the Board members received from GEAM written responses to their inquiries, which included substantial exhibits and other materials related to GEAM’s business and the services it provides to the Fund. The Board members took into account their experience as Board members and particularly their previous consideration of these types of agreements. When feasible, information was presented in a manner to facilitate comparison to prior periods and to reflect certain enhancements to GEAM’s infrastructure, systems and shareholder servicing model. To focus their review, the Board members asked GEAM management, in its oral presentation, to highlight
material differences from the information presented in recent years.
During the meetings, the Board members had an opportunity to discuss this information with GEAM representatives, including senior executives, representatives from the legal, compliance and finance departments, and investment personnel. The Board members posed questions to these representatives and engaged in substantive discussions with them concerning GEAM’s investment process.
In reaching their determination relating to continuance of the Fund’s investment advisory agreement, the Board members considered all factors that they deemed relevant, including the factors discussed below. In their deliberations, the Board members did not identify any particular information that was all-important or controlling, and each Board member may have attributed different weights to the various factors. In particular, the Board members focused on the following:
The Nature, Extent And Quality Of Services Provided.
The Board members reviewed the services provided by GEAM, taking into account their past experiences with GEAM. They focused on the favorable attributes of GEAM, including (i) an investment philosophy oriented toward long-term performance; (ii) effective processes used for selecting investments and brokers; (iii) effective processes used for providing Fund administration, including controllership and compliance functions, the optimization of its Fund administration platform and the continued oversight of the performance of other companies that provide services to the Fund and its shareholders; (iv) highly skilled professionals including analysts, research professionals, traders and portfolio managers with a depth of experience relevant to the Fund; (v) access to significant and enhanced technological resources from which the Fund may benefit; and (vi) a favorable history and reputation. The Board members noted that the Fund represents only a small portion of the assets managed by GEAM, but benefits from a full array of services and resources provided by GEAM.
In light of these discussions, the Board, including the independent Board members, concluded that GEAM’s services continue to be satisfactory.
Investment Performance Of The Fund.
The Board members considered the investment performance of the Fund for various periods. The Board
20
| | |
| Advisory and Administrative Agreement Renewal | | (Unaudited) |
members reviewed detailed comparisons of the performance of the Fund with the relevant securities index and peer groupings of mutual funds prepared by Morningstar with respect to various periods. The Board members also engaged in detailed discussions with GEAM management about its investment process and performance results. These discussions focused on the Fund’s investment objective, the number and experience of portfolio management and supporting research personnel, the investment style and approach employed, the likely market cycles for the Fund’s investment style and the Fund’s relative underperformance in certain prior periods, as well as the Fund’s improved performance over the past year. The Board members discussed GEAM’s investment approach with respect to the Fund, and the reasons for the Fund’s relative underperformance in prior periods.
The Board, including the independent Board members, concluded that the Fund’s performance was acceptable overall taking into consideration the factors discussed above.
Cost Of The Services Provided And Profits Realized From The Relationship With The Fund.
The Board members considered the fees paid to GEAM by the Fund and the cost of the services provided to the Fund by GEAM. The Board members reviewed the information they had requested from GEAM concerning its profitability. The Board members considered the profit margin information for GEAM’s investment company business as a whole, as well as GEAM’s profitability data for the Fund. The Board members reviewed GEAM’s assumptions and the methods of cost allocation used by GEAM in preparing Fund-specific profitability data. The Board members also discussed with GEAM the basis for its belief that the methods of allocation used were reasonable for each area of its business.
Information was presented regarding the financial condition of GEAM for various past periods. The Board members noted and discussed the additional services provided by GEAM to the Fund compared to other investment products managed by GEAM. The Board members determined that GEAM should be entitled to earn a reasonable level of profits for the services it provides to the Fund. The Board members also recognized that GEAM has made and continues to make significant
investments in its business in fulfilling its obligations to the Fund and supporting its Fund-related activities.
Based on their review, the Board, including the independent Board members, concluded that they were satisfied that the level of profitability achieved by GEAM from its relationship with the Fund was not unreasonable or excessive.
The Extent To Which Economies Of Scale Would Be Realized As The Fund Grows And Whether Fee Levels Would Reflect Such Economies Of Scale.
The Board noted that the Fund experienced a slight increase in assets over the past year, and the Board members considered the extent to which economies of scale would be realized as the Fund continues to grow and whether fee levels reflect these economies of scale for the benefit of Fund investors.
The Board members considered the substantial infrastructure investments that GEAM has made with respect to its operations and its commitment to continue investing resources to enhance services to Fund shareholders. The Board members recognized the benefits to the Fund of GEAM’s past investment in its operations through expenditures to support its substantial infrastructure, and that, with respect to all GEAM managed mutual funds, GEAM has not yet fully recouped that investment. The Board members also recognized the benefits to the Fund of being able to leverage a favorable cost structure achieved with respect to the Fund’s other operating expenses as a result of GEAM’s large overall base of assets under management and its vendor management practices.
Comparison Of Services To Be Rendered And Fees To Be Paid.
The Board members discussed the services provided to the Fund by GEAM, and the fees charged for those services. The Board members reviewed information concerning the fee and expense ratios for the Fund, and comparative information with respect to peer groupings of mutual funds prepared by Morningstar. They discussed that the Fund’s advisory fee and expense ratios were within the applicable peer group ranges. In light of the foregoing, the Board, including the independent Board members, determined that the advisory fees were reasonable in relation to the services provided to the Fund.
21
| | |
| Advisory and Administrative Agreement Renewal | | (Unaudited) |
Fall-Out Benefits.
The Board members considered other actual and potential financial benefits that GEAM may derive from its relationship with the Fund, including, to the extent applicable, soft dollar commission benefits generated through Fund portfolio transactions. The Board members noted, however, that the Fund benefits from the vast array of resources available through GEAM, and that the Fund represents only a small portion of the assets managed by GEAM.
Conclusion.
No single factor was determinative to the Board’s decision. Based on their discussion and such other matters as were deemed relevant, the Board, including the independent Board members, concluded that renewal of the investment advisory agreement was in the best interests of the Fund and its shareholders.
22
| | |
| Additional Information | | (Unaudited) |
Information about Directors and Executive Officers:
The business and affairs of the Funds are managed under the direction of the Funds’ Board of Directors. Information pertaining to the Directors and officers of the Funds is set forth below.
Interested Directors and Executive Officers
Michael J. Cosgrove
Address c/o GEAM 1600 Summer St. Stamford, CT 06905
Age 64
Position(s) Held with Fund Chairman of the Board and President
Term of Office and Length of Time Served Until successor is elected and qualified — 17 years
Principal Occupation(s) During Past 5 years President of Mutual Funds and Global Investment Programs of GEAM since November 2011; President and Chief Executive Officer — Mutual Funds and Intermediary Business of GEAM from March 2007 to November 2011; Executive Vice President of GEAM from February 1997 to March 2007; and Executive Vice President-Mutual Funds of GEAM from March 1993 to March 2007. Also serves as Treasurer of GE Foundation since 1988.
Number of Portfolios in Fund Complex Overseen by Director 25
Other Directorships Held by Director Chairman of the Board and President of GE Institutional Funds since 1997; Trustee of Elfun Funds, GE Retirement Savings Plan Funds (formerly GE Savings & Security Funds) and General Electric Pension Trust since 1988; Director of GEAM since 1988; Trustee of Fordham University from 2002 through June 2010 and since July 2011; Director of GE Investment Distributors, Inc. since June 2011; Director of Skin Cancer Foundation since August 2010; Member Board of Governors of the Investment Company Institute since October 2006; Director of GE Asset Management (Ireland) Limited since February 1999, GE Asset Management Funds Plc since 1998, GE Asset Management Canada Company since 1998, GE Asset Management Limited since 1998; Trustee of General Electric Insurance Plan Trust since 1988; and Chairman of the Board and President of GE Funds from 1993 to February 2011.
Matthew J. Simpson
Address c/o GEAM 1600 Summer St. Stamford, CT 06905
Age 52
Position(s) Held with Fund Director and Executive Vice President
Term of Office and Length of Time Served Until successor is elected and qualified — 6 years
Principal Occupation(s) During Past 5 years Executive Vice President, General Counsel and Secretary of GEAM since July 2007; Secretary of Elfun Funds and GE Retirement Savings Plan Funds (formerly GE Savings & Security Funds) since July 2007; Senior Vice President and General Counsel — Marketing and Client Services (formerly Asset Management Services) of GEAM and Senior Vice President and General Counsel of GE Asset Management Services from February 1997 to July 2007; Vice President and Associate General Counsel of GEAM from October 1992 to February 1997; Secretary of GE Institutional Funds and GE Investments Funds, Inc. from 1997 to July 2007 and Vice President from September 2003 to July 2007; Assistant Secretary of Elfun Funds and GE Retirement Savings Plan Funds from 1998 to July 2007 and Vice President from October 2003 to July 2007; and Secretary of GE Funds from 1993 to July 2007 and Vice President from September 2003 to July 2007.
Number of Portfolios in Fund Complex Overseen by Director 25
Other Directorships Held by Director Trustee of Elfun Funds, GE Retirement Savings Plan Funds and General Electric Pension Trust since July 2007; Trustee and Executive Vice President of GE Institutional Funds since July 2007; Director of GEAM since July 2007; Director of GE Investment Distributors, Inc. since June 2011; and Trustee and Executive Vice President of GE Funds from July 2007 to February 2011.
23
| | |
| Additional Information | | (Unaudited) |
Joon Won Choe
Address c/o GEAM 1600 Summer St. Stamford, CT 06905
Age 44
Position(s) Held with Fund Vice President & Secretary
Term of Office and Length of Time Served Until successor is elected and qualified — Vice President and Secretary — 3 years
Principal Occupation(s) During Past 5 years Senior Vice President and Deputy General Counsel at GEAM since March 2011; Vice President and Secretary of GE Institutional Funds since September 2010; Vice President and Assistant Secretary of Elfun Funds and GE Retirement Savings Plan Funds (formerly GE Savings & Security Funds) since September 2010; Senior Vice President and Associate General Counsel at GEAM from June 2010 to March 2011; Vice President and Associate General Counsel of GEAM from November 2005 to June 2010 and Vice President and Secretary of GE Funds from September 2010 to February 2011.
Number of Portfolios in Fund Complex Overseen by Officer N/A
Other Directorships Held by Officer N/A
Robert Herlihy
Address c/o GEAM 1600 Summer St. Stamford, CT 06905
Age 46
Position(s) Held with Fund Chief Compliance Officer
Term of Office and Length of Time Served Until successor is elected and qualified — 8 years
Principal Occupation(s) During Past 5 years Chief Compliance Officer of GEAM, GE Institutional Funds, Elfun Funds, and GE Retirement Savings Plan Funds (formerly GE Savings & Security Funds) since July 2005; Chief Compliance Officer of GE Funds from July 2005 to February 2011 and Manager of Fund Administration at GEAM from 2002-2005.
Number of Portfolios in Fund Complex Overseen by Officer N/A
Other Directorships Held by Officer N/A
Arthur A. Jensen
Address c/o GEAM 1600 Summer St. Stamford, CT 06905
Age 47
Position(s) Held with Fund Treasurer
Term of Office and Length of Time Served Until successor is elected and qualified — 2 years
Principal Occupation(s) During Past 5 Years Treasurer of GE Institutional Funds, Elfun Funds and GE Retirement Savings Plan Funds (formerly GE Savings & Security Funds) since June 2011; Mutual Funds Controller of GEAM since April 2011; Senior Vice President at Citigroup from 2008 to 2010 and Vice President at JPMorgan from 2005 to 2008.
Number of Portfolios in Fund Complex Overseen by Officer N/A
Other Directorships Held by Officer N/A
24
| | |
| Additional Information | | (Unaudited) |
Jeanne M. LaPorta
Address c/o GEAM 1600 Summer St. Stamford, CT 06905
Age 48
Position(s) Held with Fund Vice President
Term of Office and Length of Time Served Until successor is elected and qualified — 10 years
Principal Occupation(s) During Past 5 Years Senior Vice President and Commercial Administrative Officer of GEAM since April 2010; Vice President of GE Institutional Funds since July 2003; Vice President of Elfun Funds and GE Retirement Savings Plan Funds (formerly GE Savings & Security Funds) since October 2003; Secretary of GE Funds from July 2007 to September 2010 and Vice President from July 2007 to February 2011; Senior Vice President and Deputy General Counsel of GEAM from October 2007 to April 2010; Vice President and Assistant Secretary of Elfun Funds and GE Retirement Savings Plan Funds from July 2003 to June 2010; and Vice President and Associate General Counsel — Marketing and Client Services (formerly Asset Management Services) at GEAM from May 1997 to October 2007.
Number of Portfolios in Fund Complex Overseen by Officer N/A
Other Directorships Held by Officer N/A
Non-Interested Directors
John R. Costantino
Address c/o GEAM 1600 Summer St. Stamford, CT 06905
Age 67
Position(s) Held with Fund Director
Term of Office and Length of Time Served Until successor is elected and qualified — 17 years
Principal Occupation(s) During Past 5 years Managing General Partner, NGN Capital LLC since 2006; and Treasurer of NeuroScience Research Institute since 1986.
Number of Portfolios in Fund Complex Overseen by Director 17
Other Directorships Held by Director Trustee of GE Institutional Funds since 1997; Trustee of Fordham University from 1989 to 1995 and from 2001 to 2007 and Trustee Emeritus since 2007; Trustee of NeuroScience Research Institute since 1986; Trustee of GE Funds from 1993 to February 2011; and Director of Artes Medical from 2006 to 2008.
25
| | |
| Additional Information | | (Unaudited) |
R. Sheldon Johnson
Address c/o GEAM 1600 Summer St. Stamford, CT 06905
Age 67
Positions(s) Held with Fund Director
Term of office and Length of Time served Unit Successor is elected and qualified — 2 years
Principal Occupation(s) During Past 5 years Head of Global Institutional Equity Sales and Marketing at Morgan Stanley & Co., Inc. from 2002 to 2006 and Managing Director at Morgan Stanley & Co., Inc. from 1988 to 2006.
Number of Portfolios in Fund Complex Overseen by Director 17
Other Directorships Held by Director Trustee of GE Institutional Funds since April 2011 and Trustee of St. Lawrence University since 2003.
Donna M. Rapaccioli
Address c/o GEAM 1600 Summer St. Stamford, CT 06905
Age 51
Position(s) Held with Fund Director
Term of Office and Length of Time Served Until successor is elected and qualified — 2 years
Principal Occupation(s) During Past 5 Years Dean of the Gabelli School of Business since 2007 and Accounting professor since 1987 at Fordham University.
Number of Portfolios in Fund Complex Overseen by Officer 17
Other Directorships Held by Director Trustee of GE Institutional Funds since January 2012 and Trustee of Emmanuel College since 2010.
The Statement of Additional Information for the Funds includes additional information about the Directors and Officers and is available, without charge, upon request by calling 1-800-242-0134.
26
| | |
| Investment Team | | (Unaudited) |
Investment Adviser and Administrator
GE Asset Management Incorporated
Board of Directors
Michael J. Cosgrove, Chairman
John R. Costantino
R. Sheldon Johnson
Donna M. Rapaccioli
Matthew J. Simpson
Secretary
Joon Won Choe
Assistant Secretary
Michelle Matzelle
Treasurer
Arthur A. Jensen
Assistant Treasurer
Robert Meyers
Distributor
GE Investment Distributors, Inc.
Member FINRA and SIPC
Custodian
State Street Bank & Trust Company
At GE Asset Management, we’re dedicated to providing the investment options you’ll need to tailor your financial portfolio to every stage of your life. Each member of the GE Family of Funds is managed according to the same principles of integrity and quality that have guided GE over the past century, and have made it the world-class company that it is today. Each fund draws strength from a heritage of investment management experience that spans more than 80 years. Whether you’re creating a new investment portfolio or adding to an established one, the GE Family of Funds offers an array of professionally managed investment options that will help you meet a lifetime of financial needs.
27
Investment Adviser
GE Asset Management Incorporated
1600 Summer Street
Stamford, CT 06905
or at:
PO Box 7900
Stamford, CT 06904-7900
Distributor
GE Investment Distributors, Inc.
member FINRA and SIPC
1600 Summer Street
Stamford, CT 06905
or at:
PO Box 7900
Stamford, CT 06904-7900
The Fund files its complete schedule of portfolio holdings with the Securities and Exchange Commission for the first and third quarters of each fiscal year on Form N-Q. The Fund’s Forms N-Q, as well as a description of the policies and procedures that the Fund uses to determine how to vote proxies (if any) relating to portfolio securities is available without charge (i) upon request, by calling 1-800-493-3042; (ii) on the Fund’s website at http://www.geam.com; and (iii) on the Commission’s website at http://www.sec.gov. The Fund’s Forms N-Q may be reviewed and copied at the Commission’s Public Reference Room in Washington, DC — information on the operation of the Public Reference Room may be obtained by calling 1-800-SEC-0330.
Information (if any) regarding how the Fund voted proxies relating to portfolio securities during the most recently disclosed 12-month period ended June 30 is available without charge (i) through the Fund’s website at http://www.geam.com; and (ii) on the Commission’s website at http://www.sec.gov.

GE Investments Funds, Inc.
S&P 500 Index Fund
Annual Report
December 31, 2013

GE Investments Funds, Inc.
| | |
| |
| S&P 500 Index Fund | | Contents |
This report is prepared for Policyholders of certain variable contracts and may be distributed to others only if preceded or accompanied by the variable contract’s current prospectus and the current prospectus and/or summary prospectus of the Fund available for investments thereunder.
| | |
| Notes to Performance | | December 31, 2013 (Unaudited) |
The information provided on the performance page relates to the GE Investments S&P 500 Index Fund (the “Fund”).
Total return performance shown in this report for the Fund takes into account changes in share price and assumes reinvestment of dividends and capital gains distributions, if any. Total returns shown are net of Fund fees and expenses but do not reflect fees and charges associated with the variable contracts such as administrative fees, account charges and surrender charges, which, if reflected, would reduce the Fund’s total returns for all periods shown.
The performance data quoted represents past performance; past performance does not guarantee future results. Investment return and principal value will fluctuate so your shares, when redeemed, may be worth more or less than their original cost. Current performance may be higher or lower than the performance data quoted. Periods less than one year are not annualized. Please call 800-493-3042 or visit the Fund’s website at http://www.geam.com for the most recent month-end performance data.
An investment in the Fund is not a deposit of any bank and is not insured or guaranteed by the Federal Deposit Insurance Corporation (FDIC) or any other government agency. An investment in the Fund is subject to risk, including possible loss of principal invested.
The Standard & Poor’s (“S&P”) 500® Composite Price Index of stocks (“S&P 500 Index”) is an unmanaged, market capitalization-weighted index of stocks of 500 large U.S. companies, which is widely used as a measure of large-cap U.S. stock market performance.
The S&P 500 Index Fund is not sponsored, endorsed, sold or promoted by Standard & Poor’s, and Standard and Poor’s makes no representation or warranty, express or implied, to the investors of the Fund or any member of the public regarding the advisability of investing in the securities generally or in this Fund particularly or the ability of the S&P 500 Index Fund to track general stock market performance.
The results shown for the foregoing index assume the reinvestment of net dividends or interest and do not reflect fees, expenses, or taxes. As such, the index returns do not reflect the actual cost of investing in the instruments that comprise the index.
The peer universe of the underlying annuity funds used for the peer group average annual total return calculation is based on a blend of Morningstar peer categories, as shown. Morningstar is an independent mutual fund rating service. A Fund’s performance may be compared to or ranked within a universe of mutual funds with investment objectives and policies similar but not necessarily identical to that of the Fund.
©2014 Morningstar, Inc. All Rights Reserved. The Morningstar information contained herein: (1) is proprietary to Morningstar and/or its content providers; (2) may not be copied or distributed; and (3) is not warranted to be accurate, complete or timely. Neither Morningstar nor its content providers are responsible for any damage or losses relating from any use of this information. Past performance is no guarantee or future results.
The views expressed in this document reflect our judgement as of the publication date and are subject to change at any time without notice.
1
GE Investment Distributors, Inc., Member of FINRA & SIPC, is the principal underwriter and distributor of the GE Investments Funds, Inc. and a wholly owned subsidiary of GE Asset Management Incorporated, the investment adviser of the Fund.
| | |
| S&P 500 Index Fund | | (Unaudited) |
SSgA Funds Management, Inc. (“SSgA FM”) is the sub-adviser to the S&P 500 Index Fund. SSgA FM is registered with the SEC as an investment adviser under the Investment Advisers Act of 1940, as amended, and is a wholly owned subsidiary of State Street Corporation (State Street), a publicly held bank holding company. SSgA FM, and other advisory affiliates of State Street make up State Street Global Advisors (SSgA), the investment management arm of State Street. The Fund is managed by a team of portfolio managers and the key professionals involved in the day-to-day portfolio management for the Fund include: Karl A. Schneider and John Tucker.
Karl A. Schneider, CAIA, is a Vice President of SSgA FM and Head of US Equity Strategies for the Global Equity Beta Solutions Team (GEBS), where in addition to overseeing the management of the US equity index strategies, he also serves as a portfolio manager for a number of the group’s passive equity portfolios. Previously within GEBS, he served as a portfolio manager and product specialist for synthetic beta strategies, including commodities, buy/write, and hedge fund replication. Mr. Schneider is also a member of the SSgA Derivatives Committee. Prior to joining GEBS, Mr. Schneider worked as a portfolio manager in SSgA’s Currency Management Group, managing both active currency selection and traditional passive hedging overlay portfolios. Mr. Schneider joined State Street in 1996. He holds a BS degree in Finance and Investments from Babson College and an MS degree in Finance from Boston College. Mr. Schneider has earned the Chartered Alternative Investment Analyst designation and is a member of the CAIA Association.
John F. Tucker, CFA, is a Managing Director of SSgA FM and Co-Head of Passive Equity Strategies in North America. He is responsible for overseeing the management of all equity index strategies and exchange traded funds managed in North America. Mr. Tucker is a member of the Senior Management Group. Previously, Mr. Tucker was head of the Structured Products group in SSgA’s London office, where he was responsible for the management of all index strategies in the firm’s second largest investment center. Mr. Tucker joined State Street in 1988. Mr. Tucker received a BA from Trinity College and an MS in Finance from Boston College. He has also earned the Chartered Financial Analyst designation and is a member of the Boston Security Analysts Society and the CFA Institute. In addition, he is a member of The Russell Index Client Advisory Board and The S&P U.S. Index Advisory Panel.
| Q. | How did the GE Investments S&P 500 Index Fund perform compared to its benchmark and Morningstar peer group for the twelve-month period ended December 31, 2013? |
| A. | For the twelve-month period ended December 31, 2013, the GE Investments S&P 500 Index Fund returned 31.97%. The S&P 500® Index (S&P 500 Index), the Fund’s benchmark, returned 32.39% and the Fund’s Morningstar peer group of 324 U.S. Insurance Large Blend Funds returned an average of 31.66% over the same period. |
| Q. | What market conditions affected the Fund’s performance? |
| A. | The S&P 500 Index added value in every quarter of 2013, and the only months it lost ground during the year were June and August. For 2013 as a whole, more than 90% of the names in the index posted positive returns, and the full S&P 500 Index achieved a total return of 32.4%, its best annual result since 1997. Investors in U.S. stocks were understandably nervous as the fourth quarter got underway, since equities had already produced solidly positive returns for three consecutive quarters and the history of early autumn includes many volatile episodes. Moreover, the September postponement of a widely expected announcement of tapered Federal Reserve asset purchases had dented the U.S. dollar and diverted attention towards non-U.S. markets. When the U.S. Congress could not agree on a budget and the government underwent a partial shutdown in early October, U.S. share buyers remained on the defensive. But major averages did not breach their August lows, and investors began to anticipate a reopening of full government operations and a deal to circumvent the debt ceiling. When agreement actually came in mid-October, stocks had already built up enough momentum to drive volatility lower and lift share prices further through November. Jittery action returned in early December, when oil prices embarked on a sharp rebound. Worries about holiday spending and Chinese growth prospects contributed to the mild malaise. Even though the November employment figures reported on December 6th looked healthy, many investors stayed nervous when Congress arrived almost too easily at a new budget agreement. After all, without political rancor, the Fed might have more incentive to remove accommodation. Sure |
2

| | enough, December 18th brought the formal announcement that tapering of debt purchases would begin in January, but the accompanying guidance on maintaining interest rates at minimal levels was received very well by equity investors. The S&P 500 Index proceeded to set several new closing records, ending its extraordinary 2013 essentially on the highs. The popular benchmark returned 2.5% for December, and for the full fourth quarter, the S&P 500 Index surged 10.5%, almost matching its impressive first-quarter advance. |
| Q. | What were the primary drivers of the Fund’s performance? |
| A. | All ten of the S&P 500 Index sectors achieved double-digit gains in 2013, participating handsomely in the broad equity prosperity. The top three leadership groups even outpaced the averages consistently enough to post returns for the year that exceeded 40%. Topping the rankings was the consumer discretionary sector, which surged 43.1% for 2013 as a whole, boosted repeatedly by entertainment themes. Video purveyor Netflix and electronics retailer Best Buy led the way, and shares in both more than tripled. Travel and gaming names were also big winners. While the discretionary sector was a mild laggard in December, it still beat the full S&P 500 Index by 30 basis points in the fourth quarter, good enough for third out of ten in the last three months of the year. The healthcare sector was actually a mild underperformer for both December and the full fourth quarter, as investors shied away from defensive themes, but the sector still gained 41.5% for 2013 as a whole. Several biotechnology issues were key contributors to the strength. The third-place sector for all of 2013 was the industrials, with a 40.7% annual return. The industrials finished the year strong, with a December advance of 4.3%, which was second only to the materials group on the month. The industrials were the best sector performer of all for the full fourth quarter, gaining 13.5%. Leading industrial names during 2013 included several airlines and defense contractors. Financials benefited in 2013 from prospects of firmer interest rates, turning in a solid annual performance of 35.6% that earned the sector fourth place overall. Financials were mild laggards of the S&P 500 Index during December and the full fourth quarter. |
| | Six sectors underperformed the S&P 500 Index for the whole of 2013, but four of the laggards still returned more than 25% on the year. For information technology, where some of the big winners came from the social media and data storage arenas, the full 2013 return was 28.4%. Technology enjoyed a particularly strong finish to the year, outpacing the S&P 500 Index handily in both December and in the fourth quarter as a whole. Consumer staples were just the opposite, lagging the S&P 500 Index through the waning months of 2013. But staples still added to their strength from earlier in the year, finishing with a 26.1% gain for the full twelve months. Both energy and materials managed to outperform the S&P 500 Index during December, but only the materials were strong enough to achieve outperformance for the full fourth quarter. For all of 2013, the materials added 25.6%, while energy climbed 25.1%. The conspicuous laggards in both the fourth quarter as well as for all of 2013 were the telecommunications services and utilities sectors. Investors simply lost interest in these income-oriented groups as yield levels were biased higher after April. Telecom was the weakest group, representing the only S&P 500 Index sector to post a loss for December, and it finished the year with an 11.5% return. Utilities did only slightly better in December, and actually turned in the weakest sector performance for the full fourth quarter, during which the sector only gained 2.8%. For all of 2013, the utilities sector climbed 13.2%. |
3
| | |
| S&P 500 Index Fund | | (Unaudited) |
Understanding Your Fund’s Expenses
As a shareholder of the Fund you incur ongoing costs. Ongoing costs include portfolio management fees, professional fees, administrative fees and other Fund expenses. The following example is intended to help you understand your ongoing costs (in dollars) of investing in the Fund and to compare these costs with the ongoing costs of investing in other mutual funds.
To illustrate these ongoing costs, we have provided an example and calculated the expenses paid by investors in the Fund during the period. The information in the following table is based on an investment of $1,000, which is invested at the beginning of the period and held for the entire six-month period ended December 31, 2013.
Actual Expenses
The first section of the table provides information about actual account values and actual expenses. You may use the information in this section, together with the amount you invested, to estimate the expenses that you paid over the period. To do so, simply divide your account value by $1,000 (for example, an $8,600 account value divided by $1,000 = 8.6), then multiply the result by the number given under the heading “Expenses paid during the period” to estimate the expenses you paid on your account during the period.
Hypothetical Example for Comparison Purposes
The second section of the table provides information about hypothetical account values and hypothetical expenses based on the Fund’s actual expense ratio and an assumed rate of return of 5% per year before expenses, which is not the Fund’s actual return. The hypothetical account values and expenses may not be used to estimate the actual ending account balance or expenses you paid for the period. You may use this information to compare the ongoing costs of investing in the Fund and other funds. To do so, compare this 5% hypothetical example with the 5% hypothetical examples that appear in the shareholders reports of other funds.
Please note that the expenses shown in the table are meant to highlight and help you compare ongoing costs only and do not reflect transaction costs, such as sales charges or redemption fees, if any. Therefore, the second section of the table is useful in comparing ongoing costs only, and will not help you determine the relative total costs of owning different funds. Additionally, the expenses shown do not reflect the fees or charges associated with variable contracts through which shares of the Fund are offered.
July 1, 2013 – December 31, 2013
| | | | | | | | | | | | |
| | | Account value at the
beginning of the period ($) | | | Account value at the
end of the period ($) | | | Expenses paid
during the period ($)* | |
Actual Fund Return | | | 1,000.00 | | | | 1,161.70 | | | | 1.80 | |
Hypothetical 5% Return (2.5% for the period) | | | 1,000.00 | | | | 1,023.54 | | | | 1.68 | |
| * | Expenses are equal to the Fund’s annualized net expense ratio of 0.33% (for the period July 1, 2013 – December 31, 2013), multiplied by the average account value over the period, multiplied by 184/365 (to reflect the one-half year period). |
4
| | |
| S&P 500 Index Fund | | (Unaudited) |
Investment Profile
A mutual fund designed for investors who seek growth of capital and accumulation of income that corresponds to the investment return of the S&P 500 Index. The Fund seeks to replicate the return of the S&P 500 Index while holding transaction costs low and minimizing portfolio turnover.
|
Morningstar Performance Comparison |
Based on average annual returns for periods ended 12/31/13 |
| | | | | | | | | | | | | | | |
| | | One Year | | Five Year | | Ten
Year |
Number of funds in peer group | | | | 324 | | | | | 302 | | | | | 258 | |
Peer group average annual total return | | | | 31.66% | | | | | 16.99% | | | | | 6.78% | |
Morningstar Category in peer group: U.S. Insurance Large Blend | |
Sector Allocation
as a % of Fair Value of $206,360 (in thousands) on December 31, 2013 (b)(c)
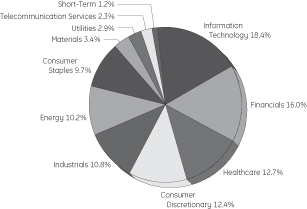
|
| as of December 31, 2013 (as a % of Fair Value) (b)(c) |
| | | | |
Apple Inc. | | | 3.03% | |
Exxon Mobil Corp. | | | 2.65% | |
Google Inc. | | | 1.88% | |
General Electric Co. | | | 1.71% | |
Microsoft Corp. | | | 1.69% | |
Johnson & Johnson | | | 1.54% | |
Chevron Corp. | | | 1.44% | |
The Procter & Gamble Co. | | | 1.33% | |
JPMorgan Chase & Co. | | | 1.32% | |
Wells Fargo & Co. | | | 1.31% | |
Change in Value of a $10,000 Investment(a)
Class 1 Shares
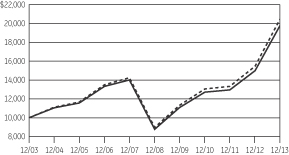

|
Average Annual Total Return |
| for the Periods Ended December 31, 2013 |
|
Class 1 Shares (Inception date: 4/15/85)
| | | | | | | | | | | | | | | | | | | | |
| | | One
Year | | Five
Year | | Ten
Year | | Ending Value of a
$10,000 Investment (a) |
S&P 500 Index Fund | | | | 31.97% | | | | | 17.63% | | | | | 7.04% | | | | $ | 19,744 | |
S&P 500 Index | | | | 32.39% | | | | | 17.94% | | | | | 7.40% | | | | $ | 20,429 | |
| (a) | Ending value of a $10,000 investment for the ten-year period or since inception, whichever is less. |
| (b) | The securities information regarding holdings, allocations and other characteristics is presented to illustrate examples of securities that the Fund has bought and the diversity of areas in which the Fund may invest as of a particular date. It may not be representative of the Fund’s current or future investments and should not be construed as a recommendation to purchase or sell a particular security. |
| (c) | Fair Value basis is inclusive of short-term investment in GE Institutional Money Market Fund Investment Class. |
See Notes to Performance on page 1 for further information, including an explanation of Morningstar peer categories.
Past performance does not predict future performance. Performance shown in the graph and table does not reflect the deduction of taxes that a shareholder would pay on fund distributions or the redemption of fund shares and does not reflect the fees or charges that would be associated with variable contracts through which shares of the Fund are offered.
5
S&P 500 Index Fund
| | |
| Schedule of Investments | | December 31, 2013 |
| | | | | | | | | | | | |
| | | |
| | | Number of Shares | | | Fair Value | | | | |
Common Stock — 98.7%† | | | | | | | | | | | | |
| | | |
Advertising — 0.2% | | | | | | | | | | | | |
| | | |
Omnicom Group Inc. | | | 3,180 | | | $ | 236,497 | | | | | |
The Interpublic Group of Companies Inc. | | | 5,530 | | | | 97,881 | | | | | |
| | | | | | | 334,378 | | | | | |
| | | |
Aerospace & Defense — 2.7% | | | | | | | | | | | | |
| | | |
General Dynamics Corp. | | | 4,067 | | | | 388,602 | | | | | |
Honeywell International Inc. | | | 9,643 | | | | 881,081 | | | | | |
L-3 Communications Holdings Inc. | | | 1,063 | | | | 113,592 | | | | | |
Lockheed Martin Corp. | | | 3,352 | | | | 498,308 | | | | | |
Northrop Grumman Corp. | | | 2,822 | | | | 323,430 | | | | | |
Precision Castparts Corp. | | | 1,800 | | | | 484,740 | | | | | |
Raytheon Co. | | | 3,969 | | | | 359,988 | | | | | |
Rockwell Collins Inc. | | | 1,636 | | | | 120,933 | | | | | |
Textron Inc. | | | 3,525 | | | | 129,579 | | | | | |
The Boeing Co. | | | 8,486 | | | | 1,158,254 | | | | (a) | |
United Technologies Corp. | | | 10,372 | | | | 1,180,334 | | | | (a) | |
| | | | | | | 5,638,841 | | | | | |
| | | |
Agricultural Products — 0.2% | | | | | | | | | | | | |
| | | |
Archer-Daniels-Midland Co. | | | 8,324 | | | | 361,262 | | | | | |
| | | |
Air Freight & Logistics — 0.8% | | | | | | | | | | | | |
| | | |
CH Robinson Worldwide Inc. | | | 1,945 | | | | 113,471 | | | | | |
Expeditors International of Washington Inc. | | | 2,500 | | | | 110,625 | | | | | |
FedEx Corp. | | | 3,711 | | | | 533,531 | | | | | |
United Parcel Service Inc. | | | 8,835 | | | | 928,382 | | | | | |
| | | | | | | 1,686,009 | | | | | |
| | | |
Airlines — 0.2% | | | | | | | | | | | | |
| | | |
Delta Air Lines Inc. | | | 10,700 | | | | 293,929 | | | | | |
Southwest Airlines Co. | | | 8,849 | | | | 166,715 | | | | | |
| | | | | | | 460,644 | | | | | |
| | | |
Aluminum — 0.1% | | | | | | | | | | | | |
| | | |
Alcoa Inc. | | | 13,140 | | | | 139,678 | | | | (a | ) |
| | | |
Apparel Retail — 0.5% | | | | | | | | | | | | |
| | | |
L Brands Inc. | | | 2,888 | | | | 178,623 | | | | | |
Ross Stores Inc. | | | 2,600 | | | | 194,818 | | | | | |
The Gap Inc. | | | 3,236 | | | | 126,463 | | | | | |
TJX Companies Inc. | | | 8,937 | | | | 569,555 | | | | | |
Urban Outfitters Inc. | | | 1,200 | | | | 44,520 | | | | (b) | |
| | | | | | | 1,113,979 | | | | | |
| |
Apparel, Accessories & Luxury Goods — 0.5% | | | | | |
| | | |
Coach Inc. | | | 3,489 | | | | 195,838 | | | | | |
Fossil Group Inc. | | | 600 | | | | 71,964 | | | | (b) | |
| | | | | | | | | | | | |
| | | |
| | | Number of Shares | | | Fair Value | | | | |
| | | |
Michael Kors Holdings Ltd. | | | 2,200 | | | $ | 178,618 | | | | (b) | |
PVH Corp. | | | 969 | | | | 131,803 | | | | | |
Ralph Lauren Corp. | | | 700 | | | | 123,599 | | | | | |
VF Corp. | | | 4,408 | | | | 274,795 | | | | | |
| | | | | | | 976,617 | | | | | |
| | | |
Application Software — 0.6% | | | | | | | | | | | | |
| | | |
Adobe Systems Inc. | | | 5,784 | | | | 346,346 | | | | (a,b) | |
Autodesk Inc. | | | 2,748 | | | | 138,307 | | | | (b) | |
Citrix Systems Inc. | | | 2,300 | | | | 145,475 | | | | (b) | |
Intuit Inc. | | | 3,600 | | | | 274,752 | | | | | |
Salesforce.com Inc. | | | 6,800 | | | | 375,292 | | | | (b) | |
Verint Systems Inc. | | | 1 | | | | 43 | | | | (b) | |
| | | | | | | 1,280,215 | | | | | |
| |
Asset Management & Custody Banks — 1.3% | | | | | |
| | | |
Ameriprise Financial Inc. | | | 2,333 | | | | 268,412 | | | | | |
BlackRock Inc. | | | 1,565 | | | | 495,275 | | | | | |
Franklin Resources Inc. | | | 5,100 | | | | 294,423 | | | | | |
Invesco Ltd. | | | 5,450 | | | | 198,380 | | | | | |
Legg Mason Inc. | | | 1,300 | | | | 56,524 | | | | | |
Northern Trust Corp. | | | 2,800 | | | | 173,292 | | | | | |
State Street Corp. | | | 5,411 | | | | 397,113 | | | | (c) | |
T Rowe Price Group Inc. | | | 3,200 | | | | 268,064 | | | | | |
The Bank of New York Mellon Corp. | | | 14,403 | | | | 503,241 | | | | | |
| | | | | | | 2,654,724 | | | | | |
| | | |
Auto Parts & Equipment — 0.4% | | | | | | | | | | | | |
| | | |
BorgWarner Inc. | | | 2,600 | | | | 145,366 | | | | | |
Delphi Automotive PLC | | | 3,400 | | | | 204,442 | | | | | |
Johnson Controls Inc. | | | 8,346 | | | | 428,150 | | | | | |
| | | | | | | 777,958 | | | | | |
| | | |
Automobile Manufacturers — 0.6% | | | | | | | | | | | | |
| | | |
Ford Motor Co. | | | 48,927 | | | | 754,944 | | | | | |
General Motors Co. | | | 14,100 | | | | 576,267 | | | | (b) | |
| | | | | | | 1,331,211 | | | | | |
| | | |
Automotive Retail — 0.3% | | | | | | | | | | | | |
| | | |
AutoNation Inc. | | | 486 | | | | 24,149 | | | | (b) | |
AutoZone Inc. | | | 444 | | | | 212,206 | | | | (b) | |
CarMax Inc. | | | 2,800 | | | | 131,656 | | | | (b) | |
O’Reilly Automotive Inc. | | | 1,400 | | | | 180,194 | | | | (b) | |
| | | | | | | 548,205 | | | | | |
| | | |
Biotechnology — 2.4% | | | | | | | | | | | | |
| | | |
Alexion Pharmaceuticals Inc. | | | 2,400 | | | | 319,344 | | | | (b) | |
Amgen Inc. | | | 9,400 | | | | 1,073,104 | | | | (a) | |
Biogen Idec Inc. | | | 2,900 | | | | 811,275 | | | | (b) | |
Celgene Corp. | | | 5,100 | | | | 861,696 | | | | (b) | |
Gilead Sciences Inc. | | | 18,998 | | | | 1,427,700 | | | | (b) | |
Regeneron Pharmaceuticals Inc. | | | 900 | | | | 247,716 | | | | (b) | |
Vertex Pharmaceuticals Inc. | | | 2,500 | | | | 185,750 | | | | (b) | |
| | | | | | | 4,926,585 | | | | | |
| | | |
Brewers — 0.1% | | | | | | | | | | | | |
| | | |
Molson Coors Brewing Co. | | | 1,898 | | | | 106,573 | | | | | |
See Notes to Schedules of Investments and Notes to Financial Statements.
6
S&P 500 Index Fund
| | |
| Schedule of Investments | | December 31, 2013 |
| | | | | | | | | | | | |
| | | |
| | | Number of Shares | | | Fair Value | | | | |
| | | |
Broadcasting — 0.4% | | | | | | | | | | | | |
| | | |
CBS Corp. | | | 6,809 | | | $ | 434,006 | | | | | |
Discovery Communications Inc. | | | 2,800 | | | | 253,176 | | | | (b) | |
Scripps Networks Interactive Inc. | | | 1,000 | | | | 86,410 | | | | | |
| | | | | | | 773,592 | | | | | |
| | | |
Building Products — 0.1% | | | | | | | | | | | | |
| | | |
Allegion PLC | | | 1,133 | | | | 50,067 | | | | (b) | |
Masco Corp. | | | 4,290 | | | | 97,684 | | | | | |
| | | | | | | 147,751 | | | | | |
| | | |
Cable & Satellite — 1.3% | | | | | | | | | | | | |
| | | |
Cablevision Systems Corp. | | | 2,800 | | | | 50,204 | | | | | |
Comcast Corp., Class A | | | 32,258 | | | | 1,676,287 | | | | | |
DIRECTV | | | 6,000 | | | | 414,540 | | | | (b) | |
Time Warner Cable Inc. | | | 3,496 | | | | 473,708 | | | | | |
| | | | | | | 2,614,739 | | | | | |
| | | |
Casinos & Gaming — 0.1% | | | | | | | | | | | | |
| | | |
International Game Technology | | | 3,400 | | | | 61,744 | | | | | |
Wynn Resorts Ltd. | | | 1,000 | | | | 194,210 | | | | | |
| | | | | | | 255,954 | | | | | |
| | | |
Coal & Consumable Fuels — 0.1% | | | | | | | | | | | | |
| | | |
CONSOL Energy Inc. | | | 2,700 | | | | 102,708 | | | | | |
Peabody Energy Corp. | | | 2,879 | | | | 56,227 | | | | | |
| | | | | | | 158,935 | | | | | |
| | | |
Commodity Chemicals — 0.2% | | | | | | | | | | | | |
| | | |
LyondellBasell Industries N.V. | | | 5,371 | | | | 431,184 | | | | | |
| | | |
Communications Equipment — 1.7% | | | | | | | | | | | | |
| | | |
Cisco Systems Inc. | | | 66,664 | | | | 1,496,607 | | | | (a) | |
F5 Networks Inc. | | | 1,000 | | | | 90,860 | | | | (b) | |
Harris Corp. | | | 1,400 | | | | 97,734 | | | | | |
Juniper Networks Inc. | | | 6,400 | | | | 144,448 | | | | (b) | |
Motorola Solutions Inc. | | | 2,935 | | | | 198,112 | | | | | |
QUALCOMM Inc. | | | 20,829 | | | | 1,546,553 | | | | | |
| | | | | | | 3,574,314 | | | | | |
| | | |
Computer & Electronics Retail — 0.1% | | | | | | | | | | | | |
| | | |
Best Buy Company Inc. | | | 3,300 | | | | 131,604 | | | | | |
GameStop Corp. | | | 1,500 | | | | 73,890 | | | | | |
| | | | | | | 205,494 | | | | | |
| | | |
Computer Hardware — 3.4% | | | | | | | | | | | | |
| | | |
Apple Inc. | | | 11,145 | | | | 6,253,571 | | | | | |
Hewlett-Packard Co. | | | 24,149 | | | | 675,689 | | | | | |
| | | | | | | 6,929,260 | | | | | |
| |
Computer Storage & Peripherals — 0.7% | | | | | |
| | | |
EMC Corp. | | | 25,214 | | | | 634,132 | | | | | |
NetApp Inc. | | | 4,400 | | | | 181,016 | | | | | |
SanDisk Corp. | | | 2,800 | | | | 197,512 | | | | | |
Seagate Technology PLC | | | 3,912 | | | | 219,698 | | | | | |
Western Digital Corp. | | | 2,600 | | | | 218,140 | | | | | |
| | | | | | | 1,450,498 | | | | | |
| | | | | | | | | | | | |
| | | |
| | | Number of Shares | | | Fair Value | | | | |
| | | |
Construction & Engineering — 0.2% | | | | | | | | | | | | |
| | | |
Fluor Corp. | | | 2,078 | | | $ | 166,843 | | | | | |
Jacobs Engineering Group Inc. | | | 1,600 | | | | 100,784 | | | | (b | ) |
Quanta Services Inc. | | | 2,500 | | | | 78,900 | | | | (b | ) |
| | | | | | | 346,527 | | | | | |
| |
Construction & Farm Machinery — 0.9% | | | | | |
| | | |
Caterpillar Inc. | | | 7,932 | | | | 720,305 | | | | | |
Cummins Inc. | | | 2,056 | | | | 289,834 | | | | | |
Deere & Co. | | | 4,782 | | | | 436,740 | | | | | |
Joy Global Inc. | | | 1,400 | | | | 81,886 | | | | | |
PACCAR Inc. | | | 4,403 | | | | 260,526 | | | | | |
| | | | | | | 1,789,291 | | | | | |
| | | |
Construction Materials — 0.0% * | | | | | | | | | | | | |
| | | |
Vulcan Materials Co. | | | 1,700 | | | | 101,014 | | | | | |
| | | |
Consumer Electronics — 0.1% | | | | | | | | | | | | |
| | | |
Garmin Ltd. | | | 1,500 | | | | 69,330 | | | | | |
Harman International Industries Inc. | | | 900 | | | | 73,665 | | | | | |
| | | | | | | 142,995 | | | | | |
| | | |
Consumer Finance — 1.0% | | | | | | | | | | | | |
| | | |
American Express Co. | | | 11,291 | | | | 1,024,433 | | | | (a | ) |
Capital One Financial Corp. | | | 7,025 | | | | 538,185 | | | | | |
Discover Financial Services | | | 6,098 | | | | 341,183 | | | | | |
SLM Corp. | | | 5,483 | | | | 144,093 | | | | | |
| | | | | | | 2,047,894 | | | | | |
| |
Data Processing & Outsourced Services — 1.9% | | | | | |
| | | |
Alliance Data Systems Corp. | | | 600 | | | | 157,758 | | | | (b | ) |
Automatic Data Processing Inc. | | | 6,080 | | | | 491,325 | | | | | |
Computer Sciences Corp. | | | 1,682 | | | | 93,990 | | | | | |
Fidelity National Information Services Inc. | | | 3,500 | | | | 187,880 | | | | | |
Fiserv Inc. | | | 3,282 | | | | 193,802 | | | | (b) | |
Mastercard Inc. | | | 1,280 | | | | 1,069,389 | | | | | |
Paychex Inc. | | | 3,825 | | | | 174,152 | | | | | |
The Western Union Co. | | | 6,324 | | | | 109,089 | | | | | |
Total System Services Inc. | | | 1,902 | | | | 63,299 | | | | | |
Visa Inc. | | | 6,300 | | | | 1,402,884 | | | | | |
| | | | | | | 3,943,568 | | | | | |
| | | |
Department Stores — 0.2% | | | | | | | | | | | | |
| | | |
Kohl’s Corp. | | | 2,573 | | | | 146,018 | | | | | |
Macy’s Inc. | | | 4,530 | | | | 241,902 | | | | | |
Nordstrom Inc. | | | 1,792 | | | | 110,745 | | | | | |
| | | | | | | 498,665 | | | | | |
| | | |
Distillers & Vintners — 0.2% | | | | | | | | | | | | |
| | | |
Beam Inc. | | | 2,041 | | | | 138,911 | | | | | |
Brown-Forman Corp. | | | 1,920 | | | | 145,094 | | | | | |
Constellation Brands Inc. | | | 2,000 | | | | 140,760 | | | | (b) | |
| | | | | | | 424,765 | | | | | |
See Notes to Schedules of Investments and Notes to Financial Statements.
7
S&P 500 Index Fund
| | |
| Schedule of Investments | | December 31, 2013 |
| | | | | | | | | | | | |
| | | |
| | | Number of Shares | | | Fair Value | | | | |
| | | |
Distributors — 0.1% | | | | | | | | | | | | |
| | | |
Genuine Parts Co. | | | 1,896 | | | $ | 157,728 | | | | | |
| | | |
Diversified Chemicals — 0.8% | | | | | | | | | | | | |
| | | |
Eastman Chemical Co. | | | 2,018 | | | | 162,853 | | | | | |
EI du Pont de Nemours & Co. | | | 11,528 | | | | 748,974 | | | | | |
FMC Corp. | | | 1,700 | | | | 128,282 | | | | | |
The Dow Chemical Co. | | | 14,945 | | | | 663,558 | | | | | |
| | | | | | | 1,703,667 | | | | | |
| | | |
Diversified Financial Services — 5.1% | | | | | | | | | | | | |
| | | |
Bank of America Corp. | | | 132,409 | | | | 2,061,608 | | | | | |
Citigroup Inc. | | | 37,453 | | | | 1,951,676 | | | | | |
Comerica Inc. | | | 2,356 | | | | 112,004 | | | | | |
JPMorgan Chase & Co. | | | 46,455 | | | | 2,716,688 | | | | (a) | |
U.S. Bancorp | | | 22,409 | | | | 905,324 | | | | | |
Wells Fargo & Co. | | | 59,544 | | | | 2,703,298 | | | | | |
| | | | | | | 10,450,598 | | | | | |
| | | |
Diversified Metals & Mining — 0.2% | | | | | | | | | | | | |
| | | |
Freeport-McMoRan Copper & Gold Inc. | | | 12,510 | | | | 472,127 | | | | | |
| | | |
Diversified REITs — 0.1% | | | | | | | | | | | | |
| | | |
Vornado Realty Trust | | | 2,147 | | | | 190,632 | | | | | |
| | | |
Diversified Support Services — 0.1% | | | | | | | | | | | | |
| | | |
Cintas Corp. | | | 1,200 | | | | 71,508 | | | | | |
Iron Mountain Inc. | | | 1,759 | | | | 53,386 | | | | | |
| | | | | | | 124,894 | | | | | |
| | | |
Drug Retail — 0.8% | | | | | | | | | | | | |
| | | |
CVS Caremark Corp. | | | 14,627 | | | | 1,046,854 | | | | | |
Walgreen Co. | | | 10,913 | | | | 626,843 | | | | | |
| | | | | | | 1,673,697 | | | | | |
| | | |
Education Services — 0.0% * | | | | | | | | | | | | |
| | | |
Graham Holdings Co. | | | 47 | | | | 31,176 | | | | | |
| | | |
Electric Utilities — 1.6% | | | | | | | | | | | | |
| | | |
American Electric Power Company Inc. | | | 6,025 | | | | 281,608 | | | | (a) | |
Duke Energy Corp. | | | 8,770 | | | | 605,218 | | | | | |
Edison International | | | 3,842 | | | | 177,885 | | | | | |
Entergy Corp. | | | 2,285 | | | | 144,572 | | | | | |
Exelon Corp. | | | 10,925 | | | | 299,236 | | | | | |
FirstEnergy Corp. | | | 5,154 | | | | 169,979 | | | | | |
NextEra Energy Inc. | | | 5,362 | | | | 459,094 | | | | | |
Northeast Utilities | | | 4,030 | | | | 170,832 | | | | | |
Pepco Holdings Inc. | | | 3,300 | | | | 63,129 | | | | | |
Pinnacle West Capital Corp. | | | 1,400 | | | | 74,088 | | | | | |
PPL Corp. | | | 7,337 | | | | 220,770 | | | | | |
The Southern Co. | | | 10,858 | | | | 446,372 | | | | | |
Xcel Energy Inc. | | | 5,880 | | | | 164,287 | | | | | |
| | | | | | | 3,277,070 | | | | | |
| | | | | | | | | | | | |
| | | |
| | | Number of Shares | | | Fair Value | | | | |
| |
Electrical Components & Equipment — 1.0% | | | | | |
| | | |
AMETEK Inc. | | | 3,000 | | | $ | 158,010 | | | | | |
Amphenol Corp. | | | 2,000 | | | | 178,360 | | | | | |
Corning Inc. | | | 18,239 | | | | 325,019 | | | | | |
Eaton Corp. PLC | | | 5,904 | | | | 449,413 | | | | | |
Emerson Electric Co. | | | 8,667 | | | | 608,250 | | | | | |
Rockwell Automation Inc. | | | 1,719 | | | | 203,117 | | | | | |
Roper Industries Inc. | | | 1,200 | | | | 166,416 | | | | | |
| | | | | | | 2,088,585 | | | | | |
| |
Electronic Equipment & Instruments — 0.0% * | | | | | |
| | | |
FLIR Systems Inc. | | | 1,700 | | | | 51,170 | | | | | |
| |
Electronic Manufacturing Services — 0.1% | | | | | |
Jabil Circuit Inc. | | | 2,109 | | | | 36,781 | | | | | |
TE Connectivity Ltd. | | | 5,000 | | | | 275,550 | | | | | |
| | | | | | | 312,331 | | | | | |
| |
Environmental & Facilities Services — 0.2% | | | | | |
| | | |
Republic Services Inc. | | | 3,115 | | | | 103,418 | | | | | |
Stericycle Inc. | | | 1,000 | | | | 116,170 | | | | (b) | |
Waste Management Inc. | | | 5,403 | | | | 242,433 | | | | | |
| | | | | | | 462,021 | | | | | |
| |
Fertilizers & Agricultural Chemicals — 0.5% | | | | | |
| | | |
CF Industries Holdings Inc. | | | 645 | | | | 150,311 | | | | | |
Monsanto Co. | | | 6,523 | | | | 760,255 | | | | (a) | |
The Mosaic Co. | | | 3,600 | | | | 170,172 | | | | | |
| | | | | | | 1,080,738 | | | | | |
| | | |
Food Distributors — 0.1% | | | | | | | | | | | | |
| | | |
Sysco Corp. | | | 7,444 | | | | 268,728 | | | | | |
| | | |
Food Retail — 0.3% | | | | | | | | | | | | |
| | | |
Safeway Inc. | | | 3,100 | | | | 100,967 | | | | | |
The Kroger Co. | | | 6,466 | | | | 255,601 | | | | | |
Whole Foods Market Inc. | | | 4,388 | | | | 253,758 | | | | | |
| | | | | | | 610,326 | | | | | |
| | | |
Footwear — 0.3% | | | | | | | | | | | | |
| | | |
NIKE Inc. | | | 9,079 | | | | 713,973 | | | | | |
| | | |
Gas Utilities — 0.1% | | | | | | | | | | | | |
| | | |
AGL Resources Inc. | | | 1,400 | | | | 66,122 | | | | | |
ONEOK Inc. | | | 2,400 | | | | 149,232 | | | | | |
| | | | | | | 215,354 | | | | | |
| | | |
General Merchandise Stores — 0.5% | | | | | | | | | | | | |
| | | |
Dollar General Corp. | | | 3,800 | | | | 229,216 | | | | (b) | |
Dollar Tree Inc. | | | 2,700 | | | | 152,334 | | | | (b) | |
Family Dollar Stores Inc. | | | 1,300 | | | | 84,461 | | | | | |
Target Corp. | | | 7,749 | | | | 490,279 | | | | | |
| | | | | | | 956,290 | | | | | |
See Notes to Schedules of Investments and Notes to Financial Statements.
8
S&P 500 Index Fund
| | |
| Schedule of Investments | | December 31, 2013 |
| | | | | | | | | | | | |
| | | |
| | | Number of Shares | | | Fair Value | | | | |
| | | |
Gold — 0.1% | | | | | | | | | | | | |
| | | |
Newmont Mining Corp. | | | 6,219 | | | $ | 143,224 | | | | | |
| | | |
Healthcare Distributors — 0.5% | | | | | | | | | | | | |
| | | |
AmerisourceBergen Corp. | | | 2,961 | | | | 208,188 | | | | | |
Cardinal Health Inc. | | | 4,251 | | | | 284,009 | | | | | |
McKesson Corp. | | | 2,802 | | | | 452,243 | | | | | |
Patterson Companies Inc. | | | 1,200 | | | | 49,440 | | | | | |
| | | | | | | 993,880 | | | | | |
| |
Healthcare Equipment — 2.0% | | | | | |
| | | |
Abbott Laboratories | | | 19,104 | | | | 732,256 | | | | (a) | |
Baxter International Inc. | | | 6,802 | | | | 473,079 | | | | (a) | |
Becton Dickinson and Co. | | | 2,488 | | | | 274,899 | | | | | |
Boston Scientific Corp. | | | 16,943 | | | | 203,655 | | | | (b) | |
CareFusion Corp. | | | 2,675 | | | | 106,519 | | | | (b) | |
Covidien PLC | | | 5,600 | | | | 381,360 | | | | | |
CR Bard Inc. | | | 901 | | | | 120,680 | | | | | |
Edwards Lifesciences Corp. | | | 1,500 | | | | 98,640 | | | | (b) | |
Intuitive Surgical Inc. | | | 420 | | | | 161,314 | | | | (b) | |
Medtronic Inc. | | | 12,232 | | | | 701,994 | | | | | |
St Jude Medical Inc. | | | 3,492 | | | | 216,329 | | | | | |
Stryker Corp. | | | 3,637 | | | | 273,284 | | | | | |
Varian Medical Systems Inc. | | | 1,300 | | | | 100,997 | | | | (b) | |
Zimmer Holdings Inc. | | | 2,000 | | | | 186,380 | | | | | |
| | | | 4,031,386 | | | | | |
| |
Healthcare Facilities — 0.0%* | | | | | |
| | | |
Tenet Healthcare Corp. | | | 1,273 | | | | 53,619 | | | | (b | ) |
| |
Healthcare Services — 0.5% | | | | | |
| | | |
DaVita Healthcare Partners Inc. | | | 2,058 | | | | 130,416 | | | | (b) | |
Express Scripts Holding Co. | | | 9,851 | | | | 691,934 | | | | (b) | |
Laboratory Corporation of America Holdings | | | 1,000 | | | | 91,370 | | | | (b) | |
Quest Diagnostics Inc. | | | 2,000 | | | | 107,080 | | | | | |
| | | | 1,020,800 | | | | | |
| |
Healthcare Supplies — 0.0%* | | | | | |
| | | |
DENTSPLY International Inc. | | | 1,800 | | | | 87,264 | | | | | |
| |
Healthcare Technology — 0.1% | | | | | |
| | | |
Cerner Corp. | | | 3,600 | | | | 200,664 | | | | (b | ) |
| |
Home Building — 0.1% | | | | | |
| | | |
DR Horton Inc. | | | 3,500 | | | | 78,120 | | | | | |
Lennar Corp. | | | 2,200 | | | | 87,032 | | | | | |
PulteGroup Inc. | | | 4,635 | | | | 94,415 | | | | | |
| | | | 259,567 | | | | | |
| |
Home Entertainment Software — 0.0%* | | | | | |
| | | |
Electronic Arts Inc. | | | 3,500 | | | | 80,290 | | | | (b | ) |
| | | | | | | | | | | | |
| | | |
| | | Number of Shares | | | Fair Value | | | | |
| |
Home Furnishing Retail — 0.1% | | | | | |
| | | |
Bed Bath & Beyond Inc. | | | 2,700 | | | $ | 216,810 | | | | (b | ) |
| |
Home Furnishings — 0.1% | | | | | |
| | | |
Leggett & Platt Inc. | | | 1,900 | | | | 58,786 | | | | | |
Mohawk Industries Inc. | | | 800 | | | | 119,120 | | | | (b) | |
| | | | 177,906 | | | | | |
| |
Home Improvement Retail — 1.0% | | | | | |
| | | |
Lowe’s Companies Inc. | | | 12,902 | | | | 639,294 | | | | | |
The Home Depot Inc. | | | 17,333 | | | | 1,427,199 | | | | | |
| | | | 2,066,493 | | | | | |
| |
Hotels, Resorts & Cruise Lines — 0.3% | | | | | |
| | | |
Carnival Corp. | | | 5,500 | | | | 220,935 | | | | | |
Marriott International Inc. | | | 2,614 | | | | 129,027 | | | | | |
Starwood Hotels & Resorts Worldwide Inc. | | | 2,400 | | | | 190,680 | | | | | |
Wyndham Worldwide Corp. | | | 1,642 | | | | 120,999 | | | | | |
| | | | 661,641 | | | | | |
| |
Household Appliances — 0.1% | | | | | |
| | | |
Whirlpool Corp. | | | 943 | | | | 147,919 | | | | | |
| |
Household Products — 2.0% | | | | | |
| | | |
Colgate-Palmolive Co. | | | 10,944 | | | | 713,658 | | | | | |
Kimberly-Clark Corp. | | | 4,736 | | | | 494,723 | | | | (a) | |
The Clorox Co. | | | 1,584 | | | | 146,932 | | | | | |
The Procter & Gamble Co. | | | 33,783 | | | | 2,750,274 | | | | | |
| | | | 4,105,587 | | | | | |
| |
Housewares & Specialties — 0.1% | | | | | |
| | | |
Newell Rubbermaid Inc. | | | 3,456 | | | | 112,009 | | | | | |
| |
Human Resource & Employment Services — 0.0%* | | | | | |
| | | |
Robert Half International Inc. | | | 1,575 | | | | 66,134 | | | | | |
| |
Hypermarkets & Super Centers — 1.1% | | | | | |
| | | |
Costco Wholesale Corp. | | | 5,406 | | | | 643,368 | | | | | |
Wal-Mart Stores Inc. | | | 20,158 | | | | 1,586,233 | | | | | |
| | | | 2,229,601 | | | | | |
| |
Independent Power Producers & Energy Traders — 0.1% | | | | | |
| | | |
AES Corp. | | | 8,300 | | | | 120,433 | | | | | |
NRG Energy Inc. | | | 4,100 | | | | 117,752 | | | | | |
| | | | 238,185 | | | | | |
| |
Industrial Conglomerates — 2.5% | | | | | |
| | | |
3M Co. | | | 7,880 | | | | 1,105,170 | | | | | |
Danaher Corp. | | | 7,300 | | | | 563,560 | | | | | |
General Electric Co. | | | 125,589 | | | | 3,520,260 | | | | (d) | |
| | | | 5,188,990 | | | | | |
See Notes to Schedules of Investments and Notes to Financial Statements.
9
S&P 500 Index Fund
| | |
| Schedule of Investments | | December 31, 2013 |
| | | | | | | | | | | | |
| | | |
| | | Number of Shares | | | Fair Value | | | | |
| |
Industrial Gases — 0.4% | | | | | |
| | | |
Air Products & Chemicals Inc. | | | 2,532 | | | $ | 283,027 | | | | (a) | |
Airgas Inc. | | | 800 | | | | 89,480 | | | | | |
Praxair Inc. | | | 3,665 | | | | 476,560 | | | | | |
| | | | 849,067 | | | | | |
| |
Industrial Machinery — 0.9% | | | | | |
| | | |
Dover Corp. | | | 2,158 | | | | 208,333 | | | | | |
Flowserve Corp. | | | 1,800 | | | | 141,894 | | | | | |
Illinois Tool Works Inc. | | | 5,127 | | | | 431,078 | | | | | |
Ingersoll-Rand PLC | | | 3,400 | | | | 209,440 | | | | | |
Pall Corp. | | | 1,378 | | | | 117,612 | | | | | |
Parker Hannifin Corp. | | | 1,844 | | | | 237,212 | | | | | |
Pentair Ltd. | | | 2,507 | | | | 194,719 | | | | | |
Snap-on Inc. | | | 709 | | | | 77,650 | | | | | |
Stanley Black & Decker Inc. | | | 1,892 | | | | 152,665 | | | | | |
Xylem Inc. | | | 2,426 | | | | 83,940 | | | | | |
| | | | 1,854,543 | | | | | |
| |
Industrial REITs — 0.1% | | | | | |
| | | |
Prologis Inc. | | | 6,129 | | | | 226,466 | | | | | |
| | | |
Insurance Brokers — 0.3% | | | | | | | | | | | | |
| | | |
Aon PLC | | | 3,836 | | | | 321,802 | | | | | |
Marsh & McLennan Companies Inc. | | | 6,953 | | | | 336,247 | | | | | |
| | | | 658,049 | | | | | |
| |
Integrated Oil & Gas — 4.7% | | | | | |
| | | |
Chevron Corp. | | | 23,812 | | | | 2,974,357 | | | | | |
Exxon Mobil Corp. | | | 54,021 | | | | 5,466,925 | | | | (a) | |
Hess Corp. | | | 3,449 | | | | 286,267 | | | | (a) | |
Occidental Petroleum Corp. | | | 10,079 | | | | 958,513 | | | | | |
| | | | 9,686,062 | | | | | |
| |
Integrated Telecommunication Services — 2.1% | | | | | |
| | | |
AT&T Inc. | | | 65,523 | | | | 2,303,789 | | | | | |
CenturyLink Inc. | | | 7,699 | | | | 245,213 | | | | | |
Frontier Communications Corp. | | | 11,474 | | | | 53,354 | | | | | |
Verizon Communications Inc. | | | 35,267 | | | | 1,733,020 | | | | | |
Windstream Holdings Inc. | | | 7,543 | | | | 60,193 | | | | | |
| | | | 4,395,569 | | | | | |
| |
Internet Retail — 1.5% | | | | | |
| | | |
Amazon.com Inc. | | | 4,517 | | | | 1,801,334 | | | | (b) | |
Expedia Inc. | | | 1,250 | | | | 87,075 | | | | | |
Netflix Inc. | | | 700 | | | | 257,719 | | | | (b) | |
priceline.com Inc. | | | 639 | | | | 742,774 | | | | (b) | |
TripAdvisor Inc. | | | 1,350 | | | | 111,820 | | | | (b) | |
| | | | 3,000,722 | | | | | |
| |
Internet Software & Services — 3.1% | | | | | |
| | | |
Akamai Technologies Inc. | | | 2,200 | | | | 103,796 | | | | (b) | |
eBay Inc. | | | 14,600 | | | | 801,394 | | | | (b) | |
Facebook Inc. | | | 20,400 | | | | 1,115,064 | | | | (b) | |
Google Inc. | | | 3,458 | | | | 3,875,415 | | | | (b) | |
VeriSign Inc. | | | 1,762 | | | | 105,333 | | | | (b) | |
Yahoo! Inc. | | | 11,689 | | | | 472,703 | | | | (b) | |
| | | | 6,473,705 | | | | | |
| | | | | | | | | | | | |
| | | |
| | | Number of Shares | | | Fair Value | | | | |
| |
Investment Banking & Brokerage — 0.9% | | | | | |
| | | |
E*TRADE Financial Corp. | | | 3,440 | | | $ | 67,562 | | | | (b) | |
Morgan Stanley | | | 16,996 | | | | 532,994 | | | | | |
The Charles Schwab Corp. | | | 13,911 | | | | 361,686 | | | | | |
The Goldman Sachs Group Inc. | | | 5,153 | | | | 913,421 | | | | | |
| | | | 1,875,663 | | | | | |
| |
IT Consulting & Other Services — 1.7% | | | | | |
| | | |
Accenture PLC | | | 7,800 | | | | 641,316 | | | | | |
Cognizant Technology Solutions Corp. | | | 3,807 | | | | 384,431 | | | | (b) | |
International Business Machines Corp. | | | 12,647 | | | | 2,372,198 | | | | | |
Teradata Corp. | | | 2,100 | | | | 95,529 | | | | (b) | |
| | | | 3,493,474 | | | | | |
| |
Leisure Products — 0.1% | | | | | |
| | | |
Hasbro Inc. | | | 1,396 | | | | 76,794 | | | | | |
Mattel Inc. | | | 4,296 | | | | 204,404 | | | | | |
| | | | 281,198 | | | | | |
| |
Life & Health Insurance — 1.1% | | | | | |
| | | |
Aflac Inc. | | | 5,800 | | | | 387,440 | | | | | |
Lincoln National Corp. | | | 3,242 | | | | 167,352 | | | | | |
MetLife Inc. | | | 13,736 | | | | 740,645 | | | | | |
Principal Financial Group Inc. | | | 3,300 | | | | 162,723 | | | | | |
Prudential Financial Inc. | | | 5,700 | | | | 525,654 | | | | | |
Torchmark Corp. | | | 1,208 | | | | 94,405 | | | | | |
Unum Group | | | 3,389 | | | | 118,886 | | | | | |
| | | | 2,197,105 | | | | | |
| |
Life Sciences Tools & Services — 0.5% | | | | | |
| | | |
Agilent Technologies Inc. | | | 4,185 | | | | 239,340 | | | | | |
Life Technologies Corp. | | | 2,103 | | | | 159,408 | | | | (b) | |
PerkinElmer Inc. | | | 1,410 | | | | 58,134 | | | | | |
Thermo Fisher Scientific Inc. | | | 4,528 | | | | 504,193 | | | | | |
Waters Corp. | | | 1,000 | | | | 100,000 | | | | (b) | |
| | | | 1,061,075 | | | | | |
| |
Managed Healthcare — 1.0% | | | | | |
| | | |
Aetna Inc. | | | 4,468 | | | | 306,460 | | | | | |
Cigna Corp. | | | 3,389 | | | | 296,470 | | | | | |
Humana Inc. | | | 1,927 | | | | 198,905 | | | | | |
UnitedHealth Group Inc. | | | 12,540 | | | | 944,262 | | | | | |
WellPoint Inc. | | | 3,700 | | | | 341,843 | | | | | |
| | | | 2,087,940 | | | | | |
| |
Metal & Glass Containers — 0.1% | | | | | |
| | | |
Ball Corp. | | | 1,832 | | | | 94,641 | | | | | |
Owens-Illinois Inc. | | | 1,800 | | | | 64,404 | | | | (b) | |
| | | | 159,045 | | | | | |
| |
Motorcycle Manufacturers — 0.1% | | | | | |
| | | |
Harley-Davidson Inc. | | | 2,800 | | | | 193,872 | | | | | |
See Notes to Schedules of Investments and Notes to Financial Statements.
10
S&P 500 Index Fund
| | |
| Schedule of Investments | | December 31, 2013 |
| | | | | | | | | | | | |
| | | |
| | | Number of Shares | | | Fair Value | | | | |
| |
Movies & Entertainment — 1.8% | | | | | |
| | | |
The Walt Disney Co. | | | 20,178 | | | $ | 1,541,599 | | | | | |
Time Warner Inc. | | | 11,338 | | | | 790,485 | | | | | |
Twenty-First Century Fox Inc. | | | 24,100 | | | | 847,838 | | | | | |
Viacom Inc. | | | 5,014 | | | | 437,923 | | | | | |
| | | | 3,617,845 | | | | | |
| | |
Multi-Line Insurance — 0.7% | | | | | | | | | |
| | | |
American International Group Inc. | | | 18,425 | | | | 940,596 | | | | | |
Assurant Inc. | | | 900 | | | | 59,733 | | | | | |
Genworth Financial Inc. | | | 6,100 | | | | 94,733 | | | | (b) | |
Hartford Financial Services Group Inc. | | | 5,604 | | | | 203,033 | | | | | |
Loews Corp. | | | 3,866 | | | | 186,496 | | | | | |
| | | | 1,484,591 | | | | | |
| | |
Multi-Sector Holdings — 1.3% | | | | | | | | | |
| | | |
Berkshire Hathaway Inc. | | | 22,169 | | | | 2,628,357 | | | | (b) | |
Leucadia National Corp. | | | 3,600 | | | | 102,024 | | | | | |
| | | | 2,730,381 | | | | | |
| | |
Multi-Utilities — 1.1% | | | | | | | | | |
| | | |
Ameren Corp. | | | 3,042 | | | | 109,999 | | | | | |
CenterPoint Energy Inc. | | | 5,218 | | | | 120,953 | | | | | |
CMS Energy Corp. | | | 3,300 | | | | 88,341 | | | | | |
Consolidated Edison Inc. | | | 3,681 | | | | 203,486 | | | | | |
Dominion Resources Inc. | | | 7,182 | | | | 464,603 | | | | | |
DTE Energy Co. | | | 2,266 | | | | 150,440 | | | | | |
Integrys Energy Group Inc. | | | 1,031 | | | | 56,097 | | | | | |
NiSource Inc. | | | 4,115 | | | | 135,301 | | | | | |
PG&E Corp. | | | 5,654 | | | | 227,743 | | | | | |
Public Service Enterprise Group Inc. | | | 6,492 | | | | 208,004 | | | | | |
SCANA Corp. | | | 1,700 | | | | 79,781 | | | | | |
Sempra Energy | | | 2,875 | | | | 258,060 | | | | | |
TECO Energy Inc. | | | 2,700 | | | | 46,548 | | | | | |
Wisconsin Energy Corp. | | | 3,000 | | | | 124,020 | | | | | |
| | | | 2,273,376 | | | | | |
| | |
Office Electronics — 0.1% | | | | | | | | | |
| | | |
Xerox Corp. | | | 13,647 | | | | 166,084 | | | | | |
| | | |
Office REITs — 0.1% | | | | | | | | | | | | |
| | | |
Boston Properties Inc. | | | 1,898 | | | | 190,502 | | | | | |
| |
Office Services & Supplies — 0.0%* | | | | | |
| | | |
Avery Dennison Corp. | | | 1,086 | | | | 54,506 | | | | | |
Pitney Bowes Inc. | | | 2,032 | | | | 47,346 | | | | | |
| | | | 101,852 | | | | | |
| | |
Oil & Gas Drilling — 0.4% | | | | | | | | | |
| | | |
Diamond Offshore Drilling Inc. | | | 900 | | | | 51,228 | | | | | |
Ensco PLC | | | 3,000 | | | | 171,540 | | | | | |
Helmerich & Payne Inc. | | | 1,400 | | | | 117,712 | | | | | |
Nabors Industries Ltd. | | | 3,300 | | | | 56,067 | | | | | |
Noble Corp. PLC | | | 3,054 | | | | 114,433 | | | | | |
Rowan Companies PLC | | | 1,677 | | | | 59,299 | | | | (b) | |
Transocean Ltd. | | | 4,200 | | | | 207,564 | | | | | |
| | | | 777,843 | | | | | |
| | | | | | | | | | | | |
| | | |
| | | Number of Shares | | | Fair Value | | | | |
| |
Oil & Gas Equipment & Services — 1.5% | | | | | |
| | | |
Baker Hughes Inc. | | | 5,564 | | | $ | 307,466 | | | | | |
Cameron International Corp. | | | 2,900 | | | | 172,637 | | | | (b) | |
FMC Technologies Inc. | | | 2,986 | | | | 155,899 | | | | (b) | |
Halliburton Co. | | | 10,345 | | | | 525,009 | | | | | |
National Oilwell Varco Inc. | | | 5,300 | | | | 421,509 | | | | | |
Schlumberger Ltd. | | | 16,346 | | | | 1,472,938 | | | | | |
| | | | 3,055,458 | | | | | |
| |
Oil & Gas Exploration & Production — 2.4% | | | | | |
| | | |
Anadarko Petroleum Corp. | | | 6,256 | | | | 496,226 | | | | | |
Apache Corp. | | | 4,948 | | | | 425,231 | | | | | |
Cabot Oil & Gas Corp. | | | 5,400 | | | | 209,304 | | | | | |
Chesapeake Energy Corp. | | | 6,315 | | | | 171,389 | | | | | |
ConocoPhillips | | | 15,219 | | | | 1,075,222 | | | | | |
Denbury Resources Inc. | | | 4,700 | | | | 77,221 | | | | (b) | |
Devon Energy Corp. | | | 4,692 | | | | 290,294 | | | | | |
EOG Resources Inc. | | | 3,400 | | | | 570,656 | | | | | |
EQT Corp. | | | 1,914 | | | | 171,839 | | | | | |
Marathon Oil Corp. | | | 8,742 | | | | 308,593 | | | | | |
Murphy Oil Corp. | | | 2,000 | | | | 129,760 | | | | | |
Newfield Exploration Co. | | | 1,900 | | | | 46,797 | | | | (b) | |
Noble Energy Inc. | | | 4,300 | | | | 292,873 | | | | | |
Pioneer Natural Resources Co. | | | 1,700 | | | | 312,919 | | | | | |
QEP Resources Inc. | | | 2,400 | | | | 73,560 | | | | | |
Range Resources Corp. | | | 2,000 | | | | 168,620 | | | | | |
Southwestern Energy Co. | | | 4,500 | | | | 176,985 | | | | (b) | |
WPX Energy Inc. | | | 2,495 | | | | 50,848 | | | | (b) | |
| | | | 5,048,337 | | | | | |
| |
Oil & Gas Refining & Marketing — 0.7% | | | | | |
| | | |
Marathon Petroleum Corp. | | | 3,821 | | | | 350,500 | | | | | |
Phillips 66 | | | 7,469 | | | | 576,084 | | | | | |
Tesoro Corp. | | | 1,700 | | | | 99,450 | | | | | |
Valero Energy Corp. | | | 6,900 | | | | 347,760 | | | | | |
| | | | 1,373,794 | | | | | |
| |
Oil & Gas Storage & Transportation — 0.4% | | | | | |
| | | |
Kinder Morgan Inc. | | | 7,984 | | | | 287,424 | | | | | |
Spectra Energy Corp. | | | 8,477 | | | | 301,951 | | | | | |
The Williams Companies Inc. | | | 8,486 | | | | 327,305 | | | | | |
| | | | 916,680 | | | | | |
| |
Packaged Foods & Meats — 1.4% | | | | | |
| | | |
Campbell Soup Co. | | | 2,315 | | | | 100,193 | | | | | |
ConAgra Foods Inc. | | | 5,068 | | | | 170,792 | | | | | |
General Mills Inc. | | | 7,969 | | | | 397,733 | | | | | |
Hormel Foods Corp. | | | 1,700 | | | | 76,789 | | | | | |
Kellogg Co. | | | 3,090 | | | | 188,706 | | | | | |
Kraft Foods Group Inc. | | | 7,330 | | | | 395,234 | | | | | |
McCormick & Company Inc. | | | 1,600 | | | | 110,272 | | | | | |
Mead Johnson Nutrition Co. | | | 2,550 | | | | 213,588 | | | | | |
Mondelez International Inc. | | | 21,990 | | | | 776,247 | | | | | |
The Hershey Co. | | | 1,861 | | | | 180,945 | | | | | |
The JM Smucker Co. | | | 1,313 | | | | 136,053 | | | | | |
Tyson Foods Inc. | | | 3,200 | | | | 107,072 | | | | | |
| | | | 2,853,624 | | | | | |
See Notes to Schedules of Investments and Notes to Financial Statements.
11
S&P 500 Index Fund
| | |
| Schedule of Investments | | December 31, 2013 |
| | | | | | | | | | | | |
| | | |
| | | Number of Shares | | | Fair Value | | | | |
| | |
Paper Packaging — 0.1% | | | | | | | | | |
| | | |
Bemis Company Inc. | | | 1,362 | | | $ | 55,787 | | | | | |
MeadWestvaco Corp. | | | 2,100 | | | | 77,553 | | | | | |
Sealed Air Corp. | | | 2,314 | | | | 78,792 | | | | | |
| | | | 212,132 | | | | | |
| | |
Paper Products — 0.1% | | | | | | | | | |
| | | |
International Paper Co. | | | 5,575 | | | | 273,342 | | | | | |
| |
Personal Products — 0.2% | | | | | |
| | | |
Avon Products Inc. | | | 5,228 | | | | 90,026 | | | | | |
The Estee Lauder Companies Inc. | | | 3,000 | | | | 225,960 | | | | | |
| | | | 315,986 | | | | | |
| | | |
Pharmaceuticals — 5.7% | | | | | | | | | | | | |
| | | |
AbbVie Inc. | | | 19,704 | | | | 1,040,568 | | | | | |
Actavis PLC | | | 2,177 | | | | 365,736 | | | | (b) | |
Allergan Inc. | | | 3,755 | | | | 417,105 | | | | | |
Bristol-Myers Squibb Co. | | | 20,418 | | | | 1,085,217 | | | | (a) | |
Eli Lilly & Co. | | | 12,143 | | | | 619,293 | | | | | |
Forest Laboratories Inc. | | | 2,918 | | | | 175,167 | | | | (b) | |
Hospira Inc. | | | 2,139 | | | | 88,298 | | | | (b) | |
Johnson & Johnson | | | 34,786 | | | | 3,186,050 | | | | | |
Merck & Company Inc. | | | 36,036 | | | | 1,803,602 | | | | | |
Mylan Inc. | | | 4,848 | | | | 210,403 | | | | (b) | |
Perrigo Co. PLC | | | 1,600 | | | | 245,536 | | | | | |
Pfizer Inc. | | | 80,044 | | | | 2,451,748 | | | | | |
Zoetis Inc. | | | 5,546 | | | | 181,299 | | | | | |
| | | | 11,870,022 | | | | | |
| | | |
Property & Casualty Insurance — 0.9% | | | | | | | | | | | | |
| | | |
ACE Ltd. | | | 4,300 | | | | 445,179 | | | | | |
Cincinnati Financial Corp. | | | 1,692 | | | | 88,610 | | | | | |
The Allstate Corp. | | | 5,586 | | | | 304,660 | | | | (a) | |
The Chubb Corp. | | | 3,194 | | | | 308,636 | | | | | |
The Progressive Corp. | | | 6,773 | | | | 184,700 | | | | | |
The Travelers Companies Inc. | | | 4,599 | | | | 416,394 | | | | | |
XL Group PLC | | | 3,500 | | | | 111,440 | | | | | |
| | | | 1,859,619 | | | | | |
| | | |
Publishing — 0.1% | | | | | | | | | | | | |
| | | |
Gannett Company Inc. | | | 2,570 | | | | 76,021 | | | | | |
News Corp. | | | 6,500 | | | | 117,130 | | | | (b) | |
| | | | 193,151 | | | | | |
| | | |
Railroads — 0.9% | | | | | | | | | | | | |
| | | |
CSX Corp. | | | 12,917 | | | | 371,622 | | | | | |
Kansas City Southern | | | 1,400 | | | | 173,362 | | | | | |
Norfolk Southern Corp. | | | 3,818 | | | | 354,425 | | | | | |
Union Pacific Corp. | | | 5,771 | | | | 969,528 | | | | | |
| | | | 1,868,937 | | | | | |
| | | |
Real Estate Services — 0.0%* | | | | | | | | | | | | |
| | | |
CBRE Group Inc. | | | 3,600 | | | | 94,680 | | | | (b | ) |
| | | |
Regional Banks — 1.0% | | | | | | | | | | | | |
| | | |
BB&T Corp. | | | 8,500 | | | | 317,220 | | | | | |
Fifth Third Bancorp | | | 11,216 | | | | 235,872 | | | | | |
| | | | | | | | | | | | |
| | | |
| | | Number of Shares | | | Fair Value | | | | |
Huntington Bancshares Inc. | | | 9,934 | | | $ | 95,863 | | | | | |
KeyCorp | | | 11,728 | | | | 157,390 | | | | | |
M&T Bank Corp. | | | 1,506 | | | | 175,329 | | | | | |
PNC Financial Services Group Inc. | | | 6,566 | | | | 509,390 | | | | | |
Regions Financial Corp. | | | 16,368 | | | | 161,880 | | | | | |
SunTrust Banks Inc. | | | 6,629 | | | | 244,013 | | | | | |
Zions Bancorporation | | | 2,500 | | | | 74,900 | | | | | |
| | | | 1,971,857 | | | | | |
| | | |
Research & Consulting Services — 0.1% | | | | | | | | | | | | |
| | | |
Equifax Inc. | | | 1,500 | | | | 103,635 | | | | | |
Nielsen Holdings N.V. | | | 2,700 | | | | 123,903 | | | | | |
The Dun & Bradstreet Corp. | | | 500 | | | | 61,375 | | | | | |
| | | | 288,913 | | | | | |
| | | |
Residential REITs — 0.2% | | | | | | | | | | | | |
| | | |
Apartment Investment & Management Co. | | | 1,831 | | | | 47,441 | | | | | |
AvalonBay Communities Inc. | | | 1,501 | | | | 177,463 | | | | | |
Equity Residential | | | 4,100 | | | | 212,667 | | | | | |
| | | | 437,571 | | | | | |
| | | |
Restaurants — 1.3% | | | | | | | | | | | | |
| | | |
Chipotle Mexican Grill Inc. | | | 400 | | | | 213,112 | | | | (b) | |
Darden Restaurants Inc. | | | 1,629 | | | | 88,569 | | | | | |
McDonald’s Corp. | | | 12,390 | | | | 1,202,202 | | | | | |
Starbucks Corp. | | | 9,398 | | | | 736,709 | | | | | |
Yum! Brands Inc. | | | 5,629 | | | | 425,608 | | | | | |
| | | | 2,666,200 | | | | | |
| | | |
Retail REITs — 0.4% | | | | | | | | | | | | |
| | | |
General Growth Properties Inc. | | | 6,900 | | | | 138,483 | | | | | |
Kimco Realty Corp. | | | 4,931 | | | | 97,387 | | | | | |
Simon Property Group Inc. | | | 3,837 | | | | 583,838 | | | | | |
The Macerich Co. | | | 1,800 | | | | 106,002 | | | | | |
| | | | 925,710 | | | | | |
| | | |
Security & Alarm Services — 0.2% | | | | | | | | | | | | |
| | | |
The ADT Corp. | | | 2,650 | | | | 107,245 | | | | | |
Tyco International Ltd. | | | 5,700 | | | | 233,928 | | | | | |
| | | | 341,173 | | | | | |
| | | |
Semiconductor Equipment — 0.2% | | | | | | | | | | | | |
| | | |
Applied Materials Inc. | | | 15,200 | | | | 268,888 | | | | (a) | |
KLA-Tencor Corp. | | | 1,900 | | | | 122,474 | | | | | |
Lam Research Corp. | | | 2,125 | | | | 115,706 | | | | (b) | |
| | | | 507,068 | | | | | |
| | | |
Semiconductors — 1.8% | | | | | | | | | | | | |
| | | |
Altera Corp. | | | 4,000 | | | | 130,120 | | | | | |
Analog Devices Inc. | | | 4,000 | | | | 203,720 | | | | | |
Broadcom Corp. | | | 6,562 | | | | 194,563 | | | | | |
First Solar Inc. | | | 910 | | | | 49,722 | | | | (b) | |
Intel Corp. | | | 61,465 | | | | 1,595,631 | | | | (a) | |
Linear Technology Corp. | | | 3,000 | | | | 136,650 | | | | | |
LSI Corp. | | | 6,892 | | | | 75,950 | | | | | |
Microchip Technology Inc. | | | 2,500 | | | | 111,875 | | | | | |
See Notes to Schedules of Investments and Notes to Financial Statements.
12
S&P 500 Index Fund
| | |
| Schedule of Investments | | December 31, 2013 |
| | | | | | | | | | | | |
| | | |
| | | Number of Shares | | | Fair Value | | | | |
Micron Technology Inc. | | | 12,854 | | | $ | 279,703 | | | | (b) | |
NVIDIA Corp. | | | 7,100 | | | | 113,742 | | | | | |
Texas Instruments Inc. | | | 13,551 | | | | 595,025 | | | | | |
Xilinx Inc. | | | 3,287 | | | | 150,939 | | | | | |
| | | | 3,637,640 | | | | | |
| | | |
Soft Drinks — 1.9% | | | | | | | | | | | | |
| | | |
Coca-Cola Enterprises Inc. | | | 2,818 | | | | 124,358 | | | | | |
Dr Pepper Snapple Group Inc. | | | 2,600 | | | | 126,672 | | | | | |
Monster Beverage Corp. | | | 1,700 | | | | 115,209 | | | | (b) | |
PepsiCo Inc. | | | 18,969 | | | | 1,573,289 | | | | (a) | |
The Coca-Cola Co. | | | 46,992 | | | | 1,941,240 | | | | (a) | |
| | | | 3,880,768 | | | | | |
| | |
Specialized Consumer Services — 0.0%* | | | | | | | | | |
| | | |
H&R Block Inc. | | | 3,092 | | | | 89,792 | | | | | |
| | | |
Specialized Finance — 0.6% | | | | | | | | | | | | |
| | | |
CME Group Inc. | | | 3,905 | | | | 306,386 | | | | | |
IntercontinentalExchange Group Inc. | | | 1,447 | | | | 325,459 | | | | | |
McGraw Hill Financial Inc. | | | 3,494 | | | | 273,231 | | | | | |
Moody’s Corp. | | | 2,484 | | | | 194,920 | | | | | |
The NASDAQ OMX Group Inc. | | | 1,200 | | | | 47,760 | | | | | |
| | | | 1,147,756 | | | | | |
| | | |
Specialized REITs — 0.9% | | | | | | | | | | | | |
| | | |
American Tower Corp. | | | 4,900 | | | | 391,118 | | | | | |
HCP Inc. | | | 5,800 | | | | 210,656 | | | | | |
Healthcare REIT Inc. | | | 3,500 | | | | 187,495 | | | | | |
Host Hotels & Resorts Inc. | | | 9,417 | | | | 183,067 | | | | | |
Plum Creek Timber Company Inc. | | | 2,100 | | | | 97,671 | | | | | |
Public Storage | | | 1,800 | | | | 270,936 | | | | | |
Ventas Inc. | | | 3,600 | | | | 206,208 | | | | | |
Weyerhaeuser Co. | | | 7,067 | | | | 223,105 | | | | | |
| | | | 1,770,256 | | | | | |
| | | |
Specialty Chemicals — 0.5% | | | | | | | | | | | | |
| | | |
Ecolab Inc. | | | 3,352 | | | | 349,513 | | | | | |
International Flavors & Fragrances Inc. | | | 1,047 | | | | 90,021 | | | | | |
PPG Industries Inc. | | | 1,803 | | | | 341,957 | | | | | |
Sigma-Aldrich Corp. | | | 1,504 | | | | 141,391 | | | | | |
The Sherwin-Williams Co. | | | 1,063 | | | | 195,061 | | | | | |
| | | | 1,117,943 | | | | | |
| | | |
Specialty Stores — 0.2% | | | | | | | | | | | | |
| | | |
PetSmart Inc. | | | 1,300 | | | | 94,575 | | | | | |
Staples Inc. | | | 8,350 | | | | 132,681 | | | | | |
Tiffany & Co. | | | 1,429 | | | | 132,583 | | | | | |
| | | | 359,839 | | | | | |
| | | |
Steel — 0.2% | | | | | | | | | | | | |
| | | |
Allegheny Technologies Inc. | | | 1,351 | | | | 48,136 | | | | | |
Cliffs Natural Resources Inc. | | | 1,900 | | | | 49,799 | | | | | |
Nucor Corp. | | | 3,936 | | | | 210,104 | | | | | |
United States Steel Corp. | | | 1,465 | | | | 43,217 | | | | | |
| | | | 351,256 | | | | | |
| | | |
Systems Software — 2.7% | | | | | | | | | | | | |
| | | |
CA Inc. | | | 4,000 | | | | 134,600 | | | | | |
Microsoft Corp. | | | 93,441 | | | | 3,497,497 | | | | (a) | |
| | | | | | | | | | | | |
| | | |
| | | Number of Shares | | | Fair Value | | | | |
Oracle Corp. | | | 43,252 | | | $ | 1,654,821 | | | | (a) | |
Red Hat Inc. | | | 2,300 | | | | 128,892 | | | | (b) | |
Symantec Corp. | | | 8,585 | | | | 202,434 | | | | | |
| | | | | | | 5,618,244 | | | | | |
| | | |
Thrifts & Mortgage Finance — 0.1% | | | | | | | | | | | | |
| | | |
Hudson City Bancorp Inc. | | | 5,300 | | | | 49,979 | | | | | |
People’s United Financial Inc. | | | 4,200 | | | | 63,504 | | | | | |
| | | | | | | 113,483 | | | | | |
| | | |
Tires & Rubber — 0.0%* | | | | | | | | | | | | |
| | | |
The Goodyear Tire & Rubber Co. | | | 2,619 | | | | 62,463 | | | | | |
| | | |
Tobacco — 1.5% | | | | | | | | | | | | |
| | | |
Altria Group Inc. | | | 25,053 | | | | 961,785 | | | | | |
Lorillard Inc. | | | 4,633 | | | | 234,800 | | | | | |
Philip Morris International Inc. | | | 19,779 | | | | 1,723,344 | | | | | |
Reynolds American Inc. | | | 4,000 | | | | 199,960 | | | | | |
| | | | | | | 3,119,889 | | | | | |
| | |
Trading Companies & Distributors — 0.2% | | | | | | | | | |
| | | |
Fastenal Co. | | | 3,500 | | | | 166,285 | | | | | |
WW Grainger Inc. | | | 782 | | | | 199,738 | | | | | |
| | | | | | | 366,023 | | | | | |
| | | |
Trucking — 0.0%* | | | | | | | | | | | | |
| | | |
Ryder System Inc. | | | 631 | | | | 46,555 | | | | | |
| |
Wireless Telecommunication Services — 0.1% | | | | | |
| | | |
Crown Castle International Corp. | | | 3,700 | | | | 271,691 | | | | (b | ) |
| | | |
Total Common Stock
(Cost $120,102,342) | | | | | | | 203,960,274 | | | | | |
| | | | | | | | |
Short-Term Investments — 1.2% | | | | | |
GE Institutional Money Market Fund—
Investment Class 0.00%
(Cost $2,399,342) | | | 2,399,342 | | | | (e,f | ) |
| | |
Total Investments
(Cost $122,501,684) | | | 206,359,616 | | | | | |
| | |
Other Assets and Liabilities,
net — 0.1% | | | 196,036 | | | | | |
| | | | | | | | |
| | |
NET ASSETS — 100.0% | | $ | 206,555,652 | | | | | |
| | | | | | | | |
The Fund had the following long futures contracts open at December 31, 2013:
| | | | | | | | | | | | | | | | | | | | |
| Description | | Expiration
date | | Number
of
Contracts | | Current
Notional
Value | | Unrealized
Appreciation |
S&P 500 Emini Index Futures | | March 2014 | | | | 34 | | | | $ | 3,129,870 | | | | $ | 123,505 | |
See Notes to Schedules of Investments and Notes to Financial Statements.
13
| | |
| Notes to Schedules of Investments | | December 31, 2013 |
The views expressed in this document reflect our judgment as of the publication date and are subject to change at any time without notice. The securities cited may not be representative of the Fund’s future investments and should not be construed as a recommendation to purchase or sell a particular security. See the Fund’s summary prospectus and statutory prospectus for complete descriptions of investment objectives, policies, risks and permissible investments.
| (a) | At December 31, 2013, all or a portion of this security was pledged to cover collateral requirements for futures. |
| (b) | Non-income producing security. |
| (c) | State Street Corp. is the parent company of State Street Bank & Trust Co., the Fund’s custodian and accounting agent. State Street Corp. is also affiliated with SSga Management, Inc., the sub-adviser. |
| (d) | General Electric Co. is the parent company of GE Asset Management Incorporated (“GEAM”), the Fund’s investment adviser. |
| (e) | Coupon amount represents effective yield. |
| (f) | GEAM, the investment adviser of the Fund, also serves as investment adviser of the GE Institutional Money Market Fund. |
| † | Percentages are based on net assets as of December 31, 2013. |
Abbreviations:
| | |
| |
REIT | | Real Estate Investment Trust |
14
Financial Highlights
Selected data based on a share outstanding throughout the fiscal years indicated
| | | | | | | | | | | | | | | | | | | | |
| | | 12/31/13 | | | 12/31/12 | | | 12/31/11 | | | 12/31/10 | | | 12/31/09 | |
| Inception date | | | — | | | | — | | | | — | | | | — | | | | 4/15/85 | |
Net asset value, beginning of period | | $ | 25.29 | | | $ | 22.31 | | | $ | 22.37 | | | $ | 19.82 | | | $ | 15.99 | |
Income/(loss) from investment operations: | | | | | | | | | | | | | | | | | | | | |
Net investment income | | | 0.55 | | | | 0.52 | | | | 0.44 | | | | 0.40 | | | | 0.38 | |
Net realized and unrealized gains/(losses) on investments | | | 7.53 | | | | 2.98 | | | | (0.06) | | | | 2.54 | | | | 3.84 | |
Total income from investment operations | | | 8.08 | | | | 3.50 | | | | 0.38 | | | | 2.94 | | | | 4.22 | |
Less distributions from: | | | | | | | | | | | | | | | | | | | | |
Net investment income | | | 0.54 | | | | 0.52 | | | | 0.44 | | | | 0.39 | | | | 0.39 | |
Total distributions | | | 0.54 | | | | 0.52 | | | | 0.44 | | | | 0.39 | | | | 0.39 | |
Net asset value, end of period | | $ | 32.83 | | | $ | 25.29 | | | $ | 22.31 | | | $ | 22.37 | | | $ | 19.82 | |
TOTAL RETURN(a) | | | 31.97% | | | | 15.70% | | | | 1.71% | | | | 14.84% | | | | 26.30% | |
| | | | | |
RATIOS/SUPPLEMENTAL DATA: | | | | | | | | | | | | | | | | | | | | |
Net assets, end of period (in thousands) | | $ | 206,556 | | | $ | 183,040 | | | $ | 179,556 | | | $ | 217,344 | | | $ | 224,165 | |
Ratios to average net assets: | | | | | | | | | | | | | | | | | | | | |
Net investment income | | | 1.75% | | | | 1.93% | | | | 1.73% | | | | 1.79% | | | | 2.05% | |
Net expenses | | | 0.35% | (b)(c) | | | 0.38% | (b)(c) | | | 0.40% | (b)(c) | | | 0.33% | (b)(c) | | | 0.43% | (b) |
Gross expenses | | | 0.40% | | | | 0.43% | | | | 0.45% | | | | 0.38% | | | | 0.43% | |
Portfolio turnover rate | | | 3% | | | | 6% | | | | 3% | | | | 4% | | | | 5% | |
Notes to Financial Highlights
| (a) | Total returns are historical and assume changes in share price, reinvestment of dividends and capital gains distributions and do not include the effect of insurance contract charges. Past performance does not guarantee future results. |
| (b) | Reflects GEAM’s waiver of a portion of the Fund’s advisory and administrative fee (“management fee”) in an amount equal to the management fee earned by GEAM with respect to the Fund’s investment in an affiliated money market fund managed by GEAM. |
| (c) | Reflects GEAM’s contractual arrangement with the Company to limit the management fee charged to the Fund to 0.30% of the average daily net assets of the Fund. |
The accompanying Notes are an integral part of these financial statements.
15
| | | | |
Statement of Assets and Liabilities
December 31, 2013 | | | |
| |
ASSETS | | | | |
Investments in securities, at Fair Value (cost $116,250,393) | | $ | 200,440,014 | |
Investments in affiliated securities, at Fair Value (cost $3,851,949) | | | 3,520,260 | |
Short-term affiliated investments (at amortized cost) | | | 2,399,342 | |
Cash | | | 712 | |
Restricted cash | | | 139,400 | |
Income receivables | | | 275,962 | |
Receivable for fund shares sold | | | 14,120 | |
Variation margin receivable | | | 11,118 | |
Other assets | | | 2,310 | |
Total assets | | | 206,803,238 | |
| |
LIABILITIES | | | | |
Payable for fund shares redeemed | | | 123,522 | |
Payable to GEAM | | | 51,396 | |
Accrued other expenses | | | 72,668 | |
Total liabilities | | | 247,586 | |
NET ASSETS | | $ | 206,555,652 | |
| |
NET ASSETS CONSIST OF: | | | | |
Capital paid in | | $ | 159,162,004 | |
Undistributed (distributions in excess of) net investment income | | | (936 | ) |
Accumulated net realized loss | | | (36,586,853 | ) |
Net unrealized appreciation (depreciation) on: | | | | |
Investments | | | 83,857,932 | |
Futures | | | 123,505 | |
NET ASSETS | | $ | 206,555,652 | |
Shares outstanding ($0.01 par value; unlimited shares authorized) | | | 6,291,213 | |
Net asset value per share | | | $32.83 | |
The accompanying Notes are an integral part of these financial statements.
16
| | | | |
Statement of Operations For the year ended December 31, 2013 | | | |
| |
INVESTMENT INCOME | | | | |
Income | | | | |
Dividend | | $ | 3,970,153 | |
Interest | | | 22,623 | |
Income from affiliated investments | | | 105,956 | |
Less: Foreign taxes withheld | | | (731 | ) |
Total income | | | 4,098,001 | |
| |
Expenses | | | | |
Advisory and administration fees | | | 685,219 | |
Directors’ fees | | | 8,607 | |
Custody and accounting expenses | | | 47,328 | |
Professional fees | | | 22,998 | |
Other expenses | | | 27,157 | |
Total expenses before waivers | | | 791,309 | |
Less: Fees waived by the adviser | | | (101,534 | ) |
Net expenses | | | 689,775 | |
Net investment income | | $ | 3,408,226 | |
| |
NET REALIZED AND UNREALIZED GAIN (LOSS) ON INVESTMENTS | | | | |
| |
Realized gain (loss) on: | | | | |
Investments | | $ | 6,728,808 | |
Affiliated investments | | | (109,233 | ) |
Futures | | | 1,305,669 | |
Foreign currency transactions | | | (21 | ) |
| |
Increase (decrease) in unrealized appreciation/depreciation on: | | | | |
Investments | | | 42,346,068 | |
Futures | | | 79,794 | |
Net realized and unrealized gain on investments | | | 50,351,085 | |
Net increase in net assets resulting from operations | | $ | 53,759,311 | |
The accompanying Notes are an integral part of these financial statements.
17
Statements of Changes in Net Assets
| | | | | | | | |
| | | Year Ended December 31,
2013 | | | Year Ended December 31,
2012 | |
| | |
INCREASE (DECREASE) IN NET ASSETS | | | | | | | | |
Operations: | | | | | | | | |
Net investment income | | $ | 3,408,226 | | | $ | 3,704,324 | |
Net realized gain (loss) on investments, futures and foreign currency transactions | | | 7,925,223 | | | | 8,128,277 | |
Net increase (decrease) in unrealized appreciation/depreciation on investments and futures | | | 42,425,862 | | | | 15,990,184 | |
Net increase (decrease) from operations | | | 53,759,311 | | | | 27,822,785 | |
Distributions to shareholders from: | | | | | | | | |
Net investment income | | | (3,372,501 | ) | | | (3,686,341 | ) |
Total distributions | | | (3,372,501 | ) | | | (3,686,341 | ) |
Increase (decrease) in assets from operations and distributions | | | 50,386,810 | | | | 24,136,444 | |
Share transactions: | | | | | | | | |
Proceeds from sale of shares | | | 12,856,923 | | | | 15,290,534 | |
Value of distributions reinvested | | | 3,372,501 | | | | 3,686,341 | |
Cost of shares redeemed | | | (43,100,366 | ) | | | (39,629,118 | ) |
Net increase (decrease) from share transactions | | | (26,870,942 | ) | | | (20,652,243 | ) |
Total increase (decrease) in net assets | | | 23,515,868 | | | | 3,484,201 | |
| | |
NET ASSETS | | | | | | | | |
Beginning of year | | | 183,039,784 | | | | 179,555,583 | |
End of year | | $ | 206,555,652 | | | $ | 183,039,784 | |
Undistributed (distributions in excess of) net investment income, end of period | | $ | (936 | ) | | $ | – | |
| | |
CHANGES IN FUND SHARES | | | | | | | | |
Shares sold | | | 430,062 | | | | 634,763 | |
Issued for distributions reinvested | | | 103,103 | | | | 146,633 | |
Shares redeemed | | | (1,479,380 | ) | | | (1,592,286 | ) |
Net decrease in fund shares | | | (946,215 | ) | | | (810,890 | ) |
The accompanying Notes are an integral part of these financial statements.
18
| | |
| Notes to Financial Statements | | December 31, 2013 |
| 1. | Organization of the Company |
GE Investments Funds, Inc. (the “Company”) was incorporated under the laws of the Commonwealth of Virginia on May 14, 1984 and is registered under the Investment Company Act of 1940, as amended (the “1940 Act”), as an open-end management investment company. The Company is composed of eleven investment portfolios (collectively the “Funds”), although only the following eight are currently being offered: U.S. Equity Fund, S&P 500 Index Fund (the “Fund”), Premier Growth Equity Fund, Core Value Equity Fund, Small-Cap Equity Fund, Total Return Fund, Income Fund and Real Estate Securities Fund.
Shares of the Funds of the Company are offered only to insurance company separate accounts that fund certain variable life insurance contracts and variable annuity contracts. GE Asset Management Incorporated (“GEAM”) is the investment adviser and administrator of each of the Funds.
| 2. | Summary of Significant Accounting Policies |
The preparation of financial statements in conformity with U.S. generally accepted accounting principles (“GAAP”) requires management to make estimates and assumptions that affect the reported amounts of assets and liabilities and disclosure of contingent assets and liabilities at the date of the financial statements and the reported amounts of increases and decreases in net assets from operations during the reporting period. Actual results may differ from those estimates.
Subsequent events after the balance sheet date through the date the financial statements were issued have been evaluated in the preparation of the financial statements. There are no items to report.
The following summarizes the significant accounting policies of the Company:
Securities Valuation and Transactions All investments in securities are recorded at their estimated fair value, as described in Note 3.
Securities transactions are accounted for as of the trade date. Realized gains and losses on investments sold are recorded on the basis of identified cost for both financial statement and federal tax purposes.
Derivatives The Fund is subject to equity price risk in the normal course of pursuing its investment objectives. The Fund may enter into derivative transactions (such as futures) to gain market exposure to a certain type of broad-based index as an alternative to investing directly in the securities representing such index.
Futures Contracts A futures contract represents a commitment for the future purchase or sale of an asset at a specified price on a specified date. During the year ended December 31, 2013, the Fund invested in stock index future contracts to gain equity exposure for accumulating and residual cash positions. Buying futures tends to increase a Fund’s exposure to the underlying instrument while selling futures tends to decrease a Fund’s exposure to the underlying instrument, or hedge other Fund investments. The Fund will not enter into a transaction involving futures for speculative purposes. With futures contracts, there is minimal counterparty credit risk to the Fund since futures contracts are exchange traded and the exchange’s clearinghouse, as counterparty to all traded futures, guarantees the futures against default. The Fund’s risks in using these contracts include changes in the value of the underlying instruments, non-performance of the counterparties under the contracts’ terms and changes in the liquidity of the secondary market for the contracts. Futures contracts are valued at the settlement price established each day by the board of trade or exchange on which they principally trade.
Upon entering into a financial futures contract, the Fund is required to pledge to the broker an amount of cash and/or other assets equal to a certain percentage of the contract amount, known as initial margin deposit. Subsequent payments, known as variation margin, are made or received by the Fund each day, depending on the daily fluctuation in the fair value of the underlying security. The Fund records an unrealized gain or loss equal to the daily variation margin. Should market conditions move unexpectedly, the Fund may not achieve the anticipated benefits of the futures contracts and may incur a loss. The Fund recognizes a realized gain or loss on the expiration or closing of a futures contract.
Investment Income Corporate actions (including cash dividends) are recorded on the ex-dividend date, net of applicable withholding taxes, except for certain foreign corporate actions which are recorded as soon after the ex-dividend date as such information becomes available. Withholding taxes in foreign dividends have been provided for in accordance with the Fund’s understanding of the applicable country’s tax rules and rates.
Interest income is recorded on the accrual basis. Accretion of discounts and amortization of premiums on taxable bonds are to the call or maturity date, whichever is shorter, using the effective yield method.
Expenses Fund specific expenses are charged to the Fund that incurs such expenses. Such expenses may
19
| | |
| Notes to Financial Statements | | December 31, 2013 |
include custodial fees, legal and accounting fees, printing costs and registration fees. Expenses that are not fund specific are allocated pro rata across the Funds. Expenses of the Fund are generally paid directly by the Fund, however, expenses may be paid by GEAM and reimbursed by the Fund.
Federal Income Taxes The Fund intends to comply with all sections of the Internal Revenue Code applicable to regulated investment companies including the distribution of substantially all of its taxable net investment income and net realized capital gains to its shareholders. Therefore, no provision for federal income tax has been made. The Fund is treated as a separate taxpayer for federal income tax purposes.
The Fund utilizes various methods to measure the fair value of most of its investments on a recurring basis. GAAP establishes a framework for measuring fair value and providing related disclosures. Broadly, the framework requires fair value to be determined based on the exchange price that would be received for an asset or paid to transfer a liability (an exit price) in the principal or most advantageous market for the asset or liability in an orderly transaction between market participants at the measurement date. In the absence of active markets for the identical assets or liabilities, such measurements involve developing assumptions based on market observable data and, in the absence of such data, internal information that is consistent with what market participants would use in a hypothetical transaction that occurs at the measurement date. It also establishes a three-level valuation hierarchy based upon observable and non-observable inputs.
Observable inputs reflect market data obtained from independent sources, while unobservable inputs reflect our market assumptions. Preference is given to observable inputs. These two types of inputs create the following fair value hierarchy:
Level 1 — Quoted prices for identical investments in active markets.
Level 2 — Quoted prices for similar investments in active markets; quoted prices for identical or similar investments in markets that are not active; and model-derived valuations whose inputs are observable or whose significant value drivers are observable.
Level 3 — Significant inputs to the valuation model are unobservable.
Policies and procedures are maintained to value investments using the best and most relevant data available. In addition, pricing vendors are utilized to assist in valuing investments. GEAM performs periodic reviews of the methodologies used by independent pricing services including price validation of individual securities.
Fair Value Measurement The following section describes the valuation methodologies the Fund uses to measure different financial investments at fair value.
The Fund’s portfolio securities are valued generally on the basis of market quotations. Equity securities generally are valued at the last reported sale price on the primary market in which they are traded. Portfolio securities listed on NASDAQ are valued using the NASDAQ Official Closing Price, Level 1 securities primarily include publicly-traded equity securities. If no sales occurred on the exchange or NASDAQ that day, the portfolio security generally is valued using the last reported bid price. In those circumstances the Fund classifies the investment securities in Level 2.
Short-term investments of sufficient credit quality with remaining maturities of sixty days or less at the time of purchase are typically valued on the basis of amortized cost which approximates fair value and these are included in Level 2. If it is determined that amortized cost does not approximate fair value, securities may be valued based on dealer supplied valuations or quotations. In these infrequent circumstances, pricing services may provide the Fund with valuations that are based on significant unobservable inputs, and in those circumstances the investment securities are classified in Level 3.
If prices are not readily available for a portfolio security, or if it is believed that a price for a portfolio security does not represent its fair value, the security may be valued using procedures approved by the Fund’s Board of Directors that are designed to establish its “fair” value. These securities are typically classified in Level 3. Those procedures require that the fair value of a security be established by a valuation committee of GEAM. The valuation committee follows different protocols for different types of investments and circumstances. The fair value procedures may be used to value any investment of the Fund in the appropriate circumstances.
Fair value determinations generally are used for securities whose value is affected by a significant event that will materially affect the value of a security and which occurs subsequent to the time of the close of the principal market on which such security trades but prior to the calculation of the Fund’s NAV.
20
| | |
| Notes to Financial Statements | | December 31, 2013 |
The value established for such a portfolio security may be different than what would be produced through the use of market quotations or another methodology. Portfolio securities that are valued using techniques other than market quotations, including “fair valued” securities, may be subject to greater fluctuation in their value from one day to the next than would be the case if market quotations were used. In addition, there is no assurance that the Fund could sell a portfolio security for the value established for it at any time and it is possible that the Fund would incur a loss because a portfolio security is sold at a discount to its established value.
Other financial investments are derivative instruments that are not reflected in total investments, such as futures,
forwards, swaps, and written options contracts, which are valued based on fair value as discussed above.
The Fund uses closing prices for derivatives included in Level 1, which are traded either on exchanges or liquid over-the-counter markets. Derivative assets and liabilities included in Level 2 primarily represent interest rate swaps, cross-currency swaps and foreign currency and commodity forward and option contracts. Derivative assets and liabilities included in Level 3 primarily represent interest rate products that contain embedded optionality or prepayment features.
The inputs or methodology used for valuing securities are not an indication of the risk associated with investing in those securities.
The following table presents the Fund’s investments measured at fair value on a recurring basis at December 31, 2013:
| | | | | | | | | | | | | | | | | | | | |
| Investments | | Level 1 | | Level 2 | | Level 3 | | Total |
Investments in Securities† | | | | | | | | | | | | | | | |
Common Stock | | | $ | 203,960,274 | | | | $ | — | | | | $ | — | | | | $ | 203,960,274 | |
Short-Term Investments | | | | 2,399,342 | | | | | — | | | | | — | | | | | 2,399,342 | |
| | | | | | | | | | | | | | | | | | | | |
Total Investments in Securities | | | $ | 206,359,616 | | | | $ | — | | | | $ | — | | | | $ | 206,359,616 | |
| | | | | | | | | | | | | | | | | | | | |
Other Financial Instruments* | | | | | | | | | | | | | | | |
Futures Contracts — Unrealized Appreciation | | | $ | 123,505 | | | | $ | — | | | | $ | — | | | | $ | 123,505 | |
| | | | | | | | | | | | | | | | | | | | |
|
| |
| † | See Schedule of Investments for industry classification. |
| * | Other financial instruments include derivative instruments such as futures contracts. Amounts shown represent unrealized appreciation (depreciation), at period end. |
There were no transfers between fair value levels. Transfers between fair value levels are considered to occur at the beginning of the period.
| 4. | Derivatives Transactions |
Shown below are the derivative contracts entered into by the Fund, summarized by primary risk exposure as they appear on the Statement of Assets and Liabilities, all of which are not accounted for as hedging instruments under FASB Accounting Standards Codification (“ASC”) No. 815 Derivatives and Hedging as of December 31, 2013.
| | | | | | | | | | | | |
| | | Asset Derivatives December 31, 2013 | | | Liability Derivatives December 31, 2013 | |
Derivatives not accounted for as hedging
instruments under ASC 815 | | Location in the Statements of Assets and Liabilities | | Fair Value ($) | | | Location in the Statements of Assets and Liabilities | | Fair
Value ($) | |
Equity Contracts | | Assets, Net Assets — Net Unrealized Appreciation/ (Depreciation) on Futures | | | 123,505 | * | | Liabilities, Net Assets — Net Unrealized Appreciation/ (Depreciation) on Futures | | | — | |
| * | Includes cumulative unrealized appreciation/(depreciation) of futures contracts as reported in the Schedule of Investments and within the components of the net assets section of the Statement of Assets and Liabilities. Only the current day’s variation margin is reported within the Assets and/or Liabilities section on the Statement of Assets and Liabilities. |
21
| | |
| Notes to Financial Statements | | December 31, 2013 |
Shown below are the effects of derivative instruments on the Fund’s Statement of Operation, summarized by primary risk exposure all of which are not accounted for as hedging instruments under ASC 815.
| | | | | | | | | | | | | | |
Derivatives not accounted for as hedging instruments under ASC 815 | | Location in the Statements of Operations | | Total Notional Amount of Futures Contracts/Foreign
Currency Forward Contracts Purchased/(Sold) ($) | | | Realized Gain
(Loss) on
Derivatives
Recognized
in Income ($) | | | Change in
Unrealized
Appreciation
(Depreciation)
on Derivatives
Recognized in
Income ($) | |
Equity Contracts | | Realized gain/(loss) on futures, Increase/(decrease) in unrealized appreciation/ (depreciation) on Futures | |
| 25,527,613/
(30,029,944) |
| | | 1,305,669 | | | | 79,794 | |
| 5. | Compensation and Fees Paid to Affiliates |
GEAM, a registered investment adviser, was retained by the Company’s Board of Directors effective May 1, 1997 to act as investment adviser and administrator of the Fund. GEAM’s compensation for investment advisory and administrative services (“management fee”) is paid monthly based on the average daily net assets of the Fund at an annualized rate of 0.35%.
GEAM has entered into a contractual arrangement with the Company to limit the management fee charged to the Fund to 0.30% of the average daily net assets of the Fund (the “Management Fee Limitation Agreement”). Unless terminated or amended, this Management Fee Limitation Agreement will continue in effect until April 30, 2014. The Management Fee Limitation Agreement can be amended or terminated only with the approval of the Company’s Board of Directors and GEAM.
GEAM has a contractual arrangement with the Fund to waive a portion of the Fund’s management fee in the amount equal to the management fee earned by GEAM with respect to the Fund’s investment in the GE Institutional Money Market Fund, if any.
Directors’ Compensation The Fund pays no compensation to its directors who are officers or employees of GEAM or its affiliates. Directors who are not such officers or employees also serve in a similar capacity
for other funds advised by GEAM. Compensation paid to non-interested Directors are reflected on the Statement of Operations. These fees are allocated pro rata across all of the mutual fund platforms served by the Directors, including the Fund, and are based upon the relative net assets of each fund within such platforms.
Pursuant to an investment sub-advisory agreement with GEAM, SSgA Funds Management, Inc. (“SSgA”) is the sub-adviser to the Fund. SSgA is responsible for the day-to-day portfolio management of the assets of the Fund, including the responsibility for making decisions to buy, sell or hold a particular security, under the general supervision of GEAM and the Board. For their services, GEAM pays SSgA monthly sub-advisory fees which are calculated as a percentage of the average daily net assets of the Fund.
| 7. | Investment Transactions |
Purchases and Sales of Securities The cost of purchases and the proceeds from sales of investments, other than short-term securities, for the year ended December 31, 2013, were as follows:
| | | | | | |
| Non-U.S. Government Securities | |
| Purchases | | | Sales | |
| $ | 5,495,037 | | | $ | 27,360,983 | |
Affiliated Investments Transactions with affiliated investments for the year ended December 31, 2013 were as follows:
| | | | | | | | | | | | | | | | | | | | | | | | | | | | | | |
Security | | |
| Value,
Beginning of
period |
| | |
| Cost of
purchases |
| | |
| Proceeds
from sales |
| | |
| Dividend/Interest
income |
| | |
| Realized gain
(loss) |
| | |
| Value, end of
period |
|
General Electric, Common Stock | | | $ | 3,057,446 | | | | $ | 37,318 | | | | $ | (514,014 | ) | | | $ | 105,233 | | | | $ | (109,233 | ) | | | $ | 3,520,260 | |
22
| | |
| Notes to Financial Statements | | December 31, 2013 |
The Fund is subject to ASC 740, Income Taxes. ASC 740 provides guidance for financial accounting and reporting for the effects of income taxes that result from an entity’s activities during the year. ASC 740 also provides guidance regarding how certain uncertain tax positions should be recognized, measured, presented and disclosed in the financial statements. ASC 740 requires evaluation of tax
positions taken or expected to be taken in the course of preparing the Fund’s tax returns to determine whether the tax positions are “more likely than not” of being sustained by the applicable tax authority. There are no adjustments to the Fund’s net assets required under ASC 740. The Fund’s 2010, 2011, 2012, and 2013 fiscal years tax returns are still open to examination by the Federal and applicable state tax authorities.
At December 31, 2013, information on the tax cost of investments and distributable earnings on a tax basis was as follows:
| | | | | | | | | | | | | | | | | | | | | | | | | | | | | | |
Cost of
Investments For
Tax Purposes | | | Gross Tax | | | Net Tax Appreciation/
(Depreciation) | | | Undistributed | | | | |
| | Appreciation | | | Depreciation | | | Investments | | | Derivatives/
Currency | | | Income | | | Accum.
Capital
Gain/(Loss) | | | Late-Year Losses | |
| $ | 130,583,666 | | | $ | 79,490,293 | | | $ | (3,714,343 | ) | | $ | 75,775,950 | | | $ | 123,505 | | | $ | — | | | $ | (28,382,302 | ) | | $ | — | |
As of December 31, 2013, the Fund had capital loss carryovers, as indicated below. Capital loss carryovers are available to offset future realized capital gains to the extent provided in the Internal Revenue Code and regulations thereunder. To the extent that these carryover losses are used to offset future capital gains, it is probable that gains offset will not be distributed to shareholders because they would be taxable as ordinary income.
| | | | | | | | | | |
| Amount | | | | |
| Short-Term | | | Long-Term | | | Expires | |
| $ | 5,131,837 | | | $ | — | | | | 12/31/2016 | |
| | 20,177,021 | | | | — | | | | 12/31/2017 | |
| | 3,073,444 | | | | — | | | | 12/31/2018 | |
These amounts will be available to offset future taxable capital gains. Under the recently enacted Regulated Investment Company Modernization Act of 2010, the Fund will be permitted to carry forward capital losses incurred in taxable years beginning after December 22, 2010 for an unlimited period. However, any losses incurred during those future years will be required to be utilized prior to the losses incurred in pre-enactment tax years. As a result of this ordering rule, pre-enactment capital loss carryforwards may be more likely to expire unused. Additionally, post-enactment capital losses that are carried forward will retain their character as either short term or long-term capital losses rather than being considered all short-term as under previous law.
During the year ended December 31, 2013, the Fund utilized $7,738,220 of prior year capital loss carryovers.
Any qualified late-year loss is deemed to arise on the first day of the Fund’s next tax year (if the Fund elects to defer such loss). Under this regime, generally, the Fund can elect to defer any post-October capital loss and/or any late-year ordinary loss as defined by the Internal Revenue Code.
The Fund incurred no such losses for the year ended December 31, 2013.
The tax character of distributions paid during the years ended December 31, 2013 and December 31, 2012 were as follows:
| | | | | | | | | | | | | | | |
| Year | | Ordinary Income | | Long-Term Capital Gains | | Total |
2013 | | | $ | 3,372,501 | | | | $ | — | | | | $ | 3,372,501 | |
2012 | | | | 3,686,341 | | | | | — | | | | | 3,686,341 | |
Distributions to Shareholders The Fund declares and pays any dividends from net investment income annually. The Fund declares and pays any net realized capital gains in excess of capital loss carryforwards distributions annually. The character of income and gains to be distributed is determined in accordance with income tax regulations which may differ from generally accepted accounting principles. These differences include (but are not limited to) futures, investments organized as partnerships for tax purposes, distributions from Real Estate Investment Trusts (REITs) and other equity investments, and losses deferred due to wash sale transactions. Reclassifications due to permanent book/tax differences are made to the Fund’s capital accounts to
23
| | |
| Notes to Financial Statements | | December 31, 2013 |
reflect income and gains available for distribution (or available capital loss carryovers) under income tax regulations. These reclassifications have no impact on net investment income, realized gains or losses, or the net asset value of the Fund. The calculation of net investment income per share in the Financial Highlights table excludes these adjustments.
The reclassifications for the year ended December 31, 2013 were as follows:
| | | | | | | | | | |
Undistributed Net Investment Income | | | Accumulated Net Realized Gain (Loss) | | | Capital Paid In | |
| $ | (36,661 | ) | | $ | 468,219 | | | $ | (431,558 | ) |
24
Report of Independent Registered Public Accounting Firm
The Shareholders and Board of Directors
GE Investments Funds, Inc.
We have audited the accompanying statement of assets and liabilities, including the schedule of investments, of the S&P 500 Index Fund (the “Fund”), a series of GE Investments Funds, Inc., as of December 31, 2013 and the related statement of operations for the year then ended, statements of changes in net assets for each of the years in the two-year period then ended, and the financial highlights for each of the years in the five-year period then ended. These financial statements and financial highlights are the responsibility of the Fund’s management. Our responsibility is to express an opinion on these financial statements and financial highlights based on our audits.
We conducted our audits in accordance with the standards of the Public Company Accounting Oversight Board (United States). Those standards require that we plan and perform the audit to obtain reasonable assurance about whether the financial statements are free of material misstatement. An audit includes examining, on a test basis, evidence supporting the amounts and disclosures in the financial statements. Our procedures included confirmation of securities owned as of December 31, 2013 by correspondence with the custodian and brokers, or by other appropriate auditing procedures where replies from brokers were not received. An audit also includes assessing the accounting principles used and significant estimates made by management, as well as evaluating the overall financial statement presentation. We believe that our audits provide a reasonable basis for our opinion.
In our opinion, the financial statements and financial highlights referred to above present fairly, in all material respects, the financial position of the S&P 500 Index Fund as of December 31, 2013, the results of its operations, changes in its net assets and financial highlights for each of the years described above, in conformity with U.S. generally accepted accounting principles.

Boston, Massachusetts
February 17, 2014
25
| | |
| Advisory and Administrative Agreement Renewal | | (Unaudited) |
The Board of Directors of the GE Investments Funds, Inc. (the “Board”), including the independent Board members, considered and unanimously approved the continuance for an additional year of the Fund’s Investment Advisory and Administration Agreement with GE Asset Management Incorporated (“GEAM”) and the Investment Sub-Advisory Agreement with the Fund’s sub-adviser, SSgA Funds Management, Inc. (“SSgA”), at meetings held on December 11 and December 13, 2013.
In considering whether to approve the Fund’s investment advisory and sub-advisory agreements, the Board members considered and discussed a substantial amount of information and analysis provided, at the Board’s request, by GEAM and SSgA. The Board members also considered detailed information regarding performance and expenses of other investment companies, including those with similar investment strategies and sizes, which was prepared by independent third party provider Morningstar, Inc. (“Morningstar”). The Board members reviewed the fees charged by GEAM for other mutual funds that employ a similar investment strategy as the Fund. The Board had the opportunity to ask questions and request additional information in connection with its considerations.
Before approving the Fund’s investment advisory and sub-advisory agreements, the independent Board members reviewed the information provided with management of GEAM and with their independent legal counsel. The Board members also reviewed a memorandum prepared by independent legal counsel discussing the legal standards for the consideration of the proposed continuances. The independent Board members discussed the proposed continuances in detail during a private session with their independent legal counsel at which no representatives of GEAM or SSgA were present. The independent Board members and their independent legal counsel requested, received and considered additional information from GEAM following these sessions.
In advance of the meetings, and in response to their request, the Board members received from GEAM written responses to their inquiries, which included substantial exhibits and other materials related to GEAM’s business and the services it provides to the Fund. Also in advance of the meetings, the Board members received from SSgA a written response to a letter of inquiry prepared by GEAM at the Board’s request, which included substantial exhibits and other materials related to the business of, and services provided by, SSgA. The Board members took into
account their experience as Board members and particularly their previous consideration of these types of agreements. When feasible, information was presented in a manner to facilitate comparison to prior periods and to reflect certain enhancements to GEAM’s infrastructure, systems and shareholder servicing model. To focus their review, the Board members asked GEAM management and SSgA, in their oral presentations and/or written materials, to highlight material differences from the information presented in recent years.
During the meetings, the Board members had an opportunity to discuss this information with GEAM representatives, including senior executives, representatives from the legal, compliance and finance departments, and investment personnel. The Board members also had an opportunity to hear presentations by representatives of SSgA during the past year. The Board members posed questions to these representatives and engaged in substantive discussions with them concerning each of their investment processes.
In reaching their determinations relating to continuance of the Fund’s investment advisory and sub-advisory agreements, the Board members considered all factors that they deemed relevant, including the factors discussed below. In their deliberations, the Board members did not identify any particular information that was all-important or controlling, and each Board member may have attributed different weights to the various factors. In particular, the Board members focused on the following:
The Nature, Extent And Quality Of Services Provided.
The Board members reviewed the services provided by GEAM and SSgA, taking into account their past experiences with GEAM and their multi-year experience with SSgA. In connection with their consideration of GEAM’s services, the Board members focused on the favorable attributes of GEAM, including (i) an investment philosophy oriented toward long-term performance; (ii) effective processes used for overseeing sub-advisers; (iii) effective processes used for providing Fund administration, including controllership and compliance functions, the optimization of its Fund administration platform and the continued oversight of the performance of other companies that provide services to the Fund and its shareholders; (iv) highly skilled professionals including analysts, research professionals, traders and portfolio managers with a depth of experience relevant to the Fund; (v) access to significant and enhanced technological
26
| | |
| Advisory and Administrative Agreement Renewal | | (Unaudited) |
resources from which the Fund may benefit; and (vi) a favorable history and reputation. The Board members noted that the Fund represents only a small portion of the assets managed by GEAM, but benefits from a full array of services and resources provided by GEAM.
In connection with their consideration of the services provided by SSgA, the Board members focused on SSgA’s favorable attributes, including its substantial experience managing funds of this type, investment philosophy and discipline, experienced investment and trading personnel, systems and other resources, and favorable history and reputation.
In light of the foregoing, the Board, including the independent Board members, concluded that the services provided by GEAM and SSgA continue to be satisfactory.
Investment Performance Of The Fund And The Sub-Adviser.
The Board members considered the investment performance of the Fund for various periods. The Board members reviewed detailed comparisons of the performance of the Fund with the relevant securities index and peer groupings of mutual funds prepared by Morningstar with respect to various periods. The Board members also engaged in detailed discussions with GEAM management and representatives of SSgA about each of their investment processes and performance results. These discussions focused on the Fund’s investment objective, the number and experience of portfolio management personnel, the passive investment style and approach employed, the likely market cycles for the Fund’s investment style and the reasons for the Fund’s relative underperformance in certain periods.
The Board, including the independent Board members, concluded that the Fund’s performance was acceptable overall taking into consideration the factors discussed above.
Cost Of The Services Provided And Profits Realized From The Relationships With The Fund.
The Board members considered the fees paid to GEAM by the Fund, as well as those paid to SSgA by GEAM, and the cost of the services provided by GEAM and SSgA to the Fund. The Board members reviewed the information they had requested from GEAM and SSgA concerning their profitability. The Board members considered the profit margin information for GEAM’s investment company business as a whole, as well as GEAM’s profitability data for the Fund. In this regard, the Board members
considered that GEAM has agreed to waive a portion of the fee it charges to the Fund to the extent necessary to maintain a management fee of 0.30% of average daily net assets until April 30, 2014, at which time GEAM intends to continue to extend the waiver for an additional one year period. The Board members reviewed GEAM’s assumptions and the methods of cost allocation used by GEAM in preparing Fund-specific profitability data. The Board members also discussed with GEAM the basis for its belief that the methods of allocation used were reasonable for each area of its business.
Information was presented regarding the financial condition of GEAM and SSgA for various past periods. The Board members noted and discussed the differences in fees paid compared to other similar mutual funds managed by GEAM and the relationship of the fees paid in light of any differences in the services provided and other relevant factors, and noted that GEAM, and not the Fund, pays the sub-advisory fees to SSgA. The Board members determined that GEAM and SSgA should be entitled to earn a reasonable level of profits for the services they provide to the Fund. The Board members also recognized that GEAM has made and continues to make significant investments in its business in fulfilling its obligations to the Fund and supporting its Fund-related activities.
Based on their review, the Board, including the independent Board members, concluded that they were satisfied that the level of profitability achieved by GEAM and SSgA from their relationship with the Fund was not unreasonable or excessive.
The Extent To Which Economies Of Scale Would Be Realized As The Fund Grows And Whether Fee Levels Would Reflect Such Economies Of Scale.
The Board noted that the Fund experienced a slight increase in assets over the past year, and the Board members considered the extent to which economies of scale would be realized as the Fund continues to grow and whether fee levels reflect these economies of scale for the benefit of Fund investors.
The Board members considered the substantial infrastructure investments that GEAM has made with respect to its operations and its commitment to continue investing resources to enhance services to Fund shareholders. The Board members recognized the benefits to the Fund of GEAM’s past investment in its operations through expenditures to support its substantial infrastructure, and that, with respect to all GEAM
27
| | |
| Advisory and Administrative Agreement Renewal | | (Unaudited) |
managed mutual funds, GEAM has not yet fully recouped that investment. The Board members also recognized the benefits to the Fund of being able to leverage a favorable cost structure achieved with respect to the Fund’s other operating expenses as a result of GEAM’s large overall base of assets under management and its vendor management practices.
Comparison Of Services To Be Rendered And Fees To Be Paid.
The Board members discussed the respective services provided to the Fund by each of GEAM and SSgA, and the fees charged for those services, including the allocation of total advisory fees between them. The Board members reviewed information concerning the fee and expense ratios for the Fund, and comparative information with respect to peer groupings of mutual funds prepared by Morningstar. They discussed that the Fund’s advisory fee and expense ratios were within the applicable peer group ranges, noting the effect of the management fee waiver discussed above. The Board members also reviewed comparative mutual fund and/or other account fee information provided by SSgA. The Board, including the independent Board members, concluded that, based on
this information, the advisory and sub-advisory fees were reasonable in relation to the services provided to the Fund.
Fall-Out Benefits.
The Board members considered other actual and potential financial benefits that GEAM and SSgA may derive from their respective relationships with the Fund, including, to the extent applicable, soft dollar commission benefits generated through Fund portfolio transactions. The Board members noted, however, that the Fund benefits from the vast array of resources available through GEAM, and that the Fund represents only a small portion of the assets managed by GEAM.
Conclusion.
No single factor was determinative to the Board’s decision. Based on their discussion and such other matters as were deemed relevant, the Board, including the independent Board members, concluded that renewal of the investment advisory and sub-advisory agreements was in the best interests of the Fund and its shareholders.
28
| | |
| Additional Information | | (Unaudited) |
Information about Directors and Executive Officers:
The business and affairs of the Funds are managed under the direction of the Funds’ Board of Directors. Information pertaining to the Directors and officers of the Funds is set forth below.
Interested Directors and Executive Officers
Michael J. Cosgrove
Address c/o GEAM 1600 Summer St. Stamford, CT 06905
Age 64
Position(s) Held with Fund Chairman of the Board and President
Term of Office and Length of Time Served Until successor is elected and qualified — 17 years
Principal Occupation(s) During Past 5 years President of Mutual Funds and Global Investment Programs of GEAM since November 2011; President and Chief Executive Officer — Mutual Funds and Intermediary Business of GEAM from March 2007 to November 2011; Executive Vice President of GEAM from February 1997 to March 2007; and Executive Vice President-Mutual Funds of GEAM from March 1993 to March 2007. Also serves as Treasurer of GE Foundation since 1988.
Number of Portfolios in Fund Complex Overseen by Director 25
Other Directorships Held by Director Chairman of the Board and President of GE Institutional Funds since 1997; Trustee of Elfun Funds, GE Retirement Savings Plan Funds (formerly GE Savings & Security Funds) and General Electric Pension Trust since 1988; Director of GEAM since 1988; Trustee of Fordham University from 2002 through June 2010 and since July 2011; Director of GE Investment Distributors, Inc. since June 2011; Director of Skin Cancer Foundation since August 2010; Member Board of Governors of the Investment Company Institute since October 2006; Director of GE Asset Management (Ireland) Limited since February 1999; GE Asset Management Funds Plc since 1998; GE Asset Management Canada Company since 1998, GE Asset Management Limited since 1998; Trustee of General Electric Insurance Plan Trust since 1988; and Chairman of the Board and President of GE Funds from 1993 to February 2011.
Matthew J. Simpson
Address c/o GEAM 1600 Summer St. Stamford, CT 06905
Age 52
Position(s) Held with Fund Director and Executive Vice President
Term of Office and Length of Time Served Until successor is elected and qualified — 6 years
Principal Occupation(s) During Past 5 years Executive Vice President, General Counsel and Secretary of GEAM since July 2007; Secretary of Elfun Funds and GE Retirement Savings Plan Funds (formerly GE Savings & Security Funds) since July 2007; Senior Vice President and General Counsel — Marketing and Client Services (formerly Asset Management Services) of GEAM and Senior Vice President and General Counsel of GE Asset Management Services from February 1997 to July 2007; Vice President and Associate General Counsel of GEAM from October 1992 to February 1997; Secretary of GE Institutional Funds and GE Investments Funds, Inc. from 1997 to July 2007 and Vice President from September 2003 to July 2007; Assistant Secretary of Elfun Funds and GE Retirement Savings Plan Funds from 1998 to July 2007 and Vice President from October 2003 to July 2007; and Secretary of GE Funds from 1993 to July 2007 and Vice President from September 2003 to July 2007.
Number of Portfolios in Fund Complex Overseen by Director 25
Other Directorships Held by Director Trustee of Elfun Funds, GE Retirement Savings Plan Funds and General Electric Pension Trust since July 2007; Trustee and Executive Vice President of GE Institutional Funds since July 2007; Director of GEAM since July 2007; Director of GE Investment Distributors, Inc. since June 2011; and Trustee and Executive Vice President of GE Funds from July 2007 to February 2011.
29
| | |
| Additional Information | | (Unaudited) |
Joon Won Choe
Address c/o GEAM 1600 Summer St. Stamford, CT 06905
Age 44
Position(s) Held with Fund Vice President & Secretary
Term of Office and Length of Time Served Until successor is elected and qualified — Vice President and Secretary — 3 years
Principal Occupation(s) During Past 5 years Senior Vice President and Deputy General Counsel at GEAM since March 2011; Vice President and Secretary of GE Institutional Funds since September 2010; Vice President and Assistant Secretary of Elfun Funds and GE Retirement Savings Plan Funds (formerly GE Savings & Security Funds) since September 2010; Senior Vice President and Associate General Counsel at GEAM from June 2010 to March 2011; Vice President and Associate General Counsel of GEAM from November 2005 to June 2010 and Vice President and Secretary of GE Funds from September 2010 to February 2011.
Number of Portfolios in Fund Complex Overseen by Officer N/A
Other Directorships Held by Officer N/A
Robert Herlihy
Address c/o GEAM 1600 Summer St. Stamford, CT 06905
Age 46
Position(s) Held with Fund Chief Compliance Officer
Term of Office and Length of Time Served Until successor is elected and qualified — 8 years
Principal Occupation(s) During Past 5 years Chief Compliance Officer of GEAM, GE Institutional Funds, Elfun Funds, and GE Retirement Savings Plan Funds (formerly GE Savings & Security Funds) since July 2005; Chief Compliance Officer of GE Funds from July 2005 to February 2011 and Manager of Fund Administration at GEAM from 2002-2005.
Number of Portfolios in Fund Complex Overseen by Officer N/A
Other Directorships Held by Officer N/A
Arthur A. Jensen
Address c/o GEAM 1600 Summer St. Stamford, CT 06905
Age 47
Position(s) Held with Fund Treasurer
Term of Office and Length of Time Served Until successor is elected and qualified — 2 years
Principal Occupation(s) During Past 5 Years Treasurer of GE Institutional Funds, Elfun Funds and GE Retirement Savings Plan Funds (formerly GE Savings & Security Funds) since June 2011; Mutual Funds Controller of GEAM since April 2011; Senior Vice President at Citigroup from 2008 to 2010 and Vice President at JPMorgan from 2005 to 2008.
Number of Portfolios in Fund Complex Overseen by Officer N/A
Other Directorships Held by Officer N/A
30
| | |
| Additional Information | | (Unaudited) |
Jeanne M. LaPorta
Address c/o GEAM 1600 Summer St. Stamford, CT 06905
Age 48
Position(s) Held with Fund Vice President
Term of Office and Length of Time Served Until successor is elected and qualified — 10 years
Principal Occupation(s) During Past 5 Years Senior Vice President and Commercial Administrative Officer of GEAM since April 2010; Vice President of GE Institutional Funds since July 2003; Vice President of Elfun Funds and GE Retirement Savings Plan Funds (formerly GE Savings & Security Funds) since October 2003; Secretary of GE Funds from July 2007 to September 2010 and Vice President from July 2007 to February 2011; Senior Vice President and Deputy General Counsel of GEAM from October 2007 to April 2010; Vice President and Assistant Secretary of Elfun Funds and GE Retirement Savings Plan Funds from July 2003 to June 2010; and Vice President and Associate General Counsel – Marketing and Client Services (formerly Asset Management Services) at GEAM from May 1997 to October 2007.
Number of Portfolios in Fund Complex Overseen by Officer N/A
Other Directorships Held by Officer N/A
Non-Interested Directors
John R. Costantino
Address c/o GEAM 1600 Summer St. Stamford, CT 06905
Age 67
Position(s) Held with Fund Director
Term of Office and Length of Time Served Until successor is elected and qualified — 17 years
Principal Occupation(s) During Past 5 years Managing General Partner, NGN Capital LLC since 2006; and Treasurer of NeuroScience Research Institute since 1986.
Number of Portfolios in Fund Complex Overseen by Director 17
Other Directorships Held by Director Trustee of GE Institutional Funds since 1997; Trustee of Fordham University from 1989 to 1995 and from 2001 to 2007 and Trustee Emeritus since 2007; Trustee of NeuroScience Research Institute since 1986; Trustee of GE Funds from 1993 to February 2011; and Director of Artes Medical from 2006 to 2008.
31
| | |
| Additional Information | | (Unaudited) |
R. Sheldon Johnson
Address c/o GEAM 1600 Summer St. Stamford, CT 06905
Age 67
Positions(s) Held with Fund Director
Term of office and Length of Time served Unit Successor is elected and qualified — 2 years
Principal Occupation(s) During Past 5 years Head of Global Institutional Equity Sales and Marketing at Morgan Stanley & Co., Inc. from 2002 to 2006 and Managing Director at Morgan Stanley & Co., Inc. from 1988 to 2006.
Number of Portfolios in Fund Complex Overseen by Director 17
Other Directorships Held by Director Trustee of GE Institutional Funds since April 2011 and Trustee of St. Lawrence University since 2003.
Donna M. Rapaccioli
Address c/o GEAM 1600 Summer St. Stamford, CT 06905
Age 51
Position(s) Held with Fund Director
Term of Office and Length of Time Served Until successor is elected and qualified — 2 years
Principal Occupation(s) During Past 5 Years Dean of the Gabelli School of Business since 2007 and Accounting professor since 1987 at Fordham University.
Number of Portfolios in Fund Complex Overseen by Officer 17
Other Directorships Held by Director Trustee of GE Institutional Funds since January 2012 and Trustee of Emmanuel College since 2010.
The Statement of Additional Information for the Funds includes additional information about the Directors and Officers and is available, without charge, upon request by calling 1-800-242-0134.
32
| | |
| Investment Team | | (Unaudited) |
Investment Adviser and Administrator
GE Asset Management Incorporated
Board of Directors
Michael J. Cosgrove, Chairman
John R. Costantino
R. Sheldon Johnson
Donna M. Rapaccioli
Matthew J. Simpson
Secretary
Joon Won Choe
Assistant Secretary
Michelle Matzelle
Treasurer
Arthur A. Jensen
Assistant Treasurer
Robert Meyers
Distributor
GE Investment Distributors, Inc.
Member FINRA and SIPC
Custodian
State Street Bank & Trust Company
At GE Asset Management, we’re dedicated to providing the investment options you’ll need to tailor your financial portfolio to every stage of your life. Each member of the GE Family of Funds is managed according to the same principles of integrity and quality that have guided GE over the past century, and have made it the world-class company that it is today. Each fund draws strength from a heritage of investment management experience that spans more than 80 years. Whether you’re creating a new investment portfolio or adding to an established one, the GE Family of Funds offers an array of professionally managed investment options that will help you meet a lifetime of financial needs.
33
Investment Adviser
GE Asset Management Incorporated
1600 Summer Street
Stamford, CT 06905
or at:
PO Box 7900
Stamford, CT 06904-7900
Distributor
GE Investment Distributors, Inc.
member FINRA and SIPC
1600 Summer Street
Stamford, CT 06905
or at:
PO Box 7900
Stamford, CT 06904-7900
The Fund files its complete schedule of portfolio holdings with the Securities and Exchange Commission for the first and third quarters of each fiscal year on Form N-Q. The Fund’s Forms N-Q, as well as a description of the policies and procedures that the Fund uses to determine how to vote proxies (if any) relating to portfolio securities is available without charge (i) upon request, by calling 1-800-493-3042; (ii) on the Fund’s website at http://www.geam.com; and (iii) on the Commission’s website at http://www.sec.gov. The Fund’s Forms N-Q may be reviewed and copied at the Commission’s Public Reference Room in Washington, DC—information on the operation of the Public Reference Room may be obtained by calling 1-800-SEC-0330.
Information (if any) regarding how the Fund voted proxies relating to portfolio securities during the most recently disclosed 12-month period ended June 30 is available without charge (i) through the Fund’s website at http://www.geam.com; and (ii) on the Commission’s website at http://www.sec.gov.

GE Investments Funds, Inc.
Premier Growth Equity Fund
Annual Report
December 31, 2013

GE Investments Funds, Inc.
| | |
| |
| Premier Growth Equity Fund | | Contents |
This report is prepared for Policyholders of certain variable contracts and may be distributed to others only if preceded or accompanied by the variable contract’s current prospectus and the current prospectus and/or summary prospectus of the Fund available for investments thereunder.
| | |
| Notes to Performance | | December 31, 2013 (Unaudited) |
The information provided on the performance pages relates to the GE Investments Premier Growth Equity Fund (the “Fund”).
Total return performance shown in this report for the Fund takes into account changes in share price and assumes reinvestment of dividends and capital gains distributions, if any. Total returns shown are net of Fund fees and expenses but do not reflect fees and charges associated with the variable contracts such as administrative fees, account charges and surrender charges, which, if reflected, would reduce the Fund’s total returns for all periods shown.
The performance data quoted represents past performance; past performance does not guarantee future results. Investment return and principal value will fluctuate so your shares, when redeemed, may be worth more or less than their original cost. Current performance may be higher or lower than the performance data quoted. Periods less than one year are not annualized. Please call 800-493-3042 or visit the Fund’s website at http://www.geam.com for the most recent month-end performance data.
An investment in the Fund is not a deposit of any bank and is not insured or guaranteed by the Federal Deposit Insurance Corporation (FDIC) or any other government agency. An investment in the Fund is subject to risk, including possible loss of principal invested.
The Standard & Poor’s (“S&P”) 500® Composite Price Index of stocks (“S&P 500 Index”) is an unmanaged, market capitalization-weighted index of stocks of 500 large U.S. companies, which is widely used as a measure of large-cap U.S. stock market performance.
The Russell 1000® Growth Index measures the performance of the large-cap growth segment of the U.S. equity universe. It includes those companies in the Russell 1000® Index (which measures the entire U.S. equity large-cap segment) with higher price-to-book ratios and higher forecasted growth values. It is a subset of the Russell 3000® Index and includes approximately 1,000 of the largest securities based on a combination of their market cap and current index membership.
The results shown for the foregoing indices assume the reinvestment of net dividends or interest and do not reflect fees, expenses, or taxes. As such, the index returns do not reflect the actual cost of investing in the instruments that comprise each index.
The peer universe of the underlying annuity funds used for the peer group average annual total return calculation is based on a blend of Morningstar peer categories, as shown. Morningstar is an independent mutual fund rating service. A Fund’s performance may be compared to or ranked within a universe of mutual funds with investment objectives and policies similar but not necessarily identical to that of the Fund.
©2014 Morningstar, Inc. All Rights Reserved. The Morningstar information contained herein: (1) is proprietary to Morningstar and/or its content providers; (2) may not be copied or distributed; and (3) is not warranted to be accurate, complete or timely. Neither Morningstar nor its content providers are responsible for any damage or losses relating from any use of this information. Past performance is no guarantee of future results.
The views expressed in this document reflect our judgment as of the publication date and are subject to change at any time without notice.
GE Investment Distributors, Inc., Member of FINRA & SIPC, is the principal underwriter and distributor of the GE Investments Funds, Inc. and a wholly owned subsidiary of GE Asset Management Incorporated, the investment adviser of the Fund.
1
| | |
| Premier Growth Equity Fund | | (Unaudited) |

Chief Investment
Officer — U.S. Equities
David B. Carlson is Chief Investment Officer — U.S. Equities at GE Asset Management. He manages the overall U.S. equity investments for GE Asset Management. Mr. Carlson has served as the portfolio manager for the Premier Growth Equity Fund since the Fund’s commencement. Mr. Carlson joined GE Asset Management in 1982 as a securities analyst for investment operations. He became a Vice President for Mutual Fund Portfolios in 1987, a Senior Vice President in 1989 and an Executive Vice President in 2003.
| Q. | How did the GE Investments Premier Growth Equity Fund perform compared to its benchmark and Morningstar peer group for the twelve-month period ended December 31, 2013? |
| A. | For the twelve-month period ended December 31, 2013, the GE Investments Premier Growth Equity Fund returned 34.88%. The Fund’s broad based benchmarks, the S&P 500® Index (S&P 500 Index) and the Russell 1000 Growth Index, returned 32.39% and 33.48%, respectively. The Fund’s Morningstar peer group of 362 U.S. Insurance Large Growth Funds returned an average of 35.26% over the same period. |
| Q. | What market factors affected the Fund’s performance? |
| A. | As economic data — from manufacturing to employment, housing, autos and consumer confidence — improved, the S&P 500 Index rose 32.4% in 2013, achieving its best single-year total return since 1997. The massive advance astonished many investors, as the size of the market rally dwarfed the pace of single-digit GDP and corporate earnings growth. In other words, the market rally was fueled by expanding valuations. At the beginning of 2013 S&P 500 stocks sold at 13x forward-earnings, and ended the year at a forward P/E of 15.4x — neither particularly cheap nor expensive by historical standards. The market’s ability to climb higher as the Federal Reserve announced its intention to taper government debt purchases, signaled |
| | investor confidence that growth could be sustained absent heroic Fed intervention. As economic confidence improved, the S&P 500 cyclical sectors outperformed, led by consumer discretionary (+43%), health care (+41.5% led by strength in biotechnology stocks) and industrials (+41%). The higher-yielding, defensive stocks lagged on concerns that rising bond yields could cut demand for equity income in sectors like telecommunications (+11.5%) and utilities (+13%). The energy sector also underperformed as commodity prices stalled. During the year, small cap stocks outperformed large cap stocks, while the growth style of investing generally beat value. |
| Q. | What were the primary drivers of Fund performance? |
| A. | The Fund’s pro-cyclical positioning was a key positive in 2013. The Fund enjoyed strong contributions from holdings leveraged to consumer strength. For example, Las Vegas Sands (+75%) dominated the mass market gaming segment in Macau, China and seemed poised to grow into new markets. Within media, strong contributions came both from cable distributors — including Liberty Global and Comcast Corp., the largest U.S. cable company — as well as content providers (e.g., Comcast via NBC Universal and Discovery). Within biotechnology, Gilead doubled on the launch of its Hepatitis C oral therapy. Careful selection among financial-related stocks also aided Fund returns, as the profit outlook improved for companies leveraged to rising interest rates and/or strong equity market activity. Winners included CME Group, State Street, Charles Schwab and Visa. Other economically sensitive contributors included Baidu (benefitted from an improved mobile-search strategy), Dover (industrials sector) and Lowe’s (leveraged to the housing recovery). |
| | Amid strong returns, selected holdings trimmed Fund outperformance. Technology holdings that offered defensive growth seemed to lag, including Qualcomm, EBay, |
2

| | EMC and Oracle (eliminated during the year). Other underperformers included American Tower (on its REIT status as investors shied away from yield-stocks), Anadarko in energy (which lagged with oil prices and due to a litigation overhang), and Dentsply within health care (another steady-growth company with defensive characteristics as a leader in the dental supply industry). |
| Q. | Were there any significant changes to the Fund during the period? |
| A. | Changes to the Fund were modest during the 12-month period. We ended the year with 36 stocks in the Fund, flat with the start of the year. At December 31, 2013, technology remained the largest sector in the Fund, however, we reduced the Fund’s sector overweight versus the S&P 500 Index, taking profits in relative outperformers (e.g., trimming Visa, eliminating Paychex) and eliminating positions where our level of conviction declined including Western Union that lost its pricing power. We eliminated several of the Fund’s “older technology” names like Microsoft, Oracle and Cisco which we believed had cloudy prospects going forward. We still believe technology has several things going for it: financial strength (large cash balances and free cash flow generation), global diversification (over 50% of the technology sector revenue is outside the U.S.), product cycle growth (e.g., e-commerce, big data and the Cloud), and many attractive valuations. We maintained the Fund’s underweight positioning in the slower-growing utilities, telecommunications and consumer staples sectors at the end of the 12-month period. We continue to focus on what we believe are financially strong companies with great management teams at attractive valuations. We favor companies with innovative products and services rather than business models tied to GDP growth. In a slow growth world, we believe the Fund’s collection of above-average growers will do well over the long term. |
3
| | |
Premier Growth Equity Fund | | (Unaudited) |
Understanding Your Fund’s Expenses
As a shareholder of the Fund you incur ongoing costs. Ongoing costs include portfolio management fees, professional fees, administrative fees and other Fund expenses. The following example is intended to help you understand your ongoing costs (in dollars) of investing in the Fund and to compare these costs with the ongoing costs of investing in other mutual funds.
To illustrate these ongoing costs, we have provided an example and calculated the expenses paid by investors in the Fund during the period. The information in the following table is based on an investment of $1,000, which is invested at the beginning of the period and held for the entire six-month period ended December 31, 2013.
Actual Expenses
The first section of the table provides information about actual account values and actual expenses. You may use the information in this section, together with the amount you invested, to estimate the expenses that you paid over the period. To do so, simply divide your account value by $1,000 (for example, an $8,600 account value divided by $1,000 = 8.6), then multiply the result by the number given under the heading “Expenses paid during the period” to estimate the expenses you paid on your account during the period.
Hypothetical Example for Comparison Purposes
The second section of the table provides information about hypothetical account values and hypothetical expenses based on the Fund’s actual expense ratio and an assumed rate of return of 5% per year before expenses, which is not the Fund’s actual return. The hypothetical account values and expenses may not be used to estimate the actual ending account balance or expenses you paid for the period. You may use this information to compare the ongoing costs of investing in the Fund and other funds. To do so, compare this 5% hypothetical example with the 5% hypothetical examples that appear in the shareholders reports of other funds.
Please note that the expenses shown in the table are meant to highlight and help you compare ongoing costs only and do not reflect transaction costs, such as sales charges or redemption fees, if any. Therefore, the second section of the table is useful in comparing ongoing costs only, and will not help you determine the relative total costs of owning different funds. Additionally, the expenses shown do not reflect the fees or charges associated with variable contracts through which shares of the Fund are offered.
July 1, 2013 – December 31, 2013
| | | | | | | | | | | | |
| | | Account value at the
beginning of the period ($) | | | Account value at the
end of the period ($) | | | Expenses paid
during the period ($)* | |
Actual Fund Return | | | 1,000.00 | | | | 1,212.00 | | | | 4.46 | |
Hypothetical 5% Return (2.5% for the period) | | | 1,000.00 | | | | 1,021.17 | | | | 4.08 | |
| * | Expenses are equal to the Fund’s annualized net expense ratio of 0.80% (for the period July 1, 2013 – December 31, 2013), multiplied by the average account value over the period, multiplied by 184/365 (to reflect the one-half year period). |
4
| | |
| Premier Growth Equity Fund | | (Unaudited) |
A mutual fund designed for investors who seek long-term growth of capital and future income rather than current income. The Fund seeks to achieve its objectives by investing at least 80% of its net assets under normal circumstances in equity securities, such as common and preferred stocks. The Fund invests primarily in a limited number of large-and medium-sized companies (meaning companies with a market capitalization of $2 billion or more) that the portfolio manager believes have above-average growth histories and/or growth potential.
|
| Morningstar Performance Comparison |
Based on average annual returns for periods ended 12/31/13
| | | | | | | | | | | | | | | |
| | | One
Year | | Five
Year | | Ten
Year |
Number of funds in peer group | | | | 362 | | | | | 341 | | | | | 292 | |
Peer group average annual total return | | | | 35.26% | | | | | 19.57% | | | | | 7.35% | |
Morningstar Category in peer group: U.S. Insurance Large Growth | |
as a % of Fair Value of $40,866 (in thousands) on December 31, 2013 (b)(c)
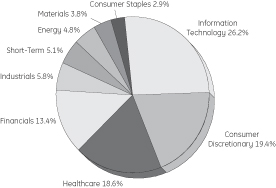
as of December 31, 2013 (as a % of Fair Value) (b)(c)
| | | | |
Gilead Sciences Inc. | | | 4.36% | |
Express Scripts Holding Co. | | | 4.25% | |
QUALCOMM Inc. | | | 4.15% | |
Apple Inc. | | | 3.83% | |
Monsanto Co. | | | 3.80% | |
Schlumberger Ltd. | | | 3.77% | |
Baidu Inc. ADR | | | 3.70% | |
Lowe’s Companies Inc. | | | 3.60% | |
CME Group Inc. | | | 3.53% | |
Covidien PLC | | | 3.49% | |
|
| Change in Value of a $10,000 Investment (a) |
Class 1 Shares
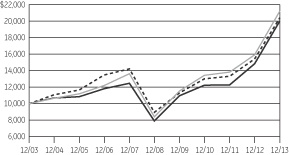
|
Average Annual Total Return |
For the Periods Ended December 31, 2013
Class 1 Shares (Inception Date: 12/12/97)
| | | | | | | | | | | | | | | | | | | | |
| | | One
Year | | Five
Year | | Ten
Year | | Ending value of a
$10,000 investment (a) |
Premier Growth Equity Fund | | | | 34.88% | | | | | 20.46% | | | | | 7.18% | | | | $ | 20,013 | |
S&P 500 Index | | | | 32.39% | | | | | 17.94% | | | | | 7.40% | | | | $ | 20,429 | |
Russell 1000 Growth Index | | | | 33.48% | | | | | 20.39% | | | | | 7.83% | | | | $ | 21,245 | |
| (a) | Ending value of a $10,000 investment for the ten-year period or since inception, whichever is less. |
| (b) | The securities information regarding holdings, allocations and other characteristics is presented to illustrate examples of securities that the Fund has bought and the diversity of areas in which the Fund may invest as of a particular date. It may not be representative of the Fund’s current or future investments and should not be construed as a recommendation to purchase or sell a particular security. |
| (c) | Fair Value basis is inclusive of short-term investment in GE Institutional Money Market Fund Investment Class. |
See Notes to Performance on page 1 for further information, including an explanation of Morningstar peer categories.
Past performance does not predict future performance. The performance shown in the graph and table does not reflect the deduction of taxes that a shareholder would pay on Fund distributions or the redemption of Fund shares and does not reflect the fees or charges that would be associated with variable contracts through which shares of the Fund are offered.
5
Premier Growth Equity Fund
| | |
| Schedule of Investments | | December 31, 2013 |
|
| Premier Growth Equity Fund |
| | | | | | | | | | |
| | | |
| | | Number of Shares | | | Fair Value | | | |
| | | | | | | | | | |
Common Stock — 94.9%† |
| |
Air Freight & Logistics — 2.7% | | | |
| | | |
United Parcel Service Inc. | | | 10,520 | | | $ | 1,105,442 | | | |
| | |
Application Software — 2.3% | | | | | | | |
| | | |
Intuit Inc. | | | 12,422 | | | | 948,047 | | | |
| |
Asset Management & Custody Banks — 3.1% | | | |
| | | |
State Street Corp. | | | 17,238 | | | | 1,265,097 | | | (a) |
| |
Biotechnology — 7.7% | | | |
| | | |
Alexion Pharmaceuticals Inc. | | | 3,549 | | | | 472,230 | | | (b) |
Amgen Inc. | | | 7,732 | | | | 882,685 | | | |
Gilead Sciences Inc. | | | 23,703 | | | | 1,781,280 | | | (b) |
| | | | | | | 3,136,195 | | | |
| |
Broadcasting — 2.0% | | | |
| | | |
Discovery Communications Inc. | | | 9,760 | | | | 818,474 | | | (b) |
| |
Cable & Satellite — 5.9% | | | |
| | | |
Comcast Corp., Class A | | | 21,294 | | | | 1,062,145 | | | |
Liberty Global PLC | | | 15,844 | | | | 1,335,966 | | | (b) |
| | | | | | | 2,398,111 | | | |
| |
Casinos & Gaming — 2.2% | | | |
| | | |
Las Vegas Sands Corp. | | | 11,408 | | | | 899,749 | | | |
| |
Communications Equipment — 4.1% | | | |
| | | |
QUALCOMM Inc. | | | 22,815 | | | | 1,694,014 | | | |
| |
Computer Hardware — 3.8% | | | |
| | | |
Apple Inc. | | | 2,789 | | | | 1,564,936 | | | (c) |
| |
Computer Storage & Peripherals — 3.2% | | | |
| | | |
EMC Corp. | | | 51,334 | | | | 1,291,050 | | | |
| |
Data Processing & Outsourced Services — 3.1% | | | |
| | | |
Visa Inc. | | | 5,704 | | | | 1,270,167 | | | |
| |
Fertilizers & Agricultural Chemicals — 3.8% | | | |
| | | |
Monsanto Co. | | | 13,309 | | | | 1,551,164 | | | |
| |
Healthcare Equipment — 4.9% | | | |
| | | |
Abbott Laboratories | | | 15,211 | | | | 583,038 | | | |
Covidien PLC | | | 20,914 | | | | 1,424,243 | | | |
| | | | | | | 2,007,281 | | | |
| | | | | | | | | | |
| | | |
| | | Number of Shares | | | Fair Value | | | |
| | | | | | | | | | |
| |
Healthcare Services — 4.2% | | | |
| | | |
Express Scripts Holding Co. | | | 24,717 | | | $ | 1,736,122 | | | (b) |
| |
Healthcare Supplies — 1.7% | | | |
| | | |
DENTSPLY International Inc. | | | 14,577 | | | | 706,693 | | | |
| |
Home Improvement Retail — 3.6% | | | |
| | | |
Lowe’s Companies Inc. | | | 29,660 | | | | 1,469,653 | | | |
| |
Industrial Machinery — 3.1% | | | |
| | | |
Dover Corp. | | | 13,309 | | | | 1,284,851 | | | |
| |
Internet Retail — 1.7% | | | |
| | | |
Amazon.com Inc. | | | 1,775 | | | | 707,852 | | | (b) |
| |
Internet Software & Services — 9.6% | | | |
| | | |
Baidu Inc. ADR | | | 8,492 | | | | 1,510,557 | | | (b) |
eBay Inc. | | | 23,449 | | | | 1,287,115 | | | (b) |
Google Inc. | | | 1,014 | | | | 1,136,400 | | | (b) |
| | | | | | | 3,934,072 | | | |
| |
Investment Banking & Brokerage — 2.9% | | | |
| | | |
The Charles Schwab Corp. | | | 16,478 | | | | 428,428 | | | |
The Goldman Sachs Group Inc. | | | 4,183 | | | | 741,478 | | | |
| | | | | | | 1,169,906 | | | |
| |
Movies & Entertainment — 1.3% | | | |
| | | |
The Walt Disney Co. | | | 6,718 | | | | 513,255 | | | |
| |
Oil & Gas Equipment & Services — 3.8% | | | |
| | | |
Schlumberger Ltd. | | | 17,112 | | | | 1,541,962 | | | |
| |
Oil & Gas Exploration & Production — 1.1% | | | |
| | | |
Anadarko Petroleum Corp. | | | 5,450 | | | | 432,294 | | | |
| |
Soft Drinks — 2.9% | | | |
| | | |
PepsiCo Inc. | | | 14,070 | | | | 1,166,966 | | | |
| |
Specialized Finance — 4.7% | | | |
| | | |
CME Group Inc. | | | 18,379 | | | | 1,442,016 | | | |
McGraw Hill Financial Inc. | | | 6,084 | | | | 475,769 | | | |
| | | | | | | 1,917,785 | | | |
| |
Specialized REITs — 2.7% | | | |
| | | |
American Tower Corp. | | | 13,943 | | | | 1,112,930 | | | |
| | |
Specialty Stores — 2.8% | | | | | | | |
| | | |
Dick’s Sporting Goods Inc. | | | 19,647 | | | | 1,141,491 | | | |
| | | |
Total Common Stock
(Cost $23,676,939) | | | | | | | 38,785,559 | | | |
See Notes to Schedule of Investments and Notes to Financial Statements.
6
Premier Growth Equity Fund
| | |
| Schedule of Investments | | December 31, 2013 |
| | | | | | | | |
| | | |
| | | | | Fair Value | | | |
| | | | | | |
Short-Term Investments — 5.1% |
GE Institutional Money Market Fund — Investment Class 0.00%
(Cost $2,079,958) | | $ | 2,079,958 | | | (d,e) |
| | |
Total Investments
(Cost $25,756,897) | | | 40,865,517 | | | |
| | |
Liabilities in Excess of Other Assets, net — (0.0)%* | | | (13,152 | ) | | |
| | | | | | | | |
| | |
NET ASSETS — 100.0% | | $ | 40,852,365 | | | |
| | | | | | | | |
| | | |
| | | | | | | | |
Other Information: |
The Fund had the following long futures contracts open at December 31, 2013:
| | | | | | | | | | | | | | | | | | | | |
Description | | Expiration
date | | Number
of
Contracts | | Current
Notional
Value | | Unrealized
Appreciation |
S&P 500 Emini
Index Futures | | March 2014 | | | | 10 | | | | $ | 920,550 | | | | $ | 30,372 | |
See Notes to Schedule of Investments and Notes to Financial Statements.
7
| | |
| Notes to Schedule of Investments | | December 31, 2013 |
The views expressed in this document reflect our judgment as of the publication date and are subject to change at any time without notice. The securities cited may not be representative of the Fund’s future investments and should not be construed as a recommendation to purchase or sell a particular security. See the Fund’s summary prospectus and statutory prospectus for complete descriptions of investment objectives, policies, risks and permissible investments.
| (a) | State Street Corp. is the parent company of State Street Bank & Trust Co., the Fund’s custodian and accounting agent. |
| (b) | Non-income producing security. |
| (c) | At December 31, 2013, all or a portion of this security was pledged to cover collateral requirements for futures. |
| (d) | Coupon amount represents effective yield. |
| (e) | GE Asset Management Incorporated (“GEAM”), the investment adviser of the Fund, also serves as investment adviser of the GE Institutional Money Market Fund. |
| † | Percentages are based on net assets as of December 31, 2013. |
Abbreviations:
| | |
| |
ADR | | American Depository Receipt |
| |
REIT | | Real Estate Investment Trust |
8
Financial Highlights
Selected data based on a share outstanding throughout the fiscal years indicated
| | | | | | | | | | | | | | | | | | | | |
| | | 12/31/13 | | | 12/31/12 | | | 12/31/11 | | | 12/31/10 | | | 12/31/09 | |
| Inception date | | | — | | | | — | | | | — | | | | — | | | | 12/12/97 | |
Net asset value, beginning of period | | $ | 85.99 | | | $ | 71.78 | | | $ | 71.60 | | | $ | 64.30 | | | $ | 46.49 | |
Income/(loss) from investment operations: | | | | | | | | | | | | | | | | | | | | |
Net investment income | | | 0.58 | | | | 0.78 | | | | 0.15 | | | | 0.14 | * | | | 0.20 | |
Net realized and unrealized gains/(losses) on investments | | | 29.35 | | | | 14.20 | | | | 0.19 | | | | 7.32 | | | | 17.81 | |
Total income from investment operations | | | 29.93 | | | | 14.98 | | | | 0.34 | | | | 7.46 | | | | 18.01 | |
Less distributions from: | | | | | | | | | | | | | | | | | | | | |
Net investment income | | | 0.58 | | | | 0.77 | | | | 0.16 | | | | 0.16 | | | | 0.20 | |
Net realized gains | | | 7.50 | | | | — | | | | — | | | | — | | | | — | |
Total distributions | | | 8.08 | | | | 0.77 | | | | 0.16 | | | | 0.16 | | | | 0.20 | |
Net asset value, end of period | | $ | 107.84 | | | $ | 85.99 | | | $ | 71.78 | | | $ | 71.60 | | | $ | 64.30 | |
TOTAL RETURN(a) | | | 34.88% | | | | 20.88% | | | | 0.47% | | | | 11.61% | | | | 38.74% | |
| | | | | |
RATIOS/SUPPLEMENTAL DATA: | | | | | | | | | | | | | | | | | | | | |
Net assets, end of period (in thousands) | | $ | 40,852 | | | $ | 35,397 | | | $ | 37,871 | | | $ | 45,280 | | | $ | 48,620 | |
Ratios to average net assets: | | | | | | | | | | | | | | | | | | | | |
Net investment income | | | 0.54% | | | | 0.84% | | | | 0.19% | | | | 0.22% | | | | 0.33% | |
Net expenses | | | 0.83% | (b) | | | 0.85% | (b) | | | 0.91% | (b) | | | 0.76% | (b) | | | 0.90% | (b) |
Gross expenses | | | 0.83% | | | | 0.85% | | | | 0.92% | | | | 0.76% | | | | 0.90% | |
Portfolio turnover rate | | | 21% | | | | 17% | | | | 21% | | | | 19% | | | | 18% | |
Notes to Financial Highlights
| (a) | Total returns are historical and assume changes in share price, reinvestment of dividends and capital gains distributions and do not include the effect of insurance contract charges. Past performance does not guarantee future results. |
| (b) | Reflects GEAM’s waiver of a portion of the Fund’s advisory and administrative fee (“management fee”) in an amount equal to the management fee earned by GEAM with respect to the Fund’s investment in an affiliated money market fund managed by GEAM. |
| * | Per share values have been calculated using the average share method. |
The accompanying Notes are an integral part of these financial statements.
9
| | | | |
Statement of Assets and Liabilities December 31, 2013 | | | |
| |
ASSETS | | | | |
Investments in securities, at Fair Value (cost $23,676,939) | | $ | 38,785,559 | |
Short-term affiliated investments (at amortized cost) | | | 2,079,958 | |
Cash | | | 126 | |
Income receivables | | | 76,669 | |
Receivable for fund shares sold | | | 261 | |
Variation margin receivable | | | 3,200 | |
Other assets | | | 155 | |
Total assets | | | 40,945,928 | |
| |
LIABILITIES | | | | |
Payable for fund shares redeemed | | | 28,037 | |
Payable to GEAM | | | 21,776 | |
Accrued other expenses | | | 43,750 | |
Total liabilities | | | 93,563 | |
NET ASSETS | | $ | 40,852,365 | |
| |
NET ASSETS CONSIST OF: | | | | |
Capital paid in | | | 25,209,936 | |
Undistributed (distributions in excess of) net investment income | | | 74 | |
Accumulated net realized gain | | | 503,363 | |
Net unrealized appreciation (depreciation) on: | | | | |
Investments | | | 15,108,620 | |
Futures | | | 30,372 | |
NET ASSETS | | $ | 40,852,365 | |
Shares outstanding ($0.01 par value; unlimited shares authorized) | | | 378,831 | |
Net asset value per share | | | $107.84 | |
The accompanying Notes are an integral part of these financial statements.
10
| | | | |
Statement of Operations
For the year ended December 31, 2013 | | | |
| |
INVESTMENT INCOME | | | | |
Income | | | | |
Dividend | | $ | 515,802 | |
Interest | | | 2,524 | |
Income from affiliated investments | | | 267 | |
Total income | | | 518,593 | |
| |
Expenses | | | | |
Advisory and administration fees | | | 247,382 | |
Directors’ fees | | | 1,637 | |
Custody and accounting expenses | | | 30,359 | |
Professional fees | | | 18,921 | |
Other expenses | | | 17,909 | |
Total expenses before waivers | | | 316,208 | |
Less: Fees waived by the adviser | | | (1,399 | ) |
Net expenses | | | 314,809 | |
Net investment income | | | 203,784 | |
| |
NET REALIZED AND UNREALIZED GAIN (LOSS) ON INVESTMENTS | | | | |
| |
Realized gain (loss) on: | | | | |
Investments | | | 4,248,684 | |
Futures | | | 163,595 | |
| |
Increase (decrease) in unrealized appreciation/depreciation on: | | | | |
Investments | | | 6,734,273 | |
Futures | | | 25,668 | |
Net realized and unrealized gain on investments | | | 11,172,220 | |
Net increase in net assets resulting from operations | | $ | 11,376,004 | |
The accompanying Notes are an integral part of these financial statements.
11
| | | | | | | | |
| Statements of Changes in Net Assets | | | | | | |
| | | Year Ended
December 31,
2013 | | | Year Ended
December 31,
2012 | |
| | |
INCREASE (DECREASE) IN NET ASSETS | | | | | | | | |
Operations: | | | | | | | | |
Net investment income | | $ | 203,784 | | | $ | 319,837 | |
Net realized gain (loss) on investments and futures | | | 4,412,279 | | | | 4,056,929 | |
Net increase (decrease) in unrealized appreciation/depreciation on investments
and futures | | | 6,759,941 | | | | 3,029,803 | |
Net increase (decrease) from operations | | | 11,376,004 | | | | 7,406,569 | |
Distributions to shareholders from: | | | | | | | | |
Net investment income | | | (204,810 | ) | | | (318,846 | ) |
Net realized gains | | | (2,644,728 | ) | | | — | |
Total distributions | | | (2,849,538 | ) | | | (318,846 | ) |
Increase (decrease) in assets from operations and distributions | | | 8,526,466 | | | | 7,087,723 | |
Share transactions: | | | | | | | | |
Proceeds from sale of shares | | | 1,321,873 | | | | 1,548,094 | |
Value of distributions reinvested | | | 2,849,538 | | | | 318,846 | |
Cost of shares redeemed | | | (7,242,978 | ) | | | (11,428,189 | ) |
Net increase (decrease) from share transactions | | | (3,071,567 | ) | | | (9,561,249 | ) |
Total increase (decrease) in net assets | | | 5,454,899 | | | | (2,473,526 | ) |
| | |
NET ASSETS | | | | | | | | |
Beginning of year | | | 35,397,466 | | | | 37,870,992 | |
End of year | | $ | 40,852,365 | | | $ | 35,397,466 | |
Undistributed (distributions in excess of) net investment income, end of period | | $ | 74 | | | $ | 1,167 | |
| | |
CHANGES IN FUND SHARES | | | | | | | | |
Shares sold | | | 13,812 | | | | 18,711 | |
Issued for distributions reinvested | | | 26,621 | | | | 3,738 | |
Shares redeemed | | | (73,257 | ) | | | (138,422 | ) |
Net decrease in fund shares | | | (32,824 | ) | | | (115,973 | ) |
The accompanying Notes are an integral part of these financial statements.
12
| | |
| Notes to Financial Statements | | December 31, 2013 |
| 1. | Organization of the Company |
GE Investments Funds, Inc. (the “Company”) was incorporated under the laws of the Commonwealth of Virginia on May 14, 1984 and is registered under the Investment Company Act of 1940, as amended (the “1940 Act”), as an open-end management investment company. The Company is composed of eleven investment portfolios (collectively the “Funds”), although only the following eight are currently being offered: U.S. Equity Fund, S&P 500 Index Fund, Premier Growth Equity Fund (the “Fund”), Core Value Equity Fund, Small-Cap Equity Fund, Total Return Fund, Income Fund and Real Estate Securities Fund.
Shares of the Funds of the Company are offered only to insurance company separate accounts that fund certain variable life insurance contracts and variable annuity contracts. GE Asset Management Incorporated (“GEAM”) is the investment adviser and administrator of each of the Funds.
The Company currently offers one share class (Class 1) of the Fund as an investment option for variable life insurance and variable annuity contracts.
| 2. | Summary of Significant Accounting Policies |
The preparation of financial statements in conformity with U.S. generally accepted accounting principles (“GAAP”) requires management to make estimates and assumptions that affect the reported amounts of assets and liabilities and disclosure of contingent assets and liabilities at the date of the financial statements and the reported amounts of increases and decreases in net assets from operations during the reporting period. Actual results may differ from those estimates.
Subsequent events after the balance sheet date through the date the financial statements were issued have been evaluated in the preparation of the financial statements. There are no items to report.
The following summarizes the significant accounting policies of the Company:
Securities Valuation and Transactions All investments in securities are recorded at their estimated fair value, as described in Note 3.
Securities transactions are accounted for as of the trade date. Realized gains and losses on investments sold are recorded on the basis of identified cost for both financial statement and federal tax purposes.
Derivatives The Fund is subject to equity price risk in the normal course of pursuing its investment objectives. The Fund may enter into derivative transactions (such as options, futures, and options on futures) to gain market exposure to a certain type of broad-based index as an alternative to investing directly in the securities representing such index.
Futures Contracts A futures contract represents a commitment for the future purchase or sale of an asset at a specified price on a specified date. During the year ended December 31, 2013, the Fund invested in stock index future contracts to gain equity exposure for accumulating and residual cash positions. Buying futures tends to increase a Fund’s exposure to the underlying instrument while selling futures tends to decrease a Fund’s exposure to the underlying instrument, or hedge other Fund investments. The Fund will not enter into a transaction involving futures for speculative purposes. With futures contracts, there is minimal counterparty credit risk to the Fund since futures contracts are exchange traded and the exchange’s clearinghouse, as counterparty to all traded futures, guarantees the futures against default. The Fund’s risks in using these contracts include changes in the value of the underlying instruments, non-performance of the counterparties under the contracts’ terms and changes in the liquidity of the secondary market for the contracts. Futures contracts are valued at the settlement price established each day by the board of trade or exchange on which they principally trade.
Upon entering into a financial futures contract, the Fund is required to pledge to the broker an amount of cash and/or other assets equal to a certain percentage of the contract amount, known as initial margin deposit. Subsequent payments, known as variation margin, are made or received by the Fund each day, depending on the daily fluctuation in the fair value of the underlying security. The Fund records an unrealized gain or loss equal to the daily variation margin. Should market conditions move unexpectedly, the Fund may not achieve the anticipated benefits of the futures contracts and may incur a loss. The Fund recognizes a realized gain or loss on the expiration or closing of a futures contract.
Investment Income Corporate actions (including cash dividends) are recorded on the ex-dividend date, net of applicable withholding taxes, except for certain foreign corporate actions which are recorded as soon after the ex-dividend date as such information becomes available. Withholding taxes in foreign dividends have been provided for in accordance with the Fund’s understanding of the applicable country’s tax rules and rates.
13
| | |
| Notes to Financial Statements | | December 31, 2013 |
Interest income is recorded on the accrual basis. Accretion of discounts and amortization of premiums on taxable bonds are to the call or maturity date, whichever is shorter, using the effective yield method.
Expenses Fund specific expenses are charged to the Fund that incurs such expenses. Such expenses may include custodial fees, legal and accounting fees, printing costs and registration fees. Expenses that are not fund specific are allocated pro rata across the Funds. Expenses of the Fund are generally paid directly by the Fund, however, expenses may be paid by GEAM and reimbursed by the Fund.
Federal Income Taxes The Fund intends to comply with all sections of the Internal Revenue Code applicable to regulated investment companies including the distribution of substantially all of its taxable net investment income and net realized capital gains to its shareholders. Therefore, no provision for federal income tax has been made. The Fund is treated as a separate taxpayer for federal income tax purposes.
The Fund utilizes various methods to measure the fair value of most of its investments on a recurring basis. GAAP establishes a framework for measuring fair value and providing related disclosures. Broadly, the framework requires fair value to be determined based on the exchange price that would be received for an asset or paid to transfer a liability (an exit price) in the principal or most advantageous market for the asset or liability in an orderly transaction between market participants at the measurement date. In the absence of active markets for the identical assets or liabilities, such measurements involve developing assumptions based on market observable data and, in the absence of such data, internal information that is consistent with what market participants would use in a hypothetical transaction that occurs at the measurement date. It also establishes a three-level valuation hierarchy based upon observable and non-observable inputs.
Observable inputs reflect market data obtained from independent sources, while unobservable inputs reflect our market assumptions. Preference is given to observable inputs. These two types of inputs create the following fair value hierarchy:
Level 1 — Quoted prices for identical investments in active markets.
Level 2 — Quoted prices for similar investments in active markets; quoted prices for identical or similar investments in markets that are not active; and model-derived valuations whose inputs are observable or whose significant value drivers are observable.
Level 3 — Significant inputs to the valuation model are unobservable.
Policies and procedures are maintained to value investments using the best and most relevant data available. In addition, pricing vendors are utilized to assist in valuing investments. GEAM performs periodic reviews of the methodologies used by independent pricing services including price validation of individual securities.
Fair Value Measurement The following section describes the valuation methodologies the Fund uses to measure different financial investments at fair value.
The Fund’s portfolio securities are valued generally on the basis of market quotations. Equity securities generally are valued at the last reported sale price on the primary market in which they are traded. Portfolio securities listed on NASDAQ are valued using the NASDAQ Official Closing Price, Level 1 securities primarily include publicly-traded equity securities. If no sales occurred on the exchange or NASDAQ that day, the portfolio security generally is valued using the last reported bid price. In those circumstances the Fund classifies the investment securities in Level 2.
Short-term investments of sufficient credit quality with remaining maturities of sixty days or less at the time of purchase are typically valued on the basis of amortized cost which approximates fair value and these are included in Level 2. If it is determined that amortized cost does not approximate fair value, securities may be valued based on dealer supplied valuations or quotations. In these infrequent circumstances, pricing services may provide the Fund with valuations that are based on significant unobservable inputs, and in those circumstances the investment securities are classified in Level 3.
If prices are not readily available for a portfolio security, or if it is believed that a price for a portfolio security does not represent its fair value, the security may be valued using procedures approved by the Fund’s Board of Directors that are designed to establish its “fair” value. These securities are typically classified in Level 3. Those procedures require that the fair value of a security be established by a valuation committee of GEAM. The valuation committee follows different protocols for
14
| | |
| Notes to Financial Statements | | December 31, 2013 |
different types of investments and circumstances. The fair value procedures may be used to value any investment of the Fund in the appropriate circumstances.
Fair value determinations generally are used for securities whose value is affected by a significant event that will materially affect the value of a security and which occurs subsequent to the time of the close of the principal market on which such security trades but prior to the calculation of the Fund’s NAV.
The value established for such a portfolio security may be different than what would be produced through the use of market quotations or another methodology. Portfolio securities that are valued using techniques other than market quotations, including “fair valued” securities, may be subject to greater fluctuation in their value from one day to the next than would be the case if market quotations were used. In addition, there is no assurance that the Fund could sell a portfolio security for the value established for it at any time and it is possible that the
Fund would incur a loss because a portfolio security is sold at a discount to its established value.
Other financial investments are derivative instruments that are not reflected in total investments, such as futures, forwards, swaps, and written options contracts, which are valued based on fair value as discussed above.
The Fund uses closing prices for derivatives included in Level 1, which are traded either on exchanges or liquid over-the-counter markets. Derivative assets and liabilities included in Level 2 primarily represent interest rate swaps, cross-currency swaps and foreign currency and commodity forward and option contracts. Derivative assets and liabilities included in Level 3 primarily represent interest rate products that contain embedded optionality or prepayment features.
The inputs or methodology used for valuing securities are not an indication of the risk associated with investing in those securities.
The following table presents the Fund’s investments measured at fair value on a recurring basis at December 31, 2013:
| | | | | | | | | | | | | | | | | | | | |
| Investments | | Level 1 | | Level 2 | | Level 3 | | Total |
Investments in Securities† | | | | | | | | | | | | | | | | | | | | |
Common Stock | | | $ | 38,785,559 | | | | $ | — | | | | $ | — | | | | $ | 38,785,559 | |
Short-Term Investments | | | | 2,079,958 | | | | | — | | | | | — | | | | | 2,079,958 | |
| | | | | | | | | | | | | | | | | | | | |
Total Investments in Securities | | | $ | 40,865,517 | | | | $ | — | | | | $ | — | | | | $ | 40,865,517 | |
| | | | | | | | | | | | | | | | | | | | |
Other Financial Instruments* | | | | | | | | | | | | | | | | | | | | |
Futures Contracts — Unrealized Appreciation | | | $ | 30,372 | | | | $ | — | | | | $ | — | | | | $ | 30,372 | |
| | | | | | | | | | | | | | | | | | | | |
| † | See Schedule of Investments for industry classification. |
| * | Other financial instruments include derivative instruments such as futures contracts. Amounts shown represent unrealized appreciation (depreciation), at period end. |
There were no transfers between fair value levels. Transfers between fair value levels are considered to occur at the beginning of the period.
15
| | |
| Notes to Financial Statements | | December 31, 2013 |
| 4. | Derivatives Transactions |
Shown below are the derivative contracts entered into by the Fund, summarized by primary risk exposure as they appear on the Statement of Assets and Liabilities, all of which are not accounted for as hedging instruments under FASB Accounting Standards Codification (“ASC”) No. 815 Derivatives and Hedging as of December 31, 2013.
| | | | | | | | | | | | |
| | | Asset Derivatives December 31, 2013 | | | Liability Derivatives December 31, 2013 | |
Derivatives not accounted for as hedging
instruments under ASC 815 | | Location in the Statements
of Assets and Liabilities | | Fair
Value ($) | | | Location in the Statements
of Assets and Liabilities | | Fair
Value ($) | |
Equity Contracts | | Assets, Net Assets — Net Unrealized Appreciation/ (Depreciation) on Futures | | | 30,372* | | | Liabilities, Net Assets — Net Unrealized Appreciation/ (Depreciation) on Futures | | | — | |
| * | Includes cumulative unrealized appreciation/(depreciation) of futures contracts as reported in the Schedule of Investments and within the components of the net assets section of the Statement of Assets and Liabilities. Only the current day’s variation margin is reported within the Assets and/or Liabilities section on the Statement of Assets and Liabilities. |
Shown below are the effects of derivative instruments on the Fund’s Statement of Operation, summarized by primary risk exposure all of which are not accounted for as hedging instruments under ASC 815.
| | | | | | | | | | | | | | |
Derivatives not accounted for as
hedging instruments under ASC 815 | | Location in the Statements
of Operations | | Total Notional Amount
of Futures Contracts
Purchased/(Sold) ($) | | | Realized Gain
(Loss) on
Derivatives
Recognized
in Income ($) | | | Change in
Unrealized
Appreciation
(Depreciation)
on Derivatives
Recognized in
Income ($) | |
Equity Contracts | | Realized gain/(loss) on futures, Increase/(decrease) in unrealized appreciation/ (depreciation) on Futures | |
| 8,288,755/
(8,390,188) |
| | | 163,595 | | | | 25,668 | |
The Company shares a revolving credit facility of up to $150 million with a number of its affiliates. The credit facility is with its custodian bank, State Street Bank and Trust Company (“State Street”). The revolving credit facility requires the payment of a commitment fee equal to 0.10% per annum on the daily unused portion of the credit facility, payable quarterly. The portion borne by the Funds generally is borne proportionally based upon net assets. In addition, the Company has a $100 million uncommitted, unsecured line of credit with State Street. Generally, borrowings under the credit facilities would accrue interest at the Federal Funds Rate plus 50 basis points and would be borne by the borrowing fund. The maximum amount allowed to be borrowed by any one fund is the lesser of (i) 33.33% of its total assets or (ii) 20% of its net assets. The credit facilities were not utilized by the Fund during the year ended December 31, 2013.
| 6. | Compensation and Fees Paid to Affiliates |
GEAM, a registered investment adviser, was retained by the Company’s Board of Directors effective November 15, 1997
to act as investment adviser and administrator of the Fund. GEAM’s compensation for investment advisory and administrative services (“management fee”) is paid monthly based on the average daily net assets of the Fund at an annualized rate of 0.65%.
GEAM has a contractual arrangement with the Fund to waive a portion of the Fund’s management fee in the amount equal to the management fee earned by GEAM with respect to the Fund’s investment in the GE Institutional Money Market Fund, if any.
Directors’ Compensation The Fund pays no compensation to its directors who are officers or employees of GEAM or its affiliates. Directors who are not such officers or employees also serve in a similar capacity for other funds advised by GEAM. Compensation paid to non-interested Directors are reflected on the Statement of Operations. These fees are allocated pro rata across all of the mutual fund platforms served by the Directors, including the Fund, and are based upon the relative net assets of each fund within such platforms.
16
| | |
| Notes to Financial Statements | | December 31, 2013 |
| 7. | Investment Transactions |
Purchases and Sales of Securities The cost of purchases and the proceeds from sales of investments, other than short-term securities, for the year ended December 31, 2013, were as follows:
| | | | | | |
| Non-U.S. Government Securities | |
| Purchases | | | Sales | |
| $ | 7,603,984 | | | $ | 13,083,566 | |
The Fund is subject to ASC 740, Income Taxes. ASC 740 provides guidance for financial accounting and reporting for the effects of income taxes that result from an entity’s
activities during the year. ASC 740 also provides guidance regarding how certain uncertain tax positions should be recognized, measured, presented and disclosed in the financial statements. ASC 740 requires evaluation of tax positions taken or expected to be taken in the course of preparing the Fund’s tax returns to determine whether the tax positions are “more likely than not” of being sustained by the applicable tax authority. There are no adjustments to the Fund’s net assets required under ASC 740. The Fund’s 2010, 2011, 2012, and 2013 fiscal years tax returns are still open to examination by the Federal and applicable state tax authorities.
At December 31, 2013, information on the tax cost of investments and distributable earnings on a tax basis was as follows:
| | | | | | | | | | | | | | | | | | | | | | | | | | | | |
Cost of
Investments For
Tax Purposes | | Gross Tax | | | Net Tax Appreciation/
(Depreciation) | | | Undistributed | | | | |
| | Appreciation | | | Depreciation | | | Investments | | | Derivatives/
Currency | | | Income | | | Accum. Capital
Gain/(Loss) | | | Late-Year
Losses | |
| $26,277,985 | | $ | 14,587,532 | | | $ | — | | | $ | 14,587,532 | | | $ | 30,372 | | | $ | 74 | | | $ | 1,054,823 | | | $ | — | |
As of December 31, 2013, the Fund had no capital loss carryovers. Capital loss carryovers are available to offset future realized capital gains to the extent provided in the Internal Revenue Code and regulations thereunder. To the extent that these carryover losses are used to offset future capital gains, it is probable that gains offset will not be distributed to shareholders because they would be taxable as ordinary income.
During the year ended December 31, 2013, the Fund utilized $276,981 of prior year capital loss carryovers.
Any qualified late-year loss is deemed to arise on the first day of the Fund’s next tax year (if the Fund elects to defer such loss). Under this regime, generally, the Fund can elect to defer any post-October capital loss and/or any late-year ordinary loss as defined by the Internal Revenue Code.
The Fund incurred no such losses for the year ended December 31, 2013.
The tax character of distributions paid during the years ended December 31, 2013 and December 31, 2012 were as follows:
| | | | | | | | | | | | | | | |
| Year | | Ordinary Income | | Long-Term Capital Gains | | Total |
2013 | | | $ | 204,810 | | | | $ | 2,644,728 | | | | $ | 2,849,538 | |
2012 | | | | 318,846 | | | | | — | | | | | 318,846 | |
Distributions to Shareholders The Fund declares and pays any dividends from net investment income annually. The Fund declares and pays any net realized capital gains in excess of capital loss carryforwards distributions annually. The character of income and gains to be distributed is determined in accordance with income tax regulations which may differ from generally accepted accounting principles. These differences include (but are not limited to) futures, investments organized as partnerships for tax purposes, and losses deferred due to wash sale transactions and future contracts. Reclassifications due to permanent book/tax differences are made to the Fund’s capital accounts to reflect income and gains available for distribution (or available capital loss carryovers) under income tax regulations. These reclassifications have no impact on net investment income, realized gains or losses, or the net asset value of the Fund. The calculation of net investment income per share in the Financial Highlights table excludes these adjustments.
The reclassifications for the year ended December 31, 2013 were as follows:
| | | | | | | | | | |
Undistributed
Net Investment
Income | | | Accumulated
Net Realized
Gain (Loss) | | | Capital
Paid In | |
| $ | (67 | ) | | $ | 128,877 | | | $ | (128,810 | ) |
17
Report of Independent Registered Public Accounting Firm
The Shareholders and Board of Directors
GE Investments Funds, Inc.
We have audited the accompanying statement of assets and liabilities, including the schedule of investments, of the Premier Growth Equity Fund (the “Fund”), a series of GE Investments Funds, Inc., as of December 31, 2013 and the related statement of operations for the year then ended, statements of changes in net assets for each of the years in the two-year period then ended, and the financial highlights for each of the years in the five-year period then ended. These financial statements and financial highlights are the responsibility of the Fund’s management. Our responsibility is to express an opinion on these financial statements and financial highlights based on our audits.
We conducted our audits in accordance with the standards of the Public Company Accounting Oversight Board (United States). Those standards require that we plan and perform the audit to obtain reasonable assurance about whether the financial statements are free of material misstatement. An audit includes examining, on a test basis, evidence supporting the amounts and disclosures in the financial statements. Our procedures included confirmation of securities owned as of December 31, 2013 by correspondence with the custodian and brokers. An audit also includes assessing the accounting principles used and significant estimates made by management, as well as evaluating the overall financial statement presentation. We believe that our audits provide a reasonable basis for our opinion.
In our opinion, the financial statements and financial highlights referred to above present fairly, in all material respects, the financial position of the Premier Growth Equity Fund as of December 31, 2013, the results of its operations, changes in its net assets and financial highlights for each of the years described above, in conformity with U.S. generally accepted accounting principles.

Boston, Massachusetts
February 17, 2014
18
| | |
| Tax Information | | (Unaudited) |
For the year ended December 31, 2013, the Fund hereby designates $2,644,728 as capital gain dividends, or the amount ultimately treated as capital gain net income.
The amounts presented herein may differ from amounts presented elsewhere in the financial statements due to differences between tax and financial accounting principles. Please consult a tax advisor if you have any questions about Federal or State income tax laws or on how to prepare your tax returns. If you have specific questions about your Fund account, please consult your investment representative.
19
| | |
| Advisory and Administrative Agreement Renewal | | (Unaudited) |
The Board of Directors of the GE Investments Funds, Inc. (the “Board”), including the independent Board members, considered and unanimously approved the continuance for an additional year of the Fund’s Investment Advisory and Administration Agreement with GE Asset Management Incorporated (“GEAM”) at meetings held on December 11 and December 13, 2013.
In considering whether to approve the Fund’s investment advisory agreement, the Board members considered and discussed a substantial amount of information and analysis provided, at the Board’s request, by GEAM. The Board members also considered detailed information regarding performance and expenses of other investment companies, including those with similar investment strategies and sizes, which was prepared by independent third party provider Morningstar, Inc. (“Morningstar”). The Board members reviewed the fees charged by GEAM for other mutual funds and investment products other than mutual funds that employ the same investment strategy as the Fund. The Board had the opportunity to ask questions and request additional information in connection with its considerations.
Before approving the Fund’s investment advisory agreement, the independent Board members reviewed the information provided with management of GEAM and with their independent legal counsel. The Board members also reviewed a memorandum prepared by independent legal counsel discussing the legal standards for the consideration of the proposed continuance. The independent Board members discussed the proposed continuance in detail during a private session with their independent legal counsel at which no representatives of GEAM were present. The independent Board members and their independent legal counsel requested, received and considered additional information from GEAM following these sessions.
In advance of the meetings, and in response to their request, the Board members received from GEAM written responses to their inquiries, which included substantial exhibits and other materials related to GEAM’s business and the services it provides to the Fund. The Board members took into account their experience as Board members and particularly their previous consideration of these types of agreements. When feasible, information was presented in a manner to facilitate comparison to prior periods and to reflect certain enhancements to GEAM’s infrastructure, systems and shareholder servicing model. To focus their review, the Board members asked GEAM management, in its oral presentation, to highlight material differences from the information presented in recent years.
During the meetings, the Board members had an opportunity to discuss this information with GEAM representatives, including senior executives, representatives from the legal, compliance and finance departments, and investment personnel. The Board members posed questions to these representatives and engaged in substantive discussions with them concerning GEAM’s investment process.
In reaching their determination relating to continuance of the Fund’s investment advisory agreement, the Board members considered all factors that they deemed relevant, including the factors discussed below. In their deliberations, the Board members did not identify any particular information that was all-important or controlling, and each Board member may have attributed different weights to the various factors. In particular, the Board members focused on the following:
The Nature, Extent And Quality Of Services Provided.
The Board members reviewed the services provided by GEAM, taking into account their past experiences with GEAM. They focused on the favorable attributes of GEAM, including (i) an investment philosophy oriented toward long-term performance; (ii) effective processes used for selecting investments and brokers; (iii) effective processes used for providing Fund administration, including controllership and compliance functions, the optimization of its Fund administration platform and the continued oversight of the performance of other companies that provide services to the Fund and its shareholders; (iv) highly skilled professionals including analysts, research professionals, traders and portfolio managers with a depth of experience relevant to the Fund; (v) access to significant and enhanced technological resources from which the Fund may benefit; and (vi) a favorable history and reputation. The Board members noted that the Fund represents only a small portion of the assets managed by GEAM, but benefits from a full array of services and resources provided by GEAM.
In light of these discussions, the Board, including the independent Board members, concluded that GEAM’s services continue to be satisfactory.
Investment Performance Of The Fund.
The Board members considered the investment performance of the Fund for various periods. The Board members reviewed detailed comparisons of the performance of the Fund with the relevant securities index and peer groupings of mutual funds prepared by Morningstar with respect to various periods. The Board
20
| | |
| Advisory and Administrative Agreement Renewal | | (Unaudited) |
members also engaged in detailed discussions with GEAM management about its investment process and performance results. These discussions focused on the Fund’s investment objective, the number and experience of portfolio management and supporting research personnel, the Fund’s investment style and approach employed, the likely market cycles for the investment style and the Fund’s competitive performance over the past year and the relatively strong performance in the three year period.
The Board, including the independent Board members, concluded that the Fund’s performance was acceptable.
Cost Of The Services Provided And Profits Realized From The Relationship With The Fund.
The Board members considered the fees paid to GEAM by the Fund and the cost of the services provided to the Fund by GEAM. The Board members reviewed the information they had requested from GEAM concerning its profitability. The Board members considered the profit margin information for GEAM’s investment company business as a whole, as well as GEAM’s profitability data for the Fund. The Board members reviewed GEAM’s assumptions and the methods of cost allocation used by GEAM in preparing Fund-specific profitability data. The Board members also discussed with GEAM the basis for its belief that the methods of allocation used were reasonable for each area of its business.
Information was presented regarding the financial condition of GEAM for various past periods. The Board members noted and discussed the additional services provided by GEAM to the Fund compared to other investment products managed by GEAM. The Board members determined that GEAM should be entitled to earn a reasonable level of profits for the services it provides to the Fund. The Board members also recognized that GEAM has made and continues to make significant investments in its business in fulfilling its obligations to the Fund and supporting its Fund-related activities.
Based on their review, the Board, including the independent Board members, concluded that they were satisfied that the level of profitability achieved by GEAM from its relationship with the Fund was not unreasonable or excessive.
The Extent To Which Economies Of Scale Would Be Realized As The Fund Grows And Whether Fee Levels Would Reflect Such Economies Of Scale.
The Board noted that the Fund experienced a slight increase in assets over the past year, the Board members considered
the extent to which economies of scale would be realized as the Fund grows, and whether fee levels reflect these economies of scale for the benefit of Fund investors.
The Board members considered the substantial infrastructure investments that GEAM has made with respect to its operations and its commitment to continue investing resources to enhance services to Fund shareholders. The Board members recognized the benefits to the Fund of GEAM’s past investment in its operations through expenditures to support its substantial infrastructure, and that, with respect to all GEAM managed mutual funds, GEAM has not yet fully recouped that investment. The Board members also recognized the benefits to the Fund of being able to leverage a favorable cost structure achieved with respect to the Fund’s other operating expenses as a result of GEAM’s large overall base of assets under management and its vendor management practices.
Comparison Of Services To Be Rendered And Fees To Be Paid.
The Board members discussed the services provided to the Fund by GEAM, and the fees charged for those services. The Board members reviewed information concerning the fee and expense ratios for the Fund, and comparative information with respect to peer groupings of mutual funds prepared by Morningstar. They discussed that the Fund’s advisory fee and expense ratios were within the applicable peer group ranges. In light of the foregoing, the Board, including the independent Board members, determined that the advisory fees were reasonable in relation to the services provided to the Fund.
Fall-Out Benefits.
The Board members considered other actual and potential financial benefits that GEAM may derive from its relationship with the Fund, including, to the extent applicable, soft dollar commission benefits generated through Fund portfolio transactions. The Board members noted, however, that the Fund benefits from the vast array of resources available through GEAM, and that the Fund represents only a small portion of the assets managed by GEAM.
Conclusion.
No single factor was determinative to the Board’s decision. Based on their discussion and such other matters as were deemed relevant, the Board, including the independent Board members, concluded that renewal of the investment advisory agreement was in the best interests of the Fund and its shareholders.
21
| | |
| Additional Information | | (Unaudited) |
Information about Directors and Executive Officers:
The business and affairs of the Funds are managed under the direction of the Funds’ Board of Directors. Information pertaining to the Directors and officers of the Funds is set forth below.
Interested Directors and Executive Officers
Michael J. Cosgrove
Address c/o GEAM 1600 Summer St. Stamford, CT 06905
Age 64
Position(s) Held with Fund Chairman of the Board and President
Term of Office and Length of Time Served Until successor is elected and qualified — 17 years
Principal Occupation(s) During Past 5 years President of Mutual Funds and Global Investment Programs of GEAM since November 2011; President and Chief Executive Officer — Mutual Funds and Intermediary Business of GEAM from March 2007 to November 2011; Executive Vice President of GEAM from February 1997 to March 2007; and Executive Vice President-Mutual Funds of GEAM from March 1993 to March 2007. Also serves as Treasurer of GE Foundation since 1988.
Number of Portfolios in Fund Complex Overseen by Director 25
Other Directorships Held by Director Chairman of the Board and President of GE Institutional Funds since 1997; Trustee of Elfun Funds, GE Retirement Savings Plan Funds (formerly GE Savings & Security Funds) and General Electric Pension Trust since 1988; Director of GEAM since 1988; Trustee of Fordham University from 2002 through June 2010 and since July 2011; Director of GE Investment Distributors, Inc. since June 2011; Director of Skin Cancer Foundation since August 2010; Member Board of Governors of the Investment Company Institute since October 2006; Director of GE Asset Management (Ireland) Limited since February 1999; GE Asset Management Funds Plc since 1998; GE Asset Management Canada Company since 1998, GE Asset Management Limited since 1998; Trustee of General Electric Insurance Plan Trust since 1988; and Chairman of the Board and President of GE Funds from 1993 to February 2011.
Matthew J. Simpson
Address c/o GEAM 1600 Summer St. Stamford, CT 06905
Age 52
Position(s) Held with Fund Director and Executive Vice President
Term of Office and Length of Time Served Until successor is elected and qualified — 6 years
Principal Occupation(s) During Past 5 years Executive Vice President, General Counsel and Secretary of GEAM since July 2007; Secretary of Elfun Funds and GE Retirement Savings Plan Funds (formerly GE Savings & Security Funds) since July 2007; Senior Vice President and General Counsel — Marketing and Client Services (formerly Asset Management Services) of GEAM and Senior Vice President and General Counsel of GE Asset Management Services from February 1997 to July 2007; Vice President and Associate General Counsel of GEAM from October 1992 to February 1997; Secretary of GE Institutional Funds and GE Investments Funds, Inc. from 1997 to July 2007 and Vice President from September 2003 to July 2007; Assistant Secretary of Elfun Funds and GE Retirement Savings Plan Funds from 1998 to July 2007 and Vice President from October 2003 to July 2007; and Secretary of GE Funds from 1993 to July 2007 and Vice President from September 2003 to July 2007.
Number of Portfolios in Fund Complex Overseen by Director 25
Other Directorships Held by Director Trustee of Elfun Funds, GE Retirement Savings Plan Funds and General Electric Pension Trust since July 2007; Trustee and Executive Vice President of GE Institutional Funds since July 2007; Director of GEAM since July 2007; Director of GE Investment Distributors, Inc. since June 2011; and Trustee and Executive Vice President of GE Funds from July 2007 to February 2011.
22
| | |
| Additional Information | | (Unaudited) |
Joon Won Choe
Address c/o GEAM 1600 Summer St. Stamford, CT 06905
Age 44
Position(s) Held with Fund Vice President & Secretary
Term of Office and Length of Time Served Until successor is elected and qualified — Vice President and Secretary – 3 years
Principal Occupation(s) During Past 5 years Senior Vice President and Deputy General Counsel at GEAM since March 2011; Vice President and Secretary of GE Institutional Funds since September 2010; Vice President and Assistant Secretary of Elfun Funds and GE Retirement Savings Plan Funds (formerly GE Savings & Security Funds) since September 2010; Senior Vice President and Associate General Counsel at GEAM from June 2010 to March 2011; Vice President and Associate General Counsel of GEAM from November 2005 to June 2010 and Vice President and Secretary of GE Funds from September 2010 to February 2011.
Number of Portfolios in Fund Complex Overseen by Officer N/A
Other Directorships Held by Officer N/A
Robert Herlihy
Address c/o GEAM 1600 Summer St. Stamford, CT 06905
Age 46
Position(s) Held with Fund Chief Compliance Officer
Term of Office and Length of Time Served Until successor is elected and qualified — 8 years
Principal Occupation(s) During Past 5 years Chief Compliance Officer of GEAM, GE Institutional Funds, Elfun Funds, and GE Retirement Savings Plan Funds (formerly GE Savings & Security Funds) since July 2005; Chief Compliance Officer of GE Funds from July 2005 to February 2011 and Manager of Fund Administration at GEAM from 2002-2005.
Number of Portfolios in Fund Complex Overseen by Officer N/A
Other Directorships Held by Officer N/A
Arthur A. Jensen
Address c/o GEAM 1600 Summer St. Stamford, CT 06905
Age 47
Position(s) Held with Fund Treasurer
Term of Office and Length of Time Served Until successor is elected and qualified — 2 years
Principal Occupation(s) During Past 5 Years Treasurer of GE Institutional Funds, Elfun Funds and GE Retirement Savings Plan Funds (formerly GE Savings & Security Funds) since June 2011; Mutual Funds Controller of GEAM since April 2011; Senior Vice President at Citigroup from 2008 to 2010 and Vice President at JPMorgan from 2005 to 2008.
Number of Portfolios in Fund Complex Overseen by Officer N/A
Other Directorships Held by Officer N/A
23
| | |
| Additional Information | | (Unaudited) |
Jeanne M. LaPorta
Address c/o GEAM 1600 Summer St. Stamford, CT 06905
Age 48
Position(s) Held with Fund Vice President
Term of Office and Length of Time Served Until successor is elected and qualified — 10 years
Principal Occupation(s) During Past 5 Years Senior Vice President and Commercial Administrative Officer of GEAM since April 2010; Vice President of GE Institutional Funds since July 2003; Vice President of Elfun Funds and GE Retirement Savings Plan Funds (formerly GE Savings & Security Funds) since October 2003; Secretary of GE Funds from July 2007 to September 2010 and Vice President from July 2007 to February 2011; Senior Vice President and Deputy General Counsel of GEAM from October 2007 to April 2010; Vice President and Assistant Secretary of Elfun Funds and GE Retirement Savings Plan Funds from July 2003 to June 2010; and Vice President and Associate General Counsel – Marketing and Client Services (formerly Asset Management Services) at GEAM from May 1997 to October 2007.
Number of Portfolios in Fund Complex Overseen by Officer N/A
Other Directorships Held by Officer N/A
Non-Interested Directors
John R. Costantino
Address c/o GEAM 1600 Summer St. Stamford, CT 06905
Age 67
Position(s) Held with Fund Director
Term of Office and Length of Time Served Until successor is elected and qualified — 17 years
Principal Occupation(s) During Past 5 years Managing General Partner, NGN Capital LLC since 2006; and Treasurer of NeuroScience Research Institute since 1986.
Number of Portfolios in Fund Complex Overseen by Director 17
Other Directorships Held by Director Trustee of GE Institutional Funds since 1997; Trustee of Fordham University from 1989 to 1995 and from 2001 to 2007 and Trustee Emeritus since 2007; Trustee of NeuroScience Research Institute since 1986; Trustee of GE Funds from 1993 to February 2011 and Director of Artes Medical from 2006 to 2008.
24
| | |
| Additional Information | | (Unaudited) |
R. Sheldon Johnson
Address c/o GEAM 1600 Summer St. Stamford, CT 06905
Age 67
Positions(s) Held with Fund Director
Term of office and Length of Time served Unit Successor is elected and qualified — 2 years
Principal Occupation(s) During Past 5 years Head of Global Institutional Equity Sales and Marketing at Morgan Stanley & Co., Inc. from 2002 to 2006 and Managing Director at Morgan Stanley & Co., Inc. from 1988 to 2006.
Number of Portfolios in Fund Complex Overseen by Director 17
Other Directorships Held by Director Trustee of GE Institutional Funds since April 2011 and Trustee of St. Lawrence University since 2003.
Donna M. Rapaccioli
Address c/o GEAM 1600 Summer St. Stamford, CT 06905
Age 51
Position(s) Held with Fund Director
Term of Office and Length of Time Served Until successor is elected and qualified — 2 years
Principal Occupation(s) During Past 5 Years Dean of the Gabelli School of Business since 2007 and Accounting professor since 1987 at Fordham University.
Number of Portfolios in Fund Complex Overseen by Officer 17
Other Directorships Held by Director Trustee of GE Institutional Funds since January 2012 and Trustee of Emmanuel College since 2010.
The Statement of Additional Information for the Funds includes additional information about the Directors and Officers and is available, without charge, upon request by calling 1-800-242-0134.
25
| | |
| Investment Team | | (Unaudited) |
Investment Adviser and Administrator
GE Asset Management Incorporated
Board of Directors
Michael J. Cosgrove, Chairman
John R. Costantino
R. Sheldon Johnson
Donna M. Rapaccioli
Matthew J. Simpson
Secretary
Joon Won Choe
Assistant Secretary
Michelle Matzelle
Treasurer
Arthur A. Jensen
Assistant Treasurer
Robert Meyers
Distributor
GE Investment Distributors, Inc.
Member FINRA and SIPC
Custodian
State Street Bank & Trust Company
At GE Asset Management, we’re dedicated to providing the investment options you’ll need to tailor your financial portfolio to every stage of your life. Each member of the GE Family of Funds is managed according to the same principles of integrity and quality that have guided GE over the past century, and have made it the world-class company that it is today. Each fund draws strength from a heritage of investment management experience that spans more than 80 years. Whether you’re creating a new investment portfolio or adding to an established one, the GE Family of Funds offers an array of professionally managed investment options that will help you meet a lifetime of financial needs.
26
Investment Adviser
GE Asset Management Incorporated
1600 Summer Street
Stamford, CT 06905
or at:
PO Box 7900
Stamford, CT 06904-7900
Distributor
GE Investment Distributors, Inc.
member FINRA and SIPC
1600 Summer Street
Stamford, CT 06905
or at:
PO Box 7900
Stamford, CT 06904-7900
The Fund files its complete schedule of portfolio holdings with the Securities and Exchange Commission for the first and third quarters of each fiscal year on Form N-Q. The Fund’s Forms N-Q, as well as a description of the policies and procedures that the Fund uses to determine how to vote proxies (if any) relating to portfolio securities is available without charge (i) upon request, by calling 1-800-493-3042; (ii) on the Fund’s website at http://www.geam.com; and (iii) on the Commission’s website at http://www.sec.gov. The Fund’s Forms N-Q may be reviewed and copied at the Commission’s Public Reference Room in Washington, DC – information on the operation of the Public Reference Room may be obtained by calling 1-800-SEC-0330.
Information (if any) regarding how the Fund voted proxies relating to portfolio securities during the most recently disclosed 12-month period ended June 30 is available without charge (i) through the Fund’s website at http://www.geam.com; and (ii) on the Commission’s website at http://www.sec.gov.

GE Investments Funds, Inc.
Core Value Equity Fund
Annual Report
December 31, 2013

GE Investments Funds, Inc.
| | |
| |
| Core Value Equity Fund | | Contents |
This report is prepared for Policyholders of certain variable contracts and may be distributed to others only if preceded or accompanied by the variable contract’s current prospectus and the current prospectus and/or summary prospectus of the Fund available for investments thereunder.
| | |
| Notes to Performance | | December 31, 2013 (Unaudited) |
The information provided on the performance pages relates to the GE Investments Core Value Equity Fund (the “Fund”).
Total return performance shown in this report for the Fund takes into account changes in share price and assumes reinvestment of dividends and capital gains distributions, if any. Total returns shown are net of Fund fees and expenses but do not reflect fees and charges associated with the variable contracts such as administrative fees, account charges and surrender charges, which, if reflected, would reduce the Fund’s total returns for all periods shown.
The performance data quoted represents past performance; past performance does not guarantee future results. Investment return and principal value will fluctuate so your shares, when redeemed, may be worth more or less than their original cost. Current performance may be higher or lower than the performance data quoted. Periods less than one year are not annualized. Please call 800-493-3042 or visit the Fund’s website at http://www.geam.com for the most recent month-end performance data.
An investment in the Fund is not a deposit of any bank and is not insured or guaranteed by the Federal Deposit Insurance Corporation (FDIC) or any other government agency. An investment in the Fund is subject to risk, including possible loss of principal invested.
The Standard & Poor’s (“S&P”) 500® Composite Price Index of stocks (“S&P 500 Index”) is an unmanaged, market capitalization-weighted index of stocks of 500 large U.S. companies, which is widely used as a measure of large-cap U.S. stock market performance. The results shown for the foregoing index assume the reinvestment of net dividends or interest and do not reflect fees, expenses, or taxes. As such, the index returns do not reflect the actual cost of investing in the instruments that comprise the index.
The peer universe of the underlying annuity funds used for the peer group average annual total return calculation is based on a blend of Morningstar peer categories, as shown. Morningstar is an independent mutual fund rating service. A Fund’s performance may be compared to or ranked within a universe of mutual funds with investment objectives and policies similar but not necessarily identical to that of the Fund.
©2014 Morningstar, Inc. All Rights Reserved. The Morningstar information contained herein: (1) is proprietary to Morningstar and/or its content providers; (2) may not be copied or distributed; and (3) is not warranted to be accurate, complete or timely. Neither Morningstar nor its content providers are responsible for any damage or losses relating from any use of this information. Past performance is no guarantee of future results.
The views expressed in this document reflect our judgment as of the publication date and are subject to change at any time without notice.
GE Investment Distributors, Inc., Member of FINRA & SIPC, is the principal underwriter and distributor of the GE Investments Funds, Inc. and a wholly owned subsidiary of GE Asset Management Incorporated, the investment adviser of the Fund.
1
| | | | |
| Core Value Equity Fund | | | (Unaudited) | |

Paul C. Reinhardt
Senior Vice President

Stephen V. Gelhaus
Senior Vice President
The Core Value Equity Fund is co-managed by Paul C. Reinhardt and Stephen V. Gelhaus. Messrs. Reinhardt and Gelhaus both manage the Fund as a collaborative team. Both portfolio managers have the authority to increase or decrease existing positions in the Fund; however, Mr. Reinhardt, as lead manager, is vested with the authority to purchase securities that are new to the Fund or to divest the Fund of its entire position in a security. Mr. Reinhardt also has veto authority over Mr. Gelhaus’ trade decisions.
Paul C. Reinhardt is a Senior Vice President of GE Asset Management. He has been a portfolio manager for the Fund since April 2002. Mr. Reinhardt joined GE Asset Management in 1982 as an equity analyst and has been a portfolio manager since 1987.
Stephen V. Gelhaus is a Senior Vice President of GE Asset Management. He has been a member of the portfolio management team for the Fund since January 2002. Mr. Gelhaus joined GE Asset Management in June 1991 and was a research analyst in the U.S. equities group from 1995 through 2001 and became an associate portfolio manager for the Fund in August 1999.
| Q. | How did the GE Investments Core Value Equity Fund perform compared to its benchmark and Morningstar peer group for the twelve-month period ended December 31, 2013? |
| A. | For the twelve-month period ended December 31, 2013, the GE Investments Core Value Equity Fund returned 33.08%. The S&P 500® Index, the Fund’s benchmark, returned 32.39% and the Fund’s Morningstar peer group of 324 U.S. Insurance Large Blend Funds returned an average of 31.66% over the same period. |
| Q. | What market conditions affected the Fund performance? |
| A. | As economic data — from manufacturing to employment, housing, autos and consumer confidence — improved, the S&P 500 rose 32.4% in 2013, achieving its best single-year |
| | total return since 1997. The massive advance astonished many investors, as the size of the market rally dwarfed the pace of single-digit GDP and corporate earnings growth. In other words, the market rally was fueled by expanding valuations. At the beginning of 2013 S&P 500 stocks sold at 13x forward-earnings, and ended the year at a forward P/E of 15.4x — neither particularly cheap nor expensive by historical standards. The market’s ability to climb higher as the Federal Reserve announced its intention to taper government debt purchases, signaled investor confidence that the U.S. economy is in a sustained recovery. In this market environment, the S&P 500 cyclical sectors outperformed, led by consumer discretionary (+43%), health care (+41.5% led by strength in biotechnology stocks) and industrials (+41%). Conversely, higher-yielding, defensive stocks such as telecommunications (+11.5%) and utilities (+13%) lagged. The energy sector also underperformed as commodity prices stalled. During the year, small cap stocks outperformed large cap stocks. |
| Q. | What were the primary drivers of Fund performance? |
| A. | Stock selection was strong across the Fund with positive contributions from the majority of S&P 500 sectors. In addition, the Fund benefited from cyclical leadership, in particular from overweights in consumer discretionary and financials, and underweights in consumer staples, telecom, and utilities. |
| | Rising interest rates and more robust capital markets activity helped lead to outperformance within the Fund’s financials sector holdings. Asset management companies enjoyed increased fund flows, and the insurers got a lift from higher interest income and stronger pricing trends. The Fund’s bank and consumer finance |
2

| | holdings also rallied, given signs of increasing loan demand, a relatively benign regulatory environment, and better credit trends. Underweighting the real-estate investment trust (REIT) industry also helped performance. |
| | The Fund generated positive relative performance in the underweight consumer staples sector through stock selection. In general, our holdings generated better fundamental performance compared with the typical consumer staples in the S&P 500 Index. In the energy sector, our underweighting of the large integrated oil companies while selectively overweighting E&P (exploration & production) and services stocks, helped portfolio performance. |
| | The technology sector was a key detractor to Fund performance In general, companies perceived as “technology disruptors,” (e.g., including internet software and services companies) outperformed. While the Fund had some exposure to internet and software companies, the Fund’s relative value discipline kept it underweighted in the most-expensive, fastest-growing technology stocks. Given a difficult outlook for IT hardware companies, we reduced positions in several holdings of companies we believed are leveraged to enterprise spending growth. Within health care, the Fund lacked exposure to the highest-flying biotechnology companies, again because of our portfolio valuation discipline. This detracted from the Fund’s performance in health care. Stock selection was mixed within the industrials sector, with strong contributions from aerospace companies offset by weakness in machinery companies — particularly agricultural equipment manufacturers. |
| Q. | Were there any significant changes to the Fund during the period? |
| A. | The Fund consistently applied its relative value discipline on a stock-by-stock basis, investing in companies with high free-cash flow generation, strong management teams, and improving business mix. During the last eighteen months, we had strengthened our focus on the stocks we feel are the most attractive holdings in the Fund. We believe this emphasis on (and increased weighting in) ”high conviction” stocks has been instrumental in the Fund’s improved relative performance this year. |
| | During the year, the Fund increased holdings in the financials, energy and consumer discretionary sectors as we found several attractively valued stocks in these areas of the market. In financials the Fund added to companies that stand to benefit from rising interest rates – in general, the life insurers, banks and consumer finance companies. Within energy, we added to E&P companies with strong production prospects, particularly in North America. In consumer discretionary, the Fund continued to emphasize media companies, while adding to leisure and specialty retailers. We also increased the Fund’s exposure to autos and auto-related companies given the improved demand outlook for consumer durable spending. The Fund also initiated a position in a major commercial airline, as the industry dynamics, in our view, have turned favorable due to consolidation and focus on improving returns on capital. |
| | Due to strong relative performance, we trimmed several industrials holdings that had outperformed; in addition, we eliminated some holdings on fundamental concerns, taking the Fund from an overweight to an underweight positioning during the year. We sold down or eliminated several of the Fund’s technology holdings, due to deteriorating fundamentals for legacy IT companies. Given this selling, technology ended the year as the most-underweighted sector in the Fund. |
3
| | | | |
| Core Value Equity Fund | | | (Unaudited) | |
Understanding Your Fund’s Expenses
As a shareholder of the Fund you incur ongoing costs. Ongoing costs include portfolio management fees, professional fees, administrative fees and other Fund expenses. The following example is intended to help you understand your ongoing costs (in dollars) of investing in the Fund and to compare these costs with the ongoing costs of investing in other mutual funds.
To illustrate these ongoing costs, we have provided an example and calculated the expenses paid by investors in the Fund during the period. The information in the following table is based on an investment of $1,000, which is invested at the beginning of the period and held for the entire six-month period ended December 31, 2013.
Actual Expenses
The first section of the table provides information about actual account values and actual expenses. You may use the information in this section, together with the amount you invested, to estimate the expenses that you paid over the period. To do so, simply divide your account value by $1,000 (for example, an $8,600 account value divided by $1,000 = 8.6), then multiply the result by the number given under the heading “Expenses paid during the period” to estimate the expenses you paid on your account during the period.
Hypothetical Example for Comparison Purposes
The second section of the table provides information about hypothetical account values and hypothetical expenses based on the Fund’s actual expense ratio and an assumed rate of return of 5% per year before expenses, which is not the Fund’s actual return. The hypothetical account values and expenses may not be used to estimate the actual ending account balance or expenses you paid for the period. You may use this information to compare the ongoing costs of investing in the Fund and other funds. To do so, compare this 5% hypothetical example with the 5% hypothetical examples that appear in the shareholders reports of other funds.
Please note that the expenses shown in the table are meant to highlight and help you compare ongoing costs only and do not reflect transaction costs, such as sales charges or redemption fees, if any. Therefore, the second section of the table is useful in comparing ongoing costs only, and will not help you determine the relative total costs of owning different funds. Additionally, the expenses shown do not reflect the fees or charges associated with variable contracts through which shares of the Fund are offered.
July 1, 2013 – December 31, 2013
| | | | | | | | | | | | |
| | | Account value at the
beginning of the period ($) | | | Account value at the
end of the period ($) | | | Expenses paid
during the period ($)* | |
Actual Fund Return | | | 1,000.00 | | | | 1,148.00 | | | | 5.52 | |
Hypothetical 5% Return (2.5% for the period) | | | 1,000.00 | | | | 1,020.06 | | | | 5.19 | |
| * | Expenses are equal to the Fund’s annualized net expense ratio of 1.02% (for the period July 1, 2013 – December 31, 2013), multiplied by the average account value over the period, multiplied by 184/365 (to reflect the one-half year period). |
4
| | |
| Core Value Equity Fund | | (Unaudited) |
A mutual fund designed for investors who seek long-term growth of capital and future income. The Fund seeks to achieve its objectives by investing at least 80% of its net assets under normal circumstances in equity securities, such as common and preferred stocks. The Fund invests primarily in U.S. companies that the portfolio managers believe are undervalued by the market but have solid growth prospects.
| | | | | | |
| Morningstar Performance Comparison |
Based on average annual returns for periods ended 12/31/13
| | | | | | | | | | | | | | | |
| | | One Year | | Five Year | | Ten Year |
Number of funds in peer group | | | | 324 | | | | | 302 | | | | | 258 | |
Peer group average annual total return | | | | 31.66% | | | | | 16.99% | | | | | 6.78% | |
Morningstar Category in peer group: U.S. Insurance Large Blend | |
as a % of Fair Value of $18,026 (in thousands) on December 31, 2013 (b)(c)
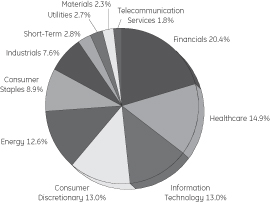
as of December 31, 2013 (as a % of Fair Value) (b)(c)
| | | | |
Wells Fargo & Co. | | | 2.72% | |
Pfizer Inc. | | | 2.72% | |
Johnson & Johnson | | | 2.60% | |
Comcast Corp., Class A | | | 2.46% | |
QUALCOMM Inc. | | | 2.43% | |
PepsiCo Inc. | | | 2.21% | |
CVS Caremark Corp. | | | 2.09% | |
Cisco Systems Inc. | | | 2.04% | |
Citigroup Inc. | | | 2.03% | |
Amgen Inc. | | | 2.03% | |
|
| Change in Value of a $10,000 Investment(a) |
Class 1 Shares
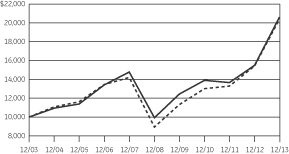

|
| Average Annual Total Return |
for the Periods Ended December 31, 2013
Class 1 Shares (Inception date 4/28/00)
| | | | | | | | | | | | | | | | | | | | |
| | | One
Year | | Five
Year | | Ten
Year | | Ending Value of a
$10,000 Investment (a) |
Core Value Equity Fund | | | | 33.08% | | | | | 15.75% | | | | | 7.50% | | | | $ | 20,617 | |
S&P 500 Index | | | | 32.39% | | | | | 17.94% | | | | | 7.40% | | | | $ | 20,429 | |
| (a) | Ending value of a $10,000 investment for the ten-year period or since inception, whichever is less. |
| (b) | The securities information regarding holdings, allocations and other characteristics is presented to illustrate examples of securities that the Fund has bought and the diversity of areas in which the Fund may invest as of a particular date. It may not be representative of the Fund’s current or future investments and should not be construed as a recommendation to purchase or sell a particular security. |
| (c) | Fair Value basis is inclusive of short-term investment in GE Institutional Money Market Fund Investment Class. |
See Notes to Performance on page 1 for further information, including an explanation of Morningstar peer categories.
Past performance does not predict future performance. The performance shown in the graphs and tables does not reflect the deduction of taxes that a shareholder would pay on Fund distributions or the redemption of Fund shares and does not reflect the fees or charges that would be associated with variable contracts through which shares of the Fund are offered.
5
Core Value Equity Fund
| | |
| Schedule of Investments | | December 31, 2013 |
| | | | | | | | | | |
| | | |
| | | Number
of Shares | | | Fair
Value | | | |
Common Stock — 95.8%† | | | | | | | | | | |
| |
Advertising — 0.7% | | | |
| | | |
The Interpublic Group of Companies Inc. | | | 6,818 | | | $ | 120,679 | | | |
| |
Aerospace & Defense — 3.3% | | | |
| | | |
General Dynamics Corp. | | | 426 | | | | 40,704 | | | |
Honeywell International Inc. | | | 3,302 | | | | 301,704 | | | |
The Boeing Co. | | | 1,811 | | | | 247,183 | | | |
| | | | | | | 589,591 | | | |
| |
Agricultural Products — 1.7% | | | |
| | | |
Archer-Daniels-Midland Co. | | | 7,033 | | | | 305,232 | | | |
| |
Airlines — 0.6% | | | |
| | | |
Delta Air Lines Inc. | | | 4,007 | | | | 110,072 | | | |
| |
Asset Management & Custody Banks — 3.5% | | | |
| | | |
Ameriprise Financial Inc. | | | 2,962 | | | | 340,778 | | | |
Invesco Ltd. | | | 7,821 | | | | 284,684 | | | |
| | | | | | | 625,462 | | | |
| |
Auto Parts & Equipment — 1.2% | | | |
| | | |
TRW Automotive Holdings Corp. | | | 2,877 | | | | 214,020 | | | (a) |
| |
Automobile Manufacturers — 1.5% | | | |
| | | |
Ford Motor Co. | | | 17,475 | | | | 269,639 | | | |
| |
Automotive Retail — 1.6% | | | |
| | | |
AutoZone Inc. | | | 618 | | | | 295,367 | | | (a) |
| |
Biotechnology — 2.0% | | | |
| | | |
Amgen Inc. | | | 3,198 | | | | 365,084 | | | |
| |
Broadcasting — 0.8% | | | |
| | | |
CBS Corp. | | | 2,131 | | | | 135,830 | | | |
| |
Cable & Satellite — 2.5% | | | |
| | | |
Comcast Corp., Class A | | | 8,524 | | | | 442,950 | | | |
| |
Commodity Chemicals — 1.7% | | | |
| | | |
LyondellBasell Industries N.V. | | | 3,835 | | | | 307,874 | | | |
| |
Communications Equipment — 4.5% | | | |
| | | |
Cisco Systems Inc. | | | 16,409 | | | | 368,382 | | | |
QUALCOMM Inc. | | | 5,902 | | | | 438,223 | | | |
| | | | | | | 806,605 | | | |
| |
Computer Hardware — 1.5% | | | |
| | | |
Apple Inc. | | | 469 | | | | 263,161 | | | (b) |
| | | | | | | | | | |
| | | |
| | | Number
of Shares | | | Fair
Value | | | |
| |
Computer Storage & Peripherals — 1.8% | | | |
| | | |
EMC Corp. | | | 12,785 | | | $ | 321,543 | | | |
| |
Construction & Farm Machinery — 0.3% | | | |
| | | |
Cummins Inc. | | | 342 | | | | 48,212 | | | |
| |
Consumer Finance — 1.4% | | | |
| | | |
American Express Co. | | | 2,771 | | | | 251,413 | | | |
| |
Department Stores — 0.9% | | | |
| | | |
Macy’s Inc. | | | 3,196 | | | | 170,666 | | | |
| |
Diversified Financial Services — 6.5% | | | |
| | | |
Citigroup Inc. | | | 7,032 | | | | 366,438 | | | |
JPMorgan Chase & Co. | | | 5,434 | | | | 317,780 | | | |
Wells Fargo & Co. | | | 10,783 | | | | 489,548 | | | |
| | | | | | | 1,173,766 | | | |
| |
Drug Retail — 2.1% | | | |
| | | |
CVS Caremark Corp. | | | 5,263 | | | | 376,673 | | | |
| |
Electric Utilities — 0.9% | | | |
| | | |
NextEra Energy Inc. | | | 1,918 | | | | 164,219 | | | |
| |
Electrical Components & Equipment — 0.8% | | | |
| | | |
Eaton Corp. PLC | | | 1,812 | | | | 137,929 | | | |
| |
General Merchandise Stores — 1.2% | | | |
| | | |
Dollar General Corp. | | | 3,624 | | | | 218,600 | | | (a) |
| |
Healthcare Distributors — 1.3% | | | |
| | | |
Cardinal Health Inc. | | | 3,536 | | | | 236,240 | | | |
| |
Healthcare Equipment — 0.9% | | | |
| | | |
Covidien PLC | | | 640 | | | | 43,584 | | | |
Medtronic Inc. | | | 320 | | | | 18,365 | | | |
Stryker Corp. | | | 1,278 | | | | 96,029 | | | |
| | | | | | | 157,978 | | | |
| |
Healthcare Services — 0.8% | | | |
| | | |
Express Scripts Holding Co. | | | 1,959 | | | | 137,600 | | | (a) |
| |
Home Improvement Retail — 0.7% | | | |
| | | |
Lowe’s Companies Inc. | | | 2,451 | | | | 121,447 | | | |
| |
Household Products — 0.6% | | | |
| | | |
Energizer Holdings Inc. | | | 1,068 | | | | 115,600 | | | |
| |
Independent Power Producers & Energy Traders — 1.8% | | | |
| | | |
AES Corp. | | | 9,590 | | | | 139,151 | | | |
Calpine Corp. | | | 4,262 | | | | 83,152 | | | (a) |
NRG Energy Inc. | | | 3,623 | | | | 104,052 | | | |
| | | | | | | 326,355 | | | |
See Notes to Schedules of Investments and Notes to Financial Statements.
6
Core Value Equity Fund
| | |
| Schedule of Investments | | December 31, 2013 |
| | | | | | | | | | |
| | | |
| | | Number
of Shares | | | Fair
Value | | | |
| |
Integrated Oil & Gas — 5.7% | | | |
| | | |
Chevron Corp. | | | 2,557 | | | $ | 319,395 | | | |
Exxon Mobil Corp. | | | 959 | | | | 97,051 | | | |
Hess Corp. | | | 3,090 | | | | 256,470 | | | |
Occidental Petroleum Corp. | | | 3,623 | | | | 344,547 | | | |
| | | | | | | 1,017,463 | | | |
| |
Integrated Telecommunication Services — 1.8% | | | |
| | | |
Verizon Communications Inc. | | | 6,562 | | | | 322,457 | | | |
| |
Internet Software & Services — 1.9% | | | |
| | | |
Google Inc. | | | 307 | | | | 344,058 | | | (a) |
| |
Life & Health Insurance — 1.0% | | | |
| | | |
Prudential Financial Inc. | | | 1,918 | | | | 176,878 | | | |
| |
Life Sciences Tools & Services — 0.6% | | | |
| | | |
PerkinElmer Inc. | | | 2,771 | | | | 114,248 | | | |
| |
Managed Healthcare — 0.9% | | | |
| | | |
UnitedHealth Group Inc. | | | 2,129 | | | | 160,314 | | | |
| |
Movies & Entertainment — 1.9% | | | |
| | | |
Time Warner Inc. | | | 5,008 | | | | 349,158 | | | |
| |
Multi-Line Insurance — 2.8% | | | |
| | | |
American International Group Inc. | | | 6,990 | | | | 356,839 | | | |
Hartford Financial Services Group Inc. | | | 4,261 | | | | 154,376 | | | |
| | | | | | | 511,215 | | | |
| |
Oil & Gas Equipment & Services — 4.8% | | | |
| | | |
Cameron International Corp. | | | 3,516 | | | | 209,307 | | | (a) |
Halliburton Co. | | | 6,457 | | | | 327,693 | | | |
Schlumberger Ltd. | | | 3,623 | | | | 326,469 | | | |
| | | | | | | 863,469 | | | |
| |
Oil & Gas Exploration & Production — 2.2% | | | |
| | | |
Anadarko Petroleum Corp. | | | 1,599 | | | | 126,833 | | | |
Marathon Oil Corp. | | | 7,672 | | | | 270,821 | | | |
| | | | | | | 397,654 | | | |
| |
Packaged Foods & Meats — 1.0% | | | |
| | | |
Mondelez International Inc. | | | 5,327 | | | | 188,043 | | | |
| |
Pharmaceuticals — 8.4% | | | |
| | | |
Actavis PLC | | | 469 | | | | 78,792 | | | (a) |
GlaxoSmithKline PLC ADR | | | 2,238 | | | | 119,487 | | | |
Johnson & Johnson | | | 5,115 | | | | 468,483 | | | |
Merck & Company Inc. | | | 7,246 | | | | 362,662 | | | |
Pfizer Inc. | | | 15,982 | | | | 489,529 | | | |
| | | | | | | 1,518,953 | | | |
| |
Property & Casualty Insurance — 1.7% | �� | | |
| | | |
ACE Ltd. | | | 3,047 | | | | 315,456 | | | |
| | | | | | | | | | |
| | | |
| | | Number
of Shares | | | Fair
Value | | | |
| |
Railroads — 1.1% | | | |
| | | |
CSX Corp. | | | 7,032 | | | $ | 202,311 | | | |
| |
Regional Banks — 1.4% | | | |
| | | |
Regions Financial Corp. | | | 25,572 | | | | 252,907 | | | |
| |
Research & Consulting Services — 0.3% | | | |
| | | |
Nielsen Holdings N.V. | | | 1,066 | | | | 48,919 | | | |
| |
Semiconductor Equipment — 0.6% | | | |
| | | |
Applied Materials Inc. | | | 5,754 | | | | 101,788 | | | |
| |
Semiconductors — 0.7% | | | |
| | | |
Analog Devices Inc. | | | 2,642 | | | | 134,557 | | | |
| |
Soft Drinks — 3.5% | | | |
| | | |
Coca-Cola Enterprises Inc. | | | 5,114 | | | | 225,681 | | | |
PepsiCo Inc. | | | 4,795 | | | | 397,697 | | | |
| | | | | | | 623,378 | | | |
| |
Specialized REITs — 1.7% | | | |
| | | |
American Tower Corp. | | | 3,837 | | | | 306,269 | | | |
| | | |
Specialty Chemicals — 0.6% | | | | | | | | | | |
| | | |
PPG Industries Inc. | | | 383 | | | | 72,640 | | | |
Rockwood Holdings Inc. | | | 426 | | | | 30,638 | | | |
| | | | | | | 103,278 | | | |
| | | |
Systems Software — 2.1% | | | | | | | | | | |
| | | |
Microsoft Corp. | | | 3,728 | | | | 139,539 | | | |
Oracle Corp. | | | 6,180 | | | | 236,447 | | | |
| | | | | | | 375,986 | | | |
| | | |
Total Common Stock
(Cost $13,021,217) | | | | | | | 17,238,566 | | | |
| | | | | | | | | | |
Exchange Traded Funds — 1.6% |
Financial Select Sector SPDR Fund | | | 2,466 | | | | 53,907 | | | (c) |
Industrial Select Sector SPDR Fund | | | 4,470 | | | | 233,602 | | | (b,c) |
| | | |
Total Exchange Traded Funds
(Cost $178,288) | | | | | | | 287,509 | | | |
| | | |
Total Investments in Securities
(Cost $13,199,505) | | | | | | | 17,526,075 | | | |
| | | | | | | | | | |
See Notes to Schedules of Investments and Notes to Financial Statements.
7
Core Value Equity Fund
| | |
| Schedule of Investments | | December 31, 2013 |
| | | | | | | | |
| | | |
| | | | | Fair
Value | | | |
Short-Term Investments — 2.8% |
GE Institutional Money Market Fund — Investment Class 0.00%
(Cost $500,296) | | | | $ | 500,296 | | | (d,e) |
| | | |
Total Investments
(Cost $13,699,801) | | | | | 18,026,371 | | | |
| | | |
Liabilities in Excess of Other Assets,
net — (0.2)% | | | | | (33,453 | ) | | |
| | | | | | | | |
| | | |
NET ASSETS — 100.0% | | | | $ | 17,992,918 | | | |
| | | | | | | | |
| | | | | | | | |
The Fund had the following long futures contracts open at December 31, 2013:
| | | | | | | | | | | | | | | | | | | | |
| Description | | Expiration
date | | Number
of
Contracts | | Current
Notional
Value | | Unrealized
Appreciation |
S&P 500 Emini Index Futures | | March 2014 | | | | 4 | | | | $ | 368,220 | | | | $ | 12,149 | |
See Notes to Schedules of Investments and Notes to Financial Statements.
8
| | |
| Notes to Schedule of Investments | | December 31, 2013 |
The views expressed in this document reflect our judgment as of the publication date and are subject to change at any time without notice. The securities cited may not be representative of the Fund’s future investments and should not be construed as a recommendation to purchase or sell a particular security. See the Fund’s summary prospectus and statutory prospectus for complete descriptions of investment objectives, policies, risks and permissible investments.
| (a) | Non-income producing security. |
| (b) | At December 31, 2013, all or a portion of this security was pledged to cover collateral requirements for futures. |
| (c) | Sponsored by SSgA Funds Management, Inc., an affiliate of State Street Bank & Trust Co., the Fund’s custodian and accounting agent. |
| (d) | Coupon amount represents effective yield. |
| (e) | GE Asset Management Incorporated (“GEAM”), the investment adviser of the Fund, also serves as investment adviser of the GE Institutional Money Market Fund. |
| † | Percentages are based on net assets as of December 31, 2013. |
Abbreviations:
| | |
| |
ADR | | American Depository Receipt |
| |
REIT | | Real Estate Investment Trust |
| |
SPDR | | Standard and Poor’s Depository Receipts |
9
Financial Highlights
Selected data based on a share outstanding throughout the fiscal years indicated
| | | | | | | | | | | | | | | | | | | | |
| | | 12/31/13 | | | 12/31/12 | | | 12/31/11 | | | 12/31/10 | | | 12/31/09 | |
| Inception date | | | — | | | | — | | | | — | | | | — | | | | 4/28/00 | |
Net asset value, beginning of period | | $ | 9.67 | | | $ | 8.63 | | | $ | 8.85 | | | $ | 8.04 | | | $ | 6.48 | |
Income/(loss) from investment operations: | | | | | | | | | | | | | | | | | | | | |
Net investment income | | | 0.11 | | | | 0.12 | | | | 0.08 | | | | 0.11 | * | | | 0.08 | |
Net realized and unrealized gains/(losses) on investments | | | 3.09 | | | | 1.04 | | | | (0.22) | | | | 0.82 | | | | 1.57 | |
Total income/(loss) from investment operations | | | 3.20 | | | | 1.16 | | | | (0.14) | | | | 0.93 | | | | 1.65 | |
Less distributions from: | | | | | | | | | | | | | | | | | | | | |
Net investment income | | | 0.11 | | | | 0.12 | | | | 0.08 | | | | 0.12 | | | | 0.09 | |
Net realized gains | | | 0.87 | | | | – | | | | – | | | | – | | | | – | |
Total distributions | | | 0.98 | | | | 0.12 | | | | 0.08 | | | | 0.12 | | | | 0.09 | |
Net asset value, end of period | | $ | 11.89 | | | $ | 9.67 | | | $ | 8.63 | | | $ | 8.85 | | | $ | 8.04 | |
TOTAL RETURN(a) | | | 33.08% | | | | 13.41% | | | | (1.60)% | | | | 11.57% | | | | 25.40% | |
| | | | | |
RATIOS/SUPPLEMENTAL DATA: | | | | | | | | | | | | | | | | | | | | |
Net assets, end of period (in thousands) | | | $17,993 | | | | $15,523 | | | | $16,251 | | | | $19,756 | | | | $21,847 | |
Ratios to average net assets: | | | | | | | | | | | | | | | | | | | | |
Net investment income | | | 0.89% | | | | 1.14% | | | | 0.80% | | | | 1.32% | | | | 1.16% | |
Net expenses | | | 1.02% | (b) | | | 1.08% | (b) | | | 1.28% | (b) | | | 0.97% | (b) | | | 1.24% | (b) |
Gross expenses | | | 1.02% | | | | 1.08% | | | | 1.28% | | | | 0.97% | | | | 1.24% | |
Portfolio turnover rate | | | 43% | | | | 62% | | | | 49% | | | | 45% | | | | 61% | |
Notes to Financial Highlights
| (a) | Total returns are historical and assume changes in share price, reinvestment of dividends and capital gains distributions and do not include the effect of insurance contract charges. Past performance does not guarantee future results. |
| (b) | Reflects GEAM’s waiver of a portion of the Fund’s advisory and administrative fee (“management fee”) in an amount equal to the management fee earned by GEAM with respect to the Fund’s investment in an affiliated money market fund managed by GEAM. |
| * | Per share values have been calculated using the average share method. |
The accompanying Notes are an integral part of these financial statements.
10
| | | | |
Statement of Assets and Liabilities December 31, 2013 | | | |
| |
ASSETS | | | | |
Investments in securities, at Fair Value (cost $13,199,505) | | $ | 17,526,075 | |
Short-term affiliated investments (at amortized cost) | | | 500,296 | |
Income receivables | | | 16,670 | |
Receivable for fund shares sold | | | 955 | |
Variation margin receivable | | | 1,280 | |
Other assets | | | 150 | |
Total assets | | | 18,045,426 | |
| |
LIABILITIES | | | | |
Payable for fund shares redeemed | | | 27 | |
Payable to GEAM | | | 9,598 | |
Accrued other expenses | | | 42,883 | |
Total liabilities | | | 52,508 | |
NET ASSETS | | $ | 17,992,918 | |
| |
NET ASSETS CONSIST OF: | | | | |
Capital paid in | | | 13,495,227 | |
Undistributed (distributions in excess of) net investment income | | | 259 | |
Accumulated net realized gain | | | 158,713 | |
Net unrealized appreciation (depreciation) on: | | | | |
Investments | | | 4,326,570 | |
Futures | | | 12,149 | |
NET ASSETS | | $ | 17,992,918 | |
Shares outstanding ($0.01 par value, unlimited shares outstanding) | | | 1,513,482 | |
Net asset value per share | | | $11.89 | |
The accompanying Notes are an integral part of these financial statements.
11
| | | | |
Statement of Operations For the year ended December 31, 2013 | | | |
| |
INVESTMENT INCOME | | | | |
Income | | | | |
Dividend | | $ | 322,321 | |
Interest | | | 1,511 | |
Income from affiliated investments | | | 87 | |
Less: Foreign taxes withheld | | | (1,475 | ) |
Total income | | | 322,444 | |
| |
Expenses | | | | |
Advisory and administration fees | | | 109,716 | |
Directors’ fees | | | 723 | |
Custody and accounting expenses | | | 27,254 | |
Professional fees | | | 18,384 | |
Other expenses | | | 16,486 | |
Total expenses before waivers | | | 172,563 | |
Less: Fees waived by the adviser | | | (541 | ) |
Net expenses | | | 172,022 | |
Net investment income | | | 150,422 | |
| |
NET REALIZED AND UNREALIZED GAIN (LOSS) ON INVESTMENTS | | | | |
| |
Realized gain (loss) on: | | | | |
Investments | | | 1,930,570 | |
Futures | | | 72,462 | |
| |
Increase (decrease) in unrealized appreciation/depreciation on: | | | | |
Investments | | | 2,611,844 | |
Futures | | | 11,365 | |
Net realized and unrealized gain on investments | | | 4,626,241 | |
Net increase in net assets resulting from operations | | $ | 4,776,663 | |
The accompanying Notes are an integral part of these financial statements.
12
| | | | | | | | |
| Statements of Changes in Net Assets | | | | | | |
| | | Year Ended December 31,
2013 | | | Year Ended December 31,
2012 | |
| | |
INCREASE (DECREASE) IN NET ASSETS | | | | | | | | |
Operations: | | | | | | | | |
Net investment income | | $ | 150,422 | | | $ | 184,977 | |
Net realized gain (loss) on investments and futures | | | 2,003,032 | | | | 1,217,645 | |
Net increase (decrease) in unrealized appreciation/depreciation on investments
and futures | | | 2,623,209 | | | | 671,266 | |
Net increase (decrease) from operations | | | 4,776,663 | | | | 2,073,888 | |
Distributions to shareholders from: | | | | | | | | |
Net investment income | | | | | | | | |
Class 1 | | | (150,163 | ) | | | (185,461 | ) |
Net realized gains | | | | | | | | |
Class 1 | | | (1,214,132 | ) | | | — | |
Total distributions | | | (1,364,295 | ) | | | (185,461 | ) |
Increase (decrease) in assets from operations and distributions | | | 3,412,368 | | | | 1,888,427 | |
Share transactions: | | | | | | | | |
Proceeds from sale of shares | | | | | | | | |
Class 1 | | | 473,023 | | | | 361,601 | |
Value of distributions reinvested | | | | | | | | |
Class 1 | | | 1,364,295 | | | | 185,461 | |
Cost of shares redeemed | | | | | | | | |
Class 1 | | | (2,779,553 | ) | | | (3,163,471 | ) |
Class 4* | | | — | | | | (10,053 | ) |
Net increase (decrease) from share transactions | | | (942,235 | ) | | | (2,626,462 | ) |
Total increase (decrease) in net assets | | | 2,470,133 | | | | (738,035 | ) |
| | |
NET ASSETS | | | | | | | | |
Beginning of year | | | 15,522,785 | | | | 16,260,820 | |
End of year | | $ | 17,992,918 | | | $ | 15,522,785 | |
Undistributed (distributions in excess of) net investment income, end of period | | $ | 259 | | | $ | 50 | |
| | |
CHANGES IN FUND SHARES | | | | | | | | |
| | |
Class 1 | | | | | | | | |
Shares sold | | | 41,696 | | | | 38,255 | |
Issued for distributions reinvested | | | 115,228 | | | | 19,279 | |
Shares redeemed | | | (248,195 | ) | | | (336,258 | ) |
Net increase (decrease) in fund shares | | | (91,271 | ) | | | (278,724 | ) |
| | |
Class 4* | | | | | | | | |
Shares redeemed | | | — | | | | (1,089 | ) |
Net increase (decrease) in fund shares | | | — | | | | (1,089 | ) |
| * | Share Class 4 was closed effective June 29, 2012. |
The accompanying Notes are an integral part of these financial statements.
13
| | |
| Notes to Financial Statements | | December 31, 2013 |
| 1. | Organization of the Company |
GE Investments Funds, Inc. (the “Company”) was incorporated under the laws of the Commonwealth of Virginia on May 14, 1984 and is registered under the Investment Company Act of 1940, as amended (the “1940 Act”), as an open-end management investment company. The Company is composed of eleven investment portfolios (collectively the “Funds”), although only the following eight are currently being offered: U.S. Equity Fund, S&P 500 Index Fund, Premier Growth Equity Fund, Core Value Equity Fund (the “Fund”), Small-Cap Equity Fund, Total Return Fund, Income Fund and Real Estate Securities Fund.
Shares of the Funds of the Company are offered only to insurance company separate accounts that fund certain variable life insurance contracts and variable annuity contracts. GE Asset Management Incorporated (“GEAM”) is the investment adviser and administrator of each of the Funds.
The Company currently offers one share class (Class 1) of the Fund as an investment option for variable life insurance and variable annuity contracts.
| 2. | Summary of Significant Accounting Policies |
The preparation of financial statements in conformity with U.S. generally accepted accounting principles (“GAAP”) requires management to make estimates and assumptions that affect the reported amounts of assets and liabilities and disclosure of contingent assets and liabilities at the date of the financial statements and the reported amounts of increases and decreases in net assets from operations during the reporting period. Actual results may differ from those estimates.
Subsequent events after the balance sheet date through the date the financial statements were issued have been evaluated in the preparation of the financial statements. There are no items to report.
The following summarizes the significant accounting policies of the Company:
Securities Valuation and Transactions All investments in securities are recorded at their estimated fair value, as described in Note 3.
Securities transactions are accounted for as of the trade date. Realized gains and losses on investments sold are recorded on the basis of identified cost for both financial statement and federal tax purposes.
Derivatives The Fund is subject to equity price risk in the normal course of pursuing its investment objective. The
Fund may enter into derivative transactions (such as options, futures, and options on futures) to gain market exposure to a certain type of broad-based index as an alternative to investing directly in the securities representing such index.
Futures Contracts A futures contract represents a commitment for the future purchase or sale of an asset at a specified price on a specified date. During the year ended December 31, 2013, the Fund invested in stock index future contracts to gain equity exposure for accumulating and residual cash positions. Buying futures tends to increase a Fund’s exposure to the underlying instrument while selling futures tends to decrease a Fund’s exposure to the underlying instrument, or hedge other Fund investments. The Fund will not enter into a transaction involving futures for speculative purposes. With futures contracts, there is minimal counterparty credit risk to the Fund since futures contracts are exchange traded and the exchange’s clearinghouse, as counterparty to all traded futures, guarantees the futures against default. The Fund’s risks in using these contracts include changes in the value of the underlying instruments, non-performance of the counterparties under the contracts’ terms and changes in the liquidity of the secondary market for the contracts. Futures contracts are valued at the settlement price established each day by the board of trade or exchange on which they principally trade.
Upon entering into a financial futures contract, the Fund is required to pledge to the broker an amount of cash and/or other assets equal to a certain percentage of the contract amount, known as initial margin deposit. Subsequent payments, known as variation margin, are made or received by the Fund each day, depending on the daily fluctuation in the fair value of the underlying security. The Fund records an unrealized gain or loss equal to the daily variation margin. Should market conditions move unexpectedly, the Fund may not achieve the anticipated benefits of the futures contracts and may incur a loss. The Fund recognizes a realized gain or loss on the expiration or closing of a futures contract.
Investment Income Corporate actions (including cash dividends) are recorded on the ex-dividend date, net of applicable withholding taxes, except for certain foreign corporate actions which are recorded as soon after the ex-dividend date as such information becomes available. Withholding taxes in foreign dividends have been provided for in accordance with the Fund’s understanding of the applicable country’s tax rules and rates.
14
| | |
| Notes to Financial Statements | | December 31, 2013 |
Interest income is recorded on the accrual basis. Accretion of discounts and amortization of premiums on taxable bonds are to the call or maturity date, whichever is shorter, using the effective yield method.
Expenses Fund specific expenses are charged to the Fund that incurs such expenses. Such expenses may include custodial fees, legal and accounting fees, printing costs and registration fees. Expenses that are not fund specific are allocated pro rata across the Funds. Expenses of the Fund are generally paid directly by the Fund, however, expenses may be paid by GEAM and reimbursed by the Fund.
Federal Income Taxes The Fund intends to comply with all sections of the Internal Revenue Code applicable to regulated investment companies including the distribution of substantially all of its taxable net investment income and net realized capital gains to its shareholders. Therefore, no provision for federal income tax has been made. The Fund is treated as a separate taxpayer for federal income tax purposes.
The Fund utilizes various methods to measure the fair value of most of its investments on a recurring basis. GAAP establishes a framework for measuring fair value and providing related disclosures. Broadly, the framework requires fair value to be determined based on the exchange price that would be received for an asset or paid to transfer a liability (an exit price) in the principal or most advantageous market for the asset or liability in an orderly transaction between market participants at the measurement date. In the absence of active markets for the identical assets or liabilities, such measurements involve developing assumptions based on market observable data and, in the absence of such data, internal information that is consistent with what market participants would use in a hypothetical transaction that occurs at the measurement date. It also establishes a three-level valuation hierarchy based upon observable and non-observable inputs.
Observable inputs reflect market data obtained from independent sources, while unobservable inputs reflect our market assumptions. Preference is given to observable inputs. These two types of inputs create the following fair value hierarchy:
Level 1 — Quoted prices for identical investments in active markets.
Level 2 — Quoted prices for similar investments in active markets; quoted prices for identical or similar
investments in markets that are not active; and model-derived valuations whose inputs are observable or whose significant value drivers are observable.
Level 3 — Significant inputs to the valuation model are unobservable.
Policies and procedures are maintained to value investments using the best and most relevant data available. In addition, pricing vendors are utilized to assist in valuing investments. GEAM performs periodic reviews of the methodologies used by independent pricing services including price validation of individual securities.
Fair Value Measurement The following section describes the valuation methodologies the Fund uses to measure different financial investments at fair value.
The Fund’s portfolio securities are valued generally on the basis of market quotations. Equity securities generally are valued at the last reported sale price on the primary market in which they are traded. Portfolio securities listed on NASDAQ are valued using the NASDAQ Official Closing Price, Level 1 securities primarily include publicly-traded equity securities. If no sales occurred on the exchange or NASDAQ that day, the portfolio security generally is valued using the last reported bid price. In those circumstances the Fund classifies the investment securities in Level 2.
Short-term investments of sufficient credit quality with remaining maturities of sixty days or less at the time of purchase are typically valued on the basis of amortized cost which approximates fair value and these are included in Level 2. If it is determined that amortized cost does not approximate fair value, securities may be valued based on dealer supplied valuations or quotations. In these infrequent circumstances, pricing services may provide the Fund with valuations that are based on significant unobservable inputs, and in those circumstances the investment securities are classified in Level 3.
If prices are not readily available for a portfolio security, or if it is believed that a price for a portfolio security does not represent its fair value, the security may be valued using procedures approved by the Fund’s Board of Directors that are designed to establish its “fair” value. These securities are typically classified in Level 3. Those procedures require that the fair value of a security be established by a valuation committee of GEAM. The valuation committee follows different protocols for different types of investments and circumstances. The fair value procedures may be used to value any investment of the Fund in the appropriate circumstances.
15
| | |
| Notes to Financial Statements | | December 31, 2013 |
Fair value determinations generally are used for securities whose value is affected by a significant event that will materially affect the value of a security and which occurs subsequent to the time of the close of the principal market on which such security trades but prior to the calculation of the Fund’s NAV.
The value established for such a portfolio security may be different than what would be produced through the use of market quotations or another methodology. Portfolio securities that are valued using techniques other than market quotations, including “fair valued” securities, may be subject to greater fluctuation in their value from one day to the next than would be the case if market quotations were used. In addition, there is no assurance that the Fund could sell a portfolio security for the value established for it at any time and it is possible that the Fund would incur a loss because a portfolio security is sold at a discount to its established value.
Other financial investments are derivative instruments that are not reflected in total investments, such as futures, forwards, swaps, and written options contracts, which are valued based on fair value as discussed above.
The Fund uses closing prices for derivatives included in Level 1, which are traded either on exchanges or liquid over-the-counter markets. Derivative assets and liabilities included in Level 2 primarily represent interest rate swaps, cross-currency swaps and foreign currency and commodity forward and option contracts. Derivative assets and liabilities included in Level 3 primarily represent interest rate products that contain embedded optionality or prepayment features.
The inputs or methodology used for valuing securities are not an indication of the risk associated with investing in those securities.
The following table presents the Fund’s investments measured at fair value on a recurring basis at December 31, 2013:
| | | | | | | | | | | | | | | | | | | | |
| Investments | | Level 1 | | Level 2 | | Level 3 | | Total |
Investments in Securities† | | | | | | | | | | | | | | | | | | | | |
Common Stock | | | $ | 17,238,566 | | | | $ | — | | | | $ | — | | | | $ | 17,238,566 | |
Exchange Traded Funds | | | | 287,509 | | | | | — | | | | | — | | | | | 287,509 | |
Short-Term Investments | | | | 500,296 | | | | | — | | | | | — | | | | | 500,296 | |
| | | | | | | | | | | | | | | | | | | | |
Total Investments in Securities | | | $ | 18,026,371 | | | | $ | — | | | | $ | — | | | | $ | 18,026,371 | |
| | | | | | | | | | | | | | | | | | | | |
Other Financial Instruments* | | | | | | | | | | | | | | | | | | | | |
Futures Contracts — Unrealized Appreciation | | | $ | 12,149 | | | | $ | — | | | | $ | — | | | | $ | 12,149 | |
| | | | | | | | | | | | | | | | | | | | |
| † | See Schedule of Investments for industry classification. |
| * | Other financial instruments include derivative instruments such as futures contracts. Amounts shown represent unrealized appreciation (depreciation), at period end. |
There were no transfers between fair value levels. Transfers between fair value levels are considered to occur at the beginning of the period.
| 4. | Derivatives Transactions |
Shown below are the derivative contracts entered into by the Fund, summarized by primary risk exposure as they appear on the Statement of Assets and Liabilities, all of
which are not accounted for as hedging instruments under FASB Accounting Standards Codification (“ASC”) No. 815 Derivatives and Hedging as of December 31, 2013.
| | | | | | | | | | | | |
| | | Asset Derivatives December 31, 2013 | | | Liability Derivatives December 31, 2013 | |
Derivatives not accounted for as hedging instruments under ASC 815 | | Location in the Statements of Assets and Liabilities | | Fair
Value ($) | | | Location in the Statements of Assets and Liabilities | | Fair
Value ($) | |
Equity Contracts | | Assets, Net Assets — Net Unrealized Appreciation/ (Depreciation) on Futures | | | 12,149* | | | Liabilities, Net Assets — Net Unrealized Appreciation/ (Depreciation) on Futures | | | — | |
| * | Includes cumulative unrealized appreciation/(depreciation) of futures contracts as reported in the Schedule of Investments and within the components of the net assets section of the Statement of Assets and Liabilities. Only the current day’s variation margin is reported within the Assets and/or Liabilities section on the Statement of Assets and Liabilities. |
16
| | |
| Notes to Financial Statements | | December 31, 2013 |
Shown below are the effects of derivative instruments on the Fund’s Statement of Operation, summarized by primary risk exposure all of which are not accounted for as hedging instruments under ASC 815.
| | | | | | | | | | | | | | |
Derivatives not accounted for as hedging instruments under ASC 815 | | Location in the Statements of Operations | | Total Notional Amount
of Futures
Contracts
Purchased/(Sold) ($) | | | Realized Gain
(Loss) on
Derivatives
Recognized
in Income ($) | | | Change in
Unrealized
Appreciation
(Depreciation)
on Derivatives
Recognized in
Income ($) | |
Equity Contracts | | Realized gain/(loss) on futures, Increase/(decrease) in unrealized appreciation/ (depreciation) on Futures | |
| 4,528,514/
(4,386,274) |
| | | 72,462 | | | | 11,365 | |
The Company shares a revolving credit facility of up to $150 million with a number of its affiliates. The credit facility is with its custodian bank, State Street Bank and Trust Company (“State Street”). The revolving credit facility requires the payment of a commitment fee equal to 0.10% per annum on the daily unused portion of the credit facility, payable quarterly. The portion borne by the Funds generally is borne proportionally based upon net assets. In addition, the Company has a $100 million uncommitted, unsecured line of credit with State Street. Generally, borrowings under the credit facilities would accrue interest at the Federal Funds Rate plus 50 basis points and would be borne by the borrowing fund. The maximum amount allowed to be borrowed by any one fund is the lesser of (i) 33.33% of its total assets or (ii) 20% of its net assets. The credit facilities were not utilized by the Fund during the year ended December 31, 2013.
| 6. | Compensation and Fees Paid to Affiliates |
GEAM, a registered investment adviser, was retained by the Company’s Board of Directors effective March 16, 2000 to act as investment adviser and administrator of the Fund. GEAM’s compensation for investment advisory and administrative services (“management fee”) is paid monthly based on the average daily net assets of the Fund at an annualized rate of 0.65%.
GEAM has a contractual arrangement with the Fund to waive a portion of the Fund’s management fee in the amount equal to the management fee earned by GEAM with respect to the Fund’s investment in the GE Institutional Money Market Fund, if any.
Directors’ Compensation The Fund pays no compensation to its directors who are officers or
employees of GEAM or its affiliates. Directors who are not such officers or employees also serve in a similar capacity for other funds advised by GEAM. Compensation paid to non-interested Directors are reflected on the Statement of Operations. These fees are allocated pro rata across all of the mutual fund platforms served by the Directors, including the Fund, and are based upon the relative net assets of each fund within such platforms.
| 7. | Investment Transactions |
Purchases and Sales of Securities The cost of purchases and the proceeds from sales of investments, other than short-term securities, for the year ended December 31, 2013, were as follows:
| | | | | | |
| Non-U.S. Government Securities | |
| Purchases | | | Sales | |
| $ | 7,061,151 | | | $ | 9,423,978 | |
The Fund is subject to ASC 740, Income Taxes. ASC 740 provides guidance for financial accounting and reporting for the effects of income taxes that result from an entity’s activities during the year. ASC 740 also provides guidance regarding how certain uncertain tax positions should be recognized, measured, presented and disclosed in the financial statements. ASC 740 requires evaluation of tax positions taken or expected to be taken in the course of preparing the Fund’s tax returns to determine whether the tax positions are “more likely than not” of being sustained by the applicable tax authority. There are no adjustments to the Fund’s net assets required under ASC 740. The Fund’s 2010, 2011, 2012, and 2013 fiscal years tax returns are still open to examination by the Federal and applicable state tax authorities.
17
| | |
| Notes to Financial Statements | | December 31, 2013 |
At December 31, 2013, information on the tax cost of investments and distributable earnings on a tax basis was as follows:
| | | | | | | | | | | | | | | | | | | | | | | | | | | | | | |
Cost of
Investments For
Tax Purposes | | | Gross Tax | | | Net Tax Appreciation/
(Depreciation) | | | Undistributed | | | | |
| | Appreciation | | | Depreciation | | | Investments | | | Derivatives/
Currency | | | Income | | | Accum.
Capital
Gain/(Loss) | | | Late-Year
Losses | |
| $ | 13,748,187 | | | $ | 4,334,125 | | | $ | (55,941 | ) | | $ | 4,278,184 | | | $ | 12,149 | | | $ | 259 | | | $ | 219,248 | | | $ | — | |
As of December 31, 2013, the Fund had no capital loss carryovers. Capital loss carryovers are available to offset future realized capital gains to the extent provided in the Internal Revenue Code and regulations thereunder. To the extent that these carryover losses are used to offset future capital gains, it is probable that gains offset will not be distributed to shareholders because they would be taxable as ordinary income.
During the year ended December 31, 2013, the Fund utilized $525,527 of prior year capital loss carryovers.
Any qualified late-year loss is deemed to arise on the first day of the Fund’s next tax year (if the Fund elects to defer such loss). Under this regime, generally, the Fund can elect to defer any post-October capital loss and/or any late-year ordinary loss as defined by the Internal Revenue Code.
The Fund incurred no such losses for the year ended December 31, 2013.
The tax character of distributions paid during the years ended December 31, 2013 and December 31, 2012 were as follows:
| | | | | | | | | | | | | | | |
| Year | | Ordinary
Income | | Long-Term
Capital Gains | | Total |
2013 | | | $ | 150,163 | | | | $ | 1,214,132 | | | | $ | 1,364,295 | |
2012 | | | | 185,461 | | | | | — | | | | | 185,461 | |
Distributions to Shareholders The Fund declares and pays any dividends from net investment income annually. The Fund declares and pays any net realized capital gains in excess of capital loss carryforwards distributions annually. The character of income and gains to be distributed is determined in accordance with income tax regulations which may differ from generally accepted accounting principles. These differences include (but are not limited to) futures, investments organized as partnerships for tax purposes, and losses deferred due to wash sale transactions and future contracts. Reclassifications due to permanent book/tax differences are made to the Fund’s capital accounts to reflect income and gains available for distribution (or available capital loss carryovers) under income tax regulations. These reclassifications have no impact on net investment income, realized gains or losses, or the net asset value of the Fund. The calculation of net investment income per share in the Financial Highlights table excludes these adjustments.
The reclassifications for the year ended December 31, 2013 were as follows:
| | | | | | | | | | |
Undistributed
Net Investment
Income | | | Accumulated
Net Realized
Gain (Loss) | | | Capital
Paid In | |
| $ | (50 | ) | | $ | 10,860 | | | $ | (10,810 | ) |
18
Report of Independent Registered Public Accounting Firm
The Shareholders and Board of Directors
GE Investments Funds, Inc.
We have audited the accompanying statement of assets and liabilities, including the schedule of investments, of the Core Value Equity Fund (the “Fund”), a series of GE Investments Funds, Inc., as of December 31, 2013 and the related statement of operations for the year then ended, statements of changes in net assets for each of the years in the two-year period then ended, and the financial highlights for each of the years in the five-year period then ended. These financial statements and financial highlights are the responsibility of the Fund’s management. Our responsibility is to express an opinion on these financial statements and financial highlights based on our audits.
We conducted our audits in accordance with the standards of the Public Company Accounting Oversight Board (United States). Those standards require that we plan and perform the audit to obtain reasonable assurance about whether the financial statements are free of material misstatement. An audit includes examining, on a test basis, evidence supporting the amounts and disclosures in the financial statements. Our procedures included confirmation of securities owned as of December 31, 2013 by correspondence with the custodian and brokers. An audit also includes assessing the accounting principles used and significant estimates made by management, as well as evaluating the overall financial statement presentation. We believe that our audits provide a reasonable basis for our opinion.
In our opinion, the financial statements and financial highlights referred to above present fairly, in all material respects, the financial position of the Core Value Equity Fund as of December 31, 2013, the results of its operations, changes in its net assets and financial highlights for each of the years described above, in conformity with U.S. generally accepted accounting principles.

Boston, Massachusetts
February 17, 2014
19
| | |
| Tax Information | | (Unaudited) |
For the year ended December 31, 2013, the Fund hereby designates $1,214,132 as capital gain dividends, or the amount ultimately treated as capital gain net income.
The amounts presented herein may differ from amounts presented elsewhere in the financial statements due to differences between tax and financial accounting principles. Please consult a tax advisor if you have any questions about Federal or State income tax laws or on how to prepare your tax returns. If you have specific questions about your Fund account, please consult your investment representative.
20
| | |
| Advisory and Administrative Agreement Renewal | | (Unaudited) |
The Board of Directors of the GE Investments Funds, Inc. (the “Board”), including the independent Board members, considered and unanimously approved the continuance for an additional year of the Fund’s Investment Advisory and Administration Agreement with GE Asset Management Incorporated (“GEAM”) at meetings held on December 11 and December 13, 2013.
In considering whether to approve the Fund’s investment advisory agreement, the Board members considered and discussed a substantial amount of information and analysis provided, at the Board’s request, by GEAM. The Board members also considered detailed information regarding performance and expenses of other investment companies, including those with similar investment strategies and sizes, which was prepared by independent third party provider Morningstar, Inc. (“Morningstar”). The Board members reviewed the fees charged by GEAM for other mutual funds and investment products other than mutual funds that employ the same investment strategy as the Fund. The Board had the opportunity to ask questions and request additional information in connection with its considerations.
Before approving the Fund’s investment advisory agreement, the independent Board members reviewed the information provided with management of GEAM and with their independent legal counsel. The Board members also reviewed a memorandum prepared by independent legal counsel discussing the legal standards for the consideration of the proposed continuance. The independent Board members discussed the proposed continuance in detail during a private session with their independent legal counsel at which no representatives of GEAM were present. The independent Board members and their independent legal counsel requested, received and considered additional information from GEAM following these sessions.
In advance of the meetings, and in response to their request, the Board members received from GEAM written responses to their inquiries, which included substantial exhibits and other materials related to GEAM’s business and the services it provides to the Fund. The Board members took into account their experience as Board members and particularly their previous consideration of these types of agreements. When feasible, information was presented in a manner to facilitate comparison to prior periods and to reflect certain enhancements to GEAM’s infrastructure, systems and shareholder servicing model. To focus their review, the Board members asked GEAM management, in its oral presentation, to highlight
material differences from the information presented in recent years.
During the meetings, the Board members had an opportunity to discuss this information with GEAM representatives, including senior executives, representatives from the legal, compliance and finance departments, and investment personnel. The Board members posed questions to these representatives and engaged in substantive discussions with them concerning GEAM’s investment process.
In reaching their determination relating to continuance of the Fund’s investment advisory agreement, the Board members considered all factors that they deemed relevant, including the factors discussed below. In their deliberations, the Board members did not identify any particular information that was all-important or controlling, and each Board member may have attributed different weights to the various factors. In particular, the Board members focused on the following:
The Nature, Extent And Quality Of Services Provided.
The Board members reviewed the services provided by GEAM, taking into account their past experiences with GEAM. They focused on the favorable attributes of GEAM, including (i) an investment philosophy oriented toward long-term performance; (ii) effective processes used for selecting investments and brokers; (iii) effective processes used for providing Fund administration, including controllership and compliance functions, the optimization of its Fund administration platform and the continued oversight of the performance of other companies that provide services to the Fund and its shareholders; (iv) highly skilled professionals including analysts, research professionals, traders and portfolio managers with a depth of experience relevant to the Fund; (v) access to significant and enhanced technological resources from which the Fund may benefit; and (vi) a favorable history and reputation. The Board members noted that the Fund represents only a small portion of the assets managed by GEAM, but benefits from a full array of services and resources provided by GEAM.
In light of these discussions, the Board, including the independent Board members, concluded that GEAM’s services continue to be satisfactory.
Investment Performance Of The Fund.
The Board members considered the investment performance of the Fund for various periods. The Board
21
| | |
| Advisory and Administrative Agreement Renewal | | (Unaudited) |
members reviewed detailed comparisons of the performance of the Fund with the relevant securities index and peer groupings of mutual funds prepared by Morningstar with respect to various periods. The Board members also engaged in detailed discussions with GEAM management about its investment process and performance results. These discussions focused on the Fund’s investment objective, the number and experience of portfolio management and supporting research personnel, the investment style and approach employed, the likely market cycles for the Fund’s investment style and the Fund’s relative underperformance in certain prior periods, as well as the Fund’s improved performance over the past year and the Fund’s competitive performance for the 10 year period. The Board members discussed GEAM’s investment approach with respect to the Fund and the reasons for the Fund’s relative underperformance in prior periods.
The Board, including the independent Board members, concluded that the Fund’s performance was acceptable overall taking into consideration the factors discussed above.
Cost Of The Services Provided And Profits Realized From The Relationship With The Fund.
The Board members considered the fees paid to GEAM by the Fund and the cost of the services provided to the Fund by GEAM. The Board members reviewed the information they had requested from GEAM concerning its profitability. The Board members considered the profit margin information for GEAM’s investment company business as a whole, as well as GEAM’s profitability data for the Fund. The Board members reviewed GEAM’s assumptions and the methods of cost allocation used by GEAM in preparing Fund-specific profitability data. The Board members also discussed with GEAM the basis for its belief that the methods of allocation used were reasonable for each area of its business.
Information was presented regarding the financial condition of GEAM for various past periods. The Board members noted and discussed the additional services provided by GEAM to the Fund compared to other investment products managed by GEAM. The Board members determined that GEAM should be entitled to earn a reasonable level of profits for the services it provides to the Fund. The Board members also recognized that GEAM has made and continues to make significant
investments in its business in fulfilling its obligations to the Fund and supporting its Fund-related activities.
Based on their review, the Board, including the independent Board members, concluded that they were satisfied that the level of profitability achieved by GEAM from its relationship with the Fund was not unreasonable or excessive.
The Extent To Which Economies Of Scale Would Be Realized As The Fund Grows And Whether Fee Levels Would Reflect Such Economies Of Scale.
The Board noted that the Fund experienced a slight increase in assets over the past year, and the Board members considered the extent to which economies of scale would be realized as the Fund continues to grow and whether fee levels reflect these economies of scale for the benefit of Fund investors.
The Board members considered the substantial infrastructure investments that GEAM has made with respect to its operations and its commitment to continue investing resources to enhance services to Fund shareholders. The Board members recognized the benefits to the Fund of GEAM’s past investment in its operations through expenditures to support its substantial infrastructure, and that, with respect to all GEAM managed mutual funds, GEAM has not yet fully recouped that investment. The Board members also recognized the benefits to the Fund of being able to leverage a favorable cost structure achieved with respect to the Fund’s other operating expenses as a result of GEAM’s large overall base of assets under management and its vendor management practices.
Comparison Of Services To Be Rendered And Fees To Be Paid.
The Board members discussed the services provided to the Fund by GEAM, and the fees charged for those services. The Board members reviewed information concerning the fee and expense ratios for the Fund, and comparative information with respect to peer groupings of mutual funds prepared by Morningstar. They discussed that the Fund’s advisory fee and expense ratios were within the applicable peer group ranges. In light of the foregoing, the Board, including the independent Board members, determined that the advisory fees were reasonable in relation to the services provided to the Fund.
22
| | |
| Advisory and Administrative Agreement Renewal | | (Unaudited) |
Fall-Out Benefits.
The Board members considered other actual and potential financial benefits that GEAM may derive from its relationship with the Fund, including, to the extent applicable, soft dollar commission benefits generated through Fund portfolio transactions. The Board members noted, however, that the Fund benefits from the vast array of resources available through GEAM, and that the Fund represents only a small portion of the assets managed by GEAM.
Conclusion.
No single factor was determinative to the Board’s decision. Based on their discussion and such other matters as were deemed relevant, the Board, including the independent Board members, concluded that renewal of the investment advisory agreement was in the best interests of the Fund and its shareholders.
23
| | |
| Additional Information | | (Unaudited) |
Information about Directors and Executive Officers:
The business and affairs of the Funds are managed under the direction of the Funds’ Board of Directors. Information pertaining to the Directors and officers of the Funds is set forth below.
Interested Directors and Executive Officers
Michael J. Cosgrove
Address c/o GEAM 1600 Summer St. Stamford, CT 06905
Age 64
Position(s) Held with Fund Chairman of the Board and President
Term of Office and Length of Time Served Until successor is elected and qualified — 17 years
Principal Occupation(s) During Past 5 years President of Mutual Funds and Global Investment Programs of GEAM since November 2011; President and Chief Executive Officer — Mutual Funds and Intermediary Business of GEAM from March 2007 to November 2011; Executive Vice President of GEAM from February 1997 to March 2007; and Executive Vice President-Mutual Funds of GEAM from March 1993 to March 2007. Also serves as Treasurer of GE Foundation since 1988.
Number of Portfolios in Fund Complex Overseen by Director 25
Other Directorships Held by Director Chairman of the Board and President of GE Institutional Funds since 1997; Trustee of Elfun Funds, GE Retirement Savings Plan Funds (formerly GE Savings & Security Funds) and General Electric Pension Trust since 1988; Director of GEAM since 1988; Trustee of Fordham University from 2002 through June 2010 and since July 2011; Director of GE Investment Distributors, Inc. since June 2011; Director of Skin Cancer Foundation since August 2010; Member Board of Governors of the Investment Company Institute since October 2006; Director of GE Asset Management (Ireland) Limited since February 1999; GE Asset Management Funds Plc since 1998; GE Asset Management Canada Company since 1998, GE Asset Management Limited since 1998; Trustee of General Electric Insurance Plan Trust since 1988; and Chairman of the Board and President of GE Funds from 1993 to February 2011.
Matthew J. Simpson
Address c/o GEAM 1600 Summer St. Stamford, CT 06905
Age 52
Position(s) Held with Fund Director and Executive Vice President
Term of Office and Length of Time Served Until successor is elected and qualified — 6 years
Principal Occupation(s) During Past 5 years Executive Vice President, General Counsel and Secretary of GEAM since July 2007; Secretary of Elfun Funds and GE Retirement Savings Plan Funds (formerly GE Savings & Security Funds) since July 2007; Senior Vice President and General Counsel — Marketing and Client Services (formerly Asset Management Services) of GEAM and Senior Vice President and General Counsel of GE Asset Management Services from February 1997 to July 2007; Vice President and Associate General Counsel of GEAM from October 1992 to February 1997; Secretary of GE Institutional Funds and GE Investments Funds, Inc. from 1997 to July 2007 and Vice President from September 2003 to July 2007; Assistant Secretary of Elfun Funds and GE Retirement Savings Plan Funds from 1998 to July 2007 and Vice President from October 2003 to July 2007; and Secretary of GE Funds from 1993 to July 2007 and Vice President from September 2003 to July 2007.
Number of Portfolios in Fund Complex Overseen by Director 25
Other Directorships Held by Director Trustee of Elfun Funds, GE Retirement Savings Plan Funds and General Electric Pension Trust since July 2007; Trustee and Executive Vice President of GE Institutional Funds since July 2007; Director of GEAM since July 2007; Director of GE Investment Distributors, Inc. since June 2011; and Trustee and Executive Vice President of GE Funds from July 2007 to February 2011.
24
| | |
| Additional Information | | (Unaudited) |
Joon Won Choe
Address c/o GEAM 1600 Summer St. Stamford, CT 06905
Age 44
Position(s) Held with Fund Vice President & Secretary
Term of Office and Length of Time Served Until successor is elected and qualified — Vice President and Secretary — 3 years
Principal Occupation(s) During Past 5 years Senior Vice President and Deputy General Counsel at GEAM since March 2011; Vice President and Secretary of GE Institutional Funds since September 2010; Vice President and Assistant Secretary of Elfun Funds and GE Retirement Savings Plan Funds (formerly GE Savings & Security Funds) since September 2010; Senior Vice President and Associate General Counsel at GEAM from June 2010 to March 2011; Vice President and Associate General Counsel of GEAM from November 2005 to June 2010 and Vice President and Secretary of GE Funds from September 2010 to February 2011.
Number of Portfolios in Fund Complex Overseen by Officer N/A
Other Directorships Held by Officer N/A
Robert Herlihy
Address c/o GEAM 1600 Summer St. Stamford, CT 06905
Age 46
Position(s) Held with Fund Chief Compliance Officer
Term of Office and Length of Time Served Until successor is elected and qualified — 8 years
Principal Occupation(s) During Past 5 years Chief Compliance Officer of GEAM, GE Institutional Funds, Elfun Funds, and GE Retirement Savings Plan Funds (formerly GE Savings & Security Funds) since July 2005; Chief Compliance Officer of GE Funds from July 2005 to February 2011 and Manager of Fund Administration at GEAM from 2002-2005.
Number of Portfolios in Fund Complex Overseen by Officer N/A
Other Directorships Held by Officer N/A
Arthur A. Jensen
Address c/o GEAM 1600 Summer St. Stamford, CT 06905
Age 47
Position(s) Held with Fund Treasurer
Term of Office and Length of Time Served Until successor is elected and qualified — 2 years
Principal Occupation(s) During Past 5 Years Treasurer of GE Institutional Funds, Elfun Funds and GE Retirement Savings Plan Funds (formerly GE Savings & Security Funds) since June 2011; Mutual Funds Controller of GEAM since April 2011; Senior Vice President at Citigroup from 2008 to 2010 and Vice President at JPMorgan from 2005 to 2008.
Number of Portfolios in Fund Complex Overseen by Officer N/A
Other Directorships Held by Officer N/A
25
| | |
| Additional Information | | (Unaudited) |
Jeanne M. LaPorta
Address c/o GEAM 1600 Summer St. Stamford, CT 06905
Age 48
Position(s) Held with Fund Vice President
Term of Office and Length of Time Served Until successor is elected and qualified — 10 years
Principal Occupation(s) During Past 5 Years Senior Vice President and Commercial Administrative Officer of GEAM since April 2010; Vice President of GE Institutional Funds since July 2003; Vice President of Elfun Funds and GE Retirement Savings Plan Funds (formerly GE Savings & Security Funds) since October 2003; Secretary of GE Funds from July 2007 to September 2010 and Vice President from July 2007 to February 2011; Senior Vice President and Deputy General Counsel of GEAM from October 2007 to April 2010; Vice President and Assistant Secretary of Elfun Funds and GE Retirement Savings Plan Funds from July 2003 to June 2010; and Vice President and Associate General Counsel – Marketing and Client Services (formerly Asset Management Services) at GEAM from May 1997 to October 2007.
Number of Portfolios in Fund Complex Overseen by Officer N/A
Other Directorships Held by Officer N/A
Non-Interested Directors
John R. Costantino
Address c/o GEAM 1600 Summer St. Stamford, CT 06905
Age 67
Position(s) Held with Fund Director
Term of Office and Length of Time Served Until successor is elected and qualified — 17 years
Principal Occupation(s) During Past 5 years Managing General Partner, NGN Capital LLC since 2006; and Treasurer of NeuroScience Research Institute since 1986.
Number of Portfolios in Fund Complex Overseen by Director 17
Other Directorships Held by Director Trustee of GE Institutional Funds since 1997; Trustee of Fordham University from 1989 to 1995 and from 2001 to 2007 and Trustee Emeritus since 2007; Trustee of NeuroScience Research Institute since 1986; Trustee of GE Funds from 1993 to February 2011; and Director of Artes Medical from 2006 to 2008.
R. Sheldon Johnson
Address c/o GEAM 1600 Summer St. Stamford, CT 06905
Age 67
Positions(s) Held with Fund Director
Term of office and Length of Time served Unit Successor is elected and qualified — 2 years
Principal Occupation(s) During Past 5 years Head of Global Institutional Equity Sales and Marketing at Morgan Stanley & Co., Inc. from 2002 to 2006 and Managing Director at Morgan Stanley & Co., Inc. from 1988 to 2006.
Number of Portfolios in Fund Complex Overseen by Director 17
Other Directorships Held by Director Trustee of GE Institutional Funds since April 2011 and Trustee of St. Lawrence University since 2003.
26
| | |
| Additional Information | | (Unaudited) |
Donna M. Rapaccioli
Address c/o GEAM 1600 Summer St. Stamford, CT 06905
Age 51
Position(s) Held with Fund Director
Term of Office and Length of Time Served Until successor is elected and qualified — 2 years
Principal Occupation(s) During Past 5 Years Dean of the Gabelli School of Business since 2007 and Accounting professor since 1987 at Fordham University.
Number of Portfolios in Fund Complex Overseen by Officer 17
Other Directorships Held by Director Trustee of GE Institutional Funds since January 2012 and Trustee of Emmanuel College since 2010.
The Statement of Additional Information for the Funds includes additional information about the Directors and Officers and is available, without charge, upon request by calling 1-800-242-0134.
27
| | |
| Investment Team | | (Unaudited) |
Investment Adviser and Administrator
GE Asset Management Incorporated
Board of Directors
Michael J. Cosgrove, Chairman
John R. Costantino
R. Sheldon Johnson
Donna M. Rapaccioli
Matthew J. Simpson
Secretary
Joon Won Choe
Assistant Secretary
Michelle Matzelle
Treasurer
Arthur A. Jensen
Assistant Treasurer
Robert Meyers
Distributor
GE Investment Distributors, Inc.
Member FINRA and SIPC
Custodian
State Street Bank & Trust Company
At GE Asset Management, we’re dedicated to providing the investment options you’ll need to tailor your financial portfolio to every stage of your life. Each member of the GE Family of Funds is managed according to the same principles of integrity and quality that have guided GE over the past century, and have made it the world-class company that it is today. Each fund draws strength from a heritage of investment management experience that spans more than 80 years. Whether you’re creating a new investment portfolio or adding to an established one, the GE Family of Funds offers an array of professionally managed investment options that will help you meet a lifetime of financial needs.
28
Investment Adviser
GE Asset Management Incorporated
1600 Summer Street
Stamford, CT 06905
or at:
PO Box 7900
Stamford, CT 06904-7900
Distributor
GE Investment Distributors, Inc.
member FINRA and SIPC
1600 Summer Street
Stamford, CT 06905
or at:
PO Box 7900
Stamford, CT 06904-7900
The Fund files its complete schedule of portfolio holdings with the Securities and Exchange Commission for the first and third quarters of each fiscal year on Form N-Q. The Fund’s Forms N-Q, as well as a description of the policies and procedures that the Fund uses to determine how to vote proxies (if any) relating to portfolio securities is available without charge (i) upon request, by calling 1-800-493-3042; (ii) on the Fund’s website at http://www.geam.com; and (iii) on the Commission’s website at http://www.sec.gov. The Fund’s Forms N-Q may be reviewed and copied at the Commission’s Public Reference Room in Washington, DC—information on the operation of the Public Reference Room may be obtained by calling 1-800-SEC-0330.
Information (if any) regarding how the Fund voted proxies relating to portfolio securities during the most recently disclosed 12-month period ended June 30 is available without charge (i) through the Fund’s website at http://www.geam.com; and (ii) on the Commission’s website at http://www.sec.gov.

GE Investments Funds, Inc.
Small-Cap Equity Fund
Annual Report
December 31, 2013

GE Investments Funds, Inc.
| | |
| |
| Small-Cap Equity Fund | | Contents |
This report is prepared for Policyholders of certain variable contracts and may be distributed to others only if preceded or accompanied by the variable contract’s current prospectus and the current prospectus and/or summary prospectus of the Fund available for investments thereunder.
| | |
| Notes to Performance | | December 31, 2013 (Unaudited) |
The information provided on the performance page relates to the GE Investments Small-Cap Equity Fund (the “Fund”).
Total return performance shown in this report for the Fund takes into account changes in share price and assumes reinvestment of dividends and capital gains distributions, if any. Total returns shown are net of Fund fees and expenses but do not reflect fees and charges associated with the variable contracts such as administrative fees, account charges and surrender charges, which, if reflected, would reduce the Fund’s total returns for all periods shown.
The performance data quoted represents past performance; past performance does not guarantee future results. Investment return and principal value will fluctuate so your shares, when redeemed, may be worth more or less than their original cost. Current performance may be higher or lower than the performance data quoted. Periods less than one year are not annualized. Please call 800-493-3042 or visit the Fund’s website at http://www.geam.com for the most recent month-end performance data.
An investment in the Fund is not a deposit of any bank and is not insured or guaranteed by the Federal Deposit Insurance Corporation (FDIC) or any other government agency. An investment in the Fund is subject to risk, including possible loss of principal invested.
The Russell 2000® Index is an unmanaged market capitalization-weighted index consisting of 2,000 of the smallest U.S.-domiciled publicly traded common stocks that are included in the Russell 3000® Index. The Russell 3000® Index is comprised of the 3,000 largest U.S. domiciled companies.
Russell Investment Group owns the Russell Index data, including all applicable trademarks and copyrights, used by GE Asset Management Incorporated in these materials. Any unauthorized use or redistribution of such Russell Index data is strictly prohibited. Russell Investment Group is not responsible for the configuration of this material or for any inaccuracy in GE Asset Management Incorporated’s presentation thereof.
The results shown for the foregoing indices assume the reinvestment of net dividends or interest and do not reflect fees, expenses, or taxes. As such, the index returns do not reflect the actual cost of investing in the instruments that comprise each index.
The peer universe of the underlying annuity funds used for the peer group average annual total return calculation is based on a blend of Morningstar peer categories, as shown. Morningstar is an independent mutual fund rating service. A Fund’s performance may be compared to or ranked within a universe of mutual funds with investment objectives and policies similar but not necessarily identical to that of the Fund.
©2014 Morningstar, Inc. All Rights Reserved. The Morningstar information contained herein: (1) is proprietary to Morningstar and/or its content providers; (2) may not be copied or distributed; and (3) is not warranted to be accurate, complete or timely. Neither Morningstar nor its content providers are responsible for any damage or losses relating from any use of this information. Past performance is no guarantee of future results.
The views expressed in this document reflect our judgment as of the publication date and are subject to change at any time without notice.
GE Investment Distributors, Inc., Member of FINRA & SIPC, is the principal underwriter and distributor of the GE Investments Funds, Inc. and a wholly owned subsidiary of GE Asset Management Incorporated, the investment adviser of the Fund.
1
| | |
| Small-Cap Equity Fund | | (Unaudited) |

David Wiederecht
President and Chief
Investment Officer-
Investment Solutions

Mike Cervi
Senior Vice President
The Small-Cap Equity Fund utilizes a multiple sub-adviser Fund structure that utilizes several sub-advisers to manage the Fund’s assets. The Fund is managed by David Wiederecht and Mike Cervi who are vested with oversight authority over the Fund’s sub-advisers that provide day-to-day management of the assets of the Fund allocated to them Messrs. Wiederecht and Cervi have full discretion in determining the assets that are allocated to each sub-adviser. The current sub-advisers of the Fund are as follows: Palisade Capital Management L.L.C.; Champlain Investment Partners, LLC; GlobeFlex Capital, LP; Kennedy Capital Management, Inc.; and SouthernSun Asset Management, LLC.
David Wiederecht is the President and Chief Investment Officer — Investment Solutions and a Director at GE Asset Management. He has served as a portfolio manager of the Small-Cap Equity Fund since September 2010. Mr. Wiederecht joined GE Asset Management in 1988 and has held various positions at GE Asset Management including Vice President — Alternative Investments/Private Equity/Hedge Fund from 1998 to 2004, Managing Director — Alternative Investments from 2004 to 2008, and President and Chief Investment Officer — Investment Solutions since 2008.
Mike Cervi is a Senior Vice President of GE Asset Management and is a Managing Director — External Managers within GE Asset Management’s Investment Solutions team. He became a member of the portfolio management team for the Small-Cap Equity Fund in May 2013. Mr. Cervi focuses on portfolio construction and manager research for a number of GE Asset Management’s portfolios including responsibility for defined benefit, defined contribution and sub-advised mutual funds accounts. Prior to his current position, Mr. Cervi led investment oversight of GE Asset Management’s multi-asset class client relationships. Mr. Cervi joined GE Asset Management in 2000 and has held several other roles with GE Asset Management including Shareholder Services Representative from 2000 to 2001, Institutional Marketing Analyst from 2001 to 2003, Director, Product Portfolio Manager — U.S. Equities from 2005 to 2006, Vice
President, Manager of Investment Relationships from 2006 to 2009 and Managing Director, Total Plan Management from 2009 to 2013. He became a Senior Vice President in 2009, served as the Managing Director of Portfolio Construction from April 2013 to December 2013 and has served as Managing Director — External Managers since December 2013.
| Q. | How did the GE Investments Small-Cap Equity Fund perform compared to its benchmark and Morningstar peer group for the twelve-month period ended December 31, 2013? |
| A. | For the twelve-month period ended December 31, 2013, the GE Investments Small-Cap Equity Fund returned 36.89%. The Russell 2000® Index, the Fund’s benchmark, returned 38.82% and the Fund’s Morningstar peer group of 149 U.S. Insurance Small Blend Funds returned an average of 38.53% over the same period. |
| Q. | What market conditions affected the Fund’s performance? |
| A. | Stocks reacted very positively due to a supportive macro environment. The Federal Reserve has kept interest rates at historic lows, inflation remained low, GDP has steadily improved, unemployment has declined and we have seen stronger housing prices. In this environment investors were comfortable assuming more risk as evidenced by the strong absolute returns for small cap stocks as well as the fact that the Russell 2000 Index outperformed the S&P 500 Index by over 6% during 2013. Earnings and margins also remained strong as there has not been upwards pressure on wages and companies have kept costs under control. |
| Q. | What were the primary drivers of the Fund’s performance? |
| A. | The Fund’s underperformance against its benchmark during the period was primarily due to the underperformance of one of the Fund’s core sub-advisors, Palisade Capital |
2
| | Management L.L.C. Poor stock selection within the healthcare and industrials sector was the main detractors to Palisade’s underperformance. Two other sub-advisers, Champlain Investment Partners, LLC and GlobeFlex Capital, LP also underperformed their respective indices, albeit by a relatively small degree. Sub-adviser’s SouthernSun Asset Management, LLC and Kennedy Capital Management, Inc. both outperformed their respective index by a large margin over the past twelve months. The Fund’s small holding of cash also contributed to the relative performance due to the strong performance of the small cap universe during the year. |
| Q. | Were there any significant changes to the Fund during the period? |
| A. | There were no changes to the sub-advisers during the year or to the allocation that each sub-adviser managed for the Fund. There was also not a significant change to the underlying sector allocations. The industrial and consumer staples sectors remained the Fund’s largest overweight position, while the financial sector remained the largest underweight at the end of the period. |
3
| | |
| Small-Cap Equity Fund | | (Unaudited) |
Understanding Your Fund’s Expenses
As a shareholder of the Fund you incur ongoing costs. Ongoing costs include portfolio management fees, professional fees, administrative fees and other Fund expenses. The following example is intended to help you understand your ongoing costs (in dollars) of investing in the Fund and to compare these costs with the ongoing costs of investing in other mutual funds.
To illustrate these ongoing costs, we have provided an example and calculated the expenses paid by investors in the Fund during the period. The information in the following table is based on an investment of $1,000, which is invested at the beginning of the period and held for the entire six-month period ended December 31, 2013.
Actual Expenses
The first section of the table provides information about actual account values and actual expenses. You may use the information in this section, together with the amount you invested, to estimate the expenses that you paid over the period. To do so, simply divide your account value by $1,000 (for example, an $8,600 account value divided by $1,000 = 8.6), then multiply the result by the number given under the heading “Expenses paid during the period” to estimate the expenses you paid on your account during the period.
Hypothetical Example for Comparison Purposes
The second section of the table provides information about hypothetical account values and hypothetical expenses based on the Fund’s actual expense ratio and an assumed rate of return of 5% per year before expenses, which is not the Fund’s actual return. The hypothetical account values and expenses may not be used to estimate the actual ending account balance or expenses you paid for the period. You may use this information to compare the ongoing costs of investing in the Fund and other funds. To do so, compare this 5% hypothetical example with the 5% hypothetical examples that appear in the shareholders reports of other funds.
Please note that the expenses shown in the table are meant to highlight and help you compare ongoing costs only and do not reflect transaction costs, such as sales charges or redemption fees, if any. Therefore, the second section of the table is useful in comparing ongoing costs only, and will not help you determine the relative total costs of owning different funds. Additionally, the expenses shown do not reflect the fees or charges associated with variable contracts through which shares of the Fund are offered.
July 1, 2013 - December 31, 2013
| | | | | | | | | | | | |
| | | Account value at the
beginning of the period ($) | | | Account value at the end of the period ($) | | | Expenses paid during the period ($)* | |
Actual Fund Return | | | 1,000.00 | | | | 1,183.00 | | | | 6.99 | |
Hypothetical 5% Return (2.5% for the period) | | | 1,000.00 | | | | 1,018.80 | | | | 6.46 | |
| * | Expenses are equal to the Fund’s annualized net expense ratio of 1.27% (for the period July 1, 2013 - December 31, 2013), multiplied by the average account value over the period, multiplied by 184/365 (to reflect the one-half year period). |
4
| | |
| Small-Cap Equity Fund | | (Unaudited) |
A mutual fund designed for investors who seek long-term growth of capital. The Fund seeks to achieve its objective by investing at least 80% of its net assets under normal circumstances in equity securities of small-cap companies, such as common and preferred stocks. The Fund uses a multi-sub-adviser investment strategy that combines growth, value and core investment management styles. This orientation will typically produce a portfolio that does not materially favor value or growth style investing, and allows the Fund the potential to benefit from both value and growth cycles in the marketplace.
|
| Morningstar Performance Comparison |
Based on average annual returns for periods ended 12/31/13
| | | | | | | | | | | | | | | | | | | | |
| |
| | | | | One
Year | | Five
Year | | Ten
Year |
Number of funds in peer group | | | | | | 149 | | | | | 139 | | | | | 117 | |
Peer group average annual total return | | | | | | 38.53% | | | | | 20.39% | | | | | 8.67% | |
Morningstar Category in peer group: U.S. Insurance Small Blend Funds | |
as a % of Fair Value of $50,151 (in thousands) on December 31, 2013 (b)(c)
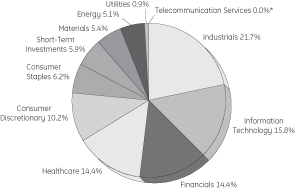
as of December 31, 2013 (as a % of Fair Value) (b)(c)
| | | | |
Sensient Technologies Corp. | | | 1.18% | |
Prosperity Bancshares Inc. | | | 0.97% | |
John Wiley & Sons Inc. | | | 0.94% | |
LKQ Corp. | | | 0.93% | |
Darling International Inc. | | | 0.92% | |
Woodward Inc. | | | 0.91% | |
UMB Financial Corp. | | | 0.85% | |
Iconix Brand Group Inc. | | | 0.84% | |
AGCO Corp. | | | 0.81% | |
Blackbaud Inc. | | | 0.80% | |
|
Change in Value of a $10,000 Investment(a) |
Class 1 Shares
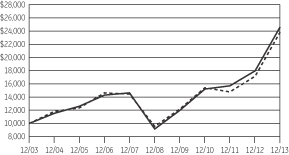

|
| Average Annual Total Return |
For the Periods Ended December 31, 2013
Class 1 Shares (Inception date 4/28/00)
| | | | | | | | | | | | | | | | | | | | |
| | | One
Year | | Five
Year | | Ten
Year | | Ending value of a
$10,000 investment (a) |
Small-Cap Equity Fund | | | | 36.89% | | | | | 21.96% | | | | | 9.43% | | | | $ | 24,633 | |
Russell 2000 Index | | | | 38.82% | | | | | 20.08% | | | | | 9.06% | | | | $ | 23,831 | |
| (a) | Ending value of a $10,000 investment for the ten-year period or since inception, whichever is less. |
| (b) | The securities information regarding holdings, allocations and other characteristics is presented to illustrate examples of securities that the Fund has bought and the diversity of areas in which the Fund may invest as of a particular date. It may not be representative of the Fund’s current or future investments and should not be construed as a recommendation to purchase or sell a particular security. |
| (c) | Fair Value basis is inclusive of short-term investment in GE Institutional Money Market Fund Investment Class. |
See Notes to Performance on page 1 for further information, including an explanation of Morningstar peer categories.
Past performance does not predict future performance. The performance shown in the graphs and tables does not reflect the deduction of taxes that a shareholder would pay on Fund distributions on the redemption of Fund shares and does not reflect the fees or charges that would be associated with variable contracts through which shares of the Fund are offered.
5
Small-Cap Equity Fund
| | |
| Schedule of Investments | | December 31, 2013 |
Small-Cap Equity Fund
| | | | | | | | | | |
| | | |
| | | Number of
Shares | | | Fair Value | | | |
Common Stock — 93.9% † | | | | | | | | | | |
| | | |
Aerospace & Defense — 1.3% | | | | | | | | | | |
| | | |
Esterline Technologies Corp. | | | 3,218 | | | $ | 328,107 | | | (a) |
Moog Inc. | | | 514 | | | | 34,921 | | | (a) |
Teledyne Technologies Inc. | | | 3,081 | | | | 283,021 | | | (a) |
Triumph Group Inc. | | | 164 | | | | 12,476 | | | |
| | | | | | | 658,525 | | | |
| | | |
Agricultural Products — 1.0% | | | | | | | | | | |
| | | |
Darling International Inc. | | | 22,129 | | | | 462,054 | | | (a) |
Fresh Del Monte Produce Inc. | | | 1,388 | | | | 39,280 | | | |
| | | | | | | 501,334 | | | |
| | | |
Air Freight & Logistics — 0.3% | | | | | | | | | | |
| | | |
Hub Group Inc. | | | 3,800 | | | | 151,544 | | | (a) |
| | | |
Airlines — 0.1% | | | | | | | | | | |
| | | |
Republic Airways Holdings Inc. | | | 1,700 | | | | 18,173 | | | (a) |
Spirit Airlines Inc. | | | 700 | | | | 31,787 | | | (a) |
| | | | | | | 49,960 | | | |
| | | |
Apparel Retail — 0.8% | | | | | | | | | | |
| | | |
Aeropostale Inc. | | | 1,297 | | | | 11,790 | | | (a) |
American Eagle Outfitters Inc. | | | 3,661 | | | | 52,718 | | | |
Express Inc. | | | 2,885 | | | | 53,863 | | | (a) |
Genesco Inc. | | | 1,380 | | | | 100,823 | | | (a) |
The Buckle Inc. | | | 3,967 | | | | 208,505 | | | |
| | | | | | | 427,699 | | | |
|
Apparel, Accessories & Luxury Goods — 1.5% |
| | | |
Columbia Sportswear Co. | | | 3,642 | | | | 286,807 | | | |
Iconix Brand Group Inc. | | | 10,590 | | | | 420,423 | | | (a) |
Oxford Industries Inc. | | | 383 | | | | 30,897 | | | |
| | | | | | | 738,127 | | | |
|
Application Software — 6.1% |
| | | |
ACI Worldwide Inc. | | | 3,583 | | | | 232,895 | | | (a) |
Advent Software Inc. | | | 800 | | | | 27,992 | | | |
Blackbaud Inc. | | | 10,711 | | | | 403,269 | | | |
Bottomline Technologies Inc. | | | 7,600 | | | | 274,816 | | | (a) |
Compuware Corp. | | | 2,600 | | | | 29,146 | | | |
Comverse Inc. | | | 700 | | | | 27,160 | | | (a) |
Guidewire Software Inc. | | | 900 | | | | 44,163 | | | (a) |
Jive Software Inc. | | | 7,052 | | | | 79,335 | | | (a) |
NICE Systems Ltd. ADR | | | 3,800 | | | | 155,648 | | | |
Pegasystems Inc. | | | 600 | | | | 29,508 | | | |
PROS Holdings Inc. | | | 3,600 | | | | 143,640 | | | (a) |
PTC Inc. | | | 9,716 | | | | 343,849 | | | (a) |
QLIK Technologies Inc. | | | 7,600 | | | | 202,388 | | | (a) |
RealPage Inc. | | | 16,059 | | | | 375,460 | | | (a) |
| | | | | | | | | | |
| | | |
| | | Number of
Shares | | | Fair Value | | | |
Seachange International Inc. | | | 1,019 | | | $ | 12,391 | | | (a) |
Solera Holdings Inc. | | | 3,337 | | | | 236,126 | | | |
SS&C Technologies Holdings Inc. | | | 7,956 | | | | 352,133 | | | (a) |
TiVo Inc. | | | 2,300 | | | | 30,176 | | | (a) |
Tyler Technologies Inc. | | | 386 | | | | 39,422 | | | (a) |
Verint Systems Inc. | | | 600 | | | | 25,764 | | | (a) |
| | | | | | | 3,065,281 | | | |
|
Asset Management & Custody Banks — 0.1% |
| | | |
Artisan Partners Asset Management Inc. | | | 389 | | | | 25,359 | | | |
Virtus Investment Partners Inc. | | | 120 | | | | 24,006 | | | (a) |
| | | | | | | 49,365 | | | |
|
Auto Parts & Equipment — 0.4% |
| | | |
American Axle & Manufacturing Holdings Inc. | | | 1,243 | | | | 25,419 | | | (a) |
Dana Holding Corp. | | | 2,465 | | | | 48,363 | | | |
Drew Industries Inc. | | | 615 | | | | 31,488 | | | |
Stoneridge Inc. | | | 1,870 | | | | 23,843 | | | (a) |
Tenneco Inc. | | | 600 | | | | 33,942 | | | (a) |
Tower International Inc. | | | 1,091 | | | | 23,348 | | | (a) |
| | | | | | | 186,403 | | | |
|
Automobile Manufacturers — 0.6% |
| | | |
Thor Industries Inc. | | | 4,825 | | | | 266,485 | | | |
Winnebago Industries Inc. | | | 2,289 | | | | 62,833 | | | (a) |
| | | | | | | 329,318 | | | |
| | | |
Automotive Retail — 0.9% | | | | | | | | | | |
| | | |
America’s Car-Mart Inc. | | | 535 | | | | 22,593 | | | (a) |
CST Brands Inc. | | | 10,243 | | | | 376,123 | | | |
Monro Muffler Brake Inc. | | | 781 | | | | 44,017 | | | |
| | | | | | | 442,733 | | | |
| | | |
Biotechnology — 1.5% | | | | | | | | | | |
| | | |
Acorda Therapeutics Inc. | | | 800 | | | | 23,360 | | | (a) |
Cepheid Inc. | | | 5,900 | | | | 275,648 | | | (a) |
Cubist Pharmaceuticals Inc. | | | 2,704 | | | | 186,224 | | | (a) |
Emergent Biosolutions Inc. | | | 1,251 | | | | 28,761 | | | (a) |
Genomic Health Inc. | | | 4,700 | | | | 137,569 | | | (a) |
Isis Pharmaceuticals Inc. | | | 900 | | | | 35,856 | | | (a) |
Ligand Pharmaceuticals Inc. | | | 600 | | | | 31,560 | | | (a) |
PDL BioPharma Inc. | | | 1,920 | | | | 16,205 | | | |
Pharmacyclics Inc. | | | 200 | | | | 21,156 | | | (a) |
| | | | | | | 756,339 | | | |
| | | |
Building Products — 0.5% | | | | | | | | | | |
| | | |
AAON Inc. | | | 656 | | | | 20,959 | | | |
AO Smith Corp. | | | 632 | | | | 34,090 | | | |
Apogee Enterprises Inc. | | | 828 | | | | 29,733 | | | |
Builders FirstSource Inc. | | | 1,897 | | | | 13,545 | | | (a) |
Patrick Industries Inc. | | | 1,500 | | | | 43,395 | | | (a) |
PGT Inc. | | | 5,900 | | | | 59,708 | | | (a) |
Universal Forest Products Inc. | | | 1,450 | | | | 75,603 | | | |
| | | | | | | 277,033 | | | |
See Notes to Schedule of Investments and Notes to Financial Statements.
6
Small-Cap Equity Fund
| | |
| Schedule of Investments | | December 31, 2013 |
| | | | | | | | | | |
| | | |
| | | Number of
Shares | | | Fair Value | | | |
| | | |
Cable & Satellite — 0.1% | | | | | | | | | | |
| | | |
Starz | | | 900 | | | $ | 26,316 | | | (a) |
| | | |
Casinos & Gaming — 0.1% | | | | | | | | | | |
| | | |
Pinnacle Entertainment Inc. | | | 1,269 | | | | 32,981 | | | (a) |
| | | |
Catalog Retail — 0.1% | | | | | | | | | | |
| | | |
HSN Inc. | | | 550 | | | | 34,265 | | | |
| | | |
Commodity Chemicals — 0.5% | | | | | | | | | | |
| | | |
Axiall Corp. | | | 412 | | | | 19,545 | | | |
Koppers Holdings Inc. | | | 5,005 | | | | 228,979 | | | |
| | | | | | | 248,524 | | | |
|
Communications Equipment — 0.8% |
| | | |
ADTRAN Inc. | | | 4,263 | | | | 115,144 | | | |
ARRIS Group Inc. | | | 3,563 | | | | 86,812 | | | (a) |
Bel Fuse Inc. | | | 591 | | | | 12,594 | | | |
Calix Inc. | | | 1,869 | | | | 18,017 | | | (a) |
Ciena Corp. | | | 1,200 | | | | 28,716 | | | (a) |
Extreme Networks Inc. | | | 4,800 | | | | 33,600 | | | (a) |
NETGEAR Inc. | | | 1,154 | | | | 38,013 | | | (a) |
Plantronics Inc. | | | 917 | | | | 42,595 | | | |
Riverbed Technology Inc. | | | 2,628 | | | | 47,514 | | | (a) |
| | | | | | | 423,005 | | | |
| | | |
Computer Hardware — 0.7% | | | | | | | | | | |
| | | |
Diebold Inc. | | | 10,995 | | | | 362,945 | | | |
| | | |
Computer Storage & Peripherals — 0.1% | | | | | | | | | | |
| | | |
Datalink Corp. | | | 1,130 | | | | 12,317 | | | (a) |
Electronics for Imaging Inc. | | | 700 | | | | 27,111 | | | (a) |
QLogic Corp. | | | 2,000 | | | | 23,660 | | | (a) |
| | | | | | | 63,088 | | | |
| | | |
Construction & Engineering — 2.2% | | | | | | | | | | |
| | | |
Chicago Bridge & Iron Company N.V. | | | 4,600 | | | | 382,444 | | | |
Comfort Systems USA Inc. | | | 1,608 | | | | 31,179 | | | |
Granite Construction Inc. | | | 810 | | | | 28,334 | | | |
Primoris Services Corp. | | | 4,616 | | | | 143,696 | | | |
Quanta Services Inc. | | | 5,677 | | | | 179,166 | | | (a) |
URS Corp. | | | 6,875 | | | | 364,306 | | | |
| | | | | | | 1,129,125 | | | |
|
Construction & Farm Machinery — 1.9% |
| | | |
AGCO Corp. | | | 6,825 | | | | 403,972 | | | |
Astec Industries Inc. | | | 1,663 | | | | 64,242 | | | |
Federal Signal Corp. | | | 1,756 | | | | 25,725 | | | (a) |
FreightCar America Inc. | | | 528 | | | | 14,055 | | | |
Lindsay Corp. | | | 283 | | | | 23,418 | | | |
The Greenbrier Companies Inc. | | | 2,144 | | | | 70,409 | | | (a) |
Trinity Industries Inc. | | | 6,580 | | | | 358,742 | | | |
| | | | | | | 960,563 | | | |
| | | | | | | | | | |
| | | |
| | | Number of
Shares | | | Fair Value | | | |
|
Construction Materials — 0.1% |
| | | |
Eagle Materials Inc. | | | 341 | | | $ | 26,404 | | | |
|
Consumer Electronics — 0.0%* |
| | | |
Zagg Inc. | | | 2,900 | | | | 12,615 | | | (a) |
| |
Data Processing & Outsourced Services — 2.0% | | | |
| | | |
Broadridge Financial Solutions Inc. | | | 8,175 | | | | 323,076 | | | |
Cardtronics Inc. | | | 5,700 | | | | 247,665 | | | (a) |
Global Cash Access Holdings Inc. | | | 22,088 | | | | 220,659 | | | (a) |
MAXIMUS Inc. | | | 700 | | | | 30,793 | | | |
WEX Inc. | | | 1,700 | | | | 168,351 | | | (a) |
| | | | | | | 990,544 | | | |
| |
Distributors — 0.9% | | | |
| | | |
LKQ Corp. | | | 14,125 | | | | 464,713 | | | (a) |
| |
Diversified Capital Markets — 0.1% | | | |
| | | |
HFF Inc. REIT | | | 1,188 | | | | 31,898 | | | (a) |
| |
Diversified Metals & Mining — 0.2% | | | |
| | | |
Compass Minerals International Inc. | | | 1,057 | | | | 84,613 | | | |
| |
Diversified REITs — 0.2% | | | |
| | | |
Cousins Properties Inc. | | | 4,419 | | | | 45,516 | | | |
PS Business Parks Inc. | | | 300 | | | | 22,926 | | | |
Spirit Realty Capital Inc. | | | 2,422 | | | | 23,808 | | | |
| | | | | | | 92,250 | | | |
| |
Diversified Support Services — 0.9% | | | |
| | | |
Healthcare Services Group Inc. | | | 7,312 | | | | 207,441 | | | |
Ritchie Bros Auctioneers Inc. | | | 9,500 | | | | 217,835 | | | |
UniFirst Corp. | | | 505 | | | | 54,035 | | | |
| | | | | | | 479,311 | | | |
| |
Education Services — 0.2% | | | |
| | | |
Apollo Education Group Inc. | | | 1,100 | | | | 30,052 | | | (a) |
DeVry Education Group Inc. | | | 1,019 | | | | 36,174 | | | |
K12 Inc. | | | 1,226 | | | | 26,666 | | | (a) |
| | | | | | | 92,892 | | | |
| |
Electric Utilities — 0.6% | | | |
| | | |
ALLETE Inc. | | | 857 | | | | 42,747 | | | |
IDACORP Inc. | | | 5,282 | | | | 273,819 | | | |
| | | | | | | 316,566 | | | |
| |
Electrical Components & Equipment — 1.3% | | | |
| | | |
Brady Corp. | | | 5,800 | | | | 179,394 | | | |
Encore Wire Corp. | | | 1,274 | | | | 69,051 | | | |
EnerSys Inc. | | | 1,323 | | | | 92,729 | | | |
Generac Holdings Inc. | | | 484 | | | | 27,414 | | | |
II-VI Inc. | | | 2,813 | | | | 49,509 | | | (a) |
Littelfuse Inc. | | | 959 | | | | 89,120 | | | |
Polypore International Inc. | | | 2,251 | | | | 87,564 | | | (a) |
|
| See Notes to Schedule of Investments and Notes to Financial Statements. |
7
Small-Cap Equity Fund
| | |
| Schedule of Investments | | December 31, 2013 |
| | | | | | | | | | |
| | | |
| | | Number of
Shares | | | Fair Value | | | |
Regal-Beloit Corp. | | | 392 | | | $ | 28,898 | | | |
Rogers Corp. | | | 525 | | | | 32,287 | | | (a) |
| | | | | | | 655,966 | | | |
| |
Electronic Equipment & Instruments — 0.1% | | | |
| | | |
National Instruments Corp. | | | 1,400 | | | | 44,828 | | | |
| |
Electronic Manufacturing Services — 0.9% | | | |
| | | |
Celestica Inc. | | | 777 | | | | 8,081 | | | (a) |
Measurement Specialties Inc. | | | 4,322 | | | | 262,302 | | | (a) |
Methode Electronics Inc. | | | 2,402 | | | | 82,124 | | | |
Multi-Fineline Electronix Inc. | | | 1,251 | | | | 17,376 | | | (a) |
Plexus Corp. | | | 1,523 | | | | 65,931 | | | (a) |
| | | | | | | 435,814 | | | |
| |
Environmental & Facilities Services — 0.6% | | | |
| | | |
Clean Harbors Inc. | | | 4,500 | | | | 269,820 | | | (a) |
Tetra Tech Inc. | | | 1,309 | | | | 36,626 | | | (a) |
| | | | | | | 306,446 | | | |
| |
Fertilizers & Agricultural Chemicals — 0.6% | | | |
| | | |
Intrepid Potash Inc. | | | 19,195 | | | | 304,049 | | | (a) |
| |
Food Distributors — 0.4% | | | |
| | | |
Spartan Stores Inc. | | | 6,616 | | | | 160,636 | | | |
United Natural Foods Inc. | | | 350 | | | | 26,387 | | | (a) |
| | | | | | | 187,023 | | | |
| |
Food Retail — 1.6% | | | |
| | | |
Casey’s General Stores Inc. | | | 3,800 | | | | 266,950 | | | |
Harris Teeter Supermarkets Inc. | | | 6,600 | | | | 325,710 | | | |
SUPERVALU Inc. | | | 3,217 | | | | 23,452 | | | (a) |
The Fresh Market Inc. | | | 4,800 | | | | 194,400 | | | (a) |
| | | | | | | 810,512 | | | |
| |
Footwear — 0.8% | | | |
| | | |
Crocs Inc. | | | 786 | | | | 12,513 | | | (a) |
Deckers Outdoor Corp. | | | 2,545 | | | | 214,951 | | | (a) |
Wolverine World Wide Inc. | | | 4,700 | | | | 159,612 | | | |
| | | | | | | 387,076 | | | |
| |
Forest Products — 0.1% | | | |
| | | |
Boise Cascade Co. | | | 938 | | | | 27,652 | | | (a) |
| |
Gas Utilities — 0.1% | | | |
| | | |
South Jersey Industries Inc. | | | 768 | | | | 42,977 | | | |
| |
Healthcare Distributors — 0.6% | | | |
| | | |
Owens & Minor Inc. | | | 8,887 | | | | 324,909 | | | |
| |
Healthcare Equipment — 4.8% | | | |
| | | |
Analogic Corp. | | | 1,286 | | | | 113,888 | | | |
Cantel Medical Corp. | | | 725 | | | | 24,585 | | | |
CryoLife Inc. | | | 2,334 | | | | 25,884 | | | |
DexCom Inc. | | | 800 | | | | 28,328 | | | (a) |
| | | | | | | | | | |
| | | |
| | | Number of
Shares | | | Fair Value | | | |
Exactech Inc. | | | 550 | | | $ | 13,068 | | | (a) |
Globus Medical Inc. | | | 8,157 | | | | 164,608 | | | (a) |
Hill-Rom Holdings Inc. | | | 8,762 | | | | 362,221 | | | |
Integra LifeSciences Holdings Corp. | | | 5,700 | | | | 271,947 | | | (a) |
Invacare Corp. | | | 921 | | | | 21,377 | | | |
Masimo Corp. | | | 10,688 | | | | 312,410 | | | (a) |
Natus Medical Inc. | | | 2,118 | | | | 47,655 | | | (a) |
NuVasive Inc. | | | 8,600 | | | | 278,038 | | | (a) |
Orthofix International N.V. | | | 983 | | | | 22,432 | | | (a) |
STERIS Corp. | | | 4,800 | | | | 230,640 | | | |
Teleflex Inc. | | | 1,400 | | | | 131,404 | | | |
Thoratec Corp. | | | 4,170 | | | | 152,622 | | | (a) |
Volcano Corp. | | | 10,400 | | | | 227,240 | | | (a) |
| | | | | | | 2,428,347 | | | |
| |
Healthcare Facilities — 0.3% | | | |
| | | |
VCA Antech Inc. | | | 5,000 | | | | 156,800 | | | (a) |
| |
Healthcare Services — 1.4% | | | |
| | | |
Air Methods Corp. | | | 2,016 | | | | 117,593 | | | (a) |
Bio-Reference Labs Inc. | | | 7,014 | | | | 179,138 | | | (a) |
MEDNAX Inc. | | | 6,708 | | | | 358,073 | | | (a) |
Team Health Holdings Inc. | | | 700 | | | | 31,885 | | | (a) |
The Providence Service Corp. | | | 1,400 | | | | 36,008 | | | (a) |
| | | | | | | 722,697 | | | |
| |
Healthcare Supplies — 1.2% | | | |
| | | |
Align Technology Inc. | | | 500 | | | | 28,575 | | | (a) |
Endologix Inc. | | | 3,958 | | | | 69,028 | | | (a) |
Haemonetics Corp. | | | 5,842 | | | | 246,123 | | | (a) |
ICU Medical Inc. | | | 900 | | | | 57,339 | | | (a) |
Merit Medical Systems Inc. | | | 1,237 | | | | 19,470 | | | (a) |
West Pharmaceutical Services Inc. | | | 4,018 | | | | 197,123 | | | |
| | | | | | | 617,658 | | | |
| |
Healthcare Technology — 0.8% | | | |
| | | |
Computer Programs & Systems Inc. | | | 1,044 | | | | 64,530 | | | |
HMS Holdings Corp. | | | 7,893 | | | | 179,408 | | | (a) |
Medidata Solutions Inc. | | | 600 | | | | 36,342 | | | (a) |
Omnicell Inc. | | | 4,600 | | | | 117,438 | | | (a) |
| | | | | | | 397,718 | | | |
| |
Heavy Electrical Equipment — 0.1% | | | |
| | | |
AZZ Inc. | | | 806 | | | | 39,381 | | | |
| |
Home Building — 0.1% | | | |
| | | |
Meritage Homes Corp. | | | 1,399 | | | | 67,138 | | | (a) |
| |
Home Entertainment Software — 0.1% | | | |
| | | |
Take-Two Interactive Software Inc. | | | 1,700 | | | | 29,529 | | | (a) |
| |
Home Furnishing Retail — 0.4% | | | |
| | | |
Aaron’s Inc. | | | 6,748 | | | | 198,391 | | | |
Haverty Furniture Companies Inc. | | | 41 | | | | 1,284 | | | |
| | | | | | | 199,675 | | | |
|
| See Notes to Schedule of Investments and Notes to Financial Statements. |
8
Small-Cap Equity Fund
| | |
| Schedule of Investments | | December 31, 2013 |
| | | | | | | | | | |
| | | |
| | | Number of
Shares | | | Fair Value | | | |
| |
Home Furnishings — 0.2% | | | |
| | | |
Ethan Allen Interiors Inc. | | | 1,434 | | | $ | 43,622 | | | |
Hooker Furniture Corp. | | | 686 | | | | 11,443 | | | |
La-Z-Boy Inc. | | | 1,356 | | | | 42,036 | | | |
| | | | | | | 97,101 | | | |
| |
Home Improvement Retail — 0.1% | | | |
| | | |
Lumber Liquidators Holdings Inc. | | | 342 | | | | 35,188 | | | (a) |
| |
Housewares & Specialties — 0.8% | | | |
| | | |
Jarden Corp. | | | 6,338 | | | | 388,836 | | | (a) |
| |
Industrial Conglomerates — 0.6% | | | |
| | | |
Raven Industries Inc. | | | 7,300 | | | | 300,322 | | | |
|
Industrial Machinery — 7.1% |
| | | |
Actuant Corp. | | | 10,470 | | | | 383,621 | | | |
Altra Industrial Motion Corp. | | | 1,762 | | | | 60,296 | | | |
CIRCOR International Inc. | | | 416 | | | | 33,605 | | | |
CLARCOR Inc. | | | 5,292 | | | | 340,540 | | | |
Columbus McKinnon Corp. | | | 880 | | | | 23,883 | | | (a) |
EnPro Industries Inc. | | | 3,800 | | | | 219,070 | | | (a) |
ESCO Technologies Inc. | | | 2,697 | | | | 92,399 | | | |
IDEX Corp. | | | 3,875 | | | | 286,169 | | | |
LB Foster Co. | | | 797 | | | | 37,690 | | | |
Luxfer Holdings PLC ADR | | | 2,900 | | | | 60,494 | | | |
Mueller Industries Inc. | | | 3,714 | | | | 234,019 | | | |
Mueller Water Products Inc. | | | 2,866 | | | | 26,854 | | | |
Nordson Corp. | | | 1,775 | | | | 131,883 | | | |
Proto Labs Inc. | | | 458 | | | | 32,601 | | | (a) |
RBC Bearings Inc. | | | 1,900 | | | | 134,425 | | | (a) |
Standex International Corp. | | | 1,550 | | | | 97,464 | | | |
The Middleby Corp. | | | 935 | | | | 224,372 | | | (a) |
Timken Co. | | | 5,545 | | | | 305,363 | | | |
Trimas Corp. | | | 9,979 | | | | 398,062 | | | (a) |
Woodward Inc. | | | 10,061 | | | | 458,882 | | | |
| | | | | | | 3,581,692 | | | |
|
Industrial REITs — 0.1% |
| | | |
Rexford Industrial Realty Inc. | | | 2,084 | | | | 27,509 | | | |
STAG Industrial Inc. | | | 2,251 | | | | 45,898 | | | |
| | | | | | | 73,407 | | | |
|
Internet Retail — 0.0%* |
| | | |
Orbitz Worldwide Inc. | | | 3,285 | | | | 23,586 | | | (a) |
|
Internet Software & Services — 1.0% |
| | | |
Blucora Inc. | | | 1,000 | | | | 29,160 | | | (a) |
comScore Inc. | | | 1,400 | | | | 40,054 | | | (a) |
Constant Contact Inc. | | | 1,100 | | | | 34,177 | | | (a) |
Envestnet Inc. | | | 649 | | | | 26,155 | | | (a) |
IntraLinks Holdings Inc. | | | 4,134 | | | | 50,063 | | | (a) |
LogMeIn Inc. | | | 7,000 | | | | 234,850 | | | (a) |
VistaPrint N.V. | | | 500 | | | | 28,425 | | | (a) |
WebMD Health Corp. | | | 800 | | | | 31,600 | | | (a) |
XO Group Inc. | | | 1,871 | | | | 27,803 | | | (a) |
| | | | | | | 502,287 | | | |
| | | | | | | | | | |
| | | |
| | | Number of
Shares | | | Fair Value | | | |
|
Investment Banking & Brokerage — 1.0% |
| | | |
KCG Holdings Inc. | | | 2,426 | | | $ | 29,015 | | | (a) |
Piper Jaffray Companies Inc. | | | 1,544 | | | | 61,065 | | | (a) |
Raymond James Financial Inc. | | | 6,951 | | | | 362,773 | | | |
Stifel Financial Corp. | | | 817 | | | | 39,151 | | | (a) |
| | | | | | | 492,004 | | | |
|
IT Consulting & Other Services — 0.1% |
| | | |
Sapient Corp. | | | 1,800 | | | | 31,248 | | | (a) |
Unisys Corp. | | | 900 | | | | 30,213 | | | (a) |
| | | | | | | 61,461 | | | |
| |
Leisure Products — 0.1% | | | |
| | | |
Arctic Cat Inc. | | | 458 | | | | 26,097 | | | |
| | | |
Life & Health Insurance — 0.2% | | | | | | | | | | |
| | | |
American Equity Investment Life
Holding Co. | | | 2,481 | | | | 65,449 | | | |
StanCorp Financial Group Inc. | | | 626 | | | | 41,472 | | | |
| | | | | | | 106,921 | | | |
| |
Life Sciences Tools & Services — 1.9% | | | |
| | | |
Bio-Rad Laboratories Inc. | | | 1,900 | | | | 234,859 | | | (a) |
Bruker Corp. | | | 12,018 | | | | 237,596 | | | (a) |
Cambrex Corp. | | | 1,909 | | | | 34,038 | | | (a) |
Charles River Laboratories
International Inc. | | | 555 | | | | 29,437 | | | (a) |
ICON PLC | | | 5,840 | | | | 235,994 | | | (a) |
Luminex Corp. | | | 7,600 | | | | 147,440 | | | (a) |
PAREXEL International Corp. | | | 600 | | | | 27,108 | | | (a) |
| | | | | | | 946,472 | | | |
|
Managed Healthcare — 1.2% |
| | | |
Centene Corp. | | | 6,655 | | | | 392,312 | | | (a) |
Molina Healthcare Inc. | | | 5,537 | | | | 192,411 | | | (a) |
| | | | | | | 584,723 | | | |
|
Marine — 0.1% |
| | | |
Baltic Trading Ltd. | | | 1,965 | | | | 12,654 | | | |
Matson Inc. | | | 944 | | | | 24,648 | | | |
| | | | | | | 37,302 | | | |
|
Metal & Glass Containers — 0.7% |
| | | |
AEP Industries Inc. | | | 375 | | | | 19,811 | | | (a) |
Aptargroup Inc. | | | 2,400 | | | | 162,744 | | | |
Silgan Holdings Inc. | | | 3,900 | | | | 187,278 | | | |
| | | | | | | 369,833 | | | |
|
Multi-Line Insurance — 0.6% |
| | | |
HCC Insurance Holdings Inc. | | | 6,663 | | | | 307,431 | | | |
Horace Mann Educators Corp. | | | 699 | | | | 22,046 | | | |
| | | | | | | 329,477 | | | |
|
Multi-Utilities — 0.2% |
| | | |
Avista Corp. | | | 1,284 | | | | 36,196 | | | |
Black Hills Corp. | | | 833 | | | | 43,741 | | | |
| | | | | | | 79,937 | | | |
|
| See Notes to Schedule of Investments and Notes to Financial Statements. |
9
Small-Cap Equity Fund
| | |
| Schedule of Investments | | December 31, 2013 |
| | | | | | | | | | |
| | | |
| | | Number of
Shares | | | Fair Value | | | |
|
Office Electronics — 0.4% |
| | | |
Zebra Technologies Corp. | | | 3,902 | | | $ | 211,020 | | | (a) |
| | | |
Office REITs — 0.8% | | | | | | | | | | |
| | | |
BioMed Realty Trust Inc. | | | 14,558 | | | | 263,791 | | | |
Coresite Realty Corp. | | | 3,416 | | | | 109,961 | | | |
DuPont Fabros Technology Inc. | | | 873 | | | | 21,572 | | | |
Highwoods Properties Inc. | | | 768 | | | | 27,778 | | | |
| | | | | | | 423,102 | | | |
|
Office Services & Supplies — 0.7% |
| | | |
Herman Miller Inc. | | | 3,891 | | | | 114,862 | | | |
West Corp. | | | 8,657 | | | | 222,572 | | | |
| | | | | | | 337,434 | | | |
|
Oil & Gas Drilling — 0.3% |
| | | |
Pioneer Energy Services Corp. | | | 19,166 | | | | 153,520 | | | (a) |
|
Oil & Gas Equipment & Services — 1.9% |
| | | |
Cal Dive International Inc. | | | 3,822 | | | | 7,682 | | | (a) |
CARBO Ceramics Inc. | | | 3,300 | | | | 384,549 | | | |
Dril-Quip Inc. | | | 1,724 | | | | 189,519 | | | (a) |
Forum Energy Technologies Inc. | | | 3,800 | | | | 107,388 | | | (a) |
Hornbeck Offshore Services Inc. | | | 825 | | | | 40,615 | | | (a) |
Mitcham Industries Inc. | | | 1,453 | | | | 25,733 | | | (a) |
Natural Gas Services Group Inc. | | | 681 | | | | 18,775 | | | (a) |
Oil States International Inc. | | | 1,267 | | | | 128,879 | | | (a) |
TETRA Technologies Inc. | | | 3,800 | | | | 46,968 | | | (a) |
| | | | | | | 950,108 | | | |
|
Oil & Gas Exploration & Production — 2.7% |
| | | |
Approach Resources Inc. | | | 9,600 | | | | 185,184 | | | (a) |
Athlon Energy Inc. | | | 790 | | | | 23,898 | | | (a) |
Bill Barrett Corp. | | | 1,305 | | | | 34,948 | | | (a) |
Bonanza Creek Energy Inc. | | | 1,157 | | | | 50,295 | | | (a) |
Carrizo Oil & Gas Inc. | | | 393 | | | | 17,595 | | | (a) |
Jones Energy Inc. | | | 1,581 | | | | 22,893 | | | (a) |
Matador Resources Co. | | | 1,976 | | | | 36,833 | | | (a) |
Newfield Exploration Co. | | | 12,750 | | | | 314,032 | | | (a) |
Northern Oil and Gas Inc. | | | 5,700 | | | | 85,899 | | | (a) |
Oasis Petroleum Inc. | | | 491 | | | | 23,062 | | | (a) |
Resolute Energy Corp. | | | 14,200 | | | | 128,226 | | | (a) |
Sanchez Energy Corp. | | | 4,334 | | | | 106,226 | | | (a) |
SM Energy Co. | | | 3,829 | | | | 318,228 | | | |
W&T Offshore Inc. | | | 1,150 | | | | 18,400 | | | |
| | | | | | | 1,365,719 | | | |
|
Oil & Gas Refining & Marketing — 0.2% |
| | | |
Alon USA Energy Inc. | | | 1,869 | | | | 30,913 | | | |
Renewable Energy Group Inc. | | | 2,000 | | | | 22,920 | | | (a) |
Western Refining Inc. | | | 896 | | | | 38,000 | | | |
| | | | | | | 91,833 | | | |
| |
Packaged Foods & Meats — 2.9% | | | |
| | | |
B&G Foods Inc. | | | 3,800 | | | | 128,858 | | | |
Lancaster Colony Corp. | | | 3,100 | | | | 273,265 | | | |
| | | | | | | | | | |
| | | |
| | | Number of
Shares | | | Fair Value | | | |
Post Holdings Inc. | | | 2,900 | | | $ | 142,883 | | | (a) |
Sanderson Farms Inc. | | | 4,779 | | | | 345,665 | | | |
Snyders-Lance Inc. | | | 7,600 | | | | 218,272 | | | |
TreeHouse Foods Inc. | | | 4,800 | | | | 330,816 | | | (a) |
| | | | | | | 1,439,759 | | | |
| |
Paper Packaging — 0.7% | | | |
| | | |
Packaging Corporation of America | | | 5,634 | | | | 356,520 | | | |
| | | |
Paper Products — 0.2% | | | | | | | | | | |
| | | |
KapStone Paper and Packaging Corp. | | | 472 | | | | 26,366 | | | (a) |
Neenah Paper Inc. | | | 1,367 | | | | 58,467 | | | |
PH Glatfelter Co. | | | 1,030 | | | | 28,469 | | | |
| | | | | | | 113,302 | | | |
| | | |
Personal Products — 0.3% | | | | | | | | | | |
| | | |
Elizabeth Arden Inc. | | | 4,415 | | | | 156,512 | | | (a) |
Inter Parfums Inc. | | | 260 | | | | 9,310 | | | |
| | | | | | | 165,822 | | | |
| | | |
Pharmaceuticals — 0.5% | | | | | | | | | | |
| | | |
Auxilium Pharmaceuticals Inc. | | | 900 | | | | 18,666 | | | (a) |
Impax Laboratories Inc. | | | 1,100 | | | | 27,654 | | | (a) |
Lannett Company Inc. | | | 2,610 | | | | 86,391 | | | (a) |
Prestige Brands Holdings Inc. | | | 1,900 | | | | 68,020 | | | (a) |
Questcor Pharmaceuticals Inc. | | | 800 | | | | 43,560 | | | |
Sagent Pharmaceuticals Inc. | | | 900 | | | | 22,842 | | | (a) |
| | | | | | | 267,133 | | | |
| | | |
Property & Casualty Insurance — 2.0% | | | | | | | | | | |
| | | |
Allied World Assurance Company
Holdings AG | | | 2,800 | | | | 315,868 | | | |
Amtrust Financial Services Inc. | | | 1,900 | | | | 62,111 | | | |
Argo Group International Holdings Ltd. | | | 5,299 | | | | 246,351 | | | |
Aspen Insurance Holdings Ltd. | | | 4,700 | | | | 194,157 | | | |
Employers Holdings Inc. | | | 762 | | | | 24,117 | | | |
The Hanover Insurance Group Inc. | | | 390 | | | | 23,287 | | | |
The Navigators Group Inc. | | | 1,900 | | | | 120,004 | | | (a) |
| | | | | | | 985,895 | | | |
| | | |
Publishing — 0.9% | | | | | | | | | | |
| | | |
John Wiley & Sons Inc. | | | 8,583 | | | | 473,782 | | | |
| | | |
Railroads — 0.8% | | | | | | | | | | |
| | | |
Genesee & Wyoming Inc. | | | 4,127 | | | | 396,398 | | | (a) |
| | | |
Regional Banks — 6.3% | | | | | | | | | | |
| | | |
Bank of the Ozarks Inc. | | | 1,072 | | | | 60,664 | | | |
BankUnited Inc. | | | 1,551 | | | | 51,059 | | | |
Banner Corp. | | | 912 | | | | 40,876 | | | |
Bryn Mawr Bank Corp. | | | 3,600 | | | | 108,648 | | | |
Camden National Corp. | | | 371 | | | | 15,664 | | | |
Capital Bank Financial Corp. | | | 1,174 | | | | 26,709 | | | (a) |
Cardinal Financial Corp. | | | 845 | | | | 15,210 | | | |
CoBiz Financial Inc. | | | 1,066 | | | | 12,749 | | | |
Columbia Banking System Inc. | | | 495 | | | | 13,617 | | | |
Community Bank System Inc. | | | 3,800 | | | | 150,784 | | | |
Cullen Frost Bankers Inc. | | | 2,888 | | | | 214,954 | | | |
CVB Financial Corp. | | | 6,700 | | | | 114,369 | | | |
See Notes to Schedule of Investments and Notes to Financial Statements.
10
Small-Cap Equity Fund
| | |
| Schedule of Investments | | December 31, 2013 |
| | | | | | | | | | |
| | | |
| | | Number of
Shares | | | Fair Value | | | |
Fulton Financial Corp. | | | 11,172 | | | $ | 146,130 | | | |
Glacier Bancorp Inc. | | | 900 | | | | 26,811 | | | |
Great Southern Bancorp Inc. | | | 604 | | | | 18,368 | | | |
Hancock Holding Co. | | | 532 | | | | 19,514 | | | |
Home BancShares Inc. | | | 698 | | | | 26,070 | | | |
Iberiabank Corp. | | | 2,621 | | | | 164,730 | | | |
Independent Bank Corp. | | | 2,100 | | | | 82,299 | | | |
Lakeland Financial Corp. | | | 326 | | | | 12,714 | | | |
NBT Bancorp Inc. | | | 2,400 | | | | 62,160 | | | |
Old National Bancorp | | | 1,109 | | | | 17,045 | | | |
PacWest Bancorp | | | 1,694 | | | | 71,521 | | | |
Prosperity Bancshares Inc. | | | 7,655 | | | | 485,250 | | | |
Southwest BanCorp. Inc. | | | 1,899 | | | | 30,232 | | | (a) |
Sterling Financial Corp. | | | 1,297 | | | | 44,202 | | | |
Susquehanna Bancshares Inc. | | | 3,047 | | | | 39,123 | | | |
SVB Financial Group | | | 2,815 | | | | 295,181 | | | (a) |
Tristate Capital Holdings Inc. | | | 969 | | | | 11,492 | | | (a) |
UMB Financial Corp. | | | 6,600 | | | | 424,248 | | | |
Umpqua Holdings Corp. | | | 1,630 | | | | 31,198 | | | |
Union First Market Bankshares Corp. | | | 312 | | | | 7,741 | | | |
Washington Trust Bancorp Inc. | | | 3,600 | | | | 133,992 | | | |
Westamerica Bancorporation | | | 2,727 | | | | 153,966 | | �� | |
Wintrust Financial Corp. | | | 923 | | | | 42,569 | | | |
| | | | | | | 3,171,859 | | | |
| | | |
Reinsurance — 0.9% | | | | | | | | | | |
| | | |
Endurance Specialty Holdings Ltd. | | | 5,700 | | | | 334,419 | | | |
Greenlight Capital Re Ltd. | | | 800 | | | | 26,968 | | | (a) |
Maiden Holdings Ltd. | | | 3,306 | | | | 36,135 | | | |
Platinum Underwriters Holdings Ltd. | | | 379 | | | | 23,225 | | | |
Third Point Reinsurance Ltd. | | | 1,516 | | | | 28,091 | | | (a) |
| | | | | | | 448,838 | | | |
|
Research & Consulting Services — 0.4% |
| | | |
Mistras Group Inc. | | | 4,000 | | | | 83,520 | | | (a) |
Resources Connection Inc. | | | 5,528 | | | | 79,216 | | | |
RPX Corp. | | | 1,300 | | | | 21,970 | | | (a) |
| | | | | | | 184,706 | | | |
| |
Residential REITs — 0.4% | | | |
| | | |
Associated Estates Realty Corp. | | | 3,157 | | | | 50,670 | | | |
Education Realty Trust Inc. | | | 11,961 | | | | 105,496 | | | |
Mid-America Apartment
Communities Inc. | | | 370 | | | | 22,474 | | | |
Sun Communities Inc. | | | 587 | | | | 25,029 | | | |
| | | | | | | 203,669 | | | |
| |
Restaurants — 1.2% | | | |
| | | |
BJ’s Restaurants Inc. | | | 5,700 | | | | 177,042 | | | (a) |
Cracker Barrel Old Country Store Inc. | | | 1,748 | | | | 192,403 | | | |
Jack in the Box Inc. | | | 500 | | | | 25,010 | | | (a) |
Ruby Tuesday Inc. | | | 983 | | | | 6,812 | | | (a) |
Texas Roadhouse Inc. | | | 6,959 | | | | 193,460 | | | |
| | | | | | | 594,727 | | | |
| |
Retail REITs — 0.2% | | | |
| | | |
Glimcher Realty Trust | | | 4,885 | | | | 45,723 | | | |
Inland Real Estate Corp. | | | 4,282 | | | | 45,047 | | | |
Ramco-Gershenson Properties Trust | | | 1,381 | | | | 21,737 | | | |
| | | | | | | 112,507 | | | |
| | | | | | | | | | |
| | | |
| | | Number of
Shares | | | Fair Value | | | |
| |
Security & Alarm Services — 0.7% | | | |
| | | |
The Brink’s Co. | | | 10,098 | | | $ | 344,746 | | | |
| | | |
Semiconductor Equipment — 0.6% | | | | | | | | | | |
| | | |
Advanced Energy Industries Inc. | | | 1,798 | | | | 41,102 | | | (a) |
ATMI Inc. | | | 880 | | | | 26,585 | | | (a) |
Cabot Microelectronics Corp. | | | 600 | | | | 27,420 | | | (a) |
Rudolph Technologies Inc. | | | 17,693 | | | | 207,716 | | | (a) |
| | | | | | | 302,823 | | | |
| |
Semiconductors — 1.4% | | | |
| | | |
Ambarella Inc. | | | 1,400 | | | | 47,502 | | | (a) |
Diodes Inc. | | | 1,194 | | | | 28,131 | | | (a) |
Fairchild Semiconductor
International Inc. | | | 3,248 | | | | 43,361 | | | (a) |
Integrated Device Technology Inc. | | | 2,500 | | | | 25,475 | | | (a) |
Microsemi Corp. | | | 12,338 | | | | 307,833 | | | (a) |
RF Micro Devices Inc. | | | 10,955 | | | | 56,528 | | | (a) |
Semtech Corp. | | | 5,087 | | | | 128,599 | | | (a) |
Silicon Image Inc. | | | 3,700 | | | | 22,755 | | | (a) |
Synaptics Inc. | | | 600 | | | | 31,086 | | | (a) |
| | | | | | | 691,270 | | | |
| |
Specialized Finance — 0.1% | | | |
| | | |
MarketAxess Holdings Inc. | | | 400 | | | | 26,748 | | | |
NewStar Financial Inc. | | | 1,352 | | | | 24,025 | | | (a) |
| | | | | | | 50,773 | | | |
|
Specialized REITs — 1.2% |
| | | |
Aviv REIT Inc. | | | 1,622 | | | | 38,441 | | | |
Hersha Hospitality Trust | | | 8,349 | | | | 46,504 | | | |
Omega Healthcare Investors Inc. | | | 9,154 | | | | 272,789 | | | |
Potlatch Corp. | | | 500 | | | | 20,870 | | | |
Sabra Healthcare REIT Inc. | | | 5,409 | | | | 141,391 | | | |
Sovran Self Storage Inc. | | | 421 | | | | 27,437 | | | |
Summit Hotel Properties Inc. | | | 4,533 | | | | 40,797 | | | |
| | | | | | | 588,229 | | | |
| | | |
Specialty Chemicals — 1.9% | | | | | | | | | | |
| | | |
Flotek Industries Inc. | | | 3,711 | | | | 74,480 | | | (a) |
HB Fuller Co. | | | 1,284 | | | | 66,819 | | | |
OM Group Inc. | | | 1,082 | | | | 39,396 | | | (a) |
PolyOne Corp. | | | 4,537 | | | | 160,383 | | | |
Sensient Technologies Corp. | | | 12,237 | | | | 593,739 | | | |
Stepan Co. | | | 38 | | | | 2,494 | | | |
| | | | | | | 937,311 | | | |
| | | |
Specialty Stores — 0.0%* | | | | | | | | | | |
| | | |
Office Depot Inc. | | | 4,312 | | | | 22,810 | | | (a) |
| | | |
Steel — 0.5% | | | | | | | | | | |
| | | |
Commercial Metals Co. | | | 9,496 | | | | 193,054 | | | |
Schnitzer Steel Industries Inc. | | | 1,218 | | | | 39,792 | | | |
| | | | | | | 232,846 | | | |
| | | |
Systems Software — 1.4% | | | | | | | | | | |
| | | |
AVG Technologies N.V. | | | 1,412 | | | | 24,300 | | | (a) |
See Notes to Schedule of Investments and Notes to Financial Statements.
11
Small-Cap Equity Fund
| | |
| Schedule of Investments | | December 31, 2013 |
| | | | | | | | | | |
| | | |
| | | Number of
Shares | | | Fair Value | | | |
CommVault Systems Inc. | | | 310 | | | $ | 23,213 | | | (a) |
FleetMatics Group PLC | | | 1,400 | | | | 60,550 | | | (a) |
Infoblox Inc. | | | 1,023 | | | | 33,779 | | | (a) |
MICROS Systems Inc. | | | 6,545 | | | | 375,487 | | | (a) |
Qualys Inc. | | | 7,600 | | | | 175,636 | | | (a) |
| | | | | | | 692,965 | | | |
| |
Technology Distributors — 0.1% | | | |
| | | |
ScanSource Inc. | | | 813 | | | | 34,495 | | | (a) |
Tech Data Corp. | | | 706 | | | | 36,430 | | | (a) |
| | | | | | | 70,925 | | | |
| |
Thrifts & Mortgage Finance — 0.2% | | | |
| | | |
Northfield Bancorp Inc. | | | 2,400 | | | | 31,680 | | | |
Oritani Financial Corp. | | | 1,500 | | | | 24,075 | | | |
Washington Federal Inc. | | | 1,187 | | | | 27,645 | | | |
| | | | | | | 83,400 | | | |
| |
Trading Companies & Distributors — 0.7% | | | |
| | | |
Applied Industrial Technologies Inc. | | | 7,026 | | | | 344,906 | | | |
| |
Trucking — 1.3% | | | |
| | | |
Landstar System Inc. | | | 3,900 | | | | 224,055 | | | |
Marten Transport Ltd. | | | 2,006 | | | | 40,501 | | | |
Old Dominion Freight Line Inc. | | | 7,109 | | | | 376,919 | | | (a) |
| | | | | | | 641,475 | | | |
| |
Wireless Telecommunication Services — 0.0%* | | | |
| | | |
NTELOS Holdings Corp. | | | 1,200 | | | | 24,276 | | | |
| | | |
Total Common Stock
(Cost $34,111,128) | | | | | | | 47,205,528 | | | |
| | | | | | | | |
| | | |
| | | Number of
Shares | | Fair Value | | | |
Short-Term Investments — 5.9% |
GE Institutional Money Market
Fund—Investment Class 0.00%
(Cost $2,945,813) | | | | $ | 2,945,813 | | | (b,c) |
| | | |
Total Investments
(Cost $37,056,941) | | | | | 50,151,341 | | | |
| | | |
Other Assets and Liabilities,
net — 0.2% | | | | | 96,692 | | | |
| | | | | | | | |
| | | |
NET ASSETS — 100.0% | | | | $ | 50,248,033 | | | |
| | | | | | | | |
| | | | | | | | |
Other Information |
The Fund had the following long futures contracts open at December 31, 2013:
| | | | | | | | | | | | | | | | | | | | |
| Description | | Expiration
date | | Number
of
Contracts | | Current
Notional
Value | | Unrealized
Appreciation |
Russell 2000 Mini Index Futures | | March 2014 | | | | 7 | | | | $ | 812,980 | | | | $ | 31,795 | |
|
| See Notes to Schedule of Investments and Notes to Financial Statements. |
12
| | |
| Notes to Schedule of Investments | | December 31, 2013 |
The views expressed in this document reflect our judgment as of the publication date and are subject to change at any time without notice. The securities cited may not be representative of the Fund’s future investments and should not be construed as a recommendation to purchase or sell a particular security. See the Fund’s summary prospectus and statutory prospectus for complete descriptions of investment objectives, policies, risks and permissible investments.
| (a) | Non-income producing security. |
| (b) | Coupon amount represents effective yield. |
| (c) | GE Asset Management Incorporated (“GEAM”), the investment adviser of the Fund, also serves as investment adviser of the GE Institutional Money Market Fund. |
| † | Percentages are based on net assets as of December 31, 2013. |
Abbreviations:
| | |
| |
ADR | | American Depository Receipt |
| |
REIT | | Real Estate Investment Trust |
13
Financial Highlights
Selected data based on a share outstanding throughout the fiscal years indicated
| | | | | | | | | | | | | | | | | | | | |
| | | 12/31/13 | | | 12/31/12 | | | 12/31/11 | | | 12/31/10 | | | 12/31/09 | |
| Inception date | | | — | | | | — | | | | — | | | | — | | | | 4/28/00 | |
Net asset value, beginning of period | | $ | 13.37 | | | $ | 12.85 | | | $ | 12.46 | | | $ | 9.79 | | | $ | 7.48 | |
Income/(loss) from investment operations: | | | | | | | | | | | | | | | | | | | | |
Net investment income (loss) | | | (0.03) | | | | 0.00 | ** | | | (0.01) | | | | 0.02 | * | | | 0.04 | |
Net realized and unrealized gains/(losses) on investments | | | 4.96 | | | | 1.86 | | | | 0.40 | | | | 2.67 | | | | 2.27 | |
Total income from investment operations | | | 4.93 | | | | 1.86 | | | | 0.39 | | | | 2.69 | | | | 2.31 | |
Less distributions from: | | | | | | | | | | | | | | | | | | | | |
Net investment income | | | — | | | | 0.00 | ** | | | 0.00 | ** | | | 0.02 | | | | — | |
Net realized gains | | | 2.04 | | | | 1.34 | | | | — | | | | — | | | | — | |
Total distributions | | | 2.04 | | | | 1.34 | | | | 0.00 | | | | 0.02 | | | | 0.00 | |
Net asset value, end of period | | $ | 16.26 | | | $ | 13.37 | | | $ | 12.85 | | | $ | 12.46 | | | $ | 9.79 | |
TOTAL RETURN(a) | | | 36.89% | | | | 14.57% | | | | 3.13% | | | | 27.47% | | | | 30.88% | |
| | | | | |
RATIOS/SUPPLEMENTAL DATA: | | | | | | | | | | | | | | | | | | | | |
Net assets, end of period (in thousands) | | $ | 50,248 | | | $ | 41,942 | | | $ | 46,855 | | | $ | 55,527 | | | $ | 54,114 | |
Ratios to average net assets: | | | | | | | | | | | | | | | | | | | | |
Net investment income (loss) | | | (0.23)% | | | | 0.01% | | | | (0.07)% | | | | 0.18% | | | | (0.04)% | |
Net expenses | | | 1.27% | (b)(c) | | | 1.34% | (b)(c) | | | 1.28% | (b)(c) | | | 1.12% | (b) | | | 1.52% | (b) |
Gross expenses | | | 1.28% | | | | 1.38% | | | | 1.50% | | | | 1.13% | | | | 1.52% | |
Portfolio turnover rate | | | 39% | | | | 36% | | | | 44% | | | | 47% | | | | 40% | |
Notes to Financial Highlights
| (a) | Total returns are historical and assume changes in share price, reinvestment of dividends and capital gains distributions and do not include the effect of insurance contract charges. Past performance does not guarantee future results. |
| (b) | Reflects GEAM’s waiver of a portion of the Fund’s advisory and administrative fee (“management fee”) in an amount equal to the management fee earned by GEAM with respect to the Fund’s investment in an affiliated money market fund managed by GEAM. |
| (c) | Reflects a voluntary reimbursement of other operating expenses by GEAM. |
| * | Per share values have been calculated using the average share method. |
| ** | Rounds to less than $0.01. |
The accompanying Notes are an integral part of these financial statements.
14
| | | | |
Statement of Assets and Liabilities December 31,2013 | | | |
| |
ASSETS | | | | |
Investments in securities, at Fair Value (cost $34,111,128) | | $ | 47,205,528 | |
Short-term affiliated investments (at amortized cost) | | | 2,945,813 | |
Cash | | | 206 | |
Restricted cash | | | 46,000 | |
Receivable for investments sold | | | 255,721 | |
Income receivables | | | 41,481 | |
Receivable for fund shares sold | | | 151 | |
Variation margin receivable | | | 3,360 | |
Other assets | | | 117 | |
Total assets | | | 50,498,377 | |
| |
LIABILITIES | | | | |
Payable for investments purchased | | | 126,594 | |
Payable for fund shares redeemed | | | 2,398 | |
Payable to GEAM | | | 39,037 | |
Accrued other expenses | | | 82,315 | |
Total liabilities | | | 250,344 | |
NET ASSETS | | $ | 50,248,033 | |
| |
NET ASSETS CONSIST OF: | | | | |
Capital paid in | | $ | 36,191,232 | |
Accumulated net realized gain | | | 930,606 | |
Net unrealized appreciation (depreciation) on: | | | | |
Investments | | | 13,094,400 | |
Futures | | | 31,795 | |
NET ASSETS | | $ | 50,248,033 | |
Shares outstanding ($0.01 par value, unlimited shares outstanding) | | | 3,089,354 | |
Net asset value per share | | | $16.26 | |
The accompanying Notes are an integral part of these financial statements.
15
| | | | |
Statement of Operations For the year ended December 31, 2013 | | | |
| |
INVESTMENT INCOME | | | | |
Income | | | | |
Dividend | | $ | 465,503 | |
Interest | | | 15,360 | |
Income from affiliated investments | | | 442 | |
Less: Foreign taxes withheld | | | (985 | ) |
Total income | | | 480,320 | |
| |
Expenses | | | | |
Advisory and administration fees | | | 438,032 | |
Directors’ fees | | | 2,022 | |
Custody and accounting expenses | | | 107,076 | |
Professional fees | | | 22,721 | |
Other expenses | | | 17,309 | |
Total expenses before waivers | | | 587,160 | |
Less: Fees waived by the adviser | | | (2,656 | ) |
Net expenses | | | 584,504 | |
Net investment loss | | | (104,184 | ) |
| |
NET REALIZED AND UNREALIZED GAIN (LOSS) ON INVESTMENTS | | | | |
| |
Realized gain (loss) on: | | | | |
Investments | | | 5,982,969 | |
Futures | | | 342,640 | |
| |
Increase (decrease) in unrealized appreciation/depreciation on: | | | | |
Investments | | | 8,146,173 | |
Futures | | | 25,246 | |
Net realized and unrealized gain on investments | | | 14,497,028 | |
Net increase in net assets resulting from operations | | $ | 14,392,844 | |
The accompanying Notes are an integral part of these financial statements.
16
| | | | | | | | |
| Statements of Changes in Net Assets | | | |
| | | Year Ended December 31,
2013 | | | Year Ended
December 31,
2012 | |
| | |
INCREASE (DECREASE) IN NET ASSETS | | | | | | | | |
Operations: | | | | | | | | |
Net investment income (loss) | | $ | (104,184 | ) | | $ | 5,657 | |
Net realized gain (loss) on investments and futures | | | 6,325,609 | | | | 5,474,938 | |
Net increase (decrease) in unrealized appreciation/depreciation on investments and futures | | | 8,171,419 | | | | 657,795 | |
Net increase (decrease) from operations | | | 14,392,844 | | | | 6,138,390 | |
Distributions to shareholders from: | | | | | | | | |
Net investment income | | | | | | | | |
Class 1 | | | — | | | | (3,721 | ) |
Net realized gains | | | | | | | | |
Class 1 | | | (5,590,639 | ) | | | (3,818,401 | ) |
Total distributions | | | (5,590,639 | ) | | | (3,822,122 | ) |
Increase (decrease) in assets from operations and distributions | | | 8,802,205 | | | | 2,316,268 | |
Share transactions: | | | | | | | | |
Proceeds from sale of shares | | | | | | | | |
Class 1 | | | 2,425,268 | | | | 699,312 | |
Value of distributions reinvested | | | | | | | | |
Class 1 | | | 5,590,639 | | | | 3,822,122 | |
Cost of shares redeemed | | | | | | | | |
Class 1 | | | (8,511,846 | ) | | | (11,749,933 | ) |
Class 4* | | | — | | | | (11,353 | ) |
Net increase (decrease) from share transactions | | | (495,939 | ) | | | (7,239,852 | ) |
Total increase (decrease) in net assets | | | 8,306,266 | | | | (4,923,584 | ) |
| | |
NET ASSETS | | | | | | | | |
Beginning of year | | | 41,941,767 | | | | 46,865,351 | |
End of year | | $ | 50,248,033 | | | $ | 41,941,767 | |
| | |
CHANGES IN FUND SHARES | | | | | | | | |
| | |
Class 1 | | | | | | | | |
Shares sold | | | 150,979 | | | | 49,874 | |
Issued for distributions reinvested | | | 344,888 | | | | 289,117 | |
Shares redeemed | | | (543,545 | ) | | | (847,048 | ) |
Net increase (decrease) in fund shares | | | (47,678 | ) | | | (508,057 | ) |
| | |
Class 4* | | | | | | | | |
Shares redeemed | | | — | | | | (838 | ) |
Net increase (decrease) in fund shares | | | — | | | | (838 | ) |
| * | Share Class 4 was closed effective June 29, 2012. |
The accompanying Notes are an integral part of these financial statements.
17
| | |
| Notes to Financial Statements | | December 31, 2013 |
| 1. | Organization of the Company |
GE Investments Funds, Inc. (the “Company”) was incorporated under the laws of the Commonwealth of Virginia on May 14, 1984 and is registered under the Investment Company Act of 1940, as amended (the “1940 Act”), as an open-end management investment company. The Company is composed of eleven investment portfolios (collectively the “Funds”), although only the following eight Funds are currently being offered: U.S. Equity Fund, S&P 500 Index Fund, Premier Growth Equity Fund, Core Value Equity Fund, Small-Cap Equity Fund (the “Fund”), Total Return Fund, Income Fund, and Real Estate Securities Fund.
Shares of the Funds of the Company are offered only to insurance company separate accounts that fund certain variable life insurance contracts and variable annuity contracts. GE Asset Management Incorporated (“GEAM”) is the investment adviser and administrator of each of the Funds.
The Company currently offers one share class (Class 1) of the Fund as an investment option for variable life insurance and variable annuity contracts.
| 2. | Summary of Significant Accounting Policies |
The preparation of financial statements in conformity with U.S. generally accepted accounting principles (“GAAP”) requires management to make estimates and assumptions that affect the reported amounts of assets and liabilities and disclosure of contingent assets and liabilities at the date of the financial statements and the reported amounts of increases and decreases in net assets from operations during the reporting period. Actual results may differ from those estimates.
Subsequent events after the balance sheet date through the date the financial statements were issued have been evaluated in the preparation of the financial statements. There are no items to report.
The following summarizes the significant accounting policies of the Company:
Securities Valuation and Transactions All investments in securities are recorded at their estimated fair value, as described in Note 3.
Securities transactions are accounted for as of the trade date. Realized gains and losses on investments sold are recorded on the basis of identified cost for both financial statement and federal tax purposes.
Derivatives The Fund is subject to equity price risk in the normal course of pursuing its investment objective. The
Fund may enter into derivative transactions (such as futures) to gain market exposure to a certain type of broad-based index as an alternative to investing directly in the securities representing such index.
Futures Contracts A futures contract represents a commitment for the future purchase or sale of an asset at a specified price on a specified date. During the year ended December 31, 2013, the Fund invested in stock index future contracts to gain equity exposure for accumulating and residual cash positions. Buying futures tends to increase a Fund’s exposure to the underlying instrument while selling futures tends to decrease a Fund’s exposure to the underlying instrument, or hedge other Fund investments. The Fund will not enter into a transaction involving futures for speculative purposes. With futures contracts, there is minimal counterparty credit risk to the Fund since futures contracts are exchange traded and the exchange’s clearinghouse, as counterparty to all traded futures, guarantees the futures against default. The Fund’s risks in using these contracts include changes in the value of the underlying instruments, non-performance of the counterparties under the contracts’ terms and changes in the liquidity of the secondary market for the contracts. Futures contracts are valued at the settlement price established each day by the board of trade or exchange on which they principally trade.
Upon entering into a financial futures contract, the Fund is required to pledge to the broker an amount of cash and/or other assets equal to a certain percentage of the contract amount, known as initial margin deposit. Subsequent payments, known as variation margin, are made or received by the Fund each day, depending on the daily fluctuation in the fair value of the underlying security. The Fund records an unrealized gain or loss equal to the daily variation margin. Should market conditions move unexpectedly, the Fund may not achieve the anticipated benefits of the futures contracts and may incur a loss. The Fund recognizes a realized gain or loss upon the expiration or closing of a futures contract.
Investment Income Corporate actions (including cash dividends) are recorded on the ex-dividend date, net of applicable withholding taxes, except for certain foreign corporate actions which are recorded as soon after the ex-dividend date as such information becomes available. Withholding taxes in foreign dividends have been provided for in accordance with the Fund’s understanding of the applicable country’s tax rules and rates.
Interest income is recorded on the accrual basis. Accretion of discounts and amortization of premiums on taxable
18
| | |
| Notes to Financial Statements | | December 31, 2013 |
bonds are to the call or maturity date, whichever is shorter, using the effective yield method.
Expenses Fund specific expenses are charged to the Fund that incurs such expenses. Such expenses may include custodial fees, legal and accounting fees, printing costs and registration fees. Expenses that are not fund specific are allocated pro rata across the Funds. Expenses of the Fund are generally paid directly by the Fund, however, expenses may be paid by GEAM and reimbursed by the Fund.
Federal Income Taxes The Fund intends to comply with all sections of the Internal Revenue Code applicable to regulated investment companies including the distribution of substantially all of its taxable net investment income and net realized capital gains to its shareholders. Therefore, no provision for federal income tax has been made. The Fund is treated as a separate taxpayer for federal income tax purposes.
The Fund utilizes various methods to measure the fair value of most of its investments on a recurring basis. GAAP establishes a framework for measuring fair value and providing related disclosures. Broadly, the framework requires fair value to be determined based on the exchange price that would be received for an asset or paid to transfer a liability (an exit price) in the principal or most advantageous market for the asset or liability in an orderly transaction between market participants at the measurement date. In the absence of active markets for the identical assets or liabilities, such measurements involve developing assumptions based on market observable data and, in the absence of such data, internal information that is consistent with what market participants would use in a hypothetical transaction that occurs at the measurement date. It also establishes a three-level valuation hierarchy based upon observable and non-observable inputs.
Observable inputs reflect market data obtained from independent sources, while unobservable inputs reflect our market assumptions. Preference is given to observable inputs. These two types of inputs create the following fair value hierarchy:
Level 1 — Quoted prices for identical investments in active markets.
Level 2 — Quoted prices for similar investments in active markets; quoted prices for identical or similar investments in markets that are not active; and
model-derived valuations whose inputs are observable or whose significant value drivers are observable.
Level 3 — Significant inputs to the valuation model are unobservable.
Policies and procedures are maintained to value investments using the best and most relevant data available. In addition, pricing vendors are utilized to assist in valuing investments. GEAM performs periodic reviews of the methodologies used by independent pricing services including price validation of individual securities.
Fair Value Measurement The following section describes the valuation methodologies the Fund uses to measure different financial investments at fair value.
The Fund’s portfolio securities are valued generally on the basis of market quotations. Equity securities generally are valued at the last reported sale price on the primary market in which they are traded. Portfolio securities listed on NASDAQ are valued using the NASDAQ Official Closing Price, Level 1 securities primarily include publicly-traded equity securities. If no sales occurred on the exchange or NASDAQ that day, the portfolio security generally is valued using the last reported bid price. In those circumstances the Fund classifies the investment securities in Level 2.
Short-term investments of sufficient credit quality with remaining maturities of sixty days or less at the time of purchase are typically valued on the basis of amortized cost which approximates fair value and these are included in Level 2. If it is determined that amortized cost does not approximate fair value, securities may be valued based on dealer supplied valuations or quotations. In these infrequent circumstances, pricing services may provide the Fund with valuations that are based on significant unobservable inputs, and in those circumstances the investment securities are classified in Level 3.
If prices are not readily available for a portfolio security, or if it is believed that a price for a portfolio security does not represent its fair value, the security may be valued using procedures approved by the Fund’s Board of Directors that are designed to establish its “fair” value. These securities are typically classified in Level 3. Those procedures require that the fair value of a security be established by a valuation committee of GEAM. The valuation committee follows different protocols for different types of investments and circumstances. The fair value procedures may be used to value any investment of the Fund in the appropriate circumstances.
19
| | |
| Notes to Financial Statements | | December 31, 2013 |
Fair value determinations generally are used for securities whose value is affected by a significant event that will materially affect the value of a security and which occurs subsequent to the time of the close of the principal market on which such security trades but prior to the calculation of the Fund’s NAV.
The value established for such a portfolio security may be different than what would be produced through the use of market quotations or another methodology. Portfolio securities that are valued using techniques other than market quotations, including “fair valued” securities, may be subject to greater fluctuation in their value from one day to the next than would be the case if market quotations were used. In addition, there is no assurance that the Fund could sell a portfolio security for the value established for it at any time and it is possible that the Fund would incur a loss because a portfolio security is sold at a discount to its established value.
Other financial investments are derivative instruments that are not reflected in total investments, such as futures, forwards, swaps, and written options contracts, which are valued based on fair value as discussed above.
The Fund uses closing prices for derivatives included in Level 1, which are traded either on exchanges or liquid over-the-counter markets. Derivative assets and liabilities included in Level 2 primarily represent interest rate swaps, cross-currency swaps and foreign currency and commodity forward and option contracts. Derivative assets and liabilities included in Level 3 primarily represent interest rate products that contain embedded optionality or prepayment features.
The inputs or methodology used for valuing securities are not an indication of the risk associated with investing in those securities.
The following table presents the Fund’s investments measured at fair value on a recurring basis at December 31, 2013:
| | | | | | | | | | | | | | | | | | | | |
| Investments | | Level 1 | | Level 2 | | Level 3 | | Total |
Investments in Securities† | | | | | | | | | | | | | | | | | | | | |
Common Stock | | | $ | 47,205,528 | | | | $ | — | | | | $ | — | | | | $ | 47,205,528 | |
Short-Term Investments | | | | 2,945,813 | | | | | — | | | | | — | | | | | 2,945,813 | |
| | | | | | | | | | | | | | | | | | | | |
Total Investments in Securities | | | $ | 50,151,341 | | | | $ | — | | | | $ | — | | | | $ | 50,151,341 | |
| | | | | | | | | | | | | | | | | | | | |
Other Financial Instruments* | | | | | | | | | | | | | | | | | | | | |
Futures Contracts — Unrealized Appreciation | | | $ | 31,795 | | | | $ | — | | | | $ | — | | | | $ | 31,795 | |
| | | | | | | | | | | | | | | | | | | | |
| † | See Schedule of Investments for industry classification. |
| * | Other financial instruments include derivative instruments such as futures contracts. Amounts shown represent unrealized appreciation (depreciation), at period end. |
There were no transfers between fair value levels. Transfers between fair value levels are considered to occur at the beginning of the period.
20
| | |
| Notes to Financial Statements | | December 31, 2013 |
| 4. | Derivatives Transactions |
Shown below are the derivative contracts entered into by the Fund, summarized by primary risk exposure as they appear on the Statement of Assets and Liabilities, all of which are not accounted for as hedging instruments under FASB Accounting Standards Codification (“ASC”) No. 815 Derivatives and Hedging as of December 31, 2013.
| | | | | | | | | | | | |
| | | Asset Derivatives December 31, 2013 | | | Liability Derivatives December 31, 2013 | |
Derivatives not accounted for as hedging
instruments under ASC 815 | | Location in the Statements
of Assets and Liabilities | | Fair
Value ($) | | | Location in the Statements
of Assets and Liabilities | | Fair
Value ($) | |
Equity Contracts | | Assets, Net Assets — Net Unrealized Appreciation/ (Depreciation) on Futures | | | 31,795* | | | Liabilities, Net Assets — Net Unrealized Appreciation/ (Depreciation) on Futures | | | — | |
| * | Includes cumulative unrealized appreciation/(depreciation) of futures contracts as reported in the Schedule of Investments and within the components of the net assets section of the Statement of Assets and Liabilities. Only the current day’s variation margin is reported within the Assets and/or Liabilities section on the Statement of Assets and Liabilities. |
Shown below are the effects of derivative instruments on the Fund’s Statement of Operation, summarized by primary risk exposure all of which are not accounted for as hedging instruments under ASC 815.
| | | | | | | | | | | | | | |
Derivatives not accounted for as
hedging instruments under ASC 815 | | Location in the Statements
of Operations | | Total Notional Amount
of Futures Contracts
Purchased/(Sold) ($) | | | Realized Gain
(Loss) on
Derivatives
Recognized
in Income ($) | | | Change in
Unrealized
Appreciation
(Depreciation)
on Derivatives
Recognized in
Income ($) | |
Equity Contracts | | Realized gain/(loss) on futures, Increase/(decrease) in unrealized appreciation/ (depreciation) on Futures | |
| 9,723,174/
(10,886,611) |
| | | 342,640 | | | | 25,246 | |
The Company shares a revolving credit facility of up to $150 million with a number of its affiliates. The credit facility is with its custodian bank, State Street Bank and Trust Company (“State Street”). The revolving credit facility requires the payment of a commitment fee equal to 0.10% per annum on the daily unused portion of the credit facility, payable quarterly. The portion borne by the Funds generally is borne proportionally based upon net assets. In addition, the Company has a $100 million uncommitted, unsecured line of credit with State Street. Generally, borrowings under the credit facilities would accrue interest at the Federal Funds Rate plus 50 basis points and would be borne by the borrowing fund. The maximum amount allowed to be borrowed by any one fund is the lesser of (i) 33.33% of its total assets or (ii) 20% of its net assets. The credit facilities were not utilized by the Fund during the year ended December 31, 2013.
| 6. | Compensation and Fees Paid to Affiliates |
GEAM, a registered investment adviser, was retained by the Company’s Board of Directors effective March 16, 2000 to act as investment adviser and administrator of the Fund. GEAM’s compensation for investment advisory and administrative services (“management fee”) is paid monthly based on the average daily net assets of the Fund at an annualized rate of 0.95%.
GEAM has a contractual arrangement with the Fund to waive a portion of the Fund’s management fee in the amount equal to the management fee earned by GEAM with respect to the Fund’s investment in the GE Institutional Money Market Fund, if any.
Directors’ Compensation The Fund pays no compensation to its directors who are officers or employees of GEAM or its affiliates. Directors who are not such officers or employees also serve in a similar capacity
21
| | |
| Notes to Financial Statements | | December 31, 2013 |
for other funds advised by GEAM. Compensation paid to non-interested Directors are reflected on the Statement of Operations. These fees are allocated pro rata across all of the mutual fund platforms served by the Directors, including the Fund, and are based upon the relative net assets of each fund within such platforms.
Pursuant to an investment sub-advisory agreements with GEAM, the assets of the Fund are allocated to and managed by each of the following sub-advisers: (i) Palisade Capital Management, L.L.C.; (ii) Champlain Investment Partners, LLC; (iii) GlobeFlex Capital, LP; (iv) Kennedy Capital Management, Inc. and (v) SouthernSun Asset Management, LLC. GEAM is responsible for allocating the Fund’s assets among the sub-advisers in its discretion (Allocated Assets), and for managing the Fund’s cash position, while each sub-adviser is responsible for the day-to-day management of their portion of the Allocated Assets, under the general supervision and oversight of GEAM and the Board. For their services, GEAM pays each sub-adviser an investment sub-advisory fee, which is calculated as a percentage of the average daily net assets of the respective Allocated Assets that it manages.
| 8. | Investment Transactions |
Purchases and Sales of Securities The cost of purchases and the proceeds from sales of investments, other than short-term securities, for the year ended December 31, 2013, were as follows:
| | | | | | |
| Non-U.S. Government Securities | |
| Purchases | | | Sales | |
| $ | 16,794,124 | | | $ | 22,560,741 | |
The Fund is subject to ASC 740, Income Taxes. ASC 740 provides guidance for financial accounting and reporting for the effects of income taxes that result from an entity’s activities during the year. ASC 740 also provides guidance regarding how certain uncertain tax positions should be recognized, measured, presented and disclosed in the financial statements. ASC 740 requires evaluation of tax positions taken or expected to be taken in the course of preparing the Fund’s tax returns to determine whether the tax positions are “more likely than not” of being sustained by the applicable tax authority. There are no adjustments to the Fund’s net assets required under ASC 740. The Fund’s 2010, 2011, 2012, and 2013 fiscal years tax returns are still open to examination by the Federal and applicable state tax authorities.
At December 31, 2013, information on the tax cost of investments and distributable earnings on a tax basis was as follows:
| | | | | | | | | | | | | | | | | | | | | | | | | | | | | | |
Cost of
Investments For
Tax Purposes | | | Gross Tax | | | Net Tax Appreciation/
(Depreciation) | | | Undistributed | | | | |
| | Appreciation | | | Depreciation | | | Investments | | | Derivatives/
Currency | | | Income | | | Accum.
Capital
Gain/(Loss) | | | Late-Year
Losses | |
| $ | 37,397,656 | | | $ | 13,585,823 | | | $ | (823,138 | ) | | $ | 12,753,685 | | | $ | 31,795 | | | $ | 151,325 | | | $ | 1,151,790 | | | $ | — | |
22
| | |
| Notes to Financial Statements | | December 31, 2013 |
As of December 31, 2013, the Fund had no capital loss carryovers. Capital loss carryovers are available to offset future realized capital gains to the extent provided in the Internal Revenue Code and regulations thereunder. To the extent that these carryover losses are used to offset future capital gains, it is probable that gains offset will not be distributed to shareholders because they would be taxable as ordinary income.
Any qualified late-year loss is deemed to arise on the first day of the Fund’s next tax year (if the Fund elects to defer such loss). Under this regime, generally, the Fund can elect to defer any post-October capital loss and/or any late-year ordinary loss as defined by the Internal Revenue Code.
The Fund incurred no such losses for the year ended December 31, 2013.
The tax character of distributions paid during the years ended December 31, 2013 and December 31, 2012 were as follows:
| | | | | | | | | | | | | | | |
| Year | | Ordinary
Income | | Long-Term
Capital Gains | | Total |
2013 | | | $ | 866,133 | | | | $ | 4,724,506 | | | | $ | 5,590,639 | |
2012 | | | | 113,702 | | | | | 3,708,420 | | | | | 3,822,122 | |
Distributions to Shareholders The Fund declares and pays any dividends from net investment income annually. The Fund declares and pays any net realized capital gains in excess of capital loss carryforwards distributions annually. The character of income and gains to be distributed is determined in accordance with income tax regulations which may differ from generally accepted accounting principles. These differences include (but are not limited to) investments in futures, distributions from Real Estate Investment Trusts (REITS) and losses deferred due to wash sale transactions. Reclassifications due to permanent book/tax differences are made to the Fund’s capital accounts to reflect income and gains available for distribution (or available capital loss carryovers) under income tax regulations. These reclassifications have no impact on net investment income, realized gains or losses, or the net asset value of the Fund. The calculation of net investment income per share in the Financial Highlights table excludes these adjustments.
The reclassifications for the year ended December 31, 2013 were as follows:
| | | | | | | | | | |
Undistributed
Net Investment
Income | | | Accumulated
Net Realized
Gain (Loss) | | | Capital
Paid In | |
| $ | 104,184 | | | $ | (95,758 | ) | | $ | (8,426 | ) |
23
Report of Independent Registered Public Accounting Firm
The Shareholders and Board of Directors
GE Investments Funds, Inc.
We have audited the accompanying statement of assets and liabilities, including the schedule of investments, of the Small-Cap Equity Fund (the “Fund”), a series of GE Investments Funds, Inc., as of December 31, 2013 and the related statement of operations for the year then ended, statements of changes in net assets for each of the years in the two-year period then ended, and the financial highlights for each of the years in the five-year period then ended. These financial statements and financial highlights are the responsibility of the Fund’s management. Our responsibility is to express an opinion on these financial statements and financial highlights based on our audits.
We conducted our audits in accordance with the standards of the Public Company Accounting Oversight Board (United States). Those standards require that we plan and perform the audit to obtain reasonable assurance about whether the financial statements are free of material misstatement. An audit includes examining, on a test basis, evidence supporting the amounts and disclosures in the financial statements. Our procedures included confirmation of securities owned as of December 31, 2013 by correspondence with the custodian and brokers, or by other appropriate auditing procedures where replies from brokers were not received. An audit also includes assessing the accounting principles used and significant estimates made by management, as well as evaluating the overall financial statement presentation. We believe that our audits provide a reasonable basis for our opinion.
In our opinion, the financial statements and financial highlights referred to above present fairly, in all material respects, the financial position of the Small-Cap Equity Fund as of December 31, 2013, the results of its operations, changes in its net assets and financial highlights for each of the years described above, in conformity with U.S. generally accepted accounting principles.

Boston, Massachusetts
February 17, 2014
24
| | |
| Tax Information | | (Unaudited) |
For the year ended December 31, 2013, the Fund hereby designates $4,724,506 as capital gain dividends, or the amount ultimately treated as capital gain net income.
The amounts presented herein may differ from amounts presented elsewhere in the financial statements due to differences between tax and financial accounting principles. Please consult a tax advisor if you have any questions about Federal or State income tax laws or on how to prepare your tax returns. If you have specific questions about your Fund account, please consult your investment representative.
25
| | |
Advisory and Administrative Agreement
Approvals and Renewals | | (Unaudited) |
The Board of Directors of the GE Investments Funds, Inc. (the “Board”), including the independent Board members, considered and unanimously approved the continuance for an additional year of the Fund’s Investment Advisory and Administration Agreement with GE Asset Management Incorporated (“GEAM”) and the Investment Sub-Advisory Agreements with each of the Fund’s sub-advisers, Palisade Capital Management, L.L.C. (“Palisade”), Champlain Investment Partners, LLC (“Champlain”), GlobeFlex Capital, LP (“GlobeFlex”), SouthernSun Asset Management, LLC (“SouthernSun”) and Kennedy Capital Management, Inc. (“Kennedy”) at meetings held on December 11 and December 13, 2013.
In considering whether to approve the Fund’s investment advisory and sub-advisory agreements, the Board members considered and discussed a substantial amount of information and analysis provided, at the Board’s request, by GEAM and each of the sub-advisers. The Board members also considered detailed information regarding performance and expenses of other investment companies, including those with similar investment strategies and sizes, which was prepared by independent third party provider Morningstar, Inc. (“Morningstar”). The Board members reviewed the fees charged by GEAM for other mutual funds that employ a similar investment strategy as the Fund. The Board had the opportunity to ask questions and request additional information in connection with its considerations.
Before approving the Fund’s investment advisory and sub-advisory agreements, the independent Board members reviewed the information provided with management of GEAM and with their independent legal counsel. The Board members also reviewed a memorandum prepared by independent legal counsel discussing the legal standards for the consideration of the proposed continuances. The independent Board members discussed the proposed continuances in detail during a private session with their independent legal counsel at which no representatives of GEAM or any of the sub-advisers were present. The independent Board members and their independent legal counsel requested, received and considered additional information from GEAM following these sessions.
In advance of the meetings, and in response to their request, the Board members received from GEAM written responses to their inquiries, which included substantial exhibits and other materials related to GEAM’s business
and the services it provides to the Fund. Also in advance of the meetings, the Board members received from each of the sub-advisers a written response to a letter of inquiry prepared by GEAM at the Board’s request, which included substantial exhibits and other materials related to the business of, and services provided by, each of the sub-advisers. The Board members took into account their experience as Board members and particularly their previous consideration of these types of agreements. When feasible, information was presented in a manner to facilitate comparison to prior periods and to reflect certain enhancements to GEAM’s infrastructure, systems and shareholder servicing model. To focus their review, the Board members asked GEAM management and each of the sub-advisers, in their oral presentations and/or written materials, to highlight material differences from the information presented in recent years.
During the meetings, the Board members had an opportunity to discuss this information with GEAM representatives, including senior executives, representatives from the legal, compliance and finance departments, and investment personnel. The Board members also had an opportunity to hear presentations by representatives of each of the sub-advisers during the past year. The Board members posed questions to these representatives and engaged in substantive discussions with them concerning each of their investment processes.
In reaching their determinations relating to continuance of the Fund’s investment advisory and sub-advisory agreements, the Board members considered all factors that they deemed relevant, including the factors discussed below. In their deliberations, the Board members did not identify any particular information that was all-important or controlling, and each Board member may have attributed different weights to the various factors. In particular, the Board members focused on the following:
The Nature, Extent And Quality Of Services Provided.
The Board members reviewed the services provided by GEAM and each of the sub-advisers, in particular taking into account their past experiences with GEAM and Palisade. In connection with their consideration of GEAM’s services, the Board members focused on the favorable attributes of GEAM, including (i) an investment philosophy oriented toward long-term performance; (ii) effective processes used for overseeing multiple sub-advisers; (iii) effective processes used for providing Fund
26
| | |
Advisory and Administrative Agreement
Approvals and Renewals | | (Unaudited) |
administration, including controllership and compliance functions, the optimization of its Fund administration platform and the continued oversight of the performance of other companies that provide services to the Fund and its shareholders; (iv) highly skilled professionals including analysts, research professionals, traders and portfolio managers with a depth of experience relevant to the Fund; (v) access to significant and enhanced technological resources from which the Fund may benefit; and (vi) a favorable history and reputation. The Board members noted that the Fund represents only a small portion of the assets managed by GEAM, but benefits from a full array of services and resources provided by GEAM.
In connection with their consideration of the services provided by each of the sub-advisers, the Board members focused on the favorable attributes of the sub-advisers relating to their respective investment philosophies and disciplines, experienced investment and trading personnel, systems and other resources, including research capabilities, and favorable histories and reputations.
In light of the foregoing, the Board, including the independent Board members, concluded that the services provided by GEAM and each of the sub-advisers continue to be satisfactory.
Investment Performance Of The Fund And The Sub-Advisers.
The Board members considered the investment performance of the Fund for various periods. The Board members reviewed detailed comparisons of the performance of the Fund with the relevant securities index and peer groupings of mutual funds prepared by Morningstar with respect to various periods. The Board members also engaged in detailed discussions with GEAM management and representatives of each of the sub-advisers at meetings held throughout the year about each of their investment processes and performance results. These discussions focused on the Fund’s investment objective, GEAM’s asset allocation process, the number and experience of portfolio management and supporting research personnel, the investment style and approach employed, the likely market cycles for the Fund’s investment style and the Fund’s relative underperformance in certain periods. The Board also considered the multi-manager structure and how each sub-adviser’s approach to small-cap investing fits within the Fund’s overall strategy, and the Fund’s strong performance in prior periods.
The Board, including the independent Board members, concluded that the Fund’s performance was acceptable
overall taking into consideration the factors discussed above.
Cost Of The Services Provided And Profits Realized From The Relationships With The Fund.
The Board members considered the fees paid to GEAM by the Fund, as well as those paid to each of the sub-advisers by GEAM, and the cost of the services provided. The Board members reviewed the information they had requested from GEAM and each of the sub-advisers concerning their profitability.
The Board members considered the profit margin information for GEAM’s investment company business as a whole, as well as GEAM’s profitability data for the Fund. The Board members reviewed GEAM’s assumptions and the methods of cost allocation used by GEAM in preparing Fund-specific profitability data. The Board members discussed with GEAM the basis for its belief that the methods of allocation used were reasonable for each area of its business. The Board members also considered information regarding the calculation methodology provided by each of the sub-advisers in preparing their profitability data.
Information was presented regarding the financial condition of GEAM and each of the sub-advisers for various past periods. The Board members noted and discussed the additional services provided by GEAM to the Fund compared to other similar mutual funds managed by GEAM, and noted the fact that GEAM, and not the Fund, pays the sub-advisory fees to the sub-advisers. GEAM reviewed the services related to the allocation of assets among, and oversight of, multiple sub-advisers as a result of the Fund’s multi-manager structure. The Board noted that GEAM, and not the Fund, pays the sub-advisory fees to each of the sub-advisers out of its advisory fee. The Board members determined that GEAM and each of the sub-advisers should be entitled to earn a reasonable level of profits for the services they provide to the Fund. The Board members also recognized that GEAM has made and continues to make significant investments in its business in fulfilling its obligations to the Fund and supporting its Fund-related activities.
Based on their review, the Board, including the independent Board members, concluded that they were
27
| | |
Advisory and Administrative Agreement
Approvals and Renewals | | (Unaudited) |
satisfied that the level of profitability achieved by GEAM and each of the sub-advisers from their relationship with the Fund was not unreasonable or excessive.
The Extent To Which Economies Of Scale Would Be Realized As The Fund Grows And Whether Fee Levels Would Reflect Such Economies Of Scale.
The Board noted that the Fund experienced a slight increase in assets over the past year, and the Board members considered the extent to which economies of scale would be realized as the Fund grows, and whether fee levels reflect these economies of scale for the benefit of Fund investors.
The Board members considered the substantial infrastructure investments that GEAM has made with respect to its operations and its commitment to continue investing resources to enhance services to Fund shareholders. The Board members recognized the benefits to the Fund of GEAM’s past investment in its operations through expenditures to support its substantial infrastructure, and that, with respect to all GEAM managed mutual funds, GEAM has not yet fully recouped that investment. The Board members also recognized the benefits to the Fund of being able to leverage a favorable cost structure achieved with respect to the Fund’s other operating expenses as a result of GEAM’s large overall base of assets under management and its vendor management practices.
Comparison Of Services To Be Rendered And Fees To Be Paid.
The Board members discussed the respective services provided to the Fund by GEAM and each of the sub-advisers, and the fees charged for those services, including the services required of GEAM to oversee
multiple sub-advisers. The Board members reviewed information concerning the fee and expense ratios for the Fund and comparative information with respect to peer groupings of mutual funds prepared by Morningstar. They discussed that the Fund’s advisory fee was within the applicable peer group range, although the expense ratios were the highest in the applicable peer group range. The Board members reviewed comparative mutual fund and/or other account fee information provided by each of the sub-advisers. The Board, including the independent Board members, concluded that, based on this information, the advisory fee and the sub-advisory fees paid to each of the sub-advisers were reasonable in relation to the services provided to the Fund.
Fall-Out Benefits.
The Board members considered other actual and potential financial benefits that GEAM and each of the sub-advisers may derive from their respective relationships with the Fund, including, to the extent applicable, soft dollar commission benefits generated through Fund portfolio transactions. The Board members noted, however, that the Fund benefits from the vast array of resources available through GEAM, and that the Fund represents only a small portion of the assets managed by GEAM.
Conclusion.
No single factor was determinative to the Board’s decision. Based on their discussion and such other matters as were deemed relevant, the Board, including the independent Board members, concluded that renewal of the investment advisory and each sub-advisory agreement was in the best interests of the Fund and its shareholders.
28
| | |
| Additional Information | | (Unaudited) |
Information about Directors and Executive Officers:
The business and affairs of the Funds are managed under the direction of the Funds’ Board of Directors. Information pertaining to the Directors and officers of the Funds is set forth below.
Interested Directors and Executive Officers
Michael J. Cosgrove
Address c/o GEAM 1600 Summer St. Stamford, CT 06905
Age 64
Position(s) Held with Fund Chairman of the Board and President
Term of Office and Length of Time Served Until successor is elected and qualified — 17 years
Principal Occupation(s) During Past 5 years President of Mutual Funds and Global Investment Programs of GEAM since November 2011; President and Chief Executive Officer — Mutual Funds and Intermediary Business of GEAM from March 2007 to November 2011; Executive Vice President of GEAM from February 1997 to March 2007; and Executive Vice President-Mutual Funds of GEAM from March 1993 to March 2007. Also serves as Treasurer of GE Foundation since 1988.
Number of Portfolios in Fund Complex Overseen by Director 25
Other Directorships Held by Director Chairman of the Board and President of GE Institutional Funds since 1997; Trustee of Elfun Funds, GE Retirement Savings Plan Funds (formerly GE Savings & Security Funds) and General Electric Pension Trust since 1988; Director of GEAM since 1988; Trustee of Fordham University from 2002 through June 2010 and since July 2011; Director of GE Investment Distributors, Inc. since June 2011; Director of Skin Cancer Foundation since August 2010; Member Board of Governors of the Investment Company Institute since October 2006; Director of GE Asset Management (Ireland) Limited since February 1999; GE Asset Management Funds Plc since 1998; GE Asset Management Canada Company since 1998, GE Asset Management Limited since 1998; Trustee of General Electric Insurance Plan Trust since 1988; and Chairman of the Board and President of GE Funds from 1993 to February 2011.
Matthew J. Simpson
Address c/o GEAM 1600 Summer St. Stamford, CT 06905
Age 52
Position(s) Held with Fund Director and Executive Vice President
Term of Office and Length of Time Served Until successor is elected and qualified — 6 years
Principal Occupation(s) During Past 5 years Executive Vice President, General Counsel and Secretary of GEAM since July 2007; Secretary of Elfun Funds and GE Retirement Savings Plan Funds (formerly GE Savings & Security Funds) since July 2007; Senior Vice President and General Counsel — Marketing and Client Services (formerly Asset Management Services) of GEAM and Senior Vice President and General Counsel of GE Asset Management Services from February 1997 to July 2007; Vice President and Associate General Counsel of GEAM from October 1992 to February 1997; Secretary of GE Institutional Funds and GE Investments Funds, Inc. from 1997 to July 2007 and Vice President from September 2003 to July 2007; Assistant Secretary of Elfun Funds and GE Savings & Security Funds from 1998 to July 2007 and Vice President from October 2003 to July 2007; and Secretary of GE Funds from 1993 to July 2007 and Vice President from September 2003 to July 2007.
Number of Portfolios in Fund Complex Overseen by Director 25
Other Directorships Held by Director Trustee of Elfun Funds, GE Retirement Savings Plan Funds and General Electric Pension Trust since July 2007; Trustee and Executive Vice President of GE Institutional Funds since July 2007; Director of GEAM since July 2007; Director of GE Investment Distributors, Inc. since June 2011; and Trustee and Executive Vice President of GE Funds from July 2007 to February 2011.
29
| | |
| Additional Information | | (Unaudited) |
Joon Won Choe
Address c/o GEAM 1600 Summer St. Stamford, CT 06905
Age 44
Position(s) Held with Fund Vice President & Secretary
Term of Office and Length of Time Served Until successor is elected and qualified — Vice President and Secretary — 3 years
Principal Occupation(s) During Past 5 years Senior Vice President and Deputy General Counsel at GEAM since March 2011; Vice President and Secretary of GE Institutional Funds since September 2010; Vice President and Assistant Secretary of Elfun Funds and GE Retirement Savings Plan Funds (formerly GE Savings & Security Funds) since September 2010; Senior Vice President and Associate General Counsel at GEAM from June 2010 to March 2011; Vice President and Associate General Counsel of GEAM from November 2005 to June 2010 and Vice President and Secretary of GE Funds from September 2010 to February 2011.
Number of Portfolios in Fund Complex Overseen by Officer N/A
Other Directorships Held by Officer N/A
Robert Herlihy
Address c/o GEAM 1600 Summer St. Stamford, CT 06905
Age 46
Position(s) Held with Fund Chief Compliance Officer
Term of Office and Length of Time Served Until successor is elected and qualified — 8 years
Principal Occupation(s) During Past 5 years Chief Compliance Officer of GEAM, GE Institutional Funds, Elfun Funds, and GE Retirement Savings Plan Funds (formerly GE Savings & Security Funds) since July 2005; Chief Compliance Officer of GE Funds from July 2005 to February 2011 and Manager of Fund Administration at GEAM from 2002-2005.
Number of Portfolios in Fund Complex Overseen by Officer N/A
Other Directorships Held by Officer N/A
Arthur A. Jensen
Address c/o GEAM 1600 Summer St. Stamford, CT 06905
Age 47
Position(s) Held with Fund Treasurer
Term of Office and Length of Time Served Until successor is elected and qualified — 2 years
Principal Occupation(s) During Past 5 Years Treasurer of GE Institutional Funds, Elfun Funds and GE Retirement Savings Plan Funds (formerly GE Savings & Security Funds) since June 2011; Mutual Funds Controller of GEAM since April 2011; Senior Vice President at Citigroup from 2008 to 2010 and Vice President at JPMorgan from 2005 to 2008.
Number of Portfolios in Fund Complex Overseen by Officer N/A
Other Directorships Held by Officer N/A
30
| | |
| Additional Information | | (Unaudited) |
Jeanne M. LaPorta
Address c/o GEAM 1600 Summer St. Stamford, CT 06905
Age 48
Position(s) Held with Fund Vice President
Term of Office and Length of Time Served Until successor is elected and qualified — 10 years
Principal Occupation(s) During Past 5 Years Senior Vice President and Commercial Administrative Officer of GEAM since April 2010; Vice President of GE Institutional Funds since July 2003; Vice President of Elfun Funds and GE Retirement Savings Plan Funds (formerly GE Savings & Security Funds) since October 2003; Secretary of GE Funds from July 2007 to September 2010 and Vice President from July 2007 to February 2011; Senior Vice President and Deputy General Counsel of GEAM from October 2007 to April 2010; Vice President and Assistant Secretary of Elfun Funds and GE Retirement Savings Plan Funds from July 2003 to June 2010; and Vice President and Associate General Counsel — Marketing and Client Services (formerly Asset Management Services) at GEAM from May 1997 to October 2007.
Number of Portfolios in Fund Complex Overseen by Officer N/A
Other Directorships Held by Officer N/A
Non-Interested Directors
John R. Costantino
Address c/o GEAM 1600 Summer St. Stamford, CT 06905
Age 67
Position(s) Held with Fund Director
Term of Office and Length of Time Served Until successor is elected and qualified — 17 years
Principal Occupation(s) During Past 5 years Managing General Partner, NGN Capital LLC since 2006; and Treasurer of NeuroScience Research Institute since 1986.
Number of Portfolios in Fund Complex Overseen by Director 17
Other Directorships Held by Director Trustee of GE Institutional Funds since 1997; Trustee of Fordham University from 1989 to 1995 and from 2001 to 2007 and Trustee Emeritus since 2007; Trustee of NeuroScience Research Institute since 1986; Trustee of GE Funds from 1993 to February 2011; and Director of Artes Medical from 2006 to 2008.
31
| | |
| Additional Information | | (Unaudited) |
R. Sheldon Johnson
Address c/o GEAM 1600 Summer St. Stamford, CT 06905
Age 67
Positions(s) Held with Fund Director
Term of office and Length of Time served Unit Successor is elected and qualified — 2 years
Principal Occupation(s) During Past 5 years Head of Global Institutional Equity Sales and Marketing at Morgan Stanley & Co., Inc. from 2002 to 2006 and Managing Director at Morgan Stanley & Co., Inc. from 1988 to 2006.
Number of Portfolios in Fund Complex Overseen by Director 17
Other Directorships Held by Director Trustee of GE Institutional Funds since April 2011 and Trustee of St. Lawrence University since 2003.
Donna M. Rapaccioli
Address c/o GEAM 1600 Summer St. Stamford, CT 06905
Age 51
Position(s) Held with Fund Director
Term of Office and Length of Time Served Until successor is elected and qualified — 2 years
Principal Occupation(s) During Past 5 Years Dean of the Gabelli School of Business since 2007 and Accounting professor since 1987 at Fordham University.
Number of Portfolios in Fund Complex Overseen by Officer 17
Other Directorships Held by Director Trustee of GE Institutional Funds since January 2012 and Trustee of Emmanuel College since 2010.
The Statement of Additional Information for the Funds includes additional information about the Directors and Officers and is available, without charge, upon request by calling 1-800-242-0134.
32
| | |
| Investment Team | | (Unaudited) |
Investment Adviser and Administrator
GE Asset Management Incorporated
Board of Directors
Michael J. Cosgrove, Chairman
John R. Costantino
R. Sheldon Johnson
Donna M. Rapaccioli
Matthew J. Simpson
Secretary
Joon Won Choe
Assistant Secretary
Michelle Matzelle
Treasurer
Arthur A. Jensen
Assistant Treasurer
Robert Meyers
Distributor
GE Investment Distributors, Inc.
Member FINRA and SIPC
Custodian
State Street Bank & Trust Company
At GE Asset Management, we’re dedicated to providing the investment options you’ll need to tailor your financial portfolio to every stage of your life. Each member of the GE Family of Funds is managed according to the same principles of integrity and quality that have guided GE over the past century, and have made it the world-class company that it is today. Each fund draws strength from a heritage of investment management experience that spans more than 80 years. Whether you’re creating a new investment portfolio or adding to an established one, the GE Family of Funds offers an array of professionally managed investment options that will help you meet a lifetime of financial needs.
33
Investment Adviser
GE Asset Management Incorporated
1600 Summer Street
Stamford, CT 06905
or at:
PO Box 7900
Stamford, CT 06904-7900
Distributor
GE Investment Distributors, Inc.
member FINRA and SIPC
1600 Summer Street
Stamford, CT 06905
or at:
PO Box 7900
Stamford, CT 06904-7900
The Fund files its complete schedule of portfolio holdings with the Securities and Exchange Commission for the first and third quarters of each fiscal year on Form N-Q. The Fund’s Forms N-Q, as well as a description of the policies and procedures that the Fund uses to determine how to vote proxies (if any) relating to portfolio securities is available without charge (i) upon request, by calling 1-800-493-3042; (ii) on the Fund’s website at http://www.geam.com; and (iii) on the Commission’s website at http://www.sec.gov. The Fund’s Forms N-Q may be reviewed and copied at the Commission’s Public Reference Room in Washington, DC – information on the operation of the Public Reference Room may be obtained by calling 1-800-SEC-0330.
Information (if any) regarding how the Fund voted proxies relating to portfolio securities during the most recently disclosed 12-month period ended June 30 is available without charge (i) through the Fund’s website at http://www.geam.com; and (ii) on the Commission’s website at http://www.sec.gov.

GE Investments Funds, Inc.
Income Fund
Annual Report
December 31, 2013

GE Investments Funds, Inc.
This report is prepared for Policyholders of certain variable contracts and may be distributed to others only if preceded or accompanied by the variable contract’s current prospectus and the current prospectus and/or summary prospectus of the Fund available for investments thereunder.
| | |
| Notes to Performance | | December 31, 2013 (Unaudited) |
The information provided on the performance pages relates to the GE Investments Income Fund (the “Fund”).
Total return performance shown in this report for the Fund takes into account changes in share price and assumes reinvestment of dividends and capital gains distributions, if any. Total returns shown are net of Fund fees and expenses but do not reflect fees and charges associated with the variable contracts such as administrative fees, account charges and surrender charges, which, if reflected, would reduce the Fund’s total returns for all periods shown.
The performance data quoted represents past performance; past performance does not guarantee future results. Investment return and principal value will fluctuate so your shares, when redeemed, may be worth more or less than their original cost. Current performance may be higher or lower than the performance data quoted. Periods less than one year are not annualized. Please call 800-493-3042 or visit the Fund’s website at http://www.geam.com for the most recent month-end performance data.
An investment in the Fund is not a deposit of any bank and is not insured or guaranteed by the Federal Deposit Insurance Corporation (FDIC) or any other government agency. An investment in the Fund is subject to risk, including possible loss of principal invested.
The Barclays U.S. Aggregate Bond Index is an unmanaged market value-weighted index of taxable investment grade debt issues, including government, corporate, asset-backed and mortgage-backed securities, with maturities
of one year or more. This index is designed to represent the performance of the U.S. investment-grade first rate bond market.
The results shown for the foregoing index assume the reinvestment of net dividends or interest and do not reflect fees, expenses, or taxes. As such, the index returns do not reflect the actual cost of investing in the instruments that comprise the index.
The peer universe of the underlying annuity funds used for the peer group average annual total return calculation is based on a blend of Morningstar peer categories, as shown. Morningstar is an independent mutual fund rating service. A Fund’s performance may be compared to or ranked within a universe of mutual funds with investment objectives and policies similar but not necessarily identical to that of the Fund.
©2014 Morningstar, Inc. All Rights Reserved. The Morningstar information contained herein: (1) is proprietary to Morningstar and/or its content providers; (2) may not be copied or distributed; and (3) is not warranted to be accurate, complete or timely. Neither Morningstar nor its content providers are responsible for any damage or losses relating from any use of this information. Past performance is no guarantee of future results.
The views expressed in this document reflect our judgment as of the publication date and are subject to change at any time without notice.
GE Investment Distributors, Inc., Member of FINRA & SIPC, is the principal underwriter and distributor of the GE Investments Funds, Inc. and a wholly owned subsidiary of GE Asset Management Incorporated, the investment adviser of the Fund.
1

William M. Healey
Senior Vice President and Chief Investment Officer — Core Fixed Income Investments

Mark H. Johnson
Senior Vice President and Chief Investment Officer — Long Duration Fixed Income & Insurance Investments

Vita Marie Pike
Senior Vice President and Chief Investment Officer — Risk Assets Fixed Income Investments
The Income Fund is managed by a team of portfolio managers that includes William M. Healey, Mark H. Johnson and Vita Marie Pike. Mr. Healey, Mr. Johnson and Ms. Pike are each responsible for a portion of the Fund, the size of which is determined by team consensus and adjusted on a periodic basis, if necessary. Although each portfolio manager manages his or her portion of the Fund independent of the other team members, the team is highly collaborative and communicative.
William M. Healey is a Senior Vice President and Chief Investment Officer — Core Fixed Income Investments of GE Asset Management. He has served on the portfolio management team for the Income Fund since September 1997. Mr. Healey joined GE Asset Management in April 1996 as a portfolio manager became Vice President in June 2001, Senior Vice President in January 2007 and Chief Investment Officer — Core Fixed Income Investments in April 2012. Prior to joining GE Asset Management, Mr. Healey spent over 10 years in the fixed income group at MetLife.
Mark H. Johnson is a Senior Vice President and Chief Investment Officer — Long Duration Fixed Income & Insurance Investments of GE Asset Management. He has been a member of the portfolio management team for the Income Fund since 2007. Mr. Johnson joined GE in 1998 and GE Asset Management as a Vice President and portfolio manager in 2002. He became Senior Vice President in 2007 and Chief Investment Officer — Long Duration Fixed Income & Insurance Investments in April 2012. Prior to joining GE Asset Management, Mr. Johnson held positions at various insurance companies and public accounting firms.
Vita Marie Pike is a Senior Vice President and Chief Investment Officer — Risk Assets Fixed Income Investments of GE Asset Management. She has served on the portfolio management team for the Income Fund since June 2004. Ms. Pike joined GE in January 2001 and GE Asset Management in January 2002 as a Vice President and Senior Portfolio Manager and became Senior Vice President in November 2010 and Chief Investment Officer — Risk Assets Fixed
Income Investments in April 2012. Prior to joining GE Asset Management, she was with Alliance Capital for over nine years serving in a number of different capacities including portfolio manager.
| Q. | How did the GE Investments Income Fund perform compared to its benchmark for the twelve-month period ended December 31, 2013? |
| A. | For the twelve-month period ended December 31, 2013, the Income Fund returned -1.34%. The Barclays Capital U.S. Aggregate Bond Index, the Fund’s benchmark, returned -2.02% and the Fund’s Morningstar peer group of 209 U.S. Insurance Intermediate-Term Bond funds returned an average of -1.52% over the same period. |
| Q. | Discuss the factors that materially affected the Fund’s performance during the period. |
| A. | The primary drivers of the Fund’s performance during the period were a rise in interest rates and tighter credit spreads. The U.S. Treasury 10-year note yield ended the year at 3.03%, up 127 basis points from the end of 2012. Rising interest rates drove bond prices down which resulted in negative total returns for both the Fund and its benchmark. However, the Fund’s duration was shorter than the benchmark when interest rates increased the most which benefited its relative performance. Credit related sectors outperformed duration-adjusted treasuries during the period due to a compression in yield spreads and higher coupon income. The Fund was generally overweight in these assets which added value but the main source of Fund performance came from strong security selection in all non-treasury sectors, predominantly high grade and high yield corporate debt and agency mortgage-backed securities. |
| Q. | Were there any significant changes to the Fund during the period? |
| A. | The Fund’s duration relative to its benchmark was strategically biased short |
2
| | and was tactically traded from neutral to 1 year below the benchmark duration during the period. The duration of the Fund began the year one-half year shorter than the benchmark and ended the year neutral. While the Fund maintained an overweight to non-treasury sectors, the Fund’s relative allocations changed throughout the period to take advantage of yield spread changes. The allocation to high grade corporate bonds began the year roughly 4% underweight and ended the year 4% overweight. The overweight in commercial mortgage-backed securities was increased from 1% to 4% at year-end. The Fund’s non-index exposure to high yield bonds moved from a 4% to 10% by mid-year and finished at 6%. The Fund’s exposure to emerging market debt started at 3%, rose to 7% by mid-year and ended at 5%. The Fund’s net increase in spread sector exposure was offset by a decrease in its relative allocation to treasury securities (including cash) from approximately -5% to -16%. |
3
Understanding Your Fund’s Expenses
As a shareholder of the Fund you incur ongoing costs. Ongoing costs include portfolio management fees, professional fees, administrative fees and other Fund expenses. The following example is intended to help you understand your ongoing costs (in dollars) of investing in the Fund and to compare these costs with the ongoing costs of investing in other mutual funds.
To illustrate these ongoing costs, we have provided an example and calculated the expenses paid by investors in the Fund during the period. The information in the following table is based on an investment of $1,000, which is invested at the beginning of the period and held for the entire six-month period ended December 31, 2013.
Actual Expenses
The first section of the table provides information about actual account values and actual expenses. You may use the information in this section, together with the amount you invested, to estimate the expenses that you paid over the period. To do so, simply divide your account value by $1,000 (for example, an $8,600 account value divided by $1,000 = 8.6), then multiply the result by the number given under the heading “Expenses paid during the period” to estimate the expenses you paid on your account during the period.
Hypothetical Example for Comparison Purposes
The second section of the table provides information about hypothetical account values and hypothetical expenses based on the Fund’s actual expense ratio and an assumed rate of return of 5% per year before expenses, which is not the Fund’s actual return. The hypothetical account values and expenses may not be used to estimate the actual ending account balance or expenses you paid for the period. You may use this information to compare the ongoing costs of investing in the Fund and other funds. To do so, compare this 5% hypothetical example with the 5% hypothetical examples that appear in the shareholders reports of other funds.
Please note that the expenses shown in the table are meant to highlight and help you compare ongoing costs only and do not reflect transaction costs, such as sales charges or redemption fees, if any. Therefore, the second section of the table is useful in comparing ongoing costs only, and will not help you determine the relative total costs of owning different funds. Additionally, the expenses shown do not reflect the fees or charges associated with variable contracts through which shares of the Fund are offered
July 1, 2013 – December 31, 2013
| | | | | | | | | | | | |
| | | Account value at the
beginning of the period ($) | | | Account value at the
end of the period ($) | | | Expenses paid
during the period ($)* | |
Actual Fund Return | | | 1,000.00 | | | | 1,012.50 | | | | 4.16 | |
Hypothetical 5% Return (2.5% for the period) | | | 1,000.00 | | | | 1,021.07 | | | | 4.18 | |
| * | Expenses are equal to the Fund’s annualized net expense ratio of 0.82% (for the period July 1, 2013 – December 31, 2013), multiplied by the average account value over the period, multiplied by 184/365 (to reflect the one-half year period). |
4
Investment Profile
A mutual fund designed for investors who seek maximum income consistent with prudent investment management and the preservation of capital. The Fund seeks to achieve its objective by investing at least 80% of its net assets under normal circumstances in debt securities.
|
| Morningstar Performance Comparison |
Based on average annual returns for periods ended 12/31/13
| | | | | | | | | | | | | | | |
| | | One
Year | | Five
Year | | Ten
Year |
Number of funds in peer group | | | | 209 | | | | | 183 | | | | | 152 | |
Peer group average annual total return | | | | -1.52% | | | | | 6.49% | | | | | 4.30% | |
Morningstar Category in peer group: U.S. Insurance Intermediate-Term Bond | |
as a % of Fair Value of $37,195 (in thousands) on December 31, 2013 (b)(c)
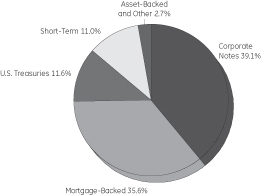
as of December 31, 2013 as a % of Fair Value (b)(c)
| | | | |
| Moody’s/S&P Rating* | | Percentage of
Fair Value | |
Aaa / AAA | | | 3.30% | |
Aa / AA | | | 55.45% | |
A / A | | | 9.84% | |
Baa / BBB | | | 22.78% | |
Ba / BB and lower | | | 8.26% | |
NR / Other | | | 0.37% | |
| | | | 100.00% | |
|
Change in Value of a $10,000 Investment(a) |
Class 1 Shares
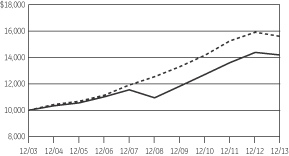

|
| Average Annual Total Return |
For the Periods Ended December 31, 2013
Class 1 Shares (Inception date: 1/03/95)
| | | | | | | | | | | | | | | | | | | | |
| | | One
Year | | Five
Year | | Ten
Year | | Ending value of a
$10,000 investment (a) |
Income Fund | | | | -1.34% | | | | | 5.34% | | | | | 3.58% | | | | $ | 14,211 | |
Barclays U.S. Aggregate Bond Index | | | | -2.02% | | | | | 4.44% | | | | | 4.55% | | | | $ | 15,599 | |
| (a) | Ending value of a $10,000 investment for the ten-year period or since inception, whichever is less. |
| (b) | The securities information regarding holdings, allocations and other characteristics is presented to illustrate examples of securities that the Fund has bought and the diversity of areas in which the Fund may invest as of a particular date. It may not be representative of the Fund’s current or future investments and should not be construed as a recommendation to purchase or sell a particular security. |
| (c) | Fair Value basis is inclusive of short-term investment in GE Institutional Money Market Fund Investment Class. |
| * | Moody’s Investors Services Inc and Standard & Poor’s are nationally recognized statistical rating organizations. |
See Notes to Performance on page 1 for further information, including an explanation of Morningstar peer categories.
Past performance does not predict future performance. The performance shown in the graph and table does not reflect the deduction of taxes that a shareholder would pay on Fund distributions or the redemption of Fund shares and does not reflect the fees or charges that would be associated with variable contracts through which shares of the Fund are offered.
5
Income Fund
| | |
| Schedule of Investments | | December 31, 2013 |
| | | | | | | | | | | | |
| | | | |
| | | | | Principal
Amount | | | Fair Value | | | |
| | | | | | | | | | | | |
Bonds and Notes – 95.1%† | | | |
| |
U.S. Treasuries — 12.4% | | | |
| |
U.S. Treasury Bonds | | | |
3.63% | | 08/15/43 | | $ | 786,700 | | | $ | 742,940 | | | |
4.50% | | 02/15/36 | | | 2,164,000 | | | | 2,407,787 | | | (a) |
U.S. Treasury Notes | | | |
0.25% | | 10/31/15 | | | 603,800 | | | | 602,951 | | | |
1.25% | | 10/31/18 | | | 214,900 | | | | 210,686 | | | |
2.50% | | 08/15/23 | | | 367,600 | | | | 353,011 | | | |
| | | | | | | | | 4,317,375 | | | |
| |
Agency Mortgage Backed — 30.1% | | | |
| |
Federal Home Loan Mortgage Corp. | | | |
2.38% | | 01/13/22 | | | 142,000 | | | | 135,747 | | | (a) |
4.50% | | 06/01/33 - 02/01/35 | | | 13,171 | | | | 13,970 | | | (a) |
5.00% | | 07/01/35 - 06/01/41 | | | 303,514 | | | | 333,159 | | | (a) |
5.50% | | 05/01/20 - 01/01/38 | | | 133,678 | | | | 146,864 | | | (a) |
6.00% | | 04/01/17 - 11/01/37 | | | 307,867 | | | | 344,029 | | | (a) |
6.00% | | 07/01/19 | | | 3,168 | | | | 3,367 | | | |
6.50% | | 02/01/29 | | | 166 | | | | 188 | | | (a) |
7.00% | | 10/01/16 - 08/01/36 | | | 52,562 | | | | 59,205 | | | (a) |
7.50% | | 01/01/30 - 09/01/33 | | | 5,512 | | | | 6,184 | | | (a) |
8.00% | | 11/01/30 | | | 13,171 | | | | 15,078 | | | (a) |
8.25% | | 06/01/26 | | | 60,000 | | | | 78,598 | | | (a,b) |
8.50% | | 04/01/30 | | | 8,442 | | | | 10,060 | | | (a) |
Federal National Mortgage Assoc. | | | |
2.35% | | 04/01/37 | | | 1,106 | | | | 1,154 | | | (c) |
3.00% | | 05/01/43 - 06/01/43 | | | 1,058,794 | | | | 1,006,472 | | | (a) |
3.50% | | 11/01/42 | | | 86,443 | | | | 85,959 | | | |
3.50% | | 02/01/43 | | | 312,906 | | | | 311,640 | | | (a) |
4.00% | | 05/01/19 - 03/01/41 | | | 420,912 | | | | 434,776 | | | (a) |
4.50% | | 05/01/18 - 04/01/41 | | | 1,323,683 | | | | 1,403,380 | | | (a) |
4.50% | | 10/01/39 | | | 5,909 | | | | 6,260 | | | |
5.00% | | 03/01/34 - 06/01/41 | | | 456,668 | | | | 500,714 | | | (a) |
5.50% | | 02/01/14 - 01/01/39 | | | 559,580 | | | | 616,341 | | | (a) |
5.50% | | 05/01/37 | | | 17,801 | | | | 19,627 | | | |
6.00% | | 06/01/14 - 07/01/35 | | | 623,235 | | | | 698,729 | | | (a) |
6.50% | | 07/01/17 - 08/01/34 | | | 89,338 | | | | 98,039 | | | (a) |
7.00% | | 03/01/15 - 02/01/34 | | | 40,449 | | | | 44,950 | | | (a) |
7.50% | | 02/01/15 - 12/01/33 | | | 39,467 | | | | 43,421 | | | (a) |
8.00% | | 12/01/15 - 01/01/33 | | | 21,421 | | | | 24,759 | | | (a) |
9.00% | | 12/01/17 - 12/01/22 | | | 4,035 | | | | 4,434 | | | (a) |
3.50% | | TBA | | | 1,840,000 | | | | 1,827,781 | | | (d) |
5.00% | | TBA | | | 240,000 | | | | 260,644 | | | (d) |
6.00% | | TBA | | | 190,000 | | | | 210,737 | | | (d) |
Government National Mortgage Assoc. | | | |
1.63% | | 02/20/23 - 02/20/26 | | | 8,578 | | | | 8,881 | | | (a,c) |
3.00% | | 06/20/43 | | | 156,700 | | | | 151,670 | | | |
3.50% | | 05/20/43 | | | 101,507 | | | | 102,560 | | | |
4.00% | | 01/20/41 | | | 314,985 | | | | 328,107 | | | (a) |
4.00% | | 04/20/43 | | | 86,074 | | | | 89,625 | | | |
4.50% | | 08/15/33 - 03/20/41 | | | 321,790 | | | | 345,681 | | | (a) |
6.00% | | 04/15/27 - 09/15/36 | | | 188,268 | | | | 212,399 | | | (a) |
6.50% | | 04/15/19 - 08/15/36 | | | 87,265 | | | | 97,630 | | | (a) |
7.00% | | 01/15/28 - 10/15/36 | | | 58,191 | | | | 64,842 | | | (a) |
| | | | | | | | | | | | |
| | | | |
| | | | | Principal
Amount | | | Fair Value | | | |
| | | | | | | | | | | | |
| | | | |
7.50% | | 11/15/31 | | $ | 481 | | | $ | 483 | | | (a) |
8.00% | | 12/15/29 | | | 2,434 | | | | 2,695 | | | (a) |
8.50% | | 10/15/17 | | | 4,126 | | | | 4,361 | | | (a) |
9.00% | | 11/15/16 - 12/15/21 | | | 12,382 | | | | 13,264 | | | (a) |
5.00% | | TBA | | | 265,000 | | | | 287,225 | | | (d) |
| | | | | | | | | 10,455,689 | | | |
| |
Agency Collateralized Mortgage Obligations — 0.7% | | | |
| |
Federal Home Loan Mortgage Corp. | | | |
0.08% | | 09/25/43 | | | 832,984 | | | | 7,643 | | | (a,c,e) |
Federal Home Loan Mortgage Corp.
REMIC | | | |
3.50% | | 09/15/29 - 11/15/30 | | | 194,614 | | | | 23,638 | | | (e) |
4.50% | | 02/15/18 - 03/15/18 | | | 38,008 | | | | 1,451 | | | (a,e) |
5.00% | | 05/15/18 - 10/15/18 | | | 28,972 | | | | 1,044 | | | (a,e) |
5.50% | | 06/15/33 | | | 62,926 | | | | 12,740 | | | (a,e) |
6.43% | | 08/15/25 | | | 101,805 | | | | 13,906 | | | (c,e) |
7.50% | | 07/15/27 | | | 4,512 | | | | 917 | | | (a,e) |
Federal Home Loan Mortgage Corp.
STRIPS | | | |
2.11% | | 08/01/27 | | | 598 | | | | 550 | | | (a,f,g) |
8.00% | | 02/01/23 - 07/01/24 | | | 2,097 | | | | 474 | | | (a,e) |
Federal National Mortgage Assoc.
REMIC | | | |
1.24% | | 12/25/42 | | | 48,925 | | | | 2,137 | | | (a,c,e) |
2.11% | | 12/25/22 | | | 130 | | | | 124 | | | (a,f,g) |
5.00% | | 02/25/32 | | | 10,086 | | | | 171 | | | (a,e) |
5.00% | | 09/25/40 | | | 154,928 | | | | 19,247 | | | (e) |
5.84% | | 07/25/38 | | | 34,878 | | | | 4,934 | | | (c,e) |
7.00% | | 09/25/20 | | | 327 | | | | 358 | | | (a) |
7.34% | | 05/25/18 | | | 115,005 | | | | 12,281 | | | (a,c,e) |
8.00% | | 05/25/22 | | | 3 | | | | 64 | | | (a,e) |
Federal National Mortgage Assoc.
STRIPS | | | |
2.11% | | 12/01/34 | | | 57,389 | | | | 52,308 | | | (a,f,g) |
4.50% | | 08/01/35 - 01/01/36 | | | 74,915 | | | | 12,721 | | | (a,e) |
5.00% | | 03/25/38 - 05/25/38 | | | 45,445 | | | | 8,380 | | | (a,e) |
5.50% | | 12/01/33 | | | 15,310 | | | | 2,907 | | | (a,e) |
6.00% | | 01/01/35 | | | 26,323 | | | | 4,790 | | | (a,e) |
7.50% | | 11/01/23 | | | 12,539 | | | | 2,922 | | | (a,e) |
8.00% | | 08/01/23 - 07/01/24 | | | 4,258 | | | | 812 | | | (a,e) |
8.50% | | 07/25/22 | | | 173 | | | | 31 | | | (a,e) |
9.00% | | 05/25/22 | | | 124 | | | | 26 | | | (a,e) |
Government National Mortgage Assoc. | | | |
4.50% | | 10/20/37 - 08/16/39 | | | 262,132 | | | | 32,668 | | | (e) |
5.00% | | 12/20/35 | | | 47,461 | | | | 2,342 | | | (e) |
5.00% | | 10/20/37 - 09/20/38 | | | 177,677 | | | | 18,223 | | | (a,e) |
6.08% | | 02/20/40 | | | 59,610 | | | | 11,228 | | | (c,e) |
| | | | | | | | | 251,037 | | | |
| |
Asset Backed — 0.2% | | | |
| |
Bear Stearns Asset Backed Securities Trust 2006-HE1 | | | |
0.38% | | 02/25/36 | | | 47,920 | | | | 47,653 | | | (a,c) |
Ford Credit Auto Lease Trust 2013-A | | | |
1.28% | | 06/15/16 | | | 20,000 | | | | 20,010 | | | |
| | | | | | | | | 67,663 | | | |
| |
Corporate Notes — 41.8% | | | |
| |
21st Century Fox America Inc. | | | |
4.00% | | 10/01/23 | | | 18,000 | | | | 17,790 | | | (h) |
See Notes to Schedules of Investments and Notes to Financial Statements.
6
Income Fund
| | |
| Schedule of Investments | | December 31, 2013 |
| | | | | | | | | | | | |
| | | | |
| | | | | Principal
Amount | | | Fair Value | | | |
| | | | | | | | | | | | |
| | | | |
5.40% | | 10/01/43 | | $ | 11,000 | | | $ | 11,138 | | | (h) |
6.65% | | 11/15/37 | | | 30,000 | | | | 35,018 | | | (a) |
ABB Finance USA Inc. | | | |
1.63% | | 05/08/17 | | | 41,000 | | | | 40,918 | | | |
AbbVie Inc. | | | |
1.75% | | 11/06/17 | | | 45,000 | | | | 44,923 | | | |
2.00% | | 11/06/18 | | | 54,000 | | | | 53,417 | | | |
2.90% | | 11/06/22 | | | 28,000 | | | | 26,170 | | | |
AES Corp. | | | |
8.00% | | 10/15/17 | | | 6,000 | | | | 7,050 | | | |
AES Panama S.A. | | | |
6.35% | | 12/21/16 | | | 50,000 | | | | 52,875 | | | (a,h) |
Agilent Technologies Inc. | | | |
5.50% | | 09/14/15 | | | 32,000 | | | | 34,499 | | | (a) |
Agrium Inc. | | | |
3.50% | | 06/01/23 | | | 22,000 | | | | 20,494 | | | |
4.90% | | 06/01/43 | | | 69,000 | | | | 63,894 | | | |
Altria Group Inc. | | | |
2.95% | | 05/02/23 | | | 23,000 | | | | 20,889 | | | |
4.50% | | 05/02/43 | | | 23,000 | | | | 20,322 | | | |
5.38% | | 01/31/44 | | | 32,000 | | | | 32,133 | | | |
Amazon.com Inc. | | | |
1.20% | | 11/29/17 | | | 44,000 | | | | 43,080 | | | |
2.50% | | 11/29/22 | | | 44,000 | | | | 39,663 | | | |
America Movil SAB de C.V. | | | |
2.38% | | 09/08/16 | | | 200,000 | | | | 205,834 | | | |
American Axle & Manufacturing Inc. | | | |
6.25% | | 03/15/21 | | | 33,000 | | | | 35,063 | | | |
7.75% | | 11/15/19 | | | 9,000 | | | | 10,238 | | | |
American Honda Finance Corp. | | | |
2.13% | | 10/10/18 | | | 87,000 | | | | 86,642 | | | |
American International Group Inc. | | | |
3.38% | | 08/15/20 | | | 46,000 | | | | 46,268 | | | |
4.88% | | 06/01/22 | | | 37,000 | | | | 39,768 | | | |
American Seafoods Group LLC | | | |
10.75% | | 05/15/16 | | | 35,000 | | | | 36,225 | | | (h) |
American Tower Corp. (REIT) | | | |
3.40% | | 02/15/19 | | | 46,000 | | | | 46,830 | | | |
3.50% | | 01/31/23 | | | 23,000 | | | | 20,970 | | | |
American Tower Trust I (REIT) | | | |
1.55% | | 03/15/43 | | | 72,000 | | | | 70,271 | | | (h) |
Amsted Industries Inc. | | | |
8.13% | | 03/15/18 | | | 44,000 | | | | 46,365 | | | (a,h) |
Anadarko Petroleum Corp. | | | |
6.20% | | 03/15/40 | | | 51,000 | | | | 56,413 | | | |
Anheuser-Busch InBev Finance Inc. | | | |
2.63% | | 01/17/23 | | | 21,000 | | | | 19,285 | | | |
Anheuser-Busch InBev Worldwide Inc. | | | |
2.50% | | 07/15/22 | | | 120,000 | | | | 110,996 | | | |
5.38% | | 11/15/14 | | | 29,000 | | | | 30,204 | | | (a) |
Archer-Daniels-Midland Co. | | | |
4.02% | | 04/16/43 | | | 35,000 | | | | 29,756 | | | |
Arizona Public Service Co. | | | |
6.25% | | 08/01/16 | | | 122,000 | | | | 136,880 | | | (a) |
Ascension Health | | | |
4.85% | | 11/15/53 | | | 36,000 | | | | 34,841 | | | |
Ashland Inc. | | | |
3.00% | | 03/15/16 | | | 46,000 | | | | 46,920 | | | |
3.88% | | 04/15/18 | | | 44,000 | | | | 44,550 | | | |
| | | | | | | | | | | | |
| | | | |
| | | | | Principal
Amount | | | Fair Value | | | |
| | | | | | | | | | | | |
| |
AT&T Inc. | | | |
0.88% | | 02/13/15 | | $ | 47,000 | | | $ | 47,099 | | | (a) |
2.38% | | 11/27/18 | | | 91,000 | | | | 91,078 | | | |
4.35% | | 06/15/45 | | | 68,000 | | | | 57,568 | | | |
Autodesk Inc. | | | |
1.95% | | 12/15/17 | | | 40,000 | | | | 39,569 | | | |
Banco del Estado de Chile | | | |
2.00% | | 11/09/17 | | | 150,000 | | | | 147,337 | | | |
Bank of America Corp. | | | |
2.00% | | 01/11/18 | | | 56,000 | | | | 55,901 | | | |
2.60% | | 01/15/19 | | | 55,000 | | | | 55,243 | | | |
3.30% | | 01/11/23 | | | 60,000 | | | | 56,776 | | | |
3.88% | | 03/22/17 | | | 47,000 | | | | 50,164 | | | |
4.10% | | 07/24/23 | | | 65,000 | | | | 65,276 | | | |
Barrick Gold Corp. | | | |
4.10% | | 05/01/23 | | | 23,000 | | | | 20,789 | | | |
Berkshire Hathaway Finance Corp. | | | |
2.90% | | 10/15/20 | | | 55,000 | | | | 54,543 | | | |
3.00% | | 05/15/22 | | | 27,000 | | | | 25,884 | | | |
Berkshire Hathaway Inc. | | | |
1.55% | | 02/09/18 | | | 49,000 | | | | 48,448 | | | |
4.50% | | 02/11/43 | | | 63,000 | | | | 58,240 | | | |
BHP Billiton Finance USA Ltd. | | | |
2.05% | | 09/30/18 | | | 23,000 | | | | 22,997 | | | |
3.85% | | 09/30/23 | | | 23,000 | | | | 23,100 | | | |
5.00% | | 09/30/43 | | | 23,000 | | | | 23,385 | | | |
Bombardier Inc. | | | |
4.25% | | 01/15/16 | | | 19,000 | | | | 19,855 | | | (h) |
7.75% | | 03/15/20 | | | 52,000 | | | | 59,020 | | | (a,h) |
BP Capital Markets PLC | | | |
1.38% | | 05/10/18 | | | 69,000 | | | | 66,968 | | | |
2.25% | | 11/01/16 | | | 23,000 | | | | 23,802 | | | (a) |
2.50% | | 11/06/22 | | | 99,000 | | | | 90,138 | | | |
Brocade Communications Systems Inc. | | | |
4.63% | | 01/15/23 | | | 14,000 | | | | 12,950 | | | (h) |
Buckeye Partners LP | | | |
2.65% | | 11/15/18 | | | 46,000 | | | | 45,324 | | | |
Burlington Northern Santa Fe LLC | | | |
3.85% | | 09/01/23 | | | 46,000 | | | | 45,247 | | | |
Cameron International Corp. | | | |
4.00% | | 12/15/23 | | | 23,000 | | | | 22,729 | | | |
Cargill Inc. | | | |
6.00% | | 11/27/17 | | | 63,000 | | | | 71,934 | | | (a,h) |
Case New Holland Inc. | | | |
7.88% | | 12/01/17 | | | 31,000 | | | | 36,580 | | | (a) |
Catholic Health Initiatives | | | |
2.60% | | 08/01/18 | | | 15,000 | | | | 15,049 | | | |
2.95% | | 11/01/22 | | | 25,000 | | | | 22,721 | | | |
4.20% | | 08/01/23 | | | 10,000 | | | | 9,805 | | | |
4.35% | | 11/01/42 | | | 16,000 | | | | 13,880 | | | |
Celgene Corp. | | | |
2.30% | | 08/15/18 | | | 23,000 | | | | 22,874 | | | |
Central American Bank for Economic Integration | | | |
5.38% | | 09/24/14 | | | 70,000 | | | | 72,116 | | | (a,h) |
Cequel Capital Corp. | | | |
5.13% | | 12/15/21 | | | 44,000 | | | | 41,250 | | | (h) |
Chesapeake Energy Corp. | | | |
3.25% | | 03/15/16 | | | 45,000 | | | | 45,450 | | | |
See Notes to Schedules of Investments and Notes to Financial Statements.
7
Income Fund
| | |
| Schedule of Investments | | December 31, 2013 |
| | | | | | | | | | | | |
| | | | |
| | | | | Principal
Amount | | | Fair Value | | | |
| | | | | | | | | | | | |
| |
Cigna Corp. | | | |
2.75% | | 11/15/16 | | $ | 47,000 | | | $ | 48,919 | | | (a) |
4.00% | | 02/15/22 | | | 64,000 | | | | 65,144 | | | |
Citigroup Inc. | | | |
1.25% | | 01/15/16 | | | 47,000 | | | | 47,156 | | | |
1.75% | | 05/01/18 | | | 47,000 | | | | 46,215 | | | |
3.50% | | 05/15/23 | | | 56,000 | | | | 52,180 | | | |
5.00% | | 09/15/14 | | | 84,000 | | | | 86,393 | | | (a) |
6.68% | | 09/13/43 | | | 47,000 | | | | 54,080 | | | |
CNA Financial Corp. | | | |
5.88% | | 08/15/20 | | | 38,000 | | | | 43,321 | | | (a) |
CNH Capital LLC | | | |
3.25% | | 02/01/17 | | | 25,000 | | | | 25,438 | | | (h) |
3.88% | | 11/01/15 | | | 28,000 | | | | 28,910 | | | |
Cogeco Cable Inc. | | | |
4.88% | | 05/01/20 | | | 45,000 | | | | 43,425 | | | (h) |
Comcast Corp. | | | |
4.50% | | 01/15/43 | | | 30,000 | | | | 27,100 | | | |
Constellation Brands Inc. | | | |
7.25% | | 09/01/16 | | | 45,000 | | | | 51,075 | | | |
Corning Inc. | | | |
3.70% | | 11/15/23 | | | 32,000 | | | | 31,516 | | | |
Corp Andina de Fomento | | | |
4.38% | | 06/15/22 | | | 46,000 | | | | 45,548 | | | |
Corp Lindley S.A. | | | |
4.63% | | 04/12/23 | | | 4,000 | | | | 3,690 | | | (h) |
Corp Nacional del Cobre de Chile | | | |
4.25% | | 07/17/42 | | | 29,000 | | | | 23,192 | | | (h) |
5.63% | | 09/21/35 | | | 14,000 | | | | 13,843 | | | (a,h) |
Corporate Office Properties LP (REIT) | | | |
3.60% | | 05/15/23 | | | 98,000 | | | | 88,822 | | | |
COX Communications Inc. | | | |
2.95% | | 06/30/23 | | | 63,000 | | | | 55,052 | | | (h) |
3.25% | | 12/15/22 | | | 16,000 | | | | 14,478 | | | (h) |
4.70% | | 12/15/42 | | | 11,000 | | | | 9,238 | | | (h) |
Crown Castle Towers LLC | | | |
6.11% | | 01/15/40 | | | 66,000 | | | | 74,008 | | | (a,h) |
CVS Caremark Corp. | | | |
2.25% | | 12/05/18 | | | 32,000 | | | | 31,991 | | | |
5.30% | | 12/05/43 | | | 23,000 | | | | 23,786 | | | |
DaVita Healthcare Partners Inc. | | | |
6.38% | | 11/01/18 | | | 51,000 | | | | 53,550 | | | (a) |
Denbury Resources Inc. | | | |
6.38% | | 08/15/21 | | | 45,000 | | | | 47,925 | | | (a) |
8.25% | | 02/15/20 | | | 40,000 | | | | 44,050 | | | (a) |
Diageo Capital PLC | | | |
1.13% | | 04/29/18 | | | 47,000 | | | | 45,312 | | | |
Diageo Investment Corp. | | | |
2.88% | | 05/11/22 | | | 76,000 | | | | 72,445 | | | |
Diamond Offshore Drilling Inc. | | | |
4.88% | | 11/01/43 | | | 41,000 | | | | 40,239 | | | |
DigitalGlobe Inc. | | | |
5.25% | | 02/01/21 | | | 47,000 | | | | 45,825 | | | (h) |
DIRECTV Holdings LLC | | | |
3.80% | | 03/15/22 | | | 58,000 | | | | 55,717 | | | |
5.15% | | 03/15/42 | | | 34,000 | | | | 30,535 | | | |
Dominion Resources Inc. | | | |
1.95% | | 08/15/16 | | | 40,000 | | | | 40,662 | | | (a) |
| | | | | | | | | | | | |
| | | | |
| | | | | Principal
Amount | | | Fair Value | | | |
| | | | | | | | | | | | |
| |
DPL Inc. | | | |
7.25% | | 10/15/21 | | $ | 55,000 | | | $ | 55,687 | | | |
Duke Energy Corp. | | | |
1.63% | | 08/15/17 | | | 47,000 | | | | 46,703 | | | |
3.05% | | 08/15/22 | | | 21,000 | | | | 19,947 | | | |
Eastman Chemical Co. | | | |
2.40% | | 06/01/17 | | | 61,000 | | | | 61,654 | | | |
Eaton Corp. | | | |
1.50% | | 11/02/17 | | | 67,000 | | | | 65,682 | | | |
2.75% | | 11/02/22 | | | 50,000 | | | | 46,643 | | | |
eBay Inc. | | | |
2.60% | | 07/15/22 | | | 25,000 | | | | 22,993 | | | |
4.00% | | 07/15/42 | | | 29,000 | | | | 24,559 | | | |
Ecopetrol S.A. | | | |
7.38% | | 09/18/43 | | | 18,000 | | | | 19,512 | | | |
7.63% | | 07/23/19 | | | 10,000 | | | | 11,850 | | | |
EMC Corp. | | | |
1.88% | | 06/01/18 | | | 46,000 | | | | 45,477 | | | |
Energy Transfer Partners LP |
3.60% | | 02/01/23 | | | 40,000 | | | | 37,042 | | | |
6.50% | | 02/01/42 | | | 42,000 | | | | 45,140 | | | |
Enterprise Products Operating LLC |
4.45% | | 02/15/43 | | | 29,000 | | | | 25,616 | | | |
Erickson Air-Crane Inc. |
8.25% | | 05/01/20 | | | 18,000 | | | | 18,630 | | | (h) |
European Investment Bank |
0.88% | | 12/15/14 | | | 100,000 | | | | 100,578 | | | (a) |
4.88% | | 01/17/17 | | | 75,000 | | | | 83,685 | | | (a) |
Exelon Corp. |
4.90% | | 06/15/15 | | | 70,000 | | | | 73,801 | | | (a) |
Express Scripts Holding Co. |
2.65% | | 02/15/17 | | | 15,000 | | | | 15,460 | | | |
3.13% | | 05/15/16 | | | 46,000 | | | | 48,011 | | | (a) |
Five Corners Funding Trust |
4.42% | | 11/15/23 | | | 100,000 | | | | 98,572 | | | (h) |
Flextronics International Ltd. |
4.63% | | 02/15/20 | | | 19,000 | | | | 18,525 | | | |
Florida Power & Light Co. |
4.13% | | 02/01/42 | | | 31,000 | | | | 28,531 | | | (a) |
FMG Resources August 2006 Pty Ltd. |
7.00% | | 11/01/15 | | | 9,000 | | | | 9,338 | | | (h) |
Forest Oil Corp. |
7.25% | | 06/15/19 | | | 27,000 | | | | 26,291 | | | |
Freeport-McMoRan Copper & Gold Inc. |
2.38% | | 03/15/18 | | | 46,000 | | | | 45,888 | | | |
5.45% | | 03/15/43 | | | 41,000 | | | | 39,238 | | | |
Fresenius Medical Care US Finance Inc. |
5.75% | | 02/15/21 | | | 30,000 | | | | 31,800 | | | (a,h) |
Frontier Communications Corp. |
7.13% | | 03/15/19 | | | 52,000 | | | | 56,030 | | | (a) |
Genworth Holdings Inc. |
7.70% | | 06/15/20 | | | 22,000 | | | | 26,193 | | | |
Glencore Funding LLC |
2.50% | | 01/15/19 | | | 67,000 | | | | 64,877 | | | (h) |
4.13% | | 05/30/23 | | | 65,000 | | | | 60,743 | | | (h) |
Goldman Sachs Capital I |
6.35% | | 02/15/34 | | | 33,000 | | | | 33,297 | | | (a) |
Great Plains Energy Inc. |
4.85% | | 06/01/21 | | | 60,000 | | | | 63,218 | | | (a) |
See Notes to Schedules of Investments and Notes to Financial Statements.
8
Income Fund
| | |
| Schedule of Investments | | December 31, 2013 |
| | | | | | | | | | | | |
| | | | |
| | | | | Principal
Amount | | | Fair Value | | | |
| | | | | | | | | | | | |
|
GXS Worldwide Inc. |
9.75% | | 06/15/15 | | $ | 32,000 | | | $ | 33,040 | | | |
HCA Inc. |
6.50% | | 02/15/20 | | | 36,000 | | | | 39,555 | | | (a) |
Hexion US Finance Corp. |
6.63% | | 04/15/20 | | | 24,000 | | | | 24,600 | | | |
Hilton Worldwide Finance LLC |
5.63% | | 10/15/21 | | | 44,000 | | | | 45,650 | | | (h) |
Host Hotels & Resorts LP (REIT) |
3.75% | | 10/15/23 | | | 59,000 | | | | 54,704 | | | |
Hughes Satellite Systems Corp. |
6.50% | | 06/15/19 | | | 28,000 | | | | 30,310 | | | (a) |
Huntsman International LLC |
4.88% | | 11/15/20 | | | 46,000 | | | | 45,310 | | | |
Hyundai Capital America |
1.63% | | 10/02/15 | | | 46,000 | | | | 46,230 | | | (h) |
2.13% | | 10/02/17 | | | 23,000 | | | | 22,843 | | | (h) |
iGATE Corp. |
9.00% | | 05/01/16 | | | 46,000 | | | | 48,875 | | | |
Industry & Construction Bank St Petersburg OJSC Via |
5.01% | | 09/29/15 | | | 100,000 | | | | 102,250 | | | (c) |
ING U.S. Inc. |
5.70% | | 07/15/43 | | | 42,000 | | | | 43,881 | | | |
Ingersoll-Rand Global Holding Company Ltd. |
2.88% | | 01/15/19 | | | 24,000 | | | | 23,655 | | | (h) |
4.25% | | 06/15/23 | | | 23,000 | | | | 22,464 | | | (h) |
Ingles Markets Inc. |
5.75% | | 06/15/23 | | | 78,000 | | | | 76,440 | | | |
IntercontinentalExchange Group Inc. |
2.50% | | 10/15/18 | | | 23,000 | | | | 23,169 | | | |
4.00% | | 10/15/23 | | | 46,000 | | | | 46,273 | | | |
Invesco Finance PLC |
3.13% | | 11/30/22 | | | 67,000 | | | | 61,995 | | | |
JB Poindexter & Company Inc. |
9.00% | | 04/01/22 | | | 13,000 | | | | 13,878 | | | (h) |
Jefferies Group Inc. |
5.13% | | 01/20/23 | | | 15,000 | | | | 15,172 | | | |
6.50% | | 01/20/43 | | | 16,000 | | | | 15,865 | | | |
JPMorgan Chase & Co. |
3.20% | | 01/25/23 | | | 98,000 | | | | 92,907 | | | |
3.38% | | 05/01/23 | | | 23,000 | | | | 21,436 | | | |
Kerr-McGee Corp. |
6.95% | | 07/01/24 | | | 46,000 | | | | 53,436 | | | |
KFW |
2.00% | | 10/04/22 | | | 115,000 | | | | 105,321 | | | |
4.50% | | 07/16/18 | | | 85,000 | | | | 95,183 | | | (a) |
Kinder Morgan Energy Partners LP |
2.65% | | 02/01/19 | | | 23,000 | | | | 22,745 | | | |
3.50% | | 09/01/23 | | | 57,000 | | | | 52,336 | | | |
4.15% | | 02/01/24 | | | 79,000 | | | | 76,430 | | | |
Kinross Gold Corp. |
6.88% | | 09/01/41 | | | 33,000 | | | | 29,571 | | | |
Korea National Oil Corp. |
2.88% | | 11/09/15 | | | 100,000 | | | | 102,992 | | | (a,h) |
Kraft Foods Group Inc. |
1.63% | | 06/04/15 | | | 25,000 | | | | 25,318 | | | |
2.25% | | 06/05/17 | | | 53,000 | | | | 53,666 | | | |
5.00% | | 06/04/42 | | | 45,000 | | | | 44,361 | | | |
| | | | | | | | | | | | |
| | | | |
| | | | | Principal
Amount | | | Fair Value | | | |
| | | | | | | | | | | | |
|
Kratos Defense & Security Solutions Inc. |
10.00% | | 06/01/17 | | $ | 40,000 | | | $ | 43,150 | | | |
Liberty Mutual Group Inc. |
4.25% | | 06/15/23 | | | 48,000 | | | | 46,345 | | | (h) |
Linn Energy LLC |
7.00% | | 11/01/19 | | | 49,000 | | | | 49,490 | | | (h) |
8.63% | | 04/15/20 | | | 42,000 | | | | 45,360 | | | (a) |
Lowe’s Companies Inc. |
5.00% | | 09/15/43 | | | 23,000 | | | | 23,516 | | | |
LYB International Finance BV |
4.00% | | 07/15/23 | | | 23,000 | | | | 22,702 | | | |
5.25% | | 07/15/43 | | | 12,000 | | | | 12,063 | | | |
Macquarie Group Ltd. |
3.00% | | 12/03/18 | | | 34,000 | | | | 33,863 | | | (h) |
Majapahit Holding BV |
7.25% | | 06/28/17 | | | 100,000 | | | | 109,500 | | | (h) |
Memorial Sloan-Kettering Cancer Center |
4.13% | | 07/01/52 | | | 20,000 | | | | 16,453 | | | |
Merck & Company Inc. |
2.80% | | 05/18/23 | | | 69,000 | | | | 63,879 | | | |
4.15% | | 05/18/43 | | | 27,000 | | | | 24,667 | | | |
MetLife Inc. |
4.88% | | 11/13/43 | | | 35,000 | | | | 34,350 | | | |
Microsoft Corp. |
2.38% | | 05/01/23 | | | 94,000 | | | | 85,042 | | | |
MidAmerican Energy Holdings Co. |
6.13% | | 04/01/36 | | | 115,000 | | | | 130,647 | | | (a) |
Monsanto Co. |
4.65% | | 11/15/43 | | | 23,000 | | | | 22,437 | | | |
Morgan Stanley |
2.13% | | 04/25/18 | | | 45,000 | | | | 44,612 | | | |
4.75% | | 03/22/17 | | | 32,000 | | | | 34,922 | | | |
4.88% | | 11/01/22 | | | 49,000 | | | | 50,159 | | | |
5.00% | | 11/24/25 | | | 46,000 | | | | 46,138 | | | |
5.55% | | 04/27/17 | | | 100,000 | | | | 111,552 | | | |
Mylan Inc. |
5.40% | | 11/29/43 | | | 15,000 | | | | 15,121 | | | |
7.88% | | 07/15/20 | | | 70,000 | | | | 79,208 | | | (a,h) |
National Agricultural Cooperative Federation |
4.25% | | 01/28/16 | | | 100,000 | | | | 105,364 | | | (a,h) |
Nationwide Financial Services Inc. |
5.38% | | 03/25/21 | | | 26,000 | | | | 27,876 | | | (h) |
NCL Corp. Ltd. |
5.00% | | 02/15/18 | | | 26,000 | | | | 26,780 | | | |
Newfield Exploration Co. |
5.63% | | 07/01/24 | | | 10,000 | | | | 9,950 | | | |
5.75% | | 01/30/22 | | | 51,000 | | | | 52,530 | | | (a) |
Nexen Energy ULC |
6.40% | | 05/15/37 | | | 31,000 | | | | 35,288 | | | |
NextEra Energy Capital Holdings Inc. |
2.60% | | 09/01/15 | | | 78,000 | | | | 80,071 | | | (a) |
Northeast Utilities |
1.45% | | 05/01/18 | | | 46,000 | | | | 44,553 | | | |
Northrop Grumman Corp. |
1.75% | | 06/01/18 | | | 44,000 | | | | 42,925 | | | |
4.75% | | 06/01/43 | | | 23,000 | | | | 21,797 | | | |
Novartis Capital Corp. |
2.40% | | 09/21/22 | | | 55,000 | | | | 50,426 | | | |
See Notes to Schedules of Investments and Notes to Financial Statements.
9
Income Fund
| | |
| Schedule of Investments | | December 31, 2013 |
| | | | | | | | | | | | |
| | | | |
| | | | | Principal
Amount | | | Fair Value | | | |
| | | | | | | | | | | | |
|
NYSE Euronext |
2.00% | | 10/05/17 | | $ | 69,000 | | | $ | 69,090 | | | |
Omnicom Group Inc. |
3.63% | | 05/01/22 | | | 44,000 | | | | 42,609 | | | |
Oracle Corp. |
1.20% | | 10/15/17 | | | 75,000 | | | | 73,804 | | | |
3.63% | | 07/15/23 | | | 33,000 | | | | 32,735 | | | |
Pacific Gas & Electric Co. |
6.05% | | 03/01/34 | | | 24,000 | | | | 27,492 | | | (a) |
PacifiCorp |
6.25% | | 10/15/37 | | | 12,000 | | | | 14,307 | | | |
Petrobras Global Finance BV |
3.00% | | 01/15/19 | | | 23,000 | | | | 21,524 | | | |
Petrobras International Finance Co. |
3.50% | | 02/06/17 | | | 76,000 | | | | 76,695 | | | (a) |
3.88% | | 01/27/16 | | | 25,000 | | | | 25,737 | | | (a) |
Petroleos Mexicanos |
3.50% | | 07/18/18 - 01/30/23 | | | 111,000 | | | | 107,203 | | | |
5.50% | | 01/21/21 | | | 18,000 | | | | 19,350 | | | |
Philip Morris International Inc. |
2.50% | | 05/16/16 | | | 60,000 | | | | 62,268 | | | (a) |
4.13% | | 03/04/43 | | | 24,000 | | | | 21,010 | | | |
Plains Exploration & Production Co. |
6.50% | | 11/15/20 | | | 25,000 | | | | 27,610 | | | |
Power Sector Assets & Liabilities Management Corp. |
7.39% | | 12/02/24 | | | 100,000 | | | | 122,000 | | | (a,h) |
Prudential Financial Inc. |
5.20% | | 03/15/44 | | | 4,000 | | | | 3,870 | | | (c) |
5.63% | | 06/15/43 | | | 16,000 | | | | 15,680 | | | (c) |
Public Service Electric & Gas Co. |
2.38% | | 05/15/23 | | | 69,000 | | | | 62,043 | | | |
Range Resources Corp. |
5.75% | | 06/01/21 | | | 51,000 | | | | 54,060 | | | (a) |
Realty Income Corp. (REIT) |
4.65% | | 08/01/23 | | | 47,000 | | | | 47,334 | | | |
Revlon Consumer Products Corp. |
5.75% | | 02/15/21 | | | 50,000 | | | | 49,312 | | | |
Rockwell Collins Inc. |
3.70% | | 12/15/23 | | | 37,000 | | | | 36,527 | | | |
Roper Industries Inc. |
2.05% | | 10/01/18 | | | 69,000 | | | | 67,056 | | | |
Royal Bank of Canada |
1.20% | | 09/19/18 | | | 81,000 | | | | 80,257 | | | |
RSI Home Products Inc. |
6.88% | | 03/01/18 | | | 46,000 | | | | 48,185 | | | (h) |
Russian Agricultural Bank OJSC Via RSHB Capital S.A. |
7.75% | | 05/29/18 | | | 100,000 | | | | 112,625 | | | (h) |
SCF Capital Ltd. |
5.38% | | 10/27/17 | | | 200,000 | | | | 201,040 | | | (h) |
Schlumberger Investment S.A. |
2.40% | | 08/01/22 | | | 70,000 | | | | 64,157 | | | (h) |
Shell International Finance BV |
3.40% | | 08/12/23 | | | 69,000 | | | | 67,251 | | | |
Sinochem Overseas Capital Company Ltd. |
4.50% | | 11/12/20 | | | 100,000 | | | | 102,032 | | | (h) |
Sprint Corp. |
7.25% | | 09/15/21 | | | 25,000 | | | | 26,844 | | | (h) |
| | | | | | | | | | | | |
| | | | |
| | | | | Principal
Amount | | | Fair Value | | | |
| | | | | | | | | | | | |
|
Statoil ASA |
3.70% | | 03/01/24 | | $ | 69,000 | | | $ | 68,505 | | | |
4.80% | | 11/08/43 | | | 23,000 | | | | 23,237 | | | |
SunTrust Banks Inc. |
2.35% | | 11/01/18 | | | 46,000 | | | | 45,756 | | | |
T-Mobile USA Inc. |
5.25% | | 09/01/18 | | | 30,000 | | | | 31,575 | | | (h) |
Talisman Energy Inc. |
6.25% | | 02/01/38 | | | 36,000 | | | | 36,607 | | | |
Teck Resources Ltd. |
5.40% | | 02/01/43 | | | 35,000 | | | | 31,925 | | | |
Telefonica Emisiones SAU |
3.19% | | 04/27/18 | | | 150,000 | | | | 152,763 | | | |
5.46% | | 02/16/21 | | | 23,000 | | | | 24,268 | | | |
Tenet Healthcare Corp. |
4.75% | | 06/01/20 | | | 17,000 | | | | 16,618 | | | |
Textron Inc. |
6.20% | | 03/15/15 | | | 40,000 | | | | 42,433 | | | (a) |
The Allstate Corp. |
5.75% | | 08/15/53 | | | 25,000 | | | | 25,188 | | | (c) |
The Coca-Cola Co. |
3.30% | | 09/01/21 | | | 63,000 | | | | 63,101 | | | (a) |
The Goldman Sachs Group Inc. |
2.38% | | 01/22/18 | | | 58,000 | | | | 58,220 | | | |
2.90% | | 07/19/18 | | | 70,000 | | | | 71,237 | | | |
3.63% | | 01/22/23 | | | 45,000 | | | | 43,576 | | | |
6.75% | | 10/01/37 | | | 49,000 | | | | 54,515 | | | |
The Home Depot Inc. |
2.25% | | 09/10/18 | | | 69,000 | | | | 69,949 | | | |
3.75% | | 02/15/24 | | | 23,000 | | | | 22,893 | | | |
4.88% | | 02/15/44 | | | 23,000 | | | | 23,289 | | | |
The Korea Development Bank |
3.25% | | 03/09/16 | | | 100,000 | | | | 103,867 | | | (a) |
The McClatchy Co. |
9.00% | | 12/15/22 | | | 28,000 | | | | 30,800 | | | |
The Mosaic Co. |
4.25% | | 11/15/23 | | | 46,000 | | | | 45,429 | | | |
5.45% | | 11/15/33 | | | 23,000 | | | | 23,434 | | | |
The Potomac Edison Co. |
5.35% | | 11/15/14 | | | 95,000 | | | | 98,667 | | | (a) |
The Southern Co. |
2.45% | | 09/01/18 | | | 55,000 | | | | 55,835 | | | |
Thermo Fisher Scientific Inc. |
2.40% | | 02/01/19 | | | 32,000 | | | | 31,702 | | | |
4.15% | | 02/01/24 | | | 51,000 | | | | 50,515 | | | |
Thomson Reuters Corp. |
1.30% | | 02/23/17 | | | 23,000 | | | | 22,899 | | | |
5.65% | | 11/23/43 | | | 19,000 | | | | 19,345 | | | |
Time Warner Cable Inc. |
5.88% | | 11/15/40 | | | 30,000 | | | | 25,951 | | | |
Time Warner Inc. |
5.35% | | 12/15/43 | | | 56,000 | | | | 56,713 | | | |
Tops Holding Corp. |
8.88% | | 12/15/17 | | | 45,000 | | | | 49,444 | | | (h) |
Total Capital Canada Ltd. |
1.45% | | 01/15/18 | | | 47,000 | | | | 46,465 | | | |
Total Capital International S.A. |
1.55% | | 06/28/17 | | | 125,000 | | | | 125,027 | | | |
See Notes to Schedules of Investments and Notes to Financial Statements.
10
Income Fund
| | |
| Schedule of Investments | | December 31, 2013 |
| | | | | | | | | | | | |
| | | | |
| | | | | Principal
Amount | | | Fair Value | | | |
| | | | | | | | | | | | |
|
Transocean Inc. |
3.80% | | 10/15/22 | | $ | 19,000 | | | $ | 18,009 | | | |
tw telecom holdings inc. |
6.38% | | 09/01/23 | | | 17,000 | | | | 17,680 | | | (h) |
U.S. Bancorp |
3.44% | | 02/01/16 | | | 76,000 | | | | 79,275 | | | |
Unit Corp. |
6.63% | | 05/15/21 | | | 47,000 | | | | 49,585 | | | |
United Rentals North America Inc. |
5.75% | | 07/15/18 | | | 46,000 | | | | 49,162 | | | |
Vail Resorts Inc. |
6.50% | | 05/01/19 | | | 61,000 | | | | 64,660 | | | (a) |
Valeant Pharmaceuticals International |
6.38% | | 10/15/20 | | | 27,000 | | | | 28,451 | | | (h) |
Verizon Communications Inc. |
2.45% | | 11/01/22 | | | 46,000 | | | | 40,721 | | | |
4.50% | | 09/15/20 | | | 68,000 | | | | 72,798 | | | |
5.15% | | 09/15/23 | | | 57,000 | | | | 61,200 | | | |
6.55% | | 09/15/43 | | | 32,000 | | | | 37,439 | | | |
Viacom Inc. |
2.50% | | 12/15/16 | | | 53,000 | | | | 54,812 | | | (a) |
5.85% | | 09/01/43 | | | 33,000 | | | | 34,690 | | | |
Viasystems Inc. |
7.88% | | 05/01/19 | | | 47,000 | | | | 50,819 | | | (h) |
Wal-Mart Stores Inc. |
1.95% | | 12/15/18 | | | 46,000 | | | | 45,834 | | | |
Weatherford International Ltd. |
4.50% | | 04/15/22 | | | 50,000 | | | | 50,315 | | | (a) |
5.95% | | 04/15/42 | | | 42,000 | | | | 42,081 | | | (a) |
6.75% | | 09/15/40 | | | 12,000 | | | | 12,979 | | | |
Weingarten Realty Investors |
4.45% | | 01/15/24 | | | 32,000 | | | | 31,343 | | | |
WellPoint Inc. |
5.10% | | 01/15/44 | | | 46,000 | | | | 45,616 | | | |
Wells Fargo & Co. |
3.45% | | 02/13/23 | | | 64,000 | | | | 60,508 | | | |
5.38% | | 11/02/43 | | | 59,000 | | | | 60,416 | | | |
Windstream Corp. |
6.38% | | 08/01/23 | | | 47,000 | | | | 43,945 | | | |
WM Wrigley Jr Co. |
2.00% | | 10/20/17 | | | 23,000 | | | | 22,936 | | | (h) |
2.90% | | 10/21/19 | | | 46,000 | | | | 45,620 | | | (h) |
Woodside Finance Ltd. |
4.50% | | 11/10/14 | | | 95,000 | | | | 97,939 | | | (a,h) |
WPX Energy Inc. |
5.25% | | 01/15/17 | | | 46,000 | | | | 49,105 | | | |
Wynn Las Vegas LLC |
5.38% | | 03/15/22 | | | 24,000 | | | | 24,240 | | | |
XLIT Ltd. |
2.30% | | 12/15/18 | | | 46,000 | | | | 45,181 | | | |
5.25% | | 12/15/43 | | | 22,000 | | | | 22,147 | | | |
Xstrata Finance Canada Ltd. |
2.70% | | 10/25/17 | | | 45,000 | | | | 45,511 | | | (h) |
Zoetis Inc. |
3.25% | | 02/01/23 | | | 40,000 | | | | 37,427 | | | |
| | | | | | | | | 14,552,168 | | | |
| | | | | | | | | | | | |
| | | | |
| | | | | Principal
Amount | | | Fair Value | | | |
| | | | | | | | | | | | |
|
Non-Agency Collateralized Mortgage Obligations — 7.3% |
|
Banc of America Commercial Mortgage Trust 2006-4 |
5.68% | | 07/10/46 | | $ | 20,000 | | | $ | 21,809 | | | |
Banc of America Commercial Mortgage Trust 2007-1 |
5.48% | | 01/15/49 | | | 100,000 | | | | 104,411 | | | (c) |
Banc of America Commercial Mortgage Trust 2007-4 |
5.75% | | 02/10/51 | | | 30,000 | | | | 33,132 | | | (a,c) |
Banc of America Commercial Mortgage Trust 2008-1 |
6.21% | | 02/10/51 | | | 30,000 | | | | 34,217 | | | (a,c) |
Banc of America Merrill Lynch Commercial Mortgage Inc. 2005-1 |
5.29% | | 11/10/42 | | | 40,000 | | | | 41,960 | | | (c) |
Banc of America Merrill Lynch Commercial Mortgage Inc. 2005-6 |
5.18% | | 09/10/47 | | | 55,000 | | | | 58,549 | | | (a,c) |
Bear Stearns Commercial Mortgage Securities Trust 2005-T18 |
4.93% | | 02/13/42 | | | 56,873 | | | | 58,915 | | | (a,c) |
Bear Stearns Commercial Mortgage Securities Trust 2006-T22 |
5.58% | | 04/12/38 | | | 60,000 | | | | 65,011 | | | (a,c) |
5.58% | | 04/12/38 | | | 25,000 | | | | 26,917 | | | (c) |
Bear Stearns Commercial Mortgage Securities Trust 2007-PW17 |
5.89% | | 06/11/50 | | | 60,000 | | | | 67,595 | | | (c) |
Bear Stearns Commercial Mortgage Securities Trust 2007-PW18 |
6.09% | | 06/11/50 | | | 50,000 | | | | 56,286 | | | (c) |
COMM 2005-LP5 Mortgage Trust |
4.98% | | 05/10/43 | | | 30,000 | | | | 31,266 | | | (a,c) |
COMM 2006-C8 Mortgage Trust |
5.35% | | 12/10/46 | | | 60,000 | | | | 65,542 | | | |
Commercial Mortgage Trust 2007-GG9 |
5.48% | | 03/10/39 | | | 125,000 | | | | 132,338 | | | |
Credit Suisse Commercial Mortgage Trust 2006-C1 |
5.46% | | 02/15/39 | | | 75,000 | | | | 79,662 | | | (c) |
Credit Suisse Commercial Mortgage Trust 2006-C5 |
5.34% | | 12/15/39 | | | 30,000 | | | | 32,030 | | | |
Credit Suisse First Boston Mortgage Securities Corp. 2005-9 |
5.25% | | 10/25/35 | | | 40,773 | | | | 364 | | | (c) |
GS Mortgage Securities Corp. II 2013-KYO |
2.77% | | 11/08/29 | | | 30,000 | | | | 29,815 | | | (c,h) |
GS Mortgage Securities Trust 2006-GG8 |
5.59% | | 11/10/39 | | | 90,000 | | | | 98,647 | | | |
GS Mortgage Securities Trust 2011-GC5 |
3.00% | | 08/10/44 | | | 60,000 | | | | 62,405 | | | (a) |
5.31% | | 08/10/44 | | | 20,000 | | | | 21,719 | | | (c,h) |
JP Morgan Chase Commercial Mortgage Securities Trust 2005-CB11 |
5.34% | | 08/12/37 | | | 79,073 | | | | 82,220 | | | (a,c) |
JP Morgan Chase Commercial Mortgage Securities Trust 2005-LDP1 |
5.04% | | 03/15/46 | | | 30,000 | | | | 30,942 | | | (a,c) |
JP Morgan Chase Commercial Mortgage Securities Trust 2007-CB18 |
5.44% | | 06/12/47 | | | 120,000 | | | | 131,877 | | | (a) |
JP Morgan Chase Commercial Mortgage Securities Trust 2007-CB20 |
5.79% | | 02/12/51 | | | 50,000 | | | | 56,050 | | | (a,c) |
JP Morgan Chase Commercial Mortgage Securities Trust 2007-LD11 |
5.81% | | 06/15/49 | | | 90,000 | | | | 100,109 | | | (c) |
JP Morgan Chase Commercial Mortgage Securities Trust 2012-CBX |
4.27% | | 06/15/45 | | | 30,000 | | | | 30,818 | | | |
JPMBB Commercial Mortgage Securities Trust 2013-C12 |
4.03% | | 07/15/45 | | | 15,000 | | | | 15,014 | | | (c) |
LB Commercial Mortgage Trust 2007-C3 |
5.88% | | 07/15/44 | | | 50,000 | | | | 55,505 | | | (c) |
See Notes to Schedules of Investments and Notes to Financial Statements.
11
Income Fund
| | |
| Schedule of Investments | | December 31, 2013 |
| | | | | | | | | | | | |
| | | | |
| | | | | Principal
Amount | | | Fair Value | | | |
| | | | | | | | | | | | |
|
LB-UBS Commercial Mortgage Trust 2006-C1 |
5.16% | | 02/15/31 | | $ | 70,000 | | | $ | 74,763 | | | (a) |
LB-UBS Commercial Mortgage Trust 2006-C4 |
5.86% | | 06/15/38 | | | 19,747 | | | | 21,477 | | | (c) |
LB-UBS Commercial Mortgage Trust 2007-C6 |
6.11% | | 07/15/40 | | | 50,000 | | | | 54,820 | | | (c) |
MASTR Alternative Loan Trust 2003-5 |
5.00% | | 08/25/18 | | | 34,392 | | | | 2,910 | | | (a,e) |
ML-CFC Commercial Mortgage Trust 2006-3 |
5.46% | | 07/12/46 | | | 75,000 | | | | 81,362 | | | (c) |
Morgan Stanley Bank of America Merrill Lynch Trust 2013-C10 |
4.08% | | 07/15/46 | | | 40,000 | | | | 39,973 | | | (c) |
Morgan Stanley Bank of America Merrill Lynch Trust 2013-C8 |
4.17% | | 12/15/48 | | | 30,000 | | | | 25,274 | | | (c,h) |
Morgan Stanley Capital I Trust 2005-T17 |
4.84% | | 12/13/41 | | | 75,000 | | | | 76,869 | | | (c) |
Morgan Stanley Capital I Trust 2006-IQ11 |
5.67% | | 10/15/42 | | | 50,000 | | | | 46,128 | | | (a,c) |
Morgan Stanley Capital I Trust 2006-T21 |
5.27% | | 10/12/52 | | | 40,000 | | | | 42,671 | | | (c) |
Morgan Stanley Capital I Trust 2006-T23 |
5.81% | | 08/12/41 | | | 30,000 | | | | 32,986 | | | (c) |
Morgan Stanley Capital I Trust 2007-IQ16 |
6.09% | | 12/12/49 | | | 50,000 | | | | 56,106 | | | (c) |
Morgan Stanley Capital I Trust 2008-T29 |
6.28% | | 01/11/43 | | | 45,000 | | | | 50,922 | | | (a,c) |
Wachovia Bank Commercial Mortgage Trust 2006-C23 |
5.47% | | 01/15/45 | | | 70,000 | | | | 75,415 | | | (a,c) |
Wachovia Bank Commercial Mortgage Trust 2006-C28 |
5.60% | | 10/15/48 | | | 85,000 | | | | 91,243 | | | (c) |
Wachovia Bank Commercial Mortgage Trust 2006-C29 |
5.34% | | 11/15/48 | | | 50,000 | | | | 54,830 | | | |
WFRBS Commercial Mortgage Trust 2011-C4 |
5.25% | | 06/15/44 | | | 25,000 | | | | 25,370 | | | (c,h) |
WFRBS Commercial Mortgage Trust 2013-C16 |
4.99% | | 09/15/46 | | | 30,000 | | | | 26,464 | | | (c,h) |
WFRBS Commercial Mortgage Trust 2013-C17 |
4.26% | | 12/15/46 | | | 25,000 | | | | 25,180 | | | |
| | | | | | | | | 2,529,888 | | | |
|
Sovereign Bonds — 1.9% |
|
Government of Chile |
3.63% | | 10/30/42 | | | 18,000 | | | | 14,139 | | | |
Government of Dominican Republic |
7.50% | | 05/06/21 | | | 100,000 | | | | 108,500 | | | (a,h) |
Government of El Salvador |
7.65% | | 06/15/35 | | | 20,000 | | | | 19,480 | | | (a,h) |
Government of Hungary |
4.13% | | 02/19/18 | | | 18,000 | | | | 18,198 | | | |
6.25% | | 01/29/20 | | | 7,000 | | | | 7,551 | | | |
Government of Mexico |
4.75% | | 03/08/44 | | | 42,000 | | | | 37,853 | | | (a) |
5.75% | | 10/12/10 | | | 10,000 | | | | 9,250 | | | |
6.05% | | 01/11/40 | | | 18,000 | | | | 19,575 | | | (a) |
Government of Panama |
4.30% | | 04/29/53 | | | 14,000 | | | | 10,605 | | | |
6.70% | | 01/26/36 | | | 21,000 | | | | 23,468 | | | (a) |
Government of Peru |
6.55% | | 03/14/37 | | | 41,000 | | | | 47,150 | | | (a) |
| | | | | | | | | | | | |
| | | | |
| | | | | Principal
Amount | | | Fair Value | | | |
Government of Poland |
3.00% | | 03/17/23 | | $ | 25,000 | | | $ | 22,763 | | | |
5.00% | | 03/23/22 | | | 50,000 | | | | 53,437 | | | |
Government of Romania |
4.38% | | 08/22/23 | | | 14,000 | | | | 13,510 | | | (h) |
6.75% | | 02/07/22 | | | 20,000 | | | | 22,700 | | | (a,h) |
Government of Sri Lanka |
6.25% | | 10/04/20 | | | 100,000 | | | | 98,500 | | | (h) |
Government of Turkey |
6.88% | | 03/17/36 | | | 90,000 | | | | 88,290 | | | |
Government of Uruguay |
6.88% | | 09/28/25 | | | 17,355 | | | | 19,828 | | | |
Russian Foreign Bond — Eurobond |
7.50% | | 03/31/30 | | | 7,274 | | | | 8,475 | | | (b) |
| | | | | | | | | 643,272 | | | |
|
Municipal Bonds and Notes — 0.7% |
|
American Municipal Power Inc. |
6.27% | | 02/15/50 | | | 25,000 | | | | 26,299 | | | (a) |
Denver City & County School District No 1 |
4.24% | | 12/15/37 | | | 40,000 | | | | 35,650 | | | |
Municipal Electric Authority of Georgia |
6.64% | | 04/01/57 | | | 48,000 | | | | 50,455 | | | (a) |
New Jersey Transportation Trust Fund Authority |
6.88% | | 12/15/39 | | | 15,000 | | | | 16,178 | | | |
Port Authority of New York & New Jersey |
4.46% | | 10/01/62 | | | 60,000 | | | | 51,113 | | | |
South Carolina State Public Service Authority |
6.45% | | 01/01/50 | | | 30,000 | | | | 32,063 | | | (a) |
State of California |
5.70% | | 11/01/21 | | | 40,000 | | | | 44,861 | | | (a) |
| | | | | | | | | 256,619 | | | |
| | |
FNMA — 0.0% * | | | | | | | |
|
Lehman TBA |
5.50% | | TBA | | | 83,122 | | | | — | | | (**,i,j) |
| | | |
Total Bonds and Notes
(Cost $33,438,993) | | | | | | | 33,073,711 | | | |
| |
Domestic Equity — 0.1% | | | |
Preferred Stock — 0.1% |
Wells Fargo & Co.
(Cost $46,500) | | | 1,860 | | | | 43,840 | | | |
| | | |
Total Investments in Securities
(Cost $33,485,493) | | | | | | | 33,117,551 | | | |
Short-Term Investments — 11.7% | | | | | | | | | | |
GE Institutional Money Market Fund —
Investment Class 0.00%
(Cost $4,077,498) | | | | | | | 4,077,498 | | | (g,k) |
| | | |
Total Investments
(Cost $37,562,991) | | | | | | | 37,195,049 | | | |
| | | |
Liabilities in Excess of Other
Assets, net — (6.9)% | | | | | | | (2,406,875 | ) | | |
| | | | | | | | | | | | |
| | | |
NET ASSETS — 100.0% | | | | | | $ | 34,788,174 | | | |
| | | | | | | | | | | | |
See Notes to Schedules of Investments and Notes to Financial Statements.
12
Income Fund
| | |
| Schedule of Investments | | December 31, 2013 |
The Fund had the following long futures contracts open at December 31, 2013:
| | | | | | | | | | | | | | | | | | | | |
| Description | | Expiration
date | | Number
of
Contracts | | Current
Notional
Value | | Unrealized
Depreciation |
2 Yr. U.S. Treasury Notes Futures | | March 2014 | | | | 8 | | | | $ | 1,758,500 | | | | $ | (3,221 | ) |
5 Yr. U.S. Treasury Notes Futures | | March 2014 | | | | 35 | | | | | 4,175,937 | | | | | (53,102 | ) |
| | | | | | | | | | | | | | | | | | |
| | | | | | | | | | | | | | | $ | (56,323 | ) |
| | | | | | | | | | | | | | | | | | |
The Fund had the following short futures contracts open at December 31, 2013:
| | | | | | | | | | | | | | | | | | | | |
| Description | | Expiration
date | | Number
of
Contracts | | Current
Notional
Value | | Unrealized
Appreciation |
U.S. Long Bond Futures | | March 2014 | | | | 8 | | | | $ | (1,026,500 | ) | | | $ | 19,967 | |
Ultra Long-Term U.S. Treasury Bond Futures | | March 2014 | | | | 11 | | | | $ | (1,498,750 | ) | | | | 28,897 | |
10 Yr. U.S. Treasury Notes Futures | | March 2014 | | | | 13 | | | | | (1,599,609 | ) | | | | 31,940 | |
| | | | | | | | | | | | | | | | | | |
| | | | | | | | | | | | | | | $ | 80,804 | |
| | | | | | | | | | | | | | | | | | |
| | | | | | | | | | | | | | | $ | 24,481 | |
| | | | | | | | | | | | | | | | | | |
See Notes to Schedules of Investments and Notes to Financial Statements.
13
| | |
| Notes to Schedule of Investments | | December 31, 2013 |
The views expressed in this document reflect our judgment as of the publication date and are subject to change at any time without notice. The securities cited may not be representative of the Fund’s future investments and should not be construed as a recommendation to purchase or sell a particular security. See the Fund’s summary prospectus and statutory prospectus for complete descriptions of investment objectives, policies, risks and permissible investments.
| (a) | At December 31, 2013, all or a portion of this security was pledged to cover collateral requirements for futures and/or TBA’s. |
| (c) | Variable or floating rate security. The stated rate represents the rate at December 31, 2013. |
| (d) | Settlement is on a delayed delivery or when-issued basis with final maturity to be announced (TBA) in the future. |
| (e) | Interest only security. These securities represent the right to receive the monthly interest payments on an underlying pool of mortgages. Payments of principal on the pool reduce the value of the “interest only” holding. |
| (f) | Principal only security. These securities represent the right to receive the monthly principal payments on an underlying pool of mortgages. No payments of interest on the pool are passed through to the “principal only” holder. |
| (g) | Coupon amount represents effective yield. |
| (h) | Pursuant to Rule 144A of the Securities Act of 1933, these securities may be resold in transactions exempt from registration, normally to qualified institutional buyers. At December 31, 2013, these securities amounted to $3,291,486 or 9.46% of the net assets of the GE Investment Income Fund. These securities have been determined to be liquid using procedures established by the Fund’s Board of Directors. |
| (i) | Security is fair valued by the Valuation Committee, in accordance with the procedures approved by the Fund’s Board of Directors. |
| (j) | Security is in default. |
| (k) | GE Asset Management Incorporated (“GEAM”), the investment adviser of the Fund, also serves as investment adviser of the GE Institutional Money Market Fund. |
| † | Percentages are based on net assets as of December 31, 2013. |
| ** | Amount is less than $0.50. |
Abbreviations:
| | |
| |
REIT | | Real Estate Investment Trust |
| |
REMIC | | Real Estate Mortgage Investment Conduit |
| |
STRIPS | | Separate Trading of Registered Interest and Principal of Security |
| |
TBA | | To Be Announced |
14
Financial Highlights
Selected data based on a share outstanding throughout the fiscal years indicated
| | | | | | | | | | | | | | | | | | | | |
| | | 12/31/13 | | | 12/31/12 | | | 12/31/11 | | | 12/31/10 | | | 12/31/09 | |
| Inception date | | | — | | | | — | | | | — | | | | — | | | | 1/3/95 | |
Net asset value, beginning of period | | $ | 11.71 | | | $ | 11.35 | | | $ | 11.05 | | | $ | 10.62 | | | $ | 10.26 | |
Income/(loss) from investment operations: | | | | | | | | | | | | | | | | | | | | |
Net investment income | | | 0.30 | | | | 0.28 | | | | 0.48 | | | | 0.34 | * | | | 0.37 | |
Net realized and unrealized gains/(losses) on investments | | | (0.46) | | | | 0.37 | | | | 0.32 | | | | 0.46 | | | | 0.45 | |
Total income/(loss) from investment operations | | | (0.16) | | | | 0.65 | | | | 0.80 | | | | 0.80 | | | | 0.82 | |
Less distributions from: | | | | | | | | | | | | | | | | | | | | |
Net investment income | | | 0.30 | | | | 0.29 | | | | 0.50 | | | | 0.37 | | | | 0.46 | |
Total distributions | | | 0.30 | | | | 0.29 | | | | 0.50 | | | | 0.37 | | | | 0.46 | |
Net asset value, end of period | | $ | 11.25 | | | $ | 11.71 | | | $ | 11.35 | | | $ | 11.05 | | | $ | 10.62 | |
TOTAL RETURN(a) | | | (1.34)% | | | | 5.69% | | | | 7.20% | | | | 7.56% | | | | 7.88% | |
| | | | | |
RATIOS/SUPPLEMENTAL DATA: | | | | | | | | | | | | | | | | | | | | |
Net assets, end of period (in thousands) | | $ | 34,788 | | | $ | 42,893 | | | $ | 51,191 | | | $ | 54,884 | | | $ | 59,532 | |
Ratios to average net assets: | | | | | | | | | | | | | | | | | | | | |
Net investment income | | | 2.41% | | | | 2.09% | | | | 3.99% | | | | 3.07% | | | | 4.01% | |
Net expenses | | | 0.79% | (b) | | | 0.80% | (b) | | | 0.86% | (b) | | | 0.83% | (b) | | | 0.84% | (b) |
Gross expenses | | | 0.80% | | | | 0.82% | | | | 0.87% | | | | 1.00% | | | | 0.84% | |
Portfolio turnover rate | | | 256% | | | | 327% | | | | 359% | | | | 320% | | | | 251% | |
Notes to Financial Highlights
| (a) | Total returns are historical and assume changes in share price, reinvestment of dividends and capital gains distributions and do not include the effect of insurance contract charges. Past performance does not guarantee future results. |
| (b) | Reflects GEAM’s waiver of a portion of the Fund’s advisory and administrative fee (“management fee”) in an amount equal to the management fee earned by GEAM with respect to the Fund’s investment in an affiliated money market fund managed by GEAM. |
| * | Per share values have been calculated using the average share method. |
The accompanying Notes are an integral part of these financial statements.
15
| | | | |
Statement of Assets and Liabilities December 31, 2013 | | | |
| |
ASSETS | | | | |
Investments in securities, at Fair Value (cost $33,485,493) | | $ | 33,117,551 | |
Short-term affiliated investments (at amortized cost) | | | 4,077,498 | |
Income receivables | | | 256,607 | |
Receivable for fund shares sold | | | 2,931 | |
Variation margin receivable | | | 11,641 | |
Other assets | | | 195 | |
Total assets | | | 37,466,423 | |
| |
LIABILITIES | | | | |
Payable for investments purchased | | | 2,592,207 | |
Payable for fund shares redeemed | | | 138 | |
Payable to GEAM | | | 14,432 | |
Accrued other expenses | | | 71,472 | |
Total liabilities | | | 2,678,249 | |
NET ASSETS | | $ | 34,788,174 | |
| |
NET ASSETS CONSIST OF: | | | | |
Capital paid in | | $ | 42,805,030 | |
Undistributed (distributions in excess of) net investment income | | | 3,217 | |
Accumulated net realized loss | | | (7,676,612 | ) |
Net unrealized appreciation (depreciation) on: | | | | |
Investments | | | (367,942 | ) |
Futures | | | 24,481 | |
NET ASSETS | | $ | 34,788,174 | |
Shares outstanding ($0.01 par value; unlimited shares authorized) | | | 3,092,848 | |
Net asset value per share | | | $11.25 | |
The accompanying Notes are an integral part of these financial statements.
16
| | | | |
Statement of Operations For the year ended December 31, 2013 | | | |
| |
INVESTMENT INCOME | | | | |
Income | | | | |
Dividend | | $ | 1,081 | |
Interest | | | 1,212,329 | |
Income from affiliated investments | | | 960 | |
Total income | | | 1,214,370 | |
| |
Expenses | | | | |
Advisory and administration fees | | | 190,704 | |
Directors’ fees | | | 2,009 | |
Custody and accounting expenses | | | 70,518 | |
Professional fees | | | 23,223 | |
Other expenses | | | 17,324 | |
Total expenses before waivers | | | 303,778 | |
Less: Fees waived by the adviser | | | (3,924 | ) |
Net expenses | | | 299,854 | |
Net investment income | | $ | 914,516 | |
| |
NET REALIZED AND UNREALIZED GAIN (LOSS) ON INVESTMENTS | | | | |
| |
Realized gain (loss) on: | | | | |
Investments | | $ | (526,590 | ) |
Futures | | | 625,296 | |
| |
Increase (decrease) in unrealized appreciation/depreciation on: | | | | |
Investments | | | (1,518,874 | ) |
Futures | | | (31,869 | ) |
Net realized and unrealized loss on investments | | | (1,452,037 | ) |
Net decrease in net assets resulting from operations | | $ | (537,521 | ) |
The accompanying Notes are an integral part of these financial statements.
17
| | | | | | | | |
| Statements of Changes in Net Assets | | | | | | |
| | | Year Ended
December 31,
2013 | | | Year Ended
December 31,
2012 | |
| | |
INCREASE (DECREASE) IN NET ASSETS | | | | | | | | |
Operations: | | | | | | | | |
Net investment income | | $ | 914,516 | | | $ | 1,007,204 | |
Net realized gain (loss) on investments and futures | | | 98,706 | | | | 1,562,468 | |
Net increase (decrease) in unrealized appreciation/depreciation on investments and futures | | | (1,550,743 | ) | | | 179,050 | |
Net increase (decrease) from operations | | | (537,521 | ) | | | 2,748,722 | |
Distributions to shareholders from: | | | | | | | | |
Net investment income | | | (911,299 | ) | | | (1,025,340 | ) |
Total distributions | | | (911,299 | ) | | | (1,025,340 | ) |
Increase (decrease) in assets from operations and distributions | | | (1,448,820 | ) | | | 1,723,382 | |
Share transactions: | | | | | | | | |
Proceeds from sale of shares | | | 1,507,074 | | | | 2,589,560 | |
Value of distributions reinvested | | | 911,299 | | | | 1,025,340 | |
Cost of shares redeemed | | | (9,074,299 | ) | | | (13,636,423 | ) |
Net increase (decrease) from share transactions | | | (6,655,926 | ) | | | (10,021,523 | ) |
Total increase (decrease) in net assets | | | (8,104,746 | ) | | | (8,298,141 | ) |
| | |
NET ASSETS | | | | | | | | |
Beginning of year | | | 42,892,920 | | | | 51,191,061 | |
End of year | | $ | 34,788,174 | | | $ | 42,892,920 | |
Undistributed (distributions in excess of) net investment income, end of period | | $ | 3,217 | | | $ | — | |
| | |
CHANGES IN FUND SHARES | | | | | | | | |
Shares sold | | | 129,952 | | | | 223,834 | |
Issued for distributions reinvested | | | 81,076 | | | | 87,561 | |
Shares redeemed | | | (782,410 | ) | | | (1,157,509 | ) |
Net decrease in fund shares | | | (571,382 | ) | | | (846,114 | ) |
The accompanying Notes are an integral part of these financial statements.
18
| | |
| Notes to Financial Statements | | December 31, 2013 |
| 1. | Organization of the Company |
GE Investments Funds, Inc. (the “Company”) was incorporated under the laws of the Commonwealth of Virginia on May 14, 1984 and is registered under the Investment Company Act of 1940, as amended (the “1940 Act”), as an open-end management investment company. The Company is composed of eleven investment portfolios (collectively the “Funds”), although only the following eight are currently being offered: U.S. Equity Fund, S&P 500 Index Fund, Premier Growth Equity Fund, Core Value Equity Fund, Small-Cap Equity Fund, Total Return Fund, Income Fund (the “Fund”), and Real Estate Securities Fund.
Shares of the Funds of the Company are offered only to insurance company separate accounts that fund certain variable life insurance contracts and variable annuity contracts. GE Asset Management Incorporated (“GEAM”) is the investment adviser and administrator of each of the Funds.
The Company currently offers one share class (Class 1) of the Fund as an investment option for variable life insurance and variable annuity contracts.
| 2. | Summary of Significant Accounting Policies |
The preparation of financial statements in conformity with U.S. generally accepted accounting principles (“GAAP”) requires management to make estimates and assumptions that affect the reported amounts of assets and liabilities and disclosure of contingent assets and liabilities at the date of the financial statements and the reported amounts of increases and decreases in net assets from operations during the reporting period. Actual results may differ from those estimates.
Subsequent events after the balance sheet date through the date the financial statements were issued have been evaluated in the preparation of the financial statements. There are no items to report.
The following summarizes the significant accounting policies of the Company:
Securities Valuation and Transactions. All investments in securities are recorded at their estimated fair value, as described in Note 3.
Securities transactions are accounted for as of the trade date. Realized gains and losses on investments sold are recorded on the basis of identified cost for both financial statement and federal tax purposes.
Foreign Currency Accounting records of the Fund are maintained in U.S. dollars. Investment securities and other assets and liabilities denominated in a foreign currency are translated to U.S. dollars at the prevailing rates of exchange at period end. Purchases and sales of securities, income receipts and expense payments denominated in foreign currencies are translated into U.S. dollars at the prevailing exchange rate on the respective dates of such transactions.
All assets and liabilities of the Fund initially expressed in foreign currency values will be converted into U.S. dollars at the WM/Reuter exchange rate computed at 11:00 a.m., Eastern Time.
The Fund does not isolate the portion of the results of operations resulting from changes in foreign exchange rates from the fluctuations arising from changes in the market prices of securities during the year. Such fluctuations are included in the net realized or unrealized gain or loss from investments. Net realized gains or losses on foreign currency transactions represent net gains or losses on sales and maturities of foreign currency contracts, disposition of foreign currencies, the difference between the amount of net investment income and withholding taxes accrued and the U.S. dollar amount actually received or paid, and gains or losses between the trade and settlement date on purchases and sales of foreign securities. Net unrealized foreign exchange gains and losses arising from changes in the value of other assets and liabilities (including foreign currencies and open foreign currency contracts) as a result of changes in foreign exchange rates are included as increases or decreases in unrealized appreciation/depreciation on foreign currency related transactions.
Derivatives The Fund is subject to equity price risk, interest rate risk, credit risk, and foreign currency exchange rate risk in the normal course of pursuing its investment objective. The Fund may enter into derivative transactions (such as options, futures, and options on futures) to gain market exposure to a broad-based index as an alternative to investing directly in the securities representing such index.
Futures Contracts A futures contract represents a commitment for the future purchase or sale of an asset at a specified price on a specified date. During the year ended December 31, 2013, the Fund invested in futures contracts on bonds and notes to manage duration of fixed income securities. Buying futures tends to increase a Fund’s exposure to the underlying instrument while selling futures tends to decrease a
19
| | |
| Notes to Financial Statements | | December 31, 2013 |
Fund’s exposure to the underlying instrument, or hedge other Fund investments. The Fund will not enter into a transaction involving futures for speculative purposes. With futures contracts, there is minimal counterparty credit risk to the Fund since futures contracts are exchange traded and the exchange’s clearinghouse, as counterparty to all traded futures, guarantees the futures against default. The Fund’s risks in using these contracts include changes in the value of the underlying instruments, non-performance of the counterparties under the contracts’ terms and changes in the liquidity of the secondary market for the contracts. Futures contracts are valued at the settlement price established each day by the board of trade or exchange on which they principally trade.
Upon entering into a financial futures contract, the Fund is required to pledge to the broker an amount of cash and/or other assets equal to a certain percentage of the contract amount, known as initial margin deposit. Subsequent payments, known as variation margin, are made or received by the Fund each day, depending on the daily fluctuation in the fair value of the underlying security. The Fund records an unrealized gain or loss equal to the daily variation margin. Should market conditions move unexpectedly, the Fund may not achieve the anticipated benefits of the futures contracts and may incur a loss. The Fund recognizes a realized gain or loss on the expiration or closing of a futures contract.
Investments in Foreign Markets Investments in foreign markets involve special risks and considerations not typically associated with investing in the United States. These risks include revaluation of currencies, high rates of inflation, restrictions on repatriation of income and capital, and adverse political and economic developments. Moreover, securities issued in these markets may be less liquid, subject to government ownership controls, tariffs and taxes, subject to delays in settlements, and their prices may be more volatile.
The Fund may be subject to capital gains and repatriation taxes imposed by certain countries in which they invest. Such taxes are generally based upon income and/or capital gains earned or repatriated. Taxes are accrued based on net investment income, net realized gains and net unrealized appreciation as income and/or capital gains are earned.
Investment Income Corporate actions (including cash dividends) are recorded on the ex-dividend date, net of applicable withholding taxes, except for certain foreign corporate actions which are recorded as soon after the
ex-dividend date as such information becomes available. Withholding taxes in foreign dividends have been provided for in accordance with the Fund’s understanding of the applicable country’s tax rules and rates.
Interest income is recorded on the accrual basis. Accretion of discounts and amortization of premiums on taxable bonds are to the call or maturity date, whichever is shorter, using the effective yield method.
Expenses Fund specific expenses are charged to the Fund that incurs such expenses. Such expenses may include custodial fees, legal and accounting fees, printing costs and registration fees. Expenses that are not fund specific are allocated pro rata across the Funds. Expenses of the Fund are generally paid directly by the Fund, however, expenses may be paid by GEAM and reimbursed by the Fund.
Federal Income Taxes The Fund intends to comply with all sections of the Internal Revenue Code applicable to regulated investment companies including the distribution of substantially all of its taxable net investment income and net realized capital gains to its shareholders. Therefore, no provision for federal income tax has been made. The Fund is treated as a separate taxpayer for federal income tax purposes.
The Fund utilizes various methods to measure the fair value of most of its investments on a recurring basis. GAAP establishes a framework for measuring fair value and providing related disclosures. Broadly, the framework requires fair value to be determined based on the exchange price that would be received for an asset or paid to transfer a liability (an exit price) in the principal or most advantageous market for the asset or liability in an orderly transaction between market participants at the measurement date. In the absence of active markets for the identical assets or liabilities, such measurements involve developing assumptions based on market observable data and, in the absence of such data, internal information that is consistent with what market participants would use in a hypothetical transaction that occurs at the measurement date. It also establishes a three-level valuation hierarchy based upon observable and non-observable inputs.
Observable inputs reflect market data obtained from independent sources, while unobservable inputs reflect our market assumptions. Preference is given to observable inputs. These two types of inputs create the following fair value hierarchy:
20
| | |
| Notes to Financial Statements | | December 31, 2013 |
Level 1 — Quoted prices for identical investments in active markets.
Level 2 — Quoted prices for similar investments in active markets; quoted prices for identical or similar investments in markets that are not active; and model-derived valuations whose inputs are observable or whose significant value drivers are observable.
Level 3 — Significant inputs to the valuation model are unobservable.
Policies and procedures are maintained to value investments using the best and most relevant data available. In addition, pricing vendors are utilized to assist in valuing investments. GEAM performs periodic reviews of the methodologies used by independent pricing services including price validation of individual securities.
Fair Value Measurement The following section describes the valuation methodologies the Fund uses to measure different financial investments at fair value.
Debt securities (other than short-term securities described below) generally are valued at an evaluated bid price as reported by independent pricing services. The pricing services use various pricing models for each asset class. The inputs and assumptions to the model of the pricing services are derived from market observable sources, which may include: benchmark yields, reported trades, broker/dealer quotes, issuer spreads, benchmark securities, bids, offers, and other market related data. Since many fixed income securities do not trade on a daily basis, the methodology of the pricing service may also use other available information as applicable such as benchmark curves, benchmarking of similar securities, sector groupings and matrix pricing. Thus, certain securities may not be priced using quoted prices, but rather determined from market observable information. These investments are included in Level 2 and are primarily comprised of corporate fixed income, government, mortgage and asset-backed securities. In the absence of a reliable bid price from such a pricing service, debt securities may be valued based on broker or dealer supplied valuations or quotations. In these infrequent circumstances, pricing services may provide the Fund with valuations that are based on significant unobservable inputs, and in those circumstances the investment securities are classified as Level 3.
The Fund may use non-binding broker or dealer quotes for valuation when there is limited or no relevant market activity for a specific investment or for other investments that share similar characteristics and a price is not
provided by a pricing service or is deemed not to be reliable. The Fund has not adjusted the prices obtained. Investment securities priced using non-binding broker or dealer quotes are included in Level 3.
Short-term investments of sufficient credit quality with remaining maturities of sixty days or less at the time of purchase are typically valued on the basis of amortized cost which approximates fair value and these are included in Level 2. If it is determined that amortized cost does not approximate fair value, securities may be valued based on dealer supplied valuations or quotations. In these infrequent circumstances, pricing services may provide the Fund with valuations that are based on significant unobservable inputs, and in those circumstances the investment securities are classified in Level 3.
If prices are not readily available for a portfolio security, or if it is believed that a price for a portfolio security does not represent its fair value, the security may be valued using procedures approved by the Fund’s Board of Directors that are designed to establish its “fair” value. These securities are typically classified in Level 3. Those procedures require that the fair value of a security be established by a valuation committee of GEAM. The valuation committee follows different protocols for different types of investments and circumstances. The fair value procedures may be used to value any investment of the Fund in the appropriate circumstances.
Fair value determinations generally are used for securities whose value is affected by a significant event that will materially affect the value of a security and which occurs subsequent to the time of the close of the principal market on which such security trades but prior to the calculation of the Fund’s NAV.
The value established for such a portfolio security may be different than what would be produced through the use of market quotations or another methodology. Portfolio securities that are valued using techniques other than market quotations, including “fair valued” securities, may be subject to greater fluctuation in their value from one day to the next than would be the case if market quotations were used. In addition, there is no assurance that the Fund could sell a portfolio security for the value established for it at any time and it is possible that the Fund would incur a loss because a portfolio security is sold at a discount to its established value.
Other financial investments are derivative instruments that are not reflected in total investments, such as futures, forwards, swaps, and written options contracts, which are valued based on fair value as discussed above.
21
| | |
| Notes to Financial Statements | | December 31, 2013 |
The Fund uses closing prices for derivatives included in Level 1, which are traded either on exchanges or liquid over-the counter markets. Derivative assets and liabilities included in Level 2 primarily represent interest rate swaps, cross-currency swaps and foreign currency and commodity forward and option contracts. Derivative
assets and liabilities included in Level 3 primarily represent interest rate products that contain embedded optionality or prepayment features.
The inputs or methodology used for valuing securities are not an indication of the risk associated with investing in those securities.
The following table presents the Fund’s investments measured at fair value on a recurring basis at December 31, 2013:
| | | | | | | | | | | | | | | | | | | | |
| Investments | | Level 1 | | Level 2 | | Level 3 | | Total |
Investments in Securities† | | | | | | | | | | | | | | | | | | | | |
U.S. Treasuries | | | $ | — | | | | $ | 4,317,375 | | | | $ | — | | | | $ | 4,317,375 | |
Agency Mortgage Backed | | | | — | | | | | 10,455,689 | | | | | — | | | | | 10,455,689 | |
Agency Collateralized Mortgage Obligations | | | | — | | | | | 251,037 | | | | | — | | | | | 251,037 | |
Asset Backed | | | | — | | | | | 67,663 | | | | | — | | | | | 67,663 | |
Corporate Notes | | | | — | | | | | 14,552,168 | | | | | — | | | | | 14,552,168 | |
Non-Agency Collateralized Mortgage Obligations | | | | — | | | | | 2,529,888 | | | | | — | | | | | 2,529,888 | |
Sovereign Bonds | | | | — | | | | | 643,272 | | | | | — | | | | | 643,272 | |
Municipal Bonds and Notes | | | | — | | | | | 256,619 | | | | | — | | | | | 256,619 | |
Preferred Stock | | | | 43,840 | | | | | — | | | | | — | | | | | 43,840 | |
Short-Term Investments | | | | 4,077,498 | | | | | — | | | | | — | | | | | 4,077,498 | |
| | | | | | | | | | | | | | | | | | | | |
Total Investments in Securities | | | $ | 4,121,338 | | | | $ | 33,073,711 | | | | $ | — | | | | $ | 37,195,049 | |
| | | | | | | | | | | | | | | | | | | | |
Other Financial Instruments* | | | | | | | | | | | | | | | | | | | | |
Short Futures Contracts — Unrealized Appreciation | | | $ | 80,804 | | | | $ | — | | | | $ | — | | | | $ | 80,804 | |
Long Futures Contracts — Unrealized Depreciation | | | | (56,323 | ) | | | | — | | | | | — | | | | | (56,323 | ) |
| | | | | | | | | | | | | | | | | | | | |
Total Other Financial Instruments | | | $ | 24,481 | | | | $ | — | | | | $ | — | | | | $ | 24,481 | |
| | | | | | | | | | | | | | | | | | | | |
| † | See Schedule of Investments for industry classification. |
| * | Other financial instruments include derivative instruments such as futures contracts. Amounts shown represent unrealized appreciation (depreciation), at period end. |
There were no transfers between fair value levels. Transfers between fair value levels are considered to occur at the beginning of the period.
| 4. | Derivatives Transactions |
Shown below are the derivative contracts entered into by the Fund, summarized by primary risk exposure as they appear on the Statement of Assets and Liabilities, all of which are not accounted for as hedging instruments under FASB Accounting Standards Codification (“ASC”) No. 815 Derivatives and Hedging as of December 31, 2013.
| | | | | | | | | | | | |
| | | Asset Derivatives December 31, 2013 | | | Liability Derivatives December 31, 2013 | |
Derivatives not accounted for as hedging instruments under ASC 815 | | Location in the Statements of Assets and Liabilities | | Fair Value ($) | | | Location in the Statements of Assets and Liabilities | | Fair Value ($) | |
Interest Rate Contracts | | Assets, Net Assets — Net Unrealized Appreciation/ (Depreciation) on Futures | | | 80,804* | | | Liabilities, Net Assets — Net Unrealized Appreciation/ (Depreciation) on Futures | | | (56,323)* | |
| * | Includes cumulative unrealized appreciation/(depreciation) of futures contracts as reported in the Schedule of Investments and within the components of the net assets section of the Statement of Assets and Liabilities. Only the current day’s variation margin is reported within the Assets and/or Liabilities section on the Statement of Assets and Liabilities. |
22
| | |
| Notes to Financial Statements | | December 31, 2013 |
Shown below are the effects of derivative instruments on the Fund’s Statement of Operation, summarized by primary risk exposure all of which are not accounted for as hedging instruments under ASC 815.
| | | | | | | | | | | | | | |
Derivatives not accounted for as hedging instruments under ASC 815 | | Location in the Statements of Operations | | Total Notional Amount of Futures Contracts/
Foreign Currency Forward Contracts Purchased/(Sold) ($) | | | Realized Gain (Loss) on Derivatives Recognized in Income ($) | | | Change in Unrealized Appreciation (Depreciation) on Derivatives Recognized in Income ($) | |
Interest Rate Contracts | | Realized gain/(loss) on futures, Increase/(decrease) in unrealized appreciation/ (depreciation) on Futures | |
| 107,935,608/
(105,903,706) |
| | | 625,296 | | | | (31,869) | |
The Company shares a revolving credit facility of up to $150 million with a number of its affiliates. The credit facility is with its custodian bank, State Street Bank and Trust Company (“State Street”). The revolving credit facility requires the payment of a commitment fee equal to 0.10% per annum on the daily unused portion of the credit facility, payable quarterly. The portion borne by the Funds generally is borne proportionally based upon net assets. In addition, the Company has a $100 million uncommitted, unsecured line of credit with State Street. Generally, borrowings under the credit facilities would accrue interest at the Federal Funds Rate plus 50 basis points and would be borne by the borrowing fund. The maximum amount allowed to be borrowed by any one fund is the lesser of (i) 33.33% of its total assets or (ii) 20% of its net assets. The credit facilities were not utilized by the Fund during the year ended December 31, 2013.
| 6. | Compensation and Fees Paid to Affiliates |
GEAM, a registered investment adviser, was retained by the Company’s Board of Directors effective November 17, 1997 to act as investment adviser and administrator of the Fund. GEAM’s compensation for investment advisory and administrative services (“management fee”) is paid monthly based on the average daily net assets of the Fund at an annualized rate of 0.50%.
GEAM has a contractual arrangement with the Fund to waive a portion of the Fund’s management fee in the amount equal to the management fee earned by GEAM with respect to the Fund’s investment in the GE Institutional Money Market Fund, if any.
Directors’ Compensation The Fund pays no compensation to its directors who are officers or employees of GEAM or its affiliates. Directors who are not such officers or employees also serve in a similar capacity
for other funds advised by GEAM. Compensation paid to non-interested Directors are reflected on the Statement of Operations. These fees are allocated pro rata across all of the mutual fund platforms served by the Directors, including the Fund, and are based upon the relative net assets of each fund within such platforms.
| 7. | Investment Transactions |
Purchases and Sales of Securities The cost of purchases and the proceeds from sales of investments, other than short-term securities, for the year ended December 31, 2013, were as follows:
| | | | | | |
| U.S. Government Securities | |
| Purchases | | | Sales | |
| $ | 71,492,911 | | | $ | 79,808,577 | |
|
| Non-U.S. Government Securities | |
| Purchases | | | Sales | |
| $ | 21,577,167 | | | $ | 18,015,890 | |
The Fund is subject to ASC 740, Income Taxes. ASC 740 provides guidance for financial accounting and reporting for the effects of income taxes that result from an entity’s activities during the year. ASC 740 also provides guidance regarding how certain uncertain tax positions should be recognized, measured, presented and disclosed in the financial statements. ASC 740 requires evaluation of tax positions taken or expected to be taken in the course of preparing the Fund’s tax returns to determine whether the tax positions are “more likely than not” of being sustained by the applicable tax authority. There are no adjustments to the Fund’s net assets required under ASC 740. The Fund’s 2010, 2011, 2012, and 2013 fiscal years tax returns are still open to examination by the Federal and applicable state tax authorities.
23
| | |
| Notes to Financial Statements | | December 31, 2013 |
At December 31, 2013, information on the tax cost of investments and distributable earnings on a tax basis was as follows:
| | | | | | | | | | | | | | | | | | | | | | | | | | | | | | |
Cost of
Investments For
Tax Purposes | | | Gross Tax | | | Net Tax Appreciation/
(Depreciation) | | | Undistributed | | | | |
| | Appreciation | | | Depreciation | | | Investments | | | Derivatives/
Currency | | | Income | | | Accum. Capital
Gain/(Loss) | | | Late-Year
Losses | |
| $ | 37,576,581 | | | $ | 623,658 | | | $ | (1,005,190 | ) | | $ | (381,532 | ) | | $ | 24,481 | | | $ | 3,217 | | | $ | (7,638,542 | ) | | $ | — | |
Capital loss carryovers are available to offset future realized capital gains to the extent provided in the Internal Revenue Code and regulations thereunder. To the extent that these carryover losses are used to offset future capital gains, it is probable that the gains offset will not be distributed to shareholders because they would be taxable as ordinary income.
As of December 31, 2013, the Fund has capital loss carryovers as follows:
| | | | | | | | | | |
| Amount | | | | |
| Short-Term | | | Long-Term | | | Expires | |
| $ | 160,389 | | | $ | — | | | | 12/31/2016 | |
| | 7,409,447 | | | | — | | | | 12/31/2017 | |
| | 68,706 | | | | — | | | | Unlimited Losses | |
These amounts will be available to offset future taxable capital gains. Under the recently enacted Regulated Investment Company Modernization Act of 2010, the Fund will be permitted to carry forward capital losses incurred in taxable years beginning after December 22, 2010 for an unlimited period. However, any losses incurred during those future years will be required to be utilized prior to the losses incurred in pre-enactment tax years. As a result of this ordering rule, pre-enactment capital loss carryforwards may be more likely to expire unused. Additionally, post-enactment capital losses that are carried forward will retain their character as either short term or long-term capital losses rather than being considered all short-term as under previous law.
Any qualified late-year loss is deemed to arise on the first day of the Fund’s next tax year (if the Fund elects to defer such loss). Under this regime, generally, the Fund can elect to defer any post-October capital loss and/or any late-year ordinary loss as defined by the Internal Revenue Code.
The Fund incurred no such losses for the year ended December 31, 2013.
The tax character of distributions paid during the years ended December 31, 2013 and December 31, 2012 were as follows:
| | | | | | | | | | | | | | | |
| Year | | Ordinary
Income | | Long-Term
Capital Gains | | Total |
2013 | | | $ | 911,299 | | | | $ | — | | | | $ | 911,299 | |
2012 | | | | 1,025,340 | | | | | — | | | | | 1,025,340 | |
Distributions to Shareholders The Fund declares and pays any dividends from net investment income annually. The Fund declares and pays any net realized capital gains in excess of capital loss carryforwards distributions annually. The character of income and gains to be distributed is determined in accordance with income tax regulations which may differ from generally accepted accounting principles. These differences include (but are not limited to) futures, treatment of realized and unrealized gains and losses on foreign currency contracts, paydown gains and losses on mortgage-backed securities, investments organized as partnerships for tax purposes, losses deferred due to offsetting positions, and losses deferred due to wash sale transactions. Reclassifications due to permanent book/tax differences are made to the Fund’s capital accounts to reflect income and gains available for distribution (or available capital loss carryovers) under income tax regulations. These reclassifications have no impact on net investment income, realized gains or losses, or the net asset value of the Fund. The calculation of net investment income per share in the Financial Highlights table excludes these adjustments.
The reclassifications for the year ended December 31, 2013 were as follows:
| | | | | | | | |
Undistributed
Net Investment
Income | | Accumulated
Net Realized
Gain (Loss) | | | Capital
Paid In | |
| $— | | $ | 58,718 | | | $ | (58,718 | ) |
24
Report of Independent Registered Public Accounting Firm
The Shareholders and Board of Directors
GE Investments Funds, Inc.
We have audited the accompanying statement of assets and liabilities, including the schedule of investments, of the Income Fund (the “Fund”), a series of GE Investments Funds, Inc., as of December 31, 2013 and the related statement of operations for the year then ended, statements of changes in net assets for each of the years in the two-year period then ended, and the financial highlights for each of the years in the five-year period then ended. These financial statements and financial highlights are the responsibility of the Fund’s management. Our responsibility is to express an opinion on these financial statements and financial highlights based on our audits.
We conducted our audits in accordance with the standards of the Public Company Accounting Oversight Board (United States). Those standards require that we plan and perform the audit to obtain reasonable assurance about whether the financial statements are free of material misstatement. An audit includes examining, on a test basis, evidence supporting the amounts and disclosures in the financial statements. Our procedures included confirmation of securities owned as of December 31, 2013 by correspondence with the custodian and brokers, or by other appropriate auditing procedures where replies from brokers were not received. An audit also includes assessing the accounting principles used and significant estimates made by management, as well as evaluating the overall financial statement presentation. We believe that our audits provide a reasonable basis for our opinion.
In our opinion, the financial statements and financial highlights referred to above present fairly, in all material respects, the financial position of the Income Fund as of December 31, 2013, the results of its operations, changes in its net assets and financial highlights for each of the years described above, in conformity with U.S. generally accepted accounting principles.

Boston, Massachusetts
February 17, 2014
25
| | |
| Advisory and Administrative Agreement Renewal | | (Unaudited) |
The Board of Directors of the GE Investments Funds, Inc. (the “Board”), including the independent Board members, considered and unanimously approved the continuance for an additional year of the Fund’s Investment Advisory and Administration Agreement with GE Asset Management Incorporated (“GEAM”) at meetings held on December 11 and December 13, 2013.
In considering whether to approve the Fund’s investment advisory agreement, the Board members considered and discussed a substantial amount of information and analysis provided, at the Board’s request, by GEAM. The Board members also considered detailed information regarding performance and expenses of other investment companies, including those with similar investment strategies and sizes, which was prepared by independent third party provider Morningstar, Inc. (“Morningstar”). The Board members reviewed the fees charged by GEAM for other mutual funds and investment products other than mutual funds that employ the same investment strategy as the Fund. The Board had the opportunity to ask questions and request additional information in connection with its considerations.
Before approving the Fund’s investment advisory agreement, the independent Board members reviewed the information provided with management of GEAM and with their independent legal counsel. The Board members also reviewed a memorandum prepared by independent legal counsel discussing the legal standards for the consideration of the proposed continuance. The independent Board members discussed the proposed continuance in detail during a private session with their independent legal counsel at which no representatives of GEAM were present. The independent Board members and their independent legal counsel requested, received and considered additional information from GEAM following these sessions.
In advance of the meetings, and in response to their request, the Board members received from GEAM written responses to their inquiries, which included substantial exhibits and other materials related to GEAM’s business and the services it provides to the Fund. The Board members took into account their experience as Board members and particularly their previous consideration of these types of agreements. When feasible, information was presented in a manner to facilitate comparison to prior periods and to reflect certain enhancements to GEAM’s infrastructure, systems and shareholder servicing model. To focus their review, the Board members asked GEAM management, in its oral presentation, to highlight material differences from the information presented in recent years.
During the meetings, the Board members had an opportunity to discuss this information with GEAM representatives, including senior executives, representatives from the legal, compliance and finance departments, and investment personnel. The Board members posed questions to these representatives and engaged in substantive discussions with them concerning GEAM’s investment process.
In reaching their determination relating to continuance of the Fund’s investment advisory agreement, the Board members considered all factors that they deemed relevant, including the factors discussed below. In their deliberations, the Board members did not identify any particular information that was all-important or controlling, and each Board member may have attributed different weights to the various factors. In particular, the Board members focused on the following:
The Nature, Extent And Quality Of Services Provided.
The Board members reviewed the services provided by GEAM, taking into account their past experiences with GEAM. They focused on the favorable attributes of GEAM, including (i) an investment philosophy oriented toward long-term performance; (ii) effective processes used for selecting investments and brokers; (iii) effective processes used for providing Fund administration, including controllership and compliance functions, the optimization of its Fund administration platform and the continued oversight of the performance of other companies that provide services to the Fund and its shareholders; (iv) highly skilled professionals including analysts, research professionals, traders and portfolio managers with a depth of experience relevant to the Fund; (v) access to significant and enhanced technological resources from which the Fund may benefit; and (vi) a favorable history and reputation. The Board members noted that the Fund represents only a small portion of the assets managed by GEAM, but benefits from a full array of services and resources provided by GEAM.
In light of these discussions, the Board, including the independent Board members, concluded that GEAM’s services continue to be satisfactory.
Investment Performance Of The Fund.
The Board members considered the investment performance of the Fund for various periods. The Board members reviewed detailed comparisons of the performance of the Fund with the relevant securities index and peer groupings of mutual funds prepared by
26
| | |
| Advisory and Administrative Agreement Renewal | | (Unaudited) |
Morningstar with respect to various periods. The Board members also engaged in detailed discussions with GEAM management about its investment process and performance results. These discussions focused on the Fund’s investment objective, the number and experience of portfolio management and supporting research personnel, the investment style and approach employed, the likely market cycles for the Fund’s investment style and the Fund’s relative underperformance over the past year and in other periods. The Board members discussed GEAM’s investment approach with respect to the Fund and the reasons for the Fund’s relative underperformance.
The Board, including the independent Board members, concluded that the Fund’s performance was acceptable overall taking into consideration the factors discussed above.
Cost Of The Services Provided And Profits Realized From The Relationship With The Fund.
The Board members considered the fees paid to GEAM by the Fund and the cost of the services provided to the Fund by GEAM. The Board members reviewed the information they had requested from GEAM concerning its profitability. The Board members considered the profit margin information for GEAM’s investment company business as a whole, as well as GEAM’s profitability data for the Fund. The Board members reviewed GEAM’s assumptions and the methods of cost allocation used by GEAM in preparing Fund-specific profitability data. The Board members also discussed with GEAM the basis for its belief that the methods of allocation used were reasonable for each area of its business.
Information was presented regarding the financial condition of GEAM for various past periods. The Board members noted and discussed the additional services provided by GEAM to the Fund compared to other investment products managed by GEAM. The Board members determined that GEAM should be entitled to earn a reasonable level of profits for the services it provides to the Fund. The Board members also recognized that GEAM has made and continues to make significant investments in its business in fulfilling its obligations to the Fund and supporting its Fund-related activities.
Based on their review, the Board, including the independent Board members, concluded that they were satisfied that the level of profitability achieved by GEAM from its relationship with the Fund was not unreasonable or excessive.
The Extent To Which Economies Of Scale Would Be Realized As The Fund Grows And Whether Fee Levels Would Reflect Such Economies Of Scale.
Although the Board noted that the Fund experienced a decrease in assets over the past year, the Board members considered the extent to which economies of scale would be realized as the Fund grows, and whether fee levels reflect these economies of scale for the benefit of Fund investors.
The Board members considered the substantial infrastructure investments that GEAM has made with respect to its operations and its commitment to continue investing resources to enhance services to Fund shareholders. The Board members recognized the benefits to the Fund of GEAM’s past investment in its operations through expenditures to support its substantial infrastructure, and that, with respect to all GEAM managed mutual funds, GEAM has not yet fully recouped that investment. The Board members also recognized the benefits to the Fund of being able to leverage a favorable cost structure achieved with respect to the Fund’s other operating expenses as a result of GEAM’s large overall base of assets under management and its vendor management practices.
Comparison Of Services To Be Rendered And Fees To Be Paid.
The Board members discussed the services provided to the Fund by GEAM, and the fees charged for those services. The Board members reviewed information concerning the fee and expense ratios for the Fund, and comparative information with respect to peer groupings of mutual funds prepared by Morningstar. They discussed that the Fund’s advisory fee and expense ratios were within the applicable peer group ranges. In light of the foregoing, the Board, including the independent Board members, determined that the advisory fees were reasonable in relation to the services provided to the Fund.
Fall-Out Benefits.
The Board members considered other actual and potential financial benefits that GEAM may derive from its relationship with the Fund, including, to the extent applicable, soft dollar commission benefits generated through Fund portfolio transactions. The Board members noted, however, that the Fund benefits from the vast array of resources available through GEAM, and that the Fund represents only a small portion of the assets managed by GEAM.
27
| | |
| Advisory and Administrative Agreement Renewal | | (Unaudited) |
Conclusion.
No single factor was determinative to the Board’s decision. Based on their discussion and such other matters as were deemed relevant, the Board, including the independent Board members, concluded that renewal of the investment advisory agreement was in the best interests of the Fund and its shareholders.
28
| | |
| Additional Information | | (Unaudited) |
Information about Directors and Executive Officers:
The business and affairs of the Funds are managed under the direction of the Funds’ Board of Directors. Information pertaining to the Directors and officers of the Funds is set forth below.
Interested Directors and Executive Officers
Michael J. Cosgrove
Address c/o GEAM 1600 Summer St. Stamford, CT 06905
Age 64
Position(s) Held with Fund Chairman of the Board and President
Term of Office and Length of Time Served Until successor is elected and qualified — 17 years
Principal Occupation(s) During Past 5 years President of Mutual Funds and Global Investment Programs of GEAM since November 2011; President and Chief Executive Officer – Mutual Funds and Intermediary Business of GEAM from March 2007 to November 2011; Executive Vice President of GEAM from February 1997 to March 2007; and Executive Vice President-Mutual Funds of GEAM from March 1993 to March 2007. Also serves as Treasurer of GE Foundation since 1988.
Number of Portfolios in Fund Complex Overseen by Director 25
Other Directorships Held by Director Chairman of the Board and President of GE Institutional Funds since 1997; Trustee of Elfun Funds, GE Retirement Savings Plan Funds (formerly GE Savings & Security Funds) and General Electric Pension Trust since 1988; Director of GEAM since 1988; Trustee of Fordham University from 2002 through June 2010 and since July 2011; Director of GE Investment Distributors, Inc. since June 2011; Director of Skin Cancer Foundation since August 2010; Member Board of Governors of the Investment Company Institute since October 2006; Director of GE Asset Management (Ireland) Limited since February 1999; GE Asset Management Funds Plc since 1998; GE Asset Management Canada Company since 1998, GE Asset Management Limited since 1998; Trustee of General Electric Insurance Plan Trust since 1988; and Chairman of the Board and President of GE Funds from 1993 to February 2011.
Matthew J. Simpson
Address c/o GEAM 1600 Summer St. Stamford, CT 06905
Age 52
Position(s) Held with Fund Director and Executive Vice President
Term of Office and Length of Time Served Until successor is elected and qualified — 6 years
Principal Occupation(s) During Past 5 years Executive Vice President, General Counsel and Secretary of GEAM since July 2007; Secretary of Elfun Funds and GE Retirement Savings Plan Funds (formerly GE Savings & Security Funds) since July 2007; Senior Vice President and General Counsel – Marketing and Client Services (formerly Asset Management Services) of GEAM and Senior Vice President and General Counsel of GE Asset Management Services from February 1997 to July 2007; Vice President and Associate General Counsel of GEAM from October 1992 to February 1997; Secretary of GE Institutional Funds and GE Investments Funds, Inc. from 1997 to July 2007 and Vice President from September 2003 to July 2007; Assistant Secretary of Elfun Funds and GE Retirement Savings Plan Funds from 1998 to July 2007 and Vice President from October 2003 to July 2007; and Secretary of GE Funds from 1993 to July 2007 and Vice President from September 2003 to July 2007.
29
| | |
| Additional Information | | (Unaudited) |
Number of Portfolios in Fund Complex Overseen by Director 25
Other Directorships Held by Director Trustee of Elfun Funds, GE Retirement Savings Plan Funds and General Electric Pension Trust since July 2007; Trustee and Executive Vice President of GE Institutional Funds since July 2007; Director of GEAM since July 2007; Director of GE Investment Distributors, Inc. since June 2011; and Trustee and Executive Vice President of GE Funds from July 2007 to February 2011.
Joon Won Choe
Address c/o GEAM 1600 Summer St. Stamford, CT 06905
Age 44
Position(s) Held with Fund Vice President & Secretary
Term of Office and Length of Time Served Until successor is elected and qualified – Vice President and Secretary — 3 years
Principal Occupation(s) During Past 5 years Senior Vice President and Deputy General Counsel at GEAM since March 2011; Vice President and Secretary of GE Institutional Funds since September 2010; Vice President and Assistant Secretary of Elfun Funds and GE Retirement Savings Plan Funds (formerly GE Savings & Security Funds) since September 2010; Senior Vice President and Associate General Counsel at GEAM from June 2010 to March 2011; Vice President and Associate General Counsel of GEAM from November 2005 to June 2010 and Vice President and Secretary of GE Funds from September 2010 to February 2011.
Number of Portfolios in Fund Complex Overseen by Officer N/A
Other Directorships Held by Officer N/A
Robert Herlihy
Address c/o GEAM 1600 Summer St. Stamford, CT 06905
Age 46
Position(s) Held with Fund Chief Compliance Officer
Term of Office and Length of Time Served Until successor is elected and qualified — 8 years
Principal Occupation(s) During Past 5 years Chief Compliance Officer of GEAM, GE Institutional Funds, Elfun Funds, and GE Retirement Savings Plan Funds (formerly GE Savings & Security Funds) since July 2005; Chief Compliance Officer of GE Funds from July 2005 to February 2011 and Manager of Fund Administration at GEAM from 2002-2005.
Number of Portfolios in Fund Complex Overseen by Officer N/A
Other Directorships Held by Officer N/A
Arthur A. Jensen
Address c/o GEAM 1600 Summer St. Stamford, CT 06905
Age 47
Position(s) Held with Fund Treasurer
30
| | |
| Additional Information | | (Unaudited) |
Term of Office and Length of Time Served Until successor is elected and qualified — 2 years
Principal Occupation(s) During Past 5 Years Treasurer of GE Institutional Funds, Elfun Funds and GE Retirement Savings Plan Funds (formerly GE Savings & Security Funds) since June 2011; Mutual Funds Controller of GEAM since April 2011; Senior Vice President at Citigroup from 2008 to 2010 and Vice President at JPMorgan from 2005 to 2008.
Number of Portfolios in Fund Complex Overseen by Officer N/A
Other Directorships Held by Officer N/A
Jeanne M. LaPorta
Address c/o GEAM 1600 Summer St. Stamford, CT 06905
Age 48
Position(s) Held with Fund Vice President
Term of Office and Length of Time Served Until successor is elected and qualified — 10 years
Principal Occupation(s) During Past 5 Years Senior Vice President and Commercial Administrative Officer of GEAM since April 2010; Vice President of GE Institutional Funds since July 2003; Vice President of Elfun Funds and GE Retirement Savings Plan Funds (formerly GE Savings & Security Funds) since October 2003; Secretary of GE Funds from July 2007 to September 2010 and Vice President from July 2007 to February 2011; Senior Vice President and Deputy General Counsel of GEAM from October 2007 to April 2010; Vice President and Assistant Secretary of Elfun Funds and GE Retirement Savings Plan Funds from July 2003 to June 2010; and Vice President and Associate General Counsel – Marketing and Client Services (formerly Asset Management Services) at GEAM from May 1997 to October 2007.
Number of Portfolios in Fund Complex Overseen by Officer N/A
Other Directorships Held by Officer N/A
Non-Interested Directors
John R. Costantino
Address c/o GEAM 1600 Summer St. Stamford, CT 06905
Age 67
Position(s) Held with Fund Director
Term of Office and Length of Time Served Until successor is elected and qualified – 17 years
Principal Occupation(s) During Past 5 years Managing General Partner, NGN Capital LLC since 2006; and Treasurer of NeuroScience Research Institute since 1986.
Number of Portfolios in Fund Complex Overseen by Director 17
Other Directorships Held by Director Trustee of GE Institutional Funds since 1997; Trustee of Fordham University from 1989 to 1995 and from 2001 to 2007 and Trustee Emeritus since 2007; Trustee of NeuroScience Research Institute since 1986; Trustee of GE Funds from 1993 to February 2011; and Director of Artes Medical from 2006 to 2008.
31
| | |
| Additional Information | | (Unaudited) |
R. Sheldon Johnson
Address c/o GEAM 1600 Summer St. Stamford, CT 06905
Age 67
Positions(s) Held with Fund Director
Term of office and Length of Time served Unit Successor is elected and qualified — 2 years
Principal Occupation(s) During Past 5 years Head of Global Institutional Equity Sales and Marketing at Morgan Stanley & Co., Inc. from 2002 to 2006 and Managing Director at Morgan Stanley & Co., Inc. from 1988 to 2006.
Number of Portfolios in Fund Complex Overseen by Director 17
Other Directorships Held by Director Trustee of GE Institutional Funds since April 2011 and Trustee of St. Lawrence University since 2003.
Donna M. Rapaccioli
Address c/o GEAM 1600 Summer St. Stamford, CT 06905
Age 51
Position(s) Held with Fund Director
Term of Office and Length of Time Served Until successor is elected and qualified — 2 years
Principal Occupation(s) During Past 5 Years Dean of the Gabelli School of Business since 2007 and Accounting professor since 1987 at Fordham University.
Number of Portfolios in Fund Complex Overseen by Officer 17
Other Directorships Held by Director Trustee of GE Institutional Funds since January 2012 and Trustee of Emmanuel College since 2010.
The Statement of Additional Information for the Funds includes additional information about the Directors and Officers and is available, without charge, upon request by calling 1-800-242-0134.
32
| | |
| Investment Team | | (Unaudited) |
Investment Adviser and Administrator
GE Asset Management Incorporated
Board of Directors
Michael J. Cosgrove, Chairman
John R. Costantino
R. Sheldon Johnson
Donna M. Rapaccioli
Matthew J. Simpson
Secretary
Joon Won Choe
Assistant Secretary
Michelle Matzelle
Treasurer
Arthur A. Jensen
Assistant Treasurer
Robert Meyers
Distributor
GE Investment Distributors, Inc.
Member FINRA and SIPC
Custodian
State Street Bank & Trust Company
At GE Asset Management, we’re dedicated to providing the investment options you’ll need to tailor your financial portfolio to every stage of your life. Each member of the GE Family of Funds is managed according to the same principles of integrity and quality that have guided GE over the past century, and have made it the world-class company that it is today. Each fund draws strength from a heritage of investment management experience that spans more than 80 years. Whether you’re creating a new investment portfolio or adding to an established one, the GE Family of Funds offers an array of professionally managed investment options that will help you meet a lifetime of financial needs.
33
Investment Adviser
GE Asset Management Incorporated
1600 Summer Street
Stamford, CT 06905
or at:
PO Box 7900
Stamford, CT 06904-7900
Distributor
GE Investment Distributors, Inc.
member FINRA and SIPC
1600 Summer Street
Stamford, CT 06905
or at:
PO Box 7900
Stamford, CT 06904-7900
The Fund files its complete schedule of portfolio holdings with the Securities and Exchange Commission for the first and third quarters of each fiscal year on Form N-Q. The Fund’s Forms N-Q, as well as a description of the policies and procedures that the Fund uses to determine how to vote proxies (if any) relating to portfolio securities is available without charge (i) upon request, by calling 1-800-493-3042; (ii) on the Fund’s website at http://www.geam.com; and (iii) on the Commission’s website at http://www.sec.gov. The Fund’s Forms N-Q may be reviewed and copied at the Commission’s Public Reference Room in Washington, DC — information on the operation of the Public Reference Room may be obtained by calling 1-800-SEC-0330.
Information (if any) regarding how the Fund voted proxies relating to portfolio securities during the most recently disclosed 12-month period ended June 30 is available without charge (i) through the Fund’s website at http://www.geam.com; and (ii) on the Commission’s website at http://www.sec.gov.

GE Investments Funds, Inc.
Total Return Fund
Annual Report
December 31, 2013

GE Investments Funds, Inc.
| | |
| |
| Total Return Fund | | Contents |
This report is prepared for Policyholders of certain variable contracts and may be distributed to others only if preceded or accompanied by the variable contract’s current prospectus and the current prospectus and/or summary prospectus of the Fund available for investments thereunder.
| | |
| Notes to Performance | | December 31, 2013 (Unaudited) |
The information provided on the performance page relates to the GE Investments Total Return Fund (the “Fund”).
Total return performance shown in this report for the Fund takes into account changes in share price and assumes reinvestment of dividends and capital gains distributions, if any. Total returns shown are net of Fund fees and expenses but do not reflect fees and charges associated with the variable contracts such as administrative fees, account charges and surrender charges, which, if reflected, would reduce the Fund’s total returns for all periods shown.
The performance data quoted represents past performance; past performance does not guarantee future results. Investment return and principal value will fluctuate so your shares, when redeemed, may be worth more or less than their original cost. Current performance may be higher or lower than the performance data quoted. Periods less than one year are not annualized. Please call 800-493-3042 or visit the Fund’s website at http://www.geam.com for the most recent month-end performance data.
An investment in the Fund is not a deposit of any bank and is not insured or guaranteed by the Federal Deposit Insurance Corporation (FDIC) or any other government agency. An investment in the Fund is subject to risk, including possible loss of principal invested.
The Standard & Poor’s (“S&P”) 500® Composite Price Index of stocks (“S&P 500 Index”) is an unmanaged, market capitalization-weighted index of stocks of 500 large U.S. companies, which is widely used as a measure of large-cap U.S. stock market performance.
The Morgan Stanley Capital International All Country World Index Ex-U.S. (MSCI® ACWI Ex-U.S.) is a market-capitalization weighted index designed to provide a broad measure of
stock performance throughout the world, with the exception of U.S.-based companies. The MSCI ACWI Ex-U.S. Index includes both developed and emerging markets.
The Barclays U.S. Aggregate Bond Index is an unmanaged market value-weighted index of taxable investment grade debt issues, including government, corporate, asset-backed and mortgage-backed securities, with maturities of one year or more. This index is designed to represent the performance of the U.S. investment-grade first rate bond market.
The results shown for the foregoing indices assume the reinvestment of net dividends or interest and do not reflect fees, expenses, or taxes. As such, the index returns do not reflect the actual cost of investing in the instruments that comprise each index.
The peer universe of the underlying annuity funds used for the peer group average annual total return calculation is based on a blend of Morningstar peer categories, as shown. Morningstar is an independent mutual fund rating service. A Fund’s performance may be compared to or ranked within a universe of mutual funds with investment objectives and policies similar but not necessarily identical to that of the Fund.
©2014 Morningstar, Inc. All Rights Reserved. The Morningstar information contained herein: (1) is proprietary to Morningstar and/or its content providers; (2) may not be copied or distributed; and (3) is not warranted to be accurate, complete or timely. Neither Morningstar nor its content providers are responsible for any damage or losses relating from any use of this information. Past performance is no guarantee of future results.
The views expressed in this document reflect our judgment as of the publication date and are subject to change at any time without notice.
GE Investment Distributors, Inc., Member of FINRA & SIPC, is the principal underwriter and distributor of the GE Investments Funds, Inc. and a wholly owned subsidiary of GE Asset Management Incorporated, the investment adviser of the Fund.
1
| | |
| Total Return Fund | | (Unaudited) |

Greg Hartch
Executive Vice President and Strategy and Business Development Leader

David Wiederecht
President and Chief Investment Officer — Investment Solutions

Jeffrey Palma
Senior Vice President
The Total Return Fund is managed by a team of portfolio managers that includes Greg Hartch, Jeffrey Palma and David Wiederecht. Messrs. Hartch, Palma and Wiederecht are vested with oversight authority for determining asset allocations for the Fund.
Each of the U.S. equity, international equity and fixed income portions of the Fund are managed by BlackRock Investment Management, LLC, a sub-adviser retained by GE Asset Management. In addition to oversight authority for asset allocation, Messrs. Hartch, Palma and Wiederecht may at times adjust the Fund’s investment techniques, such as investments in derivative instruments and exchange-traded funds.
Greg Hartch is an Executive Vice President and the Strategy and Business Development Leader at GE Asset Management. Effective February 6, 2014 Mr. Hartch relinquished his role as a portfolio manager for the Fund and will serve as
GE Asset Management Chief Risk Officer. He has served as a portfolio manager to the Total Return Fund since January 2011. Mr. Hartch joined GE Asset Management in 2002 and has held various positions at GE Asset Management including Senior Vice President — Alternative Assets from 2002-2004, Director of Fixed Income Research from 2004-2007, Managing Director — International Real Estate from 2007 to 2010 and Senior Vice President — Tactical Asset Allocation from 2010 to 2011. He has served as the Strategy and Business Development Leader since 2011 and became an Executive Vice President in 2013.
David Wiederecht is the President and Chief Investment Officer — Investment Solutions and a Director at GE Asset Management. He has served as a portfolio manager to the Total Return Fund since January 2011. Mr. Wiederecht joined GE Asset Management in 1988 and has held various positions at GE Asset Management including Vice President — Alternative Investments/Private Equity/Hedge Fund from 1998 to 2004, Managing Director — Alternative Investments from 2004 to 2008, and President and Chief Investment Officer — Investment Solutions since 2008.
Jeffrey Palma is a Senior Vice President of GE Asset Management and is a portfolio manager
for Tactical Asset Allocation. He became a member of the portfolio management team for the Total Return Fund in May 2013. Prior to joining GE Asset Management in 2012, Mr. Palma worked for UBS Investment Bank where he held a variety of global research and macro strategy roles supporting UBS’ global equities and fixed income businesses including Managing Director, Head of Global Equity Strategy from 2007 to 2012, Executive Director, Global Asset Allocation Strategist from 2001 to 2007 and Director, U.S. Economist from 1999 to 2001.
| Q. | How did the Total Return Fund perform compared to its benchmark and Morningstar peer group for the twelve-month period ended December 31, 2013? |
| A. | For the twelve-month period ended December 31, 2013, the GE Investments Total Return Fund returned 14.93% for the Class 1 shares and 14.64% for Class 3 shares. The Fund’s broad based benchmarks, the S&P 500® Index (S&P 500 Index), the MSCI All Country World ex-U.S. Index, and the Barclays U.S. Aggregate Bond Index returned 32.39%, 15.29%, and -2.02%, respectively. The Fund’s Morningstar peer group of 313 U.S. Insurance Moderate Allocation funds returned an average of 17.35% over the same period. |
| Q. | What market factors affected the Fund’s performance? |
| A. | Against the still-challenging macro backdrop of the road to recovery from the financial crisis, 2013 proved to be another year of robust returns in global equity markets (aside from emerging markets, which lagged considerably). U.S. equities surged by over 30% and global equities were up by over 20%. Risk asset performance produced strong returns in equity and credit markets as well as peripheral European bonds as credit spreads moved tighter and yields of peripheral European bonds moved sharply lower — back to pre-crisis levels. Government bond yields in the U.S. and ‘core’ Europe moved higher, consistent with the notion that |
2

| | the worst is over from risk, policy, and growth perspectives. The government shutdown and debt ceiling battle in Washington, DC did not cause lasting damage to growth early in the fourth quarter of 2013 and economic data has continued to suggest that the recovery is improving. Meanwhile, the Federal Open Market Committee announced their decision to begin to ‘taper’ asset purchases in January by $10 billion, consistent with improving economic momentum. |
| | This apparent contradiction between actual economic trends and outcomes in financial markets allows for a range of interpretations. However, several issues help to explain this paradox. First, the absence of bad news has been interpreted as good news given a perceived decline in ‘tail risk’. The U.S. fiscal cliff, turmoil in the Middle East, German elections, the U.S. government shutdown, and U.S. debt ceiling debate were all events that likely would have destabilized the economy and markets in recent years, yet none left a lasting impact in 2013. Second, the U.S. economy has shown signs of improvement, albeit modest ones. Indeed, real GDP growth in the U.S. registered only 2% to 2 1⁄2% in 2013. Significantly though, this outcome came against a backdrop of a fiscal drag from tax hikes and sequestration of 1% to 1 1⁄2%. Moreover, housing showed signs of growth in activity and prices, while the ISM index reached a multi-year high. However, we believe one of the key underpinnings for a sustainable recovery is a faster pace of employment and capital expenditure growth. Indeed, these factors, which need to be driven by a more active corporate sector, are critical for the economy’s ability to accelerate from current levels. Finally, global central banks continued to provide significant accommodation in their respective policies. The clear desire for global monetary support (even in the face of the ‘tapering’ of Fed asset purchases) has supported risk appetites. |
| | In 2013, Europe appeared to have exited its recession a bit sooner than expected, though overall activity in the region remained weak. Growth in Europe of around 1% helped take some, though not all, pressure off of government budgets and sovereign bond markets. In Japan, where policy took center stage last year, more work is needed. However, growth and expectations have improved dramatically. Finally, growth in China was around 7.5% — a slower rate than has been the case in recent years. Given China’s |
| | more advanced economic and credit cycles, there is significant focus on the ability to manage this slowdown safely. |
| | The dominant driver of returns in equity markets over the last two years has been a rise in the PE multiple – a natural consequence of robust returns and modest earnings growth. As a result, equity markets are in a somewhat unusual position compared to the last five years in that valuations are no longer below long-term averages. Instead, markets have moved from being ‘cheap’ to ‘fair value’. Valuations in non-U.S. equity markets have converged closer to the U.S. as strong returns have come against a backdrop of softer earnings. |
| | From the lows in bond yields registered in early May 2013, the rise in 10-year Treasury interest rates in the U.S. (more than 140 basis points) has been substantial. The main driver of this move has been the expectation for Fed tapering which, as noted above, was announced at the December FOMC meeting. Corporate bond markets posted solid performance last year with spreads moving tighter to government bond markets through the year. A combination of GDP, earnings, and cash flow growth, strong balance sheets, and favorable policy trends helped support this backdrop for strong excess returns in credit markets. |
| Q. | What were the primary drivers of Fund performance? |
| A. | The Fund’s performance was primarily driven by its asset allocation. A higher allocation to U.S. equities positively impacted the Fund’s performance as equity markets rallied during the period. A lower allocation to fixed income also contributed to positive performance as fixed income underperformed equities during the period. Both the S&P 500 Index and the MSCI All Country World ex-U.S. Index significantly outperformed the Barclays U.S. Aggregate Bond Index over the twelve-month period. |
| Q. | Were there any significant changes to the Fund during the period? |
| A. | The Fund’s exposure to equities, fixed income, and cash remained fairly consistent throughout the period. Allocations within the Fund were periodically rebalanced to stay within guidelines. |
3
| | |
| Total Return Fund | | (Unaudited) |
| | Earlier this year, the Fund transitioned from actively managed investment strategies to a passively managed approach. Throughout the year, within equities, we reduced the Fund’s exposure to core, value, and mid-cap while exposure to international equities, fixed income, and cash was increased to rebalance the Fund and keep equity allocations close to their strategic targets. |
| | Our preference for equities over bonds has been driven by an expectation for bond yields to rise in the short to medium-term, equity valuations that are in line with long-term averages, and our view that the economic recovery will be sustained. Nevertheless, we believe short-term setbacks in the equity markets are likely to continue to occur. We, therefore, favor being disciplined in rebalancing the Fund, rather than simply letting the Fund’s allocation to equities increase significantly. Returns in both bond and equity markets may be more modest and range-bound going forward. We continue to believe it prudent to maintain a diversified portfolio and remain vigilant in the search for attractive investment opportunities. By tactically allocating between U.S. equities, international equities, and fixed income, we believe the Fund will continue to seek to produce attractive returns while maintaining a prudent level of risk. |
4
| | |
| Total Return Fund | | (Unaudited) |
Understanding Your Fund’s Expenses
As a shareholder of the Fund you incur ongoing costs. Ongoing costs include portfolio management fees, distribution and service fees, professional fees, administrative fees and other Fund expenses. The following example is intended to help you understand your ongoing costs (in dollars) of investing in the Fund and to compare these costs with the ongoing costs of investing in other mutual funds.
To illustrate these ongoing costs, we have provided an example and calculated the expenses paid by investors in each share class of the Fund during the period. The information in the following table is based on an investment of $1,000, which is invested at the beginning of the period and held for the entire six-month period ended December 31, 2013.
Actual Expenses
The first section of the table provides information about actual account values and actual expenses. You may use the information in this section, together with the amount you invested, to estimate the expenses that you paid over the period. To do so, simply divide your account value by $1,000 (for example, an $8,600 account value divided by $1,000 = 8.6), then multiply the result by the number given under the heading “Expenses paid during the period” to estimate the expenses you paid on your account during the period.
Hypothetical Example for Comparison Purposes
The second section of the table provides information about hypothetical account values and hypothetical expenses based on the Fund’s actual expense ratio and an assumed rate of return of 5% per year before expenses, which is not the Fund’s actual return. The hypothetical account values and expenses may not be used to estimate the actual ending account balance or expenses you paid for the period. You may use this information to compare the ongoing costs of investing in the Fund and other funds. To do so, compare this 5% hypothetical example with the 5% hypothetical examples that appear in the shareholders reports of other funds.
Please note that the expenses shown in the table are meant to highlight and help you compare ongoing costs only and do not reflect transaction costs, such as sales charges or redemption fees, if any. Therefore, the second section of the table is useful in comparing ongoing costs only, and will not help you determine the relative total costs of owning different funds. Additionally, the expenses shown do not reflect the fees or charges associated with variable contracts through which shares of the Fund are offered.
July 1, 2013 – December 31, 2013
| | | | | | | | | | | | |
| | | Account value at the
beginning of the period ($) | | | Account value at the
end of the period ($) | | | Expenses paid during the period ($)* | |
Actual Fund Return | | | | | | | | | |
Class 1 | | | 1,000.00 | | | | 1,099.90 | | | | 3.18 | |
Class 3 | | | 1,000.00 | | | | 1,098.20 | | | | 4.50 | |
Hypothetical 5% Return (2.5% for the period) | | | | | | | | | |
Class 1 | | | 1,000.00 | | | | 1,022.18 | | | | 3.06 | |
Class 3 | | | 1,000.00 | | | | 1,020.92 | | | | 4.33 | |
| * | Expenses are equal to the Fund’s annualized net expense ratio of 0.60% for Class 1 and 0.85% for Class 3 (for the period July 1, 2013 – December 31, 2013), multiplied by the average account value over the period, multiplied by 184/365 (to reflect the one-half year period). |
5
| | |
| Total Return Fund | | (Unaudited) |
Investment Profile
A mutual fund designed for investors who seek the highest total return, composed of current income and capital appreciation, as is consistent with prudent investment risk. The Fund seeks to achieve its objective by investing primarily in a combination of U.S. and foreign (non-U.S.) equity and debt securities and cash. GE Asset Management utilizes information from its Asset Allocation Committee to allocate the Fund’s assets across various asset classes in order to diversify the Fund’s holdings and to adjust the asset class weightings based on market and economic conditions. Based on GEAM’s asset allocation decision the Fund’s assets are managed by the sub-adviser that employs an indexing investment approach designed to track the performance of three broad base indexes.
Morningstar Performance Comparison
Based on average annual returns for periods ended 12/31/13
| | | | | | | | | | | | | | |
| | | | | One
Year | | | Five
Year | | | Ten
Year | |
Number of Funds in peer group | | | | | 313 | | | | 233 | | | | 150 | |
Peer group average annual total return | | | | | 17.35% | | | | 12.75% | | | | 5.97% | |
Morningstar Category in peer group: U.S. Insurance Moderate Allocation | |
Sector Allocation
as a % of Fair Value of $3,071,622 (in thousands) on December 31, 2013 (b)(c)
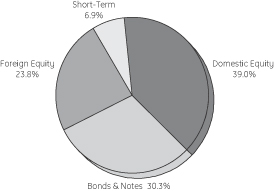
Top Ten Largest Equity Holdings
as of December 31, 2013 (as a % of Fair Value) (b)(c)
| | | | | |
Apple Inc. | | | | 1.09% | |
Exxon Mobil Corp. | | | | 0.95% | |
Google Inc. | | | | 0.68% | |
Microsoft Corp. | | | | 0.61% | |
General Electric Co. | | | | 0.61% | |
Johnson & Johnson | | | | 0.56% | |
Chevron Corp. | | | | 0.52% | |
The Procter & Gamble Co. | | | | 0.48% | |
JPMorgan Chase & Co. | | | | 0.47% | |
Wells Fargo & Co. | | | | 0.47% | |
Change in Value of a $10,000 Investment(a)
Class 1 Shares
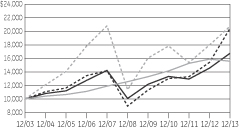
Average Annual Total Return
For the Periods Ended December 31, 2013
Class 1 Shares (Inception date: 7/01/85)
| | | | | | | | | | | | | | | | |
| | | One Year | | | Five
Year | | | Ten
Year | | | Ending value of a
$10,000 investment (a) | |
Total Return Fund | | | 14.93% | | | | 10.73% | | | | 5.31% | | | $ | 16,771 | |
S&P 500 Index | | | 32.39% | | | | 17.94% | | | | 7.40% | | | $ | 20,429 | |
Barclays U.S. Aggregate
Bond Index | | | -2.02% | | | | 4.44% | | | | 4.55% | | | $ | 15,599 | |
MSCI All Country World Index
ex U.S. | | | 15.29% | | | | 12.82% | | | | 7.57% | | | $ | 20,738 | |
Change in Value of a $10,000 Investment(a)
Class 3 Shares
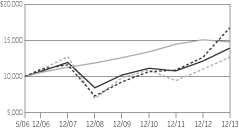
Average Annual Total Return
For the Periods Ended December 31, 2013
Class 3 Shares (Inception date: 5/01/06)
| | | | | | | | | | | | | | | | | | | | |
| | | One
Year | | Five
Year | | Since
Inception | | Ending value of a
$10,000 investment (a) |
Total Return Fund | | | | 14.64% | | | | | 10.46% | | | | | 4.37% | | | | $ | 13,886 | |
S&P 500 Index | | | | 32.39% | | | | | 17.94% | | | | | 6.85% | | | | $ | 16,696 | |
Barclays U.S. Aggregate Bond Index | | | | -2.02% | | | | | 4.44% | | | | | 5.17% | | | | $ | 14,759 | |
MSCI All Country World Index ex U.S. | | | | 15.29% | | | | | 12.82% | | | | | 3.23% | | | | $ | 12,680 | |

| (a) | Ending value of a $10,000 investment for the ten-year period or since inception, whichever is less. |
| (b) | The securities information regarding holdings, allocations and other characteristics is presented to illustrate examples of securities that the Fund has bought and the diversity of areas in which the Fund may invest as of a particular date. It may not be representative of the Fund’s current or future investments and should not be construed as a recommendation to purchase or sell a particular security. |
| (c) | Fair Value basis is inclusive of short-term investment in GE Institutional Money Market Fund Investment Class. |
See Notes to Performance on page 1 for further information, including an explanation of Morningstar peer categories.
Past performance does not predict future performance. The performance shown in the graphs and tables does not reflect the deduction of taxes that a shareholder would pay on Fund distributions or the redemption of Fund shares and does not reflect the fees or charges that would be associated with variable contracts through which shares of the Fund are offered.
6
Total Return Fund
| | |
| Schedule of Investments | | December 31, 2013 |
Total Return Fund
| | | | | | | | | | |
| | | |
| | | Number of Shares | | | Fair
Value | | | |
Equity Securities — 64.6%† | | | | | | | | | | |
|
Consumer Discretionary — 7.7% |
| | | |
Amazon.com Inc. | | | 24,593 | | | $ | 9,807,442 | | | (a) |
Comcast Corp. | | | 172,857 | | | | 8,982,514 | | | |
The Walt Disney Co. | | | 108,403 | | | | 8,281,989 | | | |
Other Securities | | | 9,787,214 | | | | 204,132,922 | | | |
| | | | | | | 231,204,867 | | | |
|
Consumer Staples — 6.1% |
| | | |
Nestle S.A. | | | 126,795 | | | | 9,309,848 | | | |
PepsiCo Inc. | | | 101,725 | | | | 8,437,072 | | | |
Philip Morris International Inc. | | | 106,273 | | | | 9,259,566 | | | |
The Coca-Cola Co. | | | 251,905 | | | | 10,406,196 | | | |
The Procter & Gamble Co. | | | 180,303 | | | | 14,678,467 | | | |
Wal-Mart Stores Inc. | | | 107,316 | | | | 8,444,696 | | | |
Other Securities | | | 6,387,563 | | | | 122,396,716 | | | |
| | | | | | | 182,932,561 | | | |
| | | |
Energy — 6.3% | | | | | | | | | | |
| | | |
Chevron Corp. | | | 127,566 | | | | 15,934,269 | | | |
Exxon Mobil Corp. | | | 289,767 | | | | 29,324,420 | | | |
L&L Energy Inc. | | | 1,397 | | | | 2,347 | | | (a,g) |
Magnum Hunter Resources Corp. | | | 694 | | | | — | | | (a,g) |
Other Securities | | | 9,959,878 | | | | 141,408,835 | | | |
| | | | | | | 186,669,871 | | | |
| | | |
Financials — 13.3% | | | | | | | | | | |
| | | |
Bank of America Corp. | | | 707,494 | | | | 11,015,682 | | | |
Berkshire Hathaway Inc. | | | 119,397 | | | | 14,155,708 | | | (a) |
Citigroup Inc. | | | 201,182 | | | | 10,483,594 | | | |
JPMorgan Chase & Co. | | | 249,350 | | | | 14,581,988 | | | |
Wells Fargo & Co. | | | 317,958 | | | | 14,435,293 | | | |
Other Securities | | | 54,900,241 | | | | 330,894,940 | | | |
| | | | | | | 395,567,205 | | | |
| | | |
Healthcare — 7.1% | | | | | | | | | | |
| | | |
Johnson & Johnson | | | 187,148 | | | | 17,140,885 | | | |
Merck & Company Inc. | | | 193,814 | | | | 9,700,391 | | | |
Pfizer Inc. | | | 429,895 | | | | 13,167,684 | | | |
Other Securities | | | 4,409,776 | | | | 171,228,254 | | | |
| | | | | | | 211,237,214 | | | |
| | | |
Industrials — 7.3% | | | | | | | | | | |
| | | |
General Electric Co. | | | 671,093 | | | | 18,810,737 | | | (b) |
Other Securities | | | 10,422,415 | | | | 199,216,677 | | | |
| | | | | | | 218,027,414 | | | |
| | | |
Information Technology — 9.0% | | | | | | | | | | |
| | | |
Apple Inc. | | | 59,681 | | | | 33,487,606 | | | |
Google Inc. | | | 18,615 | | | | 20,862,017 | | | (a) |
Hanergy Solar Group Ltd. | | | 234,000 | | | | 23,841 | | | (a,g) |
Intel Corp. | | | 329,731 | | | | 8,559,817 | | | |
International Business Machines Corp. | | | 67,704 | | | | 12,699,239 | | | |
| | | | | | | | | | |
| | | |
| | | Number of Shares | | | Fair
Value | | | |
Microsoft Corp. | | | 503,892 | | | $ | 18,860,678 | | | |
Oracle Corp. | | | 232,772 | | | | 8,905,857 | | | |
QUALCOMM Inc. | | | 112,062 | | | | 8,320,604 | | | |
Other Securities | | | 9,628,528 | | | | 158,943,027 | | | |
| | | | | | | 270,662,686 | | | |
| | | |
Materials — 3.5% | | | | | | | | | | |
Hyundai Hysco Company Ltd. | | | 1,390 | | | | 54,660 | | | (g) |
Other Securities | | | 8,081,642 | | | | 104,743,525 | | | |
| | | | | |
| 104,798,185
|
| | |
|
Telecommunication Services — 2.3% |
| | | |
AT&T Inc. | | | 349,431 | | | | 12,285,994 | | | |
Verizon Communications Inc. | | | 189,823 | | | | 9,327,902 | | | |
Other Securities | | | 10,597,220 | | | | 46,735,501 | | | |
| | | | | | | 68,349,397 | | | |
| | | |
Utilities — 2.0% | | | | | | | | | | |
| | | |
Other Securities | | | 6,916,769 | | | | 59,928,275 | | | |
| | | |
Total Equity Securities
(Cost $1,587,627,139) | | | | | | | 1,929,377,675 | | | |
| | | | | | | | | | |
| | | | | | | | | | | | | | |
| | | | |
| Principal
Amount |
| |
| Fair
Value |
| | | | |
Bonds and Notes — 31.2% | | | | | |
| |
U.S. Treasuries — 11.1% | | | | | |
| |
U.S. Treasury Bonds | | | | | |
2.75% | | 11/15/23 - 11/15/42 | | $ | 2,150,000 | | | $ | 1,981,327 | | | | | |
3.00% | | 05/15/42 | | | 11,700,000 | | | | 9,811,550 | | | | (d | ) |
3.75% | | 11/15/43 | | | 1,000,000 | | | | 966,562 | | | | | |
4.38% | | 11/15/39 | | | 11,000,000 | | | | 11,953,909 | | | | | |
4.50% | | 02/15/36 | | | 6,700,000 | | | | 7,454,795 | | | | | |
5.38% | | 02/15/31 | | | 1,850,000 | | | | 2,267,118 | | | | | |
5.50% | | 08/15/28 | | | 4,500,000 | | | | 5,546,952 | | | | | |
6.38% | | 08/15/27 | | | 2,000,000 | | | | 2,655,624 | | | | | |
7.63% | | 02/15/25 | | | 2,000,000 | | | | 2,857,188 | | | | | |
7.88% | | 02/15/21 | | | 5,000,000 | | | | 6,803,125 | | | | | |
8.75% | | 05/15/20 | | | 5,000,000 | | | | 6,976,560 | | | | | |
9.00% | | 11/15/18 | | | 3,000,000 | | | | 4,036,875 | | | | | |
| |
U.S. Treasury Notes | | | | | |
0.25% | | 01/31/15 - 12/31/15 | | | 26,250,000 | | | | 26,227,229 | | | | | |
0.38% | | 03/15/15 - 06/30/15 | | | 30,000,000 | | | | 30,062,100 | | | | | |
0.63% | | 10/15/16 - 04/30/18 | | | 12,000,000 | | | | 11,725,002 | | | | | |
0.75% | | 12/31/17 - 03/31/18 | | | 10,000,000 | | | | 9,765,620 | | | | | |
0.88% | | 12/31/16 - 01/31/18 | | | 8,000,000 | | | | 7,911,254 | | | | | |
0.88% | | 02/28/17 | | | 12,000,000 | | | | 11,999,064 | | | | (d | ) |
1.13% | | 12/31/19 - 03/31/20 | | | 24,800,000 | | | | 23,386,809 | | | | | |
1.25% | | 10/31/15 - 02/29/20 | | | 25,500,000 | | | | 24,996,050 | | | | | |
1.38% | | 07/31/18 | | | 1,000,000 | | | | 991,016 | | | | | |
1.50% | | 07/31/16 | | | 18,000,000 | | | | 18,410,616 | | | | | |
1.63% | | 11/15/22 | | | 4,000,000 | | | | 3,610,624 | | | | | |
1.75% | | 07/31/15 - 05/15/22 | | | 14,700,000 | | | | 14,236,736 | | | | | |
2.00% | | 07/31/20 - 02/15/23 | | | 7,250,000 | | | | 7,053,206 | | | | | |
2.13% | | 05/31/15 - 08/31/20 | | | 24,500,000 | | | | 25,185,904 | | | | | |
2.38% | | 03/31/16 | | | 13,500,000 | | | | 14,082,187 | | | | | |
2.50% | | 08/15/23 | | | 500,000 | | | | 480,156 | | | | | |
See Notes to Schedule of Investments and Notes to Financial Statements.
7
Total Return Fund
| | |
| Schedule of Investments | | December 31, 2013 |
| | | | | | | | | | | | | | |
| | | | |
| | | | | Principal
Amount | | | Fair
Value | | | | |
3.13% | | 05/15/19 | | $ | 7,000,000 | | | $ | 7,459,375 | | | | | |
3.25% | | 12/31/16 | | | 12,000,000 | | | | 12,870,936 | | | | | |
4.50% | | 05/15/17 | | | 15,000,000 | | | | 16,739,070 | | | | | |
| | | | | | | | | 330,504,539 | | | | | |
| |
U.S. Government Sponsored Agency — 0.2% | | | | | |
| | | |
Other Securities | | | 6,000,000 | | | | 5,794,663 | | | | | |
| |
Agency Mortgage Backed – 10.3% | | | | | |
| |
Federal Home Loan Mortgage Corp. | | | | | |
0.85% | | 11/28/16 | | | 700,000 | | | | 697,938 | | | | | |
0.88% | | 10/14/16 - 03/07/18 | | | 7,000,000 | | | | 6,895,929 | | | | | |
1.25% | | 10/02/19 | | | 1,500,000 | | | | 1,421,005 | | | | | |
1.38% | | 05/01/20 | | | 1,500,000 | | | | 1,406,271 | | | | | |
1.79% | | 06/01/43 | | | 521,254 | | | | 524,975 | | | | (c | ) |
2.38% | | 01/13/22 | | | 2,100,000 | | | | 2,007,526 | | | | (d | ) |
2.48% | | 05/01/43 | | | 1,095,944 | | | | 1,072,846 | | | | (c | ) |
2.51% | | 08/01/43 | | | 399,125 | | | | 390,990 | | | | (c | ) |
3.00% | | 05/01/33 - 06/01/43 | | | 10,646,659 | | | | 10,117,246 | | | | | |
3.50% | | 10/01/42 - 07/01/43 | | | 1,296,717 | | | | 1,288,597 | | | | | |
5.00% | | 12/01/22 - 06/01/41 | | | 6,226,786 | | | | 6,733,791 | | | | | |
5.50% | | 01/01/38 - 04/01/39 | | | 1,154,640 | | | | 1,267,661 | | | | | |
6.00% | | 06/01/37 - 11/01/37 | | | 1,101,069 | | | | 1,229,539 | | | | (d | ) |
2.50% | | TBA | | | 7,400,000 | | | | 7,289,061 | | | | (e | ) |
3.00% | | TBA | | | 3,000,000 | | | | 3,034,148 | | | | (e | ) |
3.50% | | TBA | | | 9,950,000 | | | | 9,922,578 | | | | (e | ) |
4.00% | | TBA | | | 10,617,000 | | | | 10,960,505 | | | | (e | ) |
4.50% | | TBA | | | 3,000,000 | | | | 3,174,258 | | | | (e | ) |
Federal National Mortgage Assoc. | |
0.50% | | 09/28/15 | | | 6,000,000 | | | | 6,010,602 | | | | | |
0.75% | | 11/25/16 | | | 1,900,000 | | | | 1,892,957 | | | | | |
0.88% | | 12/20/17 - 05/21/18 | | | 6,900,000 | | | | 6,745,133 | | | | | |
1.94% | | 04/01/43 | | | 877,845 | | | | 890,654 | | | | (c | ) |
2.50% | | 02/01/28 - 09/01/28 | | | 6,824,060 | | | | 6,761,551 | | | | | |
3.00% | | 01/01/28 - 08/01/43 | | | 25,184,911 | | | | 24,591,805 | | | | | |
3.50% | | 10/01/42 | | | 14,781,124 | | | | 14,698,379 | | | | | |
4.00% | | 01/01/41 - 10/01/41 | | | 9,534,234 | | | | 9,823,412 | | | | | |
4.50% | | 10/01/39 - 11/01/43 | | | 17,901,179 | | | | 18,970,768 | | | | | |
4.50% | | 11/01/40 | | | 5,211,800 | | | | 5,523,738 | | | | (d | ) |
5.00% | | 07/01/35 - 08/01/35 | | | 606,605 | | | | 658,504 | | | | (d | ) |
5.00% | | 12/01/39 - 06/01/41 | | | 15,016,430 | | | | 16,395,115 | | | | | |
5.50% | | 12/01/35 - 04/01/38 | | | 5,536,396 | | | | 6,094,489 | | | | | |
5.50% | | 08/01/37 | | | 2,541,135 | | | | 2,793,803 | | | | (d | ) |
6.00% | | 03/01/34 - 08/01/37 | | | 5,980,727 | | | | 6,639,175 | | | | | |
6.00% | | 03/01/35 - 06/01/35 | | | 609,916 | | | | 684,332 | | | | (d | ) |
6.63% | | 11/15/30 | | | 1,200,000 | | | | 1,560,934 | | | | | |
2.50% | | TBA | | | 2,934,000 | | | | 2,864,158 | | | | (e | ) |
3.00% | | TBA | | | 6,300,000 | | | | 6,016,176 | | | | (e | ) |
3.50% | | TBA | | | 15,900,000 | | | | 16,391,578 | | | | (e | ) |
4.00% | | TBA | | | 13,667,000 | | | | 14,205,551 | | | | (e | ) |
4.50% | | TBA | | | 6,900,000 | | | | 7,335,972 | | | | (e | ) |
5.00% | | TBA | | | 3,700,000 | | | | 4,018,258 | | | | (e | ) |
5.50% | | TBA | | | 700,000 | | | | 769,973 | | | | (e | ) |
6.00% | | TBA | | | 333,000 | | | | 369,344 | | | | (e | ) |
Government National Mortgage Assoc. | |
3.00% | | 10/15/42 | | | 6,626,300 | | | | 6,411,885 | | | | | |
3.50% | | 10/20/42 | | | 17,619,282 | | | | 17,802,287 | | | | | |
4.00% | | 12/20/40 - 08/15/41 | | | 10,721,849 | | | | 11,173,359 | | | | | |
4.50% | | 05/20/40 | | | 6,330,572 | | | | 6,786,826 | | | | | |
5.00% | | 08/15/41 | | | 6,566,263 | | | | 7,196,024 | | | | | |
| | | | | | | | | | | | | | |
| | | | |
| | | | | Principal
Amount | | | Fair
Value | | | | |
3.00% | | TBA | | $ | 5,400,000 | | | $ | 5,217,328 | | | | (e | ) |
4.50% | | TBA | | | 1,000,000 | | | | 1,069,141 | | | | (e | ) |
| | | | | | | | | 307,798,075 | | | | | |
| |
Asset Backed — 0.1% | | | | | |
| | | |
Other Securities | | | 3,000,000 | | | | 3,179,745 | | | | | |
| |
Corporate Notes — 8.2% | | | | | |
|
Apple Inc. | |
1.00% | | 05/03/18 | | | 250,000 | | | | 241,737 | | | | | |
General Electric Capital Corp. | |
2.15% | | 01/09/15 | | | 1,000,000 | | | | 1,018,315 | | | | (b | ) |
5.00% | | 01/08/16 | | | 750,000 | | | | 810,533 | | | | (b | ) |
5.50% | | 01/08/20 | | | 1,000,000 | | | | 1,145,163 | | | | (b | ) |
6.75% | | 03/15/32 | | | 1,250,000 | | | | 1,547,881 | | | | (b | ) |
General Electric Co. | |
5.25% | | 12/06/17 | | | 1,000,000 | | | | 1,131,942 | | | | (b | ) |
United Airlines 2013-1 Class A Pass Through Trust | |
4.30% | | 02/15/27 | | | 250,000 | | | | 254,375 | | | | (g | ) |
Other Securities | | | 233,614,275 | | | | 239,014,621 | | | | | |
| | | | | | | | | 245,164,567 | | | | | |
|
Non-Agency Collateralized Mortgage Obligations — 0.6% | |
| | | |
Other Securities | | | 16,407,773 | | | | 17,449,359 | | | | | |
|
Sovereign Bonds — 0.4% | |
| | | |
Other Securities | | | 11,522,000 | | | | 11,854,783 | | | | | |
|
Municipal Bonds and Notes — 0.3% | |
| | | |
Other Securities | | | 7,450,000 | | | | 8,090,456 | | | | | |
|
FNMA – 0.0%* | |
|
Lehman TBA | |
5.50% | | TBA | | | 620,251 | | | | — | **(f,g) | | | | |
| | | |
Total Bonds and Notes
(Cost $953,254,669) | | | | | | | 929,836,187 | | | | | |
| | | |
Total Investments in Securities
(Cost $2,540,881,808) | | | | | | | 2,859,213,862 | | | | | |
| | | | | | | | | | |
Short-Term Investments — 7.1% | | | | | | | | | | |
| | |
GE Institutional Money Market Fund —
Investment Class 0.00%
(Cost $212,407,850) | | | | 212,407,850 | | | | | (h,i | ) |
| | |
Total Investments
(Cost $2,753,289,658) | | | | 3,071,621,712 | | | | | | |
| | |
Liabilities in Excess of Other
Assets, net — (2.9)% | | | | (87,323,951 | ) | | | | | |
| | | | | | | | | | |
| | |
NET ASSETS — 100.0% | | | $ | 2,984,297,761 | | | | | | |
| | | | | | | | | | |
See Notes to Schedule of Investments and Notes to Financial Statements.
8
Total Return Fund
| | |
| Schedule of Investments | | December 31, 2013 |
The Fund had the following long futures contracts open at December 31, 2013:
| | | | | | | | | | | | | | | | | | | | |
| Description | | Expiration
date | | Number
of
Contracts | | Current
Notional Value | | Unrealized
Appreciation |
MSCI EAFE Mini Index Futures | | March 2014 | | | | 23 | | | | $ | 2,205,470 | | | | $ | 94,478 | |
MSCI Emerging Market Mini Futures | | March 2014 | | | | 14 | | | | | 711,760 | | | | | 21,430 | |
Russell 2000 Mini Index Futures | | March 2014 | | | | 8 | | | | | 929,120 | | | | | 46,772 | |
S&P 500 Emini Index Futures | | March 2014 | | | | 250 | | | | | 23,013,750 | | | | | 527,748 | |
S&P Mid 400 Emini Index Futures | | March 2014 | | | | 3 | | | | | 401,820 | | | | | 10,314 | |
| | | | | | | | | | | | | | | | | | |
| | | | | | | | | | | | | | | $ | 700,742 | |
| | | | | | | | | | | | | | | | | | |
The Fund held the following TBA sale commitments as of December 31, 2013:
| | | | | | | | | | | | | | |
| | | | |
| Principal
Amount |
| |
| Fair
Value |
| | | | |
Agency Mortgage Backed — 0.0% | | | | | |
| |
Government National Mortgage Assoc. TBA | | | | | |
3.50% | | TBA | | | | | | | | | | | | |
(Cost $1,010,859) | | $ | (1,000,000 | ) | | $ | (1,008,789 | ) | | | (e | ) |
The Summary Schedule of Investments does not reflect the complete portfolio holdings. It includes the Fund’s 50 largest holdings and each investment of any issuer that exceeds 1% of the Fund’s net assets. “Other Securities” represent all issues not required to be disclosed under the rules adopted by the U.S. Securities and Exchange Commission (“SEC”). In certain instances, securities for which footnotes listed above may otherwise apply are included in the Other Securities caption. The complete schedule of portfolio holdings is available (i) without charge, upon request, by calling (800) 493-3042; and ii) on the SEC’s website at http://www.sec.gov.
The Fund was invested in the following countries at December 31, 2013 (Unaudited):
| | | | |
| Country | | Percentage (based
on Fair Value) | |
United States | | | 73.84% | |
United Kingdom | | | 3.96% | |
Japan | | | 3.64% | |
Canada | | | 1.99% | |
Switzerland | | | 1.82% | |
France | | | 1.81% | |
| | | | |
| Country | | Percentage (based
on Fair Value) | |
Germany | | | 1.76% | |
Australia | | | 1.37% | |
China | | | 0.99% | |
South Korea | | | 0.84% | |
Brazil | | | 0.70% | |
Spain | | | 0.60% | |
Taiwan | | | 0.57% | |
Sweden | | | 0.57% | |
Netherlands | | | 0.56% | |
Hong Kong | | | 0.53% | |
Mexico | | | 0.45% | |
Italy | | | 0.42% | |
South Africa | | | 0.37% | |
Supranational | | | 0.36% | |
India | | | 0.31% | |
Russian Federation | | | 0.30% | |
Singapore | | | 0.25% | |
Belgium | | | 0.22% | |
Denmark | | | 0.20% | |
Malaysia | | | 0.19% | |
Norway | | | 0.16% | |
Finland | | | 0.16% | |
Turkey | | | 0.13% | |
Thailand | | | 0.11% | |
Poland | | | 0.11% | |
Indonesia | | | 0.11% | |
Chile | | | 0.08% | |
Colombia | | | 0.08% | |
Israel | | | 0.08% | |
Philippines | | | 0.08% | |
Ireland | | | 0.05% | |
Austria | | | 0.05% | |
Peru | | | 0.04% | |
Portugal | | | 0.03% | |
Greece | | | 0.02% | |
Uruguay | | | 0.02% | |
New Zealand | | | 0.02% | |
Czech Republic | | | 0.01% | |
Hungary | | | 0.01% | |
Panama | | | 0.01% | |
Egypt | | | 0.01% | |
Luxembourg | | | 0.01% | |
Cayman Islands | | | 0.00% | *** |
Puerto Rico | | | 0.00% | *** |
Bermuda | | | 0.00% | *** |
| | | | |
| | | 100.00% | |
| | | | |
See Notes to Schedule of Investments and Notes to Financial Statements.
9
Total Return Fund
| | |
| Schedule of Investments | | December 31, 2013 |
The Fund’s % share of investment in the various categories, based on Fair Value, is as follows at December 31, 2013 (Unaudited):
| | | | | | | | | | | | |
| Equity Securities | | | | | | | | | |
| Industry | | Domestic | | | Foreign | | | Total | |
Diversified Financial Services | | | 1.82% | | | | 3.65% | | | | 5.47% | |
Pharmaceuticals | | | 2.11% | | | | 1.56% | | | | 3.67% | |
Integrated Oil & Gas | | | 1.69% | | | | 1.38% | | | | 3.07% | |
Integrated Telecommunication Services | | | 0.76% | | | | 0.62% | | | | 1.38% | |
Internet Software & Services | | | 1.15% | | | | 0.19% | | | | 1.34% | |
Oil & Gas Exploration & Production | | | 0.93% | | | | 0.39% | | | | 1.32% | |
Industrial Conglomerates | | | 0.90% | | | | 0.39% | | | | 1.29% | |
Packaged Foods & Meats | | | 0.51% | | | | 0.78% | | | | 1.29% | |
Computer Hardware | | | 1.23% | | | | 0.05% | | | | 1.28% | |
Aerospace & Defense | | | 0.99% | | | | 0.28% | | | | 1.27% | |
Semiconductors | | | 0.64% | | | | 0.54% | | | | 1.18% | |
Automobile Manufacturers | | | 0.23% | | | | 0.82% | | | | 1.05% | |
Biotechnology | | | 0.91% | | | | 0.13% | | | | 1.04% | |
Systems Software | | | 0.99% | | | | 0.03% | | | | 1.02% | |
Electric Utilities | | | 0.60% | | | | 0.36% | | | | 0.96% | |
Life & Health Insurance | | | 0.40% | | | | 0.55% | | | | 0.95% | |
Household Products | | | 0.74% | | | | 0.16% | | | | 0.90% | |
Healthcare Equipment | | | 0.75% | | | | 0.11% | | | | 0.86% | |
Wireless Telecommunication Services | | | 0.05% | | | | 0.77% | | | | 0.82% | |
Tobacco | | | 0.54% | | | | 0.27% | | | | 0.81% | |
Data Processing & Outsourced Services | | | 0.71% | | | | 0.09% | | | | 0.80% | |
Industrial Machinery | | | 0.37% | | | | 0.42% | | | | 0.79% | |
Communications Equipment | | | 0.63% | | | | 0.16% | | | | 0.79% | |
IT Consulting & Other Services | | | 0.63% | | | | 0.13% | | | | 0.76% | |
Soft Drinks | | | 0.67% | | | | 0.07% | | | | 0.74% | |
Oil & Gas Equipment & Services | | | 0.57% | | | | 0.11% | | | | 0.68% | |
Diversified Metals & Mining | | | 0.08% | | | | 0.60% | | | | 0.68% | |
Regional Banks | | | 0.41% | | | | 0.25% | | | | 0.66% | |
Multi-Utilities | | | 0.43% | | | | 0.22% | | | | 0.65% | |
Multi-Line Insurance | | | 0.26% | | | | 0.39% | | | | 0.65% | |
Movies & Entertainment | | | 0.64% | | | | 0.01% | | | | 0.65% | |
Asset Management & Custody Banks | | | 0.50% | | | | 0.11% | | | | 0.61% | |
Restaurants | | | 0.48% | | | | 0.11% | | | | 0.59% | |
Multi-Sector Holdings | | | 0.48% | | | | 0.11% | | | | 0.59% | |
Electrical Components & Equipment | �� | | 0.40% | | | | 0.18% | | | | 0.58% | |
Cable & Satellite | | | 0.45% | | | | 0.13% | | | | 0.58% | |
Railroads | | | 0.32% | | | | 0.25% | | | | 0.57% | |
Internet Retail | | | 0.54% | | | | 0.01% | | | | 0.55% | |
Hypermarkets & Super Centers | | | 0.38% | | | | 0.17% | | | | 0.55% | |
Property & Casualty Insurance | | | 0.33% | | | | 0.21% | | | | 0.54% | |
Diversified Chemicals | | | 0.31% | | | | 0.20% | | | | 0.51% | |
Construction & Farm Machinery | | | 0.33% | | | | 0.17% | | | | 0.50% | |
Apparel, Accessories & Luxury Goods | | | 0.15% | | | | 0.34% | | | | 0.49% | |
Application Software | | | 0.30% | | | | 0.18% | | | | 0.48% | |
Investment Banking & Brokerage | | | 0.34% | | | | 0.13% | | | | 0.47% | |
| | | | | | | | | | | | |
| Industry | | Domestic | | | Foreign | | | Total | |
Food Retail | | | 0.12% | | | | 0.33% | | | | 0.45% | |
Apparel Retail | | | 0.21% | | | | 0.19% | | | | 0.40% | |
Specialty Chemicals | | | 0.24% | | | | 0.15% | | | | 0.39% | |
Consumer Finance | | | 0.36% | | | | 0.03% | | | | 0.39% | |
Home Improvement Retail | | | 0.36% | | | | 0.03% | | | | 0.39% | |
Specialized REITs | | | 0.39% | | | | 0.00% | | | | 0.39% | |
Managed Healthcare | | | 0.36% | | | | 0.02% | | | | 0.38% | |
Air Freight & Logistics | | | 0.29% | | | | 0.08% | | | | 0.37% | |
Oil & Gas Refining & Marketing | | | 0.25% | | | | 0.12% | | | | 0.37% | |
Steel | | | 0.09% | | | | 0.28% | | | | 0.37% | |
Fertilizers & Agricultural Chemicals | | | 0.19% | | | | 0.15% | | | | 0.34% | |
Auto Parts & Equipment | | | 0.15% | | | | 0.19% | | | | 0.34% | |
Retail REITs | | | 0.18% | | | | 0.15% | | | | 0.33% | |
Brewers | | | 0.02% | | | | 0.30% | | | | 0.32% | |
Trading Companies & Distributors | | | 0.08% | | | | 0.24% | | | | 0.32% | |
Drug Retail | | | 0.29% | | | | 0.02% | | | | 0.31% | |
Diversified Real Estate Activities | | | 0.00% | | | | 0.30% | | | | 0.30% | |
Oil & Gas Storage & Transportation | | | 0.16% | | | | 0.13% | | | | 0.29% | |
Specialized Finance | | | 0.21% | | | | 0.08% | | | | 0.29% | |
Computer Storage & Peripherals | | | 0.25% | | | | 0.04% | | | | 0.29% | |
Healthcare Services | | | 0.20% | | | | 0.08% | | | | 0.28% | |
Construction & Engineering | | | 0.06% | | | | 0.21% | | | | 0.27% | |
Industrial Gases | | | 0.15% | | | | 0.11% | | | | 0.26% | |
Commodity Chemicals | | | 0.08% | | | | 0.18% | | | | 0.26% | |
Distillers & Vintners | | | 0.08% | | | | 0.15% | | | | 0.23% | |
Life Sciences Tools & Services | | | 0.20% | | | | 0.03% | | | | 0.23% | |
Diversified Capital Markets | | | 0.00% | | | | 0.22% | | | | 0.22% | |
Broadcasting | | | 0.14% | | | | 0.07% | | | | 0.21% | |
Healthcare Distributors | | | 0.19% | | | | 0.02% | | | | 0.21% | |
Construction Materials | | | 0.02% | | | | 0.18% | | | | 0.20% | |
General Merchandise Stores | | | 0.17% | | | | 0.03% | | | | 0.20% | |
Gas Utilities | | | 0.05% | | | | 0.15% | | | | 0.20% | |
Oil & Gas Drilling | | | 0.08% | | | | 0.11% | | | | 0.19% | |
Casinos & Gaming | | | 0.04% | | | | 0.15% | | | | 0.19% | |
Personal Products | | | 0.06% | | | | 0.13% | | | | 0.19% | |
Semiconductor Equipment | | | 0.10% | | | | 0.08% | | | | 0.18% | |
Department Stores | | | 0.08% | | | | 0.10% | | | | 0.18% | |
Building Products | | | 0.03% | | | | 0.14% | | | | 0.17% | |
Hotels, Resorts & Cruise Lines | | | 0.11% | | | | 0.05% | | | | 0.16% | |
Publishing | | | 0.03% | | | | 0.13% | | | | 0.16% | |
Footwear | | | 0.13% | | | | 0.02% | | | | 0.15% | |
Diversified REITs | | | 0.03% | | | | 0.12% | | | | 0.15% | |
Electronic Equipment & Instruments | | | 0.01% | | | | 0.14% | | | | 0.15% | |
Airlines | | | 0.09% | | | | 0.06% | | | | 0.15% | |
Advertising | | | 0.06% | | | | 0.09% | | | | 0.15% | |
Gold | | | 0.02% | | | | 0.12% | | | | 0.14% | |
Research & Consulting Services | | | 0.07% | | | | 0.07% | | | | 0.14% | |
Reinsurance | | | 0.03% | | | | 0.10% | | | | 0.13% | |
Automotive Retail | | | 0.11% | | | | 0.02% | | | | 0.13% | |
Electronic Components | | | 0.00% | | | | 0.13% | | | | 0.13% | |
Heavy Electrical Equipment | | | 0.00% | | | | 0.12% | | | | 0.12% | |
Insurance Brokers | | | 0.12% | | | | 0.00% | | | | 0.12% | |
See Notes to Schedule of Investments and Notes to Financial Statements.
10
Total Return Fund
| | |
| Schedule of Investments | | December 31, 2013 |
| | | | | | | | | | | | |
| Industry | | Domestic | | | Foreign | | | Total | |
Electronic Manufacturing Services | | | 0.02% | | | | 0.10% | | | | 0.12% | |
Residential REITs | | | 0.10% | | | | 0.01% | | | | 0.11% | |
Environmental & Facilities Services | | | 0.09% | | | | 0.02% | | | | 0.11% | |
Specialty Stores | | | 0.10% | | | | 0.01% | | | | 0.11% | |
Agricultural Products | | | 0.07% | | | | 0.03% | | | | 0.10% | |
Tires & Rubber | | | 0.01% | | | | 0.09% | | | | 0.10% | |
Leisure Products | | | 0.06% | | | | 0.04% | | | | 0.10% | |
Office REITs | | | 0.05% | | | | 0.05% | | | | 0.10% | |
Home Building | | | 0.05% | | | | 0.05% | | | | 0.10% | |
Office Electronics | | | 0.03% | | | | 0.07% | | | | 0.10% | |
Paper Products | | | 0.05% | | | | 0.05% | | | | 0.10% | |
Consumer Electronics | | | 0.02% | | | | 0.08% | | | | 0.10% | |
Independent Power Producers & Energy Traders | | | 0.04% | | | | 0.06% | | | | 0.10% | |
Security & Alarm Services | | | 0.06% | | | | 0.04% | | | | 0.10% | |
Real Estate Development | | | 0.00% | | | | 0.10% | | | | 0.10% | |
Thrifts & Mortgage Finance | | | 0.03% | | | | 0.06% | | | | 0.09% | |
Healthcare Supplies | | | 0.03% | | | | 0.06% | | | | 0.09% | |
Diversified Support Services | | | 0.02% | | | | 0.06% | | | | 0.08% | |
Human Resource & Employment Services | | | 0.03% | | | | 0.05% | | | | 0.08% | |
Coal & Consumable Fuels | | | 0.03% | | | | 0.05% | | | | 0.08% | |
Paper Packaging | | | 0.05% | | | | 0.03% | | | | 0.08% | |
Real Estate Operating Companies | | | 0.00% | | | | 0.07% | | | | 0.07% | |
Industrial REITs | | | 0.04% | | | | 0.03% | | | | 0.07% | |
Healthcare Facilities | | | 0.02% | | | | 0.05% | | | | 0.07% | |
Marine | | | 0.01% | | | | 0.06% | | | | 0.07% | |
Food Distributors | | | 0.06% | | | | 0.01% | | | | 0.07% | |
Healthcare Technology | | | 0.05% | | | | 0.01% | | | | 0.06% | |
Highways & Railtracks | | | 0.00% | | | | 0.06% | | | | 0.06% | |
Home Furnishing Retail | | | 0.05% | | | | 0.01% | | | | 0.06% | |
Trucking | | | 0.02% | | | | 0.04% | | | | 0.06% | |
Metal & Glass Containers | | | 0.03% | | | | 0.02% | | | | 0.05% | |
Household Appliances | | | 0.03% | | | | 0.02% | | | | 0.05% | |
Distributors | | | 0.04% | | | | 0.01% | | | | 0.05% | |
Computer & Electronics Retail | | | 0.03% | | | | 0.02% | | | | 0.05% | |
Home Entertainment Software | | | 0.02% | | | | 0.03% | | | | 0.05% | |
Office Services & Supplies | | | 0.02% | | | | 0.03% | | | | 0.05% | |
Motorcycle Manufacturers | | | 0.03% | | | | 0.01% | | | | 0.04% | |
Aluminum | | | 0.02% | | | | 0.02% | | | | 0.04% | |
| | | | | | | | | | | | |
| Industry | | Domestic | | | Foreign | | | Total | |
Home Furnishings | | | 0.03% | | | | 0.01% | | | | 0.04% | |
Water Utilities | | | 0.00% | | | | 0.04% | | | | 0.04% | |
Specialized Consumer Services | | | 0.04% | | | | 0.00% | | | | 0.04% | |
Precious Metals & Minerals | | | 0.00% | | | | 0.04% | | | | 0.04% | |
Education Services | | | 0.01% | | | | 0.02% | | | | 0.03% | |
Alternative Carriers | | | 0.00% | | | | 0.03% | | | | 0.03% | |
Housewares & Specialties | | | 0.03% | | | | 0.00% | | | | 0.03% | |
Technology Distributors | | | 0.02% | | | | 0.01% | | | | 0.03% | |
Mortgage REITs | | | 0.03% | | | | 0.00% | | | | 0.03% | |
Airport Services | | | 0.00% | | | | 0.03% | | | | 0.03% | |
Commercial Printing | | | 0.01% | | | | 0.02% | | | | 0.03% | |
Marine Ports & Services | | | 0.00% | | | | 0.03% | | | | 0.03% | |
Real Estate Services | | | 0.02% | | | | 0.00% | | | | 0.02% | |
Leisure Facilities | | | 0.00% | | | | 0.02% | | | | 0.02% | |
Forest Products | | | 0.01% | | | | 0.00% | | | | 0.01% | |
Photographic Products | | | 0.00% | | | | 0.01% | | | | 0.01% | |
Textiles | | | 0.00% | | | | 0.01% | | | | 0.01% | |
Catalog Retail | | | 0.01% | | | | 0.00% | | �� | | 0.01% | |
| | | | | | | | | | | | |
| | | | | | | | | | | 62.81% | |
| | | | | | | | | | | | |
| | | | | |
| Bonds and Notes | | |
| Sector | | Percentage (based on
Fair Value) |
U.S. Treasuries | | | | 10.76 | % |
Agency Mortgage Backed | | | | 10.02 | % |
Corporate Notes | | | | 7.98 | % |
Non-Agency Collateralized Mortgage Obligations | | | | 0.57 | % |
Sovereign Bonds | | | | 0.39 | % |
Municipal Bonds and Notes | | | | 0.26 | % |
U.S. Government Sponsored Agencies | | | | 0.19 | % |
Asset Backed | | | | 0.10 | % |
| | | | | |
| | | | 30.27 | % |
| | | | | |
| |
| Short-Term Investments | | |
Short-Term Investments | | | | 6.92 | % |
| | | | | |
| | | | 6.92 | % |
| | | | | |
| | | | 100.00 | % |
| | | | | |
See Notes to Schedule of Investments and Notes to Financial Statements.
11
| | |
| Notes to Schedules of Investments | | December 31, 2013 |
The views expressed in this document reflect our judgment as of the publication date and are subject to change at any time without notice. The securities cited may not be representative of the Fund’s future investments and should not be construed as a recommendation to purchase or sell a particular security. See the Fund’s summary prospectus and statutory prospectus for complete descriptions of investment objectives, policies, risks and permissible investments.
| (a) | Non-income producing security. |
| (b) | General Electric Co. is the parent company of GEAM, the Fund’s investment adviser. |
| (c) | Variable or floating rate security. The stated rate represents the rate at December 31, 2013. |
| (d) | At December 31, 2013, all or a portion of this security was pledged to cover collateral requirements for futures and/or TBA’s. |
| (e) | Settlement is on a delayed delivery or when-issued basis with final maturity to be announced (TBA) in the future. |
| (f) | Security is in default. |
| (g) | Security is fair valued by the Valuation Committee, in accordance with the procedures approved by the Fund’s Board of Directors. |
| (h) | Coupon amount represents effective yield. |
| (i) | GE Asset Management Incorporated (“GEAM”), the investment adviser of the Fund, also serves as investment adviser of the GE Institutional Money Market Fund. |
| ** | Amount is less than $0.50. |
| † | Percentages are based on net assets as of December 31, 2013. |
Abbreviations:
| | |
REIT | | Real Estate Investment Trust |
| |
TBA | | To Be Announced |
12
Financial Highlights
Selected data based on a share outstanding throughout the fiscal years indicated
| | | | | | | | | | | | | | | | | | | | |
| | | CLASS 1 | |
| | | 12/31/13 | | | 12/31/12 | | | 12/31/11 | | | 12/31/10 | | | 12/31/09 | |
| Inception date | | | — | | | | — | | | | — | | | | — | | | | 7/1/85 | |
Net asset value, beginning of period | | $ | 17.35 | | | $ | 15.66 | | | $ | 16.42 | | | $ | 15.18 | | | $ | 12.75 | |
Income/(loss) from investment operations: | | | | | | | | | | | | | | | | | | | | |
Net investment income | | | 0.29 | | | | 0.28 | | | | 0.31 | | | | 0.23 | * | | | 0.20 | * |
Net realized and unrealized gains/(losses) on investments | | | 2.29 | | | | 1.68 | | | | (0.78) | | | | 1.23 | | | | 2.45 | |
Total income/(loss) from investment operations | | | 2.58 | | | | 1.96 | | | | (0.47) | | | | 1.46 | | | | 2.65 | |
Less distributions from: | | | | | | | | | | | | | | | | | | | | |
Net investment income | | | 0.29 | | | | 0.27 | | | | 0.29 | | | | 0.22 | | | | 0.19 | |
Net realized gains | | | 0.93 | | | | — | | | | — | | | | — | | | | — | |
Return of capital | | | — | | | | — | | | | — | | | | — | | | | 0.03 | |
Total distributions | | | 1.22 | | | | 0.27 | | | | 0.29 | | | | 0.22 | | | | 0.22 | |
Net asset value, end of period | | $ | 18.71 | | | $ | 17.35 | | | $ | 15.66 | | | $ | 16.42 | | | $ | 15.18 | |
TOTAL RETURN(a) | | | 14.93% | | | | 12.55% | | | | (2.85)% | | | | 9.64% | | | | 20.81% | |
| | | | | |
RATIOS/SUPPLEMENTAL DATA: | | | | | | | | | | | | | | | | | | | | |
Net assets, end of period (in thousands) | | $ | 1,046,388 | | | $ | 1,015,136 | | | $ | 1,006,391 | | | $ | 1,152,587 | | | $ | 1,131,038 | |
Ratios to average net assets: | | | | | | | | | | | | | | | | | | | | |
Net investment income | | | 1.50% | | | | 1.45% | | | | 1.67% | | | | 1.51% | | | | 1.47% | |
Net expenses | | | 0.60% | (b) | | | 0.73% | (b) | | | 0.74% | (b)(c) | | | 0.69% | (b)(c) | | | 0.67% | (b)(c) |
Gross expenses | | | 0.61% | | | | 0.74% | | | | 0.76% | | | | 0.73% | | | | 0.70% | |
Portfolio turnover rate | | | 175% | | | | 168% | | | | 195% | | | | 148% | | | | 174% | |
| | | | | | | | | | | | | | | | | | | | |
| | | CLASS 3 | |
| | | 12/31/13 | | | 12/31/12 | | | 12/31/11 | | | 12/31/10 | | | 12/31/09 | |
| Inception date | | | — | | | | — | | | | — | | | | — | | | | 5/1/06 | |
Net asset value, beginning of period | | $ | 17.30 | | | $ | 15.62 | | | $ | 16.38 | | | $ | 15.15 | | | $ | 12.73 | |
Income/(loss) from investment operations: | | | | | | | | | | | | | | | | | | | | |
Net investment income | | | 0.24 | | | | 0.20 | | | | 0.24 | | | | 0.19 | * | | | 0.17 | * |
Net realized and unrealized gains/(losses) on investments | | | 2.28 | | | | 1.71 | | | | (0.75) | | | | 1.23 | | | | 2.45 | |
Total income/(loss) from investment operations | | | 2.52 | | | | 1.91 | | | | (0.51) | | | | 1.42 | | | | 2.62 | |
Less distributions from: | | | | | | | | | | | | | | | | | | | | |
Net investment income | | | 0.24 | | | | 0.23 | | | | 0.25 | | | | 0.19 | | | | 0.17 | |
Net realized gains | | | 0.93 | | | | — | | | | — | | | | — | | | | — | |
Return of capital | | | — | | | | — | | | | — | | | | — | | | | 0.03 | |
Total distributions | | | 1.17 | | | | 0.23 | | | | 0.25 | | | | 0.19 | | | | 0.20 | |
Net asset value, end of period | | $ | 18.65 | | | $ | 17.30 | | | $ | 15.62 | | | $ | 16.38 | | | $ | 15.15 | |
TOTAL RETURN(a) | | | 14.64% | | | | 12.25% | | | | (3.10)% | | | | 9.37% | | | | 20.57% | |
| | | | | |
RATIOS/SUPPLEMENTAL DATA: | | | | | | | | | | | | | | | | | | | | |
Net assets, end of period (in thousands) | | $ | 1,937,910 | | | $ | 1,769,140 | | | $ | 1,624,263 | | | $ | 1,691,910 | | | $ | 1,421,191 | |
Ratios to average net assets: | | | | | | | | | | | | | | | | | | | | |
Net investment income | | | 1.25% | | | | 1.20% | | | | 1.42% | | | | 1.26% | | | | 1.26% | |
Net Expenses | | | 0.85% | (b) | | | 0.98% | (b) | | | 0.99% | (b)(c) | | | 0.94% | (b)(c) | | | 0.87% | (b)(c) |
Gross Expenses | | | 0.86% | | | | 0.99% | | | | 1.01% | | | | 0.98% | | | | 0.91% | |
Portfolio turnover rate | | | 175% | | | | 168% | | | | 195% | | | | 148% | | | | 174% | |
The accompanying Notes are an integral part of these financial statements.
13
Notes to Financial Highlights
| (a) | Total returns are historical and assume changes in share price, reinvestment of dividends and capital gains distributions and do not include the effect of insurance contract charges. Past performance does not guarantee future results. |
| (b) | Reflects GEAM’s waiver of a portion of the Fund’s advisory and administrative fee (“management fee”) in an amount equal to the management fee earned by GEAM with respect to the Fund’s investment in an affiliated money market fund managed by GEAM. |
| (c) | Reflects GEAM’s contractual arrangement with the Fund to waive management fee or limit operating expenses. The most recent arrangement expired on April 30, 2011. |
| * | Per share values have been calculated using the average share method. |
The accompanying Notes are an integral part of these financial statements.
14
| | | | |
Statement of Assets and Liabilities
December 31, 2013 | | | |
| |
ASSETS | | | | |
Investments in securities, at Fair Value (cost $2,520,406,999) | | | $2,834,749,291 | |
Investments in affiliated securities, at Fair Value (cost $20,474,809) | | | 24,464,571 | |
Short-term affiliated investments (at amortized cost) | | | 212,407,850 | |
Cash | | | 5,150 | |
Restricted cash | | | 1,879,100 | |
Foreign currency (cost $1,243,488) | | | 1,244,398 | |
Receivable for investments sold | | | 25,629,402 | |
Income receivables | | | 7,594,970 | |
Receivable for fund shares sold | | | 128,621 | |
Variation margin receivable | | | 99,455 | |
Other assets | | | 43,792 | |
Total assets | | | 3,108,246,600 | |
| |
LIABILITIES | | | | |
Payable for investments purchased | | | 119,649,301 | |
TBA sale commitments (cost $1,010,859) | | | 1,008,789 | |
Payable for fund shares redeemed | | | 443,994 | |
Payable to GEAM | | | 852,696 | |
Accrued other expenses | | | 1,994,059 | |
Total liabilities | | | 123,948,839 | |
NET ASSETS | | | $2,984,297,761 | |
| |
NET ASSETS CONSIST OF: | | | | |
Capital paid in | | | $2,661,474,438 | |
Undistributed (distributions in excess of) net investment income | | | (1,471,318 | ) |
Accumulated net realized gain | | | 5,236,396 | |
Net unrealized appreciation (depreciation) on: | | | | |
Investments | | | 318,332,054 | |
TBA sale commitments | | | 2,070 | |
Futures | | | 700,742 | |
Foreign currency transactions | | | 23,379 | |
NET ASSETS | | | $2,984,297,761 | |
| |
Class 1 | | | | |
| |
Net Assets | | | $1,046,387,610 | |
Shares outstanding ($0.01 par value, unlimited shares outstanding) | | | 55,929,491 | |
Net asset value per share | | | $18.71 | |
| |
Class 3 | | | | |
| |
Net Assets | | | $1,937,910,151 | |
Shares outstanding ($0.01 par value, unlimited shares outstanding) | | | 103,886,197 | |
Net asset value per share | | | $18.65 | |
The accompanying Notes are an integral part of these financial statements.
15
| | | | |
Statement of Operations
For the year ended December 31, 2013 | | | |
| |
INVESTMENT INCOME | | | | |
Income | | | | |
Dividend | | $ | 44,862,852 | |
Interest | | | 16,946,575 | |
Income from affiliated investments | | | 752,092 | |
Less: Foreign taxes withheld | | | (1,741,240 | ) |
Total income | | | 60,820,279 | |
| |
Expenses | | | | |
Advisory and administration fees | | | 10,443,451 | |
Distribution and service: | | | | |
Class 1 | | | 2,059,938 | |
Class 3 | | | 8,403,312 | |
Directors’ fees | | | 119,832 | |
Custody and accounting expenses | | | 749,459 | |
Professional fees | | | 192,350 | |
Other expenses | | | 236,956 | |
Total expenses before waivers | | | 22,205,298 | |
Less: Fees waived by the adviser | | | (158,414 | ) |
Net expenses | | | 22,046,884 | |
Net investment income | | $ | 38,773,395 | |
| |
NET REALIZED AND UNREALIZED GAIN (LOSS) ON INVESTMENTS | | | | |
| |
Realized gain (loss) on: | | | | |
Investments | | $ | 259,202,745 | |
Affiliated investments | | | 448,530 | |
Futures | | | 8,948,444 | |
Foreign currency transactions | | | (840,375 | ) |
| |
Increase (decrease) in unrealized appreciation/depreciation on: | | | | |
Investments | | | 93,528,601 | |
TBA sale commitments | | | 2,070 | |
Futures | | | (1,391,149 | ) |
Foreign currency translations | | | 181,771 | |
Net realized and unrealized gain on investments | | | 360,080,637 | |
Net increase in net assets resulting from operations | | $ | 398,854,032 | |
The accompanying Notes are an integral part of these financial statements.
16
| | | | | | | | |
| Statements of Changes in Net Assets | | | | | | |
| | | Year Ended
December 31,
2013 | | | Year Ended
December 31,
2012 | |
| | |
INCREASE (DECREASE) IN NET ASSETS | | | | | | | | |
Operations: | | | | | | | | |
Net investment income | | $ | 38,773,395 | | | $ | 35,464,222 | |
Net realized gain (loss) on investments, futures and foreign currency transactions | | | 267,759,344 | | | | 93,848,538 | |
Net increase (decrease) in unrealized appreciation/depreciation on investments, TBA sale commitments, futures and foreign currency translations | | | 92,321,293 | | | | 189,304,056 | |
Net increase (decrease) from operations | | | 398,854,032 | | | | 318,616,816 | |
Distributions to shareholders from: | | | | | | | | |
Net investment income | | | | | | | | |
Class 1 | | | (15,228,495 | ) | | | (15,803,736 | ) |
Class 3 | | | (23,797,552 | ) | | | (23,490,058 | ) |
Net realized gains | | | | | | | | |
Class 1 | | | (49,022,001 | ) | | | — | |
Class 3 | | | (91,312,277 | ) | | | — | |
Total distributions | | | (179,360,325 | ) | | | (39,293,794 | ) |
Increase (decrease) in assets from operations and distributions | | | 219,493,707 | | | | 279,323,022 | |
Share transactions: | | | | | | | | |
Proceeds from sale of shares | | | | | | | | |
Class 1 | | | 26,130,882 | | | | 8,543,879 | |
Class 3 | | | 156,954,993 | | | | 174,037,895 | |
Value of distributions reinvested | | | | | | | | |
Class 1 | | | 64,250,496 | | | | 15,803,736 | |
Class 3 | | | 115,109,830 | | | | 23,490,058 | |
Cost of shares redeemed | | | | | | | | |
Class 1 | | | (138,486,440 | ) | | | (121,127,522 | ) |
Class 3 | | | (243,430,859 | ) | | | (226,450,122 | ) |
Net increase (decrease) from share transactions | | | (19,471,098 | ) | | | (125,702,076 | ) |
Total increase (decrease) in net assets | | | 200,022,609 | | | | 153,620,946 | |
| | |
NET ASSETS | | | | | | | | |
Beginning of year | | | 2,784,275,152 | | | | 2,630,654,206 | |
End of year | | $ | 2,984,297,761 | | | $ | 2,784,275,152 | |
Undistributed (distributions in excess of) net investment income, end of period | | $ | (1,471,318 | ) | | $ | (158,200 | ) |
| | |
CHANGES IN FUND SHARES | | | | | | | | |
| | |
Class 1 | | | | | | | | |
Shares sold | | | 1,384,675 | | | | 507,656 | |
Issued for distributions reinvested | | | 3,452,471 | | | | 915,098 | |
Shares redeemed | | | (7,430,996 | ) | | | (7,180,857 | ) |
Net increase (decrease) in fund shares | | | (2,593,850 | ) | | | (5,758,103 | ) |
| | |
Class 3 | | | | | | | | |
Shares sold | | | 8,534,065 | | | | 10,337,487 | |
Issued for distributions reinvested | | | 6,202,038 | | | | 1,363,323 | |
Shares redeemed | | | (13,114,545 | ) | | | (13,441,850 | ) |
Net increase (decrease) in fund shares | | | 1,621,558 | | | | (1,741,040 | ) |
The accompanying Notes are an integral part of these financial statements.
17
| | |
| Notes to Financial Statements | | December 31, 2013 |
| 1. | Organization of the Company |
GE Investments Funds, Inc. (the “Company”) was incorporated under the laws of the Commonwealth of Virginia on May 14, 1984 and is registered under the Investment Company Act of 1940, as amended (the “1940 Act”), as an open-end management investment company. The Company is composed of eleven investment portfolios (collectively the “Funds”), although only the following eight are currently being offered: U.S. Equity Fund, S&P 500 Index Fund, Premier Growth Equity Fund, Core Value Equity Fund, Small-Cap Equity Fund, Total Return Fund (the “Fund”), Income Fund, and Real Estate Securities Fund.
Shares of the Funds of the Company are offered only to insurance company separate accounts that fund certain variable life insurance contracts and variable annuity contracts. GE Asset Management Incorporated (“GEAM”) is the investment adviser and administrator of each of the Funds.
The Company currently offers two share classes of the Fund as investment options for variable life insurance and variable annuity contracts — Class 1 and Class 3. Class 3 shares were first offered on May 1, 2006, and Fund shares outstanding prior to May 1, 2006 were designated as Class 1 shares. Each class of shares has different fees and expenses, and as a result, each class of shares will have different share price and performance. Not all variable contracts offer every class of the Fund’s shares.
| 2. | Summary of Significant Accounting Policies |
The preparation of financial statements in conformity with U.S. generally accepted accounting principles (“GAAP”) requires management to make estimates and assumptions that affect the reported amounts of assets and liabilities and disclosure of contingent assets and liabilities at the date of the financial statements and the reported amounts of increases and decreases in net assets from operations during the reporting period. Actual results may differ from those estimates.
Subsequent events after the balance sheet date through the date the financial statements were issued have been evaluated in the preparation of the financial statements. There are no items to report.
The following summarizes the significant accounting policies of the Company:
Securities Valuation and Transactions All investments in securities are recorded at their estimated fair value, as described in Note 3.
Securities transactions are accounted for as of the trade date. Realized gains and losses on investments sold are recorded on the basis of identified cost for both financial statement and federal tax purposes.
The Fund’s income, expenses (other than distribution fees) and realized and unrealized gains and losses are allocated proportionally each day among the share classes based upon the relative net assets of each class.
Foreign Currency Accounting records of the Fund are maintained in U.S. dollars. Investment securities and other assets and liabilities denominated in a foreign currency are translated to U.S. dollars at the prevailing rates of exchange at period end. Purchases and sales of securities, income receipts and expense payments denominated in foreign currencies are translated into U.S. dollars at the prevailing exchange rate on the respective dates of such transactions.
All assets and liabilities of the Fund initially expressed in foreign currency values will be converted into U.S. dollars at the WM/Reuter exchange rate computed at 11:00 a.m., Eastern Time.
The Fund does not isolate the portion of the results of operations resulting from changes in foreign exchange rates from the fluctuations arising from changes in the market prices of securities during the year. Such fluctuations are included in the net realized or unrealized gain or loss from investments. Net realized gains or losses on foreign currency transactions represent net gains or losses on sales and maturities of foreign currency contracts, disposition of foreign currencies, the difference between the amount of net investment income and withholding taxes accrued and the U.S. dollar amount actually received or paid, and gains or losses between the trade and settlement date on purchases and sales of foreign securities. Net unrealized foreign exchange gains and losses arising from changes in the value of other assets and liabilities (including foreign currencies and open foreign currency contracts) as a result of changes in foreign exchange rates are included as increases or decreases in unrealized appreciation/depreciation on foreign currency related transactions.
Derivatives The Fund is subject to equity price risk, interest rate risk, credit risk, and foreign currency exchange rate risk in the normal course of pursuing its investment objective. The Fund may enter into derivative transactions (such as options, futures, and options on futures) to gain market exposure to a certain type of broad-based index as an alternative to investing directly in the securities representing such index.
18
| | |
| Notes to Financial Statements | | December 31, 2013 |
Futures Contracts A futures contract represents a commitment for the future purchase or sale of an asset at a specified price on a specified date. During the year ended December 31, 2013, the Fund invested in futures contracts on various stock indices, bonds and notes to gain equity exposure and to manage duration of fixed income securities. Buying futures tends to increase a Fund’s exposure to the underlying instrument while selling futures tends to decrease a Fund’s exposure to the underlying instrument, or hedge other Fund investments. The Fund will not enter into a transaction involving futures for speculative purposes. With futures contracts, there is minimal counterparty credit risk to the Fund since futures contracts are exchange traded and the exchange’s clearinghouse, as counterparty to all traded futures, guarantees the futures against default. The Fund’s risks in using these contracts include changes in the value of the underlying instruments, non-performance of the counterparties under the contracts’ terms and changes in the liquidity of the secondary market for the contracts. Futures contracts are valued at the settlement price established each day by the board of trade or exchange on which they principally trade.
Upon entering into a financial futures contract, the Fund is required to pledge to the broker an amount of cash and/or other assets equal to a certain percentage of the contract amount, known as initial margin deposit. Subsequent payments, known as variation margin, are made or received by the Fund each day, depending on the daily fluctuation in the fair value of the underlying security. The Fund records an unrealized gain or loss equal to the daily variation margin. Should market conditions move unexpectedly, the Fund may not achieve the anticipated benefits of the futures contracts and may incur a loss. The Fund recognizes a realized gain or loss on the expiration or closing of a futures contract.
When-Issued Securities and Forward Commitments The Fund may purchase or sell securities on a when issued or forward commitment basis. These transactions are arrangements in which the Fund purchases and sells securities with payment and delivery scheduled a month or more after entering into the transaction. The price of the underlying securities and the date when these securities will be delivered and paid for are fixed at the time the transaction is negotiated. Losses may arise due to changes in the market value of the underlying securities or if the counterparty does not perform under the commitments. In connection with such purchases, the Fund maintains cash or liquid assets in an amount equal to the purchase commitments for such underlying securities until settlement date and for sales
commitments the Fund maintains equivalent deliverable securities as “cover” for the transaction. Unsettled commitments are valued at the current market value of the underlying security. Daily fluctuations in the value of such commitments are recorded as unrealized gains or losses. The Fund will not enter into such commitments for the purpose of investment leverage.
Forward Foreign Currency Exchange Contracts The Fund may enter into forward foreign currency exchange contracts to facilitate transactions in foreign denominated securities and to manage the Fund’s currency exposure. Forward foreign currency exchange contracts are valued at the mean between the bid and the offered forward rates as last quoted by a recognized dealer. The aggregate principal amounts of the contracts are not recorded in the Fund’s financial statements. Such amounts appear under the caption Forward Foreign Currency Contracts in the Schedules of Investments. Fluctuations in the value of the contracts are recorded in the Statements of Assets and Liabilities as an asset (or liability) and in the Statements of Operations as unrealized appreciation (depreciation) until the contracts are closed, when they are recorded as realized gains or losses on foreign currency related transactions. The Fund’s risks in using these contracts include changes in the value of foreign currency or the possibility that the counterparties do not perform under the contracts’ terms. When the Fund enters into a forward foreign currency exchange contract, it is required to segregate cash or liquid securities with its custodian in an amount equal to the value of the Fund’s total assets committed to the consummation of the forward contract. If the value of the segregated securities declines, additional cash or securities are segregated so that the value of the account will equal the amount of the Fund’s commitment with respect to the contract.
Investments in Foreign Markets Investments in foreign markets involve special risks and considerations not typically associated with investing in the United States. These risks include revaluation of currencies, high rates of inflation, restrictions on repatriation of income and capital, and adverse political and economic developments. Moreover, securities issued in these markets may be less liquid, subject to government ownership controls, tariffs and taxes, subject to delays in settlements, and their prices may be more volatile.
The Fund may be subject to capital gains and repatriation taxes imposed by certain countries in which they invest. Such taxes are generally based upon income and/or capital gains earned or repatriated. Taxes are accrued based on net investment income, net realized gains and net unrealized appreciation as income and/or capital gains are earned.
19
| | |
| Notes to Financial Statements | | December 31, 2013 |
Investment Income Corporate actions (including cash dividends) are recorded on the ex-dividend date, net of applicable withholding taxes, except for certain foreign corporate actions which are recorded as soon after the ex-dividend date as such information becomes available. Withholding taxes in foreign dividends have been provided for in accordance with the Fund’s understanding of the applicable country’s tax rules and rates.
Interest income is recorded on the accrual basis. Accretion of discounts and amortization of premiums on taxable bonds are to the call or maturity date, whichever is shorter, using the effective yield method.
Expenses Fund specific expenses are charged to the Fund that incurs such expenses. Such expenses may include custodial fees, legal and accounting fees, printing costs and registration fees. Expenses that are not fund specific are allocated pro rata across the Funds. Certain class specific expenses (such as distribution fees) are charged to the class that incurs such expense. Expenses of the Fund are generally paid directly by the Fund; however, expenses may be paid by GEAM and reimbursed by the Fund.
Federal Income Taxes The Fund intends to comply with all sections of the Internal Revenue Code applicable to regulated investment companies including the distribution of substantially all of its taxable net investment income and net realized capital gains to its shareholders. Therefore, no provision for federal income tax has been made. The Fund is treated as a separate taxpayer for federal income tax purposes.
The Fund utilizes various methods to measure the fair value of most of its investments on a recurring basis. GAAP establishes a framework for measuring fair value and providing related disclosures. Broadly, the framework requires fair value to be determined based on the exchange price that would be received for an asset or paid to transfer a liability (an exit price) in the principal or most advantageous market for the asset or liability in an orderly transaction between market participants at the measurement date. In the absence of active markets for the identical assets or liabilities, such measurements involve developing assumptions based on market observable data and, in the absence of such data, internal information that is consistent with what market participants would use in a hypothetical transaction that occurs at the measurement date. It also establishes a three-level valuation hierarchy based upon observable and non-observable inputs.
Observable inputs reflect market data obtained from independent sources, while unobservable inputs reflect our market assumptions. Preference is given to observable inputs. These two types of inputs create the following fair value hierarchy:
Level 1 — Quoted prices for identical investments in active markets.
Level 2 — Quoted prices for similar investments in active markets; quoted prices for identical or similar investments in markets that are not active; and model-derived valuations whose inputs are observable or whose significant value drivers are observable.
Level 3 — Significant inputs to the valuation model are unobservable.
Policies and procedures are maintained to value investments using the best and most relevant data available. In addition, pricing vendors are utilized to assist in valuing investments. GEAM performs periodic reviews of the methodologies used by independent pricing services including price validation of individual securities.
Fair Value Measurement The following section describes the valuation methodologies the Fund uses to measure different financial investments at fair value.
The Fund’s portfolio securities are valued generally on the basis of market quotations. Equity securities generally are valued at the last reported sale price on the primary market in which they are traded. Portfolio securities listed on NASDAQ are valued using the NASDAQ Official Closing Price. Level 1 securities primarily include publicly-traded equity securities. If no sales occurred on the exchange or NASDAQ that day, the portfolio security generally is valued using the last reported bid price. In those circumstances the Fund classifies the investment securities in Level 2.
Debt securities (other than short-term securities described below) generally are valued at an evaluated bid price as reported by independent pricing services. The pricing services use various pricing models for each asset class. The inputs and assumptions to the model of the pricing services are derived from market observable sources, including: benchmark yields, reported trades, broker/dealer quotes, issuer spreads, benchmark securities, bids, offers, and other market related data. Since many fixed income securities do not trade on a daily basis, the methodology of the pricing service uses other available information as applicable such as benchmark curves,
20
| | |
| Notes to Financial Statements | | December 31, 2013 |
benchmarking of similar securities, sector groupings, and matrix pricing. Thus, certain securities may not be priced using quoted prices, but rather determined from market observable information. These investments are included in Level 2 and are primarily comprised of corporate fixed income, government, mortgage and asset-backed securities. In the absence of a reliable bid price from such a pricing service, debt securities may be valued based on broker or dealer supplied valuations or quotations. In these infrequent circumstances, pricing services may provide the Fund with valuations that are based on significant unobservable inputs, and in those circumstances the investment securities are classified as Level 3.
The Fund may use non-binding broker or dealer quotes for valuation when there is limited or no relevant market activity for a specific investment or for other investments that share similar characteristics and a price is not provided by a pricing service or is deemed not to be reliable. The Fund has not adjusted the prices obtained. Investment securities priced using non-binding broker or dealer quotes are included in Level 3.
Short-term investments of sufficient credit quality with remaining maturities of sixty days or less at the time of purchase are typically valued on the basis of amortized cost which approximates fair value and these are included in Level 2. If it is determined that amortized cost does not approximate fair value, securities may be valued based on dealer supplied valuations or quotations. In these infrequent circumstances, pricing services may provide the Fund with valuations that are based on significant unobservable inputs, and in those circumstances the investment securities are classified in Level 3.
If prices are not readily available for a portfolio security, or if it is believed that a price for a portfolio security does not represent its fair value, the security may be valued using procedures approved by the Fund’s Board of Directors that are designed to establish its “fair” value. These securities are typically classified in Level 3. Those procedures require that the fair value of a security be established by a valuation committee of GEAM. The valuation committee follows different protocols for different types of investments and circumstances. The fair value procedures may be used to value any investment of the Fund in the appropriate circumstances.
Foreign securities may be valued with the assistance of an independent fair value pricing service in circumstances where it is believed that they have been or would be materially affected by events occurring after the close of
the portfolio security’s primary market and before the close of regular trading on the NYSE. In these circumstances the Fund classifies the investment securities in Level 2. This independent fair value pricing service uses a proprietary model to identify affected securities, taking into consideration various factors, and the fair value of such securities may be something other than the last available quotation or other market price.
All assets and liabilities of the Fund initially expressed in foreign currency values will be converted into U.S. dollars at the WM/Reuters exchange rate computed at 11:00 a.m. Eastern time.
Fair value determinations generally are used for securities whose value is affected by a significant event that will materially affect the value of a security and which occurs subsequent to the time of the close of the principal market on which such security trades but prior to the calculation of the Fund’s NAV.
The value established for such a portfolio security may be different than what would be produced through the use of market quotations or another methodology. Portfolio securities that are valued using techniques other than market quotations, including “fair valued” securities, may be subject to greater fluctuation in their value from one day to the next than would be the case if market quotations were used. In addition, there is no assurance that the Fund could sell a portfolio security for the value established for it at any time and it is possible that the Fund would incur a loss because a portfolio security is sold at a discount to its established value.
Other financial investments are derivative instruments that are not reflected in total investments, such as futures, forwards, swaps, and written options contracts, which are valued based on fair value as discussed above.
The Fund uses closing prices for derivatives included in Level 1, which are traded either on exchanges or liquid over-the counter markets. Derivative assets and liabilities included in Level 2 primarily represent interest rate swaps, cross-currency swaps and foreign currency and commodity forward and option contracts. Derivative assets and liabilities included in Level 3 primarily represent interest rate products that contain embedded optionality or prepayment features.
The inputs or methodology used for valuing securities are not an indication of the risk associated with investing in those securities.
21
| | |
| Notes to Financial Statements | | December 31, 2013 |
The following table presents the Fund’s investments measured at fair value on a recurring basis at December 31, 2013:
| | | | | | | | | | | | | | | | | | | | |
| Investments | | Level 1 | | Level 2 | | Level 3 | | Total |
Investments in Securities† | | | | | | | | | | | | | | | | | | | | |
Domestic Equity | | | $ | 1,198,498,778 | | | | $ | — | | | | $ | 2,347 | | | | $ | 1,198,501,125 | |
Foreign Equity | | | | 730,761,735 | | | | | 36,314 | | | | | 78,501 | | | | | 730,876,550 | |
U.S. Treasuries | | | | — | | | | | 330,504,539 | | | | | — | | | | | 330,504,539 | |
U.S. Government Sponsored Agencies | | | | — | | | | | 5,794,663 | | | | | — | | | | | 5,794,663 | |
Agency Mortgage Backed | | | | — | | | | | 307,798,075 | | | | | — | | | | | 307,798,075 | |
Asset Backed | | | | — | | | | | 3,179,745 | | | | | — | | | | | 3,179,745 | |
Corporate Notes | | | | — | | | | | 244,910,192 | | | | | 254,375 | | | | | 245,164,567 | |
Non-Agency Collateralized Mortgage Obligations | | | | — | | | | | 17,449,359 | | | | | — | | | | | 17,449,359 | |
Sovereign Bonds | | | | — | | | | | 11,854,783 | | | | | — | | | | | 11,854,783 | |
Municipal Bonds and Notes | | | | — | | | | | 8,090,456 | | | | | — | | | | | 8,090,456 | |
Short-Term Investments | | | | 212,407,850 | | | | | — | | | | | — | | | | | 212,407,850 | |
| | | | | | | | | | | | | | | | | | | | |
Total Investments in Securities | | | $ | 2,141,668,363 | | | | $ | 929,618,126 | | | | $ | 335,223 | | | | $ | 3,071,621,712 | |
| | | | | | | | | | | | | | | | | | | | |
Other Financial Instruments* | | | | | | | | | | | | | | | | | | | | |
Futures Contracts — Unrealized Appreciation | | | $ | 700,742 | | | | $ | — | | | | $ | — | | | | $ | 700,742 | |
TBA Sale Commitments | | | | — | | | | | (1,008,789 | ) | | | | — | | | | | (1,008,789 | ) |
| | | | | | | | | | | | | | | | | | | | |
Total Investments in Securities | | | $ | 2,142,369,105 | | | | $ | 928,609,337 | | | | $ | 335,223 | | | | $ | 3,071,313,665 | |
| | | | | | | | | | | | | | | | | | | | |
| † | See Schedule of Investments for industry classification. |
| * | Other financial instruments include derivative instruments such as futures contracts and TBA sale commitments. Amounts shown represent unrealized appreciation (depreciation), at period end. |
The Fund utilized the fair value pricing service on December 31, 2012 due to events occurring after the close of foreign local markets and before the close of regular trading on the NYSE. This resulted in certain foreign securities being classified as Level 2 at the beginning of the period which were classified as Level 1 at December 31, 2013. The value of securities that were transferred to Level 1 from Level 2 as a result was $459,406,346.
There were no other transfers between fair value levels during the period. Transfers between fair value levels are considered to occur at the beginning of the period.
Level 3 investments at the beginning and/or end of the period in relation to net assets were not significant and accordingly, a reconciliation of Level 3 assets for the year ended December 31, 2013 is not presented.
| 4. | Derivatives Transactions |
Shown below are the derivative contracts entered into by the Fund, summarized by primary risk exposure as they appear on the Statement of Assets and Liabilities, all of which are not accounted for as hedging instruments under FASB Accounting Standards Codification (“ASC”) No. 815 Derivatives and Hedging as of December 31, 2013.
| | | | | | | | | | | | |
| | | Asset Derivatives December 31, 2013 | | | Liability Derivatives December 31, 2013 | |
Derivatives not accounted for as hedging instruments under ASC 815 | | Location in the Statements
of Assets and Liabilities | | Fair Value ($) | | | Location in the Statements
of Assets and Liabilities | | Fair
Value ($) | |
Equity Contracts | | Assets, Net Assets — Net Unrealized Appreciation/ (Depreciation) on Futures | | | 700,742* | | | Liabilities, Net Assets — Net Unrealized Appreciation/ (Depreciation) on Futures | | | — | |
| * | Includes cumulative unrealized appreciation/(depreciation) of futures contracts as reported in the Schedule of Investments and within the components of the net assets section of the Statement of Assets and Liabilities. Only the current day’s variation margin is reported within the Assets and/or Liabilities section on the Statement of Assets and Liabilities. |
22
| | |
| Notes to Financial Statements | | December 31, 2013 |
Shown below are the effects of derivative instruments on the Fund’s Statement of Operation, summarized by primary risk exposure all of which are not accounted for as hedging instruments under ASC 815.
| | | | | | | | | | | | | | |
Derivatives not accounted for as hedging instruments under ASC 815 | | Location in the Statements of Operations | | Total Notional Amount of Futures Contracts/Foreign
Currency Forward Contracts Purchased/(Sold) ($) | | | Realized Gain (Loss) on Derivatives Recognized in Income ($) | | | Change in Unrealized Appreciation (Depreciation) on Derivatives Recognized in Income ($) | |
Equity Contracts | | Realized gain/(loss) on futures, Increase/(decrease) in unrealized appreciation/ (depreciation) on Futures | |
| 240,127,712/
(303,427,775) |
| | | 9,149,757 | | | | (860,463) | |
Interest Rate Contracts | | Realized gain/(loss) on futures, Increase/(decrease) in unrealized appreciation/ (depreciation) on Futures | |
| 259,476,248/
(281,172,271) |
| | | (201,313) | | | | (530,686) | |
Foreign Currency Forward Exchange Contracts | | Realized gain/(loss) on foreign currency related transactions, Increase/ (decrease) in unrealized appreciation/(depreciation) on foreign currency related transactions | |
| —/
(96,115,247) |
| | | 162,810 | | | | 164,796 | |
The Company shares a revolving credit facility of up to $150 million with a number of its affiliates. The credit facility is with its custodian bank, State Street Bank and Trust Company (“State Street”). The revolving credit facility requires the payment of a commitment fee equal to 0.10% per annum on the daily unused portion of the credit facility, payable quarterly. The portion borne by the Funds generally is borne proportionally based upon net assets. In addition, the Company has a $100 million uncommitted, unsecured line of credit with State Street. Generally, borrowings under the credit facilities would accrue interest at the Federal Funds Rate plus 50 basis points and would be borne by the borrowing fund. The maximum amount allowed to be borrowed by any one fund is the lesser of (i) 33.33% of its total assets or (ii) 20% of its net assets. The credit facilities were not utilized by the Fund during the year ended December 31, 2013.
| 6. | Compensation and Fees Paid to Affiliates |
GEAM, a registered investment adviser, was retained by the Company’s Board of Directors effective May 1, 1997 to act as investment adviser and administrator of the Fund.
GEAM’s compensation for investment advisory and administrative services (“management fee”) is paid monthly based on average daily net assets of the Fund at an annualized rate of 0.35%. Prior to the Fund’s restructure on January 23, 2013 (see note 7), GEAM’s compensation for management fee was an annualized rate of 0.50%.
GEAM has a contractual arrangement with the Fund to waive a portion of the Fund’s management fee in the amount equal to the management fee earned by GEAM with respect to the Fund’s investment in the GE Institutional Money Market Fund, if any.
Investor Service Plan — Class 1 and Class 3 Shares The Company adopted an Investor Service Plan (the “Service Plan”) on December 9, 2005 for Class 1 shares and on May 1, 2009 for Class 3 shares of the Fund. The Service Plan was not adopted pursuant to Rule 12b-1 under the 1940 Act. Each Service Plan provides that during any fiscal year, the amount of compensation paid under the Service Plan by the Fund’s Class 1 or Class 3 shares may not exceed the annual rate of 0.20% of the average daily net assets of the Fund attributable to each such class shares.
23
| | |
| Notes to Financial Statements | | December 31, 2013 |
Distribution and Shareholder Service (12b-1) Fees The Company has adopted a Distribution and Service (12b-1) Plan (“12b-1 Plan”) pursuant to Rule 12b-1 under the 1940 Act with respect to each of Class 1 and Class 3 shares of the Fund. Under the 12b-1 Plan for Class 1 shares that became effective May 1, 2009, payments made under the Class 1 Investor Service Plan are covered in the event that any portion of compensation paid pursuant to the Class 1 Investor Service Plan is determined to be an indirect use of the assets attributable to the Class 1 shares to finance distribution of such shares. Under each 12b-1 Plan for Class 3 shares, the Company, on behalf of the Fund, may compensate GE Investment Distributors, Inc. (“GEID”), the distributor of the shares of the Fund, for certain sales services provided by GEID or other broker dealers and investor services provided by GEID or other service providers relating to the Fund’s Class 3 shares, including services to owners or prospective owners of variable contracts issued by insurance companies that offer Class 3 shares as an investment option under such variable contracts. The amount of compensation paid under the 12b-1 Plan may not exceed 0.25% for Class 3 shares, of the average daily net assets of the Fund attributable to such share class. The 12b-1 Plan continues in effect from year to year for so long as such continuance is approved annually by the Board of Directors, including by those directors who are not interested persons of the Company and who have no direct or indirect financial interest in the operation of the 12b-1 Plan or in any agreement related to it. In addition, the Class 3 12b-1 Plan covers payments made under the Class 3 Investor Service Plan in the event that any portion of compensation paid pursuant to the Class 3 Investor Service Plan is determined to be an indirect use of the assets attributable to the Class 3 shares to finance distribution of such shares.
Directors’ Compensation The Fund pays no compensation to its directors who are officers or employees of GEAM or its affiliates. Directors who are not such officers or employees also serve in a similar capacity for other funds advised by GEAM. Compensation paid to non-interested Directors are reflected on the Statement of Operations. These fees are allocated pro rata across all of the mutual fund platforms served by the Directors, including the Fund, and are based upon the relative net assets of each fund within such platforms.
On September 19, 2012, the Board approved a restructuring of the Fund to change the investment management of the Fund’s underlying strategies from
that of active management to passive management, employing an indexing investment approach designed to track the performance of various broad-based indices (the “Fund Restructure”).
In connection with the Fund Restructure, the Board approved the appointment of a new sub-adviser, BlackRock Investment Management, LLC (“BlackRock”), to manage the Fund’s assets using a passive indexation investment approach. GEAM continues to provide asset allocation services to the Fund, and to allocate the Fund’s assets across various asset classes in order to diversify the Fund’s holdings and to adjust the asset class weightings based on market and economic conditions. Based on the asset allocation decisions of GEAM, BlackRock manages the Fund’s assets using an indexing investment approach designed to track the performance of the desired broad-based indices representing the asset classes. The Fund’s investment objective did not change. The Fund Restructure was completed on January 31, 2013, and BlackRock became sub-adviser to the Fund effective February 1, 2013. In connection therewith, both Urdang Securities Management, Inc. and Palisade Capital Management, L.L.C. were terminated as sub-advisers to the Fund effective January 22, 2013. For their services, GEAM pays BlackRock an investment sub-advisory fee, which is calculated as a percentage of the average daily net assets of the Fund.
| 8. | Investment Transactions |
Purchases and Sales of Securities The cost of purchases and the proceeds from sales of investments, other than short-term securities, for the year ended December 31, 2013, were as follows:
| | | | | | |
| U.S. Government Securities | |
| Purchases | | | Sales | |
| $ | 2,308,147,799 | | | $ | 2,150,616,668 | |
| | | | | | |
| Non-U.S. Government Securities | |
| Purchases | | | Sales | |
| $ | 2,540,008,830 | | | $ | 2,712,829,448 | |
24
| | |
| Notes to Financial Statements | | December 31, 2013 |
Affiliated Investments Transactions with affiliated investments for the year ended December 31, 2013 were as follows:
| | | | | | | | | | | | | | | | | | | | | | | | | | | | | | |
Security | | |
| Value,
Beginning of
period |
| | |
| Cost of
purchases |
| | |
| Proceeds
from sales |
| | |
| Dividend/Interest
income |
| | |
| Realized gain
(loss) |
| | |
| Value, end of
period |
|
General Electric, Common Stock | | | $ | — | | | | $ | 19,188,791 | | | | $ | (4,880,148 | ) | | | $ | 605,376 | | | | $ | 448,530 | | | | $ | 18,810,737 | |
General Electric Co., Corporate Notes | | | | — | | | | | 1,173,120 | | | | | — | | | | | 12,155 | | | | | — | | | | | 1,131,942 | |
General Electric Capital Corp., Corporate Notes | | | | — | | | | | 4,645,012 | | | | | — | | | | | 108,827 | | | | | — | | | | | 4,521,892 | |
The Fund is subject to ASC 740, Income Taxes. ASC 740 provides guidance for financial accounting and reporting for the effects of income taxes that result from an entity’s activities during the year. ASC 740 also provides guidance regarding how certain uncertain tax positions should be recognized, measured, presented and disclosed in the financial statements. ASC 740 requires evaluation of tax
positions taken or expected to be taken in the course of preparing the Fund’s tax returns to determine whether the tax positions are “more likely than not” of being sustained by the applicable tax authority. There are no adjustments to the Fund’s net assets required under ASC 740. The Fund’s 2010, 2011, 2012, and 2013 fiscal years tax returns are still open to examination by the Federal and applicable state tax authorities.
At December 31, 2013, information on the tax cost of investments and distributable earnings on a tax basis was as follows:
| | | | | | | | | | | | | | | | | | | | | | | | | | | | |
Cost of
Investments For
Tax Purposes | | Gross Tax | | | Net Tax Appreciation/
(Depreciation) | | | Undistributed | | | | |
| | Appreciation | | | Depreciation | | | Investments | | | Derivatives/
Currency | | | Income | | | Accum.
Capital Gain/(Loss) | | | Late-Year
Losses | |
| $2,758,801,268 | | $ | 386,171,067 | | | $ | (73,350,623 | ) | | $ | 312,820,444 | | | $ | 726,191 | | | $ | — | | | $ | 9,977,430 | | | $ | — | |
As of December 31, 2013, the Fund had no capital loss carryovers. Capital loss carryovers are available to offset future realized capital gains to the extent provided in the Internal Revenue Code and regulations thereunder. To the extent that these carryover losses are used to offset future capital gains, it is probable that gains offset will not be distributed to shareholders because they would be taxable as ordinary income.
During the year ended December 31, 2013, the Fund utilized $102,556,746 of prior year capital loss carryovers.
Any qualified late-year loss is deemed to arise on the first day of the Fund’s next tax year (if the Fund elects to defer such loss). Under this regime, generally, the Fund can elect to defer any post-October capital loss and/or any late-year ordinary loss as defined by the Internal Revenue Code.
The Fund incurred no such losses for the year ended December 31, 2013.
The tax character of distributions paid during the years ended December 31, 2013 and December 31, 2012 were as follows:
| | | | | | | | | | | | | | | |
| Year | | Ordinary
Income | | Long-Term
Capital Gains | | Total |
2013 | | | $ | 38,921,816 | | | | $ | 140,438,509 | | | | $ | 179,360,325 | |
2012 | | | | 39,293,794 | | | | | — | | | | | 39,293,794 | |
Distributions to Shareholders The Fund declares and pays any dividends from net investment income annually. The Fund declares and pays any net realized capital gains in excess of capital loss carryforwards distributions annually. The character of income and gains to be distributed is determined in accordance with income tax regulations which may differ from generally accepted accounting principles. These differences include (but are not limited to) investments in futures, losses deferred due to wash sale transactions, real estate investment trust basis adjustments, capital gain tax, distribution re-designations, partnership basis adjustments, passive foreign investment company gains and losses, foreign currency gains and losses and losses deferred due to offsetting positions. Reclassifications due to permanent book/tax differences are made to the Fund’s capital accounts to reflect income and gains available for
25
| | |
| Notes to Financial Statements | | December 31, 2013 |
distribution (or available capital loss carryovers) under income tax regulations. These reclassifications have no impact on net investment income, realized gains or losses, or the net asset value of the Fund. The calculation of net investment income per share in the Financial Highlights table excludes these adjustments.
The reclassifications for the year ended December 31, 2013 were as follows:
| | | | | | | | | | |
Undistributed
Net Investment
Income | | | Accumulated
Net Realized
Gain (Loss) | | | Capital Paid In | |
| $ | (1,060,466 | ) | | $ | 9,946,431 | | | $ | (8,885,965 | ) |
26
Report of Independent Registered Public Accounting Firm
The Shareholders and Board of Directors
GE Investments Funds, Inc.
We have audited the accompanying statement of assets and liabilities, including the schedule of investments, of the Total Return Fund (the “Fund”), a series of GE Investments Funds, Inc., as of December 31, 2013 and the related statement of operations for the year then ended, statements of changes in net assets for each of the years in the two-year period then ended, and the financial highlights for each of the years in the five-year period then ended. These financial statements and financial highlights are the responsibility of the Fund’s management. Our responsibility is to express an opinion on these financial statements and financial highlights based on our audits.
We conducted our audits in accordance with the standards of the Public Company Accounting Oversight Board (United States). Those standards require that we plan and perform the audit to obtain reasonable assurance about whether the financial statements are free of material misstatement. An audit includes examining, on a test basis, evidence supporting the amounts and disclosures in the financial statements. Our procedures included confirmation of securities owned as of December 31, 2013 by correspondence with the custodian and brokers, or by other appropriate auditing procedures where replies from brokers were not received. An audit also includes assessing the accounting principles used and significant estimates made by management, as well as evaluating the overall financial statement presentation. We believe that our audits provide a reasonable basis for our opinion.
In our opinion, the financial statements and financial highlights referred to above present fairly, in all material respects, the financial position of the Total Return Fund as of December 31, 2013, the results of its operations, changes in its net assets and financial highlights for each of the years described above, in conformity with U.S. generally accepted accounting principles.

Boston, Massachusetts
February 17, 2014
27
| | |
| Tax Information | | (Unaudited) |
For the year ended December 31, 2013, the Fund hereby designates $140,438,509 as capital gain dividends, or the amount ultimately treated as capital gain net income.
The amounts presented herein may differ from amounts presented elsewhere in the financial statements due to differences between tax and financial accounting principles. Please consult a tax advisor if you have any questions about Federal or State income tax laws or on how to prepare your tax returns. If you have specific questions about your Fund account, please consult your investment representative.
28
| | |
| Advisory and Administrative Agreement Approvals | | (Unaudited) |
The Board of Directors of the GE Investments Funds, Inc. (the “Board”), including the independent Board members, considered and unanimously approved the continuance for an additional year of the Fund’s Investment Advisory and Administration Agreement with GE Asset Management Incorporated (“GEAM”) at meetings held on December 11 and December 13, 2013. The Board did not consider the continuance of the Investment Sub-Advisory Agreement with Blackrock Investment Management, LLC due to the fact that renewal of the agreement was not required until December 2014.
In considering whether to approve the Fund’s investment advisory agreement, the Board members considered and discussed a substantial amount of information and analysis provided, at the Board’s request, by GEAM. The Board members also considered detailed information regarding performance and expenses of other investment companies, including those with similar investment strategies and sizes, which was prepared by independent third party provider Morningstar, Inc. (“Morningstar”). The Board members reviewed the fees charged by GEAM for other mutual funds that employ the same investment strategy as the Fund. The Board had the opportunity to ask questions and request additional information in connection with its considerations.
Before approving the Fund’s investment advisory agreement, the independent Board members reviewed the information provided with management of GEAM and with their independent legal counsel. The Board members also reviewed a memorandum prepared by independent legal counsel discussing the legal standards for the consideration of the proposed continuance. The independent Board members discussed the proposed continuance in detail during a private session with their independent legal counsel at which no representatives of GEAM were present. The independent Board members and their independent legal counsel requested, received and considered additional information from GEAM following these sessions.
In advance of the meetings, and in response to their request, the Board members received from GEAM written responses to their inquiries, which included substantial exhibits and other materials related to GEAM’s business and the services it provides to the Fund. The Board members took into account their experience as Board members and particularly their previous consideration of these types of agreements. When feasible, information was presented in a manner to facilitate comparison to prior periods and to reflect certain enhancements to
GEAM’s infrastructure, systems and shareholder servicing model. To focus their review, the Board members asked GEAM management, in its oral presentation, to highlight material differences from the information presented in recent years.
During the meetings, the Board members had an opportunity to discuss this information with GEAM representatives, including senior executives, representatives from the legal, compliance and finance departments, and investment personnel. The Board members posed questions to these representatives and engaged in substantive discussions with them concerning GEAM’s investment process.
In reaching their determination relating to continuance of the Fund’s investment advisory agreement, the Board members considered all factors that they deemed relevant, including the factors discussed below. In their deliberations, the Board members did not identify any particular information that was all-important or controlling, and each Board member may have attributed different weights to the various factors. In particular, the Board members focused on the following:
The Nature, Extent And Quality Of Services Provided.
The Board members reviewed the services provided by GEAM, taking into account their past experiences with GEAM. In connection with their consideration of GEAM’s services, they focused on the favorable attributes of GEAM, including (i) an investment philosophy oriented toward long-term performance; (ii) effective processes used for overseeing sub-advisers; (iii) effective processes used for providing Fund administration, including controllership and compliance functions, the optimization of its Fund administration platform and the continued oversight of the performance of other companies that provide services to the Fund and its shareholders; (iv) highly skilled professionals including analysts, research professionals, traders and portfolio managers with a depth of experience relevant to the Fund; (v) access to significant and enhanced technological resources from which the Fund may benefit; and (vi) a favorable history and reputation. The Board members noted that the Fund represents only a small portion of the assets managed by GEAM, but benefits from a full array of services and resources provided by GEAM.
In light of these discussions, the Board, including the independent Board members, concluded that the services provided by GEAM continue to be satisfactory.
29
| | |
| Advisory and Administrative Agreement Approvals | | (Unaudited) |
Investment Performance Of The Fund.
The Board members considered the investment performance of the Fund for various periods. The Board members reviewed detailed comparisons of the performance of the Fund with the relevant securities index and peer groupings of mutual funds prepared by Morningstar with respect to various periods. The Board members also engaged in detailed discussions with GEAM management about its investment process and performance results. These discussions focused on the Fund’s investment objective, GEAM’s asset allocation process, the number and experience of portfolio management and supporting research personnel, the investment style and approach employed, the likely market cycles for the investment style and the Fund’s relative underperformance. The Board members discussed GEAM’s investment approach with respect to the Fund and the reasons for the Fund’s relative underperformance, and considered how the recent Fund restructuring could impact the Fund’s performance going forward.
The Board, including the independent Board members, concluded that the Fund’s performance was acceptable overall taking into consideration the factors discussed above.
Cost Of The Services Provided And Profits Realized From The Relationship With The Fund.
The Board members considered the fees paid to GEAM by the Fund and the cost of the services provided to the Fund by GEAM. The Board members reviewed the information they had requested from GEAM concerning its profitability. The Board members considered the profit margin information for GEAM’s investment company business as a whole, as well as GEAM’s profitability data for the Fund. The Board members reviewed GEAM’s assumptions and the methods of cost allocation used by GEAM in preparing Fund-specific profitability data. The Board members also discussed with GEAM the basis for its belief that the methods of allocation used were reasonable for each area of its business.
Information was presented regarding the financial condition of GEAM for various past periods. The Board members noted and discussed the additional services provided by GEAM to the Fund compared to other similar mutual funds managed by GEAM. The Board members determined that GEAM should be entitled to earn a
reasonable level of profits for the services it provides to
the Fund. The Board members also recognized that GEAM has made and continues to make significant investments in its business, in fulfilling its obligations to the Fund and supporting its Fund-related activities.
Based on their review, the Board, including the independent Board members, concluded that they were satisfied that the level of profitability achieved by GEAM from its relationship with the Fund was not unreasonable or excessive.
The Extent To Which Economies Of Scale Would Be Realized As The Fund Grows And Whether Fee Levels Would Reflect Such Economies Of Scale.
The Board noted that the Fund experienced a moderate increase in assets over the past year, and the Board members considered the extent to which economies of scale would be realized as the Fund continues to grow and whether fee levels reflect these economies of scale for the benefit of Fund investors.
The Board members considered the substantial infrastructure investments that GEAM has made with respect to its operations and its commitment to continue investing resources to enhance services to Fund shareholders. The Board members recognized the benefits to the Fund of GEAM’s past investment in its operations through expenditures to support its substantial infrastructure, and that, with respect to all GEAM managed mutual funds, GEAM has not yet fully recouped that investment. The Board members also recognized the benefits to the Fund of being able to leverage a favorable cost structure achieved with respect to the Fund’s other operating expenses as a result of GEAM’s large overall base of assets under management and its vendor management practices.
Comparison Of Services To Be Rendered And Fees To Be Paid.
The Board members discussed the services provided to the Fund by GEAM, including GEAM’s asset allocation services and services required to oversee the Fund’s sub-adviser, and the fees charged for those services. The Board members reviewed information concerning the fee and expense ratios for the Fund, and comparative information with respect to peer groupings of mutual funds prepared by Morningstar. They discussed that the Fund’s advisory fee and expense ratios were within the applicable peer group ranges. In light of the foregoing, the
30
| | |
| Advisory and Administrative Agreement Approvals | | (Unaudited) |
Board, including the independent Board members, determined that the advisory fees were reasonable in relation to the services provided to the Fund.
Fall-Out Benefits.
The Board members considered other actual and potential financial benefits that GEAM may derive from their respective relationships with the Fund, including, to the extent applicable, soft dollar commission benefits generated through Fund portfolio transactions. The Board members noted, however, that the Fund benefits from the
vast array of resources available through GEAM, and that the Fund represents only a small portion of the assets managed by GEAM.
Conclusion.
No single factor was determinative to the Board’s decision. Based on their discussion and such other matters as were deemed relevant, the Board, including the independent Board members, concluded that renewal of the investment advisory agreement was in the best interests of the Fund and its shareholders.
31
| | |
| Additional Information | | (Unaudited) |
Information about Directors and Executive Officers:
The business and affairs of the Funds are managed under the direction of the Funds’ Board of Directors. Information pertaining to the Directors and officers of the Funds is set forth below.
Interested Directors and Executive Officers
Michael J. Cosgrove
Address c/o GEAM 1600 Summer St. Stamford, CT 06905
Age 64
Position(s) Held with Fund Chairman of the Board and President
Term of Office and Length of Time Served Until successor is elected and qualified – 17 years
Principal Occupation(s) During Past 5 years President of Mutual Funds and Global Investment Programs of GEAM since November 2011; President and Chief Executive Officer – Mutual Funds and Intermediary Business of GEAM from March 2007 to November 2011; Executive Vice President of GEAM from February 1997 to March 2007; and Executive Vice President-Mutual Funds of GEAM from March 1993 to March 2007. Also serves as Treasurer of GE Foundation since 1988.
Number of Portfolios in Fund Complex Overseen by Director 25
Other Directorships Held by Director Chairman of the Board and President of GE Institutional Funds since 1997; Trustee of Elfun Funds, GE Retirement Savings Plan Funds (formerly GE Savings & Security Funds) and General Electric Pension Trust since 1988; Director of GEAM since 1988; Trustee of Fordham University from 2002 through June 2010 and since July 2011; Director of GE Investment Distributors, Inc. since June 2011; Director of Skin Cancer Foundation since August 2010; Member Board of Governors of the Investment Company Institute since October 2006; Director of GE Asset Management (Ireland) Limited since February 1999; GE Asset Management Funds Plc since 1998; GE Asset Management Canada Company since 1998, GE Asset Management Limited since 1998; Trustee of General Electric Insurance Plan Trust since 1988; and Chairman of the Board and President of GE Funds from 1993 to February 2011.
Matthew J. Simpson
Address c/o GEAM 1600 Summer St. Stamford, CT 06905
Age 52
Position(s) Held with Fund Director and Executive Vice President
Term of Office and Length of Time Served Until successor is elected and qualified – 6 years
Principal Occupation(s) During Past 5 years Executive Vice President, General Counsel and Secretary of GEAM since July 2007; Secretary of Elfun Funds and GE Retirement Savings Plan Funds (formerly GE Savings & Security Funds) since July 2007; Senior Vice President and General Counsel – Marketing and Client Services (formerly Asset Management Services) of GEAM and Senior Vice President and General Counsel of GE Asset Management Services from February 1997 to July 2007; Vice President and Associate General Counsel of GEAM from October 1992 to February 1997; Secretary of GE Institutional Funds and GE Investments Funds, Inc. from 1997 to July 2007 and Vice President from September 2003 to July 2007; Assistant Secretary of Elfun Funds and GE Retirement Savings Plan Funds from 1998 to July 2007 and Vice President from October 2003 to July 2007; and Secretary of GE Funds from 1993 to July 2007 and Vice President from September 2003 to July 2007.
Number of Portfolios in Fund Complex Overseen by Director 25
Other Directorships Held by Director Trustee of Elfun Funds, GE Retirement Savings Plan Funds and General Electric Pension Trust since July 2007; Trustee and Executive Vice President of GE Institutional Funds since July 2007; Director of GEAM since July 2007; Director of GE Investment Distributors, Inc. since June 2011; and Trustee and Executive Vice President of GE Funds from July 2007 to February 2011.
32
| | |
| Additional Information | | (Unaudited) |
Joon Won Choe
Address c/o GEAM 1600 Summer St. Stamford, CT 06905
Age 44
Position(s) Held with Fund Vice President & Secretary
Term of Office and Length of Time Served Until successor is elected and qualified – Vice President and Secretary – 3 years
Principal Occupation(s) During Past 5 years Senior Vice President and Deputy General Counsel at GEAM since March 2011; Vice President and Secretary of GE Institutional Funds since September 2010; Vice President and Assistant Secretary of Elfun Funds and GE Retirement Savings Plan Funds (formerly GE Savings & Security Funds) since September 2010; Senior Vice President and Associate General Counsel at GEAM from June 2010 to March 2011; Vice President and Associate General Counsel of GEAM from November 2005 to June 2010 and Vice President and Secretary of GE Funds from September 2010 to February 2011.
Number of Portfolios in Fund Complex Overseen by Officer N/A
Other Directorships Held by Officer N/A
Robert Herlihy
Address c/o GEAM 1600 Summer St. Stamford, CT 06905
Age 46
Position(s) Held with Fund Chief Compliance Officer
Term of Office and Length of Time Served Until successor is elected and qualified – 8 years
Principal Occupation(s) During Past 5 years Chief Compliance Officer of GEAM, GE Institutional Funds, Elfun Funds, and GE Retirement Savings Plan Funds (formerly GE Savings & Security Funds) since July 2005; Chief Compliance Officer of GE Funds from July 2005 to February 2011 and Manager of Fund Administration at GEAM from 2002-2005.
Number of Portfolios in Fund Complex Overseen by Officer N/A
Other Directorships Held by Officer N/A
Arthur A. Jensen
Address c/o GEAM 1600 Summer St. Stamford, CT 06905
Age 47
Position(s) Held with Fund Treasurer
Term of Office and Length of Time Served Until successor is elected and qualified – 2 years
Principal Occupation(s) During Past 5 Years Treasurer of GE Institutional Funds, Elfun Funds and GE Retirement Savings Plan Funds (formerly GE Savings & Security Funds) since June 2011; Mutual Funds Controller of GEAM since April 2011; Senior Vice President at Citigroup from 2008 to 2010 and Vice President at JPMorgan from 2005 to 2008.
Number of Portfolios in Fund Complex Overseen by Officer N/A
Other Directorships Held by Officer N/A
33
| | |
| Additional Information | | (Unaudited) |
Jeanne M. LaPorta
Address c/o GEAM 1600 Summer St. Stamford, CT 06905
Age 48
Position(s) Held with Fund Vice President
Term of Office and Length of Time Served Until successor is elected and qualified – 10 years
Principal Occupation(s) During Past 5 Years Senior Vice President and Commercial Administrative Officer of GEAM since April 2010; Vice President of GE Institutional Funds since July 2003; Vice President of Elfun Funds and GE Retirement Savings Plan Funds (formerly GE Savings & Security Funds) since October 2003; Secretary of GE Funds from July 2007 to September 2010 and Vice President from July 2007 to February 2011; Senior Vice President and Deputy General Counsel of GEAM from October 2007 to April 2010; Vice President and Assistant Secretary of Elfun Funds and GE Savings & Security Funds from July 2003 to June 2010; and Vice President and Associate General Counsel – Marketing and Client Services (formerly Asset Management Services) at GEAM from May 1997 to October 2007.
Number of Portfolios in Fund Complex Overseen by Officer N/A
Other Directorships Held by Officer N/A
Non-Interested Directors
John R. Costantino
Address c/o GEAM 1600 Summer St. Stamford, CT 06905
Age 67
Position(s) Held with Fund Director
Term of Office and Length of Time Served Until successor is elected and qualified – 17 years
Principal Occupation(s) During Past 5 years Managing General Partner, NGN Capital LLC since 2006; and Treasurer of NeuroScience Research Institute since 1986.
Number of Portfolios in Fund Complex Overseen by Director 17
Other Directorships Held by Director Trustee of GE Institutional Funds since 1997; Trustee of Fordham University from 1989 to 1995 and from 2001 to 2007 and Trustee Emeritus since 2007; Trustee of NeuroScience Research Institute since 1986; Trustee of GE Funds from 1993 to February 2011; and Director of Artes Medical from 2006 to 2008.
34
| | |
| Additional Information | | (Unaudited) |
R. Sheldon Johnson
Address c/o GEAM 1600 Summer St. Stamford, CT 06905
Age 67
Positions(s) Held with Fund Director
Term of office and Length of Time served Unit Successor is elected and qualified – 2 years
Principal Occupation(s) During Past 5 years Head of Global Institutional Equity Sales and Marketing at Morgan Stanley & Co., Inc. from 2002 to 2006 and Managing Director at Morgan Stanley & Co., Inc. from 1988 to 2006.
Number of Portfolios in Fund Complex Overseen by Director 17
Other Directorships Held by Director Trustee of GE Institutional Funds since April 2011 and Trustee of St. Lawrence University since 2003.
Donna M. Rapaccioli
Address c/o GEAM 1600 Summer St. Stamford, CT 06905
Age 51
Position(s) Held with Fund Director
Term of Office and Length of Time Served Until successor is elected and qualified – 2 years
Principal Occupation(s) During Past 5 Years Dean of the Gabelli School of Business since 2007 and Accounting professor since 1987 at Fordham University.
Number of Portfolios in Fund Complex Overseen by Officer 17
Other Directorships Held by Director Trustee of GE Institutional Funds since January 2012 and Trustee of Emmanuel College since 2010.
The Statement of Additional Information for the Funds includes additional information about the Directors and Officers and is available, without charge, upon request by calling 1-800-242-0134.
35
| | |
| Investment Team | | (Unaudited) |
Investment Adviser and Administrator
GE Asset Management Incorporated
Board of Directors
Michael J. Cosgrove, Chairman
John R. Costantino
R. Sheldon Johnson
Donna M. Rapaccioli
Matthew J. Simpson
Secretary
Joon Won Choe
Assistant Secretary
Michelle Matzelle
Treasurer
Arthur A. Jensen
Assistant Treasurer
Robert Meyers
Distributor
GE Investment Distributors, Inc.
Member FINRA and SIPC
Custodian
State Street Bank & Trust Company
At GE Asset Management, we’re dedicated to providing the investment options you’ll need to tailor your financial portfolio to every stage of your life. Each member of the GE Family of Funds is managed according to the same principles of integrity and quality that have guided GE over the past century, and have made it the world-class company that it is today. Each fund draws strength from a heritage of investment management experience that spans more than 80 years. Whether you’re creating a new investment portfolio or adding to an established one, the GE Family of Funds offers an array of professionally managed investment options that will help you meet a lifetime of financial needs.
36
Investment Adviser
GE Asset Management Incorporated
1600 Summer Street
Stamford, CT 06905
or at:
PO Box 7900
Stamford, CT 06904-7900
Distributor
GE Investment Distributors, Inc.
member FINRA and SIPC
1600 Summer Street
Stamford, CT 06905
or at:
PO Box 7900
Stamford, CT 06904-7900
The Fund files its complete schedule of portfolio holdings with the Securities and Exchange Commission for the first and third quarters of each fiscal year on Form N-Q. The Fund’s Forms N-Q, as well as a description of the policies and procedures that the Fund uses to determine how to vote proxies (if any) relating to portfolio securities is available without charge (i) upon request, by calling 1-800-493-3042; (ii) on the Fund’s website at http://www.geam.com; and (iii) on the Commission’s website at http://www.sec.gov. The Fund’s Forms N-Q may be reviewed and copied at the Commission’s Public Reference Room in Washington, DC—information on the operation of the Public Reference Room may be obtained by calling 1-800-SEC-0330.
Information (if any) regarding how the Fund voted proxies relating to portfolio securities during the most recently disclosed 12-month period ended June 30 is available without charge (i) through the Fund’s website at http://www.geam.com; and (ii) on the Commission’s website at http://www.sec.gov.

GE Investments Funds, Inc.
Real Estate Securities Fund
Annual Report
December 31, 2013

GE Investments Funds, Inc.
| | |
| |
| Real Estate Securities Fund | | Contents |
This report is prepared for Policyholders of certain variable contracts and may be distributed to others only if preceded or accompanied by the variable contract’s current prospectus and the current prospectus and/or summary prospectus of the Fund available for investments thereunder.
| | |
| Notes to Performance | | December 31, 2013 (Unaudited) |
The information provided on the performance page relates to the GE Investments Real Estate Securities Fund (the “Fund”).
Total return performance shown in this report for the Fund takes into account changes in share price and assumes reinvestment of dividends and capital gains distributions, if any. Total returns shown are net of Fund fees and expenses but do not reflect fees and charges associated with the variable contracts such as administrative fees, account charges and surrender charges, which, if reflected, would reduce the Fund’s total returns for all periods shown.
The performance data quoted represents past performance; past performance does not guarantee future results. Investment return and principal value will fluctuate so your shares, when redeemed, may be worth more or less than their original cost. Current performance may be higher or lower than the performance data quoted. Periods less than one year are not annualized. Please call 800-493-3042 or visit the Fund’s website at http://www.geam.com for the most recent month-end performance data.
An investment in the Fund is not a deposit of any bank and is not insured or guaranteed by the Federal Deposit Insurance Corporation (FDIC) or any other government agency. An investment in the Fund is subject to risk, including possible loss of principal invested.
FTSE NAREIT Equity REITs Index is an unmanaged index of all tax-qualified equity real estate investment trusts (REITs)
(except Timber REITs or Infrastructure REITs) listed on the New York Stock Exchange, American Stock Exchange and NASDAQ which have 75% or more of their gross invested book assets invested directly or indirectly in the equity ownership of real estate. The results shown for the foregoing index assume the reinvestment of net dividends or interest and do not reflect fees, expenses, or taxes. As such, the index returns do not reflect the actual cost of investing in the instruments that comprise the index.
The peer universe of the underlying annuity funds used for the peer group average annual total return calculation is based on a blend of Morningstar peer categories, as shown. Morningstar is an independent mutual fund rating service. A Fund’s performance may be compared to or ranked within a universe of mutual funds with investment objectives and policies similar but not necessarily identical to that of the Fund.
©2014 Morningstar, Inc. All Rights Reserved. The Morningstar information contained herein: (1) is proprietary to Morningstar and/or its content providers; (2) may not be copied or distributed; and (3) is not warranted to be accurate, complete, or timely. Neither Morningstar nor its content providers are responsible for any damage or losses relating from any use of this information. Past performance is no guarantee of future results.
The views expressed in this document reflect our judgment as of the publication date and are subject to change at any time without notice.
GE Investment Distributors, Inc., Member of FINRA & SIPC, is the principal underwriter and distributor of the GE Investments Funds, Inc. and a wholly owned subsidiary of GE Asset Management Incorporated, the investment adviser of the Fund.
1
| | |
| Real Estate Securities Fund | | (Unaudited) |

CenterSquare Investment Management, Inc. (CenterSquare) (formerly, Urdang Securities Management, Inc.) is the sub-adviser for the Real Estate Securities Fund. CenterSquare is a wholly owned subsidiary of CenterSquare Investment Management Holdings, Inc. (CenterSquare Holdings) (formerly, Urdang Capital Management, Inc.). CenterSquare Holdings is wholly owned by The Bank of New York Mellon Corporation (BNY Mellon) and operates as part of BNY Mellon’s Investment Management Division. As a wholly owned subsidiary of CenterSquare Holdings, CenterSquare is a second tier subsidiary of BNY Mellon. CenterSquare is a registered investment adviser that was formed in 1995 to focus exclusively on opportunities in the real estate securities market, including publicly traded real estate investment trusts (REITs).
The Real Estate Securities Fund is co-managed by Dean Frankel, CFA and Eric Rothman, CFA.
Dean Frankel is Global Co-Head, Real Estate Securities at CenterSquare. He serves as a senior portfolio manager for U.S., North America and Global real estate securities portfolios. Mr. Frankel joined CenterSquare in 1997 and has over 16 years of real estate investment experience. Mr. Frankel is responsible for management of CenterSquare’s proprietary research process including the firm’s proprietary valuation model. In addition, Mr. Frankel analyzes and interprets implications of major events and economic trends while co-managing the daily operations of CenterSquare’s real estate securities group.
Eric Rothman is Portfolio Manager, Real Estate Securities at CenterSquare. As portfolio manager, Mr. Rothman is responsible for market research, sector allocations, and real estate securities analysis across the real estate securities investment universe. Mr. Rothman joined CenterSquare in 2006 and has over 18 years of real estate securities and real estate investment experience, including being a sell-side REIT analyst at Wachovia Securities from 2001 to 2006 and an analyst at AEW Capital Management, LP from 1997 to 2000.
| Q. | How did the GE Investments Real Estate Securities Fund perform compared to its benchmark and Morningstar peer group for the twelve-month period ended December 31, 2013? |
| A. | For the twelve-month period ended December 31, 2013, the GE Investments Real Estate Securities Fund returned 2.60%. The FTSE NAREIT Equity REITs Index, the Fund’s benchmark, returned 2.47% and the Fund’s Morningstar peer group of 41 U.S. Insurance Real Estate funds returned an average of 1.25% over the same period. |
| Q. | What market factors affected the Fund’s performance? |
| A. | The U.S. real estate securities market generated a positive return with the FTSE NAREIT Equity REITs Index posting a total return of 2.47% during the twelve-month period ended December 31, 2013. The broader equity markets outperformed the U.S. REIT market by a wide margin as the S&P 500® Index (S&P 500 Index) and the Dow Jones Industrial Average posted total returns of 32.39% and 29.65%, respectively, for the year. With the equity market fixated on the Federal Reserve commentary and direction of monetary policy, yield-oriented investment vehicles underperformed broad equities both for the quarter and the year, despite the improving macro economy. The 10-year U.S. Treasury closed the year at 3.03%, up 42bps from its September 30, 2013 level following an announcement by the Federal Reserve that it would begin tapering its bond buying program in January 2014. |
| Q. | What were the primary drivers of Fund performance? |
| A. | The Fund outperformed its benchmark by 13 bps in 2013. Both stock selection and sector selection generated strong positive alpha for the year 2013, contributing 108 bps and 36 bps of alpha, respectively. The combined effect of fees, cash, capital flows, intraday trading profits and other items not directly captured by our attribution measurement system combined to reduce relative performance by roughly another 131 bps. The positive contribution from stock selection was broad-based with office and residential picks generating significant alpha. Sector selection outperformance was driven by an underweight to health care sector and overweight to office sector, which more than offset the negative alpha from an earlier overweight to residential. |
| Q. | Were there any significant changes to the Fund during the period? |
| A. | We did not deviate from the investment process, philosophy or approach we have consistently applied since 1995. Since inception, our investment process has included a qualitative assessment of each company relative to its peers. In 2013, a formal qualitative scoring was added as an enhancement. |
2
| | |
| Real Estate Securities Fund | | (Unaudited) |
Understanding Your Fund’s Expenses
As a shareholder of the Fund you incur ongoing costs. Ongoing costs include portfolio management fees, professional fees, administrative fees and other Fund expenses. The following example is intended to help you understand your ongoing costs (in dollars) of investing in the Fund and to compare these costs with the ongoing costs of investing in other mutual funds.
To illustrate these ongoing costs, we have provided an example and calculated the expenses paid by investors in the Fund during the period. The information in the following table is based on an investment of $1,000, which is invested at the beginning of the period and held for the entire six-month period ended December 31, 2013.
Actual Expenses
The first section of the table provides information about actual account values and actual expenses. You may use the information in this section, together with the amount you invested, to estimate the expenses that you paid over the period. To do so, simply divide your account value by $1,000 (for example, an $8,600 account value divided by $1,000 = 8.6), then multiply the result by the number given under the heading “Expenses paid during the period” to estimate the expenses you paid on your account during the period.
Hypothetical Example for Comparison Purposes
The second section of the table provides information about hypothetical account values and hypothetical expenses based on the Fund’s actual expense ratio and an assumed rate of return of 5% per year before expenses, which is not the Fund’s actual return. The hypothetical account values and expenses may not be used to estimate the actual ending account balance or expenses you paid for the period. You may use this information to compare the ongoing costs of investing in the Fund and other funds. To do so, compare this 5% hypothetical example with the 5% hypothetical examples that appear in the shareholders reports of other funds.
Please note that the expenses shown in the table are meant to highlight and help you compare ongoing costs only and do not reflect transaction costs, such as sales charges or redemption fees, if any. Therefore, the second section of the table is useful in comparing ongoing costs only, and will not help you determine the relative total costs of owning different funds. Additionally, the expenses shown do not reflect the fees or charges associated with variable contracts through which shares of the Fund are offered.
July 1, 2013 - December 31, 2013
| | | | | | | | | | | | |
| | | Account value at the beginning of the period ($) | | | Account value at the end of the period ($) | | | Expenses paid
during the period ($)* | |
Actual Fund Return | | | 1,000.00 | | | | 971.10 | | | | 4.67 | |
Hypothetical 5% Return (2.5% for the period) | | | 1,000.00 | | | | 1,020.47 | | | | 4.79 | |
| * | Expenses are equal to the Fund’s annualized net expense ratio of 0.94% (for the period July 1, 2013 - December 31, 2013), multiplied by the average account value over the period, multiplied by 184/365 (to reflect the one-half year period). |
3
| | |
| Real Estate Securities Fund | | (Unaudited) |
A mutual fund designed for investors who seek maximum total return through current income and capital appreciation. The Fund seeks to achieve its investment objective by investing at least 80% of its net assets under normal circumstances in equity securities, such as common and preferred stocks, and debt securities of U.S. issuers that are principally engaged in or related to the real estate industry, including those that own significant real estate assets. The Fund does not invest directly in real estate.
|
| Morningstar Performance Comparison |
Based on average annual returns for periods ended 12/31/13
| | | | | | | | | | | | | | | |
| | | One
Year | | Five
Year | | Ten
Year |
Number of funds in peer group | | | | 41 | | | | | 41 | | | | | 38 | |
Peer group average annual total return | | | | 1.25% | | | | | 15.45% | | | | | 7.95% | |
Morningstar Category in peer group: U.S. Insurance Real Estate | |
as a % of Fair Value of $102,771 (in thousands) on December 31, 2013 (b)(c)
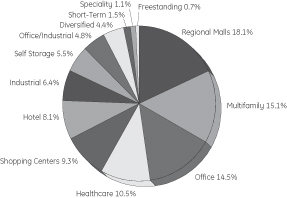
as of December 31, 2013 (as a % of Fair Value) (b)(c)
| | | | |
Simon Property Group Inc. | | | 7.38% | |
Prologis Inc. | | | 4.54% | |
Ventas Inc. | | | 4.37% | |
Boston Properties Inc. | | | 3.91% | |
Host Hotels & Resorts Inc. | | | 3.82% | |
General Growth Properties Inc. | | | 3.52% | |
The Macerich Co. | | | 3.52% | |
Vornado Realty Trust | | | 3.22% | |
Kimco Realty Corp. | | | 3.08% | |
UDR Inc. | | | 2.92% | |
|
| Change in Value of a $10,000 Investment(a) |
Class 1 Shares
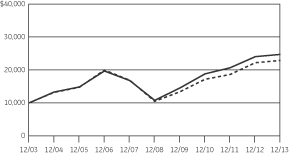

|
| Average Annual Total Return |
for the Periods Ended December 31, 2013
Class 1 Shares (Inception date 05/01/95)
| | | | | | | | | | | | | | | | | | | | |
| | | One Year | | Five Year | | Ten Year | | Ending value of a
$10,000 investment (a) |
Real Estate Securities | | | | 2.60% | | | | | 18.17% | | | | | 9.46% | | | | $ | 24,690 | |
FTSE NAREIT Equity REITs Index | | | | 2.47% | | | | | 16.50% | | | | | 8.42% | | | | $ | 22,847 | |
| (a) | Ending value of a $10,000 investment for the ten-year period or since inception, whichever is less. |
| (b) | The securities information regarding holdings, allocations and other characteristics is presented to illustrate examples of securities that the Fund has bought and the diversity of areas in which the Fund may invest as of a particular date. It may not be representative of the Fund’s current or future investments and should not be construed as a recommendation to purchase or sell a particular security. |
| (c) | Fair Value basis is inclusive of short-term investment in GE Institutional Money Market Fund Investment Class. |
See Notes to Performance on page 1 for further information, including an explanation of Morningstar peer categories.
Past performance does not predict future performance. The performance shown in the graphs and tables does not reflect the deduction of taxes that a shareholder would pay on Fund distributions or the redemption of Fund shares and does not reflect the fees or charges that would be associated with variable contracts through which shares of the Fund are offered.
4
Real Estate Securities Fund
| | |
| Schedule of Investments | | December 31, 2013 |
Real Estate Securities Fund
| | | | | | | | | | |
| | | |
| | | Number of
Shares | | | Fair
Value | | | |
Common Stock (REITs) — 98.7%† |
| |
Diversified — 4.5% | | | |
| | | |
Cousins Properties Inc. | | | 42,020 | | | $ | 432,806 | | | |
Empire State Realty Trust Inc. | | | 53,950 | | | | 825,435 | | | |
Vornado Realty Trust | | | 37,280 | | | | 3,310,091 | | | |
| | | | | | | 4,568,332 | | | |
| | | |
Freestanding — 0.7% | | | | | | | | | | |
| | | |
National Retail Properties Inc. | | | 24,640 | | | | 747,331 | | | |
| | | |
Healthcare — 10.5% | | | | | | | | | | |
| | | |
Aviv REIT Inc. | | | 27,460 | | | | 650,802 | | | |
HCP Inc. | | | 75,890 | | | | 2,756,325 | | | |
Healthcare REIT Inc. | | | 39,800 | | | | 2,132,086 | | | |
National Health Investors Inc. | | | 3,960 | | | | 222,156 | | | |
Omega Healthcare Investors Inc. | | | 16,480 | | | | 491,104 | | | |
Ventas Inc. | | | 78,400 | | | | 4,490,752 | | | |
| | | | | | | 10,743,225 | | | |
| | | |
Hotel — 8.1% | | | | | | | | | | |
| | | |
Ashford Hospitality Prime Inc. | | | 3,530 | | | | 64,246 | | | |
Host Hotels & Resorts Inc. | | | 202,150 | | | | 3,929,796 | | | |
LaSalle Hotel Properties | | | 17,770 | | | | 548,382 | | | |
RLJ Lodging Trust | | | 14,710 | | | | 357,747 | | | |
Strategic Hotels & Resorts Inc. | | | 99,040 | | | | 935,928 | | | (a) |
Sunstone Hotel Investors Inc. | | | 184,880 | | | | 2,477,392 | | | |
| | | | | | | 8,313,491 | | | |
| | | |
Industrial — 6.4% | | | | | | | | | | |
| | | |
EastGroup Properties Inc. | | | 9,530 | | | | 552,073 | | | |
First Industrial Realty Trust Inc. | | | 45,020 | | | | 785,599 | | | |
Prologis Inc. | | | 126,280 | | | | 4,666,046 | | | |
Rexford Industrial Realty Inc. | | | 46,130 | | | | 608,916 | | | |
| | | | | | | 6,612,634 | | | |
| | | |
Multifamily — 15.1% | | | | | | | | | | |
| | | |
American Campus Communities Inc. | | | 32,110 | | | | 1,034,263 | | | |
AvalonBay Communities Inc. | | | 21,350 | | | | 2,524,210 | | | |
BRE Properties Inc. | | | 17,180 | | | | 939,918 | | | |
Camden Property Trust | | | 31,060 | | | | 1,766,693 | | | |
Equity Residential | | | 42,550 | | | | 2,207,069 | | | |
Essex Property Trust Inc. | | | 17,350 | | | | 2,489,898 | | | |
Mid-America Apartment Communities Inc. | | | 25,100 | | | | 1,524,574 | | | |
UDR Inc. | | | 128,600 | | | | 3,002,810 | | | |
| | | | | | | 15,489,435 | | | |
| | | |
Office — 14.5% | | | | | | | | | | |
| | | |
Alexandria Real Estate Equities Inc. | | | 26,700 | | | | 1,698,654 | | | |
Boston Properties Inc. | | | 40,030 | | | | 4,017,811 | | | |
Brandywine Realty Trust | | | 67,890 | | | | 956,570 | | | |
| | | | | | | | | | |
| | | |
| | | Number of
Shares | | | Fair
Value | | | |
| | | |
Douglas Emmett Inc. | | | 7,820 | | | $ | 182,128 | | | |
Highwoods Properties Inc. | | | 77,950 | | | | 2,819,452 | | | |
Hudson Pacific Properties Inc. | | | 32,800 | | | | 717,336 | | | |
Kilroy Realty Corp. | | | 34,690 | | | | 1,740,744 | | | |
SL Green Realty Corp. | | | 29,600 | | | | 2,734,448 | | | |
| | | | | | | 14,867,143 | | | |
| | | |
Office/Industrial — 4.8% | | | | | | | | | | |
| | | |
Duke Realty Corp. | | | 129,060 | | | | 1,941,062 | | | |
Liberty Property Trust | | | 87,595 | | | | 2,966,843 | | | |
| | | | | | | 4,907,905 | | | |
| | | |
Regional Malls — 18.1% | | | | | | | | | | |
| | | |
General Growth Properties Inc. | | | 180,110 | | | | 3,614,808 | | | |
Simon Property Group Inc. | | | 49,870 | | | | 7,588,219 | | | |
Tanger Factory Outlet Centers | | | 91,180 | | | | 2,919,583 | | | |
Taubman Centers Inc. | | | 13,330 | | | | 852,054 | | | |
The Macerich Co. | | | 61,370 | | | | 3,614,079 | | | |
| | | | | | | 18,588,743 | | | |
| | | |
Self Storage — 5.5% | | | | | | | | | | |
| | | |
CubeSmart | | | 50,770 | | | | 809,274 | | | |
Extra Space Storage Inc. | | | 17,410 | | | | 733,483 | | | |
Public Storage | | | 18,770 | | | | 2,825,260 | | | |
Sovran Self Storage Inc. | | | 20,340 | | | | 1,325,558 | | | |
| | | | | | | 5,693,575 | | | |
| | | |
Shopping Centers — 9.4% | | | | | | | | | | |
| | | |
Brixmor Property Group Inc. | | | 30,790 | | | | 625,961 | | | |
DDR Corp. | | | 39,350 | | | | 604,810 | | | |
Federal Realty Investment Trust | | | 17,750 | | | | 1,800,027 | | | |
Kimco Realty Corp. | | | 160,440 | | | | 3,168,690 | | | |
Regency Centers Corp. | | | 59,310 | | | | 2,746,053 | | | |
Retail Properties of America Inc. | | | 51,550 | | | | 655,716 | | | |
| | | | | | | 9,601,257 | | | |
| | | |
Specialty — 1.1% | | | | | | | | | | |
| | | |
Digital Realty Trust Inc. | | | 22,590 | | | | 1,109,622 | | | |
| | | |
Total Common Stock (REITs)
(Cost $102,428,807) | | | | | | | 101,242,693 | | | |
| | | | | | | | | | |
Short-Term Investments — 1.5% | | | |
GE Institutional Money Market Fund — Investment Class 0.00%
(Cost $1,528,597) | | | | | | | 1,528,597 | | | (b,c) |
| | | |
Total Investments
(Cost $103,957,404) | | | | | | | 102,771,290 | | | |
| | | |
Liabilities in Excess of Other Assets,
net — (0.2)% | | | | | | | (168,740 | ) | | |
| | | | | | | | | | |
| | | |
NET ASSETS — 100.0% | | | | | | $ | 102,602,550 | | | |
| | | | | | | | | | |
See Notes to Schedule of Investments and Notes to Financial Statements.
5
| | |
| Notes to Schedules of Investments | | December 31, 2013 |
The views expressed in this document reflect our judgment as of the publication date and are subject to change at any time without notice. The securities cited may not be representative of the Fund’s future investments and should not be construed as a recommendation to purchase or sell a particular security. See the Fund’s summary prospectus and statutory prospectus for complete descriptions of investment objectives, policies, risks and permissible investments.
| (a) | Non-income producing security. |
| (b) | Coupon amount represents effective yield. |
| (c) | GE Asset Management Incorporated (“GEAM”), the investment adviser of the Fund, also serves as investment adviser of the GE Institutional Money Market Fund. |
| † | Percentages are based on net assets as of December 31, 2013. |
Abbreviations:
| | |
| |
REIT | | Real Estate Investment Trust |
6
Financial Highlights
Selected data based on a share outstanding throughout the fiscal years indicated
| | | | | | | | | | | | | | | | | | | | |
| | | 12/31/13 | | | 12/31/12 | | | 12/31/11 | | | 12/31/10 | | | 12/31/09 | |
| Inception date | | | — | | | | — | | | | — | | | | — | | | | 5/1/95 | |
Net asset value, beginning of period | | $ | 13.27 | | | $ | 11.58 | | | $ | 10.68 | | | $ | 8.41 | | | $ | 6.46 | |
Income/(loss) from investment operations: | | | | | | | | | | | | | | | | | | | | |
Net investment income | | | 0.19 | | | | 0.29 | | | | 0.21 | | | | 0.19 | * | | | 1.03 | |
Net realized and unrealized gains/(losses) on investments | | | 0.16 | | | | 1.65 | | | | 0.84 | | | | 2.24 | | | | 1.29 | |
Total income from investment operations | | | 0.35 | | | | 1.94 | | | | 1.05 | | | | 2.43 | | | | 2.32 | |
Less distributions from: | | | | | | | | | | | | | | | | | | | | |
Net investment income | | | 0.20 | | | | 0.25 | | | | 0.15 | | | | 0.16 | | | | 0.22 | |
Net realized gains | | | 0.74 | | | | — | | | | — | | | | — | | | | — | |
Return of capital | | | — | | | | — | | | | — | | | | — | | | | 0.15 | |
Total distributions | | | 0.94 | | | | 0.25 | | | | 0.15 | | | | 0.16 | | | | 0.37 | |
Net asset value, end of period | | $ | 12.68 | | | $ | 13.27 | | | $ | 11.58 | | | $ | 10.68 | | | $ | 8.41 | |
TOTAL RETURN(a) | | | 2.60% | | | | 16.79% | | | | 9.85% | | | | 28.94% | | | | 35.77% | |
| | | | | |
RATIOS/SUPPLEMENTAL DATA: | | | | | | | | | | | | | | | | | | | | |
Net assets, end of period (in thousands) | | $ | 102,603 | | | $ | 76,751 | | | $ | 75,012 | | | $ | 78,316 | | | $ | 70,574 | |
Ratios to average net assets: | | | | | | | | | | | | | | | | | | | | |
Net investment income | | | 1.50% | | | | 2.13% | | | | 1.73% | | | | 1.97% | | | | 4.75% | |
Net expenses | | | 0.96% | (b) | | | 0.98% | (b) | | | 1.04% | (b) | | | 0.92% | (b) | | | 1.04% | (b) |
Gross expenses | | | 0.96% | | | | 0.98% | | | | 1.04% | | | | 0.93% | | | | 1.04% | |
Portfolio turnover rate | | | 82% | | | | 49% | | | | 69% | | | | 113% | | | | 105% | |
Notes to Financial Highlights
| (a) | Total returns are historical and assume changes in share price, reinvestment of dividends and capital gains distributions and do not include the effect of insurance contract charges. Past performance does not guarantee future results. |
| (b) | Reflects GEAM’s waiver of a portion of the Fund’s advisory and administrative fee (“management fee”) in an amount equal to the management fee earned by GEAM with respect to the Fund’s investment in an affiliated money market fund managed by GEAM. |
| * | Per share values have been calculated using the average share method. |
The accompanying Notes are an integral part of these financial statements.
7
| | | | |
Statement of Assets and Liabilities December 31, 2013 | | | |
| |
ASSETS | | | | |
Investments in securities, at Fair Value (cost $102,428,807) | | $ | 101,242,693 | |
Short-term affiliated investments (at amortized cost) | | | 1,528,597 | |
Receivable for investments sold | | | 277,000 | |
Income receivables | | | 476,917 | |
Receivable for fund shares sold | | | 2,322 | |
Other assets | | | 1,463 | |
Total assets | | | 103,528,992 | |
| |
LIABILITIES | | | | |
Payable for investments purchased | | | 760,255 | |
Payable for fund shares redeemed | | | 27,532 | |
Payable to GEAM | | | 73,067 | |
Accrued other expenses | | | 65,588 | |
Total liabilities | | | 926,442 | |
NET ASSETS | | $ | 102,602,550 | |
| |
NET ASSETS CONSIST OF: | | | | |
Capital paid in | | | 103,512,767 | |
Accumulated net realized gain | | | 275,897 | |
Net unrealized appreciation (depreciation) on: | | | | |
Investments | | | (1,186,114 | ) |
NET ASSETS | | $ | 102,602,550 | |
Shares outstanding ($0.01 par value, unlimited shares outstanding) | | | 8,090,631 | |
Net asset value per share | | | $12.68 | |
The accompanying Notes are an integral part of these financial statements.
8
| | | | |
Statement of Operations For the year ended December 31, 2013 | | | |
| |
INVESTMENT INCOME | | | | |
Income | | | | |
Dividend | | $ | 2,287,575 | |
Income from affiliated investments | | | 202 | |
Less: Foreign taxes withheld | | | (1,567 | ) |
Total income | | | 2,286,210 | |
| |
Expenses | | | | |
Advisory and administration fees | | | 791,908 | |
Directors’ fees | | | 3,567 | |
Custody and accounting expenses | | | 42,674 | |
Professional fees | | | 20,281 | |
Other expenses | | | 35,400 | |
Total expenses before waivers | | | 893,830 | |
Less: Fees waived by the adviser | | | (1,364 | ) |
Net expenses | | | 892,466 | |
Net investment income | | | 1,393,744 | |
| |
NET REALIZED AND UNREALIZED GAIN (LOSS) ON INVESTMENTS | | | | |
| |
Realized gain (loss) on: | | | | |
Investments | | | 10,391,693 | |
Increase (decrease) in unrealized appreciation/depreciation on: | | | | |
Investments | | | (12,704,573 | ) |
Net realized and unrealized loss on investments | | | (2,312,880 | ) |
Net decrease in net assets resulting from operations | | | $ (919,136 | ) |
The accompanying Notes are an integral part of these financial statements.
9
| | | | | | | | |
| Statements of Changes in Net Assets | | | |
| | | Year Ended
December 31,
2013 | | | Year Ended
December 31,
2012 | |
| | |
INCREASE (DECREASE) IN NET ASSETS | | | | | | | | |
Operations: | | | | | | | | |
Net investment income | | $ | 1,393,744 | | | $ | 1,672,840 | |
Net realized gain (loss) on investments | | | 10,391,693 | | | | 8,025,669 | |
Net increase (decrease) in unrealized appreciation/depreciation on investments | | | (12,704,573 | ) | | | 2,372,291 | |
Net increase (decrease) from operations | | | (919,136 | ) | | | 12,070,800 | |
Distributions to shareholders from: | | | | | | | | |
Net investment income | | | | | | | | |
Class 1 | | | (1,500,249 | ) | | | (1,450,497 | ) |
Net realized gains | | | | | | | | |
Class 1 | | | (5,564,407 | ) | | | — | |
Total distributions | | | (7,064,656 | ) | | | (1,450,497 | ) |
Increase (decrease) in assets from operations and distributions | | | (7,983,792 | ) | | | 10,620,303 | |
Share transactions: | | | | | | | | |
Proceeds from sale of shares | | | | | | | | |
Class 1 | | | 47,940,482 | | | | 6,493,828 | |
Value of distributions reinvested | | | | | | | | |
Class 1 | | | 7,064,656 | | | | 1,450,497 | |
Cost of shares redeemed | | | | | | | | |
Class 1 | | | (21,169,647 | ) | | | (16,824,285 | ) |
Class 4* | | | — | | | | (12,374 | ) |
Net increase (decrease) from share transactions | | | 33,835,491 | | | | (8,892,334 | ) |
Total increase (decrease) in net assets | | | 25,851,699 | | | | 1,727,969 | |
| | |
NET ASSETS | | | | | | | | |
Beginning of year | | | 76,750,851 | | | | 75,022,882 | |
End of year | | $ | 102,602,550 | | | $ | 76,750,851 | |
| | |
CHANGES IN FUND SHARES | | | | | | | | |
| | |
Class 1 | | | | | | | | |
Shares sold | | | 3,262,215 | | | | 499,016 | |
Issued for distributions reinvested | | | 555,834 | | | | 109,720 | |
Shares redeemed | | | (1,512,052 | ) | | | (1,300,403 | ) |
Net increase (decrease) in fund shares | | | 2,305,997 | | | | (691,667 | ) |
| | |
Class 4* | | | | | | | | |
Shares redeemed | | | — | | | | (935 | ) |
Net increase (decrease) in fund shares | | | — | | | | (935 | ) |
| * | Share Class 4 was closed effective June 29, 2012. |
The accompanying Notes are an integral part of these financial statements.
10
| | |
| Notes to Financial Statements | | December 31, 2013 |
| 1. | Organization of the Company |
GE Investments Funds, Inc. (the “Company”) was incorporated under the laws of the Commonwealth of Virginia on May 14, 1984 and is registered under the Investment Company Act of 1940, as amended (the “1940 Act”), as an open-end management investment company. The Company is composed of eleven investment portfolios (collectively the “Funds”), although only the following eight are currently being offered: U.S. Equity Fund, S&P 500 Index Fund, Premier Growth Equity Fund, Core Value Equity Fund, Small-Cap Equity Fund, Total Return Fund, Income Fund, and Real Estate Securities Fund (the “Fund”).
Shares of the Funds of the Company are offered only to insurance company separate accounts that fund certain variable life insurance contracts and variable annuity contracts. GE Asset Management Incorporated (“GEAM”) is the investment adviser and administrator of each of the Funds.
The Company currently offers one share class (Class 1) of the Fund as an investment option for variable life insurance and variable annuity contracts.
| 2. | Summary of Significant Accounting Policies |
The preparation of financial statements in conformity with U.S. generally accepted accounting principles (“GAAP”) requires management to make estimates and assumptions that affect the reported amounts of assets and liabilities and disclosure of contingent assets and liabilities at the date of the financial statements and the reported amounts of increases and decreases in net assets from operations during the reporting period. Actual results may differ from those estimates.
Subsequent events after the balance sheet date through the date the financial statements were issued have been evaluated in the preparation of the financial statements. There are no items to report.
The following summarizes the significant accounting policies of the Company:
Securities Valuation and Transactions All investments in securities are recorded at their estimated fair value, as described in Note 3.
Securities transactions are accounted for as of the trade date. Realized gains and losses on investments sold are recorded on the basis of identified cost for both financial statement and federal tax purposes.
Derivatives The Fund is subject to equity price risk in the normal course of pursuing its investment objective. The Fund may enter into derivative transactions to gain market exposure for residual and accumulating cash positions.
Real Estate Investment Trusts Dividend income, attributable to real estate investment trusts (“REITs”), is recorded based on management’s estimate of the income included in the distributions received. Distributions received in excess of this amount are recorded as a reduction of the cost of the investments. The actual amounts of income and return of capital are determined by each REIT only after its fiscal year-end and may differ from the estimated amounts.
Investment Income Corporate actions (including cash dividends) are recorded on the ex-dividend date, net of applicable withholding taxes, except for certain foreign corporate actions which are recorded as soon after the ex-dividend date as such information becomes available. Withholding taxes in foreign dividends have been provided for in accordance with the Fund’s understanding of the applicable country’s tax rules and rates.
Interest income is recorded on the accrual basis. Accretion of discounts and amortization of premiums on taxable bonds are to the call or maturity date, whichever is shorter, using the effective yield method.
Expenses Fund specific expenses are charged to the Fund that incurs such expenses. Such expenses may include custodial fees, legal and accounting fees, printing costs and registration fees. Expenses that are not fund specific are allocated pro rata across the Funds. Expenses of the Fund are generally paid directly by the Fund, however, expenses may be paid by GEAM and reimbursed by the Fund.
Federal Income Taxes The Fund intends to comply with all sections of the Internal Revenue Code applicable to regulated investment companies including the distribution of substantially all of its taxable net investment income and net realized capital gains to its shareholders. Therefore, no provision for federal income tax has been made. The Fund is treated as a separate taxpayer for federal income tax purposes.
The Fund utilizes various methods to measure the fair value of most of its investments on a recurring basis. GAAP establishes a framework for measuring fair value
11
| | |
| Notes to Financial Statements | | December 31, 2013 |
and providing related disclosures. Broadly, the framework requires fair value to be determined based on the exchange price that would be received for an asset or paid to transfer a liability (an exit price) in the principal or most advantageous market for the asset or liability in an orderly transaction between market participants at the measurement date. In the absence of active markets for the identical assets or liabilities, such measurements involve developing assumptions based on market observable data and, in the absence of such data, internal information that is consistent with what market participants would use in a hypothetical transaction that occurs at the measurement date. It also establishes a three-level valuation hierarchy based upon observable and non-observable inputs.
Observable inputs reflect market data obtained from independent sources, while unobservable inputs reflect our market assumptions. Preference is given to observable inputs. These two types of inputs create the following fair value hierarchy:
Level 1 — Quoted prices for identical investments in active markets.
Level 2 — Quoted prices for similar investments in active markets; quoted prices for identical or similar investments in markets that are not active; and model-derived valuations whose inputs are observable or whose significant value drivers are observable.
Level 3 — Significant inputs to the valuation model are unobservable.
Policies and procedures are maintained to value investments using the best and most relevant data available. In addition, pricing vendors are utilized to assist in valuing investments. GEAM performs periodic reviews of the methodologies used by independent pricing services including price validation of individual securities.
Fair Value Measurement The following section describes the valuation methodologies the Fund uses to measure different financial investments at fair value.
The Fund’s portfolio securities are valued generally on the basis of market quotations. Equity securities generally are valued at the last reported sale price on the primary market in which they are traded. Portfolio securities listed on NASDAQ are valued using the NASDAQ Official Closing Price, Level 1 securities primarily include publicly-traded equity securities. If no sales occurred on the exchange or NASDAQ that day, the portfolio security generally is valued using the last reported bid price. In those circumstances the Fund classifies the investment securities in Level 2.
Short-term investments of sufficient credit quality with remaining maturities of sixty days or less at the time of purchase are typically valued on the basis of amortized cost which approximates fair value and these are included in Level 2. If it is determined that amortized cost does not approximate fair value, securities may be valued based on dealer supplied valuations or quotations. In these infrequent circumstances, pricing services may provide the Fund with valuations that are based on significant unobservable inputs, and in those circumstances the investment securities are classified in Level 3.
If prices are not readily available for a portfolio security, or if it is believed that a price for a portfolio security does not represent its fair value, the security may be valued using procedures approved by the Fund’s Board of Directors that are designed to establish its “fair” value. These securities are typically classified in Level 3. Those procedures require that the fair value of a security be established by a valuation committee of GEAM. The valuation committee follows different protocols for different types of investments and circumstances. The fair value procedures may be used to value any investment of the Fund in the appropriate circumstances.
Fair value determinations generally are used for securities whose value is affected by a significant event that will materially affect the value of a security and which occurs subsequent to the time of the close of the principal market on which such security trades but prior to the calculation of the Fund’s NAV.
The value established for such a portfolio security may be different than what would be produced through the use of market quotations or another methodology. Portfolio securities that are valued using techniques other than market quotations, including “fair valued” securities, may be subject to greater fluctuation in their value from one day to the next than would be the case if market quotations were used. In addition, there is no assurance that the Fund could sell a portfolio security for the value established for it at any time and it is possible that the Fund would incur a loss because a portfolio security is sold at a discount to its established value.
Other financial investments are derivative instruments that are not reflected in total investments, such as futures, forwards, swaps, and written options contracts, which are valued based on fair value as discussed above.
The Fund uses closing prices for derivatives included in Level 1, which are traded either on exchanges or liquid over-the-counter markets. Derivative assets and liabilities included in Level 2 primarily represent interest rate swaps,
12
| | |
| Notes to Financial Statements | | December 31, 2013 |
cross-currency swaps and foreign currency and commodity forward and option contracts. Derivative assets and liabilities included in Level 3 primarily represent interest rate products that contain embedded optionality or prepayment features.
The inputs or methodology used for valuing securities are not an indication of the risk associated with investing in those securities.
The following table presents the Fund’s investments measured at fair value on a recurring basis at December 31, 2013:
| | | | | | | | | | | | | | | | | | | | |
| Investments | | Level 1 | | Level 2 | | Level 3 | | Total |
Investments in Securities† | | | | | | | | | | | | | | | | | | | | |
Common Stock | | | $ | 101,242,693 | | | | | $— | | | | | $— | | | | $ | 101,242,693 | |
Short-Term Investments | | | | 1,528,597 | | | | | — | | | | | — | | | | | 1,528,597 | |
Total Investments in Securities | | | $102,771,290 | | | | | | $— | | | | | $— | | | | $ | 102,771,290 | |
| † | See Schedule of Investments for Industry Classifications |
There were no transfers between fair value levels. Transfers between fair value levels are considered to occur at the beginning of the period.
The Company shares a revolving credit facility of up to $150 million with a number of its affiliates. The credit facility is with its custodian bank, State Street Bank and Trust Company (“State Street”). The revolving credit facility requires the payment of a commitment fee equal to 0.10% per annum on the daily unused portion of the credit facility, payable quarterly. The portion borne by the Funds generally is borne proportionally based upon net assets. In addition, the Company has a $100 million uncommitted, unsecured line of credit with State Street. Generally, borrowings under the credit facilities would accrue interest at the Federal Funds Rate plus 50 basis points and would be borne by the borrowing fund. The maximum amount allowed to be borrowed by any one fund is the lesser of (i) 33.33% of its total assets or (ii) 20% of its net assets. The credit facilities were not utilized by the Fund during the year ended December 31, 2013.
| 5. | Compensation and Fees Paid to Affiliates |
GEAM, a registered investment adviser, was retained by the Board effective May 1, 1997 to act as investment adviser and administrator of the Fund. GEAM’s compensation for investment advisory and administrative services (“management fee”) is paid monthly based on the average daily net assets of the Fund. The advisory and administrative fee is stated in the following schedule:
| | |
Average Daily
Net Assets of Fund | | Advisory and
Administration Fees |
| First $100 million | | 0.85% |
| Next $100 million | | 0.80% |
| Over $200 million | | 0.75% |
GEAM has a contractual arrangement with the Fund to waive a portion of the Fund’s management fee in the amount equal to the management fee earned by GEAM with respect to the Fund’s investment in the GE Institutional Money Market Fund, if any.
Directors’ Compensation The Fund pays no compensation to its directors who are officers or employees of GEAM or its affiliates. Directors who are not such officers or employees also serve in a similar capacity for other funds advised by GEAM. Compensation paid to non-interested Directors are reflected on the Statement of Operations. These fees are allocated pro rata across all of the mutual fund platforms served by the directors, including the Fund, and are based upon the relative net assets of each fund within such platforms.
Pursuant to an investment sub-advisory agreement with GEAM, CenterSquare Management, Inc. (“CenterSquare”) is the Sub-Adviser to the Fund. CenterSquare is responsible for the day-to-day portfolio management of the assets of the Fund, including the responsibility for making decisions to buy, sell or hold a particular security, under the general supervision of GEAM and the Board. For their services, GEAM pays CenterSquare monthly sub-advisory fees which are calculated as a percentage of the average daily net assets of the Fund.
13
| | |
| Notes to Financial Statements | | December 31, 2013 |
| 7. | Investment Transactions |
Purchases and Sales of Securities The cost of purchases and the proceeds from sales of investments, other than short-term securities, for the year ended December 31, 2013, were as follows:
| | | | | | |
| Non-U.S. Government Securities | |
| Purchases | | | Sales | |
| $ | 103,363,618 | | | $ | 74,944,980 | |
The Fund is subject to ASC 740, Income Taxes. ASC 740 provides guidance for financial accounting and reporting
for the effects of income taxes that result from an entity’s activities during the year. ASC 740 also provides guidance regarding how certain uncertain tax positions should be recognized, measured, presented and disclosed in the financial statements. ASC 740 requires evaluation of tax positions taken or expected to be taken in the course of preparing the Fund’s tax returns to determine whether the tax positions are “more likely than not” of being sustained by the applicable tax authority. There are no adjustments to the Fund’s net assets required under ASC 740. The Fund’s 2010, 2011, 2012, and 2013 fiscal years tax returns are still open to examination by the Federal and applicable state tax authorities.
At December 31, 2013, information on the tax cost of investments and distributable earnings on a tax basis was as follows:
| | | | | | | | | | | | | | | | | | | | | | | | | | | | | | |
Cost of
Investments For
Tax Purposes | | | Gross Tax | | | Net Tax Appreciation/
(Depreciation) | | | Undistributed | | | | |
| | Appreciation | | | Depreciation | | | Investments | | | Derivatives/
Currency | | | Income | | | Accum.
Capital
Gain/(Loss) | | | Late-Year
Losses | |
| $ | 104,345,153 | | | $ | 4,135,506 | | | $ | (5,709,369 | ) | | $ | (1,573,863 | ) | | $ | — | | | $ | — | | | $ | 861,594 | | | $ | (197,947 | ) |
As of December 31, 2013, the Fund had no capital loss carryovers. Capital loss carryovers are available to offset future realized capital gains to the extent provided in the Internal Revenue Code and regulations thereunder. To the extent that these carryover losses are used to offset future capital gains, it is probable that gains offset will not be distributed to shareholders because they would be taxable as ordinary income.
During the year ended December 31, 2013, the Fund utilized $3,984,210 of prior year capital loss carryovers.
Any qualified late-year loss is deemed to arise on the first day of the Fund’s next tax year (if the Fund elects to defer such loss). Under this regime, generally, the Fund can elect to defer any post-October capital loss and/or any late-year ordinary loss as defined by the Internal Revenue Code.
The Fund elected to defer qualified late-year losses for the year ended December 31, 2013 as follows:
| | | | | | |
| Capital | | | Ordinary | |
| $ | (197,947 | ) | | $ | — | |
The tax character of distributions paid during the years ended December 31, 2013 and December 31, 2012 were as follows:
| | | | | | | | | | | | | | | |
| Year | | Ordinary
Income | | Long-Term
Capital Gains | | Total |
2013 | | | $ | 1,393,744 | | | | $ | 5,670,912 | | | | $ | 7,064,656 | |
2012 | | | | 1,450,497 | | | | | — | | | | | 1,450,497 | |
Distributions to Shareholders The Fund declares and pays any dividends from net investment income annually. The Fund declares and pays any net realized capital gains in excess of capital loss carryforwards distributions annually. The character of income and gains to be distributed is determined in accordance with income tax regulations which may differ from generally accepted accounting principles. These differences include (but are not limited to) distributions from Real Estate Investment Trusts, investments organized as partnerships for tax purposes and losses deferred due to wash sale transactions. Reclassifications due to permanent book/tax differences are made to the Fund’s capital accounts to reflect income and gains available for distribution (or
14
| | |
| Notes to Financial Statements | | December 31, 2013 |
available capital loss carryovers) under income tax regulations. These reclassifications have no impact on net investment income, realized gains or losses, or the net asset value of the Fund. The calculation of net investment income per share in the Financial Highlights table excludes these adjustments.
The reclassifications for the year ended December 31, 2013 were as follows:
| | | | | | | | | | |
Undistributed
Net Investment
Income | | | Accumulated
Net Realized
Gain (Loss) | | | Capital
Paid In | |
| $ | 106,505 | | | $ | 514,945 | | | $ | (621,450 | ) |
15
Report of Independent Registered Public Accounting Firm
The Shareholders and Board of Directors
GE Investments Funds, Inc.
We have audited the accompanying statement of assets and liabilities, including the schedule of investments, of the Real Estate Securities Fund (the “Fund”), a series of GE Investments Funds, Inc., as of December 31, 2013 and the related statement of operations for the year then ended, statements of changes in net assets for each of the years in the two-year period then ended, and the financial highlights for each of the years in the five-year period then ended. These financial statements and financial highlights are the responsibility of the Fund’s management. Our responsibility is to express an opinion on these financial statements and financial highlights based on our audits.
We conducted our audits in accordance with the standards of the Public Company Accounting Oversight Board (United States). Those standards require that we plan and perform the audit to obtain reasonable assurance about whether the financial statements are free of material misstatement. An audit includes examining, on a test basis, evidence supporting the amounts and disclosures in the financial statements. Our procedures included confirmation of securities owned as of December 31, 2013 by correspondence with the custodian and brokers, or by other appropriate auditing procedures where replies from brokers were not received. An audit also includes assessing the accounting principles used and significant estimates made by management, as well as evaluating the overall financial statement presentation. We believe that our audits provide a reasonable basis for our opinion.
In our opinion, the financial statements and financial highlights referred to above present fairly, in all material respects, the financial position of the Real Estate Securities Fund as of December 31, 2013, the results of its operations, changes in its net assets and financial highlights for each of the years described above, in conformity with U.S. generally accepted accounting principles.

Boston, Massachusetts
February 17, 2014
16
| | |
| Tax Information | | (Unaudited) |
For the year ended December 31, 2013, the Fund hereby designates $5,670,912 as capital gain dividends, or the amount ultimately treated as capital gain net income.
The amounts presented herein may differ from amounts presented elsewhere in the financial statements due to differences between tax and financial accounting principles. Please consult a tax advisor if you have any questions about Federal or State income tax laws or on how to prepare your tax returns. If you have specific questions about your Fund account, please consult your investment representative.
17
| | |
| Advisory and Administrative Agreement Renewal | | (Unaudited) |
The Board of Directors of the GE Investments Funds, Inc. (the “Board”), including the independent Board members, considered and unanimously approved the continuance for an additional year of the Fund’s Investment Advisory and Administration Agreement with GE Asset Management Incorporated (“GEAM”) and the Investment Sub-Advisory Agreement with the Fund’s sub-adviser, CenterSquare Investment Management, Inc. (“CenterSquare”), formerly known as Urdang Securities Management, Inc., at meetings held on December 11 and December 13, 2013.
In considering whether to approve the Fund’s investment advisory and sub-advisory agreements, the Board members considered and discussed a substantial amount of information and analysis provided, at the Board’s request, by GEAM and CenterSquare. The Board members also considered detailed information regarding performance and expenses of other investment companies, including those with similar investment strategies and sizes, which was prepared by independent third party provider Morningstar, Inc. (“Morningstar”). The Board members noted that GEAM does not manage any other mutual funds or investment products that employ the same investment strategy as the Fund. The Board had the opportunity to ask questions and request additional information in connection with its considerations.
Before approving the Fund’s investment advisory and sub-advisory agreements, the independent Board members reviewed the information provided with management of GEAM and with their independent legal counsel. The Board members also reviewed a memorandum prepared by independent legal counsel discussing the legal standards for the consideration of the proposed continuances. The independent Board members discussed the proposed continuances in detail during a private session with their independent legal counsel at which no representatives of GEAM or CenterSquare were present. The independent Board members and their independent legal counsel requested, received and considered additional information from GEAM following these sessions.
In advance of the meetings, and in response to their request, the Board members received from GEAM written responses to their inquiries, which included substantial exhibits and other materials related to GEAM’s business and the services it provides to the Fund. Also in advance of the meetings, the Board members received from CenterSquare a written response to a letter of inquiry prepared by GEAM at the Board’s request, which included
substantial exhibits and other materials related to the business of, and services provided by, CenterSquare. The Board members took into account their experience as Board members and particularly their previous consideration of these types of agreements. When feasible, information was presented in a manner to facilitate comparison to prior periods and to reflect certain enhancements to GEAM’s infrastructure, systems and shareholder servicing model. To focus their review, the Board members asked GEAM management and CenterSquare, in their oral presentations and/or written materials, to highlight material differences from the information presented in recent years.
During the meetings, the Board members had an opportunity to discuss this information with GEAM representatives, including senior executives, representatives from the legal, compliance and finance departments, and investment personnel. The Board members also had an opportunity to hear presentations by representatives of CenterSquare during the past year. The Board members posed questions to these representatives and engaged in substantive discussions with them concerning each of their investment processes.
In reaching their determinations relating to continuance of the Fund’s investment advisory and sub-advisory agreements, the Board members considered all factors that they deemed relevant, including the factors discussed below. In their deliberations, the Board members did not identify any particular information that was all-important or controlling, and each Board member may have attributed different weights to the various factors. In particular, the Board members focused on the following:
The Nature, Extent And Quality Of Services Provided.
The Board members reviewed the services provided by GEAM and CenterSquare, taking into account their past experiences with GEAM and their multi-year experience with CenterSquare. In connection with their consideration of GEAM’s services, the Board members focused on the favorable attributes of GEAM, including (i) an investment philosophy oriented toward long-term performance; (ii) effective processes used for overseeing sub-advisers; (iii) effective processes used for providing Fund administration, including controllership and compliance functions, the optimization of its Fund administration platform and the continued oversight of the performance of other companies that provide services to the Fund and its shareholders; (iv) highly skilled professionals including
18
| | |
| Advisory and Administrative Agreement Renewal | | (Unaudited) |
analysts, research professionals, traders and portfolio managers with a depth of experience relevant to the Fund; (v) access to significant and enhanced technological resources from which the Fund may benefit; and (vi) a favorable history and reputation. The Board members noted that the Fund represents only a small portion of the assets managed by GEAM, but benefits from a full array of services and resources provided by GEAM.
In connection with their consideration of the services provided by CenterSquare, the Board members focused on CenterSquare’s favorable attributes relating to its investment philosophy and discipline, experienced investment and trading personnel, systems and other resources, including research capabilities, and favorable history and reputation.
In light of the foregoing, the Board, including the independent Board members, concluded that the services provided by GEAM and CenterSquare continue to be satisfactory.
Investment Performance Of The Fund And The Sub-Adviser.
The Board members considered the investment performance of the Fund for various periods. The Board members reviewed detailed comparisons of the performance of the Fund with the relevant securities index and peer groupings of mutual funds prepared by Morningstar with respect to various periods. The Board members also engaged in detailed discussions with GEAM management and representatives of CenterSquare about each of their investment processes and performance results. These discussions focused on the Fund’s investment objective, the number and experience of portfolio management and supporting research personnel, the Fund’s investment style and approach employed, the likely market cycles for the investment style and the Fund’s relatively favorable performance.
The Board, including the independent Board members, concluded that the Fund’s performance was acceptable.
Cost Of The Services Provided And Profits Realized From The Relationships With The Fund.
The Board members considered the fees paid to GEAM by the Fund, as well as those paid to CenterSquare by GEAM, and the cost of the services provided by GEAM and CenterSquare to the Fund. The Board members reviewed the information they had requested from GEAM and CenterSquare concerning their profitability. The Board members considered the profit margin information for
GEAM’s investment company business as a whole, as well as GEAM’s profitability data for the Fund. The Board members reviewed GEAM’s assumptions and the methods of cost allocation used by GEAM in preparing Fund-specific profitability data. The Board members also discussed with GEAM the basis for its belief that the methods of allocation used were reasonable for each area of its business.
Information was presented regarding the financial condition of GEAM and CenterSquare for various past periods. The Board members noted that GEAM, and not the Fund, pays the sub-advisory fees to CenterSquare. The Board members determined that GEAM and CenterSquare should be entitled to earn a reasonable level of profits for the services they provide to the Fund. The Board members also recognized that GEAM has made and continues to make significant investments in its business in fulfilling its obligations to the Fund and supporting its Fund-related activities.
Based on their review, the Board, including the independent Board members, concluded that they were satisfied that the level of profitability achieved by GEAM and CenterSquare from their relationship with the Fund was not unreasonable or excessive.
The Extent To Which Economies Of Scale Would Be Realized As The Fund Grows And Whether Fee Levels Would Reflect Such Economies Of Scale.
The Board noted that the Fund experienced an increase in assets over the past year, and the Board members considered the extent to which economies of scale would be realized as the Fund continues to grow and whether fee levels reflect these economies of scale for the benefit of Fund investors.
The Board members considered the substantial infrastructure investments that GEAM has made with respect to its operations and its commitment to continue investing resources to enhance services to Fund shareholders. The Board members recognized the benefits to the Fund of GEAM’s past investment in its operations through expenditures to support its substantial infrastructure, and that, with respect to all GEAM managed mutual funds, GEAM has not yet fully recouped that investment. The Board members reviewed the applicable advisory fee breakpoints for the Fund. They recognized the economies of scale benefits that would be derived by the Fund as a result of the breakpoint fee
19
| | |
| Advisory and Administrative Agreement Renewal | | (Unaudited) |
structure in the event that average daily net assets exceed $100 million. The Board members also recognized the benefits to the Fund of being able to leverage a favorable cost structure achieved with respect to the Fund’s other operating expenses as a result of GEAM’s large overall base of assets under management and its vendor management practices.
Comparison Of Services To Be Rendered And Fees To Be Paid.
The Board members discussed the respective services provided to the Fund by each of GEAM and CenterSquare, and the fees charged for those services, including the allocation of total advisory fees between them. The Board members reviewed information concerning the fee and expense ratios for the Fund, and comparative information with respect to peer groupings of mutual funds prepared by Morningstar. They discussed that the Fund’s advisory fee and expense ratios were within the applicable peer group ranges. The Board members also reviewed comparative mutual fund and/or other account fee information provided by CenterSquare. The Board, including the independent Board members, concluded
that, based on this information, the advisory and sub-advisory fees were reasonable in relation to the services provided to the Fund.
Fall-Out Benefits.
The Board members considered other actual and potential financial benefits that GEAM and CenterSquare may derive from their respective relationships with the Fund, including, to the extent applicable, soft dollar commission benefits generated through Fund portfolio transactions. The Board members noted, however, that the Fund benefits from the vast array of resources available through GEAM, and that the Fund represents only a small portion of the assets managed by GEAM.
Conclusion.
No single factor was determinative to the Board’s decision. Based on their discussion and such other matters as were deemed relevant, the Board, including the independent Board members, concluded that renewal of the investment advisory and sub-advisory agreements was in the best interests of the Fund and its shareholders.
20
| | |
| Additional Information | | (Unaudited) |
Information about Directors and Executive Officers:
The business and affairs of the Funds are managed under the direction of the Funds’ Board of Directors. Information pertaining to the Directors and officers of the Funds is set forth below.
Interested Directors and Executive Officers
Michael J. Cosgrove
Address c/o GEAM 1600 Summer St. Stamford, CT 06905
Age 64
Position(s) Held with Fund Chairman of the Board and President
Term of Office and Length of Time Served Until successor is elected and qualified — 17 years
Principal Occupation(s) During Past 5 years President of Mutual Funds and Global Investment Programs of GEAM since November 2011; President and Chief Executive Officer — Mutual Funds and Intermediary Business of GEAM from March 2007 to November 2011; Executive Vice President of GEAM from February 1997 to March 2007; and Executive Vice President-Mutual Funds of GEAM from March 1993 to March 2007. Also serves as Treasurer of GE Foundation since 1988.
Number of Portfolios in Fund Complex Overseen by Director 25
Other Directorships Held by Director Chairman of the Board and President of GE Institutional Funds since 1997; Trustee of Elfun Funds, GE Retirement Savings Plan Funds (formerly GE Savings & Security Funds) and General Electric Pension Trust since 1988; Director of GEAM since 1988; Trustee of Fordham University from 2002 through June 2010 and since July 2011; Director of GE Investment Distributors, Inc. since June 2011; Director of Skin Cancer Foundation since August 2010; Member Board of Governors of the Investment Company Institute since October 2006; Director of GE Asset Management (Ireland) Limited since February 1999; GE Asset Management Funds Plc since 1998; GE Asset Management Canada Company since 1998, GE Asset Management Limited since 1998; Trustee of General Electric Insurance Plan Trust since 1988; and Chairman of the Board and President of GE Funds from 1993 to February 2011.
Matthew J. Simpson
Address c/o GEAM 1600 Summer St. Stamford, CT 06905
Age 52
Position(s) Held with Fund Director and Executive Vice President
Term of Office and Length of Time Served Until successor is elected and qualified — 6 years
Principal Occupation(s) During Past 5 years Executive Vice President, General Counsel and Secretary of GEAM since July 2007; Secretary of Elfun Funds and GE Retirement Savings Plan Funds (formerly GE Savings & Security Funds) since July 2007; Senior Vice President and General Counsel – Marketing and Client Services (formerly Asset Management Services) of GEAM and Senior Vice President and General Counsel of GE Asset Management Services from February 1997 to July 2007; Vice President and Associate General Counsel of GEAM from October 1992 to February 1997; Secretary of GE Institutional Funds and GE Investments Funds, Inc. from 1997 to July 2007 and Vice President from September 2003 to July 2007; Assistant Secretary of Elfun Funds and GE Retirement Savings Plan Funds from 1998 to July 2007 and Vice President from October 2003 to July 2007; and Secretary of GE Funds from 1993 to July 2007 and Vice President from September 2003 to July 2007.
21
| | |
| Additional Information | | (Unaudited) |
Number of Portfolios in Fund Complex Overseen by Director 25
Other Directorships Held by Director Trustee of Elfun Funds, GE Retirement Savings Plan Funds and General Electric Pension Trust since July 2007; Trustee and Executive Vice President of GE Institutional Funds since July 2007; Director of GEAM since July 2007; Director of GE Investment Distributors, Inc. since June 2011; and Trustee and Executive Vice President of GE Funds from July 2007 to February 2011.
Joon Won Choe
Address c/o GEAM 1600 Summer St. Stamford, CT 06905
Age 44
Position(s) Held with Fund Vice President & Secretary
Term of Office and Length of Time Served Until successor is elected and qualified — Vice President and Secretary — 3 years
Principal Occupation(s) During Past 5 years Senior Vice President and Deputy General Counsel at GEAM since March 2011; Vice President and Secretary of GE Institutional Funds since September 2010; Vice President and Assistant Secretary of Elfun Funds and GE Retirement Savings Plan Funds (formerly GE Savings & Security Funds) since September 2010; Senior Vice President and Associate General Counsel at GEAM from June 2010 to March 2011; Vice President and Associate General Counsel of GEAM from November 2005 to June 2010 and Vice President and Secretary of GE Funds from September 2010 to February 2011.
Number of Portfolios in Fund Complex Overseen by Officer N/A
Other Directorships Held by Officer N/A
Robert Herlihy
Address c/o GEAM 1600 Summer St. Stamford, CT 06905
Age 46
Position(s) Held with Fund Chief Compliance Officer
Term of Office and Length of Time Served Until successor is elected and qualified — 8 years
Principal Occupation(s) During Past 5 years Chief Compliance Officer of GEAM, GE Institutional Funds, Elfun Funds, and GE Retirement Savings Plan Funds (formerly GE Savings & Security Funds) since July 2005; Chief Compliance Officer of GE Funds from July 2005 to February 2011 and Manager of Fund Administration at GEAM from 2002-2005.
Number of Portfolios in Fund Complex Overseen by Officer N/A
Other Directorships Held by Officer N/A
Arthur A. Jensen
Address c/o GEAM 1600 Summer St. Stamford, CT 06905
Age 47
Position(s) Held with Fund Treasurer
Term of Office and Length of Time Served Until successor is elected and qualified — 2 years
22
| | |
| Additional Information | | (Unaudited) |
Principal Occupation(s) During Past 5 Years Treasurer of GE Institutional Funds, Elfun Funds and GE Retirement Savings Plan Funds (formerly GE Savings & Security Funds) since June 2011; Mutual Funds Controller of GEAM since April 2011; Senior Vice President at Citigroup from 2008 to 2010 and Vice President at JPMorgan from 2005 to 2008.
Number of Portfolios in Fund Complex Overseen by Officer N/A
Other Directorships Held by Officer N/A
Jeanne M. LaPorta
Address c/o GEAM 1600 Summer St. Stamford, CT 06905
Age 48
Position(s) Held with Fund Vice President
Term of Office and Length of Time Served Until successor is elected and qualified — 10 years
Principal Occupation(s) During Past 5 Years Senior Vice President and Commercial Administrative Officer of GEAM since April 2010; Vice President of GE Institutional Funds since July 2003; Vice President of Elfun Funds and GE Retirement Savings Plan Funds (formerly GE Savings & Security Funds) since October 2003; Secretary of GE Funds from July 2007 to September 2010 and Vice President from July 2007 to February 2011; Senior Vice President and Deputy General Counsel of GEAM from October 2007 to April 2010; Vice President and Assistant Secretary of Elfun Funds and GE Retirement Savings Plan Funds from July 2003 to June 2010; and Vice President and Associate General Counsel — Marketing and Client Services (formerly Asset Management Services) at GEAM from May 1997 to October 2007.
Number of Portfolios in Fund Complex Overseen by Officer N/A
Other Directorships Held by Officer N/A
Non-Interested Directors
John R. Costantino
Address c/o GEAM 1600 Summer St. Stamford, CT 06905
Age 67
Position(s) Held with Fund Director
Term of Office and Length of Time Served Until successor is elected and qualified — 17 years
Principal Occupation(s) During Past 5 years Managing General Partner, NGN Capital LLC since 2006; and Treasurer of NeuroScience Research Institute since 1986.
Number of Portfolios in Fund Complex Overseen by Director 17
Other Directorships Held by Director Trustee of GE Institutional Funds since 1997; Trustee of Fordham University from 1989 to 1995 and from 2001 to 2007 and Trustee Emeritus since 2007; Trustee of NeuroScience Research Institute since 1986; Trustee of GE Funds from 1993 to February 2011; and Director of Artes Medical from 2006 to 2008.
23
| | |
| Additional Information | | (Unaudited) |
R. Sheldon Johnson
Address c/o GEAM 1600 Summer St. Stamford, CT 06905
Age 67
Positions(s) Held with Fund Director
Term of office and Length of Time served Unit Successor is elected and qualified — 2 years
Principal Occupation(s) During Past 5 years Head of Global Institutional Equity Sales and Marketing at Morgan Stanley & Co., Inc. from 2002 to 2006 and Managing Director at Morgan Stanley & Co., Inc. from 1988 to 2006.
Number of Portfolios in Fund Complex Overseen by Director 17
Other Directorships Held by Director Trustee of GE Institutional Funds since April 2011 and Trustee of St. Lawrence University since 2003.
Donna M. Rapaccioli
Address c/o GEAM 1600 Summer St. Stamford, CT 06905
Age 51
Position(s) Held with Fund Director
Term of Office and Length of Time Served Until successor is elected and qualified — 2 years
Principal Occupation(s) During Past 5 Years Dean of the Gabelli School of Business since 2007 and Accounting professor since 1987 at Fordham University.
Number of Portfolios in Fund Complex Overseen by Officer 17
Other Directorships Held by Director Trustee of GE Institutional Funds since January 2012 and Trustee of Emmanuel College since 2010.
The Statement of Additional Information for the Funds includes additional information about the Directors and Officers and is available, without charge, upon request by calling 1-800-242-0134.
24
| | |
| Investment Team | | (Unaudited) |
Investment Adviser and Administrator
GE Asset Management Incorporated
Board of Directors
Michael J. Cosgrove, Chairman
John R. Costantino
R. Sheldon Johnson
Donna M. Rapaccioli
Matthew J. Simpson
Secretary
Joon Won Choe
Assistant Secretary
Michelle Matzelle
Treasurer
Arthur A. Jensen
Assistant Treasurer
Robert Meyers
Distributor
GE Investment Distributors, Inc.
Member FINRA and SIPC
Custodian
State Street Bank & Trust Company
At GE Asset Management, we’re dedicated to providing the investment options you’ll need to tailor your financial portfolio to every stage of your life. Each member of the GE Family of Funds is managed according to the same principles of integrity and quality that have guided GE over the past century, and have made it the world-class company that it is today. Each fund draws strength from a heritage of investment management experience that spans more than 80 years. Whether you’re creating a new investment portfolio or adding to an established one, the GE Family of Funds offers an array of professionally managed investment options that will help you meet a lifetime of financial needs.
25
Investment Adviser
GE Asset Management Incorporated
1600 Summer Street
Stamford, CT 06905
or at:
PO Box 7900
Stamford, CT 06904-7900
Distributor
GE Investment Distributors, Inc.
member FINRA and SIPC
1600 Summer Street
Stamford, CT 06905
or at:
PO Box 7900
Stamford, CT 06904-7900
The Fund files its complete schedule of portfolio holdings with the Securities and Exchange Commission for the first and third quarters of each fiscal year on Form N-Q. The Fund’s Forms N-Q, as well as a description of the policies and procedures that the Fund uses to determine how to vote proxies (if any) relating to portfolio securities is available without charge (i) upon request, by calling 1-800-493-3042; (ii) on the Fund’s website at http://www.geam.com; and (iii) on the Commission’s website at http://www.sec.gov. The Fund’s Forms N-Q may be reviewed and copied at the Commission’s Public Reference Room in Washington, DC – information on the operation of the Public Reference Room may be obtained by calling 1-800-SEC-0330.
Information (if any) regarding how the Fund voted proxies relating to portfolio securities during the most recently disclosed 12-month period ended June 30 is available without charge (i) through the Fund’s website at http://www.geam.com; and (ii) on the Commission’s website at http://www.sec.gov.

The registrant has adopted a code of ethics, as defined in Item 2 of Form N-CSR, applicable to its principal executive officer, principal financial officer, principal accounting officer or controller, or persons performing similar functions. A copy of this code of ethics is filed as an exhibit to this Form N-CSR and is included in the following link:
https://www.geam.com/ExternalWar/common/docs/pdf/Spirit_Letter.pdf
There have been no amendments to, nor any waivers granted from, a provision that relates to any element of the code of ethics definition set forth in paragraph (b) of Item 2 of Form N-CSR during the period covered by this report.
| Item 3. | Audit Committee Financial Expert. |
The Board of Directors of the registrant has determined that John R. Costantino and Donna M. Rapaccioli are designated as the audit committee financial experts for the Funds; and further that it is the finding of the Board of Directors that Mr. Costantino and Ms. Rapaccioli, the audit committee financial experts, qualify as being “independent” pursuant to paragraph (a)(2) of Item 3 to Form N-CSR.
| Item 4. | Principal Accountant Fees and Services. |
(a) AUDIT FEES. The aggregate fees billed for each of the last two fiscal years (the “Reporting Periods”) for professional services rendered by the registrant’s principal accountant (the “Auditor”) for the audit of the registrant’s annual financial statements, or services that are normally provided by the Auditor in connection with the statutory and regulatory filings or engagements for the Reporting Periods were $158,000 in 2012 and $163,460 in 2013.
(b) AUDIT RELATED FEES. There were no fees billed by the Auditor for assurance and related services that were related to the performance of the audit of the registrant during the Reporting Periods.
(c) TAX FEES. There were no fees billed for professional services rendered by the Auditor for tax compliance, tax advice or tax planning for the registrant during the Reporting Periods.
(d) ALL OTHER FEES. There were no fees billed for products and services provided by the Auditor, other than the services reported in paragraphs (a) through (c) of this Item for the registrant during the Reporting Periods.
(e)(1) AUDIT COMMITTEE PRE-APPROVAL POLICIES AND PROCEDURES.
The Audit Committee of the GE Investments Funds, Inc. (the “Funds”) Board of Directors is responsible, among other things, for the appointment, compensation and oversight of the work of the Funds’ Auditor. As part of this responsibility and to ensure that the Auditor’s independence is not impaired, the Audit Committee (1) pre-approves the audit and non-audit services provided to the Funds by the Auditor, and (2) all non-audit services provided to the Funds’ investment adviser and covered affiliates (as defined in the Audit Committee Charter) that provide ongoing services to the Funds if the services directly impact the Funds’ operations or financial reporting, in accordance with the Audit Committee Charter. The following excerpt from the Audit Committee Charter sets forth the pre-approval policies and procedures:
Pre-Approval of Audit Related Services and Permissible Non-Audit Services. The Audit Committee shall pre-approve both audit (including audit, review, and attest) services and permissible non-audit services provided to the Fund and, if the nature of the engagement relates directly to the operations and financial reporting of the Fund, permissible non-audit services provided to any Covered Affiliate.
The Audit Committee may determine to delegate the authority to grant pre-approvals to one or more Audit Committee members, each acting on behalf of the Audit Committee. In this event, the member of the Audit Committee so delegated shall report each delegated pre-approval to the Audit Committee at its next regularly scheduled meeting. The Audit Committee may also adopt and follow, in lieu of explicit pre-approval described above, written policies and procedures detailed as to the particular service, designed to safeguard the continued independence of the Auditor, consistent with the requirements of the Act and SEC regulations there under.
Notwithstanding the foregoing, the pre-approval requirement concerning permissible non-audit services provided to the Fund or any Covered Affiliate is waived if: (1) the aggregate amount of all such non-audit services provided constitutes no more than five percent (5%) of the total amount of revenues paid to the Auditor by the Fund and the Covered Affiliates during the fiscal year in which the services are provided that would have to be pre-approved by the Audit Committee, (2) the non-audit services were not recognized as non-audit services at the time of the engagement, and (3) such non-audit services are promptly brought to the attention of the Audit Committee and approved by the Audit Committee or one or more designated members of the Audit Committee prior to the completion of the audit.
(2) PERCENTAGE OF SERVICES DESCRIBED IN PARAGRAPHS (b) THROUGH (d) APPROVED BY AUDIT COMMITTEE. No fees were charged during the Reporting Period for audit related, tax or other services as indicated in sections (b) through (d) of this Item.
(f) Not applicable.
(g) NON-AUDIT FEES. The aggregate non-audit fees billed by the Auditor for services rendered to the registrant, and rendered to the registrant’s investment adviser and any entity controlling, controlled by, or under common control with the registrant’s adviser (“Service Affiliates”), for the Reporting Periods were $0 in 2012 and $0 in 2013.
(h) AUDITOR INDEPENDENCE. There were no non-audit services rendered to Service Affiliates during the Reporting Period that were not pre-approved.
| Item 5. | Audit Committee of Listed Registrants. |
Applicable only to Closed-End Management Investment Companies.
| Item 6. | Schedule of Investments. |
| | (a) | The Schedule of Investments as of the close of the reporting period for the Total Return Fund is listed below. The Schedules of Investments as of the close of the reporting period for the U.S. Equity Fund, S&P 500 Index Fund, Premier Growth Fund, Core Value Equity Fund, Small-Cap Equity Fund, Income Fund, and the Real Estate Securities Fund and a Summary Schedule of Investments for the Total Return Fund are included as part of the report to shareholders filed under Item 1 of this form. |
Total Return Fund
Schedule of Investments—December 31, 2013
| | | | | | | | |
| | | Number of
Shares | | | Fair Value | |
Domestic Equity—40.1% † | |
Common Stock—40.1% | |
| | |
Advertising—0.1% | | | | | | | | |
Digital Generation Inc. | | | 847 | | | $ | 10,799 | (a) |
Harte-Hanks Inc. | | | 1,497 | | | | 11,707 | |
Lamar Advertising Co. | | | 1,970 | | | | 102,933 | (a) |
MDC Partners Inc. | | | 1,366 | | | | 34,847 | |
National CineMedia Inc. | | | 2,167 | | | | 43,253 | |
Omnicom Group Inc. | | | 17,071 | | | | 1,269,570 | |
ReachLocal Inc. | | | 487 | | | | 6,190 | (a) |
The Interpublic Group of Companies Inc. | | | 27,612 | | | | 488,732 | |
| | | | 1,968,031 | |
| | |
Aerospace & Defense—1.1% | | | | | | | | |
AAR Corp. | | | 1,461 | | | | 40,923 | |
Aerovironment Inc. | | | 686 | | | | 19,983 | (a) |
Alliant Techsystems Inc. | | | 958 | | | | 116,569 | |
American Science & Engineering Inc. | | | 282 | | | | 20,279 | |
API Technologies Corp. | | | 1,521 | | | | 5,187 | (a) |
Astronics Corp. | | | 603 | | | | 30,753 | (a) |
B/E Aerospace Inc. | | | 2,958 | | | | 257,435 | (a) |
Cubic Corp. | | | 725 | | | | 38,179 | |
Curtiss-Wright Corp. | | | 1,757 | | | | 109,338 | |
DigitalGlobe Inc. | | | 2,796 | | | | 115,055 | (a) |
Ducommun Inc. | | | 398 | | | | 11,864 | (a) |
Engility Holdings Inc. | | | 685 | | | | 22,879 | (a) |
Erickson Air-Crane Inc. | | | 74 | | | | 1,538 | (a) |
Esterline Technologies Corp. | | | 2,116 | | | | 215,747 | (a) |
Exelis Inc. | | | 5,632 | | | | 107,346 | |
GenCorp Inc. | | | 2,358 | | | | 42,491 | (a) |
General Dynamics Corp. | | | 22,194 | | | | 2,120,637 | |
HEICO Corp. | | | 2,491 | | | | 144,353 | |
Honeywell International Inc. | | | 52,048 | | | | 4,755,626 | |
Huntington Ingalls Industries Inc. | | | 1,477 | | | | 132,945 | |
Innovative Solutions & Support Inc. | | | 736 | | | | 5,365 | (a) |
Kratos Defense & Security Solutions Inc. | | | 1,875 | | | | 14,400 | (a) |
L-3 Communications Holdings Inc. | | | 5,879 | | | | 628,230 | |
LMI Aerospace Inc. | | | 375 | | | | 5,528 | (a) |
Lockheed Martin Corp. | | | 17,847 | | | | 2,653,135 | |
Moog Inc. | | | 1,704 | | | | 115,770 | (a) |
National Presto Industries Inc. | | | 196 | | | | 15,778 | |
Northrop Grumman Corp. | | | 14,725 | | | | 1,687,632 | |
Orbital Sciences Corp. | | | 2,271 | | | | 52,914 | (a) |
Precision Castparts Corp. | | | 9,635 | | | | 2,594,705 | |
Raytheon Co. | | | 21,191 | | | | 1,922,024 | |
Rockwell Collins Inc. | | | 8,903 | | | | 658,110 | |
Sparton Corp. | | | 327 | | | | 9,140 | (a) |
Taser International Inc. | | | 1,884 | | | | 29,918 | (a) |
| | | | | | | | |
Teledyne Technologies Inc. | | | 1,385 | | | | 127,226 | (a) |
Textron Inc. | | | 18,766 | | | | 689,838 | |
The Boeing Co. | | | 45,857 | | | | 6,259,022 | |
The KEYW Holding Corp. | | | 1,108 | | | | 14,892 | (a) |
Triumph Group Inc. | | | 1,570 | | | | 119,430 | |
United Technologies Corp. | | | 55,995 | | | | 6,372,231 | |
| | | | 32,284,415 | |
| | |
Agricultural Products—0.1% | | | | | | | | |
Alico Inc. | | | 152 | | | | 5,908 | |
Archer-Daniels-Midland Co. | | | 43,645 | | | | 1,894,193 | |
Darling International Inc. | | | 5,910 | | | | 123,401 | (a) |
Fresh Del Monte Produce Inc. | | | 1,437 | | | | 40,667 | |
Griffin Land & Nurseries Inc. | | | 124 | | | | 4,139 | |
Ingredion Inc. | | | 2,301 | | | | 157,527 | |
Limoneira Co. | | | 381 | | | | 10,131 | |
| | | | 2,235,966 | |
| | |
Air Freight & Logistics—0.3% | | | | | | | | |
Air Transport Services Group Inc. | | | 1,842 | | | | 14,902 | (a) |
Atlas Air Worldwide Holdings Inc. | | | 977 | | | | 40,204 | (a) |
CH Robinson Worldwide Inc. | | | 10,059 | | | | 586,842 | |
Echo Global Logistics Inc. | | | 594 | | | | 12,759 | (a) |
Expeditors International of Washington Inc. | | | 13,570 | | | | 600,472 | |
FedEx Corp. | | | 19,743 | | | | 2,838,451 | |
Forward Air Corp. | | | 1,165 | | | | 51,155 | |
Hub Group Inc. | | | 1,417 | | | | 56,510 | (a) |
Pacer International Inc. | | | 1,000 | | | | 8,260 | (a) |
Park-Ohio Holdings Corp. | | | 326 | | | | 17,082 | (a) |
United Parcel Service Inc. | | | 47,415 | | | | 4,982,368 | |
UTi Worldwide Inc. | | | 6,194 | | | | 108,767 | |
XPO Logistics Inc. | | | 1,072 | | | | 28,183 | (a) |
| | | | 9,345,955 | |
| | |
Airlines—0.1% | | | | | | | | |
Alaska Air Group Inc. | | | 2,088 | | | | 153,197 | |
Allegiant Travel Co. | | | 584 | | | | 61,577 | |
Delta Air Lines Inc. | | | 56,750 | | | | 1,558,923 | |
Hawaiian Holdings Inc. | | | 1,702 | | | | 16,390 | (a) |
JetBlue Airways Corp. | | | 15,315 | | | | 130,943 | (a) |
Republic Airways Holdings Inc. | | | 1,809 | | | | 19,338 | (a) |
SkyWest Inc. | | | 1,907 | | | | 28,281 | |
Southwest Airlines Co. | | | 46,216 | | | | 870,709 | |
Spirit Airlines Inc. | | | 2,293 | | | | 104,125 | (a) |
| | | | 2,943,483 | |
| | |
Airport Services—0.0%* | | | | | | | | |
Wesco Aircraft Holdings Inc. | | | 1,533 | | | | 33,603 | (a) |
| | |
Alternative Carriers—0.0%* | | | | | | | | |
8x8 Inc. | | | 3,220 | | | | 32,715 | (a) |
Cogent Communications Group Inc. | | | 1,780 | | | | 71,930 | |
inContact Inc. | | | 1,963 | | | | 15,331 | (a) |
Inteliquent Inc. | | | 1,048 | | | | 11,968 | |
Iridium Communications Inc. | | | 2,715 | | | | 16,996 | (a) |
Lumos Networks Corp. | | | 584 | | | | 12,264 | |
magicJack VocalTec Ltd. | | | 685 | | | | 8,165 | (a) |
ORBCOMM Inc. | | | 1,704 | | | | 10,804 | (a) |
| | | | | | | | |
Premiere Global Services Inc. | | | 1,759 | | | | 20,387 | (a) |
Straight Path Communications Inc. | | | 333 | | | | 2,727 | (a) |
Towerstream Corp. | | | 2,314 | | | | 6,850 | (a) |
tw telecom Inc. | | | 4,322 | | | | 131,691 | (a) |
Vonage Holdings Corp. | | | 5,322 | | | | 17,722 | (a) |
| | | | 359,550 | |
| | |
Aluminum—0.0%* | | | | | | | | |
Alcoa Inc. | | | 70,654 | | | | 751,052 | |
Century Aluminum Co. | | | 1,852 | | | | 19,372 | (a) |
Kaiser Aluminum Corp. | | | 716 | | | | 50,292 | |
Noranda Aluminum Holding Corp. | | | 1,619 | | | | 5,326 | |
| | | | 826,042 | |
| | |
Apparel Retail—0.3% | | | | | | | | |
Abercrombie & Fitch Co. | | | 2,295 | | | | 75,528 | |
Aeropostale Inc. | | | 3,032 | | | | 27,561 | (a) |
American Eagle Outfitters Inc. | | | 5,073 | | | | 73,051 | |
ANN Inc. | | | 3,121 | | | | 114,104 | (a) |
Ascena Retail Group Inc. | | | 3,868 | | | | 81,847 | (a) |
bebe stores Inc. | | | 1,010 | | | | 5,373 | |
Body Central Corp. | | | 706 | | | | 2,782 | (a) |
Brown Shoe Company Inc. | | | 1,660 | | | | 46,712 | |
Chico’s FAS Inc. | | | 4,755 | | | | 89,584 | |
Christopher & Banks Corp. | | | 1,436 | | | | 12,263 | (a) |
Citi Trends Inc. | | | 652 | | | | 11,084 | (a) |
Destination Maternity Corp. | | | 445 | | | | 13,297 | |
Destination XL Group Inc. | | | 1,280 | | | | 8,410 | (a) |
Express Inc. | | | 3,301 | | | | 61,630 | (a) |
Foot Locker Inc. | | | 4,467 | | | | 185,112 | |
Francesca’s Holdings Corp. | | | 1,682 | | | | 30,966 | (a) |
Genesco Inc. | | | 890 | | | | 65,023 | (a) |
Guess? Inc. | | | 1,778 | | | | 55,242 | |
Jos A Bank Clothiers Inc. | | | 1,077 | | | | 58,944 | (a) |
L Brands Inc. | | | 16,175 | | | | 1,000,424 | |
New York & Company Inc. | | | 1,362 | | | | 5,952 | (a) |
Pacific Sunwear of California Inc. | | | 1,667 | | | | 5,568 | (a) |
Ross Stores Inc. | | | 14,373 | | | | 1,076,969 | |
Shoe Carnival Inc. | | | 633 | | | | 18,363 | |
Stage Stores Inc. | | | 1,224 | | | | 27,197 | |
Stein Mart Inc. | | | 917 | | | | 12,334 | |
The Buckle Inc. | | | 998 | | | | 52,455 | |
The Cato Corp. | | | 1,041 | | | | 33,104 | |
The Children’s Place Retail Stores Inc. | | | 893 | | | | 50,874 | (a) |
The Finish Line Inc. | | | 1,894 | | | | 53,354 | |
The Gap Inc. | | | 17,572 | | | | 686,714 | |
The Men’s Wearhouse Inc. | | | 1,809 | | | | 92,404 | |
The Wet Seal Inc. | | | 2,890 | | | | 7,890 | (a) |
Tilly’s Inc. | | | 410 | | | | 4,695 | (a) |
TJX Companies Inc. | | | 47,175 | | | | 3,006,463 | |
Urban Outfitters Inc. | | | 7,215 | | | | 267,676 | (a) |
Zumiez Inc. | | | 799 | | | | 20,774 | (a) |
| | | | 7,441,723 | |
| | |
Apparel, Accessories & Luxury Goods—0.2% | | | | | | | | |
American Apparel Inc. | | | 2,539 | | | | 3,123 | (a) |
Carter’s Inc. | | | 1,631 | | | | 117,090 | |
Coach Inc. | | | 18,604 | | | | 1,044,243 | |
| | | | | | | | |
Columbia Sportswear Co. | | | 468 | | | | 36,855 | |
Costa Inc. | | | 408 | | | | 8,866 | (a) |
Fifth & Pacific Companies Inc. | | | 4,503 | | | | 144,411 | (a) |
Fossil Group Inc. | | | 3,259 | | | | 390,884 | (a) |
G-III Apparel Group Ltd. | | | 641 | | | | 47,299 | (a) |
Hanesbrands Inc. | | | 2,976 | | | | 209,124 | |
Iconix Brand Group Inc. | | | 1,926 | | | | 76,462 | (a) |
Movado Group Inc. | | | 665 | | | | 29,267 | |
Oxford Industries Inc. | | | 498 | | | | 40,174 | |
Perry Ellis International Inc. | | | 539 | | | | 8,511 | (a) |
PVH Corp. | | | 5,395 | | | | 733,828 | |
Quiksilver Inc. | | | 5,086 | | | | 44,604 | (a) |
Ralph Lauren Corp. | | | 3,955 | | | | 698,334 | |
The Jones Group Inc. | | | 3,023 | | | | 45,224 | |
Tumi Holdings Inc. | | | 1,815 | | | | 40,928 | (a) |
Under Armour Inc. | | | 2,410 | | | | 210,393 | (a) |
Vera Bradley Inc. | | | 730 | | | | 17,549 | (a) |
VF Corp. | | | 23,364 | | | | 1,456,512 | |
Vince Holding Corp. | | | 409 | | | | 12,544 | (a) |
| | | | 5,416,225 | |
| | |
Application Software—0.4% | | | | | | | | |
Accelrys Inc. | | | 1,916 | | | | 18,279 | (a) |
ACI Worldwide Inc. | | | 2,642 | | | | 171,730 | (a) |
Actuate Corp. | | | 1,596 | | | | 12,305 | (a) |
Adobe Systems Inc. | | | 30,837 | | | | 1,846,520 | (a) |
Advent Software Inc. | | | 2,452 | | | | 85,795 | |
American Software Inc. | | | 1,036 | | | | 10,225 | |
ANSYS Inc. | | | 2,782 | | | | 242,590 | (a) |
Aspen Technology Inc. | | | 3,502 | | | | 146,384 | (a) |
Autodesk Inc. | | | 14,951 | | | | 752,484 | (a) |
Blackbaud Inc. | | | 1,742 | | | | 65,586 | |
Bottomline Technologies Inc. | | | 1,431 | | | | 51,745 | (a) |
BroadSoft Inc. | | | 1,062 | | | | 29,035 | (a) |
Cadence Design Systems Inc. | | | 8,643 | | | | 121,175 | (a) |
Callidus Software Inc. | | | 1,542 | | | | 21,172 | (a) |
Citrix Systems Inc. | | | 12,365 | | | | 782,086 | (a) |
Compuware Corp. | | | 6,510 | | | | 72,977 | |
Comverse Inc. | | | 824 | | | | 31,971 | (a) |
Concur Technologies Inc. | | | 1,419 | | | | 146,412 | (a) |
Digimarc Corp. | | | 295 | | | | 5,682 | |
Ebix Inc. | | | 1,126 | | | | 16,575 | |
Ellie Mae Inc. | | | 981 | | | | 26,359 | (a) |
EPIQ Systems Inc. | | | 1,145 | | | | 18,560 | |
ePlus Inc. | | | 167 | | | | 9,492 | (a) |
FactSet Research Systems Inc. | | | 1,206 | | | | 130,947 | |
Fair Isaac Corp. | | | 2,421 | | | | 152,136 | |
Guidance Software Inc. | | | 654 | | | | 6,605 | (a) |
Guidewire Software Inc. | | | 1,793 | | | | 87,983 | (a) |
Informatica Corp. | | | 3,263 | | | | 135,415 | (a) |
Interactive Intelligence Group Inc. | | | 578 | | | | 38,934 | (a) |
Intuit Inc. | | | 18,895 | | | | 1,442,066 | |
Jive Software Inc. | | | 1,648 | | | | 18,540 | (a) |
Manhattan Associates Inc. | | | 724 | | | | 85,056 | (a) |
Mentor Graphics Corp. | | | 6,489 | | | | 156,190 | |
MicroStrategy Inc. | | | 338 | | | | 41,993 | (a) |
| | | | | | | | |
Mitek Systems Inc. | | | 951 | | | | 5,649 | (a) |
Model N Inc. | | | 315 | | | | 3,714 | (a) |
Monotype Imaging Holdings Inc. | | | 1,453 | | | | 46,293 | |
Netscout Systems Inc. | | | 1,373 | | | | 40,627 | (a) |
Pegasystems Inc. | | | 655 | | | | 32,213 | |
PROS Holdings Inc. | | | 849 | | | | 33,875 | (a) |
PTC Inc. | | | 8,058 | | | | 285,173 | (a) |
QAD Inc. | | | 234 | | | | 4,132 | |
QLIK Technologies Inc. | | | 3,340 | | | | 88,944 | (a) |
RealPage Inc. | | | 1,715 | | | | 40,097 | (a) |
Salesforce.com Inc. | | | 36,761 | | | | 2,028,840 | (a) |
Seachange International Inc. | | | 1,305 | | | | 15,869 | (a) |
Silver Spring Networks Inc. | | | 227 | | | | 4,767 | (a) |
SolarWinds Inc. | | | 1,962 | | | | 74,222 | (a) |
Solera Holdings Inc. | | | 2,073 | | | | 146,686 | |
SS&C Technologies Holdings Inc. | | | 2,240 | | | | 99,142 | (a) |
Synchronoss Technologies Inc. | | | 1,113 | | | | 34,581 | (a) |
Synopsys Inc. | | | 4,644 | | | | 188,407 | (a) |
Tangoe Inc. | | | 1,085 | | | | 19,541 | (a) |
Telenav Inc. | | | 688 | | | | 4,534 | (a) |
The Ultimate Software Group Inc. | | | 1,045 | | | | 160,115 | (a) |
TIBCO Software Inc. | | | 4,611 | | | | 103,655 | (a) |
TiVo Inc. | | | 4,831 | | | | 63,383 | (a) |
Tyler Technologies Inc. | | | 1,175 | | | | 120,003 | (a) |
Verint Systems Inc. | | | 2,016 | | | | 86,567 | (a) |
VirnetX Holding Corp. | | | 1,601 | | | | 31,075 | (a) |
Vringo Inc. | | | 2,628 | | | | 7,779 | (a) |
| | | | 10,750,887 | |
| | |
Asset Management & Custody Banks—0.6% | | | | | | | | |
Affiliated Managers Group Inc. | | | 1,590 | | | | 344,839 | (a) |
Ameriprise Financial Inc. | | | 12,904 | | | | 1,484,605 | |
Apollo Investment Corp. | | | 15,382 | | | | 130,439 | |
Arlington Asset Investment Corp. | | | 587 | | | | 15,491 | |
BlackRock Inc. | | | 8,428 | | | | 2,667,209 | |
Calamos Asset Management Inc. | | | 1,022 | | | | 12,100 | |
Capital Southwest Corp. | | | 460 | | | | 16,040 | |
Capitala Finance Corp. | | | 150 | | | | 2,985 | |
CIFC Corp. | | | 406 | | | | 3,159 | |
Cohen & Steers Inc. | | | 729 | | | | 29,204 | |
Diamond Hill Investment Group Inc. | | | 115 | | | | 13,609 | |
Eaton Vance Corp. | | | 3,654 | | | | 156,355 | |
Federated Investors Inc. | | | 2,817 | | | | 81,130 | |
Fidus Investment Corp. | | | 510 | | | | 11,087 | |
Fifth Street Finance Corp. | | | 4,977 | | | | 46,037 | |
Financial Engines Inc. | | | 1,844 | | | | 128,121 | |
Firsthand Technology Value Fund Inc. | | | 380 | | | | 8,805 | |
Franklin Resources Inc. | | | 26,781 | | | | 1,546,067 | |
GAMCO Investors Inc. | | | 203 | | | | 17,655 | |
Garrison Capital Inc. | | | 335 | | | | 4,650 | |
Gladstone Capital Corp. | | | 1,077 | | | | 10,339 | |
Gladstone Investment Corp. | | | 1,250 | | | | 10,075 | |
Golub Capital BDC Inc. | | | 1,494 | | | | 28,550 | |
GSV Capital Corp. | | | 691 | | | | 8,354 | (a) |
Hercules Technology Growth Capital Inc. | | | 2,404 | | | | 39,426 | |
Horizon Technology Finance Corp. | | | 312 | | | | 4,434 | |
| | | | | | | | |
ICG Group Inc. | | | 1,282 | | | | 23,884 | (a) |
Invesco Ltd. | | | 29,404 | | | | 1,070,306 | |
Janus Capital Group Inc. | | | 10,243 | | | | 126,706 | |
KCAP Financial Inc. | | | 1,173 | | | | 9,466 | |
Legg Mason Inc. | | | 7,029 | | | | 305,621 | |
Main Street Capital Corp. | | | 1,364 | | | | 44,589 | |
Manning & Napier Inc. | | | 598 | | | | 10,555 | |
MCG Capital Corp. | | | 2,461 | | | | 10,828 | |
Medallion Financial Corp. | | | 589 | | | | 8,452 | |
Medley Capital Corp. | | | 1,529 | | | | 21,177 | |
MVC Capital Inc. | | | 1,069 | | | | 14,431 | |
New Mountain Finance Corp. | | | 1,406 | | | | 21,146 | |
NGP Capital Resources Co. | | | 1,121 | | | | 8,374 | |
Northern Trust Corp. | | | 14,902 | | | | 922,285 | |
PennantPark Floating Rate Capital Ltd. | | | 353 | | | | 4,847 | |
PennantPark Investment Corp. | | | 2,524 | | | | 29,278 | |
Prospect Capital Corp. | | | 10,398 | | | | 116,666 | |
Pzena Investment Management Inc. | | | 618 | | | | 7,268 | |
Safeguard Scientifics Inc. | | | 795 | | | | 15,972 | (a) |
SEI Investments Co. | | | 4,301 | | | | 149,374 | |
Silvercrest Asset Management Group Inc. | | | 186 | | | | 3,171 | |
Solar Capital Ltd. | | | 1,720 | | | | 38,786 | |
Solar Senior Capital Ltd. | | | 232 | | | | 4,227 | |
State Street Corp. | | | 29,120 | | | | 2,137,117 | (b) |
Stellus Capital Investment Corp. | | | 311 | | | | 4,649 | |
T Rowe Price Group Inc. | | | 17,307 | | | | 1,449,807 | |
TCP Capital Corp. | | | 1,322 | | | | 22,183 | |
The Bank of New York Mellon Corp. | | | 76,183 | | | | 2,661,834 | |
THL Credit Inc. | | | 1,048 | | | | 17,281 | |
TICC Capital Corp. | | | 1,975 | | | | 20,421 | |
Triangle Capital Corp. | | | 1,073 | | | | 29,668 | |
Virtus Investment Partners Inc. | | | 266 | | | | 53,213 | (a) |
Waddell & Reed Financial Inc. | | | 2,563 | | | | 166,903 | |
Walter Investment Management Corp. | | | 1,431 | | | | 50,600 | (a) |
Westwood Holdings Group Inc. | | | 272 | | | | 16,840 | |
WhiteHorse Finance Inc. | | | 332 | | | | 5,017 | |
WisdomTree Investments Inc. | | | 3,821 | | | | 67,670 | (a) |
| | | | 16,491,377 | |
| | |
Auto Parts & Equipment—0.2% | | | | | | | | |
American Axle & Manufacturing Holdings Inc. | | | 2,584 | | | | 52,843 | (a) |
BorgWarner Inc. | | | 15,384 | | | | 860,119 | |
Dana Holding Corp. | | | 5,528 | | | | 108,459 | |
Delphi Automotive PLC | | | 18,575 | | | | 1,116,915 | |
Dorman Products Inc. | | | 966 | | | | 54,164 | (a) |
Drew Industries Inc. | | | 862 | | | | 44,134 | |
Federal-Mogul Corp. | | | 654 | | | | 12,871 | (a) |
Fox Factory Holding Corp. | | | 284 | | | | 5,004 | (a) |
Fuel Systems Solutions Inc. | | | 482 | | | | 6,685 | (a) |
Gentex Corp. | | | 4,347 | | | | 143,408 | |
Gentherm Inc. | | | 1,223 | | | | 32,789 | (a) |
Johnson Controls Inc. | | | 45,437 | | | | 2,330,918 | |
Modine Manufacturing Co. | | | 1,651 | | | | 21,166 | (a) |
Remy International Inc. | | | 478 | | | | 11,147 | |
Shiloh Industries Inc. | | | 213 | | | | 4,154 | (a) |
Spartan Motors Inc. | | | 1,559 | | | | 10,445 | |
| | | | | | | | |
Standard Motor Products Inc. | | | 751 | | | | 27,637 | |
Stoneridge Inc. | | | 1,048 | | | | 13,362 | (a) |
Superior Industries International Inc. | | | 880 | | | | 18,154 | |
Tenneco Inc. | | | 2,292 | | | | 129,658 | (a) |
Tower International Inc. | | | 192 | | | | 4,109 | (a) |
| | | | 5,008,141 | |
| | |
Automobile Manufacturers—0.2% | | | | | | | | |
Ford Motor Co. | | | 261,639 | | | | 4,037,090 | |
General Motors Co. | | | 75,567 | | | | 3,088,423 | (a) |
Thor Industries Inc. | | | 1,352 | | | | 74,671 | |
Winnebago Industries Inc. | | | 1,044 | | | | 28,658 | (a) |
| | | | 7,228,842 | |
| | |
Automotive Retail—0.1% | | | | | | | | |
Advance Auto Parts Inc. | | | 2,188 | | | | 242,168 | |
America’s Car-Mart Inc. | | | 346 | | | | 14,612 | (a) |
Asbury Automotive Group Inc. | | | 1,184 | | | | 63,628 | (a) |
AutoNation Inc. | | | 4,187 | | | | 208,052 | (a) |
AutoZone Inc. | | | 2,258 | | | | 1,079,188 | (a) |
CarMax Inc. | | | 14,815 | | | | 696,601 | (a) |
CST Brands Inc. | | | 2,261 | | | | 83,024 | |
Group 1 Automotive Inc. | | | 807 | | | | 57,313 | |
Lithia Motors Inc. | | | 851 | | | | 59,076 | |
Monro Muffler Brake Inc. | | | 1,197 | | | | 67,463 | |
Murphy USA Inc. | | | 1,328 | | | | 55,192 | (a) |
O’Reilly Automotive Inc. | | | 7,119 | | | | 916,286 | (a) |
Penske Automotive Group Inc. | | | 1,579 | | | | 74,466 | |
Sonic Automotive Inc. | | | 1,479 | | | | 36,206 | |
The Pep Boys-Manny Moe & Jack | | | 1,991 | | | | 24,171 | (a) |
| | | | 3,677,446 | |
| | |
Biotechnology—1.0% | | | | | | | | |
ACADIA Pharmaceuticals Inc. | | | 2,691 | | | | 67,248 | (a) |
Acceleron Pharma Inc. | | | 228 | | | | 9,029 | (a) |
Achillion Pharmaceuticals Inc. | | | 4,032 | | | | 13,386 | (a) |
Acorda Therapeutics Inc. | | | 1,531 | | | | 44,705 | (a) |
Aegerion Pharmaceuticals Inc. | | | 1,105 | | | | 78,411 | (a) |
Agios Pharmaceuticals Inc. | | | 253 | | | | 6,059 | (a) |
Alexion Pharmaceuticals Inc. | | | 13,006 | | | | 1,730,578 | (a) |
Alnylam Pharmaceuticals Inc. | | | 2,178 | | | | 140,111 | (a) |
AMAG Pharmaceuticals Inc. | | | 744 | | | | 18,057 | (a) |
Amgen Inc. | | | 50,022 | | | | 5,710,512 | |
Amicus Therapeutics Inc. | | | 1,682 | | | | 3,953 | (a) |
Anacor Pharmaceuticals Inc. | | | 955 | | | | 16,025 | (a) |
Arena Pharmaceuticals Inc. | | | 8,286 | | | | 48,473 | (a) |
Arqule Inc. | | | 3,216 | | | | 6,914 | (a) |
Array BioPharma Inc. | | | 4,283 | | | | 21,458 | (a) |
AVEO Pharmaceuticals Inc. | | | 1,917 | | | | 3,527 | (a) |
BIND Therapeutics Inc. | | | 174 | | | | 2,626 | (a) |
Biogen Idec Inc. | | | 15,668 | | | | 4,383,123 | (a) |
Biotime Inc. | | | 1,543 | | | | 5,555 | (a) |
Bluebird Bio Inc. | | | 249 | | | | 5,224 | (a) |
Celgene Corp. | | | 27,333 | | | | 4,618,184 | (a) |
CELL THERAPEUTICS Inc. | | | 4,386 | | | | 8,421 | (a) |
Celldex Therapeutics Inc. | | | 3,337 | | | | 80,789 | (a) |
Cellular Dynamics International Inc. | | | 133 | | | | 2,196 | (a) |
| | | | | | | | |
Cepheid Inc. | | | 2,566 | | | | 119,884 | (a) |
Chelsea Therapeutics International Ltd. | | | 2,648 | | | | 11,731 | (a) |
ChemoCentryx Inc. | | | 915 | | | | 5,298 | (a) |
Chimerix Inc. | | | 285 | | | | 4,306 | (a) |
Clovis Oncology Inc. | | | 668 | | | | 40,260 | (a) |
Conatus Pharmaceuticals Inc. | | | 239 | | | | 1,542 | (a) |
Coronado Biosciences Inc. | | | 843 | | | | 2,217 | (a) |
Cubist Pharmaceuticals Inc. | | | 2,230 | | | | 153,580 | (a) |
Curis Inc. | | | 2,601 | | | | 7,335 | (a) |
Cytokinetics Inc. | | | 899 | | | | 5,844 | (a) |
Cytori Therapeutics Inc. | | | 3,179 | | | | 8,170 | (a) |
Dendreon Corp. | | | 5,804 | | | | 17,354 | (a) |
Durata Therapeutics Inc. | | | 514 | | | | 6,574 | (a) |
Dyax Corp. | | | 4,591 | | | | 34,570 | (a) |
Dynavax Technologies Corp. | | | 9,859 | | | | 19,324 | (a) |
Emergent Biosolutions Inc. | | | 1,012 | | | | 23,266 | (a) |
Enanta Pharmaceuticals Inc. | | | 139 | | | | 3,792 | (a) |
Enzon Pharmaceuticals Inc. | | | 1,783 | | | | 2,068 | |
Epizyme Inc. | | | 206 | | | | 4,285 | (a) |
Esperion Therapeutics Inc. | | | 144 | | | | 1,979 | (a) |
Exact Sciences Corp. | | | 2,786 | | | | 32,568 | (a) |
Exelixis Inc. | | | 6,714 | | | | 41,157 | (a) |
Fibrocell Science Inc. | | | 816 | | | | 3,313 | (a) |
Five Prime Therapeutics Inc. | | | 187 | | | | 3,140 | (a) |
Foundation Medicine Inc. | | | 247 | | | | 5,884 | (a) |
Galena Biopharma Inc. | | | 3,777 | | | | 18,734 | (a) |
Genomic Health Inc. | | | 594 | | | | 17,386 | (a) |
Geron Corp. | | | 4,588 | | | | 21,747 | (a) |
Gilead Sciences Inc. | | | 101,709 | | | | 7,643,431 | (a) |
GTx Inc. | | | 1,449 | | | | 2,391 | (a) |
Halozyme Therapeutics Inc. | | | 3,269 | | | | 49,002 | (a) |
Harvard Apparatus Regenerative Technology Inc. | | | 280 | | | | 1,330 | (a) |
Hyperion Therapeutics Inc. | | | 333 | | | | 6,733 | (a) |
Idenix Pharmaceuticals Inc. | | | 3,842 | | | | 22,975 | (a) |
ImmunoGen Inc. | | | 3,188 | | | | 46,768 | (a) |
Immunomedics Inc. | | | 2,819 | | | | 12,967 | (a) |
Infinity Pharmaceuticals Inc. | | | 1,802 | | | | 24,886 | (a) |
Insmed Inc. | | | 1,332 | | | | 22,657 | (a) |
Insys Therapeutics Inc. | | | 158 | | | | 6,116 | (a) |
Intercept Pharmaceuticals Inc. | | | 238 | | | | 16,251 | (a) |
InterMune Inc. | | | 3,347 | | | | 49,301 | (a) |
Intrexon Corp. | | | 433 | | | | 10,305 | (a) |
Ironwood Pharmaceuticals Inc. | | | 3,465 | | | | 40,229 | (a) |
Isis Pharmaceuticals Inc. | | | 4,220 | | | | 168,125 | (a) |
KaloBios Pharmaceuticals Inc. | | | 589 | | | | 2,603 | (a) |
Karyopharm Therapeutics Inc. | | | 260 | | | | 5,959 | (a) |
Keryx Biopharmaceuticals Inc. | | | 3,052 | | | | 39,523 | (a) |
KYTHERA Biopharmaceuticals Inc. | | | 441 | | | | 16,427 | (a) |
Lexicon Pharmaceuticals Inc. | | | 8,160 | | | | 14,688 | (a) |
Ligand Pharmaceuticals Inc. | | | 664 | | | | 34,926 | (a) |
MacroGenics Inc. | | | 201 | | | | 5,514 | (a) |
MannKind Corp. | | | 5,659 | | | | 29,483 | (a) |
MEI Pharma Inc. | | | 413 | | | | 3,308 | (a) |
Merrimack Pharmaceuticals Inc. | | | 3,623 | | | | 19,347 | (a) |
MiMedx Group Inc. | | | 3,602 | | | | 31,482 | (a) |
| | | | | | | | |
Momenta Pharmaceuticals Inc. | | | 1,704 | | | | 30,127 | (a) |
Nanosphere Inc. | | | 1,489 | | | | 3,410 | (a) |
Navidea Biopharmaceuticals Inc. | | | 4,620 | | | | 9,563 | (a) |
Neurocrine Biosciences Inc. | | | 2,464 | | | | 23,014 | (a) |
NewLink Genetics Corp. | | | 632 | | | | 13,910 | (a) |
Novavax Inc. | | | 6,902 | | | | 35,338 | (a) |
NPS Pharmaceuticals Inc. | | | 3,826 | | | | 116,157 | (a) |
OncoGenex Pharmaceutical Inc. | | | 693 | | | | 5,780 | (a) |
OncoMed Pharmaceuticals Inc. | | | 163 | | | | 4,812 | (a) |
Onconova Therapeutics Inc. | | | 213 | | | | 2,445 | (a) |
Ophthotech Corp. | | | 322 | | | | 10,417 | (a) |
Opko Health Inc. | | | 7,244 | | | | 61,139 | (a) |
Orexigen Therapeutics Inc. | | | 3,473 | | | | 19,553 | (a) |
Osiris Therapeutics Inc. | | | 642 | | | | 10,323 | (a) |
OvaScience Inc. | | | 352 | | | | 3,217 | (a) |
PDL BioPharma Inc. | | | 5,394 | | | | 45,525 | |
Peregrine Pharmaceuticals Inc. | | | 5,398 | | | | 7,503 | (a) |
Portola Pharmaceuticals Inc. | | | 352 | | | | 9,064 | (a) |
Progenics Pharmaceuticals Inc. | | | 2,247 | | | | 11,977 | (a) |
PTC Therapeutics Inc. | | | 359 | | | | 6,092 | (a) |
Puma Biotechnology Inc. | | | 843 | | | | 87,276 | (a) |
Raptor Pharmaceutical Corp. | | | 2,200 | | | | 28,644 | (a) |
Receptos Inc. | | | 264 | | | | 7,653 | (a) |
Regeneron Pharmaceuticals Inc. | | | 5,210 | | | | 1,434,001 | (a) |
Regulus Therapeutics Inc. | | | 206 | | | | 1,522 | (a) |
Repligen Corp. | | | 1,151 | | | | 15,700 | (a) |
Rigel Pharmaceuticals Inc. | | | 2,871 | | | | 8,182 | (a) |
Sangamo Biosciences Inc. | | | 2,330 | | | | 32,364 | (a) |
Sarepta Therapeutics Inc. | | | 1,429 | | | | 29,109 | (a) |
SIGA Technologies Inc. | | | 1,586 | | | | 5,186 | (a) |
Spectrum Pharmaceuticals Inc. | | | 2,161 | | | | 19,125 | (a) |
Stemline Therapeutics Inc. | | | 334 | | | | 6,546 | (a) |
Sunesis Pharmaceuticals Inc. | | | 1,624 | | | | 7,698 | (a) |
Synageva BioPharma Corp. | | | 699 | | | | 45,239 | (a) |
Synergy Pharmaceuticals Inc. | | | 3,085 | | | | 17,369 | (a) |
Synta Pharmaceuticals Corp. | | | 1,678 | | | | 8,793 | (a) |
Targacept Inc. | | | 1,463 | | | | 6,072 | (a) |
TESARO Inc. | | | 538 | | | | 15,193 | (a) |
Tetraphase Pharmaceuticals Inc. | | | 635 | | | | 8,585 | (a) |
TG Therapeutics Inc. | | | 800 | | | | 3,120 | (a) |
Threshold Pharmaceuticals Inc. | | | 1,949 | | | | 9,102 | (a) |
United Therapeutics Corp. | | | 1,387 | | | | 156,842 | (a) |
Vanda Pharmaceuticals Inc. | | | 1,220 | | | | 15,140 | (a) |
Verastem Inc. | | | 756 | | | | 8,618 | (a) |
Vertex Pharmaceuticals Inc. | | | 15,506 | | | | 1,152,096 | (a) |
Vical Inc. | | | 2,268 | | | | 2,676 | (a) |
XOMA Corp. | | | 2,780 | | | | 18,709 | (a) |
ZIOPHARM Oncology Inc. | | | 3,260 | | | | 14,148 | (a) |
| | | | 29,562,673 | |
| | |
Brewers—0.0%* | | | | | | | | |
Craft Brew Alliance Inc. | | | 504 | | | | 8,276 | (a) |
Molson Coors Brewing Co. | | | 10,548 | | | | 592,270 | |
The Boston Beer Company Inc. | | | 305 | | | | 73,746 | (a) |
| | | | 674,292 | |
| | | | | | | | |
| | |
Broadcasting—0.2% | | | | | | | | |
Beasley Broadcasting Group Inc. | | | 203 | | | | 1,772 | |
CBS Corp. | | | 37,018 | | | | 2,359,527 | |
Central European Media Enterprises Ltd. | | | 2,590 | | | | 9,946 | (a) |
Crown Media Holdings Inc. | | | 1,268 | | | | 4,476 | (a) |
Cumulus Media Inc. | | | 3,137 | | | | 24,249 | (a) |
Discovery Communications Inc. | | | 14,969 | | | | 1,353,497 | (a) |
Entercom Communications Corp. | | | 708 | | | | 7,441 | (a) |
Entravision Communications Corp. | | | 2,081 | | | | 12,673 | |
Gray Television Inc. | | | 1,899 | | | | 28,257 | (a) |
Hemisphere Media Group Inc. | | | 363 | | | | 4,309 | (a) |
Media General Inc. | | | 739 | | | | 16,702 | (a) |
Nexstar Broadcasting Group Inc. | | | 1,130 | | | | 62,975 | |
Saga Communications Inc. | | | 219 | | | | 11,016 | |
Salem Communications Corp. | | | 529 | | | | 4,602 | |
Scripps Networks Interactive Inc. | | | 7,319 | | | | 632,435 | |
Sinclair Broadcast Group Inc. | | | 2,643 | | | | 94,434 | |
| | | | 4,628,311 | |
| | |
Building Products—0.1% | | | | | | | | |
AAON Inc. | | | 1,033 | | | | 33,004 | |
American Woodmark Corp. | | | 343 | | | | 13,559 | (a) |
AO Smith Corp. | | | 2,299 | | | | 124,008 | |
Apogee Enterprises Inc. | | | 1,094 | | | | 39,286 | |
Builders FirstSource Inc. | | | 1,505 | | | | 10,746 | (a) |
Fortune Brands Home & Security Inc. | | | 4,991 | | | | 228,089 | |
Gibraltar Industries Inc. | | | 1,080 | | | | 20,077 | (a) |
Griffon Corp. | | | 1,606 | | | | 21,215 | |
Insteel Industries Inc. | | | 680 | | | | 15,456 | |
Lennox International Inc. | | | 1,361 | | | | 115,767 | |
Masco Corp. | | | 23,681 | | | | 539,216 | |
NCI Building Systems Inc. | | | 784 | | | | 13,751 | (a) |
Norcraft Companies Inc. | | | 266 | | | | 5,219 | (a) |
Nortek Inc. | | | 331 | | | | 24,693 | (a) |
Patrick Industries Inc. | | | 264 | | | | 7,637 | (a) |
PGT Inc. | | | 1,280 | | | | 12,954 | (a) |
Ply Gem Holdings Inc. | | | 673 | | | | 12,134 | (a) |
Quanex Building Products Corp. | | | 1,365 | | | | 27,191 | |
Simpson Manufacturing Company Inc. | | | 1,552 | | | | 57,005 | |
Trex Company Inc. | | | 611 | | | | 48,593 | (a) |
Universal Forest Products Inc. | | | 717 | | | | 37,384 | |
USG Corp. | | | 2,921 | | | | 82,898 | (a) |
| | | | 1,489,882 | |
| | |
Cable & Satellite—0.5% | | | | | | | | |
AMC Networks Inc. | | | 1,773 | | | | 120,759 | (a) |
Cablevision Systems Corp. | | | 13,998 | | | | 250,984 | |
Comcast Corp., Class A | | | 172,857 | | | | 8,982,514 | |
DIRECTV | | | 32,414 | | | | 2,239,483 | (a) |
Loral Space & Communications Inc. | | | 484 | | | | 39,195 | (a) |
Time Warner Cable Inc. | | | 18,698 | | | | 2,533,579 | |
| | | | 14,166,514 | |
| | |
Casinos & Gaming—0.1% | | | | | | | | |
Bally Technologies Inc. | | | 1,177 | | | | 92,336 | (a) |
Boyd Gaming Corp. | | | 2,617 | | | | 29,467 | (a) |
Caesars Entertainment Corp. | | | 1,493 | | | | 32,159 | (a) |
| | | | | | | | |
Churchill Downs Inc. | | | 515 | | | | 46,170 | |
International Game Technology | | | 16,512 | | | | 299,858 | |
Isle of Capri Casinos Inc. | | | 998 | | | | 8,982 | (a) |
Monarch Casino & Resort Inc. | | | 405 | | | | 8,132 | (a) |
Multimedia Games Holding Company Inc. | | | 1,083 | | | | 33,963 | (a) |
Pinnacle Entertainment Inc. | | | 2,226 | | | | 57,854 | (a) |
Scientific Games Corp. | | | 3,260 | | | | 55,192 | (a) |
Wynn Resorts Ltd. | | | 5,358 | | | | 1,040,577 | |
| | | | 1,704,690 | |
| | |
Catalog Retail—0.0%* | | | | | | | | |
HSN Inc. | | | 2,309 | | | | 143,851 | |
ValueVision Media Inc. | | | 1,249 | | | | 8,730 | (a) |
| | | | 152,581 | |
| | |
Coal & Consumable Fuels—0.0%* | | | | | | | | |
Alpha Natural Resources Inc. | | | 14,893 | | | | 106,336 | (a) |
Arch Coal Inc. | | | 7,844 | | | | 34,906 | |
Cloud Peak Energy Inc. | | | 2,327 | | | | 41,886 | (a) |
CONSOL Energy Inc. | | | 15,187 | | | | 577,713 | |
Hallador Energy Co. | | | 188 | | | | 1,515 | |
KiOR Inc. | | | 1,272 | | | | 2,137 | (a) |
L&L Energy Inc. | | | 1,397 | | | | 2,347 | (a,h) |
Peabody Energy Corp. | | | 18,001 | | | | 351,560 | |
Solazyme Inc. | | | 1,729 | | | | 18,829 | (a) |
Ur-Energy Inc. | | | 3,907 | | | | 5,392 | (a) |
Uranium Energy Corp. | | | 2,752 | | | | 5,504 | (a) |
Westmoreland Coal Co. | | | 549 | | | | 10,590 | (a) |
| | | | 1,158,715 | |
| | |
Commercial Printing—0.0%* | | | | | | | | |
Cenveo Inc. | | | 2,794 | | | | 9,611 | (a) |
Consolidated Graphics Inc. | | | 253 | | | | 17,062 | (a) |
Courier Corp. | | | 418 | | | | 7,562 | |
Deluxe Corp. | | | 3,439 | | | | 179,481 | |
Ennis Inc. | | | 1,147 | | | | 20,302 | |
InnerWorkings Inc. | | | 1,525 | | | | 11,880 | (a) |
Multi-Color Corp. | | | 403 | | | | 15,209 | |
Quad/Graphics Inc. | | | 873 | | | | 23,772 | |
RR Donnelley & Sons Co. | | | 5,435 | | | | 110,222 | |
| | | | 395,101 | |
| | |
Commodity Chemicals—0.1% | | | | | | | | |
Arabian American Development Co. | | | 745 | | | | 9,350 | (a) |
Axiall Corp. | | | 2,622 | | | | 124,388 | |
Cabot Corp. | | | 1,797 | | | | 92,366 | |
Calgon Carbon Corp. | | | 1,999 | | | | 41,119 | (a) |
Hawkins Inc. | | | 385 | | | | 14,318 | |
Koppers Holdings Inc. | | | 780 | | | | 35,685 | |
LyondellBasell Industries N.V. | | | 28,977 | | | | 2,326,274 | |
Tredegar Corp. | | | 940 | | | | 27,081 | |
| | | | 2,670,581 | |
| | |
Communications Equipment—0.7% | | | | | | | | |
ADTRAN Inc. | | | 3,990 | | | | 107,770 | |
Alliance Fiber Optic Products Inc. | | | 486 | | | | 7,314 | |
Anaren Inc. | | | 360 | | | | 10,076 | (a) |
| | | | | | | | |
Applied Optoelectronics Inc. | | | 166 | | | | 2,492 | (a) |
ARRIS Group Inc. | | | 4,470 | | | | 108,912 | (a) |
Aruba Networks Inc. | | | 4,368 | | | | 78,187 | (a) |
Aviat Networks Inc. | | | 2,985 | | | | 6,746 | (a) |
Bel Fuse Inc. | | | 358 | | | | 7,629 | |
Black Box Corp. | | | 544 | | | | 16,211 | |
CalAmp Corp. | | | 1,300 | | | | 36,361 | (a) |
Calix Inc. | | | 1,439 | | | | 13,872 | (a) |
Ciena Corp. | | | 6,987 | | | | 167,199 | (a) |
Cisco Systems Inc. | | | 354,647 | | | | 7,961,825 | |
Comtech Telecommunications Corp. | | | 551 | | | | 17,368 | |
Digi International Inc. | | | 1,109 | | | | 13,441 | (a) |
Emulex Corp. | | | 2,958 | | | | 21,179 | (a) |
Extreme Networks Inc. | | | 3,512 | | | | 24,584 | (a) |
F5 Networks Inc. | | | 5,148 | | | | 467,747 | (a) |
Finisar Corp. | | | 3,576 | | | | 85,538 | (a) |
Harmonic Inc. | | | 4,158 | | | | 30,686 | (a) |
Harris Corp. | | | 7,090 | | | | 494,953 | |
Infinera Corp. | | | 4,401 | | | | 43,042 | (a) |
InterDigital Inc. | | | 2,825 | | | | 83,309 | |
Ixia | | | 2,022 | | | | 26,913 | (a) |
JDS Uniphase Corp. | | | 6,995 | | | | 90,795 | (a) |
Juniper Networks Inc. | | | 33,499 | | | | 756,072 | (a) |
KVH Industries Inc. | | | 705 | | | | 9,186 | (a) |
Motorola Solutions Inc. | | | 15,274 | | | | 1,030,995 | |
NETGEAR Inc. | | | 1,462 | | | | 48,158 | (a) |
Numerex Corp. | | | 468 | | | | 6,061 | (a) |
Oplink Communications Inc. | | | 614 | | | | 11,420 | (a) |
Parkervision Inc. | | | 3,300 | | | | 15,015 | (a) |
PC-Tel Inc. | | | 792 | | | | 7,579 | |
Plantronics Inc. | | | 2,982 | | | | 138,514 | |
Polycom Inc. | | | 4,336 | | | | 48,693 | (a) |
Procera Networks Inc. | | | 904 | | | | 13,578 | (a) |
QUALCOMM Inc. | | | 112,062 | | | | 8,320,604 | |
Riverbed Technology Inc. | | | 4,854 | | | | 87,760 | (a) |
Ruckus Wireless Inc. | | | 1,766 | | | | 25,077 | (a) |
ShoreTel Inc. | | | 2,288 | | | | 21,233 | (a) |
Sonus Networks Inc. | | | 8,217 | | | | 25,884 | (a) |
Tessco Technologies Inc. | | | 239 | | | | 9,637 | |
Ubiquiti Networks Inc. | | | 482 | | | | 22,153 | (a) |
ViaSat Inc. | | | 1,483 | | | | 92,910 | (a) |
Westell Technologies Inc. | | | 2,041 | | | | 8,266 | (a) |
| | | | 20,622,944 | |
| | |
Computer & Electronics Retail—0.0%* | | | | | | | | |
Best Buy Company Inc. | | | 18,105 | | | | 722,027 | |
Conn’s Inc. | | | 841 | | | | 66,262 | (a) |
GameStop Corp. | | | 7,661 | | | | 377,381 | |
hhgregg Inc. | | | 432 | | | | 6,035 | (a) |
RadioShack Corp. | | | 3,731 | | | | 9,701 | (a) |
Rent-A-Center Inc. | | | 3,453 | | | | 115,123 | |
Systemax Inc. | | | 471 | | | | 5,299 | (a) |
| | | | 1,301,828 | |
| | | | | | | | |
| | |
Computer Hardware—1.3% | | | | | | | | |
3D Systems Corp. | | | 2,870 | | | | 266,709 | (a) |
Apple Inc. | | | 59,681 | | | | 33,487,606 | |
Avid Technology Inc. | | | 1,449 | | | | 11,809 | (a) |
Cray Inc. | | | 1,514 | | | | 41,574 | (a) |
Diebold Inc. | | | 1,910 | | | | 63,049 | |
Hewlett-Packard Co. | | | 127,477 | | | | 3,566,807 | |
NCR Corp. | | | 4,997 | | | | 170,198 | (a) |
Silicon Graphics International Corp. | | | 1,254 | | | | 16,816 | (a) |
Super Micro Computer Inc. | | | 1,103 | | | | 18,928 | (a) |
| | | | 37,643,496 | |
| | |
Computer Storage & Peripherals—0.3% | | | | | | | | |
Datalink Corp. | | | 673 | | | | 7,336 | (a) |
Electronics for Imaging Inc. | | | 1,776 | | | | 68,784 | (a) |
EMC Corp. | | | 136,500 | | | | 3,432,975 | |
Fusion-io Inc. | | | 2,893 | | | | 25,777 | (a) |
Hutchinson Technology Inc. | | | 1,009 | | | | 3,229 | (a) |
Imation Corp. | | | 1,463 | | | | 6,847 | (a) |
Immersion Corp. | | | 1,035 | | | | 10,743 | (a) |
Lexmark International Inc. | | | 1,872 | | | | 66,493 | |
NetApp Inc. | | | 22,608 | | | | 930,093 | |
QLogic Corp. | | | 3,344 | | | | 39,560 | (a) |
Quantum Corp. | | | 7,630 | | | | 9,156 | (a) |
SanDisk Corp. | | | 14,984 | | | | 1,056,971 | |
Seagate Technology PLC | | | 21,595 | | | | 1,212,775 | |
Violin Memory Inc. | | | 745 | | | | 2,950 | (a) |
Western Digital Corp. | | | 13,964 | | | | 1,171,580 | |
| | | | 8,045,269 | |
| | |
Construction & Engineering—0.1% | | | | | | | | |
AECOM Technology Corp. | | | 2,947 | | | | 86,730 | (a) |
Aegion Corp. | | | 1,488 | | | | 32,572 | (a) |
Ameresco Inc. | | | 976 | | | | 9,428 | (a) |
Argan Inc. | | | 510 | | | | 14,056 | |
Comfort Systems USA Inc. | | | 1,435 | | | | 27,825 | |
Dycom Industries Inc. | | | 1,238 | | | | 34,404 | (a) |
EMCOR Group Inc. | | | 2,533 | | | | 107,501 | |
Fluor Corp. | | | 10,824 | | | | 869,059 | |
Furmanite Corp. | | | 1,276 | | | | 13,551 | (a) |
Granite Construction Inc. | | | 2,586 | | | | 90,458 | |
Great Lakes Dredge & Dock Corp. | | | 2,185 | | | | 20,102 | (a) |
Jacobs Engineering Group Inc. | | | 8,737 | | | | 550,344 | (a) |
KBR Inc. | | | 4,460 | | | | 142,229 | |
Layne Christensen Co. | | | 645 | | | | 11,017 | (a) |
MasTec Inc. | | | 2,244 | | | | 73,424 | (a) |
MYR Group Inc. | | | 749 | | | | 18,785 | (a) |
Northwest Pipe Co. | | | 407 | | | | 15,368 | (a) |
Orion Marine Group Inc. | | | 972 | | | | 11,693 | (a) |
Pike Corp. | | | 916 | | | | 9,682 | (a) |
Primoris Services Corp. | | | 1,339 | | | | 41,683 | |
Quanta Services Inc. | | | 14,405 | | | | 454,622 | (a) |
Sterling Construction Company Inc. | | | 843 | | | | 9,888 | (a) |
Tutor Perini Corp. | | | 1,365 | | | | 35,899 | (a) |
URS Corp. | | | 2,240 | | | | 118,698 | |
| | | | 2,799,018 | |
| | | | | | | | |
| | |
Construction & Farm Machinery—0.4% | | | | | | | | |
Accuride Corp. | | | 1,301 | | | | 4,853 | (a) |
AGCO Corp. | | | 2,725 | | | | 161,293 | |
Alamo Group Inc. | | | 306 | | | | 18,571 | |
American Railcar Industries Inc. | | | 320 | | | | 14,640 | |
Astec Industries Inc. | | | 781 | | | | 30,170 | |
Caterpillar Inc. | | | 42,210 | | | | 3,833,090 | |
Commercial Vehicle Group Inc. | | | 1,161 | | | | 8,441 | (a) |
Cummins Inc. | | | 11,558 | | | | 1,629,331 | |
Deere & Co. | | | 25,395 | | | | 2,319,325 | |
Douglas Dynamics Inc. | | | 1,031 | | | | 17,341 | |
Federal Signal Corp. | | | 2,354 | | | | 34,486 | (a) |
FreightCar America Inc. | | | 547 | | | | 14,561 | |
Joy Global Inc. | | | 6,971 | | | | 407,734 | |
Lindsay Corp. | | | 498 | | | | 41,210 | |
Manitex International Inc. | | | 476 | | | | 7,559 | (a) |
Meritor Inc. | | | 3,689 | | | | 38,476 | (a) |
Miller Industries Inc. | | | 362 | | | | 6,744 | |
Oshkosh Corp. | | | 2,601 | | | | 131,038 | |
PACCAR Inc. | | | 23,488 | | | | 1,389,785 | |
Terex Corp. | | | 3,355 | | | | 140,877 | |
The Greenbrier Companies Inc. | | | 890 | | | | 29,228 | (a) |
Titan International Inc. | | | 1,929 | | | | 34,683 | |
Trinity Industries Inc. | | | 2,351 | | | | 128,177 | |
Twin Disc Inc. | | | 227 | | | | 5,877 | |
Wabash National Corp. | | | 2,555 | | | | 31,554 | (a) |
Wabtec Corp. | | | 2,893 | | | | 214,863 | |
| | | | 10,693,907 | |
| | |
Construction Materials—0.0%* | | | | | | | | |
Eagle Materials Inc. | | | 1,499 | | | | 116,067 | |
Headwaters Inc. | | | 3,011 | | | | 29,478 | (a) |
Martin Marietta Materials Inc. | | | 1,394 | | | | 139,316 | |
Texas Industries Inc. | | | 846 | | | | 58,188 | (a) |
United States Lime & Minerals Inc. | | | 54 | | | | 3,303 | (a) |
US Concrete Inc. | | | 487 | | | | 11,021 | (a) |
Vulcan Materials Co. | | | 8,623 | | | | 512,379 | |
| | | | 869,752 | |
| | |
Consumer Electronics—0.0%* | | | | | | | | |
Garmin Ltd. | | | 8,117 | | | | 375,168 | |
Harman International Industries Inc. | | | 4,481 | | | | 366,770 | |
Skullcandy Inc. | | | 747 | | | | 5,386 | (a) |
Universal Electronics Inc. | | | 495 | | | | 18,864 | (a) |
Zagg Inc. | | | 1,216 | | | | 5,290 | (a) |
| | | | 771,478 | |
| | |
Consumer Finance—0.4% | | | | | | | | |
American Express Co. | | | 61,110 | | | | 5,544,510 | |
Capital One Financial Corp. | | | 38,244 | | | | 2,929,873 | |
Cash America International Inc. | | | 1,103 | | | | 42,245 | |
Consumer Portfolio Services Inc. | | | 725 | | | | 6,808 | (a) |
Credit Acceptance Corp. | | | 259 | | | | 33,667 | (a) |
DFC Global Corp. | | | 1,676 | | | | 19,190 | (a) |
Discover Financial Services | | | 31,773 | | | | 1,777,699 | |
Encore Capital Group Inc. | | | 920 | | | | 46,239 | (a) |
| | | | | | | | |
Ezcorp Inc. | | | 1,933 | | | | 22,597 | (a) |
First Cash Financial Services Inc. | | | 1,128 | | | | 69,756 | (a) |
Green Dot Corp. | | | 907 | | | | 22,811 | (a) |
Imperial Holdings Inc. | | | 725 | | | | 4,742 | (a) |
JGWPT Holdings Inc. | | | 359 | | | | 6,243 | (a) |
Nelnet Inc. | | | 879 | | | | 37,041 | |
Nicholas Financial Inc. | | | 513 | | | | 8,075 | |
Portfolio Recovery Associates Inc. | | | 1,937 | | | | 102,351 | (a) |
Regional Management Corp. | | | 253 | | | | 8,584 | (a) |
SLM Corp. | | | 28,891 | | | | 759,255 | |
Springleaf Holdings Inc. | | | 900 | | | | 22,752 | (a) |
The First Marblehead Corp. | | | 420 | | | | 3,104 | (a) |
World Acceptance Corp. | | | 347 | | | | 30,373 | (a) |
| | | | 11,497,915 | |
| | |
Data Processing & Outsourced Services—0.8% | | | | | | | | |
Alliance Data Systems Corp. | | | 3,234 | | | | 850,316 | (a) |
Automatic Data Processing Inc. | | | 31,934 | | | | 2,580,586 | |
Blackhawk Network Holdings Inc. | | | 439 | | | | 11,089 | (a) |
Broadridge Financial Solutions Inc. | | | 3,587 | | | | 141,758 | |
Cardtronics Inc. | | | 1,702 | | | | 73,952 | (a) |
Cass Information Systems Inc. | | | 354 | | | | 23,842 | |
Computer Sciences Corp. | | | 9,765 | | | | 545,668 | |
Convergys Corp. | | | 7,100 | | | | 149,455 | |
CoreLogic Inc. | | | 2,813 | | | | 99,946 | (a) |
CSG Systems International Inc. | | | 1,274 | | | | 37,456 | |
DST Systems Inc. | | | 885 | | | | 80,305 | |
Euronet Worldwide Inc. | | | 1,910 | | | | 91,393 | (a) |
ExlService Holdings Inc. | | | 1,217 | | | | 33,614 | (a) |
Fidelity National Information Services Inc. | | | 19,312 | | | | 1,036,668 | |
First American Financial Corp. | | | 7,217 | | | | 203,519 | |
Fiserv Inc. | | | 17,514 | | | | 1,034,202 | (a) |
Global Cash Access Holdings Inc. | | | 2,705 | | | | 27,023 | (a) |
Global Payments Inc. | | | 2,187 | | | | 142,133 | |
Heartland Payment Systems Inc. | | | 1,406 | | | | 70,075 | |
Higher One Holdings Inc. | | | 1,069 | | | | 10,433 | (a) |
Jack Henry & Associates Inc. | | | 2,570 | | | | 152,170 | |
Lender Processing Services Inc. | | | 2,580 | | | | 96,440 | |
Mastercard Inc. | | | 6,867 | | | | 5,737,104 | |
MAXIMUS Inc. | | | 2,576 | | | | 113,318 | |
ModusLink Global Solutions Inc. | | | 1,327 | | | | 7,604 | (a) |
MoneyGram International Inc. | | | 860 | | | | 17,871 | (a) |
NeuStar Inc. | | | 1,880 | | | | 93,737 | (a) |
Paychex Inc. | | | 21,560 | | | | 981,627 | |
PRGX Global Inc. | | | 1,097 | | | | 7,372 | (a) |
Sykes Enterprises Inc. | | | 1,416 | | | | 30,883 | (a) |
Syntel Inc. | | | 602 | | | | 54,752 | |
TeleTech Holdings Inc. | | | 781 | | | | 18,697 | (a) |
The Western Union Co. | | | 36,333 | | | | 626,744 | |
Total System Services Inc. | | | 11,197 | | | | 372,636 | |
VeriFone Systems Inc. | | | 3,267 | | | | 87,621 | (a) |
Visa Inc. | | | 33,778 | | | | 7,521,685 | |
WEX Inc. | | | 2,632 | | | | 260,647 | (a) |
| | | | 23,424,341 | |
| | | | | | | | |
| | |
Department Stores—0.1% | | | | | | | | |
JC Penney Company Inc. | | | 9,095 | | | | 83,219 | (a) |
Kohl’s Corp. | | | 13,353 | | | | 757,783 | |
Macy’s Inc. | | | 24,442 | | | | 1,305,203 | |
Nordstrom Inc. | | | 9,478 | | | | 585,740 | |
The Bon-Ton Stores Inc. | | | 506 | | | | 8,238 | |
| | | | 2,740,183 | |
| | |
Distillers & Vintners—0.1% | | | | | | | | |
Beam Inc. | | | 10,865 | | | | 739,472 | |
Brown-Forman Corp. | | | 10,748 | | | | 812,226 | |
Constellation Brands Inc. | | | 10,995 | | | | 773,828 | (a) |
| | | | 2,325,526 | |
| | |
Distributors—0.0%* | | | | | | | | |
Core-Mark Holding Company Inc. | | | 404 | | | | 30,676 | |
Genuine Parts Co. | | | 10,239 | | | | 851,783 | |
LKQ Corp. | | | 9,026 | | | | 296,955 | (a) |
Pool Corp. | | | 1,744 | | | | 101,396 | |
VOXX International Corp. | | | 797 | | | | 13,310 | (a) |
Weyco Group Inc. | | | 182 | | | | 5,356 | |
| | | | 1,299,476 | |
| | |
Diversified Capital Markets—0.0%* | | | | | | | | |
HFF Inc. REIT | | | 1,263 | | | | 33,912 | (a) |
JMP Group Inc. | | | 860 | | | | 6,364 | |
| | | | 40,276 | |
| | |
Diversified Chemicals—0.3% | | | | | | | | |
Eastman Chemical Co. | | | 10,210 | | | | 823,947 | |
EI du Pont de Nemours & Co. | | | 61,430 | | | | 3,991,107 | |
FMC Corp. | | | 8,841 | | | | 667,142 | |
LSB Industries Inc. | | | 718 | | | | 29,452 | (a) |
Olin Corp. | | | 5,411 | | | | 156,107 | |
Penford Corp. | | | 371 | | | | 4,767 | (a) |
The Dow Chemical Co. | | | 80,451 | | | | 3,572,025 | |
| | | | 9,244,547 | |
| | |
Diversified Financial Services—1.9% | | | | | | | | |
Banco Latinoamericano de Comercio Exterior S.A. | | | 1,075 | | | | 30,122 | |
Bank of America Corp. | | | 707,494 | | | | 11,015,682 | |
Citigroup Inc. | | | 201,182 | | | | 10,483,594 | |
Comerica Inc. | | | 12,133 | | | | 576,803 | |
JPMorgan Chase & Co. | | | 249,350 | | | | 14,581,988 | |
U.S. Bancorp | | | 121,141 | | | | 4,894,096 | |
Wells Fargo & Co. | | | 317,958 | | | | 14,435,293 | |
| | | | 56,017,578 | |
| | |
Diversified Metals & Mining—0.1% | | | | | | | | |
AMCOL International Corp. | | | 1,023 | | | | 34,761 | |
Compass Minerals International Inc. | | | 1,001 | | | | 80,130 | |
Freeport-McMoRan Copper & Gold Inc. | | | 68,863 | | | | 2,598,890 | |
General Moly Inc. | | | 3,296 | | | | 4,417 | (a) |
Globe Specialty Metals Inc. | | | 2,339 | | | | 42,125 | |
Horsehead Holding Corp. | | | 1,841 | | | | 29,843 | (a) |
Materion Corp. | | | 746 | | | | 23,014 | |
Molycorp Inc. | | | 5,352 | | | | 30,078 | (a) |
RTI International Metals Inc. | | | 1,185 | | | | 40,539 | (a) |
| | | | | | | | |
U.S. Silica Holdings Inc. | | | 793 | | | | 27,049 | |
Walter Energy Inc. | | | 2,338 | | | | 38,881 | |
| | | | 2,949,727 | |
| | |
Diversified Real Estate Activities—0.0%* | | | | | | | | |
Alexander & Baldwin Inc. | | | 2,952 | | | | 123,187 | |
Consolidated-Tomoka Land Co. | | | 181 | | | | 6,568 | |
Tejon Ranch Co. | | | 477 | | | | 17,535 | (a) |
| | | | 147,290 | |
| | |
Diversified REITs—0.1% | | | | | | | | |
American Assets Trust Inc. | | | 1,241 | | | | 39,005 | |
American Realty Capital Properties Inc. | | | 5,966 | | | | 76,723 | |
Armada Hoffler Properties Inc. | | | 699 | | | | 6,487 | |
Chambers Street Properties | | | 8,879 | | | | 67,924 | |
Cousins Properties Inc. | | | 6,009 | | | | 61,893 | |
Duke Realty Corp. | | | 9,790 | | | | 147,241 | |
Empire State Realty Trust Inc. | | | 3,042 | | | | 46,542 | |
First Potomac Realty Trust | | | 2,089 | | | | 24,295 | |
Gladstone Commercial Corp. | | | 464 | | | | 8,338 | |
Investors Real Estate Trust | | | 3,684 | | | | 31,609 | |
Lexington Realty Trust | | | 6,576 | | | | 67,141 | |
Liberty Property Trust | | | 4,402 | | | | 149,096 | |
One Liberty Properties Inc. | | | 369 | | | | 7,428 | |
PS Business Parks Inc. | | | 714 | | | | 54,564 | |
RAIT Financial Trust | | | 2,604 | | | | 23,358 | |
Select Income REIT | | | 627 | | | | 16,766 | |
Vornado Realty Trust | | | 11,539 | | | | 1,024,548 | |
Washington Real Estate Investment Trust | | | 2,589 | | | | 60,479 | |
Whitestone REIT | | | 647 | | | | 8,650 | |
Winthrop Realty Trust | | | 1,080 | | | | 11,934 | |
| | | | 1,934,021 | |
| | |
Diversified Support Services—0.0%* | | | | | | | | |
Cintas Corp. | | | 6,681 | | | | 398,121 | |
Copart Inc. | | | 3,368 | | | | 123,437 | (a) |
EnerNOC Inc. | | | 890 | | | | 15,317 | (a) |
G&K Services Inc. | | | 730 | | | | 45,428 | |
Healthcare Services Group Inc. | | | 2,622 | | | | 74,386 | |
Intersections Inc. | | | 448 | | | | 3,490 | |
Iron Mountain Inc. | | | 11,122 | | | | 337,553 | |
McGrath RentCorp. | | | 930 | | | | 37,014 | |
Mobile Mini Inc. | | | 1,472 | | | | 60,617 | (a) |
Performant Financial Corp. | | | 895 | | | | 9,218 | (a) |
Schawk Inc. | | | 561 | | | | 8,342 | |
UniFirst Corp. | | | 563 | | | | 60,241 | |
Viad Corp. | | | 708 | | | | 19,668 | |
| | | | 1,192,832 | |
| | |
Drug Retail—0.3% | | | | | | | | |
CVS Caremark Corp. | | | 78,951 | | | | 5,650,523 | |
Rite Aid Corp. | | | 27,537 | | | | 139,337 | (a) |
Walgreen Co. | | | 57,766 | | | | 3,318,079 | |
| | | | 9,107,939 | |
| | |
Education Services—0.0%* | | | | | | | | |
American Public Education Inc. | | | 640 | | | | 27,821 | (a) |
Apollo Education Group Inc. | | | 3,009 | | | | 82,206 | (a) |
Bridgepoint Education Inc. | | | 608 | | | | 10,768 | (a) |
| | | | | | | | |
Bright Horizons Family Solutions Inc. | | | 458 | | | | 16,827 | (a) |
Capella Education Co. | | | 442 | | | | 29,366 | |
Career Education Corp. | | | 1,794 | | | | 10,226 | (a) |
Corinthian Colleges Inc. | | | 3,738 | | | | 6,654 | (a) |
DeVry Education Group Inc. | | | 1,725 | | | | 61,237 | |
Education Management Corp. | | | 888 | | | | 8,960 | (a) |
Graham Holdings Co. | | | 297 | | | | 197,006 | |
Grand Canyon Education Inc. | | | 1,732 | | | | 75,515 | (a) |
Houghton Mifflin Harcourt Co. | | | 734 | | | | 12,449 | (a) |
ITT Educational Services Inc. | | | 841 | | | | 28,241 | (a) |
K12 Inc. | | | 1,025 | | | | 22,294 | (a) |
Lincoln Educational Services Corp. | | | 1,225 | | | | 6,100 | |
Strayer Education Inc. | | | 419 | | | | 14,443 | |
Universal Technical Institute Inc. | | | 772 | | | | 10,738 | |
| | | | 620,851 | |
| | |
Electric Utilities—0.6% | | | | | | | | |
ALLETE Inc. | | | 1,539 | | | | 76,765 | |
American Electric Power Company Inc. | | | 32,323 | | | | 1,510,777 | |
Cleco Corp. | | | 4,063 | | | | 189,417 | |
Duke Energy Corp. | | | 46,830 | | | | 3,231,738 | |
Edison International | | | 21,612 | | | | 1,000,636 | |
El Paso Electric Co. | | | 1,524 | | | | 53,508 | |
Entergy Corp. | | | 11,799 | | | | 746,523 | |
Exelon Corp. | | | 56,840 | | | | 1,556,848 | |
FirstEnergy Corp. | | | 27,743 | | | | 914,964 | |
Great Plains Energy Inc. | | | 4,599 | | | | 111,480 | |
Hawaiian Electric Industries Inc. | | | 3,005 | | | | 78,310 | |
IDACORP Inc. | | | 3,465 | | | | 179,626 | |
MGE Energy Inc. | | | 865 | | | | 50,084 | |
NextEra Energy Inc. | | | 28,618 | | | | 2,450,273 | |
Northeast Utilities | | | 20,901 | | | | 885,993 | |
NRG Yield Inc. | | | 747 | | | | 29,887 | |
OGE Energy Corp. | | | 5,962 | | | | 202,112 | |
Otter Tail Corp. | | | 1,360 | | | | 39,807 | |
Pepco Holdings Inc. | | | 16,415 | | | | 314,019 | |
Pinnacle West Capital Corp. | | | 7,251 | | | | 383,723 | |
PNM Resources Inc. | | | 5,419 | | | | 130,706 | |
Portland General Electric Co. | | | 2,977 | | | | 89,905 | |
PPL Corp. | | | 41,806 | | | | 1,257,943 | |
The Empire District Electric Co. | | | 1,516 | | | | 34,398 | |
The Southern Co. | | | 58,487 | | | | 2,404,401 | |
UIL Holdings Corp. | | | 1,959 | | | | 75,911 | |
Unitil Corp. | | | 533 | | | | 16,251 | |
UNS Energy Corp. | | | 1,614 | | | | 96,598 | |
Westar Energy Inc. | | | 3,831 | | | | 123,243 | |
Xcel Energy Inc. | | | 33,010 | | | | 922,299 | |
| | | | 19,158,145 | |
| | |
Electrical Components & Equipment—0.4% | | | | | | | | |
Acuity Brands Inc. | | | 2,912 | | | | 318,340 | |
Aeroflex Holding Corp. | | | 1,034 | | | | 6,721 | (a) |
American Superconductor Corp. | | | 2,052 | | | | 3,365 | (a) |
AMETEK Inc. | | | 16,206 | | | | 853,570 | |
Amphenol Corp. | | | 10,499 | | | | 936,301 | |
Audience Inc. | | | 309 | | | | 3,597 | (a) |
| | | | | | | | |
Belden Inc. | | | 1,651 | | | | 116,313 | |
Brady Corp. | | | 1,782 | | | | 55,117 | |
Coleman Cable Inc. | | | 331 | | | | 8,679 | |
Corning Inc. | | | 95,996 | | | | 1,710,649 | |
DTS Inc. | | | 630 | | | | 15,107 | (a) |
Eaton Corp. PLC | | | 31,474 | | | | 2,395,801 | |
Emerson Electric Co. | | | 46,695 | | | | 3,277,055 | |
Encore Wire Corp. | | | 741 | | | | 40,162 | |
EnerSys Inc. | | | 1,811 | | | | 126,933 | |
Enphase Energy Inc. | | | 543 | | | | 3,443 | (a) |
Franklin Electric Company Inc. | | | 1,831 | | | | 81,736 | |
FuelCell Energy Inc. | | | 5,264 | | | | 7,422 | (a) |
Generac Holdings Inc. | | | 1,947 | | | | 110,278 | |
General Cable Corp. | | | 3,390 | | | | 99,700 | |
GrafTech International Ltd. | | | 4,246 | | | | 47,683 | (a) |
Hubbell Inc. | | | 1,614 | | | | 175,765 | |
II-VI Inc. | | | 1,994 | | | | 35,094 | (a) |
InvenSense Inc. | | | 2,210 | | | | 45,924 | (a) |
Littelfuse Inc. | | | 846 | | | | 78,619 | |
LSI Industries Inc. | | | 890 | | | | 7,716 | |
Polypore International Inc. | | | 1,798 | | | | 69,942 | (a) |
Powell Industries Inc. | | | 373 | | | | 24,987 | |
Preformed Line Products Co. | | | 88 | | | | 6,438 | |
Regal-Beloit Corp. | | | 1,348 | | | | 99,375 | |
Revolution Lighting Technologies Inc. | | | 1,401 | | | | 4,798 | (a) |
Rockwell Automation Inc. | | | 9,198 | | | | 1,086,836 | |
Rogers Corp. | | | 641 | | | | 39,421 | (a) |
Roper Industries Inc. | | | 6,588 | | | | 913,624 | |
Thermon Group Holdings Inc. | | | 925 | | | | 25,280 | (a) |
Universal Display Corp. | | | 1,521 | | | | 52,262 | (a) |
Vicor Corp. | | | 656 | | | | 8,803 | (a) |
Vishay Intertechnology Inc. | | | 4,073 | | | | 54,008 | (a) |
| | | | 12,946,864 | |
| | |
Electronic Equipment & Instruments—0.0%* | | | | | | | | |
Badger Meter Inc. | | | 534 | | | | 29,103 | |
Checkpoint Systems Inc. | | | 1,490 | | | | 23,497 | (a) |
Cognex Corp. | | | 3,257 | | | | 124,352 | |
Coherent Inc. | | | 925 | | | | 68,811 | (a) |
Control4 Corp. | | | 136 | | | | 2,407 | (a) |
Daktronics Inc. | | | 1,282 | | | | 20,102 | |
Electro Scientific Industries Inc. | | | 1,081 | | | | 11,307 | |
FARO Technologies Inc. | | | 626 | | | | 36,496 | (a) |
FEI Co. | | | 1,528 | | | | 136,542 | |
FLIR Systems Inc. | | | 9,321 | | | | 280,562 | |
GSI Group Inc. | | | 1,094 | | | | 12,297 | (a) |
Itron Inc. | | | 2,669 | | | | 110,577 | (a) |
Mesa Laboratories Inc. | | | 80 | | | | 6,286 | |
MTS Systems Corp. | | | 597 | | | | 42,536 | |
National Instruments Corp. | | | 2,945 | | | | 94,299 | |
Newport Corp. | | | 1,385 | | | | 25,027 | (a) |
OSI Systems Inc. | | | 766 | | | | 40,682 | (a) |
RealD Inc. | | | 1,426 | | | | 12,178 | (a) |
Rofin-Sinar Technologies Inc. | | | 1,036 | | | | 27,993 | (a) |
Vishay Precision Group Inc. | | | 463 | | | | 6,894 | (a) |
| | | | 1,111,948 | |
| | | | | | | | |
| | |
Electronic Manufacturing Services—0.0%* | | | | | | | | |
Benchmark Electronics Inc. | | | 1,973 | | | | 45,537 | (a) |
CTS Corp. | | | 1,208 | | | | 24,051 | |
Jabil Circuit Inc. | | | 12,044 | | | | 210,047 | |
Kemet Corp. | | | 1,555 | | | | 8,770 | (a) |
Maxwell Technologies Inc. | | | 1,097 | | | | 8,524 | (a) |
Measurement Specialties Inc. | | | 579 | | | | 35,140 | (a) |
Mercury Systems Inc. | | | 1,065 | | | | 11,662 | (a) |
Methode Electronics Inc. | | | 1,398 | | | | 47,798 | |
Multi-Fineline Electronix Inc. | | | 410 | | | | 5,695 | (a) |
Neonode Inc. | | | 1,169 | | | | 7,388 | (a) |
Park Electrochemical Corp. | | | 718 | | | | 20,621 | |
Plexus Corp. | | | 1,240 | | | | 53,680 | (a) |
Radisys Corp. | | | 1,236 | | | | 2,830 | (a) |
Sanmina Corp. | | | 3,127 | | | | 52,221 | (a) |
Trimble Navigation Ltd. | | | 7,742 | | | | 268,647 | (a) |
TTM Technologies Inc. | | | 1,797 | | | | 15,418 | (a) |
Uni-Pixel Inc. | | | 405 | | | | 4,054 | (a) |
Viasystems Group Inc. | | | 201 | | | | 2,750 | (a) |
Zygo Corp. | | | 736 | | | | 10,878 | (a) |
| | | | 835,711 | |
| | |
Environmental & Facilities Services—0.1% | | | | | | | | |
ABM Industries Inc. | | | 2,065 | | | | 59,038 | |
Acorn Energy Inc. | | | 821 | | | | 3,341 | |
Casella Waste Systems Inc. | | | 1,882 | | | | 10,916 | (a) |
Ceco Environmental Corp. | | | 497 | | | | 8,037 | |
Clean Harbors Inc. | | | 1,650 | | | | 98,934 | (a) |
Heritage-Crystal Clean Inc. | | | 322 | | | | 6,598 | (a) |
Republic Services Inc. | | | 17,875 | | | | 593,450 | |
Rollins Inc. | | | 1,923 | | | | 58,248 | |
SP Plus Corp. | | | 649 | | | | 16,900 | (a) |
Stericycle Inc. | | | 5,667 | | | | 658,335 | (a) |
Swisher Hygiene Inc. | | | 3,876 | | | | 1,993 | (a) |
Team Inc. | | | 763 | | | | 32,305 | (a) |
Tetra Tech Inc. | | | 2,507 | | | | 70,146 | (a) |
TRC Companies Inc. | | | 815 | | | | 5,819 | (a) |
US Ecology Inc. | | | 697 | | | | 25,921 | |
Waste Connections Inc. | | | 3,717 | | | | 162,173 | |
Waste Management Inc. | | | 28,944 | | | | 1,298,717 | |
| | | | 3,110,871 | |
| | |
Fertilizers & Agricultural Chemicals—0.2% | | | | | | | | |
American Vanguard Corp. | | | 1,087 | | | | 26,403 | |
CF Industries Holdings Inc. | | | 3,802 | | | | 886,018 | |
Intrepid Potash Inc. | | | 3,704 | | | | 58,672 | (a) |
Marrone Bio Innovations Inc. | | | 146 | | | | 2,596 | (a) |
Monsanto Co. | | | 34,880 | | | | 4,065,264 | |
The Mosaic Co. | | | 22,605 | | | | 1,068,538 | |
The Scotts Miracle-Gro Co. | | | 1,314 | | | | 81,757 | |
| | | | 6,189,248 | |
| | |
Food Distributors—0.1% | | | | | | | | |
Spartan Stores Inc. | | | 1,352 | | | | 32,826 | |
Sysco Corp. | | | 38,578 | | | | 1,392,666 | |
The Andersons Inc. | | | 699 | | | | 62,330 | |
The Chefs’ Warehouse Inc. | | | 607 | | | | 17,700 | (a) |
United Natural Foods Inc. | | | 3,333 | | | | 251,275 | (a) |
| | | | 1,756,797 | |
| | | | | | | | |
| | |
Food Retail—0.1% | | | | | | | | |
Arden Group Inc. | | | 48 | | | | 6,073 | |
Casey’s General Stores Inc. | | | 1,434 | | | | 100,739 | |
Fairway Group Holdings Corp. | | | 674 | | | | 12,213 | (a) |
Harris Teeter Supermarkets Inc. | | | 3,317 | | | | 163,694 | |
Ingles Markets Inc. | | | 503 | | | | 13,631 | |
Natural Grocers by Vitamin Cottage Inc. | | | 329 | | | | 13,966 | (a) |
Roundy’s Inc. | | | 1,044 | | | | 10,294 | |
Safeway Inc. | | | 16,416 | | | | 534,669 | |
SUPERVALU Inc. | | | 13,787 | | | | 100,507 | (a) |
Susser Holdings Corp. | | | 676 | | | | 44,271 | (a) |
The Kroger Co. | | | 34,521 | | | | 1,364,615 | |
The Pantry Inc. | | | 730 | | | | 12,249 | (a) |
Village Super Market Inc. | | | 234 | | | | 7,256 | |
Weis Markets Inc. | | | 381 | | | | 20,025 | |
Whole Foods Market Inc. | | | 24,685 | | | | 1,427,534 | |
| | | | 3,831,736 | |
| | |
Footwear—0.1% | | | | | | | | |
Crocs Inc. | | | 3,387 | | | | 53,921 | (a) |
Deckers Outdoor Corp. | | | 1,032 | | | | 87,163 | (a) |
NIKE Inc. | | | 49,565 | | | | 3,897,792 | |
RG Barry Corp. | | | 290 | | | | 5,597 | |
Skechers U.S.A. Inc. | | | 1,479 | | | | 48,999 | (a) |
Steven Madden Ltd. | | | 2,245 | | | | 82,144 | (a) |
Wolverine World Wide Inc. | | | 3,756 | | | | 127,554 | |
| | | | 4,303,170 | |
| | |
Forest Products—0.0%* | | | | | | | | |
Boise Cascade Co. | | | 370 | | | | 10,908 | (a) |
Deltic Timber Corp. | | | 398 | | | | 27,040 | |
Louisiana-Pacific Corp. | | | 9,482 | | | | 175,512 | (a) |
| | | | 213,460 | |
| | |
Gas Utilities—0.1% | | | | | | | | |
AGL Resources Inc. | | | 7,940 | | | | 375,006 | |
Atmos Energy Corp. | | | 2,734 | | | | 124,178 | |
Chesapeake Utilities Corp. | | | 315 | | | | 18,906 | |
Delta Natural Gas Company Inc. | | | 312 | | | | 6,983 | |
National Fuel Gas Co. | | | 2,516 | | | | 179,642 | |
New Jersey Resources Corp. | | | 1,617 | | | | 74,770 | |
Northwest Natural Gas Co. | | | 1,020 | | | | 43,676 | |
ONEOK Inc. | | | 13,684 | | | | 850,871 | |
Piedmont Natural Gas Company Inc. | | | 2,816 | | | | 93,379 | |
Questar Corp. | | | 5,237 | | | | 120,399 | |
South Jersey Industries Inc. | | | 1,250 | | | | 69,950 | |
Southwest Gas Corp. | | | 1,716 | | | | 95,942 | |
The Laclede Group Inc. | | | 1,289 | | | | 58,701 | |
UGI Corp. | | | 3,438 | | | | 142,540 | |
WGL Holdings Inc. | | | 3,472 | | | | 139,088 | |
| | | | 2,394,031 | |
| | |
General Merchandise Stores—0.2% | | | | | | | | |
Big Lots Inc. | | | 1,744 | | | | 56,314 | (a) |
Burlington Stores Inc. | | | 543 | | | | 17,376 | (a) |
Dollar General Corp. | | | 19,544 | | | | 1,178,894 | (a) |
Dollar Tree Inc. | | | 13,804 | | | | 778,822 | (a) |
| | | | | | | | |
Family Dollar Stores Inc. | | | 6,414 | | | | 416,718 | |
Fred’s Inc. | | | 1,301 | | | | 24,095 | |
Gordmans Stores Inc. | | | 393 | | | | 3,014 | |
Target Corp. | | | 41,927 | | | | 2,652,721 | |
Tuesday Morning Corp. | | | 1,539 | | | | 24,562 | (a) |
| | | | 5,152,516 | |
| | |
Gold—0.0%* | | | | | | | | |
Allied Nevada Gold Corp. | | | 3,749 | | | | 13,309 | (a) |
Gold Resource Corp. | | | 1,315 | | | | 5,957 | |
Midway Gold Corp. | | | 4,001 | | | | 3,241 | (a) |
Newmont Mining Corp. | | | 32,990 | | | | 759,760 | |
Royal Gold Inc. | | | 1,967 | | | | 90,619 | |
| | | | 872,886 | |
| | |
Healthcare Distributors—0.2% | | | | | | | | |
AmerisourceBergen Corp. | | | 15,259 | | | | 1,072,860 | |
Cardinal Health Inc. | | | 22,651 | | | | 1,513,313 | |
Henry Schein Inc. | | | 2,577 | | | | 294,448 | (a) |
McKesson Corp. | | | 15,237 | | | | 2,459,252 | |
MWI Veterinary Supply Inc. | | | 491 | | | | 83,760 | (a) |
Owens & Minor Inc. | | | 4,243 | | | | 155,124 | |
Patterson Companies Inc. | | | 5,607 | | | | 231,009 | |
PharMerica Corp. | | | 1,000 | | | | 21,500 | (a) |
| | | | 5,831,266 | |
| | |
Healthcare Equipment—0.8% | | | | | | | | |
Abaxis Inc. | | | 845 | | | | 33,817 | (a) |
Abbott Laboratories | | | 102,561 | | | | 3,931,163 | |
ABIOMED Inc. | | | 1,410 | | | | 37,703 | (a) |
Accuray Inc. | | | 2,548 | | | | 22,193 | (a) |
Alphatec Holdings Inc. | | | 2,440 | | | | 4,904 | (a) |
Analogic Corp. | | | 463 | | | | 41,003 | |
AngioDynamics Inc. | | | 1,076 | | | | 18,496 | (a) |
ArthroCare Corp. | | | 1,064 | | | | 42,815 | (a) |
AtriCure Inc. | | | 744 | | | | 13,898 | (a) |
Baxter International Inc. | | | 35,998 | | | | 2,503,661 | |
Becton Dickinson and Co. | | | 12,875 | | | | 1,422,559 | |
Biolase Inc. | | | 1,415 | | | | 4,005 | (a) |
Boston Scientific Corp. | | | 88,570 | | | | 1,064,611 | (a) |
Cantel Medical Corp. | | | 1,259 | | | | 42,693 | |
Cardiovascular Systems Inc. | | | 897 | | | | 30,758 | (a) |
CareFusion Corp. | | | 14,019 | | | | 558,237 | (a) |
CONMED Corp. | | | 1,049 | | | | 44,582 | |
Covidien PLC | | | 30,513 | | | | 2,077,935 | |
CR Bard Inc. | | | 5,167 | | | | 692,068 | |
CryoLife Inc. | | | 1,009 | | | | 11,190 | |
Cutera Inc. | | | 566 | | | | 5,762 | (a) |
Cyberonics Inc. | | | 1,069 | | | | 70,030 | (a) |
Cynosure Inc. | | | 655 | | | | 17,475 | (a) |
DexCom Inc. | | | 2,699 | | | | 95,572 | (a) |
Edwards Lifesciences Corp. | | | 7,258 | | | | 477,286 | (a) |
Exactech Inc. | | | 337 | | | | 8,007 | (a) |
GenMark Diagnostics Inc. | | | 1,212 | | | | 16,132 | (a) |
Globus Medical Inc. | | | 2,017 | | | | 40,703 | (a) |
Greatbatch Inc. | | | 911 | | | | 40,303 | (a) |
HeartWare International Inc. | | | 623 | | | | 58,537 | (a) |
| | | | | | | | |
Hill-Rom Holdings Inc. | | | 1,755 | | | | 72,552 | |
Hologic Inc. | | | 8,202 | | | | 183,315 | (a) |
IDEXX Laboratories Inc. | | | 1,557 | | | | 165,618 | (a) |
Insulet Corp. | | | 2,035 | | | | 75,498 | (a) |
Integra LifeSciences Holdings Corp. | | | 834 | | | | 39,790 | (a) |
Intuitive Surgical Inc. | | | 2,525 | | | | 969,802 | (a) |
Invacare Corp. | | | 1,137 | | | | 26,390 | |
Masimo Corp. | | | 3,344 | | | | 97,745 | (a) |
Medtronic Inc. | | | 66,222 | | | | 3,800,481 | |
Natus Medical Inc. | | | 1,046 | | | | 23,535 | (a) |
NuVasive Inc. | | | 1,672 | | | | 54,056 | (a) |
NxStage Medical Inc. | | | 2,219 | | | | 22,190 | (a) |
Orthofix International N.V. | | | 661 | | | | 15,084 | (a) |
PhotoMedex Inc. | | | 544 | | | | 7,045 | (a) |
ResMed Inc. | | | 4,270 | | | | 201,032 | |
Rockwell Medical Inc. | | | 1,597 | | | | 16,673 | (a) |
Solta Medical Inc. | | | 3,403 | | | | 10,039 | (a) |
St Jude Medical Inc. | | | 19,359 | | | | 1,199,290 | |
STERIS Corp. | | | 3,979 | | | | 191,191 | |
Stryker Corp. | | | 19,579 | | | | 1,471,166 | |
SurModics Inc. | | | 597 | | | | 14,561 | (a) |
Symmetry Medical Inc. | | | 1,377 | | | | 13,880 | (a) |
Tandem Diabetes Care Inc. | | | 318 | | | | 8,195 | (a) |
Teleflex Inc. | | | 1,241 | | | | 116,480 | |
Thoratec Corp. | | | 3,866 | | | | 141,496 | (a) |
Tornier N.V. | | | 1,051 | | | | 19,748 | (a) |
Varian Medical Systems Inc. | | | 7,013 | | | | 544,840 | (a) |
Veracyte Inc. | | | 179 | | | | 2,595 | (a) |
Volcano Corp. | | | 2,045 | | | | 44,683 | (a) |
Wright Medical Group Inc. | | | 1,547 | | | | 47,508 | (a) |
Zeltiq Aesthetics Inc. | | | 592 | | | | 11,195 | (a) |
Zimmer Holdings Inc. | | | 11,310 | | | | 1,053,979 | |
| | | | 24,089,750 | |
| | |
Healthcare Facilities—0.0%* | | | | | | | | |
Acadia Healthcare Company Inc. | | | 1,377 | | | | 65,173 | (a) |
Amsurg Corp. | | | 1,230 | | | | 56,482 | (a) |
Capital Senior Living Corp. | | | 1,100 | | | | 26,389 | (a) |
Chindex International Inc. | | | 481 | | | | 8,384 | (a) |
Community Health Systems Inc. | | | 2,862 | | | | 112,391 | (a) |
Emeritus Corp. | | | 1,519 | | | | 32,856 | (a) |
Five Star Quality Care Inc. | | | 1,758 | | | | 9,651 | (a) |
Hanger Inc. | | | 1,341 | | | | 52,755 | (a) |
Health Management Associates Inc. | | | 7,945 | | | | 104,079 | (a) |
HealthSouth Corp. | | | 3,309 | | | | 110,256 | |
Kindred Healthcare Inc. | | | 2,003 | | | | 39,539 | |
LifePoint Hospitals Inc. | | | 1,402 | | | | 74,082 | (a) |
National Healthcare Corp. | | | 461 | | | | 24,853 | |
Select Medical Holdings Corp. | | | 1,712 | | | | 19,876 | |
Skilled Healthcare Group Inc. | | | 923 | | | | 4,440 | (a) |
Surgical Care Affiliates Inc. | | | 400 | | | | 13,936 | (a) |
Tenet Healthcare Corp. | | | 6,522 | | | | 274,707 | (a) |
The Ensign Group Inc. | | | 738 | | | | 32,671 | |
Universal Health Services Inc. | | | 2,685 | | | | 218,183 | |
US Physical Therapy Inc. | | | 523 | | | | 18,441 | |
VCA Antech Inc. | | | 2,651 | | | | 83,135 | (a) |
| | | | 1,382,279 | |
| | | | | | | | |
| | |
Healthcare Services—0.2% | | | | | | | | |
Accretive Health Inc. | | | 2,158 | | | | 19,767 | (a) |
Addus HomeCare Corp. | | | 264 | | | | 5,927 | (a) |
Air Methods Corp. | | | 1,459 | | | | 85,103 | (a) |
Alliance HealthCare Services Inc. | | | 148 | | | | 3,662 | (a) |
Almost Family Inc. | | | 357 | | | | 11,542 | (a) |
Amedisys Inc. | | | 1,031 | | | | 15,084 | (a) |
AMN Healthcare Services Inc. | | | 1,712 | | | | 25,166 | (a) |
Bio-Reference Labs Inc. | | | 932 | | | | 23,803 | (a) |
BioScrip Inc. | | | 2,183 | | | | 16,154 | (a) |
Chemed Corp. | | | 647 | | | | 49,573 | |
Corvel Corp. | | | 381 | | | | 17,793 | (a) |
Cross Country Healthcare Inc. | | | 1,256 | | | | 12,535 | (a) |
DaVita Healthcare Partners Inc. | | | 11,672 | | | | 739,655 | (a) |
ExamWorks Group Inc. | | | 1,133 | | | | 33,843 | (a) |
Express Scripts Holding Co. | | | 53,450 | | | | 3,754,328 | (a) |
Gentiva Health Services Inc. | | | 1,040 | | | | 12,906 | (a) |
Healthways Inc. | | | 1,281 | | | | 19,663 | (a) |
IPC The Hospitalist Company Inc. | | | 635 | | | | 37,713 | (a) |
Laboratory Corporation of America Holdings | | | 5,798 | | | | 529,763 | (a) |
Landauer Inc. | | | 322 | | | | 16,940 | |
LHC Group Inc. | | | 416 | | | | 10,001 | (a) |
MEDNAX Inc. | | | 3,028 | | | | 161,635 | (a) |
National Research Corp. | | | 433 | | | | 8,149 | (a) |
Omnicare Inc. | | | 3,094 | | | | 186,754 | |
Quest Diagnostics Inc. | | | 9,647 | | | | 516,500 | |
Team Health Holdings Inc. | | | 2,575 | | | | 117,291 | (a) |
The Providence Service Corp. | | | 401 | | | | 10,314 | (a) |
| | | | 6,441,564 | |
| | |
Healthcare Supplies—0.0%* | | | | | | | | |
Align Technology Inc. | | | 2,773 | | | | 158,477 | (a) |
Anika Therapeutics Inc. | | | 443 | | | | 16,905 | (a) |
Antares Pharma Inc. | | | 3,863 | | | | 17,306 | (a) |
Atrion Corp. | | | 61 | | | | 18,071 | |
Cerus Corp. | | | 2,751 | | | | 17,744 | (a) |
DENTSPLY International Inc. | | | 9,463 | | | | 458,766 | |
Derma Sciences Inc. | | | 524 | | | | 5,670 | (a) |
Endologix Inc. | | | 2,344 | | | | 40,879 | (a) |
Haemonetics Corp. | | | 1,895 | | | | 79,836 | (a) |
ICU Medical Inc. | | | 478 | | | | 30,453 | (a) |
LDR Holding Corp. | | | 181 | | | | 4,272 | (a) |
Medical Action Industries Inc. | | | 676 | | | | 5,787 | (a) |
Meridian Bioscience Inc. | | | 1,539 | | | | 40,830 | |
Merit Medical Systems Inc. | | | 1,500 | | | | 23,610 | (a) |
Neogen Corp. | | | 1,363 | | | | 62,289 | (a) |
OraSure Technologies Inc. | | | 1,918 | | | | 12,064 | (a) |
Quidel Corp. | | | 1,070 | | | | 33,052 | (a) |
RTI Biologics Inc. | | | 2,636 | | | | 9,332 | (a) |
Spectranetics Corp. | | | 1,506 | | | | 37,650 | (a) |
Staar Surgical Co. | | | 1,340 | | | | 21,695 | (a) |
TearLab Corp. | | | 1,001 | | | | 9,349 | (a) |
The Cooper Companies Inc. | | | 1,473 | | | | 182,416 | |
Utah Medical Products Inc. | | | 97 | | | | 5,545 | |
Vascular Solutions Inc. | | | 716 | | | | 16,575 | (a) |
West Pharmaceutical Services Inc. | | | 2,530 | | | | 124,122 | |
| | | | 1,432,695 | |
| | | | | | | | |
| | |
Healthcare Technology—0.1% | | | | | | | | |
Allscripts Healthcare Solutions Inc. | | | 4,740 | | | | 73,280 | (a) |
athenahealth Inc. | | | 1,371 | | | | 184,400 | (a) |
Cerner Corp. | | | 19,582 | | | | 1,091,501 | (a) |
Computer Programs & Systems Inc. | | | 393 | | | | 24,291 | |
HealthStream Inc. | | | 733 | | | | 24,020 | (a) |
HMS Holdings Corp. | | | 6,040 | | | | 137,289 | (a) |
MedAssets Inc. | | | 2,309 | | | | 45,787 | (a) |
Medidata Solutions Inc. | | | 2,046 | | | | 123,926 | (a) |
Merge Healthcare Inc. | | | 2,971 | | | | 6,893 | (a) |
Omnicell Inc. | | | 1,273 | | | | 32,500 | (a) |
Quality Systems Inc. | | | 1,499 | | | | 31,569 | |
Vocera Communications Inc. | | | 798 | | | | 12,457 | (a) |
| | | | 1,787,913 | |
| | |
Heavy Electrical Equipment—0.0%* | | | | | | | | |
AZZ Inc. | | | 979 | | | | 47,834 | |
Capstone Turbine Corp. | | | 10,402 | | | | 13,419 | (a) |
Global Power Equipment Group Inc. | | | 608 | | | | 11,898 | |
Power Solutions International Inc. | | | 50 | | | | 3,755 | (a) |
PowerSecure International Inc. | | | 774 | | | | 13,290 | (a) |
| | | | 90,196 | |
| | |
Home Building—0.1% | | | | | | | | |
Beazer Homes USA Inc. | | | 922 | | | | 22,515 | (a) |
Cavco Industries Inc. | | | 224 | | | | 15,389 | (a) |
DR Horton Inc. | | | 18,725 | | | | 417,942 | |
Hovnanian Enterprises Inc. | | | 4,288 | | | | 28,387 | (a) |
KB Home | | | 5,715 | | | | 104,470 | |
Lennar Corp. | | | 11,182 | | | | 442,360 | |
LGI Homes Inc. | | | 319 | | | | 5,675 | (a) |
M/I Homes Inc. | | | 814 | | | | 20,716 | (a) |
MDC Holdings Inc. | | | 2,712 | | | | 87,435 | |
Meritage Homes Corp. | | | 1,401 | | | | 67,234 | (a) |
NVR Inc. | | | 125 | | | | 128,251 | (a) |
PulteGroup Inc. | | | 22,870 | | | | 465,862 | |
Standard Pacific Corp. | | | 5,753 | | | | 52,065 | (a) |
The Ryland Group Inc. | | | 1,733 | | | | 75,230 | |
Toll Brothers Inc. | | | 4,773 | | | | 176,601 | (a) |
TRI Pointe Homes Inc. | | | 580 | | | | 11,559 | (a) |
UCP Inc. | | | 169 | | | | 2,474 | (a) |
WCI Communities Inc. | | | 259 | | | | 4,944 | (a) |
William Lyon Homes | | | 554 | | | | 12,266 | (a) |
| | | | 2,141,375 | |
|
Home Entertainment Software—0.0%* | |
Electronic Arts Inc. | | | 20,420 | | | | 468,435 | (a) |
Glu Mobile Inc. | | | 2,211 | | | | 8,601 | (a) |
Rosetta Stone Inc. | | | 489 | | | | 5,975 | (a) |
Take-Two Interactive Software Inc. | | | 3,103 | | | | 53,899 | (a) |
| | | | 536,910 | |
| | |
Home Furnishing Retail—0.1% | | | | | | | | |
Aaron’s Inc. | | | 2,308 | | | | 67,855 | |
Bed Bath & Beyond Inc. | | | 14,245 | | | | 1,143,874 | (a) |
Haverty Furniture Companies Inc. | | | 678 | | | | 21,221 | |
Kirkland’s Inc. | | | 516 | | | | 12,214 | (a) |
Mattress Firm Holding Corp. | | | 531 | | | | 22,854 | (a) |
| | | | | | | | |
Pier 1 Imports Inc. | | | 3,559 | | | | 82,142 | |
Restoration Hardware Holdings Inc. | | | 685 | | | | 46,101 | (a) |
Select Comfort Corp. | | | 2,144 | | | | 45,217 | (a) |
Williams-Sonoma Inc. | | | 2,680 | | | | 156,190 | |
| | | | 1,597,668 | |
| | |
Home Furnishings—0.0%* | | | | | | | | |
Bassett Furniture Industries Inc. | | | 529 | | | | 8,083 | |
Ethan Allen Interiors Inc. | | | 949 | | | | 28,868 | |
Flexsteel Industries Inc. | | | 169 | | | | 5,193 | |
Hooker Furniture Corp. | | | 463 | | | | 7,723 | |
La-Z-Boy Inc. | | | 2,010 | | | | 62,310 | |
Leggett & Platt Inc. | | | 9,368 | | | | 289,846 | |
Mohawk Industries Inc. | | | 4,052 | | | | 603,343 | (a) |
Tempur-Sealy International Inc. | | | 1,808 | | | | 97,560 | (a) |
| | | | 1,102,926 | |
| | |
Home Improvement Retail—0.4% | | | | | | | | |
Lowe’s Companies Inc. | | | 69,371 | | | | 3,437,333 | |
Lumber Liquidators Holdings Inc. | | | 1,043 | | | | 107,314 | (a) |
Sears Hometown and Outlet Stores Inc. | | | 379 | | | | 9,665 | (a) |
The Home Depot Inc. | | | 93,409 | | | | 7,691,297 | |
Tile Shop Holdings Inc. | | | 764 | | | | 13,805 | (a) |
| | | | 11,259,414 | |
| | |
Hotels, Resorts & Cruise Lines—0.1% | | | | | | | | |
Carnival Corp. | | | 29,055 | | | | 1,167,139 | |
Diamond Resorts International Inc. | | | 584 | | | | 10,781 | (a) |
Interval Leisure Group Inc. | | | 1,479 | | | | 45,701 | |
Marcus Corp. | | | 919 | | | | 12,351 | |
Marriott International Inc. | | | 14,902 | | | | 735,563 | |
Marriott Vacations Worldwide Corp. | | | 1,111 | | | | 58,616 | (a) |
Morgans Hotel Group Co. | | | 1,116 | | | | 9,073 | (a) |
Orient-Express Hotels Ltd. | | | 3,641 | | | | 55,016 | (a) |
Starwood Hotels & Resorts Worldwide Inc. | | | 12,704 | | | | 1,009,333 | |
Wyndham Worldwide Corp. | | | 8,644 | | | | 636,976 | |
| | | | 3,740,549 | |
| | |
Household Appliances—0.0%* | | | | | | | | |
Helen of Troy Ltd. | | | 1,229 | | | | 60,848 | (a) |
iRobot Corp. | | | 1,082 | | | | 37,621 | (a) |
NACCO Industries Inc. | | | 177 | | | | 11,008 | |
Whirlpool Corp. | | | 5,207 | | | | 816,770 | |
| | | | 926,247 | |
| | |
Household Products—0.8% | | | | | | | | |
Central Garden and Pet Co. | | | 1,814 | | | | 12,245 | (a) |
Church & Dwight Company Inc. | | | 4,169 | | | | 276,321 | |
Colgate-Palmolive Co. | | | 58,302 | | | | 3,801,873 | |
Energizer Holdings Inc. | | | 1,872 | | | | 202,625 | |
Harbinger Group Inc. | | | 1,300 | | | | 15,405 | (a) |
Kimberly-Clark Corp. | | | 25,315 | | | | 2,644,405 | |
Oil-Dri Corporation of America | | | 199 | | | | 7,530 | |
Orchids Paper Products Co. | | | 206 | | | | 6,765 | |
Spectrum Brands Holdings Inc. | | | 795 | | | | 56,087 | |
The Clorox Co. | | | 8,560 | | | | 794,026 | |
The Procter & Gamble Co. | | | 180,303 | | | | 14,678,467 | |
WD-40 Co. | | | 592 | | | | 44,211 | |
| | | | 22,539,960 | |
| | | | | | | | |
| | |
Housewares & Specialties—0.0%* | | | | | | | | |
Blyth Inc. | | | 195 | | | | 2,122 | |
CSS Industries Inc. | | | 362 | | | | 10,382 | |
EveryWare Global Inc. | | | 432 | | | | 3,577 | (a) |
Jarden Corp. | | | 3,592 | | | | 220,369 | (a) |
Libbey Inc. | | | 749 | | | | 15,729 | (a) |
Lifetime Brands Inc. | | | 415 | | | | 6,528 | |
Newell Rubbermaid Inc. | | | 18,948 | | | | 614,105 | |
Tupperware Brands Corp. | | | 1,520 | | | | 143,685 | |
| | | | 1,016,497 | |
| | |
Human Resource & Employment Services—0.0%* | | | | | | | | |
Barrett Business Services Inc. | | | 252 | | | | 23,370 | |
CDI Corp. | | | 625 | | | | 11,581 | |
GP Strategies Corp. | | | 527 | | | | 15,699 | (a) |
Heidrick & Struggles International Inc. | | | 627 | | | | 12,628 | |
Insperity Inc. | | | 813 | | | | 29,374 | |
Kelly Services Inc. | | | 884 | | | | 22,047 | |
Kforce Inc. | | | 897 | | | | 18,353 | |
Korn/Ferry International | | | 1,823 | | | | 47,617 | (a) |
ManpowerGroup Inc. | | | 2,372 | | | | 203,660 | |
On Assignment Inc. | | | 1,746 | | | | 60,970 | (a) |
Robert Half International Inc. | | | 9,146 | | | | 384,040 | |
Towers Watson & Co. | | | 1,938 | | | | 247,308 | |
TrueBlue Inc. | | | 1,533 | | | | 39,521 | (a) |
WageWorks Inc. | | | 922 | | | | 54,804 | (a) |
| | | | 1,170,972 | |
| | |
Hypermarkets & Super Centers—0.4% | | | | | | | | |
Costco Wholesale Corp. | | | 28,982 | | | | 3,449,148 | |
Pricesmart Inc. | | | 702 | | | | 81,109 | |
Wal-Mart Stores Inc. | | | 107,316 | | | | 8,444,696 | |
| | | | 11,974,953 | |
| | |
Independent Power Producers & Energy Traders—0.0%* | | | | | | | | |
AES Corp. | | | 43,611 | | | | 632,796 | |
Atlantic Power Corp. | | | 4,145 | | | | 14,424 | |
Dynegy Inc. | | | 3,746 | | | | 80,614 | (a) |
Genie Energy Ltd. | | | 466 | | | | 4,758 | (a) |
NRG Energy Inc. | | | 21,610 | | | | 620,639 | |
Ormat Technologies Inc. | | | 562 | | | | 15,292 | |
Pattern Energy Group Inc. | | | 625 | | | | 18,944 | |
| | | | 1,387,467 | |
| | |
Industrial Conglomerates—0.9% | | | | | | | | |
3M Co. | | | 42,426 | | | | 5,950,247 | |
Carlisle Companies Inc. | | | 1,908 | | | | 151,495 | |
Danaher Corp. | | | 39,772 | | | | 3,070,398 | |
General Electric Co. | | | 671,093 | | | | 18,810,737 | (c) |
Raven Industries Inc. | | | 1,365 | | | | 56,156 | |
| | | | 28,039,033 | |
| | |
Industrial Gases—0.2% | | | | | | | | |
Air Products & Chemicals Inc. | | | 14,014 | | | | 1,566,485 | |
Airgas Inc. | | | 4,396 | | | | 491,692 | |
Praxair Inc. | | | 19,526 | | | | 2,538,966 | |
| | | | 4,597,143 | |
| | | | | | | | |
| | |
Industrial Machinery—0.4% | | | | | | | | |
Actuant Corp. | | | 2,754 | | | | 100,907 | |
Albany International Corp. | | | 1,051 | | | | 37,762 | |
Altra Industrial Motion Corp. | | | 1,019 | | | | 34,870 | |
Ampco-Pittsburgh Corp. | | | 386 | | | | 7,508 | |
Barnes Group Inc. | | | 2,079 | | | | 79,646 | |
Blount International Inc. | | | 1,835 | | | | 26,552 | (a) |
Briggs & Stratton Corp. | | | 1,759 | | | | 38,276 | |
Chart Industries Inc. | | | 1,148 | | | | 109,795 | (a) |
CIRCOR International Inc. | | | 666 | | | | 53,799 | |
CLARCOR Inc. | | | 3,349 | | | | 215,508 | |
Columbus McKinnon Corp. | | | 652 | | | | 17,695 | (a) |
Crane Co. | | | 1,475 | | | | 99,194 | |
Donaldson Company Inc. | | | 4,043 | | | | 175,709 | |
Dover Corp. | | | 11,301 | | | | 1,090,999 | |
Dynamic Materials Corp. | | | 437 | | | | 9,500 | |
Energy Recovery Inc. | | | 1,522 | | | | 8,462 | (a) |
EnPro Industries Inc. | | | 800 | | | | 46,120 | (a) |
ESCO Technologies Inc. | | | 979 | | | | 33,541 | |
Flow International Corp. | | | 2,323 | | | | 9,385 | (a) |
Flowserve Corp. | | | 9,252 | | | | 729,335 | |
Global Brass & Copper Holdings Inc. | | | 380 | | �� | | 6,289 | |
Graco Inc. | | | 1,835 | | | | 143,350 | |
Graham Corp. | | | 319 | | | | 11,577 | |
Hardinge Inc. | | | 535 | | | | 7,741 | |
Harsco Corp. | | | 2,413 | | | | 67,636 | |
Hurco Companies Inc. | | | 266 | | | | 6,653 | |
Hyster-Yale Materials Handling Inc. | | | 395 | | | | 36,798 | |
IDEX Corp. | | | 2,430 | | | | 179,455 | |
Illinois Tool Works Inc. | | | 27,085 | | | | 2,277,307 | |
Ingersoll-Rand PLC | | | 17,772 | | | | 1,094,755 | |
ITT Corp. | | | 2,725 | | | | 118,320 | |
John Bean Technologies Corp. | | | 1,113 | | | | 32,644 | |
Kadant Inc. | | | 376 | | | | 15,236 | |
Kennametal Inc. | | | 2,355 | | | | 122,625 | |
LB Foster Co. | | | 415 | | | | 19,625 | |
Lincoln Electric Holdings Inc. | | | 2,443 | | | | 174,284 | |
Lydall Inc. | | | 781 | | | | 13,761 | (a) |
Mueller Industries Inc. | | | 1,084 | | | | 68,303 | |
Mueller Water Products Inc. | | | 6,000 | | | | 56,220 | |
NN Inc. | | | 631 | | | | 12,740 | |
Nordson Corp. | | | 1,820 | | | | 135,226 | |
Omega Flex Inc. | | | 130 | | | | 2,660 | |
Pall Corp. | | | 7,349 | | | | 627,237 | |
Parker Hannifin Corp. | | | 9,899 | | | | 1,273,407 | |
Pentair Ltd. | | | 13,222 | | | | 1,026,953 | |
PMFG Inc. | | | 1,033 | | | | 9,349 | (a) |
Proto Labs Inc. | | | 670 | | | | 47,691 | (a) |
RBC Bearings Inc. | | | 875 | | | | 61,906 | (a) |
Rexnord Corp. | | | 1,074 | | | | 29,009 | (a) |
Snap-on Inc. | | | 3,838 | | | | 420,338 | |
SPX Corp. | | | 1,367 | | | | 136,167 | |
Standex International Corp. | | | 479 | | | | 30,120 | |
Stanley Black & Decker Inc. | | | 10,296 | | | | 830,784 | |
| | | | | | | | |
Sun Hydraulics Corp. | | | 802 | | | | 32,746 | |
Tecumseh Products Co. | | | 518 | | | | 4,688 | (a) |
Tennant Co. | | | 677 | | | | 45,907 | |
The ExOne Co. | | | 252 | | | | 15,236 | (a) |
The Gorman-Rupp Co. | | | 680 | | | | 22,732 | |
The Middleby Corp. | | | 686 | | | | 164,619 | (a) |
Timken Co. | | | 2,387 | | | | 131,452 | |
Trimas Corp. | | | 1,686 | | | | 67,255 | (a) |
Valmont Industries Inc. | | | 809 | | | | 120,638 | |
Watts Water Technologies Inc. | | | 1,113 | | | | 68,861 | |
Woodward Inc. | | | 4,397 | | | | 200,547 | |
Xerium Technologies Inc. | | | 518 | | | | 8,542 | (a) |
Xylem Inc. | | | 12,173 | | | | 421,186 | |
| | | | | | | 13,325,138 | |
| | |
Industrial REITs—0.1% | | | | | | | | |
DCT Industrial Trust Inc. | | | 11,295 | | | | 80,533 | |
EastGroup Properties Inc. | | | 1,185 | | | | 68,647 | |
First Industrial Realty Trust Inc. | | | 4,084 | | | | 71,266 | |
Monmouth Real Estate Investment Corp. | | | 1,901 | | | | 17,280 | |
Prologis Inc. | | | 33,082 | | | | 1,222,380 | |
Rexford Industrial Realty Inc. | | | 443 | | | | 5,848 | |
STAG Industrial Inc. | | | 1,559 | | | | 31,788 | |
Terreno Realty Corp. | | | 775 | | | | 13,717 | |
| | | | | | | 1,511,459 | |
| | |
Insurance Brokers—0.1% | | | | | | | | |
Aon PLC | | | 19,969 | | | | 1,675,199 | |
Arthur J Gallagher & Co. | | | 3,950 | | | | 185,374 | |
Brown & Brown Inc. | | | 3,588 | | | | 112,627 | |
Crawford & Co. | | | 753 | | | | 6,958 | |
eHealth Inc. | | | 721 | | | | 33,519 | (a) |
Marsh & McLennan Companies Inc. | | | 36,402 | | | | 1,760,401 | |
| | | | | | | 3,774,078 | |
| | |
Integrated Oil & Gas—1.7% | | | | | | | | |
Chevron Corp. | | | 127,566 | | | | 15,934,269 | |
Exxon Mobil Corp. | | | 289,767 | | | | 29,324,420 | |
Hess Corp. | | | 18,868 | | | | 1,566,044 | |
Occidental Petroleum Corp. | | | 53,467 | | | | 5,084,712 | |
| | | | | | | 51,909,445 | |
| | |
Integrated Telecommunication Services—0.8% | | | | | | | | |
AT&T Inc. | | | 349,431 | | | | 12,285,994 | |
Atlantic Tele-Network Inc. | | | 395 | | | | 22,345 | |
Cbeyond Inc. | | | 851 | | | | 5,872 | (a) |
CenturyLink Inc. | | | 39,207 | | | | 1,248,743 | |
Cincinnati Bell Inc. | | | 7,575 | | | | 26,967 | (a) |
Consolidated Communications Holdings Inc. | | | 1,535 | | | | 30,132 | |
Fairpoint Communications Inc. | | | 559 | | | | 6,322 | (a) |
Frontier Communications Corp. | | | 65,948 | | | | 306,658 | |
General Communication Inc. | | | 1,228 | | | | 13,692 | (a) |
Hawaiian Telcom Holdco Inc. | | | 355 | | | | 10,426 | (a) |
HickoryTech Corp. | | | 503 | | | | 6,454 | |
IDT Corp. | | | 666 | | | | 11,902 | |
Verizon Communications Inc. | | | 189,823 | | | | 9,327,902 | |
Windstream Holdings Inc. | | | 39,512 | | | | 315,306 | |
| | | | | | | 23,618,715 | |
| | | | | | | | |
| | |
Internet Retail—0.6% | | | | | | | | |
1-800-Flowers.com Inc. | | | 1,180 | | | | 6,384 | (a) |
Amazon.com Inc. | | | 24,593 | | | | 9,807,442 | (a) |
Blue Nile Inc. | | | 441 | | | | 20,767 | (a) |
Expedia Inc. | | | 6,831 | | | | 475,847 | |
FTD Companies Inc. | | | 691 | | | | 22,513 | (a) |
Netflix Inc. | | | 3,931 | | | | 1,447,276 | (a) |
Nutrisystem Inc. | | | 1,032 | | | | 16,966 | |
Orbitz Worldwide Inc. | | | 816 | | | | 5,859 | (a) |
Overstock.com Inc. | | | 411 | | | | 12,655 | (a) |
PetMed Express Inc. | | | 911 | | | | 15,150 | |
priceline.com Inc. | | | 3,412 | | | | 3,966,109 | (a) |
RetailMeNot Inc. | | | 340 | | | | 9,789 | (a) |
Shutterfly Inc. | | | 1,466 | | | | 74,663 | (a) |
TripAdvisor Inc. | | | 7,342 | | | | 608,138 | (a) |
Vitacost.com Inc. | | | 979 | | | | 5,668 | (a) |
| | | | | | | 16,495,226 | |
| | |
Internet Software & Services—1.2% | | | | | | | | |
Akamai Technologies Inc. | | | 11,873 | | | | 560,168 | (a) |
Angie’s List Inc. | | | 1,603 | | | | 24,285 | (a) |
AOL Inc. | | | 2,357 | | | | 109,883 | (a) |
Bankrate Inc. | | | 1,720 | | | | 30,857 | (a) |
Bazaarvoice Inc. | | | 1,837 | | | | 14,549 | (a) |
Benefitfocus Inc. | | | 182 | | | | 10,509 | (a) |
Blucora Inc. | | | 1,520 | | | | 44,323 | (a) |
Brightcove Inc. | | | 978 | | | | 13,829 | (a) |
Carbonite Inc. | | | 511 | | | | 6,045 | (a) |
ChannelAdvisor Corp. | | | 248 | | | | 10,344 | (a) |
Chegg Inc. | | | 520 | | | | 4,425 | (a) |
comScore Inc. | | | 1,340 | | | | 38,337 | (a) |
Constant Contact Inc. | | | 1,126 | | | | 34,985 | (a) |
Cornerstone OnDemand Inc. | | | 1,540 | | | | 82,144 | (a) |
CoStar Group Inc. | | | 1,083 | | | | 199,900 | (a) |
Cvent Inc. | | | 224 | | | | 8,151 | (a) |
Dealertrack Technologies Inc. | | | 1,663 | | | | 79,957 | (a) |
Demand Media Inc. | | | 1,391 | | | | 8,026 | (a) |
Demandware Inc. | | | 680 | | | | 43,602 | (a) |
Dice Holdings Inc. | | | 1,396 | | | | 10,121 | (a) |
Digital River Inc. | | | 1,236 | | | | 22,866 | (a) |
E2open Inc. | | | 552 | | | | 13,198 | (a) |
EarthLink Inc. | | | 3,517 | | | | 17,831 | |
eBay Inc. | | | 77,285 | | | | 4,242,174 | (a) |
eGain Corp. | | | 588 | | | | 6,021 | (a) |
Endurance International Group Holdings Inc. | | | 797 | | | | 11,301 | (a) |
Envestnet Inc. | | | 876 | | | | 35,303 | (a) |
Equinix Inc. | | | 1,494 | | | | 265,110 | (a) |
Facebook Inc. | | | 109,111 | | | | 5,964,007 | (a) |
Global Eagle Entertainment Inc. | | | 773 | | | | 11,495 | (a) |
Gogo Inc. | | | 377 | | | | 9,353 | (a) |
Google Inc. | | | 18,615 | | | | 20,862,017 | (a) |
Internap Network Services Corp. | | | 1,844 | | | | 13,867 | (a) |
IntraLinks Holdings Inc. | | | 1,435 | | | | 17,378 | (a) |
j2 Global Inc. | | | 1,778 | | | | 88,918 | |
Limelight Networks Inc. | | | 2,946 | | | | 5,833 | (a) |
Liquidity Services Inc. | | | 908 | | | | 20,575 | (a) |
| | | | | | | | |
LivePerson Inc. | | | 2,003 | | | | 29,684 | (a) |
LogMeIn Inc. | | | 861 | | | | 28,887 | (a) |
Marchex Inc. | | | 1,121 | | | | 9,697 | |
Marin Software Inc. | | | 492 | | | | 5,038 | (a) |
Marketo Inc. | | | 255 | | | | 9,453 | (a) |
Millennial Media Inc. | | | 1,368 | | | | 9,945 | (a) |
Monster Worldwide Inc. | | | 3,927 | | | | 28,000 | (a) |
Move Inc. | | | 1,406 | | | | 22,482 | (a) |
NIC Inc. | | | 2,447 | | | | 60,857 | |
OpenTable Inc. | | | 871 | | | | 69,131 | (a) |
Perficient Inc. | | | 1,244 | | | | 29,135 | (a) |
QuinStreet Inc. | | | 1,487 | | | | 12,922 | (a) |
Rackspace Hosting Inc. | | | 3,443 | | | | 134,725 | (a) |
RealNetworks Inc. | | | 992 | | | | 7,490 | (a) |
Reis Inc. | | | 271 | | | | 5,211 | (a) |
Responsys Inc. | | | 1,339 | | | | 36,702 | (a) |
Rocket Fuel Inc. | | | 179 | | | | 11,007 | (a) |
SciQuest Inc. | | | 798 | | | | 22,727 | (a) |
Shutterstock Inc. | | | 253 | | | | 21,158 | (a) |
Spark Networks Inc. | | | 539 | | | | 3,320 | (a) |
SPS Commerce Inc. | | | 563 | | | | 36,764 | (a) |
Stamps.com Inc. | | | 485 | | | | 20,419 | (a) |
support.com Inc. | | | 2,323 | | | | 8,804 | (a) |
TechTarget Inc. | | | 616 | | | | 4,226 | (a) |
Textura Corp. | | | 181 | | | | 5,419 | (a) |
Travelzoo Inc. | | | 344 | | | | 7,334 | (a) |
Tremor Video Inc. | | | 250 | | | | 1,450 | (a) |
Trulia Inc. | | | 1,063 | | | | 37,492 | (a) |
United Online Inc. | | | 494 | | | | 6,797 | |
Unwired Planet Inc. | | | 2,006 | | | | 2,768 | (a) |
ValueClick Inc. | | | 4,376 | | | | 102,267 | (a) |
VeriSign Inc. | | | 8,546 | | | | 510,880 | (a) |
VistaPrint N.V. | | | 1,249 | | | | 71,006 | (a) |
Vocus Inc. | | | 738 | | | | 8,406 | (a) |
Web.com Group Inc. | | | 1,582 | | | | 50,292 | (a) |
WebMD Health Corp. | | | 1,063 | | | | 41,989 | (a) |
XO Group Inc. | | | 1,158 | | | | 17,208 | (a) |
Xoom Corp. | | | 298 | | | | 8,156 | (a) |
Yahoo! Inc. | | | 62,579 | | | | 2,530,695 | (a) |
Yelp Inc. | | | 1,216 | | | | 83,843 | (a) |
YuMe Inc. | | | 225 | | | | 1,676 | (a) |
Zillow Inc. | | | 877 | | | | 71,677 | (a) |
Zix Corp. | | | 2,687 | | | | 12,253 | (a) |
| | | | 37,141,079 | |
| | |
Investment Banking & Brokerage—0.4% | | | | | | | | |
BGC Partners Inc. | | | 4,847 | | | | 29,373 | |
Cowen Group Inc. | | | 4,247 | | | | 16,606 | (a) |
E*TRADE Financial Corp. | | | 18,999 | | | | 373,140 | (a) |
Evercore Partners Inc. | | | 1,227 | | | | 73,350 | |
FBR & Co. | | | 290 | | | | 7,650 | (a) |
FXCM Inc. | | | 1,377 | | | | 24,566 | |
GFI Group Inc. | | | 2,400 | | | | 9,384 | |
Greenhill & Company Inc. | | | 1,889 | | | | 109,449 | |
INTL. FCStone Inc. | | | 605 | | | | 11,217 | (a) |
| | | | | | | | |
Investment Technology Group Inc. | | | 1,495 | | | | 30,737 | (a) |
KCG Holdings Inc. | | | 2,486 | | | | 29,732 | (a) |
Ladenburg Thalmann Financial Services Inc. | | | 4,007 | | | | 12,542 | (a) |
Marcus & Millichap Inc. | | | 223 | | | | 3,323 | (a) |
Morgan Stanley | | | 91,899 | | | | 2,881,953 | |
Oppenheimer Holdings Inc. | | | 481 | | | | 11,919 | |
Piper Jaffray Companies Inc. | | | 608 | | | | 24,046 | (a) |
Raymond James Financial Inc. | | | 3,701 | | | | 193,155 | |
Stifel Financial Corp. | | | 2,403 | | | | 115,152 | (a) |
SWS Group Inc. | | | 1,449 | | | | 8,810 | (a) |
The Charles Schwab Corp. | | | 76,965 | | | | 2,001,090 | |
The Goldman Sachs Group Inc. | | | 27,959 | | | | 4,956,012 | |
| | | | 10,923,206 | |
| | |
IT Consulting & Other Services—0.7% | | | | | | | | |
Accenture PLC | | | 42,169 | | | | 3,467,135 | |
Acxiom Corp. | | | 5,024 | | | | 185,788 | (a) |
CACI International Inc. | | | 852 | | | | 62,384 | (a) |
CIBER Inc. | | | 2,753 | | | | 11,397 | (a) |
Cognizant Technology Solutions Corp. | | | 20,065 | | | | 2,026,164 | (a) |
Computer Task Group Inc. | | | 692 | | | | 13,079 | |
EPAM Systems Inc. | | | 821 | | | | 28,686 | (a) |
Forrester Research Inc. | | | 449 | | | | 17,179 | |
Gartner Inc. | | | 2,766 | | | | 196,524 | (a) |
iGATE Corp. | | | 1,240 | | | | 49,798 | (a) |
International Business Machines Corp. | | | 67,704 | | | | 12,699,239 | |
Leidos Holdings Inc. | | | 2,178 | | | | 101,255 | |
Lionbridge Technologies Inc. | | | 2,179 | | | | 12,987 | (a) |
ManTech International Corp. | | | 1,590 | | | | 47,589 | |
Sapient Corp. | | | 4,241 | | | | 73,624 | (a) |
Science Applications International Corp. | | | 1,242 | | | | 41,073 | |
ServiceSource International Inc. | | | 2,253 | | | | 18,880 | (a) |
Teradata Corp. | | | 10,839 | | | | 493,066 | (a) |
The Hackett Group Inc. | | | 1,197 | | | | 7,433 | |
Unisys Corp. | | | 1,715 | | | | 57,573 | (a) |
Virtusa Corp. | | | 760 | | | | 28,948 | (a) |
| | | | 19,639,801 | |
| | |
Leisure Facilities—0.0%* | | | | | | | | |
ClubCorp Holdings Inc. | | | 752 | | | | 13,340 | |
International Speedway Corp. | | | 1,886 | | | | 66,934 | |
Life Time Fitness Inc. | | | 2,782 | | | | 130,754 | (a) |
Speedway Motorsports Inc. | | | 512 | | | | 10,163 | |
Town Sports International Holdings Inc. | | | 1,073 | | | | 15,838 | |
Vail Resorts Inc. | | | 1,343 | | | | 101,034 | |
| | | | 338,063 | |
| | |
Leisure Products—0.1% | | | | | | | | |
Arctic Cat Inc. | | | 487 | | | | 27,749 | |
Black Diamond Inc. | | | 836 | | | | 11,144 | (a) |
Brunswick Corp. | | | 6,132 | | | | 282,440 | |
Callaway Golf Co. | | | 2,208 | | | | 18,614 | |
Hasbro Inc. | | | 7,755 | | | | 426,603 | |
JAKKS Pacific Inc. | | | 971 | | | | 6,535 | |
Johnson Outdoors Inc. | | | 212 | | | | 5,713 | |
LeapFrog Enterprises Inc. | | | 2,381 | | | | 18,905 | (a) |
| | | | | | | | |
Marine Products Corp. | | | 446 | | | | 4,482 | |
Mattel Inc. | | | 22,449 | | | | 1,068,123 | |
Nautilus Inc. | | | 1,254 | | | | 10,571 | (a) |
Polaris Industries Inc. | | | 1,934 | | | | 281,668 | |
Smith & Wesson Holding Corp. | | | 1,878 | | | | 25,334 | (a) |
Sturm Ruger & Company Inc. | | | 756 | | | | 55,256 | |
| | | | 2,243,137 | |
| | |
Life & Health Insurance—0.4% | | | | | | | | |
Aflac Inc. | | | 30,917 | | | | 2,065,256 | |
American Equity Investment Life Holding Co. | | | 2,434 | | | | 64,209 | |
Citizens Inc. | | | 1,393 | | | | 12,189 | (a) |
CNO Financial Group Inc. | | | 8,405 | | | | 148,684 | |
FBL Financial Group Inc. | | | 388 | | | | 17,378 | |
Independence Holding Co. | | | 125 | | | | 1,686 | |
Kansas City Life Insurance Co. | | | 108 | | | | 5,156 | |
Lincoln National Corp. | | | 17,402 | | | | 898,291 | |
MetLife Inc. | | | 74,361 | | | | 4,009,545 | |
National Western Life Insurance Co. | | | 78 | | | | 17,437 | |
Primerica Inc. | | | 3,780 | | | | 162,200 | |
Principal Financial Group Inc. | | | 18,160 | | | | 895,470 | |
Protective Life Corp. | | | 2,369 | | | | 120,013 | |
Prudential Financial Inc. | | | 30,712 | | | | 2,832,261 | |
StanCorp Financial Group Inc. | | | 1,312 | | | | 86,920 | |
Symetra Financial Corp. | | | 3,129 | | | | 59,326 | |
The Phoenix Companies Inc. | | | 206 | | | | 12,648 | (a) |
Torchmark Corp. | | | 5,998 | | | | 468,744 | |
Unum Group | | | 17,324 | | | | 607,726 | |
| | | | 12,485,139 | |
| | |
Life Sciences Tools & Services—0.2% | | | | | | | | |
Accelerate Diagnostics Inc. | | | 437 | | | | 5,331 | (a) |
Affymetrix Inc. | | | 2,694 | | | | 23,088 | (a) |
Agilent Technologies Inc. | | | 21,942 | | | | 1,254,863 | |
Albany Molecular Research Inc. | | | 892 | | | | 8,991 | (a) |
Bio-Rad Laboratories Inc. | | | 608 | | | | 75,155 | (a) |
Cambrex Corp. | | | 1,071 | | | | 19,096 | (a) |
Charles River Laboratories International Inc. | | | 1,444 | | | | 76,590 | (a) |
Covance Inc. | | | 1,686 | | | | 148,469 | (a) |
Fluidigm Corp. | | | 915 | | | | 35,063 | (a) |
Furiex Pharmaceuticals Inc. | | | 213 | | | | 8,948 | (a) |
Harvard Bioscience Inc. | | | 1,121 | | | | 5,269 | (a) |
Life Technologies Corp. | | | 11,453 | | | | 868,137 | (a) |
Luminex Corp. | | | 1,490 | | | | 28,906 | (a) |
Mettler-Toledo International Inc. | | | 891 | | | | 216,148 | (a) |
NeoGenomics Inc. | | | 1,263 | | | | 4,572 | (a) |
Pacific Biosciences of California Inc. | | | 1,998 | | | | 10,450 | (a) |
PAREXEL International Corp. | | | 2,130 | | | | 96,233 | (a) |
PerkinElmer Inc. | | | 7,505 | | | | 309,431 | |
Sequenom Inc. | | | 3,823 | | | | 8,946 | (a) |
Techne Corp. | | | 992 | | | | 93,913 | |
Thermo Fisher Scientific Inc. | | | 23,970 | | | | 2,669,059 | |
Waters Corp. | | | 5,647 | | | | 564,700 | (a) |
| | | | 6,531,358 | |
| | | | | | | | |
| | |
Managed Healthcare—0.4% | | | | | | | | |
Aetna Inc. | | | 24,377 | | | | 1,672,018 | |
Centene Corp. | | | 2,062 | | | | 121,555 | (a) |
Cigna Corp. | | | 18,335 | | | | 1,603,946 | |
Health Net Inc. | | | 2,375 | | | | 70,466 | (a) |
Humana Inc. | | | 10,342 | | | | 1,067,501 | |
Magellan Health Services Inc. | | | 993 | | | | 59,491 | (a) |
Molina Healthcare Inc. | | | 1,106 | | | | 38,433 | (a) |
Triple-S Management Corp. | | | 847 | | | | 16,466 | (a) |
UnitedHealth Group Inc. | | | 66,779 | | | | 5,028,459 | |
Universal American Corp. | | | 1,336 | | | | 9,753 | |
WellCare Health Plans Inc. | | | 2,957 | | | | 208,232 | (a) |
WellPoint Inc. | | | 19,596 | | | | 1,810,474 | |
| | | | 11,706,794 | |
| | |
Marine—0.0%* | | | | | | | | |
International Shipholding Corp. | | | 162 | | | | 4,779 | |
Kirby Corp. | | | 1,709 | | | | 169,619 | (a) |
Matson Inc. | | | 2,902 | | | | 75,771 | |
Ultrapetrol Bahamas Ltd. | | | 807 | | | | 3,018 | (a) |
| | | | 253,187 | |
| | |
Metal & Glass Containers—0.0%* | | | | | | | | |
AEP Industries Inc. | | | 178 | | | | 9,404 | (a) |
Aptargroup Inc. | | | 1,982 | | | | 134,400 | |
Ball Corp. | | | 9,594 | | | | 495,626 | |
Berry Plastics Group Inc. | | | 2,137 | | | | 50,839 | (a) |
Greif Inc. | | | 910 | | | | 47,684 | |
Myers Industries Inc. | | | 1,070 | | | | 22,598 | |
Owens-Illinois Inc. | | | 11,021 | | | | 394,331 | (a) |
Silgan Holdings Inc. | | | 1,309 | | | | 62,858 | |
| | | | 1,217,740 | |
| | |
Mortgage REITs—0.0%* | | | | | | | | |
AG Mortgage Investment Trust Inc. | | | 1,126 | | | | 17,611 | |
American Capital Mortgage Investment Corp. | | | 2,390 | | | | 41,729 | |
Anworth Mortgage Asset Corp. | | | 5,779 | | | | 24,330 | |
Apollo Commercial Real Estate Finance Inc. | | | 1,254 | | | | 20,378 | |
Apollo Residential Mortgage Inc. | | | 1,198 | | | | 17,706 | |
Ares Commercial Real Estate Corp. | | | 724 | | | | 9,484 | |
ARMOUR Residential REIT Inc. | | | 14,697 | | | | 58,935 | |
Capstead Mortgage Corp. | | | 3,922 | | | | 47,378 | |
Colony Financial Inc. | | | 2,832 | | | | 57,461 | |
CYS Investments Inc. | | | 6,964 | | | | 51,603 | |
Ellington Residential Mortgage REIT | | | 291 | | | | 4,476 | |
Hannon Armstrong Sustainable Infrastructure Capital Inc. | | | 553 | | | | 7,720 | |
Invesco Mortgage Capital Inc. | | | 5,461 | | | | 80,168 | |
iStar Financial Inc. | | | 3,158 | | | | 45,065 | (a) |
JAVELIN Mortgage Investment Corp. | | | 353 | | | | 4,917 | |
New Residential Investment Corp. | | | 9,736 | | | | 65,036 | |
New York Mortgage Trust Inc. | | | 2,660 | | | | 18,593 | |
NorthStar Realty Finance Corp. | | | 10,908 | | | | 146,713 | |
PennyMac Mortgage Investment Trust | | | 2,703 | | | | 62,061 | |
Redwood Trust Inc. | | | 3,132 | | | | 60,667 | |
Resource Capital Corp. | | | 4,938 | | | | 29,282 | |
Western Asset Mortgage Capital Corp. | | | 895 | | | | 13,318 | |
ZAIS Financial Corp. | | | 278 | | | | 4,456 | |
| | | | 889,087 | |
| | | | | | | | |
| | |
Motorcycle Manufacturers—0.0%* | | | | | | | | |
Harley-Davidson Inc. | | | 14,667 | | | | 1,015,543 | |
| | |
Movies & Entertainment—0.7% | | | | | | | | |
Carmike Cinemas Inc. | | | 772 | | | | 21,492 | (a) |
Cinemark Holdings Inc. | | | 3,105 | | | | 103,490 | |
DreamWorks Animation SKG Inc. | | | 2,130 | | | | 75,615 | (a) |
Live Nation Entertainment Inc. | | | 5,387 | | | | 106,447 | (a) |
Reading International Inc. | | | 655 | | | | 4,906 | (a) |
Rentrak Corp. | | | 425 | | | | 16,103 | (a) |
SFX Entertainment Inc. | | | 704 | | | | 8,448 | (a) |
The Walt Disney Co. | | | 108,403 | | | | 8,281,989 | |
Time Warner Inc. | | | 60,011 | | | | 4,183,967 | |
Twenty-First Century Fox Inc. | | | 130,165 | | | | 4,579,205 | |
Viacom Inc. | | | 26,920 | | | | 2,351,193 | |
World Wrestling Entertainment Inc. | | | 1,198 | | | | 19,863 | |
| | | | 19,752,718 | |
| | |
Multi-Line Insurance—0.3% | | | | | | | | |
American Financial Group Inc. | | | 2,148 | | | | 123,982 | |
American International Group Inc. | | | 97,662 | | | | 4,985,645 | |
Assurant Inc. | | | 4,824 | | | | 320,169 | |
Eastern Insurance Holdings Inc. | | | 191 | | | | 4,678 | |
Fortegra Financial Corp. | | | 285 | | | | 2,357 | (a) |
Genworth Financial Inc. | | | 32,787 | | | | 509,182 | (a) |
Hartford Financial Services Group Inc. | | | 29,656 | | | | 1,074,437 | |
HCC Insurance Holdings Inc. | | | 3,017 | | | | 139,204 | |
Horace Mann Educators Corp. | | | 1,557 | | | | 49,108 | |
Kemper Corp. | | | 1,537 | | | | 62,833 | |
Loews Corp. | | | 20,289 | | | | 978,741 | |
| | | | 8,250,336 | |
| | |
Multi-Sector Holdings—0.5% | | | | | | | | |
Berkshire Hathaway Inc. | | | 119,397 | | | | 14,155,708 | (a) |
Leucadia National Corp. | | | 20,796 | | | | 589,359 | |
PICO Holdings Inc. | | | 742 | | | | 17,148 | (a) |
| | | | 14,762,215 | |
| | |
Multi-Utilities—0.4% | | | | | | | | |
Alliant Energy Corp. | | | 3,338 | | | | 172,241 | |
Ameren Corp. | | | 16,095 | | | | 581,995 | |
Avista Corp. | | | 2,269 | | | | 63,963 | |
Black Hills Corp. | | | 3,060 | | | | 160,681 | |
CenterPoint Energy Inc. | | | 28,281 | | | | 655,554 | |
CMS Energy Corp. | | | 17,645 | | | | 472,357 | |
Consolidated Edison Inc. | | | 19,428 | | | | 1,073,980 | |
Dominion Resources Inc. | | | 38,501 | | | | 2,490,630 | |
DTE Energy Co. | | | 11,749 | | | | 780,016 | |
Integrys Energy Group Inc. | | | 5,219 | | | | 283,966 | |
MDU Resources Group Inc. | | | 5,682 | | | | 173,585 | |
NiSource Inc. | | | 20,938 | | | | 688,441 | |
NorthWestern Corp. | | | 1,458 | | | | 63,160 | |
PG&E Corp. | | | 29,770 | | | | 1,199,136 | |
Public Service Enterprise Group Inc. | | | 33,555 | | | | 1,075,102 | |
SCANA Corp. | | | 9,250 | | | | 434,102 | |
Sempra Energy | | | 15,077 | | | | 1,353,311 | |
TECO Energy Inc. | | | 13,534 | | | | 233,326 | |
Vectren Corp. | | | 2,462 | | | | 87,401 | |
Wisconsin Energy Corp. | | | 14,994 | | | | 619,852 | |
| | | | 12,662,799 | |
| | | | | | | | |
| | |
Office Electronics—0.0%* | | | | | | | | |
Xerox Corp. | | | 76,764 | | | | 934,218 | |
Zebra Technologies Corp. | | | 1,499 | | | | 81,066 | (a) |
| | | | 1,015,284 | |
| | |
Office REITs—0.1% | | | | | | | | |
Alexandria Real Estate Equities Inc. | | | 2,153 | | | | 136,974 | |
BioMed Realty Trust Inc. | | | 5,746 | | | | 104,118 | |
Boston Properties Inc. | | | 10,141 | | | | 1,017,852 | |
Coresite Realty Corp. | | | 776 | | | | 24,979 | |
Corporate Office Properties Trust | | | 2,613 | | | | 61,902 | |
CyrusOne Inc. | | | 752 | | | | 16,792 | |
DuPont Fabros Technology Inc. | | | 2,404 | | | | 59,403 | |
Franklin Street Properties Corp. | | | 3,456 | | | | 41,299 | |
Government Properties Income Trust | | | 2,095 | | | | 52,061 | |
Gramercy Property Trust Inc. | | | 2,686 | | | | 15,445 | (a) |
Highwoods Properties Inc. | | | 6,178 | | | | 223,458 | |
Hudson Pacific Properties Inc. | | | 1,560 | | | | 34,117 | |
Kilroy Realty Corp. | | | 2,465 | | | | 123,694 | |
Mack-Cali Realty Corp. | | | 2,632 | | | | 56,535 | |
Parkway Properties Inc. | | | 2,087 | | | | 40,253 | |
QTS Realty Trust Inc. | | | 478 | | | | 11,845 | |
SL Green Realty Corp. | | | 2,751 | | | | 254,137 | |
| | | | 2,274,864 | |
| | |
Office Services & Supplies—0.0%* | | | | | | | | |
ACCO Brands Corp. | | | 4,269 | | | | 28,688 | (a) |
ARC Document Solutions Inc. | | | 1,419 | | | | 11,664 | (a) |
Avery Dennison Corp. | | | 6,370 | | | | 319,710 | |
Herman Miller Inc. | | | 4,042 | | | | 119,320 | |
HNI Corp. | | | 3,113 | | | | 120,878 | |
Interface Inc. | | | 2,248 | | | | 49,366 | |
Kimball International Inc. | | | 1,029 | | | | 15,466 | |
Knoll Inc. | | | 1,797 | | | | 32,903 | |
Mine Safety Appliances Co. | | | 2,050 | | | | 104,981 | |
NL Industries Inc. | | | 305 | | | | 3,410 | |
Pitney Bowes Inc. | | | 13,595 | | | | 316,763 | |
Steelcase Inc. | | | 3,238 | | | | 51,355 | |
United Stationers Inc. | | | 1,541 | | | | 70,716 | |
West Corp. | | | 870 | | | | 22,368 | |
| | | | 1,267,588 | |
| | |
Oil & Gas Drilling—0.1% | | | | | | | | |
Atwood Oceanics Inc. | | | 1,742 | | | | 93,006 | (a) |
Diamond Offshore Drilling Inc. | | | 4,552 | | | | 259,100 | |
Ensco PLC | | | 15,495 | | | | 886,004 | |
Helmerich & Payne Inc. | | | 7,107 | | | | 597,557 | |
Hercules Offshore Inc. | | | 6,029 | | | | 39,369 | (a) |
Nabors Industries Ltd. | | | 17,170 | | | | 291,718 | |
Parker Drilling Co. | | | 4,456 | | | | 36,227 | (a) |
Patterson-UTI Energy Inc. | | | 4,329 | | | | 109,610 | |
Pioneer Energy Services Corp. | | | 2,181 | | | | 17,470 | (a) |
Rowan Companies PLC | | | 8,217 | | | | 290,553 | (a) |
Unit Corp. | | | 1,307 | | | | 67,467 | (a) |
Vantage Drilling Co. | | | 8,521 | | | | 15,679 | (a) |
| | | | 2,703,760 | |
| | | | | | | | |
| | |
Oil & Gas Equipment & Services—0.6% | | | | | | | | |
Baker Hughes Inc. | | | 29,400 | | | | 1,624,644 | |
Basic Energy Services Inc. | | | 1,093 | | | | 17,248 | (a) |
Bolt Technology Corp. | | | 365 | | | | 8,034 | |
Bristow Group Inc. | | | 1,339 | | | | 100,505 | |
C&J Energy Services Inc. | | | 1,714 | | | | 39,593 | (a) |
Cal Dive International Inc. | | | 2,825 | | | | 5,678 | (a) |
Cameron International Corp. | | | 15,779 | | | | 939,324 | (a) |
CARBO Ceramics Inc. | | | 1,341 | | | | 156,267 | |
Dawson Geophysical Co. | | | 244 | | | | 8,252 | (a) |
Dresser-Rand Group Inc. | | | 2,299 | | | | 137,089 | (a) |
Dril-Quip Inc. | | | 1,224 | | | | 134,554 | (a) |
Era Group Inc. | | | 679 | | | | 20,954 | (a) |
Exterran Holdings Inc. | | | 2,211 | | | | 75,616 | (a) |
FMC Technologies Inc. | | | 15,694 | | | | 819,384 | (a) |
Forum Energy Technologies Inc. | | | 1,518 | | | | 42,899 | (a) |
Geospace Technologies Corp. | | | 492 | | | | 46,656 | (a) |
Global Geophysical Services Inc. | | | 1,033 | | | | 1,663 | (a) |
Gulf Island Fabrication Inc. | | | 442 | | | | 10,263 | |
Gulfmark Offshore Inc. | | | 1,028 | | | | 48,450 | |
Halliburton Co. | | | 56,264 | | | | 2,855,398 | |
Helix Energy Solutions Group Inc. | | | 7,011 | | | | 162,515 | (a) |
Hornbeck Offshore Services Inc. | | | 1,340 | | | | 65,968 | (a) |
ION Geophysical Corp. | | | 4,961 | | | | 16,371 | (a) |
Key Energy Services Inc. | | | 5,556 | | | | 43,892 | (a) |
Matrix Service Co. | | | 923 | | | | 22,586 | (a) |
Mitcham Industries Inc. | | | 594 | | | | 10,520 | (a) |
National Oilwell Varco Inc. | | | 28,397 | | | | 2,258,413 | |
Natural Gas Services Group Inc. | | | 546 | | | | 15,053 | (a) |
Newpark Resources Inc. | | | 3,240 | | | | 39,820 | (a) |
Nuverra Environmental Solutions Inc. | | | 520 | | | | 8,731 | (a) |
Oceaneering International Inc. | | | 3,249 | | | | 256,281 | |
Oil States International Inc. | | | 1,659 | | | | 168,754 | (a) |
PHI Inc. | | | 442 | | | | 19,183 | (a) |
RigNet Inc. | | | 452 | | | | 21,664 | (a) |
Schlumberger Ltd. | | | 87,355 | | | | 7,871,559 | |
SEACOR Holdings Inc. | | | 759 | | | | 69,221 | (a) |
Superior Energy Services Inc. | | | 4,772 | | | | 126,983 | (a) |
Tesco Corp. | | | 1,049 | | | | 20,749 | (a) |
TETRA Technologies Inc. | | | 2,967 | | | | 36,672 | (a) |
TGC Industries Inc. | | | 715 | | | | 5,220 | |
Tidewater Inc. | | | 1,498 | | | | 88,786 | |
Willbros Group Inc. | | | 1,511 | | | | 14,234 | (a) |
| | | | 18,435,646 | |
| | |
Oil & Gas Exploration & Production—1.0% | | | | | | | | |
Abraxas Petroleum Corp. | | | 3,205 | | | | 10,512 | (a) |
Anadarko Petroleum Corp. | | | 33,383 | | | | 2,647,940 | |
Apache Corp. | | | 26,482 | | | | 2,275,863 | |
Apco Oil and Gas International Inc. | | | 434 | | | | 6,766 | (a) |
Approach Resources Inc. | | | 1,272 | | | | 24,537 | (a) |
Athlon Energy Inc. | | | 637 | | | | 19,269 | (a) |
Bill Barrett Corp. | | | 3,341 | | | | 89,472 | (a) |
Bonanza Creek Energy Inc. | | | 1,123 | | | | 48,817 | (a) |
BPZ Resources Inc. | | | 4,828 | | | | 8,787 | (a) |
Cabot Oil & Gas Corp. | | | 27,936 | | | | 1,082,799 | |
Callon Petroleum Co. | | | 1,347 | | | | 8,796 | (a) |
| | | | | | | | |
Carrizo Oil & Gas Inc. | | | 1,709 | | | | 76,512 | (a) |
Chesapeake Energy Corp. | | | 33,530 | | | | 910,004 | |
Cimarex Energy Co. | | | 2,607 | | | | 273,500 | |
Clayton Williams Energy Inc. | | | 228 | | | | 18,685 | (a) |
Comstock Resources Inc. | | | 1,779 | | | | 32,538 | |
ConocoPhillips | | | 81,262 | | | | 5,741,160 | |
Contango Oil & Gas Co. | | | 566 | | | | 26,749 | (a) |
Denbury Resources Inc. | | | 24,325 | | | | 399,660 | (a) |
Devon Energy Corp. | | | 25,315 | | | | 1,566,239 | |
Diamondback Energy Inc. | | | 699 | | | | 36,949 | (a) |
Emerald Oil Inc. | | | 2,032 | | | | 15,565 | (a) |
Endeavour International Corp. | | | 1,510 | | | | 7,927 | (a) |
Energen Corp. | | | 2,182 | | | | 154,376 | |
Energy XXI Bermuda Ltd. | | | 3,021 | | | | 81,748 | |
EOG Resources Inc. | | | 18,107 | | | | 3,039,079 | |
EPL Oil & Gas Inc. | | | 1,119 | | | | 31,891 | (a) |
EQT Corp. | | | 9,998 | | | | 897,620 | |
Evolution Petroleum Corp. | | | 603 | | | | 7,441 | |
EXCO Resources Inc. | | | 5,025 | | | | 26,683 | |
Forest Oil Corp. | | | 4,349 | | | | 15,700 | (a) |
FX Energy Inc. | | | 2,499 | | | | 9,146 | (a) |
Gastar Exploration Inc. | | | 2,242 | | | | 15,515 | (a) |
Goodrich Petroleum Corp. | | | 1,154 | | | | 19,641 | (a) |
Gulfport Energy Corp. | | | 2,532 | | | | 159,896 | (a) |
Halcon Resources Corp. | | | 8,541 | | | | 32,968 | (a) |
Isramco Inc. | | | 44 | | | | 5,590 | (a) |
Jones Energy Inc. | | | 292 | | | | 4,228 | (a) |
Kodiak Oil & Gas Corp. | | | 9,958 | | | | 111,629 | (a) |
Magnum Hunter Resources Corp. | | | 6,447 | | �� | | 47,128 | (a) |
Marathon Oil Corp. | | | 46,209 | | | | 1,631,178 | |
Matador Resources Co. | | | 2,181 | | | | 40,654 | (a) |
Midstates Petroleum Company Inc. | | | 1,128 | | | | 7,467 | (a) |
Miller Energy Resources Inc. | | | 1,114 | | | | 7,843 | (a) |
Murphy Oil Corp. | | | 11,634 | | | | 754,814 | |
Newfield Exploration Co. | | | 9,166 | | | | 225,759 | (a) |
Noble Energy Inc. | | | 23,832 | | | | 1,623,197 | |
Northern Oil and Gas Inc. | | | 2,385 | | | | 35,942 | (a) |
Panhandle Oil and Gas Inc. | | | 255 | | | | 8,520 | |
PDC Energy Inc. | | | 1,300 | | | | 69,186 | (a) |
Penn Virginia Corp. | | | 2,028 | | | | 19,124 | (a) |
PetroQuest Energy Inc. | | | 2,680 | | | | 11,578 | (a) |
Pioneer Natural Resources Co. | | | 9,464 | | | | 1,742,038 | |
QEP Resources Inc. | | | 12,018 | | | | 368,352 | |
Quicksilver Resources Inc. | | | 4,675 | | | | 14,352 | (a) |
Range Resources Corp. | | | 10,840 | | | | 913,920 | |
Resolute Energy Corp. | | | 2,818 | | | | 25,447 | (a) |
Rex Energy Corp. | | | 1,676 | | | | 33,034 | (a) |
Rosetta Resources Inc. | | | 4,190 | | | | 201,288 | (a) |
Sanchez Energy Corp. | | | 1,392 | | | | 34,118 | (a) |
SM Energy Co. | | | 2,015 | | | | 167,467 | |
Southwestern Energy Co. | | | 23,263 | | | | 914,934 | (a) |
Stone Energy Corp. | | | 1,886 | | | | 65,237 | (a) |
Swift Energy Co. | | | 1,568 | | | | 21,168 | (a) |
Synergy Resources Corp. | | | 1,861 | | | | 17,233 | (a) |
Triangle Petroleum Corp. | | | 2,462 | | | | 20,484 | (a) |
Vaalco Energy Inc. | | | 2,238 | | | | 15,420 | (a) |
| | | | | | | | |
W&T Offshore Inc. | | | 1,280 | | | | 20,480 | |
Warren Resources Inc. | | | 3,392 | | | | 10,651 | (a) |
WPX Energy Inc. | | | 13,124 | | | | 267,467 | (a) |
| | | | 29,277,677 | |
| | |
Oil & Gas Refining & Marketing—0.3% | | | | | | | | |
Adams Resources & Energy Inc. | | | 101 | | | | 6,918 | |
Alon USA Energy Inc. | | | 993 | | | | 16,424 | |
Amyris Inc. | | | 1,627 | | | | 8,607 | (a) |
Clean Energy Fuels Corp. | | | 2,489 | | | | 32,058 | (a) |
Delek US Holdings Inc. | | | 1,436 | | | | 49,413 | |
Green Plains Renewable Energy Inc. | | | 905 | | | | 17,548 | |
HollyFrontier Corp. | | | 5,956 | | | | 295,954 | |
Marathon Petroleum Corp. | | | 19,968 | | | | 1,831,665 | |
Phillips 66 | | | 39,768 | | | | 3,067,306 | |
Renewable Energy Group Inc. | | | 830 | | | | 9,512 | (a) |
Rentech Inc. | | | 725 | | | | 1,269 | (a) |
REX American Resources Corp. | | | 216 | | | | 9,657 | (a) |
Tesoro Corp. | | | 8,812 | | | | 515,502 | |
Valero Energy Corp. | | | 35,790 | | | | 1,803,816 | |
Western Refining Inc. | | | 2,048 | | | | 86,856 | |
World Fuel Services Corp. | | | 2,177 | | | | 93,959 | |
| | | | 7,846,464 | |
| | |
Oil & Gas Storage & Transportation—0.2% | | | | | | | | |
Crosstex Energy Inc. | | | 1,771 | | | | 64,039 | |
Frontline Ltd. | | | 1,851 | | | | 6,923 | (a) |
GasLog Ltd. | | | 1,190 | | | | 20,337 | |
Kinder Morgan Inc. | | | 44,662 | | | | 1,607,832 | |
Knightsbridge Tankers Ltd. | | | 1,214 | | | | 11,157 | |
Nordic American Tankers Ltd. | | | 2,801 | | | | 27,170 | |
Scorpio Tankers Inc. | | | 6,707 | | | | 79,075 | |
SemGroup Corp. | | | 1,620 | | | | 105,672 | |
Ship Finance International Ltd. | | | 2,005 | | | | 32,842 | |
Spectra Energy Corp. | | | 44,445 | | | | 1,583,131 | |
Targa Resources Corp. | | | 1,254 | | | | 110,565 | |
Teekay Tankers Ltd. | | | 3,247 | | | | 12,761 | |
The Williams Companies Inc. | | | 45,333 | | | | 1,748,494 | |
| | | | 5,409,998 | |
| | |
Packaged Foods & Meats—0.6% | | | | | | | | |
Annie’s Inc. | | | 490 | | | | 21,090 | (a) |
B&G Foods Inc. | | | 2,052 | | | | 69,583 | |
Boulder Brands Inc. | | | 2,207 | | | | 35,003 | (a) |
Cal-Maine Foods Inc. | | | 563 | | | | 33,909 | |
Calavo Growers Inc. | | | 532 | | | | 16,098 | |
Campbell Soup Co. | | | 11,910 | | | | 515,465 | |
Chiquita Brands International Inc. | | | 1,668 | | | | 19,516 | (a) |
ConAgra Foods Inc. | | | 27,985 | | | | 943,094 | |
Dean Foods Co. | | | 2,810 | | | | 48,304 | (a) |
Diamond Foods Inc. | | | 795 | | | | 20,543 | (a) |
Farmer Bros Co. | | | 78 | | | | 1,814 | (a) |
Flowers Foods Inc. | | | 5,280 | | | | 113,362 | |
General Mills Inc. | | | 42,072 | | | | 2,099,814 | |
Green Mountain Coffee Roasters Inc. | | | 3,937 | | | | 297,558 | (a) |
Hillshire Brands Co. | | | 3,681 | | | | 123,093 | |
Hormel Foods Corp. | | | 8,887 | | | | 401,426 | |
| | | | | | | | |
Inventure Foods Inc. | | | 575 | | | | 7,625 | (a) |
J&J Snack Foods Corp. | | | 572 | | | | 50,673 | |
John B Sanfilippo & Son Inc. | | | 357 | | | | 8,811 | |
Kellogg Co. | | | 17,058 | | | | 1,041,732 | |
Kraft Foods Group Inc. | | | 39,525 | | | | 2,131,188 | |
Lancaster Colony Corp. | | | 1,258 | | | | 110,893 | |
Lifeway Foods Inc. | | | 157 | | | | 2,509 | |
McCormick & Company Inc. | | | 8,833 | | | | 608,770 | |
Mead Johnson Nutrition Co. | | | 13,398 | | | | 1,122,216 | |
Mondelez International Inc. | | | 116,331 | | | | 4,106,484 | |
Omega Protein Corp. | | | 877 | | | | 10,778 | (a) |
Pilgrim’s Pride Corp. | | | 2,198 | | | | 35,718 | (a) |
Post Holdings Inc. | | | 2,220 | | | | 109,379 | (a) |
Sanderson Farms Inc. | | | 889 | | | | 64,301 | |
Seaboard Corp. | | | 11 | | | | 30,745 | |
Seneca Foods Corp. | | | 360 | | | | 11,480 | (a) |
Snyders-Lance Inc. | | | 1,824 | | | | 52,385 | |
The Hain Celestial Group Inc. | | | 2,865 | | | | 260,085 | (a) |
The Hershey Co. | | | 9,937 | | | | 966,175 | |
The JM Smucker Co. | | | 6,955 | | | | 720,677 | |
Tootsie Roll Industries Inc. | | | 1,322 | | | | 43,018 | |
TreeHouse Foods Inc. | | | 1,348 | | | | 92,904 | (a) |
Tyson Foods Inc. | | | 18,018 | | | | 602,882 | |
WhiteWave Foods Co. | | | 5,223 | | | | 119,816 | (a) |
| | | | 17,070,916 | |
| | |
Paper Packaging—0.1% | | | | | | | | |
Bemis Company Inc. | | | 6,739 | | | | 276,029 | |
Graphic Packaging Holding Co. | | | 7,443 | | | | 71,453 | (a) |
MeadWestvaco Corp. | | | 11,755 | | | | 434,112 | |
Packaging Corporation of America | | | 2,940 | | | | 186,043 | |
Rock Tenn Co. | | | 2,163 | | | | 227,137 | |
Sealed Air Corp. | | | 12,856 | | | | 437,747 | |
Sonoco Products Co. | | | 3,062 | | | | 127,747 | |
UFP Technologies Inc. | | | 197 | | | | 4,968 | (a) |
| | | | 1,765,236 | |
| | |
Paper Products—0.1% | | | | | | | | |
Clearwater Paper Corp. | | | 793 | | | | 41,633 | (a) |
Domtar Corp. | | | 976 | | | | 92,076 | |
International Paper Co. | | | 29,427 | | | | 1,442,806 | |
KapStone Paper and Packaging Corp. | | | 1,539 | | | | 85,969 | (a) |
Neenah Paper Inc. | | | 587 | | | | 25,106 | |
PH Glatfelter Co. | | | 1,644 | | | | 45,440 | |
Resolute Forest Products Inc. | | | 2,366 | | | | 37,903 | (a) |
Schweitzer-Mauduit International Inc. | | | 1,169 | | | | 60,168 | |
Wausau Paper Corp. | | | 1,843 | | | | 23,369 | |
| | | | 1,854,470 | |
| | |
Personal Products—0.1% | | | | | | | | |
Avon Products Inc. | | | 28,774 | | | | 495,488 | |
Elizabeth Arden Inc. | | | 996 | | | | 35,308 | (a) |
Inter Parfums Inc. | | | 614 | | | | 21,987 | |
Lifevantage Corp. | | | 4,684 | | | | 7,729 | (a) |
Medifast Inc. | | | 489 | | | | 12,778 | (a) |
Nature’s Sunshine Products Inc. | | | 511 | | | | 8,851 | |
Nutraceutical International Corp. | | | 300 | | | | 8,034 | (a) |
Revlon Inc. | | | 343 | | | | 8,561 | (a) |
| | | | | | | | |
Star Scientific Inc. | | | 7,065 | | | | 8,195 | (a) |
Synutra International Inc. | | | 640 | | | | 5,683 | (a) |
The Estee Lauder Companies Inc. | | | 16,984 | | | | 1,279,235 | |
The Female Health Co. | | | 853 | | | | 7,251 | |
USANA Health Sciences Inc. | | | 221 | | | | 16,703 | (a) |
| | | | 1,915,803 | |
| | |
Pharmaceuticals—2.2% | | | | | | | | |
AbbVie Inc. | | | 105,524 | | | | 5,572,723 | |
AcelRx Pharmaceuticals Inc. | | | 746 | | | | 8,437 | (a) |
Actavis PLC | | | 11,545 | | | | 1,939,560 | (a) |
Aerie Pharmaceuticals Inc. | | | 242 | | | | 4,346 | (a) |
Akorn Inc. | | | 2,200 | | | | 54,186 | (a) |
Alimera Sciences Inc. | | | 1,013 | | | | 4,771 | (a) |
Allergan Inc. | | | 19,711 | | | | 2,189,498 | |
Ampio Pharmaceuticals Inc. | | | 1,207 | | | | 8,606 | (a) |
Aratana Therapeutics Inc. | | | 220 | | | | 4,202 | (a) |
Auxilium Pharmaceuticals Inc. | | | 1,833 | | | | 38,016 | (a) |
AVANIR Pharmaceuticals Inc. | | | 5,326 | | | | 17,895 | (a) |
BioDelivery Sciences International Inc. | | | 1,377 | | | | 8,111 | (a) |
Bristol-Myers Squibb Co. | | | 109,217 | | | | 5,804,884 | |
Cadence Pharmaceuticals Inc. | | | 2,222 | | | | 20,109 | (a) |
Cempra Inc. | | | 756 | | | | 9,367 | (a) |
Corcept Therapeutics Inc. | | | 2,736 | | | | 8,810 | (a) |
Cornerstone Therapeutics Inc. | | | 258 | | | | 2,448 | (a) |
Depomed Inc. | | | 2,158 | | | | 22,832 | (a) |
Eli Lilly & Co. | | | 65,764 | | | | 3,353,964 | |
Endo Health Solutions Inc. | | | 3,448 | | | | 232,602 | (a) |
Endocyte Inc. | | | 1,109 | | | | 11,855 | (a) |
Forest Laboratories Inc. | | | 15,708 | | | | 942,951 | (a) |
Hi-Tech Pharmacal Company Inc. | | | 427 | | | | 18,528 | (a) |
Horizon Pharma Inc. | | | 2,128 | | | | 16,215 | (a) |
Hospira Inc. | | | 10,989 | | | | 453,626 | (a) |
Impax Laboratories Inc. | | | 2,616 | | | | 65,766 | (a) |
Johnson & Johnson | | | 187,148 | | | | 17,140,885 | |
Lannett Company Inc. | | | 720 | | | | 23,832 | (a) |
Mallinckrodt PLC | | | 1,726 | | | | 90,201 | (a) |
Merck & Company Inc. | | | 193,814 | | | | 9,700,391 | |
Mylan Inc. | | | 25,396 | | | | 1,102,186 | (a) |
Nektar Therapeutics | | | 4,382 | | | | 49,736 | (a) |
Omeros Corp. | | | 1,321 | | | | 14,914 | (a) |
Pacira Pharmaceuticals Inc. | | | 1,040 | | | | 59,790 | (a) |
Pernix Therapeutics Holdings | | | 433 | | | | 1,091 | (a) |
Perrigo Co. PLC | | | 10,280 | | | | 1,577,569 | |
Pfizer Inc. | | | 429,895 | | | | 13,167,684 | |
Pozen Inc. | | | 999 | | | | 8,032 | (a) |
Prestige Brands Holdings Inc. | | | 1,900 | | | | 68,020 | (a) |
Questcor Pharmaceuticals Inc. | | | 1,946 | | | | 105,960 | |
Relypsa Inc. | | | 194 | | | | 4,850 | (a) |
Repros Therapeutics Inc. | | | 828 | | | | 15,152 | (a) |
Sagent Pharmaceuticals Inc. | | | 686 | | | | 17,411 | (a) |
Salix Pharmaceuticals Ltd. | | | 1,888 | | | | 169,807 | (a) |
Santarus Inc. | | | 2,121 | | | | 67,787 | (a) |
Sciclone Pharmaceuticals Inc. | | | 1,782 | | | | 8,981 | (a) |
Sucampo Pharmaceuticals Inc. | | | 578 | | | | 5,433 | (a) |
Supernus Pharmaceuticals Inc. | | | 678 | | | | 5,112 | (a) |
| | | | | | | | |
The Medicines Co. | | | 2,303 | | | | 88,942 | (a) |
TherapeuticsMD Inc. | | | 2,930 | | | | 15,265 | (a) |
ViroPharma Inc. | | | 2,500 | | | | 124,625 | (a) |
Vivus Inc. | | | 3,818 | | | | 34,668 | (a) |
XenoPort Inc. | | | 2,036 | | | | 11,707 | (a) |
Zoetis Inc. | | | 33,167 | | | | 1,084,229 | |
Zogenix Inc. | | | 3,643 | | | | 12,532 | (a) |
| | | | 65,591,100 | |
| | |
Precious Metals & Minerals—0.0%* | | | | | | | | |
Coeur Mining Inc. | | | 3,903 | | | | 42,348 | (a) |
Hecla Mining Co. | | | 12,124 | | | | 37,342 | |
Paramount Gold and Silver Corp. | | | 5,406 | | | | 5,037 | (a) |
Stillwater Mining Co. | | | 4,535 | | | | 55,962 | (a) |
| | | | | | | 140,689 | |
| | |
Property & Casualty Insurance—0.4% | | | | | | | | |
ACE Ltd. | | | 22,557 | | | | 2,335,326 | |
Ambac Financial Group Inc. | | | 1,738 | | | | 42,685 | (a) |
AMERISAFE Inc. | | | 707 | | | | 29,864 | |
Amtrust Financial Services Inc. | | | 1,206 | | | | 39,424 | |
Argo Group International Holdings Ltd. | | | 1,066 | | | | 49,558 | |
Aspen Insurance Holdings Ltd. | | | 1,969 | | | | 81,339 | |
Baldwin & Lyons Inc. | | | 264 | | | | 7,213 | |
Cincinnati Financial Corp. | | | 9,781 | | | | 512,231 | |
Donegal Group Inc. | | | 272 | | | | 4,325 | |
EMC Insurance Group Inc. | | | 124 | | | | 3,797 | |
Employers Holdings Inc. | | | 1,165 | | | | 36,872 | |
Fidelity National Financial Inc. | | | 7,499 | | | | 243,343 | |
Global Indemnity PLC | | | 281 | | | | 7,109 | (a) |
Hallmark Financial Services Inc. | | | 817 | | | | 7,259 | (a) |
HCI Group Inc. | | | 324 | | | | 17,334 | |
Hilltop Holdings Inc. | | | 2,420 | | | | 55,975 | (a) |
Infinity Property & Casualty Corp. | | | 421 | | | | 30,207 | |
Investors Title Co. | | | 69 | | | | 5,588 | |
Meadowbrook Insurance Group Inc. | | | 1,730 | | | | 12,041 | |
Mercury General Corp. | | | 1,085 | | | | 53,935 | |
National Interstate Corp. | | | 225 | | | | 5,175 | |
Old Republic International Corp. | | | 7,288 | | | | 125,864 | |
OneBeacon Insurance Group Ltd. | | | 850 | | | | 13,447 | |
RLI Corp. | | | 819 | | | | 79,754 | |
Safety Insurance Group Inc. | | | 551 | | | | 31,021 | |
Selective Insurance Group Inc. | | | 2,183 | | | | 59,072 | |
State Auto Financial Corp. | | | 519 | | | | 11,024 | |
Stewart Information Services Corp. | | | 788 | | | | 25,429 | |
The Allstate Corp. | | | 30,171 | | | | 1,645,526 | |
The Chubb Corp. | | | 16,700 | | | | 1,613,721 | |
The Hanover Insurance Group Inc. | | | 1,310 | | | | 78,220 | |
The Navigators Group Inc. | | | 394 | | | | 24,885 | (a) |
The Progressive Corp. | | | 36,616 | | | | 998,518 | |
The Travelers Companies Inc. | | | 24,149 | | | | 2,186,451 | |
Tower Group International Ltd. | | | 2,230 | | | | 7,537 | |
United Fire Group Inc. | | | 769 | | | | 22,040 | |
Universal Insurance Holdings Inc. | | | 1,099 | | | | 15,914 | |
WR Berkley Corp. | | | 3,278 | | | | 142,232 | |
XL Group PLC | | | 18,760 | | | | 597,318 | |
| | | | | | | 11,258,573 | |
| | | | | | | | |
| | |
Publishing—0.1% | | | | | | | | |
AH Belo Corp. | | | 740 | | | | 5,528 | |
Daily Journal Corp. | | | 18 | | | | 3,330 | (a) |
Dex Media Inc. | | | 701 | | | | 4,753 | (a) |
EW Scripps Co. | | | 1,119 | | | | 24,305 | (a) |
Gannett Company Inc. | | | 15,118 | | | | 447,190 | |
Global Sources Ltd. | | | 829 | | | | 6,740 | (a) |
John Wiley & Sons Inc. | | | 1,386 | | | | 76,507 | |
Journal Communications Inc. | | | 1,462 | | | | 13,611 | (a) |
Martha Stewart Living Omnimedia | | | 849 | | | | 3,566 | (a) |
Meredith Corp. | | | 2,489 | | | | 128,930 | |
News Corp. | | | 33,307 | | | | 600,192 | (a) |
Scholastic Corp. | | | 957 | | | | 32,547 | |
The McClatchy Co. | | | 2,905 | | | | 9,877 | (a) |
The New York Times Co. | | | 8,733 | | | | 138,593 | |
Valassis Communications Inc. | | | 2,637 | | | | 90,317 | |
| | | | | | | 1,585,986 | |
| | |
Railroads—0.3% | | | | | | | | |
CSX Corp. | | | 67,239 | | | | 1,934,466 | |
Genesee & Wyoming Inc. | | | 1,527 | | | | 146,668 | (a) |
Kansas City Southern | | | 7,311 | | | | 905,321 | |
Norfolk Southern Corp. | | | 20,491 | | | | 1,902,180 | |
Union Pacific Corp. | | | 30,551 | | | | 5,132,568 | |
| | | | | | | 10,021,203 | |
| | |
Real Estate Development—0.0%* | | | | | | | | |
AV Homes Inc. | | | 221 | | | | 4,016 | (a) |
Forestar Group Inc. | | | 1,311 | | | | 27,885 | (a) |
| | | | | | | 31,901 | |
| | |
Real Estate Operating Companies—0.0%* | | | | | | | | |
Altisource Residential Corp. | | | 1,500 | | | | 45,165 | |
| | |
Real Estate Services—0.0%* | | | | | | | | |
CBRE Group Inc. | | | 18,418 | | | | 484,393 | (a) |
Jones Lang LaSalle Inc. | | | 1,340 | | | | 137,203 | |
Kennedy-Wilson Holdings Inc. | | | 1,970 | | | | 43,832 | |
RE/MAX Holdings Inc. | | | 428 | | | | 13,726 | (a) |
| | | | | | | 679,154 | |
| | |
Regional Banks—0.6% | | | | | | | | |
1st Source Corp. | | | 508 | | | | 16,226 | |
1st United Bancorp Inc. | | | 1,357 | | | | 10,327 | |
Access National Corp. | | | 350 | | | | 5,233 | |
American National Bankshares Inc. | | | 307 | | | | 8,059 | |
Ameris Bancorp. | | | 819 | | | | 17,289 | (a) |
Ames National Corp. | | | 402 | | | | 9,001 | |
Arrow Financial Corp. | | | 446 | | | | 11,846 | |
Associated Banc-Corp. | | | 4,878 | | | | 84,877 | |
Bancfirst Corp. | | | 288 | | | | 16,145 | |
Bancorp Inc. | | | 1,251 | | | | 22,405 | (a) |
BancorpSouth Inc. | | | 6,105 | | | | 155,189 | |
Bank of Hawaii Corp. | | | 1,334 | | | | 78,893 | |
Bank of Kentucky Financial Corp. | | | 231 | | | | 8,524 | |
Bank of Marin Bancorp. | | | 230 | | | | 9,980 | |
| | | | | | | | |
Bank of the Ozarks Inc. | | | 1,180 | | | | 66,776 | |
Banner Corp. | | | 720 | | | | 32,270 | |
Bar Harbor Bankshares | | | 141 | | | | 5,639 | |
BB&T Corp. | | | 46,759 | | | | 1,745,046 | |
BBCN Bancorp Inc. | | | 3,021 | | | | 50,118 | |
BNC Bancorp | | | 617 | | | | 10,575 | |
Boston Private Financial Holdings Inc. | | | 2,966 | | | | 37,431 | |
Bridge Bancorp Inc. | | | 375 | | | | 9,750 | |
Bridge Capital Holdings | | | 421 | | | | 8,647 | (a) |
Bryn Mawr Bank Corp. | | | 516 | | | | 15,573 | |
C&F Financial Corp. | | | 146 | | | | 6,668 | |
Camden National Corp. | | | 348 | | | | 14,693 | |
Capital Bank Financial Corp. | | | 873 | | | | 19,861 | (a) |
Capital City Bank Group Inc. | | | 622 | | | | 7,321 | (a) |
Cardinal Financial Corp. | | | 1,101 | | | | 19,818 | |
Cascade Bancorp | | | 488 | | | | 2,552 | (a) |
Cathay General Bancorp. | | | 5,250 | | | | 140,332 | |
Center Bancorp Inc. | | | 501 | | | | 9,399 | |
Centerstate Banks Inc. | | | 1,386 | | | | 14,068 | |
Central Pacific Financial Corp. | | | 747 | | | | 15,000 | |
Century Bancorp Inc. | | | 118 | | | | 3,924 | |
Chemical Financial Corp. | | | 1,024 | | | | 32,430 | |
Chemung Financial Corp. | | | 149 | | | | 5,091 | |
Citizens & Northern Corp. | | | 577 | | | | 11,904 | |
City Holding Co. | | | 562 | | | | 26,037 | |
City National Corp. | | | 1,428 | | | | 113,126 | |
CNB Financial Corp. | | | 570 | | | | 10,830 | |
CoBiz Financial Inc. | | | 1,169 | | | | 13,981 | |
Columbia Banking System Inc. | | | 1,962 | | | | 53,975 | |
Commerce Bancshares Inc. | | | 2,447 | | | | 109,895 | |
Community Bank System Inc. | | | 1,559 | | | | 61,861 | |
Community Trust Bancorp Inc. | | | 493 | | | | 22,264 | |
CommunityOne Bancorp | | | 554 | | | | 7,063 | (a) |
CU Bancorp | | | 321 | | | | 5,611 | (a) |
Cullen Frost Bankers Inc. | | | 1,581 | | | | 117,674 | |
Customers Bancorp Inc. | | | 882 | | | | 18,046 | (a) |
CVB Financial Corp. | | | 3,550 | | | | 60,598 | |
Eagle Bancorp Inc. | | | 844 | | | | 25,852 | (a) |
East West Bancorp Inc. | | | 4,148 | | | | 145,056 | |
Enterprise Bancorp Inc. | | | 268 | | | | 5,674 | |
Enterprise Financial Services Corp. | | | 809 | | | | 16,520 | |
Farmers Capital Bank Corp. | | | 270 | | | | 5,873 | (a) |
Fidelity Southern Corp. | | | 484 | | | | 8,039 | |
Fifth Third Bancorp | | | 58,561 | | | | 1,231,538 | |
Financial Institutions Inc. | | | 450 | | | | 11,119 | |
First BanCorp | | | 2,841 | | | | 17,586 | (a,††) |
First BanCorp | | | 781 | | | | 12,980 | (††) |
First Bancorp Inc. | | | 431 | | | | 7,508 | |
First Busey Corp. | | | 2,124 | | | | 12,319 | |
First Commonwealth Financial Corp. | | | 3,757 | | | | 33,137 | |
First Community Bancshares Inc. | | | 503 | | | | 8,400 | |
First Connecticut Bancorp Inc. | | | 642 | | | | 10,349 | |
First Financial Bancorp. | | | 2,172 | | | | 37,858 | |
First Financial Bankshares Inc. | | | 1,197 | | | | 79,385 | |
First Financial Corp. | | | 514 | | | | 18,792 | |
First Financial Holdings Inc. | | | 894 | | | | 59,460 | |
| | | | | | | | |
First Horizon National Corp. | | | 7,092 | | | | 82,622 | |
First Interstate Bancsystem Inc. | | | 695 | | | | 19,717 | |
First Merchants Corp. | | | 1,301 | | | | 29,611 | |
First Midwest Bancorp Inc. | | | 2,826 | | | | 49,540 | |
First NBC Bank Holding Co. | | | 199 | | | | 6,428 | (a) |
First Niagara Financial Group Inc. | | | 10,587 | | | | 112,434 | |
First Security Group Inc. | | | 2,440 | | | | 5,612 | (a) |
FirstMerit Corp. | | | 11,208 | | | | 249,154 | |
Flushing Financial Corp. | | | 1,091 | | | | 22,584 | |
FNB Corp. | | | 5,674 | | | | 71,606 | |
Fulton Financial Corp. | | | 5,797 | | | | 75,825 | |
German American Bancorp Inc. | | | 577 | | | | 16,444 | |
Glacier Bancorp Inc. | | | 2,796 | | | | 83,293 | |
Great Southern Bancorp Inc. | | | 488 | | | | 14,840 | |
Guaranty Bancorp | | | 313 | | | | 4,398 | |
Hancock Holding Co. | | | 5,677 | | | | 208,232 | |
Hanmi Financial Corp. | | | 1,139 | | | | 24,933 | |
Heartland Financial USA Inc. | | | 525 | | | | 15,115 | |
Heritage Commerce Corp. | | | 1,056 | | | | 8,701 | |
Heritage Financial Corp. | | | 677 | | | | 11,583 | |
Heritage Oaks Bancorp | | | 938 | | | | 7,035 | (a) |
Home BancShares Inc. | | | 1,762 | | | | 65,811 | |
Home Federal Bancorp Inc. | | | 719 | | | | 10,713 | |
HomeTrust Bancshares Inc. | | | 960 | | | | 15,350 | (a) |
Horizon Bancorp | | | 324 | | | | 8,207 | |
Hudson Valley Holding Corp. | | | 764 | | | | 15,547 | |
Huntington Bancshares Inc. | | | 55,093 | | | | 531,647 | |
Iberiabank Corp. | | | 1,149 | | | | 72,215 | |
Independent Bank Corp. | | | 855 | | | | 33,507 | |
Independent Bank Group Inc. | | | 165 | | | | 8,194 | |
International Bancshares Corp. | | | 3,753 | | | | 99,042 | |
Intervest Bancshares Corp. | | | 759 | | | | 5,700 | (a) |
Investors Bancorp Inc. | | | 1,754 | | | | 44,867 | |
KeyCorp | | | 59,480 | | | | 798,222 | |
Lakeland Bancorp Inc. | | | 954 | | | | 11,801 | |
Lakeland Financial Corp. | | | 571 | | | | 22,269 | |
LCNB Corp. | | | 236 | | | | 4,217 | |
M&T Bank Corp. | | | 8,639 | | | | 1,005,752 | |
Macatawa Bank Corp. | | | 964 | | | | 4,820 | (a) |
MainSource Financial Group Inc. | | | 936 | | | | 16,876 | |
MB Financial Inc. | | | 2,114 | | | | 67,838 | |
Mercantile Bank Corp. | | | 407 | | | | 8,783 | |
Merchants Bancshares Inc. | | | 189 | | | | 6,331 | |
Metro Bancorp Inc. | | | 628 | | | | 13,527 | (a) |
MetroCorp Bancshares Inc. | | | 618 | | | | 9,313 | |
Middleburg Financial Corp. | | | 228 | | | | 4,113 | |
MidSouth Bancorp Inc. | | | 424 | | | | 7,573 | |
MidWestOne Financial Group Inc. | | | 297 | | | | 8,078 | |
National Bank Holdings Corp. | | | 1,701 | | | | 36,401 | |
National Bankshares Inc. | | | 310 | | | | 11,436 | |
National Penn Bancshares Inc. | | | 4,426 | | | | 50,147 | |
NBT Bancorp Inc. | | | 1,658 | | | | 42,942 | |
NewBridge Bancorp | | | 807 | | | | 6,052 | (a) |
Northrim BanCorp Inc. | | | 274 | | | | 7,190 | |
OFG Bancorp | | | 1,668 | | | | 28,923 | |
Old National Bancorp | | | 3,931 | | | | 60,419 | |
| | | | | | | | |
OmniAmerican Bancorp Inc. | | | 455 | | | | 9,728 | (a) |
Pacific Continental Corp. | | | 831 | | | | 13,246 | |
Pacific Premier Bancorp Inc. | | | 517 | | | | 8,138 | (a) |
PacWest Bancorp | | | 1,450 | | | | 61,219 | |
Palmetto Bancshares Inc. | | | 365 | | | | 4,730 | (a) |
Park National Corp. | | | 445 | | | | 37,856 | |
Park Sterling Corp. | | | 2,028 | | | | 14,480 | |
Peapack Gladstone Financial Corp. | | | 354 | | | | 6,761 | |
Penns Woods Bancorp Inc. | | | 142 | | | | 7,242 | |
Peoples Bancorp Inc. | | | 523 | | | | 11,773 | |
Pinnacle Financial Partners Inc. | | | 1,326 | | | | 43,135 | |
PNC Financial Services Group Inc. | | | 35,296 | | | | 2,738,264 | |
Preferred Bank | | | 546 | | | | 10,947 | (a) |
PrivateBancorp Inc. | | | 2,486 | | | | 71,920 | |
Prosperity Bancshares Inc. | | | 3,982 | | | | 252,419 | |
Regions Financial Corp. | | | 91,379 | | | | 903,738 | |
Renasant Corp. | | | 1,148 | | | | 36,116 | |
Republic Bancorp Inc. | | | 472 | | | | 11,583 | |
S&T Bancorp Inc. | | | 1,064 | | | | 26,930 | |
Sandy Spring Bancorp Inc. | | | 898 | | | | 25,315 | |
Seacoast Banking Corp. of Florida | | | 495 | | | | 6,039 | (a) |
Sierra Bancorp | | | 470 | | | | 7,562 | |
Signature Bank | | | 1,424 | | | | 152,966 | (a) |
Simmons First National Corp. | | | 530 | | | | 19,689 | |
Southside Bancshares Inc. | | | 609 | | | | 16,650 | |
Southwest BanCorp. Inc. | | | 632 | | | | 10,061 | (a) |
State Bank Financial Corp. | | | 1,204 | | | | 21,901 | |
StellarOne Corp. | | | 806 | | | | 19,400 | |
Sterling Bancorp | | | 3,249 | | | | 43,439 | |
Sterling Financial Corp. | | | 1,297 | | | | 44,202 | |
Suffolk Bancorp | | | 429 | | | | 8,923 | (a) |
Sun Bancorp Inc. | | | 2,128 | | | | 7,491 | (a) |
SunTrust Banks Inc. | | | 35,506 | | | | 1,306,976 | |
Susquehanna Bancshares Inc. | | | 7,038 | | | | 90,368 | |
SVB Financial Group | | | 1,372 | | | | 143,868 | (a) |
SY Bancorp Inc. | | | 526 | | | | 16,790 | |
Synovus Financial Corp. | | | 29,260 | | | | 105,336 | |
Taylor Capital Group Inc. | | | 572 | | | | 15,204 | (a) |
TCF Financial Corp. | | | 4,984 | | | | 80,990 | |
Texas Capital Bancshares Inc. | | | 1,543 | | | | 95,975 | (a) |
The First of Long Island Corp. | | | 331 | | | | 14,190 | |
Tompkins Financial Corp. | | | 524 | | | | 26,928 | |
TowneBank | | | 899 | | | | 13,836 | |
Trico Bancshares | | | 545 | | | | 15,462 | |
Tristate Capital Holdings Inc. | | | 380 | | | | 4,507 | (a) |
Trustmark Corp. | | | 4,637 | | | | 124,457 | |
UMB Financial Corp. | | | 1,280 | | | | 82,278 | |
Umpqua Holdings Corp. | | | 4,311 | | | | 82,513 | |
Union First Market Bankshares Corp. | | | 720 | | | | 17,863 | |
United Community Banks Inc. | | | 1,719 | | | | 30,512 | (a) |
Univest Corp of Pennsylvania | | | 507 | | | | 10,485 | |
Valley National Bancorp | | | 5,966 | | | | 60,376 | |
VantageSouth Bancshares Inc. | | | 304 | | | | 1,602 | (a) |
ViewPoint Financial Group Inc. | | | 1,456 | | | | 39,967 | |
Virginia Commerce Bancorp Inc. | | | 907 | | | | 15,410 | (a) |
Washington Banking Co. | | | 708 | | | | 12,553 | |
Washington Trust Bancorp Inc. | | | 494 | | | | 18,387 | |
| | | | | | | | |
Webster Financial Corp. | | | 6,109 | | | | 190,479 | |
WesBanco Inc. | | | 971 | | | | 31,072 | |
West Bancorporation Inc. | | | 581 | | | | 9,191 | |
Westamerica Bancorporation | | | 1,844 | | | | 104,112 | |
Western Alliance Bancorp | | | 2,849 | | | | 67,977 | (a) |
Wilshire Bancorp Inc. | | | 2,275 | | | | 24,866 | |
Wintrust Financial Corp. | | | 1,425 | | | | 65,721 | |
Yadkin Financial Corp. | | | 463 | | | | 7,890 | (a) |
Zions Bancorporation | | | 12,115 | | | | 362,965 | |
| | | | 17,315,785 | |
| | |
Reinsurance—0.0%* | | | | | | | | |
Alleghany Corp. | | | 504 | | | | 201,580 | (a) |
Enstar Group Ltd. | | | 354 | | | | 49,174 | (a) |
Everest Re Group Ltd. | | | 1,437 | | | | 223,985 | |
Greenlight Capital Re Ltd. | | | 1,062 | | | | 35,800 | (a) |
Maiden Holdings Ltd. | | | 2,096 | | | | 22,909 | |
Montpelier Re Holdings Ltd. | | | 1,626 | | | | 47,317 | |
Platinum Underwriters Holdings Ltd. | | | 963 | | | | 59,013 | |
Reinsurance Group of America Inc. | | | 2,123 | | | | 164,341 | |
| | | | 804,119 | |
| | |
Research & Consulting Services—0.1% | | | | | | | | |
Acacia Research Corp. | | | 1,858 | | | | 27,015 | |
CBIZ Inc. | | | 1,556 | | | | 14,191 | (a) |
CRA International Inc. | | | 438 | | | | 8,672 | (a) |
Equifax Inc. | | | 8,072 | | | | 557,694 | |
Exponent Inc. | | | 486 | | | | 37,636 | |
Franklin Covey Co. | | | 194 | | | | 3,857 | (a) |
FTI Consulting Inc. | | | 2,734 | | | | 112,477 | (a) |
Huron Consulting Group Inc. | | | 886 | | | | 55,570 | (a) |
ICF International Inc. | | | 723 | | | | 25,095 | (a) |
Mistras Group Inc. | | | 602 | | | | 12,570 | (a) |
Navigant Consulting Inc. | | | 1,849 | | | | 35,501 | (a) |
Nielsen Holdings N.V. | | | 16,802 | | | | 771,044 | |
Odyssey Marine Exploration Inc. | | | 3,468 | | | | 7,005 | (a) |
Pendrell Corp. | | | 5,867 | | | | 11,793 | (a) |
Resources Connection Inc. | | | 1,413 | | | | 20,248 | |
RPX Corp. | | | 1,309 | | | | 22,122 | (a) |
The Advisory Board Co. | | | 1,367 | | | | 87,037 | (a) |
The Corporate Executive Board Co. | | | 2,263 | | | | 175,224 | |
The Dun & Bradstreet Corp. | | | 2,532 | | | | 310,803 | |
VSE Corp. | | | 118 | | | | 5,665 | |
| | | | 2,301,219 | |
| | |
Residential REITs—0.1% | | | | | | | | |
American Campus Communities Inc. | | | 3,134 | | | | 100,946 | |
American Residential Properties Inc. | | | 510 | | | | 8,752 | (a) |
Apartment Investment & Management Co. | | | 9,543 | | | | 247,259 | |
Associated Estates Realty Corp. | | | 2,032 | | | | 32,614 | |
AvalonBay Communities Inc. | | | 8,069 | | | | 953,998 | |
BRE Properties Inc. | | | 2,326 | | | | 127,255 | |
Camden Property Trust | | | 2,568 | | | | 146,068 | |
Campus Crest Communities Inc. | | | 2,349 | | | | 22,104 | |
Education Realty Trust Inc. | | | 4,186 | | | | 36,920 | |
Equity Residential | | | 22,234 | | | | 1,153,278 | |
Essex Property Trust Inc. | | | 1,145 | | | | 164,319 | |
Home Properties Inc. | | | 1,701 | | | | 91,208 | |
| | | | | | | | |
Mid-America Apartment Communities Inc. | | | 2,252 | | | | 136,786 | |
Silver Bay Realty Trust Corp. | | | 628 | | | | 10,042 | |
Sun Communities Inc. | | | 1,379 | | | | 58,800 | |
UDR Inc. | | | 7,542 | | | | 176,106 | |
UMH Properties Inc. | | | 607 | | | | 5,718 | |
| | | | 3,472,173 | |
| | |
Restaurants—0.5% | | | | | | | | |
AFC Enterprises Inc. | | | 856 | | | | 32,956 | (a) |
Biglari Holdings Inc. | | | 50 | | | | 25,332 | (a) |
BJ’s Restaurants Inc. | | | 937 | | | | 29,103 | (a) |
Bloomin’ Brands Inc. | | | 2,161 | | | | 51,886 | (a) |
Bob Evans Farms Inc. | | | 1,879 | | | | 95,059 | |
Bravo Brio Restaurant Group Inc. | | | 626 | | | | 10,185 | (a) |
Brinker International Inc. | | | 2,014 | | | | 93,329 | |
Buffalo Wild Wings Inc. | | | 699 | | | | 102,893 | (a) |
Carrols Restaurant Group Inc. | | | 778 | | | | 5,143 | (a) |
CEC Entertainment Inc. | | | 656 | | | | 29,048 | |
Chipotle Mexican Grill Inc. | | | 2,053 | | | | 1,093,797 | (a) |
Chuy’s Holdings Inc. | | | 558 | | | | 20,099 | (a) |
Cracker Barrel Old Country Store Inc. | | | 732 | | | | 80,571 | |
Darden Restaurants Inc. | | | 8,605 | | | | 467,854 | |
Del Frisco’s Restaurant Group Inc. | | | 333 | | | | 7,849 | (a) |
Denny’s Corp. | | | 3,631 | | | | 26,107 | (a) |
DineEquity Inc. | | | 639 | | | | 53,389 | |
Diversified Restaurant Holdings Inc. | | | 613 | | | | 2,924 | (a) |
Domino’s Pizza Inc. | | | 1,679 | | | | 116,942 | |
Einstein Noah Restaurant Group Inc. | | | 358 | | | | 5,191 | |
Fiesta Restaurant Group Inc. | | | 829 | | | | 43,307 | (a) |
Ignite Restaurant Group Inc. | | | 352 | | | | 4,400 | (a) |
Jack in the Box Inc. | | | 1,661 | | | | 83,083 | (a) |
Jamba Inc. | | | 733 | | | | 9,111 | (a) |
Krispy Kreme Doughnuts Inc. | | | 2,539 | | | | 48,977 | (a) |
Luby’s Inc. | | | 972 | | | | 7,504 | (a) |
McDonald’s Corp. | | | 66,001 | | | | 6,404,077 | |
Nathan’s Famous Inc. | | | 114 | | | | 5,747 | (a) |
Noodles & Co. | | | 208 | | | | 7,471 | (a) |
Panera Bread Co. | | | 803 | | | | 141,882 | (a) |
Papa John’s International Inc. | | | 1,242 | | | | 56,387 | |
Potbelly Corp. | | | 291 | | | | 7,066 | (a) |
Red Robin Gourmet Burgers Inc. | | | 517 | | | | 38,020 | (a) |
Ruby Tuesday Inc. | | | 2,543 | | | | 17,623 | (a) |
Ruth’s Hospitality Group Inc. | | | 1,315 | | | | 18,686 | |
Sonic Corp. | | | 2,038 | | | | 41,147 | (a) |
Starbucks Corp. | | | 49,987 | | | | 3,918,481 | |
Texas Roadhouse Inc. | | | 2,321 | | | | 64,524 | |
The Cheesecake Factory Inc. | | | 3,415 | | | | 164,842 | |
The Wendy’s Co. | | | 8,470 | | | | 73,858 | |
Yum! Brands Inc. | | | 29,540 | | | | 2,233,519 | |
| | | | 15,739,369 | |
| | |
Retail REITs—0.2% | | | | | | | | |
Acadia Realty Trust | | | 2,135 | | | | 53,012 | |
Agree Realty Corp. | | | 530 | | | | 15,381 | |
Alexander’s Inc. | | | 81 | | | | 26,730 | |
AmREIT Inc. | | | 605 | | | | 10,164 | |
| | | | | | | | |
Cedar Realty Trust Inc. | | | 3,119 | | | | 19,525 | |
Equity One Inc. | | | 4,296 | | | | 96,402 | |
Excel Trust Inc. | | | 2,014 | | | | 22,940 | |
Federal Realty Investment Trust | | | 1,952 | | | | 197,952 | |
General Growth Properties Inc. | | | 35,661 | | | | 715,716 | |
Getty Realty Corp. | | | 873 | | | | 16,037 | |
Glimcher Realty Trust | | | 5,512 | | | | 51,592 | |
Inland Real Estate Corp. | | | 3,240 | | | | 34,085 | |
Kimco Realty Corp. | | | 27,177 | | | | 536,746 | |
Kite Realty Group Trust | | | 4,822 | | | | 31,681 | |
National Retail Properties Inc. | | | 3,660 | | | | 111,008 | |
Pennsylvania Real Estate Investment Trust | | | 2,592 | | | | 49,196 | |
Ramco-Gershenson Properties Trust | | | 2,252 | | | | 35,447 | |
Realty Income Corp. | | | 5,867 | | | | 219,015 | |
Regency Centers Corp. | | | 2,782 | | | | 128,807 | |
Retail Opportunity Investments Corp. | | | 2,495 | | | | 36,726 | |
Rouse Properties Inc. | | | 786 | | | | 17,441 | |
Saul Centers Inc. | | | 336 | | | | 16,037 | |
Simon Property Group Inc. | | | 20,584 | | | | 3,132,061 | |
Taubman Centers Inc. | | | 1,909 | | | | 122,023 | |
The Macerich Co. | | | 9,323 | | | | 549,032 | |
Urstadt Biddle Properties Inc. | | | 803 | | | | 14,815 | |
Weingarten Realty Investors | | | 3,355 | | | | 91,994 | |
| | | | 6,351,565 | |
| | |
Security & Alarm Services—0.1% | | | | | | | | |
The ADT Corp. | | | 13,267 | | | | 536,916 | |
The Brink’s Co. | | | 3,253 | | | | 111,057 | |
Tyco International Ltd. | | | 30,865 | | | | 1,266,700 | |
| | | | 1,914,673 | |
| | |
Semiconductor Equipment—0.1% | | | | | | | | |
Advanced Energy Industries Inc. | | | 1,465 | | | | 33,490 | (a) |
Amkor Technology Inc. | | | 2,179 | | | | 13,357 | (a) |
Applied Materials Inc. | | | 79,877 | | | | 1,413,024 | |
ATMI Inc. | | | 1,168 | | | | 35,285 | (a) |
Axcelis Technologies Inc. | | | 3,265 | | | | 7,967 | (a) |
Brooks Automation Inc. | | | 2,396 | | | | 25,134 | |
Cabot Microelectronics Corp. | | | 864 | | | | 39,485 | (a) |
Cohu Inc. | | | 759 | | | | 7,969 | |
Entegris Inc. | | | 5,266 | | | | 61,086 | (a) |
FormFactor Inc. | | | 2,328 | | | | 14,015 | (a) |
GT Advanced Technologies Inc. | | | 4,972 | | | | 43,356 | (a) |
KLA-Tencor Corp. | | | 11,112 | | | | 716,280 | |
Lam Research Corp. | | | 10,772 | | | | 586,535 | (a) |
LTX-Credence Corp. | | | 1,791 | | | | 14,310 | (a) |
MKS Instruments Inc. | | | 1,995 | | | | 59,730 | |
Nanometrics Inc. | | | 750 | | | | 14,287 | (a) |
PDF Solutions Inc. | | | 890 | | | | 22,802 | (a) |
Photronics Inc. | | | 2,236 | | | | 20,191 | (a) |
Rubicon Technology Inc. | | | 808 | | | | 8,040 | (a) |
Rudolph Technologies Inc. | | | 1,110 | | | | 13,031 | (a) |
SunEdison Inc. | | | 17,421 | | | | 227,344 | (a) |
Teradyne Inc. | | | 5,756 | | | | 101,421 | (a) |
Tessera Technologies Inc. | | | 1,989 | | | | 39,203 | |
Ultra Clean Holdings Inc. | | | 661 | | | | 6,630 | (a) |
| | | | | | | | |
Ultratech Inc. | | | 1,035 | | | | 30,015 | (a) |
Veeco Instruments Inc. | | | 1,502 | | | | 49,431 | (a) |
| | | | 3,603,418 | |
| | |
Semiconductors—0.7% | | | | | | | | |
Advanced Micro Devices Inc. | | | 18,581 | | | | 71,908 | (a) |
Alpha & Omega Semiconductor Ltd. | | | 694 | | | | 5,351 | (a) |
Altera Corp. | | | 21,409 | | | | 696,435 | |
Ambarella Inc. | | | 701 | | | | 23,785 | (a) |
ANADIGICS Inc. | | | 3,653 | | | | 6,721 | (a) |
Analog Devices Inc. | | | 20,633 | | | | 1,050,839 | |
Applied Micro Circuits Corp. | | | 2,738 | | | | 36,634 | (a) |
Atmel Corp. | | | 12,789 | | | | 100,138 | (a) |
Broadcom Corp. | | | 35,793 | | | | 1,061,262 | |
Cavium Inc. | | | 1,967 | | | | 67,881 | (a) |
Ceva Inc. | | | 768 | | | | 11,689 | (a) |
Cirrus Logic Inc. | | | 2,438 | | | | 49,808 | (a) |
Cree Inc. | | | 3,624 | | | | 226,754 | (a) |
Cypress Semiconductor Corp. | | | 9,806 | | | | 102,963 | (a) |
Diodes Inc. | | | 1,361 | | | | 32,065 | (a) |
DSP Group Inc. | | | 969 | | | | 9,409 | (a) |
Entropic Communications Inc. | | | 3,025 | | | | 14,248 | (a) |
Exar Corp. | | | 1,330 | | | | 15,681 | (a) |
Fairchild Semiconductor International Inc. | | | 3,810 | | | | 50,863 | (a) |
First Solar Inc. | | | 4,646 | | | | 253,857 | (a) |
GSI Technology Inc. | | | 955 | | | | 6,341 | (a) |
Hittite Microwave Corp. | | | 1,209 | | | | 74,632 | (a) |
Inphi Corp. | | | 1,118 | | | | 14,422 | (a) |
Integrated Device Technology Inc. | | | 9,092 | | | | 92,647 | (a) |
Integrated Silicon Solution Inc. | | | 1,229 | | | | 14,859 | (a) |
Intel Corp. | | | 329,731 | | | | 8,559,817 | |
Intermolecular Inc. | | | 679 | | | | 3,341 | (a) |
International Rectifier Corp. | | | 4,777 | | | | 124,536 | (a) |
Intersil Corp. | | | 8,561 | | | | 98,195 | |
IXYS Corp. | | | 733 | | | | 9,507 | |
Kopin Corp. | | | 2,287 | | | | 9,651 | (a) |
Lattice Semiconductor Corp. | | | 4,201 | | | | 23,147 | (a) |
Linear Technology Corp. | | | 15,634 | | | | 712,129 | |
LSI Corp. | | | 36,150 | | | | 398,373 | |
M/A-COM Technology Solutions Holdings Inc. | | | 296 | | | | 5,029 | (a) |
MaxLinear Inc. | | | 953 | | | | 9,940 | (a) |
Micrel Inc. | | | 1,619 | | | | 15,980 | |
Microchip Technology Inc. | | | 13,159 | | | | 588,865 | |
Micron Technology Inc. | | | 69,555 | | | | 1,513,517 | (a) |
Microsemi Corp. | | | 3,568 | | | | 89,022 | (a) |
Monolithic Power Systems Inc. | | | 1,380 | | | | 47,831 | (a) |
MoSys Inc. | | | 1,573 | | | | 8,683 | (a) |
NeoPhotonics Corp. | | | 836 | | | | 5,902 | (a) |
NVE Corp. | | | 202 | | | | 11,773 | (a) |
NVIDIA Corp. | | | 38,712 | | | | 620,166 | |
OmniVision Technologies Inc. | | | 2,070 | | | | 35,604 | (a) |
Peregrine Semiconductor Corp. | | | 927 | | | | 6,869 | (a) |
Pericom Semiconductor Corp. | | | 1,027 | | | | 9,099 | (a) |
PLX Technology Inc. | | | 1,476 | | | | 9,712 | (a) |
PMC—Sierra Inc. | | | 7,677 | | | | 49,363 | (a) |
Power Integrations Inc. | | | 1,098 | | | | 61,290 | |
| | | | | | | | |
Rambus Inc. | | | 4,197 | | | | 39,746 | (a) |
RF Micro Devices Inc. | | | 19,334 | | | | 99,763 | (a) |
Semtech Corp. | | | 4,675 | | | | 118,184 | (a) |
Sigma Designs Inc. | | | 1,502 | | | | 7,089 | (a) |
Silicon Image Inc. | | | 2,904 | | | | 17,860 | (a) |
Silicon Laboratories Inc. | | | 1,197 | | | | 51,842 | (a) |
Skyworks Solutions Inc. | | | 5,651 | | | | 161,393 | (a) |
Spansion Inc. | | | 1,730 | | | | 24,030 | (a) |
SunPower Corp. | | | 1,591 | | | | 47,428 | (a) |
Supertex Inc. | | | 415 | | | | 10,396 | (a) |
Synaptics Inc. | | | 1,249 | | | | 64,711 | (a) |
Texas Instruments Inc. | | | 72,604 | | | | 3,188,042 | |
TriQuint Semiconductor Inc. | | | 6,216 | | | | 51,841 | (a) |
Xilinx Inc. | | | 17,881 | | | | 821,095 | |
| | | | 21,821,953 | |
| | |
Soft Drinks—0.7% | | | | | | | | |
Coca-Cola Bottling Company Consolidated | | | 186 | | | | 13,613 | |
Coca-Cola Enterprises Inc. | | | 16,018 | | | | 706,874 | |
Dr Pepper Snapple Group Inc. | | | 13,310 | | | | 648,463 | |
Monster Beverage Corp. | | | 9,065 | | | | 614,335 | (a) |
National Beverage Corp. | | | 508 | | | | 10,241 | (a) |
PepsiCo Inc. | | | 101,725 | | | | 8,437,072 | |
The Coca-Cola Co. | | | 251,905 | | | | 10,406,196 | |
| | | | 20,836,794 | |
| | |
Specialized Consumer Services—0.0%* | | | | | | | | |
Ascent Capital Group Inc. | | | 514 | | | | 43,978 | (a) |
Carriage Services Inc. | | | 491 | | | | 9,589 | |
H&R Block Inc. | | | 18,127 | | | | 526,408 | |
Hillenbrand Inc. | | | 2,133 | | | | 62,753 | |
JTH Holding Inc. | | | 169 | | | | 4,107 | (a) |
LifeLock Inc. | | | 2,238 | | | | 36,725 | (a) |
Mac-Gray Corp. | | | 492 | | | | 10,445 | |
Matthews International Corp. | | | 1,847 | | | | 78,701 | |
Regis Corp. | | | 1,913 | | | | 27,758 | |
Service Corp International | | | 6,339 | | | | 114,926 | |
Sotheby’s | | | 4,633 | | | | 246,475 | |
Steiner Leisure Ltd. | | | 540 | | | | 26,563 | (a) |
| | | | 1,188,428 | |
| | |
Specialized Finance—0.2% | | | | | | | | |
California First National Bancorp | | | 100 | | | | 1,510 | |
CBOE Holdings Inc. | | | 2,623 | | | | 136,291 | |
CME Group Inc. | | | 20,910 | | | | 1,640,599 | |
Gain Capital Holdings Inc. | | | 400 | | | | 3,004 | |
IntercontinentalExchange Group Inc. | | | 7,631 | | | | 1,716,364 | |
MarketAxess Holdings Inc. | | | 1,417 | | | | 94,755 | |
Marlin Business Services Corp. | | | 385 | | | | 9,702 | |
McGraw Hill Financial Inc. | | | 17,963 | | | | 1,404,707 | |
Moody’s Corp. | | | 12,556 | | | | 985,269 | |
MSCI Inc. | | | 3,554 | | | | 155,381 | (a) |
NewStar Financial Inc. | | | 949 | | | | 16,864 | (a) |
PHH Corp. | | | 2,181 | | | | 53,107 | (a) |
Resource America Inc. | | | 631 | | | | 5,906 | |
The NASDAQ OMX Group Inc. | | | 7,684 | | | | 305,823 | |
| | | | 6,529,282 | |
| | | | | | | | |
| | |
Specialized REITs—0.4% | | | | | | | | |
American Tower Corp. | | | 26,177 | | | | 2,089,448 | |
Ashford Hospitality Prime Inc. | | | 464 | | | | 8,445 | |
Ashford Hospitality Trust Inc. | | | 2,322 | | | | 19,226 | |
Aviv REIT Inc. | | | 498 | | | | 11,803 | |
Chatham Lodging Trust | | | 929 | | | | 18,998 | |
Chesapeake Lodging Trust | | | 1,765 | | | | 44,637 | |
Corrections Corp of America | | | 3,491 | | | | 111,956 | |
CubeSmart | | | 5,135 | | | | 81,852 | |
DiamondRock Hospitality Co. | | | 7,484 | | | | 86,440 | |
EPR Properties | | | 1,905 | | | | 93,650 | |
Extra Space Storage Inc. | | | 3,303 | | | | 139,155 | |
FelCor Lodging Trust Inc. | | | 5,194 | | | | 42,383 | (a) |
HCP Inc. | | | 30,266 | | | | 1,099,261 | |
Healthcare Realty Trust Inc. | | | 3,545 | | | | 75,544 | |
Healthcare REIT Inc. | | | 19,131 | | | | 1,024,848 | |
Hersha Hospitality Trust | | | 7,534 | | | | 41,964 | |
Hospitality Properties Trust | | | 4,434 | | | | 119,851 | |
Host Hotels & Resorts Inc. | | | 49,918 | | | | 970,406 | |
LaSalle Hotel Properties | | | 3,797 | | | | 117,175 | |
LTC Properties Inc. | | | 1,343 | | | | 47,529 | |
Medical Properties Trust Inc. | | | 5,909 | | | | 72,208 | |
National Health Investors Inc. | | | 969 | | | | 54,361 | |
Omega Healthcare Investors Inc. | | | 3,680 | | | | 109,664 | |
Pebblebrook Hotel Trust | | | 2,286 | | | | 70,317 | |
Physicians Realty Trust | | | 658 | | | | 8,383 | |
Plum Creek Timber Company Inc. | | | 11,752 | | | | 546,586 | |
Potlatch Corp. | | | 2,793 | | | | 116,580 | |
Public Storage | | | 9,587 | | | | 1,443,035 | |
Rayonier Inc. | | | 3,797 | | | | 159,854 | |
RLJ Lodging Trust | | | 4,676 | | | | 113,720 | |
Ryman Hospitality Properties | | | 1,748 | | | | 73,031 | |
Sabra Healthcare REIT Inc. | | | 1,419 | | | | 37,093 | |
Senior Housing Properties Trust | | | 5,670 | | | | 126,044 | |
Sovran Self Storage Inc. | | | 1,243 | | | | 81,006 | |
Strategic Hotels & Resorts Inc. | | | 6,937 | | | | 65,555 | (a) |
Summit Hotel Properties Inc. | | | 2,594 | | | | 23,346 | |
Sunstone Hotel Investors Inc. | | | 6,825 | | | | 91,455 | |
The Geo Group Inc. | | | 2,684 | | | | 86,478 | |
Universal Health Realty Income Trust | | | 394 | | | | 15,784 | |
Ventas Inc. | | | 19,507 | | | | 1,117,361 | |
Weyerhaeuser Co. | | | 38,656 | | | | 1,220,370 | |
| | | | 11,876,802 | |
| | |
Specialty Chemicals—0.3% | | | | | | | | |
A Schulman Inc. | | | 1,102 | | | | 38,857 | |
Advanced Emissions Solutions Inc. | | | 427 | | | | 23,156 | (a) |
Albemarle Corp. | | | 2,449 | | | | 155,242 | |
American Pacific Corp. | | | 219 | | | | 8,160 | (a) |
Ashland Inc. | | | 2,164 | | | | 209,995 | |
Balchem Corp. | | | 1,138 | | | | 66,801 | |
Chase Corp. | | | 268 | | | | 9,460 | |
Chemtura Corp. | | | 3,681 | | | | 102,774 | (a) |
Cytec Industries Inc. | | | 1,064 | | | | 99,122 | |
Ecolab Inc. | | | 17,987 | | | | 1,875,504 | |
Ferro Corp. | | | 2,639 | | | | 33,858 | (a) |
Flotek Industries Inc. | | | 1,790 | | | | 35,925 | (a) |
| | | | | | | | |
FutureFuel Corp. | | | 789 | | | | 12,466 | |
GSE Holding Inc. | | | 366 | | | | 758 | (a) |
HB Fuller Co. | | | 1,880 | | | | 97,835 | |
Innophos Holdings Inc. | | | 835 | | | | 40,581 | |
Innospec Inc. | | | 902 | | | | 41,690 | |
International Flavors & Fragrances Inc. | | | 5,407 | | | | 464,894 | |
KMG Chemicals Inc. | | | 329 | | | | 5,557 | |
Kraton Performance Polymers Inc. | | | 1,197 | | | | 27,591 | (a) |
Landec Corp. | | | 1,137 | | | | 13,780 | (a) |
Minerals Technologies Inc. | | | 2,333 | | | | 140,143 | |
NewMarket Corp. | | | 342 | | | | 114,279 | |
OM Group Inc. | | | 1,212 | | | | 44,129 | (a) |
OMNOVA Solutions Inc. | | | 1,538 | | | | 14,011 | (a) |
PolyOne Corp. | | | 3,729 | | | | 131,820 | |
PPG Industries Inc. | | | 9,421 | | | | 1,786,787 | |
Quaker Chemical Corp. | | | 501 | | | | 38,612 | |
RPM International Inc. | | | 3,999 | | | | 165,998 | |
Sensient Technologies Corp. | | | 3,365 | | | | 163,270 | |
Sigma-Aldrich Corp. | | | 7,938 | | | | 746,251 | |
Stepan Co. | | | 725 | | | | 47,582 | |
Taminco Corp. | | | 650 | | | | 13,137 | (a) |
The Sherwin-Williams Co. | | | 5,713 | | | | 1,048,336 | |
Valspar Corp. | | | 2,426 | | | | 172,950 | |
Zep Inc. | | | 680 | | | | 12,349 | |
Zoltek Companies Inc. | | | 900 | | | | 15,075 | (a) |
| | | | 8,018,735 | |
| | |
Specialty Stores—0.1% | | | | | | | | |
Barnes & Noble Inc. | | | 1,492 | | | | 22,305 | (a) |
Big 5 Sporting Goods Corp. | | | 609 | | | | 12,070 | |
Cabela’s Inc. | | | 1,393 | | | | 92,857 | (a) |
Dick’s Sporting Goods Inc. | | | 3,059 | | | | 177,728 | |
Five Below Inc. | | | 1,260 | | | | 54,432 | (a) |
Hibbett Sports Inc. | | | 1,002 | | | | 67,344 | (a) |
MarineMax Inc. | | | 965 | | | | 15,517 | (a) |
Office Depot Inc. | | | 32,383 | | | | 171,306 | (a) |
Outerwall Inc. | | | 1,047 | | | | 70,432 | (a) |
PetSmart Inc. | | | 6,881 | | | | 500,593 | |
Signet Jewelers Ltd. | | | 2,408 | | | | 189,510 | |
Staples Inc. | | | 43,641 | | | | 693,456 | |
The Container Store Group Inc. | | | 522 | | | | 24,330 | (a) |
Tiffany & Co. | | | 7,260 | | | | 673,583 | |
Tractor Supply Co. | | | 4,191 | | | | 325,138 | |
Vitamin Shoppe Inc. | | | 1,168 | | | | 60,748 | (a) |
West Marine Inc. | | | 577 | | | | 8,211 | (a) |
Winmark Corp. | | | 69 | | | | 6,391 | |
Zale Corp. | | | 1,190 | | | | 18,766 | (a) |
| | | | 3,184,717 | |
| | |
Steel—0.1% | | | | | | | | |
AK Steel Holding Corp. | | | 4,961 | | | | 40,680 | (a) |
Allegheny Technologies Inc. | | | 7,213 | | | | 256,999 | |
AM Castle & Co. | | | 802 | | | | 11,846 | (a) |
Carpenter Technology Corp. | | | 1,599 | | | | 99,458 | |
Cliffs Natural Resources Inc. | | | 10,242 | | | | 268,443 | |
Commercial Metals Co. | | | 7,984 | | | | 162,315 | |
Handy & Harman Ltd. | | | 179 | | | | 4,334 | (a) |
Haynes International Inc. | | | 440 | | | | 24,306 | |
| | | | | | | | |
Nucor Corp. | | | 21,108 | | | | 1,126,745 | |
Olympic Steel Inc. | | | 415 | | | | 12,027 | |
Reliance Steel & Aluminum Co. | | | 2,322 | | | | 176,100 | |
Schnitzer Steel Industries Inc. | | | 891 | | | | 29,109 | |
Steel Dynamics Inc. | | | 6,667 | | | | 130,273 | |
SunCoke Energy Inc. | | | 2,631 | | | | 60,013 | (a) |
United States Steel Corp. | | | 9,508 | | | | 280,486 | |
Universal Stainless & Alloy Products Inc. | | | 307 | | | | 11,070 | (a) |
Worthington Industries Inc. | | | 3,556 | | | | 149,636 | |
| | | | 2,843,840 | |
| | |
Systems Software—1.0% | | | | | | | | |
AVG Technologies N.V. | | | 819 | | | | 14,095 | (a) |
Barracuda Networks Inc. | | | 140 | | | | 5,555 | (a) |
CA Inc. | | | 21,553 | | | | 725,258 | |
CommVault Systems Inc. | | | 3,097 | | | | 231,903 | (a) |
Covisint Corp. | | | 223 | | | | 2,799 | (a) |
Cyan Inc. | | | 512 | | | | 2,708 | (a) |
FleetMatics Group PLC | | | 683 | | | | 29,540 | (a) |
Gigamon Inc. | | | 277 | | | | 7,778 | (a) |
Imperva Inc. | | | 760 | | | | 36,579 | (a) |
Infoblox Inc. | | | 1,998 | | | | 65,974 | (a) |
Mavenir Systems Inc. | | | 220 | | | | 2,455 | (a) |
MICROS Systems Inc. | | | 2,259 | | | | 129,599 | (a) |
Microsoft Corp. | | | 503,892 | | | | 18,860,678 | |
Oracle Corp. | | | 232,772 | | | | 8,905,857 | |
Progress Software Corp. | | | 1,772 | | | | 45,771 | (a) |
Proofpoint Inc. | | | 826 | | | | 27,398 | (a) |
Qualys Inc. | | | 456 | | | | 10,538 | (a) |
Rally Software Development Corp. | | | 257 | | | | 4,999 | (a) |
Red Hat Inc. | | | 12,662 | | | | 709,578 | (a) |
Rovi Corp. | | | 3,096 | | | | 60,960 | (a) |
Symantec Corp. | | | 46,170 | | | | 1,088,689 | |
TeleCommunication Systems Inc. | | | 2,146 | | | | 4,979 | (a) |
VASCO Data Security International Inc. | | | 1,340 | | | | 10,358 | (a) |
| | | | 30,984,048 | |
| | |
Technology Distributors—0.0%* | | | | | | | | |
Agilysys Inc. | | | 705 | | | | 9,814 | (a) |
Anixter International Inc. | | | 1,007 | | | | 90,469 | |
Arrow Electronics Inc. | | | 3,025 | | | | 164,106 | (a) |
Avnet Inc. | | | 4,131 | | | | 182,218 | |
Electro Rent Corp. | | | 836 | | | | 15,483 | |
Ingram Micro Inc. | | | 4,630 | | | | 108,620 | (a) |
Insight Enterprises Inc. | | | 1,630 | | | | 37,017 | (a) |
PC Connection Inc. | | | 379 | | | | 9,418 | |
Richardson Electronics Ltd. | | | 493 | | | | 5,600 | |
ScanSource Inc. | | | 1,030 | | | | 43,703 | (a) |
Speed Commerce Inc. | | | 1,819 | | | | 8,495 | (a) |
SYNNEX Corp. | | | 995 | | | | 67,063 | (a) |
Tech Data Corp. | | | 1,130 | | | | 58,308 | (a) |
| | | | 800,314 | |
| | |
Textiles—0.0%* | | | | | | | | |
Culp Inc. | | | 374 | | | | 7,648 | |
Unifi Inc. | | | 627 | | | | 17,080 | (a) |
| | | | 24,728 | |
| | | | | | | | |
| | |
Thrifts & Mortgage Finance—0.1% | | | | | | | | |
Astoria Financial Corp. | | | 5,892 | | | | 81,486 | |
Bank Mutual Corp. | | | 1,422 | | | | 9,968 | |
BankFinancial Corp. | | | 1,086 | | | | 9,948 | |
BBX Capital Corp. | | | 391 | | | | 6,100 | (a) |
Beneficial Mutual Bancorp Inc. | | | 1,178 | | | | 12,864 | (a) |
Berkshire Hills Bancorp Inc. | | | 907 | | | | 24,734 | |
BofI Holding Inc. | | | 426 | | | | 33,411 | (a) |
Brookline Bancorp Inc. | | | 2,437 | | | | 23,322 | |
Capitol Federal Financial Inc. | | | 5,726 | | | | 69,342 | |
Charter Financial Corp. | | | 897 | | | | 9,661 | |
Clifton Savings Bancorp Inc. | | | 423 | | | | 5,414 | |
Dime Community Bancshares Inc. | | | 1,120 | | | | 18,950 | |
Doral Financial Corp. | | | 281 | | | | 4,401 | (a) |
ESB Financial Corp. | | | 597 | | | | 8,477 | |
ESSA Bancorp Inc. | | | 391 | | | | 4,520 | |
EverBank Financial Corp. | | | 3,006 | | | | 55,130 | |
Federal Agricultural Mortgage Corp. | | | 323 | | | | 11,063 | |
First Defiance Financial Corp. | | | 460 | | | | 11,946 | |
First Federal Bancshares of Arkansas Inc. | | | 222 | | | | 1,931 | (a) |
First Financial Northwest Inc. | | | 676 | | | | 7,010 | |
First Pactrust Bancorp Inc. | | | 518 | | | | 6,946 | |
Flagstar Bancorp Inc. | | | 745 | | | | 14,617 | (a) |
Fox Chase Bancorp Inc. | | | 560 | | | | 9,733 | |
Franklin Financial Corp. | | | 521 | | | | 10,305 | (a) |
Hingham Institution for Savings | | | 15 | | | | 1,177 | |
Home Bancorp Inc. | | | 213 | | | | 4,015 | (a) |
Home Loan Servicing Solutions Ltd. | | | 2,586 | | | | 59,401 | |
HomeStreet Inc. | | | 449 | | | | 8,980 | |
Hudson City Bancorp Inc. | | | 31,263 | | | | 294,810 | |
Kearny Financial Corp. | | | 734 | | | | 8,537 | (a) |
Meridian Interstate Bancorp Inc. | | | 357 | | | | 8,061 | (a) |
Meta Financial Group Inc. | | | 187 | | | | 7,542 | |
MGIC Investment Corp. | | | 12,177 | | | | 102,774 | (a) |
NASB Financial Inc. | | | 217 | | | | 6,553 | |
New York Community Bancorp Inc. | | | 13,247 | | | | 223,212 | |
Northfield Bancorp Inc. | | | 2,369 | | | | 31,271 | |
Northwest Bancshares Inc. | | | 3,609 | | | | 53,341 | |
OceanFirst Financial Corp. | | | 647 | | | | 11,083 | |
Oritani Financial Corp. | | | 1,617 | | | | 25,953 | |
PennyMac Financial Services Inc. | | | 456 | | | | 8,003 | (a) |
People’s United Financial Inc. | | | 21,083 | | | | 318,775 | |
Provident Financial Holdings Inc. | | | 504 | | | | 7,560 | |
Provident Financial Services Inc. | | | 2,226 | | | | 43,006 | |
Radian Group Inc. | | | 6,493 | | | | 91,681 | |
Rockville Financial Inc. | | | 786 | | | | 11,169 | |
Stonegate Mortgage Corp. | | | 285 | | | | 4,711 | (a) |
Territorial Bancorp Inc. | | | 397 | | | | 9,210 | |
Tree.com Inc. | | | 235 | | | | 7,717 | (a) |
TrustCo Bank Corp. | | | 3,382 | | | | 24,283 | |
United Community Financial Corp. | | | 1,244 | | | | 4,441 | (a) |
United Financial Bancorp Inc. | | | 490 | | | | 9,256 | |
Walker & Dunlop Inc. | | | 556 | | | | 8,991 | (a) |
| | | | | | | | |
Washington Federal Inc. | | | 3,052 | | | | 71,081 | |
Waterstone Financial Inc. | | | 267 | | | | 2,964 | (a) |
Westfield Financial Inc. | | | 1,127 | | | | 8,408 | |
WSFS Financial Corp. | | | 293 | | | | 22,716 | |
| | | | 1,951,961 | |
| | |
Tires & Rubber—0.0%* | | | | | | | | |
Cooper Tire & Rubber Co. | | | 2,342 | | | | 56,302 | |
The Goodyear Tire & Rubber Co. | | | 16,516 | | | | 393,906 | |
| | | | 450,208 | |
| | |
Tobacco—0.6% | | | | | | | | |
Alliance One International Inc. | | | 3,110 | | | | 9,485 | (a) |
Altria Group Inc. | | | 132,663 | | | | 5,092,933 | |
Lorillard Inc. | | | 24,435 | | | | 1,238,366 | |
Philip Morris International Inc. | | | 106,273 | | | | 9,259,566 | |
Reynolds American Inc. | | | 20,793 | | | | 1,039,442 | |
Universal Corp. | | | 1,573 | | | | 85,886 | |
Vector Group Ltd. | | | 2,391 | | | | 39,141 | |
| | | | 16,764,819 | |
| | |
Trading Companies & Distributors—0.1% | | | | | | | | |
Aceto Corp. | | | 1,025 | | | | 25,635 | |
Aircastle Ltd. | | | 2,597 | | | | 49,758 | |
Applied Industrial Technologies Inc. | | | 1,586 | | | | 77,857 | |
Beacon Roofing Supply Inc. | | | 1,837 | | | | 73,994 | (a) |
BlueLinx Holdings Inc. | | | 2,106 | | | | 4,107 | (a) |
CAI International Inc. | | | 670 | | | | 15,792 | (a) |
DXP Enterprises Inc. | | | 321 | | | | 36,979 | (a) |
Fastenal Co. | | | 18,109 | | | | 860,359 | |
GATX Corp. | | | 1,382 | | | | 72,099 | |
H&E Equipment Services Inc. | | | 1,128 | | | | 33,423 | (a) |
Houston Wire & Cable Co. | | | 787 | | | | 10,530 | |
Kaman Corp. | | | 1,019 | | | | 40,485 | |
MSC Industrial Direct Co. Inc. | | | 1,454 | | | | 117,585 | |
Rush Enterprises Inc. | | | 1,284 | | | | 38,071 | (a) |
Stock Building Supply Holdings Inc. | | | 220 | | | | 4,008 | (a) |
TAL International Group Inc. | | | 1,318 | | | | 75,587 | (a) |
Textainer Group Holdings Ltd. | | | 806 | | | | 32,417 | |
Titan Machinery Inc. | | | 528 | | | | 9,409 | (a) |
United Rentals Inc. | | | 2,804 | | | | 218,572 | (a) |
Watsco Inc. | | | 1,780 | | | | 170,987 | |
WW Grainger Inc. | | | 4,098 | | | | 1,046,711 | |
| | | | 3,014,365 | |
| | |
Trucking—0.0%* | | | | | | | | |
Arkansas Best Corp. | | | 960 | | | | 32,333 | |
Celadon Group Inc. | | | 645 | | | | 12,565 | |
Con-way Inc. | | | 1,716 | | | | 68,142 | |
Heartland Express Inc. | | | 1,785 | | | | 35,022 | |
JB Hunt Transport Services Inc. | | | 2,760 | | | | 213,348 | |
Knight Transportation Inc. | | | 2,186 | | | | 40,091 | |
Landstar System Inc. | | | 1,367 | | | | 78,534 | |
Marten Transport Ltd. | | | 934 | | | | 18,857 | |
Old Dominion Freight Line Inc. | | | 2,096 | | | | 111,130 | (a) |
Patriot Transportation Holding Inc. | | | 275 | | | | 11,415 | (a) |
Quality Distribution Inc. | | | 813 | | | | 10,431 | (a) |
| | | | | | | | |
Roadrunner Transportation Systems Inc. | | | 651 | | | | 17,544 | (a) |
Ryder System Inc. | | | 3,446 | | | | 254,246 | |
Saia Inc. | | | 904 | | | | 28,973 | (a) |
Swift Transportation Co. | | | 3,150 | | | | 69,962 | (a) |
Universal Truckload Services Inc. | | | 261 | | | | 7,963 | |
Werner Enterprises Inc. | | | 3,187 | | | | 78,815 | |
YRC Worldwide Inc. | | | 373 | | | | 6,479 | (a) |
| | | | 1,095,850 | |
| | |
Water Utilities—0.0%* | | | | | | | | |
American States Water Co. | | | 1,488 | | | | 42,750 | |
Aqua America Inc. | | | 5,321 | | | | 125,522 | |
Artesian Resources Corp. | | | 336 | | | | 7,711 | |
California Water Service Group | | | 1,802 | | | | 41,572 | |
Connecticut Water Service Inc. | | | 360 | | | | 12,784 | |
Consolidated Water Company Ltd. | | | 684 | | | | 9,645 | |
Middlesex Water Co. | | | 660 | | | | 13,821 | |
Pure Cycle Corp. | | | 855 | | | | 5,412 | (a) |
SJW Corp. | | | 676 | | | | 20,138 | |
York Water Co. | | | 498 | | | | 10,423 | |
| | | | 289,778 | |
| | |
Wireless Telecommunication Services—0.1% | | | | | | | | |
Boingo Wireless Inc. | | | 705 | | | | 4,519 | (a) |
Crown Castle International Corp. | | | 22,185 | | | | 1,629,045 | (a) |
Leap Wireless International Inc. | | | 1,991 | | | | 34,643 | (a) |
NII Holdings Inc. | | | 6,369 | | | | 17,515 | (a) |
NTELOS Holdings Corp. | | | 722 | | | | 14,606 | |
RingCentral Inc. | | | 281 | | | | 5,162 | (a) |
Shenandoah Telecommunications Co. | | | 951 | | | | 24,412 | |
Telephone & Data Systems Inc. | | | 2,947 | | | | 75,974 | |
USA Mobility Inc. | | | 587 | | | | 8,382 | |
| | | | | | | 1,814,258 | |
| | |
Total Common Stock | | | | | | | | |
(Cost $932,886,101) | | | | | | | 1,198,500,321 | |
| | |
Rights—0.0%* | | | | | | | | |
(Cost $0) | | | | | | | | |
| | |
Oil & Gas Exploration & Production—0.0%* | | | | | | | | |
EXCO Resources Inc. | | | 5,025 | | | | 804 | (a) |
| | |
Warrant—0.0%* | | | | | | | | |
(Cost $0) | | | | | | | | |
| | |
Oil & Gas Exploration & Production—0.0%* | | | | | | | | |
Magnum Hunter Resources Corp. | | | 694 | | | | — | (h) |
| | |
Total Domestic Equity | | | | | | | | |
(Cost $932,886,101) | | | | | | | 1,198,501,125 | |
| | |
Foreign Equity—24.5% | | | | | | | | |
| | |
Common Stock—24.1% | | | | | | | | |
| | |
Advertising—0.1% | | | | | | | | |
Cheil Worldwide Inc. | | | 3,970 | | | | 103,449 | (a) |
Dentsu Inc. | | | 9,200 | | | | 376,386 | |
Hakuhodo DY Holdings Inc. | | | 8,600 | | | | 66,686 | |
JCDecaux S.A. | | | 2,567 | | | | 106,010 | |
Publicis Groupe S.A. | | | 7,217 | | | | 661,419 | |
REA Group Ltd. | | | 842 | | | | 28,444 | |
WPP PLC | | | 53,125 | | | | 1,214,237 | |
| | | | 2,556,631 | |
| | | | | | | | |
| | |
Aerospace & Defense—0.2% | | | | | | | | |
AviChina Industry & Technology Company Ltd. | | | 76,000 | | | | 44,304 | |
BAE Systems PLC | | | 128,365 | | | | 924,829 | |
Bombardier Inc. | | | 51,880 | | | | 225,098 | |
CAE Inc. | | | 8,733 | | | | 111,043 | |
Cobham PLC | | | 43,606 | | | | 198,251 | |
Embraer S.A. | | | 22,900 | | | | 183,355 | |
European Aeronautic Defence and Space Company N.V. | | | 23,436 | | | | 1,802,307 | |
Finmeccanica S.p.A. | | | 15,038 | | | | 114,072 | (a) |
Korea Aerospace Industries Ltd. | | | 1,660 | | | | 45,615 | |
Meggitt PLC | | | 31,899 | | | | 278,692 | |
Rolls-Royce Holdings PLC | | | 74,717 | | | | 1,577,812 | (a) |
Safran S.A. | | | 9,971 | | | | 693,984 | |
Singapore Technologies Engineering Ltd. | | | 63,000 | | | | 197,592 | |
Thales S.A. | | | 3,301 | | | | 212,875 | |
Zodiac Aerospace | | | 1,247 | | | | 221,232 | |
| | | | 6,831,061 | |
| | |
Agricultural Products—0.0%* | | | | | | | | |
Astra Agro Lestari Tbk PT | | | 15,000 | | | | 30,937 | |
Charoen Pokphand Indonesia Tbk PT | | | 289,500 | | | | 80,284 | |
China Agri-Industries Holdings Ltd. | | | 83,000 | | | | 41,212 | |
Felda Global Ventures Holdings Bhd | | | 47,900 | | | | 65,661 | |
Genting Plantations Bhd | | | 8,500 | | | | 28,649 | |
Golden Agri-Resources Ltd. | | | 324,000 | | | | 139,854 | |
IOI Corp Bhd | | | 127,900 | | | | 183,914 | |
Kernel Holding S.A. | | | 1,837 | | | | 23,177 | (a) |
Kuala Lumpur Kepong Bhd | | | 18,200 | | | | 138,354 | |
Wilmar International Ltd. | | | 76,000 | | | | 205,861 | |
| | | | 937,903 | |
| | |
Air Freight & Logistics—0.1% | | | | | | | | |
Deutsche Post AG | | | 36,503 | | | | 1,332,931 | |
Hyundai Glovis Company Ltd. | | | 540 | | | | 118,198 | |
TNT Express N.V. | | | 14,146 | | | | 131,535 | |
Toll Holdings Ltd. | | | 25,348 | | | | 128,809 | |
Yamato Holdings Company Ltd. | | | 16,000 | | | | 323,638 | |
| | | | | | | 2,035,111 | |
| | |
Airlines—0.1% | | | | | | | | |
Air China Ltd. | | | 70,000 | | | | 52,362 | |
AirAsia Bhd | | | 48,500 | | | | 32,575 | |
ANA Holdings Inc. | | | 46,000 | | | | 91,908 | |
Cathay Pacific Airways Ltd. | | | 54,000 | | | | 114,494 | |
China Airlines Ltd. | | | 104,000 | | | | 38,210 | (a) |
Deutsche Lufthansa AG | | | 9,262 | | | | 196,799 | (a) |
easyJet PLC | | | 5,802 | | | | 147,603 | |
Eva Airways Corp. | | | 65,000 | | | | 36,204 | (a) |
International Consolidated Airlines Group S.A. | | | 37,196 | | | | 248,019 | (a) |
Japan Airlines Company Ltd. | | | 2,500 | | | | 123,448 | (d) |
Korean Air Lines Company Ltd. | | | 1,328 | | | | 39,261 | (a) |
Latam Airlines Group S.A. | | | 11,360 | | | | 177,929 | |
Qantas Airways Ltd. | | | 41,362 | | | | 40,520 | (a) |
Singapore Airlines Ltd. | | | 24,000 | | | | 197,877 | |
Turk Hava Yollari | | | 23,896 | | | | 71,627 | |
| | | | | | | 1,608,836 | |
| | | | | | | | |
| | |
Airport Services—0.0%* | | | | | | | | |
Aeroports de Paris | | | 1,084 | | | | 123,230 | |
Airports of Thailand PCL | | | 16,100 | | | | 77,658 | |
Auckland International Airport Ltd. | | | 35,641 | | | | 103,550 | |
Beijing Capital International Airport Company Ltd. | | | 64,000 | | | | 50,267 | |
Fraport AG Frankfurt Airport Services Worldwide | | | 1,434 | | | | 107,473 | |
Grupo Aeroportuario del Pacifico SAB de C.V. | | | 10,700 | | | | 56,690 | |
Grupo Aeroportuario del Sureste SAB de C.V. | | | 7,500 | | | | 93,473 | |
Malaysia Airports Holdings Bhd | | | 22,300 | | | | 61,273 | |
Sydney Airport | | | 21,887 | | | | 74,409 | |
TAV Havalimanlari Holding AS | | | 6,264 | | | | 45,045 | |
| | | | | | | 793,068 | |
| | |
Alternative Carriers—0.0%* | | | | | | | | |
Iliad S.A. | | | 844 | | | | 173,169 | |
Inmarsat PLC | | | 16,632 | | | | 208,254 | |
Ziggo N.V. | | | 6,053 | | | | 276,912 | |
| | | | | | | 658,335 | |
| | |
Aluminum—0.0%* | | | | | | | | |
Alumina Ltd. | | | 91,959 | | | | 91,732 | (a) |
Aluminum Corp of China Ltd. | | | 152,000 | | | | 52,733 | (a) |
Hindalco Industries Ltd. | | | 39,321 | | | | 77,905 | |
Norsk Hydro ASA | | | 55,454 | | | | 247,433 | |
| | | | | | | 469,803 | |
| | |
Apparel Retail—0.2% | | | | | | | | |
ABC-Mart Inc. | | | 1,000 | | | | 43,718 | |
Belle International Holdings Ltd. | | | 203,000 | | | | 234,843 | |
Cia Hering | | | 5,200 | | | | 65,902 | |
Fast Retailing Company Ltd. | | | 2,100 | | | | 867,133 | |
Hennes & Mauritz AB | | | 37,620 | | | | 1,734,974 | |
Inditex S.A. | | | 8,690 | | | | 1,434,531 | |
Mr Price Group Ltd. | | | 8,676 | | | | 135,635 | |
Shimamura Company Ltd. | | | 800 | | | | 75,049 | |
The Foschini Group Ltd. | | | 7,514 | | | | 68,692 | |
Truworths International Ltd. | | | 16,087 | | | | 117,898 | |
| | | | | | | 4,778,375 | |
| | |
Apparel, Accessories & Luxury Goods—0.3% | | | | | | | | |
Adidas AG | | | 8,514 | | | | 1,086,840 | |
Burberry Group PLC | | | 18,506 | | | | 464,662 | |
Christian Dior S.A. | | | 2,086 | | | | 394,799 | |
Cie Financiere Richemont S.A. | | | 21,015 | | | | 2,098,310 | |
Gildan Activewear Inc. | | | 4,621 | | | | 246,207 | |
Hugo Boss AG | | | 1,300 | | | | 185,403 | |
Kering | | | 3,052 | | | | 646,175 | |
Li & Fung Ltd. | | | 250,000 | | | | 323,070 | |
Luxottica Group S.p.A. | | | 6,436 | | | | 345,427 | |
LVMH Moet Hennessy Louis Vuitton S.A. | | | 10,213 | | | | 1,866,080 | |
Michael Kors Holdings Ltd. | | | 11,896 | | | | 965,836 | (a) |
The Swatch Group AG | | | 1,274 | | | | 844,463 | (††) |
The Swatch Group AG | | | 1,612 | | | | 181,981 | (††) |
| | | | | | | 9,649,253 | |
| | | | | | | | |
| | |
Application Software—0.1% | | | | | | | | |
Dassault Systemes S.A. | | | 2,512 | | | | 312,323 | |
NICE Systems Ltd. | | | 2,227 | | | | 91,236 | |
Open Text Corp. | | | 2,406 | | | | 221,261 | |
SAP AG | | | 36,239 | | | | 3,111,482 | |
Sapiens International Corp N.V. | | | 604 | | | | 4,657 | |
The Sage Group PLC | | | 47,625 | | | | 318,434 | |
| | | | | | | 4,059,393 | |
| | |
Asset Management & Custody Banks—0.1% | | | | | | | | |
3i Group PLC | | | 38,166 | | | | 243,431 | |
Aberdeen Asset Management PLC | | | 41,840 | | | | 346,487 | |
CETIP SA—Mercados Organizados | | | 8,005 | | | | 82,111 | |
CI Financial Corp. | | | 6,077 | | | | 202,185 | |
Hargreaves Lansdown PLC | | | 9,137 | | | | 204,903 | |
IGM Financial Inc. | | | 5,147 | | | | 271,713 | |
Julius Baer Group Ltd. | | | 9,628 | | | | 463,781 | (a) |
Mirae Asset Securities Company Ltd. | | | 1,260 | | | | 45,847 | |
Partners Group Holding AG | | | 704 | | | | 188,319 | |
SBI Holdings Inc. | | | 7,800 | | | | 117,996 | |
Schroders PLC | | | 4,533 | | | | 195,052 | |
| | | | | | | 2,361,825 | |
| | |
Auto Parts & Equipment—0.2% | | | | | | | | |
Aisin Seiki Company Ltd. | | | 8,300 | | | | 337,196 | |
Continental AG | | | 4,474 | | | | 982,693 | |
Denso Corp. | | | 19,300 | | | | 1,019,124 | |
GKN PLC | | | 67,352 | | | | 416,423 | |
Halla Visteon Climate Control Corp. | | | 1,200 | | | | 44,061 | |
Hyundai Mobis | | | 2,063 | | | | 573,734 | |
Hyundai Wia Corp. | | | 628 | | | | 113,062 | |
Koito Manufacturing Company Ltd. | | | 4,000 | | | | 76,381 | |
Magna International Inc. | | | 9,305 | | | | 762,791 | |
NGK Spark Plug Company Ltd. | | | 7,000 | | | | 165,834 | |
NHK Spring Company Ltd. | | | 6,000 | | | | 67,704 | |
NOK Corp. | | | 4,000 | | | | 65,458 | |
Stanley Electric Company Ltd. | | | 5,300 | | | | 121,425 | |
Toyoda Gosei Company Ltd. | | | 2,500 | | | | 58,204 | |
Toyota Boshoku Corp. | | | 2,700 | | | | 33,729 | |
Toyota Industries Corp. | | | 6,800 | | | | 306,988 | |
Valeo S.A. | | | 1,987 | | | | 220,216 | |
| | | | | | | 5,365,023 | |
| | |
Automobile Manufacturers—0.8% | | | | | | | | |
Astra International Tbk PT | | | 847,000 | | | | 473,262 | |
Bayerische Motoren Werke AG | | | 13,370 | | | | 1,570,024 | |
Brilliance China Automotive Holdings Ltd. | | | 122,000 | | | | 198,567 | |
Byd Company Ltd. | | | 19,500 | | | | 95,567 | (a) |
China Motor Corp. | | | 19,000 | | | | 18,392 | |
Daihatsu Motor Company Ltd. | | | 8,000 | | | | 135,636 | |
Daimler AG | | | 38,384 | | | | 3,326,857 | |
Dongfeng Motor Group Company Ltd. | | | 114,000 | | | | 177,607 | |
Fiat S.p.A. | | | 34,881 | | | | 285,742 | (a) |
Ford Otomotiv Sanayi AS | | | 2,547 | | | | 26,910 | |
Fuji Heavy Industries Ltd. | | | 24,000 | | | | 688,454 | |
Geely Automobile Holdings Ltd. | | | 185,000 | | | | 89,234 | |
Great Wall Motor Company Ltd. | | | 41,500 | | | | 228,541 | |
| | | | | | | | |
Guangzhou Automobile Group Company Ltd. | | | 82,000 | | | | 89,575 | |
Honda Motor Company Ltd. | | | 65,100 | | | | 2,681,918 | |
Hyundai Motor Co. | | | 6,239 | | | | 1,398,137 | |
Isuzu Motors Ltd. | | | 48,000 | | | | 298,673 | |
Kia Motors Corp. | | | 10,653 | | | | 566,289 | |
Mahindra & Mahindra Ltd. | | | 11,419 | | | | 173,911 | |
Mazda Motor Corp. | | | 108,000 | | | | 558,984 | (a) |
Mitsubishi Motors Corp. | | | 18,600 | | | | 199,794 | (a) |
Nissan Motor Company Ltd. | | | 98,700 | | | | 830,130 | |
Renault S.A. | | | 7,787 | | | | 627,174 | |
Suzuki Motor Corp. | | | 15,700 | | | | 422,431 | |
Tata Motors Ltd. | | | 31,933 | | | | 194,370 | |
Tofas Turk Otomobil Fabrikasi AS | | | 4,588 | | | | 28,615 | |
Toyota Motor Corp. | | | 105,900 | | | | 6,468,560 | |
UMW Holdings Bhd | | | 21,300 | | | | 78,424 | |
Volkswagen AG | | | 1,127 | | | | 305,776 | |
Yulon Motor Company Ltd. | | | 32,000 | | | | 57,980 | |
| | | | 22,295,534 | |
| | |
Automotive Retail—0.0%* | | | | | | | | |
Hotai Motor Company Ltd. | | | 9,000 | | | | 111,128 | |
USS Company Ltd. | | | 7,800 | | | | 107,161 | |
Zhongsheng Group Holdings Ltd. | | | 21,500 | | | | 29,559 | |
| | | | 247,848 | |
| | |
Biotechnology—0.1% | | | | | | | | |
Actelion Ltd. | | | 4,457 | | | | 377,619 | (a) |
CSL Ltd. | | | 19,126 | | | | 1,179,979 | |
Grifols S.A. | | | 5,817 | | | | 278,660 | |
Novozymes A/S | | | 9,365 | | | | 395,938 | |
Prothena Corporation PLC | | | 535 | | | | 14,188 | (a) |
| | | | 2,246,384 | |
| | |
Brewers—0.3% | | | | | | | | |
AMBEV S.A. | | | 171,600 | | | | 1,259,770 | |
Anadolu Efes Biracilik Ve Malt Sanayii AS | | | 8,317 | | | | 90,002 | |
Anheuser-Busch InBev N.V. | | | 31,771 | | | | 3,382,353 | |
Asahi Group Holdings Ltd. | | | 16,700 | | | | 470,946 | |
Carlsberg A/S | | | 4,221 | | | | 467,779 | |
Cia Cervecerias Unidas S.A. | | | 3,906 | | | | 46,683 | |
Heineken Holding N.V. | | | 4,389 | | | | 278,109 | |
Heineken N.V. | | | 8,737 | | | | 590,881 | |
Hite Jinro Company Ltd. | | | 540 | | | | 11,283 | |
Kirin Holdings Company Ltd. | | | 35,000 | | | | 503,830 | |
SABMiller PLC | | | 38,380 | | | | 1,971,207 | |
Tsingtao Brewery Company Ltd. | | | 14,000 | | | | 118,626 | |
United Breweries Ltd. | | | 2,416 | | | | 30,181 | |
| | | | 9,221,650 | |
| | |
Broadcasting—0.1% | | | | | | | | |
Astro Malaysia Holdings Bhd | | | 30,600 | | | | 28,026 | |
BEC World PCL | | | 35,500 | | | | 54,557 | |
Global Mediacom Tbk PT | | | 224,500 | | | | 35,049 | |
Grupo Televisa SAB | | | 108,800 | | | | 652,942 | |
ITV PLC | | | 153,123 | | | | 492,003 | |
Media Nusantara Citra Tbk PT | | | 154,000 | | | | 33,217 | |
ProSiebenSat.1 Media AG | | | 6,872 | | | | 340,894 | |
RTL Group S.A. | | | 858 | | | | 111,052 | (a) |
Zee Entertainment Enterprises Ltd. | | | 11,076 | | | | 49,520 | |
| | | | 1,797,260 | |
| | | | | | | | |
| | |
Building Products—0.1% | | | | | | | | |
Allegion PLC | | | 5,907 | | | | 261,030 | (a) |
Asahi Glass Company Ltd. | | | 41,000 | | | | 255,116 | |
Assa Abloy AB | | | 13,672 | | | | 723,344 | |
Cie de St-Gobain | | | 16,223 | | | | 893,620 | |
Daikin Industries Ltd. | | | 9,400 | | | | 585,795 | |
Geberit AG | | | 1,593 | | | | 484,519 | |
KCC Corp. | | | 194 | | | | 86,122 | |
LIXIL Group Corp. | | | 10,400 | | | | 285,269 | |
Taiwan Glass Industry Corp. | | | 34,000 | | | | 37,818 | |
TOTO Ltd. | | | 12,000 | | | | 190,324 | |
| | | | 3,802,957 | |
| | |
Cable & Satellite—0.1% | | | | | | | | |
British Sky Broadcasting Group PLC | | | 42,146 | | | | 589,148 | |
Cyfrowy Polsat S.A. | | | 6,693 | | | | 43,918 | (a) |
Eutelsat Communications S.A. | | | 5,802 | | | | 181,204 | |
Kabel Deutschland Holding AG | | | 1,061 | | | | 137,750 | |
Naspers Ltd. | | | 16,333 | | | | 1,709,143 | |
SES S.A. | | | 13,295 | | | | 431,066 | |
Shaw Communications Inc. | | | 15,097 | | | | 367,301 | |
Sky Deutschland AG | | | 15,602 | | | | 171,990 | (a) |
Telenet Group Holding N.V. | | | 1,897 | | | | 113,381 | |
| | | | 3,744,901 | |
| | |
Casinos & Gaming—0.1% | | | | | | | | |
Berjaya Sports Toto Bhd | | | 25,300 | | | | 31,282 | |
Crown Resorts Ltd. | | | 17,620 | | | | 265,619 | |
Echo Entertainment Group Ltd. | | | 27,689 | | | | 60,939 | |
Galaxy Entertainment Group Ltd. | | | 86,000 | | | | 771,407 | (a) |
Genting Bhd | | | 88,600 | | | | 277,526 | |
Genting Malaysia Bhd | | | 109,600 | | | | 146,557 | |
Genting Singapore PLC | | | 251,000 | | | | 297,200 | |
Kangwon Land Inc. | | | 4,050 | | | | 118,773 | |
MGM China Holdings Ltd. | | | 39,200 | | | | 167,594 | |
OPAP S.A. | | | 10,054 | | | | 133,967 | |
Sands China Ltd. | | | 101,600 | | | | 833,372 | |
SJM Holdings Ltd. | | | 82,000 | | | | 273,906 | |
Tabcorp Holdings Ltd. | | | 27,993 | | | | 90,910 | |
Tatts Group Ltd. | | | 55,779 | | | | 154,698 | |
William Hill PLC | | | 36,414 | | | | 242,389 | |
Wynn Macau Ltd. | | | 66,400 | | | | 301,439 | |
| | | | 4,167,578 | |
| | |
Coal & Consumable Fuels—0.1% | | | | | | | | |
Adaro Energy Tbk PT | | | 538,500 | | | | 48,230 | |
Banpu PCL | | | 38,000 | | | | 34,982 | |
Cameco Corp. | | | 14,809 | | | | 307,191 | |
China Coal Energy Company Ltd. | | | 196,000 | | | | 110,212 | |
China Shenhua Energy Company Ltd. | | | 138,500 | | | | 437,627 | |
Coal India Ltd. | | | 18,723 | | | | 87,781 | |
Exxaro Resources Ltd. | | | 4,703 | | | | 65,764 | |
Indo Tambangraya Megah Tbk PT | | | 14,500 | | | | 33,956 | |
Inner Mongolia Yitai Coal Company Ltd. | | | 42,400 | | | | 75,006 | |
Tambang Batubara Bukit Asam Persero Tbk PT | | | 30,000 | | | | 25,144 | |
Yanzhou Coal Mining Company Ltd. | | | 102,000 | | | | 93,137 | |
| | | | 1,319,030 | |
| | | | | | | | |
| | |
Commercial Printing—0.0%* | | | | | | | | |
Dai Nippon Printing Company Ltd. | | | 23,000 | | | | 244,213 | |
Toppan Printing Company Ltd. | | | 21,000 | | | | 168,032 | |
| | | | 412,245 | |
| | |
Commodity Chemicals—0.2% | | | | | | | | |
Arkema S.A. | | | 2,425 | | | | 283,328 | |
Asahi Kasei Corp. | | | 54,000 | | | | 423,348 | |
China Petrochemical Development Corp. | | | 65,000 | | | | 29,661 | |
Formosa Chemicals & Fibre Corp. | | | 128,540 | | | | 362,285 | |
Formosa Plastics Corp. | | | 165,960 | | | | 448,262 | |
Hanwha Chemical Corp. | | | 3,760 | | | | 76,778 | |
Hanwha Corp. | | | 2,100 | | | | 78,003 | |
Hyosung Corp. | | | 1,055 | | | | 70,277 | |
Indorama Ventures PCL | | | 55,500 | | | | 33,780 | |
Kaneka Corp. | | | 11,000 | | | | 72,214 | |
Kumho Petro chemical Company Ltd. | | | 572 | | | | 51,598 | |
Kuraray Company Ltd. | | | 14,900 | | | | 177,629 | |
LCY Chemical Corp. | | | 19,000 | | | | 24,704 | |
LG Chem Ltd. | | | 1,904 | | | | 540,340 | |
Lotte Chemical Corp. | | | 682 | | | | 149,926 | |
Methanex Corp. | | | 3,008 | | | | 177,847 | |
Mexichem SAB de C.V. | | | 41,600 | | | | 172,471 | |
Mitsui Chemicals Inc. | | | 34,000 | | | | 82,165 | |
Nan Ya Plastics Corp. | | | 214,850 | | | | 496,692 | |
Orica Ltd. | | | 15,476 | | | | 330,356 | |
Petronas Chemicals Group Bhd | | | 112,500 | | | | 237,674 | |
PTT Global Chemical PCL | | | 62,900 | | | | 151,220 | |
Sinopec Shanghai Petrochemical Company Ltd. | | | 129,000 | | | | 36,934 | |
Synthos S.A. | | | 17,899 | | | | 32,447 | |
Teijin Ltd. | | | 36,000 | | | | 80,148 | |
Toray Industries Inc. | | | 61,000 | | | | 422,511 | |
TSRC Corp. | | | 21,000 | | | | 31,003 | |
| | | | 5,073,601 | |
| | |
Communications Equipment—0.1% | | | | | | | | |
AAC Technologies Holdings Inc. | | | 30,000 | | | | 145,672 | |
Alcatel-Lucent | | | 104,374 | | | | 468,572 | (a) |
BlackBerry Ltd. | | | 17,699 | | | | 131,597 | (a) |
HTC Corp. | | | 30,000 | | | | 141,930 | |
Nokia Oyj | | | 146,549 | | | | 1,175,274 | (a) |
Telefonaktiebolaget LM Ericsson | | | 115,197 | | | | 1,407,991 | |
ZTE Corp. | | | 24,400 | | | | 48,399 | (a) |
| | | | 3,519,435 | |
| | |
Computer & Electronics Retail—0.0%* | | | | | | | | |
GOME Electrical Appliances Holding Ltd. | | | 395,000 | | | | 72,849 | |
Yamada Denki Company Ltd. | | | 36,800 | | | | 120,443 | |
| | | | 193,292 | |
| | |
Computer Hardware—0.1% | | | | | | | | |
Acer Inc. | | | 94,000 | | | | 57,718 | (a) |
Advantech Company Ltd. | | | 10,000 | | | | 69,287 | |
Asustek Computer Inc. | | | 26,000 | | | | 233,798 | |
Clevo Co. | | | 19,000 | | | | 41,056 | |
Compal Electronics Inc. | | | 158,000 | | | | 121,137 | |
Foxconn Technology Company Ltd. | | | 50,400 | | | | 117,699 | |
| | | | | | | | |
Inventec Corp. | | | 80,000 | | | | 70,730 | |
Lenovo Group Ltd. | | | 272,000 | | | | 330,802 | |
NEC Corp. | | | 98,000 | | | | 220,979 | |
Pegatron Corp. | | | 59,000 | | | | 76,018 | |
Quanta Computer Inc. | | | 112,000 | | | | 261,177 | |
Wistron Corp. | | | 82,950 | | | | 69,720 | |
| | | | | | | 1,670,121 | |
| | |
Computer Storage & Peripherals—0.0%* | | | | | | | | |
Catcher Technology Company Ltd. | | | 28,000 | | | | 181,791 | |
Chicony Electronics Company Ltd. | | | 17,170 | | | | 43,150 | |
Gemalto N.V. | | | 3,114 | | | | 343,318 | |
Lite-On Technology Corp. | | | 83,413 | | | | 133,781 | |
Simplo Technology Company Ltd. | | | 11,000 | | | | 48,719 | |
| | | | | | | 750,759 | |
| | |
Construction & Engineering—0.2% | | | | | | | | |
ACS Actividades de Construccion y Servicios S.A. | | | 5,552 | | | | 191,412 | |
Bouygues S.A. | | | 7,841 | | | | 296,260 | |
China Communications Construction Company Ltd. | | | 166,000 | | | | 133,806 | |
China Railway Construction Corporation Ltd. | | | 73,500 | | | | 73,180 | |
China Railway Group Ltd. | | | 149,000 | | | | 77,058 | |
China State Construction International Holdings Ltd. | | | 66,000 | | | | 118,487 | |
Chiyoda Corp. | | | 6,000 | | | | 87,113 | |
CTCI Corp. | | | 20,000 | | | | 32,412 | |
Daelim Industrial Company Ltd. | | | 1,043 | | | | 92,999 | |
Daewoo Engineering & Construction Company Ltd. | | | 5,220 | | | | 36,454 | (a) |
Doosan Heavy Industries & Construction Company Ltd. | | | 2,060 | | | | 69,099 | |
Ferrovial S.A. | | | 17,553 | | | | 340,192 | |
Gamuda Bhd | | | 63,600 | | | | 93,201 | |
GS Engineering & Construction Corp. | | | 1,527 | | | | 44,131 | |
Hochtief AG | | | 1,172 | | | | 100,224 | |
Hyundai Development Co. | | | 2,530 | | | | 55,618 | |
Hyundai Engineering & Construction Company Ltd. | | | 2,684 | | | | 154,374 | |
IJM Corp. Bhd | | | 41,500 | | | | 74,499 | |
JGC Corp. | | | 8,000 | | | | 313,972 | |
Kajima Corp. | | | 37,000 | | | | 139,051 | |
Kinden Corp. | | | 4,000 | | | | 41,863 | |
Koninklijke Boskalis Westminster N.V. | | | 2,811 | | | | 148,759 | |
Larsen & Toubro Ltd. | | | 13,482 | | | | 233,360 | |
Leighton Holdings Ltd. | | | 6,661 | | | | 96,004 | |
Obayashi Corp. | | | 28,000 | | | | 159,574 | |
OCI N.V. | | | 3,493 | | | | 157,559 | (a) |
Promotora y Operadora de Infraestructura SAB de C.V. | | | 2,000 | | | | 23,975 | (a) |
Samsung Engineering Company Ltd. | | | 1,192 | | | | 74,546 | |
Shimizu Corp. | | | 23,000 | | | | 116,198 | |
Skanska AB | | | 14,837 | | | | 303,550 | |
SNC-Lavalin Group Inc. | | | 6,167 | | | | 277,384 | |
Taisei Corp. | | | 43,000 | | | | 195,557 | |
Vinci S.A. | | | 18,711 | | | | 1,230,356 | |
| | | | | | | 5,582,227 | |
| | |
Construction & Farm Machinery—0.2% | | | | | | | | |
CNH Industrial N.V. | | | 35,038 | | | | 400,005 | (a) |
CSR Corp Ltd. | | | 72,000 | | | | 58,965 | |
Daewoo Shipbuilding & Marine Engineering Company Ltd. | | | 3,870 | | | | 128,346 | |
Hino Motors Ltd. | | | 10,000 | | | | 157,176 | |
| | | | | | | | |
Hitachi Construction Machinery Company Ltd. | | | 4,100 | | | | 87,574 | |
Hyundai Heavy Industries Company Ltd. | | | 1,726 | | | | 420,317 | |
Hyundai Mipo Dockyard | | | 499 | | | | 84,164 | |
Komatsu Ltd. | | | 37,500 | | | | 762,452 | |
Kubota Corp. | | | 43,000 | | | | 711,450 | |
MAN SE | | | 1,514 | | | | 186,195 | |
Samsung Heavy Industries Company Ltd. | | | 6,570 | | | | 236,877 | |
Scania AB | | | 12,441 | | | | 243,877 | |
SembCorp Marine Ltd. | | | 38,000 | | | | 133,930 | |
United Tractors Tbk PT | | | 63,000 | | | | 98,357 | |
Volvo AB | | | 59,028 | | | | 776,152 | |
Weichai Power Company Ltd. | | | 18,000 | | | | 72,894 | |
Yangzijiang Shipbuilding Holdings Ltd. | | | 82,000 | | | | 76,960 | |
Zoomlion Heavy Industry Science and Technology Company Ltd. | | | 51,600 | | | | 48,314 | |
| | | | | | | 4,684,005 | |
| | |
Construction Materials—0.2% | | | | | | | | |
ACC Ltd. | | | 1,972 | | | | 35,319 | |
Ambuja Cements Ltd. | | | 22,724 | | | | 67,046 | |
Anhui Conch Cement Company Ltd. | | | 52,000 | | | | 192,810 | |
Asia Cement Corp. | | | 76,500 | | | | 99,079 | |
BBMG Corp. | | | 42,500 | | | | 36,998 | |
Boral Ltd. | | | 33,016 | | | | 140,895 | |
Cementos Argos S.A. | | | 13,625 | | | | 69,112 | |
Cemex Latam Holdings S.A. | | | 3,034 | | | | 23,242 | (a) |
Cemex SAB de C.V. | | | 472,168 | | | | 551,583 | (a) |
China National Building Material Company Ltd. | | | 126,000 | | | | 136,014 | |
China Resources Cement Holdings Ltd. | | | 80,000 | | | | 53,755 | |
CRH PLC | | | 28,530 | | | | 719,426 | |
Fletcher Building Ltd. | | | 25,315 | | | | 177,310 | |
Grupo Argos S.A. | | | 11,233 | | | | 113,028 | |
HeidelbergCement AG | | | 5,674 | | | | 431,190 | |
Holcim Ltd. | | | 8,250 | | | | 619,202 | (a) |
Imerys S.A. | | | 1,254 | | | | 109,224 | |
Indocement Tunggal Prakarsa Tbk PT | | | 55,500 | | | | 91,208 | |
James Hardie Industries PLC | | | 17,203 | | | | 199,155 | |
Lafarge Malaysia Bhd | | | 13,800 | | | | 36,106 | |
Lafarge S.A. | | | 7,603 | | | | 570,658 | |
PPC Ltd. | | | 18,434 | | | | 55,265 | |
Semen Indonesia Persero Tbk PT | | | 110,500 | | | | 128,478 | |
Siam Cement PCL | | | 12,300 | | | | 151,972 | (††) |
Siam Cement PCL | | | 8,400 | | | | 102,252 | (††) |
Taiheiyo Cement Corp. | | | 47,000 | | | | 180,658 | |
Taiwan Cement Corp. | | | 134,000 | | | | 207,945 | |
Titan Cement Co. S.A. | | | 1,510 | | | | 41,198 | (a) |
Ultratech Cement Ltd. | | | 1,319 | | | | 37,658 | |
| | | | | | | 5,377,786 | |
| | |
Consumer Electronics—0.1% | | | | | | | | |
Casio Computer Company Ltd. | | | 8,300 | | | | 101,633 | |
LG Electronics Inc. | | | 4,419 | | | | 285,151 | |
Panasonic Corp. | | | 88,700 | | | | 1,032,955 | |
Sharp Corp. | | | 42,000 | | | | 133,466 | (a) |
Sony Corp. | | | 40,500 | | | | 703,611 | |
| | | | | | | 2,256,816 | |
| | | | | | | | |
| | |
Consumer Finance—0.0%* | | | | | | | | |
Acom Company Ltd. | | | 16,000 | | | | 54,346 | (a) |
AEON Financial Service Company Ltd. | | | 2,900 | | | | 77,808 | |
Compartamos SAB de C.V. | | | 41,300 | | | | 76,910 | |
Credit Saison Company Ltd. | | | 6,100 | | | | 160,531 | |
Mahindra & Mahindra Financial Services Ltd. | | | 10,172 | | | | 52,607 | |
Samsung Card Company Ltd. | | | 1,450 | | | | 51,386 | |
Shriram Transport Finance Company Ltd. | | | 4,730 | | | | 51,242 | |
| | | | | | | 524,830 | |
| | |
Data Processing & Outsourced Services—0.1% | | | | | | | | |
Amadeus IT Holding S.A. | | | 15,911 | | | | 681,963 | |
Cielo S.A. | | | 14,380 | | | | 400,147 | |
Computershare Ltd. | | | 18,369 | | | | 187,017 | |
EVERTEC Inc. | | | 1,099 | | | | 27,102 | |
Planet Payment Inc. | | | 1,799 | | | | 5,001 | (a) |
| | | | | | | 1,301,230 | |
| | |
Department Stores—0.1% | | | | | | | | |
El Puerto de Liverpool SAB de C.V. | | | 6,900 | | | | 78,972 | |
Far Eastern Department Stores Company Ltd. | | | 38,110 | | | | 37,722 | |
Golden Eagle Retail Group Ltd. | | | 26,000 | | | | 34,337 | |
Hyundai Department Store Company Ltd. | | | 628 | | | | 95,805 | |
Intime Retail Group Co. Ltd. | | | 38,000 | | | | 39,697 | |
Isetan Mitsukoshi Holdings Ltd. | | | 14,800 | | | | 210,513 | |
J Front Retailing Company Ltd. | | | 18,000 | | | | 136,321 | |
Lojas Renner S.A. | | | 5,300 | | | | 137,035 | |
Lotte Shopping Company Ltd. | | | 446 | | | | 170,734 | |
Marks & Spencer Group PLC | | | 67,924 | | | | 486,671 | |
Marui Group Company Ltd. | | | 8,400 | | | | 85,355 | |
Matahari Department Store Tbk PT | | | 50,000 | | | | 45,193 | (a) |
Next PLC | | | 6,528 | | | | 589,254 | |
Parkson Holdings Bhd | | | 22,300 | | | | 18,722 | |
SACI Falabella | | | 27,761 | | | | 249,371 | |
Shinsegae Company Ltd. | | | 309 | | | | 73,930 | |
Takashimaya Company Ltd. | | | 10,000 | | | | 99,615 | |
Woolworths Holdings Ltd. | | | 29,405 | | | | 209,579 | |
| | | | | | | 2,798,826 | |
| | |
Distillers & Vintners—0.2% | | | | | | | | |
Diageo PLC | | | 100,093 | | | | 3,315,578 | |
Pernod-Ricard S.A. | | | 8,703 | | | | 993,082 | |
Remy Cointreau S.A. | | | 964 | | | | 81,016 | |
Treasury Wine Estates Ltd. | | | 23,841 | | | | 102,807 | |
United Spirits Ltd. | | | 3,577 | | | | 150,413 | |
Vina Concha y Toro S.A. | | | 15,626 | | | | 29,144 | |
Yantai Changyu Pioneer Wine Company Ltd. | | | 5,800 | | | | 19,299 | |
| | | | | | | 4,691,339 | |
| | |
Distributors—0.0%* | | | | | | | | |
Imperial Holdings Ltd. | | | 6,577 | | | | 127,229 | |
Jardine Cycle & Carriage Ltd. | | | 4,000 | | | | 113,892 | |
| | | | | | | 241,121 | |
| | |
Diversified Capital Markets—0.2% | | | | | | | | |
China Everbright Ltd. | | | 36,000 | | | | 57,015 | |
Credit Suisse Group AG | | | 60,336 | | | | 1,850,073 | (a) |
| | | | | | | | |
Deutsche Bank AG | | | 39,684 | | | | 1,896,117 | |
Investec Ltd. | | | 9,627 | | | | 68,477 | |
Investec PLC | | | 26,049 | | | | 188,797 | |
UBS AG | | | 142,730 | | | | 2,715,457 | (a) |
| | | | | | | 6,775,936 | |
| | |
Diversified Chemicals—0.2% | | | | | | | | |
Akzo Nobel N.V. | | | 9,682 | | | | 751,649 | |
BASF SE | | | 36,008 | | | | 3,844,837 | |
Cheil Industries Inc. | | | 1,760 | | | | 147,591 | |
Incitec Pivot Ltd. | | | 61,205 | | | | 146,749 | |
Lanxess AG | | | 3,347 | | | | 223,566 | |
Mitsubishi Chemical Holdings Corp. | | | 55,500 | | | | 256,629 | |
Mitsubishi Gas Chemical Company Inc. | | | 14,000 | | | | 103,097 | |
OCI Company Ltd. | | | 643 | | | | 116,372 | |
Showa Denko KK | | | 55,000 | | | | 77,970 | |
Solvay S.A. | | | 2,467 | | | | 390,931 | |
Sumitomo Chemical Company Ltd. | | | 62,000 | | | | 243,033 | |
Ube Industries Ltd. | | | 39,000 | | | | 83,488 | |
| | | | | | | 6,385,912 | |
| | |
Diversified Financial Services—3.7% | | | | | | | | |
African Bank Investments Ltd. | | | 52,786 | | | | 60,730 | |
Agricultural Bank of China Ltd. | | | 875,000 | | | | 429,953 | |
Akbank TAS | | | 73,211 | | | | 228,305 | |
Alior Bank S.A. | | | 980 | | | | 26,460 | (a) |
Alliance Financial Group Bhd | | | 47,100 | | | | 68,446 | |
Alpha Bank AE | | | 50,422 | | | | 43,841 | (a) |
AMMB Holdings Bhd | | | 71,600 | | | | 158,261 | |
Aozora Bank Ltd. | | | 41,000 | | | | 116,246 | |
Australia & New Zealand Banking Group Ltd. | | | 109,358 | | | | 3,153,290 | |
Banca Monte dei Paschi di Siena S.p.A. | | | 249,632 | | | | 60,334 | (a) |
Banco Bilbao Vizcaya Argentaria S.A. | | | 224,790 | | | | 2,771,636 | |
Banco Bradesco S.A. | | | 18,640 | | | | 252,431 | |
Banco de Chile | | | 870,102 | | | | 125,866 | |
Banco de Credito e Inversiones | | | 1,057 | | | | 58,840 | |
Banco de Sabadell S.A. | | | 128,060 | | | | 334,569 | |
Banco do Brasil S.A. | | | 23,500 | | | | 243,043 | |
Banco Espirito Santo S.A. | | | 76,882 | | | | 110,071 | (a) |
Banco Popular Espanol S.A. | | | 52,624 | | | | 317,970 | (a) |
Banco Santander Brasil S.A. | | | 36,800 | | | | 218,063 | |
Banco Santander Chile | | | 2,798,504 | | | | 161,908 | |
Banco Santander S.A. | | | 452,261 | | | | 4,054,493 | |
Bancolombia S.A. | | | 9,289 | | | | 114,526 | |
Bangkok Bank PCL | | | 39,400 | | | | 213,427 | (††) |
Bangkok Bank PCL | | | 25,300 | | | | 137,048 | (††) |
Bank Central Asia Tbk PT | | | 516,500 | | | | 407,428 | |
Bank Danamon Indonesia Tbk PT | | | 138,000 | | | | 42,806 | |
Bank Handlowy w Warszawie S.A. | | | 1,235 | | | | 42,975 | |
Bank Hapoalim BM | | | 44,492 | | | | 249,314 | |
Bank Leumi Le-Israel BM | | | 47,822 | | | | 195,366 | (a) |
Bank Mandiri Persero Tbk PT | | | 411,500 | | | | 265,429 | |
Bank Millennium S.A. | | | 17,468 | | | | 41,681 | (a) |
Bank Negara Indonesia Persero Tbk PT | | | 294,500 | | | | 95,585 | |
Bank of Baroda | | | 1,952 | | | | 20,364 | |
| | | | | | | | |
Bank of China Ltd. | | | 3,081,000 | | | | 1,418,561 | |
Bank of Communications Company Ltd. | | | 367,000 | | | | 258,432 | |
Bank of East Asia Ltd. | | | 52,000 | | | | 220,306 | |
Bank of Ireland | | | 806,173 | | | | 279,938 | (a) |
Bank of Montreal | | | 25,575 | | | | 1,704,438 | |
Bank of Nova Scotia | | | 47,010 | | | | 2,939,176 | |
Bank of the Philippine Islands | | | 25,850 | | | | 49,507 | |
Bank Pekao S.A. | | | 5,497 | | | | 327,002 | |
Bank Rakyat Indonesia Persero Tbk PT | | | 490,500 | | | | 292,204 | |
Bank Zachodni WBK S.A. | | | 987 | | | | 126,783 | |
Bankia S.A. | | | 162,937 | | | | 277,056 | (a) |
Barclays Africa Group Ltd. | | | 16,356 | | | | 206,524 | |
Barclays PLC | | | 600,677 | | | | 2,705,551 | |
BDO Unibank Inc. | | | 56,200 | | | | 86,866 | |
BNP Paribas S.A. | | | 39,265 | | | | 3,065,059 | |
BOC Hong Kong Holdings Ltd. | | | 166,500 | | | | 533,616 | |
CaixaBank S.A. | | | 59,164 | | | | 308,817 | |
Canadian Imperial Bank of Commerce | | | 15,624 | | | | 1,334,032 | |
Chang Hwa Commercial Bank | | | 189,390 | | | | 116,607 | |
China CITIC Bank Corp. Ltd. | | | 336,000 | | | | 182,002 | |
China Construction Bank Corp. | | | 2,940,000 | | | | 2,218,153 | |
China Development Financial Holding Corp. | | | 490,000 | | | | 147,969 | |
China Merchants Bank Company Ltd. | | | 203,731 | | | | 434,066 | |
China Minsheng Banking Corp Ltd. | | | 203,500 | | | | 225,710 | |
CIMB Group Holdings Bhd | | | 185,400 | | | | 431,308 | |
Commercial International Bank Egypt SAE | | | 32,322 | | | | 151,178 | |
Commerzbank AG | | | 38,795 | | | | 625,988 | (a) |
Commonwealth Bank of Australia | | | 62,983 | | | | 4,383,852 | |
Corpbanca S.A. | | | 5,524,790 | | | | 76,208 | |
Credicorp Ltd. | | | 2,686 | | | | 356,513 | |
Credit Agricole S.A. | | | 40,637 | | | | 521,040 | (a) |
CTBC Financial Holding Company Ltd. | | | 496,139 | | | | 338,767 | |
Danske Bank A/S | | | 25,555 | | | | 587,178 | (a) |
DBS Group Holdings Ltd. | | | 65,000 | | | | 880,326 | |
DNB ASA | | | 38,597 | | | | 690,272 | |
E.Sun Financial Holding Company Ltd. | | | 200,200 | | | | 133,003 | |
Erste Group Bank AG | | | 10,566 | | | | 368,790 | |
First Financial Holding Company Ltd. | | | 268,380 | | | | 167,042 | |
FirstRand Ltd. | | | 140,080 | | | | 480,007 | |
Fubon Financial Holding Company Ltd. | | | 274,000 | | | | 400,839 | |
Grupo Financiero Banorte SAB de C.V. | | | 101,100 | | | | 705,075 | |
Grupo Financiero Inbursa SAB de C.V. | | | 94,700 | | | | 267,098 | |
Grupo Financiero Santander Mexico SAB de C.V. | | | 68,900 | | | | 186,334 | |
Hana Financial Group Inc. | | | 10,917 | | | | 454,121 | |
Hang Seng Bank Ltd. | | | 34,000 | | | | 551,630 | |
HDFC Bank Ltd. | | | 61,290 | | | | 661,403 | |
Hong Leong Bank Bhd | | | 22,500 | | | | 98,916 | |
Hong Leong Financial Group Bhd | | | 8,200 | | | | 38,753 | |
HSBC Holdings PLC | | | 734,007 | | | | 8,052,785 | |
Hua Nan Financial Holdings Company Ltd. | | | 212,100 | | | | 123,829 | |
ICICI Bank Ltd. | | | 12,075 | | | | 214,346 | |
Industrial & Commercial Bank of China Ltd. | | | 3,006,000 | | | | 2,031,461 | |
Industrial Bank of Korea | | | 6,050 | | | | 69,652 | |
| | | | | | | | |
ING Groep N.V. | | | 150,460 | | | | 2,093,995 | (a) |
Intesa Sanpaolo S.p.A. | | | 469,355 | | | | 1,160,265 | |
Kasikornbank PCL | | | 48,000 | | | | 231,528 | (††) |
Kasikornbank PCL | | | 30,000 | | | | 142,422 | (††) |
KB Financial Group Inc. | | | 14,430 | | | | 577,692 | |
KBC Groep N.V. | | | 9,441 | | | | 536,630 | |
Komercni Banka AS | | | 621 | | | | 138,207 | |
Kotak Mahindra Bank Ltd. | | | 11,259 | | | | 132,458 | |
Krung Thai Bank PCL | | | 138,400 | | | | 69,495 | |
Lloyds Banking Group PLC | | | 1,841,642 | | | | 2,406,012 | (a) |
Malayan Banking Bhd | | | 171,500 | | | | 520,443 | |
mBank | | | 587 | | | | 97,268 | |
Mega Financial Holding Company Ltd. | | | 355,192 | | | | 299,137 | |
Metropolitan Bank & Trust Co. | | | 15,028 | | | | 25,581 | |
Mitsubishi UFJ Financial Group Inc. | | | 506,400 | | | | 3,343,719 | |
Mizrahi Tefahot Bank Ltd. | | | 4,951 | | | | 64,815 | |
Mizuho Financial Group Inc. | | | 911,400 | | | | 1,977,063 | |
National Australia Bank Ltd. | | | 93,397 | | | | 2,910,311 | |
National Bank of Canada | | | 6,434 | | | | 535,248 | |
National Bank of Greece S.A. | | | 10,574 | | | | 56,096 | (a) |
Natixis | | | 35,140 | | | | 206,952 | |
Nedbank Group Ltd. | | | 7,989 | | | | 160,180 | |
Nordea Bank AB | | | 112,301 | | | | 1,515,100 | |
ORIX Corp. | | | 50,800 | | | | 892,703 | |
OTP Bank PLC | | | 8,571 | | | | 162,998 | |
Oversea-Chinese Banking Corp Ltd. | | | 101,000 | | | | 815,935 | |
Piraeus Bank S.A. | | | 32,900 | | | | 69,362 | (a) |
Pohjola Bank PLC | | | 5,612 | | | | 113,057 | |
Powszechna Kasa Oszczednosci Bank Polski S.A. | | | 35,676 | | | | 466,072 | |
Public Bank Bhd | | | 41,400 | | | | 246,972 | |
Raiffeisen Bank International AG | | | 1,884 | | | | 66,511 | |
Reliance Capital Ltd. | | | 4,115 | | | | 24,019 | |
RHB Capital Bhd | | | 26,700 | | | | 64,396 | |
RMB Holdings Ltd. | | | 26,636 | | | | 122,960 | |
Royal Bank of Canada | | | 56,748 | | | | 3,814,000 | |
Royal Bank of Scotland Group PLC | | | 87,120 | | | | 487,853 | (a) |
Sberbank of Russia ADR | | | 98,468 | | | | 1,237,743 | |
Shinhan Financial Group Company Ltd. | | | 17,140 | | | | 768,202 | |
Siam Commercial Bank PCL | | | 74,000 | | | | 323,159 | |
SinoPac Financial Holdings Company Ltd. | | | 252,636 | | | | 125,879 | |
Skandinaviska Enskilda Banken AB | | | 61,759 | | | | 815,427 | |
Societe Generale S.A. | | | 28,437 | | | | 1,654,380 | |
Standard Bank Group Ltd. | | | 54,687 | | | | 675,746 | |
Standard Chartered PLC | | | 96,721 | | | | 2,178,639 | |
State Bank of India | | | 5,899 | | | | 167,972 | |
Sumitomo Mitsui Financial Group Inc. | | | 50,700 | | | | 2,614,471 | |
Sumitomo Mitsui Trust Holdings Inc. | | | 136,000 | | | | 716,845 | |
Svenska Handelsbanken AB | | | 19,695 | | | | 969,019 | |
Swedbank AB | | | 36,034 | | | | 1,015,501 | |
Taishin Financial Holding Company Ltd. | | | 285,341 | | | | 140,260 | |
Taiwan Business Bank | | | 139,360 | | | | 42,411 | (a) |
Taiwan Cooperative Financial Holding Company Ltd. | | | 212,000 | | | | 115,946 | |
The Toronto-Dominion Bank | | | 35,977 | | | | 3,389,795 | |
TMB Bank PCL | | | 250,000 | | | | 15,673 | |
Turkiye Garanti Bankasi AS | | | 100,688 | | | | 326,176 | |
| | | | | | | | |
Turkiye Halk Bankasi AS | | | 25,730 | | | | 145,506 | |
Turkiye Is Bankasi | | | 68,731 | | | | 148,755 | |
Turkiye Vakiflar Bankasi Tao | | | 28,976 | | | | 51,519 | |
UniCredit S.p.A. | | | 176,368 | | | | 1,307,481 | |
Unione di Banche Italiane SCPA | | | 32,581 | | | | 221,602 | |
United Overseas Bank Ltd. | | | 49,000 | | | | 824,299 | |
VTB Bank OJSC GDR | | | 56,870 | | | | 170,326 | |
Westpac Banking Corp. | | | 123,777 | | | | 3,585,666 | |
Woori Finance Holdings Company Ltd. | | | 14,980 | | | | 188,785 | |
Yapi ve Kredi Bankasi AS | | | 34,531 | | | | 59,788 | |
| | | | 108,871,220 | |
| | |
Diversified Metals & Mining—0.6% | | | | | | | | |
African Rainbow Minerals Ltd. | | | 3,913 | | | | 70,610 | |
Anglo American PLC | | | 55,796 | | | | 1,219,839 | |
Antofagasta PLC | | | 15,969 | | | | 217,937 | |
Assore Ltd. | | | 1,177 | | | | 38,276 | |
BHP Billiton Ltd. | | | 124,620 | | | | 4,235,552 | |
BHP Billiton PLC | | | 83,698 | | | | 2,590,896 | |
Boliden AB | | | 11,175 | | | | 171,298 | |
First Quantum Minerals Ltd. | | | 21,644 | | | | 389,898 | |
Glencore Xstrata PLC | | | 423,420 | | | | 2,192,930 | (a) |
Grupo Mexico SAB de C.V. | | | 162,400 | | | | 534,549 | |
Iluka Resources Ltd. | | | 17,117 | | | | 132,157 | |
Jastrzebska Spolka Weglowa S.A. | | | 1,318 | | | | 23,207 | |
Jiangxi Copper Company Ltd. | | | 61,000 | | | | 110,140 | |
KGHM Polska Miedz S.A. | | | 5,917 | | | | 231,389 | |
Korea Zinc Company Ltd. | | | 341 | | | | 102,751 | |
Minera Frisco SAB de C.V. | | | 25,300 | | | | 52,060 | (a) |
Mitsubishi Materials Corp. | | | 47,000 | | | | 173,503 | |
MMC Norilsk Nickel OJSC ADR | | | 18,922 | | | | 314,484 | |
Rio Tinto Ltd. | | | 17,358 | | | | 1,058,790 | |
Rio Tinto PLC | | | 50,489 | | | | 2,851,104 | |
Shougang Fushan Resources Group Ltd. | | | 120,000 | | | | 41,941 | |
Southern Copper Corp. | | | 6,467 | | | | 185,668 | |
Sumitomo Metal Mining Company Ltd. | | | 22,000 | | | | 288,226 | |
Teck Resources Ltd. | | | 23,453 | | | | 610,330 | |
Turquoise Hill Resources Ltd. | | | 14,556 | | | | 48,086 | (a) |
| | | | 17,885,621 | |
| | |
Diversified Real Estate Activities—0.3% | | | | | | | | |
Ayala Land Inc. | | | 206,700 | | | | 115,267 | |
Brookfield Asset Management Inc. | | | 22,475 | | | | 871,924 | |
CapitaLand Ltd. | | | 97,000 | | | | 232,781 | |
City Developments Ltd. | | | 16,000 | | | | 121,654 | |
Daito Trust Construction Company Ltd. | | | 2,900 | | | | 271,224 | |
Daiwa House Industry Company Ltd. | | | 24,000 | | | | 464,678 | |
DLF Ltd. | | | 15,616 | | | | 42,035 | |
Franshion Properties China Ltd. | | | 114,000 | | | | 39,403 | |
Hang Lung Properties Ltd. | | | 100,000 | | | | 317,266 | |
Henderson Land Development Company Ltd. | | | 44,800 | | | | 255,670 | |
Kerry Properties Ltd. | | | 29,500 | | | | 102,344 | |
Lend Lease Group | | | 22,555 | | | | 224,792 | |
Mitsubishi Estate Company Ltd. | | | 50,000 | | | | 1,496,123 | |
Mitsui Fudosan Company Ltd. | | | 30,000 | | | | 1,080,348 | |
New World Development Company Ltd. | | | 146,000 | | | | 184,907 | |
| | | | | | | | |
Nomura Real Estate Holdings Inc. | | | 5,000 | | | | 112,649 | |
Poly Property Group Company Ltd. | | | 74,000 | | | | 39,416 | |
Sumitomo Realty & Development Company Ltd. | | | 14,000 | | | | 696,637 | |
Sun Hung Kai Properties Ltd. | | | 66,000 | | | | 837,582 | |
Swire Pacific Ltd. | | | 31,500 | | | | 370,301 | |
Tokyo Tatemono Company Ltd. | | | 17,000 | | | | 188,916 | |
Tokyu Fudosan Holdings Corp. | | | 18,000 | | | | 169,545 | (a) |
UOL Group Ltd. | | | 18,000 | | | | 88,246 | |
Wharf Holdings Ltd. | | | 64,000 | | | | 488,641 | |
Wheelock & Company Ltd. | | | 38,000 | | | | 174,715 | |
Yuexiu Property Company Ltd. | | | 186,000 | | | | 45,818 | |
| | | | 9,032,882 | |
| | |
Diversified REITs—0.1% | | | | | | | | |
British Land Co. PLC | | | 39,262 | | | | 409,024 | |
Dexus Property Group | | | 187,091 | | | | 168,218 | |
Fibra Uno Administracion S.A. de C.V. | | | 55,500 | | | | 178,444 | |
Fonciere Des Regions | | | 950 | | | | 82,143 | |
Gecina S.A. | | | 794 | | | | 105,066 | |
GPT Group | | | 73,340 | | | | 223,086 | |
Growthpoint Properties Ltd. | | | 65,849 | | | | 152,650 | |
H&R Real Estate Investment Trust | | | 5,097 | | | | 102,659 | |
ICADE | | | 1,137 | | | | 106,020 | |
Land Securities Group PLC | | | 31,767 | | | | 506,936 | |
Mirvac Group | | | 147,961 | | | | 222,387 | |
Stockland | | | 93,768 | | | | 302,841 | |
United Urban Investment Corp. | | | 89 | | | | 128,117 | |
| | | | 2,687,591 | |
| | |
Diversified Support Services—0.1% | | | | | | | | |
Aggreko PLC | | | 10,619 | | | | 300,574 | |
Babcock International Group PLC | | | 14,013 | | | | 314,482 | |
Brambles Ltd. | | | 66,635 | | | | 545,477 | |
Edenred | | | 7,377 | | | | 247,318 | |
| | | | 1,407,851 | |
| | |
Drug Retail—0.0%* | | | | | | | | |
Raia Drogasil S.A. | | | 7,400 | | | | 46,359 | |
Shoppers Drug Mart Corp. | | | 8,250 | | | | 451,828 | |
| | | | 498,187 | |
| | |
Education Services—0.0%* | | | | | | | | |
Anhanguera Educacional Participacoes S.A. | | | 16,400 | | | | 103,575 | |
Benesse Holdings Inc. | | | 3,000 | | | | 120,594 | |
Estacio Participacoes S.A. | | | 10,000 | | | | 86,510 | |
Kroton Educacional S.A. | | | 7,500 | | | | 124,807 | |
| | | | | | | 435,486 | |
| | |
Electric Utilities—0.3% | | | | | | | | |
Centrais Eletricas Brasileiras S.A. | | | 11,000 | | | | 27,369 | |
CEZ AS | | | 6,598 | | | | 171,720 | |
Cheung Kong Infrastructure Holdings Ltd. | | | 30,000 | | | | 189,973 | |
Chubu Electric Power Company Inc. | | | 26,900 | | | | 347,815 | |
CLP Holdings Ltd. | | | 70,500 | | | | 557,363 | |
Contact Energy Ltd. | | | 14,241 | | | | 60,129 | |
CPFL Energia S.A. | | | 9,200 | | | | 74,442 | |
E.CL S.A. | | | 20,143 | | | | 26,221 | |
| | | | | | | | |
EDP—Energias de Portugal S.A. | | | 83,004 | | | | 305,382 | |
EDP—Energias do Brasil S.A. | | | 9,400 | | | | 45,222 | |
Electricite de France S.A. | | | 9,161 | | | | 324,232 | |
Enea S.A. | | | 3,755 | | | | 16,924 | |
Enel S.p.A. | | | 268,439 | | | | 1,174,048 | |
Enersis S.A. | | | 792,939 | | | | 237,678 | |
Fortis Inc. | | | 8,347 | | | | 239,215 | |
Fortum Oyj | | | 15,290 | | | | 350,375 | |
Hokkaido Electric Power Company Inc. | | | 6,900 | | | | 79,369 | (a) |
Hokuriku Electric Power Co. | | | 6,200 | | | | 84,177 | |
Iberdrola S.A. | | | 182,907 | | | | 1,168,190 | |
Interconexion Electrica S.A. ESP | | | 12,838 | | | | 60,469 | |
Isagen S.A. ESP | | | 25,432 | | | | 42,782 | |
Joint Stock Company Russian Grids GDR | | | 3,694 | | | | 17,805 | (a) |
Korea Electric Power Corp. | | | 10,420 | | | | 343,104 | (a) |
Kyushu Electric Power Co. Inc. | | | 17,100 | | | | 218,336 | (a) |
PGE S.A. | | | 27,532 | | | | 148,543 | |
Power Assets Holdings Ltd. | | | 61,500 | | | | 489,382 | |
Power Grid Corporation of India Ltd. | | | 41,167 | | | | 66,421 | |
Public Power Corp. S.A. | | | 3,690 | | | | 54,914 | |
Red Electrica Corp S.A. | | | 4,028 | | | | 269,193 | |
Reliance Infrastructure Ltd. | | | 4,020 | | | | 27,660 | |
RusHydro JSC ADR | | | 52,229 | | | | 90,147 | |
Shikoku Electric Power Company Inc. | | | 6,300 | | | | 94,406 | (a) |
SP AusNet | | | 62,633 | | | | 69,763 | |
SSE PLC | | | 38,316 | | | | 869,413 | |
Tata Power Company Ltd. | | | 35,700 | | | | 52,579 | |
Tauron Polska Energia S.A. | | | 37,527 | | | | 54,348 | |
Tenaga Nasional Bhd | | | 119,100 | | | | 413,787 | |
Terna Rete Elettrica Nazionale S.p.A. | | | 57,316 | | | | 286,850 | |
The Chugoku Electric Power Company Inc. | | | 11,800 | | | | 183,672 | |
The Kansai Electric Power Co. Inc. | | | 29,400 | | | | 338,182 | (a) |
Tohoku Electric Power Company Inc. | | | 17,000 | | | | 191,342 | (a) |
Tokyo Electric Power Company Inc. | | | 57,700 | | | | 283,820 | (a) |
Transmissora Alianca de Energia Eletrica S.A. | | | 2,300 | | | | 17,743 | |
| | | | | | | 10,164,505 | |
| | |
Electrical Components & Equipment—0.2% | | | | | | | | |
Fuji Electric Company Ltd. | | | 21,000 | | | | 98,302 | |
Legrand S.A. | | | 10,580 | | | | 584,023 | |
LS Corp. | | | 809 | | | | 62,016 | |
LS Industrial Systems Company Ltd. | | | 738 | | | | 45,944 | |
Mabuchi Motor Company Ltd. | | | 900 | | | | 53,518 | |
Murata Manufacturing Company Ltd. | | | 8,100 | | | | 719,794 | |
Nidec Corp. | | | 4,200 | | | | 411,588 | |
OSRAM Licht AG | | | 3,806 | | | | 215,023 | (a) |
Prysmian S.p.A. | | | 7,493 | | | | 193,180 | |
Schneider Electric S.A. | | | 21,332 | | | | 1,863,606 | |
Sumitomo Electric Industries Ltd. | | | 32,100 | | | | 535,687 | |
Teco Electric and Machinery Company Ltd. | | | 64,000 | | | | 73,334 | |
Walsin Lihwa Corp. | | | 120,000 | | | | 38,492 | (a) |
Zhen Ding Technology Holding Ltd. | | | 7,350 | | | | 17,707 | |
Zhuzhou CSR Times Electric Company Ltd. | | | 17,000 | | | | 61,390 | |
| | | | | | | 4,973,604 | |
| | | | | | | | |
| | |
Electronic Components—0.1% | | | | | | | | |
AU Optronics Corp. | | | 413,000 | | | | 131,923 | (a) |
Cheng Uei Precision Industry Company Ltd. | | | 14,000 | | | | 28,091 | |
Delta Electronics Inc. | | | 80,000 | | | | 456,322 | |
Hamamatsu Photonics KK | | | 2,600 | | | | 104,020 | |
Hirose Electric Company Ltd. | | | 1,200 | | | | 171,029 | |
Hoya Corp. | | | 17,200 | | | | 478,173 | |
Ibiden Company Ltd. | | | 4,700 | | | | 87,914 | |
Innolux Corp. | | | 269,000 | | | | 102,443 | (a) |
Kingboard Chemical Holdings Ltd. | | | 27,000 | | | | 70,340 | |
Kyocera Corp. | | | 12,900 | | | | 644,356 | |
Largan Precision Company Ltd. | | | 4,000 | | | | 163,068 | |
LG Display Company Ltd. | | | 8,970 | | | | 215,463 | (a) |
LG Innotek Company Ltd. | | | 512 | | | | 40,607 | (a) |
Nippon Electric Glass Company Ltd. | | | 14,000 | | | | 73,526 | |
Omron Corp. | | | 8,000 | | | | 353,551 | |
Samsung Electro-Mechanics Company Ltd. | | | 2,239 | | | | 154,875 | |
Samsung SDI Company Ltd. | | | 1,338 | | | | 205,388 | |
TDK Corp. | | | 5,100 | | | | 244,555 | |
Unimicron Technology Corp. | | | 46,000 | | | | 34,882 | |
Yaskawa Electric Corp. | | | 8,000 | | | | 126,578 | |
| | | | | | | 3,887,104 | |
| | |
Electronic Equipment & Instruments—0.1% | | | | | | | | |
Citizen Holdings Company Ltd. | | | 9,900 | | | | 83,454 | |
FUJIFILM Holdings Corp. | | | 18,700 | | | | 530,372 | |
Hexagon AB | | | 9,951 | | | | 314,988 | |
Hitachi High-Technologies Corp. | | | 2,400 | | | | 60,305 | |
Hitachi Ltd. | | | 193,000 | | | | 1,461,662 | |
Keyence Corp. | | | 1,800 | | | | 770,658 | |
Shimadzu Corp. | | | 9,000 | | | | 78,350 | |
TPK Holding Company Ltd. | | | 9,000 | | | | 53,148 | |
Yokogawa Electric Corp. | | | 9,000 | | | | 138,290 | |
| | | | | | | 3,491,227 | |
| | |
Electronic Manufacturing Services—0.1% | | | | | | | | |
Fabrinet | | | 1,003 | | | | 20,622 | (a) |
Hon Hai Precision Industry Company Ltd. | | | 443,900 | | | | 1,193,027 | |
TE Connectivity Ltd. | | | 27,221 | | | | 1,500,149 | |
| | | | | | | 2,713,798 | |
| | |
Environmental & Facilities Services—0.0%* | | | | | | | | |
China Everbright International Ltd. | | | 88,000 | | | | 117,352 | |
Park24 Company Ltd. | | | 3,600 | | | | 67,921 | |
Serco Group PLC | | | 21,501 | | | | 177,770 | |
| | | | | | | 363,043 | |
| | |
Fertilizers & Agricultural Chemicals—0.1% | | | | | | | | |
Agrium Inc. | | | 5,511 | | | | 504,004 | |
China BlueChemical Ltd. | | | 68,000 | | | | 42,797 | |
Grupa Azoty S.A. | | | 816 | | | | 16,902 | |
Israel Chemicals Ltd. | | | 18,673 | | | | 155,635 | |
K+S AG | | | 6,950 | | | | 214,280 | |
Potash Corporation of Saskatchewan Inc. | | | 34,748 | | | | 1,145,294 | |
Syngenta AG | | | 3,524 | | | | 1,407,460 | |
| | | | | | | | |
Taiwan Fertilizer Company Ltd. | | | 28,000 | | | | 63,415 | |
The Israel Corp. Ltd. | | | 88 | | | | 46,320 | (a) |
Uralkali OJSC GDR | | | 8,135 | | | | 216,391 | (††) |
Uralkali OJSC GDR | | | 2,205 | | | | 58,653 | (††) |
Yara International ASA | | | 7,293 | | | | 313,750 | |
| | | | | | | 4,184,901 | |
| | |
Food Distributors—0.0%* | | | | | | | | |
Metcash Ltd. | | | 33,592 | | | | 94,968 | |
Olam International Ltd. | | | 62,000 | | | | 75,376 | |
The Spar Group Ltd. | | | 6,247 | | | | 78,456 | |
| | | | | | | 248,800 | |
| | |
Food Retail—0.3% | | | | | | | | |
Alimentation Couche Tard Inc. | | | 5,626 | | | | 422,969 | |
BIM Birlesik Magazalar AS | | | 7,874 | | | | 159,056 | |
Casino Guichard Perrachon S.A. | | | 2,125 | | | | 245,290 | |
China Resources Enterprise Ltd. | | | 48,000 | | | | 159,407 | |
Colruyt S.A. | | | 2,817 | | | | 157,519 | |
CP ALL PCL | | | 186,600 | | | | 238,503 | |
Delhaize Group S.A. | | | 3,869 | | | | 230,312 | |
Empire Company Ltd. | | | 1,327 | | | | 90,648 | |
Eurocash S.A. | | | 2,510 | | | | 39,670 | |
FamilyMart Company Ltd. | | | 2,200 | | | | 100,576 | |
George Weston Ltd. | | | 2,454 | | | | 178,998 | |
Grupo Comercial Chedraui S.A. de C.V. | | | 5,400 | | | | 18,958 | |
J Sainsbury PLC | | | 49,855 | | | | 301,389 | |
Jeronimo Martins SGPS S.A. | | | 11,184 | | | | 219,067 | |
Koninklijke Ahold N.V. | | | 40,488 | | | | 728,065 | |
Lawson Inc. | | | 2,600 | | | | 194,681 | |
Loblaw Companies Ltd. | | | 5,079 | | | | 202,586 | |
Magnit OJSC GDR | | | 11,929 | | | | 789,700 | |
Metro Inc. | | | 4,289 | | | | 261,982 | |
Pick n Pay Stores Ltd. | | | 9,438 | | | | 46,858 | |
President Chain Store Corp. | | | 21,000 | | | | 145,503 | |
Seven & I Holdings Company Ltd. | | | 30,200 | | | | 1,201,046 | |
Shoprite Holdings Ltd. | | | 16,646 | | | | 260,646 | |
Tesco PLC | | | 292,546 | | | | 1,620,023 | |
WM Morrison Supermarkets PLC | | | 91,077 | | | | 393,708 | |
Woolworths Ltd. | | | 49,386 | | | | 1,495,600 | |
| | | | 9,902,760 | |
| | |
Footwear—0.0%* | | | | | | | | |
Anta Sports Products Ltd. | | | 34,000 | | | | 42,183 | |
Asics Corp. | | | 6,600 | | | | 112,716 | |
Pou Chen Corp. | | | 80,000 | | | | 119,583 | |
Yue Yuen Industrial Holdings Ltd. | | | 31,000 | | | | 103,550 | |
| | | | 378,032 | |
| | |
Forest Products—0.0%* | | | | | | | | |
Duratex S.A. | | | 10,340 | | | | 57,633 | |
| | |
Gas Utilities—0.1% | | | | | | | | |
APA Group | | | 33,483 | | | | 179,733 | |
China Gas Holdings Ltd. | | | 94,000 | | | | 138,204 | |
China Resources Gas Group Ltd. | | | 34,000 | | | | 117,737 | |
Enagas S.A. | | | 7,111 | | | | 186,124 | |
| | | | | | | | |
ENN Energy Holdings Ltd. | | | 32,000 | | | | 237,098 | |
GAIL India Ltd. | | | 14,061 | | | | 78,040 | |
Gas Natural SDG S.A. | | | 14,558 | | | | 375,025 | |
Hong Kong & China Gas Company Ltd. | | | 255,700 | | | | 587,661 | |
Korea Gas Corp. | | | 1,143 | | | | 72,131 | |
Osaka Gas Company Ltd. | | | 74,000 | | | | 290,776 | |
Perusahaan Gas Negara Persero Tbk PT | | | 436,000 | | | | 160,320 | |
Petronas Gas Bhd | | | 24,000 | | | | 177,903 | |
Snam S.p.A. | | | 85,327 | | | | 478,065 | |
Toho Gas Company Ltd. | | | 15,000 | | | | 73,070 | |
Tokyo Gas Company Ltd. | | | 99,000 | | | | 487,912 | |
| | | | 3,639,799 | |
| | |
General Merchandise Stores—0.0%* | | | | | | | | |
Canadian Tire Corp Ltd. | | | 3,488 | | | | 326,608 | |
Dollarama Inc. | | | 3,135 | | | | 260,271 | |
Don Quijote Holdings Company Ltd. | | | 2,000 | | | | 121,212 | |
Harvey Norman Holdings Ltd. | | | 20,526 | | | | 58,029 | |
Lojas Americanas S.A. | | | 3,900 | | | | 22,598 | |
| | | | 788,718 | |
| | |
Gold—0.1% | | | | | | | | |
Agnico-Eagle Mines Ltd. | | | 7,434 | | | | 196,118 | |
AngloGold Ashanti Ltd. | | | 14,863 | | | | 174,432 | |
Barrick Gold Corp. | | | 42,773 | | | | 753,207 | |
Cia de Minas Buenaventura S.A. ADR | | | 8,589 | | | | 96,369 | |
Eldorado Gold Corp. | | | 25,001 | | | | 141,888 | |
Franco-Nevada Corp. | | | 6,022 | | | | 245,358 | |
Gold Fields Ltd. | | | 31,089 | | | | 97,627 | |
Goldcorp Inc. | | | 33,407 | | | | 724,421 | |
Harmony Gold Mining Company Ltd. | | | 14,498 | | | | 35,851 | |
Kinross Gold Corp. | | | 42,336 | | | | 185,282 | |
Koza Altin Isletmeleri AS | | | 2,504 | | | | 25,873 | |
New Gold Inc. | | | 16,844 | | | | 88,144 | (a) |
Newcrest Mining Ltd. | | | 30,646 | | | | 213,856 | |
Randgold Resources Ltd. | | | 3,419 | | | | 214,617 | |
Yamana Gold Inc. | | | 28,763 | | | | 247,971 | |
Zijin Mining Group Company Ltd. | | | 230,000 | | | | 48,944 | |
| | | | 3,489,958 | |
| | |
Healthcare Distributors—0.0%* | | | | | | | | |
Alfresa Holdings Corp. | | | 1,600 | | | | 79,463 | |
Celesio AG | | | 3,289 | | | | 104,238 | |
Medipal Holdings Corp. | | | 5,400 | | | | 71,312 | |
Shanghai Pharmaceuticals Holding Company Ltd. | | | 22,700 | | | | 55,508 | |
Sinopharm Group Company Ltd. | | | 41,600 | | | | 119,106 | |
Suzuken Company Ltd. | | | 2,600 | | | | 84,230 | |
| | | | 513,857 | |
| | |
Healthcare Equipment—0.1% | | | | | | | | |
Cochlear Ltd. | | | 2,383 | | | | 125,615 | |
Elekta AB | | | 14,831 | | | | 227,109 | |
Getinge AB | | | 7,959 | | | | 272,628 | |
Olympus Corp. | | | 10,000 | | | | 316,826 | (a) |
Oxford Immunotec Global PLC | | | 232 | | | | 4,496 | (a) |
Smith & Nephew PLC | | | 37,958 | | | | 541,293 | |
| | | | | | | | |
Sonova Holding AG | | | 1,968 | | | | 265,542 | (a) |
Sysmex Corp. | | | 3,100 | | | | 183,160 | |
Terumo Corp. | | | 6,200 | | | | 299,072 | |
William Demant Holding A/S | | | 1,227 | | | | 119,434 | (a) |
| | | | 2,355,175 | |
| | |
Healthcare Facilities—0.0%* | | | | | | | | |
Apollo Hospitals Enterprise Ltd. | | | 2,610 | | | | 39,913 | |
Bangkok Dusit Medical Services PCL | | | 10,900 | | | | 38,976 | |
IHH Healthcare Bhd | | | 95,100 | | | | 112,070 | (a) |
Life Healthcare Group Holdings Ltd. | | | 36,982 | | | | 147,804 | |
Mediclinic International Ltd. | | | 14,711 | | | | 106,747 | |
Netcare Ltd. | | | 33,031 | | | | 82,059 | |
Ramsay Healthcare Ltd. | | | 4,955 | | | | 191,771 | |
| | | | 719,340 | |
| | |
Healthcare Services—0.1% | | | | | | | | |
Catamaran Corp. | | | 8,665 | | | | 411,435 | (a) |
Fresenius Medical Care AG & Company KGaA | | | 8,305 | | | | 591,991 | |
Fresenius SE & Company KGaA | | | 4,960 | | | | 762,745 | |
Miraca Holdings Inc. | | | 2,100 | | | | 99,101 | |
Sonic Healthcare Ltd. | | | 15,192 | | | | 225,347 | |
| | | | 2,090,619 | |
| | |
Healthcare Supplies—0.0%* | | | | | | | | |
Coloplast A/S | | | 4,405 | | | | 292,088 | |
Essilor International S.A. | | | 8,314 | | | | 885,341 | |
Shandong Weigao Group Medical Polymer Company Ltd. | | | 60,000 | | | | 80,941 | |
Unilife Corp. | | | 4,035 | | | | 17,754 | (a) |
| | | | 1,276,124 | |
| | |
Healthcare Technology—0.0%* | | | | | | | | |
M3 Inc. | | | 24 | | | | 60,168 | |
| | |
Heavy Electrical Equipment—0.1% | | | | | | | | |
ABB Ltd. | | | 88,003 | | | | 2,323,394 | (a) |
Alstom S.A. | | | 9,100 | | | | 331,979 | |
Bharat Heavy Electricals Ltd. | | | 22,240 | | | | 63,353 | |
Mitsubishi Electric Corp. | | | 79,000 | | | | 992,151 | |
Shanghai Electric Group Company Ltd. | | | 108,000 | | | | 39,000 | |
| | | | 3,749,877 | |
| | |
Highways & Railtracks—0.1% | | | | | | | | |
Abertis Infraestructuras S.A. | | | 16,824 | | | | 374,399 | |
Atlantia S.p.A. | | | 13,697 | | | | 307,831 | |
BTS Group Holdings PCL | | | 100,000 | | | | 26,476 | |
CCR S.A. | | | 36,100 | | | | 271,907 | |
EcoRodovias Infraestrutura e Logistica S.A. | | | 6,200 | | | | 38,894 | |
Groupe Eurotunnel S.A. | | | 21,236 | | | | 223,563 | |
Jasa Marga Persero Tbk PT | | | 81,500 | | | | 31,643 | |
Jiangsu Expressway Company Ltd. | | | 44,000 | | | | 54,250 | |
OHL Mexico SAB de C.V. | | | 24,300 | | | | 61,728 | (a) |
Transurban Group | | | 58,607 | | | | 358,640 | |
Zhejiang Expressway Company Ltd. | | | 52,000 | | | | 49,292 | |
| | | | 1,798,623 | |
| | | | | | | | |
| | |
Home Building—0.0%* | | | | | | | | |
Cyrela Brazil Realty S.A. Empreendimentos e Participacoes | | | 11,000 | | | | 67,140 | |
Iida Group Holdings Co. Ltd. | | | 1,700 | | | | 33,998 | (a) |
MRV Engenharia e Participacoes S.A. | | | 11,800 | | | | 42,164 | |
Persimmon PLC | | | 12,340 | | | | 253,228 | (a) |
Sekisui Chemical Company Ltd. | | | 16,000 | | | | 196,375 | |
Sekisui House Ltd. | | | 23,000 | | | | 321,678 | |
| | | | 914,583 | |
| | |
Home Entertainment Software—0.0%* | | | | | | | | |
GungHo Online Entertainment Inc. | | | 14,400 | | | | 103,713 | (a) |
Konami Corp. | | | 3,800 | | | | 87,819 | |
NCSoft Corp. | | | 620 | | | | 145,990 | |
Nexon Company Ltd. | | | 4,000 | | | | 36,992 | |
NHN Entertainment Corp. | | | 483 | | | | 44,119 | (a) |
Nintendo Company Ltd. | | | 3,500 | | | | 466,533 | |
| | | | | | | 885,166 | |
| | |
Home Furnishing Retail—0.0%* | | | | | | | | |
Nitori Holdings Company Ltd. | | | 1,300 | | | | 123,315 | |
| | |
Home Furnishings—0.0%* | | | | | | | | |
Steinhoff International Holdings Ltd. | | | 44,630 | | | | 192,305 | |
| | |
Home Improvement Retail—0.0%* | | | | | | | | |
Home Product Center PCL | | | 78,283 | | | | 22,275 | |
Kingfisher PLC | | | 98,992 | | | | 630,736 | |
| | | | | | | 653,011 | |
| | |
Hotels, Resorts & Cruise Lines—0.1% | | | | | | | | |
Accor S.A. | | | 6,094 | | | | 288,025 | |
Carnival PLC | | | 7,452 | | | | 308,683 | |
Flight Centre Travel Group Ltd. | | | 2,032 | | | | 86,442 | |
Formosa International Hotels Corp. | | | 1,100 | | | | 12,549 | |
InterContinental Hotels Group PLC | | | 10,767 | | | | 358,975 | |
Minor International PCL | | | 44,400 | | | | 27,969 | |
Shangri-La Asia Ltd. | | | 64,000 | | | | 124,967 | |
TUI Travel PLC | | | 16,273 | | | | 111,339 | |
| | | | | | | 1,318,949 | |
| | |
Household Appliances—0.0%* | | | | | | | | |
Arcelik AS | | | 8,562 | | | | 48,419 | |
Coway Company Ltd. | | | 2,160 | | | | 135,902 | |
Electrolux AB | | | 9,443 | | | | 247,742 | |
Haier Electronics Group Company Ltd. | | | 31,000 | | | | 90,156 | |
Husqvarna AB | | | 14,820 | | | | 89,346 | |
Rinnai Corp. | | | 1,200 | | | | 93,506 | |
| | | | | | | 705,071 | |
| | |
Household Products—0.1% | | | | | | | | |
Henkel AG & Company KGaA | | | 4,992 | | | | 520,307 | |
Hindustan Unilever Ltd. | | | 14,991 | | | | 138,580 | |
Kimberly-Clark de Mexico SAB de C.V. | | | 58,300 | | | | 165,279 | |
LG Household & Healthcare Ltd. | | | 359 | | | | 186,414 | |
Reckitt Benckiser Group PLC | | | 25,919 | | | | 2,057,554 | |
Svenska Cellulosa AB SCA | | | 24,122 | | | | 743,648 | |
Unicharm Corp. | | | 5,100 | | | | 291,137 | |
Unilever Indonesia Tbk PT | | | 56,500 | | | | 120,707 | |
| | | | | | | 4,223,626 | |
| | | | | | | | |
| | |
Human Resource & Employment Services—0.1% | | | | | | | | |
Adecco S.A. | | | 5,530 | | | | 438,992 | (a) |
Capita PLC | | | 27,721 | | | | 476,576 | |
Randstad Holding N.V. | | | 4,968 | | | | 322,773 | |
Seek Ltd. | | | 13,036 | | | | 156,396 | |
| | | | | | | 1,394,737 | |
| | |
Hypermarkets & Super Centers—0.2% | | | | | | | | |
Aeon Company Ltd. | | | 24,500 | | | | 332,168 | |
Almacenes Exito S.A. | | | 7,211 | | | | 111,972 | |
Carrefour S.A. | | | 24,431 | | | | 969,880 | |
Cencosud S.A. | | | 43,221 | | | | 155,462 | |
Controladora Comercial Mexicana SAB de C.V. | | | 13,600 | | | | 58,877 | |
Distribuidora Internacional de Alimentacion S.A. | | | 22,662 | | | | 202,976 | |
E-Mart Company Ltd. | | | 840 | | | | 212,119 | |
Massmart Holdings Ltd. | | | 3,853 | | | | 47,823 | |
Metro AG | | | 5,385 | | | | 261,193 | |
Sun Art Retail Group Ltd. | | | 88,500 | | | | 124,411 | |
Wal-Mart de Mexico SAB de C.V. | | | 226,600 | | | | 593,095 | |
Wesfarmers Ltd. | | | 39,604 | | | | 1,560,412 | |
Wumart Stores Inc. | | | 18,000 | | | | 29,436 | |
| | | | | | | 4,659,824 | |
| | |
Independent Power Producers & Energy Traders—0.1% | | | | | | | | |
Aboitiz Power Corp. | | | 66,300 | | | | 50,790 | |
AES Gener S.A. | | | 79,585 | | | | 43,904 | |
China Longyuan Power Group Corp. | | | 101,000 | | | | 129,999 | |
China Resources Power Holdings Company Ltd. | | | 82,000 | | | | 194,378 | |
Colbun S.A. | | | 260,471 | | | | 59,287 | |
Datang International Power Generation Company Ltd. | | | 112,000 | | | | 51,567 | |
Electric Power Development Company Ltd. | | | 4,300 | | | | 125,394 | |
Empresa Nacional de Electricidad S.A. | | | 137,870 | | | | 207,284 | |
Enel Green Power S.p.A. | | | 65,696 | | | | 165,753 | |
Energy Development Corp. | | | 270,200 | | | | 32,449 | |
Glow Energy PCL | | | 17,700 | | | | 37,975 | |
Huaneng Power International Inc. | | | 126,000 | | | | 113,751 | |
NTPC Ltd. | | | 44,321 | | | | 98,057 | |
Reliance Power Ltd. | | | 22,142 | | | | 26,150 | (a) |
Tractebel Energia S.A. | | | 6,100 | | | | 92,925 | |
TransAlta Corp. | | | 9,219 | | | | 116,962 | |
| | | | | | | 1,546,625 | |
| | |
Industrial Conglomerates—0.4% | | | | | | | | |
Aboitiz Equity Ventures Inc. | | | 66,580 | | | | 81,833 | |
Aditya Birla Nuvo Ltd. | | | 1,222 | | | | 24,501 | |
Alfa SAB de C.V. | | | 119,800 | | | | 336,611 | |
Alliance Global Group Inc. | | | 117,400 | | | | 68,246 | |
Beijing Enterprises Holdings Ltd. | | | 19,500 | | | | 192,642 | |
Bidvest Group Ltd. | | | 11,326 | | | | 290,186 | |
CITIC Pacific Ltd. | | | 50,000 | | | | 76,479 | |
CJ Corp. | | | 632 | | | | 69,766 | |
DMCI Holdings Inc. | | | 28,000 | | | | 35,329 | |
Doosan Corp. | | | 378 | | | | 49,965 | |
Enka Insaat ve Sanayi AS | | | 15,599 | | | | 43,708 | |
Far Eastern New Century Corp. | | | 115,260 | | | | 133,036 | |
Grupo Carso SAB de C.V. | | | 22,000 | | | | 115,752 | |
| | | | | | | | |
Hopewell Holdings Ltd. | | | 24,000 | | | | 81,406 | |
Hutchison Whampoa Ltd. | | | 88,000 | | | | 1,197,356 | |
Jaiprakash Associates Ltd. | | | 36,106 | | | | 31,784 | |
Keppel Corp. Ltd. | | | 53,000 | | | | 469,721 | |
KOC Holding AS | | | 23,474 | | | | 96,147 | |
Koninklijke Philips N.V. | | | 38,195 | | | | 1,402,347 | |
LG Corp. | | | 3,743 | | | | 226,988 | |
MMC Corp Bhd | | | 22,700 | | | | 19,959 | |
NWS Holdings Ltd. | | | 61,395 | | | | 93,592 | |
Reunert Ltd. | | | 6,013 | | | | 39,326 | |
Samsung Techwin Company Ltd. | | | 1,650 | | | | 85,052 | |
Sembcorp Industries Ltd. | | | 42,000 | | | | 182,623 | |
Shanghai Industrial Holdings Ltd. | | | 20,000 | | | | 73,255 | |
Siemens AG | | | 31,064 | | | | 4,250,071 | |
Siemens Ltd. | | | 2,575 | | | | 27,517 | |
Sime Darby Bhd | | | 118,700 | | | | 344,993 | |
SK Holdings Company Ltd. | | | 1,018 | | | | 184,240 | |
SM Investments Corp. | | | 10,194 | | | | 163,306 | |
Smiths Group PLC | | | 15,368 | | | | 376,708 | |
Toshiba Corp. | | | 163,000 | | | | 685,467 | |
Turkiye Sise ve Cam Fabrikalari AS | | | 17,815 | | | | 22,554 | |
| | | | | | | 11,572,466 | |
| | |
Industrial Gases—0.1% | | | | | | | | |
Air Liquide S.A. | | | 12,444 | | | | 1,762,733 | |
Air Water Inc. | | | 6,000 | | | | 81,290 | |
Linde AG | | | 7,352 | | | | 1,540,371 | |
Taiyo Nippon Sanso Corp. | | | 9,000 | | | | 64,050 | |
Yingde Gases Group Company Ltd. | | | 34,000 | | | | 35,562 | |
| | | | | | | 3,484,006 | |
| | |
Industrial Machinery—0.4% | | | | | | | | |
Alfa Laval AB | | | 12,518 | | | | 321,594 | |
Amada Company Ltd. | | | 13,000 | | | | 114,657 | |
Andritz AG | | | 3,315 | | | | 208,251 | |
Atlas Copco AB | | | 31,037 | | | | 861,629 | (††) |
Atlas Copco AB | | | 10,739 | | | | 272,881 | (††) |
China International Marine Containers Group Company Ltd. | | | 23,400 | | | | 49,675 | |
Doosan Infracore Company Ltd. | | | 4,510 | | | | 53,846 | (a) |
FANUC Corp. | | | 7,100 | | | | 1,300,366 | |
GEA Group AG | | | 7,004 | | | | 333,930 | |
Hiwin Technologies Corp. | | | 7,210 | | | | 60,842 | |
IHI Corp. | | | 53,000 | | | | 228,933 | |
IMI PLC | | | 12,527 | | | | 316,404 | |
Invensys PLC | | | 26,221 | | | | 220,834 | |
JTEKT Corp. | | | 8,400 | | | | 143,057 | |
Kawasaki Heavy Industries Ltd. | | | 60,000 | | | | 251,748 | |
Kone Oyj | | | 12,164 | | | | 549,773 | |
Kurita Water Industries Ltd. | | | 4,400 | | | | 91,345 | |
Makita Corp. | | | 4,600 | | | | 241,587 | |
Melrose Industries PLC | | | 48,690 | | | | 246,525 | |
Metso Oyj | | | 5,381 | | | | 230,005 | |
Mitsubishi Heavy Industries Ltd. | | | 122,000 | | | | 755,644 | |
Nabtesco Corp. | | | 4,600 | | | | 106,132 | |
NGK Insulators Ltd. | | | 10,000 | | | | 190,096 | |
| | | | | | | | |
NSK Ltd. | | | 19,000 | | | | 236,449 | |
Sandvik AB | | | 42,617 | | | | 601,838 | |
Schindler Holding AG | | | 1,798 | | | | 265,449 | (††) |
Schindler Holding AG | | | 1,044 | | | | 154,484 | (††) |
SKF AB | | | 15,703 | | | | 412,465 | |
SMC Corp. | | | 2,200 | | | | 554,683 | |
Sulzer AG | | | 1,015 | | | | 164,231 | |
Sumitomo Heavy Industries Ltd. | | | 21,000 | | | | 96,703 | |
The Japan Steel Works Ltd. | | | 12,000 | | | | 67,133 | |
The Weir Group PLC | | | 8,910 | | | | 314,623 | |
THK Company Ltd. | | | 4,600 | | | | 114,841 | |
Vallourec S.A. | | | 4,128 | | | | 225,252 | |
Wartsila Oyj Abp | | | 7,536 | | | | 371,444 | |
WEG S.A. | | | 7,900 | | | | 104,340 | |
Zardoya Otis S.A. | | | 6,283 | | | | 113,848 | |
| | | | | | | 10,947,537 | |
| | |
Industrial REITs—0.0%* | | | | | | | | |
Ascendas Real Estate Investment Trust | | | 84,000 | | | | 146,365 | |
Goodman Group | | | 70,089 | | | | 296,595 | |
Nippon Prologis REIT Inc. | | | 7 | | | | 67,000 | |
Segro PLC | | | 27,782 | | | | 153,686 | |
| | | | | | | 663,646 | |
| | |
Integrated Oil & Gas—1.4% | | | | | | | | |
BG Group PLC | | | 133,748 | | | | 2,874,222 | |
BP PLC | | | 737,808 | | | | 5,963,940 | |
Cenovus Energy Inc. | | | 31,166 | | | | 891,714 | |
China Petroleum & Chemical Corp. | | | 1,041,400 | | | | 850,177 | |
Ecopetrol S.A. | | | 211,335 | | | | 404,731 | |
Eni S.p.A. | | | 102,590 | | | | 2,472,454 | |
Galp Energia SGPS S.A. | | | 14,320 | | | | 235,110 | |
Gazprom OAO ADR | | | 206,282 | | | | 1,784,339 | |
Husky Energy Inc. | | | 13,955 | | | | 442,620 | |
Imperial Oil Ltd. | | | 11,801 | | | | 522,465 | |
Lukoil OAO ADR | | | 19,584 | | | | 1,236,142 | |
MOL Hungarian Oil & Gas PLC | | | 1,514 | | | | 101,651 | |
OMV AG | | | 6,239 | | | | 299,091 | |
Origin Energy Ltd. | | | 45,284 | | | | 570,022 | |
PetroChina Company Ltd. | | | 862,000 | | | | 943,850 | |
Petroleo Brasileiro S.A. | | | 117,000 | | | | 792,977 | |
Polskie Gornictwo Naftowe i Gazownictwo S.A. | | | 63,407 | | | | 108,219 | |
PTT PCL | | | 37,900 | | | | 329,866 | |
Repsol S.A. | | | 33,939 | | | | 856,757 | |
Rosneft OAO GDR | | | 45,830 | | | | 348,996 | |
Royal Dutch Shell PLC | | | 151,788 | | | | 5,437,754 | (††) |
Royal Dutch Shell PLC | | | 96,148 | | | | 3,630,786 | (††) |
Sasol Ltd. | | | 23,266 | | | | 1,142,891 | |
Statoil ASA | | | 39,562 | | | | 958,589 | |
Suncor Energy Inc. | | | 59,180 | | | | 2,074,224 | |
Surgutneftegas OAO ADR | | | 27,270 | | | | 211,615 | (††) |
Surgutneftegas OAO ADR | | | 29,028 | | | | 251,673 | (††) |
Total S.A. | | | 85,904 | | | | 5,271,077 | |
| | | | | | | 41,007,952 | |
| | |
Integrated Telecommunication Services—0.6% | | | | | | | | |
BCE Inc. | | | 10,421 | | | | 451,168 | |
Belgacom S.A. | | | 5,928 | | | | 175,663 | |
| | | | | | | | |
Bell Aliant Inc. | | | 2,827 | | | | 71,121 | |
Bezeq The Israeli Telecommunication Corp Ltd. | | | 71,154 | | | | 120,640 | |
BT Group PLC | | | 311,711 | | | | 1,958,732 | |
China Communications Services Corp Ltd. | | | 84,000 | | | | 52,001 | |
China Telecom Corp Ltd. | | | 564,000 | | | | 285,137 | |
China Unicom Hong Kong Ltd. | | | 188,000 | | | | 280,773 | |
Chunghwa Telecom Company Ltd. | | | 152,000 | | | | 474,817 | |
Deutsche Telekom AG | | | 111,716 | | | | 1,913,462 | |
Elisa Oyj | | | 5,366 | | | | 142,410 | |
France Telecom S.A. | | | 74,510 | | | | 924,039 | |
Hellenic Telecommunications Organization S.A. | | | 10,479 | | | | 139,630 | (a) |
HKT Trust | | | 96,000 | | | | 94,963 | |
Koninklijke KPN N.V. | | | 127,709 | | | | 412,313 | (a) |
KT Corp. | | | 1,110 | | | | 33,184 | |
LG Uplus Corp. | | | 8,060 | | | | 82,101 | (a) |
Nippon Telegraph & Telephone Corp. | | | 15,000 | | | | 807,764 | |
PCCW Ltd. | | | 173,000 | | | | 77,422 | |
Portugal Telecom SGPS S.A. | | | 23,867 | | | | 103,925 | |
Rostelecom OJSC ADR | | | 7,764 | | | | 160,016 | |
Singapore Telecommunications Ltd. | | | 300,000 | | | | 869,634 | |
Swisscom AG | | | 901 | | | | 477,069 | |
TDC A/S | | | 28,766 | | | | 279,472 | |
Telecom Corp. of New Zealand Ltd. | | | 68,211 | | | | 129,405 | |
Telecom Egypt Co. | | | 13,363 | | | | 27,885 | |
Telecom Italia S.p.A. | | | 449,635 | | | | 446,713 | (††) |
Telecom Italia S.p.A. | | | 190,334 | | | | 149,232 | (††) |
Telefonica Czech Republic AS | | | 3,979 | | | | 59,090 | |
Telefonica Deutschland Holding AG | | | 9,195 | | | | 76,021 | |
Telefonica S.A. | | | 160,653 | | | | 2,619,934 | |
Telekom Austria AG | | | 8,813 | | | | 66,840 | |
Telekom Malaysia Bhd | | | 42,600 | | | | 72,181 | |
Telekomunikacja Polska S.A. | | | 28,318 | | | | 91,970 | |
Telekomunikasi Indonesia Persero Tbk PT | | | 1,797,500 | | | | 317,553 | |
Telenor ASA | | | 27,199 | | | | 648,273 | |
TeliaSonera AB | | | 87,196 | | | | 727,018 | |
Telstra Corp Ltd. | | | 170,718 | | | | 801,847 | |
TELUS Corp. | | | 11,130 | | | | 382,977 | |
True Corp PCL | | | 168,400 | | | | 38,436 | (a) |
Turk Telekomunikasyon AS | | | 16,769 | | | | 46,518 | |
Vivendi S.A. | | | 47,597 | | | | 1,256,305 | |
XL Axiata Tbk PT | | | 93,500 | | | | 39,951 | |
| | | | | | | 18,385,605 | |
| | |
Internet Retail—0.0%* | | | | | | | | |
Rakuten Inc. | | | 30,300 | | | | 450,875 | |
| | |
Internet Software & Services—0.1% | | | | | | | | |
Dena Company Ltd. | | | 3,900 | | | | 82,078 | |
Gree Inc. | | | 3,500 | | | | 34,599 | |
Kakaku.com Inc. | | | 3,100 | | | | 54,476 | |
NAVER Corp. | | | 1,139 | | | | 781,386 | |
Tencent Holdings Ltd. | | | 40,900 | | | | 2,605,784 | |
United Internet AG | | | 4,602 | | | | 196,074 | |
Wix.com Ltd. | | | 297 | | | | 7,975 | (a) |
Yahoo Japan Corp. | | | 57,700 | | | | 321,150 | |
| | | | | | | 4,083,522 | |
| | | | | | | | |
| | |
Investment Banking & Brokerage—0.1% | | | | | | | | |
CITIC Securities Company Ltd. | | | 42,500 | | | | 115,654 | |
Daewoo Securities Company Ltd. | | | 7,490 | | | | 63,165 | |
Daiwa Securities Group Inc. | | | 67,000 | | | | 669,331 | |
Haitong Securities Company Ltd. | | | 49,200 | | | | 85,281 | |
Hyundai Securities Company Ltd. | | | 6,640 | | | | 36,807 | |
ICAP PLC | | | 21,687 | | | | 162,210 | |
Korea Investment Holdings Company Ltd. | | | 1,740 | | | | 67,269 | |
Macquarie Group Ltd. | | | 11,771 | | | | 578,885 | |
Mediobanca S.p.A. | | | 20,019 | | | | 175,442 | (a) |
Nomura Holdings Inc. | | | 145,300 | | | | 1,118,383 | |
Samsung Securities Company Ltd. | | | 2,292 | | | | 95,667 | |
Woori Investment & Securities Company Ltd. | | | 6,220 | | | | 56,521 | |
Yuanta Financial Holding Company Ltd. | | | 351,000 | | | | 209,633 | |
| | | | | | | 3,434,248 | |
| | |
IT Consulting & Other Services—0.1% | | | | | | | | |
AtoS | | | 2,010 | | | | 182,217 | |
Cap Gemini S.A. | | | 5,602 | | | | 379,248 | |
CGI Group Inc. | | | 7,985 | | | | 267,093 | (a) |
Fujitsu Ltd. | | | 49,000 | | | | 253,613 | (a) |
HCL Technologies Ltd. | | | 7,684 | | | | 157,233 | |
Infosys Ltd. | | | 18,855 | | | | 1,061,586 | |
Itochu Techno-Solutions Corp. | | | 900 | | | | 36,521 | |
Luxoft Holding Inc. | | | 113 | | | | 4,292 | (a) |
Nomura Research Institute Ltd. | | | 3,800 | | | | 119,852 | |
NTT Data Corp. | | | 5,300 | | | | 195,652 | |
Otsuka Corp. | | | 600 | | | | 76,552 | |
SK C&C Company Ltd. | | | 921 | | | | 117,814 | |
Tata Consultancy Services Ltd. | | | 18,636 | | | | 655,069 | |
Tech Mahindra Ltd. | | | 2,313 | | | | 68,749 | |
Wipro Ltd. | | | 25,134 | | | | 227,143 | |
| | | | | | | 3,802,634 | |
| | |
Leisure Facilities—0.0%* | | | | | | | | |
Oriental Land Company Ltd. | | | 2,100 | | | | 303,097 | |
| | |
Leisure Products—0.0%* | | | | | | | | |
Giant Manufacturing Company Ltd. | | | 10,000 | | | | 68,784 | |
Merida Industry Company Ltd. | | | 7,000 | | | | 50,850 | |
Namco Bandai Holdings Inc. | | | 6,600 | | | | 146,562 | |
Sankyo Company Ltd. | | | 1,900 | | | | 87,674 | |
Sega Sammy Holdings Inc. | | | 7,400 | | | | 188,476 | |
Shimano Inc. | | | 3,200 | | | | 274,925 | |
Yamaha Corp. | | | 6,100 | | | | 96,864 | |
| | | | | | | 914,135 | |
| | |
Life & Health Insurance—0.6% | | | | | | | | |
Aegon N.V. | | | 70,659 | | | | 668,115 | |
AIA Group Ltd. | | | 487,600 | | | | 2,446,254 | |
AMP Ltd. | | | 120,452 | | | | 473,077 | |
Cathay Financial Holding Company Ltd. | | | 310,874 | | | | 503,286 | |
China Life Insurance Company Ltd. | | | 85,500 | | | | 86,637 | (††) |
| | | | | | | | |
China Life Insurance Company Ltd. | | | 305,000 | | | | 953,893 | (††) |
China Taiping Insurance Holdings Company Ltd. | | | 32,800 | | | | 66,584 | (a) |
CNP Assurances | | | 5,764 | | | | 118,343 | |
Delta Lloyd N.V. | | | 7,100 | | | | 176,493 | |
Discovery Ltd. | | | 10,317 | | | | 83,235 | |
Great-West Lifeco Inc. | | | 11,430 | | | | 352,313 | |
Hanwha Life Insurance Company Ltd. | | | 8,480 | | | | 60,988 | |
Industrial Alliance Insurance & Financial Services Inc. | | | 3,775 | | | | 166,811 | |
Legal & General Group PLC | | | 240,719 | | | | 887,884 | |
Liberty Holdings Ltd. | | | 4,059 | | | | 47,125 | |
Manulife Financial Corp. | | | 70,176 | | | | 1,384,366 | |
MMI Holdings Ltd. | | | 36,164 | | | | 87,356 | |
New China Life Insurance Company Ltd. | | | 23,300 | | | | 77,829 | (a) |
Old Mutual PLC | | | 200,483 | | | | 627,906 | |
Ping An Insurance Group Company of China Ltd. | | | 76,000 | | | | 682,689 | |
Power Corp of Canada | | | 13,526 | | | | 406,735 | |
Power Financial Corp. | | | 9,419 | | | | 319,138 | |
Prudential PLC | | | 102,007 | | | | 2,263,916 | |
Resolution Ltd. | | | 55,034 | | | | 322,671 | |
RMI Holdings | | | 22,171 | | | | 58,107 | |
Samsung Life Insurance Company Ltd. | | | 2,361 | | | | 232,666 | |
Sanlam Ltd. | | | 67,666 | | | | 343,959 | |
Shin Kong Financial Holding Company Ltd. | | | 242,192 | | | | 83,701 | |
Sony Financial Holdings Inc. | | | 6,500 | | | | 118,367 | |
Standard Life PLC | | | 97,011 | | | | 577,785 | |
Sun Life Financial Inc. | | | 24,295 | | | | 857,928 | |
Swiss Life Holding AG | | | 1,203 | | | | 250,515 | (a) |
T&D Holdings Inc. | | | 22,500 | | | | 314,471 | |
The Dai-ichi Life Insurance Company Ltd. | | | 35,300 | | | | 590,097 | |
| | | | | | | 16,691,240 | |
| | |
Life Sciences Tools & Services—0.0%* | | | | | | | | |
Divi’s Laboratories Ltd. | | | 1,428 | | | | 28,189 | |
Lonza Group AG | | | 1,992 | | | | 189,490 | (a) |
QIAGEN N.V. | | | 9,834 | | | | 229,482 | (a) |
| | | | | | | 447,161 | |
| | |
Managed Healthcare—0.0%* | | | | | | | | |
Odontoprev S.A. | | | 10,100 | | | | 42,082 | |
Qualicorp S.A. | | | 8,200 | | | | 78,203 | (a) |
| | | | | | | 120,285 | |
| | |
Marine—0.1% | | | | | | | | |
AP Moeller—Maersk A/S | | | 53 | | | | 576,098 | (††) |
AP Moeller—Maersk A/S | | | 19 | | | | 196,173 | (††) |
China COSCO Holdings Company Ltd. | | | 102,500 | | | | 49,969 | (a) |
China Shipping Container Lines Company Ltd. | | | 146,000 | | | | 38,036 | (a) |
Evergreen Marine Corp Taiwan Ltd. | | | 64,000 | | | | 39,083 | (a) |
Hyundai Merchant Marine Company Ltd. | | | 2,675 | | | | 28,896 | (a) |
Kuehne + Nagel International AG | | | 2,460 | | | | 323,906 | |
MISC Bhd | | | 40,400 | | | | 70,304 | (a) |
Mitsui OSK Lines Ltd. | | | 42,000 | | | | 189,410 | |
Nippon Yusen KK | | | 69,000 | | | | 220,579 | |
U-Ming Marine Transport Corp. | | | 17,000 | | | | 30,516 | |
Wan Hai Lines Ltd. | | | 36,000 | | | | 18,723 | |
Yang Ming Marine Transport Corp. | | | 59,000 | | | | 27,616 | (a) |
| | | | | | | 1,809,309 | |
| | | | | | | | |
| | |
Marine Ports & Services—0.0%* | | | | | | | | |
Adani Ports and Special Economic Zone | | | 14,192 | | | | 35,632 | |
China Merchants Holdings International Company Ltd. | | | 42,000 | | | | 153,293 | |
COSCO Pacific Ltd. | | | 62,000 | | | | 85,079 | |
Hutchison Port Holdings Trust | | | 201,000 | | | | 135,675 | |
International Container Terminal Services Inc. | | | 26,800 | | | | 61,592 | |
Kamigumi Company Ltd. | | | 8,000 | | | | 73,374 | |
Koninklijke Vopak N.V. | | | 2,589 | | | | 151,691 | |
Mitsubishi Logistics Corp. | | | 5,000 | | | | 79,016 | |
| | | | | | | 775,352 | |
| | |
Metal & Glass Containers—0.0%* | | | | | | | | |
Nampak Ltd. | | | 13,509 | | | | 52,882 | |
Rexam PLC | | | 32,047 | | | | 281,578 | |
Toyo Seikan Group Holdings Ltd. | | | 5,800 | | | | 124,658 | |
| | | | | | | 459,118 | |
| | |
Motorcycle Manufacturers—0.0%* | | | | | | | | |
Bajaj Auto Ltd. | | | 3,146 | | | | 96,890 | |
Hero Motocorp Ltd. | | | 3,073 | | | | 103,187 | |
Yamaha Motor Company Ltd. | | | 10,600 | | | | 159,043 | |
| | | | | | | 359,120 | |
| | |
Movies & Entertainment—0.0%* | | | | | | | | |
Toho Company Ltd. | | | 4,400 | | | | 96,829 | |
| | |
Multi-Line Insurance—0.4% | | | | | | | | |
Ageas | | | 9,634 | | | | 410,866 | |
Allianz SE | | | 17,797 | | | | 3,196,621 | |
Assicurazioni Generali S.p.A. | | | 46,975 | | | | 1,106,869 | |
Aviva PLC | | | 118,058 | | | | 879,314 | |
AXA S.A. | | | 71,794 | | | | 1,999,345 | |
Baloise Holding AG | | | 1,917 | | | | 244,866 | |
BB Seguridade Participacoes S.A. | | | 23,900 | | | | 248,193 | |
China Pacific Insurance Group Company Ltd. | | | 107,400 | | | | 421,081 | |
Fairfax Financial Holdings Ltd. | | | 152 | | | | 60,673 | |
Gjensidige Forsikring ASA | | | 7,732 | | | | 147,456 | |
Mapfre S.A. | | | 32,631 | | | | 139,972 | |
Porto Seguro S.A. | | | 4,400 | | | | 55,484 | |
Powszechny Zaklad Ubezpieczen S.A. | | | 2,320 | | | | 345,180 | |
Sampo | | | 16,717 | | | | 822,817 | |
Sul America S.A. | | | 5,000 | | | | 31,345 | |
Vienna Insurance Group AG Wiener Versicherung Gruppe | | | 1,571 | | | | 78,418 | |
Zurich Insurance Group AG | | | 5,274 | | | | 1,532,950 | (a) |
| | | | | | | 11,721,450 | |
| | |
Multi-Sector Holdings—0.1% | | | | | | | | |
Ayala Corp. | | | 7,150 | | | | 83,450 | |
Corp. Financiera Colombiana S.A. | | | 2,956 | | | | 60,589 | |
Eurazeo | | | 1,312 | | | | 103,012 | |
Exor S.p.A. | | | 3,417 | | | | 136,121 | |
First Pacific Company Ltd. | | | 94,000 | | | | 106,926 | |
Groupe Bruxelles Lambert S.A. | | | 4,014 | | | | 369,090 | |
Grupo de Inversiones Suramericana S.A. | | | 8,633 | | | | 150,586 | |
Haci Omer Sabanci Holding AS | | | 34,397 | | | | 138,324 | |
Industrivarden AB | | | 4,939 | | | | 94,049 | |
| | | | | | | | |
Investment AB Kinnevik | | | 9,470 | | | | 439,248 | |
Investor AB | | | 19,167 | | | | 660,427 | |
Metro Pacific Investments Corp. | | | 129,200 | | | | 12,576 | |
Onex Corp. | | | 3,866 | | | | 208,673 | |
Pargesa Holding S.A. | | | 1,294 | | | | 104,614 | |
Remgro Ltd. | | | 19,519 | | | | 387,296 | |
Wendel S.A. | | | 1,280 | | | | 186,872 | |
| | | | | | | 3,241,853 | |
| | |
Multi-Utilities—0.3% | | | | | | | | |
AGL Energy Ltd. | | | 23,385 | | | | 314,448 | |
Atco Ltd. | | | 2,398 | | | | 105,309 | |
Canadian Utilities Ltd. | | | 4,562 | | | | 153,154 | |
Centrica PLC | | | 204,253 | | | | 1,176,248 | |
E.ON SE | | | 68,381 | | | | 1,264,036 | |
GDF Suez | | | 53,714 | | | | 1,265,290 | |
National Grid PLC | | | 144,573 | | | | 1,886,857 | |
RWE AG | | | 19,430 | | | | 712,311 | |
Suez Environnement Co. | | | 10,531 | | | | 189,008 | |
Veolia Environnement S.A. | | | 14,035 | | | | 229,270 | |
YTL Corp Bhd | | | 200,400 | | | | 99,114 | |
YTL Power International Bhd | | | 82,900 | | | | 47,834 | |
| | | | | | | 7,442,879 | |
| | |
Office Electronics—0.1% | | | | | | | | |
Brother Industries Ltd. | | | 8,800 | | | | 120,314 | |
Canon Inc. | | | 44,600 | | | | 1,413,044 | |
Konica Minolta Inc. | | | 20,500 | | | | 204,600 | |
Ricoh Company Ltd. | | | 28,000 | | | | 297,836 | |
| | | | | | | 2,035,794 | |
| | |
Office REITs—0.0%* | | | | | | | | |
CapitaCommercial Trust | | | 95,000 | | | | 109,100 | |
Japan Prime Realty Investment Corp. | | | 29 | | | | 92,983 | |
Japan Real Estate Investment Corp. | | | 46 | | | | 246,839 | |
Nippon Building Fund Inc. | | | 56 | | | | 326,074 | |
Nomura Real Estate Office Fund Inc. | | | 14 | | | | 65,135 | |
| | | | | | | 840,131 | |
| | |
Office Services & Supplies—0.0%* | | | | | | | | |
Societe BIC S.A. | | | 1,036 | | | | 127,138 | |
| | |
Oil & Gas Drilling—0.1% | | | | | | | | |
China Oilfield Services Ltd. | | | 58,000 | | | | 179,900 | |
Noble Corp. PLC | | | 16,693 | | | | 625,487 | |
Seadrill Ltd. | | | 15,178 | | | | 619,444 | |
Transocean Ltd. | | | 22,484 | | | | 1,111,159 | (††) |
Transocean Ltd. | | | 14,406 | | | | 703,656 | (††) |
| | | | | | | 3,239,646 | |
| | |
Oil & Gas Equipment & Services—0.1% | | | | | | | | |
Aker Solutions ASA | | | 7,194 | | | | 128,539 | |
AMEC PLC | | | 12,623 | | | | 227,466 | |
Bumi Armada Bhd | | | 42,800 | | | | 52,659 | (a) |
CGG S.A. | | | 5,975 | | | | 103,574 | (a) |
Fugro N.V. | | | 2,870 | | | | 171,299 | |
Petrofac Ltd. | | | 10,564 | | | | 214,159 | |
| | | | | | | | |
Saipem S.p.A. | | | 10,901 | | | | 233,727 | |
Sapurakencana Petroleum Bhd | | | 127,700 | | | | 191,033 | (a) |
Subsea 7 S.A. | | | 11,444 | | | | 219,001 | |
Technip S.A. | | | 4,256 | | | | 409,698 | |
Tenaris S.A. | | | 19,053 | | | | 416,915 | |
WorleyParsons Ltd. | | | 8,516 | | | | 126,473 | |
| | | | | | | 2,494,543 | |
| | |
Oil & Gas Exploration & Production—0.4% | | | | | | | | |
ARC Resources Ltd. | | | 11,975 | | | | 333,271 | |
Athabasca Oil Corp. | | | 11,308 | | | | 68,965 | ��(a) |
Baytex Energy Corp. | | | 4,899 | | | | 191,995 | |
Cairn India Ltd. | | | 17,722 | | | | 92,571 | |
Canadian Natural Resources Ltd. | | | 42,635 | | | | 1,442,166 | |
Canadian Oil Sands Ltd. | | | 18,537 | | | | 348,583 | |
CNOOC Ltd. | | | 727,000 | | | | 1,352,035 | |
Crescent Point Energy Corp. | | | 16,066 | | | | 623,739 | |
Encana Corp. | | | 28,724 | | | | 518,519 | |
Enerplus Corp. | | | 7,283 | | | | 132,294 | |
Equal Energy Ltd. | | | 1,276 | | | | 6,814 | |
Inpex Corp. | | | 34,100 | | | | 437,342 | |
Japan Petroleum Exploration Co. | | | 1,100 | | | | 41,706 | |
Kunlun Energy Company Ltd. | | | 138,000 | | | | 243,118 | |
Lundin Petroleum AB | | | 8,987 | | | | 175,469 | (a) |
MEG Energy Corp. | | | 5,897 | | | | 169,889 | (a) |
NovaTek OAO GDR | | | 4,307 | | | | 589,628 | |
Oil & Natural Gas Corp. Ltd. | | | 28,871 | | | | 134,892 | |
Oil India Ltd. | | | 17,637 | | | | 139,203 | |
Pacific Rubiales Energy Corp. | | | 11,182 | | | | 193,014 | |
Pengrowth Energy Corp. | | | 16,966 | | | | 104,910 | |
Penn West Petroleum Ltd. | | | 17,358 | | | | 144,909 | |
Peyto Exploration & Development Corp. | | | 4,880 | | | | 149,317 | |
PTT Exploration & Production PCL | | | 57,900 | | | | 293,376 | |
Santos Ltd. | | | 39,106 | | | | 511,848 | |
Talisman Energy Inc. | | | 39,373 | | | | 457,653 | |
Tatneft OAO ADR | | | 9,139 | | | | 349,293 | |
Tourmaline Oil Corp. | | | 6,249 | | | | 262,899 | (a) |
Tullow Oil PLC | | | 36,421 | | | | 515,755 | |
Vermilion Energy Inc. | | | 4,105 | | | | 240,891 | |
Woodside Petroleum Ltd. | | | 26,556 | | | | 924,198 | |
| | | | | | | 11,190,262 | |
| | |
Oil & Gas Refining & Marketing—0.1% | | | | | | | | |
Bharat Petroleum Corp. Ltd. | | | 6,480 | | | | 36,457 | |
Caltex Australia Ltd. | | | 4,925 | | | | 88,343 | |
Cosan S.A. Industria e Comercio | | | 5,500 | | | | 92,271 | |
Delek Group Ltd. | | | 174 | | | | 66,472 | |
Empresas COPEC S.A. | | | 18,588 | | | | 249,043 | |
Formosa Petrochemical Corp. | | | 43,000 | | | | 118,020 | |
Grupa Lotos S.A. | | | 2,254 | | | | 26,481 | (a) |
GS Holdings | | | 2,084 | | | | 113,150 | |
Hellenic Petroleum S.A. | | | 1,633 | | | | 17,056 | |
Idemitsu Kosan Company Ltd. | | | 3,200 | | | | 72,857 | |
IRPC PCL | | | 378,600 | | | | 37,560 | |
JX Holdings Inc. | | | 90,000 | | | | 463,251 | |
Keyera Corp. | | | 3,488 | | | | 209,871 | |
| | | | | | | | |
Neste Oil Oyj | | | 5,805 | | | | 114,946 | |
Petronas Dagangan Bhd | | | 8,900 | | | | 85,427 | |
Polski Koncern Naftowy Orlen S.A. | | | 13,345 | | | | 181,327 | |
Reliance Industries Ltd. | | | 51,727 | | | | 747,618 | |
S-Oil Corp. | | | 1,820 | | | | 127,616 | |
Showa Shell Sekiyu KK | | | 7,600 | | | | 77,226 | |
SK Innovation Company Ltd. | | | 2,421 | | | | 324,605 | |
Thai Oil PCL | | | 30,500 | | | | 52,210 | |
TonenGeneral Sekiyu KK | | | 11,000 | | | | 100,994 | |
Tupras Turkiye Petrol Rafinerileri AS | | | 5,349 | | | | 106,806 | |
| | | | | | | 3,509,607 | |
| | |
Oil & Gas Storage & Transportation—0.1% | | | | | | | | |
AltaGas Ltd. | | | 4,683 | | | | 179,695 | |
Enbridge Inc. | | | 31,347 | | | | 1,369,237 | |
Pembina Pipeline Corp. | | | 12,074 | | | | 425,232 | |
TransCanada Corp. | | | 27,741 | | | | 1,267,339 | |
Ultrapar Participacoes S.A. | | | 13,300 | | | | 315,412 | |
| | | | | | | 3,556,915 | |
| | |
Packaged Foods & Meats—0.8% | | | | | | | | |
Ajinomoto Company Inc. | | | 25,000 | | | | 362,019 | |
Aryzta AG | | | 3,492 | | | | 268,570 | (a) |
Associated British Foods PLC | | | 14,854 | | | | 601,517 | |
Barry Callebaut AG | | | 87 | | | | 109,367 | (a) |
Biostime International Holdings Ltd. | | | 3,000 | | | | 26,697 | |
BRF S.A. | | | 27,600 | | | | 576,158 | |
Calbee Inc. | | | 2,400 | | | | 58,342 | |
Charoen Pokphand Foods PCL | | | 115,100 | | | | 112,088 | |
China Mengniu Dairy Company Ltd. | | | 53,000 | | | | 251,885 | |
CJ CheilJedang Corp. | | | 320 | | | | 83,991 | |
Danone S.A. | | | 23,130 | | | | 1,667,542 | |
GlaxoSmithKline Consumer Healthcare Ltd. | | | 162 | | | | 11,627 | |
Grupo Bimbo SAB de C.V. | | | 66,600 | | | | 205,183 | |
Indofood CBP Sukses Makmur Tbk PT | | | 32,000 | | | | 26,820 | |
Indofood Sukses Makmur Tbk PT | | | 165,000 | | | | 89,482 | |
JBS S.A. | | | 25,900 | | | | 96,278 | |
Kerry Group PLC | | | 5,662 | | | | 393,998 | |
Kikkoman Corp. | | | 6,000 | | | | 113,372 | |
Lindt & Spruengli AG | | | 33 | | | | 149,202 | (††) |
Lindt & Spruengli AG | | | 3 | | | | 162,253 | (††) |
Lotte Confectionery Company Ltd. | | | 35 | | | | 63,410 | |
M Dias Branco S.A. | | | 1,000 | | | | 42,386 | |
MEIJI Holdings Company Ltd. | | | 2,300 | | | | 147,928 | |
Nestle S.A. | | | 126,795 | | | | 9,309,848 | |
Nippon Meat Packers Inc. | | | 7,000 | | | | 120,280 | |
Nisshin Seifun Group Inc. | | | 7,700 | | | | 79,634 | |
Nissin Foods Holdings Company Ltd. | | | 2,300 | | | | 97,160 | |
Orion Corp. | | | 142 | | | | 127,690 | |
Orkla ASA | | | 35,555 | | | | 277,321 | |
PPB Group Bhd | | | 17,800 | | | | 87,709 | |
Saputo Inc. | | | 5,180 | | | | 235,915 | |
Standard Foods Corp. | | | 11,500 | | | | 35,885 | |
Suedzucker AG | | | 3,033 | | | | 81,998 | |
Tate & Lyle PLC | | | 19,062 | | | | 255,413 | |
Tiger Brands Ltd. | | | 6,889 | | | | 175,570 | |
Tingyi Cayman Islands Holding Corp. | | | 82,000 | | | | 236,363 | |
Toyo Suisan Kaisha Ltd. | | | 4,000 | | | | 120,261 | |
| | | | | | | | |
Ulker Biskuvi Sanayi AS | | | 3,012 | | | | 21,309 | |
Uni-President China Holdings Ltd. | | | 40,000 | | | | 40,961 | |
Uni-President Enterprises Corp. | | | 171,720 | | | | 309,405 | |
Unilever N.V. | | | 62,346 | | | | 2,515,005 | |
Unilever PLC | | | 51,316 | | | | 2,109,503 | |
Universal Robina Corp. | | | 30,200 | | | | 76,959 | |
Want Want China Holdings Ltd. | | | 242,000 | | | | 348,936 | |
Yakult Honsha Company Ltd. | | | 3,400 | | | | 171,771 | |
Yamazaki Baking Company Ltd. | | | 4,000 | | | | 41,064 | |
| | | | 22,496,075 | |
| | |
Paper Packaging—0.0%* | | | | | | | | |
Amcor Ltd. | | | 49,720 | | | | 469,285 | |
Orora Ltd. | | | 49,720 | | | | 51,599 | (a) |
| | | | 520,884 | |
| | |
Paper Products—0.0%* | | | | | | | | |
Empresas CMPC S.A. | | | 46,932 | | | | 114,336 | |
Fibria Celulose S.A. | | | 9,300 | | | | 108,994 | (a) |
Lee & Man Paper Manufacturing Ltd. | | | 71,000 | | | | 46,700 | |
Nine Dragons Paper Holdings Ltd. | | | 63,000 | | | | 54,844 | |
Oji Holdings Corp. | | | 31,000 | | | | 158,974 | |
Sappi Ltd. | | | 19,577 | | | | 61,215 | (a) |
Stora Enso Oyj | | | 23,120 | | | | 232,406 | |
UPM-Kymmene Oyj | | | 21,948 | | | | 371,387 | |
| | | | 1,148,856 | |
| | |
Personal Products—0.1% | | | | | | | | |
AMOREPACIFIC Corp. | | | 131 | | | | 124,130 | |
AMOREPACIFIC Group | | | 68 | | | | 29,962 | |
Beiersdorf AG | | | 4,131 | | | | 419,182 | |
Dabur India Ltd. | | | 13,803 | | | | 38,047 | |
Godrej Consumer Products Ltd. | | | 4,709 | | | | 65,327 | |
Hengan International Group Company Ltd. | | | 29,500 | | | | 347,741 | |
Hypermarcas S.A. | | | 12,800 | | | | 95,759 | |
Kao Corp. | | | 21,300 | | | | 670,786 | |
L’Oreal S.A. | | | 9,486 | | | | 1,669,196 | |
Natura Cosmeticos S.A. | | | 7,200 | | | | 126,254 | |
Shiseido Company Ltd. | | | 15,000 | | | | 241,330 | |
| | | | 3,827,714 | |
| | |
Pharmaceuticals—1.6% | | | | | | | | |
Aspen Pharmacare Holdings Ltd. | | | 12,203 | | | | 313,087 | |
Astellas Pharma Inc. | | | 17,500 | | | | 1,037,296 | |
AstraZeneca PLC | | | 47,992 | | | | 2,841,252 | |
Bayer AG | | | 32,647 | | | | 4,586,314 | |
Celltrion Inc. | | | 2,486 | | | | 90,338 | |
Chugai Pharmaceutical Company Ltd. | | | 9,400 | | | | 207,935 | |
Cipla Ltd. | | | 12,861 | | | | 83,439 | |
Daiichi Sankyo Company Ltd. | | | 27,600 | | | | 504,969 | |
Dainippon Sumitomo Pharma Company Ltd. | | | 6,100 | | | | 95,471 | |
Dr Reddy’s Laboratories Ltd. | | | 3,837 | | | | 157,249 | |
Eisai Company Ltd. | | | 10,300 | | | | 399,339 | |
Genomma Lab Internacional SAB de C.V. | | | 29,900 | | | | 83,236 | (a) |
GlaxoSmithKline PLC | | | 193,243 | | | | 5,157,743 | |
Hisamitsu Pharmaceutical Company Inc. | | | 2,400 | | | | 121,022 | |
Kalbe Farma Tbk PT | | | 854,500 | | | | 87,767 | |
Kyowa Hakko Kirin Company Ltd. | | | 8,000 | | | | 88,217 | |
Lupin Ltd. | | | 3,427 | | | | 50,237 | |
| | | | | | | | |
Merck KGaA | | | 2,576 | | | | 462,335 | |
Mitsubishi Tanabe Pharma Corp. | | | 8,600 | | | | 119,952 | |
Novartis AG | | | 90,226 | | | | 7,223,356 | |
Novo Nordisk A/S | | | 15,418 | | | | 2,830,663 | |
Ono Pharmaceutical Company Ltd. | | | 3,200 | | | | 280,405 | |
Orion Oyj | | | 4,156 | | | | 116,940 | |
Otsuka Holdings Company Ltd. | | | 14,600 | | | | 422,283 | |
Piramal Enterprises Ltd. | | | 2,159 | | | | 19,103 | |
Ranbaxy Laboratories Ltd. | | | 4,850 | | | | 35,488 | (a) |
Richter Gedeon Nyrt | | | 2,156 | | | | 43,992 | |
Roche Holding AG | | | 27,674 | | | | 7,754,383 | |
Sanofi | | | 48,033 | | | | 5,104,345 | |
Santen Pharmaceutical Company Ltd. | | | 2,700 | | | | 126,003 | |
ScinoPharm Taiwan Ltd. | | | 10,400 | | | | 30,568 | |
Shionogi & Company Ltd. | | | 11,900 | | | | 258,142 | |
Shire PLC | | | 22,446 | | | | 1,060,264 | |
Sihuan Pharmaceutical Holdings Group Ltd. | | | 74,000 | | | | 67,474 | |
Sino Biopharmaceutical Ltd. | | | 124,000 | | | | 98,512 | |
Sun Pharmaceutical Industries Ltd. | | | 23,014 | | | | 211,146 | |
Taisho Pharmaceutical Holdings Company Ltd. | | | 1,300 | | | | 89,425 | |
Takeda Pharmaceutical Company Ltd. | | | 31,100 | | | | 1,427,691 | |
Teva Pharmaceutical Industries Ltd. | | | 35,096 | | | | 1,403,436 | |
Tsumura & Co. | | | 2,200 | | | | 58,357 | |
UCB S.A. | | | 4,895 | | | | 365,178 | |
Valeant Pharmaceuticals International Inc. | | | 12,626 | | | | 1,480,896 | (a) |
Yuhan Corp. | | | 313 | | | | 55,461 | |
| | | | 47,050,709 | |
| | |
Photographic Products—0.0%* | | | | | | | | |
Nikon Corp. | | | 13,600 | | | | 259,953 | |
| | |
Precious Metals & Minerals—0.0%* | | | | | | | | |
Anglo American Platinum Ltd. | | | 3,198 | | | | 120,275 | (a) |
Fresnillo PLC | | | 8,016 | | | | 98,976 | |
Impala Platinum Holdings Ltd. | | | 21,829 | | | | 256,352 | |
Industrias Penoles SAB de C.V. | | | 6,055 | | | | 150,423 | |
Northam Platinum Ltd. | | | 8,512 | | | | 34,133 | (a) |
Silver Wheaton Corp. | | | 14,644 | | | | 295,637 | |
| | | | 955,796 | |
| | |
Property & Casualty Insurance—0.2% | | | | | | | | |
Admiral Group PLC | | | 8,319 | | | | 180,496 | |
Direct Line Insurance Group PLC | | | 30,088 | | | | 124,384 | |
Dongbu Insurance Company Ltd. | | | 1,830 | | | | 97,452 | |
Hyundai Marine & Fire Insurance Company Ltd. | | | 2,720 | | | | 83,764 | |
Insurance Australia Group Ltd. | | | 88,521 | | | | 460,917 | |
Intact Financial Corp. | | | 5,931 | | | | 387,231 | |
MS&AD Insurance Group Holdings | | | 20,700 | | | | 555,781 | |
NKSJ Holdings Inc. | | | 14,200 | | | | 395,041 | |
People’s Insurance Company Group of China Ltd. | | | 224,000 | | | | 108,335 | |
PICC Property & Casualty Company Ltd. | | | 140,000 | | | | 207,641 | |
QBE Insurance Group Ltd. | | | 48,103 | | | | 495,337 | |
RSA Insurance Group PLC | | | 154,806 | | | | 234,347 | |
Samsung Fire & Marine Insurance Company Ltd. | | | 1,403 | | | | 344,319 | |
Suncorp Group Ltd. | | | 52,094 | | | | 610,537 | |
Tokio Marine Holdings Inc. | | | 28,400 | | | | 949,774 | |
Tryg A/S | | | 1,127 | | | | 109,180 | |
| | | | 5,344,536 | |
| | | | | | | | |
| | |
Publishing—0.1% | | | | | | | | |
Axel Springer SE | | | 1,610 | | | | 103,604 | |
Lagardere SCA | | | 4,450 | | | | 165,683 | |
Pearson PLC | | | 33,915 | | | | 753,262 | |
Reed Elsevier N.V. | | | 28,339 | | | | 601,366 | |
Reed Elsevier PLC | | | 48,272 | | | | 718,754 | |
Singapore Press Holdings Ltd. | | | 57,737 | | | | 188,402 | |
Thomson Reuters Corp. | | | 15,288 | | | | 577,994 | |
Wolters Kluwer N.V. | | | 11,537 | | | | 329,792 | |
| | | | 3,438,857 | |
| | |
Railroads—0.3% | | | | | | | | |
ALL America Latina Logistica S.A. | | | 17,200 | | | | 47,826 | |
Asciano Ltd. | | | 36,444 | | | | 187,803 | |
Aurizon Holdings Ltd. | | | 79,572 | | | | 347,403 | |
Canadian National Railway Co. | | | 33,432 | | | | 1,905,545 | |
Canadian Pacific Railway Ltd. | | | 7,021 | | | | 1,061,575 | |
Central Japan Railway Co. | | | 5,900 | | | | 694,943 | |
East Japan Railway Co. | | | 13,500 | | | | 1,076,352 | |
Hankyu Hanshin Holdings Inc. | | | 44,000 | | | | 237,781 | |
Keikyu Corp. | | | 19,000 | | | | 156,729 | |
Keio Corp. | | | 23,000 | | | | 153,399 | |
Keisei Electric Railway Company Ltd. | | | 10,000 | | | | 92,003 | |
Kintetsu Corp. | | | 74,000 | | | | 259,798 | |
MTR Corp Ltd. | | | 63,500 | | | | 240,364 | |
Odakyu Electric Railway Company Ltd. | | | 24,000 | | | | 217,154 | |
Tobu Railway Company Ltd. | | | 40,000 | | | | 194,092 | |
Tokyu Corp. | | | 44,000 | | | | 285,086 | |
West Japan Railway Co. | | | 6,700 | | | | 290,681 | |
| | | | 7,448,534 | |
| | |
Real Estate Development—0.1% | | | | | | | | |
Agile Property Holdings Ltd. | | | 52,000 | | | | 55,731 | |
Bumi Serpong Damai PT | | | 185,500 | | | | 19,663 | |
Cheung Kong Holdings Ltd. | | | 58,000 | | | | 916,331 | |
China Overseas Grand Oceans Group Ltd. | | | 20,000 | | | | 19,036 | |
China Overseas Land & Investment Ltd. | | | 172,000 | | | | 483,585 | |
China Resources Land Ltd. | | | 80,000 | | | | 197,891 | |
China Vanke Company Ltd. | | | 49,400 | | | | 77,091 | |
Country Garden Holdings Company Ltd. | | | 170,000 | | | | 102,389 | |
Evergrande Real Estate Group Ltd. | | | 257,000 | | | | 97,779 | |
Farglory Land Development Company Ltd. | | | 13,862 | | | | 23,488 | |
Greentown China Holdings Ltd. | | | 26,000 | | | | 39,702 | |
Guangzhou R&F Properties Company Ltd. | | | 33,600 | | | | 49,141 | |
Highwealth Construction Corp. | | | 12,000 | | | | 25,366 | |
Keppel Land Ltd. | | | 31,000 | | | | 82,005 | |
Lippo Karawaci Tbk PT | | | 744,500 | | | | 55,669 | |
Longfor Properties Company Ltd. | | | 50,000 | | | | 69,902 | |
Ruentex Development Company Ltd. | | | 24,578 | | | | 47,666 | |
Shimao Property Holdings Ltd. | | | 51,500 | | | | 117,961 | |
Shui On Land Ltd. | | | 136,666 | | | | 41,949 | |
Sino Land Company Ltd. | | | 116,000 | | | | 158,581 | |
Sino-Ocean Land Holdings Ltd. | | | 104,500 | | | | 68,330 | |
SOHO China Ltd. | | | 76,000 | | | | 65,083 | |
Talaat Moustafa Group | | | 36,052 | | | | 31,701 | (a) |
UEM Sunrise Bhd | | | 59,300 | | | | 42,726 | |
| | | | | | | 2,888,766 | |
| | | | | | | | |
| | |
Real Estate Operating Companies—0.1% | | | | | | | | |
Aeon Mall Company Ltd. | | | 4,000 | | | | 112,307 | |
BR Malls Participacoes S.A. | | | 17,200 | | | | 124,302 | |
BR Properties S.A. | | | 11,700 | | | | 92,241 | |
Brookfield Office Properties Inc. | | | 10,283 | | | | 197,918 | |
CapitaMalls Asia Ltd. | | | 52,000 | | | | 80,722 | |
Central Pattana PCL | | | 44,200 | | | | 55,149 | |
Deutsche Wohnen AG | | | 9,959 | | | | 192,602 | |
First Capital Realty Inc. | | | 863 | | | | 14,385 | |
Global Logistic Properties Ltd. | | | 125,000 | | | | 286,116 | |
Hulic Company Ltd. | | | 10,000 | | | | 147,947 | |
Hysan Development Company Ltd. | | | 26,000 | | | | 111,997 | |
IMMOFINANZ AG | | | 43,610 | | | | 202,391 | (a) |
IOI Properties Group Sdn Bhd | | | 42,633 | | | | 36,314 | (a) |
Multiplan Empreendimentos Imobiliarios S.A. | | | 3,200 | | | | 67,683 | |
NTT Urban Development Corp. | | | 4,500 | | | | 51,763 | |
Redefine Properties Ltd. | | | 110,314 | | | | 102,586 | |
SM Prime Holdings Inc. | | | 245,000 | | | | 81,036 | |
Swire Properties Ltd. | | | 50,800 | | | | 128,413 | |
Swiss Prime Site AG | | | 1,980 | | | | 153,729 | (a) |
| | | | | | | 2,239,601 | |
| | |
Regional Banks—0.1% | | | | | | | | |
Bank of Queensland Ltd. | | | 4,383 | | | | 47,682 | |
Bendigo and Adelaide Bank Ltd. | | | 15,355 | | | | 161,414 | |
BS Financial Group Inc. | | | 6,160 | | | | 93,391 | |
Chongqing Rural Commercial Bank | | | 92,000 | | | | 44,376 | |
DGB Financial Group Inc. | | | 5,020 | | | | 78,486 | |
Fukuoka Financial Group Inc. | | | 30,000 | | | | 131,583 | |
Hokuhoku Financial Group Inc. | | | 34,000 | | | | 67,932 | |
Resona Holdings Inc. | | | 76,900 | | | | 392,164 | |
Seven Bank Ltd. | | | 22,000 | | | | 86,028 | |
Shinsei Bank Ltd. | | | 64,000 | | | | 156,491 | |
Suruga Bank Ltd. | | | 7,000 | | | | 125,608 | |
The Bank of Kyoto Ltd. | | | 14,000 | | | | 116,950 | |
The Bank of Yokohama Ltd. | | | 47,000 | | | | 262,043 | |
The Chiba Bank Ltd. | | | 27,000 | | | | 182,132 | |
The Chugoku Bank Ltd. | | | 7,000 | | | | 88,978 | |
The Gunma Bank Ltd. | | | 14,000 | | | | 78,188 | |
The Hachijuni Bank Ltd. | | | 15,000 | | | | 87,484 | |
The Hiroshima Bank Ltd. | | | 19,000 | | | | 78,636 | |
The Iyo Bank Ltd. | | | 11,000 | | | | 107,901 | |
The Joyo Bank Ltd. | | | 25,000 | | | | 127,729 | |
The Nishi-Nippon City Bank Ltd. | | | 27,000 | | | | 72,699 | |
The Shizuoka Bank Ltd. | | | 21,000 | | | | 224,176 | |
Yamaguchi Financial Group Inc. | | | 8,000 | | | | 74,135 | |
| | | | | | | 2,886,206 | |
| | |
Reinsurance—0.1% | | | | | | | | |
Blue Capital Reinsurance Holdings Ltd. | | | 217 | | | | 3,986 | (a) |
Hannover Rueck SE | | | 2,352 | | | | 202,170 | |
Muenchener Rueckversicherungs AG | | | 7,120 | | | | 1,571,232 | |
SCOR SE | | | 5,925 | | | | 216,886 | |
Swiss Re AG | | | 14,274 | | | | 1,316,896 | (a) |
Third Point Reinsurance Ltd. | | | 932 | | | | 17,270 | (a) |
| | | | | | | 3,328,440 | |
| | | | | | | | |
| | |
Research & Consulting Services—0.1% | | | | | | | | |
ALS Ltd/Queensland | | | 15,554 | | | | 122,595 | |
Bureau Veritas S.A. | | | 8,532 | | | | 249,770 | |
Experian PLC | | | 39,967 | | | | 737,416 | |
Intertek Group PLC | | | 6,828 | | | | 356,003 | |
SGS S.A. | | | 239 | | | | 551,445 | |
| | | | | | | 2,017,229 | |
| | |
Residential REITs—0.0%* | | | | | | | | |
Emlak Konut Gayrimenkul Yatirim Ortakligi AS | | | 58,985 | | | | 57,653 | |
| | |
Restaurants—0.1% | | | | | | | | |
Compass Group PLC | | | 72,523 | | | | 1,162,724 | |
Jollibee Foods Corp. | | | 15,290 | | | | 59,634 | |
McDonald’s Holdings Company Japan Ltd. | | | 2,600 | | | | 66,469 | |
Sodexo | | | 3,708 | | | | 376,259 | |
Tim Hortons Inc. | | | 6,998 | | | | 408,288 | |
Whitbread PLC | | | 7,512 | | | | 466,689 | |
| | | | | | | 2,540,063 | |
| | |
Retail REITs—0.1% | | | | | | | | |
CapitaMall Trust | | | 109,000 | | | | 164,458 | |
CFS Retail Property Trust Group | | | 82,684 | | | | 143,878 | |
Corio N.V. | | | 2,561 | | | | 114,955 | |
Federation Centres Ltd. | | | 53,686 | | | | 112,391 | |
Hammerson PLC | | | 30,144 | | | | 250,628 | |
Intu Properties PLC | | | 28,013 | | | | 143,783 | |
Japan Retail Fund Investment Corp. | | | 77 | | | | 156,923 | |
Klepierre | | | 3,685 | | | | 171,044 | |
RioCan Real Estate Investment Trust | | | 5,179 | | | | 120,738 | |
The Link REIT | | | 102,000 | | | | 495,941 | |
Unibail-Rodamco SE | | | 3,652 | | | | 937,260 | (††) |
Unibail-Rodamco SE | | | 94 | | | | 24,124 | (††) |
Westfield Group | | | 82,987 | | | | 749,125 | |
Westfield Retail Trust | | | 126,325 | | | | 335,659 | |
| | | | | | | 3,920,907 | |
| | |
Security & Alarm Services—0.0%* | | | | | | | | |
G4S PLC | | | 64,223 | | | | 279,219 | |
S-1 Corp. | | | 841 | | | | 59,608 | |
Secom Company Ltd. | | | 9,000 | | | | 542,886 | |
Securitas AB | | | 11,896 | | | | 126,598 | |
| | | | | | | 1,008,311 | |
| | |
Semiconductor Equipment—0.1% | | | | | | | | |
Advantest Corp. | | | 5,600 | | | | 69,637 | |
ASM Pacific Technology Ltd. | | | 9,300 | | | | 77,722 | |
ASML Holding N.V. | | | 14,113 | | | | 1,323,174 | |
GCL-Poly Energy Holdings Ltd. | | | 394,000 | | | | 121,446 | (a) |
Hanergy Solar Group Ltd. | | | 234,000 | | | | 23,841 | (a,h) |
Hermes Microvision Inc. | | | 1,000 | | | | 32,480 | |
Sumco Corp. | | | 4,500 | | | | 39,732 | (a) |
Tokyo Electron Ltd. | | | 6,900 | | | | 378,136 | |
| | | | | | | 2,066,168 | |
| | |
Semiconductors—0.5% | | | | | | | | |
Advanced Semiconductor Engineering Inc. | | | 289,000 | | | | 268,603 | |
ARM Holdings PLC | | | 55,403 | | | | 1,008,455 | |
Epistar Corp. | | | 31,000 | | | | 59,704 | (a) |
| | | | | | | | |
Infineon Technologies AG | | | 43,926 | | | | 469,696 | |
Kinsus Interconnect Technology Corp. | | | 10,000 | | | | 33,184 | |
MediaTek Inc. | | | 50,000 | | | | 744,040 | |
MStar Semiconductor Inc. | | | 8,000 | | | | 93,143 | |
Novatek Microelectronics Corp. | | | 22,000 | | | | 90,057 | |
Phison Electronics Corp. | | | 5,000 | | | | 31,959 | |
Powertech Technology Inc. | | | 27,000 | | | | 41,265 | |
Radiant Opto-Electronics Corp. | | | 15,450 | | | | 56,505 | |
Realtek Semiconductor Corp. | | | 16,160 | | | | 43,377 | |
Rohm Company Ltd. | | | 3,600 | | | | 175,368 | |
Samsung Electronics Company Ltd. | | | 4,373 | | | | 5,685,087 | |
Siliconware Precision Industries Co. | | | 108,000 | | | | 129,005 | |
SK Hynix Inc. | | | 21,170 | | | | 738,197 | (a) |
STMicroelectronics N.V. | | | 27,067 | | | | 217,814 | |
Taiwan Semiconductor Manufacturing Company Ltd. | | | 993,000 | | | | 3,515,074 | |
Transcend Information Inc. | | | 6,000 | | | | 17,253 | |
United Microelectronics Corp. | | | 501,000 | | | | 207,605 | |
Vanguard International Semiconductor Corp. | | | 19,000 | | | | 22,568 | |
| | | | 13,647,959 | |
| | |
Soft Drinks—0.1% | | | | | | | | |
Arca Continental SAB de C.V. | | | 14,500 | | | | 90,229 | |
Coca-Cola Amatil Ltd. | | | 23,185 | | | | 249,532 | |
Coca-Cola Femsa SAB de C.V. | | | 16,500 | | | | 198,585 | |
Coca-Cola HBC AG ADR | | | 5,610 | | | | 163,644 | |
Coca-Cola HBC AG | | | 1,264 | | | | 36,887 | (a) |
Coca-Cola Icecek AS | | | 2,227 | | | | 53,641 | |
Coca-Cola West Company Ltd. | | | 2,500 | | | | 52,971 | |
Fomento Economico Mexicano SAB de C.V. | | | 81,900 | | | | 790,476 | |
Suntory Beverage & Food Ltd. | | | 5,100 | | | | 162,794 | |
| | | | 1,798,759 | |
| | |
Specialized Finance—0.1% | | | | | | | | |
ASX Ltd. | | | 8,294 | | | | 272,767 | |
BM&FBovespa S.A. | | | 83,000 | | | | 389,098 | |
Chailease Holding Company Ltd. | | | 28,600 | | | | 75,234 | |
Deutsche Boerse AG | | | 7,977 | | | | 661,713 | |
Far East Horizon Ltd. | | | 53,000 | | | | 45,182 | |
Japan Exchange Group Inc. | | | 10,000 | | | | 284,382 | |
London Stock Exchange Group PLC | | | 7,666 | | | | 220,036 | |
Mitsubishi UFJ Lease & Finance Company Ltd. | | | 22,400 | | | | 137,463 | |
Power Finance Corp Ltd. | | | 10,821 | | | | 29,215 | |
Rural Electrification Corp Ltd. | | | 11,578 | | | | 41,236 | |
Singapore Exchange Ltd. | | | 38,000 | | | | 218,501 | |
| | | | 2,374,827 | |
| | |
Specialty Chemicals—0.1% | | | | | | | | |
Asian Paints Ltd. | | | 10,450 | | | | 82,757 | |
Croda International PLC | | | 5,451 | | | | 221,823 | |
Daicel Corp. | | | 11,000 | | | | 89,587 | |
EMS-Chemie Holding AG | | | 324 | | | | 115,487 | |
Givaudan S.A. | | | 346 | | | | 495,647 | (a) |
Hitachi Chemical Company Ltd. | | | 4,000 | | | | 63,822 | |
Johnson Matthey PLC | | | 8,428 | | | | 457,851 | |
JSR Corp. | | | 6,700 | | | | 129,786 | |
Kansai Paint Company Ltd. | | | 6,000 | | | | 88,768 | |
Koninklijke DSM N.V. | | | 6,073 | | | | 478,331 | |
Nippon Paint Co. Ltd. | | | 2,000 | | | | 33,281 | |
Nitto Denko Corp. | | | 7,000 | | | | 295,371 | |
| | | | | | | | |
Shin-Etsu Chemical Company Ltd. | | | 16,500 | | | | 963,893 | |
Sika AG | | | 85 | | | | 303,070 | |
Umicore S.A. | | | 4,697 | | | | 219,765 | |
| | | | 4,039,239 | |
| | |
Specialty Stores—0.0%* | | | | | | | | |
Folli Follie S.A. | | | 920 | | | | 29,664 | (a) |
JUMBO S.A. | | | 3,948 | | | | 63,106 | (a) |
Sanrio Company Ltd. | | | 1,700 | | | | 71,571 | |
| | | | 164,341 | |
| | |
Steel—0.2% | | | | | | | | |
ArcelorMittal | | | 40,959 | | | | 732,019 | |
CAP S.A. | | | 2,624 | | | | 50,408 | |
China Steel Corp. | | | 462,310 | | | | 418,822 | |
Cia Siderurgica Nacional S.A. | | | 27,400 | | | | 167,007 | |
Daido Steel Company Ltd. | | | 10,000 | | | | 49,665 | |
Eregli Demir ve Celik Fabrikalari TAS | | | 55,084 | | | | 66,147 | |
Feng Hsin Iron & Steel Co. | | | 12,000 | | | | 22,024 | |
Fortescue Metals Group Ltd. | | | 62,526 | | | | 325,564 | |
Fosun International Ltd. | | | 57,500 | | | | 56,953 | |
Hitachi Metals Ltd. | | | 8,000 | | | | 113,106 | |
Hyundai Hysco Company Ltd. | | | 1,390 | | | | 54,660 | (h) |
Hyundai Steel Co. | | | 2,231 | | | | 182,437 | |
Industrias CH SAB de C.V. | | | 5,600 | | | | 37,712 | (a) |
JFE Holdings Inc. | | | 20,300 | | | | 483,237 | |
Jindal Steel & Power Ltd. | | | 13,806 | | | | 58,233 | |
JSW Steel Ltd. | | | 2,896 | | | | 47,573 | |
Kobe Steel Ltd. | | | 95,000 | | | | 162,694 | (a) |
Kumba Iron Ore Ltd. | | | 3,400 | | | | 143,953 | |
Maruichi Steel Tube Ltd. | | | 1,600 | | | | 40,432 | |
Nippon Steel & Sumitomo Metal Corp. | | | 304,000 | | | | 1,018,106 | |
POSCO | | | 2,641 | | | | 817,062 | |
Sesa Sterlite Ltd. | | | 42,022 | | | | 137,095 | |
Severstal OAO GDR | | | 7,140 | | | | 70,543 | |
Tata Steel Ltd. | | | 11,358 | | | | 77,682 | |
ThyssenKrupp AG | | | 15,697 | | | | 382,629 | (a) |
Vale S.A. | | | 41,300 | | | | 625,124 | |
Voestalpine AG | | | 4,459 | | | | 214,620 | |
Yamato Kogyo Company Ltd. | | | 1,400 | | | | 44,755 | |
| | | | 6,600,262 | |
| | |
Systems Software—0.0%* | | | | | | | | |
Oracle Corp Japan | | | 1,400 | | | | 51,216 | |
Totvs S.A. | | | 4,200 | | | | 65,797 | |
Trend Micro Inc. | | | 4,000 | | | | 140,050 | (a) |
| | | | 257,063 | |
| | |
Technology Distributors—0.0%* | | | | | | | | |
Synnex Technology International Corp. | | | 48,000 | | | | 76,179 | |
WPG Holdings Ltd. | | | 51,000 | | | | 58,694 | |
| | | | 134,873 | |
| | |
Textiles—0.0%* | | | | | | | | |
Eclat Textile Company Ltd. | | | 5,000 | | | | 56,369 | |
Formosa Taffeta Company Ltd. | | | 25,000 | | | | 30,240 | |
Ruentex Industries Ltd. | | | 19,711 | | | | 50,594 | |
Shenzhou International Group Holdings Ltd. | | | 16,000 | | | | 60,461 | |
| | | | 197,664 | |
| | | | | | | | |
| | |
Thrifts & Mortgage Finance—0.0%* | | | | | | | | |
Essent Group Ltd. | | | 820 | | | | 19,729 | (a) |
Housing Development Finance Corp. | | | 60,658 | | | | 782,558 | |
LIC Housing Finance Ltd. | | | 11,981 | | | | 42,487 | |
| | | | 844,774 | |
| | |
Tires & Rubber—0.1% | | | | | | | | |
Bridgestone Corp. | | | 26,700 | | | | 1,011,046 | |
Cheng Shin Rubber Industry Company Ltd. | | | 65,550 | | | | 171,554 | |
Cie Generale des Etablissements Michelin | | | 7,444 | | | | 792,388 | |
Hankook Tire Company Ltd. | | | 3,030 | | | | 174,275 | |
Nan Kang Rubber Tire Company Ltd. | | | 23,000 | | | | 28,515 | (a) |
Nokian Renkaat Oyj | | | 4,624 | | | | 222,179 | |
Pirelli & C. S.p.A. | | | 8,788 | | | | 152,337 | |
Sumitomo Rubber Industries Ltd. | | | 6,400 | | | | 90,972 | |
The Yokohama Rubber Company Ltd. | | | 7,000 | | | | 68,798 | |
| | | | 2,712,064 | |
| | |
Tobacco—0.3% | | | | | | | | |
British American Tobacco Malaysia Bhd | | | 4,300 | | | | 84,175 | |
British American Tobacco PLC | | | 74,563 | | | | 3,998,764 | |
Gudang Garam Tbk PT | | | 18,500 | | | | 63,846 | |
Imperial Tobacco Group PLC | | | 38,711 | | | | 1,499,010 | |
ITC Ltd. | | | 88,390 | | | | 458,705 | |
Japan Tobacco Inc. | | | 44,000 | | | | 1,431,711 | |
KT&G Corp. | | | 4,116 | | | | 290,560 | |
Souza Cruz S.A. | | | 17,900 | | | | 182,926 | |
Swedish Match AB | | | 8,173 | | | | 263,033 | |
| | | | 8,272,730 | |
| | |
Trading Companies & Distributors—0.2% | | | | | | | | |
Adani Enterprises Ltd. | | | 8,457 | | | | 35,862 | |
Barloworld Ltd. | | | 7,965 | | | | 76,055 | |
Brenntag AG | | | 1,986 | | | | 368,758 | |
Bunzl PLC | | | 12,822 | | | | 307,928 | |
Daewoo International Corp. | | | 2,030 | | | | 79,442 | |
Finning International Inc. | | | 6,330 | | | | 161,750 | |
ITOCHU Corp. | | | 60,700 | | | | 750,196 | |
Marubeni Corp. | | | 67,000 | | | | 481,918 | |
Mitsubishi Corp. | | | 55,300 | | | | 1,061,226 | |
Mitsui & Company Ltd. | | | 68,300 | | | | 951,996 | |
Noble Group Ltd. | | | 177,000 | | | | 150,000 | |
Rexel S.A. | | | 8,008 | | | | 210,485 | |
Samsung C&T Corp. | | | 5,075 | | | | 291,415 | |
SK Networks Company Ltd. | | | 6,600 | | | | 47,279 | |
Sojitz Corp. | | | 49,600 | | | | 88,247 | |
Sumitomo Corp. | | | 45,600 | | | | 573,118 | |
Toyota Tsusho Corp. | | | 8,800 | | | | 217,938 | |
Travis Perkins PLC | | | 10,064 | | | | 312,034 | |
Wolseley PLC | | | 10,712 | | | | 607,655 | |
| | | | | | | 6,773,302 | |
| | |
Trucking—0.0%* | | | | | | | | |
ComfortDelGro Corp Ltd. | | | 84,000 | | | | 133,724 | |
DSV A/S | | | 7,775 | | | | 255,333 | |
Localiza Rent a Car S.A. | | | 5,145 | | | | 72,576 | |
Nippon Express Company Ltd. | | | 32,000 | | | | 154,969 | |
| | | | | | | 616,602 | |
| | | | | | | | |
| | |
Water Utilities—0.0%* | | | | | | | | |
Aguas Andinas S.A. | | | 77,578 | | | | 50,183 | |
Cia de Saneamento Basico do Estado de Sao Paulo | | | 13,500 | | | | 151,408 | |
Cia de Saneamento de Minas Gerais-COPASA | | | 2,100 | | | | 33,112 | |
Guangdong Investment Ltd. | | | 92,000 | | | | 89,939 | |
Severn Trent PLC | | | 9,568 | | | | 270,191 | |
United Utilities Group PLC | | | 27,581 | | | | 306,748 | |
| | | | | | | 901,581 | |
| | |
Wireless Telecommunication Services—0.8% | | | | | | | | |
Advanced Info Service PCL | | | 44,100 | | | | 267,740 | |
America Movil SAB de C.V. | | | 1,355,400 | | | | 1,571,985 | |
Axiata Group Bhd | | | 97,600 | | | | 205,599 | |
Bharti Airtel Ltd. | | | 24,134 | | | | 128,932 | |
China Mobile Ltd. | | | 242,000 | | | | 2,504,659 | |
DiGi.Com Bhd | | | 145,400 | | | | 220,175 | |
ENTEL Chile S.A. | | | 4,152 | | | | 56,419 | |
Far EasTone Telecommunications Company Ltd. | | | 58,000 | | | | 127,468 | |
Global Telecom Holding | | | 98,792 | | | | 66,681 | (a) |
Globe Telecom Inc. | | | 1,235 | | | | 45,635 | |
Idea Cellular Ltd. | | | 24,304 | | | | 65,598 | |
KDDI Corp. | | | 21,400 | | | | 1,317,330 | |
Maxis Bhd | | | 88,900 | | | | 197,314 | |
MegaFon OAO GDR | | | 5,726 | | | | 191,821 | |
Millicom International Cellular S.A. | | | 2,635 | | | | 262,778 | |
Mobile Telesystems OJSC ADR | | | 38,352 | | | | 829,554 | |
MTN Group Ltd. | | | 70,073 | | | | 1,451,939 | |
NTT DOCOMO Inc. | | | 59,100 | | | | 969,959 | |
Philippine Long Distance Telephone Co. | | | 1,645 | | | | 98,813 | |
Reliance Communications Ltd. | | | 20,483 | | | | 43,082 | |
Rogers Communications Inc. | | | 14,390 | | | | 651,037 | |
Sistema JSFC GDR | | | 7,023 | | | | 225,579 | |
SK Telecom Company Ltd. | | | 353 | | | | 76,932 | |
Softbank Corp. | | | 37,300 | | | | 3,264,926 | |
StarHub Ltd. | | | 26,000 | | | | 88,342 | |
Taiwan Mobile Company Ltd. | | | 62,000 | | | | 200,332 | |
Tele2 AB | | | 11,746 | | | | 133,232 | |
Tim Participacoes S.A. | | | 31,600 | | | | 165,149 | |
Turkcell Iletisim Hizmetleri AS | | | 31,681 | | | | 167,363 | (a) |
Vodacom Group Ltd. | | | 15,462 | | | | 196,343 | |
Vodafone Group PLC | | | 1,896,885 | | | | 7,445,861 | (a) |
| | | | | | | 23,238,577 | |
| | |
Total Common Stock | | | | | | | | |
(Cost $640,954,519) | | | | | | | 718,699,185 | |
| | |
Preferred Stocks—0.4% | | | | | | | | |
| | |
Automobile Manufacturers—0.1% | | | | | | | | |
Bayerische Motoren Werke AG | | | 1,658 | | | | 141,853 | |
Hyundai Motor Co. | | | 666 | | | | 78,884 | (††) |
Hyundai Motor Co. | | | 1,448 | | | | 179,054 | (††) |
Porsche Automobil Holding SE | | | 6,290 | | | | 655,768 | |
Volkswagen AG | | | 5,762 | | | | 1,620,899 | |
| | | | | | | 2,676,458 | |
| | |
Commodity Chemicals—0.0%* | | | | | | | | |
Braskem S.A. | | | 6,100 | | | | 54,297 | (a) |
Fuchs Petrolub AG | | | 1,223 | | | | 119,719 | |
LG Chem Ltd. | | | 274 | | | | 39,593 | |
| | | | | | | 213,609 | |
| | | | | | | | |
| | |
Construction & Farm Machinery—0.0%* | | | | | | | | |
Marcopolo S.A. | | | 15,200 | | | | 32,858 | |
| | |
Construction Materials—0.0%* | | | | | | | | |
Grupo Argos S.A. | | | 3,447 | | | | 34,791 | |
| | |
Diversified Financial Services—0.1% | | | | | | | | |
Banco Bradesco S.A. | | | 94,420 | | | | 1,164,216 | |
Banco Davivienda S.A. | | | 2,995 | | | | 36,678 | |
Banco do Estado do Rio Grande do Sul S.A. | | | 6,900 | | | | 36,851 | |
Bancolombia S.A. | | | 12,485 | | | | 151,474 | |
Grupo Aval Acciones y Valores | | | 57,961 | | | | 38,251 | |
Itau Unibanco Holding S.A. | | | 102,370 | | | | 1,360,305 | |
Itausa—Investimentos Itau S.A. | | | 125,453 | | | | 473,257 | |
| | | | | | | 3,261,032 | |
| | |
Electric Utilities—0.0%* | | | | | | | | |
Centrais Eletricas Brasileiras S.A. | | | 8,100 | | | | 34,093 | |
Cia Energetica de Minas Gerais | | | 28,508 | | | | 169,290 | |
Cia Paranaense de Energia | | | 3,900 | | | | 50,468 | |
| | | | | | | 253,851 | |
| | |
Fertilizers & Agricultural Chemicals—0.0%* | | | | | | | | |
Sociedad Quimica y Minera de Chile S.A. | | | 3,310 | | | | 84,286 | |
| | |
General Merchandise Stores—0.0%* | | | | | | | | |
Lojas Americanas S.A. | | | 15,700 | | | | 104,678 | |
| | |
Household Products—0.0%* | | | | | | | | |
Henkel AG & Company KGaA | | | 7,473 | | | | 868,175 | |
| | |
Hypermarkets & Super Centers—0.0%* | | | | | | | | |
Cia Brasileira de Distribuicao Grupo Pao de Acucar | | | 4,800 | | | | 213,444 | |
| | |
Independent Power Producers & Energy Traders—0.0%* | | | | | | | | |
AES Tiete S.A. | | | 3,800 | | | | 30,748 | |
Cia Energetica de Sao Paulo | | | 5,900 | | | | 56,068 | |
| | | | | | | 86,816 | |
| | |
Integrated Oil & Gas—0.1% | | | | | | | | |
Petroleo Brasileiro S.A. | | | 171,500 | | | | 1,241,590 | |
| | |
Integrated Telecommunication Services—0.0%* | | | | | | | | |
Oi S.A. | | | 31,700 | | | | 48,237 | |
Telefonica Brasil S.A. | | | 11,900 | | | | 226,121 | |
| | | | | | | 274,358 | |
| | |
Multi-Sector Holdings—0.0%* | | | | | | | | |
Grupo de Inversiones Suramericana S.A. | | | 3,025 | | | | 54,769 | |
| | |
Paper Packaging—0.0%* | | | | | | | | |
Klabin S.A. | | | 19,600 | | | | 101,853 | |
| | |
Paper Products—0.0%* | | | | | | | | |
Suzano Papel e Celulose S.A. | | | 9,200 | | | | 36,032 | |
| | |
Semiconductors—0.0%* | | | | | | | | |
Samsung Electronics Company Ltd. | | | 819 | | | | 786,134 | |
| | |
Soft Drinks—0.0%* | | | | | | | | |
Embotelladora Andina S.A. | | | 7,865 | | | | 36,073 | |
| | | | | | | | |
| | |
Steel—0.1% | | | | | | | | |
Bradespar S.A. | | | 8,400 | | | | 89,296 | |
Gerdau S.A. | | | 34,600 | | | | 268,968 | |
Metalurgica Gerdau S.A. | | | 10,200 | | | | 101,168 | |
Usinas Siderurgicas de Minas Gerais S.A. | | | 14,200 | | | | 85,528 | (a) |
Vale S.A. | | | 89,000 | | | | 1,234,702 | |
| | | | | | | 1,779,662 | |
| | |
Total Preferred Stock | | | | | | | | |
(Cost $13,737,287) | | | | | | | 12,140,469 | |
| | |
Rights—0.0%* | | | | | | | | |
| | |
Computer & Electronics Retail—0.0%* | | | | | | | | |
Groupe Fnac | | | 1 | | | | — | (a) |
| | |
Diversified Metals & Mining—0.0%* | | | | | | | | |
Turquoise Hill Resources Ltd. | | | 14,556 | | | | 13,700 | (a) |
| | |
Integrated Oil & Gas—0.0%* | | | | | | | | |
Repsol S.A. | | | 33,939 | | | | 23,196 | (a) |
| | |
Total Rights | | | | | | | | |
(Cost $49,232) | | | | | | | 36,896 | |
| | |
Total Foreign Equity | | | | | | | | |
(Cost $654,741,038) | | | | | | | 730,876,550 | |
| | | | | | | | | | |
| | | | | Principal
Amount | | | Fair Value | |
Bonds and Notes—31.2% | | | | | | | | |
U.S. Treasuries—11.1% | | | | | | | | | | |
U.S. Treasury Bonds | | | | | | | | | | |
2.75% | | 11/15/23 - 11/15/42 | | $ | 2,150,000 | | | $ | 1,981,327 | |
3.00% | | 05/15/42 | | | 11,700,000 | | | | 9,811,550 | (d) |
3.75% | | 11/15/43 | | | 1,000,000 | | | | 966,562 | |
4.38% | | 11/15/39 | | | 11,000,000 | | | | 11,953,909 | |
4.50% | | 02/15/36 | | | 6,700,000 | | | | 7,454,795 | |
5.38% | | 02/15/31 | | | 1,850,000 | | | | 2,267,118 | |
5.50% | | 08/15/28 | | | 4,500,000 | | | | 5,546,952 | |
6.38% | | 08/15/27 | | | 2,000,000 | | | | 2,655,624 | |
7.63% | | 02/15/25 | | | 2,000,000 | | | | 2,857,188 | |
7.88% | | 02/15/21 | | | 5,000,000 | | | | 6,803,125 | |
8.75% | | 05/15/20 | | | 5,000,000 | | | | 6,976,560 | |
9.00% | | 11/15/18 | | | 3,000,000 | | | | 4,036,875 | |
U.S. Treasury Notes | | | | | | | | | | |
0.25% | | 01/31/15 - 12/31/15 | | | 26,250,000 | | | | 26,227,229 | |
0.38% | | 03/15/15 - 06/30/15 | | | 30,000,000 | | | | 30,062,100 | |
0.63% | | 10/15/16 - 04/30/18 | | | 12,000,000 | | | | 11,725,002 | |
0.75% | | 12/31/17 - 03/31/18 | | | 10,000,000 | | | | 9,765,620 | |
0.88% | | 12/31/16 - 01/31/18 | | | 8,000,000 | | | | 7,911,254 | |
0.88% | | 02/28/17 | | | 12,000,000 | | | | 11,999,064 | (d) |
1.13% | | 12/31/19 - 03/31/20 | | | 24,800,000 | | | | 23,386,809 | |
1.25% | | 10/31/15 - 02/29/20 | | | 25,500,000 | | | | 24,996,050 | |
1.38% | | 07/31/18 | | | 1,000,000 | | | | 991,016 | |
1.50% | | 07/31/16 | | | 18,000,000 | | | | 18,410,616 | |
1.63% | | 11/15/22 | | | 4,000,000 | | | | 3,610,624 | |
1.75% | | 07/31/15 - 05/15/22 | | | 14,700,000 | | | | 14,236,736 | |
2.00% | | 07/31/20 - 02/15/23 | | | 7,250,000 | | | | 7,053,206 | |
2.13% | | 05/31/15 - 08/31/20 | | | 24,500,000 | | | | 25,185,904 | |
| | | | | | | | | | |
2.38% | | 03/31/16 | | | 13,500,000 | | | | 14,082,187 | |
2.50% | | 08/15/23 | | | 500,000 | | | | 480,156 | |
3.13% | | 05/15/19 | | | 7,000,000 | | | | 7,459,375 | |
3.25% | | 12/31/16 | | | 12,000,000 | | | | 12,870,936 | |
4.50% | | 05/15/17 | | | 15,000,000 | | | | 16,739,070 | |
| | | | | | | | | 330,504,539 | |
| | | |
U.S. Government Sponsored Agencies—0.2% | | | | | | | | | | |
Federal Home Loan Banks | | | | | | | | | | |
0.50% | | 11/20/15 | | | 5,000,000 | | | | 5,006,300 | |
Tennessee Valley Authority | | | | | | | | | | |
3.50% | | 12/15/42 | | | 1,000,000 | | | | 788,363 | |
| | | | | | | | | 5,794,663 | |
| | | |
Agency Mortgage Backed—10.3% | | | | | | | | | | |
Federal Home Loan Mortgage Corp. | | | | | | | | | | |
0.85% | | 11/28/16 | | | 700,000 | | | | 697,938 | |
0.88% | | 10/14/16 - 03/07/18 | | | 7,000,000 | | | | 6,895,929 | |
1.25% | | 10/02/19 | | | 1,500,000 | | | | 1,421,005 | |
1.38% | | 05/01/20 | | | 1,500,000 | | | | 1,406,271 | |
1.79% | | 06/01/43 | | | 521,254 | | | | 524,975 | (e) |
2.38% | | 01/13/22 | | | 2,100,000 | | | | 2,007,526 | (d) |
2.48% | | 05/01/43 | | | 1,095,944 | | | | 1,072,846 | (e) |
2.51% | | 08/01/43 | | | 399,125 | | | | 390,990 | (e) |
3.00% | | 05/01/33 - 06/01/43 | | | 10,646,659 | | | | 10,117,246 | |
3.50% | | 10/01/42 - 07/01/43 | | | 1,296,717 | | | | 1,288,597 | |
5.00% | | 12/01/22 - 06/01/41 | | | 6,226,786 | | | | 6,733,791 | |
5.50% | | 01/01/38 - 04/01/39 | | | 1,154,640 | | | | 1,267,661 | |
6.00% | | 06/01/37 - 11/01/37 | | | 1,101,069 | | | | 1,229,539 | (d) |
2.50% | | TBA | | | 7,400,000 | | | | 7,289,061 | (f) |
3.00% | | TBA | | | 3,000,000 | | | | 3,034,148 | (f) |
3.50% | | TBA | | | 9,950,000 | | | | 9,922,578 | (f) |
4.00% | | TBA | | | 10,617,000 | | | | 10,960,505 | (f) |
4.50% | | TBA | | | 3,000,000 | | | | 3,174,258 | (f) |
Federal National Mortgage Assoc. | | | | | | | | | | |
0.50% | | 09/28/15 | | | 6,000,000 | | | | 6,010,602 | |
0.75% | | 11/25/16 | | | 1,900,000 | | | | 1,892,957 | |
0.88% | | 12/20/17 - 05/21/18 | | | 6,900,000 | | | | 6,745,133 | |
1.94% | | 04/01/43 | | | 877,845 | | | | 890,654 | (e) |
2.50% | | 02/01/28 - 09/01/28 | | | 6,824,060 | | | | 6,761,551 | |
3.00% | | 01/01/28 - 08/01/43 | | | 25,184,911 | | | | 24,591,805 | |
3.50% | | 10/01/42 | | | 14,781,124 | | | | 14,698,379 | |
4.00% | | 01/01/41 - 10/01/41 | | | 9,534,234 | | | | 9,823,412 | |
4.50% | | 10/01/39 - 11/01/43 | | | 17,901,179 | | | | 18,970,768 | |
4.50% | | 11/01/40 | | | 5,211,800 | | | | 5,523,738 | (d) |
5.00% | | 07/01/35 - 08/01/35 | | | 606,605 | | | | 658,504 | (d) |
5.00% | | 12/01/39 - 06/01/41 | | | 15,016,430 | | | | 16,395,115 | |
5.50% | | 12/01/35 - 04/01/38 | | | 5,536,396 | | | | 6,094,489 | |
5.50% | | 08/01/37 | | | 2,541,135 | | | | 2,793,803 | (d) |
6.00% | | 03/01/34 - 08/01/37 | | | 5,980,727 | | | | 6,639,175 | |
6.00% | | 03/01/35 - 06/01/35 | | | 609,916 | | | | 684,332 | (d) |
6.63% | | 11/15/30 | | | 1,200,000 | | | | 1,560,934 | |
2.50% | | TBA | | | 2,934,000 | | | | 2,864,158 | (f) |
3.00% | | TBA | | | 6,300,000 | | | | 6,016,176 | (f) |
3.50% | | TBA | | | 15,900,000 | | | | 16,391,578 | (f) |
4.00% | | TBA | | | 13,667,000 | | | | 14,205,551 | (f) |
| | | | | | | | | | |
4.50% | | TBA | | | 6,900,000 | | | | 7,335,972 | (f) |
5.00% | | TBA | | | 3,700,000 | | | | 4,018,258 | (f) |
5.50% | | TBA | | | 700,000 | | | | 769,973 | (f) |
6.00% | | TBA | | | 333,000 | | | | 369,344 | (f) |
Government National Mortgage Assoc. | | | | | | | | | | |
3.00% | | 10/15/42 | | | 6,626,300 | | | | 6,411,885 | |
3.50% | | 10/20/42 | | | 17,619,282 | | | | 17,802,287 | |
4.00% | | 12/20/40 - 08/15/41 | | | 10,721,849 | | | | 11,173,359 | |
4.50% | | 05/20/40 | | | 6,330,572 | | | | 6,786,826 | |
5.00% | | 08/15/41 | | | 6,566,263 | | | | 7,196,024 | |
3.00% | | TBA | | | 5,400,000 | | | | 5,217,328 | (f) |
4.50% | | TBA | | | 1,000,000 | | | | 1,069,141 | (f) |
| | | | | | | | | 307,798,075 | |
| | | |
Asset Backed—0.1% | | | | | | | | | | |
AmeriCredit Automobile Receivables Trust 2012-2 | | | | | | | | | | |
3.38% | | 04/09/18 | | | 1,000,000 | | | | 1,035,762 | |
Chase Issuance Trust 2012-A8 | | | | | | | | | | |
0.54% | | 10/16/17 | | | 1,000,000 | | | | 998,638 | |
Citibank Credit Card Issuance Trust 2007-A8 | | | | | | | | | | |
5.65% | | 09/20/19 | | | 1,000,000 | | | | 1,145,345 | |
| | | | | | | | | 3,179,745 | |
| | | |
Corporate Notes—8.2% | | | | | | | | | | |
21st Century Fox America Inc. | | | | | | | | | | |
6.65% | | 11/15/37 | | | 579,000 | | | | 675,845 | |
ABB Finance USA Inc. | | | | | | | | | | |
1.63% | | 05/08/17 | | | 869,000 | | | | 867,272 | (d) |
Abbey National Treasury Services PLC | | | | | | | | | | |
3.05% | | 08/23/18 | | | 250,000 | | | | 256,883 | |
AbbVie Inc. | | | | | | | | | | |
1.75% | | 11/06/17 | | | 875,000 | | | | 873,501 | |
4.40% | | 11/06/42 | | | 250,000 | | | | 233,169 | |
ACE INA Holdings Inc. | | | | | | | | | | |
2.70% | | 03/13/23 | | | 250,000 | | | | 229,081 | |
Actavis Inc. | | | | | | | | | | |
3.25% | | 10/01/22 | | | 1,000,000 | | | | 932,719 | |
Aetna Inc. | | | | | | | | | | |
1.50% | | 11/15/17 | | | 713,000 | | | | 702,513 | |
2.75% | | 11/15/22 | | | 500,000 | | | | 460,576 | |
Aflac Inc. | | | | | | | | | | |
2.65% | | 02/15/17 | | | 250,000 | | | | 257,977 | |
Agilent Technologies Inc. | | | | | | | | | | |
5.50% | | 09/14/15 | | | 909,000 | | | | 980,000 | (d) |
Agrium Inc. | | | | | | | | | | |
6.75% | | 01/15/19 | | | 1,000,000 | | | | 1,179,798 | |
Alcoa Inc. | | | | | | | | | | |
5.55% | | 02/01/17 | | | 750,000 | | | | 807,270 | |
Altria Group Inc. | | | | | | | | | | |
4.25% | | 08/09/42 | | | 663,000 | | | | 565,817 | |
5.38% | | 01/31/44 | | | 70,000 | | | | 70,290 | |
Amazon.com Inc. | | | | | | | | | | |
1.20% | | 11/29/17 | | | 873,000 | | | | 854,748 | |
America Movil SAB de C.V. | | | | | | | | | | |
2.38% | | 09/08/16 | | | 1,000,000 | | | | 1,029,170 | (d) |
3.13% | | 07/16/22 | | | 750,000 | | | | 692,361 | |
| | | | | | | | | | |
American Express Co. | | | | | | | | | | |
7.00% | | 03/19/18 | | | 1,000,000 | | | | 1,194,843 | |
American Express Credit Corp. | | | | | | | | | | |
1.75% | | 06/12/15 | | | 610,000 | | | | 619,844 | (d) |
American International Group Inc. | | | | | | | | | | |
4.88% | | 06/01/22 | | | 1,000,000 | | | | 1,074,823 | |
8.18% | | 05/15/68 | | | 250,000 | | | | 302,500 | (e) |
American Tower Corp. (REIT) | | | | | | | | | | |
3.50% | | 01/31/23 | | | 500,000 | | | | 455,873 | |
Amgen Inc. | | | | | | | | | | |
5.38% | | 05/15/43 | | | 817,000 | | | | 838,827 | (d) |
Anadarko Petroleum Corp. | | | | | | | | | | |
6.20% | | 03/15/40 | | | 442,000 | | | | 488,912 | |
Anheuser-Busch InBev Worldwide Inc. | | | | | | | | | | |
2.50% | | 07/15/22 | | | 892,000 | | | | 825,071 | |
7.75% | | 01/15/19 | | | 500,000 | | | | 624,329 | |
Aon PLC | | | | | | | | | | |
4.25% | | 12/12/42 | | | 250,000 | | | | 214,495 | |
Apache Corp. | | | | | | | | | | |
5.10% | | 09/01/40 | | | 750,000 | | | | 761,496 | |
Apple Inc. | | | | | | | | | | |
1.00% | | 05/03/18 | | | 250,000 | | | | 241,737 | |
Archer-Daniels-Midland Co. | | | | | | | | | | |
4.02% | | 04/16/43 | | | 620,000 | | | | 527,106 | |
Arizona Public Service Co. | | | | | | | | | | |
6.25% | | 08/01/16 | | | 273,000 | | | | 306,297 | (d) |
Arrow Electronics Inc. | | | | | | | | | | |
3.00% | | 03/01/18 | | | 250,000 | | | | 250,129 | |
Asian Development Bank | | | | | | | | | | |
2.63% | | 02/09/15 | | | 1,500,000 | | | | 1,538,565 | |
AstraZeneca PLC | | | | | | | | | | |
6.45% | | 09/15/37 | | | 250,000 | | | | 298,525 | |
AT&T Inc. | | | | | | | | | | |
0.88% | | 02/13/15 | | | 899,000 | | | | 900,898 | (d) |
2.95% | | 05/15/16 | | | 844,000 | | | | 880,078 | (d) |
4.35% | | 06/15/45 | | | 750,000 | | | | 634,944 | |
5.55% | | 08/15/41 | | | 954,000 | | | | 968,176 | (d) |
Australia & New Zealand Banking Group Ltd. | | | | | | | | | | |
0.90% | | 02/12/16 | | | 500,000 | | | | 499,441 | |
Autodesk Inc. | | | | | | | | | | |
1.95% | | 12/15/17 | | | 888,000 | | | | 878,442 | |
Avon Products Inc. | | | | | | | | | | |
4.60% | | 03/15/20 | | | 250,000 | | | | 247,910 | |
AXA S.A. | | | | | | | | | | |
8.60% | | 12/15/30 | | | 100,000 | | | | 123,125 | |
Baidu Inc. | | | | | | | | | | |
3.25% | | 08/06/18 | | | 205,000 | | | | 207,214 | |
Bank of America Corp. | | | | | | | | | | |
1.50% | | 10/09/15 | | | 1,000,000 | | | | 1,010,069 | |
5.42% | | 03/15/17 | | | 800,000 | | | | 879,510 | |
5.70% | | 01/24/22 | | | 1,321,000 | | | | 1,495,180 | (d) |
5.75% | | 12/01/17 | | | 1,360,000 | | | | 1,547,834 | (d) |
Bank of Montreal | | | | | | | | | | |
1.45% | | 04/09/18 | | | 500,000 | | | | 486,875 | |
| | | | | | | | | | |
Bank of Nova Scotia | | | | | | | | | | |
0.75% | | 10/09/15 | | | 500,000 | | | | 501,633 | |
2.05% | | 10/30/18 | | | 250,000 | | | | 247,654 | |
Barclays Bank PLC | | | | | | | | | | |
5.00% | | 09/22/16 | | | 1,000,000 | | | | 1,100,944 | |
Barrick Gold Corp. | | | | | | | | | | |
6.95% | | 04/01/19 | | | 750,000 | | | | 865,709 | |
Baxter International Inc. | | | | | | | | | | |
1.85% | | 06/15/18 | | | 500,000 | | | | 493,746 | |
BB&T Corp. | | | | | | | | | | |
2.05% | | 06/19/18 | | | 350,000 | | | | 346,513 | |
2.15% | | 03/22/17 | | | 500,000 | | | | 505,522 | |
Berkshire Hathaway Finance Corp. | | | | | | | | | | |
1.60% | | 05/15/17 | | | 944,000 | | | | 953,104 | (d) |
3.00% | | 05/15/22 | | | 500,000 | | | | 479,328 | (d) |
BHP Billiton Finance USA Ltd. | | | | | | | | | | |
2.05% | | 09/30/18 | | | 325,000 | | | | 324,960 | |
BNP Paribas S.A. | | | | | | | | | | |
2.38% | | 09/14/17 | | | 750,000 | | | | 765,724 | |
2.40% | | 12/12/18 | | | 250,000 | | | | 250,159 | |
Boeing Capital Corp. | | | | | | | | | | |
4.70% | | 10/27/19 | | | 250,000 | | | | 280,514 | |
Boston Properties LP (REIT) | | | | | | | | | | |
3.85% | | 02/01/23 | | | 250,000 | | | | 244,262 | |
Boston Scientific Corp. | | | | | | | | | | |
2.65% | | 10/01/18 | | | 500,000 | | | | 503,401 | |
4.13% | | 10/01/23 | | | 100,000 | | | | 99,191 | |
BP Capital Markets PLC | | | | | | | | | | |
2.25% | | 11/01/16 | | | 1,425,000 | | | | 1,474,677 | (d) |
2.50% | | 11/06/22 | | | 500,000 | | | | 455,242 | |
Bristol-Myers Squibb Co. | | | | | | | | | | |
2.00% | | 08/01/22 | | | 500,000 | | | | 442,575 | |
British Telecommunications PLC | | | | | | | | | | |
9.63% | | 12/15/30 | | | 250,000 | | | | 373,061 | |
Buckeye Partners LP | | | | | | | | | | |
4.15% | | 07/01/23 | | | 250,000 | | | | 240,385 | |
Burlington Northern Santa Fe LLC | | | | | | | | | | |
5.75% | | 05/01/40 | | | 750,000 | | | | 823,045 | |
Capital One Financial Corp. | | | | | | | | | | |
1.00% | | 11/06/15 | | | 1,000,000 | | | | 999,564 | |
Cardinal Health Inc. | | | | | | | | | | |
3.20% | | 03/15/23 | | | 500,000 | | | | 468,130 | |
CareFusion Corp. | | | | | | | | | | |
3.30% | | 03/01/23 | | | 250,000 | | | | 228,450 | (g) |
Caterpillar Financial Services Corp. | | | | | | | | | | |
1.25% | | 11/06/17 | | | 611,000 | | | | 602,247 | |
Caterpillar Inc. | | | | | | | | | | |
1.50% | | 06/26/17 | | | 1,073,000 | | | | 1,067,799 | |
Catholic Health Initiatives | | | | | | | | | | |
1.60% | | 11/01/17 | | | 175,000 | | | | 169,618 | |
CBS Corp. | | | | | | | | | | |
3.38% | | 03/01/22 | | | 250,000 | | | | 238,601 | |
Celgene Corp. | | | | | | | | | | |
5.25% | | 08/15/43 | | | 220,000 | | | | 221,808 | |
Cenovus Energy Inc. | | | | | | | | | | |
3.80% | | 09/15/23 | | | 250,000 | | | | 243,721 | |
| | | | | | | | | | |
CF Industries Inc. | | | | | | | | | | |
3.45% | | 06/01/23 | | | 250,000 | | | | 228,307 | |
Chevron Corp. | | | | | | | | | | |
1.72% | | 06/24/18 | | | 750,000 | | | | 747,169 | |
2.43% | | 06/24/20 | | | 75,000 | | | | 72,980 | |
Cigna Corp. | | | | | | | | | | |
2.75% | | 11/15/16 | | | 250,000 | | | | 260,206 | (d) |
5.38% | | 02/15/42 | | | 250,000 | | | | 259,925 | (d) |
Cisco Systems Inc. | | | | | | | | | | |
5.90% | | 02/15/39 | | | 500,000 | | | | 555,888 | |
Citigroup Inc. | | | | | | | | | | |
1.30% | | 11/15/16 | | | 500,000 | | | | 498,255 | |
1.70% | | 07/25/16 | | | 500,000 | | | | 504,711 | |
3.88% | | 10/25/23 | | | 500,000 | | | | 491,529 | |
5.38% | | 08/09/20 | | | 1,500,000 | | | | 1,706,463 | |
5.88% | | 01/30/42 | | | 272,000 | | | | 305,694 | |
6.13% | | 08/25/36 | | | 347,000 | | | | 369,961 | |
Cliffs Natural Resources Inc. | | | | | | | | | | |
3.95% | | 01/15/18 | | | 250,000 | | | | 252,449 | |
CNA Financial Corp. | | | | | | | | | | |
5.88% | | 08/15/20 | | | 781,000 | | | | 890,364 | (d) |
Comcast Corp. | | | | | | | | | | |
4.25% | | 01/15/33 | | | 1,000,000 | | | | 928,919 | |
5.15% | | 03/01/20 | | | 500,000 | | | | 557,784 | |
Commonwealth Edison Co. | | | | | | | | | | |
4.60% | | 08/15/43 | | | 250,000 | | | | 242,325 | |
ConAgra Foods Inc. | | | | | | | | | | |
1.30% | | 01/25/16 | | | 750,000 | | | | 751,300 | |
ConocoPhillips | | | | | | | | | | |
6.50% | | 02/01/39 | | | 750,000 | | | | 940,513 | |
Consolidated Edison Company of New York Inc. | | | | | | | | | | |
3.95% | | 03/01/43 | | | 250,000 | | | | 220,572 | |
Continental Resources Inc. | | | | | | | | | | |
4.50% | | 04/15/23 | | | 250,000 | | | | 253,438 | |
Cooperatieve Centrale Raiffeisen-Boerenleenbank BA | | | | | | | | | | |
3.95% | | 11/09/22 | | | 500,000 | | | | 484,495 | |
4.63% | | 12/01/23 | | | 250,000 | | | | 251,755 | |
Corp Andina de Fomento | | | | | | | | | | |
4.38% | | 06/15/22 | | | 250,000 | | | | 247,545 | |
Covidien International Finance S.A. | | | | | | | | | | |
1.35% | | 05/29/15 | | | 708,000 | | | | 713,194 | |
COX Communications Inc. | | | | | | | | | | |
4.70% | | 12/15/42 | | | 218,000 | | | | 183,082 | (g) |
Credit Suisse | | | | | | | | | | |
5.30% | | 08/13/19 | | | 1,000,000 | | | | 1,122,538 | |
Crown Castle Towers LLC | | | | | | | | | | |
6.11% | | 01/15/40 | | | 326,000 | | | | 365,554 | (g,d) |
CSX Corp. | | | | | | | | | | |
4.10% | | 03/15/44 | | | 568,000 | | | | 481,324 | |
CVS Caremark Corp. | | | | | | | | | | |
2.75% | | 12/01/22 | | | 500,000 | | | | 461,487 | |
DCP Midstream Operating LP | | | | | | | | | | |
2.50% | | 12/01/17 | | | 873,000 | | | | 869,244 | |
DDR Corp. (REIT) | | | | | | | | | | |
4.63% | | 07/15/22 | | | 626,000 | | | | 638,506 | |
| | | | | | | | | | |
Deere & Co. | | | | | | | | | | |
3.90% | | 06/09/42 | | | 471,000 | | | | 413,228 | |
Delhaize Group S.A. | | | | | | | | | | |
4.13% | | 04/10/19 | | | 500,000 | | | | 514,020 | |
DENTSPLY International Inc. | | | | | | | | | | |
2.75% | | 08/15/16 | | | 725,000 | | | | 746,003 | (d) |
4.13% | | 08/15/21 | | | 250,000 | | | | 250,303 | (d) |
Deutsche Bank AG | | | | | | | | | | |
3.25% | | 01/11/16 | | | 500,000 | | | | 522,932 | |
Deutsche Telekom International Finance BV | | | | | | | | | | |
8.75% | | 06/15/30 | | | 250,000 | | | | 352,696 | |
Devon Energy Corp. | | | | | | | | | | |
2.25% | | 12/15/18 | | | 500,000 | | | | 494,761 | |
3.25% | | 05/15/22 | | | 500,000 | | | | 476,774 | |
Diageo Capital PLC | | | | | | | | | | |
1.50% | | 05/11/17 | | | 500,000 | | | | 498,920 | (d) |
Diageo Investment Corp. | | | | | | | | | | |
2.88% | | 05/11/22 | | | 500,000 | | | | 476,615 | (d) |
DIRECTV Holdings LLC | | | | | | | | | | |
5.15% | | 03/15/42 | | | 500,000 | | | | 449,051 | (d) |
Discover Bank | | | | | | | | | | |
4.20% | | 08/08/23 | | | 350,000 | | | | 345,209 | |
Discovery Communications LLC | | | | | | | | | | |
3.25% | | 04/01/23 | | | 325,000 | | | | 301,870 | |
Dominion Resources Inc. | | | | | | | | | | |
1.95% | | 08/15/16 | | | 667,000 | | | | 678,037 | (d) |
DTE Energy Co. | | | | | | | | | | |
3.85% | | 12/01/23 | | | 250,000 | | | | 246,831 | |
Duke Energy Corp. | | | | | | | | | | |
1.63% | | 08/15/17 | | | 884,000 | | | | 878,413 | |
3.05% | | 08/15/22 | | | 2,639,000 | | | | 2,506,649 | |
Eastman Chemical Co. | | | | | | | | | | |
2.40% | | 06/01/17 | | | 1,000,000 | | | | 1,010,716 | (d) |
Eaton Corp. | | | | | | | | | | |
1.50% | | 11/02/17 | | | 1,310,000 | | | | 1,284,235 | |
eBay Inc. | | | | | | | | | | |
1.35% | | 07/15/17 | | | 619,000 | | | | 615,474 | |
Ecolab Inc. | | | | | | | | | | |
1.45% | | 12/08/17 | | | 750,000 | | | | 732,916 | |
Ecopetrol S.A. | | | | | | | | | | |
7.63% | | 07/23/19 | | | 345,000 | | | | 408,825 | (d) |
EMC Corp. | | | | | | | | | | |
1.88% | | 06/01/18 | | | 500,000 | | | | 494,320 | |
Emerson Electric Co. | | | | | | | | | | |
2.63% | | 02/15/23 | | | 500,000 | | | | 466,996 | |
Encana Corp. | | | | | | | | | | |
3.90% | | 11/15/21 | | | 500,000 | | | | 496,443 | |
Energy Transfer Partners LP | | | | | | | | | | |
6.50% | | 02/01/42 | | | 500,000 | | | | 537,377 | (d) |
6.70% | | 07/01/18 | | | 701,000 | | | | 813,899 | (d) |
Entergy Louisiana LLC | | | | | | | | | | |
4.05% | | 09/01/23 | | | 250,000 | | | | 253,874 | |
Enterprise Products Operating LLC | | | | | | | | | | |
4.45% | | 02/15/43 | | | 442,000 | | | | 390,426 | |
| | | | | | | | | | |
ERP Operating LP (REIT) | | | | | | | | | | |
3.00% | | 04/15/23 | | | 250,000 | | | | 228,285 | |
European Bank for Reconstruction & Development | | | | | | | | | | |
1.00% | | 02/16/17 | | | 1,000,000 | | | | 1,002,360 | |
European Investment Bank | | | | | | | | | | |
1.00% | | 07/15/15 | | | 2,000,000 | | | | 2,019,480 | |
4.88% | | 01/17/17 | | | 2,040,000 | | | | 2,276,232 | (d) |
Exelon Corp. | | | | | | | | | | |
4.90% | | 06/15/15 | | | 1,393,000 | | | | 1,468,644 | (d) |
Express Scripts Holding Co. | | | | | | | | | | |
3.13% | | 05/15/16 | | | 1,421,000 | | | | 1,483,116 | (d) |
4.75% | | 11/15/21 | | | 474,000 | | | | 500,859 | |
FedEx Corp. | | | | | | | | | | |
2.70% | | 04/15/23 | | | 200,000 | | | | 179,768 | |
Fifth Third BanCorp | | | | | | | | | | |
4.50% | | 06/01/18 | | | 500,000 | | | | 533,186 | |
Florida Power & Light Co. | | | | | | | | | | |
4.13% | | 02/01/42 | | | 500,000 | | | | 460,174 | |
Ford Motor Co. | | | | | | | | | | |
4.75% | | 01/15/43 | | | 800,000 | | | | 721,499 | |
Ford Motor Credit Company LLC | | | | | | | | | | |
2.75% | | 05/15/15 | | | 1,000,000 | | | | 1,025,842 | |
France Telecom S.A. | | | | | | | | | | |
8.75% | | 03/01/31 | | | 250,000 | | | | 345,169 | |
Freeport-McMoRan Copper & Gold Inc. | | | | | | | | | | |
3.10% | | 03/15/20 | | | 500,000 | | | | 485,766 | |
General Electric Capital Corp. | | | | | | | | | | |
2.15% | | 01/09/15 | | | 1,000,000 | | | | 1,018,315 | (c) |
5.00% | | 01/08/16 | | | 750,000 | | | | 810,533 | (c) |
5.50% | | 01/08/20 | | | 1,000,000 | | | | 1,145,163 | (c) |
6.75% | | 03/15/32 | | | 1,250,000 | | | | 1,547,881 | (c) |
General Electric Co. | | | | | | | | | | |
5.25% | | 12/06/17 | | | 1,000,000 | | | | 1,131,942 | (c) |
Genworth Holdings Inc. | | | | | | | | | | |
6.52% | | 05/22/18 | | | 250,000 | | | | 284,353 | |
Georgia Power Co. | | | | | | | | | | |
4.30% | | 03/15/42 | | | 472,000 | | | | 424,616 | |
GlaxoSmithKline Capital PLC | | | | | | | | | | |
1.50% | | 05/08/17 | | | 1,000,000 | | | | 1,000,446 | |
Goldman Sachs Capital I | | | | | | | | | | |
6.35% | | 02/15/34 | | | 503,000 | | | | 507,529 | |
Great Plains Energy Inc. | | | | | | | | | | |
4.85% | | 06/01/21 | | | 1,004,000 | | | | 1,057,855 | (d) |
Halliburton Co. | | | | | | | | | | |
3.50% | | 08/01/23 | | | 900,000 | | | | 872,436 | |
Hartford Financial Services Group Inc. | | | | | | | | | | |
4.00% | | 10/15/17 | | | 500,000 | | | | 531,810 | |
HCP Inc. (REIT) | | | | | | | | | | |
2.63% | | 02/01/20 | | | 500,000 | | | | 476,594 | |
Healthcare REIT Inc. | | | | | | | | | | |
2.25% | | 03/15/18 | | | 500,000 | | | | 494,326 | |
5.13% | | 03/15/43 | | | 250,000 | | | | 231,486 | |
Hess Corp. | | | | | | | | | | |
8.13% | | 02/15/19 | | | 500,000 | | | | 621,057 | |
| | | | | | | | | | |
Hewlett-Packard Co. | | | | | | | | | | |
2.13% | | 09/13/15 | | | 750,000 | | | | 763,706 | |
6.00% | | 09/15/41 | | | 262,000 | | | | 262,505 | |
Honeywell International Inc. | | | | | | | | | | |
3.35% | | 12/01/23 | | | 450,000 | | | | 440,464 | |
HSBC Bank USA NA | | | | | | | | | | |
5.88% | | 11/01/34 | | | 500,000 | | | | 549,669 | |
HSBC Finance Corp. | | | | | | | | | | |
6.68% | | 01/15/21 | | | 250,000 | | | | 287,259 | |
HSBC Holdings PLC | | | | | | | | | | |
5.10% | | 04/05/21 | | | 1,000,000 | | | | 1,111,449 | |
Indiana Michigan Power Co. | | | | | | | | | | |
3.20% | | 03/15/23 | | | 750,000 | | | | 701,096 | |
ING US Inc. | | | | | | | | | | |
2.90% | | 02/15/18 | | | 250,000 | | | | 255,697 | |
Ingersoll-Rand Global Holding Company Ltd. | | | | | | | | | | |
4.25% | | 06/15/23 | | | 200,000 | | | | 195,342 | (g) |
Intel Corp. | | | | | | | | | | |
1.35% | | 12/15/17 | | | 872,000 | | | | 861,832 | |
4.25% | | 12/15/42 | | | 186,000 | | | | 164,389 | |
Inter-American Development Bank | | | | | | | | | | |
1.38% | | 10/18/16 | | | 1,500,000 | | | | 1,523,806 | |
International Bank for Reconstruction & Development | | | | | | | | | | |
2.38% | | 05/26/15 | | | 1,500,000 | | | | 1,543,242 | |
International Business Machines Corp. | | | | | | | | | | |
4.00% | | 06/20/42 | | | 750,000 | | | | 669,691 | |
International Finance Corp. | | | | | | | | | | |
2.75% | | 04/20/15 | | | 1,000,000 | | | | 1,031,008 | |
International Paper Co. | | | | | | | | | | |
7.95% | | 06/15/18 | | | 1,000,000 | | | | 1,214,692 | |
Intesa Sanpaolo S.p.A. | | | | | | | | | | |
3.88% | | 01/15/19 | | | 200,000 | | | | 198,843 | |
Invesco Finance PLC | | | | | | | | | | |
3.13% | | 11/30/22 | | | 500,000 | | | | 462,648 | |
Jabil Circuit Inc. | | | | | | | | | | |
4.70% | | 09/15/22 | | | 223,000 | | | | 214,080 | |
Jefferies Group Inc. | | | | | | | | | | |
5.13% | | 01/20/23 | | | 250,000 | | | | 252,867 | |
John Deere Capital Corp. | | | | | | | | | | |
1.95% | | 12/13/18 | | | 500,000 | | | | 496,816 | |
Johnson & Johnson | | | | | | | | | | |
4.38% | | 12/05/33 | | | 250,000 | | | | 251,628 | |
JPMorgan Chase & Co. | | | | | | | | | | |
1.10% | | 10/15/15 | | | 2,000,000 | | | | 2,007,628 | |
3.25% | | 09/23/22 | | | 436,000 | | | | 417,828 | |
3.38% | | 05/01/23 | | | 250,000 | | | | 233,000 | |
4.50% | | 01/24/22 | | | 703,000 | | | | 743,585 | |
6.30% | | 04/23/19 | | | 1,000,000 | | | | 1,180,254 | |
6.40% | | 05/15/38 | | | 500,000 | | | | 596,752 | |
KeyCorp | | | | | | | | | | |
2.30% | | 12/13/18 | | | 170,000 | | | | 168,767 | |
KFW | | | | | | | | | | |
2.00% | | 10/04/22 | | | 1,500,000 | | | | 1,373,748 | |
4.50% | | 07/16/18 | | | 1,567,000 | | | | 1,754,727 | (d) |
| | | | | | | | | | |
Kinder Morgan Energy Partners LP | | | | | | | | | | |
2.65% | | 02/01/19 | | | 740,000 | | | | 731,793 | |
3.50% | | 09/01/23 | | | 300,000 | | | | 275,455 | |
5.00% | | 08/15/42 | | | 442,000 | | | | 408,214 | |
Kinross Gold Corp. | | | | | | | | | | |
6.88% | | 09/01/41 | | | 250,000 | | | | 224,020 | |
Koninklijke Philips N.V. | | | | | | | | | | |
3.75% | | 03/15/22 | | | 500,000 | | | | 500,270 | |
Kraft Foods Group Inc. | | | | | | | | | | |
1.63% | | 06/04/15 | | | 579,000 | | | | 586,354 | |
2.25% | | 06/05/17 | | | 443,000 | | | | 448,570 | |
5.00% | | 06/04/42 | | | 500,000 | | | | 492,896 | |
L-3 Communications Corp. | | | | | | | | | | |
5.20% | | 10/15/19 | | | 500,000 | | | | 540,425 | |
Laboratory Corp. of America Holdings | | | | | | | | | | |
4.00% | | 11/01/23 | | | 200,000 | | | | 192,183 | |
Landwirtschaftliche Rentenbank | | | | | | | | | | |
0.88% | | 09/12/17 | | | 500,000 | | | | 493,350 | |
Lincoln National Corp. | | | | | | | | | | |
4.00% | | 09/01/23 | | | 200,000 | | | | 197,374 | |
4.20% | | 03/15/22 | | | 317,000 | | | | 323,029 | |
Lockheed Martin Corp. | | | | | | | | | | |
4.25% | | 11/15/19 | | | 1,000,000 | | | | 1,075,331 | |
Loews Corp. | | | | | | | | | | |
2.63% | | 05/15/23 | | | 400,000 | | | | 358,370 | |
Lorillard Tobacco Co. | | | | | | | | | | |
3.75% | | 05/20/23 | | | 500,000 | | | | 455,185 | |
Lowe’s Companies Inc. | | | | | | | | | | |
3.12% | | 04/15/22 | | | 750,000 | | | | 727,228 | |
LyondellBasell Industries N.V. | | | | | | | | | | |
6.00% | | 11/15/21 | | | 250,000 | | | | 287,528 | |
Macy’s Retail Holdings Inc. | | | | | | | | | | |
3.88% | | 01/15/22 | | | 500,000 | | | | 492,839 | |
Marsh & McLennan Companies Inc. | | | | | | | | | | |
4.05% | | 10/15/23 | | | 250,000 | | | | 246,293 | |
McDonald’s Corp. | | | | | | | | | | |
1.88% | | 05/29/19 | | | 500,000 | | | | 487,853 | (d) |
3.70% | | 02/15/42 | | | 250,000 | | | | 211,728 | |
Medtronic Inc. | | | | | | | | | | |
4.50% | | 03/15/42 | | | 250,000 | | | | 236,801 | |
Memorial Sloan-Kettering Cancer Center | | | | | | | | | | |
4.13% | | 07/01/52 | | | 395,000 | | | | 324,946 | |
Merck & Company Inc. | | | | | | | | | | |
2.40% | | 09/15/22 | | | 878,000 | | | | 801,994 | |
Merrill Lynch & Company Inc. | | | | | | | | | | |
6.11% | | 01/29/37 | | | 250,000 | | | | 269,618 | |
MetLife Inc. | | | | | | | | | | |
1.76% | | 12/15/17 | | | 500,000 | | | | 494,696 | |
4.13% | | 08/13/42 | | | 250,000 | | | | 217,406 | |
6.50% | | 12/15/32 | | | 250,000 | | | | 297,458 | |
Microsoft Corp. | | | | | | | | | | |
0.88% | | 11/15/17 | | | 1,000,000 | | | | 984,538 | |
3.75% | | 05/01/43 | | | 300,000 | | | | 255,939 | |
MidAmerican Energy Holdings Co. | | | | | | | | | | |
6.13% | | 04/01/36 | | | 1,000,000 | | | | 1,136,064 | (d) |
| | | | | | | | | | |
Mondelez International Inc. | | | | | | | | | | |
5.38% | | 02/10/20 | | | 1,000,000 | | | | 1,129,390 | |
Moody’s Corp. | | | | | | | | | | |
4.88% | | 02/15/24 | | | 250,000 | | | | 249,774 | |
Morgan Stanley | | | | | | | | | | |
4.10% | | 05/22/23 | | | 250,000 | | | | 241,938 | |
4.75% | | 03/22/17 | | | 639,000 | | | | 697,352 | |
4.88% | | 11/01/22 | | | 250,000 | | | | 255,915 | |
5.50% | | 07/28/21 | | | 898,000 | | | | 1,003,477 | |
5.75% | | 01/25/21 | | | 473,000 | | | | 535,088 | |
6.63% | | 04/01/18 | | | 433,000 | | | | 506,651 | |
Murphy Oil Corp. | | | | | | | | | | |
2.50% | | 12/01/17 | | | 500,000 | | | | 503,040 | |
3.70% | | 12/01/22 | | | 500,000 | | | | 462,003 | |
Mylan Inc. | | | | | | | | | | |
1.80% | | 06/24/16 | | | 250,000 | | | | 254,864 | (g) |
National Australia Bank Ltd. | | | | | | | | | | |
2.30% | | 07/25/18 | | | 500,000 | | | | 503,277 | |
NBCUniversal Media LLC | | | | | | | | | | |
5.15% | | 04/30/20 | | | 750,000 | | | | 838,309 | |
Newell Rubbermaid Inc. | | | | | | | | | | |
2.05% | | 12/01/17 | | | 500,000 | | | | 495,417 | |
Newmont Mining Corp. | | | | | | | | | | |
3.50% | | 03/15/22 | | | 250,000 | | | | 212,796 | |
Nexen Energy ULC | | | | | | | | | | |
6.40% | | 05/15/37 | | | 500,000 | | | | 569,157 | |
NextEra Energy Capital Holdings Inc. | | | | | | | | | | |
2.60% | | 09/01/15 | | | 1,706,000 | | | | 1,751,306 | (d) |
Nisource Finance Corp. | | | | | | | | | | |
3.85% | | 02/15/23 | | | 1,074,000 | | | | 1,033,448 | |
Noble Energy Inc. | | | | | | | | | | |
8.25% | | 03/01/19 | | | 500,000 | | | | 621,473 | |
Nomura Holdings Inc. | | | | | | | | | | |
2.00% | | 09/13/16 | | | 500,000 | | | | 504,133 | |
Norfolk Southern Corp. | | | | | | | | | | |
2.90% | | 02/15/23 | | | 500,000 | | | | 461,840 | |
4.80% | | 08/15/43 | | | 250,000 | | | | 242,120 | |
Northeast Utilities | | | | | | | | | | |
1.45% | | 05/01/18 | | | 250,000 | | | | 242,135 | |
Northrop Grumman Corp. | | | | | | | | | | |
1.75% | | 06/01/18 | | | 750,000 | | | | 731,671 | |
Novartis Capital Corp. | | | | | | | | | | |
2.40% | | 09/21/22 | | | 552,000 | | | | 506,090 | |
NYSE Euronext | | | | | | | | | | |
2.00% | | 10/05/17 | | | 500,000 | | | | 500,650 | |
Occidental Petroleum Corp. | | | | | | | | | | |
1.50% | | 02/15/18 | | | 500,000 | | | | 488,687 | |
Oglethorpe Power Corp. | | | | | | | | | | |
5.38% | | 11/01/40 | | | 491,000 | | | | 503,685 | |
Omnicom Group Inc. | | | | | | | | | | |
3.63% | | 05/01/22 | | | 500,000 | | | | 484,198 | |
ONEOK Partners LP | | | | | | | | | | |
3.38% | | 10/01/22 | | | 233,000 | | | | 217,811 | |
6.13% | | 02/01/41 | | | 562,000 | | | | 595,136 | (d) |
| | | | | | | | | | |
Oracle Corp. | | | | | | | | | | |
1.20% | | 10/15/17 | | | 2,185,000 | | | | 2,150,167 | |
3.63% | | 07/15/23 | | | 125,000 | | | | 123,996 | |
Owens Corning | | | | | | | | | | |
4.20% | | 12/15/22 | | | 250,000 | | | | 238,733 | |
Pacific Gas & Electric Co. | | | | | | | | | | |
6.05% | | 03/01/34 | | | 1,111,000 | | | | 1,272,645 | (d) |
PacifiCorp | | | | | | | | | | |
6.25% | | 10/15/37 | | | 153,000 | | | | 182,417 | |
Pentair Finance S.A. | | | | | | | | | | |
3.15% | | 09/15/22 | | | 500,000 | | | | 451,633 | |
PepsiCo Inc. | | | | | | | | | | |
2.75% | | 03/01/23 | | | 250,000 | | | | 231,391 | |
7.90% | | 11/01/18 | | | 1,000,000 | | | | 1,249,980 | |
Petrobras Global Finance BV | | | | | | | | | | |
4.38% | | 05/20/23 | | | 500,000 | | | | 445,446 | |
Petrobras International Finance Co. | | | | | | | | | | |
3.50% | | 02/06/17 | | | 1,183,000 | | | | 1,193,826 | (d) |
3.88% | | 01/27/16 | | | 420,000 | | | | 432,374 | |
Petrobras International Finance Co. - Pifco | | | | | | | | | | |
6.75% | | 01/27/41 | | | 250,000 | | | | 232,608 | |
Petroleos Mexicanos | | | | | | | | | | |
3.50% | | 07/18/18 | | | 500,000 | | | | 513,125 | |
5.50% | | 01/21/21 - 06/27/44 | | | 1,179,000 | | | | 1,238,338 | |
6.50% | | 06/02/41 | | | 167,000 | | | | 174,515 | |
Pfizer Inc. | | | | | | | | | | |
4.30% | | 06/15/43 | | | 350,000 | | | | 329,123 | |
6.20% | | 03/15/19 | | | 1,000,000 | | | | 1,185,430 | |
Philip Morris International Inc. | | | | | | | | | | |
2.50% | | 05/16/16 | | | 1,004,000 | | | | 1,041,943 | (d) |
3.88% | | 08/21/42 | | | 442,000 | | | | 374,150 | |
Plains All American Pipeline LP | | | | | | | | | | |
3.85% | | 10/15/23 | | | 500,000 | | | | 487,751 | |
Plains Exploration & Production Co. | | | | | | | | | | |
6.63% | | 05/01/21 | | | 425,000 | | | | 466,032 | |
PNC Funding Corp. | | | | | | | | | | |
2.70% | | 09/19/16 | | | 1,000,000 | | | | 1,043,063 | |
PPL Capital Funding Inc. | | | | | | | | | | |
3.40% | | 06/01/23 | | | 500,000 | | | | 465,246 | |
Praxair Inc. | | | | | | | | | | |
0.75% | | 02/21/16 | | | 500,000 | | | | 498,792 | |
Pride International Inc. | | | | | | | | | | |
6.88% | | 08/15/20 | | | 950,000 | | | | 1,137,508 | (d) |
Principal Financial Group Inc. | | | | | | | | | | |
1.85% | | 11/15/17 | | | 250,000 | | | | 247,739 | |
ProLogis LP (REIT) | | | | | | | | | | |
4.25% | | 08/15/23 | | | 250,000 | | | | 246,964 | |
Prudential Financial Inc. | | | | | | | | | | |
5.63% | | 05/12/41 | | | 475,000 | | | | 511,911 | (d) |
7.38% | | 06/15/19 | | | 350,000 | | | | 429,690 | |
Public Service Company of Colorado | | | | | | | | | | |
3.95% | | 03/15/43 | | | 250,000 | | | | 222,372 | |
Public Service Electric & Gas Co. | | | | | | | | | | |
2.38% | | 05/15/23 | | | 500,000 | | | | 449,584 | |
Qwest Corp. | | | | | | | | | | |
6.75% | | 12/01/21 | | | 500,000 | | | | 547,482 | |
| | | | | | | | | | |
Realty Income Corp. (REIT) | | | | | | | | | | |
4.65% | | 08/01/23 | | | 500,000 | | | | 503,549 | |
Republic Services Inc. | | | | | | | | | | |
5.50% | | 09/15/19 | | | 500,000 | | | | 562,618 | |
Reynolds American Inc. | | | | | | | | | | |
3.25% | | 11/01/22 | | | 500,000 | | | | 460,858 | |
Rio Tinto Finance USA Ltd. | | | | | | | | | | |
5.20% | | 11/02/40 | | | 750,000 | | | | 772,549 | |
Rogers Communications Inc. | | | | | | | | | | |
3.00% | | 03/15/23 | | | 250,000 | | | | 230,619 | |
Rowan Companies Inc. | | | | | | | | | | |
5.40% | | 12/01/42 | | | 250,000 | | | | 231,284 | |
Royal Bank of Canada | | | | | | | | | | |
0.80% | | 10/30/15 | | | 500,000 | | | | 501,232 | |
1.20% | | 09/19/18 | | | 500,000 | | | | 495,416 | |
Royal Bank of Scotland Group PLC | | | | | | | | | | |
6.40% | | 10/21/19 | | | 500,000 | | | | 576,162 | |
San Diego Gas & Electric Co. | | | | | | | | | | |
3.60% | | 09/01/23 | | | 500,000 | | | | 499,751 | |
Sanofi | | | | | | | | | | |
1.25% | | 04/10/18 | | | 500,000 | | | | 486,807 | |
Santander Holdings USA Inc. | | | | | | | | | | |
3.00% | | 09/24/15 | | | 438,000 | | | | 452,300 | |
Seagate HDD Cayman | | | | | | | | | | |
3.75% | | 11/15/18 | | | 125,000 | | | | 126,406 | (g) |
4.75% | | 06/01/23 | | | 250,000 | | | | 233,750 | (g) |
Sempra Energy | | | | | | | | | | |
4.05% | | 12/01/23 | | | 250,000 | | | | 246,859 | |
Shell International Finance BV | | | | | | | | | | |
2.00% | | 11/15/18 | | | 225,000 | | | | 225,142 | |
4.38% | | 03/25/20 | | | 1,000,000 | | | | 1,096,246 | |
Simon Property Group LP (REIT) | | | | | | | | | | |
2.75% | | 02/01/23 | | | 621,000 | | | | 567,469 | |
Spectra Energy Capital LLC | | | | | | | | | | |
3.30% | | 03/15/23 | | | 250,000 | | | | 221,404 | |
Stanley Black & Decker Inc. | | | | | | | | | | |
2.90% | | 11/01/22 | | | 250,000 | | | | 232,257 | |
State Street Corp. | | | | | | | | | | |
3.70% | | 11/20/23 | | | 275,000 | | | | 272,838 | |
Statoil ASA | | | | | | | | | | |
2.45% | | 01/17/23 | | | 750,000 | | | | 683,635 | |
Sumitomo Mitsui Banking Corp. | | | | | | | | | | |
2.50% | | 07/19/18 | | | 500,000 | | | | 502,221 | |
Suncor Energy Inc. | | | | | | | | | | |
6.85% | | 06/01/39 | | | 250,000 | | | | 300,769 | |
SunTrust Banks Inc. | | | | | | | | | | |
2.35% | | 11/01/18 | | | 350,000 | | | | 348,146 | |
Svensk Exportkredit AB | | | | | | | | | | |
0.63% | | 05/31/16 | | | 500,000 | | | | 497,850 | |
Talisman Energy Inc. | | | | | | | | | | |
5.50% | | 05/15/42 | | | 250,000 | | | | 235,474 | |
Target Corp. | | | | | | | | | | |
4.00% | | 07/01/42 | | | 500,000 | | | | 433,705 | |
Teck Resources Ltd. | | | | | | | | | | |
2.50% | | 02/01/18 | | | 1,000,000 | | | | 1,006,038 | |
| | | | | | | | | | |
Telefonica Emisiones SAU | | | | | | | | | | |
5.88% | | 07/15/19 | | | 1,000,000 | | | | 1,115,101 | |
Textron Inc. | | | | | | | | | | |
6.20% | | 03/15/15 | | | 798,000 | | | | 846,529 | (d) |
The Allstate Corp. | | | | | | | | | | |
5.75% | | 08/15/53 | | | 250,000 | | | | 251,875 | (e) |
The Bank of New York Mellon Corp. | | | | | | | | | | |
1.20% | | 02/20/15 | | | 1,000,000 | | | | 1,007,681 | |
The Boeing Co. | | | | | | | | | | |
0.95% | | 05/15/18 | | | 325,000 | | | | 311,641 | |
The Charles Schwab Corp. | | | | | | | | | | |
2.20% | | 07/25/18 | | | 200,000 | | | | 200,713 | |
The Chubb Corp. | | | | | | | | | | |
6.38% | | 03/29/67 | | | 250,000 | | | | 270,625 | (e) |
The Coca-Cola Co. | | | | | | | | | | |
1.15% | | 04/01/18 | | | 250,000 | | | | 242,873 | |
2.45% | | 11/01/20 | | | 500,000 | | | | 485,657 | |
3.30% | | 09/01/21 | | | 326,000 | | | | 326,522 | |
The Dow Chemical Co. | | | | | | | | | | |
3.00% | | 11/15/22 | | | 437,000 | | | | 407,564 | |
4.38% | | 11/15/42 | | | 437,000 | | | | 383,700 | |
The Goldman Sachs Group Inc. | | | | | | | | | | |
1.60% | | 11/23/15 | | | 2,000,000 | | | | 2,021,496 | |
5.75% | | 01/24/22 | | | 1,000,000 | | | | 1,125,688 | (d) |
6.75% | | 10/01/37 | | | 700,000 | | | | 778,781 | |
The Home Depot Inc. | | | | | | | | | | |
4.20% | | 04/01/43 | | | 250,000 | | | | 227,825 | |
4.40% | | 04/01/21 | | | 500,000 | | | | 539,987 | |
The Korea Development Bank | | | | | | | | | | |
3.25% | | 03/09/16 | | | 897,000 | | | | 931,686 | (d) |
4.00% | | 09/09/16 | | | 518,000 | | | | 550,744 | (d) |
The Kroger Co. | | | | | | | | | | |
3.85% | | 08/01/23 | | | 500,000 | | | | 492,278 | |
The Procter & Gamble Co. | | | | | | | | | | |
4.70% | | 02/15/19 | | | 1,000,000 | | | | 1,116,937 | |
The Sherwin-Williams Co. | | | | | | | | | | |
1.35% | | 12/15/17 | | | 436,000 | | | | 424,538 | |
The Toronto-Dominion Bank | | | | | | | | | | |
2.63% | | 09/10/18 | | | 250,000 | | | | 254,970 | |
The Travelers Companies Inc. | | | | | | | | | | |
5.35% | | 11/01/40 | | | 250,000 | | | | 269,619 | |
The Western Union Co. | | | | | | | | | | |
2.88% | | 12/10/17 | | | 500,000 | | | | 507,619 | |
Thermo Fisher Scientific Inc. | | | | | | | | | | |
4.15% | | 02/01/24 | | | 25,000 | | | | 24,762 | |
Thomson Reuters Corp. | | | | | | | | | | |
4.50% | | 05/23/43 | | | 150,000 | | | | 126,973 | |
Time Warner Cable Inc. | | | | | | | | | | |
4.50% | | 09/15/42 | | | 500,000 | | | | 378,783 | |
6.75% | | 07/01/18 | | | 1,288,000 | | | | 1,444,412 | (d) |
Time Warner Inc. | | | | | | | | | | |
6.10% | | 07/15/40 | | | 1,000,000 | | | | 1,091,367 | |
Total Capital International S.A. | | | | | | | | | | |
1.55% | | 06/28/17 | | | 1,000,000 | | | | 1,000,215 | |
| | | | | | | | | | |
Toyota Motor Credit Corp. | | | | | | | | | | |
1.38% | | 01/10/18 | | | 1,000,000 | | | | 980,684 | |
TransAlta Corp. | | | | | | | | | | |
4.50% | | 11/15/22 | | | 873,000 | | | | 838,625 | |
TransCanada PipeLines Ltd. | | | | | | | | | | |
7.63% | | 01/15/39 | | | 350,000 | | | | 467,163 | |
Transocean Inc. | | | | | | | | | | |
3.80% | | 10/15/22 | | | 438,000 | | | | 415,148 | |
Tyco Electronics Group S.A. | | | | | | | | | | |
2.38% | | 12/17/18 | | | 80,000 | | | | 78,887 | |
U.S. Bancorp | | | | | | | | | | |
3.44% | | 02/01/16 | | | 1,525,000 | | | | 1,590,708 | |
UBS AG | | | | | | | | | | |
5.75% | | 04/25/18 | | | 1,000,000 | | | | 1,148,050 | |
Unilever Capital Corp. | | | | | | | | | | |
2.20% | | 03/06/19 | | | 400,000 | | | | 399,486 | |
Union Pacific Corp. | | | | | | | | | | |
4.75% | | 12/15/43 | | | 250,000 | | | | 243,530 | |
United Airlines 2013-1 Class A Pass Through Trust | | | | | | | | | | |
4.30% | | 02/15/27 | | | 250,000 | | | | 254,375 | (h) |
United Parcel Service Inc. | | | | | | | | | | |
2.45% | | 10/01/22 | | | 875,000 | | | | 804,050 | |
United Technologies Corp. | | | | | | | | | | |
1.80% | | 06/01/17 | | | 472,000 | | | | 479,275 | (d) |
4.50% | | 06/01/42 | | | 708,000 | | | | 687,530 | (d) |
UnitedHealth Group Inc. | | | | | | | | | | |
0.85% | | 10/15/15 | | | 437,000 | | | | 438,749 | |
1.40% | | 10/15/17 | | | 437,000 | | | | 431,482 | |
6.88% | | 02/15/38 | | | 250,000 | | | | 311,369 | |
Vale Overseas Ltd. | | | | | | | | | | |
6.88% | | 11/10/39 | | | 750,000 | | | | 775,817 | |
Valero Energy Corp. | | | | | | | | | | |
6.63% | | 06/15/37 | | | 500,000 | | | | 570,367 | |
Ventas Realty LP (REIT) | | | | | | | | | | |
2.00% | | 02/15/18 | | | 500,000 | | | | 491,502 | |
Verizon Communications Inc. | | | | | | | | | | |
2.00% | | 11/01/16 | | | 1,350,000 | | | | 1,377,487 | |
2.45% | | 11/01/22 | | | 436,000 | | | | 385,967 | |
3.85% | | 11/01/42 | | | 686,000 | | | | 560,328 | |
5.15% | | 09/15/23 | | | 1,250,000 | | | | 1,342,115 | |
6.40% | | 09/15/33 | | | 500,000 | | | | 575,060 | |
6.55% | | 09/15/43 | | | 500,000 | | | | 584,979 | |
Verizon New York Inc. | | | | | | | | | | |
7.38% | | 04/01/32 | | | 250,000 | | | | 283,423 | |
Viacom Inc. | | | | | | | | | | |
2.50% | | 12/15/16 | | | 1,159,000 | | | | 1,198,625 | (d) |
3.25% | | 03/15/23 | | | 200,000 | | | | 185,243 | |
5.85% | | 09/01/43 | | | 100,000 | | | | 105,122 | |
Virginia Electric and Power Co. | | | | | | | | | | |
4.65% | | 08/15/43 | | | 500,000 | | | | 497,992 | |
Vodafone Group PLC | | | | | | | | | | |
2.50% | | 09/26/22 | | | 376,000 | | | | 332,063 | |
4.38% | | 02/19/43 | | | 250,000 | | | | 216,032 | |
Wal-Mart Stores Inc. | | | | | | | | | | |
6.50% | | 08/15/37 | | | 1,250,000 | | | | 1,563,662 | |
| | | | | | | | | | |
Waste Management Inc. | | | | | | | | | | |
2.90% | | 09/15/22 | | | 500,000 | | | | 463,192 | |
Weatherford International Ltd. | | | | | | | | | | |
4.50% | | 04/15/22 | | | 250,000 | | | | 251,575 | (d) |
5.95% | | 04/15/42 | | | 250,000 | | | | 250,485 | (d) |
WellPoint Inc. | | | | | | | | | | |
1.88% | | 01/15/18 | | | 602,000 | | | | 595,264 | |
3.30% | | 01/15/23 | | | 500,000 | | | | 466,607 | |
3.70% | | 08/15/21 | | | 237,000 | | | | 236,124 | |
Wells Fargo & Co. | | | | | | | | | | |
1.50% | | 07/01/15 - 01/16/18 | | | 2,500,000 | | | | 2,514,633 | |
4.13% | | 08/15/23 | | | 250,000 | | | | 246,462 | |
5.38% | | 11/02/43 | | | 150,000 | | | | 153,601 | |
5.61% | | 01/15/44 | | | 569,000 | | | | 591,013 | (g) |
Wells Fargo Bank NA | | | | | | | | | | |
0.75% | | 07/20/15 | | | 500,000 | | | | 501,509 | |
Westpac Banking Corp. | | | | | | | | | | |
1.13% | | 09/25/15 | | | 1,000,000 | | | | 1,010,844 | |
Weyerhaeuser Co. (REIT) | | | | | | | | | | |
7.38% | | 03/15/32 | | | 100,000 | | | | 122,366 | |
Williams Partners LP | | | | | | | | | | |
5.80% | | 11/15/43 | | | 250,000 | | | | 255,183 | |
WPP Finance 2010 | | | | | | | | | | |
5.13% | | 09/07/42 | | | 441,000 | | | | 401,606 | |
Wyndham Worldwide Corp. | | | | | | | | | | |
4.25% | | 03/01/22 | | | 250,000 | | | | 243,993 | |
Xerox Corp. | | | | | | | | | | |
4.25% | | 02/15/15 | | | 500,000 | | | | 518,714 | |
Xstrata Finance Canada Ltd. | | | | | | | | | | |
5.80% | | 11/15/16 | | | 751,275 | | | | 827,729 | (d,g) |
Zoetis Inc. | | | | | | | | | | |
4.70% | | 02/01/43 | | | 500,000 | | | | 467,330 | |
| | | | | | | | | 245,164,567 | |
| | | |
Non-Agency Collateralized Mortgage Obligations—0.6% | | | | | | | | | | |
Banc of America Commercial Mortgage Trust 2006-4 | | | | | | | | | | |
5.63% | | 07/10/46 | | | 400,000 | | | | 433,606 | (d) |
5.68% | | 07/10/46 | | | 440,000 | | | | 479,793 | |
Banc of America Commercial Mortgage Trust 2007-4 | | | | | | | | | | |
5.75% | | 02/10/51 | | | 277,000 | | | | 305,922 | (d,e) |
Banc of America Commercial Mortgage Trust 2008-1 | | | | | | | | | | |
6.21% | | 02/10/51 | | | 792,000 | | | | 903,337 | (d,e) |
Banc of America Merrill Lynch Commercial Mortgage Inc. 2005-6 | | | | | | | | | | |
5.18% | | 09/10/47 | | | 980,000 | | | | 1,043,245 | (d,e) |
Bear Stearns Commercial Mortgage Securities Trust 2005-T18 | | | | | | | | | | |
4.93% | | 02/13/42 | | | 957,369 | | | | 991,738 | (d,e) |
Bear Stearns Commercial Mortgage Securities Trust 2006-T22 | | | | | | | | | | |
5.58% | | 04/12/38 | | | 1,050,000 | | | | 1,137,685 | (d,e) |
COMM 2005-LP5 Mortgage Trust | | | | | | | | | | |
4.98% | | 05/10/43 | | | 500,000 | | | | 521,102 | (d,e) |
COMM 2013-CR11 Mortgage Trust | | | | | | | | | | |
4.72% | | 10/10/46 | | | 1,000,000 | | | | 1,036,971 | (e) |
GS Mortgage Securities Trust 2011-GC5 | | | | | | | | | | |
3.00% | | 08/10/44 | | | 950,000 | | | | 988,077 | |
JP Morgan Chase Commercial Mortgage Securities Trust 2005-CB11 | | | | | | | | | | |
5.34% | | 08/12/37 | | | 385,480 | | | | 400,821 | (e) |
| | | | | | | | | | |
JP Morgan Chase Commercial Mortgage Securities Trust 2005-LDP1 | | | | | | | | | | |
5.04% | | 03/15/46 | | | 710,000 | | | | 732,299 | (e) |
JP Morgan Chase Commercial Mortgage Securities Trust 2007-CB18 | | | | | | | | | | |
5.44% | | 06/12/47 | | | 1,420,000 | | | | 1,560,539 | |
JP Morgan Chase Commercial Mortgage Securities Trust 2007-LD11 | | | | | | | | | | |
5.81% | | 06/15/49 | | | 870,000 | | | | 967,717 | (e) |
LB-UBS Commercial Mortgage Trust 2005-C5 | | | | | | | | | | |
4.95% | | 09/15/30 | | | 626,501 | | | | 654,399 | |
LB-UBS Commercial Mortgage Trust 2006-C1 | | | | | | | | | | |
5.16% | | 02/15/31 | | | 860,000 | | | | 918,511 | |
LB-UBS Commercial Mortgage Trust 2006-C4 | | | | | | | | | | |
5.86% | | 06/15/38 | | | 434,423 | | | | 472,502 | (e) |
Morgan Stanley Capital I Trust 2006-T23 | | | | | | | | | | |
5.81% | | 08/12/41 | | | 1,055,000 | | | | 1,159,995 | (e) |
Morgan Stanley Capital I Trust 2008-T29 | | | | | | | | | | |
6.28% | | 01/11/43 | | | 470,000 | | | | 531,856 | (e) |
Wachovia Bank Commercial Mortgage Trust 2006-C23 | | | | | | | | | | |
5.47% | | 01/15/45 | | | 810,000 | | | | 872,665 | (e) |
Wells Fargo Commercial Mortgage Trust 2012-LC5 | | | | | | | | | | |
4.69% | | 10/15/45 | | | 220,000 | | | | 215,923 | (e) |
WF-RBS Commercial Mortgage Trust | | | | | | | | | | |
2.88% | | 12/15/45 | | | 1,200,000 | | | | 1,120,656 | |
| | | | | | | | | 17,449,359 | |
| | | |
Sovereign Bonds—0.4% | | | | | | | | | | |
Government of Brazil | | | | | | | | | | |
2.63% | | 01/05/23 | | | 750,000 | | | | 645,000 | |
5.88% | | 01/15/19 | | | 1,000,000 | | | | 1,120,000 | |
7.13% | | 01/20/37 | | | 500,000 | | | | 572,500 | |
Government of Chile | | | | | | | | | | |
3.63% | | 10/30/42 | | | 350,000 | | | | 274,925 | |
Government of Colombia | | | | | | | | | | |
4.38% | | 07/12/21 | | | 300,000 | | | | 309,000 | (d) |
6.13% | | 01/18/41 | | | 250,000 | | | | 267,500 | |
Government of Italy | | | | | | | | | | |
3.13% | | 01/26/15 | | | 1,000,000 | | | | 1,023,569 | |
5.38% | | 06/15/33 | | | 250,000 | | | | 260,250 | |
Government of Mexico | | | | | | | | | | |
4.75% | | 03/08/44 | | | 702,000 | | | | 632,677 | (d) |
5.63% | | 01/15/17 | | | 1,000,000 | | | | 1,117,500 | |
5.75% | | 10/12/10 | | | 172,000 | | | | 159,100 | (d) |
6.05% | | 01/11/40 | | | 130,000 | | | | 141,375 | (d) |
Government of Panama | | | | | | | | | | |
6.70% | | 01/26/36 | | | 250,000 | | | | 279,375 | |
Government of Peru | | | | | | | | | | |
6.55% | | 03/14/37 | | | 447,000 | | | | 514,050 | (d) |
7.35% | | 07/21/25 | | | 100,000 | | | | 126,000 | |
Government of Philippines | | | | | | | | | | |
4.00% | | 01/15/21 | | | 500,000 | | | | 518,750 | |
7.75% | | 01/14/31 | | | 500,000 | | | | 658,125 | |
Government of Poland | | | | | | | | | | |
3.00% | | 03/17/23 | | | 147,000 | | | | 133,844 | |
5.00% | | 03/23/22 | | | 500,000 | | | | 534,375 | |
6.38% | | 07/15/19 | | | 74,000 | | | | 86,488 | |
Government of South Africa | | | | | | | | | | |
6.25% | | 03/08/41 | | | 100,000 | | | | 103,630 | (d) |
| | | | | | | | | | |
Government of Turkey | | | | | | | | | | |
3.25% | | 03/23/23 | | | 500,000 | | | | 411,250 | |
4.88% | | 04/16/43 | | | 500,000 | | | | 382,750 | |
6.75% | | 04/03/18 | | | 500,000 | | | | 543,000 | |
7.38% | | 02/05/25 | | | 500,000 | | | | 539,750 | |
Government of Uruguay | | | | | | | | | | |
4.50% | | 08/14/24 | | | 500,000 | | | | 500,000 | |
| | | | | | | | | 11,854,783 | |
| | | |
Municipal Bonds and Notes—0.3% | | | | | | | | | | |
American Municipal Power Inc. | | | | | | | | | | |
6.27% | | 02/15/50 | | | 300,000 | | | | 315,591 | (d) |
Bay Area Toll Authority | | | | | | | | | | |
6.26% | | 04/01/49 | | | 250,000 | | | | 299,827 | |
Chicago Transit Authority | | | | | | | | | | |
6.90% | | 12/01/40 | | | 250,000 | | | | 280,545 | |
City of New York | | | | | | | | | | |
5.97% | | 03/01/36 | | | 250,000 | | | | 277,755 | |
City Public Service Board of San Antonio | | | | | | | | | | |
5.72% | | 02/01/41 | | | 200,000 | | | | 226,074 | |
Commonwealth of Massachusetts | | | | | | | | | | |
4.50% | | 08/01/31 | | | 200,000 | | | | 196,828 | |
Dallas Area Rapid Transit | | | | | | | | | | |
5.02% | | 12/01/48 | | | 250,000 | | | | 253,998 | |
East Bay Municipal Utility District | | | | | | | | | | |
5.87% | | 06/01/40 | | | 100,000 | | | | 113,738 | |
Los Angeles Department of Water & Power | | | | | | | | | | |
6.57% | | 07/01/45 | | | 250,000 | | | | 306,847 | |
6.60% | | 07/01/50 | | | 90,000 | | | | 112,411 | |
Los Angeles Unified School District | | | | | | | | | | |
5.76% | | 07/01/29 | | | 160,000 | | | | 177,634 | |
Metropolitan Transportation Authority | | | | | | | | | | |
6.81% | | 11/15/40 | | | 250,000 | | | | 296,780 | |
Municipal Electric Authority of Georgia | | | | | | | | | | |
6.64% | | 04/01/57 | | | 250,000 | | | | 262,785 | |
New Jersey Transportation Trust Fund Authority | | | | | | | | | | |
6.88% | | 12/15/39 | | | 620,000 | | | | 668,707 | (d) |
New York City Water & Sewer System | | | | | | | | | | |
6.01% | | 06/15/42 | | | 250,000 | | | | 289,245 | |
North Texas Tollway Authority | | | | | | | | | | |
6.72% | | 01/01/49 | | | 100,000 | | | | 119,203 | |
Port Authority of New York & New Jersey | | | | | | | | | | |
4.46% | | 10/01/62 | | | 500,000 | | | | 425,940 | |
San Diego County Water Authority | | | | | | | | | | |
6.14% | | 05/01/49 | | | 200,000 | | | | 229,998 | |
South Carolina State Public Service Authority | | | | | | | | | | |
6.45% | | 01/01/50 | | | 150,000 | | | | 160,314 | (d) |
State Board of Administration Finance Corp. | | | | | | | | | | |
3.00% | | 07/01/20 | | | 100,000 | | | | 94,647 | |
State of California | | | | | | | | | | |
5.70% | | 11/01/21 | | | 705,000 | | | | 790,665 | |
7.55% | | 04/01/39 | | | 600,000 | | | | 776,082 | |
State of Illinois | | | | | | | | | | |
5.10% | | 06/01/33 | | | 800,000 | | | | 743,152 | |
| | | | | | | | | | |
State of Texas | | | | | | | | | | |
5.52% | | 04/01/39 | | | 200,000 | | | | 223,716 | |
Texas Transportation Commission | | | | | | | | | | |
5.03% | | 04/01/26 | | | 100,000 | | | | 107,464 | |
University of California | | | | | | | | | | |
4.60% | | 05/15/31 | | | 100,000 | | | | 99,714 | |
6.58% | | 05/15/49 | | | 100,000 | | | | 116,460 | |
University of Texas System | | | | | | | | | | |
4.79% | | 08/15/46 | | | 125,000 | | | | 124,336 | |
| | | | | | | | | 8,090,456 | |
| | | |
FNMA—0.0%* | | | | | | | | | | |
Lehman TBA | | | | | | | | | | |
5.50% | | TBA | | | 620,251 | | | | — | **(h,i) |
| | | |
Total Bonds and Notes | | | | | | | | | | |
(Cost $953,254,669) | | | | | | | | | 929,836,187 | |
| | | |
Total Investments in Securities | | | | | | | | | | |
(Cost $2,540,881,808) | | | | | | | | | 2,859,213,862 | |
| | | |
Short-Term Investments—7.1% | | | | | | | | | | |
GE Institutional Money Market Fund - Investment Class 0.00% | | | | | | | | | | |
(Cost $212,407,850) | | | | | | | | | 212,407,850 | (j,k) |
| | | |
Total Investments | | | | | | | | | | |
(Cost $2,753,289,658) | | | | | | | | | 3,071,621,712 | |
| | | |
Liabilities in Excess of Other Assets, net—(2.9)% | | | | | | | | | (87,323,951 | ) |
| | | | | | | | | | |
NET ASSETS—100.0% | | | | | | | | $ | 2,984,297,761 | |
| | | | | | | | | | |
Other Information:
The Fund had the following long futures contracts open at December 31, 2013:
| | | | | | | | | | | | | | |
Description | | Expiration date | | Number of
Contracts | | | Current
Notional
Value | | | Unrealized
Appreciation | |
MSCI EAFE Mini Index Futures | | March 2014 | | | 23 | | | $ | 2,205,470 | | | $ | 94,478 | |
MSCI Emerging Market Mini Futures | | March 2014 | | | 14 | | | | 711,760 | | | | 21,430 | |
Russell 2000 Mini Index Futures | | March 2014 | | | 8 | | | | 929,120 | | | | 46,772 | |
S&P 500 Emini Index Futures | | March 2014 | | | 250 | | | | 23,013,750 | | | | 527,748 | |
S&P Mid 400 Emini Index Futures | | March 2014 | | | 3 | | | | 401,820 | | | | 10,314 | |
| | | | | | | | | | | | | | |
| | | | | | | | | | | | $ | 700,742 | |
| | | | | | | | | | | | | | |
The Fund held the following TBA sale commitments as of December 31, 2013:
| | | | | | | | | | |
| | | | | Principal
Amount | | | Fair Value | |
Agency Mortgage Backed | | | | | | | | | | |
Government National Mortgage Assoc. TBA
3.50% | | | | | | | | | | |
(Cost $1,010,859) | | TBA | | $ | (1,000,000 | ) | | $ | (1,008,789 | ) (f) |
| The | Fund was invested in the following countries at December 31, 2013 (Unaudited): |
| | | | |
Country | | Percentage
(based
on Fair
Value) | |
United States | | | 73.84 | % |
United Kingdom | | | 3.96 | % |
Japan | | | 3.64 | % |
Canada | | | 1.99 | % |
Switzerland | | | 1.82 | % |
France | | | 1.81 | % |
Germany | | | 1.76 | % |
Australia | | | 1.37 | % |
China | | | 0.99 | % |
South Korea | | | 0.84 | % |
Brazil | | | 0.70 | % |
Spain | | | 0.60 | % |
Taiwan | | | 0.57 | % |
Sweden | | | 0.57 | % |
Netherlands | | | 0.56 | % |
Hong Kong | | | 0.53 | % |
Mexico | | | 0.45 | % |
Italy | | | 0.42 | % |
South Africa | | | 0.37 | % |
Supranational | | | 0.36 | % |
India | | | 0.31 | % |
Russian Federation | | | 0.30 | % |
Singapore | | | 0.25 | % |
Belgium | | | 0.22 | % |
Denmark | | | 0.20 | % |
Malaysia | | | 0.19 | % |
Norway | | | 0.16 | % |
| | | | |
Finland | | | 0.16 | % |
Turkey | | | 0.13 | % |
Thailand | | | 0.11 | % |
Poland | | | 0.11 | % |
Indonesia | | | 0.11 | % |
Chile | | | 0.08 | % |
Colombia | | | 0.08 | % |
Israel | | | 0.08 | % |
Philippines | | | 0.08 | % |
Ireland | | | 0.05 | % |
Austria | | | 0.05 | % |
Peru | | | 0.04 | % |
Portugal | | | 0.03 | % |
Greece | | | 0.02 | % |
Uruguay | | | 0.02 | % |
New Zealand | | | 0.02 | % |
Czech Republic | | | 0.01 | % |
Hungary | | | 0.01 | % |
Panama | | | 0.01 | % |
Egypt | | | 0.01 | % |
Luxembourg | | | 0.01 | % |
Cayman Islands | | | 0.00 | %*** |
Puerto Rico | | | 0.00 | %*** |
Bermuda | | | 0.00 | %*** |
| | | | |
| | | 100.00 | % |
| | | | |
The Fund’s % share of investment in the various categories, based on Fair Value, is as follows at December 31, 2013 (Unaudited):
Equity Securities
| | | | | | | | | | | | |
Industry | | Domestic | | | Foreign | | | Total | |
Diversified Financial Services | | | 1.82 | % | | | 3.65 | % | | | 5.47 | % |
Pharmaceuticals | | | 2.11 | % | | | 1.56 | % | | | 3.67 | % |
Integrated Oil & Gas | | | 1.69 | % | | | 1.38 | % | | | 3.07 | % |
Integrated Telecommunication Services | | | 0.76 | % | | | 0.62 | % | | | 1.38 | % |
Internet Software & Services | | | 1.15 | % | | | 0.19 | % | | | 1.34 | % |
Oil & Gas Exploration & Production | | | 0.93 | % | | | 0.39 | % | | | 1.32 | % |
Industrial Conglomerates | | | 0.90 | % | | | 0.39 | % | | | 1.29 | % |
Packaged Foods & Meats | | | 0.51 | % | | | 0.78 | % | | | 1.29 | % |
Computer Hardware | | | 1.23 | % | | | 0.05 | % | | | 1.28 | % |
Aerospace & Defense | | | 0.99 | % | | | 0.28 | % | | | 1.27 | % |
Semiconductors | | | 0.64 | % | | | 0.54 | % | | | 1.18 | % |
Automobile Manufacturers | | | 0.23 | % | | | 0.82 | % | | | 1.05 | % |
Biotechnology | | | 0.91 | % | | | 0.13 | % | | | 1.04 | % |
Systems Software | | | 0.99 | % | | | 0.03 | % | | | 1.02 | % |
Electric Utilities | | | 0.60 | % | | | 0.36 | % | | | 0.96 | % |
Life & Health Insurance | | | 0.40 | % | | | 0.55 | % | | | 0.95 | % |
Household Products | | | 0.74 | % | | | 0.16 | % | | | 0.90 | % |
Healthcare Equipment | | | 0.75 | % | | | 0.11 | % | | | 0.86 | % |
Wireless Telecommunication Services | | | 0.05 | % | | | 0.77 | % | | | 0.82 | % |
Tobacco | | | 0.54 | % | | | 0.27 | % | | | 0.81 | % |
Data Processing & Outsourced Services | | | 0.71 | % | | | 0.09 | % | | | 0.80 | % |
Industrial Machinery | | | 0.37 | % | | | 0.42 | % | | | 0.79 | % |
Communications Equipment | | | 0.63 | % | | | 0.16 | % | | | 0.79 | % |
| | | | | | | | | | | | |
IT Consulting & Other Services | | | 0.63 | % | | | 0.13 | % | | | 0.76 | % |
Soft Drinks | | | 0.67 | % | | | 0.07 | % | | | 0.74 | % |
Oil & Gas Equipment & Services | | | 0.57 | % | | | 0.11 | % | | | 0.68 | % |
Diversified Metals & Mining | | | 0.08 | % | | | 0.60 | % | | | 0.68 | % |
Regional Banks | | | 0.41 | % | | | 0.25 | % | | | 0.66 | % |
Multi-Utilities | | | 0.43 | % | | | 0.22 | % | | | 0.65 | % |
Multi-Line Insurance | | | 0.26 | % | | | 0.39 | % | | | 0.65 | % |
Movies & Entertainment | | | 0.64 | % | | | 0.01 | % | | | 0.65 | % |
Asset Management & Custody Banks | | | 0.50 | % | | | 0.11 | % | | | 0.61 | % |
Restaurants | | | 0.48 | % | | | 0.11 | % | | | 0.59 | % |
Multi-Sector Holdings | | | 0.48 | % | | | 0.11 | % | | | 0.59 | % |
Electrical Components & Equipment | | | 0.40 | % | | | 0.18 | % | | | 0.58 | % |
Cable & Satellite | | | 0.45 | % | | | 0.13 | % | | | 0.58 | % |
Railroads | | | 0.32 | % | | | 0.25 | % | | | 0.57 | % |
Internet Retail | | | 0.54 | % | | | 0.01 | % | | | 0.55 | % |
Hypermarkets & Super Centers | | | 0.38 | % | | | 0.17 | % | | | 0.55 | % |
Property & Casualty Insurance | | | 0.33 | % | | | 0.21 | % | | | 0.54 | % |
Diversified Chemicals | | | 0.31 | % | | | 0.20 | % | | | 0.51 | % |
Construction & Farm Machinery | | | 0.33 | % | | | 0.17 | % | | | 0.50 | % |
Apparel, Accessories & Luxury Goods | | | 0.15 | % | | | 0.34 | % | | | 0.49 | % |
Application Software | | | 0.30 | % | | | 0.18 | % | | | 0.48 | % |
Investment Banking & Brokerage | | | 0.34 | % | | | 0.13 | % | | | 0.47 | % |
Food Retail | | | 0.12 | % | | | 0.33 | % | | | 0.45 | % |
Apparel Retail | | | 0.21 | % | | | 0.19 | % | | | 0.40 | % |
Specialty Chemicals | | | 0.24 | % | | | 0.15 | % | | | 0.39 | % |
Consumer Finance | | | 0.36 | % | | | 0.03 | % | | | 0.39 | % |
Home Improvement Retail | | | 0.36 | % | | | 0.03 | % | | | 0.39 | % |
Specialized REITs | | | 0.39 | % | | | 0.00 | % | | | 0.39 | % |
Managed Healthcare | | | 0.36 | % | | | 0.02 | % | | | 0.38 | % |
Air Freight & Logistics | | | 0.29 | % | | | 0.08 | % | | | 0.37 | % |
Oil & Gas Refining & Marketing | | | 0.25 | % | | | 0.12 | % | | | 0.37 | % |
Steel | | | 0.09 | % | | | 0.28 | % | | | 0.37 | % |
Fertilizers & Agricultural Chemicals | | | 0.19 | % | | | 0.15 | % | | | 0.34 | % |
Auto Parts & Equipment | | | 0.15 | % | | | 0.19 | % | | | 0.34 | % |
Retail REITs | | | 0.18 | % | | | 0.15 | % | | | 0.33 | % |
Brewers | | | 0.02 | % | | | 0.30 | % | | | 0.32 | % |
Trading Companies & Distributors | | | 0.08 | % | | | 0.24 | % | | | 0.32 | % |
Drug Retail | | | 0.29 | % | | | 0.02 | % | | | 0.31 | % |
Diversified Real Estate Activities | | | 0.00 | % | | | 0.30 | % | | | 0.30 | % |
Oil & Gas Storage & Transportation | | | 0.16 | % | | | 0.13 | % | | | 0.29 | % |
Specialized Finance | | | 0.21 | % | | | 0.08 | % | | | 0.29 | % |
Computer Storage & Peripherals | | | 0.25 | % | | | 0.04 | % | | | 0.29 | % |
Healthcare Services | | | 0.20 | % | | | 0.08 | % | | | 0.28 | % |
Construction & Engineering | | | 0.06 | % | | | 0.21 | % | | | 0.27 | % |
Industrial Gases | | | 0.15 | % | | | 0.11 | % | | | 0.26 | % |
Commodity Chemicals | | | 0.08 | % | | | 0.18 | % | | | 0.26 | % |
Distillers & Vintners | | | 0.08 | % | | | 0.15 | % | | | 0.23 | % |
Life Sciences Tools & Services | | | 0.20 | % | | | 0.03 | % | | | 0.23 | % |
Diversified Capital Markets | | | 0.00 | % | | | 0.22 | % | | | 0.22 | % |
Broadcasting | | | 0.14 | % | | | 0.07 | % | | | 0.21 | % |
Healthcare Distributors | | | 0.19 | % | | | 0.02 | % | | | 0.21 | % |
Construction Materials | | | 0.02 | % | | | 0.18 | % | | | 0.20 | % |
General Merchandise Stores | | | 0.17 | % | | | 0.03 | % | | | 0.20 | % |
Gas Utilities | | | 0.05 | % | | | 0.15 | % | | | 0.20 | % |
Oil & Gas Drilling | | | 0.08 | % | | | 0.11 | % | | | 0.19 | % |
Casinos & Gaming | | | 0.04 | % | | | 0.15 | % | | | 0.19 | % |
| | | | | | | | | | | | |
Personal Products | | | 0.06 | % | | | 0.13 | % | | | 0.19 | % |
Semiconductor Equipment | | | 0.10 | % | | | 0.08 | % | | | 0.18 | % |
Department Stores | | | 0.08 | % | | | 0.10 | % | | | 0.18 | % |
Building Products | | | 0.03 | % | | | 0.14 | % | | | 0.17 | % |
Hotels, Resorts & Cruise Lines | | | 0.11 | % | | | 0.05 | % | | | 0.16 | % |
Publishing | | | 0.03 | % | | | 0.13 | % | | | 0.16 | % |
Footwear | | | 0.13 | % | | | 0.02 | % | | | 0.15 | % |
Diversified REITs | | | 0.03 | % | | | 0.12 | % | | | 0.15 | % |
Electronic Equipment & Instruments | | | 0.01 | % | | | 0.14 | % | | | 0.15 | % |
Airlines | | | 0.09 | % | | | 0.06 | % | | | 0.15 | % |
Advertising | | | 0.06 | % | | | 0.09 | % | | | 0.15 | % |
Gold | | | 0.02 | % | | | 0.12 | % | | | 0.14 | % |
Research & Consulting Services | | | 0.07 | % | | | 0.07 | % | | | 0.14 | % |
Reinsurance | | | 0.03 | % | | | 0.10 | % | | | 0.13 | % |
Automotive Retail | | | 0.11 | % | | | 0.02 | % | | | 0.13 | % |
Electronic Components | | | 0.00 | % | | | 0.13 | % | | | 0.13 | % |
Heavy Electrical Equipment | | | 0.00 | % | | | 0.12 | % | | | 0.12 | % |
Insurance Brokers | | | 0.12 | % | | | 0.00 | % | | | 0.12 | % |
Electronic Manufacturing Services | | | 0.02 | % | | | 0.10 | % | | | 0.12 | % |
Residential REITs | | | 0.10 | % | | | 0.01 | % | | | 0.11 | % |
Environmental & Facilities Services | | | 0.09 | % | | | 0.02 | % | | | 0.11 | % |
Specialty Stores | | | 0.10 | % | | | 0.01 | % | | | 0.11 | % |
Agricultural Products | | | 0.07 | % | | | 0.03 | % | | | 0.10 | % |
Tires & Rubber | | | 0.01 | % | | | 0.09 | % | | | 0.10 | % |
Leisure Products | | | 0.06 | % | | | 0.04 | % | | | 0.10 | % |
Office REITs | | | 0.05 | % | | | 0.05 | % | | | 0.10 | % |
Home Building | | | 0.05 | % | | | 0.05 | % | | | 0.10 | % |
Office Electronics | | | 0.03 | % | | | 0.07 | % | | | 0.10 | % |
Paper Products | | | 0.05 | % | | | 0.05 | % | | | 0.10 | % |
Consumer Electronics | | | 0.02 | % | | | 0.08 | % | | | 0.10 | % |
Independent Power Producers & Energy Traders | | | 0.04 | % | | | 0.06 | % | | | 0.10 | % |
Security & Alarm Services | | | 0.06 | % | | | 0.04 | % | | | 0.10 | % |
Real Estate Development | | | 0.00 | % | | | 0.10 | % | | | 0.10 | % |
Thrifts & Mortgage Finance | | | 0.03 | % | | | 0.06 | % | | | 0.09 | % |
Healthcare Supplies | | | 0.03 | % | | | 0.06 | % | | | 0.09 | % |
Diversified Support Services | | | 0.02 | % | | | 0.06 | % | | | 0.08 | % |
Human Resource & Employment Services | | | 0.03 | % | | | 0.05 | % | | | 0.08 | % |
Coal & Consumable Fuels | | | 0.03 | % | | | 0.05 | % | | | 0.08 | % |
Paper Packaging | | | 0.05 | % | | | 0.03 | % | | | 0.08 | % |
Real Estate Operating Companies | | | 0.00 | % | | | 0.07 | % | | | 0.07 | % |
Industrial REITs | | | 0.04 | % | | | 0.03 | % | | | 0.07 | % |
Healthcare Facilities | | | 0.02 | % | | | 0.05 | % | | | 0.07 | % |
Marine | | | 0.01 | % | | | 0.06 | % | | | 0.07 | % |
Food Distributors | | | 0.06 | % | | | 0.01 | % | | | 0.07 | % |
Healthcare Technology | | | 0.05 | % | | | 0.01 | % | | | 0.06 | % |
Highways & Railtracks | | | 0.00 | % | | | 0.06 | % | | | 0.06 | % |
Home Furnishing Retail | | | 0.05 | % | | | 0.01 | % | | | 0.06 | % |
Trucking | | | 0.02 | % | | | 0.04 | % | | | 0.06 | % |
Metal & Glass Containers | | | 0.03 | % | | | 0.02 | % | | | 0.05 | % |
Household Appliances | | | 0.03 | % | | | 0.02 | % | | | 0.05 | % |
Distributors | | | 0.04 | % | | | 0.01 | % | | | 0.05 | % |
Computer & Electronics Retail | | | 0.03 | % | | | 0.02 | % | | | 0.05 | % |
Home Entertainment Software | | | 0.02 | % | | | 0.03 | % | | | 0.05 | % |
Office Services & Supplies | | | 0.02 | % | | | 0.03 | % | | | 0.05 | % |
Motorcycle Manufacturers | | | 0.03 | % | | | 0.01 | % | | | 0.04 | % |
Aluminum | | | 0.02 | % | | | 0.02 | % | | | 0.04 | % |
| | | | | | | | | | | | |
Home Furnishings | | | 0.03 | % | | | 0.01 | % | | | 0.04 | % |
Water Utilities | | | 0.00 | % | | | 0.04 | % | | | 0.04 | % |
Specialized Consumer Services | | | 0.04 | % | | | 0.00 | % | | | 0.04 | % |
Precious Metals & Minerals | | | 0.00 | % | | | 0.04 | % | | | 0.04 | % |
Education Services | | | 0.01 | % | | | 0.02 | % | | | 0.03 | % |
Alternative Carriers | | | 0.00 | % | | | 0.03 | % | | | 0.03 | % |
Housewares & Specialties | | | 0.03 | % | | | 0.00 | % | | | 0.03 | % |
Technology Distributors | | | 0.02 | % | | | 0.01 | % | | | 0.03 | % |
Mortgage REITs | | | 0.03 | % | | | 0.00 | % | | | 0.03 | % |
Airport Services | | | 0.00 | % | | | 0.03 | % | | | 0.03 | % |
Commercial Printing | | | 0.01 | % | | | 0.02 | % | | | 0.03 | % |
Marine Ports & Services | | | 0.00 | % | | | 0.03 | % | | | 0.03 | % |
Real Estate Services | | | 0.02 | % | | | 0.00 | % | | | 0.02 | % |
Leisure Facilities | | | 0.00 | % | | | 0.02 | % | | | 0.02 | % |
Forest Products | | | 0.01 | % | | | 0.00 | % | | | 0.01 | % |
Photographic Products | | | 0.00 | % | | | 0.01 | % | | | 0.01 | % |
Textiles | | | 0.00 | % | | | 0.01 | % | | | 0.01 | % |
Catalog Retail | | | 0.01 | % | | | 0.00 | % | | | 0.01 | % |
| | | | | | | | | | | | |
| | | | | | | | | | | 62.81 | % |
| | | | | | | | | | | | |
Bonds and Notes
| | | | |
Sector | | Percentage
(based on Fair
Value) | |
U.S. Treasuries | | | 10.76 | % |
Agency Mortgage Backed | | | 10.02 | % |
Corporate Notes | | | 7.98 | % |
Non-Agency Collateralized Mortgage Obligations | | | 0.57 | % |
Sovereign Bonds | | | 0.39 | % |
Municipal Bonds and Notes | | | 0.26 | % |
U.S. Government Sponsored Agencies | | | 0.19 | % |
Asset Backed | | | 0.10 | % |
| | | | |
| | | 30.27 | % |
| | | | |
| |
Short-Term Investments | | | |
Short-Term Investments | | | 6.92 | % |
| | | | |
| | | 6.92 | % |
| | | | |
| | | 100.00 | % |
| | | | |
Notes to Schedules of Investments December 31, 2013
The views expressed in this document reflect our judgment as of the publication date and are subject to change at any time without notice. The securities cited may not be representative of the Fund’s future investments and should not be construed as a recommendation to purchase or sell a particular security. See the Fund’s summary prospectus and statutory prospectus for complete descriptions of investment objectives, policies, risks and permissible investments.
| (a) | Non-income producing security. |
| (b) | State Street Corp. is the parent company of State Street Bank & Trust Co., the Fund’s custodian and accounting agent. |
| (c) | General Electric Co. is the parent company of GEAM, the Fund’s investment adviser. |
| (d) | At December 31, 2013, all or a portion of this security was pledged to cover collateral requirements for futures and/or TBA’s. |
| (e) | Variable or floating rate security. The stated rate represents the rate at December 31, 2013. |
| (f) | Settlement is on a delayed delivery or when-issued basis with final maturity to be announced (TBA) in the future. |
| (g) | Pursuant to Rule 144A of the Securities Act of 1933, these securities may be resold in transactions exempt from registration, normally to qualified institutional buyers. At December 31, 2013, these securities amounted to $3,006,190 or 0.10% of the net assets of the GE Investment Total Return Fund. These securities have been determined to be liquid using procedures established by the Fund’s Board of Trustees. |
| (h) | Security is fair valued by the Valuation Committee, in accordance with the procedures approved by the Fund’s Board of Director’s. |
| (i) | Security is in default. |
| (j) | Coupon amount represents effective yield. |
| (k) | GE Asset Management Incorporated (“GEAM”), the investment adviser of the Fund, also serves as investment adviser of the GE Institutional Money Market Fund. |
| ** | Amount is less than $0.50. |
| † | Percentages are based on net assets as of December 31, 2013. |
| †† | Security traded on different exchanges. |
| | |
| ADR | | American Depository Receipt |
| |
| GDR | | Global Depository Receipt |
| |
| REIT | | Real Estate Investment Trust |
| |
| TBA | | To Be Announced |
Item 7. Disclosure of Proxy Voting Policies and Procedures for Closed-End Management Investment Companies.
Applicable only to Closed-End Management Investment Companies.
| Item 8. | Portfolio Managers of Closed-End Management Investment Companies. |
Applicable only to Closed-End Management Investment Companies.
Item 9. Purchases of Equity Securities by Closed-End Management Investment Company and Affiliated Purchasers.
Applicable only to Closed-End Management Investment Companies.
| Item 10. | Submission of Matters to a Vote of Security Holders. |
During the reporting period, there have been no material changes to the procedures by which the shareholders may recommend nominees to the registrant’s Board of Directors.
| Item 11. | Controls and Procedures. |
(a) The registrant’s principal executive officer and principal financial officer have concluded that the registrant’s disclosure controls and procedures (as defined in Rule 30a-3(c) under the Investment Company Act of 1940, as amended (the “1940 Act”)) are effective as of a date within 90 days of the filing date of the report included in Item 1 of this Form N-CSR, based on the evaluation of these controls and procedures required by Rule 30a-3(b) under the 1940 Act and Rules 13a-15(b) or 15d-15(b) under the Securities Exchange Act of 1934.
(b) There were no changes in the registrant’s internal control over financial reporting (as defined in Rule 30a-3(d) under the 1940 Act) that occurred during the registrant’s second fiscal quarter of the period covered by this Form N-CSR that have materially affected, or are reasonably likely to materially affect, the registrant’s internal control over financial reporting.
(a)(1) The Code of Ethics that applies to the registrant’s principal executive officer and principal financial officer is attached hereto.
(a)(2) The certifications required by Rule 30a-2(a) of the 1940 Act and Section 302 of the Sarbanes-Oxley Act of 2002 are attached hereto.
(a)(3) Not applicable.
(b) The certifications by the registrant’s principal executive officer and principal financial officer, as required by Rule 30a-2(b) of the 1940 Act, and Section 906 of the Sarbanes-Oxley Act of 2002 are attached hereto.
SIGNATURES
Pursuant to the requirements of the Securities Exchange Act of 1934 and the Investment Company Act of 1940, the registrant has duly caused this report to be signed on its behalf by the undersigned, thereunto duly authorized.
| | |
| GE Investments Funds, Inc. |
| |
| By: | | /s/ Michael J. Cosgrove |
| | Michael J. Cosgrove |
| | Chairman, GE Investments Funds, Inc. |
| |
| Date: | | February 12, 2014 |
Pursuant to the requirements of the Securities Exchange Act of 1934 and the Investment Company Act of 1940, this report has been signed below by the following persons on behalf of the registrant and in the capacities and on the dates indicated.
| | |
| By: | | /s/ Michael J. Cosgrove |
| | Michael J. Cosgrove |
| | Chairman, GE Investments Funds, Inc. |
| |
| Date: | | February 12, 2014 |
| | |
| By: | | /s/ Arthur A. Jensen |
| | Arthur A. Jensen |
| | Treasurer, GE Investments Funds, Inc. |
| |
| Date: | | February 12, 2014 |