UNITED STATES
SECURITIES AND EXCHANGE COMMISSION
Washington, D.C. 20549
FORM N-CSR
CERTIFIED SHAREHOLDER REPORT OF REGISTERED
MANAGEMENT INVESTMENT COMPANIES
Investment Company Act file number 811-04041
GE INVESTMENTS FUNDS, INC.
(Exact name of registrant as specified in charter)
3001 SUMMER STREET, STAMFORD, CONNECTICUT 06905
(Address of principal executive offices) (Zip code)
GE ASSET MANAGEMENT, INC.
3001 SUMMER STREET, STAMFORD, CONNECTICUT 06905
(Name and address of agent for service)
Registrant’s telephone number, including area code: 800-242-0134
Date of fiscal year end: 12/31
Date of reporting period: 12/31/10
| ITEM 1. | REPORTS TO STOCKHOLDERS. |
GE Investments Funds, Inc.
U.S. Equity Fund
Annual Report
December 31, 2010

GE Investments Funds, Inc.
| | |
| |
| U.S. Equity Fund | | Contents |
This report is prepared for Policyholders of certain variable contracts and may be distributed to others only if preceded or accompanied by the variable contract’s current prospectus and the current prospectus of the Fund available for investments thereunder.
| | |
| Notes to Performance | | December 31, 2010 (unaudited) |
The information on the following performance pages relates to the GE Investments U.S. Equity Fund (the “Fund”).
Total returns take into account changes in share price and assume reinvestment of dividends and capital gains distributions, if any. Total returns shown are net of Fund fees and expenses but do not reflect fees and charges associated with the variable contracts such as administrative fees, account charges and surrender charges, which, if reflected, would reduce the Fund’s total returns for all periods shown.
The performance data quoted represent past performance; past performance does not guarantee future results. Investment return and principal value will fluctuate so your shares, when redeemed, may be worth more or less than their original cost. Current performance may be higher or lower than the performance data quoted. Periods less than one year are not annualized. Please call 800-493-3042 or visit the Fund’s website at http://www.geam.com for the most recent month-end performance data.
An investment in the Fund is not a deposit of any bank and is not insured or guaranteed by the Federal Deposit Insurance Corporation (FDIC) or any other government agency. An investment in the Fund is subject to risk, including possible loss of principal invested.
The S&P 500® Index is an unmanaged market capitalization-weighted index of stocks of 500 large U.S. companies, which is widely used as a measure of large-cap stock market performance. The results shown for the foregoing index assume the reinvestment of net dividends or interest. They do not reflect the actual cost of investing in the instruments that comprise the index.
The peer universe of the underlying annuity funds used for the peer group average annual total return calculation is based on a blend of Morningstar peer categories, as shown. Morningstar is an independent mutual fund rating service. A Fund’s performance may be compared to or ranked within a universe of mutual funds with investment objectives and policies similar but not necessarily identical to that of the Fund.
©2010 Morningstar, Inc. All Rights Reserved. The Morningstar information contained herein: (1) is proprietary to Morningstar and/or its content providers; (2) may not be copied or distributed; and (3) is no warranted to be accurate, complete or timely. Neither Morningstar nor its content providers are responsible for any damage or losses relating from any use of this information. Past performance is no guarantee or future results.
GE Investment Distributors, Inc., Member of FINRA & SIPC, is the principal underwriter and distributor of the GE Investments Funds, Inc. and a wholly owned subsidiary of GE Asset Management Incorporated, the investment adviser of the Fund.
1
| | |
| U.S. Equity Fund | | (unaudited) |

George A. Bicher

Stephen V. Gelhaus

Thomas R. Lincoln

Paul C. Reinhardt
The U.S. Equity Fund is managed by a team of portfolio managers that includes George A. Bicher, Paul C. Reinhardt, Stephen V. Gelhaus and Thomas R. Lincoln. Each of the foregoing portfolio managers manages (or co-manages) one of three sub-portfolios, which comprise the Fund. A sub-portfolio refers to the portion of the Fund’s assets that are allocated to, and managed by, a particular portfolio manager on the Fund’s portfolio management team. The three sub-portfolios are managed independently of each other and the portfolio managers have full discretion over their sub-portfolio. The weightings to each sub-portfolio in the Fund, can be changed at any time but generally remain stable for 18 to 24 months.
George A. Bicher is a Senior Vice President of GE Asset Management. Mr. Bicher is Director of the U.S. Equity Research Team and a portfolio manager for the Fund. Mr. Bicher has held the position of equity research analyst since joining GE Asset Management in June 2002. Prior to joining GE Asset Management, he served in a number of positions at Deutsche Banc Alex Brown since 1994.
Stephen V. Gelhaus is a Senior Vice President of GE Asset Management. He has been a member of the portfolio management team for the Fund since January 2002. Mr. Gelhaus joined GE Asset Management in June 1991 and was a research analyst in the U.S. Equities group from 1995 through 2001.
Thomas R. Lincoln is a Senior Vice President of GE Asset Management. He has been a member of the portfolio management team for the Fund since May 2007. Mr. Lincoln joined GE Asset Management in 1994 as a financial analyst in U.S. Equities. Mr. Lincoln became part of the investment management team for U.S. Equities at GE Asset Management in 1997 and a portfolio manager for U.S. Equities in 2003.
Paul C. Reinhardt is a Senior Vice President of GE Asset Management. He has been a portfolio manager for the Fund since January 2001. Mr. Reinhardt joined GE Asset Management in 1982 as an equity analyst and has been a portfolio manager since 1987.
| Q. | How did the U.S. Equity Fund perform compared to its benchmarks and Morningstar peer group for the twelve-month period ended December 31, 2010? |
| A. | For the twelve-month period ended December 31, 2010, the U.S. Equity Fund returned 10.26% for Class 1 shares and 9.81% for Class 4 shares. The S&P 500 Index, the Fund’s benchmark, returned 15.06% and the Fund’s Morningstar peer group of 454 US Insurance Large Blend funds returned on average of 14.31% for the same period. |
| Q. | What market conditions impacted the Fund performance? |
| A. | 2010’s 15% advance did not feel like an easy climb for the S&P 500, amid ongoing debate around the durability of the economic expansion. Indeed, all U.S. equity indices were in negative territory at mid-year and over much of the summer, beset by concerns about the European debt crisis, persistently high unemployment levels and skyrocketing government debt. However, reassurances that the Fed would purchase additional treasury bonds in a $600B “quantitative easing-2” program ignited a mighty second-half rally. In this environment, cyclical sectors generally outperformed, while defensive sectors lagged. For the year, the S&P 500 consumer discretionary, industrials, materials and energy sectors each advanced over 20%, while health care, utilities and IT lagged. |
2010 was a challenging investment environment for large-cap, high quality investors. Small and mid-cap companies led — typical in the early innings of economic recovery. Smaller companies also benefitted from increased M&A activity as larger companies looked to spend excess balance sheet cash on strategic acquisitions. Low quality also outperformed high quality, with an approximately 22% increase in S&P 500 C-rated companies, while the high-quality A-rated companies rose only 15%. We generally prefer to invest in high quality companies, and acknowledge that relative performance may be challenged in the early stages of an economic recovery, when higher-risk (i.e., lower quality) companies get re-rated. We continue to believe that higher quality companies can make the best long-term investments, and a diversified portfolio of high quality large caps has the potential to outperform over a full market cycle.
2

Amid the year’s uncertainties, correlations of performance among S&P 500 stocks reached levels unseen since the Great Depression. It was difficult for the active manager to differentiate as top-down factors moved the markets, with fundamentals largely ignored. For example, Microsoft achieved and raised earnings estimates throughout the year, yet the stock lagged. This seeming disconnect between fundamentals, valuations and performance created a source of frustration for many large-cap active managers.
| Q. | What were the primary drivers of Fund performance? |
| A. | After last year’s strong outperformance, the Fund struggled to keep pace in the investing environment generally favoring smaller-cap, low quality companies this year. The key contributions came from strong stock selection among telecommunications, utilities and industrials stocks, while stock selection within technology and health care weighed most on returns. The Fund benefited from strength in its wireless communications holdings, driven by rallies in NII Holdings (+33%) and American Tower (+20%). Nextel International rallied after successful spectrum auctions, and enjoyed a general relief rally from as pressures from the failed Televisa deal subsided. American Tower benefited from strong secular growth in wireless data transmission and communications. Northeast Utilities (+28%) and Dominion (+15%) were top contributors within the utilities sector. As the recovery strengthened, several of our industrials holdings performed well, as illustrated by Honeywell (+39%) which generated strong free cash flow and earnings growth as the aerospace and material segments built momentum. The top-performer in the Fund was Baidu (+135%) as the dominant Chinese Internet search engine took share from Google as it left China. One of our holdings was the target of one of the year’s largest announced M&A transactions: Potash Corp. of Saskatchewan (+43%). We trimmed our position in this leading maker of potash fertilizer upon the announcement. |
In terms of portfolio detractors, the technology sector saw a divergence in performance between the larger- cap, less cyclical companies and smaller, more economically-sensitive firms. For example, Cisco (-16%) experienced demand disappointments from the public sector and Europe. At the same time, Cisco’s smaller competitor Juniper (+38% and not held in the Fund) detracted from performance. The Fed’s move to cut debit fees hurt Visa (-19%) within technology services, although we believe that the selling was overdone in the stock. Research in Motion (-14%) declined amid U.S. share losses for BlackBerry. While we trimmed RIMM to
reflect the shift in fundamentals, on the whole we continued to believe that there was ample growth in the smart phone market to support multiple competitors, especially outside of North America.
The Fund’s financials holdings also lagged, with Goldman Sachs (+1%) and CME (-3%) weighing most. Goldman Sachs plunged on news of the SEC fraud allegations that emerged in April. We continued to hold Goldman at a lighter weighting at the end of the year, as we believed that its fundamentals and market leadership were not broken. CME was hurt by decreased derivatives transaction volumes during the year. Within health care, Gilead (-16%) and Amgen (-3%) both underperformed smaller biotech companies that enjoyed takeout premiums. We maintained our conviction in both stocks. The Fund’s modest overweight in health care stocks amplified the performance drag from these holdings.
| Q. | Were there any significant changes to the Fund during the period? |
| A. | No. Our process remained consistent as we continued to seek large-cap, high quality companies that we felt had the potential to grow market share during a slow, gradual recovery. We continued to emphasize companies with strong balance sheets and earnings stability, over more cyclical or leveraged opportunities. We became underweight in energy, due to our Transocean elimination and trims of Marathon Oil, Occidental Petroleum, Chevron and Halliburton. We took advantage of volatility around regulatory changes to increase our exposure to financials — ending the year with an overweight position. We initiated positions in Invesco, American Express and Wells Fargo, and increased our weightings in JPMorgan Chase, Bank of America and CME Group. We bolstered our materials holdings by adding to Allegheny Technologies and Monsanto. At December 31, 2010, the Fund’s largest overweights were in technology and materials, and the largest underweights were in consumer staples, industrials, consumer discretionary. |
Valuations for many companies remain attractive, in our view. If the slow growth recovery continues as we believe it will, we believe that market share winners with strong balance sheets and management teams can survive, and have the potential to outperform. Amid changing market conditions in the past year, we have maintained our time-tested bottom-up stock selection approach with focus on a long-term investment horizon.
3
| | |
| U.S. Equity Fund | | (unaudited) |
Understanding Your Fund’s Expenses
As a shareholder of the Fund you incur transaction and ongoing expenses. Transaction expenses including sales charges on purchases payments, reinvested dividends (or other distributions), and redemption fees directly reduce the investment return of the Fund. Ongoing costs include portfolio management fees, distribution and services fees, professional fees, administrative fees and other Fund expenses. The following example is intended to help you understand your ongoing costs (in dollars) of investing in the Fund and to compare these costs with the ongoing costs of investing in other mutual funds.
To illustrate these ongoing costs, we have provided an example and calculated the expenses paid by investors during the period. The information in the following table is based on an investment of $1,000, which is invested at the beginning of the period and held for the entire six-month period ended December 31, 2010.
Actual Expenses
The first section of the table provides information about actual account values and actual expenses. You may use the information in this section, together with the amount you invested, to estimate the expenses that you paid
over the period. To do so, simply divide your account value by $1,000 (for example, an $8,600 account value divided by $1,000 = 8.6), then multiply the result by the number given for your class under the heading “Expenses Paid During Period.”
Hypothetical Example for Comparison Purposes
The second section of the table provides information about hypothetical account values and hypothetical expenses based on the Fund’s actual expense ratio and an assumed rate of return of 5% per year before expenses, which is not the Fund’s actual return. You may use this information to compare the ongoing costs of investing in the Fund and other funds. To do so, compare this 5% hypothetical example with the 5% hypothetical examples that appear in the shareholders reports of other funds.
Please note that the expenses shown in the table for both “Actual” and “Hypothetical” do not reflect any transaction costs, such as sales charges or redemption fees. Additionally, the expenses shown do not reflect the fees or charges associated with variable contracts through which shares of the Fund are offered.
July 1, 2010 - December 31, 2010
| | | | | | | | | | | | |
| | | Account value at the
beginning of the period ($) | | | Account value at the
end of the period ($) | | | Expenses paid
during the period ($)* | |
Actual Fund Return** | | | | | | | | | | | | |
Class 1 | | | 1,000.00 | | | | 1,219.44 | | | | 3.86 | |
Class 4 | | | 1,000.00 | | | | 1,216.65 | | | | 6.09 | |
Hypothetical 5% Return (2.5% for the period) | | | | | | | | | |
Class 1 | | | 1,000.00 | | | | 1,021.50 | | | | 3.52 | |
Class 4 | | | 1,000.00 | | | | 1,019.52 | | | | 5.55 | |
| * | | Expenses are equal to the Fund’s annualized expense ratio of 0.69% for Class 1 shares and 1.09% for Class 4 shares (for the period July 1, 2010 - December 31, 2010), multiplied by the average account value over the period, multiplied by 184/365 (to reflect the one-half year period). |
| ** | | Actual Fund Returns for the six-month period ended December 31, 2010 were as follows: 21.94% for Class 1 shares, and 21.66% for Class 4 shares. Past performance does not guarantee future results. |
4
| | |
| U.S. Equity Fund | | (unaudited) |
Investment Profile
A mutual fund designed for investors who seek long-term growth of capital by investing at least 80% of its net assets in equity securities of U.S. companies, such as common and preferred stocks.
Morningstar Performance Comparison
Based on average annual returns for periods ended 12/31/10
| | | | | | | | | | | | | | | | |
| | | | | | One
Year | | | Five
Year | | | Ten
Year | |
Number of Funds in peer group: | | | | | | | 454 | | | | 397 | | | | 302 | |
Peer group average annual total return: | | | | | | | 14.31% | | | | 1.86% | | | | 1.14% | |
Morningstar category in peer group: U.S. Insurance Large Blend | | | | | | | | | | | | | | | | |
Sector Allocation
as a % of Fair Value(c) of $38,425 (in thousands) on December 31, 2010(b)(c)
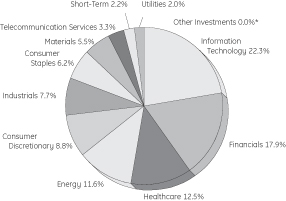
Top Ten Largest Holdings
as of December 31, 2010 (as a % of Fair Value)(b)(c)
| | | | |
Microsoft Corp. | | | 3.31% | |
Schlumberger Ltd. | | | 2.80% | |
PepsiCo Inc. | | | 2.49% | |
QUALCOMM Inc. | | | 2.47% | |
Apple Inc. | | | 2.39% | |
Exxon Mobil Corp. | | | 2.03% | |
JPMorgan Chase & Co. | | | 2.03% | |
The Goldman Sachs Group Inc. | | | 2.02% | |
State Street Corp. | | | 2.01% | |
Amgen Inc. | | | 2.00% | |
Change in Value of a $10,000 Investment
Class 1 Shares
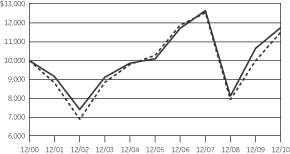
Average Annual Total Return
for the Periods Ended December 31, 2010
Class 1 Shares (Inception date: 1/3/95)
| | | | | | | | | | | | | | | | |
| | | One
Year | | | Five
Year | | | Ten
Year | | | Ending value of a
$10,000
investment(a) | |
U.S. Equity Fund | | | 10.26% | | | | 3.08% | | | | 1.63% | | | | 11,757 | |
S&P 500 Index | | | 15.06% | | | | 2.29% | | | | 1.41% | | | | 11,508 | |
Change in Value of a $10,000 Investment
Class 4 Shares

Average Annual Total Returns
for the Periods Ended December 31, 2010
Class 4 Shares (Inception date: 5/1/08)
| | | | | | | | | | | | | | | | |
| | | | | | One
Year | | | Since
Inception | | | Ending value of a
$10,000
investment(a) | |
U.S. Equity Fund | | | | | | | 9.81% | | | | -2.05% | | | | 9,461 | |
S&P 500 Index | | | | | | | 15.06% | | | | -1.31% | | | | 9,654 | |

| (a) | Ending value of a $10,000 investment for the ten-year period or since inception, whichever is less. |
| (b) | The securities information regarding holdings, allocations and other characteristics is presented to illustrate examples of securities that the Fund has bought and the diversity of areas in which the Fund may invest as of a particular date. It may not be representative of the Fund’s current or future investments and should not be construed as a recommendation to purchase or sell a particular security. |
| (c) | Fair value basis is inclusive of Short Term Investment in GE Money Market Fund. |
See Notes to Performance on page 1 for further information, including an explanation of Morningstar peer categories.
Past performance does not predict future performance. The performance shown in the graphs and tables does not reflect the deduction of taxes that a shareholder would pay on Fund distributions or the redemption of Fund shares and do not reflect the fees or charges that would be associated with variable contracts through which shares of the Fund are offered.
5
U.S. Equity Fund
| | |
| Schedule of Investments | | December 31, 2010 |
U.S. Equity Fund
| | | | | | | | | | | | |
| | | |
| | | Number
of Shares | | | Fair Value | | | | |
Common Stock — 96.5%† | | | | | |
| |
Advertising — 1.5% | | | | | |
| | | |
Omnicom Group Inc. | | | 12,775 | | | $ | 585,095 | | | | | |
| |
Aerospace & Defense — 3.2% | | | | | |
| | | |
CAE Inc. | | | 17,386 | | | | 201,392 | | | | | |
Hexcel Corp. | | | 5,705 | | | | 103,203 | | | | (a | ) |
Honeywell International Inc. | | | 11,090 | | | | 589,544 | | | | | |
Rockwell Collins Inc. | | | 2,447 | | | | 142,562 | | | | | |
United Technologies Corp. | | | 2,366 | | | | 186,252 | | | | | |
| | | | | | | 1,222,953 | | | | | |
| |
Agricultural Products — 0.5% | | | | | |
| | | |
Archer-Daniels-Midland Co. | | | 5,879 | | | | 176,840 | | | | | |
| |
Air Freight & Logistics — 0.3% | | | | | |
| | | |
FedEx Corp. | | | 1,323 | | | | 123,052 | | | | | |
| |
Asset Management & Custody Banks — 4.3% | | | | | |
| | | |
Ameriprise Financial Inc. | | | 4,849 | | | | 279,060 | | | | | |
Invesco Ltd. | | | 16,259 | | | | 391,192 | | | | | |
State Street Corp. | | | 16,702 | | | | 773,971 | | | | (c | ) |
The Bank of New York Mellon Corp. | | | 7,187 | | | | 217,047 | | | | | |
| | | | | | | 1,661,270 | | | | | |
| |
Automobile Manufacturers — 0.1% | | | | | |
| | | |
O’Reilly Automotive Inc. | | | 785 | | | | 47,430 | | | | | |
| |
Biotechnology — 3.9% | | | | | |
| | | |
Amgen Inc. | | | 13,995 | | | | 768,325 | | | | (a | ) |
Gilead Sciences Inc. | | | 20,299 | | | | 735,636 | | | | (a | ) |
| | | | | | | 1,503,961 | | | | | |
| |
Cable & Satellite — 1.0% | | | | | |
| | | |
DIRECTV | | | 6,160 | | | | 245,969 | | | | (a | ) |
Liberty Global Inc. | | | 4,449 | | | | 150,777 | | | | (a | ) |
| | | | | | | 396,746 | | | | | |
| |
Coal & Consumable Fuels — 0.2% | | | | | |
| | | |
Peabody Energy Corp. | | | 1,216 | | | | 77,800 | | | | | |
| |
Communications Equipment — 4.6% | | | | | |
| | | |
Cisco Systems Inc. | | | 33,423 | | | | 676,147 | | | | (a | ) |
QUALCOMM Inc. | | | 19,180 | | | | 949,218 | | | | | |
Research In Motion Ltd. | | | 2,092 | | | | 121,608 | | | | (a | ) |
| | | | | | | 1,746,973 | | | | | |
| |
Computer Hardware — 2.7% | | | | | |
| | | |
Apple Inc. | | | 2,849 | | | | 918,973 | | | | (a | ) |
| | | | | | | | | | | | |
| | | |
| | | Number
of Shares | | | Fair Value | | | | |
| | | |
Hewlett-Packard Co. | | | 2,994 | | | $ | 126,047 | | | | | |
| | | | | | | 1,045,020 | | | | | |
| |
Construction & Farm Machinery & Heavy Trucks — 1.0% | | | | | |
| | | |
Cummins Inc. | | | 1,131 | | | | 124,421 | | | | | |
Deere & Co. | | | 2,524 | | | | 209,618 | | | | | |
Navistar International Corp. | | | 973 | | | | 56,346 | | | | (a | ) |
| | | | | | | 390,385 | | | | | |
| |
Consumer Finance — 0.6% | | | | | |
| | | |
American Express Co. | | | 2,645 | | | | 113,523 | | | | | |
Capital One Financial Corp. | | | 2,348 | | | | 99,931 | | | | | |
| | | | | | | 213,454 | | | | | |
| |
Data Processing & Outsourced Services — 3.0% | | | | | |
| | | |
The Western Union Co. | | | 31,950 | | | | 593,312 | | | | | |
Visa Inc. | | | 7,841 | | | | 551,850 | | | | | |
| | | | | | | 1,145,162 | | | | | |
| |
Department Stores — 0.2% | | | | | |
| | | |
Macy’s Inc. | | | 3,294 | | | | 83,338 | | | | | |
| |
Diversified Financial Services — 4.8% | | | | | |
| | | |
Bank of America Corp. | | | 29,287 | | | | 390,689 | | | | | |
Citigroup Inc. | | | 34,948 | | | | 165,304 | | | | (a | ) |
JPMorgan Chase & Co. | | | 18,354 | | | | 778,577 | | | | | |
US BanCorp | | | 2,567 | | | | 69,232 | | | | | |
Wells Fargo & Co. | | | 13,802 | | | | 427,724 | | | | | |
| | | | | | | 1,831,526 | | | | | |
| |
Diversified Metals & Mining — 0.5% | | | | | |
| | | |
Freeport-McMoRan Copper & Gold Inc. | | | 1,735 | | | | 208,356 | | | | | |
| |
Diversified Support Services — 0.2% | | | | | |
| | | |
Iron Mountain Inc. | | | 3,536 | | | | 88,435 | | | | | |
| |
Drug Retail — 0.2% | | | | | |
| | | |
CVS Caremark Corp. | | | 1,984 | | | | 68,984 | | | | | |
| |
Electric Utilities — 1.2% | | | | | |
| | | |
Edison International | | | 1,675 | | | | 64,655 | | | | | |
Entergy Corp. | | | 1,102 | | | | 78,055 | | | | | |
ITC Holdings Corp. | | | 997 | | | | 61,794 | | | | | |
NextEra Energy Inc. | | | 2,054 | | | | 106,787 | | | | | |
Northeast Utilities | | | 4,710 | | | | 150,155 | | | | | |
| | | | | | | 461,446 | | | | | |
| |
Electrical Components & Equipment — 0.5% | | | | | |
| | | |
Cooper Industries PLC | | | 2,976 | | | | 173,471 | | | | | |
| |
Electronic Components — 0.3% | | | | | |
| | | |
Corning Inc. | | | 5,561 | | | | 107,439 | | | | | |
See Notes to Schedule of Investments and Notes to Financial Statements.
6
U.S. Equity Fund
| | |
| Schedule of Investments | | December 31, 2010 |
| | | | | | | | | | | | |
| | | |
| | | Number
of Shares | | | Fair Value | | | | |
| |
Fertilizers & Agricultural Chemicals — 1.8% | | | | | |
| | | |
Monsanto Co. | | | 6,598 | | | $ | 459,485 | | | | | |
Potash Corporation of Saskatchewan Inc. | | | 1,116 | | | | 172,790 | | | | | |
The Mosaic Co. | | | 559 | | | | 42,685 | | | | | |
| | | | | | | 674,960 | | | | | |
| |
General Merchandise Stores — 1.5% | | | | | |
| | | |
Target Corp. | | | 9,464 | | | | 569,070 | | | | | |
| |
Gold — 0.2% | | | | | |
| | | |
Barrick Gold Corp. | | | 1,763 | | | | 93,756 | | | | | |
| |
Healthcare Distributors — 0.2% | | | | | |
| | | |
Cardinal Health Inc. | | | 1,984 | | | | 76,007 | | | | | |
| |
Healthcare Equipment — 2.6% | | | | | |
| | | |
Becton Dickinson and Co. | | | 573 | | | | 48,430 | | | | | |
Covidien PLC | | | 15,049 | | | | 687,137 | | | | | |
ResMed Inc. | | | 7,842 | | | | 271,647 | | | | (a | ) |
| | | | | | | 1,007,214 | | | | | |
| |
Healthcare Services — 2.0% | | | | | |
| | | |
Express Scripts Inc. | | | 10,164 | | | | 549,364 | | | | (a | ) |
Medco Health Solutions Inc. | | | 1,014 | | | | 62,128 | | | | (a | ) |
Omnicare Inc. | | | 5,775 | | | | 146,627 | | | | | |
| | | | | | | 758,119 | | | | | |
| |
Home Improvement Retail — 1.4% | | | | | |
| | | |
Lowe’s companies Inc. | | | 21,251 | | | | 532,975 | | | | | |
| |
Homebuilding — 0.1% | | | | | |
| | | |
MDC Holdings Inc. | | | 929 | | | | 26,727 | | | | | |
| |
Homefurnishing Retail — 0.2% | | | | | |
| | | |
Bed Bath & Beyond Inc. | | | 1,680 | | | | 82,572 | | | | (a | ) |
| |
Hotels, Resorts & Cruise Lines — 0.6% | | | | | |
| | | |
Carnival Corp. | | | 4,684 | | | | 215,979 | | | | | |
| |
Household Products — 1.9% | | | | | |
| | | |
Clorox Co. | | | 3,080 | | | | 194,902 | | | | | |
The Procter & Gamble Co. | | | 8,246 | | | | 530,465 | | | | | |
| | | | | | | 725,367 | | | | | |
| |
Independent Power Producers & Energy Traders — 0.3% | | | | | |
| | | |
Calpine Corp. | | | 3,593 | | | | 47,931 | | | | (a | ) |
The AES Corp. | | | 6,770 | | | | 82,459 | | | | (a | ) |
| | | | | | | 130,390 | | | | | |
| |
Industrial Gases — 1.1% | | | | | |
| | | |
Praxair Inc. | | | 4,570 | | | | 436,298 | | | | | |
| | | | | | | | | | | | |
| | | |
| | | Number
of Shares | | | Fair Value | | | | |
| |
Industrial Machinery — 0.1% | | | | | |
| | | |
Eaton Corp. | | | 299 | | | $ | 30,351 | | | | | |
| |
Integrated Oil & Gas — 5.8% | | | | | |
| | | |
Chevron Corp. | | | 4,849 | | | | 442,471 | | | | | |
Exxon Mobil Corp. | | | 10,657 | | | | 779,240 | | | | (d | ) |
Hess Corp. | | | 1,732 | | | | 132,567 | | | | | |
Marathon Oil Corp. | | | 3,086 | | | | 114,275 | | | | | |
Occidental Petroleum Corp. | | | 1,422 | | | | 139,498 | | | | | |
Suncor Energy Inc. | | | 15,828 | | | | 606,054 | | | | | |
| | | | | | | 2,214,105 | | | | | |
| |
Integrated Telecommunication Services — 1.3% | | | | | |
| | | |
AT&T Inc. | | | 9,540 | | | | 280,285 | | | | | |
Verizon Communications Inc. | | | 5,561 | | | | 198,973 | | | | | |
| | | | | | | 479,258 | | | | | |
| |
Internet Retail — 0.1% | | | | | |
| | | |
Amazon.com Inc. | | | 214 | | | | 38,520 | | | | (a | ) |
| |
Internet Software & Services — 2.6% | | | | | |
| | | |
Baidu Inc. ADR | | | 4,771 | | | | 460,545 | | | | (a | ) |
Equinix Inc. | | | 2,256 | | | | 183,323 | | | | (a | ) |
Google Inc. | | | 628 | | | | 373,013 | | | | (a | ) |
| | | | | | | 1,016,881 | | | | | |
| |
Investment Banking & Brokerage — 2.4% | | | | | |
| | | |
Morgan Stanley | | | 4,706 | | | | 128,050 | | | | | |
The Goldman Sachs Group Inc. | | | 4,622 | | | | 777,236 | | | | | |
| | | | | | | 905,286 | | | | | |
| |
IT Consulting & Other Services — 1.6% | | | | | |
| | | |
International Business Machines Corp. | | | 4,212 | | | | 618,153 | | | | | |
| |
Life & Health Insurance — 2.3% | | | | | |
| | | |
Aflac Inc. | | | 3,580 | | | | 202,019 | | | | | |
MetLife Inc. | | | 3,037 | | | | 134,964 | | | | | |
Principal Financial Group Inc. | | | 5,133 | | | | 167,130 | | | | | |
Prudential Financial Inc. | | | 6,156 | | | | 361,419 | | | | | |
| | | | | | | 865,532 | | | | | |
| |
Life Sciences Tools & Services — 1.1% | | | | | |
| | | |
Life Technologies Corp. | | | 2,360 | | | | 130,980 | | | | (a | ) |
PerkinElmer Inc. | | | 1,672 | | | | 43,171 | | | | | |
Thermo Fisher Scientific Inc. | | | 4,789 | | | | 265,119 | | | | (a | ) |
| | | | | | | 439,270 | | | | | |
| |
Movies & Entertainment — 2.1% | | | | | |
| | | |
News Corp. | | | 13,176 | | | | 191,843 | | | | | |
The Walt Disney Co. | | | 4,919 | | | | 184,512 | | | | | |
Time Warner Inc. | | | 13,262 | | | | 426,639 | | | | | |
| | | | | | | 802,994 | | | | | |
See Notes to Schedule of Investments and Notes to Financial Statements.
7
U.S. Equity Fund
| | |
| Schedule of Investments | | December 31, 2010 |
| | | | | | | | | | | | |
| | | |
| | | Number
of Shares | | | Fair Value | | | | |
| |
Multi-Line Insurance — 0.1% | | | | | |
| | | |
Hartford Financial Services Group Inc. | | | 822 | | | $ | 21,775 | | | | | |
| |
Multi-Utilities — 0.5% | | | | | |
| | | |
Dominion Resources Inc. | | | 4,278 | | | | 182,756 | | | | | |
| |
Oil & Gas Equipment & Services — 3.3% | | | | | |
| | | |
Halliburton Co. | | | 1,283 | | | | 52,385 | | | | | |
National Oilwell Varco Inc. | | | 1,102 | | | | 74,110 | | | | | |
Schlumberger Ltd. | | | 12,866 | | | | 1,074,311 | | | | | |
Weatherford International Ltd. | | | 3,129 | | | | 71,341 | | | | (a | ) |
| | | | | | | 1,272,147 | | | | | |
| |
Oil & Gas Exploration & Production — 1.6% | | | | | |
| | | |
Apache Corp. | | | 3,805 | | | | 453,670 | | | | | |
Devon Energy Corp. | | | 1,198 | | | | 94,055 | | | | | |
Southwestern Energy Co. | | | 1,518 | | | | 56,819 | | | | (a | ) |
| | | | | | | 604,544 | | | | | |
| |
Oil & Gas Storage & Transportation — 0.7% | | | | | |
| | | |
El Paso Corp. | | | 14,858 | | | | 204,446 | | | | | |
Spectra Energy Corp. | | | 2,781 | | | | 69,497 | | | | | |
| | | | | | | 273,943 | | | | | |
| |
Packaged Foods & Meats — 1.2% | | | | | |
| | | |
Kraft Foods Inc. | | | 11,131 | | | | 350,738 | | | | | |
McCormick & Company Inc. | | | 925 | | | | 43,040 | | | | | |
Nestle S.A. ADR | | | 881 | | | | 51,820 | | | | | |
| | | | | | | 445,598 | | | | | |
| |
Pharmaceuticals — 2.6% | | | | | |
| | | |
Bristol-Myers Squibb Co. | | | 8,002 | | | | 211,893 | | | | | |
Hospira Inc. | | | 3,421 | | | | 190,516 | | | | (a | ) |
Johnson & Johnson | | | 5,561 | | | | 343,948 | | | | | |
Novartis AG ADR | | | 1,843 | | | | 108,645 | | | | | |
Pfizer Inc. | | | 8,952 | | | | 156,750 | | | | | |
| | | | | | | 1,011,752 | | | | | |
| |
Property & Casualty Insurance — 0.5% | | | | | |
| | | |
ACE Ltd. | | | 2,822 | | | | 175,670 | | | | | |
| |
Railroads — 0.9% | | | | | |
| | | |
Union Pacific Corp. | | | 3,795 | | | | 351,645 | | | | | |
| |
Real Estate Services — 0.4% | | | | | |
| | | |
CB Richard Ellis Group Inc. (REIT) | | | 6,935 | | | | 142,029 | | | | (a | ) |
| |
Regional Banks — 0.1% | | | | | |
| | | |
Regions Financial Corp. | | | 4,909 | | | | 34,363 | | | | | |
| |
Reinsurance — 0.4% | | | | | |
| | | |
PartnerRe Ltd. | | | 1,713 | | | | 137,640 | | | | | |
| | | | | | | | | | | | |
| | | |
| | | Number
of Shares | | | Fair Value | | | | |
| |
Security & Alarm Services — 0.4% | | | | | |
| | | |
Corrections Corporation of America | | | 6,545 | | | $ | 164,018 | | | | (a | ) |
| |
Semiconductor Equipment — 0.3% | | | | | |
| | | |
KLA-Tencor Corp. | | | 2,792 | | | | 107,883 | | | | | |
| |
Semiconductors — 2.5% | | | | | |
| | | |
Intel Corp. | | | 27,211 | | | | 572,247 | | | | | |
Microchip Technology Inc. | | | 1,969 | | | | 67,359 | | | | | |
Texas Instruments Inc. | | | 9,303 | | | | 302,347 | | | | | |
| | | | | | | 941,953 | | | | | |
| |
Soft Drinks — 2.5% | | | | | |
| | | |
PepsiCo Inc. | | | 14,620 | | | | 955,125 | | | | | |
| |
Specialized Finance — 1.9% | | | | | |
| | | |
CME Group Inc. | | | 2,328 | | | | 749,034 | | | | | |
| |
Steel — 1.8% | | | | | |
| | | |
Allegheny Technologies Inc. | | | 12,804 | | | | 706,525 | | | | | |
| |
Systems Software — 4.6% | | | | | |
| | | |
Microsoft Corp. | | | 45,498 | | | | 1,270,304 | | | | (d | ) |
Oracle Corp. | | | 15,907 | | | | 497,889 | | | | | |
| | | | | | | 1,768,193 | | | | | |
| |
Wireless Telecommunication Services — 2.1% | | | | | |
| | | |
American Tower Corp. | | | 3,079 | | | | 159,000 | | | | (a | ) |
NII Holdings Inc. | | | 14,543 | | | | 649,490 | | | | (a | ) |
| | | | | | | 808,490 | | | | | |
| | | |
Total Common Stock
(Cost $31,153,082) | | | | | | | 36,954,003 | | | | | |
Exchange Traded Funds — 1.6% | | | | | |
Financial Select Sector SPDR Fund | | | 7,758 | | | | 123,740 | | | | (f | ) |
Industrial Select Sector SPDR Fund | | | 13,918 | | | | 485,738 | | | | (f | ) |
| | | |
Total Exchange Traded Funds
(Cost $598,484) | | | | | | | 609,478 | | | | | |
Other Investments — 0.0%* | | | | | | | | | |
GEI Investment Fund
(Cost $8,988) | | | | | | | 8,539 | | | | (e | ) |
| | | |
Total Investments in Securities
(Cost $31,760,554) | | | | | | | 37,572,020 | | | | | |
See Notes to Schedule of Investments and Notes to Financial Statements.
8
U.S. Equity Fund
| | |
| Schedule of Investments | | December 31, 2010 |
| | | | | | | | | | | | |
| | | |
| | | | | | Fair Value | | | | |
Short-Term Investments — 2.2% | | | | | |
GE Money Market Fund Institutional
Class 0.00%
(Cost $852,619) | | | | | | $ | 852,619 | | | | (b,e | ) |
| | | |
Total Investments
(Cost $32,613,173) | | | | | | | 38,424,639 | | | | | |
| | | |
Liabilities in Excess Of Other Assets,
net — (0.3)% | | | | | | | (109,921 | ) | | | | |
| | | | | | | | | | | | |
| | | |
NET ASSETS — 100.0% | | | | | | $ | 38,314,718 | | | | | |
| | | | | | | | | | | | |
| | | |
| | | | | | | | | | | | |
Other Information | |
The GEI U.S. Equity Fund had the following long futures contracts open at December 31, 2010
| | | | | | | | | | | | | | | | |
| Description | | Expiration
date | | | Number
of
Contracts | | | Current
Notional
Value | | | Unrealized
Appreciation | |
S&P 500 EMini Index
Futures | | | March 2011 | | | | 6 | | | $ | 375,900 | | | $ | 4,812 | |
See Notes to Schedule of Investments and Notes to Financial Statements.
9
| | |
| Notes to Schedule of Investments | | December 31, 2010 |
The views expressed in this document reflect our judgment as of the publication date and are subject to change at any time without notice. The securities information regarding holdings, allocations and other characteristics are presented as of a particular date to illustrate examples of securities that the Fund bought and the diversity of areas in which the Fund may invest as of a particular date. It may not be representative of the Fund’s current or future investments and should not be construed as a recommendation to purchase or sell a particular security. See the prospectus for complete descriptions of investment objective, policies, risks and permissible investments.
| (a) | Non-income producing security. |
| (b) | Coupon amount represents effective yield. |
| (c) | State Street Corp. is the parent company of State Street Bank & Trust Co., the Fund’s custodian and accounting agent. |
| (d) | At December 31, 2010 , all or a portion of this security was pledged to cover collateral requirements for futures, options, forward foreign currency contracts and/or TBA’s. |
| (e) | GE Asset Management, the investment adviser of the Fund, also serves as investment adviser of the GEI Investment Fund and the GE Funds-GE Money Market Fund. |
| (f) | Sponsored by SSgA Funds Management, Inc., an affiliate of State Street Bank & Trust Co., the Fund’s custodian and accounting agent. |
| † | Percentages are based on net assets as of December 31, 2010 . |
Abbreviations:
| | |
ADR | | American Depository Receipt |
SPDR | | Standard & Poors Depository Receipts |
10
Financial Highlights
Selected data based on a share outstanding throughout the fiscal years indicated
| | | | | | | | | | | | | | | | | | | | | | | | | | | | | | | | | | | | |
| | | CLASS 1 | | | | | | CLASS 4 | |
| | | 12/31/10 | | | 12/31/09 | | | 12/31/08 | | | 12/31/07 | | | 12/31/06 | | | | | | 12/31/10 | | | 12/31/09 | | | 12/31/08 | |
| Inception date | | | — | | | | — | | | | — | | | | — | | | | 1/3/95 | | | | | | | | | | | | — | | | | 5/1/08 | |
Net asset value,
beginning of period | | $ | 29.23 | | | $ | 22.44 | | | $ | 36.41 | | | $ | 39.02 | | | $ | 34.06 | | | | | | | $ | 29.25 | | | $ | 22.47 | | | $ | 35.32 | |
Income/(loss)
from
investment
operations: | | | | | | | | | | | | | | | | | | | | | | | | | | | | | | | | | | | | |
Net investment
income (loss) | | | 0.28 | ** | | | 0.30 | | | | 0.37 | | | | 0.45 | | | | 0.53 | | | | | | | | 0.16 | ** | | | 0.03 | | | | 0.15 | ** |
Net realized and unrealized
gains/(losses) on invest
ments | | | 2.72 | | | | 6.80 | | | | (13.52 | ) | | | 2.70 | | | | 4.96 | | | | | | | | 2.71 | | | | 6.95 | | | | (12.26 | ) |
Total income/(loss)
from
investment
operations | | | 3.00 | | | | 7.10 | | | | (13.15 | ) | | | 3.15 | | | | 5.49 | | | | | | | | 2.87 | | | | 6.98 | | | | (12.11 | ) |
Less distributions
from: | | | | | | | | | | | | | | | | | | | | | | | | | | | | | | | | | | | | |
Net investment
income | | | 0.31 | | | | 0.31 | | | | 0.36 | | | | 0.44 | | | | 0.53 | | | | | | | | 0.18 | | | | 0.20 | | | | 0.28 | |
Net realized
gains | | | — | | | | — | | | | 0.46 | | | | 5.32 | | | | — | | | | | | | | — | | | | — | | | | 0.46 | |
Total distributions | | | 0.31 | | | | 0.31 | | | | 0.82 | | | | 5.76 | | | | 0.53 | | | | | | | | 0.18 | | | | 0.20 | | | | 0.74 | |
Net asset value,
end of period | | $ | 31.92 | | | $ | 29.23 | | | $ | 22.44 | | | $ | 36.41 | | | $ | 39.02 | | | | | | | $ | 31.94 | | | | $29.25 | | | | $22.47 | |
TOTAL RETURN(a) | | | 10.26 | % | | | 31.63 | % | | | (36.05 | )% | | | 8.01 | % | | | 16.12 | % | | | | | | | 9.81 | % | | | 31.05 | % | | | (34.25 | )% |
| | | | | | | | | |
RATIOS/
SUPPLE
MENTAL
DATA: | | | | | | | | | | | | | | | | | | | | | | | | | | | | | | | | | | | | |
Net assets,
end of period
(in thousands) | | $ | 38,305 | | | $ | 41,792 | | | $ | 37,917 | | | $ | 77,777 | | | $ | 101,885 | | | | | | | $ | 9 | | | $ | 9 | | | $ | 7 | |
Ratios to
average
net assets: | | | | | | | | | | | | | | | | | | | | | | | | | | | | | | | | | | | | |
Net invest
ment
income | | | 0.96 | % | | | 1.11 | % | | | 1.03 | % | | | 0.94 | % | | | 1.43 | % | | | | | | | 0.56 | % | | | 0.68 | % | | | 0.74 | %* |
Net Expenses | | | 0.69 | %(b) | | | 0.86 | %(b) | | | 0.72 | %(b) | | | 0.66 | % | | | 0.63 | % | | | | | | | 1.09 | %(b) | | | 1.31 | %(b) | | | 1.17 | %(b)* |
Gross expenses | | | 0.69 | % | | | 0.86 | % | | | 0.72 | % | | | 0.66 | % | | | 0.63 | % | | | | | | | 1.09 | % | | | 1.31 | % | | | 1.17 | % |
Portfolio turnover rate | | | 42 | % | | | 46 | % | | | 56 | % | | | 55 | % | | | 45 | % | | | | | | | 42 | % | | | 46 | % | | | 56 | % |
Notes to Financial Highlights
| (a) | Total returns are historical and assume changes in share price, reinvestment of dividends and capital gains distributions and do not include the effect of insurance contract charges. Past performance does not guarantee future results. |
| (b) | Reflects GE Asset Management’s waiver of a portion of the Fund’s management fee in an amount equal to the management fee earned by GEAM with respect to the Fund’s investment in the GE Funds – GE Money Market Fund. Excluding waiver, the expense ratios would be unchanged. |
| * | Annualized for periods less than one year. |
| ** | Per share values have been calculated using the average share method. |
The accompanying Notes are an integral part of these financial statements.
11
| | | | |
Statement of Assets and Liabilities December 31, 2010 | | | |
| |
ASSETS | | | | |
Investments in securities, at Fair Value (cost $31,751,566) | | | $37,563,481 | |
Investments in affiliated securities, at Fair Value (cost $8,988) | | | 8,539 | |
Short-term affiliated investments (at amortized cost) | | | 852,619 | |
Foreign cash (cost $591) | | | 595 | |
Receivable for investments sold | | | 435 | |
Income receivables | | | 24,938 | |
Receivable for fund shares sold | | | 2,644 | |
Total Assets | | | 38,453,251 | |
| |
LIABILITIES | | | | |
Payable for Fund shares redeemed | | | 4,220 | |
Payable to GEAM | | | 17,728 | |
Accrued other expenses | | | 116,135 | |
Variation margin payable | | | 450 | |
Total Liabilities | | | 138,533 | |
NET ASSETS | | | $38,314,718 | |
| |
NET ASSETS CONSIST OF : | | | | |
Capital paid in | | | 43,301,979 | |
Undistributed (distribution in excess of)
net investment income | | | 902 | |
Accumulated net realized gain (loss) | | | (10,804,445 | ) |
Net unrealized appreciation/(depreciation) on: | | | | |
Investments | | | 5,811,466 | |
Futures and other | | | 4,816 | |
NET ASSETS | | | $38,314,718 | |
| |
Class 1: | | | | |
| |
NET ASSETS | | | 38,305,258 | |
Shares outstanding ($0.01 par value; unlimited shares authorized) | | | 1,200,182 | |
Net asset value per share | | | 31.92 | |
| |
Class 4: | | | | |
| |
NET ASSETS | | | 9,460 | |
Shares outstanding ($0.01 par value; unlimited shares authorized) | | | 296 | |
Net asset value per share | | | 31.94 | |
The accompanying Notes are an integral part of these financial statements.
12
| | | | |
Statement of Operations For the year ending December 31, 2010 | | | |
| |
INVESTMENT INCOME | | | | |
Income: | | | | |
Dividends | | | $609,314 | |
Interest | | | 23,374 | |
Interest from affiliated investments | | | 225 | |
Less: Foreign taxes withheld | | | (2,916 | ) |
Total Income | | | 629,997 | |
| |
Expenses: | | | | |
Advisory and administrative fees | | | 211,600 | |
Transfer agent fees | | | 13,037 | |
Directors’ fees | | | 1,395 | |
Custody and accounting expenses | | | 14,805 | |
Professional fees | | | 15,371 | |
Other expenses | | | 9,005 | |
Total expenses before waiver and reimbursement | | | 265,213 | |
Less: Expenses reimbursed by the adviser | | | (2,200 | ) |
Net expenses | | | 263,013 | |
Net investment income (loss) | | | 366,984 | |
| |
NET REALIZED AND UNREALIZED GAIN (LOSS)
ON INVESTMENTS | | | | |
| |
Realized gain (loss) on: | | | | |
Investments | | | 354,541 | |
Futures and other | | | 143,564 | |
| |
Increase (decrease) in unrealized appreciation/(depreciation) on: | | | | |
Investments | | | 2,777,037 | |
Futures and other | | | 4,354 | |
Net realized and unrealized gain (loss) on investments | | | 3,279,496 | |
Net increase (decrease) in net assets resulting from operations | | | $3,646,480 | |
The accompanying Notes are an integral part of these financial statements.
13
| | | | | | | | |
Statements of Changes in Net Assets | | | |
| | | Year Ended
December
31, 2010 | | | Year Ended
December
31, 2009 | |
| | |
INCREASE (DECREASE) IN NET ASSETS | | | | | | | | |
Operations: | | | | | | | | |
Net investments income | | | $ 366,984 | | | | $ 423,730 | |
Net realized gain (loss) on investments, futures and foreign currency transactions | | | 498,105 | | | | (6,358,263 | ) |
Net increase (decrease) in unrealized appreciation/(depreciation) on investments,
futures and foreign currency transaction | | | 2,781,391 | | | | 16,408,296 | |
Net increase (decrease) from operations | | | 3,646,480 | | | | 10,473,763 | |
Distributions to shareholders from : | | | | | | | | |
Net investment income | | | | | | | | |
Class 1 | | | (369,247 | ) | | | (439,224 | ) |
Class 4 | | | (53 | ) | | | (58 | ) |
Total distributions | | | (369,300 | ) | | | (439,282 | ) |
Increase (decrease) in net assets from operations and distributions | | | 3,277,180 | | | | 10,034,481 | |
Share transactions : | | | | | | | | |
Proceeds from sale of shares | | | | | | | | |
Class 1 | | | 353,286 | | | | 798,549 | |
Class 4 | | | — | | | | — | |
Value of distributions reinvested | | | | | | | | |
Class 1 | | | 369,247 | | | | 439,224 | |
Class 4 | | | 53 | | | | 58 | |
Cost of shares redeemed | | | | | | | | |
Class 1 | | | (7,485,265 | ) | | | (7,396,085 | ) |
Class 4 | | | — | | | | — | |
Net increase (decrease) from share transactions | | | (6,762,679 | ) | | | (6,158,254 | ) |
Total increase (decrease) in net assets | | | (3,485,499 | ) | | | 3,876,227 | |
| | |
NET ASSETS | | | | | | | | |
Beginning of period | | | 41,800,217 | | | | 37,923,990 | |
End of period | | | $38,314,718 | | | | $41,800,217 | |
Undistributed (distribution in excess of)
net investment income, end of period | | | $ 902 | | | | $ 3,181 | |
| | |
CHANGES IN FUND SHARES | | | | | | | | |
| | |
Class 1 | | | | | | | | |
Shares sold | | | 11,976 | | | | 30,844 | |
Issued for distributions reinvested | | | 11,546 | | | | 14,889 | |
Shares redeemed | | | (253,018 | ) | | | (305,851 | ) |
Net increase (decrease) in fund shares | | | (229,496 | ) | | | (260,118 | ) |
| | |
Class 4 | | | | | | | | |
Shares sold | | | — | | | | — | |
Issued for distributions reinvested | | | 2 | | | | 2 | |
Shares redeemed | | | — | | | | — | |
Net increase (decrease) in fund shares | | | 2 | | | | 2 | |
The accompanying Notes are an integral part of these financial statements.
14
| | |
| Notes to Financial Statements | | December 31, 2010 |
| 1. | Organization of the Company |
GE Investments Funds, Inc. (the “Company”) was incorporated under the laws of the Commonwealth of Virginia on May 14, 1984 and is registered under the Investment Company Act of 1940, as amended (the “1940 Act”), as an open-end management investment company. The Company is composed of fourteen investment portfolios (collectively the “Funds”), although only the following eleven are currently being offered: U.S. Equity Fund, (the “Fund”) S&P 500 Index Fund, Premier Growth Equity Fund, Core Value Equity Fund, Mid-Cap Equity Fund, Small-Cap Equity Fund, International Equity Fund, Total Return Fund, Income Fund, Money Market Fund and Real Estate Securities Fund.
Shares of the Funds of the Company are offered only to insurance company separate accounts that fund certain variable life insurance contracts and variable annuity contracts. GE Asset Management Incorporated (“GEAM”) is the investment adviser and administrator of each of the Funds.
The Company offers two share classes (Class 1 and Class 4) of the Fund. Class 4 shares were first offered on May 1, 2008, and Fund shares outstanding prior to May 1, 2008 were designated as Class 1 shares. Each share class has different fees and expenses, and as a result, each share class will have different share price and performance. Not all variable contracts offer both share classes of the Fund.
| 2. | Summary of Significant Accounting Policies |
The preparation of financial statements in conformity with U.S. generally accepted accounting principles (GAAP) requires management to make estimates and assumptions that affect the reported amounts of assets and liabilities and disclosure of contingent assets and liabilities at the date of the financial statements and the reported amounts of increases and decreases in net assets from operations during the reporting period. Actual results may differ from those estimates.
Subsequent events after the balance sheet date through the date the financial statements were issued, have been evaluated in the preparation of the financial statements.
There are no items to report.
The following summarizes the significant accounting policies of the Company:
Securities Valuation and Transactions. All investments in securities are recorded at their estimated fair value, as described in Note 3.
Securities transactions are accounted for as of the trade date. Realized gains and losses on investments sold are recorded on the basis of identified cost for both financial statement and federal tax purposes.
The Fund’s income, expenses (other than distribution fees) and realized and unrealized gains and losses are allocated proportionally each day among the share classes based upon the relative net assets of each class.
Futures Contracts A futures contract represents a commitment for the future purchase or sale of an asset at a specified price on a specified date. The Fund invests in stock index futures contracts subject to certain limitations to manage its exposure to the stock markets. Buying futures tends to increase a Fund’s exposure to the underlying instrument while selling futures tends to decrease a Fund’s exposure to the underlying instrument or to hedge other Fund investments. With futures contracts, there is minimal counterparty credit risk to the Fund since futures contracts are exchange traded and the exchange’s clearinghouse, as counterparty to all traded futures, guarantees the futures against default. A Fund’s risks in using these contracts include changes in the value of the underlying instruments, non- performance of the counterparties under the contracts’ terms and changes in the liquidity of the secondary market for the contracts. Futures contracts are valued at the settlement price established each day by the board of trade or exchange on which they principally trade.
Upon entering into a financial futures contract, the Fund is required to pledge to the broker an amount of cash and/or other assets equal to a certain percentage of the contract amount, known as initial margin deposit. Subsequent payments, known as variation margin, are made or received by the Fund each day, depending on the daily fluctuation in the fair value of the underlying security. The Fund records an unrealized gain or loss equal to the daily variation margin. Should market conditions move unexpectedly, the Fund may not achieve the anticipated benefits of the futures contracts and may incur a loss. The Fund recognizes a realized gain or loss upon the expiration or closing of a futures contract.
Investment Income Corporate actions (including cash dividends) are recorded on the ex-dividend date, net of applicable withholding taxes. Interest income is recorded on the accrual basis.
15
| | |
| Notes to Financial Statements | | December 31, 2010 |
Expenses Fund specific expenses are allocated to the Fund that incurs such expenses and pro rata across share classes. Expenses, other than those incurred by a specific Fund, are allocated pro rata among Fund’s share classes. Such expenses may include custodial fees, legal and accounting fees, printing costs and registration fees. All expenses of the Fund are paid by GEAM and reimbursed by the Fund. Certain class specific expenses (such as transfer agency fees or distribution fees) are allocated to the class that incurs such expense.
Federal Income Taxes The Fund intends to comply with all sections of the Internal Revenue Code applicable to regulated investment companies including the distribution of substantially all of its taxable net investment income and net realized capital gains to its shareholders. Therefore, no provision for federal income tax has been made. The Fund is treated as a separate taxpayer for federal income tax purposes.
The Fund utilizes various methods to measure the fair value of most of its investments on a recurring basis. GAAP establishes a framework for measuring fair value and providing related disclosures. Broadly, the framework requires fair value to be determined based on the exchange price that would be received for an asset or paid to transfer a liability (an exit price) in the principal or most advantageous market for the asset or liability in an orderly transaction between market participants at the measurement date. In the absence of active markets for the identical assets or liabilities, such measurements involve developing assumptions based on market observable data and, in the absence of such data, internal information that is consistent with what market participants would use in a hypothetical transaction that occurs at the measurement date. It also establishes a three-level valuation hierarchy based upon observable and non-observable inputs.
Observable inputs reflect market data obtained from independent sources, while unobservable inputs reflect our market assumptions. Preference is given to observable inputs. These two types of inputs create the following fair value hierarchy:
Level 1 — Quoted prices for identical investments in active markets.
Level 2 — Quoted prices for similar investments in active markets; quoted prices for identical or similar
investments in markets that are not active; and model-derived valuations whose inputs are observable or whose significant value drivers are observable.
Level 3 — Significant inputs to the valuation model are unobservable.
Policies and procedures are maintained to value investments using the best and most relevant data available. In addition, pricing vendors are utilized to assist in valuing investments. GEAM performs periodic reviews of the methodologies used by independent pricing services including price validation of individual securities.
Fair Value Measurement The following section describes the valuation methodologies the Fund use to measure different financial investments at fair value.
The Fund’s portfolio securities are valued generally on the basis of market quotations. Equity securities generally are valued at the last reported sale price on the primary market in which they are traded. Portfolio securities listed on NASDAQ are valued using the NASDAQ Official Closing Price. Level 1 securities primarily include publicly-traded equity securities which may not necessarily represent the last sale price. If no sales occurred on the exchange or NASDAQ that day, the portfolio security generally is valued using the last reported bid price. In those circumstances the Fund classifies the investment securities in Level 2.
The Fund uses non-binding broker quotes as the primary basis for valuation when there is limited, or no, relevant market activity for a specific investment or for other investments that share similar characteristics. The Funds have not adjusted the prices obtained. Investment securities priced using non-binding broker quotes are included in Level 3. As is the case with the primary pricing vendor, third-party brokers do not provide access to their proprietary valuation models, inputs and assumptions. Accordingly, GEAM conducts internal reviews of pricing for all such investment securities periodically to ensure reasonableness of valuations used in the Fund‘s financial statements. These reviews are designed to identify prices that appear stale, those that have changed significantly from prior valuations, and other anomalies that may indicate that a price may not be accurate. Based on the information available, GEAM believes that the fair values provided by the brokers are representative of prices that would be received to sell the assets at the measurement date (exit prices).
16
| | |
| Notes to Financial Statements | | December 31, 2010 |
A Fund’s written or purchased options are valued at the last sales price, or if no sales occurred that day, at the last reported bid price and those are also included in Level 2.
If prices are not readily available for a portfolio security, or if it is believed that a price for a portfolio security does not represent its fair value, the security may be valued using procedures approved by the Fund’s Board of Directors that are designed to establish its “fair” value. These securities would be classified in Level 3. Those procedures require
that the fair value of a security be established by the valuation committee. The valuation committee follows different protocols for different types of investments and circumstances. The fair value procedures may be used to value any investment of the Fund in the appropriate circumstances.
The following table presents the Fund’s investments measured at fair value on a recurring basis at December 31, 2010:
| | | | | | | | | | | | | | | | |
| | | Level 1 | | | Level 2 | | | Level 3 | | | Total | |
Investments in Securities† | | | | | | | | | | | | | | | | |
Common Stock | | $ | 36,954,003 | | | $ | — | | | $ | — | | | $ | 36,954,003 | |
Exchanged Traded Funds | | | 609,478 | | | | — | | | | — | | | | 609,478 | |
Other Investments | | | — | | | | 8,539 | | | | — | | | | 8,539 | |
Short-Term Investments | | | 852,619 | | | | — | | | | — | | | | 852,619 | |
| | | | | | | | | | | | | | | | |
Total Investments in Securities | | $ | 38,416,100 | | | $ | 8,539 | | | | — | | | $ | 38,424,639 | |
| | | | | | | | | | | | | | | | |
Other Financial Instruments* | | | | | | | | | | | | | | | | |
Futures Contracts — Unrealized Appreciation | | $ | 4,812 | | | $ | — | | | $ | — | | | $ | 4,812 | |
|
† See Schedule of Investments for Industry Classification. * Other financial instruments include derivative instruments such as futures, forward foreign currency exchange contracts, swap contacts and option contacts. Amounts shown represent unrealized appreciation (depreciation), or in the case of options, market value at period end. | |
| 4. | Derivatives Transactions |
Shown below are the derivative contracts entered into by the Fund, summarized by primary risk exposure as they appear on the Statement of Assets and Liabilities, all of which are not accounted for as hedging instruments under FASB Accounting Standards Codification (“ASC”) No. 815 Derivatives and Hedging as of December 31, 2010.
| | | | | | | | | | | | |
| | | Asset Derivatives | | | Liability Derivatives | |
| | | Location | | Fair Value($) | | | Location | | Fair Value($) | |
| Equity Futures | | Assets, Net Assets — Unrealized Appreciation/ (Depreciation) on Futures | | | 4,812 | * | | | | | | |
Shown below are the effects of derivative instruments on the Fund’s Statement of Operations, summarized by primary risk exposure all of which are not accounted for as hedging instruments under ASC 815.
| | | | | | | | | | | | | | |
| | | Location | | Notional Amount of
Futures Contracts
Purchased/(Sold)($) | | | Realized Gain
or (Loss)($) | | | Change in Unrealized
Appreciation/(Depreciation)($) | |
Equity Futures | | Net realized gain/(loss) on futures, Increase/(decrease) in unrealized appreciation/ (depreciation) on futures | | | 8,598,685/(8,315,245) | | | | 143,646 | | | | 4,350 | |
| * | Includes cumulative appreciation/depreciation of futures contracts as reported in the Schedule of Investments and within the components of Net Assets section of the Statements of Assets and Liabilities. Only the current day’s variation margin is reported within the receivables and/or payables of the Statement of Assets and Liabilities. |
17
| | |
| Notes to Financial Statements | | December 31, 2010 |
The Company shares a revolving credit facility of up to $150 million with a number of its affiliates. The credit facility is with its custodian bank, State Street Bank and Trust Company (“State Street”). The revolving credit facility requires the payment of a commitment fee equal to 0.125% per annum on the daily unused portion of the credit facility, payable quarterly. The portion borne by the Funds generally is borne proportionally based upon net assets. In addition, the Company has a $100 million uncommitted, unsecured line of credit with State Street. Generally, borrowings under the credit facilities would accrue interest at the Federal Funds Rate plus 50 basis points and would be borne by the borrowing Fund. The maximum amount allowed to be borrowed by any one Fund is the lesser of (i) 33.33% of its total assets or (ii) 20% of its net assets. The credit facilities were not utilized by the Fund during the fiscal year ended December 31, 2010.
| 6. | Fees and Compensation Paid to Affiliates |
GEAM, a registered investment adviser, was retained by the Company’s Board of Directors effective November 17, 1997 to act as investment adviser and administrator of the Fund. GEAM’s compensation for investment advisory and administrative services is paid monthly based on the average daily net assets of the Fund at an annualized rate of 0.55%.
GEAM waives a portion of the Fund’s management fee in the amount equal to the management fee earned by GEAM with respect to the Fund’s investment in the GE Funds—GE Money Market Fund.
Distribution and Service (12b-1) Fees The Company has adopted a Distribution and Service (12b-1) Plan (the “Plan”) pursuant to Rule 12b-1 under the 1940 Act with respect to Class 4 shares of the Fund. Under the Plan, the Fund may compensate GE Investment Distributors, Inc. (“GEID”), a wholly-owned subsidiary of GEAM and the Fund’s principal distributor, for certain sales services provided by GEID or other broker dealers and investor services provided by GEID or other service providers relating to the Fund’s Class 4 shares, including services to owners or prospective owners of variable contracts issued by insurance companies that offer such share class as an investment option. The amount of compensation paid under the Plan by the Fund’s Class 4 shares may not exceed 0.45% of the average daily net assets of the Fund attributable to such share class. The Plan continues in effect from year to year for so long as such
continuance is approved annually by the Board of Directors, including by those directors who are not interested persons of the Company and who have no direct or indirect financial interest in the operation of the Plan or in any agreement related to it.
Directors’ Compensation The Fund pays no compensation to its directors who are officers or employees of GEAM or its affiliates. Directors who are not such officers or employees also serve in a similar capacity for other funds advised by GEAM. Compensation paid to unaffiliated directors are reflected on the Statement of Operations. These fees are allocated pro rata across all of the mutual fund platforms and share classes served by the directors, including the Fund, and are based upon the relative net assets of each Fund within such platforms.
| 7. | Investment Transactions |
Purchases and Sales of Securities The cost of purchases and the proceeds from sales of investments, other than short-term securities and options, for the year ended December 31, 2010 were as follows:
| | |
| Non U.S. Government Securities |
| Purchases | | Sales |
$15,762,135 | | $22,469,061 |
The Fund is subject to ASC 740, Income Taxes. ASC 740 provides guidance for financial accounting and reporting for the effects of income taxes that result from an entity’s activities during the year. ASC 740 also provides guidance regarding how certain uncertain tax positions should be recognized, measured, presented and disclosed in the financial statements. ASC 740 requires evaluation of tax positions taken or expected to be taken in the course of preparing the Fund’s tax returns to determine whether the tax positions are “more likely than not” of being sustained by the applicable tax authority. There are no adjustments to the Fund’s net assets required under ASC 740. The Fund’s 2007, 2008, 2009 and 2010 fiscal years tax returns are still open to examination by the Federal and applicable state tax authorities.
18
| | |
| Notes to Financial Statements | | December 31, 2010 |
At December 31, 2010, information on the tax components of capital is as follows:
| | | | | | | | | | | | | | |
Cost on
Tax Basis | | Gross Unrealized Tax | | Net Tax Appreciation/(Depreciation) | | | | | | |
| | Appreciation | | Depreciation | | Investments | | Derivatives/
Currency | | Undistributed
Income | | Undistributed
Accumulated
Capital Loss | | Post
October
Losses |
| $35,461,993 | | $6,399,030 | | $(3,436,384) | | $2,962,646 | | $— | | $1,579 | | $(7,951,481) | | $(5) |
As of December 31, 2010, the Fund has capital loss carryovers as indicated below. Capital loss carryovers are available to offset future realized capital gains to the extent provided in the Internal Revenue Code and regulations thereunder. To the extent that these carryover losses are used to offset future capital gains, it is probable that the gains so offset will not be distributed to shareholders because they would be taxable as ordinary income.
| | |
| Amount | | Expires |
$ 26,864 | | 12/31/2016 |
7,924,617 | | 12/31/2017 |
These amounts will be available to offset future taxable capital gains. Under the recently enacted Regulated Investment Company Modernization Act of 2010, the Fund will be permitted to carry forward capital losses incurred in taxable years beginning after December 22, 2010 for an unlimited period. However, any losses incurred during those future years will be required to be utilized prior to the losses incurred in pre-enactment tax years. As a result of this ordering rule, pre-enactment capital loss carryforwards may be more likely to expire unused. Additionally, post-enactment capital losses that are carried forward will retain their character as either short-term or long-term capital losses rather than being considered all short-term as under previous law.
During the year ended December 31, 2010, the Fund utilized $778,743 of prior year capital loss carryovers.
Any net capital and currency losses incurred after October 31, within the Fund’s tax year, are deemed to arise on the first day of the Fund’s next tax year if the Fund so elects to defer such losses.
The Fund elected to defer losses incurred after October 31, 2010 as follows:
The tax composition of distributions paid during the years ended December 31, 2010 and December 31, 2009 were as follows:
| | | | | | | | | | | | |
| | | Ordinary
Income | | | Long-Term
Capital Gains | | | Total | |
2010 | | $ | 369,300 | | | $ | — | | | $ | 369,300 | |
2009 | | | 439,282 | | | | — | | | | 439,282 | |
Distributions to Shareholders The Fund declares and pays any dividends from net investment income annually. The Fund declares and pays any net realized capital gains in excess of capital loss carryforwards distributions annually. The character of income and gains to be distributed is determined in accordance with income tax regulations which may differ from generally accepted accounting principles. These differences include (but are not limited to) futures investments organized as partnerships for tax purposes and losses deferred due to wash sale transactions. Reclassifications due to permanent book/tax differences are made to the Fund’s capital accounts to reflect income and gains available for distribution (or available capital loss carryovers) under income tax regulations. These reclassifications have no impact on net investment income, realized gains or losses, or the net asset value of the Fund. The calculation of net investment income per share in the Financial Highlights table excludes these adjustments.
The reclassifications for the year ended December 31, 2010 were as follows:
| | |
Undistributed Net Investment Income | | Accumulated Net Realized (Loss) |
$37 | | $(37) |
19
Report of Independent Registered Public Accounting Firm
The Shareholders and Board of Directors
GE Investments Funds, Inc.
We have audited the accompanying statement of assets and liabilities, including the schedule of investments, of the U.S. Equity Fund, a series of GE Investments Funds, Inc., as of December 31, 2010, and the related statement of operations for the year then ended, statements of changes in net assets for each of the years in the two-year period then ended, and the financial highlights for each of the years in the five-year period then ended. These financial statements and financial highlights are the responsibility of the Fund’s management. Our responsibility is to express an opinion on these financial statements and financial highlights based on our audits.
We conducted our audits in accordance with the standards of the Public Company Accounting Oversight Board (United States). Those standards require that we plan and perform the audit to obtain reasonable assurance about whether the financial statements and financial highlights are free of material misstatement. An audit includes examining, on a test basis, evidence supporting the amounts and disclosures in the financial statements. Our procedures included confirmation of securities owned as of December 31, 2010 by correspondence with the custodian. An audit also includes assessing the accounting principles used and significant estimates made by management, as well as evaluating the overall financial statement presentation. We believe that our audits provide a reasonable basis for our opinion.
In our opinion, the financial statements and financial highlights referred to above present fairly, in all material respects, the financial position of the U.S. Equity Fund as of December 31, 2010, the results of its operations, changes in its net assets and financial highlights for each of the years or periods described above, in conformity with U.S. generally accepted accounting principles.

Boston, Massachusetts
February 25, 2011
20
| | |
| Advisory and Administrative Agreement Renewal | | (unaudited) |
The Board of Directors of the GE Investments Funds, Inc. (the “Board”), including the independent Board members, considered and all those that were present unanimously approved the continuance of the Fund’s Investment Advisory and Administration Agreement with GE Asset Management Incorporated (“GEAM”) at meetings held on December 3 and December 10, 2010.
In considering whether to approve the Fund’s investment advisory agreement, the Board members considered and discussed a substantial amount of information and analysis provided, at the Board’s request, by GEAM. The Board members also considered detailed information regarding performance and expenses of other investment companies, including those with similar investment strategies and sizes, which was prepared by independent third party provider Morningstar, Inc. (“Morningstar”). The Board members reviewed the fees charged by GEAM for other mutual funds and investment products other than mutual funds that employ the same investment strategy as the Fund. The Board had the opportunity to ask questions and request additional information in connection with its considerations.
Before approving the Fund’s advisory agreement, the Board members reviewed the information provided with management of GEAM and with independent legal counsel. The Board members also reviewed a memorandum prepared by independent legal counsel discussing the legal standards for the consideration of the proposed continuance. The independent Board members discussed the proposed continuance in detail during a private session with their independent legal counsel at which no representatives of GEAM were present. The independent Board members and their independent legal counsel requested, and received and considered, additional information from GEAM following these sessions.
In advance of the meetings, and in response to their request, the Board members received from GEAM written responses to their inquiries, which included substantial exhibits and other materials related to GEAM’s business and the services it provides to the Fund. The Board members took into account their multi-year experience as Board members and particularly their consideration of these types of agreements in recent years. The information was presented in a manner to facilitate comparison to prior periods and to reflect certain enhancements. To focus their review, the Board members asked GEAM management, in its oral presentation, to highlight material differences from the information presented in recent years.
During the meetings, the Board members had an opportunity to discuss this information with GEAM managers, including senior executives, representatives from the legal, compliance and finance departments, and investment personnel. The Board members posed questions to these representatives and engaged in substantive discussions with them concerning GEAM’s investment process.
In reaching their determination relating to continuance of the Fund’s investment advisory agreement, the Board members considered all factors that they deemed relevant, including the factors discussed below. In their deliberations, the Board members did not identify any particular information that was all-important or controlling, and each Board member may have attributed different weights to the various factors. In particular, the Board members focused on the following:
The Nature, Extent And Quality Of Services Provided.
The Board members reviewed the services provided by GEAM, taking into account their extensive past experiences with GEAM. They focused on the favorable attributes of GEAM, including (i) an investment philosophy oriented toward long-term performance; (ii) effective processes used for selecting investments and brokers; (iii) effective processes used for providing Fund administration, including controllership and compliance functions and oversight of the performance of other companies that provide services to the Fund; (iv) highly skilled professionals including analysts, research professionals, traders and portfolio managers with a depth of experience relevant to the Fund; (v) access to significant technological resources from which the Fund may benefit; and (vi) a favorable history and reputation. The Board members noted that the Fund represents only a small portion of the assets managed by GEAM, but benefits from a full array of services and resources provided by GEAM.
In light of these discussions, the Board, including the independent Board members, concluded that GEAM’s services continue to be satisfactory.
Investment Performance Of The Fund.
The Board members considered the investment performance of the Fund for various periods. The Board members reviewed detailed comparisons of the performance of the Fund with the relevant securities index and peer groupings of mutual funds prepared by
21
| | |
| Advisory and Administrative Agreement Renewal | | (unaudited) |
Morningstar with respect to various periods. The Board members also engaged in detailed discussions with GEAM management about its investment process and performance results. These discussions focused on the Fund’s investment objective, the number and experience of portfolio management and supporting research personnel, the investment style and approach employed and the likely market cycles for the investment style and recent relative underperformance. The Board members discussed GEAM’s investment approach with respect to the Fund, and that the performance of the Fund is consistent with GEAM’s articulated long-term approach and overall investment philosophy.
The Board, including the independent Board members, concluded that the Fund’s performance was acceptable overall taking into consideration the factors discussed above.
Cost Of The Services Provided And Profits Realized From The Relationship With The Fund.
The Board members considered the fees paid to GEAM by the Fund and the cost of the services provided to the Fund by GEAM. The Board members reviewed the information they had requested from GEAM concerning its profitability. The Board members considered the profit margin information for GEAM’s investment company business as a whole, as well as GEAM’s profitability data for the Fund. The Board members reviewed GEAM’s assumptions and the methods of cost allocation used by GEAM in preparing Fund-specific profitability data. The Board members also discussed with GEAM the basis for its belief that the methods of allocation used were reasonable for each area of its business.
Information was presented regarding the financial condition of GEAM for various past periods. The Board members noted and discussed the additional services provided by GEAM to the Fund compared to other investment products managed by GEAM, and previously had been provided a study conducted by the Investment Company Institute that discusses and compares advisory fees and services for mutual funds and institutional separate accounts. The Board members determined that GEAM should be entitled to earn a reasonable level of profits for the services it provides to the Fund. The Board members also recognized that GEAM had made significant investments in its business and had not fully recovered the sums invested. The Board also considered that GEAM
continues to make a substantial investment in fulfilling its obligations to the Fund and supporting its Fund-related activities.
Based on their review, the Board, including the independent Board members, concluded that they were satisfied that the level of profitability achieved by GEAM from its relationship with the Fund was not unreasonable or excessive.
The Extent To Which Economies Of Scale Would Be Realized As The Fund Grows And Whether Fee Levels Would Reflect Such Economies Of Scale.
Although the Board noted that the Fund did not experience significant growth in assets over the past year, the Board members considered the extent to which economies of scale would be realized as the Fund grows, and whether fee levels reflect these economies of scale for the benefit of Fund investors.
The Board members considered the substantial infrastructure investments that GEAM has made with respect to its operations and its commitment to continue investing resources to enhance services to Fund shareholders. The Board members recognized the benefits to the Fund of GEAM’s past investment in its operations through the expenditure of sums to support its substantial infrastructure, and that, with respect to all GEAM managed mutual funds, GEAM has not yet fully recouped that investment. The Board members also recognized the benefits to the Fund of being able to leverage a favorable cost structure achieved with respect to the Fund’s other operating expenses as a result of GEAM’s large overall base of assets under management and its vendor management practices.
Comparison Of Services To Be Rendered And Fees To Be Paid.
The Board members discussed the services provided to the Fund by GEAM, and the fees charged for those services. The Board members reviewed information concerning the fee and expense ratios for the Fund, and comparative information with respect to peer groupings of mutual funds prepared by Morningstar. They discussed that the Fund’s figures were within the applicable peer group ranges. In light of the foregoing, the Board, including the independent Board members, determined that the advisory fees were reasonable in relation to the services provided to the Fund.
22
| | |
| Advisory and Administrative Agreement Renewal | | (unaudited) |
Fall-Out Benefits.
The Board members considered other actual and potential financial benefits that GEAM may derive from its relationship with the Fund, including, to the extent applicable, soft dollar commission benefits generated through Fund portfolio transactions. The Board members noted, however, that the Fund benefits from the vast array of resources available through GEAM, and that the Fund represents only a small portion of the assets managed by GEAM.
Conclusion.
No single factor was determinative to the Board’s decision. Based on their discussion and such other matters as were deemed relevant, the Board, including the independent Board members, concluded that renewal of the advisory agreement was in the best interests of the Fund and its shareholders.
23
| | |
| Additional Information | | (unaudited) |
Information about Directors and Executive Officers:
The business and affairs of the Company are managed under the direction of the Company’s Board of Directors. Information pertaining to the Directors and officers of the Company is set forth below.
Interested Directors and Executive Officers
Michael J. Cosgrove
Address c/o GEAM 3001 Summer St. Stamford, CT 06905
Age 61
Position(s) Held with Fund Chairman of the Board and President
Term of Office and Length of Time Served Until successor is elected and qualified – 14 years
Principal Occupation(s) During Past 5 years President and Chief Executive Officer – Mutual Funds and Intermediary Business since March 2007; Executive Vice President of GEAM from February 1997 to March 2007; Director of GEAM since 1988; Vice President, GE Capital Corporation, an indirect wholly-owned subsidiary of GE, since December 1999; Executive Vice President – Sales and Marketing of GEAM, a wholly-owned subsidiary of GE that is registered as an investment adviser under the Investment Advisers Act of 1940, as amended, from March 1993 to March 2007.
Number of Portfolios in Fund Complex Overseen by Director 49
Other Directorships Held by Director Chairman of the Board and President of GE Funds from 1993 to February 2011, and GE Institutional Funds since its inception; Trustee of General Electric Savings & Security Trust, General Electric S&S Income Fund, General Electric S&S Program Mutual Fund (“GE Savings & Security Funds”), Elfun Funds, General Electric Insurance Plan Trust, General Relief Loan Fund, and General Electric Pension Trust since 1988; Trustee of Fordham University since 2002; Trustee of GE Volunteers since 1993; Director, GE Asset Management (Ireland) since February 1999; Director, GE Asset Management Funds Plc., GE Asset Canada Company, and GE Asset Management Limited since 1998.
Matthew J. Simpson
Address c/o GEAM 3001 Summer St. Stamford, CT 06905
Age 49
Position(s) Held with Fund Director and Executive Vice President
Term of Office and Length of Time Served Until successor is elected and qualified – 3 years
Principal Occupation(s) During Past 5 years Executive Vice President, General Counsel and Secretary of GEAM since July 2007; Senior Vice President and General Counsel – Marketing and Client Services (formerly Asset Management Services), at GEAM and Senior Vice President and General Counsel of GEAMS from February 1997 to June 2007; Vice President and Associate General Counsel of GEAM from October 1992 to February 1997; Vice President of GE Funds, GE Institutional Funds and GE LifeStyle Funds from September 2003 to June 2007; Secretary of GE Funds and GE Institutional Funds from 1997 to June 2007; Vice President of Elfun Funds and GE Savings & Security Funds from October 2003 to June 2007; Assistant Secretary of Elfun Funds and GE Savings & Security Funds from 1998 to June 2007.
Number of Portfolios in Fund Complex Overseen by Director 49
Other Directorships Held by Director Trustee of GE Institutional Funds, Elfun Funds and GE Savings & Security Funds since July 2007. Trustee of GE Funds from July 2007 to February 2011.
24
| | |
| Additional Information | | (unaudited) |
Joon Won Choe
Address c/o GEAM 3001 Summer St. Stamford, CT 06905
Age 41
Position(s) Held with Fund Vice President & Secretary
Term of Office and Length of Time Served Until successor is elected and qualified – Vice President and Secretary – less than 1 year
Principal Occupation(s) During Past 5 years Senior Vice President and Associate General Counsel at GEAM since June 2010; Vice President and Associate General Counsel at GEAM from November 2005 to June 2010; Vice President and Secretary of GE Funds from September 2010 to February 2011. Vice President and Secretary of GE Institutional Funds and GE Investments Funds, Inc. since September 2010; Vice President and Assistant Secretary of Elfun Funds and GE Savings & Security Funds since September 2010.
Number of Portfolios in Fund Complex Overseen by Officer N/A
Other Directorships Held by Officer N/A
Robert Herlihy
Address c/o GEAM 3001 Summer St. Stamford, CT 06905
Age 43
Position(s) Held with Fund Senior Vice President and Chief Compliance Officer
Term of Office and Length of Time Served Until successor is elected and qualified — 5 years
Principal Occupation(s) During Past 5 years Chief Compliance Officer of GEAM, GE Institutional Funds, Elfun Funds, and GE Savings and Security Funds since July 2005; Chief Compliance officer of GE Funds from July 2005 to February 2011; Manager of Fund Administration at GEAM from 2002 – 2005.
Number of Portfolios in Fund Complex Overseen by Officer N/A
Other Directorships Held by Officer N/A
Eunice Tsang
Address c/o GEAM 3001 Summer St. Stamford, CT 06905
Age 51
Position(s) Held with Fund Treasurer
Term of Office and Length of Time Served Until successor is elected and qualified – less than one year
Principal Occupations(s) During Past 5 years Treasurer of GE Institutional Funds, Elfun Funds and GE Savings and Security Funds since January 2010; Treasurer of GE Funds from January 2010 to February 2011; GEAM Operational Controllership and Technical Accounting Manager since December 2007; Financial Planning & Analysis Manager – Performance Leader from June 2005 to December 2007; GEAM Quality Black Belt from 2001 to June 2005; Financial Planning & Analysis Manager from 2000 to 2001; and Mutual Fund Assistant Controller from October 1997 to 2000.
Number of Portfolios in Fund Complex Overseen by Officer N/A
Other Directorships Held by Officer N/A
25
| | |
| Additional Information | | (unaudited) |
Non-Interested Directors
John R. Costantino
Address c/o GEAM 3001 Summer St. Stamford, CT 06905
Age 64
Position(s) Held with Fund Director
Term of Office and Length of Time Served Until successor is elected and qualified – 14 years
Principal Occupation(s) During Past 5 years General Partner, NGN Capital LLC since 2006; Managing Director, Vice President of Walden Capital Management since 1996.
Number of Portfolios in Fund Complex Overseen by Director 41
Other Directorships Held by Director Trustee of GE Funds since 1993, GE Institutional Funds since its inception; Trustee of Fordham University from 1989 to 1995 and 2001 to 2007 and Trustee Emeritus since 2007; Trustee of Neuro Science Research Institute since 1986; Trustee of Gregorian University Foundation from 1992 to 2007; Director of Artes Medical from 2006 to 2008.
William J. Lucas
Address c/o GEAM 3001 Summer St. Stamford, CT 06905
Age 61
Position(s) Held with Fund Director
Term of Office and Length of Time Served Until successor is elected and qualified – 13 years (No longer serves as Trustee effective November 4, 2010)
Principal Occupation(s) During Past 5 years Retired since 2010, previously Vice President and Treasurer of Fairfield University since 1983.
Number of Portfolios in Fund Complex Overseen by Director 41
Other Directorships Held by Director Trustee of GE Funds since 1993, and GE Institutional Funds since its inception.
Robert P. Quinn
Address c/o GEAM 3001 Summer St. Stamford, CT 06905
Age 74
Position(s) Held with Fund Director
Term of Office and Length of Time Served Until successor is elected and qualified – 14 years
Principal Occupation(s) During Past 5 years Retired since 1983 from Salomon Brothers Inc.
Number of Portfolios in Fund Complex Overseen by Director 41
Other Directorships Held by Director Trustee of GE Funds since 1993, and GE Institutional Funds since its inception; Trustee, St. Francis Hospital Corp. Since 1980.
The Statement of Additional Information for the Fund includes additional information about the Directors and Officers and is available, without charge, upon request by calling 1-800-493-3042.
26
Investment Adviser and Administrator
GE Asset Management Incorporated
Board of Directors
Michael J. Cosgrove, Chairman
John R. Costantino
William J. Lucas*
Robert P. Quinn
Matthew J. Simpson
Secretary
Joon Won Choe
Assistant Secretary
Michelle Matzelle
Treasurer
Eunice Tsang
Assistant Treasurers
Tatyana Begun**
Casey Yantosca
Distributor
GE Investment Distributors, Inc.
Member FINRA and SIPC
Counsel
Sutherland, Asbill & Brennan, LLP
Custodian
State Street Bank & Trust Company
Independent Registered Public Accounting Firm
KPMG LLP
Officers of the Investment Adviser
James W. Ireland, President and Chief Executive Officer
Cheryl H. Beacock, Senior Vice President, Human Resources
Paul M. Colonna, President and Chief Investment Officer – Fixed Income Investments
Michael J. Cosgrove, President and Chief Executive
Officer – Mutual Funds & Intermediary Business
Ralph R. Layman, President and Chief Investment Officer – Public Equity Investments
Maureen B. Mitchell, President – Institutional Sales and Marketing
Steve Rullo, Chief Information Officer (since February 2011)
Matthew J. Simpson, Executive Vice President, General Counsel and Secretary
Don W. Torey, President – Alternative Investments
John J. Walker, Executive Vice President, Chief Operating Officer
David Wiederecht, President and Chief Investment Officer – Investment Strategies
Tracie Winbigler, Executive Vice President, Chief Financial Officer***
| * | As of November 4, 2010, Mr. Lucas no longer served as a director of the Company. |
| ** | As of February 18, 2011, Ms. Begun no longer served as an officer of the Company. |
| *** | Effective January, 2011. |
27
Investment Adviser
GE Asset Management Incorporated
3001 Summer Street
PO Box 7900
Stamford, CT 06904-7900
Distributor
GE Investment Distributors, Inc.
member FINRA and SIPC
3001 Summer Street
PO Box 7900
Stamford, CT 06904-7900
The Fund files its complete schedule of portfolio holdings with the Securities and Exchange Commission for the first and third quarters of each fiscal year on Form N-Q. The Fund’s Forms N-Q, as well as a description of the policies and procedures that the Fund uses to determine how to vote proxies (if any) relating to portfolio securities is available without charge (i) upon request, by calling 1-800-493-3042; (ii) on the Fund’s website at http://www.geam.com; and (iii) on the Commission’s website at http://www.sec.gov. The Fund’s Forms N-Q may be reviewed and copied at the Commission’s Public Reference Room in Washington, DC – information on the operation of the Public Reference Room may be obtained by calling 1-800-SEC-0330.
Information (if any) regarding how the Fund voted proxies relating to portfolio securities during the most recently disclosed 12-month period ended June 30 is available without charge (i) through the Fund’s website at http://www.geam.com; and (ii) on the Commission’s website at http://www.sec.gov.

GE Investments Funds, Inc.
S&P 500 Index Fund
Annual Report
December 31, 2010

GE Investments Funds, Inc.
| | |
| |
| S&P 500 Index Fund | | Contents |
This report is prepared for Policyholders of certain variable contracts and may be distributed to others only if preceded or accompanied by the variable contract’s current prospectus and the current prospectus of the Fund available for investments thereunder.
| | |
| Notes to Performance | | December 31, 2010 |
The information on the following performance pages relates to the GE Investments S&P 500 Index Fund (the “Fund”).
Total returns take into account changes in share price and assume reinvestment of dividends and capital gains distributions, if any. Total returns shown are net of Fund fees and expenses but do not reflect fees and charges associated with the variable contracts such as administrative fees, account charges and surrender charges, which, if reflected, would reduce the Fund’s total returns for all periods shown.
The performance data quoted represent past performance; past performance does not guarantee future results. Investment return and principal value will fluctuate so your shares, when redeemed, may be worth more or less than their original cost. Current performance may be higher or lower than the performance data quoted. Periods less than one year are not annualized. Please call 800-493-3042 or visit the Fund’s website at http://www.geam.com for the most recent month-end performance data.
An investment in the Fund is not a deposit of any bank and is not insured or guaranteed by the Federal Deposit Insurance Corporation (FDIC) or any other government agency. An investment in the Fund is subject to risk, including possible loss of principal invested.
The S&P 500® Index is an unmanaged market capitalization-weighted index of stocks of 500 large U.S. companies, which is widely used as a measure of large-cap
stock market performance. The results shown for the foregoing index assume the reinvestment of net dividends or interest. They do not reflect the actual cost of investing in the instruments that comprise the index.
The peer universe of the underlying annuity funds used for the peer group average annual total return calculation is based on a blend of Morningstar peer categories, as shown. Morningstar is an independent mutual fund rating service. A Fund’s performance may be compared to or ranked within a universe of mutual funds with investment objectives and policies similar but not necessarily identical to that of the Fund.
The S&P 500 Index Fund is not sponsored, endorsed, sold or promoted by Standard & Poor’s, and Standard & Poor’s makes no representation or warranty, express or implied, to the investors of the Fund or any member of the public regarding the advisability of investing in the securities generally or in this Fund particularly or the ability of the S&P 500 Index Fund to track general stock market performance.
©2010 Morningstar, Inc. All Rights Reserved. The Morningstar information contained herein: (1) is proprietary to Morningstar and/or its content providers; (2) may not be copied or distributed; and (3) is no warranted to be accurate, complete or timely. Neither Morningstar nor its content providers are responsible for any damage or losses relating from any use of this information. Past performance is no guarantee or future results.
GE Investment Distributors, Inc., Member of FINRA & SIPC, is the principal underwriter and distributor of the GE Investments Funds, Inc. and a wholly owned subsidiary of GE Asset Management Incorporated, the investment adviser of the Fund.
1
| | |
| S&P 500 Index Fund | | (unaudited) |

SSgA Funds Management, Inc. (“SSgA FM”) is the sub-adviser to the S&P 500 Index Fund. SSgA FM is registered with the SEC as an investment adviser under the Investment Advisers Act of 1940, as amended, and is a wholly owned subsidiary of State Street Corporation. The Fund is managed by a team of portfolio managers composed of the following members: Karl Schneider and John Tucker.
Karl Schneider is the lead portfolio manager for the Fund, and is a Vice President of State Street Global Advisors (“SSgA”) and a Principal of SSgA FM. Karl joined the firm in 1996 and is a member of the firm’s Global Structured
Products Team. Karl manages a variety of the firm’s domestic and international passive funds. Karl holds a BS degree in Finance and Investments from Babson College and an MS degree in Finance from Boston College. Additionally, he holds a Series 3 license from the National Futures Association.
John F. Tucker, CFA, is a Vice President of SSgA and a Principal of SSgA FM. John joined the firm in 1988 and is the Head of US Equity Markets in the Global Structured Products Team. He is also responsible for all derivative strategies and Exchange Traded Funds. John received a BA in Economics from Trinity College and an MS in Finance from Boston College. He is a member of the Boston Security Analysts Society and the CFA Institute.
| Q. | How did the GE Investments S&P 500 Index Fund perform compared to its benchmark for the twelve-months ended December 31, 2010? |
| A. | For the twelve-month period ended December 31, 2010, Class 1 shares of the S&P 500 Index Fund returned 14.84%. The S&P 500 Index, the Fund’s benchmark returned 15.06% and the Fund’s Morningstar peer group of 454 US Insurance Large Blend funds returned on average of 14.31% for the same period. |
| Q. | What market conditions impacted the Fund performance? |
| A. | Despite headwinds during the second quarter, US equities posted a solid 2010, with the S&P 500 up 15.06%. The final quarter had lingering debt concerns in Europe looming as a threat to investor sentiment, but global financial markets instead focused on a brightening economic outlook. A formal announcement of renewed quantitative easing sparked a burst of giddiness among buyers and with a |
| | deal between President Obama and congressional Republicans to keep taxes low, the S&P 500 proceeded to march steadily higher through the final month of the year, capping off the second quarter in a row of double digit gains. |
| Q. | What were the primary drivers of Fund performance? |
| A. | By utilizing a passive, full replication investment style, the fund owns the same stocks and sectors in approximately the same weights as the S&P 500 Index. As of December 31st, 2010, the four largest sectors in the S&P 500 Index were Information Technology (18.6%), Financials (16.1%), Energy (12.0%), and Industrials (10.9%). The highest returning sector for the last twelve months was Consumer Discretionary (+27%) followed by Industrials (+26%). The lowest returning sectors were Health Care (+3%) and Utilities (+5%). |
| Q. | Were there any significant changes to the Fund during the period? |
| A. | Over the last twelve months there were 16 index addition/deletion changes announced by Standard & Poor’s that impacted the fund. Not all the additions and deletions were bought and sold in the fund, however, as many changes were as a result of a merger or acquisition, or a spin-off involving another S&P 500 constituent. Additionally, there were numerous index share changes throughout the period, as well as at each quarter’s end. Many of the share changes also required no trading, as the weight change within the portfolio was negligible. |
2
| | |
| S&P 500 Index Fund | | (unaudited) |
Understanding Your Fund’s Expenses
As a shareholder of the Fund you incur transaction and ongoing expenses. Transaction expenses including sales charges on purchases payments, reinvested dividends (or other distributions), and redemption fees directly reduce the investment return of the Fund. Ongoing costs include portfolio management fees, distribution and services fees, professional fees, administrative fees and other Fund expenses. The following example is intended to help you understand your ongoing costs (in dollars) of investing in the Fund and to compare these costs with the ongoing costs of investing in other mutual funds.
To illustrate these ongoing costs, we have provided an example and calculated the expenses paid by investors during the period. The information in the following table is based on an investment of $1,000, which is invested at the beginning of the period and held for the entire six-month period ended December 31, 2010.
Actual Expenses
The first section of the table provides information about actual account values and actual expenses. You may use the information in this section, together with the amount you invested, to estimate the expenses that you paid
over the period. To do so, simply divide your account value by $1,000 (for example, an $8,600 account value divided by $1,000 = 8.6), then multiply the result by the number given for your class under the heading “Expenses Paid During Period.”
Hypothetical Example for Comparison Purposes
The second section of the table provides information about hypothetical account values and hypothetical expenses based on the Fund’s actual expense ratio and an assumed rate of return of 5% per year before expenses, which is not the Fund’s actual return. You may use this information to compare the ongoing costs of investing in the Fund and other funds. To do so, compare this 5% hypothetical example with the 5% hypothetical examples that appear in the shareholders reports of other funds.
Please note that the expenses shown in the table for both “Actual” and “Hypothetical” do not reflect any transaction costs, such as sales charges or redemption fees. Additionally, the expenses shown do not reflect the fees or charges associated with variable contracts through which shares of the Fund are offered.
July 1, 2010 – December 31, 2010
| | | | | | | | | | | | |
| | | Account value at the
beginning of the period ($) | | | Account value at the
end of the period ($) | | | Expenses paid
during the period ($)* | |
Actual Fund Return** | | | 1,000.00 | | | | 1,232.29 | | | | 1.86 | |
Hypothetical 5% Return (2.5% for the period) | | | 1,000.00 | | | | 1,023.28 | | | | 1.68 | |
| * | | Expenses are equal to the Fund’s annualized expense ratio of 0.33% (for the period July 1, 2010—December 31, 2010), multiplied by the average account value over the period, multiplied by 184/365 (to reflect the six month period). |
| ** | | Actual Fund Return for the six-month period ended December 31, 2010 was: 23.23%. Past performance does not guarantee future results. |
3
| | |
| S&P 500 Index Fund | | (unaudited) |
Investment Profile
A mutual fund designed for investors who seek growth of capital and accumulation of income that corresponds to the investment return of the Standard & Poor’s 500 Composite Stock Index.
Morningstar Performance Comparison
Based on average annual returns for periods ended 12/31/10
| | | | | | | | | | | | | | | | |
| | | | | | One
Year | | | Five
Year | | | Ten
Year | |
Number of Funds in peer group: | | | | | | | 454 | | | | 397 | | | | 302 | |
Peer group average annual total return: | | | | | | | 14.31% | | | | 1.86% | | | | 1.14% | |
Morningstar category in peer group : U.S. Insurance Large Blend | |
Sector Allocation
as a % of Fair Value of $217,397 (in thousands) on December 31, 2010(b)(c)
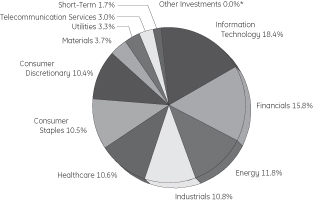
Top Ten Largest Holdings
as of December 31, 2010 (as a % of Fair Value)(b)(c)
| | | | |
Exxon Mobil Corp. | | | 3.17% | |
Apple Inc. | | | 2.54% | |
Microsoft Corp. | | | 1.80% | |
General Electric Co. | | | 1.67% | |
Chevron Corp. | | | 1.58% | |
International Business Machines Corp. | | | 1.57% | |
The Procter & Gamble Co. | | | 1.55% | |
AT&T Inc. | | | 1.49% | |
Johnson & Johnson | | | 1.46% | |
JPMorgan Chase & Co. | | | 1.43% | |
Change in Value of a $10,000 Investment
Class 1 Shares
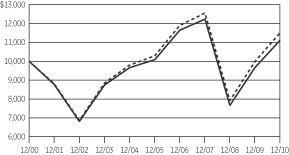
Average Annual Total Returns
for the Periods Ended December 31, 2010
Class 1 Shares (Inception date 4/15/85)
| | | | | | | | | | | | | | | | |
| | | One
Year | | | Five
Year | | | Ten
Year | | | Ending value of a
$10,000 investment(a) | |
S&P 500 Index Fund | | | 14.84% | | | | 1.95% | | | | 1.06% | | | $ | 11,108 | |
S&P 500 Index | | | 15.06% | | | | 2.29% | | | | 1.41% | | | $ | 11,508 | |

| (a) | Ending value of a $10,000 investment for the ten-year period or since inception, whichever is less. |
| (b) | The securities information regarding holdings, allocations and other characteristics is presented to illustrate examples of securities that the Fund has bought and the diversity of areas in which the Fund may invest as of a particular date. It may not be representative of the Fund’s current or future investments and should not be construed as a recommendation to purchase or sell a particular security. |
| (c) | Fair value basis is inclusive of Short Term Investment in GE Money Market Fund. |
See Notes to Performance on page 1 for further information, including an explanation of Morningstar peer categories.
Past performance does not predict future performance and the graph and table do not reflect the deduction of taxes that a shareholder would pay on fund distributions or the redemption of fund shares and do not reflect the fees or charges that would be associated with variable contracts through which shares of the Fund are offered.
4
S&P 500 Index Fund
| | |
| Schedule of Investments | | December 31, 2010 |
S&P 500 Index Fund
| | | | | | | | | | |
| | | |
| | | Number
of Shares | | | Fair Value | | | |
Common Stock — 98.3%† | | | | | | | | | | |
| |
Advertising — 0.2% | | | |
| | | |
Omnicom Group Inc. | | | 5,680 | | | $ | 260,144 | | | |
The Interpublic Group of companies Inc. | | | 9,830 | | | | 104,395 | | | (a) |
| | | | | | | 364,539 | | | |
| |
Aerospace & Defense — 2.6% | | | |
| | | |
General Dynamics Corp. | | | 7,067 | | | | 501,474 | | | |
Goodrich Corp. | | | 2,384 | | | | 209,959 | | | |
Honeywell International Inc. | | | 14,543 | | | | 773,106 | | | |
ITT Corp. | | | 3,426 | | | | 178,529 | | | |
L-3 Communications Holdings Inc. | | | 2,100 | | | | 148,029 | | | |
Lockheed Martin Corp. | | | 5,552 | | | | 388,140 | | | |
Northrop Grumman Corp. | | | 5,422 | | | | 351,237 | | | |
Precision Castparts Corp. | | | 2,700 | | | | 375,867 | | | |
Raytheon Co. | | | 6,769 | | | | 313,675 | | | |
Rockwell Collins Inc. | | | 2,868 | | | | 167,090 | | | |
The Boeing Co. | | | 13,686 | | | | 893,148 | | | (d) |
United Technologies Corp. | | | 17,172 | | | | 1,351,780 | | | (d) |
| | | | | | | 5,652,034 | | | |
| |
Agricultural Products — 0.2% | | | |
| | | |
Archer-Daniels-Midland Co. | | | 12,186 | | | | 366,555 | | | |
| |
Air Freight & Logistics — 1.1% | | | |
| | | |
CH Robinson Worldwide Inc. | | | 3,000 | | | | 240,570 | | | |
Expeditors International of Washington Inc. | | | 4,000 | | | | 218,400 | | | |
FedEx Corp. | | | 5,911 | | | | 549,782 | | | |
United Parcel Service Inc. | | | 18,396 | | | | 1,335,182 | | | |
| | | | | | | 2,343,934 | | | |
| |
Airlines — 0.1% | | | |
| | | |
Southwest Airlines Co. | | | 14,249 | | | | 184,952 | | | |
| |
Aluminum — 0.1% | | | |
| | | |
Alcoa Inc. | | | 19,040 | | | | 293,026 | | | (d) |
| |
Apparel Retail — 0.4% | | | |
| | | |
Abercrombie & Fitch Co. | | | 1,600 | | | | 92,208 | | | |
Ltd Brands Inc. | | | 4,888 | | | | 150,208 | | | |
Ross Stores Inc. | | | 2,200 | | | | 139,150 | | | |
The Gap Inc. | | | 8,379 | | | | 185,511 | | | |
TJX companies Inc. | | | 7,280 | | | | 323,159 | | | |
Urban Outfitters Inc. | | | 2,400 | | | | 85,944 | | | (a) |
| | | | | | | 976,180 | | | |
| |
Apparel, Accessories & Luxury Goods — 0.3% | | | |
| | | |
Coach Inc. | | | 5,600 | | | | 309,736 | | | |
Polo Ralph Lauren Corp. | | | 1,200 | | | | 133,104 | | | |
| | | | | | | | | | |
| | | |
| | | Number
of Shares | | | Fair Value | | | |
| | | |
VF Corp. | | | 1,602 | | | $ | 138,060 | | | |
| | | | | | | 580,900 | | | |
| |
Application Software — 0.6% | | | |
| | | |
Adobe Systems Inc. | | | 9,384 | | | | 288,840 | | | (a,d) |
Autodesk Inc. | | | 4,248 | | | | 162,274 | | | (a) |
Citrix Systems Inc. | | | 3,600 | | | | 246,276 | | | (a) |
Compuware Corp. | | | 4,100 | | | | 47,847 | | | (a) |
Intuit Inc. | | | 5,300 | | | | 261,290 | | | (a) |
Salesforce.com Inc. | | | 2,200 | | | | 290,400 | | | (a) |
| | | | | | | 1,296,927 | | | |
| |
Asset Management & Custody Banks — 1.2% | | | |
| | | |
Ameriprise Financial Inc. | | | 4,704 | | | | 270,715 | | | |
Federated Investors Inc. | | | 1,500 | | | | 39,255 | | | |
Franklin Resources Inc. | | | 2,700 | | | | 300,267 | | | |
Invesco Ltd. | | | 8,600 | | | | 206,916 | | | |
Janus Capital Group Inc. | | | 3,400 | | | | 44,098 | | | |
Legg Mason Inc. | | | 2,900 | | | | 105,183 | | | |
Northern Trust Corp. | | | 4,500 | | | | 249,345 | | | |
State Street Corp. | | | 9,400 | | | | 435,596 | | | (c) |
T Rowe Price Group Inc. | | | 4,900 | | | | 316,246 | | | |
The Bank of New York Mellon Corp. | | | 22,603 | | | | 682,611 | | | |
| | | | | | | 2,650,232 | | | |
| |
Auto Parts & Equipment — 0.2% | | | |
| | | |
Johnson Controls Inc. | | | 12,446 | | | | 475,437 | | | |
| |
Automobile Manufacturers — 0.6% | | | |
| | | |
Ford Motor Co. | | | 70,427 | | | | 1,182,469 | | | (a) |
O’Reilly Automotive Inc. | | | 2,700 | | | | 163,134 | | | |
| | | | | | | 1,345,603 | | | |
| |
Automotive Retail — 0.1% | | | |
| | | |
AutoNation Inc. | | | 1,286 | | | | 36,265 | | | (a) |
AutoZone Inc. | | | 494 | | | | 134,659 | | | (a) |
CarMax Inc. | | | 4,300 | | | | 137,084 | | | (a) |
| | | | | | | 308,008 | | | |
| |
Biotechnology — 1.3% | | | |
| | | |
Amgen Inc. | | | 17,622 | | | | 967,448 | | | (a,d) |
Biogen Idec Inc. | | | 4,500 | | | | 301,725 | | | (a) |
Celgene Corp. | | | 8,763 | | | | 518,244 | | | (a) |
Cephalon Inc. | | | 1,500 | | | | 92,580 | | | (a) |
Genzyme Corp. | | | 4,800 | | | | 341,760 | | | (a) |
Gilead Sciences Inc. | | | 15,149 | | | | 549,000 | | | (a) |
| | | | | | | 2,770,757 | | | |
| |
Brewers — 0.1% | | | |
| | | |
Molson Coors Brewing Co. | | | 2,998 | | | | 150,470 | | | |
| |
Broadcasting — 0.2% | | | |
| | | |
CBS Corp. | | | 12,509 | | | | 238,296 | | | |
Discovery Communications Inc. | | | 5,400 | | | | 225,180 | | | (a) |
Scripps Networks Interactive Inc. | | | 1,600 | | | | 82,800 | | | |
| | | | | | | 546,276 | | | |
See Notes to Schedule of Investments and Notes to Financial Statements.
5
S&P 500 Index Fund
| | |
| Schedule of Investments | | December 31, 2010 |
| | | | | | | | | | |
| | | |
| | | Number
of Shares | | | Fair Value | | | |
| |
Building Products — 0.0%* | | | |
| | | |
Masco Corp. | | | 7,090 | | | $ | 89,759 | | | |
| |
Cable & Satellite — 1.1% | | | |
| | | |
Cablevision Systems Corp. | | | 4,400 | | | | 148,896 | | | |
Comcast Corp. | | | 51,958 | | | | 1,141,517 | | | |
DIRECTV | | | 15,500 | | | | 618,915 | | | (a) |
Time Warner Cable Inc. | | | 6,596 | | | | 435,534 | | | |
| | | | | | | 2,344,862 | | | |
| |
Casinos & Gaming — 0.1% | | | |
| | | |
International Game Technology | | | 5,500 | | | | 97,295 | | | |
Wynn Resorts Ltd. | | | 1,300 | | | | 134,992 | | | |
| | | | | | | 232,287 | | | |
| |
Coal & Consumable Fuels — 0.3% | | | |
| | | |
Consol Energy Inc. | | | 4,200 | | | | 204,708 | | | |
Massey Energy Co. | | | 1,800 | | | | 96,570 | | | |
Peabody Energy Corp. | | | 4,979 | | | | 318,556 | | | |
| | | | | | | 619,834 | | | |
| |
Commercial Printing — 0.0%* | | | |
| | | |
RR Donnelley & Sons Co. | | | 3,599 | | | | 62,875 | | | |
| |
Communications Equipment — 2.2% | | | |
| | | |
Cisco Systems Inc. | | | 103,764 | | | | 2,099,146 | | | (a,d) |
F5 Networks Inc. | | | 1,500 | | | | 195,240 | | | (a) |
Harris Corp. | | | 2,500 | | | | 113,250 | | | |
JDS Uniphase Corp. | | | 4,450 | | | | 64,436 | | | (a) |
Juniper Networks Inc. | | | 9,900 | | | | 365,508 | | | (a) |
Motorola Inc. | | | 44,350 | | | | 402,254 | | | (a) |
QUALCOMM Inc. | | | 29,929 | | | | 1,481,186 | | | |
Tellabs Inc. | | | 7,652 | | | | 51,881 | | | |
| | | | | | | 4,772,901 | | | |
| |
Computer & Electronics Retail — 0.1% | | | |
| | | |
Best Buy Company Inc. | | | 6,100 | | | | 209,169 | | | |
GameStop Corp. | | | 2,900 | | | | 66,352 | | | (a) |
RadioShack Corp. | | | 2,256 | | | | 41,713 | | | |
| | | | | | | 317,234 | | | |
| |
Computer Hardware - 3.6% | | | |
| | | |
Apple Inc. | | | 17,139 | | | | 5,528,356 | | | (a) |
Dell Inc. | | | 31,628 | | | | 428,559 | | | (a,d) |
Hewlett-Packard Co. | | | 42,249 | | | | 1,778,683 | | | |
| | | | | | | 7,735,598 | | | |
| |
Computer Storage & Peripherals — 0.8% | | | |
| | | |
EMC Corp. | | | 38,514 | | | | 881,971 | | | (a) |
Lexmark International Inc. | | | 1,400 | | | | 48,748 | | | (a) |
NetApp Inc. | | | 6,600 | | | | 362,736 | | | (a) |
QLogic Corp. | | | 2,200 | | | | 37,444 | | | (a) |
SanDisk Corp. | | | 4,300 | | | | 214,398 | | | (a) |
Western Digital Corp. | | | 4,400 | | | | 149,160 | | | (a) |
| | | | | | | 1,694,457 | | | |
| | | | | | | | | | |
| | | |
| | | Number
of Shares | | | Fair Value | | | |
| |
Construction & Engineering — 0.2% | | | |
| | | |
Fluor Corp. | | | 3,278 | | | $ | 217,200 | | | |
Jacobs Engineering Group Inc. | | | 2,300 | | | | 105,455 | | | (a) |
Quanta Services Inc. | | | 4,000 | | | | 79,680 | | | (a) |
| | | | | | | 402,335 | | | |
| |
Construction & Farm Machinery & Heavy Trucks — 1.2% | | | |
| | | |
Caterpillar Inc. | | | 11,832 | | | | 1,108,185 | | | |
Cummins Inc. | | | 3,756 | | | | 413,198 | | | |
Deere & Co. | | | 7,940 | | | | 659,417 | | | |
PACCAR Inc. | | | 6,903 | | | | 396,370 | | | |
| | | | | | | 2,577,170 | | | |
| |
Construction Materials — 0.0%* | | | |
| | | |
Vulcan Materials Co. | | | 2,400 | | | | 106,464 | | | |
| |
Consumer Electronics — 0.0%* | | | |
| | | |
Harman International Industries Inc. | | | 1,200 | | | | 55,560 | | | (a) |
| |
Consumer Finance — 0.7% | | | |
| | | |
American Express Co. | | | 19,591 | | | | 840,846 | | | (d) |
Capital One Financial Corp. | | | 8,525 | | | | 362,824 | | | |
Discover Financial Services | | | 10,298 | | | | 190,822 | | | |
SLM Corp. | | | 9,100 | | | | 114,569 | | | (a) |
| | | | | | | 1,509,061 | | | |
| |
Data Processing & Outsourced Services — 1.1% | | | |
| | | |
Automatic Data Processing Inc. | | | 9,280 | | | | 429,478 | | | |
Computer Sciences Corp. | | | 2,882 | | | | 142,947 | | | |
Fidelity National Information Services Inc. | | | 5,200 | | | | 142,428 | | | |
Fiserv Inc. | | | 2,778 | | | | 162,680 | | | (a) |
Mastercard Inc. | | | 1,800 | | | | 403,398 | | | |
Paychex Inc. | | | 6,225 | | | | 192,415 | | | |
The Western Union Co. | | | 12,324 | | | | 228,857 | | | |
Total System Services Inc. | | | 2,902 | | | | 44,633 | | | |
Visa Inc. | | | 9,100 | | | | 640,458 | | | |
| | | | | | | 2,387,294 | | | |
| |
Department Stores — 0.4% | | | |
| | | |
JC Penney Company Inc. | | | 4,387 | | | | 141,744 | | | |
Kohl’s Corp. | | | 5,700 | | | | 309,738 | | | (a) |
Macy’s Inc. | | | 7,830 | | | | 198,099 | | | |
Nordstrom Inc. | | | 3,292 | | | | 139,515 | | | |
Sears Holdings Corp. | | | 819 | | | | 60,401 | | | (a) |
| | | | | | | 849,497 | | | |
| |
Distillers & Vintners — 0.1% | | | |
| | | |
Brown-Forman Corp. | | | 1,947 | | | | 135,550 | | | |
Constellation Brands Inc. | | | 3,500 | | | | 77,525 | | | (a) |
| | | | | | | 213,075 | | | |
| |
Distributors — 0.1% | | | |
| | | |
Genuine Parts Co. | | | 2,896 | | | | 148,681 | | | |
See Notes to Schedule of Investments and Notes to Financial Statements.
6
S&P 500 Index Fund
| | |
| Schedule of Investments | | December 31, 2010 |
| | | | | | | | | | |
| | | |
| | | Number
of Shares | | | Fair Value | | | |
| |
Diversified Chemicals — 1.0% | | | |
| | | |
Eastman Chemical Co. | | | 1,359 | | | $ | 114,265 | | | |
EI du Pont de Nemours & Co. | | | 16,961 | | | | 846,015 | | | |
FMC Corp. | | | 1,400 | | | | 111,846 | | | |
PPG Industries Inc. | | | 3,137 | | | | 263,728 | | | |
The Dow Chemical Co. | | | 21,894 | | | | 747,461 | | | |
| | | | | | | 2,083,315 | | | |
| |
Diversified Financial Services — 5.7% | | | |
| | | |
Bank of America Corp. | | | 187,129 | | | | 2,496,301 | | | |
Citigroup Inc. | | | 540,406 | | | | 2,556,120 | | | (a,d) |
Comerica Inc. | | | 3,356 | | | | 141,757 | | | |
JPMorgan Chase & Co. | | | 73,150 | | | | 3,103,023 | | | (d) |
US BanCorp | | | 36,109 | | | | 973,860 | | | |
Wells Fargo & Co. | | | 97,602 | | | | 3,024,686 | | | |
| | | | | | | 12,295,747 | | | |
| |
Diversified Metals & Mining — 0.5% | | | |
| | | |
Freeport-McMoRan Copper & Gold Inc. | | | 8,855 | | | | 1,063,397 | | | |
Titanium Metals Corp. | | | 1,600 | | | | 27,488 | | | (a) |
| | | | | | | 1,090,885 | | | |
| |
Diversified REITs — 0.1% | | | |
| | | |
Vornado Realty Trust | | | 3,047 | | | | 253,906 | | | |
| |
Diversified Support Services — 0.1% | | | |
| | | |
Cintas Corp. | | | 2,500 | | | | 69,900 | | | |
Iron Mountain Inc. | | | 3,500 | | | | 87,535 | | | |
| | | | | | | 157,435 | | | |
| |
Drug Retail — 0.7% | | | |
| | | |
CVS Caremark Corp. | | | 25,527 | | | | 887,574 | | | |
Walgreen Co. | | | 17,213 | | | | 670,618 | | | |
| | | | | | | 1,558,192 | | | |
| |
Education Services — 0.1% | | | |
| | | |
Apollo Group Inc. | | | 2,400 | | | | 94,776 | | | (a) |
DeVry Inc. | | | 1,200 | | | | 57,576 | | | |
| | | | | | | 152,352 | | | |
| |
Electric Utilities — 1.7% | | | |
| | | |
Allegheny Energy Inc. | | | 3,200 | | | | 77,568 | | | |
American Electric Power Company Inc. | | | 9,125 | | | | 328,317 | | | (d) |
Duke Energy Corp. | | | 24,409 | | | | 434,724 | | | |
Edison International | | | 6,242 | | | | 240,941 | | | |
Entergy Corp. | | | 3,285 | | | | 232,677 | | | |
Exelon Corp. | | | 12,252 | | | | 510,173 | | | |
FirstEnergy Corp. | | | 5,620 | | | | 208,052 | | | |
NextEra Energy Inc. | | | 7,662 | | | | 398,347 | | | |
Northeast Utilities | | | 3,500 | | | | 111,580 | | | |
Pepco Holdings Inc. | | | 4,000 | | | | 73,000 | | | |
Pinnacle West Capital Corp. | | | 2,200 | | | | 91,190 | | | |
| | | | | | | | | | |
| | | |
| | | Number
of Shares | | | Fair Value | | | |
| | | |
PPL Corp. | | | 9,244 | | | $ | 243,302 | | | |
Progress Energy Inc. | | | 5,356 | | | | 232,879 | | | |
Southern Co. | | | 15,558 | | | | 594,782 | | | |
| | | | | | | 3,777,532 | | | |
| |
Electrical Components & Equipment — 0.5% | | | |
| | | |
Emerson Electric Co. | | | 13,938 | | | | 796,835 | | | |
Rockwell Automation Inc. | | | 2,668 | | | | 191,322 | | | |
Roper Industries Inc. | | | 1,800 | | | | 137,574 | | | |
| | | | | | | 1,125,731 | | | |
| |
Electronic Components — 0.3% | | | |
| | | |
Amphenol Corp. | | | 3,300 | | | | 174,174 | | | |
Corning Inc. | | | 29,039 | | | | 561,033 | | | |
| | | | | | | 735,207 | | | |
| |
Electronic Equipment & Instruments — 0.0%* | | | |
| | | |
FLIR Systems Inc. | | | 3,200 | | | | 95,200 | | | (a) |
| |
Electronic Manufacturing Services — 0.1% | | | |
| | | |
Jabil Circuit Inc. | | | 3,900 | | | | 78,351 | | | |
Molex Inc. | | | 2,650 | | | | 60,208 | | | |
| | | | | | | 138,559 | | | |
| |
Environmental & Facilities Services — 0.3% | | | |
| | | |
Republic Services Inc. | | | 5,950 | | | | 177,667 | | | |
Stericycle Inc. | | | 1,600 | | | | 129,472 | | | (a) |
Waste Management Inc. | | | 8,803 | | | | 324,567 | | | |
| | | | | | | 631,706 | | | |
| |
Fertilizers & Agricultural Chemicals — 0.4% | | | |
| | | |
CF Industries Holdings Inc. | | | 1,370 | | | | 185,155 | | | |
Monsanto Co. | | | 10,123 | | | | 704,966 | | | (d) |
| | | | | | | 890,121 | | | |
| |
Food Distributors — 0.1% | | | |
| | | |
Sysco Corp. | | | 11,144 | | | | 327,634 | | | |
| |
Food Retail — 0.3% | | | |
| | | |
Safeway Inc. | | | 7,100 | | | | 159,679 | | | |
SUPERVALU Inc. | | | 4,613 | | | | 44,423 | | | |
The Kroger Co. | | | 12,066 | | | | 269,796 | | | |
Whole Foods Market Inc. | | | 2,700 | | | | 136,593 | | | (a) |
| | | | | | | 610,491 | | | |
| |
Footwear — 0.3% | | | |
| | | |
NIKE Inc. | | | 7,110 | | | | 607,336 | | | |
| |
Gas Utilities — 0.1% | | | |
| | | |
Nicor Inc. | | | 843 | | | | 42,083 | | | |
Oneok Inc. | | | 1,900 | | | | 105,393 | | | |
| | | | | | | 147,476 | | | |
See Notes to Schedule of Investments and Notes to Financial Statements.
7
S&P 500 Index Fund
| | |
| Schedule of Investments | | December 31, 2010 |
| | | | | | | | | | |
| | | |
| | | Number
of Shares | | | Fair Value | | | |
| |
General Merchandise Stores — 0.4% | | | |
| | | |
Big Lots Inc. | | | 1,400 | | | $ | 42,644 | | | (a) |
Family Dollar Stores Inc. | | | 2,300 | | | | 114,333 | | | |
Target Corp. | | | 13,249 | | | | 796,662 | | | |
| | | | | | | 953,639 | | | |
| |
Gold — 0.3% | | | |
| | | |
Newmont Mining Corp. | | | 9,228 | | | | 566,876 | | | |
| |
Healthcare Distributors — 0.4% | | | |
| | | |
AmerisourceBergen Corp. | | | 5,161 | | | | 176,093 | | | |
Cardinal Health Inc. | | | 6,651 | | | | 254,800 | | | |
McKesson Corp. | | | 4,702 | | | | 330,927 | | | |
Patterson companies Inc. | | | 1,700 | | | | 52,071 | | | |
| | | | | | | 813,891 | | | |
| |
Healthcare Equipment — 1.5% | | | |
| | | |
Baxter International Inc. | | | 11,029 | | | | 558,288 | | | (d) |
Becton Dickinson and Co. | | | 4,388 | | | | 370,874 | | | |
Boston Scientific Corp. | | | 27,943 | | | | 211,528 | | | (a) |
CareFusion Corp. | | | 3,375 | | | | 86,738 | | | (a) |
CR Bard Inc. | | | 1,702 | | | | 156,193 | | | |
Intuitive Surgical Inc. | | | 720 | | | | 185,580 | | | (a) |
Medtronic Inc. | | | 20,332 | | | | 754,114 | | | |
St Jude Medical Inc. | | | 6,292 | | | | 268,983 | | | (a) |
Stryker Corp. | | | 6,452 | | | | 346,472 | | | |
Varian Medical Systems Inc. | | | 2,200 | | | | 152,416 | | | (a) |
Zimmer Holdings Inc. | | | 3,700 | | | | 198,616 | | | (a) |
| | | | | | | 3,289,802 | | | |
| |
Healthcare Facilities — 0.0%* | | | |
| | | |
Tenet Healthcare Corp. | | | 7,895 | | | | 52,818 | | | (a) |
| |
Healthcare Services — 0.7% | | | |
| | | |
DaVita Inc. | | | 1,900 | | | | 132,031 | | | (a) |
Express Scripts Inc. | | | 9,800 | | | | 529,690 | | | (a) |
Laboratory Corporation of America Holdings | | | 1,900 | | | | 167,048 | | | (a) |
Medco Health Solutions Inc. | | | 7,866 | | | | 481,950 | | | (a) |
Quest Diagnostics Inc. | | | 2,600 | | | | 140,322 | | | |
| | | | | | | 1,451,041 | | | |
| |
Healthcare Supplies — 0.0%* | | | |
| | | |
DENTSPLY International Inc. | | | 2,500 | | | | 85,425 | | | |
| |
Healthcare Technology — 0.1% | | | |
| | | |
Cerner Corp. | | | 1,400 | | | | 132,636 | | | (a) |
| |
Home Entertainment Software — 0.0%* | | | |
| | | |
Electronic Arts Inc. | | | 6,100 | | | | 99,918 | | | (a) |
| |
Home Furnishings — 0.0%* | | | |
| | | |
Leggett & Platt Inc. | | | 2,700 | | | | 61,452 | | | |
| | | | | | | | | | |
| | | |
| | | Number
of Shares | | | Fair Value | | | |
| |
Home Improvement Retail — 0.8% | | | |
| | | |
Home Depot Inc. | | | 30,633 | | | $ | 1,073,993 | | | |
Lowe’s companies Inc. | | | 25,602 | | | | 642,098 | | | |
| | | | | | | 1,716,091 | | | |
| |
Homebuilding — 0.1% | | | |
| | | |
DR Horton Inc. | | | 5,600 | | | | 66,808 | | | |
Lennar Corp. | | | 3,200 | | | | 60,000 | | | |
Pulte Group Inc. | | | 6,435 | | | | 48,391 | | | (a) |
| | | | | | | 175,199 | | | |
| |
Homefurnishing Retail — 0.1% | | | |
| | | |
Bed Bath & Beyond Inc. | | | 4,800 | | | | 235,920 | | | (a) |
| |
Hotels, Resorts & Cruise Lines — 0.4% | | | |
| | | |
Carnival Corp. | | | 8,200 | | | | 378,102 | | | |
Marriott International Inc. | | | 5,514 | | | | 229,052 | | | |
Starwood Hotels & Resorts Worldwide Inc. | | | 3,600 | | | | 218,808 | | | |
Wyndham Worldwide Corp. | | | 3,349 | | | | 100,336 | | | |
| | | | | | | 926,298 | | | |
| |
Household Appliances — 0.2% | | | |
| | | |
Stanley Black & Decker Inc. | | | 3,192 | | | | 213,449 | | | |
Whirlpool Corp. | | | 1,443 | | | | 128,182 | | | |
| | | | | | | 341,631 | | | |
| |
Household Products — 2.2% | | | |
| | | |
Clorox Co. | | | 2,584 | | | | 163,516 | | | |
Colgate-Palmolive Co. | | | 8,972 | | | | 721,080 | | | |
Kimberly-Clark Corp. | | | 7,636 | | | | 481,373 | | | (d) |
The Procter & Gamble Co. | | | 52,273 | | | | 3,362,722 | | | |
| | | | | | | 4,728,691 | | | |
| |
Housewares & Specialties — 0.1% | | | |
| | | |
Fortune Brands Inc. | | | 2,841 | | | | 171,170 | | | |
Newell Rubbermaid Inc. | | | 5,156 | | | | 93,736 | | | |
| | | | | | | 264,906 | | | |
| |
Human Resource & Employment Services — 0.0%* | | | |
| | | |
Robert Half International Inc. | | | 2,600 | | | | 79,560 | | | |
| |
Hypermarkets & Super Centers — 1.2% | | | |
| | | |
Costco Wholesale Corp. | | | 8,017 | | | | 578,908 | | | |
Wal-Mart Stores Inc. | | | 36,687 | | | | 1,978,530 | | | |
| | | | | | | 2,557,438 | | | |
| |
Independent Power Producers & Energy Traders — 0.2% | | | |
| | | |
Constellation Energy Group Inc. | | | 3,803 | | | | 116,486 | | | |
NRG Energy Inc. | | | 4,400 | | | | 85,976 | | | (a) |
The AES Corp. | | | 12,300 | | | | 149,814 | | | (a) |
| | | | | | | 352,276 | | | |
See Notes to Schedule of Investments and Notes to Financial Statements.
8
S&P 500 Index Fund
| | |
| Schedule of Investments | | December 31, 2010 |
| | | | | | | | | | |
| | | |
| | | Number
of Shares | | | Fair Value | | | |
| |
Industrial Conglomerates — 2.4% | | | |
| | | |
General Electric Co. | | | 198,862 | | | $ | 3,637,186 | | | (f) |
Textron Inc. | | | 5,025 | | | | 118,791 | | | |
3M Co. | | | 13,280 | | | | 1,146,064 | | | |
Tyco International Ltd. | | | 9,300 | | | | 385,392 | | | |
| | | | | | | 5,287,433 | | | |
| |
Industrial Gases — 0.5% | | | |
| | | |
Air Products & Chemicals Inc. | | | 4,032 | | | | 366,710 | | | (d) |
Airgas Inc. | | | 1,400 | | | | 87,444 | | | |
Praxair Inc. | | | 5,765 | | | | 550,385 | | | |
| | | | | | | 1,004,539 | | | |
| |
Industrial Machinery — 1.1% | | | |
| | | |
Danaher Corp. | | | 10,100 | | | | 476,417 | | | |
Dover Corp. | | | 3,558 | | | | 207,965 | | | |
Eaton Corp. | | | 3,100 | | | | 314,681 | | | |
Flowserve Corp. | | | 1,100 | | | | 131,142 | | | |
Illinois Tool Works Inc. | | | 9,227 | | | | 492,722 | | | |
Ingersoll-Rand PLC | | | 6,100 | | | | 287,249 | | | |
Pall Corp. | | | 2,178 | | | | 107,985 | | | |
Parker Hannifin Corp. | | | 3,072 | | | | 265,114 | | | |
Snap-On Inc. | | | 1,009 | | | | 57,089 | | | |
| | | | | | | 2,340,364 | | | |
| |
Industrial REITs — 0.1% | | | |
| | | |
ProLogis | | | 10,400 | | | | 150,176 | | | |
| |
Insurance Brokers — 0.3% | | | |
| | | |
AON Corp. | | | 6,236 | | | | 286,918 | | | |
Marsh & McLennan companies Inc. | | | 10,153 | | | | 277,583 | | | |
| | | | | | | 564,501 | | | |
| |
Integrated Oil & Gas — 6.8% | | | |
| | | |
Chevron Corp. | | | 37,558 | | | | 3,427,167 | | | |
ConocoPhillips | | | 27,519 | | | | 1,874,044 | | | |
Exxon Mobil Corp. | | | 94,193 | | | | 6,887,392 | | | (d) |
Hess Corp. | | | 5,570 | | | | 426,328 | | | (d) |
Marathon Oil Corp. | | | 13,442 | | | | 497,757 | | | |
Murphy Oil Corp. | | | 3,600 | | | | 268,380 | | | |
Occidental Petroleum Corp. | | | 15,179 | | | | 1,489,060 | | | |
| | | | | | | 14,870,128 | | | |
| |
Integrated Telecommunication Services — 2.7% | | | |
| | | |
AT&T Inc. | | | 110,280 | | | | 3,240,026 | | | |
CenturyLink Inc. | | | 5,600 | | | | 258,552 | | | |
Frontier Communications Corp. | | | 18,974 | | | | 184,617 | | | |
Qwest Communications International Inc. | | | 31,848 | | | | 242,363 | | | |
Verizon Communications Inc. | | | 52,667 | | | | 1,884,425 | | | |
Windstream Corp. | | | 8,843 | | | | 123,271 | | | |
| | | | | | | 5,933,254 | | | |
| | | | | | | | | | |
| | | |
| | | Number
of Shares | | | Fair Value | | | |
| |
Internet Retail — 0.8% | | | |
| | | |
Amazon.com Inc. | | | 6,600 | | | $ | 1,188,000 | | | (a) |
Expedia Inc. | | | 3,600 | | | | 90,324 | | | |
NetFlix Inc. | | | 800 | | | | 140,560 | | | (a) |
priceline.com Inc. | | | 870 | | | | 347,609 | | | (a) |
| | | | | | | 1,766,493 | | | |
| |
Internet Software & Services — 1.9% | | | |
| | | |
Akamai Technologies Inc. | | | 3,400 | | | | 159,970 | | | (a) |
eBay Inc. | | | 21,400 | | | | 595,562 | | | (a) |
Google Inc. | | | 4,664 | | | | 2,770,276 | | | (a) |
Monster Worldwide Inc. | | | 2,700 | | | | 63,801 | | | (a) |
VeriSign Inc. | | | 3,162 | | | | 103,303 | | | |
Yahoo! Inc. | | | 24,189 | | | | 402,263 | | | (a) |
| | | | | | | 4,095,175 | | | |
| |
Investment Banking & Brokerage — 1.3% | | | |
| | | |
E*Trade Financial Corp. | | | 3,440 | | | | 55,040 | | | (a) |
Morgan Stanley | | | 28,496 | | | | 775,376 | | | |
The Charles Schwab Corp. | | | 18,211 | | | | 311,590 | | | |
The Goldman Sachs Group Inc. | | | 9,499 | | | | 1,597,352 | | | |
| | | | | | | 2,739,358 | | | |
| |
IT Consulting & Other Services — 1.9% | | | |
| | | |
Cognizant Technology Solutions Corp. | | | 5,700 | | | | 417,753 | | | (a) |
International Business Machines Corp. | | | 23,230 | | | | 3,409,235 | | | |
SAIC Inc. | | | 5,200 | | | | 82,472 | | | (a) |
Teradata Corp. | | | 3,300 | | | | 135,828 | | | (a) |
| | | | | | | 4,045,288 | | | |
| |
Leisure Products — 0.1% | | | |
| | | |
Hasbro Inc. | | | 2,596 | | | | 122,479 | | | |
Mattel Inc. | | | 6,651 | | | | 169,135 | | | |
| | | | | | | 291,614 | | | |
| |
Life & Health Insurance — 1.1% | | | |
| | | |
Aflac Inc. | | | 8,700 | | | | 490,941 | | | |
Lincoln National Corp. | | | 6,142 | | | | 170,809 | | | |
MetLife Inc. | | | 16,973 | | | | 754,280 | | | |
Principal Financial Group Inc. | | | 5,900 | | | | 192,104 | | | |
Prudential Financial Inc. | | | 8,800 | | | | 516,648 | | | |
Torchmark Corp. | | | 1,572 | | | | 93,911 | | | |
Unum Group | | | 6,089 | | | | 147,476 | | | |
| | | | | | | 2,366,169 | | | |
| |
Life Sciences Tools & Services — 0.5% | | | |
| | | |
Agilent Technologies Inc. | | | 6,385 | | | | 264,531 | | | (a) |
Life Technologies Corp. | | | 3,503 | | | | 194,416 | | | (a) |
PerkinElmer Inc. | | | 2,310 | | | | 59,644 | | | |
Thermo Fisher Scientific Inc. | | | 7,328 | | | | 405,678 | | | (a) |
Waters Corp. | | | 1,700 | | | | 132,107 | | | (a) |
| | | | | | | 1,056,376 | | | |
See Notes to Schedule of Investments and Notes to Financial Statements.
9
S&P 500 Index Fund
| | |
| Schedule of Investments | | December 31, 2010 |
| | | | | | | | | | |
| | | |
| | | Number
of Shares | | | Fair Value | | | |
| |
Managed Healthcare — 0.8% | | | |
| | | |
Aetna Inc. | | | 7,408 | | | $ | 226,018 | | | |
CIGNA Corp. | | | 5,189 | | | | 190,229 | | | |
Coventry Healthcare Inc. | | | 2,800 | | | | 73,920 | | | (a) |
Humana Inc. | | | 3,127 | | | | 171,172 | | | (a) |
UnitedHealth Group Inc. | | | 20,476 | | | | 739,388 | | | |
WellPoint Inc. | | | 7,300 | | | | 415,078 | | | (a) |
| | | | | | | 1,815,805 | | | |
| |
Metal & Glass Containers — 0.1% | | | |
| | | |
Ball Corp. | | | 1,716 | | | | 116,774 | | | |
Owens-Illinois Inc. | | | 3,100 | | | | 95,170 | | | (a) |
| | | | | | | 211,944 | | | |
| |
Motorcycle Manufacturers — 0.1% | | | |
| | | |
Harley-Davidson Inc. | | | 4,300 | | | | 149,081 | | | |
| |
Movies & Entertainment — 1.4% | | | |
| | | |
News Corp. | | | 42,400 | | | | 617,344 | | | |
The Walt Disney Co. | | | 35,420 | | | | 1,328,604 | | | |
Time Warner Inc. | | | 20,638 | | | | 663,924 | | | |
Viacom Inc. | | | 11,213 | | | | 444,147 | | | |
| | | | | | | 3,054,019 | | | |
| |
Multi-Line Insurance — 0.4% | | | |
| | | |
American International Group Inc. | | | 2,625 | | | | 151,253 | | | (a) |
Assurant Inc. | | | 2,100 | | | | 80,892 | | | |
Genworth Financial Inc. | | | 9,600 | | | | 126,144 | | | (a) |
Hartford Financial Services Group Inc. | | | 8,304 | | | | 219,973 | | | |
Loews Corp. | | | 5,866 | | | | 228,246 | | | |
| | | | | | | 806,508 | | | |
| |
Multi-Sector Holdings — 0.0%* | | | |
| | | |
Leucadia National Corp. | | | 3,700 | | | | 107,966 | | | |
| |
Multi-Utilities — 1.3% | | | |
| | | |
Ameren Corp. | | | 4,542 | | | | 128,039 | | | |
CenterPoint Energy Inc. | | | 7,618 | | | | 119,755 | | | |
CMS Energy Corp. | | | 4,700 | | | | 87,420 | | | |
Consolidated Edison Inc. | | | 5,307 | | | | 263,068 | | | |
Dominion Resources Inc. | | | 11,000 | | | | 469,920 | | | |
DTE Energy Co. | | | 3,066 | | | | 138,951 | | | |
Integrys Energy Group Inc. | | | 1,531 | | | | 74,269 | | | |
NiSource Inc. | | | 5,115 | | | | 90,126 | | | |
PG&E Corp. | | | 7,354 | | | | 351,815 | | | |
Public Service Enterprise Group Inc. | | | 9,592 | | | | 305,122 | | | |
SCANA Corp. | | | 2,100 | | | | 85,260 | | | |
Sempra Energy | | | 4,375 | | | | 229,600 | | | |
TECO Energy Inc. | | | 4,400 | | | | 78,320 | | | |
Wisconsin Energy Corp. | | | 2,200 | | | | 129,492 | | | |
Xcel Energy Inc. | | | 8,480 | | | | 199,704 | | | |
| | | | | | | 2,750,861 | | | |
| | | | | | | | | | |
| | | |
| | | Number
of Shares | | | Fair Value | | | |
| |
Office Electronics — 0.1% | | | |
| | | |
Xerox Corp. | | | 26,347 | | | $ | 303,517 | | | |
| |
Office REITs — 0.1% | | | |
| | | |
Boston Properties Inc. | | | 2,700 | | | | 232,470 | | | |
| |
Office Services & Supplies — 0.1% | | | |
| | | |
Avery Dennison Corp. | | | 2,055 | | | | 87,009 | | | |
Pitney Bowes Inc. | | | 3,632 | | | | 87,822 | | | |
| | | | | | | 174,831 | | | |
| |
Oil & Gas Drilling — 0.2% | | | |
| | | |
Diamond Offshore Drilling Inc. | | | 1,300 | | | | 86,931 | | | |
Helmerich & Payne Inc. | | | 1,900 | | | | 92,112 | | | |
Nabors Industries Ltd. | | | 5,300 | | | | 124,338 | | | (a) |
Rowan companies Inc. | | | 2,177 | | | | 75,999 | | | (a) |
| | | | | | | 379,380 | | | |
| |
Oil & Gas Equipment & Services — 2.0% | | | |
| | | |
Baker Hughes Inc. | | | 8,132 | | | | 464,906 | | | |
Cameron International Corp. | | | 4,600 | | | | 233,358 | | | (a) |
FMC Technologies Inc. | | | 2,243 | | | | 199,425 | | | (a) |
Halliburton Co. | | | 17,091 | | | | 697,826 | | | |
National Oilwell Varco Inc. | | | 7,800 | | | | 524,550 | | | |
Schlumberger Ltd. | | | 25,446 | | | | 2,124,741 | | | |
| | | | | | | 4,244,806 | | | |
| |
Oil & Gas Exploration & Production — 2.0% | | | |
| | | |
Anadarko Petroleum Corp. | | | 9,256 | | | | 704,937 | | | |
Apache Corp. | | | 7,148 | | | | 852,256 | | | |
Cabot Oil & Gas Corp. | | | 1,900 | | | | 71,915 | | | |
Chesapeake Energy Corp. | | | 12,400 | | | | 321,284 | | | |
Denbury Resources Inc. | | | 7,600 | | | | 145,084 | | | (a) |
Devon Energy Corp. | | | 8,092 | | | | 635,303 | | | |
EOG Resources Inc. | | | 4,800 | | | | 438,768 | | | |
EQT Corp. | | | 2,914 | | | | 130,664 | | | |
Newfield Exploration Company | | | 2,500 | | | | 180,275 | | | (a) |
Noble Energy Inc. | | | 3,300 | | | | 284,064 | | | |
Pioneer Natural Resources Co. | | | 2,200 | | | | 191,004 | | | |
QEP Resources Inc. | | | 3,400 | | | | 123,454 | | | |
Range Resources Corp. | | | 2,900 | | | | 130,442 | | | |
Southwestern Energy Co. | | | 6,500 | | | | 243,295 | | | (a) |
| | | | | | | 4,452,745 | | | |
| |
Oil & Gas Refining & Marketing — 0.2% | | | |
| | | |
Sunoco Inc. | | | 2,376 | | | | 95,777 | | | |
Tesoro Corp. | | | 2,300 | | | | 42,642 | | | |
Valero Energy Corp. | | | 10,500 | | | | 242,760 | | | |
| | | | | | | 381,179 | | | |
| |
Oil & Gas Storage & Transportation — 0.3% | | | |
| | | |
El Paso Corp. | | | 13,382 | | | | 184,136 | | | |
Spectra Energy Corp. | | | 12,277 | | | | 306,802 | | | |
The Williams companies Inc. | | | 10,886 | | | | 269,102 | | | |
| | | | | | | 760,040 | | | |
See Notes to Schedule of Investments and Notes to Financial Statements.
10
S&P 500 Index Fund
| | |
| Schedule of Investments | | December 31, 2010 |
| | | | | | | | | | |
| | | |
| | | Number
of Shares | | | Fair Value | | | |
| |
Packaged Foods & Meats — 1.5% | | | |
| | | |
Campbell Soup Co. | | | 3,715 | | | $ | 129,096 | | | |
ConAgra Foods Inc. | | | 8,168 | | | | 184,433 | | | |
Dean Foods Co. | | | 3,700 | | | | 32,708 | | | (a) |
General Mills Inc. | | | 12,062 | | | | 429,287 | | | |
HJ Heinz Co. | | | 5,997 | | | | 296,612 | | | |
Hormel Foods Corp. | | | 1,400 | | | | 71,764 | | | |
Kellogg Co. | | | 4,890 | | | | 249,781 | | | |
Kraft Foods Inc. | | | 32,590 | | | | 1,026,911 | | | |
McCormick & Company Inc. | | | 2,600 | | | | 120,978 | | | |
Mead Johnson Nutrition Co. | | | 3,850 | | | | 239,662 | | | |
Sara Lee Corp. | | | 11,757 | | | | 205,865 | | | |
The Hershey Co. | | | 2,884 | | | | 135,981 | | | |
The JM Smucker Co. | | | 2,217 | | | | 145,546 | | | |
Tyson Foods Inc. | | | 5,400 | | | | 92,988 | | | |
| | | | | | | 3,361,612 | | | |
| |
Paper Packaging — 0.1% | | | |
| | | |
Bemis Company Inc. | | | 1,962 | | | | 64,079 | | | |
Sealed Air Corp. | | | 2,814 | | | | 71,616 | | | |
| | | | | | | 135,695 | | | |
| |
Paper Products — 0.1% | | | |
| | | |
International Paper Co. | | | 8,075 | | | | 219,963 | | | |
MeadWestvaco Corp. | | | 3,300 | | | | 86,328 | | | |
| | | | | | | 306,291 | | | |
| |
Personal Products — 0.2% | | | |
| | | |
Avon Products Inc. | | | 7,928 | | | | 230,388 | | | |
The Estee Lauder companies Inc. | | | 2,100 | | | | 169,470 | | | |
| | | | | | | 399,858 | | | |
| |
Pharmaceuticals — 5.4% | | | |
| | | |
Abbott Laboratories | | | 28,904 | | | | 1,384,791 | | | (d) |
Allergan Inc. | | | 5,755 | | | | 395,196 | | | |
Bristol-Myers Squibb Co. | | | 32,018 | | | | 847,837 | | | (d) |
Eli Lilly & Co. | | | 19,143 | | | | 670,771 | | | |
Forest Laboratories Inc. | | | 5,500 | | | | 175,890 | | | (a) |
Hospira Inc. | | | 3,239 | | | | 180,380 | | | (a) |
Johnson & Johnson | | | 51,386 | | | | 3,178,224 | | | |
Merck & Company Inc. | | | 57,645 | | | | 2,077,526 | | | |
Mylan Inc. | | | 8,465 | | | | 178,865 | | | (a) |
Pfizer Inc. | | | 149,914 | | | | 2,624,994 | | | |
Watson Pharmaceuticals Inc. | | | 2,000 | | | | 103,300 | | | (a) |
| | | | | | | 11,817,774 | | | |
| |
Property & Casualty Insurance — 2.1% | | | |
| | | |
ACE Ltd. | | | 6,300 | | | | 392,175 | | | |
Berkshire Hathaway Inc. | | | 32,269 | | | | 2,585,070 | | | (a) |
Chubb Corp. | | | 5,694 | | | | 339,590 | | | |
CIncinnati Financial Corp. | | | 3,192 | | | | 101,154 | | | |
The Allstate Corp. | | | 10,286 | | | | 327,918 | | | (d) |
The Progressive Corp. | | | 12,273 | | | | 243,865 | | | |
The Travelers companies Inc. | | | 8,499 | | | | 473,479 | | | |
XL Group Plc | | | 5,900 | | | | 128,738 | | | |
| | | | | | | 4,591,989 | | | |
| | | | | | | | | | |
| | | |
| | | Number
of Shares | | | Fair Value | | | |
| |
Publishing — 0.2% | | | |
| | | |
Gannett Company Inc. | | | 4,808 | | | $ | 72,553 | | | |
Meredith Corp. | | | 598 | | | | 20,721 | | | |
The McGraw-Hill companies Inc. | | | 5,821 | | | | 211,943 | | | |
The Washington Post Co. | | | 90 | | | | 39,555 | | | |
| | | | | | | 344,772 | | | |
| |
Railroads — 0.8% | | | |
| | | |
CSX Corp. | | | 6,939 | | | | 448,329 | | | |
Norfolk Southern Corp. | | | 6,718 | | | | 422,025 | | | |
Union Pacific Corp. | | | 9,237 | | | | 855,900 | | | |
| | | | | | | 1,726,254 | | | |
| |
Real Estate Services — 0.1% | | | |
| | | |
CB Richard Ellis Group Inc. (REIT) | | | 5,500 | | | | 112,640 | | | (a) |
| |
Regional Banks — 1.0% | | | |
| | | |
BB&T Corp. | | | 13,100 | | | | 344,399 | | | |
Fifth Third Bancorp | | | 14,616 | | | | 214,563 | | | |
First Horizon National Corp. | | | 4,055 | | | | 47,770 | | | (a) |
Huntington Bancshares Inc. | | | 13,934 | | | | 95,727 | | | |
KeyCorp | | | 17,128 | | | | 151,583 | | | |
M&T Bank Corp. | | | 2,200 | | | | 191,510 | | | |
Marshall & Ilsley Corp. | | | 10,298 | | | | 71,262 | | | |
PNC Financial Services Group Inc. | | | 9,904 | | | | 601,371 | | | |
Regions Financial Corp. | | | 23,768 | | | | 166,376 | | | |
SunTrust Banks Inc. | | | 9,229 | | | | 272,348 | | | |
Zions Bancorp. | | | 2,500 | | | | 60,575 | | | |
| | | | | | | 2,217,484 | | | |
| |
Research & Consulting Services — 0.1% | | | |
| | | |
Dun & Bradstreet Corp. | | | 900 | | | | 73,881 | | | |
Equifax Inc. | | | 2,400 | | | | 85,440 | | | |
| | | | | | | 159,321 | | | |
| |
Residential REITs — 0.2% | | | |
| | | |
Apartment Investment & Management Co. (REIT) | | | 2,431 | | | | 62,817 | | | |
AvalonBay Communities Inc. (REIT) | | | 1,601 | | | | 180,193 | | | |
Equity Residential (REIT) | | | 5,300 | | | | 275,335 | | | |
| | | | | | | 518,345 | | | |
| |
Restaurants — 1.1% | | | |
| | | |
Darden Restaurants Inc. | | | 2,729 | | | | 126,735 | | | |
McDonald’s Corp. | | | 19,790 | | | | 1,519,080 | | | |
Starbucks Corp. | | | 13,698 | | | | 440,117 | | | |
Yum! Brands Inc. | | | 8,629 | | | | 423,252 | | | |
| | | | | | | 2,509,184 | | | |
| |
Retail REITs — 0.3% | | | |
| | | |
Kimco Realty Corp. (REIT) | | | 7,600 | | | | 137,104 | | | |
Simon Property Group Inc. (REIT) | | | 5,537 | | | | 550,876 | | | |
| | | | | | | 687,980 | | | |
See Notes to Schedule of Investments and Notes to Financial Statements.
11
S&P 500 Index Fund
| | |
| Schedule of Investments | | December 31, 2010 |
| | | | | | | | | | |
| | | |
| | | Number
of Shares | | | Fair Value | | | |
| |
Semiconductor Equipment — 0.3% | | | |
| | | |
Applied Materials Inc. | | | 25,400 | | | $ | 356,870 | | | (d) |
KLA-Tencor Corp. | | | 3,200 | | | | 123,648 | | | |
MEMC Electronic Materials Inc. | | | 4,500 | | | | 50,670 | | | (a) |
Novellus Systems Inc. | | | 1,700 | | | | 54,944 | | | (a) |
Teradyne Inc. | | | 3,600 | | | | 50,544 | | | (a) |
| | | | | | | 636,676 | | | |
| |
Semiconductors — 2.2% | | | |
| | | |
Advanced Micro Devices Inc. | | | 10,074 | | | | 82,405 | | | (a,d) |
Altera Corp. | | | 5,700 | | | | 202,806 | | | |
Analog Devices Inc. | | | 5,700 | | | | 214,719 | | | |
Broadcom Corp. | | | 8,250 | | | | 359,287 | | | |
First Solar Inc. | | | 1,010 | | | | 131,441 | | | (a) |
Intel Corp. | | | 103,865 | | | | 2,184,281 | | | (d) |
Linear Technology Corp. | | | 4,300 | | | | 148,737 | | | |
LSI Corp. | | | 12,292 | | | | 73,629 | | | (a) |
Microchip Technology Inc. | | | 3,500 | | | | 119,735 | | | |
Micron Technology Inc. | | | 16,654 | | | | 133,565 | | | (a) |
National Semiconductor Corp. | | | 4,566 | | | | 62,828 | | | |
NVIDIA Corp. | | | 10,500 | | | | 161,700 | | | (a) |
Texas Instruments Inc. | | | 21,851 | | | | 710,157 | | | |
Xilinx Inc. | | | 4,787 | | | | 138,727 | | | |
| | | | | | | 4,724,017 | | | |
| |
Soft Drinks — 2.4% | | | |
| | | |
Coca-Cola Enterprises Inc. | | | 6,518 | | | | 163,146 | | | |
Dr Pepper Snapple Group Inc. | | | 4,400 | | | | 154,704 | | | |
PepsiCo Inc. | | | 29,549 | | | | 1,930,436 | | | (d) |
The Coca-Cola Co. | | | 43,502 | | | | 2,861,127 | | | (d) |
| | | | | | | 5,109,413 | | | |
| |
Specialized Consumer Services — 0.0%* | | | |
| | | |
H&R Block Inc. | | | 6,292 | | | | 74,938 | | | |
| |
Specialized Finance — 0.4% | | | |
| | | |
CME Group Inc. | | | 1,261 | | | | 405,727 | | | |
IntercontinentalExchange Inc. | | | 1,400 | | | | 166,810 | | | (a) |
Moody’s Corp. | | | 4,084 | | | | 108,389 | | | |
NYSE Euronext | | | 4,800 | | | | 143,904 | | | |
The NASDAQ OMX Group Inc. | | | 2,600 | | | | 61,646 | | | (a) |
| | | | | | | 886,476 | | | |
| |
Specialized REITs — 0.6% | | | |
| | | |
HCP Inc. | | | 6,000 | | | | 220,740 | | | |
Healthcare Inc. | | | 2,300 | | | | 109,572 | | | |
Host Hotels & Resorts Inc. | | | 12,717 | | | | 227,253 | | | |
Plum Creek Timber Company Inc. | | | 3,200 | | | | 119,840 | | | |
Public Storage | | | 2,600 | | | | 263,692 | | | |
Ventas Inc. | | | 3,000 | | | | 157,440 | | | |
Weyerhaeuser Co. | | | 10,167 | | | | 192,461 | | | |
| | | | | | | 1,290,998 | | | |
| |
Specialty Chemicals — 0.3% | | | |
| | | |
Ecolab Inc. | | | 4,352 | | | | 219,428 | | | |
| | | | | | | | | | |
| | | |
| | | Number
of Shares | | | Fair Value | | | |
| | | |
International Flavors & Fragrances Inc. | | | 1,547 | | | $ | 85,998 | | | |
Sigma-Aldrich Corp. | | | 2,182 | | | | 145,234 | | | |
The Sherwin-Williams Co. | | | 1,763 | | | | 147,651 | | | |
| | | | | | | 598,311 | | | |
| |
Specialty Stores — 0.2% | | | |
| | | |
Staples Inc. | | | 13,450 | | | | 306,256 | | | |
Tiffany & Co. | | | 2,400 | | | | 149,448 | | | |
| | | | | | | 455,704 | | | |
| |
Steel — 0.4% | | | |
| | | |
AK Steel Holding Corp. | | | 2,300 | | | | 37,651 | | | |
Allegheny Technologies Inc. | | | 1,951 | | | | 107,656 | | | |
Cliffs Natural Resources Inc. | | | 2,600 | | | | 202,826 | | | |
Nucor Corp. | | | 6,036 | | | | 264,498 | | | |
United States Steel Corp. | | | 2,665 | | | | 155,689 | | | |
| | | | | | | 768,320 | | | |
| |
Systems Software — 3.3% | | | |
| | | |
BMC Software Inc. | | | 3,300 | | | | 155,562 | | | (a) |
CA Inc. | | | 7,200 | | | | 175,968 | | | |
McAfee Inc. | | | 3,000 | | | | 138,930 | | | (a) |
Microsoft Corp. | | | 140,539 | | | | 3,923,849 | | | (d) |
Novell Inc. | | | 7,666 | | | | 45,383 | | | (a) |
Oracle Corp. | | | 72,152 | | | | 2,258,358 | | | (d) |
Red Hat Inc. | | | 3,600 | | | | 164,340 | | | (a) |
Symantec Corp. | | | 14,785 | | | | 247,501 | | | (a) |
| | | | | | | 7,109,891 | | | |
| |
Thrifts & Mortgage Finance — 0.1% | | | |
| | | |
Hudson City Bancorp Inc. | | | 9,600 | | | | 122,304 | | | |
People’s United Financial Inc. | | | 6,700 | | | | 93,867 | | | |
| | | | | | | 216,171 | | | |
| |
Tires & Rubber — 0.0%* | | | |
| | | |
The Goodyear Tire & Rubber Co. | | | 4,519 | | | | 53,550 | | | (a) |
| |
Tobacco — 1.6% | | | |
| | | |
Altria Group Inc. | | | 39,253 | | | | 966,409 | | | |
Lorillard Inc. | | | 2,711 | | | | 222,465 | | | |
Philip Morris International Inc. | | | 33,979 | | | | 1,988,791 | | | |
Reynolds American Inc. | | | 6,400 | | | | 208,768 | | | |
| | | | | | | 3,386,433 | | | |
| |
Trading Companies & Distributors — 0.1% | | | |
| | | |
Fastenal Co. | | | 2,600 | | | | 155,766 | | | |
WW Grainger Inc. | | | 1,082 | | | | 149,435 | | | |
| | | | | | | 305,201 | | | |
| |
Trucking — 0.0%* | | | |
| | | |
Ryder System Inc. | | | 931 | | | | 49,008 | | | |
| |
Wireless Telecommunication Services — 0.3% | | | |
| | | |
American Tower Corp. | | | 7,600 | | | | 392,464 | | | (a) |
MetroPCS Communications Inc. | | | 4,600 | | | | 58,098 | | | (a) |
See Notes to Schedule of Investments and Notes to Financial Statements.
12
S&P 500 Index Fund
| | |
| Schedule of Investments | | December 31, 2010 |
| | | | | | | | | | |
| | | |
| | | Number
of Shares | | | Fair Value | | | |
| | | |
Sprint Nextel Corp. | | | 54,600 | | | $ | 230,958 | | | (a) |
| | | | | | | 681,520 | | | |
| | | |
Total Common Stock
(Cost $185,492,248) | | | | | | | 213,560,953 | | | |
Other Investments — 0.0%* | | | |
GEI Investment Fund
(Cost $80,391) | | | | | | | 76,371 | | | (e) |
| | | |
Total Investments in Securities
(Cost $185,572,639) | | | | | | | 213,637,324 | | | |
Short-Term Investments — 1.7% | | | |
| | | |
Short-Term Investments — 1.6% | | | | | | | | | | |
GE Money Market Fund Institutional Class 0.00% | | | | | | | 3,459,247 | | | (b,e) |
| | | |
| | | Principal
Amount | | | | | | |
| | |
U.S. Government — 0.1% | | | | | | | |
U.S. Treasury Bill 0.02% 01/20/11 | | $ | 300,000 | | | | 299,996 | | | (b) |
| | | |
Total Short-Term Investments
(Cost $3,759,228) | | | | | | | 3,759,243 | | | |
| | | |
Total Investments
(Cost $189,331.867) | | | | | | | 217,396,567 | | | |
| | | |
Liabilities in Excess of Other Assets, net — (0.0)%* | | | | | | | (52,999 | ) | | |
| | | | | | | | | | |
| | | |
NET ASSETS — 100.0% | | | | | | $ | 217,343,568 | | | |
| | | | | | | | | | |
The Fund had the following long futures contracts open at December 31, 2010:
| | | | | | | | | | | | | | | | |
| Description | | Expiration
date | | | Number
of
Contracts | | | Current
Notional
Value | | | Unrealized
Appreciation | |
S&P 500 Emini Index Futures | | | March 2011 | | | | 60 | | | $ | 3,759,000 | | | $ | 74,867 | |
See Notes to Schedule of Investments and Notes to Financial Statements.
13
| | |
| Notes to Schedule of Investments | | December 31, 2010 |
The views expressed in this document reflect our judgment as of the publication date and are subject to change at any time without notice. The securities information regarding holdings, allocations and other characteristics are presented as of a particular date to illustrate examples of securities that the fund has bought and the diversity of areas in which the Fund may invest as of a particular date. It may not be representative of the Fund’s current or future investments and should not be construed as a recommendation to purchase or sell a particular security. See the prospectus for complete descriptions of investment objective, policies, risks and permissible investments.
| (a) | Non-income producing security. |
| (b) | Coupon amount represents effective yield. |
| (c) | State Street Corp. is the parent company of State Street Bank & Trust Co., the Fund’s custodian and accounting agent. Also affiliated with SSgA Management, Inc., the sub-adviser. |
| (d) | At December 31, 2010 , all or a portion of this security was pledged to cover collateral requirements for futures, options, forward foreign currency contracts and/or TBA’s. |
| (e) | GE Asset Management, the investment adviser of the Fund, also serves as investment adviser of the GEI Investment Fund and the GE Funds-GE Money Market Fund. |
| (f) | General Electric Co. is the parent company of GE Asset Management Incorporated, the Fund’s investment adviser. |
| † | Percentages are based on net assets as of December 31, 2010. |
Abbreviations:
| | |
REIT | | Real Estate Investment Trust |
14
Financial Highlights
Selected data based on a share outstanding throughout the fiscal years indicated
| | | | | | | | | | | | | | | | | | | | |
| | | 12/31/10 | | | 12/31/09 | | | 12/31/08 | | | 12/31/07 | | | 12/31/06 | |
| Inception date | | | — | | | | — | | | | — | | | | — | | | | 4/15/85 | |
Net asset value, beginning of period | | $ | 19.82 | | | $ | 15.99 | | | $ | 26.52 | | | $ | 26.06 | | | $ | 22.94 | |
Income/(loss) from investment operations: | | | | | | | | | | | | | | | | | | | | |
Net investment income | | | 0.40 | | | | 0.38 | | | | 0.52 | | | | 0.47 | | | | 0.42 | |
Net realized and unrealized
gains/(losses) on investments | | | 2.54 | | | | 3.84 | | | | (10.46) | | | | 0.86 | | | | 3.12 | |
Total income/(loss) from
investment operations | | | 2.94 | | | | 4.22 | | | | (9.94) | | | | 1.33 | | | | 3.54 | |
Less distributions from: | | | | | | | | | | | | | | | | | | | | |
Net investment income | | | 0.39 | | | | 0.39 | | | | 0.50 | | | | 0.47 | | | | 0.42 | |
Net realized gains | | | — | | | | — | | | | 0.09 | | | | 0.40 | | | | — | |
Total distributions | | | 0.39 | | | | 0.39 | | | | 0.59 | | | | 0.87 | | | | 0.42 | |
Net asset value, end of period | | $ | 22.37 | | | $ | 19.82 | | | $ | 15.99 | | | $ | 26.52 | | | $ | 26.06 | |
TOTAL RETURN (a) | | | 14.84% | | | | 26.30% | | | | (37.40)% | | | | 5.10% | | | | 15.43% | |
| | | | | |
RATIOS/SUPPLEMENTAL DATA: | | | | | | | | | | | | | | | | | | | | |
Net assets, end of period (in thousands) | | $ | 217,344 | | | $ | 224,165 | | | $ | 209,176 | | | $ | 447,426 | | | $ | 497,105 | |
Ratios to average net assets: | | | | | | | | | | | | | | | | | | | | |
Net investment income (loss) | | | 1.79% | | | | 2.05% | | | | 1.91% | | | | 1.62% | | | | 1.58% | |
Net Expenses | | | 0.33% | (b)(c) | | | 0.43% | (b) | | | 0.41% | (b) | | | 0.39% | | | | 0.40% | |
Gross Expenses | | | 0.38% | | | | 0.43% | | | | 0.41% | | | | 0.39% | | | | 0.40% | |
Portfolio turnover rate | | | 4% | | | | 5% | | | | 4% | | | | 6% | | | | 4% | |
Notes to Financial Highlights
| (a) | Total returns are historical and assume changes in share price, reinvestment of dividends and capital gains distributions and do not include the effect of insurance contract charges. Past performance does not guarantee future results. |
| (b) | Reflects GE Asset Management’s waiver of a portion of the Fund’s management fee in an amount equal to the management fee earned by GEAM with respect to the Fund’s investment in the GE Funds – GE Money Market Fund. Excluding waiver, the expense ratios would be unchanged. |
| (c) | Effective January 1, 2010, GEAM has entered into a contractual arrangement with the Company to limit the management fee charged to the Fund to 0.30% of the average daily net assets of the Fund. Unless terminated or amended, this agreement will continue in effect until April 30, 2011. The agreement may be changed or terminated with the approval of the Company’s Board of Directors and GEAM. |
The accompanying Notes are an integral part of these financial statements.
15
| | | | |
Statement of Assets and Liabilities December 31, 2010 | | | |
| |
ASSETS | | | | |
Investments in securities, at fair value (cost $185,492,248) | | | $213,560,953 | |
Investments in affiliated securities, at fair value (cost $80,391) | | | 76,371 | |
Short-term Investments at fair value (cost $299,981) | | | 299,996 | |
Short-term affiliated investments (at amortized cost) | | | 3,459,247 | |
Income receivables | | | 252,133 | |
Receivable for fund shares sold | | | 1,899 | |
Total Assets | | | 217,650,599 | |
| |
LIABILITIES | | | | |
Payable for Fund shares redeemed | | | 120,420 | |
Payable to GEAM | | | 134,650 | |
Accrued other expenses | | | 47,461 | |
Variation margin payable | | | 4,500 | |
Total Liabilities | | | 307,031 | |
NET ASSETS | | | $217,343,568 | |
| |
NET ASSETS CONSIST OF: | | | | |
Capital paid in | | | 245,222,819 | |
Undistributed (distribution in excess of) net investment income | | | 19,127 | |
Accumulated net realized gain (loss) | | | (56,037,945 | ) |
Net unrealized appreciation/ (depreciation) on: | | | | |
Investments | | | 28,064,700 | |
Futures | | | 74,867 | |
NET ASSETS | | | $217,343,568 | |
| |
NET ASSETS | | | 217,343,568 | |
Shares outstanding ($0.01 par value; unlimited shares authorized) | | | 9,716,270 | |
Net asset value per share | | | 22.37 | |
The accompanying Notes are an integral part of these financial statements.
16
| | | | |
Statement of Operations Year Ended December 31, 2010 | | | |
| |
INVESTMENT INCOME | | | | |
Income: | | | | |
Dividends | | $ | 4,324,932 | |
Interest | | | 144,510 | |
Interest from affiliated investments | | | 489 | |
Total Income | | | 4,469,931 | |
| |
Expenses: | | | | |
Advisory and administrative fees | | | 744,143 | |
Transfer agent fees | | | 40 | |
Directors’ fees | | | 7,320 | |
Custody and accounting expenses | | | 958 | |
Professional fees | | | 40,919 | |
Other expenses | | | 9,200 | |
Total expenses before waiver and reimbursement | | | 802,580 | |
Less: Expenses waived or borne by the adviser | | | (6,325 | ) |
Less: Expenses reimbursed by the adviser | | | (105,778 | ) |
Net expenses | | | 690,477 | |
Net investment income (loss) | | | 3,779,454 | |
| |
NET REALIZED AND UNREALIZED GAIN (LOSS)
ON INVESTMENTS | | | | |
| |
Realized gain (loss) on: | | | | |
Investments | | | (3,819,425 | ) |
Futures | | | 473,046 | |
| |
Increase (decrease) in unrealized appreciation/(depreciation) on: | | | | |
Investments | | | 28,636,947 | |
Futures | | | 19,706 | |
Net realized and unrealized gain (loss) on investments | | | 25,310,274 | |
Net increase (decrease) in net assets resulting from operations | | $ | 29,089,728 | |
The accompanying Notes are an integral part of these financial statements.
17
| | | | | | | | |
Statements of Changes in Net Assets | | | |
| | | Year Ended
December 31,
2010 | | | Year Ended
December 31,
2009 | |
| | |
INCREASE (DECREASE) IN NET ASSETS | | | | | | | | |
Operations: | | | | | | | | |
Net investments income (loss) | | $ | 3,779,454 | | | $ | 4,156,927 | |
Net realized gain (loss) on investments and futures | | | (3,346,379 | ) | | | (18,244,107 | ) |
Net increase (decrease) in unrealized appreciation/(depreciation) on investments and futures | | | 28,656,653 | | | | 61,943,292 | |
Net increase (decrease) from operations | | | 29,089,728 | | | | 47,856,112 | |
| | |
Distributions to shareholders from: | | | | | | | | |
Net investment income | | | (3,730,010 | ) | | | (4,356,429 | ) |
Total distributions | | | (3,730,010 | ) | | | (4,356,429 | ) |
Increase (decrease) in net assets from operations and distributions | | | 25,359,718 | | | | 43,499,683 | |
Share transactions: | | | | | | | | |
Proceeds from sale of shares | | | 2,496,222 | | | | 3,626,812 | |
Value of distributions reinvested | | | 3,730,010 | | | | 4,356,429 | |
Cost of shares redeemed | | | (38,407,507 | ) | | | (36,493,594 | ) |
Net increase (decrease) from share transactions | | | (32,181,275 | ) | | | (28,510,353 | ) |
Total increase (decrease) in net assets | | | (6,821,557 | ) | | | 14,989,330 | |
| | |
NET ASSETS | | | | | | | | |
Beginning of period | | | 224,165,125 | | | | 209,175,795 | |
End of period | | $ | 217,343,568 | | | $ | 224,165,125 | |
Undistributed (distribution in excess of)
net investment income, end of period | | $ | 19,127 | | | $ | 1,556 | |
| | |
CHANGES IN FUND SHARES | | | | | | | | |
| | |
Shares sold | | | 119,058 | | | | 230,073 | |
Issued for distributions reinvested | | | 166,444 | | | | 217,713 | |
Shares redeemed | | | (1,880,228 | ) | | | (2,212,725 | ) |
Net increase (decrease) in fund shares | | | (1,594,726 | ) | | | (1,764,939 | ) |
The accompanying Notes are an integral part of these financial statements.
18
| | |
| Notes to Financial Statements | | December 31, 2010 |
1. Organization of the Company
GE Investments Funds, Inc. (the “Company”) was incorporated under the laws of the Commonwealth of Virginia on May 14, 1984 and is registered under the Investment Company Act of 1940, as amended (the “1940 Act”), as an open-end management investment company. The Company is composed of fourteen investment portfolios (collectively the “Funds”), although only the following eleven are currently being offered: U.S. Equity Fund, S&P 500 Index Fund (the “Fund”), Premier Growth Equity Fund, Core Value Equity Fund, Mid-Cap Equity Fund, Small-Cap Equity Fund, International Equity Fund, Total Return Fund, Income Fund, Money Market Fund and Real Estate Securities Fund.
Shares of the Funds of the Company are offered only to insurance company separate accounts that fund certain variable life insurance contracts and variable annuity contracts. GE Asset Management Incorporated (“GEAM”) is the investment adviser and administrator of each of the Funds.
| 2. | Summary of Significant Accounting Policies |
The preparation of financial statements in conformity with U.S. generally accepted accounting principles (GAAP) requires management to make estimates and assumptions that affect the reported amounts of assets and liabilities and disclosure of contingent assets and liabilities at the date of the financial statements and the reported amounts of increases and decreases in net assets from operations during the reporting period. Actual results may differ from those estimates.
Subsequent events after the balance sheet date through the date the financial statements were issued, have been evaluated in the preparation of the financial statements.
There are no items to report.
The following summarizes the significant accounting policies of the Company:
Securities Valuation and Transactions. All investments in securities are recorded at their estimated fair value, as described in Note 3.
Securities transactions are accounted for as of the trade date. Realized gains and losses on investments sold are recorded on the basis of identified cost for both financial statement and federal tax purposes.
The Fund’s income, expenses (other than distribution fees) and realized and unrealized gains and losses are allocated proportionally each day among the share classes based upon the relative net assets of each class.
Futures Contracts A futures contract represents a commitment for the future purchase or sale of an asset at a specified price on a specified date. The Fund invests in stock index futures contracts subject to certain limitations to manage its exposure to the stock markets. Buying futures tends to increase a Fund’s exposure to the underlying instrument while selling futures tends to decrease a Fund’s exposure to the underlying instrument or to hedge other Fund investments. With futures contracts, there is minimal counterparty credit risk to the Fund since futures contracts are exchange traded and the exchange’s clearinghouse, as counterparty to all traded futures, guarantees the futures against default. A Fund’s risks in using these contracts include changes in the value of the underlying instruments, non- performance of the counterparties under the contracts’ terms and changes in the liquidity of the secondary market for the contracts. Futures contracts are valued at the settlement price established each day by the board of trade or exchange on which they principally trade.
Upon entering into a financial futures contract, the Fund is required to pledge to the broker an amount of cash and/or other assets equal to a certain percentage of the contract amount, known as initial margin deposit. Subsequent payments, known as variation margin, are made or received by the Fund each day, depending on the daily fluctuation in the fair value of the underlying security. The Fund records an unrealized gain or loss equal to the daily variation margin. Should market conditions move unexpectedly, the Fund may not achieve the anticipated benefits of the futures contracts and may incur a loss. The Fund recognizes a realized gain or loss upon the expiration or closing of a futures contract.
Investment Income Corporate actions (including cash dividends) are recorded on the ex-dividend date, net of applicable withholding taxes, except for certain foreign corporate actions which are recorded as soon after ex-dividend date as such information becomes available. Interest income is recorded on the accrual basis.
Expenses Fund specific expenses are allocated to the Fund that incurs such expenses. Expenses, other than those incurred by a specific Fund, are allocated pro rata among Funds. Such expenses may include custodial fees, legal and accounting fees, printing costs and registration fees. All
19
| | |
| Notes to Financial Statements | | December 31, 2010 |
expenses of the Fund are paid by GEAM and reimbursed by the Fund.
Federal Income Taxes The Fund intends to comply with all sections of the Internal Revenue Code applicable to regulated investment companies including the distribution of substantially all of its taxable net investment income and net realized capital gains to its shareholders. Therefore, no provision for federal income tax has been made. The Fund is treated as a separate taxpayer for federal income tax purposes.
The Fund utilizes various methods to measure the fair value of most of its investments on a recurring basis. GAAP establishes a framework for measuring fair value and providing related disclosures. Broadly, the framework requires fair value to be determined based on the exchange price that would be received for an asset or paid to transfer a liability (an exit price) in the principal or most advantageous market for the asset or liability in an orderly transaction between market participants at the measurement date. In the absence of active markets for the identical assets or liabilities, such measurements involve developing assumptions based on market observable data and, in the absence of such data, internal information that is consistent with what market participants would use in a hypothetical transaction that occurs at the measurement date. It also establishes a three-level valuation hierarchy based upon observable and non-observable inputs.
Observable inputs reflect market data obtained from independent sources, while unobservable inputs reflect our market assumptions. Preference is given to observable inputs. These two types of inputs create the following fair value hierarchy:
Level 1 — Quoted prices for identical investments in active markets.
Level 2 — Quoted prices for similar investments in active markets; quoted prices for identical or similar investments in markets that are not active; and model-derived valuations whose inputs are observable or whose significant value drivers are observable.
Level 3 — Significant inputs to the valuation model are unobservable.
Policies and procedures are maintained to value investments using the best and most relevant data
available. In addition, pricing vendors are utilized to assist in valuing investments. GEAM performs periodic reviews of the methodologies used by independent pricing services including price validation of individual securities.
Fair Value Measurement The following section describes the valuation methodologies the Funds use to measure different financial investments at fair value.
The Fund’s portfolio securities are valued generally on the basis of market quotations. Equity securities generally are valued at the last reported sale price on the primary market in which they are traded. Portfolio securities listed on NASDAQ are valued using the NASDAQ Official Closing Price. Level 1 securities primarily include publicly-traded equity securities which may not necessarily represent the last sale price. If no sales occurred on the exchange or NASDAQ that day, the portfolio security generally is valued using the last reported bid price. In those circumstances the Fund classifies the investment securities in Level 2.
The Fund uses non-binding broker quotes as the primary basis for valuation when there is limited, or no, relevant market activity for a specific investment or for other investments that share similar characteristics. The Funds have not adjusted the prices obtained. Investment securities priced using non-binding broker quotes are included in Level 3. As is the case with the primary pricing vendor, third-party brokers do not provide access to their proprietary valuation models, inputs and assumptions. Accordingly, GEAM conducts internal reviews of pricing for all such investment securities periodically to ensure reasonableness of valuations used in the Fund‘s financial statements. These reviews are designed to identify prices that appear stale, those that have changed significantly from prior valuations, and other anomalies that may indicate that a price may not be accurate. Based on the information available, GEAM believes that the fair values provided by the brokers are representative of prices that would be received to sell the assets at the measurement date (exit prices).
The Fund’s written or purchased options are valued at the last sales price, or if no sales occurred that day, at the last reported bid price and those are also included in Level 2.
If prices are not readily available for a portfolio security, or if it is believed that a price for a portfolio security does not represent its fair value, the security may be valued using procedures approved by the Fund’s Board of Directors that are designed to establish its “fair” value. These securities would be classified in Level 3. Those procedures require
20
| | |
| Notes to Financial Statements | | December 31, 2010 |
that the fair value of a security be established by the valuation committee. The valuation committee follows different protocols for different types of investments and
circumstances. The fair value procedures may be used to value any investment of the Fund in the appropriate circumstances.
The following table presents the Fund’s investments measured at fair value on a recurring basis at December 31, 2010:
| | | | | | | | | | | | | | | | |
Investments | | | Level 1 | | | | Level 2 | | | | Level 3 | | | | Total | |
| | | | |
Investments in Securities | | | | | | | | | | | | | | | | |
Common Stock | | $ | 213,560,953 | | | $ | — | | | $ | — | | | $ | 213,560,953 | |
Other Investments | | | — | | | | 76,371 | | | | — | | | | 76,371 | |
Short-Term Investments | | | 3,459,247 | | | | 299,996 | | | | — | | | | 3,759,243 | |
| | | | | | | | | | | | | | | | |
Total Investments in Securities | | $ | 217,020,200 | | | $ | 376,367 | | | $ | — | | | $ | 217,396,567 | |
| | | | | | | | | | | | | | | | |
| | | | |
| | | | | | | | | | | | | | | | | |
| | | | |
Other Financial Instruments | | | | | | | | | | | | | | | | |
Futures Contracts — Unrealized Appreciation | | $ | 74,867 | | | $ | — | | | $ | — | | | $ | 74,867 | |
| | | | | | | | | | | | | | | | |
| | | | |
| | | | | | | | | | | | | | | | | |
|
† Schedule of Investments for Industry Classification. * Other financial instruments include derivative instruments such as futures, forward foreign currency exchange contracts, swap contacts and option contacts. Amounts shown represent unrealized appreciation (depreciation), or in the case of options, market value at period end. | |
| 4. | Derivatives Transactions |
Shown below are the derivative contracts entered into by the Fund, summarized by primary risk exposure as they appear on the Statement of Assets and Liabilities, all of which are not accounted for as hedging instruments under FASB Accounting Standards Codification (“ASC”) No. 815 Derivatives and Hedging as of December 31, 2010.
| | | | | | | | | | | | |
| | | Asset Derivatives | | | Liability Derivatives | |
| | | Location | | Fair Value ($) | | | Location | | Fair Value ($) | |
| Equity Futures | | Assets, Net Assets — Unrealized Appreciation/ (Depreciation) on Futures | | | 74,867* | | | | | | | |
Shown below are the effects of derivative instruments on the Fund’s Statements of Operations, summarized by primary risk exposure all of which are not accounted for as hedging instruments under ASC 815.
| | | | | | | | | | | | | | |
| | | Location | | Notional Amount of
Futures Contracts
Purchased/(Sold) ($) | | | Realized Gain
or (Loss) ($) | | | Change in Unrealized
Appreciation/(Depreciation) ($) | |
Equity Futures | | Net realized gain/(loss) on futures, Increase/(decrease) in unrealized appreciation/ (depreciation) on futures | | | 18,181,890/(19,469,788) | | | | 473,046 | | | | 19,706 | |
| * | Includes cumulative appreciation/depreciation of futures contracts as reported in the Schedule of Investments and Net Assets section of the Statement of Assets and Liabilities. Only the current day’s variation margin is updated within the Assets/or Liabilities sections of the Statement of Assets and Liabilities. |
21
| | |
| Notes to Financial Statements | | December 31, 2010 |
| 5. | Fees and Compensation Paid to Affiliates |
GEAM, a registered investment adviser, was retained by the Company’s Board of Directors effective May 1, 1997 to act as investment adviser and administrator of the Fund. GEAM’s compensation for investment advisory and administrative services is paid monthly based on the average daily net assets of the Fund at an annualized rate of 0.35%.
Effective January 1, 2010, GEAM has entered into a contractual arrangement with the Company to limit the management fee charged to the Fund to 0.30% of the average daily net assets of the Fund. Unless terminated or amended, this agreement will continue in effect until April 30, 2011. The agreement may be changed or terminated with the approval of the Company’s Board of Directors and GEAM.
GEAM waives a portion of the Fund’s management fee in the amount equal to the management fee earned by GEAM with respect to the Fund’s investment in the GE Funds – GE Money Market Fund.
GENPACT performs certain accounting and certain administration services not provided by GEAM. For the period ending December 31, 2010, $3,697 was charged to the Fund.
Directors’ Compensation The Fund pays no compensation to its directors who are officers or employees of GEAM or its affiliates. Directors who are not such officers or employees also serve in a similar capacity for other funds advised by GEAM. Compensation paid to unaffiliated directors are reflected on the Statement of Operations. These fees are allocated pro rata across all of the mutual fund platforms and share classes served by the directors, including the Fund, and are based upon the relative net assets of each fund within such platforms.
Pursuant to an investment sub-advisory agreement with GEAM, SSgA Funds Management, Inc. (“SSgA”) is the Sub-Adviser to the S&P 500 Index Fund. SSgA is responsible for the day-to-day portfolio management of the assets of the Fund, including the responsibility for making decisions to buy, sell or hold a particular security, under the general supervision of GEAM and the Board.
For its services, GEAM pays SSgA monthly sub-advisory fees which are calculated as a percentage of the average daily net assets of the Fund.
| 7. | Investment Transactions |
Purchases and Sales of Securities The cost of purchases and the proceeds from sales of investments, other than short-term securities and options, for the year ended December 31, 2009 were as follows:
| | |
| Non-U.S. Government Securities |
| Purchases | | Sales |
| $7,967,470 | | $39,233,256 |
The Fund is subject to ASC 740, Income Taxes. ASC 740 provides guidance for financial accounting and reporting for the effects of income taxes that result from an entity’s activities during the year. ASC 740 also provides guidance regarding how certain tax positions should be recognized, measured, presented and disclosed in the financial statements. ASC 740 requires evaluation of tax positions taken or expected to be taken in the course of preparing the Fund’s tax returns to determine whether the tax positions are “more likely than not” of being sustained by the applicable tax authority. There are no adjustments to the Fund’s net assets required under ASC 740. The Fund’s 2007, 2008, 2009 and 2010 fiscal years tax returns are still open to examination by the Federal and applicable state tax authorities.
At December 31, 2010, information on the tax components of capital is as follows:
| | | | | | | | | | | | | | |
Cost on
Tax Basis | | Gross Unrealized Tax | | Net Tax Appreciation/(Depreciation) | | Undistributed
Income | | Undistributed
Accum.
Capital Loss | | Post October
Losses |
| | Appreciation | | Depreciation | | Investments | | Derivatives/Currency | | | |
| $200,620,997 | | $58,349,009 | | $(41,573,439) | | $16,775,570 | | $(283) | | $25,111 | | $(44,679,649) | | $— |
As of December 31, 2010, the Fund has capital loss carryovers, as indicated below. Capital loss carryovers are available to offset future realized capital gains to the extent provided in the Internal Revenue Code and regulations thereunder. To the extent that these carryover losses are used to offset future capital gains, it is probable that the gains so offset will not be distributed to shareholders because they would be taxable as ordinary income.
| | |
| Amount | | Expires |
| $21,852,323 | | 12/31/16 |
| 19,954,605 | | 12/31/17 |
| 2,872,721 | | 12/31/18 |
These amounts will be available to offset future taxable capital gains. Under the recently enacted Regulated Investment Company Modernization Act of 2010, the Fund
22
| | |
| Notes to Financial Statements | | December 31, 2010 |
will be permitted to carry forward capital losses incurred in taxable years beginning after December 22, 2010 for an unlimited period. However, any losses incurred during those future years will be required to be utilized prior to the losses incurred in pre-enactment tax years. As a result of this ordering rule, pre-enactment capital loss carryforwards may be more likely to expire unused. Additionally, post-enactment capital losses that are carried forward will retain their character as either short-term or long-term capital losses rather than being considered all short-term as under previous law.
During the year ended December 31, 2010, there were no capital loss carryover expirations.
Any net capital and currency losses incurred after October 31, within the Fund’s tax year, are deemed to arise on the first day of the Fund’s next tax year if the Fund so elects to defer such losses.
The Fund did not defer any post-October losses for the year ended December 31, 2010.
The tax composition of distributions paid during the years ended December 31, 2010 and December 31, 2009 were as follows:
| | | | | | | | | | | | |
| | | Ordinary
Income | | | Long-Term
Capital Gains | | | Total | |
2010 | | $ | 3,730,010 | | | $ | — | | | $ | 3,730,010 | |
2009 | | | 4,356,429 | | | | — | | | | 4,356,429 | |
Distributions to Shareholders The Fund declares and pays any dividends from net investment income annually. The Fund declares and pays any net realized capital gains in excess of capital loss carryforwards distributions annually. The character of income and gains to be distributed is determined in accordance with income tax regulations which may differ from generally accepted accounting principles. These differences include (but are not limited to) futures, investments organized as partnerships for tax purposes, distributions from Real Estate Investment Trusts (REITs), and losses deferred due to wash sale transactions. Reclassifications due to permanent book/tax differences are made to the Fund’s capital accounts to reflect income and gains available for distribution (or available capital loss carryovers) under income tax regulations. These reclassifications have no impact on net investment income, realized gains or losses, or the net asset value of the Fund. The calculation of net investment income per share in the Financial Highlights table excludes these adjustments.
The reclassifications for the year ended December 31, 2010 were as follows:
| | | | |
Undistributed
Net Investment Income | | Accumulated Net Realized Gain | | Paid In Capital |
| $(31,873) | | $31,508 | | $365 |
23
Report of Independent Registered Public Accounting Firm
The Shareholders and Board of Directors
GE Investments Funds, Inc.
We have audited the accompanying statement of assets and liabilities, including the schedule of investments, of the S&P 500 Index Fund, a series of GE Investments Funds, Inc., as of December 31, 2010, and the related statement of operations for the year then ended, statements of changes in net assets for each of the years in the two-year period then ended, and the financial highlights for each of the years in the five-year period then ended. These financial statements and financial highlights are the responsibility of the Fund’s management. Our responsibility is to express an opinion on these financial statements and financial highlights based on our audits.
We conducted our audits in accordance with the standards of the Public Company Accounting Oversight Board (United States). Those standards require that we plan and perform the audit to obtain reasonable assurance about whether the financial statements and financial highlights are free of material misstatement. An audit includes examining, on a test basis, evidence supporting the amounts and disclosures in the financial statements. Our procedures included confirmation of securities owned as of December 31, 2010 by correspondence with the custodian and brokers, or by other appropriate auditing procedures where replies from brokers were not received. An audit also includes assessing the accounting principles used and significant estimates made by management, as well as evaluating the overall financial statement presentation. We believe that our audits provide a reasonable basis for our opinion.
In our opinion, the financial statements and financial highlights referred to above present fairly, in all material respects, the financial position of the S&P 500 Index Fund as of December 31, 2010, the results of its operations, changes in its net assets and financial highlights for each of the years described above, in conformity with U.S. generally accepted accounting principles.

Boston, Massachusetts
February 25, 2011
24
| | |
| Advisory and Administrative Agreement Renewal | | (unaudited) |
The Board of Directors of the GE Investments Funds, Inc. (the “Board”), including the independent Board members, considered and all those that were present unanimously approved the continuance of the Fund’s Investment Advisory and Administration Agreement with GE Asset Management Incorporated (“GEAM”) and the Investment Sub-Advisory Agreement with the Fund’s sub-adviser, SSgA Funds Management, Inc. (“SSgA”), at meetings held on December 3 and December 10, 2010.
In considering whether to approve the Fund’s investment advisory and sub-advisory agreements, the Board members considered and discussed a substantial amount of information and analysis provided, at the Board’s request, by GEAM and SSgA. The Board members also considered detailed information regarding performance and expenses of other investment companies, including those with similar investment strategies and sizes, which was prepared by independent third party provider Morningstar, Inc. (“Morningstar”). The Board members reviewed the fees charged by GEAM for other mutual funds that employ a similar investment strategy as the Fund. The Board had the opportunity to ask questions and request additional information in connection with its considerations.
Before approving the Fund’s advisory and sub-advisory agreements, the Board members reviewed the information provided with management of GEAM and with independent legal counsel. The Board members also reviewed a memorandum prepared by independent legal counsel discussing the legal standards for the consideration of the proposed continuances. The independent Board members discussed the proposed continuances in detail during a private session with their independent legal counsel at which no representatives of GEAM or SSgA were present. The independent Board members and their independent legal counsel requested, and received and considered, additional information from GEAM following these sessions.
In advance of the meetings, and in response to their request, the Board members received from GEAM written responses to their inquiries, which included substantial exhibits and other materials related to GEAM’s business and the services it provides to the Fund. Also in advance of the meetings, the Board members received from SSgA a written response to a letter of inquiry prepared by GEAM at the Board’s request, which included substantial exhibits and other materials related to the business of, and services provided by, SSgA. The Board members took into account their multi-year experience as Board members and
particularly their consideration of these types of agreements in recent years. The information was presented in a manner to facilitate comparison to prior periods and to reflect certain enhancements. To focus their review, the Board members asked GEAM management and SSgA, in their oral presentations, to highlight material differences from the information presented in recent years.
During the meetings, the Board members had an opportunity to discuss this information with GEAM managers, including senior executives, representatives from the legal, compliance and finance departments, and investment personnel. The Board members also had an opportunity to hear presentations by representatives of SSgA. The Board members posed questions to these representatives and engaged in substantive discussions with them concerning each of their investment processes.
In reaching their determinations relating to continuance of the Fund’s investment advisory and sub-advisory agreements, the Board members considered all factors that they deemed relevant, including the factors discussed below. In their deliberations, the Board members did not identify any particular information that was all-important or controlling, and each Board member may have attributed different weights to the various factors. In particular, the Board members focused on the following:
The Nature, Extent And Quality Of Services Provided.
The Board members reviewed the services provided by GEAM and SSgA, taking into account their extensive past experiences with GEAM and SSgA. In connection with their consideration of GEAM’s services, the Board members focused on the favorable attributes of GEAM, including (i) an investment philosophy oriented toward long-term performance; (ii) effective processes used for overseeing sub-advisers; (iii)��effective processes used for providing Fund administration, including controllership and compliance functions and oversight of the performance of other companies that provide services to the Fund; (iv) highly skilled professionals including analysts, research professionals, traders and portfolio managers with a depth of experience relevant to the Fund; (v) access to significant technological resources from which the Fund may benefit; and (vi) a favorable history and reputation. The Board members noted that the Fund represents only a small portion of the assets managed by GEAM, but benefits from a full array of services and resources provided by GEAM.
25
| | |
| Advisory and Administrative Agreement Renewal | | (unaudited) |
In connection with their consideration of the services provided by SSgA, the Board members focused on SSgA’s favorable attributes, including its substantial experience managing funds of this type, investment philosophy and discipline, experienced investment and trading personnel, systems and other resources, and favorable history and reputation.
In light of the foregoing, the Board, including the independent Board members, concluded that the services provided by GEAM and SSgA continue to be satisfactory.
Investment Performance Of The Fund And The Sub-Adviser.
The Board members considered the investment performance of the Fund for various periods. The Board members reviewed detailed comparisons of the performance of the Fund with the relevant securities index and peer groupings of mutual funds prepared by Morningstar with respect to various periods. The Board members also engaged in detailed discussions with GEAM management and representatives of SSgA about each of their investment processes and performance results. These discussions focused on the Fund’s investment objective, the number and experience of portfolio management personnel, the passive investment style and approach employed, the likely market cycles for the investment style and the reasons for the Fund’s relative underperformance.
The Board, including the independent Board members, concluded that the Fund’s performance was acceptable overall taking into consideration the factors discussed above.
Cost Of The Services Provided And Profits Realized From The Relationship With The Fund.
The Board members considered the fees paid to GEAM by the Fund, as well as those paid to SSgA by GEAM, and the cost of the services provided by GEAM and SSgA to the Fund. The Board members reviewed the information they had requested from GEAM and SSgA concerning their profitability. The Board members considered the profit margin information for GEAM’s investment company business as a whole, as well as GEAM’s profitability data for the Fund. In this regard, the Board members considered that GEAM has agreed to waive a portion of the fee it charges to the Fund to the extent necessary to maintain a management fee of 0.30% of average daily net assets until April 30, 2011, at which time GEAM intends to continue to extend the waiver for an additional one year period. The
Board members reviewed GEAM’s assumptions and the methods of cost allocation used by GEAM in preparing Fund-specific profitability data. The Board members also discussed with GEAM the basis for its belief that the methods of allocation used were reasonable for each area of its business. The Board members also reviewed the assumptions and cost allocation methods used by SSgA in preparing its profitability data.
Information was presented regarding the financial condition of GEAM and SSgA for various past periods. The Board members noted and discussed the additional services provided by GEAM to the Fund compared to other investment products managed by GEAM, and noted the fact that GEAM, and not the Fund, pays the sub-advisory fees to SSgA. The Board members previously had been provided a study conducted by the Investment Company Institute that discusses and compares advisory fees and services for mutual funds and institutional separate accounts. The Board members determined that GEAM and SSgA should be entitled to earn a reasonable level of profits for the services they provide to the Fund. The Board members also recognized that GEAM had made significant investments in its business and had not fully recovered the sums invested. The Board also considered that GEAM continues to make a substantial investment in fulfilling its obligations to the Fund and supporting its Fund-related activities.
Based on their review, the Board, including the independent Board members, concluded that they were satisfied that the level of profitability achieved by GEAM and SSgA from their relationship with the Fund was not unreasonable or excessive.
The Extent To Which Economies Of Scale Would Be Realized As The Fund Grows And Whether Fee Levels Would Reflect Such Economies Of Scale.
Although the Board noted that the Fund did not experience significant growth in assets over the past year, the Board members considered the extent to which economies of scale would be realized as the Fund grows, and whether fee levels reflect these economies of scale for the benefit of Fund investors.
The Board members considered the substantial infrastructure investments that GEAM has made with respect to its operations and its commitment to continue investing resources to enhance services to Fund shareholders. The Board members recognized the benefits
26
| | |
| Advisory and Administrative Agreement Renewal | | (unaudited) |
to the Fund of GEAM’s past investment in its operations through the expenditure of sums to support its substantial infrastructure, and that, with respect to all GEAM managed mutual funds, GEAM has not yet fully recouped that investment. The Board members also recognized the benefits to the Fund of being able to leverage a favorable cost structure achieved with respect to the Fund’s other operating expenses as a result of GEAM’s large overall base of assets under management and its vendor management practices.
Comparison Of Services To Be Rendered And Fees To Be Paid.
The Board members discussed the services provided to the Fund by GEAM and SSgA, and the fees charged for those services. The Board members reviewed information concerning the fee and expense ratios for the Fund, and comparative information with respect to peer groupings of mutual funds prepared by Morningstar. They discussed that the Fund’s figures were within the applicable peer group ranges, noting the effect of the management fee waiver discussed above. The Board members also reviewed comparative fee information with respect to any comparable mutual fund or other client accounts
managed by SSgA. The Board, including the independent Board members, concluded that, based on this information, the advisory and sub-advisory fees were reasonable in relation to the services provided to the Fund.
Fall-Out Benefits.
The Board members considered other actual and potential financial benefits that GEAM and SSgA may derive from their respective relationships with the Fund, including, to the extent applicable, soft dollar commission benefits generated through Fund portfolio transactions. The Board members noted, however, that the Fund benefits from the vast array of resources available through GEAM, and that the Fund represents only a small portion of the assets managed by GEAM.
Conclusion.
No single factor was determinative to the Board’s decision. Based on their discussion and such other matters as were deemed relevant, the Board, including the independent Board members, concluded that renewal of the advisory and sub-advisory agreements were in the best interests of the Fund and its shareholders.
27
| | |
| Additional Information | | (unaudited) |
Information about Directors and Executive Officers:
The business and affairs of the Company are managed under the direction of the Company’s Board of Directors. Information pertaining to the Directors and officers of the Company is set forth below.
Interested Directors and Executive Officers
Michael J. Cosgrove
Address c/o GEAM 3001 Summer St. Stamford, CT 06905
Age 61
Position(s) Held with Fund Chairman of the Board and President
Term of Office and Length of Time Served Until successor is elected and qualified – 14 years
Principal Occupation(s) During Past 5 years President and Chief Executive Officer – Mutual Funds and Intermediary Business since March 2007; Executive Vice President of GEAM from February 1997 to March 2007; Director of GEAM since 1988; Vice President, GE Capital Corporation, an indirect wholly-owned subsidiary of GE, since December 1999; Executive Vice President – Sales and Marketing of GEAM, a wholly-owned subsidiary of GE that is registered as an investment adviser under the Investment Advisers Act of 1940, as amended, from March 1993 to March 2007.
Number of Portfolios in Fund Complex Overseen by Director 49
Other Directorships Held by Director Chairman of the Board and President of GE Funds from 1993 to February 2011, and GE Institutional Funds since its inception; Trustee of General Electric Savings & Security Trust, General Electric S&S Income Fund, General Electric S&S Program Mutual Fund (“GE Savings & Security Funds”), Elfun Funds, General Electric Insurance Plan Trust, General Relief Loan Fund, and General Electric Pension Trust since 1988; Trustee of Fordham University since 2002; Trustee of GE Volunteers since 1993; Director, GE Asset Management (Ireland) since February 1999; Director, GE Asset Management Funds Plc., GE Asset Canada Company, and GE Asset Management Limited since 1998.
Matthew J. Simpson
Address c/o GEAM 3001 Summer St. Stamford, CT 06905
Age 49
Position(s) Held with Fund Director and Executive Vice President
Term of Office and Length of Time Served Until successor is elected and qualified – 3 years
Principal Occupation(s) During Past 5 years Executive Vice President, General Counsel and Secretary of GEAM since July 2007; Senior Vice President and General Counsel – Marketing and Client Services (formerly Asset Management Services), at GEAM and Senior Vice President and General Counsel of GEAMS from February 1997 to June 2007; Vice President and Associate General Counsel of GEAM from October 1992 to February 1997; Vice President of GE Funds, GE Institutional Funds and GE LifeStyle Funds from September 2003 to June 2007; Secretary of GE Funds and GE Institutional Funds from 1997 to June 2007; Vice President of Elfun Funds and GE Savings & Security Funds from October 2003 to June 2007; Assistant Secretary of Elfun Funds and GE Savings & Security Funds from 1998 to June 2007.
Number of Portfolios in Fund Complex Overseen by Director 49
Other Directorships Held by Director Trustee of GE Institutional Funds, Elfun Funds and GE Savings & Security Funds since July 2007. Trustee of GE Funds from July 2007 to February 2011.
28
| | |
| Additional Information | | (unaudited) |
Joon Won Choe
Address c/o GEAM 3001 Summer St. Stamford, CT 06905
Age 41
Position(s) Held with Fund Vice President & Secretary
Term of Office and Length of Time Served Until successor is elected and qualified – Vice President and Secretary – less than 1 year
Principal Occupation(s) During Past 5 years Senior Vice President and Associate General Counsel at GEAM since June 2010; Vice President and Associate General Counsel at GEAM from November 2005 to June 2010; Vice President and Secretary of GE Funds from September 2010 to February 2011. Vice President and Secretary of GE Institutional Funds and GE Investments Funds, Inc. since September 2010; Vice President and Assistant Secretary of Elfun Funds and GE Savings & Security Funds since September 2010.
Number of Portfolios in Fund Complex Overseen by Officer N/A
Other Directorships Held by Officer N/A
Robert Herlihy
Address c/o GEAM 3001 Summer St. Stamford, CT 06905
Age 43
Position(s) Held with Fund Senior Vice President and Chief Compliance Officer
Term of Office and Length of Time Served Until successor is elected and qualified — 5 years
Principal Occupation(s) During Past 5 years Chief Compliance Officer of GEAM, GE Institutional Funds, Elfun Funds, and GE Savings and Security Funds since July 2005; Chief Compliance Officer of GE Funds from July 2005 to February 2011; Manager of Fund Administration at GEAM from 2002 – 2005.
Number of Portfolios in Fund Complex Overseen by Officer N/A
Other Directorships Held by Officer N/A
Eunice Tsang
Address c/o GEAM 3001 Summer St. Stamford, CT 06905
Age 51
Position(s) Held with Fund Treasurer
Term of Office and Length of Time Served Until successor is elected and qualified – less than one year
Principal Occupations(s) During Past 5 years Treasurer of GE Institutional Funds, Elfun Funds and GE Savings and Security Funds since January 2010; Treasurer of GE Funds from January 2010 to February 2011; GEAM Operational Controllership and Technical Accounting Manager since December 2007; Financial Planning & Analysis Manager – Performance Leader from June 2005 to December 2007; GEAM Quality Black Belt from 2001 to June 2005; Financial Planning & Analysis Manager from 2000 to 2001; and Mutual Fund Assistant Controller from October 1997 to 2000.
Number of Portfolios in Fund Complex Overseen by Officer N/A
Other Directorships Held by Officer N/A
29
| | |
| Additional Information | | (unaudited) |
Non-Interested Directors
John R. Costantino
Address c/o GEAM 3001 Summer St. Stamford, CT 06905
Age 64
Position(s) Held with Fund Director
Term of Office and Length of Time Served Until successor is elected and qualified – 14 years
Principal Occupation(s) During Past 5 years General Partner, NGN Capital LLC since 2006; Managing Director, Vice President of Walden Capital Management since 1996.
Number of Portfolios in Fund Complex Overseen by Director 41
Other Directorships Held by Director Trustee of GE Funds since 1993, GE Institutional Funds since its inception; Trustee of Fordham University from 1989 to 1995 and 2001 to 2007 and Trustee Emeritus since 2007; Trustee of Neuro Science Research Institute since 1986; Trustee of Gregorian University Foundation from 1992 to 2007; Director of Artes Medical from 2006 to 2008.
William J. Lucas
Address c/o GEAM 3001 Summer St. Stamford, CT 06905
Age 61
Position(s) Held with Fund Director
Term of Office and Length of Time Served Until successor is elected and qualified – 13 years (No longer serves as Trustee effective November 4, 2010)
Principal Occupation(s) During Past 5 years Retired since 2010, previously Vice President and Treasurer of Fairfield University since 1983.
Number of Portfolios in Fund Complex Overseen by Director 41
Other Directorships Held by Director Trustee of GE Funds since 1993, and GE Institutional Funds since its inception.
Robert P. Quinn
Address c/o GEAM 3001 Summer St. Stamford, CT 06905
Age 74
Position(s) Held with Fund Director
Term of Office and Length of Time Served Until successor is elected and qualified – 14 years
Principal Occupation(s) During Past 5 years Retired since 1983 from Salomon Brothers Inc.
Number of Portfolios in Fund Complex Overseen by Director 41
Other Directorships Held by Director Trustee of GE Funds since 1993, and GE Institutional Funds since its inception; Trustee, St. Francis Hospital Corp. since 1980.
The Statement of Additional Information for the Fund includes additional information about the Directors and Officers and is available, without charge, upon request by calling 1-800-493-3042.
30
Investment Team
Investment Adviser and Administrator
GE Asset Management Incorporated
Board of Directors
Michael J. Cosgrove, Chairman
John R. Costantino
William J. Lucas*
Robert P. Quinn
Matthew J. Simpson
Secretary
Joon Won Choe
Assistant Secretary
Michelle Matzelle
Treasurer
Eunice Tsang
Assistant Treasurers
Tatyana Begun**
Casey Yantosca
Distributor
GE Investment Distributors, Inc.
Member FINRA and SIPC
Counsel
Sutherland, Asbill & Brennan, LLP
Custodian
State Street Bank & Trust Company
Independent Registered Public Accounting Firm
KPMG LLP
Officers of the Investment Adviser
James W. Ireland, President and Chief Executive Officer
Cheryl H. Beacock, Senior Vice President, Human Resources
Paul M. Colonna, President and Chief Investment Officer – Fixed Income Investments
Michael J. Cosgrove, President and Chief Executive
Officer – Mutual Funds & Intermediary Business
Ralph R. Layman, President and Chief Investment Officer – Public Equity Investments
Maureen B. Mitchell, President – Institutional Sales and Marketing
Steve Rullo, Chief Information Officer (since February 2011)
Matthew J. Simpson, Executive Vice President, General Counsel and Secretary
Don W. Torey, President – Alternative Investments
John J. Walker, Executive Vice President, Chief Operating Officer
David Wiederecht, President and Chief Investment Officer – Investment Strategies
Tracie Winbigler, Executive Vice President, Chief Financial Officer***
| * | As of November 4, 2010, Mr. Lucas no longer served as a director of the Company. |
| ** | As of February 18, 2011, Ms. Begun no longer served as an officer of the Company. |
| *** | Effective January, 2011. |
31
Investment Adviser
GE Asset Management Incorporated
3001 Summer Street
PO Box 7900
Stamford, CT 06904-7900
Distributor
GE Investment Distributors, Inc.
member FINRA and SIPC
3001 Summer Street
PO Box 7900
Stamford, CT 06904-7900
The Fund files its complete schedule of portfolio holdings with the Securities and Exchange Commission for the first and third quarters of each fiscal year on Form N-Q. The Fund’s Forms N-Q, as well as a description of the policies and procedures that the Fund uses to determine how to vote proxies (if any) relating to portfolio securities is available without charge (i) upon request, by calling 1-800-493-3042; (ii) on the Fund’s website at http://www.geam.com; and (iii) on the Commission’s website at http://www.sec.gov. The Fund’s Forms N-Q may be reviewed and copied at the Commission’s Public Reference Room in Washington, DC—information on the operation of the Public Reference Room may be obtained by calling 1-800-SEC-0330.
Information (if any) regarding how the Fund voted proxies relating to portfolio securities during the most recently disclosed 12-month period ended June 30 is available without charge (i) through the Fund’s website at http://www.geam.com; and (ii) on the Commission’s website at http://www.sec.gov.

GE Investments Funds, Inc.
Premier Growth Equity Fund
Annual Report
December 31, 2010

GE Investments Funds, Inc.
| | |
| |
| Premier Growth Equity Fund | | Contents |
This report is prepared for Policyholders of certain variable contracts and may be distributed to others only if preceded or accompanied by the variable contract’s current prospectus and the current prospectus of the Fund available for investments thereunder.
| | |
| Notes to Performance | | December 31, 2010 (unaudited) |
The information on the following performance pages relates to the GE Investments Premier Growth Equity Fund (the “Fund”).
Total returns take into account changes in share price and assume reinvestment of dividends and capital gains distributions, if any. Total returns shown are net of Fund fees and expenses but do not reflect fees and charges associated with the variable contracts such as administrative fees, account charges and surrender charges, which, if reflected, would reduce the Fund’s total returns for all periods shown.
The performance data quoted represent past performance; past performance does not guarantee future results. Investment return and principal value will fluctuate so your shares, when redeemed, may be worth more or less than their original cost. Current performance may be higher or lower than the performance data quoted. Periods less than one year are not annualized. Please call 800-493-3042 or visit the Fund’s website at http://www.geam.com for the most recent month-end performance data.
An investment in the Fund is not a deposit of any bank and is not insured or guaranteed by the Federal Deposit Insurance Corporation (FDIC) or any other government agency. An investment in the Fund is subject to risk, including possible loss of principal invested.
The S&P 500® Index is an unmanaged market capitalization-weighted index of stocks of 500 large U.S. companies, which is widely used as a measure of large-cap
stock market performance. The results shown for the foregoing index assume the reinvestment of net dividends or interest. They do not reflect the actual cost of investing in the instruments that comprise the index.
The Russell 1000 Growth Index measures the performance of the large-cap growth segment of the U.S. equity universe. It includes those Russell 1000 companies with higher price-to-book ratios and higher forecasted growth values.
The peer universe of the underlying annuity funds used for the peer group average annual total return calculation is based on a blend of Morningstar peer categories, as shown. Morningstar is an independent mutual fund rating service. A Fund’s performance may be compared to or ranked within a universe of mutual funds with investment objectives and policies similar but not necessarily identical to that of the Fund.
©2010 Morningstar, Inc. All Rights Reserved. The Morningstar information contained herein: (1) is proprietary to Morningstar and/or its content providers; (2) may not be copied or distributed; and (3) is no warranted to be accurate, complete or timely. Neither Morningstar nor its content providers are responsible for any damage or losses relating from any use of this information. Past performance is no guarantee or future results.
GE Investment Distributors, Inc., Member of FINRA & SIPC, is the principal underwriter and distributor of the GE Investments Funds, Inc. and a wholly owned subsidiary of GE Asset Management Incorporated, the investment adviser of the Fund.
1
| | |
| Premier Growth Equity Fund | | (unaudited) |

David B. Carlson is Chief Investment Officer — U.S. Equities at GE Asset Management. He manages the overall U.S. equity investments for GE Asset Management. Mr. Carlson is portfolio manager for the Premier Growth Equity Fund and has served in that capacity since the Fund’s commencement. Mr. Carlson joined GE Asset Management in 1982 as a securities analyst for investment operations. He became a Vice President for Mutual Fund Portfolios in 1987, a Senior Vice President in 1989.
| Q. | How did the Premier Growth Equity Fund perform compared to its benchmarks and Morningstar peer group for the twelve-month period ended December 31, 2010? |
| A. | For the twelve-month period ended December 31, 2010, the Premier Growth Equity Fund returned 11.61% for Class 1 shares and 11.10% for Class 4 shares. The S&P 500 Index and Russell 1000 Growth Index, the Fund’s benchmarks, returned 15.06% and 16.71% respectively, and the Fund’s Morningstar peer group of 414 U.S. Insurance Large Growth funds returned on average of 16.46% for the same period. |
| Q. | What market conditions impacted the Fund performance? |
| A. | 2010’s 15% advance did not feel like an easy climb for the S&P 500, amid ongoing debate around the durability of the economic expansion. Indeed, all U.S. equity indices were in negative territory at mid-year and over much of the summer, beset by concerns about the European debt crisis, persistently high unemployment levels and skyrocketing government debt. However, reassurances that the Fed would purchase additional treasury bonds in a $600B “quantitative easing-2” program ignited a mighty second-half rally. In this environment, cyclical sectors generally outperformed, while defensive sectors lagged. For the year, the S&P 500 consumer discretionary, industrials, materials and energy sectors each advanced over 20%, while health care, utilities and IT lagged. |
| | 2010 was a challenging investment environment for large cap, high quality |
| | investors. Small and mid-cap companies led — typical in the early innings of economic recovery. Smaller companies also benefitted from increased M&A activity as larger companies looked to spend excess balance sheet cash on strategic acquisitions. Low quality also outperformed high quality, with an approximately 22% increase in S&P 500 C-rated companies, while the high-quality A-rated companies rose only 15%. We generally prefer to invest in high quality companies, and acknowledge that relative performance may be challenged in the early stages of an economic recovery, when higher-risk (i.e., lower quality) companies get re-rated. We continue to believe that higher quality companies can make the best long-term investments, and a diversified portfolio of high quality large caps has the potential to outperform over a full market cycle. |
| | Amid the year’s uncertainties, correlations of performance among S&P 500 stocks reached levels unseen since the Great Depression. It was difficult for the active manager to differentiate as top-down factors moved the markets, with fundamentals largely ignored. For example, Microsoft achieved and raised earnings estimates throughout the year, yet the stock lagged. This seeming disconnect between fundamentals, valuations and performance created a source of frustration for many large-cap active managers. |
| Q. | What were the primary drivers of Fund performance? |
| A. | After outperforming the benchmarks in 2009, the portfolio lagged in 2010 due primarily to stock selections in materials, health care, energy and technology. Weakness in Monsanto (-13%) resulted from a flood of cheap Chinese herbicide generics driving prices down for Round-Up, Monsanto’s herbicide product. We continued to own Monsanto at year end for its higher-growth genetically modified seeds and traits business which has historically been a more significant earnings driver. |
2

| | Health care was a difficult sector in the past year, as many consumers cut back on their health care spending. For example, VCA Antech
(-7%) and Medtronic (-16%) weighed on returns as they performed fewer animal health and cardiac procedures, respectively. Amgen (-3%) and Gilead (16%) both underperformed smaller biotech companies that enjoyed takeout premiums. We maintained our conviction in both stocks, and believed there is potential for Amgen’s new bone-building therapy expected to be launched within the next six months. |
| | Transocean (-13%) drove most of the weakness in energy following the Gulf oil spill; we eliminated the holding in light of the change in risk profile. Within technology, Research in Motion (-14%) struggled with share losses in the U.S. although we held it primarily for its global handset growth potential. An overhang of financial reform legislation pressured Visa (-19%) as debit transaction fees came under scrutiny. We believed that Visa’s profitability wouldn’t be as heavily impacted as the selloff indicated. Therefore we added modestly to Visa on weakness. Finally, Western Union (-.05%) weighed on returns, although the stock was acting much better by the end of the year on a management change and pick-up in fundamentals. |
| | During a tough year, a number of our individual holdings performed well, including Baidu which more than doubled as it gained share and ad spending accelerated in China. Software maker Intuit (+60%) was another winner in the technology sector. The Fund’s overweight in consumer discretionary also bolstered returns, and our media holdings, including DirecTV (+20%) and Liberty Global (+55%) added to performance. Within industrials, Dover (+51%) rose as the economic recovery took hold. This diversified industrial is the parent to more than 30 companies that make products from hearing-aid parts to gasoline nozzles. Other companies that outperformed in the early innings of the recovery included CB Richard Ellis (+51%), Schlumberger (+30%) and cruising company, Carnival (+47%). |
| Q. | Were there any significant changes to the Fund during the period? |
| A. | There were no significant changes during the year. The Fund remained positioned for a slow-economic growth environment, as we continued to employ our |
| | bottom-up process of seeking high quality stocks that we believe can generate double-digit earnings growth. We ended the period with 34 stocks in the Fund, consistent with our history. The largest sector weighting remained technology at approximately 34% of the Fund — as we continued to like the financial conditions, global business models and valuations of many leading tech companies. The largest sector weightings after technology remained consumer discretionary, health care and financials. |
| | In terms of portfolio activity, we initiated a switch within technology, beginning a position in Apple and eliminating Molex and Corning. We also eliminated our position in Transocean before absorbing the full extent of the deepwater driller’s fall following the BP accident. Although we do not believe Transocean was responsible for the disaster, they leased the rig to BP. At year-end oil services company, Schlumberger (+30%) was the Fund’s largest holding. Within health care, we eliminated Medtronic and initiated a position in Covidien, a health care equipment and supplies company that we believe may be facing fewer headwinds. We maintained our underweight in pharmaceutical companies and our overweight in biotech companies, preferring biotech’s innovative pipelines. |
| | On the margin, we modestly decreased our exposure to energy (with the eliminations of Transocean and Southwestern Energy) and consumer discretionary (taking profits in Bed Bath & Beyond and Liberty Global), and added to our holdings within healthcare, financials and technology, driven by what we believe were compelling valuations (e.g., adding to positions in Express Scripts, Goldman Sachs, CME, Microsoft, Visa, Western Union and Research in Motion). The Fund continues to focus on high-quality companies, with above-average earnings growth, trading at attractive valuations. |
3
Premier Growth Equity Fund
(unaudited)
Understanding Your Fund’s Expenses
As a shareholder of the Fund you incur transaction and ongoing expenses. Transaction expenses including sales charges on purchases payments, reinvested dividends (or other distributions), and redemption fees directly reduce the investment return of the Fund. Ongoing costs include portfolio management fees, distribution and services fees, professional fees, administrative fees and other Fund expenses. The following example is intended to help you understand your ongoing costs (in dollars) of investing in the Fund and to compare these costs with the ongoing costs of investing in other mutual funds.
To illustrate these ongoing costs, we have provided an example and calculated the expenses paid by investors during the period. The information in the following table is based on an investment of $1,000, which is invested at the beginning of the period and held for the entire six-month period ended December 31, 2010.
Actual Expenses
The first section of the table provides information about actual account values and actual expenses. You may use the information in this section, together with the amount you invested, to estimate the expenses that you paid
over the period. To do so, simply divide your account value by $1,000 (for example, an $8,600 account value divided by $1,000 = 8.6), then multiply the result by the number given for your class under the heading “Expenses paid during period.”
Hypothetical Example for Comparison Purposes
The second section of the table provides information about hypothetical account values and hypothetical expenses based on the Fund’s actual expense ratio and an assumed rate of return of 5% per year before expenses, which is not the Fund’s actual return. You may use this information to compare the ongoing costs of investing in the Fund and other funds. To do so, compare this 5% hypothetical example with the 5% hypothetical examples that appear in the shareholders reports of other funds.
Please note that the expenses shown in the table for both “Actual” and “Hypothetical” do not reflect any transaction costs, such as sales charges or redemption fees. Additionally, the expenses shown do not reflect the fees or charges associated with variable contracts through which shares of the Fund are offered.
July 1, 2010 – December 31, 2010
| | | | | | | | | | | | |
| | | Account value at the
beginning of the period ($) | | | Account value at the
end of the period ($) | | | Expenses paid
during the period ($)* | |
Actual Fund Return** | | | | | | | | | |
Class 1 | | | 1,000.00 | | | | 1,222.53 | | | | 4.26 | |
Class 4 | | | 1,000.00 | | | | 1,219.74 | | | | 6.66 | |
Hypothetical 5% Return (2.5% for the period) | |
Class 1 | | | 1,000.00 | | | | 1,021.15 | | | | 3.87 | |
Class 4 | | | 1,000.00 | | | | 1,019.03 | | | | 6.06 | |
| * | | Expenses are equal to the Fund’s annualized expense ratio of 0.76% for Class 1 shares and 1.19% for Class 4 shares (for the period July 1, 2010—December 31, 2010), multiplied by the average account value over the period, multiplied by 184/365 (to reflect the one-half year period). |
| ** | | Actual Fund Returns for the six-month period ended December 31, 2010 were as follows: 22.25% for Class 1 shares, and 21.97% for Class 4 shares. Past performance does not guarantee future returns. |
4
| | |
| Premier Growth Equity Fund | | (unaudited) |
Investment Profile
A Mutual Fund designed for investors who seek long-term growth of capital and future income rather than current income by investing at least 80% of its net assets in common and preferred stocks and other types of Equity Securities. The Fund invests primarily in a limited number large-and medium-sized companies (market capitalization of $1 billion or more) that the portfolio manager believes have above-average growth potential.
Morningstar Performance Comparison
Based on average annual returns for periods ended 12/31/10
| | | | | | | | | | | | | | | | |
| | | | | | One
Year | | | Five
Year | | | Ten
Year | |
Number of Funds in peer group: | | | | | | | 414 | | | | 361 | | | | 288 | |
Peer group average annual total return: | | | | | | | 16.4 | 6% | | | 2.63 | % | | | 0.20 | % |
Morningstar category in peer group: U.S. Insurance Large Growth | | | | | | | | | | | | | | | | |
Sector Allocation
as a % of Fair Value of $45,408 (in thousands) on December 31, 2010 (b) (c)
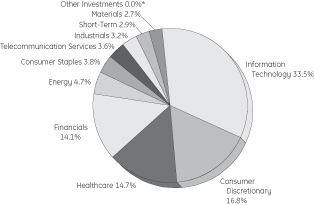
Top Ten Largest Holdings
as of December 31, 2010 (as a % of Fair Value) (b) (c)
| | | | |
Schlumberger Ltd. | | | 4.73% | |
QUALCOMM Inc. | | | 4.54% | |
Express Scripts Inc. | | | 4.29% | |
The Western Union Co. | | | 4.21% | |
CME Group Inc. | | | 4.16% | |
PepsiCo Inc. | | | 3.85% | |
DIRECTV | | | 3.68% | |
Apple Inc. | | | 3.58% | |
American Tower Corp. | | | 3.57% | |
Amgen Inc. | | | 3.42% | |
Change in Value of a $10,000 Investment
Class 1 Shares
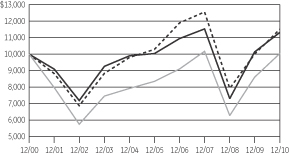
Average Annual Total Return
for the Periods Ended December 31, 2010
Class 1 Shares (Inception date: 12/12/97)
| | | | | | | | | | | | | | | | |
| | | One
Year | | | Five
Year | | | Ten Year | | | Ending value of a
$10,000 investment (a) | |
Premier Growth Equity Fund | | | 11.61% | | | | 2.42% | | | | 1.23% | | | $ | 11,303 | |
S&P 500 Index | | | 15.06% | | | | 2.29% | | | | 1.41% | | | $ | 11,508 | |
Russell 1000 Growth Index | | | 16.71% | | | | 3.76% | | | | 0.02% | | | $ | 10,024 | |
Change in Value of a $10,000 Investment
Class 4 Shares
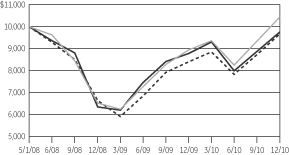
Average Annual Total Returns
for the Periods Ended December 31, 2010
Class 4 Shares (Inception date: 5/1/08)
| | | | | | | | | | | | | | | | |
| | | | | | One
Year | | | Since
Inception | | | Ending value of a
$10,000 investment (a) | |
Premier Growth Equity Fund | | | | | | | 11.10% | | | | -0.96% | | | $ | 9,746 | |
S&P 500 Index | | | | | | | 15.06% | | | | -1.31% | | | $ | 9,654 | |
Russell 1000 Growth Index | | | | | | | 16.71% | | | | 1.58% | | | $ | 10,427 | |
| (a) | Ending value of a $10,000 investment for the ten-year period or since inception, whichever is less. |
| (b) | The securities information regarding holdings, allocations and other characteristics is presented to illustrate examples of securities that the Fund has bought and the diversity of areas in which the Fund may invest as of a particular date. It may not be representative of the Fund’s current or future investments and should not be construed as a recommendation to purchase or sell a particular security. |
| (c) | Fair value basis is inclusive of Short Term Investment in GE Money Market Fund. |
See Notes to Performance on page 1 for further information, including an explanation of Morningstar peer categories.
Past performance does not predict future performance and the graph and table do not reflect the deduction of taxes that a shareholder would pay on Fund distributions or the redemption of Fund shares and do not reflect the fees or charges that would be associated with variable contracts through which shares of the Fund are offered.
5
Premier Growth Equity Fund
| | |
| Schedule of Investments | | December 31, 2010 |
Premier Growth Equity Fund
| | | | | | | | | | |
| | | |
| | | Number
of Shares | | | Fair Value | | | |
Common Stock — 97.4% † | | | | | | | | | | |
|
Application Software — 1.4% |
| | | |
Intuit Inc. | | | 13,383 | | | $ | 659,782 | | | (a,d) |
|
Asset Management & Custody Banks — 3.1% |
| | | |
State Street Corp. | | | 30,368 | | | | 1,407,253 | | | (c) |
|
Biotechnology — 4.9% |
| | | |
Amgen Inc. | | | 28,309 | | | | 1,554,164 | | | (a) |
Gilead Sciences Inc. | | | 18,529 | | | | 671,491 | | | (a) |
| | | | | | | 2,225,655 | | | |
|
Cable & Satellite — 8.4% |
| | | |
Comcast Corp. | | | 28,824 | | | | 599,827 | | | |
DIRECTV | | | 41,897 | | | | 1,672,947 | | | (a) |
Liberty Global Inc. | | | 44,779 | | | | 1,517,560 | | | (a) |
| | | | | | | 3,790,334 | | | |
|
Communications Equipment — 8.1% |
| | | |
Cisco Systems Inc. | | | 53,015 | | | | 1,072,493 | | | (a,d) |
QUALCOMM Inc. | | | 41,691 | | | | 2,063,288 | | | |
Research In Motion Ltd. | | | 9,058 | | | | 526,542 | | | (a) |
| | | | | | | 3,662,323 | | | |
|
Computer Hardware — 3.6% |
| | | |
Apple Inc. | | | 5,039 | | | | 1,625,380 | | | (a) |
|
Data Processing & Outsourced Services — 9.6% |
| | | |
Paychex Inc. | | | 31,912 | | | | 986,400 | | | |
The Western Union Co. | | | 102,941 | | | | 1,911,614 | | | |
Visa Inc. | | | 20,794 | | | | 1,463,482 | | | |
| | | | | | | 4,361,496 | | | |
|
Diversified Support Services — 2.3% |
| | | |
Iron Mountain Inc. | | | 41,691 | | | | 1,042,692 | | | |
|
Fertilizers & Agricultural Chemicals — 2.7% |
| | | |
Monsanto Co. | | | 17,294 | | | | 1,204,354 | | | |
|
Healthcare Equipment — 2.9% |
| | | |
Covidien PLC | | | 28,834 | | | | 1,316,560 | | | |
|
Healthcare Facilities — 1.1% |
| | | |
VCA Antech Inc. | | | 21,618 | | | | 503,483 | | | (a) |
|
Healthcare Services — 5.8% |
| | | |
Express Scripts Inc. | | | 36,029 | | | | 1,947,367 | | | (a) |
Lincare Holdings Inc. | | | 25,735 | | | | 690,470 | | | |
| | | | | | | 2,637,837 | | | |
| | | | | | | | | | |
| | | |
| | | Number
of Shares | | | Fair Value | | | |
|
Home Improvement Retail — 2.9% |
| | | |
Lowe’s companies Inc. | | | 51,471 | | | $ | 1,290,893 | | | |
|
Home Furnishing Retail — 3.3% |
| | | |
Bed Bath & Beyond Inc. | | | 30,882 | | | | 1,517,850 | | | (a) |
|
Hotels, Resorts & Cruise Lines — 2.3% |
| | | |
Carnival Corp. | | | 22,132 | | | | 1,020,507 | | | |
|
Industrial Machinery — 3.2% |
| | | |
Dover Corp. | | | 24,706 | | | | 1,444,066 | | | |
|
Internet Software & Services — 5.5% |
| | | |
Baidu Inc. ADR | | | 12,090 | | | | 1,167,048 | | | (a) |
eBay Inc. | | | 47,353 | | | | 1,317,834 | | | (a) |
| | | | | | | 2,484,882 | | | |
|
Investment Banking & Brokerage — 3.3% |
| | | |
The Goldman Sachs Group Inc. | | | 8,956 | | | | 1,506,041 | | | |
|
Life & Health Insurance — 1.4% |
| | | |
Aflac Inc. | | | 11,118 | | | | 627,389 | | | |
|
Oil & Gas Equipment & Services — 4.7% |
| | | |
Schlumberger Ltd. | | | 25,735 | | | | 2,148,873 | | | |
|
Real Estate Services — 2.1% |
| | | |
CB Richard Ellis Group Inc. (REIT) | | | 47,044 | | | | 963,461 | | | (a) |
|
Soft Drinks — 3.9% |
| | | |
PepsiCo Inc. | | | 26,765 | | | | 1,748,557 | | | |
|
Specialized Finance — 4.2% |
| | | |
CME Group Inc. | | | 5,868 | | | | 1,888,029 | | | |
|
Systems Software — 3.1% |
| | | |
Microsoft Corp. | | | 49,927 | | | | 1,393,962 | | | (d) |
|
Wireless Telecommunication Services — 3.6% |
| | | |
American Tower Corp. | | | 31,397 | | | | 1,621,341 | | | (a) |
| | | |
Total Common Stock
(Cost $37,046,468) | | | | | | | 44,093,000 | | | |
Other Investments — 0.0%* |
GEI Investment Fund
(Cost $3,072) | | | | | | | 2,918 | | | (e) |
| | | |
Total Investments in Securities
(Cost $37,049,540) | | | | | | | 44,095,918 | | | |
See Notes to Schedule of Investments and Notes to Financial Statements.
6
Premier Growth Equity Fund
| | |
| Schedule of Investments | | December 31, 2010 |
| | | | | | | | | | |
| | | |
| | | | | | Fair Value | | | |
Short-Term Investments — 2.9% | | | | | | | |
GE Money Market Fund Institutional
Class 0.00%
(Cost $1,312,499) | | | | | | $ | 1,312,499 | | | (b,e) |
| | | |
Total Investments
(Cost $38,362,039) | | | | | | | 45,408,417 | | | |
| | | |
Liabilities in Excess of Other Assets, net — (0.3)% | | | | | | | (119,159 | ) | | |
| | | | | | | | | | |
NET ASSETS — 100.0% | | | | | | $ | 45,289,258 | | | |
| | | | | | | | | | |
See Notes to Schedule of Investments and Notes to Financial Statements.
7
| | |
| Notes to Schedule of Investments | | December 31, 2010 |
The views expressed in this document reflect our judgment as of the publication date and are subject to change at any time without notice. The securities information regarding holdings, allocations and other characteristics are presented as of a particular date to illustrate examples of securities that the Fund has bought and the diversity of areas in which the Fund may invest as of a particular date. It may not be representative of the Fund’s current or future investments and should not be construed as a recommendation to purchase or sell a particular security. See the prospectus for complete descriptions of investment objectives, policies, risks and permissible investments
| (a) | Non-income producing security. |
| (b) | Coupon amount represents effective yield. |
| (c) | State Street Corp. is the parent company of State Street Bank & Trust Co., the Fund’s custodian and accounting agent. |
| (d) | At December 31, 2010 , all or a portion of this security was pledged to cover collateral requirements for futures, options, forward foreign currency contracts and/or TBA’s. |
| (e) | GE Asset Management, the investment adviser of the Fund, also serves as investment adviser of the GEI Investment Fund and the GE Funds-GE Money Market Fund. |
| † | Percentages are based on net assets as of December 31, 2010 . |
Abbreviations:
| | |
ADR | | American Depository Receipt |
REIT | | Real Estate Investment Trust |
8
Financial Highlights
Selected data based on a share outstanding throughout the fiscal years indicated
| | | | | | | | | | | | | | | | | | | | | | | | | | | | | | | | | | | | |
| | | CLASS 1 | | | | | | CLASS 4 | |
| | | 12/31/10 | | | 12/31/09 | | | 12/31/08 | | | 12/31/07 | | | 12/31/06 | | | | | | 12/31/10 | | | 12/31/09 | | | 12/31/08 | |
| Inception date | | | — | | | | — | | | | — | | | | — | | | | 12/12/97 | | | | | | | | — | | | | — | | | | 5/1/08 | |
Net asset value, beginning of period | | | $64.30 | | | | $46.49 | | | | $78.95 | | | | $82.17 | | | | $75.65 | | | | | | | | $64.30 | | | | $46.55 | | | | $78.52 | |
Income/(loss) from investment operations: | | | | | | | | | | | | | | | | | | | | | | | | | | | | | | | | | | | | |
Net investment income (loss) | | | 0.14 | ** | | | 0.20 | | | | 0.30 | | | | 0.23 | | | | 0.35 | | | | | | | | (0.14 | )** | | | (0.16) | | | | 0.02 | ** |
Net realized and unrealized
gains/(losses) on investments | | | 7.32 | | | | 17.81 | | | | (29.32) | | | | 4.19 | | | | 6.51 | | | | | | | | 7.28 | | | | 17.91 | | | | (28.75) | |
Total income/(loss) from
investment operations | | | 7.46 | | | | 18.01 | | | | (29.02) | | | | 4.42 | | | | 6.86 | | | | | | | | 7.14 | | | | 17.75 | | | | (28.73) | |
Less distributions from: | | | | | | | | | | | | | | | | | | | | | | | | | | | | | | | | | | | | |
Net investment income | | | 0.16 | | | | 0.20 | | | | 0.26 | | | | 0.23 | | | | 0.34 | | | | | | | | — | | | | — | | | | 0.06 | |
Return of Capital | | | — | | | | — | | | | 0.01 | | | | — | | | | — | | | | | | | | — | | | | — | | | | 0.01 | |
Net realized gains | | | — | | | | — | | | | 3.17 | | | | 7.41 | | | | — | | | | | | | | — | | | | — | | | | 3.17 | |
Total distributions | | | 0.16 | | | | 0.20 | | | | 3.44 | | | | 7.64 | | | | 0.34 | | | | | | | | — | | | | — | | | | 3.24 | |
Net asset value, end of period | | | $71.60 | | | | $64.30 | | | | $46.49 | | | | $78.95 | | | | $82.17 | | | | | | | | $71.44 | | | | $64.30 | | | | $46.55 | |
TOTAL RETURN(a) | | | 11.61% | | | | 38.74% | | | | (36.66)% | | | | 5.34% | | | | 9.07% | | | | | | | | 11.10% | | | | 38.13% | | | | (36.49)% | |
| | | | | | | | | |
RATIOS/SUPPLEMENTAL DATA: | | | | | | | | | | | | | | | | | | | | | | | | | | | | | | | | | | | | |
Net assets, end of period
(in thousands) | | | $45,280 | | | | $48,620 | | | | $43,308 | | | | $94,720 | | | | $110,538 | | | | | | | | $10 | | | | $9 | | | | $6 | |
Ratios to average net assets: | | | | | | | | | | | | | | | | | | | | | | | | | | | | | | | | | | | | |
Net investment income (loss) | | | 0.22% | | | | 0.33% | | | | 0.36% | | | | 0.24% | | | | 0.41% | | | | | | | | (0.22)% | | | | (0.12)% | | | | 0.05% | * |
Net expenses | | | 0.76% | (b) | | | 0.90% | (b) | | | 0.76% | (b) | | | 0.72% | | | | 0.71% | | | | | | | | 1.19% | (b) | | | 1.35% | (b) | | | 1.21% | (b)* |
Gross expenses | | | 0.76% | | | | 0.90% | | | | 0.76% | | | | 0.72% | | | | 0.71% | | | | | | | | 1.20% | | | | 1.35% | | | | 1.21% | |
Portfolio turnover rate | | | 19% | | | | 18% | | | | 23% | | | | 29% | | | | 27% | | | | | | | | 19% | | | | 18% | | | | 23% | |
Notes to Financial Highlights
| (a) | Total returns are historical and assume changes in share price, reinvestment of dividends and capital gains distributions and do not include the effect of insurance contract charges. Past performance does not guarantee future results. |
| (b) | Reflects GE Asset Management waiver of a portion of the Fund’s management fee in an amount equal to the management fee earned by GEAM with respect to the Fund’s investment in the GE Funds – GE Money Market Fund. Excluding waiver, the expense ratios would be unchanged. |
| * | Annualized for periods less than one year. |
| ** | Per share values have been calculated using the average share method. |
The accompanying Notes are an integral part of these financial statements.
9
| | | | |
Statement of Assets and Liabilities
December 31, 2010 | | | |
| |
ASSETS | | | | |
Investments in securities, at Fair Value (cost $37,046,468) | | | $44,093,000 | |
Investments in affiliated securities, at Fair Value (cost $3,072) | | | 2,918 | |
Short-term affiliated investments (at amortized cost) | | | 1,312,499 | |
Income receivables | | | 26,372 | |
Receivable for fund shares sold | | | 2,065 | |
Total Assets | | | 45,436,854 | |
| |
LIABILITIES | | | | |
Payable for fund shares redeemed | | | 22,686 | |
Payable to GEAM | | | 24,866 | |
Accrued other expenses | | | 100,044 | |
Total Liabilities | | | 147,596 | |
NET ASSETS | | | $45,289,258 | |
| |
NET ASSETS CONSIST OF : | | | | |
Capital paid in | | | 45,671,431 | |
Undistributed (distribution in excess of) net investment income | | | (230 | ) |
Accumulated net realized gain (loss) | | | (7,428,321 | ) |
Net unrealized appreciation/(depreciation) on: | | | | |
Investments | | | 7,046,378 | |
NET ASSETS | | | $45,289,258 | |
| |
Class 1: | | | | |
| |
NET ASSETS | | | 45,279,511 | |
Shares outstanding ($0.01 par value; unlimited shares authorized) | | | 632,384 | |
Net asset value per share | | | $71.60 | |
| |
Class 4: | | | | |
| |
NET ASSETS | | | 9,747 | |
Shares outstanding ($0.01 par value; unlimited shares authorized) | | | 136 | |
Net asset value per share | | | $71.44 | |
The accompanying Notes are an integral part of these financial statements.
10
| | | | |
Statement of Operations
For the year ended December 31, 2010 | | | |
| |
INVESTMENT INCOME | | | | |
Income: | | | | |
Dividends | | | $420,456 | |
Interest | | | 20,873 | |
Interest from affiliated investments | | | 300 | |
Total Income | | | 441,629 | |
| |
Expenses: | | | | |
Advisory and administrative fees | | | 295,961 | |
Transfer agent | | | 8,077 | |
Directors’ fees | | | 1,665 | |
Custody and accounting expenses | | | 12,257 | |
Professional fees | | | 10,965 | |
Other expenses | | | 17,526 | |
Total expenses before waiver and reimbursement | | | 346,451 | |
Less: Expenses reimbursed by the adviser | | | (3,045 | ) |
Net expenses | | | 343,406 | |
Net investment income (loss) | | | 98,223 | |
| |
NET REALIZED AND UNREALIZED GAIN (LOSS)
ON INVESTMENTS | | | | |
| |
Realized gain (loss) on: | | | | |
Investments | | | (964,104 | ) |
Futures | | | 149,721 | |
| |
Increase (decrease) in unrealized appreciation/ (depreciation) on: | | | | |
Investments | | | 5,586,470 | |
Futures | | | 8,798 | |
Net realized and unrealized gain (loss) on investments | | | 4,780,885 | |
Net increase (decrease) in net assets resulting from operations | | | $4,879,108 | |
The accompanying Notes are an integral part of these financial statements.
11
| | | | | | | | |
Statements of
Changes in Net Assets | | | |
| | | Year Ended
December 31,
2010 | | | Year Ended
December 31,
2009 | |
| | |
INCREASE (DECREASE) IN NET ASSETS | | | | | | | | |
Operations: | | | | | | | | |
Net investments income | | $ | 98,223 | | | $ | 149,572 | |
Net realized gain (loss) on investments and futures | | | (814,383 | ) | | | (4,666,781 | ) |
Net increase (decrease) in unrealized appreciation / (depreciation) on investments and futures | | | 5,595,268 | | | | 19,092,472 | |
Net increase (decrease) from operations | | | 4,879,108 | | | | 14,575,263 | |
Distributions to shareholders from : | | | | | | | | |
Net investment income | | | | | | | | |
Class 1 | | | (102,983 | ) | | | (153,151 | ) |
Class 4 | | | — | | | | — | |
Total distributions | | | (102,983 | ) | | | (153,151 | ) |
Increase (decrease) in net assets from operations and distributions | | | 4,776,125 | | | | 14,422,112 | |
Share transactions : | | | | | | | | |
Proceeds from sale of shares | | | | | | | | |
Class 1 | | | 403,902 | | | | 713,200 | |
Class 4 | | | — | | | | — | |
Value of distributions reinvested | | | | | | | | |
Class 1 | | | 102,983 | | | | 153,151 | |
Class 4 | | | — | | | | — | |
Cost of shares redeemed | | | | | | | | |
Class 1 | | | (8,622,493 | ) | | | (9,973,949 | ) |
Class 4 | | | — | | | | — | |
Net increase (decrease) from share transactions | | | (8,115,608 | ) | | | (9,107,598 | ) |
Total increase (decrease) in net assets | | | (3,339,483 | ) | | | 5,314,514 | |
| | |
NET ASSETS | | | | | | | | |
Beginning of period | | | 48,628,741 | | | | 43,314,227 | |
End of period | | $ | 45,289,258 | | | $ | 48,628,741 | |
Undistributed (distribution in excess of)
net investment income, end of period | | $ | (230 | ) | | $ | — | |
| | |
CHANGES IN FUND SHARES | | | | | | | | |
| | |
Class 1 | | | | | | | | |
Shares sold | | | 6,304 | | | | 13,169 | |
Issued for distributions reinvested | | | 1,434 | | | | 2,361 | |
Shares redeemed | | | (131,514 | ) | | | (190,965 | ) |
Net increase (decrease) in fund shares | | | (123,776 | ) | | | (175,435 | ) |
| | |
Class 4 | | | | | | | | |
Shares sold | | | — | | | | — | |
Issued for distributions reinvested | | | — | | | | — | |
Shares redeemed | | | — | | | | — | |
Net increase (decrease) in fund shares | | | — | | | | — | |
The accompanying Notes are an integral part of these financial statements.
12
| | |
| Notes to Financial Statements | | December 31, 2010 |
| 1. | Organization of the Company |
GE Investments Funds, Inc. (the “Company”) was incorporated under the laws of the Commonwealth of Virginia on May 14, 1984 and is registered under the Investment Company Act of 1940, as amended (the “1940 Act”), as an open-end management investment company. The Company is composed of fourteen investment portfolios (collectively the “Funds”), although only the following eleven are currently being offered: U.S. Equity Fund, S&P 500 Index Fund, Premier Growth Equity Fund (the “Fund”), Core Value Equity Fund, Mid-Cap Equity Fund, Small-Cap Equity Fund, International Equity Fund, Total Return Fund, Income Fund, Money Market Fund and Real Estate Securities Fund.
Shares of the Funds of the Company are offered only to insurance company separate accounts that fund certain variable life insurance contracts and variable annuity contracts. GE Asset Management Incorporated (“GEAM”) is the investment adviser and administrator of each of the Funds.
The Company offers two share classes (Class 1 and Class 4) of the Fund. Class 4 shares were first offered on May 1, 2008, and Fund shares outstanding prior to May 1, 2008 were designated as Class 1 shares. Each share class has different fees and expenses, and as a result, each share class will have different share price and performance. Not all variable contracts offer both share classes of the Fund.
| 2. | Summary of Significant Accounting Policies |
The preparation sof financial statements in conformity with U.S. generally accepted accounting principles (GAAP) requires management to make estimates and assumptions that affect the reported amounts of assets and liabilities and disclosure of contingent assets and liabilities at the date of the financial statements and the reported amounts of increases and decreases in net assets from operations during the reporting period. Actual results may differ from those estimates.
Subsequent events after the balance sheet date through the date the financial statements were issued, have been evaluated in the preparation of the financial statements.
There are no items to report.
The following summarizes the significant accounting policies of the Company:
Securities Valuation and Transactions. All investments in securities are recorded at their estimated fair value, as described in Note 3.
Securities transactions are accounted for as of the trade date. Realized gains and losses on investments sold are recorded on the basis of identified cost for both financial statement and federal tax purposes.
The Fund’s income, expenses (other than distribution fees) and realized and unrealized gains and losses are allocated proportionally each day among the share classes based upon the relative net assets of each class.
Futures Contracts A futures contract represents a commitment for the future purchase or sale of an asset at a specified price on a specified date. The Fund invests in stock index futures contracts subject to certain limitations to manage its exposure to the stock markets. Buying futures tends to increase a Fund’s exposure to the underlying instrument while selling futures tends to decrease a Fund’s exposure to the underlying instrument or to hedge other Fund investments. With futures contracts, there is minimal counterparty credit risk to the Fund since futures contracts are exchange traded and the exchange’s clearinghouse, as counterparty to all traded futures, guarantees the futures against default. A Fund’s risks in using these contracts include changes in the value of the underlying instruments, non- performance of the counterparties under the contracts’ terms and changes in the liquidity of the secondary market for the contracts. Futures contracts are valued at the settlement price established each day by the board of trade or exchange on which they principally trade.
Upon entering into a financial futures contract, the Fund is required to pledge to the broker an amount of cash and/or other assets equal to a certain percentage of the contract amount, known as initial margin deposit. Subsequent payments, known as variation margin, are made or received by the Fund each day, depending on the daily fluctuation in the fair value of the underlying security. The Fund records an unrealized gain or loss equal to the daily variation margin. Should market conditions move unexpectedly, the Fund may not achieve the anticipated benefits of the futures contracts and may incur a loss. The Fund recognizes a realized gain or loss upon the expiration or closing of a futures contract.
Investment Income Corporate actions (including cash dividends) are recorded on the ex-dividend date, net of
13
| | |
| Notes to Financial Statements | | December 31, 2010 |
applicable withholding taxes. Interest income is recorded on the accrual basis.
Expenses Fund specific expenses are allocated to the Fund that incurs such expenses and pro rata across share classes. Expenses, other than those incurred by a specific Fund, are allocated pro rata among Funds and share classes. Such expenses may include custodial fees, legal and accounting fees, printing costs and registration fees. All expenses of the Fund are paid by GEAM and reimbursed by the Fund. Certain class specific expenses (such as transfer agency fees or distribution fees) are allocated to the class that incurs such expense.
Federal Income Taxes The Fund intends to comply with all sections of the Internal Revenue Code applicable to regulated investment companies including the distribution of substantially all of its taxable net investment income and net realized capital gains to its shareholders. Therefore, no provision for federal income tax has been made. The Fund is treated as a separate taxpayer for federal income tax purposes.
The Fund utilizes various methods to measure the fair value of most of its investments on a recurring basis. GAAP establishes a framework for measuring fair value and providing related disclosures. Broadly, the framework requires fair value to be determined based on the exchange price that would be received for an asset or paid to transfer a liability (an exit price) in the principal or most advantageous market for the asset or liability in an orderly transaction between market participants at the measurement date. In the absence of active markets for the identical assets or liabilities, such measurements involve developing assumptions based on market observable data and, in the absence of such data, internal information that is consistent with what market participants would use in a hypothetical transaction that occurs at the measurement date. It also establishes a three-level valuation hierarchy based upon observable and non-observable inputs.
Observable inputs reflect market data obtained from independent sources, while unobservable inputs reflect our market assumptions. Preference is given to observable inputs. These two types of inputs create the following fair value hierarchy:
Level 1 — Quoted prices for identical investments in active markets.
Level 2 — Quoted prices for similar investments in active markets; quoted prices for identical or similar investments in markets that are not active; and model-derived valuations whose inputs are observable or whose significant value drivers are observable.
Level 3 — Significant inputs to the valuation model are unobservable.
Policies and procedures are maintained to value investments using the best and most relevant data available. In addition, pricing vendors are utilized to assist in valuing investments. GEAM performs periodic reviews of the methodologies used by independent pricing services including price validation of individual securities.
Fair Value Measurement The following section describes the valuation methodologies the Fund uses to measure different financial investments at fair value.
The Fund’s portfolio securities are valued generally on the basis of market quotations. Equity securities generally are valued at the last reported sale price on the primary market in which they are traded. Portfolio securities listed on NASDAQ are valued using the NASDAQ Official Closing Price. Level 1 securities primarily include publicly-traded equity securities which may not necessarily represent the last sale price. If no sales occurred on the exchange or NASDAQ that day, the portfolio security generally is valued using the last reported bid price. In those circumstances the Fund classifies the investment securities in Level 2.
The Fund uses non-binding broker quotes as the primary basis for valuation when there is limited, or no, relevant market activity for a specific investment or for other investments that share similar characteristics. The Fund has not adjusted the prices obtained. Investment securities priced using non-binding broker quotes are included in Level 3. As is the case with the primary pricing vendor, third-party brokers do not provide access to their proprietary valuation models, inputs and assumptions. Accordingly, GEAM conducts internal reviews of pricing for all such investment securities periodically to ensure reasonableness of valuations used in the Fund‘s financial statements. These reviews are designed to identify prices that appear stale, those that have changed significantly from prior valuations, and other anomalies that may indicate that a price may not be accurate. Based on the information available, GEAM believes that the fair values provided by the brokers are representative of prices that would be received to sell the assets at the measurement date (exit prices).
14
| | |
| Notes to Financial Statements | | December 31, 2010 |
A Fund’s written or purchased options are valued at the last sale price, or if no sales occurred that day, at the last reported bid price and those are also included in Level 2.
If prices are not readily available for a portfolio security, or if it is believed that a price for a portfolio security does not represent its fair value, the security may be valued using procedures approved by the Fund’s Board of Directors that are designed to establish its “fair” value. These securities would be classified in Level 3. Those procedures require
that the fair value of a security be established by the valuation committee. The valuation committee follows different protocols for different types of investments and circumstances. The fair value procedures may be used to value any investment of the Fund in the appropriate circumstances.
The following table presents the Fund’s investments measured at fair value on a recurring basis at December 31, 2010:
| | | | | | | | | | | | | | | | |
| | | | Level 1 | | | | Level 2 | | | | Level 3 | | | | Total | |
Investments in Securities | | | | | | | | | | | | | | | | |
Common Stock | | $ | 44,093,000 | | | $ | — | | | $ | — | | | $ | 44,093,000 | |
Other Investments | | | — | | | | 2,918 | | | | — | | | | 2,918 | |
Short-term Investments | | | 1,312,499 | | | | — | | | | — | | | | 1,312,499 | |
Total Investments in Securities | | $ | 45,405,499 | | | $ | 2,918 | | | $ | — | | | $ | 45,408,417 | |
| 4. | Derivatives Transactions |
Shown below are the effects of derivative instruments on the Fund’s Statement of Operations, summarized by primary risk exposure all of which are not accounted for as hedging instruments under FASB Accounting ASC 815.
| | | | | | | | | | | | | | |
| | | Location | | Notional Amount of
Futures
Contracts
Purchased/(Sold) ($) | | | Realized Gain
or (Loss) ($) | | | Change in Unrealized
Appreciation/(Depreciation) ($) | |
Equity Futures | | Net realized gain/(loss) on futures, Increase/(decrease) in unrealized appreciation/ (depreciation) on futures | |
| 9,246,594/
(10,127,066 |
) | | $ | 149,721 | | | $ | 8,798 | |
The Company shares a revolving credit facility of up to $150 million with a number of its affiliates. The credit facility is with its custodian bank, State Street Bank and Trust Company (“State Street”). The revolving credit facility requires the payment of a commitment fee equal to 0.125% per annum on the daily unused portion of the credit facility, payable quarterly. The portion borne by the Fund generally is borne proportionally based upon net assets. In addition, the Company has a $100 million uncommitted, unsecured line of credit with State Street. Generally, borrowings under the credit facilities would accrue interest at the Federal Funds Rate plus 50 basis points and would be borne by the borrowing Fund. The maximum amount allowed to be borrowed by any one Fund is the lesser of (i) 33.33% of the Fund’s total assets or (ii) 20% of its net assets. The credit facilities were not utilized by the Fund during the fiscal year ended December 31, 2010.
| 6. | Fees and Compensation Paid to Affiliates |
GEAM, a registered investment adviser, was retained by the Company’s Board of Directors effective November 15, 1997 to act as investment adviser and administrator of the Fund. GEAM’s compensation for investment advisory and administrative services is paid monthly based on the average daily net assets of the Fund at an annualized rate of 0.65%.
GEAM waives a portion of the Fund’s Management Fee in the amount equal to the management fee earned by GEAM with respect to the Funds Investment in the GE Funds-GE Money Market Fund.
Distribution and Service (12b-1) Fee The Company has adopted a Distribution and Service (12b-1) Plan (the “Plan”) pursuant to Rule 12b-1 under the 1940 Act with respect to Class 4 shares of the Fund. Under the Plan, the Fund may
15
| | |
| Notes to Financial Statements | | December 31, 2010 |
compensate GE Investment Distributors, Inc. (“GEID”), a wholly-owned subsidiary of GEAM and the Fund’s principal distributor, for certain sales services provided by GEID or other broker dealers and investor services provided by GEID or other service providers relating to the Fund’s Class 4 shares, including services to owners or prospective owners of variable contracts issued by insurance companies that offer such share class as an investment option. The amount of compensation paid under the Plan by the Fund’s Class 4 shares may not exceed 0.45% of the average daily net assets of the Fund attributable to such share class. The Plan continues in effect from year to year for so long as such continuance is approved annually by the Board of Directors, including by those directors who are not interested persons of the Company and who have no direct or indirect financial interest in the operation of the Plan or in any agreement related to it.
Directors’ Compensation The Fund pays no compensation to its directors who are officers or employees of GEAM or its affiliates. Directors who are not such officers or employees also serve in a similar capacity for other funds advised by GEAM. Compensation paid to unaffiliated directors are reflected on the Statement of Operations. These fees are allocated pro rata across all of the mutual fund platforms and share classes served by the directors, including the Fund, and are based upon the relative net assets of each fund within such platforms.
| 7. | Investment Transactions |
Purchases and Sales of Securities The cost of purchases and the proceeds from sales of investments, other than short-term securities and options, for the year ended December 31, 2010 were as follows:
| | |
| Non-U.S. Government Securities |
| Purchases | | Sales |
| $8,182,451 | | $15,357,739 |
The Fund is subject to ASC 740, Income Taxes. ASC 740 provides guidance for financial accounting and reporting for the effects of income taxes that result from an entity’s activities during the year. ASC 740 also provides guidance regarding how certain tax positions should be recognized, measured, presented and disclosed in the financial statements. ASC 740 requires evaluation of tax positions taken or expected to be taken in the course of preparing the Fund’s tax returns to determine whether the tax positions are “more likely than not” of being sustained by the applicable tax authority. There are no adjustments to the Fund’s net assets required under ASC 740. The Fund’s 2007, 2008, 2009 and 2010 fiscal years tax returns are still open to examination by the Federal and applicable state tax authorities.
At December 31, 2010, information on the tax components of capital is as follows:
| | | | | | | | | | | | |
Cost for Tax Purposes | | Gross Tax Unrealized Apprec. | | Gross Tax Unrealized Deprec. | | Net Tax Apprec/ (Deprec) on Investments | | Undistributed Income | | Undistributed Accumulated Capital Loss | | Post October Losses |
| $40,846,637 | | $7,874,769 | | $(3,312,989) | | $4,561,780 | | $— | | $(4,943,953) | | $— |
As of December 31, 2010, the Fund has capital loss carryovers as indicated below.
| | |
| Amount | | Expires |
$3,967,110 | | 12/31/17 |
| 976,843 | | 12/31/18 |
These amounts will be available to offset future taxable capital gains. Under the recently enacted Regulated Investment Company Modernization Act of 2010, the Fund will be permitted to carry forward capital losses incurred in taxable years beginning after December 22, 2010 for an unlimited period. However, any losses incurred during
those future years will be required to be utilized prior to the losses incurred in pre-enactment tax years. As a result of this ordering rule, pre-enactment capital loss carryforwards may be more likely to expire unused. Additionally, post-enactment capital losses that are carried forward will retain their character as either short-term or long-term capital losses rather than being considered all short-term as under previous law.
Capital loss carryovers are available to offset future realized capital gains to the extent provided in the Internal Revenue Code and regulations thereunder. To the extent that these carryover losses are used to offset future capital gains, it is
16
| | |
| Notes to Financial Statements | | December 31, 2010 |
probable that the gains so offset will not be distributed to shareholders because they would be taxable as ordinary income.
Any net capital and currency losses incurred after October 31, within the Fund’s tax year, are deemed to arise on the first day of the Fund’s next tax year if the Fund so elects to defer such losses.
The Fund did not defer any post-October losses for the year ended December 31, 2010.
The tax composition of distributions paid during the years ended December 31, 2010 and December 31, 2009 were as follows:
| | | | | | | | | | | | | | | | |
| | | Ordinary
Income | | | Long-
Term
Capital
Gains | | | Return
of Capital | | | Total | |
2010 | | $ | 102,983 | | | $ | — | | | $ | — | | | $ | 102,983 | |
2009 | | | 153,151 | | | | — | | | | — | | | | 153,151 | |
Distributions to Shareholders The Fund declares and pays any dividends from net investment income annually. The Fund declares and pays any net realized capital gains in excess of capital loss carryforwards distributions annually. The character of income and gains to be distributed is determined in accordance with income tax regulations which may differ from generally accepted accounting principles. These differences include (but are not limited to) futures, investments organized as partnerships for tax purposes, and losses deferred due to wash sale transactions. Reclassifications due to permanent book/tax differences are made to the Fund’s capital accounts to reflect income and gains available for distribution (or available capital loss carryovers) under income tax regulations. These reclassifications have no impact on net investment income, realized gains or losses, or the net asset value of the Fund. The calculation of net investment income per share in the Financial Highlights table excludes these adjustments.
| | | | |
Undistributed
Net Investment
Income | | Accumulated
Net Realized Loss | | Paid In Capital |
$4,530 | | $(6) | | $(4,524) |
17
Report of Independent Registered Public Accounting Firm
The Shareholders and Board of Directors
GE Investments Funds, Inc.
We have audited the accompanying statement of assets and liabilities, including the schedule of investments, of the Premier Growth Equity Fund, a series of GE Investments Funds, Inc., as of December 31, 2010, and the related statement of operations for the year then ended, statements of changes in net assets for each of the years in the two-year period then ended, and the financial highlights for each of the years in the five-year period then ended. These financial statements and financial highlights are the responsibility of the Fund’s management. Our responsibility is to express an opinion on these financial statements and financial highlights based on our audits.
We conducted our audits in accordance with the standards of the Public Company Accounting Oversight Board (United States). Those standards require that we plan and perform the audit to obtain reasonable assurance about whether the financial statements and financial highlights are free of material misstatement. An audit includes examining, on a test basis, evidence supporting the amounts and disclosures in the financial statements. Our procedures included confirmation of securities owned as of December 31, 2010 by correspondence with the custodian. An audit also includes assessing the accounting principles used and significant estimates made by management, as well as evaluating the overall financial statement presentation. We believe that our audits provide a reasonable basis for our opinion.
In our opinion, the financial statements and financial highlights referred to above present fairly, in all material respects, the financial position of the Premier Growth Equity Fund as of December 31, 2010, the results of its operations, changes in its net assets and financial highlights for each of the years or periods described above, in conformity with U.S. generally accepted accounting principles.

Boston, Massachusetts
February 25, 2011
18
| | |
| Advisory and Administrative Agreement Renewal | | (unaudited) |
The Board of Directors of the GE Investments Funds, Inc. (the “Board”), including the independent Board members, considered and all those that were present unanimously approved the continuance of the Fund’s Investment Advisory and Administration Agreement with GE Asset Management Incorporated (“GEAM”) at meetings held on December 3 and December 10, 2010.
In considering whether to approve the Fund’s investment advisory agreement, the Board members considered and discussed a substantial amount of information and analysis provided, at the Board’s request, by GEAM. The Board members also considered detailed information regarding performance and expenses of other investment companies, including those with similar investment strategies and sizes, which was prepared by independent third party provider Morningstar, Inc. (“Morningstar”). The Board members reviewed the fees charged by GEAM for other mutual funds and investment products other than mutual funds that employ the same investment strategy as the Fund. The Board had the opportunity to ask questions and request additional information in connection with its considerations.
Before approving the Fund’s advisory agreement, the Board members reviewed the information provided with management of GEAM and with independent legal counsel. The Board members also reviewed a memorandum prepared by independent legal counsel discussing the legal standards for the consideration of the proposed continuance. The independent Board members discussed the proposed continuance in detail during a private session with their independent legal counsel at which no representatives of GEAM were present. The independent Board members and their independent legal counsel requested, and received and considered, additional information from GEAM following these sessions.
In advance of the meetings, and in response to their request, the Board members received from GEAM written responses to their inquiries, which included substantial exhibits and other materials related to GEAM’s business and the services it provides to the Fund. The Board members took into account their multi-year experience as Board members and particularly their consideration of these types of agreements in recent years. The information was presented in a manner to facilitate comparison to prior periods and to reflect certain enhancements. To focus their review, the Board members asked GEAM management, in its oral presentation, to highlight material differences from the information presented in recent years.
During the meetings, the Board members had an opportunity to discuss this information with GEAM managers, including senior executives, representatives from the legal, compliance and finance departments, and investment personnel. The Board members posed questions to these representatives and engaged in substantive discussions with them concerning GEAM’s investment process.
In reaching their determination relating to continuance of the Fund’s investment advisory agreement, the Board members considered all factors that they deemed relevant, including the factors discussed below. In their deliberations, the Board members did not identify any particular information that was all-important or controlling, and each Board member may have attributed different weights to the various factors. In particular, the Board members focused on the following:
The Nature, Extent And Quality Of Services Provided.
The Board members reviewed the services provided by GEAM, taking into account their extensive past experiences with GEAM. They focused on the favorable attributes of GEAM, including (i) an investment philosophy oriented toward long-term performance; (ii) effective processes used for selecting investments and brokers; (iii) effective processes used for providing Fund administration, including controllership and compliance functions and oversight of the performance of other companies that provide services to the Fund; (iv) highly skilled professionals including analysts, research professionals, traders and portfolio managers with a depth of experience relevant to the Fund; (v) access to significant technological resources from which the Fund may benefit; and (vi) a favorable history and reputation. The Board members noted that the Fund represents only a small portion of the assets managed by GEAM, but benefits from a full array of services and resources provided by GEAM.
In light of these discussions, the Board, including the independent Board members, concluded that GEAM’s services continue to be satisfactory.
Investment Performance Of The Fund.
The Board members considered the investment performance of the Fund for various periods. The Board members reviewed detailed comparisons of the performance of the Fund with the relevant securities index and peer groupings of mutual funds prepared by
19
| | |
| Advisory and Administrative Agreement Renewal | | (unaudited) |
Morningstar with respect to various periods. The Board members also engaged in detailed discussions with GEAM management about its investment process and performance results. These discussions focused on the Fund’s investment objective, the number and experience of portfolio management and supporting research personnel, the investment style and approach employed, the likely market cycles for the investment style and relative underperformance in certain periods. The Board members discussed GEAM’s investment approach with respect to the Fund, and that the performance of the Fund is consistent with GEAM’s articulated long-term approach and overall investment philosophy.
The Board, including the independent Board members, concluded that the Fund’s performance was acceptable overall taking into consideration the factors discussed above.
Cost Of The Services Provided And Profits Realized From The Relationship With The Fund.
The Board members considered the fees paid to GEAM by the Fund and the cost of the services provided to the Fund by GEAM. The Board members reviewed the information they had requested from GEAM concerning its profitability. The Board members considered the profit margin information for GEAM’s investment company business as a whole, as well as GEAM’s profitability data for the Fund. The Board members reviewed GEAM’s assumptions and the methods of cost allocation used by GEAM in preparing Fund-specific profitability data. The Board members also discussed with GEAM the basis for its belief that the methods of allocation used were reasonable for each area of its business.
Information was presented regarding the financial condition of GEAM for various past periods. The Board members noted and discussed the additional services provided by GEAM to the Fund compared to other investment products managed by GEAM, and previously had been provided a study conducted by the Investment Company Institute that discusses and compares advisory fees and services for mutual funds and institutional separate accounts. The Board members determined that GEAM should be entitled to earn a reasonable level of profits for the services it provides to the Fund. The Board members also recognized that GEAM had made significant investments in its business and had not fully recovered the sums invested. The Board also considered that GEAM
continues to make a substantial investment in fulfilling its obligations to the Fund and supporting its Fund-related activities.
Based on their review, the Board, including the independent Board members, concluded that they were satisfied that the level of profitability achieved by GEAM from its relationship with the Fund was not unreasonable or excessive.
The Extent To Which Economies Of Scale Would Be Realized As The Fund Grows And Whether Fee Levels Would Reflect Such Economies Of Scale.
Although the Board noted that the Fund did not experience significant growth in assets over the past year, the Board members considered the extent to which economies of scale would be realized as the Fund grows, and whether fee levels reflect these economies of scale for the benefit of Fund investors.
The Board members considered the substantial infrastructure investments that GEAM has made with respect to its operations and its commitment to continue investing resources to enhance services to Fund shareholders. The Board members recognized the benefits to the Fund of GEAM’s past investment in its operations through the expenditure of sums to support its substantial infrastructure, and that, with respect to all GEAM managed mutual funds, GEAM has not yet fully recouped that investment. The Board members also recognized the benefits to the Fund of being able to leverage a favorable cost structure achieved with respect to the Fund’s other operating expenses as a result of GEAM’s large overall base of assets under management and its vendor management practices.
Comparison Of Services To Be Rendered And Fees To Be Paid.
The Board members discussed the services provided to the Fund by GEAM, and the fees charged for those services. The Board members reviewed information concerning the fee and expense ratios for the Fund, and comparative information with respect to peer groupings of mutual funds prepared by Morningstar. They discussed that the Fund’s figures were within the applicable peer group ranges. In light of the foregoing, the Board, including the independent Board members, determined that the advisory fees were reasonable in relation to the services provided to the Fund.
20
| | |
| Advisory and Administrative Agreement Renewal | | (unaudited) |
Fall-Out Benefits.
The Board members considered other actual and potential financial benefits that GEAM may derive from its relationship with the Fund, including, to the extent applicable, soft dollar commission benefits generated through Fund portfolio transactions. The Board members noted, however, that the Fund benefits from the vast array of resources available through GEAM, and that the Fund represents only a small portion of the assets managed by GEAM.
Conclusion.
No single factor was determinative to the Board’s decision. Based on their discussion and such other matters as were deemed relevant, the Board, including the independent Board members, concluded that renewal of the advisory agreement was in the best interests of the Fund and its shareholders.
21
| | |
| Additional Information | | (unaudited) |
Information about Directors and Executive Officers:
The business and affairs of the Company are managed under the direction of the Company’s Board of Directors. Information pertaining to the Directors and officers of the Company is set forth below.
Interested Directors and Executive Officers
Michael J. Cosgrove
Address c/o GEAM 3001 Summer St. Stamford, CT 06905
Age 61
Position(s) Held with Fund Chairman of the Board and President
Term of Office and Length of Time Served Until successor is elected and qualified — 14 years
Principal Occupation(s) During Past 5 years President and Chief Executive Officer — Mutual Funds and Intermediary Business since March 2007; Executive Vice President of GEAM from February 1997 to March 2007; Director of GEAM since 1988; Vice President, GE Capital Corporation, an indirect wholly-owned subsidiary of GE, since December 1999; Executive Vice President — Sales and Marketing of GEAM, a wholly-owned subsidiary of GE that is registered as an investment adviser under the Investment Advisers Act of 1940, as amended, from March 1993 to March 2007.
Number of Portfolios in Fund Complex Overseen by Director 49
Other Directorships Held by Director Chairman of the Board and President of GE Funds from 1993 to February 2011, and GE Institutional Funds since its inception; Trustee of General Electric Savings & Security Trust, General Electric S&S Income Fund, General Electric S&S Program Mutual Fund (“GE Savings & Security Funds”), Elfun Funds, General Electric Insurance Plan Trust, General Relief Loan Fund, and General Electric Pension Trust since 1988; Trustee of Fordham University since 2002; Trustee of GE Volunteers since 1993; Director, GE Asset Management (Ireland) since February 1999; Director, GE Asset Management Funds Plc., GE Asset Canada Company, and GE Asset Management Limited since 1998.
Matthew J. Simpson
Address c/o GEAM 3001 Summer St. Stamford, CT 06905
Age 49
Position(s) Held with Fund Director and Executive Vice President
Term of Office and Length of Time Served Until successor is elected and qualified — 3 years
Principal Occupation(s) During Past 5 years Executive Vice President, General Counsel and Secretary of GEAM since July 2007; Senior Vice President and General Counsel — Marketing and Client Services (formerly Asset Management Services), at GEAM and Senior Vice President and General Counsel of GEAMS from February 1997 to June 2007; Vice President and Associate General Counsel of GEAM from October 1992 to February 1997; Vice President of GE Funds, GE Institutional Funds and GE LifeStyle Funds from September 2003 to June 2007; Secretary of GE Funds and GE Institutional Funds from 1997 to June 2007; Vice President of Elfun Funds and GE Savings & Security Funds from October 2003 to June 2007; Assistant Secretary of Elfun Funds and GE Savings & Security Funds from 1998 to June 2007.
Number of Portfolios in Fund Complex Overseen by Director 49
Other Directorships Held by Director Trustee of GE Institutional Funds, Elfun Funds and GE Savings & Security Funds since July 2007. Trustee of GE Funds from July 2007 to February 2011.
22
| | |
| Additional Information | | (unaudited) |
Joon Won Choe
Address c/o GEAM 3001 Summer St. Stamford, CT 06905
Age 41
Position(s) Held with Fund Vice President & Secretary
Term of Office and Length of Time Served Until successor is elected and qualified – Vice President and Secretary — less than 1 year
Principal Occupation(s) During Past 5 years Senior Vice President and Associate General Counsel at GEAM since June 2010; Vice President and Associate General Counsel at GEAM from November 2005 to June 2010; Vice President and Secretary of GE Funds from September 2010 to February 2011; Vice President and Secretary of GE Institutional Funds and GE Investments Funds, Inc. since September 2010; Vice President and Assistant Secretary of Elfun Funds and GE Savings & Security Funds since September 2010.
Number of Portfolios in Fund Complex Overseen by Officer N/A
Other Directorships Held by Officer N/A
Robert Herlihy
Address c/o GEAM 3001 Summer St. Stamford, CT 06905
Age 43
Position(s) Held with Fund Senior Vice President and Chief Compliance Officer
Term of Office and Length of Time Served Until successor is elected and qualified — 5 years
Principal Occupation(s) During Past 5 years Chief Compliance Officer of GEAM, GE Institutional Funds, Elfun Funds, and GE Savings and Security Funds since July 2005; Chief Compliance Officer of GE Funds from July 2005 to February 2011; Manager of Fund Administration at GEAM from 2002 — 2005.
Number of Portfolios in Fund Complex Overseen by Officer N/A
Other Directorships Held by Officer N/A
Eunice Tsang
Address c/o GEAM 3001 Summer St. Stamford, CT 06905
Age 51
Position(s) Held with Fund Treasurer
Term of Office and Length of Time Served Until successor is elected and qualified — less than one year
Principal Occupations(s) During Past 5 years Treasurer of GE Institutional Funds, Elfun Funds and GE Savings and Security Funds since January 2010; Treasurer of GE Funds from January 2010 to February 2011; GEAM Operational Controllership and Technical Accounting Manager since December 2007; Financial Planning & Analysis Manager — Performance Leader from June 2005 to December 2007; GEAM Quality Black Belt from 2001 to June 2005; Financial Planning & Analysis Manager from 2000 to 2001; and Mutual Fund Assistant Controller from October 1997 to 2000.
Number of Portfolios in Fund Complex Overseen by Officer N/A
Other Directorships Held by Officer N/A
23
| | |
| Additional Information | | (unaudited) |
Non-Interested Directors
John R. Costantino
Address c/o GEAM 3001 Summer St. Stamford, CT 06905
Age 64
Position(s) Held with Fund Director
Term of Office and Length of Time Served Until successor is elected and qualified — 14 years
Principal Occupation(s) During Past 5 years General Partner, NGN Capital LLC since 2006; Managing Director, Vice President of Walden Capital Management since 1996.
Number of Portfolios in Fund Complex Overseen by Director 41
Other Directorships Held by Director Trustee of GE Funds since 1993, GE Institutional Funds since its inception; Trustee of Fordham University from 1989 to 1995 and 2001 to 2007 and Trustee Emeritus since 2007; Trustee of Neuro Science Research Institute since 1986; Trustee of Gregorian University Foundation from 1992 to 2007; Director of Artes Medical from 2006 to 2008.
William J. Lucas
Address c/o GEAM 3001 Summer St. Stamford, CT 06905
Age 61
Position(s) Held with Fund Director
Term of Office and Length of Time Served Until successor is elected and qualified — 13 years (No longer serves as Trustee effective November 4, 2010)
Principal Occupation(s) During Past 5 years Retired since 2010, previously Vice President and Treasurer of Fairfield University since 1983.
Number of Portfolios in Fund Complex Overseen by Director 41
Other Directorships Held by Director Trustee of GE Funds since 1993, and GE Institutional Funds since its inception.
Robert P. Quinn
Address c/o GEAM 3001 Summer St. Stamford, CT 06905
Age 74
Position(s) Held with Fund Director
Term of Office and Length of Time Served Until successor is elected and qualified — 14 years
Principal Occupation(s) During Past 5 years Retired since 1983 from Salomon Brothers Inc.
Number of Portfolios in Fund Complex Overseen by Director 41
Other Directorships Held by Director Trustee of GE Funds since 1993, and GE Institutional Funds since its inception; Trustee, St. Francis Hospital Corp.
The Statement of Additional Information for the Fund includes additional information about the Directors and Officers and is available, without charge, upon request by calling 1-800-493-3042.
24
Investment Adviser and Administrator
GE Asset Management Incorporated
Board of Directors
Michael J. Cosgrove, Chairman
John R. Costantino
William J. Lucas*
Robert P. Quinn
Matthew J. Simpson
Secretary
Joon Won Choe
Assistant Secretary
Michelle Matzelle
Treasurer
Eunice Tsang
Assistant Treasurers
Tatyana Begun**
Casey Yantosca
Distributor
GE Investment Distributors, Inc.
Member FINRA and SIPC
Counsel
Sutherland, Asbill & Brennan, LLP
Custodian
State Street Bank & Trust Company
Independent Registered Public Accounting Firm
KPMG LLP
Officers of the Investment Adviser
James W. Ireland, President and Chief Executive Officer
Cheryl H. Beacock, Senior Vice President, Human Resources
Paul M. Colonna, President and Chief Investment Officer — Fixed Income Investments
Michael J. Cosgrove, President and Chief Executive
Officer — Mutual Funds & Intermediary Business
Ralph R. Layman, President and Chief Investment Officer — Public Equity Investments (since July 2009)
Maureen B. Mitchell, President — Institutional Sales and Marketing (since July 2009)
Steve Rullo, Chief Information Officer (since February 2011)
Matthew J. Simpson, Executive Vice President, General Counsel and Secretary
Don W. Torey, President — Alternative Investments
John J. Walker, Executive Vice President, Chief Operating Officer
David Wiederecht, President and Chief Investment Officer — Investment Strategies
Tracie Winbigler, Executive Vice President, Chief Financial Officer***
| * As | of November 4, 2010, Mr. Lucas no longer served as a director of the Company. |
| ** As | of February 18, 2011, Ms. Begun no longer served as an officer of the Company. |
| *** | Effective January, 2011. |
25
Investment Adviser
GE Asset Management Incorporated
3001 Summer Street
PO Box 7900
Stamford, CT 06904-7900
Distributor
GE Investment Distributors, Inc.
member FINRA and SIPC
3001 Summer Street
PO Box 7900
Stamford, CT 06904-7900
The Fund files its complete schedule of portfolio holdings with the Securities and Exchange Commission for the first and third quarters of each fiscal year on Form N-Q. The Fund’s Forms N-Q, as well as a description of the policies and procedures that the Fund uses to determine how to vote proxies (if any) relating to portfolio securities is available without charge (i) upon request, by calling 1-800-493-3042; (ii) on the Fund’s website at http://www.geam.com; and (iii) on the Commission’s website at http://www.sec.gov. The Fund’s Forms N-Q may be reviewed and copied at the Commission’s Public Reference Room in Washington, DC—information on the operation of the Public Reference Room may be obtained by calling 1-800-SEC-0330.
Information (if any) regarding how the Fund voted proxies relating to portfolio securities during the most recently disclosed 12-month period ended June 30 is available without charge (i) through the Fund’s website at http://www.geam.com; and (ii) on the Commission’s website at http://www.sec.gov.

GE Investments Funds, Inc.
Core Value Equity Fund
Annual Report
December 31, 2010

GE Investments Funds, Inc.
| | |
| |
| Core Value Equity Fund | | Contents |
This report is prepared for Policyholders of certain variable contracts and may be distributed to others only if preceded or accompanied by the variable contract’s current prospectus and the current prospectus of the Fund available for investments thereunder.
| | |
| Notes to Performance | | December 31, 2010 (unaudited) |
The information on the following performance pages relates to the GE Investments Core Value Equity Fund (the “Fund”).
Total returns take into account changes in share price and assume reinvestment of dividends and capital gains distributions, if any. Total returns shown are net of Fund fees and expenses but do not reflect fees and charges associated with the variable contracts such as administrative fees, account charges and surrender charges, which, if reflected, would reduce the Fund’s total returns for all periods shown.
The performance data quoted represent past performance; past performance does not guarantee future results. Investment return and principal value will fluctuate so your shares, when redeemed, may be worth more or less than their original cost. Current performance may be higher or lower than the performance data quoted. Periods less than one year are not annualized. Please call 800-493-3042 or visit the Fund’s website at http://www.geam.com for the most recent month-end performance data.
An investment in the Fund is not a deposit of any bank and is not insured or guaranteed by the Federal Deposit Insurance Corporation (FDIC) or any other government agency. An investment in the Fund is subject to risk, including possible loss of principal invested.
The S&P 500® Index is an unmanaged, market capitalization-weighted index of stocks of 500 large U.S. companies, which is widely used as a measure of large-cap stock market performance. The results shown for the foregoing index assume the reinvestment of net dividends or interest. They do not reflect the actual cost of investing in the instruments that comprise the index.
The peer universe of the underlying annuity funds used for the peer group average annual total return calculation is based on a blend of Morningstar peer categories, as shown. Morningstar is an independent mutual fund rating service. A Fund’s performance may be compared to or ranked within a universe of mutual funds with investment objectives and policies similar but not necessarily identical to that of the Fund.
©2010 Morningstar, Inc. All Rights Reserved. The Morningstar information contained herein: (1) is proprietary to Morningstar and/or its content providers; (2) may not be copied or distributed; and (3) is no warranted to be accurate, complete or timely. Neither Morningstar nor its content providers are responsible for any damage or losses relating from any use of this information. Past performance is no guarantee or future results.
GE Investment Distributors, Inc., Member of FINRA & SIPC, is the principal underwriter and distributor of the GE Investments Funds, Inc. and a wholly owned subsidiary of GE Asset Management Incorporated, the investment adviser of the Fund.
1
| | | | |
| Core Value Equity Fund | | | (unaudited) | |

Stephen V. Gelhaus

Paul C. Reinhardt
The Core Value Equity Fund is co-managed by Paul C. Reinhardt and Stephen V. Gelhaus. Messrs. Reinhardt and Gelhaus both manage the Fund as a collaborative team. Both portfolio managers have the authority to increase or decrease existing positions in the Fund; however, Mr. Reinhardt, as lead manager, is vested with the authority to purchase securities that are new to the Fund or to divest the Fund of its entire position in a security. Mr. Reinhardt also has veto authority over Mr. Gelhaus’ trade decisions.
Paul Reinhardt is a Senior Vice President of GE Asset Management and lead portfolio manager of the Core Value Equity Fund. He has served in this capacity since April 2002. Mr. Reinhardt joined GE Asset Management in 1982 as an equity analyst and has been a portfolio manager since 1987.
Stephen V. Gelhaus is a Senior Vice President of GE Asset Management. He has been a member of the portfolio management team for the Core Value Equity Fund since January 2002. Mr. Gelhaus joined GE Asset Management in June 1991 and was a research analyst in the U.S. equities group from 1995 through 2001 and became an associate portfolio manager for the Core Value Equity Fund in August 1999.
| Q. | How did the Core Value Equity Fund perform compared to its benchmarks and Morningstar peer group for the twelve-month period ended December 31, 2010? |
| A. | For the twelve-month period ended December 31, 2010, the Core Value Equity Fund returned 11.57% for Class 1 shares and 11.12% for Class 4 shares. The S&P 500 Index, the Fund’s benchmark, returned 15.06% and the Fund’s Morningstar peer group of 454 US Insurance Large Blend funds returned on average of 14.31% for the same period. |
| Q. | What market conditions impacted the Fund performance? |
| A. | 2010’s 15% advance did not feel like an easy climb for the S&P 500, amid ongoing debate around the durability of the economic expansion. Indeed, all U.S. equity |
indices were in negative territory at mid-year and over much of the summer, beset by concerns about the European debt crisis, persistently high unemployment levels and skyrocketing government debt. However, reassurances that the Fed would purchase additional treasury bonds in a $600B “quantitative easing-2” program ignited a mighty second-half rally. In this environment, cyclical sectors generally outperformed, while defensive sectors lagged. For the year, the S&P 500 consumer discretionary, industrials, materials and energy sectors each advanced over 20%, while health care, utilities and IT lagged.
2010 was a challenging investment environment for large-cap, high quality investors. Small and mid-cap companies led—typical in the early innings of economic recovery. Smaller companies also benefitted from increased M&A activity as larger companies looked to spend excess balance sheet cash on strategic acquisitions. Low quality also outperformed high quality, with an approximately 22% increase in S&P 500 C-rated companies, while the high-quality A-rated companies rose only 15%. We generally prefer to invest in high quality companies, and acknowledge that relative performance may be challenged in the early stages of an economic recovery, when higher-risk (i.e., lower quality) companies get re-rated. We continue to believe that higher quality companies can make the best long-term investments, and a diversified portfolio of high quality large-caps has the potential to outperform over a full market cycle.
Amid the year’s uncertainties, correlations of performance among S&P 500 stocks reached levels unseen since the Great Depression. It was difficult for the active manager to differentiate as top-down factors moved the markets, with fundamentals largely ignored. For example, Microsoft achieved and raised earnings estimates throughout the year, yet the stock lagged. This seeming disconnect between fundamentals, valuations and performance created a source of frustration for many large-cap active managers.
2

| Q. | What were the primary drivers of Fund performance? |
| A. | The Fund lagged the S&P 500 in the market environment favoring smaller-cap, low quality companies in 2010. However, the Fund’s investments in materials and industrials helped both absolute and relative returns, as these sectors were up 41% and 35% respectively. For example, the Fund benefited from investments in Deere & Co. and Potash Corp. of Saskatchewan, as both stocks soared on strong agricultural commodity demand. Potash had a takeover bid from BHP Billiton but remained an independent global fertilizer provider at year-end. Deere benefited from robust overseas demand and strengthening U.S. orders as sales picked up for its industrial and agricultural machinery. As metals prices increased, so did the stocks of some of our metals and mining holdings, including Barrick Gold (+36%), Freeport McMoran Copper & Gold (+53%) and Allegheny Technologies (+25%). Another key holding that bolstered returns was Honeywell, up 39%. Honeywell has generated strong free cash flow and earnings growth as its aerospace and material segments continue to build momentum. Amid signs of firming demand in the U.S., the railroad stocks skyrocketed, and Union Pacific (+48%) contributed significantly to returns. |
In terms of portfolio detractors, the technology sector saw a divergence in performance between the larger-cap, less cyclical companies and firms more leveraged to key trends like smart phones and cloud computing. For instance, not owning Apple (+53%) was the Fund’s greatest single performance detractor. Other stocks that dragged on performance included Hewlett-Packard (-18%) which pulled back after CEO Mark Hurd departed. We trimmed our position in HP as our thesis regarding management had changed. Western Union (-.05%) was another detractor, which underperformed on concerns about U.S. money transfer pricing. At year-end we continued to believe that the global brand name companies in technology that we hold, including Western Union and others like IBM and Texas Instruments, were attractively valued based on both earnings and free cash flow.
Stock selection in consumer discretionary and health care stocks also detracted from returns. Within consumer discretionary, we remained underweighted in autos, gaming, lodging, retail and restaurants as we felt some of these stocks were overvalued. Instead, we had larger positions in media companies, which returned only 16% compared to the sector overall at over 27%. The Fund’s health care selections further weighed on returns, as illustrated by Baxter International (-27%) and Covidien (-3%). Baxter was eliminated on deteriorating fundamentals while we added to Covidien as the company’s improving business mix and low valuation made the stock attractive to us.
| Q. | Were there any significant changes to the Fund during the period? |
| A. | The Fund continued to emphasize financially strong companies that the investment team believes can gain market share in all economic environments. The biggest changes in positioning included new holdings added in energy and increased exposure in financials. In fact, at year end financials and energy represented the portfolio’s largest overweights. We built our energy overweight taking advantage of valuations in the sector, and anticipating long-term supply-demand imbalances in both the E&P and energy service industries. We initiated positions in Suncor and Weatherford International, while adding to our Apache, Chevron and El Paso Energy positions. Within consumer staples, the valuation of large-cap, multinational consumer companies became even more compelling. Thus, we increased our exposure to consumer staples, adding to Archer Daniels Midland, Clorox and Kraft. |
We funded these purchases with proceeds from some financials sales, including eliminations of Goldman Sachs, Aon and MetLife post the announcement of the firm’s purchase of AIG’s life insurance business. We also sold Baxter International, Boston Scientific, CVS Caremark and Alliant Techsystems due to fundamental concerns. We also lightened our exposure to industrials, taking profits in names like Deere, Eaton, Union Pacific and Rockwell Collins as they rallied. By the end of the year, industrials joined consumer discretionary and information technology as the largest underweighted sectors in the portfolio.
3
| | | | |
| Core Value Equity Fund | | | (unaudited) | |
Understanding Your Fund’s Expenses
As a shareholder of the Fund you incur transaction and ongoing expenses. Transaction expenses including sales charges on purchases payments, reinvested dividends (or other distributions), and redemption fees directly reduce the investment return of the Fund. Ongoing costs include portfolio management fees, distribution and services fees, professional fees, administrative fees and other Fund expenses. The following example is intended to help you understand your ongoing costs (in dollars) of investing in the Fund and to compare these costs with the ongoing costs of investing in other mutual funds.
To illustrate these ongoing costs, we have provided an example and calculated the expenses paid by investors during the period. The information in the following table is based on an investment of $1,000, which is invested at the beginning of the period and held for the entire six-month period ended December 31, 2010.
Actual Expenses
The first section of the table provides information about actual account values and actual expenses. You may use the information in this section, together with the amount you invested, to estimate the expenses that you paid
over the period. To do so, simply divide your account value by $1,000 (for example, an $8,600 account value divided by $1,000 = 8.6), then multiply the result by the number given for your class under the heading “Expenses paid during period.”
Hypothetical Example for Comparison Purposes
The second section of the table provides information about hypothetical account values and hypothetical expenses based on the Fund’s actual expense ratio and an assumed rate of return of 5% per year before expenses, which is not the Fund’s actual return. You may use this information to compare the ongoing costs of investing in the Fund and other funds. To do so, compare this 5% hypothetical example with the 5% hypothetical examples that appear in the shareholders reports of other funds.
Please note that the expenses shown in the table for both “Actual” and “Hypothetical” do not reflect any transaction costs, such as sales charges or redemption fees. Additionally, the expenses shown do not reflect the fees or charges associated with variable contracts through which shares of the Fund are offered.
July 1, 2010 – December 31, 2010
| | | | | | | | | | | | |
| | | Account value at the
beginning of the period ($) | | | Account value at the
end of the period ($) | | | Expenses paid
during the period ($)* | |
Actual Fund Return** | | | | | | | | | |
Class 1 | | | 1,000.00 | | | | 1,222.12 | | | | 5.43 | |
Class 4 | | | 1,000.00 | | | | 1,218.78 | | | | 7.77 | |
Hypothetical 5% Return (2.5% for the period) | | | | | | | | | |
Class 1 | | | 1,000.00 | | | | 1,020.12 | | | | 4.94 | |
Class 4 | | | 1,000.00 | | | | 1,018.04 | | | | 7.07 | |
| * | | Expenses are equal to the Fund’s annualized expense ratio of 0.97% for Class 1 shares and 1.39% for Class 4 shares (for the period July 1, 2010—December 31, 2010), multiplied by the average account value over the period, multiplied by 184/365 (to reflect the one-half year period). |
| ** | | Actual Fund Returns for the six-month period ended December 31, 2010 were as follows: 22.21% for Class 1 shares, and 21.88% for Class 4 shares. Past performance does not guarantee future results. |
4
| | |
| Core Value Equity Fund | | (unaudited) |
Investment Profile
A Mutual Fund designed for investors who seek long-term growth of capital and future income by investing at least 80% of its net assets in equity common and preferred stocks and other types of equity securities. The Fund primarily in U.S. companies that the portfolio manager believes are undervalued by the market but have solid growth prospects.
Morningstar Performance Comparison
Based on average annual returns for periods ended 12/31/10
| | | | | | | | | | | | | | | | |
| | | | | | One
Year | | | Five
Year | | | Ten
Year | |
Number of Funds in peer group: | | | | | | | 454 | | | | 397 | | | | 302 | |
Peer group average annual total return: | | | | | | | 14.31 | % | | | 1.86 | % | | | 1.14 | % |
Morningstar category in peer group: U.S. Insurance Large Blend | | | | | | | | | | | | | | | | |
Sector Allocation
as a % of Fair Value (c) of $19,859 (in thousands) on December 31, 2010 (b)(c)
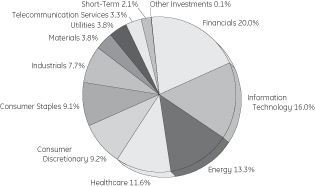
Top Ten Largest Holdings
as of December 31, 2010 (as a % of Fair Value) (b)(c)
| | | | |
Chevron Corp. | | | 2.86% | |
JPMorgan Chase & Co. | | | 2.86% | |
Microsoft Corp. | | | 2.78% | |
International Business Machines Corp. | | | 2.72% | |
Time Warner Inc. | | | 2.33% | |
The Procter & Gamble Co. | | | 2.32% | |
Johnson & Johnson | | | 2.23% | |
Intel Corp. | | | 2.21% | |
Exxon Mobil Corp. | | | 2.09% | |
Wells Fargo & Co. | | | 1.99% | |
Change in Value of a $10,000 Investment
Class 1 Shares
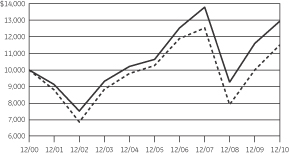
Average Annual Total Return
for the Periods Ended December 31, 2010
Class 1 Shares (Inception date: 4/28/00)
| | | | | | | | | | | | | | | | |
| | | One
Year | | | Five
Year | | | Ten
Year | | | Ending
Value of a
$10,000
investment (a) | |
Core Value Equity Fund | | | 11.57% | | | | 4.01% | | | | 2.62% | | | | 12,953 | |
S&P 500 Index | | | 15.06% | | | | 2.29% | | | | 1.41% | | | | 11,508 | |
Change in Value of a $10,000 Investment
Class 4 Shares
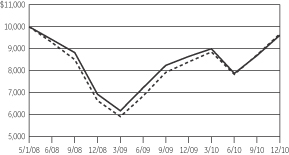
Average Annual Total Returns
for the Periods Ended December 31, 2010
Class 4 Shares (Inception date: 5/1/08)
| | | | | | | | | | | | | | | | |
| | | | | | One Year | | | Since
Inception | | | Ending
Value of a
$10,000
investment (a) | |
Core Value Equity Fund | | | | | | | 11.12% | | | | -1.53% | | | | 9,596 | |
S&P 500 Index | | | | | | | 15.06% | | | | -1.31% | | | | 9,654 | |

| (a) | Ending value of a $10,000 investment for the ten-year period or since inception, whichever is less. |
| (b) | The securities information regarding holdings, allocations and other characteristics is presented to illustrate examples of securities that the Fund has bought and the diversity of areas in which the Fund may invest as of a particular date. It may not be representative of the Fund’s current or future investments and should not be construed as a recommendation to purchase or sell a particular security. |
| (c) | Fair value basis is inclusive of Short Term Investment in GE Money Market Fund. |
See Notes to Performance on page 1 for further information, including an explanation of Morningstar peer categories.
Past performance does not predict future performance and the graph and table do not reflect the deduction of taxes that a shareholder would pay on Fund distributions or the redemption of Fund shares and do not reflect the fees or charges that would be associated with variable contracts through which shares of the Fund are offered.
5
Core Value Equity Fund
| | |
| Schedule of Investments | | December 31, 2010 |
Core Value Equity Fund
| | | | | | | | | | |
| | | |
| | | Number
of Shares | | | Fair Value | | | |
Common Stock — 96.7%† | | | |
| |
Advertising — 2.0% | | | |
| | | |
Omnicom Group Inc. | | | 8,611 | | | $ | 394,384 | | | |
| |
Aerospace & Defense — 2.3% | | | |
| | | |
Honeywell International Inc. | | | 7,148 | | | | 379,988 | | | |
Rockwell Collins Inc. | | | 1,381 | | | | 80,457 | | | |
| | | | | | | 460,445 | | | |
| |
Agricultural Products — 1.0% | | | |
| | | |
Archer-Daniels-Midland Co. | | | 6,346 | | | | 190,888 | | | |
| |
Air Freight & Logistics — 0.8% | | | |
| | | |
FedEx Corp. | | | 1,700 | | | | 158,117 | | | |
| |
Asset Management & Custody Banks — 5.3% | | | |
| | | |
Ameriprise Financial Inc. | | | 6,233 | | | | 358,709 | | | |
Invesco Ltd. | | | 6,518 | | | | 156,823 | | | |
State Street Corp. | | | 5,326 | | | | 246,807 | | | (c) |
The Bank of New York Mellon Corp. | | | 9,237 | | | | 278,957 | | | |
| | | | | | | 1,041,296 | | | |
| |
Biotechnology — 1.9% | | | |
| | | |
Amgen Inc. | | | 2,832 | | | | 155,477 | | | (a) |
Gilead Sciences Inc. | | | 5,951 | | | | 215,664 | | | (a) |
| | | | | | | 371,141 | | | |
| |
Coal & Consumable Fuels — 0.5% | | | |
| | | |
Peabody Energy Corp. | | | 1,564 | | | | 100,065 | | | |
| |
Communications Equipment — 1.1% | | | |
| | | |
Cisco Systems Inc. | | | 11,048 | | | | 223,501 | | | (a) |
| | |
Computer Hardware — 0.8% | | | | | | | |
| | | |
Hewlett-Packard Co. | | | 3,849 | | | | 162,043 | | | |
| |
Construction & Farm Machinery & Heavy Trucks — 1.4% | | | |
| | | |
Deere & Co. | | | 3,244 | | | | 269,414 | | | |
| |
Consumer Finance — 0.7% | | | |
| | | |
American Express Co. | | | 3,401 | | | | 145,971 | | | |
|
Data Processing & Outsourced Services — 1.6% |
| | | |
The Western Union Co. | | | 17,374 | | | | 322,635 | | | |
| |
Department Stores — 0.5% | | | |
| | | |
Macy’s Inc. | | | 4,233 | | | | 107,095 | | | |
| | | | | | | | | | |
| | | |
| | | Number
of Shares | | | Fair Value | | | |
| |
Diversified Financial Services — 7.4% | | | |
| | | |
Bank of America Corp. | | | 18,143 | | | $ | 242,028 | | | |
Citigroup Inc. | | | 34,871 | | | | 164,940 | | | (a) |
JPMorgan Chase & Co. | | | 13,373 | | | | 567,283 | | | |
US BanCorp | | | 3,299 | | | | 88,974 | | | |
Wells Fargo & Co. | | | 12,749 | | | | 395,092 | | | |
| | | | | | | 1,458,317 | | | |
| |
Diversified Metals & Mining — 1.1% | | | |
| | | |
Freeport-McMoRan Copper & Gold Inc. | | | 1,749 | | | | 210,037 | | | |
| |
Drug Retail — 0.4% | | | |
| | | |
CVS Caremark Corp. | | | 2,551 | | | | 88,698 | | | |
| |
Electric Utilities — 2.0% | | | |
| | | |
Edison International | | | 2,153 | | | | 83,106 | | | |
Entergy Corp. | | | 1,416 | | | | 100,295 | | | |
NextEra Energy Inc. | | | 2,639 | | | | 137,202 | | | |
Northeast Utilities | | | 2,584 | | | | 82,378 | | | |
| | | | | | | 402,981 | | | |
| |
Electrical Components & Equipment — 0.5% | | | |
| | | |
Cooper Industries PLC | | | 1,700 | | | | 99,093 | | | |
| |
Electronic Components — 0.7% | | | |
| | | |
Corning Inc. | | | 7,147 | | | | 138,080 | | | |
| |
Fertilizers & Agricultural Chemicals — 0.8% | | | |
| | | |
Potash Corporation of Saskatchewan Inc. | | | 1,045 | | | | 161,797 | | | |
| |
General Merchandise Stores — 0.6% | | | |
| | | |
Target Corp. | | | 1,925 | | | | 115,750 | | | |
| |
Gold — 0.6% | | | |
| | | |
Barrick Gold Corp. | | | 2,266 | | | | 120,506 | | | |
| |
Healthcare Distributors — 0.5% | | | |
| | | |
Cardinal Health Inc. | | | 2,550 | | | | 97,691 | | | |
| |
Healthcare Equipment — 2.2% | | | |
| | | |
Becton Dickinson and Co. | | | 737 | | | | 62,291 | | | |
Covidien PLC | | | 8,241 | | | | 376,284 | | | |
| | | | | | | 438,575 | | | |
| |
Healthcare Services — 1.4% | | | |
| | | |
Medco Health Solutions Inc. | | | 1,304 | | | | 79,896 | | | (a) |
Omnicare Inc. | | | 7,422 | | | | 188,445 | | | |
| | | | | | | 268,341 | | | |
| |
Home Improvement Retail — 0.8% | | | |
| | | |
Lowe’s companies Inc. | | | 6,488 | | | | 162,719 | | | |
See Notes to Schedule of Investments and Notes to Financial Statements.
6
Core Value Equity Fund
| | |
| Schedule of Investments | | December 31, 2010 |
| | | | | | | | | | |
| | | |
| | | Number
of Shares | | | Fair Value | | | |
| |
Home Furnishing Retail — 0.3% | | | |
| | | |
Bed Bath & Beyond Inc. | | | 1,245 | | | $ | 61,192 | | | (a) |
| |
Hotels, Resorts & Cruise Lines — 0.2% | | | |
| | | |
Carnival Corp. | | | 825 | | | | 38,041 | | | |
| |
Household Products — 3.6% | | | |
| | | |
Clorox Co. | | | 3,959 | | | | 250,526 | | | |
The Procter & Gamble Co. | | | 7,147 | | | | 459,767 | | | |
| | | | | | | 710,293 | | | |
| |
Independent Power Producers & Energy Traders — 0.6% | | | |
| | | |
Calpine Corp. | | | 4,618 | | | | 61,604 | | | (a) |
The AES Corp. | | | 4,991 | | | | 60,790 | | | (a) |
| | | | | | | 122,394 | | | |
| |
Industrial Machinery — 0.2% | | | |
| | | |
Eaton Corp. | | | 385 | | | | 39,081 | | | |
| |
Integrated Oil & Gas — 6.7% | | | |
| | | |
Chevron Corp. | | | 6,233 | | | | 568,761 | | | |
Exxon Mobil Corp. | | | 5,665 | | | | 414,225 | | | (d) |
Marathon Oil Corp. | | | 3,965 | | | | 146,824 | | | |
Suncor Energy Inc. | | | 4,987 | | | | 190,952 | | | |
| | | | | | | 1,320,762 | | | |
|
Integrated Telecommunication Services — 3.1% |
| | | |
AT&T Inc. | | | 12,261 | | | | 360,228 | | | |
Verizon Communications Inc. | | | 7,148 | | | | 255,755 | | | |
| | | | | | | 615,983 | | | |
| |
Investment Banking & Brokerage — 0.8% | | | |
| | | |
Morgan Stanley | | | 6,048 | | | | 164,566 | | | |
| |
IT Consulting & Other Services — 2.7% | | | |
| | | |
International Business Machines Corp. | | | 3,682 | | | | 540,370 | | | |
| |
Life & Health Insurance — 3.6% | | | |
| | | |
MetLife Inc. | | | 3,904 | | | | 173,494 | | | |
Principal Financial Group Inc. | | | 6,598 | | | | 214,831 | | | |
Prudential Financial Inc. | | | 5,498 | | | | 322,788 | | | |
| | | | | | | 711,113 | | | |
| |
Life Sciences Tools & Services — 1.0% | | | |
| | | |
Thermo Fisher Scientific Inc. | | | 3,464 | | | | 191,767 | | | (a) |
| |
Movies & Entertainment — 4.8% | | | |
| | | |
News Corp. | | | 16,934 | | | | 246,559 | | | |
The Walt Disney Co. | | | 6,323 | | | | 237,176 | | | |
Time Warner Inc. | | | 14,405 | | | | 463,409 | | | |
| | | | | | | 947,144 | | | |
| | | | | | | | | | |
| | | |
| | | Number
of Shares | | | Fair Value | | | |
| |
Multi-Utilities — 1.2% | | | |
| | | |
Dominion Resources Inc. | | | 5,498 | | | $ | 234,875 | | | |
| |
Oil & Gas Equipment & Services — 2.3% | | | |
| | | |
Halliburton Co. | | | 1,649 | | | | 67,329 | | | |
National Oilwell Varco Inc. | | | 1,416 | | | | 95,226 | | | |
Schlumberger Ltd. | | | 2,347 | | | | 195,974 | | | |
Weatherford International Ltd. | | | 4,021 | | | | 91,679 | | | (a) |
| | | | | | | 450,208 | | | |
| |
Oil & Gas Exploration & Production — 2.5% | | | |
| | | |
Apache Corp. | | | 3,079 | | | | 367,109 | | | |
Devon Energy Corp. | | | 1,539 | | | | 120,827 | | | |
| | | | | | | 487,936 | | | |
| |
Oil & Gas Storage & Transportation — 1.4% | | | |
| | | |
El Paso Corp. | | | 13,600 | | | | 187,136 | | | |
Spectra Energy Corp. | | | 3,574 | | | | 89,314 | | | |
| | | | | | | 276,450 | | | |
| |
Packaged Foods & Meats — 2.3% | | | |
| | | |
Kraft Foods Inc. | | | 10,281 | | | | 323,954 | | | |
McCormick & Company Inc. | | | 1,189 | | | | 55,324 | | | |
Nestle S.A. ADR | | | 1,132 | | | | 66,584 | | | |
| | | | | | | 445,862 | | | |
| |
Pharmaceuticals — 4.7% | | | |
| | | |
Bristol-Myers Squibb Co. | | | 5,666 | | | | 150,036 | | | |
Johnson & Johnson | | | 7,147 | | | | 442,042 | | | |
Novartis AG ADR | | | 2,370 | | | | 139,711 | | | |
Pfizer Inc. | | | 11,505 | | | | 201,453 | | | |
| | | | | | | 933,242 | | | |
| |
Property & Casualty Insurance — 1.1% | | | |
| | | |
ACE Ltd. | | | 3,625 | | | | 225,656 | | | |
| |
Railroads — 1.3% | | | |
| | | |
Union Pacific Corp. | | | 2,694 | | | | 249,626 | | | |
| |
Reinsurance — 0.9% | | | |
| | | |
PartnerRe Ltd. | | | 2,086 | | | | 167,610 | | | |
| |
Semiconductor Equipment — 0.7% | | | |
| | | |
KLA-Tencor Corp. | | | 3,341 | | | | 129,096 | | | |
| |
Semiconductors — 4.0% | | | |
| | | |
Intel Corp. | | | 20,907 | | | | 439,674 | | | |
Microchip Technology Inc. | | | 2,531 | | | | 86,586 | | | |
Texas Instruments Inc. | | | 8,082 | | | | 262,665 | | | |
| | | | | | | 788,925 | | | |
| |
Soft Drinks — 1.9% | | | |
| | | |
PepsiCo Inc. | | | 5,828 | | | | 380,743 | | | |
See Notes to Schedule of Investments and Notes to Financial Statements.
7
Core Value Equity Fund
| | |
| Schedule of Investments | | December 31, 2010 |
| | | | | | | | | | |
| | | |
| | | Number
of Shares | | | Fair Value | | | |
| | | |
Steel — 1.3% | | | | | | | | | | |
| | | |
Allegheny Technologies Inc. | | | 4,563 | | | $ | 251,786 | | | |
| |
Systems Software — 4.4% | | | |
| | | |
Microsoft Corp. | | | 19,793 | | | | 552,620 | | | (d) |
Oracle Corp. | | | 10,171 | | | | 318,352 | | | |
| | | | | | | 870,972 | | | |
| |
Wireless Telecommunication Services — 0.2% | | | |
| | | |
American Tower Corp. | | | 907 | | | | 46,837 | | | (a) |
| | | |
Total Common Stock
(Cost $16,116,250) | | | | | | | 19,112,110 | | | |
Exchange Traded Funds — 1.6% | | | |
| | | |
Financial Select Sector SPDR Fund | | | 4,042 | | | | 64,470 | | | (f) |
Industrial Select Sector SPDR Fund | | | 7,313 | | | | 255,224 | | | (d,f) |
| | | |
Total Exchange Traded Funds
(Cost $342,887) | | | | | | | 319,694 | | | |
Other Investments — 0.1% | | | |
| | | |
GEI Investment Fund
(Cost $8,991) | | | | | | | 8,541 | | | (e) |
| | | |
Total Investments in Securities
(Cost $16,468,128) | | | | | | | 19,440,345 | | | |
Short-Term Investments — 2.1% | | | |
GE Money Market Fund Institutional
Class 0.00%
(Cost $418,802) | | | | | | | 418,802 | | | (b,e) |
| | | |
Total Investments
(Cost $16,886,930) | | | | | | | 19,859,147 | | | |
| | |
Liabilities in Excess of Other Assets,
net — (0.5)% | | | | (93,919 | ) | | |
| | | | | | | | | | |
| | | |
NET ASSETS — 100.0% | | | | | | $ | 19,765,228 | | | |
| | | | | | | | | | |
The Fund had the following long futures contracts open at December 31, 2010:
| | | | | | | | | | | | | | | | |
| Description | | Expiration
date | | | Number
of
Contracts | | | Current
Notional
Value | | | Unrealized
Appreciation | |
S&P 500 Emini Index Futures | | | March 2011 | | | | 2 | | | $ | 125,300 | | | $ | 1,604 | |
See Notes to Schedule of Investments and Notes to Financial Statements.
8
| | |
| Notes to Schedule of Investments | | December 31, 2010 |
The views expressed in this document reflect our judgment as of the publication date and are subject to change at any time without notice. The securities information regarding holdings, allocations and other characteristics are presented as of a particular date to illustrate examples of securities that the Fund has bought and the diversity of areas in which the Fund may invest as of a particular date. It may not be representative of the Fund’s current or future investments and should not be construed as a recommendation to purchase or sell a particular security. See the Fund’s prospectus for complete descriptions of investment objectives, policies, risks and permissible investments.
| (a) | Non-income producing security. |
| (b) | Coupon amount represents effective yield. |
| (c) | State Street Corp. is the parent company of State Street Bank & Trust Co., the Fund’s custodian and accounting agent. |
| (d) | At December 31, 2010, all or a portion of this security was pledged to cover collateral requirements for futures, options, forward foreign currency contracts and/or TBA’s. |
| (e) | GE Asset Management, the investment adviser of the Fund, also serves as investment adviser of the GEI Investment Fund and the GE Funds-GE Money Market Fund. |
| (f) | Sponsored by SSgA Funds Management, Inc., an affiliate of State Street Bank & Trust Co., the Fund’s custodian and accounting agent. |
| † | Percentages are based on net assets as of December 31, 2010 . |
Abbreviations:
| | |
| |
ADR | | American Depository Receipt |
| |
SPDR | | Standard & Poors Depository Receipts |
9
Financial Highlights
Selected data based on a share outstanding throughout the fiscal years indicated
| | | | | | | | | | | | | | | | | | | | | | | | | | | | | | | | | | | | |
| | | CLASS 1 | | | | | | CLASS 4 | |
| | | 12/31/10 | | | 12/31/09 | | | 12/31/08 | | | 12/31/07 | | | 12/31/06 | | | | | | 12/31/10 | | | 12/31/09 | | | 12/31/08 | |
| Inception date | | | — | | | | — | | | | — | | | | — | | | | 4/28/00 | | | | | | | | — | | | | — | | | | 5/1/08 | |
Net asset value, beginning of period | | $ | 8.04 | | | $ | 6.48 | | | $ | 10.16 | | | $ | 10.70 | | | $ | 10.01 | | | | | | | $ | 8.04 | | | $ | 6.49 | | | | $9.82 | |
Income/(loss) from investment operations: | | | | | | | | | | | | | | | | | | | | | | | | | | | | | | | | | | | | |
Net investment income | | | 0.11 | ** | | | 0.08 | | | | 0.11 | | | | 0.12 | | | | 0.17 | | | | | | | | 0.07 | ** | | | 0.01 | | | | 0.05 | ** |
Net realized and unrealized
gains/(losses) on investments | | | 0.82 | | | | 1.57 | | | | (3.46) | | | | 0.97 | | | | 1.62 | | | | | | | | 0.82 | | | | 1.60 | | | | (3.08) | |
Total income/(loss) from
investment operations | | | 0.93 | | | | 1.65 | | | | (3.35) | | | | 1.09 | | | | 1.79 | | | | | | | | 0.89 | | | | 1.61 | | | | (3.03) | |
Less distributions from: | | | | | | | | | | | | | | | | | | | | | | | | | | | | | | | | | | | | |
Net investment income | | | 0.12 | | | | 0.09 | | | | 0.12 | | | | 0.12 | | | | 0.17 | | | | | | | | 0.08 | | | | 0.06 | | | | 0.09 | |
Net realized gains | | | — | | | | — | | | | 0.21 | | | | 1.51 | | | | 0.93 | | | | | | | | — | | | | — | | | | 0.21 | |
Total distributions | | | 0.12 | | | | 0.09 | | | | 0.33 | | | | 1.63 | | | | 1.10 | | | | | | | | 0.08 | | | | 0.06 | | | | 0.30 | |
Net asset value, end of period | | $ | 8.85 | | | $ | 8.04 | | | $ | 6.48 | | | $ | 10.16 | | | $ | 10.70 | | | | | | | $ | 8.85 | | | $ | 8.04 | | | | $6.49 | |
TOTAL RETURN (a) | | | 11.57% | | | | 25.40% | | | | (32.94)% | | | | 10.10% | | | | 17.85% | | | | | | | | 11.12% | | | | 24.74% | | | | (30.77)% | |
| | | | | | | | | |
RATIOS/SUPPLEMENTAL DATA: | | | | | | | | | | | | | | | | | | | | | | | | | | | | | | | | | | | | |
Net assets, end of period (in thousands) | | | $19,756 | | | | $21,847 | | | | $20,361 | | | | $37,765 | | | | $39,683 | | | | | | | | $10 | | | | $9 | | | | $7 | |
Ratios to average net assets: | | | | | | | | | | | | | | | | | | | | | | | | | | | | | | | | | | | | |
Net investment income (loss) | | | 1.32% | | | | 1.16% | | | | 1.18% | | | | 0.96% | | | | 1.55% | | | | | | | | 0.91% | | | | 0.72% | | | | 0.95% | * |
Net expenses | | | 0.97% | (b) | | | 1.24% | (b) | | | 0.95% | (b) | | | 0.81% | | | | 0.81% | | | | | | | | 1.39% | (b) | | | 1.69% | (b) | | | 1.40% | (b)* |
Gross expenses | | | 0.97% | | | | 1.24% | | | | 0.95% | | | | 0.81% | | | | 0.81% | | | | | | | | 1.39% | | | | 1.69% | | | | 1.40% | |
Portfolio turnover rate | | | 45% | | | | 61% | | | | 68% | | | | 45% | | | | 42% | | | | | | | | 45% | | | | 61% | | | | 68% | |
Notes to Financial Highlights
| (a) | Total returns are historical and assume changes in share price, reinvestment of dividends and capital gains distributions, and do not include the effect of insurance contract charges. Past performance does not guarantee future results. |
| (b) | Reflects GE Asset Management’s waiver of a portion of the Fund’s management fee in an amount equal to the management fee earned by GEAM with respect to the Fund’s investment in the GE Funds – GE Money Market Fund. Excluding waiver, the expense ratios would be unchanged. |
| * | Annualized for periods less than one year. |
| ** | Per share values have been calculated using the average share method. |
The accompanying Notes are an integral part of these financial statements.
10
| | | | |
Statement of Assets and Liabilities
December 31, 2010 | | | |
| |
ASSETS | | | | |
Investments in securities, at Fair Value (cost $16,459,137) | | | $19,431,804 | |
Investments in affiliated securities, at Fair Value (cost $8,991) | | | 8,541 | |
Short-term affiliated investments (at amortized cost) | | | 418,802 | |
Income receivables | | | 16,707 | |
Receivable for fund shares sold | | | 1,217 | |
Total Assets | | | 19,877,071 | |
| |
LIABILITIES | | | | |
Payable to GEAM | | | 10,784 | |
Accrued other expenses | | | 100,909 | |
Variation margin payable | | | 150 | |
Total Liabilities | | | 111,843 | |
NET ASSETS | | | $19,765,228 | |
| |
NET ASSETS CONSIST OF: | | | | |
Capital paid in | | | 20,194,726 | |
Undistributed (distribution in excess of) net investment income | | | (671 | ) |
Accumulated net realized gain (loss) | | | (3,402,648 | ) |
Net unrealized appreciation/(depreciation) on: | | | | |
Investments | | | 2,972,217 | |
Futures | | | 1,604 | |
NET ASSETS | | | $19,765,228 | |
| |
Class 1: | | | | |
| |
NET ASSETS | | | 19,755,630 | |
Shares outstanding ($0.01 par value; unlimited shares authorized) | | | 2,233,032 | |
Net asset value per share | | | $8.85 | |
| |
Class 4: | | | | |
| |
NET ASSETS | | | 9,598 | |
Shares outstanding ($0.01 par value; unlimited shares authorized) | | | 1,084 | |
Net asset value per share | | | $8.85 | |
The accompanying Notes are an integral part of these financial statements.
11
| | | | |
Statement of Operations
For the year ended December 31, 2010 | | | |
| |
INVESTMENT INCOME | | | | |
Income: | | | | |
Dividend | | | $454,896 | |
Interest | | | 3,710 | |
Interest from affiliated investments | | | 91 | |
Less: Foreign taxes withheld | | | (2,513 | ) |
Total Income | | | 456,184 | |
| |
Expenses: | | | | |
Advisory and administrative fees | | | 130,155 | |
Transfer agent fees | | | 13,014 | |
Directors’ fees | | | 715 | |
Custody and accounting expenses | | | 19,600 | |
Professional fees | | | 14,026 | |
Other expenses | | | 16,484 | |
Total expenses before waiver and reimbursement | | | 193,994 | |
Less: Expenses reimbursed by the adviser | | | (1,036 | ) |
Net expenses | | | 192,958 | |
Net investment income (loss) | | | 263,226 | |
| |
NET REALIZED AND UNREALIZED GAIN (LOSS)
ON INVESTMENTS | | | | |
| |
Realized gain (loss) on: | | | | |
Investments | | | 851,019 | |
Futures and other | | | 34,847 | |
| |
Increase (decrease) in unrealized appreciation/(depreciation) on: | | | | |
Investments | | | 919,429 | |
Futures | | | 3,263 | |
Net realized and unrealized gain (loss) on investments | | | 1,808,558 | |
Net increase (decrease) in net assets resulting from operations | | | $2,071,784 | |
The accompanying Notes are an integral part of these financial statements.
12
| | | | | | | | |
Statement of
Changes in Net Assets | | | |
| | | Year Ended
December 31,
2010 | | | Year Ended
December 31,
2009 | |
| | |
INCREASE (DECREASE) IN NET ASSETS | | | | | | | | |
Operations: | | | | | | | | |
Net investments income | | $ | 263,226 | | | $ | 229,050 | |
Net realized gain (loss) on investments, futures and foreign currency transactions | | | 885,866 | | | | (2,785,679 | ) |
Net increase (decrease) in unrealized appreciation/(depreciation)
on investments, futures and foreign currency transactions | | | 922,692 | | | | 7,048,101 | |
Net increase (decrease) from operations | | | 2,071,784 | | | | 4,491,472 | |
Distributions to shareholders from: | | | | | | | | |
Net investment income | | | | | | | | |
Class 1 | | | (265,366 | ) | | | (233,609 | ) |
Class 4 | | | (90 | ) | | | (60 | ) |
Total distributions | | | (265,456 | ) | | | (233,669 | ) |
Increase (decrease) in net assets from operations and distributions | | | 1,806,328 | | | | 4,257,803 | |
Share transactions: | | | | | | | | |
Proceeds from sale of shares | | | | | | | | |
Class 1 | | | 451,257 | | | | 615,077 | |
Class 4 | | | — | | | | — | |
Value of distributions reinvested | | | | | | | | |
Class 1 | | | 265,366 | | | | 233,609 | |
Class 4 | | | 90 | | | | 60 | |
Cost of shares redeemed | | | | | | | | |
Class 1 | | | (4,613,196 | ) | | | (3,618,774 | ) |
Class 4 | | | — | | | | — | |
Net increase (decrease) from share transactions | | | (3,896,483 | ) | | | (2,770,028 | ) |
Total increase (decrease) in net assets | | | (2,090,155 | ) | | | 1,487,775 | |
| | |
NET ASSETS | | | | | | | | |
Beginning of period | | | 21,855,383 | | | | 20,367,608 | |
End of period | | $ | 19,765,228 | | | $ | 21,855,383 | |
Undistributed (distribution in excess of)
net investment income, end of period | | $ | (671 | ) | | $ | — | |
| | |
CHANGES IN FUND SHARES | | | | | | | | |
| | |
Class 1 | | | | | | | | |
Shares sold | | | 54,320 | | | | 91,344 | |
Issued for distributions reinvested | | | 29,951 | | | | 28,806 | |
Shares redeemed | | | (569,397 | ) | | | (545,161 | ) |
Net increase (decrease) in fund shares | | | (485,126 | ) | | | (425,011 | ) |
| | |
Class 4 | | | | | | | | |
Shares sold | | | — | | | | — | |
Issued for distributions reinvested | | | 10 | | | | 7 | |
Shares redeemed | | | — | | | | — | |
Net increase (decrease) in fund shares | | | 10 | | | | 7 | |
The accompanying Notes are an integral part of these financial statements.
13
| | |
| Notes to Financial Statements | | December 31, 2010 |
| 1. | Organization of the Company |
GE Investments Funds, Inc. (the “Company”) was incorporated under the laws of the Commonwealth of Virginia on May 14, 1984 and is registered under the Investment Company Act of 1940, as amended (the “1940 Act”), as an open-end management investment company. The Company is composed of fourteen investment portfolios (collectively the “Funds”), although only the following eleven are currently being offered: U.S. Equity Fund, S&P 500 Index Fund, Premier Growth Equity Fund, Core Value Equity Fund (the “Fund”), Mid-Cap Equity Fund, Small-Cap Equity Fund, International Equity Fund, Total Return Fund, Income Fund, Money Market Fund and Real Estate Securities Fund.
Shares of the Funds of the Company are offered only to insurance company separate accounts that fund certain variable life insurance contracts and variable annuity contracts. GE Asset Management Incorporated (“GEAM”) is the investment adviser and administrator of each of the Funds.
The Company offers two share classes (Class 1 and Class 4) of the Fund. Class 4 shares were first offered on May 1, 2008, and Fund shares outstanding prior to May 1, 2008 were designated as Class 1 shares. Each share class has different fees and expenses, and as a result, each share class will have different share price and performance. Not all variable contracts offer both share classes of the Fund.
| 2. | Summary of Significant Accounting Policies |
The preparation of financial statements in conformity with U.S. generally accepted accounting principles (GAAP) requires management to make estimates and assumptions that affect the reported amounts of assets and liabilities and disclosure of contingent assets and liabilities at the date of the financial statements and the reported amounts of increases and decreases in net assets from operations during the reporting period. Actual results may differ from those estimates.
Subsequent events after the balance sheet date through the date the financial statements were issued, have been evaluated in the preparation of the financial statements. There are no items to report.
The following summarizes the significant accounting policies of the Company:
Securities Valuation and Transactions. All investments in securities are recorded at their estimated fair value, as described in Note 3.
Securities transactions are accounted for as of the trade date. Realized gains and losses on investments sold are recorded on the basis of identified cost for both financial statement and federal tax purposes.
The Fund’s income, expenses (other than distribution fees) and realized and unrealized gains and losses are allocated proportionally each day among the share classes based upon the relative net assets of each class.
Futures Contracts A futures contract represents a commitment for the future purchase or sale of an asset at a specified price on a specified date. The Fund invests in stock index futures contracts subject to certain limitations to manage its exposure to the stock markets. Buying futures tends to increase a Fund’s exposure to the underlying instrument while selling futures tends to decrease a Fund’s exposure to the underlying instrument or to hedge other Fund investments. With futures contracts, there is minimal counterparty credit risk to the Fund since futures contracts are exchange traded and the exchange’s clearinghouse, as counterparty to all traded futures, guarantees the futures against default. A Fund’s risks in using these contracts include changes in the value of the underlying instruments, non- performance of the counterparties under the contracts’ terms and changes in the liquidity of the secondary market for the contracts. Futures contracts are valued at the settlement price established each day by the board of trade or exchange on which they principally trade.
Upon entering into a financial futures contract, the Fund is required to pledge to the broker an amount of cash and/or other assets equal to a certain percentage of the contract amount, known as initial margin deposit. Subsequent payments, known as variation margin, are made or received by the Fund each day, depending on the daily fluctuation in the fair value of the underlying security. The Fund records an unrealized gain or loss equal to the daily variation margin. Should market conditions move unexpectedly, the Fund may not achieve the anticipated benefits of the futures contracts and may incur a loss. The Fund recognizes a realized gain or loss upon the expiration or closing of a futures contract.
Investment Income Corporate actions (including cash dividends) are recorded on the ex-dividend date, net of
14
| | |
| Notes to Financial Statements | | December 31, 2010 |
applicable withholding taxes. Interest income is recorded on the accrual basis.
Expenses Fund specific expenses are allocated to the Fund that incurs such expenses and pro rata across share classes. Expenses, other than those incurred by a specific Fund, are allocated pro rata among Funds and share classes. Such expenses may include custodial fees, legal and accounting fees, printing costs and registration fees. All expenses of the Fund are paid by GEAM and reimbursed by the Fund. Certain class specific expenses (such as transfer agency fees or distribution fees) are allocated to the class that incurs such expense.
Federal Income Taxes The Fund intends to comply with all sections of the Internal Revenue Code applicable to regulated investment companies including the distribution of substantially all of its taxable net investment income and net realized capital gains to its shareholders. Therefore, no provision for federal income tax has been made. The Fund is treated as a separate taxpayer for federal income tax purposes.
The Fund utilizes various methods to measure the fair value of most of its investments on a recurring basis. GAAP establishes a framework for measuring fair value and providing related disclosures. Broadly, the framework requires fair value to be determined based on the exchange price that would be received for an asset or paid to transfer a liability (an exit price) in the principal or most advantageous market for the asset or liability in an orderly transaction between market participants at the measurement date. In the absence of active markets for the identical assets or liabilities, such measurements involve developing assumptions based on market observable data and, in the absence of such data, internal information that is consistent with what market participants would use in a hypothetical transaction that occurs at the measurement date. It also establishes a three-level valuation hierarchy based upon observable and non-observable inputs.
Observable inputs reflect market data obtained from independent sources, while unobservable inputs reflect our market assumptions. Preference is given to observable inputs. These two types of inputs create the following fair value hierarchy:
Level 1 — Quoted prices for identical investments in active markets.
Level 2 — Quoted prices for similar investments in active markets; quoted prices for identical or similar investments in markets that are not active; and model-derived valuations whose inputs are observable or whose significant value drivers are observable.
Level 3 — Significant inputs to the valuation model are unobservable.
Policies and procedures are maintained to value investments using the best and most relevant data available. In addition, pricing vendors are utilized to assist in valuing investments. GEAM performs periodic reviews of the methodologies used by independent pricing services including price validation of individual securities.
Fair Value Measurement The following section describes the valuation methodologies the Fund uses to measure different financial investments at fair value.
The Fund’s portfolio securities are valued generally on the basis of market quotations. Equity securities generally are valued at the last reported sale price on the primary market in which they are traded. Portfolio securities listed on NASDAQ are valued using the NASDAQ Official Closing Price. Level 1 securities primarily include publicly-traded equity securities which may not necessarily represent the last sale price. If no sales occurred on the exchange or NASDAQ that day, the portfolio security generally is valued using the last reported bid price. In those circumstances the Fund classifies the investment securities in Level 2.
The Fund uses non-binding broker quotes as the primary basis for valuation when there is limited, or no, relevant market activity for a specific investment or for other investments that share similar characteristics. The Fund has not adjusted the prices obtained. Investment securities priced using non-binding broker quotes are included in Level 3. As is the case with the primary pricing vendor, third-party brokers do not provide access to their proprietary valuation models, inputs and assumptions. Accordingly, GEAM conducts internal reviews of pricing for all such investment securities periodically to ensure reasonableness of valuations used in the Fund‘s financial statements. These reviews are designed to identify prices that appear stale, those that have changed significantly from prior valuations, and other anomalies that may indicate that a price may not be accurate. Based on the information available, GEAM believes that the fair values provided by the brokers are representative of prices that would be received to sell the assets at the measurement date (exit prices).
15
| | |
| Notes to Financial Statements | | December 31, 2010 |
A Fund’s written or purchased options are valued at the last sales price, or if no sales occurred that day, at the last reported bid price and those are also included in Level 2.
If prices are not readily available for a portfolio security, or if it is believed that a price for a portfolio security does not represent its fair value, the security may be valued using procedures approved by the Fund’s Board of Directors that are designed to establish its “fair” value. These securities would be classified in Level 3. Those procedures require
that the fair value of a security be established by the valuation committee. The valuation committee follows different protocols for different types of investments and circumstances. The fair value procedures may be used to value any investment of the Fund in the appropriate circumstances.
The following table presents the Fund’s investments measured at fair value on a recurring basis at December 31, 2010:
| | | | | | | | | | | | | | | | |
Investments | | | Level 1 | | | | Level 2 | | | | Level 3 | | | | Total | |
Investments in Securities | | | | | | | | | | | | | | | | |
Common Stock | | $ | 19,112,110 | | | $ | — | | | $ | — | | | $ | 19,112,110 | |
Exchanged Traded Funds | | | 319,694 | | | | — | | | | — | | | | 319,694 | |
Other Investments | | | — | | | | 8,541 | | | | — | | | | 8,541 | |
Short-Term Investments | | | 418,802 | | | | — | | | | — | | | | 418,802 | |
| | | | | | | | | | | | | | | | |
Total Investments in Securities | | $ | 19,850,606 | | | $ | 8,541 | | | $ | — | | | $ | 19,859,147 | |
| | | | | | | | | | | | | | | | |
Other Financial Instruments | | | | | | | | | | | | | | | | |
Futures Contracts — Unrealized Appreciation | | $ | 1,604 | | | $ | — | | | $ | — | | | $ | 1,604 | |
| | | | | | | | | | | | | | | | |
| | | | |
| | | | | | | | | | | | | | | | | |
| 4. | Derivatives Transactions |
Shown below are the derivative contracts entered into by the Fund, summarized by primary risk exposure as they appear on the Statement of Assets and Liabilities, all of which are not accounted for as hedging instruments under FASB Accounting Standards Codification (“ASC”) No. 815 Derivatives and Hedging as of December 31, 2010.
| | | | | | | | | | | | |
| | | Asset Derivatives | | | Liability Derivatives | |
| | | Location | | Fair Value($) | | | Location | | Fair Value($) | |
| Equity Futures | | Assets, Net Assets — Unrealized Appreciation/ (Depreciation) on Futures | | | 1,604 | * | | | | | | |
Shown below are the effects of derivative instruments on the Fund’s Statements of Operations, summarized by primary risk exposure all of which are not accounted for as hedging instruments under ASC 815.
| | | | | | | | | | | | | | |
| | | Location | | Notional Amount of
Future Contracts
Purchased/(Sold)($) | | | Realized Gain
or (Loss)($) | | | Change in Unrealized
Appreciation/(Depreciation)($) | |
Equity Futures | | Net realized gain/(loss) on futures, Increase/(decrease) in unrealized appreciation/ (depreciation) on futures | | | 4,490,080/ | (4,736,086) | | | 34,833 | | | | 3,263 | |
| * | Includes cumulative appreciation/depreciation of futures contracts as reported in the Schedule of Investments and Net Assets section of the Statement of Assets and Liabilities. Only the current day’s variation margin is reported within the receivables and/or payables of the Statement of Assets and Liabilities. |
The Company shares a revolving credit facility of up to $150 million with a number of its affiliates. The credit facility is with its custodian bank, State Street Bank and Trust Company (“State Street”). The revolving credit facility requires the payment of a commitment fee equal to 0.125% per annum on the daily unused portion of the credit facility, payable quarterly.
The portion borne by the Fund generally is borne proportionally based upon net assets. In addition, the Company has a $100 million uncommitted, unsecured line of credit with State Street. Generally, borrowings under the credit facilities would accrue interest at the Federal Funds Rate plus 50 basis points and would be borne by the borrowing Fund. The maximum amount allowed to be borrowed by any one Fund is the lesser of (i) 33.33% of its
16
| | |
| Notes to Financial Statements | | December 31, 2010 |
total assets or (ii) 20% of its net assets. The credit facilities were not utilized by the Fund during the fiscal year ended December 31, 2010.
| 6. | Compensation and Fees Paid to Affiliates |
Advisory and Administration Fees GEAM, a registered investment adviser, was retained by the Company’s Board of Directors effective March 16, 2000 to act as investment adviser and administrator of the Fund. GEAM’s compensation for investment advisory and administrative services is paid monthly based on the average daily net assets of the Fund at an annualized rate of 0.65%.
GEAM waives a portion of the Fund’s management fee in the amount equal to the management fee earned by GEAM with respect to the Fund’s investment in the GE Funds — GE Money Market Fund.
Distribution and Service (12b-1) Fee The Company has adopted a Distribution and Service (12b-1) Plan (the “Plan”) pursuant to Rule 12b-1 under the 1940 Act with respect to Class 4 shares of the Fund. Under the Plan, the Fund may compensate GE Investment Distributors, Inc. (“GEID”), a wholly-owned subsidiary of GEAM and the Fund’s principal distributor, for certain sales services provided by GEID or other broker dealers and investor services provided by GEID or other service providers relating to the Fund’s Class 4 shares, including services to owners or prospective owners of variable contracts issued by insurance companies that offer such share class as an investment option. The amount of compensation paid under the Plan by the Fund’s Class 4 shares may not exceed 0.45% of the average daily net assets of the Fund attributable to such share class. The Plan continues in effect from year to year for so long as such continuance is approved annually by the Board of Directors, including by those directors who are not interested persons of the Company and who have no direct or indirect financial interest in the operation of the Plan or in any agreement related to it.
Directors’ Compensation The Fund pays no compensation to its directors who are officers or employees of GEAM or its affiliates. Directors who are not such officers or employees
also serve in a similar capacity for other funds advised by GEAM. Compensation paid to unaffiliated directors are reflected on the Statement of Operations. These fees are allocated pro rata across all of the mutual fund platforms and share classes served by the directors, including the Fund, and are based upon the relative net assets of each fund within such platforms.
| 7. | Investment Transactions |
Purchases and Sales of Securities The cost of purchases and the proceeds from sales of investments, other than short-term securities and options, for the period ended December 31, 2010 were as follows:
| | |
| Non-U.S. Government Securities |
| Purchases | | Sales |
| $8,744,094 | | $12,441,966 |
The Fund is subject to ASC 740, Income Taxes. ASC 740 provides guidance for financial accounting and reporting for the effects of income taxes that result from an entity’s activities during the year. ASC 740 also provides guidance regarding how certain tax positions should be recognized, measured, presented and disclosed in the financial statements. ASC 740 requires evaluation of tax positions taken or expected to be taken in the course of preparing the Fund’s tax returns to determine whether the tax positions are “more likely than not” of being sustained by the applicable tax authority. There are no adjustments to the Fund’s net assets required under ASC 740. The Fund’s 2007, 2008, 2009 and 2010 fiscal years tax returns are still open to examination by the Federal and applicable state tax authorities.
At December 31, 2010, information on the tax components of capital as follows:
| | | | | | | | | | | | | | |
Cost on
Tax Basis | | Gross Unrealized Tax | | Net Tax Appreciation/
(Depreciation) | | Undistributed
Income | | Undistributed
Accum.
Capital Loss | | Post October
Losses |
| | Appreciation | | Depreciation | | Investments | | Derivatives/
Currency | | | |
| $17,627,227 | | $3,203,815 | | $(971,895) | | $2,231,920 | | $— | | $— | | $(2,661,418) | | $— |
17
| | |
| Notes to Financial Statements | | December 31, 2010 |
As of December 31, 2010, the Fund has capital loss carryovers as indicated below. Capital loss carryovers are available to offset future realized capital gains to the extent provided in the Internal Revenue Code and regulations thereunder. To the extent that these carryover losses are used to offset future capital gains, it is probable that the gains so offset will not be distributed to shareholders because they would be taxable as ordinary income.
| | |
| Amount | | Expires |
| $2,661,418 | | 12/31/2017 |
These amounts will be available to offset future taxable capital gains. Under the recently enacted Regulated Investment Company Modernization Act of 2010, the Fund will be permitted to carry forward capital losses incurred in taxable years beginning after December 22, 2010 for an unlimited period. However, any losses incurred during those future years will be required to be utilized prior to the losses incurred in pre-enactment tax years. As a result of this ordering rule, pre-enactment capital loss carryforwards may be more likely to expire unused. Additionally, post-enactment capital losses that are carried forward will retain their character as either short-term or long-term capital losses rather than being considered all short-term as under previous law.
During the year ended December 31, 2010, the Fund utilized $927,651 of prior year capital loss carryovers.
Any net capital and currency losses incurred after October 31, within the Fund’s tax year, are deemed to arise on the first day of the Fund’s next tax year if the Fund so elects to defer such losses.
The Fund did not defer any post-October losses for the year ended December 31, 2010.
The tax composition of distributions paid during the years ended December 31, 2010 and December 31, 2009 were as follows:
| | | | | | | | | | | | |
| | |
| Ordinary
Income |
| |
| Long-Term
Capital
Gains |
| | | Total | |
2010 | | $ | 265,456 | | | $ | — | | | $ | 265,456 | |
2009 | | | 233,669 | | | | — | | | | 233,669 | |
Distributions to Shareholders The Fund declares and pays any dividends from net investment income annually. The Fund declares and pays any net realized capital gains in excess of capital loss carryforwards distributions annually. The character of income and gains to be distributed is determined in accordance with income tax regulations which may differ from generally accepted accounting principles. These differences include (but are not limited to) futures, investments organized as partnerships for tax purposes, and losses deferred due to wash sale transactions. Reclassifications due to permanent book/tax differences are made to the Fund’s capital accounts to reflect income and gains available for distribution (or available capital loss carryovers) under income tax regulations. These reclassifications have no impact on net investment income, realized gains or losses, or the net asset value of the Fund. The calculation of net investment income per share in the Financial Highlights table excludes these adjustments.
The reclassifications for the year ended December 31, 2010 were as follows:
| | | | |
Undistributed Net Investment Income | | Accumulated Net Realized Loss | | Paid in Capital |
| $1,559 | | $(14) | | $(1,545) |
18
Report of Independent Registered Public Accounting Firm
The Shareholders and Board of Directors
GE Investments Funds, Inc.
We have audited the accompanying statement of assets and liabilities, including the schedule of investments, of the Core Value Equity Fund, a series of GE Investments Funds, Inc., as of December 31, 2010, and the related statement of operations for the year then ended, statements of changes in net assets for each of the years in the two-year period then ended, and the financial highlights for each of the years in the five-year period then ended. These financial statements and financial highlights are the responsibility of the Fund’s management. Our responsibility is to express an opinion on these financial statements and financial highlights based on our audits.
We conducted our audits in accordance with the standards of the Public Company Accounting Oversight Board (United States). Those standards require that we plan and perform the audit to obtain reasonable assurance about whether the financial statements and financial highlights are free of material misstatement. An audit includes examining, on a test basis, evidence supporting the amounts and disclosures in the financial statements. Our procedures included confirmation of securities owned as of December 31, 2010 by correspondence with the custodian. An audit also includes assessing the accounting principles used and significant estimates made by management, as well as evaluating the overall financial statement presentation. We believe that our audits provide a reasonable basis for our opinion.
In our opinion, the financial statements and financial highlights referred to above present fairly, in all material respects, the financial position of the Core Value Equity Fund as of December 31, 2010, the results of its operations, changes in its net assets and financial highlights for each of the years or periods described above, in conformity with U.S. generally accepted accounting principles.

Boston, Massachusetts
February 25, 2011
19
| | |
| Advisory and Administrative Agreement Renewal | | (unaudited) |
The Board of Directors of the GE Investments Funds, Inc. (the “Board”), including the independent Board members, considered and all those that were present unanimously approved the continuance of the Fund’s Investment Advisory and Administration Agreement with GE Asset Management Incorporated (“GEAM”) at meetings held on December 3 and December 10, 2010.
In considering whether to approve the Fund’s investment advisory agreement, the Board members considered and discussed a substantial amount of information and analysis provided, at the Board’s request, by GEAM. The Board members also considered detailed information regarding performance and expenses of other investment companies, including those with similar investment strategies and sizes, which was prepared by independent third party provider Morningstar, Inc. (“Morningstar”). The Board members reviewed the fees charged by GEAM for other mutual funds and investment products other than mutual funds that employ the same investment strategy as the Fund. The Board had the opportunity to ask questions and request additional information in connection with its considerations.
Before approving the Fund’s advisory agreement, the Board members reviewed the information provided with management of GEAM and with independent legal counsel. The Board members also reviewed a memorandum prepared by independent legal counsel discussing the legal standards for the consideration of the proposed continuance. The independent Board members discussed the proposed continuance in detail during a private session with their independent legal counsel at which no representatives of GEAM were present. The independent Board members and their independent legal counsel requested, and received and considered, additional information from GEAM following these sessions.
In advance of the meetings, and in response to their request, the Board members received from GEAM written responses to their inquiries, which included substantial exhibits and other materials related to GEAM’s business and the services it provides to the Fund. The Board members took into account their multi-year experience as Board members and particularly their consideration of these types of agreements in recent years. The information was presented in a manner to facilitate comparison to prior periods and to reflect certain enhancements. To focus their review, the Board members asked GEAM management, in its oral presentation, to highlight material differences from the information presented in recent years.
During the meetings, the Board members had an opportunity to discuss this information with GEAM managers, including senior executives, representatives from the legal, compliance and finance departments, and investment personnel. The Board members posed questions to these representatives and engaged in substantive discussions with them concerning GEAM’s investment process.
In reaching their determination relating to continuance of the Fund’s investment advisory agreement, the Board members considered all factors that they deemed relevant, including the factors discussed below. In their deliberations, the Board members did not identify any particular information that was all-important or controlling, and each Board member may have attributed different weights to the various factors. In particular, the Board members focused on the following:
The Nature, Extent And Quality Of Services Provided.
The Board members reviewed the services provided by GEAM, taking into account their extensive past experiences with GEAM. They focused on the favorable attributes of GEAM, including (i) an investment philosophy oriented toward long-term performance; (ii) effective processes used for selecting investments and brokers; (iii) effective processes used for providing Fund administration, including controllership and compliance functions and oversight of the performance of other companies that provide services to the Fund; (iv) highly skilled professionals including analysts, research professionals, traders and portfolio managers with a depth of experience relevant to the Fund; (v) access to significant technological resources from which the Fund may benefit; and (vi) a favorable history and reputation. The Board members noted that the Fund represents only a small portion of the assets managed by GEAM, but benefits from a full array of services and resources provided by GEAM.
In light of these discussions, the Board, including the independent Board members, concluded that GEAM’s services continue to be satisfactory.
Investment Performance Of The Fund.
The Board members considered the investment performance of the Fund for various periods. The Board members reviewed detailed comparisons of the performance of the Fund with the relevant securities index and peer groupings of mutual funds prepared by
20
| | |
| Advisory and Administrative Agreement Renewal | | (unaudited) |
Morningstar with respect to various periods. The Board members also engaged in detailed discussions with GEAM management about its investment process and performance results. These discussions focused on the Fund’s investment objective, the number and experience of portfolio management and supporting research personnel, the investment style and approach employed, the likely market cycles for the investment style and recent relative underperformance. The Board members discussed GEAM’s investment approach with respect to the Fund, and that the performance of the Fund is consistent with GEAM’s articulated long-term approach and overall investment philosophy.
The Board, including the independent Board members, concluded that the Fund’s performance was acceptable overall taking into consideration the factors discussed above.
Cost Of The Services Provided And Profits Realized From The Relationship With The Fund.
The Board members considered the fees paid to GEAM by the Fund and the cost of the services provided to the Fund by GEAM. The Board members reviewed the information they had requested from GEAM concerning its profitability. The Board members considered the profit margin information for GEAM’s investment company business as a whole, as well as GEAM’s profitability data for the Fund. The Board members reviewed GEAM’s assumptions and the methods of cost allocation used by GEAM in preparing Fund-specific profitability data. The Board members also discussed with GEAM the basis for its belief that the methods of allocation used were reasonable for each area of its business.
Information was presented regarding the financial condition of GEAM for various past periods. The Board members noted and discussed the additional services provided by GEAM to the Fund compared to other investment products managed by GEAM, and previously had been provided a study conducted by the Investment Company Institute that discusses and compares advisory fees and services for mutual funds and institutional separate accounts. The Board members determined that GEAM should be entitled to earn a reasonable level of profits for the services it provides to the Fund. The Board members also recognized that GEAM had made significant investments in its business and had not fully recovered the sums invested. The Board also considered that GEAM
continues to make a substantial investment in fulfilling its obligations to the Fund and supporting its Fund-related activities.
Based on their review, the Board, including the independent Board members, concluded that they were satisfied that the level of profitability achieved by GEAM from its relationship with the Fund was not unreasonable or excessive.
The Extent To Which Economies Of Scale Would Be Realized As The Fund Grows And Whether Fee Levels Would Reflect Such Economies Of Scale.
Although the Board noted that the Fund did not experience significant growth in assets over the past year, the Board members considered the extent to which economies of scale would be realized as the Fund grows, and whether fee levels reflect these economies of scale for the benefit of Fund investors.
The Board members considered the substantial infrastructure investments that GEAM has made with respect to its operations and its commitment to continue investing resources to enhance services to Fund shareholders. The Board members recognized the benefits to the Fund of GEAM’s past investment in its operations through the expenditure of sums to support its substantial infrastructure, and that, with respect to all GEAM managed mutual funds, GEAM has not yet fully recouped that investment. The Board members also recognized the benefits to the Fund of being able to leverage a favorable cost structure achieved with respect to the Fund’s other operating expenses as a result of GEAM’s large overall base of assets under management and its vendor management practices.
Comparison Of Services To Be Rendered And Fees To Be Paid.
The Board members discussed the services provided to the Fund by GEAM, and the fees charged for those services. The Board members reviewed information concerning the fee and expense ratios for the Fund, and comparative information with respect to peer groupings of mutual funds prepared by Morningstar. They discussed that the Fund’s figures were within the applicable peer group ranges. In light of the foregoing, the Board, including the independent Board members, determined that the advisory fees were reasonable in relation to the services provided to the Fund.
21
| | |
| Advisory and Administrative Agreement Renewal | | (unaudited) |
Fall-Out Benefits.
The Board members considered other actual and potential financial benefits that GEAM may derive from its relationship with the Fund, including, to the extent applicable, soft dollar commission benefits generated through Fund portfolio transactions. The Board members noted, however, that the Fund benefits from the vast array of resources available through GEAM, and that the Fund represents only a small portion of the assets managed by GEAM.
Conclusion.
No single factor was determinative to the Board’s decision. Based on their discussion and such other matters as were deemed relevant, the Board, including the independent Board members, concluded that renewal of the advisory agreement was in the best interests of the Fund and its shareholders.
22
| | |
| Additional Information | | (unaudited) |
Information about Directors and Executive Officers:
The business and affairs of the Company are managed under the direction of the Company’s Board of Directors. Information pertaining to the Directors and officers of the Company is set forth below.
Interested Directors and Executive Officers
Michael J. Cosgrove
Address c/o GEAM 3001 Summer St. Stamford, CT 06905
Age 61
Position(s) Held with Fund Chairman of the Board and President
Term of Office and Length of Time Served Until successor is elected and qualified – 14 years
Principal Occupation(s) During Past 5 years President and Chief Executive Officer – Mutual Funds and Intermediary Business since March 2007; Executive Vice President of GEAM from February 1997 to March 2007; Director of GEAM since 1988; Vice President, GE Capital Corporation, an indirect wholly-owned subsidiary of GE, since December 1999; Executive Vice President – Sales and Marketing of GEAM, a wholly-owned subsidiary of GE that is registered as an investment adviser under the Investment Advisers Act of 1940, as amended, from March 1993 to March 2007.
Number of Portfolios in Fund Complex Overseen by Director 49
Other Directorships Held by Director Chairman of the Board and President of GE Funds from 1993 to February 2011, and GE Institutional Funds since its inception; Trustee of General Electric Savings & Security Trust, General Electric S&S Income Fund, General Electric S&S Program Mutual Fund (“GE Savings & Security Funds”), Elfun Funds, General Electric Insurance Plan Trust, General Relief Loan Fund, and General Electric Pension Trust since 1988; Trustee of Fordham University since 2002; Trustee of GE Volunteers since 1993; Director, GE Asset Management (Ireland) since February 1999; Director, GE Asset Management Funds Plc., GE Asset Canada Company, and GE Asset Management Limited since 1998.
Matthew J. Simpson
Address c/o GEAM 3001 Summer St. Stamford, CT 06905
Age 49
Position(s) Held with Fund Director and Executive Vice President
Term of Office and Length of Time Served Until successor is elected and qualified – 3 years
Principal Occupation(s) During Past 5 years Executive Vice President, General Counsel and Secretary of GEAM since July 2007; Senior Vice President and General Counsel – Marketing and Client Services (formerly Asset Management Services), at GEAM and Senior Vice President and General Counsel of GEAMS from February 1997 to June 2007; Vice President and Associate General Counsel of GEAM from October 1992 to February 1997; Vice President of GE Funds, GE Institutional Funds and GE LifeStyle Funds from September 2003 to June 2007; Secretary of GE Funds and GE Institutional Funds from 1997 to June 2007; Vice President of Elfun Funds and GE Savings & Security Funds from October 2003 to June 2007; Assistant Secretary of Elfun Funds and GE Savings & Security Funds from 1998 to June 2007.
Number of Portfolios in Fund Complex Overseen by Director 49
Other Directorships Held by Director Trustee of GE Institutional Funds, Elfun Funds and GE Savings & Security Funds since July 2007. Trustee of GE Funds from July 2007 to February 2011.
23
| | |
| Additional Information | | (unaudited) |
Joon Won Choe
Address c/o GEAM 3001 Summer St. Stamford, CT 06905
Age 41
Position(s) Held with Fund Vice President & Secretary
Term of Office and Length of Time Served Until successor is elected and qualified – Vice President and Secretary – less than 1 year
Principal Occupation(s) During Past 5 years Senior Vice President and Associate General Counsel at GEAM since June 2010; Vice President and Associate General Counsel at GEAM from November 2005 to June 2010; Vice President and Secretary of GE Funds from September 2010 to February 2011. Vice President and Secretary of GE Institutional Funds and GE Investments Funds, Inc. since September 2010; Vice President and Assistant Secretary of Elfun Funds and GE Savings & Security Funds since September 2010.
Number of Portfolios in Fund Complex Overseen by Officer N/A
Other Directorships Held by Officer N/A
Robert Herlihy
Address c/o GEAM 3001 Summer St. Stamford, CT 06905
Age 43
Position(s) Held with Fund Senior Vice President and Chief Compliance Officer
Term of Office and Length of Time Served Until successor is elected and qualified – 5 years
Principal Occupation(s) During Past 5 years Chief Compliance Officer of GEAM, GE Institutional Funds, Elfun Funds, and GE Savings and Security Funds since July 2005; Chief Compliance Officer of GE Funds from July 2005 to February 2011; Manager of Fund Administration at GEAM from 2002 – 2005.
Number of Portfolios in Fund Complex Overseen by Officer N/A
Other Directorships Held by Officer N/A
Eunice Tsang
Address c/o GEAM 3001 Summer St. Stamford, CT 06905
Age 51
Position(s) Held with Fund Treasurer
Term of Office and Length of Time Served Until successor is elected and qualified – less than one year
Principal Occupations(s) During Past 5 years Treasurer of GE Institutional Funds, Elfun Funds and GE Savings and Security Funds since January 2010; Treasurer of GE Funds from January 2010 to February 2011; GEAM Operational Controllership and Technical Accounting Manager since December 2007; Financial Planning & Analysis Manager – Performance Leader from June 2005 to December 2007; GEAM Quality Black Belt from 2001 to June 2005; Financial Planning & Analysis Manager from 2000 to 2001; and Mutual Fund Assistant Controller from October 1997 to 2000.
Number of Portfolios in Fund Complex Overseen by Officer N/A
Other Directorships Held by Officer N/A
24
| | |
| Additional Information | | (unaudited) |
Non-Interested Directors
John R. Costantino
Address c/o GEAM 3001 Summer St. Stamford, CT 06905
Age 64
Position(s) Held with Fund Director
Term of Office and Length of Time Served Until successor is elected and qualified – 14 years
Principal Occupation(s) During Past 5 years General Partner, NGN Capital LLC since 2006; Managing Director, Vice President of Walden Capital Management since 1996.
Number of Portfolios in Fund Complex Overseen by Director 41
Other Directorships Held by Director Trustee of GE Funds since 1993, GE Institutional Funds since its inception; Trustee of Fordham University from 1989 to 1995 and 2001 to 2007 and Trustee Emeritus since 2007; Trustee of Neuro Science Research Institute since 1986; Trustee of Gregorian University Foundation from 1992 to 2007; Director of Artes Medical from 2006 to 2008.
William J. Lucas
Address c/o GEAM 3001 Summer St. Stamford, CT 06905
Age 61
Position(s) Held with Fund Director
Term of Office and Length of Time Served Until successor is elected and qualified – 13 years (No longer serves as Trustee effective November 4, 2010)
Principal Occupation(s) During Past 5 years Retired since 2010, previously Vice President and Treasurer of Fairfield University since 1983.
Number of Portfolios in Fund Complex Overseen by Director 41
Other Directorships Held by Director Trustee of GE Funds since 1993, and GE Institutional Funds since its inception.
Robert P. Quinn
Address c/o GEAM 3001 Summer St. Stamford, CT 06905
Age 74
Position(s) Held with Fund Director
Term of Office and Length of Time Served Until successor is elected and qualified – 14 years
Principal Occupation(s) During Past 5 years Retired since 1983 from Salomon Brothers Inc.
Number of Portfolios in Fund Complex Overseen by Director 41
Other Directorships Held by Director Trustee of GE Funds since 1993, and GE Institutional Funds since its inception; Trustee, St. Francis Hospital Corp. since 1980.
The Statement of Additional Information for the Fund includes additional information about the Directors and Officers and is available, without charge, upon request by calling 1-800-493-3042.
25
Investment Adviser and Administrator
GE Asset Management Incorporated
Board of Directors
Michael J. Cosgrove, Chairman
John R. Costantino
William J. Lucas*
Robert P. Quinn
Matthew J. Simpson
Secretary
Joon Won Choe
Assistant Secretary
Michelle Matzelle
Treasurer
Eunice Tsang
Assistant Treasurers
Tatyana Begun**
Casey Yantosca
Distributor
GE Investment Distributors, Inc.
Member FINRA and SIPC
Counsel
Sutherland, Asbill & Brennan, LLP
Custodian
State Street Bank & Trust Company
Independent Registered Public Accounting Firm
KPMG LLP
Officers of the Investment Adviser
James W. Ireland, President and Chief Executive Officer
Cheryl H. Beacock, Senior Vice President, Human Resources
Paul M. Colonna, President and Chief Investment Officer – Fixed Income Investments
Michael J. Cosgrove, President and Chief Executive
Officer – Mutual Funds & Intermediary Business
Ralph R. Layman, President and Chief Investment Officer – Public Equity Investments
Maureen B. Mitchell, President – Institutional Sales and Marketing
Steve Rullo, Chief Information Officer (since February 2011)
Matthew J. Simpson, Executive Vice President, General Counsel and Secretary
Don W. Torey, President – Alternative Investments
John J. Walker, Executive Vice President, Chief Operating Officer
David Wiederecht, President and Chief Investment Officer – Investment Strategies
Tracie Winbigler, Executive Vice President, Chief Financial Officer***
| * | As of November 4, 2010, Mr. Lucas no longer served as a director of the Company. |
| ** | As of February 18, 2011, Ms. Begun no longer served as an officer of the Company. |
| *** | Effective January, 2011. |
26
Investment Adviser
GE Asset Management Incorporated
3001 Summer Street
PO Box 7900
Stamford, CT 06904-7900
Distributor
GE Investment Distributors, Inc.
member FINRA and SIPC
3001 Summer Street
PO Box 7900
Stamford, CT 06904-7900
The Fund files its complete schedule of portfolio holdings with the Securities and Exchange Commission for the first and third quarters of each fiscal year on Form N-Q. The Fund’s Forms N-Q, as well as a description of the policies and procedures that the Fund uses to determine how to vote proxies (if any) relating to portfolio securities is available without charge (i) upon request, by calling 1-800-493-3042; (ii) on the Fund’s website at http://www.geam.com; and (iii) on the Commission’s website at http://www.sec.gov. The Fund’s Forms N-Q may be reviewed and copied at the Commission’s Public Reference Room in Washington, DC—information on the operation of the Public Reference Room may be obtained by calling 1-800-SEC-0330.
Information (if any) regarding how the Fund voted proxies relating to portfolio securities during the most recently disclosed 12-month period ended June 30 is available without charge (i) through the Fund’s website at http://www.geam.com; and (ii) on the Commission’s website at http://www.sec.gov.

GE Investments Funds, Inc.
Mid-Cap Equity Fund
Annual Report
December 31, 2010

GE Investments Funds, Inc.
| | |
| |
| Mid-Cap Equity Fund | | Contents |
This report is prepared for Policyholders of certain variable contracts and may be distributed to others only if preceded or accompanied by the variable contract’s current prospectus and the current prospectus of the Fund available for investments thereunder.
| | |
| Notes to Performance | | December 31, 2010 (unaudited) |
The information on the following performance pages relates to the GE Investments Mid-Cap Equity Fund (the “Fund”).
Total returns take into account changes in share price and assume reinvestment of dividends and capital gains distributions, if any. Total returns shown are net of Fund fees and expenses but do not reflect fees and charges associated with the variable contracts such as administrative fees, account charges and surrender charges, which, if reflected, would reduce the Fund’s total returns for all periods shown.
The performance data quoted represent past performance; past performance does not guarantee future results. Investment return and principal value will fluctuate so your shares, when redeemed, may be worth more or less than their original cost. Current performance may be higher or lower than the performance data quoted. Periods less than one year are not annualized. Please call 800-493-3042 or visit the Fund’s website at http://www.geam.com for the most recent month-end performance data.
An investment in the Fund is not a deposit of any bank and is not insured or guaranteed by the Federal Deposit Insurance Corporation (FDIC) or any other government agency. An investment in the Fund is subject to risk, including possible loss of principal invested.
Russell Mid-Cap Index is an unmanaged market capitalization-weighted index of the smallest 800 companies included in the Russell 1000 Index. The Russell 1000 Index comprises the 1,000 largest U.S. domiciled
companies. The results shown for the foregoing index assume the reinvestment of net dividends or interest. They do not reflect the actual cost of investing in the instruments that comprise the index.
Russell Investment Group owns the Russell Index data, including all applicable trademarks and copyrights, used by GE Asset Management Incorporated in these materials. Any unauthorized use or redistribution of such Russell Index data is strictly prohibited. Russell Investment Group is not responsible for the configuration of this material or for any inaccuracy in GE Asset Management Incorporated’s presentation thereof.
The peer universe of the underlying annuity funds used for the peer group average annual total return calculation is based on a blend of Morningstar peer categories, as shown. Morningstar is an independent mutual fund rating service. A Fund’s performance may be compared to or ranked within a universe of mutual funds with investment objectives and policies similar but not necessarily identical to that of the Fund.
©2010 Morningstar, Inc. All Rights Reserved. The Morningstar information contained herein: (1) is proprietary to Morningstar and/or its content providers; (2) may not be copied or distributed; and (3) is no warranted to be accurate, complete or timely. Neither Morningstar nor its content providers are responsible for any damage or losses relating from any use of this information. Past performance is no guarantee or future results.
GE Investment Distributors, Inc., Member of FINRA & SIPC, is the principal underwriter and distributor of the GE Investments Funds, Inc. and a wholly owned subsidiary of GE Asset Management Incorporated, the investment adviser of the Fund.
1
| | |
| Mid-Cap Equity Fund | | (unaudited) |

Diane M. Wehner
The Mid-Cap Equity Fund is managed by Diane M. Wehner. Ms. Wehner is a Senior Vice President of GE Asset Management and portfolio manager of the Mid-Cap Equity Fund. She has served in this capacity since September 2004. Before joining GE Asset Management, Ms. Wehner was a Vice President and senior portfolio manager from January 1997 to June 2001, and associate portfolio manager from May 1995 to January 1997, with Benefit Capital Management Corporation. Ms. Wehner has served as an analyst/portfolio manager in the investment management industry since 1985.
| Q. | How did the Mid-Cap Equity Fund perform compared to its benchmark for the twelve- month period ended December 31, 2010? |
| A. | For the twelve-month period ended December 31, 2010, the Mid-Cap Equity Fund returned 26.18% for Class 1 shares and 25.66% for Class 4 shares. The Russell Mid-Cap Index, the Fund’s benchmark, returned 25.47% and the Fund’s Morningstar peer group of 180 US Insurance Mid-Cap Growth funds returned on average of 26.39% for the same period. |
| Q. | What market conditions impacted Fund performance? |
| A. | The year 2010 began on a positive note for the equity markets. Optimism about the nascent recovery in the U.S. economy fueled procyclical sectors like consumer discretionary, industrials, and materials. Within the financial sector, regional bank stocks rallied 40% by the middle of April fueled by expectations for continued improvement in credit quality and an outlook for renewed loan growth. In fact, midcap stocks overall rallied through April 23d with the Russell Midcap Index appreciating 15%. Given our concerns about the fragility of the recovery in the domestic economy, the midcap portfolio was defensively positioned entering the year with underweights in these sectors. Our skew towards higher quality, secular growth companies was a headwind for performance during this period. |
| | While an economic recovery in the U.S. was underway, it became evident that expectations were too optimistic. In addition, signs of slower growth in the global economy and concerns about the sovereign debt crisis in Europe resulted in a retreat for the equity markets overall and a correction in midcap stocks which completely erased the earlier gains. Though unemployment in the U.S. remained stubbornly high and the housing market remained fragile, industrial America was showing signs of recovery, consumer confidence was improving and issues in Europe were being addressed. With this backdrop and more attractive valuations, the correction provided an opportunity to invest in higher quality industrial and basic material companies with both secular growth in earnings and leverage to an economic recovery. The portfolio therefore was better positioned for the yearend rally ignited by the Federal Reserve’s more accommodative monetary policy (additional quantitative easing), a more pro-business Congress after the November elections (as evidenced for example by a new payroll tax cut), the extension of the Bush tax cuts, and continued evidence of a U.S. economic recovery. |
| | In general, correlations of performance among midcap stocks reached historically high levels in 2010. It was difficult for active managers to differentiate as top-down factors moved the markets, with fundamentals largely ignored. An offset to this lack of differentiation was increased M&A activity as larger companies looked to spend excess balance sheet cash on strategic acquisitions. The Fund benefited from consolidation with several companies being acquired in the latter part of the year. Growth stocks outperformed Value by a small margin during the year which helped performance given our skew towards companies with growth-at-a-reasonable-price. From a sector perspective, information technology, though it underperformed the overall market was the most additive to |
2

| | performance due to good stock selection. Meanwhile, though new investments in the industrial and basic materials sectors participated in the yearend rally, performance was dominated by lower quality, higher beta, more cyclical companies. Finally, within the financial sector our underweight in regional banks/thrifts detracted from performance along with underperformance in individual stocks within the insurance and exchanges industries. |
| Q. | What were the primary drivers of Fund Performance? |
| A. | The Fund outperformed during the twelve-month period, due to solid stock selection within the information technology, utilities, and consumer staples sectors. Within information technology, several software names meaningfully outperformed the overall market. Specifically, Rovi Corporation (+95%) benefited as investors continue to recognize its strong technology position and view the company as a play on the future of digital entertainment and connected devices. Citrix Systems (+65%) performed well as the company benefited from the trend towards desktop virtualization. Arcsight Inc. (+65%) a developer of security software was acquired by Hewlett Packard. Also, within information technology, the Fund was positively impacted by Baidu (+135%), a Chinese internet search engine company which benefited from its dominant position within the fast-growing Chinese internet industry. The Fund’s underweight in the utility sector along with good stock selection added to Fund performance with investments such as Northeast Utilities (+28%). Consumer staple stocks were also strong contributors. For example, Mead Johnson Nutrition (+45%), a global leader in the pediatric-nutrition market, outperformed in part due to its large exposure to emerging markets and its attractiveness as a takeout candidate. |
| | Detracting from performance were some of our more defensive investments within the industrial, materials, and financial sectors. Within the industrial sector, Alliant Techsystems (-16%) detracted from performance amid ongoing concerns about its NASA contract and its exposure to defense budgets. In the financial sector, diversified insurance company HCC (+6%) lagged, as overall pricing in the property and casualty industry remains under pressure. Among banks, People’s United Financial (-12%) is considered one of the highest quality thrifts in the industry having |
| | avoided the missteps of its competition in the residential real estate debacle. With an increased appetite for risk, investors favored lower quality regional banks with more leverage to an economic recovery. Meanwhile, basic materials company Monsanto (-13%) corrected as the company restructured its chemical business in response to overcapacity and competitive pricing resulting in a near-term hit to earnings. |
| Q. | Were there any significant changes to the Fund over the period? |
| A. | During the period we increased the Fund’s weighting in the industrial, materials, financial and energy sectors. We reduced our exposure to utilities, telecom services and consumer staples. We are focused on investing in attractively valued companies with strong balance sheets, experienced management teams, solid earnings prospects, leading market shares, and superior long-term fundamentals. With an emphasis on growth, we continue to look to invest in innovative companies that provide prospects for above-average earnings growth. Therefore, healthcare and information technology companies represent a meaningful percentage of the Fund’s holdings. |
3
| | |
| Mid-Cap Equity Fund | | (unaudited) |
Understanding Your Fund’s Expenses
As a shareholder of the Fund you incur transaction and ongoing expenses. Transaction expenses including sales charges on purchases payments, reinvested dividends (or other distributions), and redemption fees directly reduce the investment return of the Fund. Ongoing costs include portfolio management fees, distribution and services fees, professional fees, administrative fees and other Fund expenses. The following example is intended to help you understand your ongoing costs (in dollars) of investing in the Fund and to compare these costs with the ongoing costs of investing in other mutual funds.
To illustrate these ongoing costs, we have provided an example and calculated the expenses paid by investors during the period. The information in the following table is based on an investment of $1,000, which is invested at the beginning of the period and held for the entire six-month period ended December 31, 2010.
Actual Expenses
The first section of the table provides information about actual account values and actual expenses. You may use the information in this section, together with the amount you invested, to estimate the expenses that you paid
over the period. To do so, simply divide your account value by $1,000 (for example, an $8,600 account value divided by $1,000 = 8.6), then multiply the result by the number given for your class under the heading “Expenses Paid During Period.”
Hypothetical Example for Comparison Purposes
The second section of the table provides information about hypothetical account values and hypothetical expenses based on the Fund’s actual expense ratio and an assumed rate of return of 5% per year before expenses, which is not the Fund’s actual return. You may use this information to compare the ongoing costs of investing in the Fund and other funds. To do so, compare this 5% hypothetical example with the 5% hypothetical examples that appear in the shareholders reports of other funds.
Please note that the expenses shown in the table for both “Actual” and “Hypothetical” do not reflect any transaction costs, such as sales charges or redemption fees. Additionally, the expenses shown do not reflect the fees or charges associated with variable contracts through which shares of the Fund are offered.
July 1, 2010 – December 31, 2010
| | | | | | | | | | | | |
| | | Account value at the
beginning of the period ($) | | | Account value at the
end of the period ($) | | | Expenses paid
during the period ($)* | |
Actual Fund Return** | | | | | | | | | |
Class 1 | | | 1,000.00 | | | | 1,312.31 | | | | 4.14 | |
Class 4 | | | 1,000.00 | | | | 1,309.64 | | | | 6.58 | |
Hypothetical 5% Return (2.5% for the period) | |
Class 1 | | | 1,000.00 | | | | 1,021.40 | | | | 3.62 | |
Class 4 | | | 1,000.00 | | | | 1,019.33 | | | | 5.75 | |
| * | | Expenses are equal to the Fund’s annualized expense ratio of 0.71% for Class 1 shares and 1.13% for Class 4 shares (for the period July 1, 2010 – December 31, 2010), multiplied by the average account value over the period, multiplied by 184/365 (to reflect the one-half year period). |
| ** | | Actual Fund Returns for the six-month period ended December 31, 2010 were as follows: 31.23% for Class 1 shares, and 30.96% for Class 4 shares. Past performance does not guarantee future results. |
4
| | |
| Mid-Cap Equity Fund | | (unaudited) |
Investment Profile
A mutual fund designed for investors who seek long-term growth of capital and future income by investing at least 80% of its net assets in common and preferred stocks and other types of equity securities of mid-cap companies. The Fund invests primarily in mid-cap companies the portfolio believes are undervalued by the market and have above-average growth potential.
Morningstar Performance Comparison
Based on average annual returns for periods ended 12/31/10
| | | | | | | | | | | | | | | | |
| | | | | | One
Year | | | Five
Year | | | Ten
Year | |
Number of Funds in peer group: | | | | | | | 180 | | | | 167 | | | | 126 | |
Peer group average annual total return: | | | | | | | 26.39% | | | | 4.47% | | | | 1.93% | |
Morningstar category in peer group: U.S. Insurance Mid-Cap Growth | |
Sector Allocation
as a % of Fair Value(c) of $97,442 (in thousands) on December 31, 2010(b)(c)
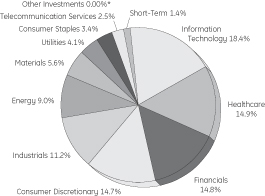
Top Ten Largest Holdings
as of December 31, 2010 (as a % of Fair Value)(b)(c)
| | | | |
Rovi Corp. | | | 3.80% | |
HCC Insurance Holdings Inc. | | | 2.26% | |
ITC Holdings Corp. | | | 2.12% | |
CB Richard Ellis Group Inc. (REIT) | | | 2.08% | |
Harsco Corp. | | | 2.00% | |
Affiliated Managers Group Inc. | | | 1.96% | |
Coach Inc. | | | 1.90% | |
Illumina Inc. | | | 1.82% | |
Corrections Corporation of America | | | 1.79% | |
Catalyst Health Solutions Inc. | | | 1.76% | |
Change in Value of a $10,000 Investment
Class 1 Shares
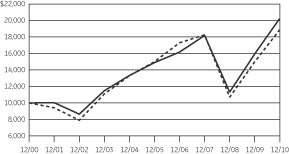
Average Annual Total Return
for the Periods Ended December 31, 2010
Class 1 Shares (Inception date: 5/1//97)
| | | | | | | | | | | | | | | | |
| | | One
Year | | | Five
Year | | | Ten
Year | | | Ending
Value of a
$10,000
investment(a) | |
Mid-Cap Equity Fund | | | 26.18% | | | | 6.26% | | | | 7.28% | | | | 20,200 | |
Russell Midcap Index | | | 25.47% | | | | 4.67% | | | | 6.54% | | | | 18,846 | |
Change in Value of a $10,000 Investment
Class 4 Shares

Average Annual Total Returns
for the Periods Ended December 31, 2010
Class 4 Shares (Inception date: 5/1/08)
| | | | | | | | | | | | |
| | | One
Year | | | Since
Inception | | | Ending
Value of a
$10,000
investment(a) | |
Mid-Cap Equity Fund | | | 25.66% | | | | 4.57% | | | | 11,269 | |
Russell Midcap Index | | | 25.47% | | | | 2.70% | | | | 10,736 | |

| (a) | Ending value of a $10,000 investment for the ten-year period or since inception, whichever is less. |
| (b) | The securities information regarding holdings, allocations and other characteristics is presented to illustrate examples of securities that the Fund has bought and the diversity of areas in which the Fund may invest as of a particular date. It may not be representative of the Fund’s current or future investments and should not be construed as a recommendation to purchase or sell a particular security. |
| (c) | Fair value basis is inclusive of Short Term Investment in GE Money Market Fund. |
See Notes to Performance on page 1 for further information, including an explanation of Morningstar peer categories.
Past performance does not predict future performance and the graph and table do not reflect the deduction of taxes that a shareholder would pay on Fund distributions or the redemption of Fund shares and do not reflect the fees or charges that would be associated with variable contracts through which shares of the Fund are offered.
5
Mid-Cap Equity Fund
| | |
| Schedule of Investments | | December 31, 2010 |
Mid-Cap Equity Fund
| | | | | | | | | | |
| | | |
| | | Number
of Shares | | | Fair Value | | | |
Common Stock — 98.2%† | | | |
| |
Advertising — 1.5% | | | |
| | | |
Omnicom Group Inc. | | | 31,356 | | | $ | 1,436,105 | | | |
| |
Aerospace & Defense — 2.1% | | | |
| | | |
Alliant Techsystems Inc. | | | 16,495 | | | | 1,227,723 | | | (a,c) |
Hexcel Corp. | | | 43,204 | | | | 781,560 | | | (a) |
| | | | | | | 2,009,283 | | | |
| |
Air Freight & Logistics — 0.5% | | | |
| | | |
UTi Worldwide Inc. | | | 22,905 | | | | 485,586 | | | |
| |
Apparel Retail — 1.0% | | | |
| | | |
Urban Outfitters Inc. | | | 28,285 | | | | 1,012,886 | | | (a) |
| |
Apparel, Accessories & Luxury Goods — 1.9% | | | |
| | | |
Coach Inc. | | | 33,422 | | | | 1,848,571 | | | |
| |
Application Software — 3.1% | | | |
| | | |
Blackboard Inc. | | | 20,666 | | | | 853,506 | | | (a) |
Citrix Systems Inc. | | | 23,726 | | | | 1,623,096 | | | (a) |
Longtop Financial Technologies Ltd. ADR | | | 16,322 | | | | 590,530 | | | (a) |
| | | | | | | 3,067,132 | | | |
| |
Asset Management & Custody Banks — 3.2% | | | |
| | | |
Affiliated Managers Group Inc. | | | 19,205 | | | | 1,905,520 | | | (a) |
Invesco Ltd. | | | 51,532 | | | | 1,239,860 | | | |
| | | | | | | 3,145,380 | | | |
| |
Automobile Manufacturers — 1.5% | | | |
| | | |
O’Reilly Automotive Inc. | | | 24,978 | | | | 1,509,171 | | | |
| |
Biotechnology — 3.2% | | | |
| | | |
Alexion Pharmaceuticals Inc. | | | 12,718 | | | | 1,024,435 | | | (a) |
Human Genome Sciences Inc. | | | 26,375 | | | | 630,099 | | | (a) |
Incyte Corp Ltd. | | | 36,618 | | | | 606,394 | | | (a) |
Vertex Pharmaceuticals Inc. | | | 25,643 | | | | 898,274 | | | (a) |
| | | | | | | 3,159,202 | | | |
| |
Broadcasting — 1.0% | | | |
| | | |
Discovery Communications Inc. | | | 9,375 | | | | 390,938 | | | (a) |
Discovery Communications Inc. | | | 15,716 | | | | 576,620 | | | (a) |
| | | | | | | 967,558 | | | |
| |
Cable & Satellite — 1.6% | | | |
| | | |
DIRECTV | | | 16,988 | | | | 678,331 | | | (a) |
Liberty Global Inc. | | | 26,733 | | | | 905,981 | | | (a) |
| | | | | | | 1,584,312 | | | |
| | | | | | | | | | |
| | | |
| | | Number
of Shares | | | Fair Value | | | |
| |
Casinos & Gaming — 1.3% | | | |
| | | |
Penn National Gaming Inc. | | | 36,922 | | | $ | 1,297,808 | | | (a) |
| |
Coal & Consumable Fuels — 0.8% | | | |
| | | |
Peabody Energy Corp. | | | 12,183 | | | | 779,468 | | | |
| |
Communications Equipment — 1.7% | | | |
| | | |
Juniper Networks Inc. | | | 44,697 | | | | 1,650,213 | | | (a) |
| |
Computer Storage & Peripherals — 1.4% | | | |
| | | |
Synaptics Inc. | | | 48,250 | | | | 1,417,585 | | | (a) |
| |
Construction & Engineering — 0.6% | | | |
| | | |
Quanta Services Inc. | | | 30,222 | | | | 602,022 | | | (a) |
| |
Construction & Farm Machinery & Heavy Trucks — 0.9% | | | |
| | | |
Cummins Inc. | | | 8,071 | | | | 887,891 | | | |
| |
Electric Utilities — 3.0% | | | |
| | | |
ITC Holdings Corp. | | | 33,338 | | | | 2,066,289 | | | (c) |
Northeast Utilities | | | 27,765 | | | | 885,148 | | | |
| | | | | | | 2,951,437 | | | |
| |
Electrical Components & Equipment — 1.1% | | | |
| | | |
Cooper Industries PLC | | | 18,940 | | | | 1,104,013 | | | |
| |
Environmental & Facilities Services — 0.5% | | | |
| | | |
Stericycle Inc. | | | 5,906 | | | | 477,914 | | | (a) |
| |
Fertilizers & Agricultural Chemicals — 1.8% | | | |
| | | |
Intrepid Potash Inc. | | | 28,876 | | | | 1,076,786 | | | (a) |
Monsanto Co. | | | 10,300 | | | | 717,292 | | | (c) |
| | | | | | | 1,794,078 | | | |
| |
General Merchandise Stores — 0.8% | | | |
| | | |
Dollar General Corp. | | | 26,665 | | | | 817,816 | | | (a) |
| |
Healthcare Equipment — 2.5% | | | |
| | | |
Gen-Probe Inc. | | | 15,869 | | | | 925,956 | | | (a) |
Masimo Corp. | | | 51,523 | | | | 1,497,774 | | | (c) |
| | | | | | | 2,423,730 | | | |
| |
Healthcare Services — 1.8% | | | |
| | | |
Catalyst Health Solutions Inc. | | | 36,967 | | | | 1,718,596 | | | (a) |
| |
Healthcare Technology — 1.1% | | | |
| | | |
MedAssets Inc. | | | 52,009 | | | | 1,050,062 | | | (a) |
| |
Home Entertainment Software — 1.6% | | | |
| | | |
Activision Blizzard Inc. | | | 123,558 | | | | 1,537,062 | | | |
| |
Home Building — 0.4% | | | |
| | | |
MDC Holdings Inc. | | | 14,535 | | | | 418,172 | | | |
See Notes to Schedule of Investments and Notes to Financial Statements.
6
Mid-Cap Equity Fund
| | |
| Schedule of Investments | | December 31, 2010 |
| | | | | | | | | | |
| | | |
| | | Number
of Shares | | | Fair Value | | | |
| |
Home Furnishing Retail — 1.6% | | | |
| | | |
Bed Bath & Beyond Inc. | | | 32,067 | | | $ | 1,576,093 | | | (a) |
| |
Hotels, Resorts & Cruise Lines — 0.4% | | | |
| | | |
Marriott International Inc. | | | 9,150 | | | | 380,091 | | | |
| |
Industrial Gases — 1.2% | | | |
| | | |
Praxair Inc. | | | 12,350 | | | | 1,179,055 | | | (c) |
| |
Industrial Machinery — 2.0% | | | |
| | | |
Harsco Corp. | | | 68,878 | | | | 1,950,625 | | | |
| |
Internet Retail — 0.1% | | | |
| | | |
E-Commerce China Dangdang Inc. ADR | | | 1,938 | | | | 52,462 | | | (a) |
| |
Internet Software & Services — 3.4% | | | |
| | | |
Baidu Inc. ADR | | | 16,460 | | | | 1,588,884 | | | (a) |
Equinix Inc. | | | 9,209 | | | | 748,323 | | | (a) |
MercadoLibre Inc. | | | 14,875 | | | | 991,419 | | | (a) |
| | | | | | | 3,328,626 | | | |
| |
IT Consulting & Other Services — 0.5% | | | |
| | | |
Telvent GIT S.A. | | | 19,504 | | | | 515,296 | | | |
| |
Life Sciences Tools & Services — 6.3% | | | |
| | | |
Covance Inc. | | | 23,614 | | | | 1,213,996 | | | (a) |
Illumina Inc. | | | 28,041 | | | | 1,776,117 | | | (a) |
Mettler-Toledo International Inc. | | | 10,078 | | | | 1,523,894 | | | (a,c) |
Thermo Fisher Scientific Inc. | | | 29,154 | | | | 1,613,965 | | | (a,c) |
| | | | | | | 6,127,972 | | | |
| |
Movies & Entertainment — 0.5% | | | |
| | | |
Regal Entertainment Group | | | 42,589 | | | | 499,995 | | | (c) |
| |
Multi-Line Insurance — 2.3% | | | |
| | | |
HCC Insurance Holdings Inc. | | | 76,210 | | | | 2,205,517 | | | (c) |
| |
Office REITs — 1.4% | | | |
| | | |
Douglas Emmett Inc. | | | 45,673 | | | | 758,172 | | | |
SL Green Realty Corp. | | | 9,538 | | | | 643,910 | | | |
| | | | | | | 1,402,082 | | | |
| |
Oil & Gas Drilling — 0.8% | | | |
| | | |
Noble Corp. | | | 23,165 | | | | 828,612 | | | |
| |
Oil & Gas Equipment & Services — 3.2% | | | |
| | | |
Dresser-Rand Group Inc. | | | 29,694 | | | | 1,264,667 | | | (a) |
McDermott International Inc. | | | 32,525 | | | | 672,942 | | | (a) |
Weatherford International Ltd. | | | 52,689 | | | | 1,201,309 | | | (a) |
| | | | | | | 3,138,918 | | | |
| | | | | | | | | | |
| | | |
| | | Number
of Shares | | | Fair Value | | | |
| |
Oil & Gas Exploration & Production — 4.3% | | | |
| | | |
EQT Corp. | | | 22,451 | | | $ | 1,006,703 | | | |
Petrohawk Energy Corp. | | | 59,627 | | | | 1,088,193 | | | (a) |
Pioneer Natural Resources Co. | | | 13,626 | | | | 1,183,009 | | | |
Range Resources Corp. | | | 19,995 | | | | 899,375 | | | |
| | | | | | | 4,177,280 | | | |
| |
Packaged Foods & Meats — 1.9% | | | |
| | | |
McCormick & Company Inc. | �� | | 20,755 | | | | 965,730 | | | (c) |
Mead Johnson Nutrition Co. | | | 14,513 | | | | 903,434 | | | |
| | | | | | | 1,869,164 | | | |
| |
Personal Products — 0.5% | | | |
| | | |
Avon Products Inc. | | | 15,897 | | | | 461,967 | | | |
| |
Property & Casualty Insurance — 1.3% | | | |
| | | |
ACE Ltd. | | | 19,941 | | | | 1,241,327 | | | |
| |
Real Estate Services — 2.1% | | | |
| | | |
CB Richard Ellis Group Inc. (REIT) | | | 98,801 | | | | 2,023,445 | | | (a,c) |
| |
Regional Banks — 1.4% | | | |
| | | |
Regions Financial Corp. | | | 86,671 | | | | 606,697 | | | |
Zions Bancorp. | | | 31,980 | | | | 774,875 | | | |
| | | | | | | 1,381,572 | | | |
| |
Research & Consulting Services — 1.6% | | | |
| | | |
IHS Inc. | | | 18,885 | | | | 1,518,165 | | | (a) |
| |
Security & Alarm Services — 1.8% | | | |
| | | |
Corrections Corporation of America | | | 69,701 | | | | 1,746,707 | | | (a) |
| |
Semiconductors — 3.8% | | | |
| | | |
Cree Inc. | | | 8,670 | | | | 571,266 | | | (a) |
Hittite Microwave Corp. | | | 26,229 | | | | 1,601,018 | | | (a) |
Marvell Technology Group Ltd. | | | 80,980 | | | | 1,502,179 | | | (a) |
| | | | | | | 3,674,463 | | | |
| |
Soft Drinks — 1.0% | | | |
| | | |
Coca-Cola Enterprises Inc. | | | 38,608 | | | | 966,358 | | | |
| |
Specialized Finance — 1.5% | | | |
| | | |
CBOE Holdings Inc. | | | 29,594 | | | | 676,519 | | | |
MSCI Inc. | | | 19,782 | | | | 770,707 | | | (a) |
| | | | | | | 1,447,226 | | | |
| |
Specialty Chemicals — 0.3% | | | |
| | | |
Cytec Industries Inc. | | | 5,999 | | | | 318,307 | | | |
| |
Steel — 2.2% | | | |
| | | |
Allegheny Technologies Inc. | | | 20,486 | | | | 1,130,417 | | | |
Steel Dynamics Inc. | | | 57,958 | | | | 1,060,631 | | | |
| | | | | | | 2,191,048 | | | |
See Notes to Schedule of Investments and Notes to Financial Statements.
7
Mid-Cap Equity Fund
| | |
| Schedule of Investments | | December 31, 2010 |
| | | | | | | | | | |
| | | |
| | | Number
of Shares | | | Fair Value | | | |
| |
Systems Software — 3.8% | | | |
| | | |
Rovi Corp. | | | 59,637 | | | $ | 3,698,090 | | | (a,c) |
| |
Thrifts & Mortgage Finance — 1.7% | | | |
| | | |
People’s United Financial Inc. | | | 115,863 | | | | 1,623,241 | | | |
| |
Trading Companies & Distributors — 1.0% | | | |
| | | |
MSC Industrial Direct Co. | | | 15,566 | | | | 1,006,965 | | | |
| |
Wireless Telecommunication Services — 2.4% | | | |
| | | |
American Tower Corp. | | | 31,325 | | | | 1,617,623 | | | (a) |
NII Holdings Inc. | | | 16,328 | | | | 729,208 | | | (a) |
| | | | | | | 2,346,831 | | | |
| | | |
Total Common Stock
(Cost $70,906,035) | | | | | | | 96,030,553 | | | |
Other Investments — 0.0%* | | | |
GEI Investment Fund
(Cost $23,010) | | | | | | | 21,860 | | | (d) |
| | | |
Total Investments in Securities
(Cost $70,929,045) | | | | | | | 96,052,413 | | | |
Short-Term Investments — 1.4% | | | |
GE Money Market Fund Institutional
Class 0.00%
(Cost $1,389,787) | | | | | | | 1,389,787 | | | (b,d) |
| | | |
Total Investments
(Cost $72,318,832) | | | | | | | 97,442,200 | | | |
| | | |
Other Assets and Liabilities, net — 0.4% | | | | | | | 397,615 | | | |
| | | | | | | | | | |
| | | |
NET ASSETS — 100.0% | | | | | | $ | 97,839,815 | | | |
| | | | | | | | | | |
Other Information | | | | | | | | | | |
The Fund had the following short futures contracts open at December 31, 2010:
| | | | | | | | | | | | | | | | |
| Description | | Expiration
date | | | Number
of
Contracts | | | Current
Notional
Value | | | Unrealized
Appreciation | |
S&P Midcap 400 Emini Index Futures | | | March 2011 | | | | 6 | | | $ | (543,180 | ) | | $ | 3,092 | |
See Notes to Schedule of Investments and Notes to Financial Statements.
8
| | |
| Notes to Schedule of Investments | | December 31, 2010 |
The views expressed in this document reflect our judgment as of the publication date and are subject to change at any time without notice. The securities information regarding holdings, allocations and other characteristics are presented as of a particular date to illustrate examples of securities that the fund bought and the diversity of areas in which the Fund may invest as of a particular date. It may not be representative of the Fund’s current or future investments and should not be construed as a recommendation to purchase or sell a particular security. See the prospectus for complete descriptions of investment objective, policies, risks and permissible investments.
| (a) | Non-income producing security. |
| (b) | Coupon amount represents effective yield. |
| (c) | At December 31, 2010 , all or a portion of this security was pledged to cover collateral requirements for |
| | futures, options, forward foreign currency contracts and/or TBA’s. |
| (d) | GE Asset Management, the investment adviser of the Fund, also serves as investment adviser of the GEI Investment Fund and the GE Funds-GE Money Market Fund. |
| † | Percentages are based on net assets as of December 31, 2010 . |
Abbreviations:
| | |
ADR | | American Depository Receipt |
| |
REIT | | Real Estate Investment Trust |
9
Financial Highlights
Selected data based on a share outstanding throughout the fiscal years indicated
| | | | | | | | | | | | | | | | | | | | | | | | | | | | | | | | | | | | |
| | | CLASS 1 | | | | | | CLASS 4 | |
| | | 12/31/10 | | | 12/31/09 | | | 12/31/08 | | | 12/31/07 | | | 12/31/06 | | | | | | 12/31/10 | | | 12/31/09 | | | 12/31/08 | |
| Inception date | | | — | | | | — | | | | — | | | | — | | | | 5/1/97 | | | | | | | | — | | | | — | | | | 5/1/08 | |
Net asset value, beginning of period | | $ | 14.82 | | | $ | 10.50 | | | $ | 17.30 | | | $ | 18.19 | | | $ | 19.22 | | | | | | | $ | 14.81 | | | $ | 10.51 | | | $ | 16.85 | |
Income/(loss) from investment operations: | | | | | | | | | | | | | | | | | | | | | | | | | | | | | | | | | | | | |
Net investment income | | | 0.06 | ** | | | 0.09 | | | | 0.10 | | | | 0.08 | | | | 0.23 | | | | | | | | (0.01) | ** | | | (0.05) | | | | (0.01) | ** |
Net realized and unrealized gains/(losses) on investments | | | 3.82 | | | | 4.26 | | | | (6.65) | | | | 2.23 | | | | 1.40 | | | | | | | | 3.81 | | | | 4.35 | | | | (6.12) | |
Total income/(loss) from
investment operations | | | 3.88 | | | | 4.35 | | | | (6.55) | | | | 2.31 | | | | 1.63 | | | | | | | | 3.80 | | | | 4.30 | | | | (6.13) | |
Less distributions from: | | | | | | | | | | | | | | | | | | | | | | | | | | | | | | | | | | | | |
Net investment income | | | 0.06 | | | | 0.03 | | | | 0.05 | | | | 0.07 | | | | 0.22 | | | | | | | | — | | | | — | | | | 0.01 | |
Net realized gains | | | — | | | | — | | | | 0.20 | | | | 3.13 | | | | 2.44 | | | | | | | | — | | | | — | | | | 0.20 | |
Total distributions | | | 0.06 | | | | 0.03 | | | | 0.25 | | | | 3.20 | | | | 2.66 | | | | | | | | — | | | | — | | | | 0.21 | |
Net asset value, end of period | | $ | 18.64 | | | $ | 14.82 | | | $ | 10.50 | | | $ | 17.30 | | | $ | 18.19 | | | | | | | $ | 18.61 | | | $ | 14.81 | | | $ | 10.51 | |
TOTAL RETURN (a) | | | 26.18% | | | | 41.45% | | | | (37.82)% | | | | 12.60% | | | | 8.40% | | | | | | | | 25.66% | | | | 40.91% | | | | (36.36)% | |
| | | | | | | | | |
RATIOS/SUPPLEMENTAL DATA: | | | | | | | | | | | | | | | | | | | | | | | | | | | | | | | | | | | | |
Net assets, end of period (in thousands) | | | $97,829 | | | | $92,374 | | | | $81,791 | | | | $191,339 | | | | $199,311 | | | | | | | | $11 | | | | $9 | | | | $6 | |
Ratios to average net assets: | | | | | | | | | | | | | | | | | | | | | | | | | | | | | | | | | | | | |
Net investment income | | | 0.35% | | | | 0.19% | | | | 0.29% | | | | 0.35% | | | | 1.01% | | | | | | | | (0.06)% | | | | (0.22)% | | | | (0.05)% | * |
Net expenses | | | 0.71% | (b) | | | 0.80% | (b) | | | 0.73% | (b) | | | 0.70% | (b) | | | 0.69% | (b) | | | | | | | 1.13% | (b) | | | 1.25% | (b) | | | 1.18% | (b)* |
Gross expenses | | | 0.71% | | | | 0.80% | | | | 0.73% | | | | 0.70% | | | | 0.69% | | | | | | | | 1.13% | | | | 1.25% | | | | 1.18% | |
Portfolio turnover rate | | | 31% | | | | 24% | | | | 49% | | | | 65% | | | | 29% | | | | | | | | 31% | | | | 24% | | | | 49% | |
Notes to Financial Highlights
| (a) | Total returns are historical and assume changes in share price, reinvestment of dividends and capital gains distributions, and do not include the effect of insurance contract charges. Past performance does not guarantee future results. |
| (b) | Reflects GE Asset Management’s waiver of a portion of the Fund’s management fee in an amount equal to the management fee earned by GEAM with respect to the Fund’s investment in the GE Funds – GE Money Market Fund. Excluding waiver, the expense ratios would be unchanged. |
| * | Annualized for periods less than one year. |
| ** | Per share values have been calculated using the average share method. |
The accompanying Notes are an integral part of these financial statements.
10
| | | | |
Statement of Assets and Liabilities
December 31, 2010 | | | |
| |
ASSETS | | | | |
Investments in securities, at Fair Value (cost $70,906,035) | | | $96,030,553 | |
Investments in affiliated securities, at Fair Value (cost $23,010) | | | 21,860 | |
Short-term affiliated investments (at amortized cost) | | | 1,389,787 | |
Receivable for investments sold | | | 188,315 | |
Income receivables | | | 55,316 | |
Receivable for fund shares sold | | | 403,366 | |
Variation margin receivable | | | 3,647 | |
Total Assets | | | 98,092,844 | |
| |
LIABILITIES | | | | |
Payable for investments purchased | | | 96,116 | |
Payable for fund shares redeemed | | | 2,126 | |
Payable to GEAM | | | 53,460 | |
Accrued other expenses | | | 101,327 | |
Total Liabilities | | | 253,029 | |
NET ASSETS | | | $97,839,815 | |
| |
NET ASSETS CONSIST OF : | | | | |
Capital paid in | | | 80,289,361 | |
Undistributed (distribution in excess of) net investment income | | | 8,976 | |
Accumulated net realized gain (loss) | | | (7,584,982 | ) |
Net unrealized appreciation/(depreciation) on: | | | | |
Investments | | | 25,123,368 | |
Futures | | | 3,092 | |
NET ASSETS | | | $97,839,815 | |
| |
Class 1: | | | | |
| |
NET ASSETS | | | 97,828,545 | |
Shares outstanding ($0.01 par value; unlimited shares authorized) | | | 5,248,502 | |
Net asset value per share | | | $18.64 | |
| |
Class 4: | | | | |
| |
NET ASSETS | | | 11,270 | |
Shares outstanding ($0.01 par value; unlimited shares authorized) | | | 606 | |
Net asset value per share | | | $18.61 | |
The accompanying Notes are an integral part of these financial statements.
11
| | | | |
Statement of Operations
For the year ending December 31, 2010 | | | |
| |
INVESTMENT INCOME | | | | |
Income: | | | | |
Dividends | | $ | 932,674 | |
Interest | | | 31,862 | |
Interest from affiliated investments | | | 348 | |
Total Income | | | 964,884 | |
| |
Expenses: | | | | |
Advisory and administrative fees | | | 593,045 | |
Transfer agent | | | 8,033 | |
Directors’ fees | | | 3,050 | |
Custody and accounting expenses | | | 6,222 | |
Professional fees | | | 14,117 | |
Other expenses | | | 22,551 | |
Total expenses before waiver and reimbursement | | | 647,018 | |
Less Expenses reimbursed by the adviser | | | (4,347 | ) |
Net expenses | | | 642,671 | |
Net investment income (loss) | | | 322,213 | |
| |
NET REALIZED AND UNREALIZED GAIN (LOSS)
ON INVESTMENTS | | | | |
| |
Realized gain (loss) on: | | | | |
Investments | | | 6,800,630 | |
Futures and other | | | 129,170 | |
| |
Increase (decrease) in unrealized appreciation/(depreciation) on: | | | | |
Investments | | | 14,154,403 | |
Futures | | | (7,015 | ) |
Net realized and unrealized gain (loss) on investments | | | 21,077,188 | |
Net increase (decrease) in net assets resulting from operations | | $ | 21,399,401 | |
The accompanying Notes are an integral part of these financial statements.
12
| | | | | | | | |
Statements of
Changes in Net Assets | | | |
| | | Year Ended
December 31,
2010 | | | Year Ended
December 31,
2009 | |
| | |
INCREASE (DECREASE) IN NET ASSETS | | | | | | | | |
Operations: | | | | | | | | |
Net investments income | | $ | 322,213 | | | $ | 139,604 | |
Net realized gain (loss) on investments, futures and foreign currency transactions | | | 6,929,800 | | | | (7,860,484 | ) |
Net increase (decrease) in unrealized appreciation/(depreciation) on investments and futures | | | 14,147,388 | | | | 36,731,845 | |
Net increase (decrease) from operations | | | 21,399,401 | | | | 29,010,965 | |
Distributions to shareholders from : | | | | | | | | |
Net investment income | | | | | | | | |
Class 1 | | | (316,553 | ) | | | (200,960 | ) |
Class 4 | | | — | | | | — | |
Total distributions | | | (316,553 | ) | | | (200,960 | ) |
Increase (decrease) in net assets from operations and distributions | | | 21,082,848 | | | | 28,810,005 | |
Share transactions : | | | | | | | | |
Proceeds from sale of shares | | | | | | | | |
Class 1 | | | 5,577,989 | | | | 1,178,747 | |
Class 4 | | | — | | | | — | |
Value of distributions reinvested | | | | | | | | |
Class 1 | | | 316,553 | | | | 200,960 | |
Class 4 | | | — | | | | — | |
Cost of shares redeemed | | | | | | | | |
Class 1 | | | (21,520,293 | ) | | | (19,604,175 | ) |
Class 4 | | | — | | | | — | |
Net increase (decrease) from share transactions | | | (15,625,751 | ) | | | (18,224,468 | ) |
Total increase (decrease) in net assets | | | 5,457,097 | | | | 10,585,537 | |
| | |
NET ASSETS | | | | | | | | |
Beginning of period | | | 92,382,718 | | | | 81,797,181 | |
End of period | | $ | 97,839,815 | | | $ | 92,382,718 | |
Undistributed (distribution in excess of) net investment income, end of period | | $ | 8,976 | | | $ | 5,029 | |
| | |
CHANGES IN FUND SHARES | | | | | | | | |
| | |
Class 1 | | | | | | | | |
Shares sold | | | 358,871 | | | | 100,537 | |
Issued for distributions reinvested | | | 16,937 | | | | 13,432 | |
Shares redeemed | | | (1,361,438 | ) | | | (1,671,328 | ) |
Net increase (decrease) in fund shares | | | (985,630 | ) | | | (1,557,359 | ) |
| | |
Class 4 | | | | | | | | |
Shares sold | | | — | | | | — | |
Issued for distributions reinvested | | | — | | | | — | |
Shares redeemed | | | — | | | | — | |
Net increase (decrease) in fund shares | | | — | | | | — | |
The accompanying Notes are an integral part of these financial statements.
13
| | |
| Notes to Financial Statements | | December 31, 2010 |
1. Organization of the Company
GE Investments Funds, Inc. (the “Company”) was incorporated under the laws of the Commonwealth of Virginia on May 14, 1984 and is registered under the Investment Company Act of 1940, as amended (the “1940 Act”), as an open-end management investment company. The Company is composed of fourteen investment portfolios (collectively the “Funds”), although only the following eleven are currently being offered: U.S. Equity Fund, S&P 500 Index Fund, Premier Growth Equity Fund, Core Value Equity Fund, Mid-Cap Equity Fund (the “Fund”), Small-Cap Equity Fund, International Equity Fund, Total Return Fund, Income Fund, Money Market Fund and Real Estate Securities Fund.
Shares of the Funds of the Company are offered only to insurance company separate accounts that fund certain variable life insurance contracts and variable annuity contracts. GE Asset Management Incorporated (“GEAM”), is the investment adviser and administrator of each of the Funds.
The Company offers two share classes (Class 1 and Class 4) of the Fund. Class 4 shares were first offered on May 1, 2008, and Fund shares outstanding prior to May 1, 2008 were designated as Class 1 shares. Each share class has different fees and expenses, and as a result, each share class will have different share price and performance. Not all variable contracts offer both share classes of the Fund.
| 2. | Summary of Significant Accounting Policies |
The preparation of financial statements in conformity with U.S. generally accepted accounting principles (GAAP) requires management to make estimates and assumptions that affect the reported amounts of assets and liabilities and disclosure of contingent assets and liabilities at the date of the financial statements and the reported amounts of increases and decreases in net assets from operations during the reporting period. Actual results may differ from those estimates.
Subsequent events after the balance sheet date through the date the financial statements were issued, have been evaluated in the preparation of the financial statements. There are no items to report.
The following summarizes the significant accounting policies of the Company:
Securities Valuation and Transactions. All investments in securities are recorded at their estimated fair value, as described in Note 3.
Securities transactions are accounted for as of the trade date. Realized gains and losses on investments sold are recorded on the basis of identified cost for both financial statement and federal tax purposes.
The Fund’s income, expenses (other than distribution fees) and realized and unrealized gains and losses are allocated proportionally each day among the share classes based upon the relative net assets of each class.
Futures Contracts A futures contract represents a commitment for the future purchase or sale of an asset at a specified price on a specified date. The Fund invests in stock index futures contracts subject to certain limitations to manage its exposure to the stock markets. Buying futures tends to increase a Fund’s exposure to the underlying instrument while selling futures tends to decrease a Fund’s exposure to the underlying instrument or to hedge other Fund investments. With futures contracts, there is minimal counterparty credit risk to the Fund since futures contracts are exchange traded and the exchange’s clearinghouse, as counterparty to all traded futures, guarantees the futures against default. A Fund’s risks in using these contracts include changes in the value of the underlying instruments, non- performance of the counterparties under the contracts’ terms and changes in the liquidity of the secondary market for the contracts. Futures contracts are valued at the settlement price established each day by the board of trade or exchange on which they principally trade.
Upon entering into a financial futures contract, the Fund is required to pledge to the broker an amount of cash and/or other assets equal to a certain percentage of the contract amount, known as initial margin deposit. Subsequent payments, known as variation margin, are made or received by the Fund each day, depending on the daily fluctuation in the fair value of the underlying security. The Fund records an unrealized gain or loss equal to the daily variation margin. Should market conditions move unexpectedly, the Fund may not achieve the anticipated benefits of the futures contracts and may incur a loss. The Fund recognizes a realized gain or loss upon the expiration or closing of a futures contract.
Investment Income Corporate actions (including cash dividends) are recorded on the ex-dividend date, net of applicable withholding taxes. Interest income is recorded on the accrual basis.
14
| | |
| Notes to Financial Statements | | December 31, 2010 |
Expenses Fund specific expenses are allocated to the Fund that incurs such expenses and pro rata across share classes. Expenses, other than those incurred by a specific Fund, are allocated pro rata among Funds and share classes. Such expenses may include custodial fees, legal and accounting fees, printing costs and registration fees. All expenses of the Fund are paid by GEAM and reimbursed by the Fund. Certain class specific expenses (such as transfer agency fees or distribution fees) are allocated to the class that incurs such expense.
Federal Income Taxes The Fund intends to comply with all sections of the Internal Revenue Code applicable to regulated investment companies including the distribution of substantially all of its taxable net investment income and net realized capital gains to its shareholders. Therefore, no provision for federal income tax has been made. The Fund is treated as a separate taxpayer for federal income tax purposes.
The Fund utilizes various methods to measure the fair value of most of its investments on a recurring basis. GAAP establishes a framework for measuring fair value and providing related disclosures. Broadly, the framework requires fair value to be determined based on the exchange price that would be received for an asset or paid to transfer a liability (an exit price) in the principal or most advantageous market for the asset or liability in an orderly transaction between market participants at the measurement date. In the absence of active markets for the identical assets or liabilities, such measurements involve developing assumptions based on market observable data and, in the absence of such data, internal information that is consistent with what market participants would use in a hypothetical transaction that occurs at the measurement date. It also establishes a three-level valuation hierarchy based upon observable and non-observable inputs.
Observable inputs reflect market data obtained from independent sources, while unobservable inputs reflect our market assumptions. Preference is given to observable inputs. These two types of inputs create the following fair value hierarchy:
Level 1 — Quoted prices for identical investments in active markets.
Level 2 — Quoted prices for similar investments in active markets; quoted prices for identical or similar
investments in markets that are not active; and model-derived valuations whose inputs are observable or whose significant value drivers are observable.
Level 3 — Significant inputs to the valuation model are unobservable.
Policies and procedures are maintained to value investments using the best and most relevant data available. In addition, pricing vendors are utilized to assist in valuing investments. GEAM performs periodic reviews of the methodologies used by independent pricing services including price validation of individual securities.
Fair Value Measurement The following section describes the valuation methodologies the Fund uses to measure different financial investments at fair value.
The Fund’s portfolio securities are valued generally on the basis of market quotations. Equity securities generally are valued at the last reported sale price on the primary market in which they are traded. Portfolio securities listed on NASDAQ are valued using the NASDAQ Official Closing Price. Level 1 securities primarily include publicly-traded equity securities which may not necessarily represent the last sale price. If no sales occurred on the exchange or NASDAQ that day, the portfolio security generally is valued using the last reported bid price. In those circumstances the Fund classifies the investment securities in Level 2.
The Fund uses non-binding broker quotes as the primary basis for valuation when there is limited, or no, relevant market activity for a specific investment or for other investments that share similar characteristics. The Fund has not adjusted the prices obtained. Investment securities priced using non-binding broker quotes are included in Level 3. As is the case with the primary pricing vendor, third-party brokers do not provide access to their proprietary valuation models, inputs and assumptions. Accordingly, GEAM conducts internal reviews of pricing for all such investment securities periodically to ensure reasonableness of valuations used in the Fund‘s financial statements. These reviews are designed to identify prices that appear stale, those that have changed significantly from prior valuations, and other anomalies that may indicate that a price may not be accurate. Based on the information available, GEAM believes that the fair values provided by the brokers are representative of prices that would be received to sell the assets at the measurement date (exit prices).
15
| | |
| Notes to Financial Statements | | December 31, 2010 |
A Fund’s written or purchased options are valued at the last sales price, or if no sales occurred that day, at the last reported bid price and those are also included in Level 2.
If prices are not readily available for a portfolio security, or if it is believed that a price for a portfolio security does not represent its fair value, the security may be valued using procedures approved by the Fund’s Board of Trustees that are designed to establish its “fair” value. These securities would be classified in Level 3. Those procedures require
that the fair value of a security be established by the valuation committee. The valuation committee follows different protocols for different types of investments and circumstances. The fair value procedures may be used to value any investment of the Fund in the appropriate circumstances.
The following table presents the Fund’s investments measured at fair value on a recurring basis at December 31, 2010:
| | | | | | | | | | | | | | | | |
Investments | | | Level 1 | | | | Level 2 | | | | Level 3 | | | | Total | |
| | | | |
Investments in Securities† | | | | | | | | | | | | | | | | |
Common Stock | | $ | 96,030,553 | | | $ | — | | | $ | — | | | $ | 96,030,553 | |
Other Investments | | | — | | | | 21,860 | | | | — | | | | 21,860 | |
Short-Term Investments | | | 1,389,787 | | | | — | | | | — | | | | 1,389,787 | |
| | | | | | | | | | | | | | | | |
Total Investments in Securities | | $ | 97,420,340 | | | $ | 21,860 | | | $ | — | | | $ | 97,442,200 | |
| | | | | | | | | | | | | | | | |
| | | | |
| | | | | | | | | | | | | | | | | |
| | | | |
Other Financial Instruments* | | | | | | | | | | | | | | | | |
Futures Contracts — Unrealized Appreciation | | $ | 3,092 | | | $ | — | | | $ | — | | | $ | 3,092 | |
| | | | | | | | | | | | | | | | |
| | | | |
| | | | | | | | | | | | | | | | | |
|
† See Schedule of Investments for Industry Classification. * Other financial instruments include derivative instruments such as futures, forward foreign currency exchange contracts, swap contacts and option contacts. Amounts shown represent unrealized appreciation (depreciation), or in the case of options, market value at period end. | |
| 4. | Derivatives Transactions |
Shown below are the derivative contracts entered into by the Fund, summarized by primary risk exposure as they appear on the Statement of Assets and Liabilities, all of which are not accounted for as hedging instruments under FASB Accounting Standards Codification (“ASC”) No. 815 Derivatives and Hedging as of December 31, 2010.
| | | | | | | | | | | | |
| | | Asset Derivatives | | | Liability Derivatives | |
| | | Location | | Fair Value ($) | | | Location | | Fair Value ($) | |
| Equity Futures | | Assets, Net Assets — Unrealized Appreciation/ (Depreciation) on Futures | | | 3,092* | | | | | | | |
Shown below are the effects of derivative instruments on the Fund’s Statements of Operations, summarized by primary risk exposure all of which are not accounted for as hedging instruments under ASC 815.
| | | | | | | | | | | | | | |
| | | Location | | Notional Amount of
Futures/Contracts
Purchased/(Sold) ($) | | | Realized Gain
or (Loss) ($) | | | Change in Unrealized
Appreciation/(Depreciation) ($) | |
Equity Futures | | Net realized gain/(loss) on futures, Increase/(decrease) in unrealized appreciation/ (depreciation) on futures | | | 22,444,442/(22,312,383) | | | | 129,170 | | | | (7,015 | ) |
| * | Includes cumulative appreciation/depreciation of futures contracts as reported in the Schedule of Investments and Net Assets section of the Statement of Assets and Liabilities. Only the current day’s variation margin is reported within the receivables and/or payables of the Statement of Assets and Liabilities. |
16
| | |
| Notes to Financial Statements | | December 31, 2010 |
The Company shares a revolving credit facility of up to $150 million with a number of its affiliates. The credit facility is with its custodian bank, State Street Bank and Trust Company (“State Street”). The revolving credit facility requires the payment of a commitment fee equal to 0.125% per annum on the daily unused portion of the credit facility, payable quarterly. The portion borne by the Funds generally is borne proportionally based upon net assets. In addition, the Company has a $100 million uncommitted, unsecured line of credit with State Street. Generally, borrowings under the credit facilities would accrue interest at the Federal Funds Rate plus 50 basis points and would be borne by the borrowing Fund. The maximum amount allowed to be borrowed by any one Fund is the lesser of (i) 10% of its total assets or (ii) 20% of its net assets. The credit facilities were not utilized by the Fund during the fiscal year ended December 31, 2010.
| 6. | Fees and Compensation Paid to Affiliates |
GEAM, a registered investment adviser, was retained by the Company’s Board of Directors effective May 1, 1997 to act as investment adviser and administrator of the Fund.
GEAM’s compensation for investment advisory and administrative services is paid monthly based on the average daily net assets of the Fund at an annualized rate of 0.65%.
GEAM waives a portion of the Fund’s management fee in the amount equal to the management fee earned by GEAM with respect to the Fund’s investment in the GE Funds — GE Money Market Fund.
Distribution and Service (12b-1) Fees The Company has adopted a Distribution and Service (12b-1) Plan (the “Plan”) pursuant to Rule 12b-1 under the 1940 Act with respect to Class 4 shares of the Fund. Under the Plan, the Fund may compensate GE Investment Distributors, Inc. (“GEID”), a wholly-owned subsidiary of GEAM and the Fund’s principal distributor, for certain sales services provided by GEID or other broker dealers and investor services provided by GEID or other service providers relating to the Fund’s Class 4 shares, including services to owners or prospective owners of variable contracts issued by insurance companies that offer such share class as an investment option. The amount of compensation paid under the Plan by the Fund’s Class 4 shares may not exceed 0.45% of the average daily net
assets of the Fund attributable to such share class. The Plan continues in effect from year to year for so long as such continuance is approved annually by the Board of Directors, including by those directors who are not interested persons of the Company and who have no direct or indirect financial interest in the operation of the Plan or in any agreement related to it.
Directors’ Compensation The Fund pays no compensation to its directors who are officers or employees of GEAM or its affiliates. Directors who are not such officers or employees also serve in a similar capacity for other funds advised by GEAM. Compensation paid to unaffiliated directors are reflected on the Statement of Operations. These fees are allocated pro rata across all of the mutual fund platforms and share classes served by the directors, including the Fund, and are based upon the relative net assets of each fund within such platforms.
| 7. | Investment Transactions |
Purchases and Sales of Securities The cost of purchases and the proceeds from sales of investments, other than short-term securities and options, for the year ended December 31, 2010 were as follows:
| | |
| Non U.S. Government Securities |
| Purchases | | Sales |
| $27,720,120 | | $44,747,747 |
The Fund is subject to ASC 740, Income Taxes. ASC 740 provides guidance for financial accounting and reporting for the effects of income taxes that result from an entity’s activities during the year. ASC 740 also provides guidance regarding how certain tax positions should be recognized, measured, presented and disclosed in the financial statements. ASC 740 requires evaluation of tax positions taken or expected to be taken in the course of preparing the Fund’s tax returns to determine whether the tax positions are “more likely than not” of being sustained by the applicable tax authority. There are no adjustments to the Fund’s net assets required under ASC 740. The Fund’s 2007, 2008, 2009 and 2010 fiscal years tax returns are still open to examination by the Federal and applicable state tax authorities.
17
| | |
| Notes to Financial Statements | | December 31, 2010 |
At December 31, 2010, information on the tax components of capital is as follows:
| | | | | | | | | | | | | | |
Cost on
Tax Basis | | Gross Unrealized Tax | | Net Tax Appreciation/(Depreciation) | | Undistributed
Income | | Undistributed
Accum.
Capital Loss | | Post October
Losses |
| | Appreciation | | Depreciation | | Investments | | Derivatives/
Currency | | | |
| $75,774,933 | | $27,541,996 | | $(5,874,729) | | $21,667,267 | | $— | | $10,687 | | $(4,127,500) | | $— |
As of December 31, 2010, the Fund has capital loss carryovers as indicated below. Capital loss carryovers are available to offset future realized capital gains to the extent provided in the Internal Revenue Code and regulations thereunder. To the extent that these carryover losses are used to offset future capital gains, it is probable that the gains so offset will not be distributed to shareholders because they would be taxable as ordinary income.
| | |
| Amount | | Expires |
$4,127,500 | | 12/31/2017 |
These amounts will be available to offset future taxable capital gains. Under the recently enacted Regulated Investment Company Modernization Act of 2010, the Fund will be permitted to carry forward capital losses incurred in taxable years beginning after December 22, 2010 for an unlimited period. However, any losses incurred during those future years will be required to be utilized prior to the losses incurred in pre-enactment tax years. As a result of this ordering rule, pre-enactment capital loss carryforwards may be more likely to expire unused. Additionally, post-enactment capital losses that are carried forward will retain their character as either short-term or long-term capital losses rather than being considered all short-term as under previous law.
During the year ended December 31, 2010, the Fund utilized $7,105,929 of prior year capital loss carryovers.
Any net capital and currency losses incurred after October 31, within the Fund’s tax year, are deemed to arise on the first day of the Fund’s next tax year if the Fund so elects to defer such losses.
The Fund did not defer any post-October losses for the year ended December 31, 2010.
The tax composition of distributions paid during the years ended December 31, 2010 and December 31, 2009 were as follows:
| | | | | | | | | | | | |
| | | Ordinary
Income | | | Long-Term
Capital Gains | | | Total | |
2010 | | $ | 316,553 | | | | $— | | | $ | 316,553 | |
2009 | | | 200,960 | | | | — | | | | 200,960 | |
Distributions to Shareholders The Fund declares and pays any dividends from net investment income annually. The Fund declares and pays any net realized capital gains in excess of capital loss carryforwards distributions annually. The character of income and gains to be distributed is determined in accordance with income tax regulations which may differ from generally accepted accounting principles. These differences include (but are not limited to) futures, distributions from Real Estate Investment Trusts (REITS), investments organized as partnerships for tax purposes, and losses deferred due to wash sale transactions. Reclassifications due to permanent book/tax differences are made to the Fund’s capital accounts to reflect income and gains available for distribution (or available capital loss carryovers) under income tax regulations. These reclassifications have no impact on net investment income, realized gains or losses, or the net asset value of the Fund. The calculation of net investment income per share in the Financial Highlights table excludes these adjustments.
The reclassifications for the year ended December 31, 2010 were as follows:
| | | | |
Undistributed
Net Investment
Income | | Accumulated
Net Realized Gain | | Paid In Capital |
| $(1,713) | | $2 | | $1,711 |
18
Report of Independent Registered Public Accounting Firm
The Shareholders and Board of Directors GE Investments Funds, Inc.
We have audited the accompanying statement of assets and liabilities, including the schedule of investments, of the Mid-Cap Equity Fund, a series of GE Investments Funds, Inc., as of December 31, 2010, and the related statement of operations for the year then ended, statements of changes in net assets for each of the years in the two-year period then ended, and the financial highlights for each of the years or periods in the five-year period then ended. These financial statements and financial highlights are the responsibility of the Fund’s management. Our responsibility is to express an opinion on these financial statements and financial highlights based on our audits.
We conducted our audits in accordance with the standards of the Public Company Accounting Oversight Board (United States). Those standards require that we plan and perform the audit to obtain reasonable assurance about whether the financial statements and financial highlights are free of material misstatement. An audit includes examining, on a test basis, evidence supporting the amounts and disclosures in the financial statements. Our procedures included confirmation of securities owned as of December 31, 2010 by correspondence with the custodian and brokers, or by other appropriate auditing procedures where replies from brokers were not received. An audit also includes assessing the accounting principles used and significant estimates made by management, as well as evaluating the overall financial statement presentation. We believe that our audits provide a reasonable basis for our opinion.
In our opinion, the financial statements and financial highlights referred to above present fairly, in all material respects, the financial position of the Mid-Cap Equity Fund as of December 31, 2010, the results of its operations, changes in its net assets and financial highlights for each of the years or periods described above, in conformity with U.S. generally accepted accounting principles.

Boston, Massachusetts
February 25, 2011
19
| | |
| Advisory and Administrative Agreement Renewal | | (unaudited) |
The Board of Directors of the GE Investments Funds, Inc. (the “Board”), including the independent Board members, considered and all those that were present unanimously approved the continuance of the Fund’s Investment Advisory and Administration Agreement with GE Asset Management Incorporated (“GEAM”) at meetings held on December 3 and December 10, 2010.
In considering whether to approve the Fund’s investment advisory agreement, the Board members considered and discussed a substantial amount of information and analysis provided, at the Board’s request, by GEAM. The Board members also considered detailed information regarding performance and expenses of other investment companies, including those with similar investment strategies and sizes, which was prepared by independent third party provider Morningstar, Inc. (“Morningstar”). GEAM does not manage any other mutual funds or investment products other than mutual funds that employ the same investment strategy as the Fund. The Board had the opportunity to ask questions and request additional information in connection with its considerations.
Before approving the Fund’s advisory agreement, the Board members reviewed the information provided with management of GEAM and with independent legal counsel. The Board members also reviewed a memorandum prepared by independent legal counsel discussing the legal standards for the consideration of the proposed continuance. The independent Board members discussed the proposed continuance in detail during a private session with their independent legal counsel at which no representatives of GEAM were present. The independent Board members and their independent legal counsel requested, and received and considered, additional information from GEAM following these sessions.
In advance of the meetings, and in response to their request, the Board members received from GEAM written responses to their inquiries, which included substantial exhibits and other materials related to GEAM’s business and the services it provides to the Fund. The Board members took into account their multi-year experience as Board members and particularly their consideration of these types of agreements in recent years. The information was presented in a manner to facilitate comparison to prior periods and to reflect certain enhancements. To focus their review, the Board members asked GEAM management, in its oral presentation, to highlight material differences from the information presented in recent years.
During the meetings, the Board members had an opportunity to discuss this information with GEAM managers, including senior executives, representatives from the legal, compliance and finance departments, and investment personnel. The Board members posed questions to these representatives and engaged in substantive discussions with them concerning GEAM’s investment process.
In reaching their determination relating to continuance of the Fund’s investment advisory agreement, the Board members considered all factors that they deemed relevant, including the factors discussed below. In their deliberations, the Board members did not identify any particular information that was all-important or controlling, and each Board member may have attributed different weights to the various factors. In particular, the Board members focused on the following:
The Nature, Extent And Quality Of Services Provided.
The Board members reviewed the services provided by GEAM, taking into account their extensive past experiences with GEAM. They focused on the favorable attributes of GEAM, including (i) an investment philosophy oriented toward long-term performance; (ii) effective processes used for selecting investments and brokers; (iii) effective processes used for providing Fund administration, including controllership and compliance functions and oversight of the performance of other companies that provide services to the Fund; (iv) highly skilled professionals including analysts, research professionals, traders and portfolio managers with a depth of experience relevant to the Fund; (v) access to significant technological resources from which the Fund may benefit; and (vi) a favorable history and reputation. The Board members noted that the Fund represents only a small portion of the assets managed by GEAM, but benefits from a full array of services and resources provided by GEAM.
In light of these discussions, the Board, including the independent Board members, concluded that GEAM’s services continue to be satisfactory.
Investment Performance Of The Fund.
The Board members considered the investment performance of the Fund for various periods. The Board members reviewed detailed comparisons of the performance of the Fund with the relevant securities index and peer groupings of mutual funds prepared by
20
| | |
| Advisory and Administrative Agreement Renewal | | (unaudited) |
Morningstar with respect to various periods. The Board members also engaged in detailed discussions with GEAM management about its investment process and performance results. These discussions focused on the Fund’s investment objective, the number and experience of portfolio management and supporting research personnel, the investment style and approach employed and the likely market cycles for the investment style.
The Board, including the independent Board members, concluded that the Fund’s performance was acceptable overall taking into consideration the factors discussed above.
Cost Of The Services Provided And Profits Realized From The Relationship With The Fund.
The Board members considered the fees paid to GEAM by the Fund and the cost of the services provided to the Fund by GEAM. The Board members reviewed the information they had requested from GEAM concerning its profitability. The Board members considered the profit margin information for GEAM’s investment company business as a whole, as well as GEAM’s profitability data for the Fund. The Board members reviewed GEAM’s assumptions and the methods of cost allocation used by GEAM in preparing Fund-specific profitability data. The Board members also discussed with GEAM the basis for its belief that the methods of allocation used were reasonable for each area of its business.
Information was presented regarding the financial condition of GEAM for various past periods. The Board members noted and discussed the additional services provided by GEAM to the Fund compared to other investment products managed by GEAM, and previously had been provided a study conducted by the Investment Company Institute that discusses and compares advisory fees and services for mutual funds and institutional separate accounts. The Board members determined that GEAM should be entitled to earn a reasonable level of profits for the services it provides to the Fund. The Board members also recognized that GEAM had made significant investments in its business and had not fully recovered the sums invested. The Board also considered that GEAM continues to make a substantial investment in fulfilling its obligations to the Fund and supporting its Fund-related activities.
Based on their review, the Board, including the independent Board members, concluded that they were satisfied that the level of profitability achieved by GEAM from its relationship with the Fund was not unreasonable or excessive.
The Extent To Which Economies Of Scale Would Be Realized As The Fund Grows And Whether Fee Levels Would Reflect Such Economies Of Scale.
Although the Board noted that the Fund did not experience significant growth in assets over the past year, the Board members considered the extent to which economies of scale would be realized as the Fund grows, and whether fee levels reflect these economies of scale for the benefit of Fund investors.
The Board members considered the substantial infrastructure investments that GEAM has made with respect to its operations and its commitment to continue investing resources to enhance services to Fund shareholders. The Board members recognized the benefits to the Fund of GEAM’s past investment in its operations through the expenditure of sums to support its substantial infrastructure, and that, with respect to all GEAM managed mutual funds, GEAM has not yet fully recouped that investment. The Board members also recognized the benefits to the Fund of being able to leverage a favorable cost structure achieved with respect to the Fund’s other operating expenses as a result of GEAM’s large overall base of assets under management and its vendor management practices.
Comparison Of Services To Be Rendered And Fees To Be Paid.
The Board members discussed the services provided to the Fund by GEAM, and the fees charged for those services. The Board members reviewed information concerning the fee and expense ratios for the Fund, and comparative information with respect to peer groupings of mutual funds prepared by Morningstar. They discussed that the Fund’s figures were within the applicable peer group ranges. In light of the foregoing, the Board, including the independent Board members, determined that the advisory fees were reasonable in relation to the services provided to the Fund.
21
| | |
| Advisory and Administrative Agreement Renewal | | (unaudited) |
Fall-Out Benefits.
The Board members considered other actual and potential financial benefits that GEAM may derive from its relationship with the Fund, including, to the extent applicable, soft dollar commission benefits generated through Fund portfolio transactions. The Board members noted, however, that the Fund benefits from the vast array of resources available through GEAM, and that the Fund represents only a small portion of the assets managed by GEAM.
Conclusion.
No single factor was determinative to the Board’s decision. Based on their discussion and such other matters as were deemed relevant, the Board, including the independent Board members, concluded that renewal of the advisory agreement was in the best interests of the Fund and its shareholders.
22
| | |
| Additional Information | | (unaudited) |
Information about Directors and Executive Officers:
The business and affairs of the Company are managed under the direction of the Company’s Board of Directors. Information pertaining to the Directors and officers of the Company is set forth below.
Interested Directors and Executive Officers
Michael J. Cosgrove
Address c/o GEAM 3001 Summer St. Stamford, CT 06905
Age 61
Position(s) Held with Fund Chairman of the Board and President
Term of Office and Length of Time Served Until successor is elected and qualified – 14 years
Principal Occupation(s) During Past 5 years President and Chief Executive Officer – Mutual Funds and Intermediary Business since March 2007; Executive Vice President of GEAM from February 1997 to March 2007; Director of GEAM since 1988; Vice President, GE Capital Corporation, an indirect wholly-owned subsidiary of GE, since December 1999; Executive Vice President – Sales and Marketing of GEAM, a wholly-owned subsidiary of GE that is registered as an investment adviser under the Investment Advisers Act of 1940, as amended, from March 1993 to March 2007.
Number of Portfolios in Fund Complex Overseen by Director 49
Other Directorships Held by Director Chairman of the Board and President of GE Funds from 1993 to February 2011, and GE Institutional Funds since its inception; Trustee of General Electric Savings & Security Trust, General Electric S&S Income Fund, General Electric S&S Program Mutual Fund (“GE Savings & Security Funds”), Elfun Funds, General Electric Insurance Plan Trust, General Relief Loan Fund, and General Electric Pension Trust since 1988; Trustee of Fordham University since 2002; Trustee of GE Volunteers since 1993; Director, GE Asset Management (Ireland) since February 1999; Director, GE Asset Management Funds Plc., GE Asset Canada Company, and GE Asset Management Limited since 1998.
Matthew J. Simpson
Address c/o GEAM 3001 Summer St. Stamford, CT 06905
Age 49
Position(s) Held with Fund Director and Executive Vice President
Term of Office and Length of Time Served Until successor is elected and qualified – 3 years
Principal Occupation(s) During Past 5 years Executive Vice President, General Counsel and Secretary of GEAM since July 2007; Senior Vice President and General Counsel – Marketing and Client Services (formerly Asset Management Services), at GEAM and Senior Vice President and General Counsel of GEAMS from February 1997 to June 2007; Vice President and Associate General Counsel of GEAM from October 1992 to February 1997; Vice President of GE Funds, GE Institutional Funds and GE LifeStyle Funds from September 2003 to June 2007; Secretary of GE Funds and GE Institutional Funds from 1997 to June 2007; Vice President of Elfun Funds and GE Savings & Security Funds from October 2003 to June 2007; Assistant Secretary of Elfun Funds and GE Savings & Security Funds from 1998 to June 2007.
Number of Portfolios in Fund Complex Overseen by Director 49
Other Directorships Held by Director Trustee of GE Institutional Funds, Elfun Funds and GE Savings & Security Funds since July 2007. Trustee of GE Funds from July 2007 to February 2011.
23
| | |
| Additional Information | | (unaudited) |
Joon Won Choe
Address c/o GEAM 3001 Summer St. Stamford, CT 06905
Age 41
Position(s) Held with Fund Vice President & Secretary
Term of Office and Length of Time Served Until successor is elected and qualified – Vice President and Secretary – less than 1 year
Principal Occupation(s) During Past 5 years Senior Vice President and Associate General Counsel at GEAM since June 2010; Vice President and Associate General Counsel at GEAM from November 2005 to June 2010; Vice President and Secretary of GE Funds from September 2010 to February 2011. Vice President and Secretary of GE Institutional Funds and GE Investments Funds, Inc. since September 2010; Vice President and Assistant Secretary of Elfun Funds and GE Savings & Security Funds since September 2010.
Number of Portfolios in Fund Complex Overseen by Officer N/A
Other Directorships Held by Officer N/A
Robert Herlihy
Address c/o GEAM 3001 Summer St. Stamford, CT 06905
Age 43
Position(s) Held with Fund Senior Vice President and Chief Compliance Officer
Term of Office and Length of Time Served Until successor is elected and qualified — 5 years
Principal Occupation(s) During Past 5 years Chief Compliance Officer of GEAM, GE Institutional Funds, Elfun Funds, and GE Savings and Security Funds since July 2005; Chief compliance officer of GE Funds from July 2005 to February 2011; Manager of Fund Administration at GEAM from 2002 – 2005.
Number of Portfolios in Fund Complex Overseen by Officer N/A
Other Directorships Held by Officer N/A
Eunice Tsang
Address c/o GEAM 3001 Summer St. Stamford, CT 06905
Age 51
Position(s) Held with Fund Treasurer
Term of Office and Length of Time Served Until successor is elected and qualified – less than one year
Principal Occupations(s) During Past 5 years Treasurer of GE Institutional Funds, Elfun Funds and GE Savings and Security Funds since January 2010; Treasurer of GE Funds from January 2010 to February 2011; GEAM Operational Controllership and Technical Accounting Manager since December 2007; Financial Planning & Analysis Manager – Performance Leader from June 2005 to December 2007; GEAM Quality Black Belt from 2001 to June 2005; Financial Planning & Analysis Manager from 2000 to 2001; and Mutual Fund Assistant Controller from October 1997 to 2000.
Number of Portfolios in Fund Complex Overseen by Officer N/A
Other Directorships Held by Officer N/A
24
| | |
| Additional Information | | (unaudited) |
Non-Interested Directors
John R. Costantino
Address c/o GEAM 3001 Summer St. Stamford, CT 06905
Age 64
Position(s) Held with Fund Director
Term of Office and Length of Time Served Until successor is elected and qualified – 14 years
Principal Occupation(s) During Past 5 years General Partner, NGN Capital LLC since 2006; Managing Director, Vice President of Walden Capital Management since 1996.
Number of Portfolios in Fund Complex Overseen by Director 41
Other Directorships Held by Director Trustee of GE Funds since 1993, GE Institutional Funds since its inception; Trustee of Fordham University from 1989 to 1995 and 2001 to 2007 and Trustee Emeritus since 2007; Trustee of Neuro Science Research Institute since 1986; Trustee of Gregorian University Foundation from 1992 to 2007; Director of Artes Medical from 2006 to 2008.
William J. Lucas
Address c/o GEAM 3001 Summer St. Stamford, CT 06905
Age 61
Position(s) Held with Fund Director
Term of Office and Length of Time Served Until successor is elected and qualified – 13 years (No longer serves as Trustee effective November 4, 2010)
Principal Occupation(s) During Past 5 years Retired since 2010, previously Vice President and Treasurer of Fairfield University since 1983.
Number of Portfolios in Fund Complex Overseen by Director 41
Other Directorships Held by Director Trustee of GE Funds since 1993, and GE Institutional Funds since its inception.
Robert P. Quinn
Address c/o GEAM 3001 Summer St. Stamford, CT 06905
Age 74
Position(s) Held with Fund Director
Term of Office and Length of Time Served Until successor is elected and qualified – 14 years
Principal Occupation(s) During Past 5 years Retired since 1983 from Salomon Brothers Inc.
Number of Portfolios in Fund Complex Overseen by Director 41
Other Directorships Held by Director Trustee of GE Funds since 1993, and GE Institutional Funds since its inception; Trustee, St. Francis Hospital Corp. since 1980.
The Statement of Additional Information for the Fund includes additional information about the Directors and Officers and is available, without charge, upon request by calling 1-800-493-3042.
25
Investment Adviser and Administrator
GE Asset Management Incorporated
Board of Directors
Michael J. Cosgrove, Chairman
John R. Costantino
William J. Lucas*
Robert P. Quinn
Matthew J. Simpson
Secretary
Joon Won Choe
Assistant Secretary
Michelle Matzelle
Treasurer
Eunice Tsang
Assistant Treasurers
Tatyana Begun**
Casey Yantosca
Distributor
GE Investment Distributors, Inc.
Member FINRA and SIPC
Counsel
Sutherland, Asbill & Brennan, LLP
Custodian
State Street Bank & Trust Company
Independent Registered Public Accounting Firm
KPMG LLP
Officers of the Investment Adviser
James W. Ireland, President and Chief Executive Officer
Cheryl H. Beacock, Senior Vice President, Human Resources
Paul M. Colonna, President and Chief Investment Officer – Fixed Income Investments
Michael J. Cosgrove, President and Chief Executive
Officer – Mutual Funds & Intermediary Business
Ralph R. Layman, President and Chief Investment Officer – Public Equity Investments
Maureen B. Mitchell, President – Institutional Sales and Marketing
Steve Rullo, Chief Information Officer (Since February 2011)
Matthew J. Simpson, Executive Vice President, General Counsel and Secretary
Don W. Torey, President – Alternative Investments
John J. Walker, Executive Vice President, Chief Operating Officer
David Wiederecht, President and Chief Investment Officer – Investment Strategies
Tracie Winbigler, Executive Vice President, Chief Financial Officer***
| * | As of November 4, 2010, Mr. Lucas no longer served as a director of the Company. |
| ** | As of February 18, 2011, Ms. Begun no longer served as an officer of the Company. |
| *** | Effective January, 2011. |
26
Investment Adviser
GE Asset Management Incorporated
3001 Summer Street
PO Box 7900
Stamford, CT 06904-7900
Distributor
GE Investment Distributors, Inc.
member FINRA and SIPC
3001 Summer Street
PO Box 7900
Stamford, CT 06904-7900
The Fund files its complete schedule of portfolio holdings with the Securities and Exchange Commission for the first and third quarters of each fiscal year on Form N-Q. The Fund’s Forms N-Q, as well as a description of the policies and procedures that the Fund uses to determine how to vote proxies (if any) relating to portfolio securities is available without charge (i) upon request, by calling 1-800-493-3042; (ii) on the Fund’s website at http://www.geam.com; and (iii) on the Commission’s website at http://www.sec.gov. The Fund’s Forms N-Q may be reviewed and copied at the Commission’s Public Reference Room in Washington, DC—information on the operation of the Public Reference Room may be obtained by calling 1-800-SEC-0330.
Information (if any) regarding how the Fund voted proxies relating to portfolio securities during the most recently disclosed 12-month period ended June 30 is available without charge (i) through the Fund’s website at http://www.geam.com; and (ii) on the Commission’s website at http://www.sec.gov.

GE Investments Funds, Inc.
Small-Cap Equity Fund
Annual Report
December 31, 2010

GE Investments Funds, Inc.
| | |
| |
| Small-Cap Equity Fund | | Contents |
This report is prepared for Policyholders of certain variable contracts and may be distributed to others only if preceded or accompanied by the variable contract’s current prospectus and the current prospectus of the Fund available for investments thereunder.
| | |
| Notes to Performance | | December 31, 2010 (unaudited) |
The information on the following performance pages relates to the GE Investments Small-Cap Equity Fund (the “Fund”).
Total returns take into account changes in share price and assume reinvestment of dividends and capital gains distributions, if any. Total returns shown are net of Fund expenses but do not reflect fees and charges associated with the variable contracts such as administrative fees, account charges and surrender charges, which, if reflected, would reduce the Fund’s total returns for all periods shown.
The performance data quoted represent past performance; past performance does not guarantee future results. Investment return and principal value will fluctuate so your shares, when redeemed, may be worth more or less than their original cost. Current performance may be higher or lower than the performance data quoted. Periods less than one year are not annualized. Please call 800-493-3042 or visit the Fund’s website at http://www.geam.com for the most recent month-end performance data.
An investment in the Fund is not a deposit of any bank and is not insured or guaranteed by the Federal Deposit Insurance Corporation (FDIC) or any other government agency. An investment in the Fund is subject to risk, including possible loss of principal invested.
The Russell 2000® Index is an unmanaged market capitalization-weighted index consisting of 2,000 of the smallest U.S.-domiciled publicly traded common stocks that are included in the Russell 3000® Index. The Russell 3000®
Index is comprised of the 3,000 largest U.S. domiciled companies. The results shown for the foregoing index assume the reinvestment of net dividends or interest. They do not reflect the actual cost of investing in the instruments that comprise the index.
Russell Investment Group owns the Russell Index data, including all applicable trademarks and copyrights, used by GE Asset Management Incorporated in these materials. Any unauthorized use or redistribution of such Russell Index data is strictly prohibited. Russell Investment Group is not responsible for the configuration of this material or for any inaccuracy in GE Asset Management Incorporated’s presentation thereof.
The peer universe of the underlying annuity funds used for the peer group average annual total return calculation is based on a blend of Morningstar peer categories, as shown. Morningstar is an independent mutual fund rating service. A Fund’s performance may be compared to or ranked within a universe of mutual funds with investment objectives and policies similar but not necessarily identical to that of the Fund.
©2010 Morningstar, Inc. All Rights Reserved. The Morningstar information contained herein: (1) is proprietary to Morningstar and/or its content providers; (2) may not be copied or distributed; and (3) is no warranted to be accurate, complete or timely. Neither Morningstar nor its content providers are responsible for any damage or losses relating from any use of this information. Past performance is no guarantee or future results.
GE Investment Distributors, Inc., Member of FINRA & SIPC, is the principal underwriter and distributor of the GE Investments Funds, Inc. and a wholly owned subsidiary of GE Asset Management Incorporated, the investment adviser of the Fund.
1
| | |
| Small-Cap Equity Fund | | (unaudited) |

David Wiederecht
The Small-Cap Equity Fund utilizes a multiple sub-adviser Fund structure that utilizes several sub-advisers to manage the Fund’s assets. The Fund is managed by David Wiederecht, who is vested with oversight authority over the Fund’s sub-advisers that provide day-to-day management of the assets of the Fund allocated to them. David Wiederecht has full discretion in determining the assets that are allocated to each sub-adviser. The current sub-advisers of the Fund are as follows: Palisade Capital Management L.L.C.; Champlain Investment Partners, LLC; GlobeFlex Capital, LP; Kennedy Capital Management, Inc.; and SouthernSun Asset Management, LLC.
David Wiederecht is the President and Chief Investment Officer — Investment Strategies and a Director at GE Asset Management. He has served as a portfolio manager of the Small-Cap Equity Fund since September 2010. Mr. Wiederecht joined GE Asset Management in 1988 and has held various positions at GE Asset Management including Vice President — Alternative Investments/Private Equity/Hedge Fund from 1998 to 2004, Managing Director — Alternative Investments from 2004 to 2008, and President — Investment Strategies since 2008.
| Q. | How did the GE Investments Funds Small-Cap Equity Fund perform compared to its benchmark and Morningstar peer group for the twelve-month period ended December 31, 2010? |
| A. | For the twelve-month period ended December 30, 2010, the GE Investments Funds Small-Cap Equity Fund returned 27.47% for Class 1 shares and 26.95% for Class 4 shares. The Russell 2000 Index, the Fund’s benchmark, returned 26.86% and the Fund’s Morningstar peer group of 148 Small Blend Funds returned an average of 25.76% for the same period. |
| Q. | What market conditions impacted Fund performance? |
| A. | During 2010, smaller capitalization stocks outperformed, as is typically the case in the early innings of an economic recovery. |
| | Equities improved steadily over the year underpinned by strong corporate earnings growth. The tone of the markets improved after Federal Reserve Chairman Ben Bernanke announced more quantitative easing (or “QE2”) in late August, igniting a rally for equities through year-end. |
| Q. | What were the primary drivers of Fund performance? |
| A. | The Fund outperformed the Russell 2000 Index over the twelve-month period ending December 31, 2010. The outperformance, spread across eight sectors, was most pronounced in the Industrials and Consumer Staples sectors. Strong stock selection in both sectors, along with a slight overweight in Industrials, produced outperformance relative to the Index sectors. Information Technology and Consumer Discretionary sectors also benefited from strong stock selection, as well as an underweight position within the Financials sector. Healthcare and Materials sectors detracted to Fund performance over the twelve-month period. |
| Q. | Were there any significant changes to the Fund during the period? |
| A. | On September 10, 2010, the Board of Trustees approved the addition of Kennedy Capital Management, Inc. as sub-adviser to the Fund. Kennedy will serve as one of five sub-advisers to the Fund, and will manage a portion of the Fund’s assets allocated to it by the Adviser. Additionally, effective September 10, 2010, David Wiederecht assumed overall portfolio management responsibilities for the Fund. |
| | Finally, Judy Studer, GEAM’s Chief Market Strategist and portfolio manager responsible for the asset allocation of the Fund, retired from GE Asset Management as of December 31, 2010. |
| | We remain confident in both the sub-adviser’s abilities and the investment approaches which have brought them success in the past. |
2
| | |
| Small-Cap Equity Fund | | (unaudited) |
Understanding Your Fund’s Expenses
As a shareholder of the Fund you incur transaction and ongoing expenses. Transaction expenses including sales charges on purchases payments, reinvested dividends (or other distributions), and redemption fees directly reduce the investment return of the Fund. Ongoing costs include portfolio management fees, distribution and services fees, professional fees, administrative fees and other Fund expenses. The following example is intended to help you understand your ongoing costs (in dollars) of investing in the Fund and to compare these costs with the ongoing costs of investing in other mutual funds.
To illustrate these ongoing costs, we have provided an example and calculated the expenses paid by investors during the period. The information in the following table is based on an investment of $1,000, which is invested at the beginning of the period and held for the entire six-month period ended December 31, 2010.
Actual Expenses
The first section of the table provides information about actual account values and actual expenses. You may use the information in this section, together with the amount you invested, to estimate the expenses that you paid
over the period. To do so, simply divide your account value by $1,000 (for example, an $8,600 account value divided by $1,000 = 8.6), then multiply the result by the number given for your class under the heading “Expenses Paid During Period.”
Hypothetical Example for Comparison Purposes
The second section of the table provides information about hypothetical account values and hypothetical expenses based on the Fund’s actual expense ratio and an assumed rate of return of 5% per year before expenses, which is not the Fund’s actual return. You may use this information to compare the ongoing costs of investing in the Fund and other funds. To do so, compare this 5% hypothetical example with the 5% hypothetical examples that appear in the shareholders reports of other funds.
Please note that the expenses shown in the table for both “Actual” and “Hypothetical” do not reflect any transaction costs, such as sales charges or redemption fees. Additionally, the expenses shown do not reflect the fees or changes associated with variable contracts through which shares of the Fund are offered.
July 1, 2010 – December 31, 2010
| | | | | | | | | | | | | | | | |
| | | | | | Account value at the
beginning of the period ($) | | | Account value at the
end of the period ($) | | | Expenses paid
during the period ($)* | |
Actual Fund Return** | | | | | | | | | |
Class 1 | | | | | | | 1,000.00 | | | | 1,287.85 | | | | 6.46 | |
Class 4 | | | | | | | 1,000.00 | | | | 1,285.27 | | | | 8.87 | |
Hypothetical 5% Return (2.5% for the period) | | | | | | | | | |
Class 1 | | | | | | | 1,000.00 | | | | 1,019.37 | | | | 5.70 | |
Class 4 | | | | | | | 1,000.00 | | | | 1,017.30 | | | | 7.83 | |
| * | | Expenses are equal to the Fund’s annualized expense ratio of 1.12% for Class 1 shares and 1.54% for Class 4 shares (for the period July 1, 2010—December 31, 2010), multiplied by the average account value over the period, multiplied by 184/365 (to reflect the one-half year period). |
| ** | | Actual Fund Returns for the six-month period ended December 31, 2010 were as follows: 28.79% for Class 1 shares, and 28.53% for Class 4 shares. Past performance does not guarantee future results. |
3
| | |
| Small-Cap Equity Fund | | (unaudited) |
Investment Profile
A mutual fund designed for investors who seek long-term growth of capital by investing at least 80% of its net assets under normal circumstances in common and preferred stocks and other types of equity securities of small-cap companies. The Fund uses a multi-sub-adviser investment strategy that combines growth, value and core investment management styles.
Morningstar Performance Comparison
Based on average annual returns for periods ended 12/31/10
| | | | | | | | | | | | | | | | |
| | | | | | One
Year | | | Five
Year | | | Ten
Year | |
Number of Funds in peer group: | | | | | | | 148 | | | | 131 | | | | 101 | |
Peer group average annual total return: | | | | | | | 25.76 | % | | | 3.59 | % | | | 6.21 | % |
Morningstar category in peer group: U.S. Insurance Small Blend Funds. | |
Sector Allocation
as a % of Fair Value of $55,812 (in thousands) on December 31, 2010(b)(c)
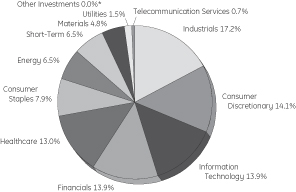
Top Ten Largest Holdings
as of December 31, 2010 (as a % of Fair Value)(b)(c)
| | | | |
Sensient Technologies Corp. | | | 1.41% | |
Oil States International Inc. | | | 1.18% | |
Del Monte Foods Co. | | | 1.15% | |
SM Energy Co. | | | 0.99% | |
Bio-Reference Laboratories Inc. | | | 0.99% | |
LKQ Corp. | | | 0.94% | |
Genesee & Wyoming Inc. | | | 0.93% | |
HCC Insurance Holdings Inc. | | | 0.88% | |
John Wiley & Sons Inc. | | | 0.88% | |
Raymond James Financial Inc. | | | 0.87% | |
Change in Value of a $10,000 Investment
Class 1 Shares
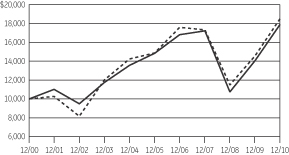
Average Annual Total Return
for the Periods Ended December 31, 2010
Class 1 Shares (Inception date: 4/28/00)
| | | | | | | | | | | | | | | | |
| | | One
Year | | | Five
Year | | | Ten
Year | | | Ending value of a
$10,000 investment(a) | |
Small-Cap Equity Fund | | | 27.47% | | | | 3.84% | | | | 6.00% | | | | 17,906 | |
Russell 2000 Index | | | 26.86% | | | | 4.47% | | | | 6.34% | | | | 18,497 | |
Change in Value of a $10,000 Investment
Class 4 Shares

Average Annual Total Returns
for the Periods Ended December 31, 2010
Class 4 Shares (Inception date: 5/1/08)
| | | | | | | | | | | | | | | | |
| | | | | | One
Year | | | Since
Inception | | | Ending value of a
$10,000 investment(a) | |
Small-Cap Equity Fund | | | | | | | 26.95% | | | | 1.44% | | | �� | 10,389 | |
Russell 2000 Index | | | | | | | 26.86% | | | | 4.96% | | | | 11,378 | |

| (a) | Ending value of a $10,000 investment for the ten-year period or since inception, whichever is less. |
| (b) | The securities information regarding holdings, allocations and other characteristics is presented to illustrate examples of securities that the Fund has bought and the diversity of areas in which the Fund may invest as of a particular date. It may not be representative of the Fund’s current or future investments and should not be construed as a recommendation to purchase or sell a particular security. |
| (c) | Fair value basis is inclusive of Short Term Investment in GE Money Market Fund. |
See Notes to Performance on page 1 for further information, including an explanation of Morningstar peer categories.
Past performance does not predict future performance and the graph and table do not reflect the deduction of taxes that a shareholder would pay on Fund distributions on the redemption of Fund shares and do not reflect the fees or charges that would be associated with variable contracts through which shares of the Fund are offered.
4
Small-Cap Equity Fund
| | |
| Schedule of Investments | | December 31, 2010 |
Small-Cap Equity Fund
| | | | | | | | | | |
| | | |
| | | Number
of Shares | | | Fair Value | | | |
Common Stock — 93.9% † | | | |
|
Advertising — 0.8% |
| | | |
Arbitron Inc. | | | 11,110 | | | $ | 461,287 | | | |
|
Aerospace & Defense — 0.8% |
| | | |
Esterline Technologies Corp. | | | 863 | | | | 59,194 | | | (a) |
Herley Industries Inc. | | | 295 | | | | 5,109 | | | (a) |
Moog Inc. | | | 555 | | | | 22,089 | | | (a) |
Teledyne Technologies Inc. | | | 8,500 | | | | 373,745 | | | (a) |
| | | | | | | 460,137 | | | |
|
Agricultural Products — 0.6% |
| | | |
Darling International Inc. | | | 24,500 | | | | 325,360 | | | (a) |
Fresh Del Monte Produce Inc. | | | 1,010 | | | | 25,199 | | | |
| | | | | | | 350,559 | | | |
|
Air Freight & Logistics — 0.2% |
| | | |
UTi Worldwide Inc. | | | 6,050 | | | | 128,260 | | | |
|
Apparel Retail — 1.4% |
| | | |
Aeropostale Inc. | | | 12,000 | | | | 295,680 | | | (a) |
American Eagle Outfitters Inc. | | | 6,400 | | | | 93,632 | | | |
Brown Shoe Company Inc. | | | 1,000 | | | | 13,930 | | | |
DSW Inc. | | | 500 | | | | 19,550 | | | (a) |
Genesco Inc. | | | 847 | | | | 31,754 | | | (a) |
The Buckle Inc. | | | 7,900 | | | | 298,383 | | | |
The Finish Line Inc. | | | 1,300 | | | | 22,347 | | | |
| | | | | | | 775,276 | | | |
|
Apparel, Accessories & Luxury Goods — 0.9% |
| | | |
Columbia Sportswear Co. | | | 5,085 | | | | 306,626 | | | |
Fossil Inc. | | | 400 | | | | 28,192 | | | (a) |
Maidenform Brands Inc. | | | 6,400 | | | | 152,128 | | | (a) |
Movado Group Inc. | | | 975 | | | | 15,736 | | | (a) |
The Warnaco Group Inc. | | | 100 | | | | 5,507 | | | (a) |
| | | | | | | 508,189 | | | |
| |
Application Software — 4.6% | | | |
| | | |
ACI Worldwide Inc. | | | 4,900 | | | | 131,663 | | | (a) |
Actuate Corp. | | | 3,200 | | | | 18,240 | | | (a) |
Blackbaud Inc. | | | 15,710 | | | | 406,889 | | | |
Blackboard Inc. | | | 6,000 | | | | 247,800 | | | (a) |
Bottomline Technologies Inc. | | | 10,100 | | | | 219,271 | | | (a) |
Concur Technologies Inc. | | | 3,000 | | | | 155,790 | | | (a) |
Ebix Inc. | | | 6,800 | | | | 160,956 | | | (a) |
Interactive Intelligence Inc. | | | 1,566 | | | | 40,967 | | | (a) |
Mentor Graphics Corp. | | | 540 | | | | 6,480 | | | (a) |
Monotype Imaging Holdings Inc. | | | 1,700 | | | | 18,870 | | | (a) |
Parametric Technology Corp. | | | 17,800 | | | | 401,034 | | | (a) |
Quest Software Inc. | | | 1,285 | | | | 35,646 | | | (a) |
SolarWinds Inc. | | | 13,100 | | | | 252,175 | | | (a) |
| | | | | | | | | | |
| | | |
| | | Number
of Shares | | | Fair Value | | | |
| | | |
Solera Holdings Inc. | | | 2,300 | | | $ | 118,036 | | | |
SS&C Technologies Holdings Inc. | | | 1,490 | | | | 30,560 | | | (a) |
TeleNav Inc. | | | 2,400 | | | | 17,472 | | | (a) |
TIBCO Software Inc. | | | 700 | | | | 13,797 | | | (a) |
Ultimate Software Group Inc. | | | 6,000 | | | | 291,780 | | | (a) |
| | | | | | | 2,567,426 | | | |
|
Asset Management & Custody Banks — 1.0% |
| | | |
Affiliated Managers Group Inc. | | | 3,225 | | | | 319,984 | | | (a) |
Financial Engines Inc. | | | 8,400 | | | | 166,572 | | | (a) |
Waddell & Reed Financial Inc. | | | 2,000 | | | | 70,580 | | | |
| | | | | | | 557,136 | | | |
|
Auto Parts & Equipment — 0.3% |
| | | |
China Automotive Systems Inc. | | | 600 | | | | 8,160 | | | (a) |
Dana Holding Corp. | | | 2,297 | | | | 39,531 | | | (a) |
Federal-Mogul Corp. | | | 800 | | | | 16,520 | | | (a) |
Modine Manufacturing Co. | | | 1,550 | | | | 24,025 | | | (a) |
Spartan Motors Inc. | | | 1,025 | | | | 6,242 | | | |
Stoneridge Inc. | | | 1,624 | | | | 25,643 | | | (a) |
Tenneco Inc. | | | 500 | | | | 20,580 | | | (a) |
Wonder Auto Technology Inc. | | | 3,065 | | | | 23,110 | | | (a) |
| | | | | | | 163,811 | | | |
|
Automobile Manufacturers — 0.0%* |
| | | |
Thor Industries Inc. | | | 250 | | | | 8,490 | | | |
|
Automotive Retail — 0.1% |
| | | |
America’s Car-Mart Inc. | | | 895 | | | | 24,237 | | | (a) |
|
Biotechnology — 1.2% |
| | | |
Cubist Pharmaceuticals Inc. | | | 3,900 | | | | 83,460 | | | (a) |
Genomic Health Inc. | | | 6,000 | | | | 128,340 | | | (a) |
Martek Biosciences Corp. | | | 6,727 | | | | 210,555 | | | (a) |
Myriad Genetics Inc. | | | 9,000 | | | | 205,560 | | | (a) |
Nabi Biopharmaceuticals | | | 3,500 | | | | 20,265 | | | (a) |
PDL BioPharma Inc. | | | 2,220 | | | | 13,831 | | | |
Sciclone Pharmaceuticals Inc. | | | 4,800 | | | | 20,064 | | | (a) |
| | | | | | | 682,075 | | | |
| |
Building Products — 0.2% | | | |
| | | |
AAON Inc. | | | 736 | | | | 20,763 | | | |
AO Smith Corp. | | | 450 | | | | 17,136 | | | |
Apogee Enterprises Inc. | | | 915 | | | | 12,325 | | | |
Universal Forest Products Inc. | | | 755 | | | | 29,369 | | | |
| | | | | | | 79,593 | | | |
| |
Coal & Consumable Fuels — 0.6% | | | |
| | | |
Cloud Peak Energy Inc. | | | 800 | | | | 18,584 | | | (a) |
James River Coal Co. | | | 11,375 | | | | 288,129 | | | (a) |
| | | | | | | 306,713 | | | |
| |
Commercial Printing — 0.0%* | | | |
| | | |
Multi-Color Corp. | | | 1,200 | | | | 23,352 | | | |
See Notes to Schedule of Investments and Notes to Financial Statements.
5
Small-Cap Equity Fund
| | |
| Schedule of Investments | | December 31, 2010 |
| | | | | | | | | | |
| | | |
| | | Number
of Shares | | | Fair Value | | | |
| |
Commodity Chemicals — 0.7% | | | |
| | | |
Calgon Carbon Corp. | | | 800 | | | $ | 12,096 | | | (a) |
Koppers Holdings Inc. | | | 9,625 | | | | 344,383 | | | |
| | | | | | | 356,479 | | | |
| |
Communications Equipment — 0.7% | | | |
| | | |
Acme Packet Inc. | | | 550 | | | | 29,238 | | | (a) |
Arris Group Inc. | | | 2,105 | | | | 23,618 | | | (a) |
Blue Coat Systems Inc. | | | 7,000 | | | | 209,090 | | | (a) |
Comtech Telecommunications Corp. | | | 449 | | | | 12,451 | | | |
DG FastChannel Inc. | | | 600 | | | | 17,328 | | | (a) |
Loral Space & Communications Inc. | | | 300 | | | | 22,950 | | | (a) |
Netgear Inc. | | | 766 | | | | 25,799 | | | (a) |
Plantronics Inc. | | | 550 | | | | 20,471 | | | |
Sierra Wireless Inc. | | | 984 | | | | 14,681 | | | (a) |
| | | | | | | 375,626 | | | |
| |
Computer & Electronics Retail — 0.0%* | | | |
| | | |
Systemax Inc. | | | 920 | | | | 12,972 | | | (a) |
| |
Construction & Engineering — 1.6% | | | |
| | | |
Chicago Bridge & Iron Company N.V. | | | 9,875 | | | | 324,887 | | | (a) |
Great Lakes Dredge & Dock Corp. | | | 2,349 | | | | 17,312 | | | |
Primoris Services Corp. | | | 2,000 | | | | 19,080 | | | |
Quanta Services Inc. | | | 10,300 | | | | 205,176 | | | (a) |
URS Corp. | | | 7,775 | | | | 323,518 | | | (a) |
| | | | | | | 889,973 | | | |
| |
Construction & Farm Machinery & Heavy Trucks — 2.1% | | | |
| | | |
AGCO Corp. | | | 5,890 | | | | 298,387 | | | (a) |
Astec Industries Inc. | | | 1,262 | | | | 40,901 | | | (a) |
Cascade Corp. | | | 4,600 | | | | 217,488 | | | |
Greenbrier companies Inc. | | | 708 | | | | 14,861 | | | (a) |
NACCO Industries Inc. | | | 100 | | | | 10,837 | | | |
The Toro Co. | | | 232 | | | | 14,301 | | | |
Trinity Industries Inc. | | | 12,500 | | | | 332,625 | | | |
WABCO Holdings Inc. | | | 600 | | | | 36,558 | | | (a) |
Wabtec Corp. | | | 4,000 | | | | 211,560 | | | |
| | | | | | | 1,177,518 | | | |
| |
Consumer Electronics — 0.1% | | | |
| | | |
Harman International Industries Inc. | | | 715 | | | | 33,104 | | | (a) |
| |
Consumer Finance — 0.1% | | | |
| | | |
Ezcorp Inc. | | | 950 | | | | 25,774 | | | (a) |
First Cash Financial Services Inc. | | | 650 | | | | 20,144 | | | (a) |
Nelnet Inc. | | | 950 | | | | 22,505 | | | |
| | | | | | | 68,423 | | | |
| |
Data Processing & Outsourced Services — 1.6% | | | |
| | | |
ExlService Holdings Inc. | | | 650 | | | | 13,962 | | | (a) |
Global Cash Access Holdings Inc. | | | 23,570 | | | | 75,188 | | | (a) |
Jack Henry & Associates Inc. | | | 6,000 | | | | 174,900 | | | |
NeuStar Inc. | | | 4,058 | | | | 105,711 | | | (a) |
TeleTech Holdings Inc. | | | 850 | | | | 17,502 | | | (a) |
| | | | | | | | | | |
| | | |
| | | Number
of Shares | | | Fair Value | | | |
| | | |
TNS Inc. | | | 815 | | | $ | 16,952 | | | (a) |
VeriFone Systems Inc. | | | 7,300 | | | | 281,488 | | | (a) |
Wright Express Corp. | | | 4,400 | | | | 202,400 | | | (a) |
| | | | | | | 888,103 | | | |
| |
Department Stores — 0.0%* | | | |
| | | |
Retail Ventures Inc. | | | 1,100 | | | | 17,930 | | | (a) |
| |
Distributors — 1.0% | | | |
| | | |
LKQ Corp. | | | 23,200 | | | | 527,104 | | | (a) |
| |
Diversified Chemicals — 0.0%* | | | |
| | | |
Solutia Inc. | | | 800 | | | | 18,464 | | | (a) |
| |
Diversified Metals & Mining — 0.5% | | | |
| | | |
Compass Minerals International Inc. | | | 3,090 | | | | 275,844 | | | |
| |
Diversified Real Estate Activities — 0.2% | | | |
| | | |
Coresite Realty Corp. (REIT) | | | 5,400 | | | | 73,656 | | | |
Tejon Ranch Co. | | | 700 | | | | 19,285 | | | (a) |
| | | | | | | 92,941 | | | |
| |
Diversified REITs — 0.1% | | | |
| | | |
Cousins Properties Inc. | | | 1,642 | | | | 13,694 | | | |
Washington Real Estate Investment Trust | | | 665 | | | | 20,608 | | | |
| | | | | | | 34,302 | | | |
| |
Diversified Support Services — 1.2% | | | |
| | | |
Copart Inc. | | | 5,600 | | | | 209,160 | | | (a) |
Healthcare Services Group Inc. | | | 13,500 | | | | 219,645 | | | |
Ritchie Bros Auctioneers Inc. | | | 10,000 | | | | 230,500 | | | |
Unifirst Corp. | | | 250 | | | | 13,763 | | | |
| | | | | | | 673,068 | | | |
| |
Education Services — 1.3% | | | |
| | | |
American Public Education Inc. | | | 4,500 | | | | 167,580 | | | (a) |
Bridgepoint Education Inc. | | | 400 | | | | 7,600 | | | (a) |
Capella Education Co. | | | 2,600 | | | | 173,108 | | | (a) |
K12 Inc. | | | 6,000 | | | | 171,960 | | | (a) |
Lincoln Educational Services Corp. | | | 4,205 | | | | 65,220 | | | |
Strayer Education Inc. | | | 1,000 | | | | 152,220 | | | |
| | | | | | | 737,688 | | | |
| |
Electric Utilities — 0.7% | | | |
| | | |
Allete Inc. | | | 545 | | | | 20,307 | | | |
IDACORP Inc. | | | 9,800 | | | | 362,404 | | | |
Westar Energy Inc. | | | 930 | | | | 23,399 | | | |
| | | | | | | 406,110 | | | |
| |
Electrical Components & Equipment — 1.5% | | | |
| | | |
Brady Corp. | | | 12,535 | | | | 408,766 | | | |
Generac Holdings Inc. | | | 575 | | | | 9,298 | | | (a) |
II-VI Inc. | | | 435 | | | | 20,167 | | | (a) |
LSI Industries Inc. | | | 1,030 | | | | 8,714 | | | |
See Notes to Schedule of Investments and Notes to Financial Statements.
6
Small-Cap Equity Fund
| | |
| Schedule of Investments | | December 31, 2010 |
| | | | | | | | | | |
| | | |
| | | Number
of Shares | | | Fair Value | | | |
| | | |
Preformed Line Products Company | | | 231 | | | $ | 13,519 | | | |
Regal-Beloit Corp. | | | 440 | | | | 29,374 | | | |
Woodward Governor Co. | | | 8,800 | | | | 330,528 | | | |
| | | | | | | 820,366 | | | |
| |
Electronic Components — 0.1% | | | |
| | | |
Vishay Intertechnology Inc. | | | 1,600 | | | | 23,488 | | | (a) |
| |
Electronic Equipment & Instruments — 1.5% | | | |
| | | |
Checkpoint Systems Inc. | | | 700 | | | | 14,385 | | | (a) |
Coherent Inc. | | | 400 | | | | 18,056 | | | (a) |
Daktronics Inc. | | | 1,200 | | | | 19,104 | | | |
Elster Group SE ADR | | | 3,400 | | | | 57,460 | | | (a) |
FARO Technologies Inc. | | | 6,000 | | | | 197,040 | | | (a) |
National Instruments Corp. | | | 9,000 | | | | 338,760 | | | |
Newport Corp. | | | 7,050 | | | | 122,458 | | | (a) |
Rofin-Sinar Technologies Inc. | | | 1,315 | | | | 46,604 | | | (a) |
| | | | | | | 813,867 | | | |
| |
Electronic Manufacturing Services — 0.3% | | | |
| | | |
Benchmark Electronics Inc. | | | 1,542 | | | | 28,003 | | | (a) |
CTS Corp. | | | 1,600 | | | | 17,696 | | | |
DDi Corp. | | | 1,267 | | | | 14,900 | | | |
Measurement Specialties Inc. | | | 550 | | | | 16,142 | | | (a) |
Methode Electronics Inc. | | | 2,084 | | | | 27,030 | | | |
Multi-Fineline Electronix Inc. | | | 995 | | | | 26,358 | | | (a) |
Zygo Corp. | | | 250 | | | | 3,057 | | | (a) |
| | | | | | | 133,186 | | | |
| |
Environmental & Facilities Services — 1.4% | | | |
| | | |
ABM Industries Inc. | | | 15,100 | | | | 397,130 | | | |
Waste Connections Inc. | | | 13,650 | | | | 375,784 | | | |
| | | | | | | 772,914 | | | |
| |
Food Distributors — 0.2% | | | |
| | | |
Nash Finch Co. | | | 275 | | | | 11,690 | | | |
Spartan Stores Inc. | | | 4,400 | | | | 74,580 | | | |
| | | | | | | 86,270 | | | |
| |
Food Retail — 0.6% | | | |
| | | |
Ruddick Corp. | | | 9,000 | | | | 331,560 | | | |
| |
Footwear — 0.8% | | | |
| | | |
Deckers Outdoor Corp. | | | 4,284 | | | | 341,606 | | | (a) |
K-Swiss Inc. | | | 915 | | | | 11,410 | | | (a) |
The Timberland Co. | | | 850 | | | | 20,902 | | | (a) |
Wolverine World Wide Inc. | | | 1,430 | | | | 45,588 | | | |
| | | | | | | 419,506 | | | |
| |
Gas Utilities — 0.1% | | | |
| | | |
South Jersey Industries Inc. | | | 925 | | | | 48,858 | | | |
| |
Healthcare Distributors — 0.7% | | | |
| | | |
Owens & Minor Inc. | | | 13,010 | | | | 382,884 | | | |
| | | | | | | | | | |
| | | |
| | | Number
of Shares | | | Fair Value | | | |
| |
Healthcare Equipment — 3.0% | | | |
| | | |
American Medical Systems Holdings Inc. | | | 10,100 | | | $ | 190,486 | | | (a) |
Analogic Corp. | | | 300 | | | | 14,853 | | | |
Exactech Inc. | | | 490 | | | | 9,222 | | | (a) |
Gen-Probe Inc. | | | 5,000 | | | | 291,750 | | | (a) |
Hill-Rom Holdings Inc. | | | 635 | | | | 25,000 | | | |
Integra LifeSciences Holdings Corp. | | | 6,300 | | | | 297,990 | | | (a) |
Masimo Corp. | | | 6,000 | | | | 174,420 | | | |
Natus Medical Inc. | | | 950 | | | | 13,471 | | | (a) |
NuVasive Inc. | | | 10,085 | | | | 258,680 | | | (a) |
Orthofix International N.V. | | | 300 | | | | 8,700 | | | (a) |
Sirona Dental Systems Inc. | | | 300 | | | | 12,534 | | | (a) |
SonoSite Inc. | | | 4,000 | | | | 126,400 | | | (a) |
STERIS Corp. | | | 400 | | | | 14,584 | | | |
Teleflex Inc. | | | 3,430 | | | | 184,568 | | | |
Zoll Medical Corp. | | | 865 | | | | 32,204 | | | (a) |
| | | | | | | 1,654,862 | | | |
| |
Healthcare Facilities — 0.6% | | | |
| | | |
National Healthcare Corp. | | | 250 | | | | 11,567 | | | |
Sun Healthcare Group Inc. | | | 3,811 | | | | 48,248 | | | (a) |
The Ensign Group Inc. | | | 645 | | | | 16,041 | | | |
VCA Antech Inc. | | | 10,100 | | | | 235,229 | | | (a) |
| | | | | | | 311,085 | | | |
| |
Healthcare Services — 2.6% | | | |
| | | |
Almost Family Inc. | | | 322 | | | | 12,371 | | | (a) |
Bio-Reference Laboratories Inc. | | | 24,800 | | | | 550,064 | | | (a) |
Catalyst Health Solutions Inc. | | | 350 | | | | 16,272 | | | (a) |
Continucare Corp. | | | 4,503 | | | | 21,074 | | | (a) |
Gentiva Health Services Inc. | | | 600 | | | | 15,960 | | | (a) |
HMS Holdings Corp. | | | 5,500 | | | | 356,235 | | | (a) |
Mednax Inc. | | | 7,000 | | | | 471,030 | | | (a) |
RehabCare Group Inc. | | | 550 | | | | 13,035 | | | (a) |
| | | | | | | 1,456,041 | | | |
| |
Healthcare Supplies — 1.2% | | | |
| | | |
Align Technology Inc. | | | 1,300 | | | | 25,402 | | | (a) |
Atrion Corp. | | | 50 | | | | 8,973 | | | |
Immucor Inc. | | | 6,075 | | | | 120,467 | | | (a) |
Medical Action Industries Inc. | | | 1,036 | | | | 9,925 | | | (a) |
Meridian Bioscience Inc. | | | 6,000 | | | | 138,960 | | | |
Merit Medical Systems Inc. | | | 698 | | | | 11,049 | | | (a) |
West Pharmaceutical Services Inc. | | | 8,500 | | | | 350,200 | | | |
| | | | | | | 664,976 | | | |
| |
Healthcare Technology — 1.3% | | | |
| | | |
Allscripts Healthcare Solutions Inc. | | | 861 | | | | 16,591 | | | (a) |
athenahealth Inc. | | | 3,000 | | | | 122,940 | | | (a) |
Computer Programs & Systems Inc. | | | 5,700 | | | | 266,988 | | | |
MedAssets Inc. | | | 14,100 | | | | 284,679 | | | (a) |
| | | | | | | 691,198 | | | |
| |
Home Entertainment Software — 0.0%* | | | |
| | | |
Take-Two Interactive Software Inc. | | | 1,200 | | | | 14,688 | | | (a) |
See Notes to Schedule of Investments and Notes to Financial Statements.
7
Small-Cap Equity Fund
| | |
| Schedule of Investments | | December 31, 2010 |
| | | | | | | | | | |
| | | |
| | | Number
of Shares | | | Fair Value | | | |
| |
Homefurnishing Retail — 0.7% | | | |
| | | |
Aaron’s Inc. | | | 18,913 | | | $ | 385,636 | | | |
Pier 1 Imports Inc. | | | 2,142 | | | | 22,491 | | | (a) |
| | | | | | | 408,127 | | | |
| |
Household Products — 0.3% | | | |
| | | |
WD-40 Co. | | | 4,400 | | | | 177,232 | | | |
| |
Housewares & Specialties — 1.2% | | | |
| | | |
Jarden Corp. | | | 14,500 | | | | 447,615 | | | |
Tupperware Brands Corp. | | | 4,000 | | | | 190,680 | | | |
| | | | | | | 638,295 | | | |
| |
Human Resource & Employment
Services — 0.0%* | | | |
| | | |
Administaff Inc. | | | 650 | | | | 19,045 | | | |
| |
Hypermarkets & Super Centers — 0.0%* | | | |
| | | |
Pricesmart Inc. | | | 500 | | | | 19,015 | | | |
| |
Industrial Machinery — 4.2% | | | |
| | | |
Actuant Corp. | | | 915 | | | | 24,357 | | | |
Briggs & Stratton Corp. | | | 725 | | | | 14,275 | | | |
Chart Industries Inc. | | | 726 | | | | 24,524 | | | (a) |
CLARCOR Inc. | | | 8,400 | | | | 360,276 | | | |
Columbus McKinnon Corp. | | | 986 | | | | 20,036 | | | (a) |
Flowserve Corp. | | | 1,475 | | | | 175,849 | | | |
Harsco Corp. | | | 4,500 | | | | 127,440 | | | |
IDEX Corp. | | | 10,100 | | | �� | 395,112 | | | |
Kaydon Corp. | | | 400 | | | | 16,288 | | | |
Kennametal Inc. | | | 515 | | | | 20,322 | | | |
Lincoln Electric Holdings Inc. | | | 320 | | | | 20,886 | | | |
Middleby Corp. | | | 3,750 | | | | 316,575 | | | (a) |
Mueller Industries Inc. | | | 4,200 | | | | 137,340 | | | |
Nordson Corp. | | | 3,000 | | | | 275,640 | | | |
Robbins & Myers Inc. | | | 4,800 | | | | 171,744 | | | |
Tennant Co. | | | 500 | | | | 19,205 | | | |
Timken Co. | | | 4,550 | | | | 217,172 | | | |
Valmont Industries Inc. | | | 150 | | | | 13,309 | | | |
| | | | | | | 2,350,350 | | | |
| |
Industrial REITs — 0.1% | | | |
| | | |
DuPont Fabros Technology Inc. | | | 610 | | | | 12,975 | | | |
First Potomac Realty Trust | | | 890 | | | | 14,970 | | | |
| | | | | | | 27,945 | | | |
| |
Insurance Brokers — 0.8% | | | |
| | | |
Arthur J Gallagher & Co. | | | 6,000 | | | | 174,480 | | | |
Brown & Brown Inc. | | | 10,100 | | | | 241,794 | | | |
| | | | | | | 416,274 | | | |
| |
Internet Software & Services — 1.2% | | | |
| | | |
Art Technology Group Inc. | | | 21,800 | | | | 130,364 | | | (a) |
comScore Inc. | | | 9,100 | | | | 203,021 | | | (a) |
Constant Contact Inc. | | | 7,300 | | | | 226,227 | | | (a) |
Liquidity Services Inc. | | | 1,000 | | | | 14,050 | | | (a) |
| | | | | | | | | | |
| | | |
| | | Number
of Shares | | | Fair Value | | | |
| | | |
LogMeIn Inc. | | | 2,000 | | | $ | 88,680 | | | (a) |
NIC Inc. | | | 2,100 | | | | 20,391 | | | |
| | | | | | | 682,733 | | | |
| |
Investment Banking & Brokerage — 1.2% | | | |
| | | |
GFI Group Inc. | | | 27,000 | | | | 126,630 | | | |
Piper Jaffray companies | | | 965 | | | | 33,785 | | | (a) |
Raymond James Financial Inc. | | | 14,800 | | | | 483,960 | | | |
Stifel Financial Corp. | | | 295 | | | | 18,302 | | | (a) |
SWS Group Inc. | | | 1,151 | | | | 5,813 | | | |
| | | | | | | 668,490 | | | |
| |
IT Consulting & Other Services — 0.3% | | | |
| | | |
CACI International Inc. | | | 300 | | | | 16,020 | | | (a) |
iGate Corp. | | | 2,626 | | | | 51,758 | | | |
SRA International Inc. | | | 4,300 | | | | 87,935 | | | (a) |
Unisys Corp. | | | 500 | | | | 12,945 | | | (a) |
| | | | | | | 168,658 | | | |
| |
Leisure Products — 0.6% | | | |
| | | |
Brunswick Corp. | | | 575 | | | | 10,775 | | | |
Polaris Industries Inc. | | | 4,165 | | | | 324,953 | | | |
| | | | | | | 335,728 | | | |
| |
Life & Health Insurance — 0.1% | | | |
| | | |
American Equity Investment Life Holding Co. | | | 1,330 | | | | 16,692 | | | |
Delphi Financial Group Inc. | | | 585 | | | | 16,871 | | | |
| | | | | | | 33,563 | | | |
| |
Life Sciences Tools & Services — 2.4% | | | |
| | | |
Bio-Rad Laboratories Inc. | | | 3,000 | | | | 311,550 | | | (a) |
Bruker Corp. | | | 25,085 | | | | 416,411 | | | (a) |
ICON PLC ADR | | | 11,700 | | | | 256,230 | | | (a) |
Luminex Corp. | | | 10,128 | | | | 185,140 | | | (a) |
Techne Corp. | | | 2,600 | | | | 170,742 | | | |
| | | | | | | 1,340,073 | | | |
| |
Managed Healthcare — 1.2% | | | |
| | | |
AMERIGROUP Corp. | | | 550 | | | | 24,156 | | | (a) |
Centene Corp. | | | 11,725 | | | | 297,112 | | | (a) |
Metropolitan Health Networks Inc. | | | 747 | | | | 3,339 | | | (a) |
Molina Healthcare Inc. | | | 12,250 | | | | 341,162 | | | (a) |
| | | | | | | 665,769 | | | |
| |
Metal & Glass Containers — 1.3% | | | |
| | | |
AEP Industries Inc. | | | 575 | | | | 14,921 | | | (a) |
Aptargroup Inc. | | | 8,100 | | | | 385,317 | | | |
Myers Industries Inc. | | | 900 | | | | 8,766 | | | |
Silgan Holdings Inc. | | | 8,000 | | | | 286,480 | | | |
| | | | | | | 695,484 | | | |
| |
Movies & Entertainment — 0.0%* | | | |
| | | |
Madison Square Garden Inc. | | | 600 | | | | 15,468 | | | (a) |
See Notes to Schedule of Investments and Notes to Financial Statements.
8
Small-Cap Equity Fund
| | |
| Schedule of Investments | | December 31, 2010 |
| | | | | | | | | | |
| | | |
| | | Number
of Shares | | | Fair Value | | | |
| |
Multi-Line Insurance — 0.9% | | | |
| | | |
HCC Insurance Holdings Inc. | | | 17,000 | | | $ | 491,980 | | | |
Horace Mann Educators Corp. | | | 845 | | | | 15,244 | | | |
| | | | | | | 507,224 | | | |
| |
Multi-Sector Holdings — 0.0%* | | | |
| | | |
Compass Diversified Holdings | | | 1,083 | | | | 19,158 | | | |
| |
Multi-Utilities — 0.7% | | | |
| | | |
Avista Corp. | | | 1,325 | | | | 29,839 | | | |
Black Hills Corp. | | | 780 | | | | 23,400 | | | |
OGE Energy Corp. | | | 6,725 | | | | 306,257 | | | |
| | | | | | | 359,496 | | | |
| |
Office Electronics — 0.3% | | | |
| | | |
Zebra Technologies Corp. | | | 5,100 | | | | 193,749 | | | (a) |
| |
Office REITs — 1.4% | | | |
| | | |
BioMed Realty Trust Inc. | | | 20,960 | | | | 390,904 | | | |
Digital Realty Trust Inc. | | | 7,600 | | | | 391,704 | | | |
Highwoods Properties Inc. | | | 265 | | | | 8,440 | | | |
Lexington Realty Trust | | | 775 | | | | 6,161 | | | |
| | | | | | | 797,209 | | | |
| |
Office Services & Supplies — 0.2% | | | |
| | | |
Herman Miller Inc. | | | 3,480 | | | | 88,044 | | | |
Kimball International Inc. | | | 835 | | | | 5,762 | | | |
Knoll Inc. | | | 857 | | | | 14,338 | | | |
| | | | | | | 108,144 | | | |
| |
Oil & Gas Drilling — 0.4% | | | |
| | | |
Pioneer Drilling Co. | | | 26,400 | | | | 232,584 | | | (a) |
| |
Oil & Gas Equipment & Services — 2.7% | | | |
| | | |
Dawson Geophysical Co. | | | 840 | | | | 26,796 | | | (a) |
Dril-Quip Inc. | | | 3,680 | | | | 286,010 | | | (a) |
Hornbeck Offshore Services Inc. | | | 1,064 | | | | 22,216 | | | (a) |
Oil States International Inc. | | | 10,290 | | | | 659,486 | | | (a) |
RPC Inc. | | | 600 | | | | 10,872 | | | |
Superior Energy Services Inc. | | | 10,000 | | | | 349,900 | | | (a) |
Tetra Technologies Inc. | | | 14,100 | | | | 167,367 | | | (a) |
| | | | | | | 1,522,647 | | | |
| |
Oil & Gas Exploration & Production — 2.8% | | | |
| | | |
Brigham Exploration Co. | | | 5,950 | | | | 162,078 | | | (a) |
Contango Oil & Gas Co. | | | 530 | | | | 30,703 | | | (a) |
GMX Resources Inc. | | | 1,793 | | | | 9,897 | | | (a) |
Gulfport Energy Corp. | | | 7,000 | | | | 151,550 | | | (a) |
Oasis Petroleum Inc. | | | 6,000 | | | | 162,720 | | | (a) |
Petroleum Development Corp. | | | 577 | | | | 24,355 | | | (a) |
Resolute Energy Corp. | | | 11,100 | | | | 163,836 | | | (a) |
Rosetta Resources Inc. | | | 4,000 | | | | 150,560 | | | (a) |
SandRidge Energy Inc. | | | 20,200 | | | | 147,864 | | | (a) |
SM Energy Co. | | | 9,390 | | | | 553,353 | | | |
Vaalco Energy Inc. | | | 905 | | | | 6,480 | | | (a) |
| | | | | | | | | | |
| | | |
| | | Number
of Shares | | | Fair Value | | | |
| | | |
Venoco Inc. | | | 800 | | | $ | 14,760 | | | (a) |
| | | | | | | 1,578,156 | | | |
| |
Oil & Gas Refining & Marketing — 0.0%* | | | |
| | | |
Holly Corp. | | | 400 | | | | 16,308 | | | |
| |
Oil & Gas Storage & Transportation — 0.0%* | | | |
| | | |
Knightsbridge Tankers Ltd. | | | 330 | | | | 7,349 | | | |
| |
Packaged Foods & Meats — 4.5% | | | |
| | | |
Del Monte Foods Co. | | | 34,150 | | | | 642,020 | | | |
Flowers Foods Inc. | | | 14,100 | | | | 379,431 | | | |
Lancaster Colony Corp. | | | 6,100 | | | | 348,920 | | | |
Sanderson Farms Inc. | | | 385 | | | | 15,073 | | | |
Smart Balance Inc. | | | 18,200 | | | | 78,806 | | | (a) |
Smithfield Foods Inc. | | | 18,575 | | | | 383,202 | | | (a) |
Snyders-Lance Inc. | | | 10,100 | | | | 236,744 | | | |
The Hain Celestial Group Inc. | | | 9,000 | | | | 243,540 | | | (a) |
TreeHouse Foods Inc. | | | 3,000 | | | | 153,270 | | | (a) |
| | | | | | | 2,481,006 | | | |
|
Paper Packaging — 0.8% |
| | | |
Packaging Corporation of America | | | 16,900 | | | | 436,696 | | | |
Rock-Tenn Co. | | | 350 | | | | 18,883 | | | |
| | | | | | | 455,579 | | | |
|
Paper Products — 0.0%* |
| | | |
Clearwater Paper Corp. | | | 200 | | | | 15,660 | | | (a) |
Neenah Paper Inc. | | | 313 | | | | 6,160 | | | |
| | | | | | | 21,820 | | | |
|
Personal Products — 0.3% |
| | | |
Alberto-Culver Co. | | | 4,000 | | | | 148,160 | | | |
Revlon Inc. | | | 900 | | | | 8,856 | | | (a) |
| | | | | | | 157,016 | | | |
|
Pharmaceuticals — 0.1% |
| | | |
Hi-Tech Pharmacal Company Inc. | | | 232 | | | | 5,788 | | | (a) |
Par Pharmaceutical Companies Inc. | | | 389 | | | | 14,980 | | | (a) |
Questcor Pharmaceuticals Inc. | | | 1,245 | | | | 18,339 | | | (a) |
The Medicines Co. | | | 1,150 | | | | 16,249 | | | (a) |
| | | | | | | 55,356 | | | |
|
Photographic Products — 0.0%* |
| | | |
Eastman Kodak Co. | | | 3,400 | | | | 18,224 | | | (a) |
|
Property & Casualty Insurance — 2.5% |
| | | |
Alleghany Corp. | | | 420 | | | | 128,675 | | | (a) |
Allied World Assurance Company Holdings Ltd. | | | 6,000 | | | | 356,640 | | | |
American Safety Insurance Holdings Ltd. | | | 1,010 | | | | 21,594 | | | (a) |
Argo Group International Holdings Ltd. | | | 4,345 | | | | 162,720 | | | |
Aspen Insurance Holdings Ltd. | | | 10,100 | | | | 289,062 | | | |
See Notes to Schedule of Investments and Notes to Financial Statements.
9
Small-Cap Equity Fund
| | |
| Schedule of Investments | | December 31, 2010 |
| | | | | | | | | | |
| | | |
| | | Number
of Shares | | | Fair Value | | | |
| | | |
CNA Surety Corp. | | | 450 | | | $ | 10,656 | | | (a) |
First American Financial Corp. | | | 1,200 | | | | 17,928 | | | |
First Mercury Financial Corp. | | | 560 | | | | 9,184 | | | |
National Interstate Corp. | | | 3,200 | | | | 68,480 | | | |
The Navigators Group Inc. | | | 6,000 | | | | 302,100 | | | (a) |
Tower Group Inc. | | | 730 | | | | 18,673 | | | |
| | | | | | | 1,385,712 | | | |
|
Publishing — 1.5% |
| | | |
John Wiley & Sons Inc. | | | 10,800 | | | | 488,592 | | | |
Morningstar Inc. | | | 6,000 | | | | 318,480 | | | |
Valassis Communications Inc. | | | 400 | | | | 12,940 | | | (a) |
| | | | | | | 820,012 | | | |
|
Railroads — 0.9% |
| | | |
Genesee & Wyoming Inc. | | | 9,760 | | | | 516,792 | | | (a) |
|
Regional Banks - 3.4% |
| | | |
BancorpSouth Inc. | | | 885 | | | | 14,116 | | | |
Bank of the Ozarks Inc. | | | 473 | | | | 20,505 | | | |
Banner Corp. | | | 4,145 | | | | 9,616 | | | |
Camden National Corp. | | | 200 | | | | 7,246 | | | |
Cardinal Financial Corp. | | | 550 | | | | 6,397 | | | |
CoBiz Financial Inc. | | | 865 | | | | 5,259 | | | |
Cullen Frost Bankers Inc. | | | 5,240 | | | | 320,269 | | | |
East West Bancorp Inc. | | | 1,385 | | | | 27,077 | | | |
First Horizon National Corp. | | | 1,045 | | | | 12,313 | | | (a) |
Fulton Financial Corp. | | | 9,500 | | | | 98,230 | | | |
Glacier Bancorp Inc. | | | 435 | | | | 6,573 | | | |
Great Southern Bancorp Inc. | | | 243 | | | | 5,732 | | | |
Iberiabank Corp. | | | 515 | | | | 30,452 | | | |
Lakeland Financial Corp. | | | 520 | | | | 11,159 | | | |
Old National Bancorp | | | 894 | | | | 10,630 | | | |
PacWest BanCorp. | | | 955 | | | | 20,418 | | | |
Peoples Bancorp Inc. | | | 370 | | | | 5,791 | | | |
Prosperity Bancshares Inc. | | | 8,230 | | | | 323,274 | | | |
Sandy Spring Bancorp Inc. | | | 540 | | | | 9,952 | | | |
Southwest Bancorp Inc. | | | 1,125 | | | | 13,950 | | | |
Susquehanna Bancshares Inc. | | | 1,515 | | | | 14,665 | | | |
SVB Financial Group | | | 6,000 | | | | 318,300 | | | (a) |
UMB Financial Corp. | | | 8,100 | | | | 335,502 | | | |
Umpqua Holdings Corp. | | | 1,925 | | | | 23,446 | | | |
Westamerica Bancorp. | | | 3,800 | | | | 210,786 | | | |
Whitney Holding Corp. | | | 972 | | | | 13,754 | | | |
Wintrust Financial Corp. | | | 433 | | | | 14,302 | | | |
| | | | | | | 1,889,714 | | | |
|
Reinsurance — 0.0%* |
| | | |
Maiden Holdings Ltd. | | | 1,490 | | | | 11,711 | | | |
|
Research & Consulting Services — 0.5% |
| | | |
CoStar Group Inc. | | | 5,000 | | | | 287,800 | | | (a) |
Resources Connection Inc. | | | 550 | | | | 10,224 | | | |
| | | | | | | 298,024 | | | |
| | | | | | | | | | |
| | | |
| | | Number
of Shares | | | Fair Value | | | |
|
Residential REITs — 0.0%* |
| | | |
Mid-America Apartment Communities Inc. | | | 335 | | | $ | 21,269 | | | |
|
Restaurants — 1.0% |
| | | |
Bob Evans Farms Inc. | | | 100 | | | | 3,296 | | | |
Cracker Barrel Old Country Store Inc. | | | 8,300 | | | | 454,591 | | | |
Domino’s Pizza Inc. | | | 850 | | | | 13,557 | | | (a) |
Einstein Noah Restaurant Group Inc. | | | 1,050 | | | | 14,753 | | | (a) |
Wendy’s Arby’s Group Inc. | | | 19,500 | | | | 90,090 | | | |
| | | | | | | 576,287 | | | |
|
Retail REITs — 0.1% |
| | | |
Getty Realty Corp. | | | 600 | | | | 18,768 | | | |
Saul Centers Inc. | | | 400 | | | | 18,940 | | | |
| | | | | | | 37,708 | | | |
|
Security & Alarm Services — 0.2% |
| | | |
The Brink’s Company | | | 3,800 | | | | 102,144 | | | |
| |
Semiconductor Equipment — 0.9% | | | |
| | | |
GT Solar International Inc. | | | 2,250 | | | | 20,520 | | | (a) |
MKS Instruments Inc. | | | 1,105 | | | | 27,062 | | | (a) |
Rudolph Technologies Inc. | | | 33,000 | | | | 271,590 | | | (a) |
Varian Semiconductor Equipment Associates Inc. | | | 4,550 | | | | 168,214 | | | (a) |
| | | | | | | 487,386 | | | |
|
Semiconductors — 1.5% |
| | | |
Ceva Inc. | | | 921 | | | | 18,881 | | | (a) |
Diodes Inc. | | | 1,400 | | | | 37,786 | | | (a) |
Fairchild Semiconductor International Inc. | | | 1,696 | | | | 26,475 | | | (a) |
Integrated Device Technology Inc. | | | 4,050 | | | | 26,973 | | | (a) |
IXYS Corp. | | | 1,359 | | | | 15,792 | | | (a) |
Lattice Semiconductor Corp. | | | 3,109 | | | | 18,841 | | | (a) |
Microsemi Corp. | | | 13,400 | | | | 306,860 | | | (a) |
Pericom Semiconductor Corp. | | | 1,090 | | | | 11,968 | | | (a) |
RF Micro Devices Inc. | | | 5,635 | | | | 41,417 | | | (a) |
Semtech Corp. | | | 10,230 | | | | 231,607 | | | (a) |
Standard Microsystems Corp. | | | 1,560 | | | | 44,975 | | | (a) |
TriQuint Semiconductor Inc. | | | 1,850 | | | | 21,627 | | | (a) |
| | | | | | | 803,202 | | | |
|
Soft Drinks — 0.0%* |
| | | |
National Beverage Corp. | | | 1,000 | | | | 13,140 | | | |
|
Specialized Consumer Services — 0.3% |
| | | |
Matthews International Corp. | | | 4,900 | | | | 171,402 | | | |
Sotheby’s | | | 400 | | | | 18,000 | | | |
| | | | | | | 189,402 | | | |
|
Specialized Finance — 0.0%* |
| | | |
NewStar Financial Inc. | | | 1,985 | | | | 20,982 | | | (a) |
See Notes to Schedule of Investments and Notes to Financial Statements.
10
Small-Cap Equity Fund
| | |
| Schedule of Investments | | December 31, 2010 |
| | | | | | | | | | |
| | | |
| | | Number
of Shares | | | Fair Value | | | |
|
Specialized REITs — 1.5% |
| | | |
DiamondRock Hospitality Co. | | | 1,735 | | | $ | 20,820 | | | (a) |
Healthcare Realty Trust Inc. | | | 16,100 | | | | 340,837 | | | |
Hersha Hospitality Trust | | | 2,175 | | | | 14,355 | | | |
National Health Investors Inc. | | | 319 | | | | 14,361 | | | |
Omega Healthcare Investors Inc. | | | 16,500 | | | | 370,260 | | | |
Sabra Healthcare REIT Inc. | | | 3,366 | | | | 61,934 | | | |
Universal Health Realty Income Trust | | | 500 | | | | 18,265 | | | |
| | | | | | | 840,832 | | | |
|
Specialty Chemicals — 2.2% |
| | | |
Arch Chemicals Inc. | | | 8,475 | | | | 321,457 | | | |
Ferro Corp. | | | 1,200 | | | | 17,568 | | | (a) |
HB Fuller Co. | | | 1,110 | | | | 22,777 | | | |
Minerals Technologies Inc. | | | 300 | | | | 19,623 | | | |
Omnova Solutions Inc. | | | 1,912 | | | | 15,984 | | | (a) |
PolyOne Corp. | | | 1,450 | | | | 18,111 | | | (a) |
Quaker Chemical Corp. | | | 479 | | | | 19,960 | | | |
Sensient Technologies Corp. | | | 21,425 | | | | 786,940 | | | |
Stepan Co. | | | 63 | | | | 4,805 | | | |
WR Grace & Co. | | | 400 | | | | 14,052 | | | (a) |
| | | | | | | 1,241,277 | | | |
| |
Specialty Stores — 1.3% | | | |
| | | |
Jo-Ann Stores Inc. | | | 6,525 | | | | 392,935 | | | (a) |
Tractor Supply Co. | | | 6,175 | | | | 299,426 | | | |
Ulta Salon Cosmetics & Fragrance Inc. | | | 750 | | | | 25,500 | | | (a) |
| | | | | | | 717,861 | | | |
| | | |
Steel — 0.7% | | | | | | | | | | |
| | | |
Carpenter Technology Corp. | | | 1,365 | | | | 54,928 | | | |
Commercial Metals Co. | | | 19,830 | | | | 328,980 | | | |
| | | | | | | 383,908 | | | |
| |
Systems Software — 2.0% | | | |
| | | |
Ariba Inc. | | | 12,100 | | | | 284,229 | | | (a) |
MICROS Systems Inc. | | | 10,100 | | | | 442,986 | | | (a) |
Progress Software Corp. | | | 6,140 | | | | 259,845 | | | (a) |
Sourcefire Inc. | | | 4,100 | | | | 106,313 | | | (a) |
| | | | | | | 1,093,373 | | | |
| |
Technology Distributors — 0.1% | | | |
| | | |
Insight Enterprises Inc. | | | 1,050 | | | | 13,818 | | | (a) |
Scansource Inc. | | | 621 | | | | 19,810 | | | (a) |
Tech Data Corp. | | | 595 | | | | 26,192 | | | (a) |
| | | | | | | 59,820 | | | |
| |
Thrifts & Mortgage Finance — 0.1% | | | |
| | | |
Northwest Bancshares Inc. | | | 1,786 | | | | 21,003 | | | |
Washington Federal Inc. | | | 1,294 | | | | 21,895 | | | |
| | | | | | | 42,898 | | | |
| |
Tires & Rubber — 0.1% | | | |
| | | |
Cooper Tire & Rubber Co. | | | 1,550 | | | | 36,549 | | | |
| | | | | | | | | | |
| | | |
| | | Number
of Shares | | | Fair Value | | | |
| |
Trading Companies & Distributors — 0.7% | | | |
| | | |
Applied Industrial Technologies Inc. | | | 11,100 | | | $ | 360,528 | | | |
DXP Enterprises Inc. | | | 691 | | | | 16,584 | | | (a) |
TAL International Group Inc. | | | 600 | | | | 18,522 | | | |
| | | | | | | 395,634 | | | |
| | | |
Trucking — 1.2% | | | | | | | | | | |
| | | |
Landstar System Inc. | | | 7,000 | | | | 286,580 | | | |
Marten Transport Ltd. | | | 705 | | | | 15,073 | | | |
Old Dominion Freight Line Inc. | | | 12,150 | | | | 388,678 | | | (a) |
| | | | | | | 690,331 | | | |
| | | |
Total Common Stock
(Cost $42,566,190) | | | | | | | 52,177,181 | | | |
| | | | | | | | | | |
Other Investments — 0.0%* | | | |
GEI Investment Fund
(Cost $11) | | | | | | | 11 | | | (c) |
| | | |
Total Investments in Securities
(Cost $42,566,201) | | | | | | | 52,177,192 | | | |
| | | | | | | | | | |
Short-Term Investments — 6.6% | | | |
GE Money Market Fund Institutional
Class 0.00%
(Cost $3,635,058) | | | | | | | 3,635,058 | | | (b,c) |
| | | |
Total Investments
(Cost $406,201,259) | | | | | | | 55,812,250 | | | |
| | | |
Liabilities in Excess of Other
Assets,
net — (0.5)% | | | | | | | (274,809 | ) | | |
| | | | | | | | | | |
| | | |
NET ASSETS — 100.0% | | | | | | $ | 55,537,441 | | | |
| | | | | | | | | | |
| | | | | | | | | | |
Other Information | | | |
The Fund had the following long future contracts open at December 31, 2010:
| | | | | | | | | | | | | | |
| Description | | Expiration
Date | | Number
of
Contracts | | | Current
Notional
Value | | | Unrealized
(Depreciation) | |
Russell 2000 Mini Index Futures | | March 2011 | | | 15 | | | $ | 1,173,450 | | | $ | (9,340 | ) |
See Notes to Schedule of Investments and Notes to Financial Statements.
11
| | |
| Notes to Schedule of Investments | | December 31, 2010 |
The views expressed in this document reflect our judgment as of the publication date and are subject to change at any time without notice. The securities information regarding holdings, allocations and other characteristics are presented as of a particular date to illustrate examples of securities that the Fund has bought and the diversity of areas in which the Fund may invest as of a particular date. It may not be representative of the Fund’s current or future investments and should not be construed as a recommendation to purchase or sell a particular security. See the prospectus for complete descriptions of investment objectives, policies, risks and permissible investments
| (a) | Non-income producing security. |
| (b) | Coupon amount represents effective yield. |
| (c) | GE Asset Management, the investment adviser of the Fund, also serves as investment adviser of the GEI Investment Fund and the GE Funds-GE Money Market Fund. |
| † | Percentages are based on net assets as of December 31, 2010 . |
Abbreviations:
| | |
ADR | | American Depository Receipt |
| |
REIT | | Real Estate Investment Trust |
12
Financial Highlights
Selected data based on a share outstanding throughout the fiscal years indicated
| | | | | | | | | | | | | | | | | | | | | | | | | | | | | | | | | | | | |
| | | CLASS 1 | | | | | | CLASS 4 | |
| | | 12/31/10 | | | 12/31/09 | | | 12/31/08(c) | | | 12/31/07 | | | 12/31/06 | | | | | | 12/31/10 | | | 12/31/09 | | | 12/31/08(c) | |
| Inception date | | | — | | | | — | | | | — | | | | — | | | | 4/28/00 | | | | | | | | — | | | | — | | | | 5/1/08 | |
Net asset value, beginning of period | | | $ 9.79 | | | | $7.48 | | | | $12.17 | | | | $14.39 | | | | $14.44 | | | | | | | | $ 9.76 | | | | $7.49 | | | | $12.06 | |
Income/(loss) from investment operations: | | | | | | | | | | | | | | | | | | | | | | | | | | | | | | | | | | | | |
Net investment income | | | 0.02 | ** | | | 0.04 | | | | 0.09 | | | | 0.06 | | | | 0.05 | | | | | | | | (0.02 | )** | | | (0.05) | | | | 0.02 | ** |
Net realized and unrealized
gains/(losses) on investments | | | 2.67 | | | | 2.27 | | | | (4.67) | | | | 0.31 | | | | 1.87 | | | | | | | | 2.65 | | | | 2.32 | | | | (4.51) | |
Total income/(loss) from
investment operations | | | 2.69 | | | | 2.31 | | | | (4.58) | | | | 0.37 | | | | 1.92 | | | | | | | | 2.63 | | | | 2.27 | | | | (4.49) | |
Less distributions from: | | | | | | | | | | | | | | | | | | | | | | | | | | | | | | | | | | | | |
Net investment income | | | 0.02 | | | | — | | | | 0.05 | | | | 0.06 | | | | 0.04 | | | | | | | | — | | | | — | | | | 0.02 | |
Net realized gains | | | — | | | | — | | | | 0.06 | | | | 2.53 | | | | 1.93 | | | | | | | | — | | | | — | | | | 0.06 | |
Total distributions | | | 0.02 | | | | 0.00 | | | | 0.11 | | | | 2.59 | | | | 1.97 | | | | | | | | 0.00 | | | | 0.00 | | | | 0.08 | |
Net asset value, end of period | | | $12.46 | | | | $9.79 | | | | $7.48 | | | | $12.17 | | | | $14.39 | | | | | | | | $12.39 | | | | $9.76 | | | | $ 7.49 | |
TOTAL RETURN (a) | | | 27.47% | | | | 30.88% | | | | (37.59)% | | | | 2.39% | | | | 13.27% | | | | | | | | 26.95% | | | | 30.31% | | | | (37.20)% | |
| | | | | | | | | |
RATIOS/
SUPPLEMENTAL DATA: | | | | | | | | | | | | | | | | | | | | | | | | | | | | | | | | | | | | |
Net assets, end of period (in thousands) | | | $55,527 | | | | $54,114 | | | | $50,210 | | | | $104,010 | | | | $127,381 | | | | | | | | $10 | | | | $8 | | | | $6 | |
Ratios to average net assets: | | | | | | | | | | | | | | | | | | | | | | | | | | | | | | | | | | | | |
Net investment income (loss) | | | 0.18% | | | | (0.04)% | | | | 0.46% | | | | 0.31% | | | | 0.31% | | | | | | | | (0.23)% | | | | (0.51)% | | | | (0.01)% | * |
Net Expenses | | | 1.12% | (b) | | | 1.52% | (b) | | | 0.94% | (b) | | | 0.87% | | | | 0.86% | | | | | | | | 1.54% | (b) | | | 1.97% | (b) | | | 1.39% | (b)* |
Gross Expenses | | | 1.13% | | | | 1.52% | | | | 0.94% | | | | 0.87% | | | | 0.86% | | | | | | | | 1.55% | | | | 1.97% | | | | 1.39% | |
Portfolio turnover rate | | | 47% | | | | 40% | | | | 85% | | | | 25% | | | | 52% | | | | | | | | 47% | | | | 40% | | | | 85% | |
Notes to Financial Highlights
| (a) | Total returns are historical and assume changes in share price, reinvestment of dividends and capital gains distributions and do not include the effect of insurance contract charges. Past performance does not guarantee future results. |
| (b) | Reflects GE Asset Management’s waiver of a portion of the Fund’s management fee in an amount equal to the management fee earned by GEAM with respect to the Fund’s investment in the GE Funds – GE Money Market Fund. Excluding waiver, the expense ratios would be unchanged. |
| (c) | Less than $0.01 per share of the distribution paid was from Return of Capital. |
| * | Annualized for periods less than one year. |
| ** | Per share values have been calculated using the average share method. |
The accompanying Notes are an integral part of these financial statements.
13
| | | | |
Statements of Assets and Liabilities
December 31, 2010 | | | |
| |
ASSETS | | | | |
Investments in securities, at Fair Value (cost $42,566,190) | | $ | 52,177,181 | |
Investments in affiliated securities, at Fair Value (cost $11) | | | 11 | |
Short-term affiliated investments (at amortized cost) | | | 3,635,058 | |
Receivable for investments sold | | | 87,560 | |
Income receivables | | | 35,871 | |
Receivable for fund shares sold | | | 21,399 | |
Other assets | | | 90,000 | |
Total Assets | | | 56,047,080 | |
| |
LIABILITIES | | | | |
Payable for investments purchased | | | 289,838 | |
Payable to GEAM | | | 15,395 | |
Accrued other expenses | | | 196,683 | |
Variation margin payable | | | 7,723 | |
Total Liabilities | | | 509,639 | |
NET ASSETS | | $ | 55,537,441 | |
| |
NET ASSETS CONSIST OF : | | | | |
Capital paid in | | | 54,527,476 | |
Undistributed (distribution in excess of) net investment income | | | 6,950 | |
Accumulated net realized gain (loss) | | | (8,598,636 | ) |
Net unrealized appreciation/ (depreciation) on: | | | | |
Investments | | | 9,610,991 | |
Futures | | | (9,340 | ) |
NET ASSETS | | $ | 55,537,441 | |
| |
Class 1: | | | | |
| |
NET ASSETS | | | 55,527,053 | |
Shares outstanding ($0.01 par value; unlimited shares authorized) | | | 4,455,353 | |
Net asset value per share | | | $12.46 | |
| |
Class 4: | | | | |
| |
NET ASSETS | | | 10,388 | |
Shares outstanding ($0.01 par value; unlimited shares authorized) | | | 838 | |
Net asset value per share | | | $12.39 | |
The accompanying Notes are an integral part of these financial statements.
14
| | | | |
Statements of Operations
For the year ending December 31, 2010 | | | |
| |
INVESTMENT INCOME | | | | |
Income: | | | | |
Dividends | | $ | 653,366 | |
Interest | | | 9,667 | |
Interest from affiliated investments | | | 459 | |
Less: Foreign taxes withheld | | | (510 | ) |
Total Income | | | 662,982 | |
| |
Expenses: | | | | |
Advisory and administrative fees | | | 487,797 | |
Transfer agent fees | | | 13,015 | |
Directors’ fees | | | 1,815 | |
Custody and accounting expenses | | | 42,280 | |
Professional fees | | | 16,316 | |
Other expenses | | | 16,938 | |
Total expenses before waiver and reimbursement | | | 578,161 | |
Less: Expenses waived or borne by the adviser | | | (6,702 | ) |
Net expenses | | | 571,459 | |
Net investment income (loss) | | | 91,523 | |
| |
NET REALIZED AND UNREALIZED GAIN (LOSS)
ON INVESTMENTS | | | | |
| |
Realized gain (loss) on: | | | | |
Investments | | | 3,296,817 | |
Futures | | | 295,797 | |
| |
Increase (decrease) in unrealized appreciation/ (depreciation) on: | | | | |
Investments | | | 8,865,463 | |
Futures | | | (36,479 | ) |
Net realized and unrealized gain (loss) on investments | | | 12,421,598 | |
Net increase (decrease) in net assets resulting from operations | | $ | 12,513,121 | |
The accompanying Notes are an integral part of these financial statements.
15
| | | | | | | | |
Statements of
Changes in Net Assets | | | |
| | | Year Ended
December 31,
2010 | | | Year Ended
December 31,
2009 | |
| | |
INCREASE (DECREASE) IN NET ASSETS | | | | | | | | |
Operations: | | | | | | | | |
Net investments income (loss) | | $ | 91,523 | | | $ | (46,080 | ) |
Net realized gain (loss) on investments and futures | | | 3,592,614 | | | | (7,175,502 | ) |
Net increase (decrease) in unrealized appreciation / (depreciation) on investments and futures | | | 8,828,984 | | | | 20,714,743 | |
Net increase (decrease) from operations | | | 12,513,121 | | | | 13,493,161 | |
Distributions to shareholders from : | | | | | | | | |
Net investment income | | | | | | | | |
Class 1 | | | (86,511 | ) | | | — | |
Class 4 | | | — | | | | — | |
Total distributions | | | (86,511 | ) | | | — | |
Increase (decrease) in net assets from operations and distributions | | | 12,426,610 | | | | 13,493,161 | |
Share transactions : | | | | | | | | |
Proceeds from sale of shares | | | | | | | | |
Class 1 | | | 1,611,974 | | | | 2,405,061 | |
Class 4 | | | — | | | | — | |
Value of distributions reinvested | | | | | | | | |
Class 1 | | | 86,511 | | | | — | |
Class 4 | | | — | | | | — | |
Cost of shares redeemed | | | | | | | | |
Class 1 | | | (12,710,116 | ) | | | (11,991,743 | ) |
Class 4 | | | — | | | | — | |
Net increase (decrease) from share transactions | | | (11,011,631 | ) | | | (9,586,682 | ) |
Total increase (decrease) in net assets | | | 1,414,979 | | | | 3,906,479 | |
| | |
NET ASSETS | | | | | | | | |
Beginning of period | | | 54,122,462 | | | | 50,215,983 | |
End of period | | $ | 55,537,441 | | | $ | 54,122,462 | |
Undistributed (distribution in excess of) net investment income, end of period | | $ | 6,950 | | | $ | 5,498 | |
| | |
CHANGES IN FUND SHARES | | | | | | | | |
| | |
Class 1 | | | | | | | | |
Shares sold | | | 134,720 | | | | 309,191 | |
Issued for distributions reinvested | | | 6,893 | | | | — | |
Shares redeemed | | | (1,211,910 | ) | | | (1,499,252 | ) |
Net increase (decrease) in fund shares | | | (1,070,297 | ) | | | (1,190,061 | ) |
| | |
Class 4 | | | | | | | | |
Shares sold | | | — | | | | — | |
Issued for distributions reinvested | | | — | | | | — | |
Shares redeemed | | | — | | | | — | |
Net increase (decrease) in fund shares | | | — | | | | — | |
The accompanying Notes are an integral part of these financial statements.
16
| | |
| Notes to Financial Statements | | December 31, 2010 |
| 1. | Organization of the Company |
GE Investments Funds, Inc. (the “Company”) was incorporated under the laws of the Commonwealth of Virginia on May 14, 1984 and is registered under the Investment Company Act of 1940, as amended (the “1940 Act”), as an open-end management investment company. The Company is composed of fourteen investment portfolios (collectively the “Funds”), although only the following eleven are currently being offered: U.S. Equity Fund, S&P 500 Index Fund, Premier Growth Equity Fund, Core Value Equity Fund, Mid-Cap Equity Fund, Small-Cap Equity Fund (the “Fund”), International Equity Fund, Total Return Fund, Income Fund, Money Market Fund and Real Estate Securities Fund.
Shares of the Funds of the Company are offered only to insurance company separate accounts that fund certain variable life insurance contracts and variable annuity contracts. GE Asset Management Incorporated (“GEAM”) is the investment adviser and administrator of each of the Funds.
The Company offers two share classes (Class 1 and Class 4) of the Fund. Class 4 shares were first offered on May 1, 2008, and Fund shares outstanding prior to May 1, 2008 were designated as Class 1 shares. Each share class has different fees and expenses, and as a result, each share class will have different share price and performance. Not all variable contracts offer both share classes of the Fund.
| 2. | Summary of Significant Accounting Policies |
The preparation of financial statements in conformity with U.S. generally accepted accounting principles (GAAP) requires management to make estimates and assumptions that affect the reported amounts of assets and liabilities and disclosure of contingent assets and liabilities at the date of the financial statements and the reported amounts of increases and decreases in net assets from operations during the reporting period. Actual results may differ from those estimates.
Subsequent events after the balance sheet date through the date the financial statements were issued, have been evaluated in the preparation of the financial statements. There are no items to report.
The following summarizes the significant accounting policies of the Company:
Securities Valuation and Transactions. All investments in securities are recorded at their estimated fair value, as described in Note 3.
Securities transactions are accounted for as of the trade date. Realized gains and losses on investments sold are recorded on the basis of identified cost for both financial statement and federal tax purposes.
The Fund’s income, expenses (other than distribution fees) and realized and unrealized gains and losses are allocated proportionally each day among the share classes based upon the relative net assets of each class.
Futures Contracts A futures contract represents a commitment for the future purchase or sale of an asset at a specified price on a specified date. The Fund invests in stock index futures contracts subject to certain limitations to manage its exposure to the stock markets. Buying futures tends to increase a Fund’s exposure to the underlying instrument while selling futures tends to decrease a Fund’s exposure to the underlying instrument or to hedge other Fund investments. With futures contracts, there is minimal counterparty credit risk to the Fund since futures contracts are exchange traded and the exchange’s clearinghouse, as counterparty to all traded futures, guarantees the futures against default. A Fund’s risks in using these contracts include changes in the value of the underlying instruments, non- performance of the counterparties under the contracts’ terms and changes in the liquidity of the secondary market for the contracts. Futures contracts are valued at the settlement price established each day by the board of trade or exchange on which they principally trade.
Upon entering into a financial futures contract, the Fund is required to pledge to the broker an amount of cash and/or other assets equal to a certain percentage of the contract amount, known as initial margin deposit. Subsequent payments, known as variation margin, are made or received by the Fund each day, depending on the daily fluctuation in the fair value of the underlying security. The Fund records an unrealized gain or loss equal to the daily variation margin. Should market conditions move unexpectedly, the Fund may not achieve the anticipated benefits of the futures contracts and may incur a loss. The Fund recognizes a realized gain or loss upon the expiration or closing of a futures contract.
17
| | |
| Notes to Financial Statements | | December 31, 2010 |
Investment Income Corporate actions (including cash dividends) are recorded on the ex-dividend date, net of applicable withholding taxes. Interest income is recorded on the accrual basis.
Expenses Fund specific expenses are allocated to the Fund that incurs such expenses and pro rata across share classes. Expenses, other than those incurred by a specific Fund, are allocated pro rata among Funds and share classes. Such expenses may include custodial fees, legal and accounting fees, printing costs and registration fees. All expenses of the Fund are paid by GEAM and reimbursed by the Fund. Certain class specific expenses (such as transfer agency fees or distribution fees) are allocated to the class that incurs such expense.
Federal Income Taxes The Fund intends to comply with all sections of the Internal Revenue Code applicable to regulated investment companies including the distribution of substantially all of its taxable net investment income and net realized capital gains to its shareholders. Therefore, no provision for federal income tax has been made. The Fund is treated as a separate taxpayer for federal income tax purposes.
The Fund utilizes various methods to measure the fair value of most of its investments on a recurring basis. GAAP establishes a framework for measuring fair value and providing related disclosures. Broadly, the framework requires fair value to be determined based on the exchange price that would be received for an asset or paid to transfer a liability (an exit price) in the principal or most advantageous market for the asset or liability in an orderly transaction between market participants at the measurement date. In the absence of active markets for the identical assets or liabilities, such measurements involve developing assumptions based on market observable data and, in the absence of such data, internal information that is consistent with what market participants would use in a hypothetical transaction that occurs at the measurement date. It also establishes a three-level valuation hierarchy based upon observable and non-observable inputs.
Observable inputs reflect market data obtained from independent sources, while unobservable inputs reflect our market assumptions. Preference is given to observable inputs. These two types of inputs create the following fair value hierarchy:
Level 1 — Quoted prices for identical investments in active markets.
Level 2 — Quoted prices for similar investments in active markets; quoted prices for identical or similar investments in markets that are not active; and model-derived valuations whose inputs are observable or whose significant value drivers are observable.
Level 3 — Significant inputs to the valuation model are unobservable.
Policies and procedures are maintained to value investments using the best and most relevant data available. In addition, pricing vendors are utilized to assist in valuing investments. GEAM performs periodic reviews of the methodologies used by independent pricing services including price validation of individual securities.
Fair Value Measurement The following section describes the valuation methodologies the Fund uses to measure different financial investments at fair value.
The Fund’s portfolio securities are valued generally on the basis of market quotations. Equity securities generally are valued at the last reported sale price on the primary market in which they are traded. Portfolio securities listed on NASDAQ are valued using the NASDAQ Official Closing Price. Level 1 securities primarily include publicly-traded equity securities which may not necessarily represent the last sale price. If no sales occurred on the exchange or NASDAQ that day, the portfolio security generally is valued using the last reported bid price. In those circumstances the Fund classifies the investment securities in Level 2.
The Fund uses non-binding broker quotes as the primary basis for valuation when there is limited, or no, relevant market activity for a specific investment or for other investments that share similar characteristics. The Fund has not adjusted the prices obtained. Investment securities priced using non-binding broker quotes are included in Level 3. As is the case with the primary pricing vendor, third-party brokers do not provide access to their proprietary valuation models, inputs and assumptions. Accordingly, GEAM conducts internal reviews of pricing for all such investment securities periodically to ensure reasonableness of valuations used in the Fund‘s financial statements. These reviews are designed to identify prices that appear stale, those that have changed significantly from prior valuations, and other anomalies that may indicate that a price may not be accurate. Based on the information available, GEAM believes that the fair values
18
| | |
| Notes to Financial Statements | | December 31, 2010 |
provided by the brokers are representative of prices that would be received to sell the assets at the measurement date (exit prices).
A Fund’s written or purchased options are valued at the last sales price, or if no sales occurred that day, at the last reported bid price and those are also included in Level 2.
If prices are not readily available for a portfolio security, or if it is believed that a price for a portfolio security does not represent its fair value, the security may be valued using procedures approved by the Funds Board of Directors that are designed to establish its “fair” value. These securities
would be classified in Level 3. Those procedures require that the fair value of a security be established by the fair valuation committee. The fair valuation committee follows different protocols for different types of investments and circumstances. The fair value procedures may be used to value any investment of the Fund in the appropriate circumstances.
The following table presents the Fund’s investments measured at fair value on a recurring basis at December 31, 2010:
| | | | | | | | | | | | | | | | |
Investments | | | Level 1 | | | | Level 2 | | | | Level 3 | | | | Total | |
| | | | |
Investments in Securities† | | | | | | | | | | | | | | | | |
Common Stock | | $ | 52,177,181 | | | $ | — | | | $ | — | | | $ | 52,177,181 | |
Other Investments | | | — | | | | 11 | | | | — | | | | 11 | |
Short-Term Investments | | | 3,635,058 | | | | — | | | | — | | | | 3,635,058 | |
Total Investments in Securities | | $ | 55,812,239 | | | $ | 11 | | | $ | — | | | $ | 55,812,250 | |
Other Financial Instruments* | | | | | | | | | | | | | | | | |
Futures Contracts — Unrealized Depreciation | | $ | (9,340 | ) | | $ | — | | | $ | — | | | $ | (9,340 | ) |
|
† See Schedule of Investments for Industry Classification. * Other financial instruments include derivative instruments such as futures, forward foreign currency exchange contracts, swap contacts and option contacts. Amounts shown represent unrealized appreciation (depreciation), or in the case of options, market value at period end. | |
| 4. | Derivatives Transactions |
Shown below are the derivative contracts entered into by the Fund, summarized by primary risk exposure as they appear on the Statement of Assets and Liabilities, all of which are not accounted for as hedging instruments under FASB Accounting Standards Codification (“ASC”) No. 815 Derivatives and Hedging as of December 31, 2010.
| | | | | | | | | | | | |
| | | Asset Derivatives | | | Liability Derivatives | |
| | | Location | | Fair Value ($) | | | Location | | Fair Value ($) | |
| Equity Futures | | Assets, Net Assets — Net Unrealized Appreciation/ (Depreciation) on Futures | | | — | | | Liabilities, Net Assets — Net Unrealized Appreciation/ (Depreciation) on Futures | | | (9,340 | )* |
Shown below are the effects of derivative instruments on the Fund’s Statements of Operations, summarized by primary risk exposure all of which are not accounted for as hedging instruments under ASC 815.
| | | | | | | | | | | | | | |
| | | Location | | Notional Amount of
Futures/Contracts
Purchased/(Sold) ($) | | | Realized Gain
or (Loss) ($) | | | Change in Unrealized
Appreciation/(Depreciation) ($) | |
Equity Futures | | Net realized gain/(loss) on futures, Increase/(decrease) in unrealized appreciation/ (depreciation) on futures | | | 12,710,653/(12,857,151) | | | | 295,797 | | | | (36,479) | |
| * | Includes cumulative appreciation/depreciation of futures contracts as reported in the Schedule of Investments and Net Assets section of the Statement of Assets and Liabilities. Only the current day's variation margin is reported within the Assets or Liabilities sections of the Statement of Assets and Liabilities. |
19
| | |
| Notes to Financial Statements | | December 31, 2010 |
The Company shares a revolving credit facility of up to $150 million with a number of its affiliates. The credit facility is with its custodian bank, State Street Bank and Trust Company (“State Street”). The revolving credit facility requires the payment of a commitment fee equal to 0.125% per annum on the daily unused portion of the credit facility, payable quarterly. The portion borne by the Funds generally is borne proportionally based upon net assets. In addition, the Company has a $100 million uncommitted, unsecured line of credit with State Street. Generally, borrowings under the credit facilities would accrue interest at the Federal Funds Rate plus 50 basis points and would be borne by the borrowing Fund. The maximum amount allowed to be borrowed by any one Fund is the lesser of (i) 33.33% of its total assets or (ii) 20% of its net assets. The credit facilities were not utilized by the Fund during the fiscal year ended December 31, 2010.
| 6. | Fees and Compensation Paid to Affiliates |
GEAM, a registered investment adviser, was retained by the Company’s Board of Directors effective March 16, 2000 to act as investment adviser and administrator of the Fund. GEAM’s compensation for investment advisory and administrative services is paid monthly based on the average daily net assets of the Fund at an annualized rate of 0.95%.
GEAM waives a portion of the Fund’s management fee in the amount equal to the management fee earned by GEAM with respect to the Fund’s investment in the GE Funds — GE Money Market Fund.
Distribution and Service (12b-1) Fees The Company has adopted a Distribution and Service (12b-1) Plan (the “Plan”) pursuant to Rule 12b-1 under the 1940 Act with respect to Class 4 shares of the Fund. Under the Plan, the Fund may compensate GE Investment Distributors, Inc. (“GEID”), a wholly-owned subsidiary of GEAM and the Fund’s principal distributor, for certain sales services provided by GEID or other broker dealers and investor services provided by GEID or other service providers relating to the Fund’s Class 4 shares, including services to owners or prospective owners of variable contracts issued by insurance companies that offer such share class as an investment option. The amount of compensation paid under the Plan by the Fund’s Class 4 shares may not exceed 0.45% of the average daily net assets of the Fund attributable to such share class. The Plan continues in effect from year to year for so long as such continuance is approved annually by the Board of Directors, including by those directors who are not interested persons of the Company and who have no direct
or indirect financial interest in the operation of the Plan or in any agreement related to it.
Directors’ Compensation The Fund pays no compensation to its directors who are officers or employees of GEAM or its affiliates. Directors who are not such officers or employees also serve in a similar capacity for other funds advised by GEAM. Compensation paid to unaffiliated directors are reflected on the Statement of Operations. These fees are allocated pro rata across all of the mutual fund platforms and share classes served by the directors, including the Fund, and are based upon the relative net assets of each fund within such platforms.
Pursuant to investment sub-advisory agreements with GEAM, the assets of the Small-Cap Equity Fund are allocated to and managed by each of the following sub-advisers: (i) Palisade Capital Management, L.L.C.; (ii) Champlain Investment Partners, LLC; (iii) GlobeFlex Capital, LP; (iv) Kennedy Capital Management, Inc. and (v) SouthernSun Asset Management, LLC. GEAM is responsible for allocating the Fund’s assets among the sub-advisers in its discretion (Allocated Assets), and for managing the Fund’s cash position, while each sub-adviser is responsible for the day-to-day management of their portion of the Allocated Assets, under the general supervision and oversight of GEAM and the Board.
For their services, GEAM pays each sub-adviser an investment sub-advisory fee, which is calculated as a percentage of the average daily net assets of the respective Allocated Assets that it manages.
| 8. | Investment Transactions |
Purchases and Sales of Securities The cost of purchases and the proceeds from sales of investments, other than short-term securities and options, for the period ended December 31, 2009 were as follows:
| | |
| Non-U.S. Government Securities |
| Purchases | | Sales |
$22,537,241 | | $32,365,913 |
The Fund is subject to ASC 740, Income Taxes. ASC 740 provides guidance for financial accounting and reporting for the effects of income taxes that result from an entity’s activities during the year. ASC 740 also provides guidance
20
| | |
| Notes to Financial Statements | | December 31, 2010 |
regarding how certain uncertain tax positions should be recognized, measured, presented and disclosed in the financial statements. ASC 740 requires evaluation of tax positions taken or expected to be taken in the course of preparing the Funds’ tax returns to determine whether the tax positions are “more likely than not” of being sustained by the applicable tax authority. There are no adjustments
to the Fund’s net assets required under ASC 740. The Fund’s 2007, 2008, 2009 and 2010 fiscal years tax returns are still open to examination by the Federal and applicable state tax authorities.
At December 31, 2010, information on the tax components of capital is as follows:
| | | | | | | | | | | | | | |
Cost on
Tax Basis | | Gross Unrealized Tax | | Net Tax Appreciation/
(Depreciation) | | Undistributed Income | | Undistributed
Accum.
Capital Loss | | Post October
Losses |
| | Appreciation | | Depreciation | | Investments | | Derivatives/
Currency | | | |
| $46,795,026 | | $11,121,985 | | $(2,104,761) | | $9,017,224 | | $— | | $6,950 | | $(8,014,209) | | $— |
As of December 31, 2010, the Fund has capital loss carryovers as indicated below.
Capital loss carryovers are available to offset future realized capital gain to the extent provided in the Internal Revenue Code and regulations thereunder. To the extent that these carryover losses are used to offset future capital gains, it is probable that gains so offset will not be distributed to shareholders because they would be taxable as ordinary income.
| | |
| Amount | | Expires |
| $8,014,209 | | 12/31/2017 |
These amounts will be available to offset future taxable capital gains. Under the recently enacted Regulated Investment Company Modernization Act of 2010, the Fund will be permitted to carry forward capital losses incurred in taxable years beginning after December 22, 2010 for an unlimited period. However, any losses incurred during those future years will be required to be utilized prior to the losses incurred in pre-enactment tax years. As a result of this ordering rule, pre-enactment capital loss carryforwards may be more likely to expire unused. Additionally, post-enactment capital losses that are carried forward will retain their character as either short-term or long-term capital losses rather than being considered all short-term as under previous law.
During the year ended December 31, 2010, the Fund utilized $3,538,221 of prior year capital loss carryovers.
Any net capital and currency losses incurred after October 31, within the Fund’s tax year, are deemed to arise on the first day of the Fund’s next tax year if the Fund so elects to defer such losses.
The Fund did not defer any post-October losses for the year ended December 31, 2010.
The tax composition of distributions paid during the years ended December 31, 2010 and December 31, 2009 were as follows:
| | | | | | | | |
| | | Ordinary
Income | | Long-Term
Capital
Gains | | Return of
Capital | | Total |
2010 | | $86,511 | | $— | | $— | | $86,511 |
2009 | | — | | — | | — | | — |
Distributions to Shareholders The Fund declares and pays any dividends from net investment income annually. The Fund declares and pays any net realized capital gains in excess of capital loss carryforwards distributions annually. The character of income and gains to be distributed is determined in accordance with income tax regulations which may differ from generally accepted accounting principles. These differences include (but are not limited to) futures, distributions from Real Estate Investment Trusts (REITS) and losses deferred due to wash sale transactions. Reclassifications due to permanent book/tax differences are made to the Fund’s capital accounts to reflect income and gains available for distribution (or available capital loss carryovers) under income tax regulations. These reclassifications have no impact on net investment income, realized gains or losses, or the net asset value of the Fund. The calculation of net investment income per share in the Financial Highlights table excludes these adjustments.
The reclassifications for the year ended December 31, 2010 were as follows:
| | | | |
Undistributed
Net Investment
Income | | Accumulated
Net Realized Gain | | Paid In
Capital |
| $(3,560) | | $11,728 | | $(8,168) |
21
Report of Independent Registered Public Accounting Firm
The Shareholders and Board of Directors GE Investments Funds, Inc.
We have audited the accompanying statement of assets and liabilities, including the schedule of investments, of the Small-Cap Equity Fund, a series of GE Investments Funds, Inc., as of December 31, 2010, and the related statement of operations for the year then ended, statements of changes in net assets for each of the years in the two-year period then ended, and the financial highlights for each of the years or periods in the five-year period then ended. These financial statements and financial highlights are the responsibility of the Fund’s management. Our responsibility is to express an opinion on these financial statements and financial highlights based on our audits.
We conducted our audits in accordance with the standards of the Public Company Accounting Oversight Board (United States). Those standards require that we plan and perform the audit to obtain reasonable assurance about whether the financial statements and financial highlights are free of material misstatement. An audit includes examining, on a test basis, evidence supporting the amounts and disclosures in the financial statements. Our procedures included confirmation of securities owned as of December 31, 2010 by correspondence with the custodian and brokers, or by other appropriate auditing procedures where replies from brokers were not received. An audit also includes assessing the accounting principles used and significant estimates made by management, as well as evaluating the overall financial statement presentation. We believe that our audits provide a reasonable basis for our opinion.
In our opinion, the financial statements and financial highlights referred to above present fairly, in all material respects, the financial position of the Small-Cap Equity Fund as of December 31, 2010, the results of its operations, changes in its net assets and financial highlights for each of the years or periods described above, in conformity with U.S. generally accepted accounting principles.

Boston, Massachusetts
February 25, 2011
22
| | |
Advisory and Administrative Agreement
Approvals and Renewals | | (unaudited) |
The Board of Directors of the GE Investments Funds, Inc. (the “Board”), including the independent Board members, considered and all those that were present unanimously approved the continuance of the Fund’s Investment Advisory and Administration Agreement with GE Asset Management Incorporated (“GEAM”) and the Investment Sub-Advisory Agreements with each of the Fund’s sub-advisers, Palisade Capital Management, L.L.C. (“Palisade”), Champlain Investment Partners, LLC (“Champlain”) and GlobeFlex Partners, LP (“GlobeFlex”), at meetings held on December 3 and December 10, 2010.
The Board also was not asked to consider for renewal the Investment Sub-Advisory Agreements with SouthernSun Asset Management, LLC (“SouthernSun”) and Kennedy Capital Management, Inc. (“Kennedy”) at this time since they were approved by the Board on July 30, 2010 and September 10, 2010, respectively (descriptions of these approval processes are set forth below), and each has an initial term of two years. They are expected to be reviewed during next year’s contract renewal process.
In considering whether to approve the Fund’s investment advisory and sub-advisory agreements, the Board members considered and discussed a substantial amount of information and analysis provided, at the Board’s request, by GEAM and each of the sub-advisers. The Board members also considered detailed information regarding performance and expenses of other investment companies, including those with similar investment strategies and sizes, which was prepared by independent third party provider Morningstar, Inc. (“Morningstar”). The Board members reviewed the fees charged by GEAM for other mutual funds that employ a similar investment strategy as the Fund. The Board had the opportunity to ask questions and request additional information in connection with its considerations.
Before approving the Fund’s advisory and sub-advisory agreements the Board members reviewed the information provided with management of GEAM and with independent legal counsel. The Board members also reviewed a memorandum prepared by independent legal counsel discussing the legal standards for the consideration of the proposed continuances. The independent Board members discussed the proposed continuances in detail during a private session with their independent legal counsel at which no representatives of GEAM or any of the sub-advisers were present. The independent Board members and their independent legal counsel requested,
and received and considered, additional information from GEAM following these sessions.
In advance of the meetings, and in response to their request, the Board members received from GEAM written responses to their inquiries, which included substantial exhibits and other materials related to GEAM’s business and the services it provides to the Fund. Also in advance of the meetings, the Board members received from each of the sub-advisers a written response to a letter of inquiry prepared by GEAM at the Board’s request, which included substantial exhibits and other materials related to the business of, and services provided by, each of the sub-advisers. The Board members took into account their multi-year experience as Board members and particularly their consideration of these types of agreements in recent years. The information was presented in a manner to facilitate comparison to prior periods and to reflect certain enhancements. To focus their review, the Board members asked GEAM management and each of the sub-advisers, in their oral presentations, to highlight material differences from the information presented in recent years.
During the meetings, the Board members had an opportunity to discuss this information with GEAM managers, including senior executives, representatives from the legal, compliance and finance departments, and investment personnel. The Board members also had an opportunity to hear presentations by representatives of each of the sub-advisers at the meeting or during the past year. The Board members posed questions to these representatives and engaged in substantive discussions with them concerning each of their investment processes.
In reaching their determinations relating to continuance of the Fund’s investment advisory and sub-advisory agreements, the Board members considered all factors that they deemed relevant, including the factors discussed below. In their deliberations, the Board members did not identify any particular information that was all-important or controlling, and each Board member may have attributed different weights to the various factors. In particular, the Board members focused on the following:
The Nature, Extent And Quality Of Services Provided.
The Board members reviewed the services provided by GEAM and each of the sub-advisers, in particular taking into account their extensive past experiences with GEAM and
23
| | |
Advisory and Administrative Agreement
Approvals and Renewals | | (unaudited) |
Palisade. In connection with their consideration of GEAM’s services, the Board members focused on the favorable attributes of GEAM, including (i) an investment philosophy oriented toward long-term performance; (ii) effective processes used for overseeing multiple sub-advisers; (iii) effective processes used for providing Fund administration, including controllership and compliance functions and oversight of the performance of other companies that provide services to the Fund; (iv) highly skilled professionals including analysts, research professionals, traders and portfolio managers with a depth of experience relevant to the Fund; (v) access to significant technological resources from which the Fund may benefit; and (vi) a favorable history and reputation. The Board members noted that the Fund represents only a small portion of the assets managed by GEAM, but benefits from a full array of services and resources provided by GEAM.
In connection with their consideration of the services provided by each of the sub-advisers, the Board members focused on the favorable attributes of the sub-advisers relating to their respective investment philosophies and disciplines, experienced investment and trading personnel, systems and other resources, including research capabilities, and favorable histories and reputations.
In light of the foregoing, the Board, including the independent Board members, concluded that the services provided by GEAM and each of the sub-advisers continue to be satisfactory.
Investment Performance Of The Fund And Sub-Advisers.
The Board members considered the investment performance of the Fund for various periods. The Board members reviewed detailed comparisons of the performance of the Fund with the relevant securities index and peer groupings of mutual funds prepared by Morningstar with respect to various periods. The Board members also engaged in detailed discussions with GEAM management and representatives of each of the sub-advisers at meetings held throughout the year, about each of their investment processes and performance results. These discussions focused on the Fund’s investment objective, GEAM’s asset allocation process, the number and experience of portfolio management and supporting research personnel, the investment style and approach employed, the likely market cycles for the investment style and relative underperformance in certain periods. The
Board also considered the multi-manager structure and how each sub-adviser’s approach to small-cap investing fits within the Fund’s overall strategy. The Board members discussed GEAM’s investment approach with respect to the Fund, and that the performance of the Fund is consistent with GEAM’s articulated long-term approach and overall investment philosophy.
The Board, including the independent Board members, concluded that the Fund’s performance was acceptable overall taking into consideration the factors discussed above.
Cost Of The Services Provided And Profits Realized From The Relationships With The Fund.
The Board members considered the fees paid to GEAM by the Fund, as well as those paid to each of the sub-advisers by GEAM, and the cost of the services provided by GEAM and each of the sub-advisers. The Board members reviewed the information they had requested from GEAM and each of the sub-advisers concerning their profitability.
The Board members considered the profit margin information for GEAM’s investment company business as a whole, as well as GEAM’s profitability data for the Fund. The Board members reviewed GEAM’s assumptions and the methods of cost allocation used by GEAM in preparing Fund-specific profitability data. The Board members discussed with GEAM the basis for its belief that the methods of allocation used were reasonable for each area of its business. The Board members also reviewed the assumptions and cost allocation methods used by each of the sub-advisers in preparing their profitability data.
Information was presented regarding the financial condition of GEAM and each of the sub-advisers for various past periods. The Board members noted and discussed the additional services provided by GEAM to the Fund compared to other investment products managed by GEAM, and previously had been provided a study conducted by the Investment Company Institute that discusses and compares advisory fees and services for mutual funds and institutional separate accounts. GEAM reviewed the services related to the allocation of assets among, and oversight of, multiple sub-advisers as a result of the Fund’s multi-manager structure. The Board noted that GEAM, and not the Fund, pays the sub-advisory fees to each of the sub-advisers out of its advisory fee. The Board
24
| | |
Advisory and Administrative Agreement
Approvals and Renewals | | (unaudited) |
members determined that GEAM and each of the sub-advisers should be entitled to earn a reasonable level of profits for the services they provide to the Fund. The Board members also recognized that GEAM had made significant investments in its business and had not fully recovered the sums invested. The Board also considered that GEAM continues to make a substantial investment in fulfilling its obligations to the Fund and supporting its Fund-related activities.
Based on their review, the Board, including the independent Board members, concluded that they were satisfied that the level of profitability achieved by GEAM and each of the sub-advisers from their relationship with the Fund was not unreasonable or excessive.
The Extent To Which Economies Of Scale Would Be Realized As The Fund Grows And Whether Fee Levels Would Reflect Such Economies Of Scale.
Although the Board noted that the Fund did not experience significant growth in assets over the past year, the Board members considered the extent to which economies of scale would be realized as the Fund grows, and whether fee levels reflect these economies of scale for the benefit of Fund investors.
The Board members considered the substantial infrastructure investments that GEAM has made with respect to its operations and its commitment to continue investing resources to enhance services to Fund shareholders. The Board members recognized the benefits to the Fund of GEAM’s past investment in its operations through the expenditure of sums to support its substantial infrastructure, and that, with respect to all GEAM managed mutual funds, GEAM has not yet fully recouped that investment. The Board members also recognized the benefits to the Fund of being able to leverage a favorable cost structure achieved with respect to the Fund’s other operating expenses as a result of GEAM’s large overall base of assets under management and its vendor management practices.
Comparison Of Services To Be Rendered And Fees To Be Paid.
The Board members discussed the services provided to the Fund by GEAM and each of the sub-advisers, and the fees charged for those services, including the services required of GEAM to oversee multiple sub-advisers. The Board
members reviewed information concerning the fee and expense ratios for the Fund and comparative information with respect to peer groupings of mutual funds prepared by Morningstar. They discussed that the Fund’s figures were within the applicable peer group ranges, although at the higher end of the ranges. The Board members reviewed comparative fee information with respect to any comparable mutual fund or other client accounts managed by each of the sub-advisers. The Board, including the independent Board members, concluded that, based on this information, the advisory fee and the sub-advisory fees paid to each of the sub-advisers were reasonable in relation to the services provided to the Fund.
Fall-Out Benefits.
The Board members considered other actual and potential financial benefits that GEAM and each of the sub-advisers may derive from their respective relationships with the Fund, including, to the extent applicable, soft dollar commission benefits generated through Fund portfolio transactions. The Board members noted, however, that the Fund benefits from the vast array of resources available through GEAM, and that the Fund represents only a small portion of the assets managed by GEAM.
Conclusion.
No single factor was determinative to the Board’s decision. Based on their discussion and such other matters as were deemed relevant, the Board, including the independent Board members, concluded that renewal of the advisory and each sub-advisory agreement was in the best interests of the Fund and its shareholders.
* * * * *
At a special meeting held on July 30, 2010, the Board, including the independent Board members, considered and unanimously approved a proposal by GEAM to approve a sub-advisory agreement with SouthernSun (which, as SouthernSun Asset Management, Inc. (“SouthernSun Inc.”) was a current sub-adviser for the Fund), thereby allowing SouthernSun to continue to provide sub-advisory services with respect to assets allocated to SouthernSun. The parent company of SouthernSun Inc. had reached an agreement to repurchase a portion of SouthernSun Inc.’s shares held by its external shareholders (meaning non-employees) to become majority employee-owned (the “Transaction”).
25
| | |
Advisory and Administrative Agreement
Approvals and Renewals | | (unaudited) |
GEAM reminded the Board that the Company and GEAM had received an exemptive order from the SEC to permit GEAM and the Company to select and retain sub-advisers for the Fund and to enter into sub-advisory agreements without shareholder approval. Accordingly, GEAM would be able, subject to the approval of the Board, to re-appoint SouthernSun as a sub-adviser and enter into a new sub-advisory agreement with SouthernSun, on behalf of the Fund, without obtaining shareholder approval, provided there is not an increase in the Fund’s advisory fee.
In considering the approval of the new sub-advisory agreement, the Board members, including the independent Board members, considered and discussed a substantial amount of information and analyses provided by GEAM and SouthernSun. The Board reviewed SouthernSun’s performance history as well as detailed information about SouthernSun and its professional staff, including SouthernSun’s investment philosophy and expertise in small-cap equity investments. The Board noted that SouthernSun (as SouthernSun Inc.) served as sub-adviser to the Fund as well as to other investment companies managed by GEAM that have small-cap investment strategies, namely the GE Funds — GE Small-Cap Equity Fund and the GE Institutional Funds—Small-Cap Equity Fund (together, the “Small-Cap Equity Funds”), and that both GEAM and SouthernSun Inc. had provided the Board with a substantial amount of information and analysis at prior Board meetings, including the annual contract renewal meetings held on December 4, 2009, and December 11, 2009. As such, the basis for the Board’s December 2009 renewal of the sub-advisory agreements with SouthernSun Inc. with respect to the Fund and the Small-Cap Equity Funds would continue to be relevant for the Board’s consideration of the new sub-advisory agreement.
The Board members had an opportunity to discuss this information with GEAM managers and representatives of SouthernSun. The Board members posed questions to these representatives and engaged in substantive discussions. The independent Board members discussed the approval of the new sub-advisory agreement in detail during a private session with their independent legal counsel at which no representatives of GEAM or SouthernSun were present. In reaching their determination relating to the new sub-advisory agreement, the Board, including the independent Board members, considered all factors that it deemed relevant including the factors discussed below. In
their deliberations, the Board members did not identify any particular information that was all-important or controlling, and each Board member may have attributed different weights to the various factors. The Board members evaluated this information and all other information available to them with respect to the Fund. In particular, the Board members focused on the following:
The Nature, Extent and Quality of Services Expected to be Provided.
The Board reviewed the services expected to be provided to the Fund by SouthernSun. The Board noted that as a result of the Transaction there would be no changes in the nature, extent or quality of the sub-advisory services currently provided by SouthernSun Inc., or in the portfolio management of the Fund with respect to the assets it managed. The Board focused on its extensive past experiences with SouthernSun (as SouthernSun Inc.) in connection with its services as a sub-adviser to the Fund and the Small-Cap Equity Funds. The Board considered SouthernSun’s favorable attributes relating to its investment philosophy oriented toward long-term performance, its process for selecting investments, and its experienced professionals, including research analysts and portfolio managers with a depth of experience involving small-cap equity securities.
In light of the foregoing, the Board, including the independent Board members, concluded that the services expected to be provided by SouthernSun would be satisfactory and would have the potential to benefit the Fund.
Investment Performance of SouthernSun.
The Board members considered the investment performance of SouthernSun for various periods focusing on SouthernSun’s investment performance with respect to the Fund and the Small-Cap Equity Funds and its history of sub-advising those funds. The Board members reviewed detailed information provided by GEAM and SouthernSun comparing SouthernSun’s performance to that of relevant securities indices and peer groupings over these periods. The Board members also engaged in discussions with GEAM and SouthernSun about SouthernSun’s investment process, focusing on the number and experience of portfolio management and supporting research personnel and SouthernSun’s investment style and approach
26
| | |
Advisory and Administrative Agreement
Approvals and Renewals | | (unaudited) |
employed. The Board considered the extent to which the expected investment style and approach would be consistent with GEAM’s articulated long-term approach and overall investment philosophy. The Board members also considered GEAM’s discussion of how the re-appointment of SouthernSun would fit within its management of the Fund’s overall allocation strategy.
Taking these factors into consideration, the Board, including the independent Board members, found the investment performance of SouthernSun to be satisfactory.
Cost of the Services to be Provided and Profits to be Realized from the Relationship with the Fund.
The Board considered that the proposed fee to be paid to SouthernSun by GEAM was the same as the fee paid under the agreement with SouthernSun Inc. and had been negotiated at arm’s-length, and that GEAM had used its influence with respect to the total assets it proposes to be managed by SouthernSun to obtain what it regards as the most favorable and reasonably available fee arrangement, based on the expected relative allocation of the Fund’s assets to SouthernSun. The Board also noted that SouthernSun’s sub-advisory fee rate decreases in amount as assets allocated to it grow. Given the arm’s-length nature of the arrangement, the Board did not examine the specific levels of profitability for SouthernSun with respect to the Fund.
The Board did not review information regarding the expected impact on GEAM’s profitability in approving the sub-advisory agreement, since the fee was not changing from the fee in effect under the sub-advisory agreement with SouthernSun Inc. so there would be no impact on profitability.
The Extent to Which Economies of Scale Would be Realized as the Fund Grows and Whether Fee Levels Would Reflect Such Economies of Scale.
The Board members considered the extent to which economies of scale would be realized as the Fund grows, and whether fee levels reflect these economies of scale for the benefit of Fund investors. The Board recognized that this consideration is less relevant with respect to the proposed sub-advisory fees, because GEAM will pay SouthernSun out of its advisory fees received from the Fund, and noted that the Board considered economies of scale for the Fund in connection with the annual renewals of GEAM’s advisory agreement with the Fund.
Comparison of Services to be Rendered and Fees to be Paid.
The Board discussed the services expected to be provided to the Fund by SouthernSun, and the proposed fees to be charged to GEAM for those services. The Board members reviewed information regarding the proposed sub-advisory fees and noted that they would be competitive with applicable peer group averages. They also reviewed SouthernSun’s fee rates for the Small-Cap Equity Funds, which were the same at current asset levels and estimated allocation. The Board also considered its favorable experience with SouthernSun (as SouthernSun Inc.) as a sub-adviser to the Fund and to the Small-Cap Equity Funds.
The Board, including the independent Board members, concluded that, based on this information, the proposed sub-advisory fees would be reasonable in relation to the services expected to be provided to the Fund.
Fall-Out Benefits.
The Board considered that there may be financial benefits that SouthernSun derives from its relationship with GEAM and the Fund, including soft dollar commission benefits generated through Fund portfolio transactions. The Board did not view this consideration as having a material effect on its overall view of the reasonableness of the proposed fees to SouthernSun.
Conclusion.
No single factor was determinative to the Board’s decision. Based on their discussion and such other matters as were deemed relevant, the Board members, including the independent Board members, concluded that the new sub-advisory agreement was in the best interests of the Fund and its shareholders.
* * * * *
At a regular meeting held on September 10, 2010, the Board, including the independent Board members, considered and unanimously approved a proposal by GEAM to engage Kennedy to provide sub-advisory services with respect to a portion of the Fund’s assets.
GEAM reminded the Board that the Company and GEAM had received an exemptive order from the SEC to permit GEAM and the Company to select and retain sub-advisers for the Fund and to enter into sub-advisory agreements
27
| | |
Advisory and Administrative Agreement
Approvals and Renewals | �� | (unaudited) |
without shareholder approval. Accordingly, GEAM would be able, subject to the approval of the Board, to engage Kennedy and enter into a sub-advisory agreement with Kennedy, on behalf of the Fund, without obtaining shareholder approval, provided there is not an increase in the Fund’s advisory fee.
In considering the approval of the sub-advisory agreement with Kennedy, the Board members, including the independent Board members, considered and discussed a substantial amount of information and analyses provided by GEAM and Kennedy. The Board reviewed Kennedy’s performance history as well as detailed information about Kennedy and its professional staff, including Kennedy’s investment philosophy and expertise in small-cap equity investments.
The Board members had an opportunity to discuss this information with GEAM managers and representatives of Kennedy. The Board members posed questions to these representatives and engaged in substantive discussions. The independent Board members discussed the approval of Kennedy as a sub-adviser to the Fund in detail during a private session with their independent legal counsel at which no representatives of GEAM or Kennedy were present. In reaching their determination relating to the new sub-advisory agreement with Kennedy, the Board, including the independent Board members, considered all factors that it deemed relevant including the factors discussed below. In their deliberations, the Board members did not identify any particular information that was all-important or controlling, and each Board member may have attributed different weights to the various factors. The Board members evaluated this information and all other information available to them with respect to the Fund. In particular, the Board members focused on the following:
The Nature, Extent and Quality of Services Expected to be Provided.
The Board reviewed the services expected to be provided to the Fund by Kennedy. The Board focused on GEAM’s report of its diligence review of Kennedy, as well as the materials presented by Kennedy at the meeting. The Board considered Kennedy’s favorable attributes relating to its investment philosophy oriented toward long-term performance, its process for selecting investments, and its experienced professionals, including research analysts and portfolio managers with a depth of experience involving small-cap equity securities.
In light of the foregoing, the Board, including the independent Board members, concluded that the services expected to be provided by Kennedy would be satisfactory and would have the potential to benefit the Fund.
Complementary Investment Styles.
The Board then considered Kennedy’s investment style as presented by GEAM and Kennedy, and noted that Kennedy would represent a value style approach to small-cap investments. The Board engaged in a discussion with GEAM’s management regarding how Kennedy’s investment style would complement the various investment styles of the existing sub-advisers of the Fund, and GEAM noted that the addition of Kennedy could potentially improve the Fund’s overall performance, especially when one style is out of favor or excessively volatile.
Investment Performance of Kennedy.
The Board members considered the investment performance of Kennedy for various periods. The Board members reviewed detailed information provided by GEAM and Kennedy comparing Kennedy’s performance to that of relevant securities indices and peer groupings over these periods. The Board members also engaged in discussions with GEAM and Kennedy about Kennedy’s investment process, focusing on the number and experience of portfolio management and supporting research personnel and Kennedy’s investment style and approach employed. The Board considered the extent to which the expected investment style and approach would be consistent with GEAM’s articulated long-term approach and overall investment philosophy. The Board members also considered GEAM’s discussion of how the retention of Kennedy would fit within its management of the Fund’s overall allocation strategy.
Taking these factors into consideration, the Board, including the independent Board members, found the investment performance of Kennedy to be satisfactory.
Cost of the Services to be Provided and Profits to be Realized from the Relationship with the Fund.
The Board considered that the proposed fees to be paid to Kennedy by GEAM had been negotiated at arm’s-length, and that GEAM had used its influence with respect to the total assets it proposes to be managed by Kennedy to obtain what it regards as the most favorable and
28
| | |
Advisory and Administrative Agreement
Approvals and Renewals | | (unaudited) |
reasonably available fee arrangement, based on the expected relative allocation of the Fund’s assets to Kennedy. Given the arm’s-length nature of the arrangement, the Board did not examine the specific levels of profitability for Kennedy with respect to the Fund.
The Board was provided with information regarding the expected impact on GEAM’s profitability in hiring Kennedy, which showed a negligible reduction in profitability. The Board members had reviewed GEAM’s assumptions and the methods of cost allocation used by GEAM in preparing profitability data in connection with previous reviews of profitability. The Board members also had previously discussed with GEAM the basis for its belief that the methods of allocation used were reasonable.
The Extent to Which Economies of Scale Would be Realized as the Fund Grows and Whether Fee Levels Would Reflect Such Economies of Scale.
The Board members considered the extent to which economies of scale would be realized as the Fund grows, and whether fee levels reflect these economies of scale for the benefit of Fund investors. The Board recognized that this consideration is less relevant with respect to the proposed sub-advisory fees, because GEAM will pay Kennedy out of its advisory fees received from the Fund, and noted that the Board considered economies of scale for the Fund in connection with annual contract renewals.
Comparison of Services to be Rendered and Fees to be Paid.
The Board discussed the services expected to be provided to the Fund by Kennedy, and the proposed fees to be charged to GEAM for those services. The Board members reviewed information regarding the proposed sub-advisory fees and noted that they would be competitive with applicable peer group averages.
The Board, including the independent Board members, concluded that, based on this information, the proposed sub-advisory fees would be reasonable in relation to the services expected to be provided to the Fund.
Fall-Out Benefits.
The Board considered that there may be financial benefits that Kennedy derives from its relationship with GEAM and the Fund, including soft dollar commission benefits
generated through Fund portfolio transactions. The Board did not view this consideration as having a material effect on its overall view of the reasonableness of the proposed fees for the Fund.
Conclusion.
No single factor was determinative to the Board’s decision. Based on their discussion and such other matters as were deemed relevant, the Board members, including the independent Board members, concluded that the new sub-advisory agreement with Kennedy was in the best interests of the Fund and its shareholders.
29
| | |
| Additional Information | | (unaudited) |
Information about Directors and Executive Officers:
The business and affairs of the Company are managed under the direction of the Company’s Board of Directors. Information pertaining to the Directors and officers of the Company is set forth below.
Interested Directors and Executive Officers
Michael J. Cosgrove
Address c/o GEAM 3001 Summer St. Stamford, CT 06905
Age 61
Position(s) Held with Fund Chairman of the Board and President
Term of Office and Length of Time Served Until successor is elected and qualified – 14 years
Principal Occupation(s) During Past 5 years President and Chief Executive Officer – Mutual Funds and Intermediary Business since March 2007; Executive Vice President of GEAM from February 1997 to March 2007; Director of GEAM since 1988; Vice President, GE Capital Corporation, an indirect wholly-owned subsidiary of GE, since December 1999; Executive Vice President – Sales and Marketing of GEAM, a wholly-owned subsidiary of GE that is registered as an investment adviser under the Investment Advisers Act of 1940, as amended, from March 1993 to March 2007.
Number of Portfolios in Fund Complex Overseen by Director 49
Other Directorships Held by Director Chairman of the Board and President of GE Funds from 1993 to February 2011, and GE Institutional Funds since its inception; Trustee of General Electric Savings & Security Trust, General Electric S&S Income Fund, General Electric S&S Program Mutual Fund (“GE Savings & Security Funds”), Elfun Funds, General Electric Insurance Plan Trust, General Relief Loan Fund, and General Electric Pension Trust since 1988; Trustee of Fordham University since 2002; Trustee of GE Volunteers since 1993; Director, GE Asset Management (Ireland) since February 1999; Director, GE Asset Management Funds Plc., GE Asset Canada Company, and GE Asset Management Limited since 1998.
Matthew J. Simpson
Address c/o GEAM 3001 Summer St. Stamford, CT 06905
Age 49
Position(s) Held with Fund Director and Executive Vice President
Term of Office and Length of Time Served Until successor is elected and qualified – 3 years
Principal Occupation(s) During Past 5 years Executive Vice President, General Counsel and Secretary of GEAM since July 2007; Senior Vice President and General Counsel – Marketing and Client Services (formerly Asset Management Services), at GEAM and Senior Vice President and General Counsel of GEAMS from February 1997 to June 2007; Vice President and Associate General Counsel of GEAM from October 1992 to February 1997; Vice President of GE Funds, GE Institutional Funds and GE LifeStyle Funds from September 2003 to June 2007; Secretary of GE Funds and GE Institutional Funds from 1997 to June 2007; Vice President of Elfun Funds and GE Savings & Security Funds from October 2003 to June 2007; Assistant Secretary of Elfun Funds and GE Savings & Security Funds from 1998 to June 2007.
Number of Portfolios in Fund Complex Overseen by Director 49
Other Directorships Held by Director Trustee of GE Institutional Funds, Elfun Funds and GE Savings & Security Funds since July 2007. Trustee of GE Funds from July 2007 to February 2011.
30
| | |
| Additional Information | | (unaudited) |
Joon Won Choe
Address c/o GEAM 3001 Summer St. Stamford, CT 06905
Age 41
Position(s) Held with Fund Vice President & Secretary
Term of Office and Length of Time Served Until successor is elected and qualified – Vice President and Secretary – less than 1 year
Principal Occupation(s) During Past 5 years Senior Vice President and Associate General Counsel at GEAM since June 2010; Vice President and Associate General Counsel at GEAM from November 2005 to June 2010; Vice President and Secretary of GE Funds from September 2010 to February 2011. Vice President and Secretary of GE Institutional Funds and GE Investments Funds, Inc. since September 2010; Vice President and Assistant Secretary of Elfun Funds and GE Savings & Security Funds since September 2010.
Number of Portfolios in Fund Complex Overseen by Officer N/A
Other Directorships Held by Officer N/A
Robert Herlihy
Address c/o GEAM 3001 Summer St. Stamford, CT 06905
Age 43
Position(s) Held with Fund Senior Vice President and Chief Compliance Officer
Term of Office and Length of Time Served Until successor is elected and qualified — 5 years
Principal Occupation(s) During Past 5 years Chief Compliance Officer of GEAM, GE Institutional Funds, Elfun Funds, and GE Savings and Security Funds since July 2005; Chief Compliance Officer of GE Funds from July 2005 to February 2011; Manager of Fund Administration at GEAM from 2002 – 2005.
Number of Portfolios in Fund Complex Overseen by Officer N/A
Other Directorships Held by Officer N/A
Eunice Tsang
Address c/o GEAM 3001 Summer St. Stamford, CT 06905
Age 51
Position(s) Held with Fund Treasurer
Term of Office and Length of Time Served Until successor is elected and qualified – less than one year
Principal Occupations(s) During Past 5 years Treasurer of GE Institutional Funds, Elfun Funds and GE Savings and Security Funds since January 2010; Treasurer of GE Funds from January 2010 to February 2011; GEAM Operational Controllership and Technical Accounting Manager since December 2007; Financial Planning & Analysis Manager – Performance Leader from June 2005 to December 2007; GEAM Quality Black Belt from 2001 to June 2005; Financial Planning & Analysis Manager from 2000 to 2001; and Mutual Fund Assistant Controller from October 1997 to 2000.
Number of Portfolios in Fund Complex Overseen by Officer N/A
Other Directorships Held by Officer N/A
31
| | |
| Additional Information | | (unaudited) |
Non-Interested Directors
John R. Costantino
Address c/o GEAM 3001 Summer St. Stamford, CT 06905
Age 64
Position(s) Held with Fund Director
Term of Office and Length of Time Served Until successor is elected and qualified – 14 years
Principal Occupation(s) During Past 5 years General Partner, NGN Capital LLC since 2006; Managing Director, Vice President of Walden Capital Management since 1996.
Number of Portfolios in Fund Complex Overseen by Director 41
Other Directorships Held by Director Trustee of GE Funds since 1993, GE Institutional Funds since its inception; Trustee of Fordham University from 1989 to 1995 and 2001 to 2007 and Trustee Emeritus since 2007; Trustee of Neuro Science Research Institute since 1986; Trustee of Gregorian University Foundation from 1992 to 2007; Director of Artes Medical from 2006 to 2008.
William J. Lucas
Address c/o GEAM 3001 Summer St. Stamford, CT 06905
Age 61
Position(s) Held with Fund Director
Term of Office and Length of Time Served Until successor is elected and qualified – 13 years (No longer serves as Trustee effective November 4, 2010)
Principal Occupation(s) During Past 5 years Retired since 2010, previously Vice President and Treasurer of Fairfield University since 1983.
Number of Portfolios in Fund Complex Overseen by Director 41
Other Directorships Held by Director Trustee of GE Funds since 1993, and GE Institutional Funds since its inception.
Robert P. Quinn
Address c/o GEAM 3001 Summer St. Stamford, CT 06905
Age 74
Position(s) Held with Fund Director
Term of Office and Length of Time Served Until successor is elected and qualified – 14 years
Principal Occupation(s) During Past 5 years Retired since 1983 from Salomon Brothers Inc.
Number of Portfolios in Fund Complex Overseen by Director 41
Other Directorships Held by Director Trustee of GE Funds since 1993, and GE Institutional Funds since its inception; Trustee, St. Francis Hospital Corp. since 1980.
The Statement of Additional Information for the Fund includes additional information about the Directors and Officers and is available, without charge, upon request by calling 1-800-493-3042.
32
Investment Adviser and Administrator
GE Asset Management Incorporated
Board of Directors
Michael J. Cosgrove, Chairman
John R. Costantino
William J. Lucas*
Robert P. Quinn
Matthew J. Simpson
Secretary
Joon Won Choe
Assistant Secretary
Michelle Matzelle
Treasurer
Eunice Tsang
Assistant Treasurers
Tatyana Begun**
Casey Yantosca
Distributor
GE Investment Distributors, Inc.
Member FINRA and SIPC
Counsel
Sutherland, Asbill & Brennan, LLP
Custodian
State Street Bank & Trust Company
Independent Registered Public Accounting Firm
KPMG LLP
Officers of the Investment Adviser
James W. Ireland, President and Chief Executive Officer
Cheryl H. Beacock, Senior Vice President, Human Resources
Paul M. Colonna, President and Chief Investment Officer – Fixed Income Investments
Michael J. Cosgrove, President and Chief Executive
Officer – Mutual Funds & Intermediary Business
Ralph R. Layman, President and Chief Investment Officer – Public Equity Investments
Maureen B. Mitchell, President – Institutional Sales and Marketing
Steve Rullo, Chief Information Officer (since February 2011)
Matthew J. Simpson, Executive Vice President, General Counsel and Secretary
Don W. Torey, President – Alternative Investments
John J. Walker, Executive Vice President, Chief Operating Officer
David Wiederecht, President and Chief Investment Officer – Investment Strategies
Tracie Winbigler, Executive Vice President, Chief Financial Officer***
| * | As of November 4, 2010, Mr. Lucas no longer served as a director of the Company. |
| ** | As of February 18, 2011, Ms. Begun no longer served as an officer of the Company. |
| *** | Effective January, 2011. |
33
Investment Adviser
GE Asset Management Incorporated
3001 Summer Street
PO Box 7900
Stamford, CT 06904-7900
Distributor
GE Investment Distributors, Inc.
member FINRA and SIPC
3001 Summer Street
PO Box 7900
Stamford, CT 06904-7900
The Fund files its complete schedule of portfolio holdings with the Securities and Exchange Commission for the first and third quarters of each fiscal year on Form N-Q. The Fund’s Forms N-Q, as well as a description of the policies and procedures that the Fund uses to determine how to vote proxies (if any) relating to portfolio securities is available without charge (i) upon request, by calling 1-800-493-3042; (ii) on the Fund’s website at http://www.geam.com; and (iii) on the Commission’s website at http://www.sec.gov. The Fund’s Forms N-Q may be reviewed and copied at the Commission’s Public Reference Room in Washington, DC—information on the operation of the Public Reference Room may be obtained by calling 1-800-SEC-0330.
Information (if any) regarding how the Fund voted proxies relating to portfolio securities during the most recently disclosed 12-month period ended June 30 is available without charge (i) through the Fund’s website at http://www.geam.com; and (ii) on the Commission’s website at http://www.sec.gov.

GE Investments Funds, Inc.
International Equity Fund
Annual Report
December 31, 2010

GE Investments Funds, Inc.
| | |
| |
| International Equity Fund | | Contents |
This report is prepared for Policyholders of certain variable contracts and may be distributed to others only if preceded or accompanied by the variable contract’s current prospectus and the current prospectus of the Fund available for investments thereunder.
| | |
| Notes to Performance | | December 31, 2010 |
The information on the following performance pages relates to the GE Investments International Equity Fund (the “Fund”).
Total returns take into account changes in share price and assume reinvestment of dividends and capital gains distributions, if any. Total returns shown are net of Fund fees and expenses but do not reflect fees and charges associated with the variable contracts such as administrative fees, account charges and surrender charges, which, if reflected, would reduce the Fund’s total returns for all periods shown.
The performance data quoted represent past performance; past performance does not guarantee future results. Investment return and principal value will fluctuate so your shares, when redeemed, may be worth more or less than their original cost. Current performance may be higher or lower than the performance data quoted. Periods less than one year are not annualized. Please call 800-493-3042 or visit the Fund’s website at http://www.geam.com for the most recent month-end performance data.
An investment in the Fund is not a deposit of any bank and is not insured or guaranteed by the Federal Deposit Insurance Corporation (FDIC) or any other government agency. An investment in the Fund is subject to risk, including possible loss of principal invested.
GE Investment Distributors, Inc., Member of FINRA & SIPC, is the principal underwriter and distributor of the GE Investments Funds, Inc. and a wholly owned subsidiary of GE Asset Management Incorporated, the investment adviser of the Fund.
The MSCI® EAFE® Index is an unmanaged market capitalization-weighted index of equity securities of companies domiciled in various countries. The Index is designed to represent the performance of developed stock markets outside the U.S. and Canada. The results shown for the foregoing index assume the reinvestment of net dividends or interest. They do not reflect the actual cost of investing in the instruments that comprise the index.
The peer universe of the underlying annuity funds used for the peer group average annual total return calculation is based on a blend of Morningstar peer categories, as shown. Morningstar is an independent mutual fund rating service. A Fund’s performance may be compared to or ranked within a universe of mutual funds with investment objectives and policies similar but not necessarily identical to that of the Fund.
©2010 Morningstar, Inc. All Rights Reserved. The Morningstar information contained herein: (1) is proprietary to Morningstar and/or its content providers; (2) may not be copied or distributed; and (3) is no warranted to be accurate, complete or timely. Neither Morningstar nor its content providers are responsible for any damage or losses relating from any use of this information. Past performance is no guarantee or future results.
1
International Equity Fund
(unaudited)

Ralph R. Layman
The International Equity Fund is managed by a team of portfolio managers that includes Brian Hopkinson, Ralph R. Layman, Paul Nestro, Jonathan L. Passmore and Michael J. Solecki. As lead portfolio manager for the Fund, Mr. Layman oversees the entire team and assigns a portion of the Fund to each manager, including himself. Each portfolio manager is limited to the management of his or her portion of the Fund, the size of the portion which Mr. Layman determines on an annual basis. The portfolio managers do not operate independently of each other, rather, the team operates collaboratively, communicating purchases or sales of securities on behalf of the Fund.
Ralph R. Layman is President and Chief Investment Officer — Public Equities and a Director at GE Asset Management. Mr. Layman has led the team of portfolio managers for the International Equity Fund since 1997. Mr. Layman joined GE Asset Management in 1991 as Senior Vice President for International Investments and became an Executive Vice President in 1992, President —International Equities in March 2007 and President — Public Equities since July 2009.
Brian Hopkinson is a Senior Vice President of GE Asset Management. He has been a portfolio manager for the Fund since 1997. Prior to joining GE Asset Management, Mr. Hopkinson worked for Fiduciary Trust International in both London and New York.
Paul Nestro is a Senior Vice President of GE Asset Management. He has been a member of the portfolio management team for the International Equity Fund since February 2007. Mr. Nestro joined GE Asset Management in 1993 as a performance and attribution analyst in U.S. Equities. He became a senior performance and attribution analyst in 1994 and since 1996 has been an analyst and portfolio manager in the international equities group.
Jonathan L. Passmore is a Senior Vice President of GE Asset Management. He has served as a portfolio manager of the International Equity Fund since January 2002. Prior to joining GE Asset Management in January 2001, he was
with Merrill Lynch for six years, most recently as Director, international equity.
Michael J. Solecki is a Senior Vice President and Chief Investment Officer — International Equities at GE Asset Management. He has served as a portfolio manager of the International Equity Fund since September 1997. He joined GE Asset Management in 1990 as an international equity analyst. He became a Vice President for international equity portfolios in 1996 and Senior Vice President in 2000.
| Q. | How did the GE Investment International Equity Fund perform compared to its benchmark for the twelve-month period ended December 31, 2010? |
| A. | For the twelve-month period ended December 31, 2010, the International Equity Fund returned 4.85% for Class 1 shares and 4.33% for Class 4 shares. The MSCI EAFE Index, the Fund’s benchmark, returned 7.75% and the Fund’s Morningstar peer group of 140 U.S. Insurance Foreign Large Blend funds returned on average of 8.98% for the same period. |
| Q. | What market conditions impacted the Fund performance? |
| A. | Markets were volatile for much of the year as contradictory forces dampened performance early in the year but gave way to strong gains in the second half. The evolving sovereign debt crisis in Europe negatively affected markets concerned about a growing need for austerity but the persistence of low rates, anecdotal evidence of an improving global economy and strong earnings across the globe pushed stocks higher in all major markets. Similarly, doubts regarding much-needed regulatory reform in the financial sector cast a cloud over markets in the first half but increased clarity from bodies such as the Basel 3 Committee regarding bank capitalization, liquidity and leverage provided much-needed transparency to investors later in the year. |
2

| Q. | What were the primary drivers of Fund performance? |
| A. | Positive impact was seen from holdings in materials, energy stocks and telecom services. The steady rise of commodity prices throughout the year was highly beneficial to metals and mining stocks and fertilizer companies leveraged to rising crop prices. A somewhat different result was seen in energy where despite rising oil prices, a combination of the BP crisis and low natural gas prices saw that sector underperform. An underweight in the underperforming telecom sector was also beneficial for performance. |
| | The lion’s share of the negative performance in the portfolio came from holdings in the financial sector, mainly in European banks. Although underweight, the portfolio was hit by the assumption that all European banks would be dragged down by the sovereign debt crisis, although direct exposure to the troubled markets of Greece, Ireland and Portugal was insignificant. Japanese holdings, especially those in the export markets also suffered due to a strong Yen. |
| Q. | Were there any significant changes to the Fund during the period? |
| A. | Significant changes occurred during the year, most notably in the information technology and industrial sectors (additions) funded through sales in healthcare, financials, the consumer sectors and utilities. Generally, a growing conviction in a return to economic growth prompted purchases in the more cyclical sectors and disposals in the defensive segment of the portfolio. Stocks in the IT sector appealed for increasing evidence that corporate entities are beginning to spend and industrial companies in Europe gained material advantage from the weakness in the Euro caused by the sovereign debt crisis. While the outlook for the consumer is improving, especially in Emerging Asia, the outlook for consumer staples companies is less robust, as much for valuation reasons than lack of a catalyst. Financials have remained troubled all year with individual stocks in the commercial banking segment paying a steeper price than stocks in insurance for example and particular positions were reduced as a result. Healthcare companies, given the uncertainties surrounding the regulatory environment have offered little appeal and utilities have been challenged by anemic growth and a tough financing environment, |
| | despite low rates. The portfolio finished the year overweight IT, materials and industrials, and underweight consumer discretionary, utilities, healthcare, financials and telecom. |
3
International Equity Fund
(unaudited)
Understanding Your Fund’s Expenses
As a shareholder of the Fund you incur transaction and ongoing expenses. Transaction expenses including sales charges on purchases payments, reinvested dividends (or other distributions), and redemption fees directly reduce the investment return of the Fund. Ongoing costs include portfolio management fees, distribution and services fees, professional fees, administrative fees and other Fund expenses. The following example is intended to help you understand your ongoing costs (in dollars) of investing in the Fund and to compare these costs with the ongoing costs of investing in other mutual funds.
To illustrate these ongoing costs, we have provided an example and calculated the expenses paid by investors during the period. The information in the following table is based on an investment of $1,000, which is invested at the beginning of the period and held for the entire six-month period ended December 31, 2010.
Actual Expenses
The first section of the table provides information about actual account values and actual expenses. You may use the information in this section, together with the amount you invested, to estimate the expenses that you paid
over the period. To do so, simply divide your account value by $1,000 (for example, an $8,600 account value divided by $1,000 = 8.6), then multiply the result by the number given for your class under the heading “Expenses Paid During Period.”
Hypothetical Example for Comparison Purposes
The second section of the table provides information about hypothetical account values and hypothetical expenses based on the Fund’s actual expense ratio and an assumed rate of return of 5% per year before expenses, which is not the Fund’s actual return. You may use this information to compare the ongoing costs of investing in the Fund and other funds. To do so, compare this 5% hypothetical example with the 5% hypothetical examples that appear in the shareholders reports of other funds.
Please note that the expenses shown in the table for both “Actual” and “Hypothetical” do not reflect any transaction costs, such as sales charges or redemption fees. Additionally, the expenses shown do not reflect the fees or charges associated with variable contracts through which shares of the Fund are offered.
July 1, 2010 – December 31, 2010
| | | | | | | | | | | | |
| | | Account value at the
beginning of the period ($) | | | Account value at the
end of the period ($) | | | Expenses paid
during the period ($)* | |
Actual Fund Return** | | | | | | | | | | | | |
Class 1 | | | 1,000.00 | | | | 1,253.11 | | | | 9.48 | |
Class 4 | | | 1,000.00 | | | | 1,242.02 | | | | 11.92 | |
Hypothetical 5% Return (2.5% for the period) | |
Class 1 | | | 1,000.00 | | | | 1,016.65 | | | | 8.49 | |
Class 4 | | | 1,000.00 | | | | 1,014.47 | | | | 10.71 | |
| * | | Expenses are equal to the Fund’s annualized expense ratio of 1.67% for Class 1 shares and 2.11% for Class 4 shares (for the period July 1, 2010 – December 31, 2010), multiplied by the average account value over the period, multiplied by 184/365 (to reflect six months period). |
| ** | | Actual Fund Returns for six-month period ended December 31, 2010 were as follows: 25.31% for Class 1 shares, and 24.20% for Class 4 shares. Past performance does not guarantee future results. |
4
| | |
| International Equity Fund | | (unaudited) |
Investment Profile
A mutual fund designed for investors who seek long-term growth of capital by investing at least 80% of its net assets under normal circumstances in common and preferred stocks and other types of equity securities primarily in developed and emerging market countries outside the United States. The Fund invests primarily (meaning at least 65%) in companies in both developed and emerging market countries outside the United States.
Morningstar Performance Comparison
Based on average annual returns for periods ended 12/31/10
| | | | | | | | | | | | | | | | |
| | | | | | One
Year | | | Five
Year | | | Ten
Year | |
Number of Funds in peer group: | | | | | | | 140 | | | | 113 | | | | 86 | |
Peer group average annual total return: | | | | | | | 8.98 | % | | | 2.24 | % | | | 2.60 | % |
Morningstar category in peer group: U.S. Insurance Foreign Large Blend. | | | | | | | | | | | | | | | | |
Sector Allocation
as a % of Fair Value of $15,382 (in thousands) on December 31, 2010 (b)(c)
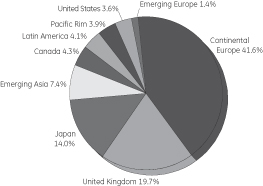
Top Ten Largest Holdings
as of December 31, 2010 (as a % of Fair Value) (b)(c)
| | | | |
Nestle S.A. | | | 2.87% | |
Siemens AG | | | 2.57% | |
HSBC Holdings PLC | | | 2.34% | |
BHP Billiton PLC | | | 2.26% | |
Potash Corporation of Saskatchewan Inc. | | | 2.20% | |
Rio Tinto PLC | | | 2.13% | |
Linde AG | | | 1.91% | |
BNP Paribas | | | 1.87% | |
Prudential PLC | | | 1.85% | |
Royal Dutch Shell PLC | | | 1.77% | |
Change in Value of a $10,000 Investment
Class 1 Shares
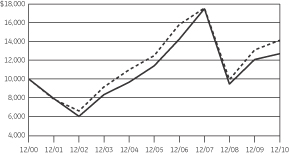
Average Annual Total Return
for the Periods Ended December 31, 2010
Class 1 Shares (Inception date: 5/1/95)
| | | | | | | | | | | | | | | | |
| | | One
Year | | | Five
Year | | | Ten
Year | | | Ending value of a
$10,000 investment (a) | |
International Equity fund | | | 4.85% | | | | 2.15% | | | | 2.38% | | | | 12,658 | |
MSCI EAFE Index | | | 7.75% | | | | 2.46% | | | | 3.48% | | | | 14,079 | |
Change in Value of a $10,000 Investment
Class 4 Shares

Average Annual Total Returns
for the Periods Ended December 31, 2010
Class 4 Shares (Inception date: 5/1/08)
| | | | | | | | | | | | | | | | |
| | | | | | One
Year | | | Since
Inception | | | Ending value of a
$10,000 investment (a) | |
International Equity fund | | | | | | | 4.33% | | | | -11.18% | | | | 7,285 | |
MSCI EAFE Index | | | | | | | 7.75% | | | | -6.45% | | | | 8,371 | |

| (a) | Ending value of a $10,000 investment for the ten-year period or since inception, whichever is less. |
| (b) | The securities information regarding holdings, allocations and other characteristics is presented to illustrate examples of securities that the Fund has bought and the diversity of areas in which the Fund may invest as of a particular date. It may not be representative of the Fund’s current or future investments and should not be construed as a recommendation to purchase or sell a particular security. |
| (c) | Fair value basis is inclusive of Short Term Investment in GE Money Market Fund. |
See Notes to Performance on page 1 for further information, including an explanation of Morningstar peer categories.
Past performance does not predict future performance and the graph and table do not reflect the deduction of taxes that a shareholder would pay on Fund distributions or the redemption of Fund shares and do not reflect the fees or charges that would be associated with variable contracts through which shares of the Fund are offered.
5
International Equity Fund
| | |
| Schedule of Investments | | December 31, 2010 |
International Equity Fund
| | | | | | | | | | |
| | | |
| | | Number
of Shares | | | Fair Value | | | |
| | | | | | | | | | |
Common Stock — 94.7% † | | | | | | | | | | |
| | | |
Australia — 2.2% | | | | | | | | | | |
| | | |
Brambles Ltd. | | | 13,532 | | | $ | 98,761 | | | |
Lynas Corporation Ltd. | | | 51,826 | | | | 109,436 | | | (a) |
Paladin Energy Ltd. | | | 26,119 | | | | 131,992 | | | (a) |
| | | | | | | 340,189 | | | |
| | | |
Brazil — 3.1% | | | | | | | | | | |
| | | |
Banco Santander Brasil S.A. | | | 12,100 | | | | 164,370 | | | |
Petroleo Brasileiro S.A. ADR | | | 4,878 | | | | 166,681 | | | (c) |
Vale S.A. ADR | | | 4,465 | | | | 134,932 | | | (a) |
| | | | | | | 465,983 | | | |
| | | |
Canada — 4.3% | | | | | | | | | | |
| | | |
Kinross Gold Corp. | | | 2,273 | | | | 43,257 | | | |
Potash Corporation of Saskatchewan Inc. | | | 2,174 | | | | 337,920 | | | |
Research In Motion Ltd. | | | 2,685 | | | | 156,914 | | | (a) |
Suncor Energy Inc. | | | 3,161 | | | | 121,776 | | | |
| | | | | | | 659,867 | | | |
| | | |
Chile — 0.3% | | | | | | | | | | |
| | | |
Sociedad Quimica y Minera de Chile S.A. ADR | | | 875 | | | | 51,117 | | | |
| | | |
China — 1.8% | | | | | | | | | | |
| | | |
Baidu Inc. ADR | | | 1,093 | | | | 105,507 | | | (a) |
Bank of China Ltd. | | | 136,998 | | | | 72,432 | | | |
CSR Corp Ltd. | | | 75,391 | | | | 99,116 | | | |
| | | | | | | 277,055 | | | |
| | | |
Denmark — 0.6% | | | | | | | | | | |
| | | |
AP Moller—Maersk A/S | | | 10 | | | | 90,930 | | | |
| | | |
France — 11.2% | | | | | | | | | | |
| | | |
AXA S.A. | | | 8,049 | | | | 134,437 | | | (c) |
BNP Paribas | | | 4,495 | | | | 287,101 | | | (c) |
Cap Gemini S.A. | | | 2,401 | | | | 112,512 | | | |
Cie Generale d’Optique Essilor International S.A. | | | 3,712 | | | | 239,904 | | | |
Credit Agricole S.A. | | | 4,641 | | | | 59,173 | | | |
European Aeronautic Defence and Space Company N.V. | | | 5,065 | | | | 118,504 | | | |
Safran S.A. | | | 3,677 | | | | 130,721 | | | |
Schneider Electric S.A. | | | 1,691 | | | | 254,079 | | | |
Total S.A. | | | 3,016 | | | | 160,429 | | | |
Veolia Environnement S.A. | | | 3,718 | | | | 109,085 | | | |
Vinci S.A. | | | 1,889 | | | | 103,091 | | | |
| | | | | | | 1,709,036 | | | |
| | | | | | | | | | |
| | | |
| | | Number
of Shares | | | Fair Value | | | |
| | | | | | | | | | |
| | | |
Germany — 11.5% | | | | | | | | | | |
| | | |
Adidas AG | | | 1,697 | | | $ | 111,304 | | | |
Bayer AG | | | 1,762 | | | | 130,719 | | | |
Daimler AG | | | 2,681 | | | | 182,460 | | | |
Deutsche Boerse AG | | | 2,856 | | | | 198,470 | | | |
Linde AG | | | 1,933 | | | | 294,460 | | | |
Metro AG | | | 3,029 | | | | 218,944 | | | |
SAP AG | | | 2,136 | | | | 109,178 | | | |
Siemens AG | | | 3,178 | | | | 395,222 | | | |
ThyssenKrupp AG | | | 2,597 | | | | 107,952 | | | |
| | | | | | | 1,748,709 | | | |
| | | |
Hong Kong — 1.7% | | | | | | | | | | |
| | | |
AIA Group Ltd. | | | 23,186 | | | | 65,171 | | | (a) |
Esprit Holdings Ltd. | | | 11,661 | | | | 55,352 | | | |
Hutchison Whampoa Ltd. | | | 13,468 | | | | 138,948 | | | |
| | | | | | | 259,471 | | | |
| | | |
India — 1.2% | | | | | | | | | | |
| | | |
Larsen & Toubro Ltd. | | | 3,175 | | | | 140,448 | | | |
Power Grid Corporation of India Ltd. | | | 20,496 | | | | 45,058 | | | |
| | | | | | | 185,506 | | | |
| | | |
Ireland — 0.6% | | | | | | | | | | |
| | | |
CRH PLC | | | 4,233 | | | | 88,873 | | | |
| | | |
Italy — 1.3% | | | | | | | | | | |
| | | |
ENI S.p.A. | | | 2,584 | | | | 56,644 | | | |
UniCredit S.p.A. | | | 67,575 | | | | 140,334 | | | |
| | | | | | | 196,978 | | | |
| | | |
Japan — 14.1% | | | | | | | | | | |
| | | |
Daikin Industries Ltd. | | | 3,000 | | | | 106,529 | | | |
FANUC Corp. | | | 800 | | | | 123,001 | | | |
Mitsubishi Corp. | | | 5,000 | | | | 135,503 | | | |
Mitsubishi Estate Company Ltd. (REIT) | | | 4,982 | | | | 92,508 | | | |
Mitsubishi UFJ Financial Group Inc. | | | 28,890 | | | | 156,374 | | | |
Nomura Holdings Inc. | | | 32,742 | | | | 207,905 | | | |
SMC Corp. | | | 700 | | | | 120,054 | | | |
Sony Financial Holdings Inc. | | | 45 | | | | 182,264 | | | |
Sumitomo Metal Industries Ltd. | | | 71,002 | | | | 175,087 | | | (c) |
Sumitomo Realty & Development Company Ltd. (REIT) | | | 3,000 | | | | 71,722 | | | |
Suzuki Motor Corp. | | | 11,000 | | | | 271,253 | | | |
Taiyo Nippon Sanso Corp. | | | 7,999 | | | | 70,714 | | | |
The Bank of Yokohama Ltd. | | | 21,130 | | | | 109,682 | | | |
Toyota Motor Corp. | | | 3,646 | | | | 144,752 | | | |
Unicharm Corp. | | | 4,700 | | | | 187,177 | | | |
| | | | | | | 2,154,525 | | | |
| | | |
Mexico — 0.8% | | | | | | | | | | |
| | | |
America Movil SAB de C.V. ADR | | | 2,104 | | | | 120,643 | | | |
See Notes to Schedule of Investments and Notes to Financial Statements.
6
International Equity Fund
| | |
| Schedule of Investments | | December 31, 2010 |
| | | | | | | | | | |
| | | |
| | | Number
of Shares | | | Fair Value | | | |
| | | | | | | | | | |
| | | |
Netherlands — 2.9% | | | | | | | | | | |
| | | |
Koninklijke Ahold N.V. | | | 6,416 | | | $ | 85,007 | | | |
Koninklijke Philips Electronics N.V. | | | 8,094 | | | | 248,877 | | | |
Unilever N.V., CVA | | | 3,389 | | | | 105,934 | | | |
| | | | | | | 439,818 | | | |
| | | |
Russian Federation — 0.5% | | | | | | | | | | |
| | | |
Mobile Telesystems OJSC ADR | | | 3,845 | | | | 80,245 | | | |
| | | |
South Africa — 0.9% | | | | | | | | | | |
| | | |
MTN Group Ltd. | | | 6,748 | | | | 137,107 | | | |
| | | |
South Korea — 1.6% | | | | | | | | | | |
| | | |
Samsung Electronics Company Ltd. | | | 150 | | | | 125,430 | | | |
Samsung Electronics Company Ltd. GDR | | | 261 | | | | 110,116 | | | |
| | | | | | | 235,546 | | | |
| | | |
Spain — 2.5% | | | | | | | | | | |
| | | |
Banco Santander S.A. | | | 22,457 | | | | 238,848 | | | (c) |
Telefonica S.A. | | | 6,359 | | | | 144,727 | | | |
| | | | | | | 383,575 | | | |
| | | |
Sweden — 0.8% | | | | | | | | | | |
| | | |
Telefonaktiebolaget LM Ericsson | | | 10,024 | | | | 116,524 | | | |
| | | |
Switzerland — 8.1% | | | | | | | | | | |
| | | |
Credit Suisse Group AG | | | 4,239 | | | | 171,315 | | | |
Nestle S.A. | | | 7,518 | | | | 441,595 | | | |
Novartis AG | | | 2,883 | | | | 169,961 | | | |
Roche Holding AG | | | 1,168 | | | | 171,673 | | | |
Syngenta AG | | | 682 | | | | 200,115 | | | |
Zurich Financial Services AG | | | 301 | | | | 78,213 | | | |
| | | | | | | 1,232,872 | | | |
| | | |
Taiwan — 2.8% | | | | | | | | | | |
| | | |
Delta Electronics Inc. | | | 29,000 | | | | 141,735 | | | |
Taiwan Semiconductor Manufacturing Company Ltd. | | | 108,634 | | | | 264,538 | | | |
Taiwan Semiconductor Manufacturing Company Ltd. ADR | | | 2,218 | | | | 27,814 | | | |
| | | | | | | 434,087 | | | |
| | | |
United Kingdom — 19.9% | | | | | | | | | | |
| | | |
Autonomy Corporation PLC | | | 3,816 | | | | 89,917 | | | (a) |
BG Group PLC | | | 9,863 | | | | 200,129 | | | |
BHP Billiton PLC | | | 8,720 | | | | 348,275 | | | (c) |
Diageo PLC | | | 3,463 | | | | 64,249 | | | |
| | | | | | | | | | |
| | | |
| | | Number
of Shares | | | Fair Value | | | |
| | | | | | | | | | |
| | | |
G4S PLC | | | 20,583 | | | $ | 82,047 | | | |
G4S PLC | | | 5,357 | | | | 21,988 | | | |
HSBC Holdings PLC | | | 35,272 | | | | 359,561 | | | |
Lloyds Banking Group PLC | | | 175,517 | | | | 180,543 | | | (a,c) |
National Grid PLC | | | 21,202 | | | | 183,568 | | | |
Prudential PLC | | | 27,224 | | | | 284,724 | | | (c) |
Reckitt Benckiser Group PLC | | | 3,679 | | | | 203,041 | | | |
Rio Tinto PLC | | | 4,657 | | | | 327,121 | | | |
Royal Dutch Shell PLC | | | 8,144 | | | | 272,673 | | | |
Tesco PLC | | | 29,121 | | | | 193,772 | | | |
The Capita Group PLC | | | 8,149 | | | | 88,863 | | | |
Vodafone Group PLC | | | 50,482 | | | | 131,044 | | | (c) |
| | | | | | | 3,031,515 | | | |
| | | |
Total Common Stock
(Cost $12,613,868) | | | | | | | 14,440,171 | | | |
Preferred Stock — 2.5% | | | | | | | | | | |
Fresenius SE | | | 1,537 | | | | 132,110 | | | |
Volkswagen AG | | | 1,577 | | | | 256,837 | | | |
| | | |
Total Preferred Stock
(Cost $277,348) | | | | | | | 388,947 | | | |
Other Investments — 0.1% | | | | | | | | | | |
GEI Investment Fund
(Cost $11,477) | | | | | | | 10,904 | | | (d) |
| | | |
Total Investments in Securities
(Cost $12,902,693) | | | | | | | 14,840,022 | | | |
Short-Term Investments — 3.6% | | | | | | | | | | |
GE Money Market Fund Institutional
Class 0.00%
(Cost $541,776) | | | | | | | 541,776 | | | (b,d) |
| | | |
Total Investments
(Cost $13,444,469) | | | | | | | 15,381,798 | | | |
| | | |
Liabilities in Excess of Other Assets, net — (0.9)% | | | | | | | (134,852 | ) | | |
| | | | | | | | | | |
| | | |
NET ASSETS — 100.0% | | | | | | $ | 15,246,946 | | | |
| | | | | | | | | | |
See Notes to Schedule of Investments and Notes to Financial Statements.
7
International Equity Fund
| | |
| Schedule of Investments | | December 31, 2010 |
Other Information
The Fund had the following long futures contracts open at December 31, 2010:
| | | | | | | | | | | | | | | | |
| Description | | Expiration
Date | | | Number
of
Contracts | | | Current
Notional
Value | | | Unrealized
Appreciation/
(Depreciation) | |
DJ Euro Stoxx 50 Index Futures | | | March 2011 | | | | 2 | | | $ | 74,966 | | | $ | (1,159 | ) |
FTSE 100 Index Futures | | | March 2011 | | | | 1 | | | | 92,264 | | | | 872 | |
Topix Index Futures | | | March 2011 | | | | 1 | | | | 110,474 | | | | 727 | |
| | | | | | | | | | | | | | | | |
| | | | | | | | | | | | | | $ | 440 | |
| | | | | | | | | | | | | | | | |
The Fund was invested in the following categories at December 31, 2010:
| | | | |
| Industry (unaudited) | | Percentage (based
on Fair Value) | |
Diversified Financial Services | | | 10.79 | % |
Integrated Oil & Gas | | | 6.36 | % |
Automobile Manufacturers | | | 5.56 | % |
Diversified Metals & Mining | | | 5.10 | % |
Industrial Conglomerates | | | 5.09 | % |
Fertilizers & Agricultural Chemicals | | | 3.83 | % |
Packaged Foods & Meats | | | 3.56 | % |
Life & Health Insurance | | | 3.46 | % |
Semiconductors | | | 3.43 | % |
Pharmaceuticals | | | 3.07 | % |
Wireless Telecommunication Services | | | 3.05 | % |
Steel | | | 2.72 | % |
Household Products | | | 2.54 | % |
Industrial Gases | | | 2.38 | % |
Multi-Utilities | | | 1.90 | % |
Food Retail | | | 1.81 | % |
Communications Equipment | | | 1.78 | % |
Electrical Components & Equipment | | | 1.65 | % |
Aerospace & Defense | | | 1.62 | % |
Construction & Engineering | | | 1.58 | % |
Industrial Machinery | | | 1.58 | % |
Healthcare Supplies | | | 1.56 | % |
Hypermarkets & Super Centers | | | 1.42 | % |
Multi-Line Insurance | | | 1.38 | % |
Investment Banking & Brokerage | | | 1.35 | % |
Application Software | | | 1.30 | % |
Specialized Finance | | | 1.29 | % |
Diversified Capital Markets | | | 1.11 | % |
Diversified Real Estate Activities | | | 1.07 | % |
Integrated Telecommunication Services | | | 0.94 | % |
Electronic Components | | | 0.92 | % |
Trading Companies & Distributors | | | 0.88 | % |
Coal & Consumable Fuels | | | 0.86 | % |
Healthcare Services | | | 0.86 | % |
IT Consulting & Other Services | | | 0.73 | % |
Apparel, Accessories & Luxury Goods | | | 0.72 | % |
| | | | |
| Industry | | Percentage (based
on Fair Value) | |
Regional Banks | | | 0.71 | % |
Building Products | | | 0.69 | % |
Internet Software & Services | | | 0.69 | % |
Security & Alarm Services | | | 0.68 | % |
Construction & Farm Machinery & Heavy Trucks | | | 0.65 | % |
Diversified Support Services | | | 0.64 | % |
Marine | | | 0.59 | % |
Construction Materials | | | 0.58 | % |
Human Resource & Employment Services | | | 0.58 | % |
Distillers & Vintners | | | 0.42 | % |
Apparel Retail | | | 0.36 | % |
Electric Utilities | | | 0.29 | % |
Gold | | | 0.28 | % |
| | | | |
| | | 96.41 | % |
| | | | |
| | | | |
| Short-Term and Other Investments | | | |
Short-Term | | | 3.52 | % |
Other Investments | | | 0.07 | % |
| | | | |
| | | 3.59 | % |
| | | | |
| | | 100.00 | % |
| | | | |
See Notes to Schedule of Investments and Notes to Financial Statements.
8
| | |
| Notes to Schedule of Investments | | December 31, 2010 |
The views expressed in this document reflect our judgment as of the publication date and are subject to change at any time without notice. The securities information regarding holdings, allocations and other characteristics are presented as of a particular date to illustrate examples of securities that the Fund has bought and the diversity of areas in which the Fund may invest as of a particular date. It may not be representative of the Fund’s current or future investments and should not be construed as a recommendation to purchase or sell a particular security. See the prospectus for complete descriptions of investment objective, policies, risks and permissible investments.
| (a) | Non-income producing security. |
| (b) | Coupon amount represents effective yield. |
| (c) | At December 31, 2010 , all or a portion of this security was pledged to cover collateral requirements for futures, options, forward foreign currency contracts and/or TBA’s. |
| (d) | GE Asset Management, the investment adviser of the Fund, also serves as investment adviser of the GEI Investment Fund and the GE Funds-GE Money Market Fund. |
| † | Percentages are based on net assets as of December 31, 2010 . |
Abbreviations:
| | |
ADR | | American Depository Receipt |
| |
GDR | | Global Depository Receipt |
| |
REIT | | Real Estate Investment Trust |
9
Financial Highlights
Selected data based on a share outstanding throughout the fiscal years indicated
| | | | | | | | | | | | | | | | | | | | | | | | | | | | | | | | | | | | |
| | | CLASS 1 | | | | | | CLASS 4 | |
| | | 12/31/10 | | | 12/31/09 | | | 12/31/08 | | | 12/31/07 | | | 12/31/06 | | | | | | 12/31/10 | | | 12/31/09 | | | 12/31/08 | |
| Inception date | | | — | | | | — | | | | — | | | | — | | | | 5/1/95 | | | | | | | | — | | | | — | | | | 5/1/08 | |
Net asset value, beginning of period | | $ | 0.49 | | | $ | 0.39 | | | $ | 14.67 | | | $ | 14.08 | | | $ | 11.42 | | | | | | | $ | 0.50 | | | | $0.40 | | | | $14.36 | |
Income/(loss) from investment operations: | | | | | | | | | | | | | | | | | | | | | | | | | | | | | | | | | | | | |
Net investment income (loss) | | | 0.00 | †** | | | 0.01 | | | | 0.51 | | | | 0.23 | | | | 0.15 | | | | | | | | 0.00 | †** | | | (0.01 | ) | | | 0.10 | ** |
Net realized and unrealized
gains/(losses) on investments | | | 0.02 | | | | 0.10 | | | | (7.04 | ) | | | 2.98 | | | | 2.67 | | | | | | | | 0.02 | | | | 0.12 | | | | (6.35 | ) |
Total income/(loss) from
investment operations | | | 0.02 | | | | 0.11 | | | | (6.53 | ) | | | 3.21 | | | | 2.82 | | | | | | | | 0.02 | | | | 0.11 | | | | (6.25 | ) |
Less distributions from: | | | | | | | | | | | | | | | | | | | | | | | | | | | | | | | | | | | | |
Net investment income | | | 0.00 | † | | | 0.01 | | | | 0.51 | | | | 0.23 | | | | 0.16 | | | | | | | | 0.00 | † | | | 0.01 | | | | 0.47 | |
Net realized gains | | | — | | | | 0.00 | | | | 7.24 | | | | 2.39 | | | | — | | | | | | | | — | | | | 0.00 | | | | 7.24 | |
Total distributions | | | 0.00 | † | | | 0.01 | | | | 7.75 | | | | 2.62 | | | | 0.16 | | | | | | | | 0.00 | † | | | 0.01 | | | | 7.71 | |
Net asset value, end of period | | $ | 0.51 | | | $ | 0.49 | | | $ | 0.39 | | | $ | 14.67 | | | $ | 14.08 | | | | | | | $ | 0.52 | | | | $0.50 | | | | $0.40 | |
TOTAL RETURN (a) | | | 4.85 | % | | | 27.68 | % | | | (45.83 | )% | | | 22.98 | % | | | 24.69 | % | | | | | | | 4.33 | % | | | 26.47 | % | | | (44.79 | )% |
| | | | | | | | | |
RATIOS/SUPPLEMENTAL DATA: | | | | | | | | | | | | | | | | | | | | | | | | | | | | | | | | | | | | |
Net assets, end of period (in thousands) | | $ | 15,240 | | | $ | 18,307 | | | $ | 17,920 | | | $ | 84,272 | | | $ | 80,648 | | | | | | | $ | 7 | | | | $7 | | | | $6 | |
Ratios to average net assets: | | | | | | | | | | | | | | | | | | | | | | | | | | | | | | | | | | | | |
Net investment income | | | 0.75 | % | | | 1.28 | % | | | 2.57 | % | | | 1.30 | % | | | 1.16 | % | | | | | | | 0.25 | % | | | 0.77 | % | | | 1.63 | % |
Net expenses | | | 1.67 | %(b,c) | | | 1.68 | %(b,c) | | | 1.18 | %(b,c) | | | 1.13 | % | | | 1.13 | % | | | | | | | 2.11 | %(b,c) | | | 2.13 | %(b,c) | | | 1.56 | %(b,c)* |
Gross expenses | | | 1.91 | % | | | 1.88 | % | | | 1.29 | % | | | 1.13 | % | | | 1.13 | % | | | | | | | 2.35 | % | | | 2.33 | % | | | 1.74 | %* |
Portfolio turnover rate | | | 41 | % | | | 46 | % | | | 41 | % | | | 32 | % | | | 34 | % | | | | | | | 41 | % | | | 46 | % | | | 41 | % |
Notes to Financial Highlights
| (a) | Total returns are historical and assume changes in share price, reinvestment of dividends and capital gains distributions and do not include the effect of insurance contract charges. Past performance does not guarantee future results. |
| (b) | Reflects GE Asset Management’s waiver of a portion of the Fund’s management fee in an amount equal to the management fee earned by GEAM with respect to the Fund’s investment in the GE Funds – GE Money Market Fund. |
| (c) | Reflects GE Asset Management’s contractual arrangement with GE Investments Funds, Inc. to limit the Fund’s management fee to 0.80% of the average daily net assets of the Fund until April 30, 2011. |
| * | Annualized for periods less than one year. |
| ** | Per share values have been calculated using the average share method. |
| † | Less than 0.005 per share. |
The accompanying Notes are an integral part of these financial statements.
10
| | | | |
Statement of Assets and Liabilities December 31, 2010 | | | |
| |
ASSETS | | | | |
Investments in securities, at Fair Value (cost $12,891,216) | | | $14,829,118 | |
Investments in affiliated securities, at Fair Value (cost $11,477) | | | 10,904 | |
Short-term affiliated investments (at amortized cost) | | | 541,776 | |
Foreign cash (cost $4,093) | | | 4,153 | |
Income receivables | | | 41,536 | |
Receivable for fund shares sold | | | 122 | |
Variation margin receivable | | | 38 | |
Other assets | | | 73,582 | |
TOTAL ASSETS | | | 15,501,229 | |
| |
LIABILITIES | | | | |
Payable for fund shares redeemed | | | 40,319 | |
Payable to GEAM | | | 17,679 | |
Accrued other expenses | | | 191,931 | |
Variation margin payable | | | 4,354 | |
TOTAL LIABILITIES | | | 254,283 | |
NET ASSETS | | | $15,246,946 | |
| |
NET ASSETS CONSIST OF : | | | | |
Capital paid in | | | 22,067,084 | |
Undistributed (distribution in excess of) net investment income | | | 694 | |
Accumulated net realized gain (loss) | | | (8,763,489 | ) |
Net unrealized appreciation/(depreciation) on: | | | | |
Investments | | | 1,937,329 | |
Futures | | | 440 | |
Foreign currency related transactions | | | 4,888 | |
NET ASSETS | | | $15,246,946 | |
| |
Class 1: | | | | |
| |
NET ASSETS | | | 15,239,656 | |
Shares outstanding ($0.01 par value; unlimited shares authorized) | | | 30,018,481 | |
Net asset value per share | | | $0.51 | |
| |
Class 4: | | | | |
| |
NET ASSETS | | | 7,290 | |
Shares outstanding ($0.01 par value; unlimited shares authorized) | | | 14,009 | |
Net asset value per share | | | $0.52 | |
The accompanying Notes are an integral part of these financial statements.
11
| | | | |
Statement of Operations
For the year ended December 31, 2010 | | | |
| |
INVESTMENT INCOME | | | | |
Income: | | | | |
Dividends | | $ | 423,295 | |
Interest | | | 2,112 | |
Interest from affiliated investments | | | 84 | |
Less: Foreign taxes withheld | | | (43,026 | ) |
Total Income | | | 382,465 | |
| |
Expenses: | | | | |
Advisory and administrative fees | | | 159,019 | |
Transfer agent fees | | | 18,036 | |
Directors’ fees | | | 628 | |
Custody and accounting expenses | | | 87,281 | |
Professional fees | | | 19,457 | |
Other expenses | | | 18,012 | |
Total expenses before waiver and reimbursement | | | 302,433 | |
Less: Expenses Waived or borne by the adviser | | | (1,018 | ) |
Less: Expenses reimbursed by the adviser | | | (37,181 | ) |
Net expenses | | | 264,234 | |
Net investment income (loss) | | | 118,231 | |
| |
NET REALIZED AND UNREALIZED GAIN (LOSS)
ON INVESTMENTS | | | | |
| |
Realized gain (loss) on: | | | | |
Investments | | | (1,101,668 | ) |
Futures | | | (20,908 | ) |
Foreign currency transactions | | | (12,792 | ) |
| |
Increase (decrease) in unrealized appreciation/ (depreciation) on: | | | | |
Investments | | | 1,516,937 | |
Futures | | | 773 | |
Foreign currency transactions | | | 846 | |
Net realized and unrealized gain (loss) on investments | | | 383,188 | |
Net increase (decrease) in net assets resulting from operations | | $ | 501,419 | |
The accompanying Notes are an integral part of these financial statements.
12
| | | | | | | | |
Statements of
Changes in Net Assets | | | |
| | | Year Ended
December 31,
2010 | | | Year Ended
December 31,
2009 | |
| | |
INCREASE (DECREASE) IN NET ASSETS | | | | | | | | |
Operations: | | | | | | | | |
Net investments income | | $ | 118,231 | | | $ | 219,728 | |
Net realized gain (loss) on investments, futures and foreign currency transactions | | | (1,135,368 | ) | | | (4,777,508 | ) |
Net increase (decrease) in unrealized appreciation / (depreciation) on investments, futures
and foreign currency transaction | | | 1,518,556 | | | | 8,526,741 | |
Net increase (decrease) from operations | | | 501,419 | | | | 3,968,961 | |
Distributions to shareholders from : | | | | | | | | |
Net investment income | | | | | | | | |
Class 1 | | | (112,991 | ) | | | (293,918 | ) |
Class 4 | | | (23 | ) | | | (83 | ) |
Total distributions | | | (113,014 | ) | | | (294,001 | ) |
Increase (decrease) in net assets from operations and distributions | | | 388,405 | | | | 3,674,960 | |
Share transactions : | | | | | | | | |
Proceeds from sale of shares | | | | | | | | |
Class 1 | | | 195,676 | | | | 779,958 | |
Class 4 | | | — | | | | — | |
Value of distributions reinvested | | | | | | | | |
Class 1 | | | 112,991 | | | | 293,918 | |
Class 4 | | | 23 | | | | 83 | |
Cost of shares redeemed | | | | | | | | |
Class 1 | | | (3,764,231 | ) | | | (4,360,018 | ) |
Class 4 | | | — | | | | — | |
Net increase (decrease) from share transactions | | | (3,455,541 | ) | | | (3,286,059 | ) |
Total increase (decrease) in net assets | | | (3,067,136 | ) | | | 388,901 | |
| | |
NET ASSETS | | | | | | | | |
Beginning of period | | | 18,314,082 | | | | 17,925,181 | |
End of period | | $ | 15,246,946 | | | $ | 18,314,082 | |
Undistributed (distribution in excess of) net investment income, end of period | | $ | 694 | | | $ | (18,387 | ) |
| | |
CHANGES IN FUND SHARES | | | | | | | | |
| | |
Class 1 | | | | | | | | |
Shares sold | | | 422,267 | | | | 1,756,212 | |
Issued for distributions reinvested | | | 221,551 | | | | 599,686 | |
Shares redeemed | | | (8,009,103 | ) | | | (10,393,580 | ) |
Net increase (decrease) in fund shares | | | (7,365,285 | ) | | | (8,037,682 | ) |
| | |
Class 4 | | | | | | | | |
Shares sold | | | — | | | | — | |
Issued for distributions reinvested | | | 44 | | | | 163 | |
Shares redeemed | | | — | | | | — | |
Net increase (decrease) in fund shares | | | 44 | | | | 163 | |
The accompanying Notes are an integral part of these financial statements.
13
| | |
| Notes to Financial Statements | | December 31, 2010 |
| 1. Organization | of the Company |
GE Investments Funds, Inc. (the “Company”) was incorporated under the laws of the Commonwealth of Virginia on May 14, 1984 and is registered under the Investment Company Act of 1940, as amended (the “1940 Act”), as an open-end management investment company. The Company is composed of fourteen investment portfolios (collectively the “Funds”), although only the following eleven are currently being offered: U.S. Equity Fund, S&P 500 Index Fund, Premier Growth Equity Fund, Core Value Equity Fund, Mid-Cap Equity Fund, Small-Cap Equity Fund, International Equity Fund (the “Fund”), Total Return Fund, Income Fund, Money Market Fund and Real Estate Securities Fund.
Shares of the Funds of the Company are offered only to insurance company separate accounts that fund certain variable life insurance contracts and variable annuity contracts. GE Asset Management Incorporated (“GEAM”) is the investment adviser and administrator of each of the Funds.
The Company offers two share classes (Class 1 and Class 4) of the Fund. Class 4 shares were first offered on May 1, 2008, and Fund shares outstanding prior to May 1, 2008 were designated as Class 1 shares. Each share class has different fees and expenses, and as a result, each share class will have different share price and performance. Not all variable contracts offer both share class of the Fund.
| 2. Summary | of Significant Accounting Policies |
The preparation of financial statements in conformity with U.S. generally accepted accounting principles (GAAP) requires management to make estimates and assumptions that affect the reported amounts of assets and liabilities and disclosure of contingent assets and liabilities at the date of the financial statements and the reported amounts of increases and decreases in net assets from operations during the reporting period. Actual results may differ from those estimates.
Subsequent events after the balance sheet date through the date the financial statements were issued, have been evaluated in the preparation of the financial statements. There are no items to report.
The following summarizes the significant accounting policies of the Company.
Securities Valuation and Transactions. All investments in securities are recorded at their estimated fair value, as described in Note 3.
Securities transactions are accounted for as of the trade date. Realized gains and losses on investments sold are recorded on the basis of identified cost for both financial statement and federal tax purposes.
The Fund’s income, expenses (other than distribution fees) and realized and unrealized gains and losses are allocated proportionally each day among the share classes based upon the relative net assets of each class.
Foreign Currency Accounting records of the Fund are maintained in U.S. dollars. Investment securities and other assets and liabilities denominated in a foreign currency are translated to U.S. dollars at the prevailing rates of exchange at period end. Purchases and sales of securities, income receipts and expense payments denominated in foreign currencies are translated into U.S. dollars at the prevailing exchange rate on the respective dates of such transactions.
All assets and liabilities of the Fund initially expressed in foreign currency values will be converted into U.S. dollars at the WM/Reuter exchange rate computed at 11:00 a.m., Eastern time.
The Fund does not isolate the portion of the results of operations resulting from changes in foreign exchange rates from the fluctuations arising from changes in the market prices of securities during the year. Such fluctuations are included in the net realized or unrealized gain or loss from investments. Net realized gains or losses on foreign currency transactions represent net gains or losses on sales and maturities of foreign currency contracts, disposition of foreign currencies, the difference between the amount of net investment income and withholding taxes accrued and the U.S. dollar amount actually received or paid, and gains or losses between the trade and settlement date on purchases and sales of foreign securities. Net unrealized foreign exchange gains and losses arising from changes in the value of other assets and liabilities (including foreign currencies and open foreign currency contracts) as a result of changes in foreign exchange rates are included as increases or decreases in unrealized appreciation/depreciation on foreign currency related transactions.
Futures Contracts A futures contract represents a commitment for the future purchase or sale of an asset at a specified price on a specified date. The Fund invests in stock index futures contracts to manage its exposure to the stock
14
| | |
| Notes to Financial Statements | | December 31, 2010 |
markets and fluctuations in currency values. Buying futures tends to increase a Fund’s exposure to the underlying instrument while selling futures tends to decrease a Fund’s exposure to the underlying instrument or to hedge other Fund investments. With futures contracts, there is minimal counterparty credit risk to the Fund since futures contracts are exchange traded and the exchange’s clearinghouse, as counterparty to all traded futures, guarantees the futures against default. A Fund’s risks in using these contracts include changes in the value of the underlying instruments, non- performance of the counterparties under the contracts’ terms and changes in the liquidity of the secondary market for the contracts. Futures contracts are valued at the settlement price established each day by the board of trade or exchange on which they principally trade.
Upon entering into a financial futures contract, the Fund is required to pledge to the broker an amount of cash and/or other assets equal to a certain percentage of the contract amount, known as initial margin deposit. Subsequent payments, known as variation margin, are made or received by the Fund each day, depending on the daily fluctuation in the fair value of the underlying security. The Fund records an unrealized gain or loss equal to the daily variation margin. Should market conditions move unexpectedly, the Fund may not achieve the anticipated benefits of the futures contracts and may incur a loss. The Fund recognizes a realized gain or loss on the expiration or closing of a futures contract.
Forward Foreign Currency Exchange Contracts The Fund enters into forward foreign currency exchange contracts to facilitate transactions in foreign denominated securities and to manage the Funds’ currency exposure. Forward foreign currency exchange contracts are valued at the mean between the bid and the offered forward rates as last quoted by a recognized dealer. The aggregate principal amounts of the contracts are not recorded in the Funds’ financial statements. Such amounts appear under the caption Forward Foreign Currency Contracts in the Schedule of Investments. Fluctuations in the value of the contracts are recorded in the Statement of Assets and Liabilities as an asset (or liability) and in the Statement of Operations as unrealized appreciation (depreciation) until the contracts are closed, when they are recorded as realized gains or losses on foreign currency related transactions. The Funds’ risks in using these contracts include changes in the value of foreign currency or the possibility that the counterparties do not perform under the contracts’ terms. When a Fund enters into a forward foreign currency exchange contract, it is required to segregate
cash or liquid securities with its custodian in an amount equal to the value of the Fund’s total assets committed to the consummation of the forward contract. If the value of the segregated securities declines, additional cash or securities are segregated so that the value of the account will equal the amount of the Fund’s commitment with respect to the contract.
Investments in Foreign Markets Investments in foreign markets involve special risks and considerations not typically associated with investing in the United States. These risks include revaluation of currencies, high rates of inflation, restrictions on repatriation of income and capital, and adverse political and economic developments. Moreover, securities issued in these markets may be less liquid, subject to government ownership controls, tariffs and taxes, subject to delays in settlements, and their prices may be more volatile.
The Fund may be subject to capital gains and repatriation taxes imposed by certain countries in which they invest. Such taxes are generally based upon income and/or capital gains earned or repatriated. Taxes are accrued based on net investment income, net realized gains and net unrealized appreciation as income and/or capital gains are earned.
Investment Income Corporate actions (including cash dividends) are recorded on the ex-dividend date, net of applicable withholding taxes, except for certain foreign corporate actions which are recorded as soon after the ex-dividend date as such information becomes available. Interest income is recorded on the accrual basis.
Accretion of discounts and amortization of premiums on taxable bonds are to the call or maturity date, whichever is shorter, using the effective yield method. Withholding taxes in foreign dividends have been provided for in accordance with the Fund’s understanding of the applicable country’s tax rules and rates.
Expenses Fund specific expenses are allocated to the Fund that incurs such expense and pro rata across share classes. Expenses, other than those incurred by a specific Fund, are allocated pro rata among Funds and share classes. Such expenses may include custodial fees, legal and accounting fees, printing costs and registration fees. All expenses of the Fund are paid by GEAM and reimbursed by the Fund.
Certain class specific expenses (Such as transfer agency fees or distribution fees) are allocated to the class that incurs such expense.
15
| | |
| Notes to Financial Statements | | December 31, 2010 |
Federal Income Taxes The Funds intend to comply with all sections of the Internal Revenue Code applicable to regulated investment companies including the distribution of substantially all its taxable net investment income and net realized capital gains to its shareholders. Therefore, no provision for federal income tax has been made. Each Fund is treated as a separate taxpayer for federal income tax purposes.
The Funds utilize various methods to measure the fair value of most of its investments on a recurring basis. GAAP establishes a framework for measuring fair value and providing related disclosures. Broadly, the framework requires fair value to be determined based on the exchange price that would be received for an asset or paid to transfer a liability (an exit price) in the principal or most advantageous market for the asset or liability in an orderly transaction between market participants at the measurement date. In the absence of active markets for the identical assets or liabilities, such measurements involve developing assumptions based on market observable data and, in the absence of such data, internal information that is consistent with what market participants would use in a hypothetical transaction that occurs at the measurement date. It also establishes a three-level valuation hierarchy based upon observable and non-observable inputs.
Observable inputs reflect market data obtained from independent sources, while unobservable inputs reflect our market assumptions. Preference is given to observable inputs. These two types of inputs create the following fair value hierarchy:
Level 1 — Quoted prices for identical investments in active markets.
Level 2 — Quoted prices for similar investments in active markets; quoted prices for identical or similar investments in markets that are not active; and model-derived valuations whose inputs are observable or whose significant value drivers are observable.
Level 3 — Significant inputs to the valuation model are unobservable.
Policies and procedures are maintained to value investments using the best and most relevant data available. In addition, pricing vendors are utilized to assist in valuing investments. GEAM performs periodic reviews of the methodologies used by independent pricing services including price validation of individual securities.
Fair Value Measurement The following section describes the valuation methodologies the Fund uses to measure different financial investments at fair value.
A Fund’s portfolio securities are valued generally on the basis of market quotations. Equity securities generally are valued at the last reported sale price on the primary market in which they are traded. Portfolio securities listed on NASDAQ are valued using the NASDAQ Official Closing Price. Level 1 securities primarily include publicly-traded equity securities which may not necessarily represent the last sale price. If no sales occurred on the exchange or NASDAQ that day, the portfolio security generally is valued using the last reported bid price. In those circumstances the Fund classifies the investment securities in Level 2.
The Fund uses non-binding broker quotes as the primary basis for valuation when there is limited, or no, relevant market activity for a specific investment or for other investments that share similar characteristics. The Fund’s have not adjusted the prices obtained. Investment securities priced using non-binding broker quotes are included in Level 3. As is the case with the primary pricing vendor, third-party brokers do not provide access to their proprietary valuation models, inputs and assumptions. Accordingly, GEAM conducts internal reviews of pricing for all such investment securities periodically to ensure reasonableness of valuations used in the Fund’s financial statements. These reviews are designed to identify prices that appear stale, those that have changed significantly from prior valuations, and other anomalies that may indicate that a price may not be accurate. Based on the information available, GEAM believes that the fair values provided by the brokers are representative of prices that would be received to sell the assets at the measurement date (exit prices).
A Fund’s written or purchased options are valued at the last sales price, or if no sales occurred that day, at the last reported bid price and those are also included in Level 2.
If prices are not readily available for a portfolio security, or if it is believed that a price for a portfolio security does not represent its fair value, the security may be valued using procedures approved by the Fund’s Board of Directors that are designed to establish its “fair” value. These securities would be classified in Level 3. Those procedures require that the fair value of a security be established by the valuation committee. The valuation committee follows different protocols for different types of investments and circumstances. The fair value procedures may be used to value any investment of any Fund in the appropriate circumstances.
16
| | |
| Notes to Financial Statements | | December 31, 2010 |
Foreign securities may be valued with the assistance of an independent fair value pricing service in circumstances where it is believed that they have been or would be materially affected by events occurring after the close of the portfolio security’s primary market and before the close of regular trading on the NYSE. In these circumstances the Fund classifies the investment securities in Level 2. This independent fair value pricing service uses a model to identify affected securities and portfolios taking into consideration various factors and the fair value of such securities may be something other than the last available quotation or other market price.
Portfolio securities may be valued using techniques other than market quotations, under the circumstances described above. The value established for a portfolio security may be different than what would be produced through the use of another methodology or if it had been priced using market quotations. Portfolio securities that are valued using techniques other than market quotations, including “fair valued” securities, may be subject to greater fluctuation in their value from one day to the next than would be the case if market quotations were used. In addition, there is no assurance that the Fund could sell a portfolio security for the value established for it at any time and it is possible that the
Fund would incur a loss because a portfolio security is sold at a discount to its established value.
Other financial investments are derivative instruments that are not reflected in Total Investments, such as futures, forwards, swaps, and written options contracts, which are valued based on fair value as discussed above.
The Fund uses closing prices for derivatives included in Level 1, which are traded either on exchanges or liquid over-the counter markets. Derivative assets and liabilities included in Level 2 primarily represent interest rate swaps, cross-currency swaps and foreign currency and commodity forward and option contracts. Derivative assets and liabilities included in Level 3 primarily represent interest rate products that contain embedded optionality or prepayment features.
The inputs or methodology used for valuing securities are not an indication of the risk associated with investing in those securities. Fair value determinations are required for securities whose value is affected by a significant event that will materially affect the value of a domestic or foreign security and which occurs subsequent to the time of the close of the principal market on which such domestic or foreign security trades but prior to the calculation of the Fund’s NAV.
The following table presents the Fund’s investments measured at fair value on a recurring basis at December 31, 2010:
| | | | | | | | | | | | | | | | |
Investments | | Level 1 | | | Level 2 | | | Level 3 | | | Total | |
Investments in Securities† | | | | | | | | | | | | | | | | |
Common Stock | | $ | 14,440,171 | | | $ | — | | | $ | — | | | $ | 14,440,171 | |
Preferred Stock | | | 388,947 | | | | — | | | | — | | | | 388,947 | |
Other Investments | | | — | | | | 10,904 | | | | — | | | | 10,904 | |
Short-Term Investments | | | 541,776 | | | | — | | | | — | | | | 541,776 | |
Total Investments in Securities | | $ | 15,370,894 | | | $ | 10,904 | | | $ | — | | | $ | 15,381,798 | |
Other Financial Instruments | | | | | | | | | | | | | | | | |
Futures Contracts — Unrealized Appreciation | | $ | 1,599 | | | | | | | | | | | $ | 1,599 | |
Futures Contracts — Unrealized Depreciation | | | (1,159 | ) | | | — | | | | — | | | | (1,159 | ) |
Total Other Financial Instruments | | $ | 440 | | | $ | — | | | $ | — | | | $ | 440 | |
| † | See Schedule of Investments for Industry Classification. |
| * | Other financial instruments include derivative instruments such as futures, forward foreign currency exchange contracts, swap contacts and option contacts. Amounts shown represent unrealized appreciation (depreciation), or in the case of options, market value at period end. |
4. Derivatives Transactions
Shown below are the derivative contracts entered into by the Fund, summarized by primary risk exposure as they
appear on the Statement of Assets and Liabilities, all of which are not accounted for as hedging instruments under FASB Accounting Standards Codification (“ASC”) No. 815 Derivatives and Hedging as of December 31, 2010.
| | | | | | | | | | | | |
| | | Asset Derivatives | | | Liability Derivatives | |
| | | Location | | Fair Value ($) | | | Location | | Fair Value ($) | |
| | | | | | | | | | |
| Equity Contracts | | Assets, Net Assets — Unrealized Appreciation/ (Depreciation) on Futures | | | 1,599 | * | | Liabilities, Net Assets — Unrealized Appreciation/(Depreciation) on Futures | | | (1,159 | )* |
17
| | |
| Notes to Financial Statements | | December 31 , 2010 |
Shown below are the effects of derivative instruments on the Fund’s Statements of Operations, summarized by primary risk exposure all of which are not accounted for as hedging instruments under ASC 815.
| | | | | | | | | | | | | | |
| | | Location | | Notional Amount of
Futures Contracts
Purchased/(Sold) $ | | | Realized Gain
or (Loss) $ | | | Change in Unrealized
Appreciation/(Depreciation) $ | |
| | | | | | | | | | | | | | |
Equity Contracts | | Net realized gain/(loss) on futures, Increase/(decrease) in unrealized appreciation/ (depreciation) on futures | |
| 4,319,117/
(3,801,710 |
) | | | (20,908 | ) | | | 773 | |
| * | Includes cumulative appreciation/depreciation of futures contracts as reported in the Schedule of Investments and Net Assets section of the Statement of Assets and Liabilities. Only the current day’s variation margin is reported within the Assets & Liabilities sections of the Statement of Assets and Liabilities. |
The Company shares a revolving credit facility of up to $150 million with a number of its affiliates. The credit facility is with its custodian bank, State Street Bank and Trust Company (“State Street”). The revolving credit facility requires the payment of a commitment fee equal to 0.125% per annum on the daily unused portion of the credit facility, payable quarterly. The portion borne by the Funds generally is borne proportionally based upon net assets. In addition, the Company has a $100 million uncommitted, unsecured line of credit with State Street. Generally, borrowings under the credit facilities would accrue interest at the Federal Funds Rate plus 50 basis points and would be borne by the borrowing Fund. The maximum amount allowed to be borrowed by any one Fund is the lesser of (i) 10% of its total assets, or (ii) 20% of its net assets. The credit facilities were not utilized by the Fund during the fiscal year ended December 31, 2010.
| 6. | Fees and Compensation Paid to Affiliates |
GEAM, a registered investment adviser, was retained by the Company’s Board of Directors effective May 1, 1997 to act as investment adviser and administrator of the Fund. Compensation of GEAM for investment advisory and administrative services is paid monthly based on the average daily net assets of the Fund. The advisory and administrative fee is stated in the following schedule:
| | |
| Annualized based on average daily net assets |
Average Daily
Net Assets of Fund | | Advisory and
Administration Fees |
| First $100 million | | 1.00% |
| Next $100 million | | 0.95% |
| Over $200 million | | 0.90% |
GEAM has entered into a contractual arrangement with the Company to limit the management fee charged to the Fund to 0.80% of the average daily net assets of the Fund (the
“Management Fee Waiver Agreement”). Unless terminated or amended, the Management Fee Waiver Agreement will continue until April 30, 2011. The fee waiver will terminate automatically if the management agreement terminates. The Management Fee Limitation Agreement can only be changed or terminated with the approval of the Company’s Board of Directors.
GEAM waives a portion of the Fund’s management fee in the amount equal to the management fee earned by GEAM with respect to the Fund’s Investment in the GE Funds — GE Money Market Fund.
Distribution and Service (12b-1) Fees The Company has adopted a Distribution and Service (12b-1) Plan (the “Plan”) pursuant to Rule 12b-1 under the 1940 Act with respect to Class 4 shares of the Fund. Under the Plan, the Fund may compensate GE Investment Distributors, Inc. (“GEID”), a wholly-owned subsidiary of GEAM and the Fund’s principal distributor, for certain sales services provided by GEID or other broker dealers and investor services provided by GEID or other service providers relating to the Fund’s Class 4 shares, including services to owners or prospective owners of variable contracts issued by insurance companies that offer such share class as an investment option. The amount of compensation paid under the Plan by the Fund’s Class 4 shares may not exceed 0.45% of the average daily net assets of the Fund attributable to such share class. The Plan continues in effect from year to year for so long as such continuance is approved annually by the Board of Directors, including by those directors who are not interested persons of the Company and who have no direct or indirect financial interest in the operation of the Plan or in any agreement related to it.
Directors’ Compensation The Fund pays no compensation to its directors who are officers or employees of GEAM or its affiliates. Directors who are not such officers or employees also serve in a similar capacity for other funds advised by GEAM. Compensation paid to unaffiliated directors are
18
| | |
| Notes to Financial Statements | | December 31, 2010 |
reflected on the Statement of Operations. These fees are allocated pro rata across all of the mutual fund platforms and share classes served by the directors, including the Fund, and are based upon the relative net assets of each fund within such platforms.
| 7. | Investment Transactions |
Purchases and Sales of Securities The cost of purchases and the proceeds from sales of investments, other than short-term securities and options, for the year ended December 31, 2010 were as follows:
| | |
| Non U.S. Government Securities |
| Purchases | | Sales |
$6,358,210 | | $10,139,390 |
The Fund is subject to ASC 740, Income Taxes. ASC 740 provides guidance for financial accounting and reporting for the effects of income taxes that result from an entity’s activities during the year. ASC 740 also provides guidance regarding how certain uncertain tax positions should be recognized, measured, presented and disclosed in the financial statements. ASC 740 requires evaluation of tax positions taken or expected to be taken in the course of preparing the Fund’s tax returns to determine whether the tax positions are “more likely than not” of being sustained by the applicable tax authority. There are no adjustments to the Fund’s net assets required under ASC 740. The Fund’s 2007, 2008, 2009 and 2010 fiscal years tax returns are still open to examination by the Federal and applicable state tax authorities.
At December 31, 2010, information on the tax cost of investments is as follows:
| | | | | | | | | | | | | | |
Cost For
Tax Purposes | | Gross Tax
Unrealized
Apprec. | | Gross Tax
Unrealized
Deprec. | | Net Tax
Apprec/
(Deprec) | | Net Tax
Apprec/(Deprec)
on Derivatives,
Currency Assets | | Undistributed Income | | Undistributed
CG/(Accum.
Capital Loss) | | Post
October
Losses
(see Detail Below) |
| $15,431,024 | | $2,304,654 | | $(2,353,880) | | $(49,226) | | $4,456 | | $1,550 | | $(6,776,918) | | $— |
As of December 31, 2010, the Fund has capital loss carryovers as indicated below. Capital loss carryovers are available to offset future realized capital gains to the extent provided in the Internal Revenue Code and regulations thereunder. To the extent that these carryover losses are used to offset future capital gains, it is probable that the gains so offset will not be distributed to shareholders because they would be taxable as ordinary income.
As of December 31, 2010, the Fund has capital loss carryovers as follows:
| | |
| Amount | | Expires |
| $5,547,226 | | 12/31/2017 |
| 1,229,692 | | 12/31/2018 |
These amounts will be available to offset future taxable capital gains. Under the recently enacted Regulated Investment Company Modernization Act of 2010, the Fund will be permitted to carry forward capital losses incurred in taxable years beginning after December 22, 2010 for an unlimited period. However, any losses incurred during those future years will be required to be utilized prior to the losses incurred in pre-enactment tax years. As a result of this ordering rule, pre-enactment capital loss carryforwards may be more likely to expire unused. Additionally, post-
enactment capital losses that are carried forward will retain their character as either short-term or long-term capital losses rather than being considered all short-term as under previous law.
Any net capital and currency losses incurred after October 31, within the Fund’s tax year, are deemed to arise on the first day of the Fund’s next tax year if the Fund so elects to defer such losses.
The Fund did not defer any post-October losses for the year ended December 31, 2010.
The tax composition of distributions paid during the years ended December 31, 2010 and December 31, 2009 were as follows:
| | | | | | | | | | | | |
| | | Ordinary
Income | | | Long-Term
Capital
Gains | | | Total | |
2010 | | $ | 113,014 | | | $ | — | | | $ | 113,014 | |
2009 | | | 294,001 | | | | — | | | | 294,001 | |
Distributions to Shareholders The Fund declares and pays any dividends from net investment income annually. The Fund declares and pays any net realized capital gains in
19
| | |
| Notes to Financial Statements | | December 31, 2010 |
excess of capital loss carryforwards distributions annually. The character of income and gains to be distributed is determined in accordance with income tax regulations which may differ from generally accepted accounting principles. These differences include (but are not limited to) futures, treatment of realized gains and losses on foreign currency contracts, investments organized as partnerships for tax purposes, and losses deferred due to wash sale transactions. Reclassifications due to permanent book/tax differences are made to the Fund’s capital accounts to reflect income and gains available for distribution (or available capital loss carryovers) under income tax regulations. These
reclassifications have no impact on net investment income, realized gains or losses, or the net asset value of the Fund. The calculation of net investment income per share in the Financial Highlights table excludes these adjustments.
The reclassifications for the year ended December 31, 2010 were as follows:
| | | | |
Undistributed
Net Investment
Income | | Accumulated
Net Realized (Loss) | | Paid In Capital |
| $13,864 | | $(20,317) | | $6,453 |
20
Report of Independent Registered Public Accounting Firm
The Shareholders and Board of Directors
GE Investments Funds, Inc.
We have audited the accompanying statement of assets and liabilities, including the schedule of investments, of the International Equity Fund, a series of GE Investments Funds, Inc., as of December 31, 2010, and the related statement of operations for the year then ended, statements of changes in net assets for each of the years in the two-year period then ended, and the financial highlights for each of the years in the five-year period then ended. These financial statements and financial highlights are the responsibility of the Fund’s management. Our responsibility is to express an opinion on these financial statements and financial highlights based on our audits.
We conducted our audits in accordance with the standards of the Public Company Accounting Oversight Board (United States). Those standards require that we plan and perform the audit to obtain reasonable assurance about whether the financial statements and financial highlights are free of material misstatement. An audit includes examining, on a test basis, evidence supporting the amounts and disclosures in the financial statements. Our procedures included confirmation of securities owned as of December 31, 2010 by correspondence with the custodian and brokers. An audit also includes assessing the accounting principles used and significant estimates made by management, as well as evaluating the overall financial statement presentation. We believe that our audits provide a reasonable basis for our opinion.
In our opinion, the financial statements and financial highlights referred to above present fairly, in all material respects, the financial position of the International Equity Fund as of December 31, 2010, the results of its operations, changes in its net assets and financial highlights for each of the years or periods described above, in conformity with U.S. generally accepted accounting principles.

Boston, Massachusetts
February 25, 2011
21
| | |
| Tax Information | | (unaudited) |
| For the year ended December 31, 2010 | | |
Summary
The following Fund intends to make an election under Internal Revenue Code Section 853. The election will allow shareholders to treat their attributable share of foreign taxes paid by the Fund to be paid by them directly. For the fiscal year ended December 31, 2010, the total amount of income received by the Fund from sources within foreign countries and possessions of the United States and the amount of taxes paid by the Fund is as follows:
| | | | | | | | |
| Fund name | | Total Foreign
Source Income | | | Total Foreign
Taxes Paid | |
GE Investments Funds, Inc. — International Equity Fund | | $ | 423,295 | | | $ | 42,132 | |
22
| | |
| Advisory and Administrative Agreement Renewal | | (unaudited) |
The Board of Directors of the GE Investments Funds, Inc. (the “Board”), including the independent Board members, considered and all those that were present unanimously approved the continuance of the Fund’s Investment Advisory and Administration Agreement with GE Asset Management Incorporated (“GEAM”) at meetings held on December 3 and December 10, 2010.
In considering whether to approve the Fund’s investment advisory agreement, the Board members considered and discussed a substantial amount of information and analysis provided, at the Board’s request, by GEAM. The Board members also considered detailed information regarding performance and expenses of other investment companies, including those with similar investment strategies and sizes, which was prepared by independent third party provider Morningstar, Inc. (“Morningstar”). The Board members reviewed the fees charged by GEAM for other mutual funds and investment products other than mutual funds that employ the same investment strategy as the Fund. The Board had the opportunity to ask questions and request additional information in connection with its considerations.
Before approving the Fund’s advisory agreement, the Board members reviewed the information provided with management of GEAM and with independent legal counsel. The Board members also reviewed a memorandum prepared by independent legal counsel discussing the legal standards for the consideration of the proposed continuance. The independent Board members discussed the proposed continuance in detail during a private session with their independent legal counsel at which no representatives of GEAM were present. The independent Board members and their independent legal counsel requested, and received and considered, additional information from GEAM following these sessions.
In advance of the meetings, and in response to their request, the Board members received from GEAM written responses to their inquiries, which included substantial exhibits and other materials related to GEAM’s business and the services it provides to the Fund. The Board members took into account their multi-year experience as Board members and particularly their consideration of these types of agreements in recent years. The information was presented in a manner to facilitate comparison to prior periods and to reflect certain enhancements. To focus their review, the Board members asked GEAM management, in its oral presentation, to highlight material differences from the information presented in recent years.
During the meetings, the Board members had an opportunity to discuss this information with GEAM managers, including senior executives, representatives from the legal, compliance and finance departments, and investment personnel. The Board members posed questions to these representatives and engaged in substantive discussions with them concerning GEAM’s investment process.
In reaching their determination relating to continuance of the Fund’s investment advisory agreement, the Board members considered all factors that they deemed relevant, including the factors discussed below. In their deliberations, the Board members did not identify any particular information that was all-important or controlling, and each Board member may have attributed different weights to the various factors. In particular, the Board members focused on the following:
The Nature, Extent And Quality Of Services Provided.
The Board members reviewed the services provided by GEAM, taking into account their extensive past experiences with GEAM. They focused on the favorable attributes of GEAM, including (i) an investment philosophy oriented toward long-term performance; (ii) effective processes used for selecting investments and brokers; (iii) effective processes used for providing Fund administration, including controllership and compliance functions and oversight of the performance of other companies that provide services to the Fund; (iv) highly skilled professionals including analysts, research professionals, traders and portfolio managers with a depth of experience relevant to the Fund; (v) access to significant technological resources from which the Fund may benefit; and (vi) a favorable history and reputation. The Board members noted that the Fund represents only a small portion of the assets managed by GEAM, but benefits from a full array of services and resources provided by GEAM.
In light of these discussions, the Board, including the independent Board members, concluded that GEAM’s services continue to be satisfactory.
Investment Performance Of The Fund.
The Board members considered the investment performance of the Fund for various periods. The Board members reviewed detailed comparisons of the performance of the Fund with the relevant securities index and peer groupings of mutual funds prepared by
23
| | |
| Advisory and Administrative Agreement Renewal | | (unaudited) |
Morningstar with respect to various periods. The Board members also engaged in detailed discussions with GEAM management about its investment process and performance results. These discussions focused on the Fund’s investment objective, the number and experience of portfolio management and supporting research personnel, the investment style and approach employed, the likely market cycles for the investment style and relative underperformance in certain periods. The Board members discussed GEAM’s investment approach with respect to the Fund, and that the performance of the Fund is consistent with GEAM’s articulated long-term approach and overall investment philosophy.
The Board, including the independent Board members, concluded that the Fund’s performance was acceptable overall taking into consideration the factors discussed above.
Cost Of The Services Provided And Profits Realized From The Relationship With The Fund.
The Board members considered the fees paid to GEAM by the Fund and the cost of the services provided to the Fund by GEAM. The Board members reviewed the information they had requested from GEAM concerning its profitability. The Board members considered the profit margin information for GEAM’s investment company business as a whole, as well as GEAM’s profitability data for the Fund. In this regard, the Board members considered the management fee waiver agreement between the Fund and GEAM, pursuant to which GEAM has waived 20 basis points of its management fee and that this waiver continues through April 30, 2011, at which time GEAM intends to continue to extend the waiver for an additional one year period. The Board members reviewed GEAM’s assumptions and the methods of cost allocation used by GEAM in preparing Fund-specific profitability data. The Board members also discussed with GEAM the basis for its belief that the methods of allocation used were reasonable for each area of its business.
Information was presented regarding the financial condition of GEAM for various past periods. The Board members noted and discussed the additional services provided by GEAM to the Fund compared to other investment products managed by GEAM, and previously had been provided a study conducted by the Investment Company Institute that discusses and compares advisory fees and services for mutual funds and institutional separate accounts. The Board members determined that
GEAM should be entitled to earn a reasonable level of profits for the services it provides to the Fund. The Board members also recognized that GEAM had made significant investments in its business and had not fully recovered the sums invested. The Board also considered that GEAM continues to make a substantial investment in fulfilling its obligations to the Fund and supporting its Fund-related activities.
Based on their review, the Board, including the independent Board members, concluded that they were satisfied that the level of profitability achieved by GEAM from its relationship with the Fund was not unreasonable or excessive.
The Extent To Which Economies Of Scale Would Be Realized As The Fund Grows And Whether Fee Levels Would Reflect Such Economies Of Scale.
Although the Board noted that the Fund did not experience significant growth in assets over the past year, the Board members considered the extent to which economies of scale would be realized as the Fund grows, and whether fee levels reflect these economies of scale for the benefit of Fund investors.
The Board members considered the substantial infrastructure investments that GEAM has made with respect to its operations and its commitment to continue investing resources to enhance services to Fund shareholders. The Board members recognized the benefits to the Fund of GEAM’s past investment in its operations through the expenditure of sums to support its substantial infrastructure, and that, with respect to all GEAM managed mutual funds, GEAM has not yet fully recouped that investment. The Board members reviewed the applicable advisory fee breakpoints for the Fund. They recognized the economies of scale benefits that would be derived by the Fund as a result of the breakpoint fee structure in the event that average daily net assets exceed $100 million. The Board members also recognized the benefits to the Fund of being able to leverage a favorable cost structure achieved with respect to the Fund’s other operating expenses as a result of GEAM’s large overall base of assets under management and its vendor management practices.
Comparison Of Services To Be Rendered And Fees To Be Paid.
The Board members discussed the services provided to the Fund by GEAM, and the fees charged for those services. The
24
| | |
| Advisory and Administrative Agreement Renewal | | (unaudited) |
Board members reviewed information concerning the fee and expense ratios for the Fund, and comparative information with respect to peer groupings of mutual funds prepared by Morningstar. They discussed that the Fund’s figures were within the applicable peer group ranges, although at the higher end of the ranges. They also considered the Fund’s relatively small asset size. In light of the foregoing, the Board, including the independent Board members, determined that the advisory fees were reasonable in relation to the services provided to the Fund.
Fall-Out Benefits.
The Board members considered other actual and potential financial benefits that GEAM may derive from its relationship
with the Fund, including, to the extent applicable, soft dollar commission benefits generated through Fund portfolio transactions. The Board members noted, however, that the Fund benefits from the vast array of resources available through GEAM, and that the Fund represents only a small portion of the assets managed by GEAM.
Conclusion.
No single factor was determinative to the Board’s decision. Based on their discussion and such other matters as were deemed relevant, the Board, including the independent Board members, concluded that renewal of the advisory agreement was in the best interests of the Fund and its shareholders.
25
| | |
| Additional Information | | (unaudited) |
Information about Directors and Executive Officers:
The business and affairs of the Company are managed under the direction of the Company’s Board of Directors. Information pertaining to the Directors and officers of the Company is set forth below.
Interested Directors and Executive Officers
Michael J. Cosgrove
Address c/o GEAM 3001 Summer St. Stamford, CT 06905
Age 61
Position(s) Held with Fund Chairman of the Board and President
Term of Office and Length of Time Served Until successor is elected and qualified — 14 years
Principal Occupation(s) During Past 5 years President and Chief Executive Officer — Mutual Funds and Intermediary Business since March 2007; Executive Vice President of GEAM from February 1997 to March 2007; Director of GEAM since 1988; Vice President, GE Capital Corporation, an indirect wholly-owned subsidiary of GE, since December 1999; Executive Vice President — Sales and Marketing of GEAM, a wholly-owned subsidiary of GE that is registered as an investment adviser under the Investment Advisers Act of 1940, as amended, from March 1993 to March 2007.
Number of Portfolios in Fund Complex Overseen by Director 49
Other Directorships Held by Director Chairman of the Board and President of GE Funds from 1993 to February 2011, and GE Institutional Funds since its inception; Trustee of General Electric Savings & Security Trust, General Electric S&S Income Fund, General Electric S&S Program Mutual Fund (“GE Savings & Security Funds”), Elfun Funds, General Electric Insurance Plan Trust, General Relief Loan Fund, and General Electric Pension Trust since 1988; Trustee of Fordham University since 2002; Trustee of GE Volunteers since 1993; Director, GE Asset Management (Ireland) since February 1999; Director, GE Asset Management Funds Plc., GE Asset Canada Company, and GE Asset Management Limited since 1998.
Matthew J. Simpson
Address c/o GEAM 3001 Summer St. Stamford, CT 06905
Age 49
Position(s) Held with Fund Director and Executive Vice President
Term of Office and Length of Time Served Until successor is elected and qualified — 3 years
Principal Occupation(s) During Past 5 years Executive Vice President, General Counsel and Secretary of GEAM since July 2007; Senior Vice President and General Counsel — Marketing and Client Services (formerly Asset Management Services), at GEAM and Senior Vice President and General Counsel of GEAMS from February 1997 to June 2007; Vice President and Associate General Counsel of GEAM from October 1992 to February 1997; Vice President of GE Funds, GE Institutional Funds and GE LifeStyle Funds from September 2003 to June 2007; Secretary of GE Funds and GE Institutional Funds from 1997 to June 2007; Vice President of Elfun Funds and GE Savings & Security Funds from October 2003 to June 2007; Assistant Secretary of Elfun Funds and GE Savings & Security Funds from 1998 to June 2007.
Number of Portfolios in Fund Complex Overseen by Director 49
Other Directorships Held by Director Trustee of GE Institutional Funds, Elfun Funds and GE Savings & Security Funds since July 2007. Trustee of GE Funds from July 2007 to February 2011.
26
| | |
| Additional Information | | (unaudited) |
Joon Won Choe
Address c/o GEAM 3001 Summer St. Stamford, CT 06905
Age 41
Position(s) Held with Fund Vice President & Secretary
Term of Office and Length of Time Served Until successor is elected and qualified — Vice President and Secretary — less than 1 year
Principal Occupation(s) During Past 5 years Senior Vice President and Associate General Counsel at GEAM since June 2010; Vice President and Associate General Counsel at GEAM from November 2005 to June 2010; Vice President and Secretary of GE Funds from September 2010 to February 2011. Vice President and Secretary of GE Institutional Funds and GE Investments Funds, Inc. since September 2010; Vice President and Assistant Secretary of Elfun Funds and GE Savings & Security Funds since September 2010.
Number of Portfolios in Fund Complex Overseen by Officer N/A
Other Directorships Held by Officer N/A
Robert Herlihy
Address c/o GEAM 3001 Summer St. Stamford, CT 06905
Age 43
Position(s) Held with Fund Senior Vice President and Chief Compliance Officer
Term of Office and Length of Time Served Until successor is elected and qualified — 5 years
Principal Occupation(s) During Past 5 years Chief Compliance Officer of GEAM, GE Institutional Funds, Elfun Funds, and GE Savings and Security Funds since July 2005; Chief Compliance Officer of GE Funds from July 2005 to February 2011; Manager of Fund Administration at GEAM from 2002 — 2005.
Number of Portfolios in Fund Complex Overseen by Officer N/A
Other Directorships Held by Officer N/A
Eunice Tsang
Address c/o GEAM 3001 Summer St. Stamford, CT 06905
Age 51
Position(s) Held with Fund Treasurer
Term of Office and Length of Time Served Until successor is elected and qualified — less than one year
Principal Occupations(s) During Past 5 years Treasurer of GE Institutional Funds, Elfun Funds and GE Savings and Security Funds since January 2010; Treasurer of GE Funds from January 2010 to February 2011; GEAM Operational Controllership and Technical Accounting Manager since December 2007; Financial Planning & Analysis Manager — Performance Leader from June 2005 to December 2007; GEAM Quality Black Belt from 2001 to June 2005; Financial Planning & Analysis Manager from 2000 to 2001; and Mutual Fund Assistant Controller from October 1997 to 2000.
Number of Portfolios in Fund Complex Overseen by Officer N/A
Other Directorships Held by Officer N/A
27
| | |
| Additional Information | | (unaudited) |
Non-Interested Directors
John R. Costantino
Address c/o GEAM 3001 Summer St. Stamford, CT 06905
Age 64
Position(s) Held with Fund Director
Term of Office and Length of Time Served Until successor is elected and qualified — 14 years
Principal Occupation(s) During Past 5 years General Partner, NGN Capital LLC since 2006; Managing Director, Vice President of Walden Capital Management since 1996.
Number of Portfolios in Fund Complex Overseen by Director 41
Other Directorships Held by Director Trustee of GE Funds since 1993, GE Institutional Funds since its inception; Trustee of Fordham University from 1989 to 1995 and 2001 to 2007 and Trustee Emeritus since 2007; Trustee of Neuro Science Research Institute since 1986; Trustee of Gregorian University Foundation from 1992 to 2007; Director of Artes Medical from 2006 to 2008.
William J. Lucas
Address c/o GEAM 3001 Summer St. Stamford, CT 06905
Age 61
Position(s) Held with Fund Director
Term of Office and Length of Time Served Until successor is elected and qualified — 13 years (No longer serves as Trustee effective November 4, 2010)
Principal Occupation(s) During Past 5 years Retired since 2010, previously Vice President and Treasurer of Fairfield University since 1983.
Number of Portfolios in Fund Complex Overseen by Director 41
Other Directorships Held by Director Trustee of GE Funds since 1993, and GE Institutional Funds since its inception.
Robert P. Quinn
Address c/o GEAM 3001 Summer St. Stamford, CT 06905
Age 74
Position(s) Held with Fund Director
Term of Office and Length of Time Served Until successor is elected and qualified — 14 years
Principal Occupation(s) During Past 5 years Retired since 1983 from Salomon Brothers Inc.
Number of Portfolios in Fund Complex Overseen by Director 41
Other Directorships Held by Director Trustee of GE Funds since 1993, and GE Institutional Funds since its inception; Trustee, St. Francis Hospital Corp since 1980.
The Statement of Additional Information for the Fund includes additional information about the Directors and Officers and is available, without charge, upon request by calling 1-800-493-3042.
28
Investment Adviser and Administrator
GE Asset Management Incorporated
Board of Directors
Michael J. Cosgrove, Chairman
John R. Costantino
William J. Lucas*
Robert P. Quinn
Matthew J. Simpson
Secretary
Joon Won Choe
Assistant Secretary
Michelle Matzelle
Treasurer
Eunice Tsang
Assistant Treasurers
Tatyana Begun**
Casey Yantosca
Distributor
GE Investment Distributors, Inc.
Member FINRA and SIPC
Counsel
Sutherland, Asbill & Brennan, LLP
Custodian
State Street Bank & Trust Company
Independent Registered Public Accounting Firm
KPMG LLP
Officers of the Investment Adviser
James W. Ireland, President and Chief Executive Officer
Cheryl H. Beacock, Senior Vice President, Human Resources
Paul M. Colonna, President and Chief Investment Officer — Fixed Income Investments
Michael J. Cosgrove, President and Chief Executive
Officer — Mutual Funds & Intermediary Business
Ralph R. Layman, President and Chief Investment Officer — Public Equity Investments
Maureen B. Mitchell, President — Institutional Sales and Marketing
Steve Rullo, Chief Information Officer (since February 2011)
Matthew J. Simpson, Executive Vice President, General Counsel and Secretary
Don W. Torey, President — Alternative Investments
John J. Walker, Executive Vice President, Chief Operating Officer
David Wiederecht, President and Chief Investment Officer — Investment Strategies
Tracie Winbigler, Executive Vice President, Chief Financial Officer***
| * | As of November 4, 2010, Mr Lucas no longer served as a director of the Company. |
| ** | As of February 18, 2011, Ms. Begun no longer served as an officer of the Company. |
| *** | Effective January , 2011. |
29
Investment Adviser
GE Asset Management Incorporated
3001 Summer Street
PO Box 7900
Stamford, CT 06904-7900
Distributor
GE Investment Distributors, Inc.
member FINRA and SIPC
3001 Summer Street
PO Box 7900
Stamford, CT 06904-7900
The Fund files its complete schedule of portfolio holdings with the Securities and Exchange Commission for the first and third quarters of each fiscal year on Form N-Q. The Fund’s Forms N-Q, as well as a description of the policies and procedures that the Fund uses to determine how to vote proxies (if any) relating to portfolio securities is available without charge (i) upon request, by calling 1-800-493-3042; (ii) on the Fund’s website at http://www.geam.com; and (iii) on the Commission’s website at http://www.sec.gov. The Fund’s Forms N-Q may be reviewed and copied at the Commission’s Public Reference Room in Washington, DC—information on the operation of the Public Reference Room may be obtained by calling 1-800-SEC-0330.
Information (if any) regarding how the Fund voted proxies relating to portfolio securities during the most recently disclosed 12-month period ended June 30 is available without charge (i) through the Fund’s website at http://www.geam.com; and (ii) on the Commission’s website at http://www.sec.gov.

GE Investments Funds, Inc.
Income Fund
Annual Report
December 31, 2010

GE Investments Funds, Inc.
This report is prepared for Policyholders of certain variable contracts and may be distributed to others only if preceded or accompanied by the variable contract’s current prospectus and the current prospectus of the Fund available for investments thereunder.
| | |
| Notes to Performance | | December 31, 2010 (unaudited) |
The information on the following performance pages relates to the GE Investments Income Fund (the “Fund”).
Total returns take into account changes in share price and assume reinvestment of dividends and capital gains distributions, if any. Total returns shown are net of Fund fees and expenses but do not reflect fees and charges associated with the variable contracts such as administrative fees, account charges and surrender charges, which, if reflected, would reduce the Fund’s total returns for all periods shown. The performance data quoted represent past performance; past performance does not guarantee future results.
Investment return and principal value will fluctuate so your shares, when redeemed, may be worth more or less than their original cost. Current performance may be higher or lower than the performance data quoted. Periods less than one year are not annualized. Please call 800-493-3042 or visit the Fund’s website at http://www.geam.com for the most recent month-end performance data.
An investment in the Fund is not a deposit of any bank and is not insured or guaranteed by the Federal Deposit Insurance Corporation (FDIC) or any other government agency. An investment in the Fund is subject to risk, including possible loss of principal invested.
The Barclays Capital U.S. Aggregate Bond Index is a market value-weighted unmanaged index of taxable
investment-grade debt issues, including government, corporate, asset-backed and mortgage-backed securities, with maturities of one year or more. This index is designed to represent the performance of the U.S. investment-grade first rate bond market. The results shown for the foregoing index assume the reinvestment of net dividends or interest. They do not reflect the actual cost of investing in the instruments that comprise the index.
The peer universe of the underlying annuity funds used for the peer group average annual total return calculation is based on the blend of Morningstar peer categories, as shown. Morningstar is an independent mutual fund rating service. A Fund’s performance may be compared to or ranked within a universe of mutual funds with investment objectives and policies similar but not necessarily identical to that of the Fund.
©2010 Morningstar, Inc. All Rights Reserved. The Morningstar information contained herein: (1) is proprietary to Morningstar and/or its content providers; (2) may not be copied or distributed; and (3) is no warranted to be accurate, complete or timely. Neither Morningstar nor its content providers are responsible for any damage or losses relating from any use of this information. Past performance is no guarantee or future results.
GE Investment Distributors, Inc., Member of FINRA & SIPC, is the principal underwriter and distributor of the GE Investments Funds, Inc. and a wholly owned subsidiary of GE Asset Management Incorporated, the investment adviser of the Fund.
1

Paul M. Colonna
The Income Fund is managed by a team of portfolio managers that includes Paul M. Colonna, William M. Healey, Mark H. Johnson and Vita Marie Pike. As lead portfolio manager for the Income Fund, Mr. Colonna is vested with oversight authority. Each portfolio manager is assigned a class of assets, the size of which are determined by team consensus and adjusted on a monthly basis, if necessary. Although each portfolio manager manages his or her asset class independent of the other team members, the team is highly collaborative and communicative.
Paul M. Colonna is the President and Chief Investment Officer — Fixed Income and a Director at GE Asset Management. Since January 2005, he has led the team of portfolio managers for the Income Fund. Prior to joining GE Asset Management in February 2000, Mr. Colonna was a senior portfolio manager with the Federal Home Loan Mortgage Corporation, overseeing the Mortgage Investment Group.
William M. Healey is a Senior Vice President of GE Asset Management. He has served on the portfolio management team for the Income Fund since September 1997. Prior to joining GE Asset Management, Mr. Healey spent over 10 years in the fixed income group at MetLife.
Mark H. Johnson is a Senior Vice President of GE Asset Management and senior portfolio manager of structured products. He has been a member of the portfolio management team for the Income Fund since September 2007. Mr. Johnson joined GE Electric Company (GE) in 1998 in its Employers Reinsurance Corporation as a taxable income portfolio manager. Mr. Johnson joined GE Asset Management as a Vice President and portfolio manager in 2002 and became a Senior Vice President and senior portfolio manager of structured products in 2007.
Vita Marie Pike is a Senior Vice President of GE Asset Management. She has served on the portfolio management team for the Income Fund since June 2004. Prior to joining GE Asset Management in January 2001, she was with Alliance Capital for over nine years serving in a number of different capacities including portfolio manager.
| Q. | How did the GE Investments Income Fund perform compared to its benchmark for the twelve-month period ended December 31, 2010 |
| A. | For the twelve-month period ended December 31, 2010, the Income Fund returned 7.56% for Class 1 shares and 7.10% for Class 4 shares. |
| | The Barclays Capital U.S. Aggregate Bond Index, the Fund’s benchmark, returned 6.54% and the Fund’s Morningstar peer group of 213 US Insurance Intermediate-Term Bond funds returned on average of 7.80% for the same period. |
| Q. | Discuss the factors that materially affected the Fund’s performance during the fiscal period. |
| A. | The fixed income market benefited from both declining interest rates and spread compression over the last fiscal period, producing positive price returns which added to income generated from coupon interest. U.S. 2-year and 10-year Treasury note yields ended the year at 0.59% and 3.29%, respectively, down 54 basis points each. The U.S. 30-year bond finished the year yielding 4.33%, down 31 basis points. As the U.S. economy recovered in 2010 and growth expectations for 2011 picked up, non-treasury securities outperformed treasury securities during the period due to tightening spreads. The Barclays Capital U.S. Credit Index yield spread narrowed 11 basis points, which contributed to a total return of 8.47% last year. Commercial mortgage-backed securities experienced the largest spread compression and led all sectors with an annual return of 20.4%. Yield spreads on high yield and emerging market debt also narrowed contributing to double digit returns for both (BC High Yield Index returned 15.12% and JPM EMBI-GD Index returned 12.24%). |
The largest contributor to the Fund’s performance on an absolute basis and relative to its benchmark was the overweight positions in investment grade credit and commercial mortgage-backed
2

securities plus non-index allocations to high yield and emerging market debt. Security selection within the agency and commercial MBS sectors added value as did an overweight in financial versus non-corporate issuers in investment grade credit. Duration positioning had a negative effect on performance, primarily in April and May when the Fund’s duration was shorter than that of the benchmark and U.S. interest rates fell significantly in a flight to quality away from risky assets brought on by the fiscal crises among the European peripheral countries, namely Greece, Ireland, Portugal and Spain. A small position in Greek bonds early in the year impacted performance negatively.
| Q. | Were there any significant changes to the Fund during the period |
| A. | Sector allocations did change throughout the year, primarily adding to non-treasury sectors vis-à-vis treasury securities. The underweight in agency MBS (approximately 10%) was brought back to a neutral weighting mid-year while the overweight in commercial MBS was increased during the first half of 2010 to roughly 7.5% and remained through year end. Allocations to high yield and emerging market debt were increased also after the flight to quality in May and finished the year around 8% each in the Fund. Duration relative to the benchmark remained short during most of the first half of 2010 but was brought back to neutral in the third quarter and tactically traded with a long bias towards the end of the year. |
3
Understanding Your Fund’s Expenses
As a shareholder of the Fund you incur transaction and ongoing expenses. Transaction expenses including sales charges on purchases payments, reinvested dividends (or other distributions), and redemption fees directly reduce the investment return of the Fund. Ongoing costs include portfolio management fees, distribution and services fees, professional fees, administrative fees and other Fund expenses. The following example is intended to help you understand your ongoing costs (in dollars) of investing in the Fund and to compare these costs with the ongoing costs of investing in other mutual funds.
To illustrate these ongoing costs, we have provided an example and calculated the expenses paid by investors during the period. The information in the following table is based on an investment of $1,000, which is invested at the beginning of the period and held for the entire six-month period ended December 31, 2010.
Actual Expenses
The first section of the table provides information about actual account values and actual expenses. You may use the information in this section, together with the amount you invested, to estimate the expenses that you paid
over the period. To do so, simply divide your account value by $1,000 (for example, an $8,600 account value divided by $1,000 = 8.6), then multiply the result by the number given for your class under the heading “Expenses Paid During Period.”
Hypothetical Example for Comparison Purposes
The second section of the table provides information about hypothetical account values and hypothetical expenses based on the Fund’s actual expense ratio and an assumed rate of return of 5% per year before expenses, which is not the Fund’s actual return. You may use this information to compare the ongoing costs of investing in the Fund and other funds. To do so, compare this 5% hypothetical example with the 5% hypothetical examples that appear in the shareholders reports of other funds.
Please note that the expenses shown in the table for both “Actual” and “Hypothetical” do not reflect any transaction costs, such as sales charges or redemption fees. Additionally, the expenses shown do not reflect the fees or charges associated with variable contracts through which shares of the Fund are offered.
July 1, 2010 – December 31, 2010
| | | | | | | | | | | | |
| | | Account value at the
beginning of the period ($) | | | Account value at the
end of the period ($) | | | Expenses paid
during the period ($)* | |
Actual Fund Return** | | | | | | | | | | | | |
Class 1 | | | 1,000.00 | | | | 1,034.73 | | | | 4.26 | |
Class 4 | | | 1,000.00 | | | | 1,032.16 | | | | 6.45 | |
Hypothetical 5% Return (2.5% for the period) | |
Class 1 | | | 1,000.00 | | | | 1,020.81 | | | | 4.23 | |
Class 4 | | | 1,000.00 | | | | 1,018.68 | | | | 6.41 | |
| * | | Expenses are equal to the Fund’s annualized expense ratio of 0.83% for Class 1 shares and 1.26% for Class 4 shares (for the period July 1, 2010—December 31, 2010), multiplied by the average account value over the period, multiplied by 184/365 (to reflect the one-half year period) |
| ** | | Actual Fund Returns for the six-month period ended December 31, 2010 were as follows: 3.47% for Class 1 shares, and 3.22% for Class 4 shares. Past performance does not guarantee future results. |
4
Investment Profile
A Mutual fund designed for investors who seek maximum income consistent with prudent investment management and the preservation of capital by investing at least 80% of its net assets in debt securities.
Morningstar Performance Comparison
Based on average annual returns for periods ended 12/31/10
| | | | | | | | | | | | | | | | |
| | | | | | One
Year | | | Five
Year | | | Ten
Year | |
Number of Funds in peer group: | | | | | | | 213 | | | | 187 | | | | 158 | |
Peer group average annual total return: | | | | | | | 7.80 | % | | | 5.13 | % | | | 5.23 | % |
Morningstar category in peer group:
U.S. Insurance Intermediate-Term Bond | | | | | | | | | | | | | | | | |
Sector Allocation
as a % of Fair Value (c) of $57,110 (in thousands) on December 31,
2010(b)(c)
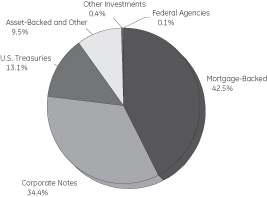
Quality Ratings
as of December 31, 2010 (as a % of Fair Value) (b) (c)
| | | | |
Moody’s / S&P / Fitch Rating * | |
| Percentage of
Fair Value |
|
Aaa / AAA | | | 58.29% | |
Aa / AA | | | 2.59% | |
A / A | | | 13.22% | |
Baa / BBB | | | 15.00% | |
Ba / BB and lower | | | 10.90% | |
| | | | 100.00% | |
Change in Value of a $10,000 Investment
Class 1 Shares
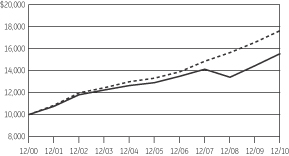
Average Annual Total Return
for the Periods Ended December 31, 2010
Class 1 Shares (Inception date: 1/3/95)
| | | | | | | | | | | | | | | | |
| | | One
Year | | | Five
Year | | | Ten
Year | | | Ending value of a
$10,000 investment (a) | |
Income Fund | | | 7.56% | | | | 3.80% | | | | 4.51% | | | | 15,548 | |
Barclays Capital U.S. Aggregate Bond Index | | | 6.54% | | | | 5.80% | | | | 5.84% | | | | 17,633 | |
Change in Value of a $10,000 Investment
Class 4 Shares

Average Annual Total Returns
for the Periods Ended December 31, 2010
Class 4 Shares (Inception date: 5/1/08)
| | | | | | | | | | | | |
| | | One
Year | | | Since
Inception | | | Ending value of a
$10,000 investment (a) | |
Income Fund | | | 7.10% | | | | 3.03% | | | | 10,830 | |
Barclays Capital U.S. Aggregate Bond Index | | | 6.54% | | | | 5.89% | | | | 11,650 | |

| (a) | Ending value of a $10,000 investment for the ten-year period or since inception, whichever is less. |
| (b) | The securities information regarding holdings, allocations and other characteristics is presented to illustrate examples of securities that the Fund has bought and the diversity of areas in which the Fund may invest as of a particular date. It may not be representative of the Fund’s current or future investments and should not be construed as a recommendation to purchase or sell a particular security. |
| (c) | Fair value basis is inclusive of Short Term Investment in GE Money Market Fund. |
| * | Moody's Investors Services Inc, Standard & Poor's and Fitch are nationally recognized statistical rating organizations. |
See Notes to Performance on page 1 for further information, including an explanation of Morningstar peer categories.
Past performance does not predict future performance and the graph and table do not reflect the deduction of taxes that a shareholder would pay on Fund distributions or the redemption of Fund shares and do not reflect the fees or charges that would be associated with variable contracts through which shares of the Fund are offered.
5
Income Fund
| | |
| Schedule of Investments | | December 31, 2010 |
Income Fund
| | | | | | | | | | | | |
| | | | |
| | | | | Principal
Amount | | | Fair Value | | | |
Bonds and Notes — 99.4%† |
| | |
U.S. Treasuries — 13.6% | | | | | | | |
| | | |
U.S. Treasury Bonds | | | | | | | | | | |
3.88% | | 08/15/40 | | $ | 2,697,300 | | | $ | 2,484,467 | | | (f) |
U.S. Treasury Notes | | | | | | | |
2.63% | | 08/15/20 | | | 4,665,100 | | | | 4,422,734 | | | (f) |
3.25% | | 07/31/16 | | | 513,300 | | | | 540,288 | | | (f) |
| | | | | | | | | 7,447,489 | | | |
| | |
Federal Agencies — 0.2% | | | | | | | |
| | | |
Federal Home Loan
Mortgage Corp. | | | | | | | | | | |
| | | | |
8.25% | | 06/01/26 | | | 60,000 | | | | 82,749 | | | (f,h) |
| |
Agency Mortgage Backed — 29.9% | | | |
| | | |
Federal Home Loan
Mortgage Corp. | | | | | | | | | | |
4.50% | | 06/01/33 -
02/01/35 | | | 32,865 | | | | 33,900 | | | (f) |
5.00% | | 07/01/35 -
08/01/40 | | | 943,071 | | | | 991,916 | | | (f) |
5.00% | | 07/01/35 | | | 15,529 | | | | 16,529 | | | (f,k) |
5.50% | | 05/01/20 | | | 16,478 | | | | 17,896 | | | (f,k) |
5.50% | | 05/01/20 -
01/01/38 | | | 287,310 | | | | 311,597 | | | (f) |
6.00% | | 06/01/17 -
11/01/37 | | | 620,548 | | | | 682,608 | | | (f) |
6.00% | | 04/01/17 -
03/01/34 | | | 41,883 | | | | 46,090 | | | (f,k) |
6.50% | | 02/01/29 | | | 321 | | | | 361 | | | (f) |
7.00% | | 06/01/29 -
08/01/36 | | | 76,977 | | | | 87,392 | | | (f) |
7.00% | | 10/01/16 -
07/01/34 | | | 8,644 | | | | 9,739 | | | (f,k) |
7.50% | | 09/01/12 -
09/01/33 | | | 16,274 | | | | 18,537 | | | (f) |
8.00% | | 11/01/30 | | | 16,397 | | | | 19,194 | | | (f) |
8.50% | | 04/01/30 -
05/01/30 | | | 21,002 | | | | 24,804 | | | (f) |
5.50% | | TBA | | | 180,000 | | | | 191,813 | | | (b) |
Federal National
Mortgage Assoc. | | | | | | | | | | |
4.00% | | 05/01/19 -
10/01/40 | | | 1,321,694 | | | | 1,322,501 | | | (f) |
4.50% | | 05/01/18 -
11/01/40 | | | 3,446,748 | | | | 3,555,164 | | | (f) |
5.00% | | 03/01/34 -
11/01/40 | | | 1,470,715 | | | | 1,550,307 | | | (f) |
5.32% | | 03/01/37 | | | 2,711 | | | | 2,865 | | | (g) |
5.50% | | 12/01/13 -
01/01/39 | | | 2,022,622 | | | | 2,177,501 | | | (f) |
5.53% | | 04/01/37 | | | 4,323 | | | | 4,579 | | | (g) |
6.00% | | 06/01/14 -
07/01/35 | | | 1,283,955 | | | | 1,417,007 | | | (f) |
6.50% | | 07/01/17 -
08/01/34 | | | 179,985 | | | | 200,924 | | | (f) |
7.00% | | 03/01/15 -
02/01/34 | | | 65,558 | | | | 73,437 | | | (f) |
7.50% | | 08/01/13 -
03/01/34 | | | 96,843 | | | | 110,663 | | | (f) |
8.00% | | 12/01/12 -
11/01/33 | | | 71,935 | | | | 82,912 | | | (f) |
8.50% | | 05/01/31 | | | 4,036 | | | | 4,690 | | | (f) |
9.00% | | 04/01/16 -
12/01/22 | | | 8,815 | | | | 9,749 | | | (f) |
4.50% | | TBA | | | 1,750,000 | | | | 1,796,211 | | | (b) |
5.00% | | TBA | | | 547,000 | | | | 580,333 | | | (b) |
Government National
Mortgage Assoc. | | | | | | | | | | |
3.13% | | 12/20/24 | | | 2,750 | | | | 2,831 | | | (f,g) |
3.38% | | 02/20/23 -
02/20/26 | | | 9,461 | | | | 9,755 | | | (f,g) |
4.50% | | 08/15/33 -
09/15/34 | | | 211,327 | | | | 220,950 | | | (f) |
6.00% | | 04/15/27 -
09/15/36 | | | 293,583 | | | | 326,655 | | | (f) |
| | | | | | | | | | | | |
| | | | |
| | | | | Principal
Amount | | | Fair Value | | | |
| | | | |
6.50% | | 04/15/19 -
08/15/36 | | $ | 251,266 | | | $ | 285,547 | | | (f) |
7.00% | | 03/15/12 -
10/15/36 | | | 160,675 | | | | 182,822 | | | (f) |
7.50% | | 11/15/31 -
10/15/33 | | | 6,627 | | | | 7,686 | | | (f) |
8.00% | | 12/15/29 | | | 2,627 | | | | 3,110 | | | (f) |
8.50% | | 10/15/17 | | | 10,669 | | | | 12,003 | | | (f) |
9.00% | | 11/15/16 -
12/15/21 | | | 29,702 | | | | 33,484 | | | (f) |
| | | | | | | | | 16,426,062 | | | |
| |
Agency Collateralized Mortgage
Obligations — 3.7% | | | |
| | | |
Fannie Mae Whole Loan | | | | | | | | | | |
0.97% | | 08/25/43 | | | 296,666 | | | | 9,084 | | | (e,f,l) |
Federal Home Loan
Mortgage Corp. | | | | | | | | | | |
0.08% | | 09/25/43 | | | 1,129,726 | | | | 9,879 | | | (e,f,l) |
Federal Home Loan
Mortgage Corp.
REMIC | | | | | | | | | | |
5.00% | | 05/15/38 | | | 78,971 | | | | 80,973 | | | |
5.50% | | 04/15/17 | | | 30,967 | | | | 913 | | | (e,f,l) |
Federal Home Loan
Mortgage Corp.
REMIC
(Class YQ) | | | | | | | | | | |
5.00% | | 05/15/17 | | | 27,880 | | | | 1,724 | | | (e,f,l) |
Federal Home Loan
Mortgage Corp.
REMIC
(Series 1980)
(Class 1980) | | | | | | | | | | |
7.50% | | 07/15/27 | | | 8,121 | | | | 1,774 | | | (e,f,l) |
Federal Home Loan
Mortgage Corp.
REMIC
(Series 2631)
(Class DI) | | | | | | | | | | |
5.50% | | 06/15/33 | | | 191,431 | | | | 38,905 | | | (e,f,l) |
Federal Home Loan
Mortgage Corp.
REMIC
(Series 2643)
(Class IM) | | | | | | | | | | |
4.50% | | 03/15/18 | | | 139,220 | | | | 10,938 | | | (e,f,l) |
Federal Home Loan
Mortgage Corp.
REMIC
(Series 2645)
(Class BI) | | | | | | | | | | |
4.50% | | 02/15/18 | | | 22,739 | | | | 1,615 | | | (e,f,l) |
Federal Home Loan
Mortgage Corp.
REMIC
(Series 2647)
(Class DI) | | | | | | | | | | |
4.50% | | 10/15/16 | | | 12,821 | | | | 201 | | | (e,f,l) |
Federal Home Loan
Mortgage Corp.
REMIC
(Series 2656)
(Class IU) | | | | | | | | | | |
5.00% | | 04/15/28 | | | 6,240 | | | | 3 | | | (e,f,l) |
Federal Home Loan
Mortgage Corp.
REMIC
(Series 2722)
(Class PI) | | | | | | | | | | |
5.00% | | 06/15/28 | | | 14,743 | | | | 344 | | | (e,f,l) |
Federal Home Loan
Mortgage Corp.
REMIC
(Series 2763)
(Class JI) | | | | | | | | | | |
5.00% | | 10/15/18 | | | 87,815 | | | | 7,931 | | | (e,f,l) |
Federal Home Loan
Mortgage Corp.
REMIC
(Series 2781)
(Class IC) | | | | | | | | | | |
5.00% | | 11/15/17 -
05/15/18 | | | 75,083 | | | | 3,864 | | | (e,f,l) |
Federal Home Loan
Mortgage Corp.
REMIC
(Series 2795)
(Class IC) | | | | | | | | | | |
5.00% | | 07/15/17 | | | 15,918 | | | | 581 | | | (e,f,l) |
Federal Home Loan
Mortgage Corp.
REMIC
(Series 2852)
(Class OJ) | | | | | | | | | | |
14.25% | | 09/15/34 | | | 16,302 | | | | 15,327 | | | (c,d) |
Federal Home Loan
Mortgage Corp.
REMIC
(Series 2990)
(Class TS) | | | | | | | | | | |
6.49% | | 05/15/35 | | | 145,122 | | | | 14,298 | | | (e,l) |
See Notes to Schedule of Investments and Notes to Financial Statements.
6
Income Fund
| | |
| Schedule of Investments | | December 31, 2010 |
| | | | | | | | | | | | |
| | | | |
| | | | | Principal
Amount | | | Fair Value | | | |
| | | |
Federal Home Loan
Mortgage Corp.
REMIC
(Series 3311)
(Class IA) | | | | | | | | | | |
6.15% | | 05/15/37 | | $ | 153,943 | | | $ | 23,992 | | | (e,l) |
Federal Home Loan
Mortgage Corp.
REMIC
(Series 3311)
(Class IB) | | | | | | | | | | |
6.15% | | 05/15/37 | | | 153,943 | | | | 23,992 | | | (e,l) |
Federal Home Loan
Mortgage Corp.
REMIC
(Series 3311)
(Class IC) | | | | | | | | | | |
6.15% | | 05/15/37 | | | 153,943 | | | | 23,992 | | | (e,l) |
Federal Home Loan
Mortgage Corp.
REMIC
(Series 3311)
(Class ID) | | | | | | | | | | |
6.15% | | 05/15/37 | | | 153,943 | | | | 23,992 | | | (e,l) |
Federal Home Loan
Mortgage Corp.
REMIC
(Series 3311)
(Class IE) | | | | | | | | | | |
6.15% | | 05/15/37 | | | 225,262 | | | | 35,107 | | | (e,l) |
Federal Home Loan
Mortgage Corp.
STRIPS | | | | | | | | | | |
8.00% | | 02/01/23 -
07/01/24 | | | 3,948 | | | | 841 | | | (e,f,l) |
Federal Home Loan
Mortgage Corp.
STRIPS
(Class IO) | | | | | | | | | | |
5.00% | | 12/01/34 | | | 81,195 | | | | 15,772 | | | (e,f,k,l) |
Federal Home Loan
Mortgage
STRIPS | | | | | | | | | | |
4.39% | | 08/01/27 | | | 1,034 | | | | 857 | | | (c,d,f) |
Federal National
Mortgage Assoc.
REMIC | | | | | | | | | | |
5.00% | | 08/25/38 | | | 78,869 | | | | 80,103 | | | |
5.24% | | 01/25/37 | | | 222,571 | | | | 26,907 | | | (e,l) |
5.74% | | 07/25/38 -
12/25/40 | | | 452,399 | | | | 63,142 | | | (e,l) |
5.79% | | 11/25/40 | | | 294,528 | | | | 49,072 | | | (e,l) |
6.07% | | 03/25/40 | | | 325,827 | | | | 47,700 | | | (e,l) |
6.14% | | 12/25/36 | | | 170,699 | | | | 20,370 | | | (e,l) |
Federal National
Mortgage Assoc.
REMIC
(Class 109J) | | | | | | | | | | |
7.00% | | 09/25/20 | | | 526 | | | | 575 | | | (f) |
Federal National
Mortgage Assoc.
REMIC
(Class B) | | | | | | | | | | |
2.52% | | 12/25/22 | | | 246 | | | | 227 | | | (c,d,f) |
Federal National
Mortgage Assoc.
REMIC
(Class BZ) | | | | | | | | | | |
5.50% | | 01/25/33 | | | 162,870 | | | | 177,560 | | | (f) |
Federal National
Mortgage Assoc.
REMIC
(Class CS) | | | | | | | | | | |
7.44% | | 08/25/16 | | | 31,322 | | | | 549 | | | (e,f,l) |
Federal National
Mortgage Assoc.
REMIC
(Class VZ) | | | | | | | | | | |
5.00% | | 10/25/35 | | | 75,810 | | | | 73,664 | | | |
Federal National
Mortgage Assoc.
REMIC
(Series 1992)
(Class K) | | | | | | | | | | |
1008.00% | | 05/25/22 | | | 6 | | | | 135 | | | (e,f,l) |
Federal National
Mortgage Assoc.
REMIC
(Series 2003) | | | | | | | | | | |
5.00% | | 08/25/17 | | | 49,276 | | | | 3,310 | | | (e,f,l) |
7.24% | | 05/25/18 | | | 378,428 | | | | 44,159 | | | (e,f,l) |
Federal National
Mortgage Assoc.
REMIC
(Series 2003)
(Class HI) | | | | | | | | | | |
5.00% | | 10/25/22 | | | 47,542 | | | | 3,960 | | | (e,f,l) |
Federal National
Mortgage Assoc.
REMIC
(Series 2003)
(Class IJ) | | | | | | | | | | |
5.00% | | 02/25/32 | | | 125,720 | | | | 14,360 | | | (e,f,l) |
| | | | | | | | | | | | |
| | | | |
| | | | | Principal
Amount | | | Fair Value | | | |
| | | |
Federal National
Mortgage Assoc.
REMIC
(Series 2003)
(Class IO) | | | | | | | | | | |
1.19% | | 12/25/42 | | $ | 70,609 | | | $ | 3,018 | | | (e,f,l) |
Federal National
Mortgage Assoc.
REMIC
(Series 2003)
(Class KI) | | | | | | | | | | |
4.50% | | 05/25/18 | | | 15,594 | | | | 551 | | | (e,f,l) |
Federal National
Mortgage Assoc.
REMIC
(Series 2003)
(Class SL) | | | | | | | | | | |
16.04% | | 03/25/31 | | | 179,861 | | | | 204,922 | | | (f) |
Federal National
Mortgage Assoc.
REMIC
(Series 2007)
(Class IA) | | | | | | | | | | |
6.15% | | 06/25/37 | | | 116,735 | | | | 18,994 | | | (e,l) |
Federal National
Mortgage Assoc.
REMIC
(Series 2007)
(Class IB) | | | | | | | | | | |
6.15% | | 06/25/37 | | | 116,735 | | | | 18,994 | | | (e,l) |
Federal National
Mortgage Assoc.
REMIC
(Series 2007)
(Class IC) | | | | | | | | | | |
6.15% | | 06/25/37 | | | 116,735 | | | | 18,994 | | | (e,l) |
Federal National
Mortgage Assoc.
REMIC
(Series 2007)
(Class ID) | | | | | | | | | | |
6.15% | | 06/25/37 | | | 116,735 | | | | 18,994 | | | (e,l) |
Federal National
Mortgage Assoc.
REMIC
(Series 2007)
(Class IE) | | | | | | | | | | |
6.15% | | 06/25/37 | | | 116,735 | | | | 18,994 | | | (e,l) |
Federal National
Mortgage Assoc.
REMIC
(Series 2007)
(Class IF) | | | | | | | | | | |
6.15% | | 06/25/37 | | | 177,922 | | | | 28,949 | | | (e,l) |
Federal National
Mortgage Assoc.
REMIC
(Series 2008)
(Class ZW) | | | | | | | | | | |
5.00% | | 07/25/38 | | | 63,577 | | | | 64,154 | | | |
Federal National
Mortgage Assoc.
STRIPS | | | | | | | | | | |
6.00% | | 01/01/35 | | | 56,944 | | | | 9,735 | | | (e,f,l) |
Federal National
Mortgage Assoc.
STRIPS
(Class 2) | | | | | | | | | | |
4.50% | | 08/01/35 | | | 124,307 | | | | 22,537 | | | (e,f,l) |
5.00% | | 03/25/38 | | | 101,354 | | | | 16,783 | | | (e,f,l) |
5.50% | | 12/01/33 | | | 51,047 | | | | 10,294 | | | (e,f,l) |
7.50% | | 11/01/23 | | | 24,308 | | | | 4,207 | | | (e,f,l) |
8.00% | | 08/01/23 -
07/01/24 | | | 8,755 | | | | 1,982 | | | (e,f,l) |
8.50% | | 07/25/22 | | | 224 | | | | 34 | | | (e,f,l) |
8.50% | | 07/25/22 | | | 154 | | | | 41 | | | (e,f,l) |
9.00% | | 05/25/22 | | | 250 | | | | 49 | | | (e,f,l) |
Federal National
Mortgage Assoc.
STRIPS
(Series 354)
(Class 1) | | | | | | | | | | |
3.56% | | 11/01/34 | | | 187,410 | | | | 164,017 | | | (c,d,f) |
Federal National
Mortgage Assoc.
STRIPS
(Series 364)
(Class 1) | | | | | | | | | | |
4.50% | | 09/01/35 | | | 225,022 | | | | 40,797 | | | (e,f,l) |
Federal National
Mortgage Assoc.
STRIPS
(Series 378)
(Class 1) | | | | | | | | | | |
4.50% | | 01/01/36 | | | 168,185 | | | | 30,492 | | | (e,f,l) |
Federal National
Mortgage Assoc.
STRIPS
(Series 387)
(Class 1) | | | | | | | | | | |
5.00% | | 05/25/38 | | | 100,864 | | | | 15,419 | | | (e,f,l) |
Government National
Mortgage Assoc. | | | | | | | | | | |
4.50% | | 11/20/39 | | | 105,464 | | | | 102,715 | | | |
5.00% | | 10/20/37 -
09/20/38 | | | 388,881 | | | | 57,362 | | | (e,f,l) |
5.74% | | 11/20/39 | | | 626,004 | | | | 95,076 | | | (e,l) |
See Notes to Schedule of Investments and Notes to Financial Statements.
7
Income Fund
| | |
| Schedule of Investments | | December 31, 2010 |
| | | | | | | | | | | | |
| | | | |
| | | | | Principal
Amount | | | Fair Value | | | |
| | | | |
5.99% | | 10/16/39 | | $ | 233,633 | | | $ | 32,050 | | | (e,l) |
6.24% | | 01/16/39 | | | 399,614 | | | | 62,777 | | | (e,l) |
Government National Mortgage Assoc. (Class IC) | | | | | | | | | | |
5.99% | | 04/16/37 | | | 157,223 | | | | 27,085 | | | (e,f,l) |
Vendee Mortgage Trust | | | | | | | | | | |
0.38% | | 04/15/40 | | | 312,687 | | | | 6,848 | | | (e,l) |
Vendee Mortgage Trust (Class 2003) | | | | | | | | | | |
0.86% | | 05/15/33 | | | 183,086 | | | | 7,286 | | | (e,f,l) |
| | | | | | | | | 2,056,842 | | | |
| | |
Asset Backed — 3.1% | | | | | | | |
| | | |
Bear Stearns Asset Backed Securities Trust (Class 2A2) | | | | | | | | | | |
15.92% | | 02/25/36 | | | 446,649 | | | | 425,364 | | | (c,f) |
Chase Funding Mortgage Loan Asset-Backed Certificates (Class IB) | | | | | | | | | | |
5.75% | | 05/25/32 | | | 20,391 | | | | 11,686 | | | (f,k) |
Chase Funding Mortgage Loan Asset-Backed Certificates (Class IIA2) | | | | | | | | | | |
4.22% | | 02/25/33 | | | 19,166 | | | | 16,410 | | | (c,f) |
Citicorp Residential Mortgage Securities Inc. (Series 2006)
(Class A5) | | | | | | | | | | |
6.04% | | 09/25/36 | | | 60,000 | | | | 52,124 | | | |
Countrywide Asset-Backed Certificates | | | | | | | | | | |
1.12% | | 05/25/33 | | | 8,766 | | | | 7,114 | | | (f) |
Countrywide Asset-Backed Certificates (Class AF4) | | | | | | | | | | |
5.31% | | 08/25/35 | | | 676,596 | | | | 630,936 | | | (f) |
Countrywide Asset-Backed Certificates (Class AF6) | | | | | | | | | | |
4.74% | | 10/25/35 | | | 52,330 | | | | 47,518 | | | |
Mid-State Trust (Class A3) | | | | | | | | | | |
7.54% | | 07/01/35 | | | 1,850 | | | | 1,871 | | | (f,k) |
Popular ABS Mortgage Pass-Through Trust (Class AF4) | | | | | | | | | | |
5.30% | | 11/25/35 | | | 50,000 | | | | 41,663 | | | |
Residential Asset Mortgage Products Inc. (Class A2) | | | | | | | | | | |
6.23% | | 06/25/32 | | | 19,766 | | | | 16,284 | | | (c,f) |
Residential Asset Securities Corp. (Series 2002) (Class AIIB) | | | | | | | | | | |
31.64% | | 07/25/32 | | | 3,922 | | | | 2,147 | | | (c,f) |
Saxon Asset Securities Trust | | | | | | | | | | |
5.23% | | 08/25/35 | | | 465,633 | | | | 446,579 | | | |
| | | | | | | | | 1,699,696 | | | |
| | |
Corporate Notes — 35.8% | | | | | | | |
| | | |
AES El Salvador Trust | | | | | | | | | | |
6.75% | | 02/01/16 | | | 100,000 | | | | 96,741 | | | (a) |
AES Panama S.A. | | | | | | | | | | |
6.35% | | 12/21/16 | | | 40,000 | | | | 42,896 | | | (a) |
Agilent Technologies Inc. | | | | | | | | | | |
5.00% | | 07/15/20 | | | 66,000 | | | | 66,999 | | | |
5.50% | | 09/14/15 | | | 46,000 | | | | 49,965 | | | |
| | | | | | | | | | | | |
| | | | |
| | | | | Principal
Amount | | | Fair Value | | | |
| | | |
Alcoa Inc. | | | | | | | | | | |
6.15% | | 08/15/20 | | $ | 66,000 | | | $ | 67,775 | | | |
Allergan Inc. | | | | | | | | | | |
3.38% | | 09/15/20 | | | 130,000 | | | | 122,619 | | | |
Alliance One International Inc. | | | | | | | | | | |
10.00% | | 07/15/16 | | | 95,000 | | | | 97,375 | | | |
Ameren Illinois Co. | | | | | | | | | | |
9.75% | | 11/15/18 | | | 98,000 | | | | 125,708 | | | |
American International Group Inc. | | | | | | | | | | |
5.85% | | 01/16/18 | | | 33,000 | | | | 34,028 | | | |
American Tower Corp. | | | | | | | | | | |
4.50% | | 01/15/18 | | | 95,000 | | | | 94,170 | | | |
Amsted Industries Inc. | | | | | | | | | | |
8.13% | | 03/15/18 | | | 109,000 | | | | 115,676 | | | (a) |
Anadarko Petroleum Corp. | | | | | | | | | | |
6.20% | | 03/15/40 | | | 200,000 | | | | 195,236 | | | |
6.38% | | 09/15/17 | | | 33,000 | | | | 35,947 | | | |
Anheuser-Busch InBev Worldwide Inc. | | | | | | | | | | |
3.63% | | 04/15/15 | | | 96,000 | | | | 99,089 | | | |
5.00% | | 04/15/20 | | | 136,000 | | | | 143,743 | | | |
5.38% | | 11/15/14 | | | 89,000 | | | | 98,056 | | | (a) |
ARAMARK Corp. | | | | | | | | | | |
8.50% | | 02/01/15 | | | 106,000 | | | | 110,770 | | | (f) |
Arizona Public Service Co. | | | | | | | | | | |
6.25% | | 08/01/16 | | | 165,000 | | | | 184,412 | | | (f) |
AT&T Inc. | | | | | | | | | | |
6.40% | | 05/15/38 | | | 148,000 | | | | 157,325 | | | (f) |
6.70% | | 11/15/13 | | | 108,000 | | | | 122,706 | | | (f) |
Avis Budget Car Rental LLC | | | | | | | | | | |
9.63% | | 03/15/18 | | | 52,000 | | | | 56,030 | | | |
Ball Corp. | | | | | | | | | | |
5.75% | | 05/15/21 | | | 91,000 | | | | 88,043 | | | |
Banco do Brasil Cayman | | | | | | | | | | |
8.50% | | 10/29/49 | | | 100,000 | | | | 115,120 | | | (a,f,g) |
Banco Mercantil del Norte S.A. (Series REGS) | | | | | | | | | | |
6.14% | | 10/13/16 | | | 14,000 | | | | 14,385 | | | (g) |
BanColombia S.A. | | | | | | | | | | |
6.13% | | 07/26/20 | | | 10,000 | | | | 10,238 | | | |
Bank of America Corp. | | | | | | | | | | |
4.50% | | 04/01/15 | | | 180,000 | | | | 182,940 | | | |
5.63% | | 07/01/20 | | | 250,000 | | | | 254,873 | | | |
5.75% | | 12/01/17 | | | 25,000 | | | | 26,016 | | | |
6.50% | | 08/01/16 | | | 130,000 | | | | 141,062 | | | |
BE Aerospace Inc. | | | | | | | | | | |
8.50% | | 07/01/18 | | | 10,000 | | | | 10,950 | | | (f) |
Boise Paper Holdings LLC | | | | | | | | | | |
8.00% | | 04/01/20 | | | 66,000 | | | | 70,620 | | | |
Bombardier Inc. | | | | | | | | | | |
7.75% | | 03/15/20 | | | 124,000 | | | | 133,610 | | | (a,f) |
BP Capital Markets PLC | | | | | | | | | | |
3.13% | | 10/01/15 | | | 32,000 | | | | 31,978 | | | |
4.50% | | 10/01/20 | | | 32,000 | | | | 31,923 | | | |
Calpine Corp. | | | | | | | | | | |
7.25% | | 10/15/17 | | | 25,000 | | | | 25,000 | | | (a) |
Cantor Fitzgerald LP | | | | | | | | | | |
7.88% | | 10/15/19 | | | 32,000 | | | | 32,954 | | | (a) |
See Notes to Schedule of Investments and Notes to Financial Statements.
8
Income Fund
| | |
| Schedule of Investments | | December 31, 2010 |
| | | | | | | | | | | | |
| | | | |
| | | | | Principal
Amount | | | Fair Value | | | |
| | | |
Cargill Inc. | | | | | | | | | | |
5.20% | | 01/22/13 | | $ | 162,000 | | | $ | 174,778 | | | (a,f) |
6.00% | | 11/27/17 | | | 63,000 | | | | 71,289 | | | (a) |
Case New Holland Inc. | | | | | | | | | | |
7.88% | | 12/01/17 | | | 32,000 | | | | 34,960 | | | (a) |
CBS Corp. | | | | | | | | | | |
5.75% | | 04/15/20 | | | 61,000 | | | | 64,822 | | | |
5.90% | | 10/15/40 | | | 46,000 | | | | 44,311 | | | |
CCO Holdings LLC | | | | | | | | | | |
7.88% | | 04/30/18 | | | 32,000 | | | | 33,120 | | | |
8.13% | | 04/30/20 | | | 40,000 | | | | 42,100 | | | |
Central American Bank for Economic Integration | | | | | | | | | | |
5.38% | | 09/24/14 | | | 70,000 | | | | 74,692 | | | (a) |
CFG Investment SAC | | | | | | | | | | |
9.25% | | 12/19/13 | | | 100,000 | | | | 104,750 | | | (f) |
Chesapeake Energy Corp. | | | | | | | | | | |
6.63% | | 08/15/20 | | | 70,000 | | | | 68,950 | | | |
7.25% | | 12/15/18 | | | 17,000 | | | | 17,595 | | | |
Cincinnati Bell Inc. | | | | | | | | | | |
8.25% | | 10/15/17 | | | 122,000 | | | | 120,780 | | | (f) |
8.75% | | 03/15/18 | | | 80,000 | | | | 75,000 | | | |
Citigroup Inc. | | | | | | | | | | |
5.00% | | 09/15/14 | | | 79,000 | | | | 81,724 | | | |
5.13% | | 05/05/14 | | | 102,000 | | | | 108,228 | | | (f) |
5.38% | | 08/09/20 | | | 108,000 | | | | 112,213 | | | |
6.13% | | 11/21/17 | | | 33,000 | | | | 36,164 | | | |
6.38% | | 08/12/14 | | | 222,000 | | | | 245,356 | | | (f) |
8.50% | | 05/22/19 | | | 51,000 | | | | 63,313 | | | |
Clarendon Alumina Production Ltd. | | | | | | | | | | |
8.50% | | 11/16/21 | | | 155,000 | | | | 155,000 | | | (a,f) |
Community Health Systems Inc. | | | | | | | | | | |
8.88% | | 07/15/15 | | | 154,000 | | | | 161,700 | | | (f) |
Consolidated Edison Company of New York Inc. | | | | | | | | | | |
6.65% | | 04/01/19 | | | 74,000 | | | | 88,199 | | | |
Consolidated Edison Company of New York Inc. (Series 2008) | | | | | | | | | | |
5.85% | | 04/01/18 | | | 45,000 | | | | 51,699 | | | |
Corp Nacional del Cobre de Chile | | | | | | | | | | |
3.75% | | 11/04/20 | | | 100,000 | | | | 94,754 | | | (a) |
5.63% | | 09/21/35 | | | 14,000 | | | | 14,308 | | | (a) |
COX Communications Inc. | | | | | | | | | | |
6.25% | | 06/01/18 | | | 83,000 | | | | 92,700 | | | (a) |
Credit Suisse First Boston International for CJSC The EXIM of Ukraine | | | | | | | | | | |
7.65% | | 09/07/11 | | | 100,000 | | | | 101,375 | | | |
Crown Castle International Corp. | | | | | | | | | | |
7.13% | | 11/01/19 | | | 51,000 | | | | 53,933 | | | (f) |
Crown Castle Towers LLC | | | | | | | | | | |
4.88% | | 08/15/40 | | | 100,000 | | | | 96,108 | | | (a) |
6.11% | | 01/15/40 | | | 66,000 | | | | 68,859 | | | (a) |
CVS Caremark Corp. | | | | | | | | | | |
3.25% | | 05/18/15 | | | 70,000 | | | | 71,140 | | | |
5.75% | | 06/01/17 | | | 38,000 | | | | 42,281 | | | |
6.13% | | 09/15/39 | | | 94,000 | | | | 100,435 | | | |
Denbury Resources Inc. | | | | | | | | | | |
8.25% | | 02/15/20 | | | 66,000 | | | | 71,610 | | | |
| | | | | | | | | | | | |
| | | | |
| | | | | Principal
Amount | | | Fair Value | | | |
| | | |
DirecTV Holdings LLC | | | | | | | | | | |
4.75% | | 10/01/14 | | $ | 70,000 | | | $ | 74,603 | | | |
5.88% | | 10/01/19 | | | 76,000 | | | | 82,600 | | | |
Drummond Company Inc. | | | | | | | | | | |
9.00% | | 10/15/14 | | | 67,000 | | | | 71,523 | | | (a) |
El Paso Corp. | | | | | | | | | | |
8.05% | | 10/15/30 | | | 67,000 | | | | 67,978 | | | |
European Investment Bank | | | | | | | | | | |
4.88% | | 01/17/17 | | | 200,000 | | | | 222,889 | | | (f) |
Exelon Corp. | | | | | | | | | | |
4.90% | | 06/15/15 | | | 100,000 | | | | 106,643 | | | |
Exelon Generation Company LLC | | | | | | | | | | |
6.25% | | 10/01/39 | | | 47,000 | | | | 47,302 | | | |
Expedia Inc. | | | | | | | | | | |
5.95% | | 08/15/20 | | | 67,000 | | | | 67,335 | | | |
Fibria Overseas Finance Ltd. | | | | | | | | | | |
7.50% | | 05/04/20 | | | 119,000 | | | | 124,950 | | | (a) |
First Horizon National Corp. | | | | | | | | | | |
5.38% | | 12/15/15 | | | 63,000 | | | | 63,593 | | | |
FPL Group Capital Inc. | | | | | | | | | | |
2.60% | | 09/01/15 | | | 131,000 | | | | 128,284 | | | |
France Telecom S.A. | | | | | | | | | | |
2.13% | | 09/16/15 | | | 65,000 | | | | 63,273 | | | |
Frontier Communications Corp. | | | | | | | | | | |
8.25% | | 04/15/17 | | | 92,000 | | | | 100,970 | | | |
Gaz Capital SA for Gazprom | | | | | | | | | | |
9.25% | | 04/23/19 | | | 100,000 | | | | 122,880 | | | |
Georgia-Pacific LLC | | | | | | | | | | |
5.40% | | 11/01/20 | | | 49,000 | | | | 48,445 | | | (a) |
Globo Comunicacao e Participacoes S.A. | | | | | | | | | | |
7.25% | | 04/26/22 | | | 100,000 | | | | 107,500 | | | (a,f) |
Goldman Sachs Capital I | | | | | | | | | | |
6.35% | | 02/15/34 | | | 64,000 | | | | 60,982 | | | |
Hanesbrands Inc. | | | | | | | | | | |
6.38% | | 12/15/20 | | | 49,000 | | | | 46,550 | | | (a) |
Hartford Financial Services Group Inc. | | | | | | | | | | |
5.50% | | 03/30/20 | | | 122,000 | | | | 123,759 | | | |
HCA Inc. | | | | | | | | | | |
9.25% | | 11/15/16 | | | 148,000 | | | | 157,898 | | | (f) |
Health Management Associates Inc. | | | | | | | | | | |
6.13% | | 04/15/16 | | | 87,000 | | | | 87,870 | | | |
Hess Corp. | | | | | | | | | | |
5.60% | | 02/15/41 | | | 66,000 | | | | 65,520 | | | |
Host Hotels & Resorts LP (REIT) | | | | | | | | | | |
9.00% | | 05/15/17 | | | 81,000 | | | | 89,910 | | | |
HSBC Finance Corp. | | | | | | | | | | |
6.68% | | 01/15/21 | | | 259,000 | | | | 261,663 | | | (a) |
Huntington BancShares Inc. | | | | | | | | | | |
7.00% | | 12/15/20 | | | 44,000 | | | | 46,327 | | | |
IIRSA Norte Finance Ltd. | | | | | | | | | | |
8.75% | | 05/30/24 | | | 154,162 | | | | 171,505 | | | (a,f) |
Ingles Markets Inc. | | | | | | | | | | |
8.88% | | 05/15/17 | | | 140,000 | | | | 149,800 | | | |
Intelsat Subsidiary Holding Company S.A. | | | | | | | | | | |
8.88% | | 01/15/15 | | | 69,000 | | | | 70,898 | | | (f) |
Intergas Finance BV | | | | | | | | | | |
6.38% | | 05/14/17 | | | 100,000 | | | | 105,000 | | | (a,f) |
See Notes to Schedule of Investments and Notes to Financial Statements.
9
Income Fund
| | |
| Schedule of Investments | | December 31, 2010 |
| | | | | | | | | | | | |
| | | | |
| | | | | Principal
Amount | | | Fair Value | | | |
| | | |
Intergen N.V. | | | | | | | | | | |
9.00% | | 06/30/17 | | $ | 288,000 | | | $ | 305,280 | | | (a,f) |
International Paper Co. | | | | | | | | | | |
7.50% | | 08/15/21 | | | 87,000 | | | | 102,761 | | | (f) |
JP Morgan Chase
Capital XXV
(Series Y) | | | | | | | | | | |
6.80% | | 10/01/37 | | | 33,000 | | | | 34,026 | | | (f) |
JPMorgan Chase & Co. | | | | | | | | | | |
5.13% | | 09/15/14 | | | 40,000 | | | | 42,563 | | | (f) |
JPMorgan Chase
Bank NA | | | | | | | | | | |
5.88% | | 06/13/16 | | | 19,000 | | | | 20,780 | | | (f) |
6.00% | | 10/01/17 | | | 250,000 | | | | 277,140 | | | |
Kazakhstan Temir
Zholy Finance BV | | | | | | | | | | |
6.50% | | 05/11/11 | | | 100,000 | | | | 101,375 | | | |
Korea Development
Bank | | | | | | | | | | |
3.25% | | 03/09/16 | | | 100,000 | | | | 97,245 | | | |
Kraft Foods Inc. | | | | | | | | | | |
4.13% | | 02/09/16 | | | 64,000 | | | | 67,182 | | | |
5.38% | | 02/10/20 | | | 144,000 | | | | 154,983 | | | (f) |
6.50% | | 02/09/40 | | | 66,000 | | | | 73,962 | | | |
Kreditanstalt fuer
Wiederaufbau | | | | | | | | | | |
3.50% | | 03/10/14 | | | 340,000 | | | | 361,748 | | | (f) |
4.13% | | 10/15/14 | | | 132,000 | | | | 143,523 | | | (f) |
4.50% | | 07/16/18 | | | 231,000 | | | | 251,275 | | | (f) |
Levi Strauss & Co. | | | | | | | | | | |
7.63% | | 05/15/20 | | | 100,000 | | | | 103,250 | | | |
Lincoln National Corp. | | | | | | | | | | |
6.25% | | 02/15/20 | | | 34,000 | | | | 37,087 | | | (f) |
8.75% | | 07/01/19 | | | 79,000 | | | | 98,817 | | | (f) |
Lloyds TSB Bank PLC | | | | | | | | | | |
6.50% | | 09/14/20 | | | 100,000 | | | | 92,003 | | | (a) |
Majapahit Holding BV | | | | | | | | | | |
7.25% | | 10/17/11 | | | 100,000 | | | | 103,500 | | | (a,f) |
7.75% | | 10/17/16 -
01/20/20 | | | 200,000 | | | | 230,750 | | | (a,f) |
Merrill Lynch & Company
Inc. | | | | | | | | | | |
6.05% | | 08/15/12 | | | 110,000 | | | | 116,479 | | | (f) |
6.88% | | 04/25/18 | | | 110,000 | | | | 120,379 | | | (f) |
MetroPCS Wireless Inc. | | | | | | | | | | |
6.63% | | 11/15/20 | | | 60,000 | | | | 57,150 | | | |
Midamerican Energy
Holdings Co. | | | | | | | | | | |
6.13% | | 04/01/36 | | | 115,000 | | | | 124,222 | | | (f) |
Morgan Stanley | | | | | | | | | | |
5.50% | | 01/26/20 | | | 200,000 | | | | 201,605 | | | (f) |
5.63% | | 09/23/19 | | | 125,000 | | | | 127,460 | | | (f) |
6.00% | | 04/28/15 | | | 67,000 | | | | 72,561 | | | (f) |
Morgan Stanley
(Series F) | | | | | | | | | | |
6.63% | | 04/01/18 | | | 100,000 | | | | 108,477 | | | (f) |
Mylan Inc. | | | | | | | | | | |
7.88% | | 07/15/20 | | | 90,000 | | | | 96,975 | | | (a,f) |
NAK Naftogaz Ukraine | | | | | | | | | | |
9.50% | | 09/30/14 | | | 100,000 | | | | 109,000 | | | (j) |
Nalco Company | | | | | | | | | | |
6.63% | | 01/15/19 | | | 27,000 | | | | 27,607 | | | (a) |
National Agricultural
Cooperative Federation | | | | | | | | | | |
4.25% | | 01/28/16 | | | 100,000 | | | | 100,264 | | | (a) |
5.00% | | 09/30/14 | | | 58,000 | | | | 60,934 | | | (a) |
National Power Corp. | | | | | | | | | | |
4.53% | | 08/23/11 | | | 33,000 | | | | 33,625 | | | (g) |
| | | | | | | | | | | | |
| | | | |
| | | | | Principal
Amount | | | Fair Value | | | |
| | | |
NET Servicos de Comunicacao S.A. | | | | | | | | | | |
7.50% | | 01/27/20 | | $ | 100,000 | | | $ | 114,750 | | | |
News America Inc. | | | | | | | | | | |
6.65% | | 11/15/37 | | | 96,000 | | | | 106,329 | | | |
Nexen Inc. | | | | | | | | | | |
6.40% | | 05/15/37 | | | 156,000 | | | | 151,146 | | | |
Nisource Finance Corp. | | | | | | | | | | |
6.13% | | 03/01/22 | | | 62,000 | | | | 66,802 | | | |
NRG Energy Inc. | | | | | | | | | | |
7.38% | | 02/01/16 | | | 175,000 | | | | 179,375 | | | (f) |
Oglethorpe Power Corp. | | | | | | | | | | |
5.38% | | 11/01/40 | | | 64,000 | | | | 61,284 | | | |
Pacific Gas & Electric Co. | | | | | | | | | | |
5.80% | | 03/01/37 | | | 105,000 | | | | 111,281 | | | |
6.05% | | 03/01/34 | | | 77,000 | | | | 84,307 | | | |
Pacific Rubiales Energy Corp. | | | | | | | | | | |
8.75% | | 11/10/16 | | | 100,000 | | | | 112,500 | | | (a) |
PacifiCorp | | | | | | | | | | |
6.25% | | 10/15/37 | | | 2,000 | | | | 2,267 | | | |
PAETEC Holding Corp. | | | | | | | | | | |
8.88% | | 06/30/17 | | | 46,000 | | | | 49,105 | | | |
Pemex Finance Ltd. | | | | | | | | | | |
9.03% | | 02/15/11 | | | 3,250 | | | | 3,277 | | | (f) |
Pemex Project Funding
Master Trust | | | | | | | | | | |
6.63% | | 06/15/35 -
06/15/38 | | | 32,000 | | | | 32,525 | | | |
Petroleos Mexicanos | | | | | | | | | | |
4.88% | | 03/15/15 | | | 100,000 | | | | 105,250 | | | |
6.00% | | 03/05/20 | | | 30,000 | | | | 31,800 | | | |
8.00% | | 05/03/19 | | | 10,000 | | | | 12,050 | | | |
Petroleum Company of
Trinidad & Tobago Ltd. | | | | | | | | | | |
6.00% | | 05/08/22 | | | 95,833 | | | | 96,073 | | | |
Petronas Capital Ltd. | | | | | | | | | | |
5.25% | | 08/12/19 | | | 100,000 | | | | 107,489 | | | (a) |
Pioneer Natural Resources Co. | | | | | | | | | | |
7.50% | | 01/15/20 | | | 58,000 | | | | 63,686 | | | |
Plains All American
Pipeline LP Corp. | | | | | | | | | | |
3.95% | | 09/15/15 | | | 68,000 | | | | 70,263 | | | |
4.25% | | 09/01/12 | | | 32,000 | | | | 33,369 | | | |
Plains Exploration & Production Co. | | | | | | | | | | |
7.63% | | 06/01/18 | | | 32,000 | | | | 33,680 | | | |
Prudential Financial Inc. | | | | | | | | | | |
3.63% | | 09/17/12 | | | 31,000 | | | | 32,172 | | | |
3.88% | | 01/14/15 | | | 100,000 | | | | 103,168 | | | |
6.20% | | 11/15/40 | | | 64,000 | | | | 67,702 | | | |
7.38% | | 06/15/19 | | | 66,000 | | | | 77,817 | | | |
Qatari Diar Finance QSC (REIT) | | | | | | | | | | |
5.00% | | 07/21/20 | | | 100,000 | | | | 99,525 | | | (a) |
QVC Inc. | | | | | | | | | | |
7.50% | | 10/01/19 | | | 78,000 | | | | 82,095 | | | (a) |
RailAmerica Inc. | | | | | | | | | | |
9.25% | | 07/01/17 | | | 76,000 | | | | 83,505 | | | |
Republic Services Inc. | | | | | | | | | | |
5.25% | | 11/15/21 | | | 64,000 | | | | 67,448 | | | |
5.50% | | 09/15/19 | | | 44,000 | | | | 47,984 | | | |
Reynolds Group Issuer Inc. | | | | | | | | | | |
7.75% | | 10/15/16 | | | 167,000 | | | | 176,602 | | | (a) |
Roche Holdings Inc. | | | | | | | | | | |
6.00% | | 03/01/19 | | | 76,000 | | | | 88,376 | | | (a) |
See Notes to Schedule of Investments and Notes to Financial Statements.
10
Income Fund
| | |
| Schedule of Investments | | December 31, 2010 |
| | | | | | | | | | | | |
| | | | |
| | | | | Principal
Amount | | | Fair Value | | | |
| | | |
Rockies Express
Pipeline LLC | | | | | | | | | | |
5.63% | | 04/15/20 | | $ | 79,000 | | | $ | 76,363 | | | (a) |
RR Donnelley &
Sons Co. | | | | | | | | | | |
7.63% | | 06/15/20 | | | 68,000 | | | | 72,836 | | | |
RSHB Capital SA for
OJSC Russian
Agricultural Bank | | | | | | | | | | |
6.30% | | 05/15/17 | | | 100,000 | | | | 100,500 | | | (a) |
Solutia Inc. | | | | | | | | | | |
7.88% | | 03/15/20 | | | 66,000 | | | | 70,620 | | | |
Southern Copper Corp. | | | | | | | | | | |
5.38% | | 04/16/20 | | | 86,000 | | | | 86,944 | | | |
6.75% | | 04/16/40 | | | 77,000 | | | | 79,733 | | | |
7.50% | | 07/27/35 | | | 100,000 | | | | 110,980 | | | |
Spirit Aerosystems Inc. | | | | | | | | | | |
7.50% | | 10/01/17 | | | 37,000 | | | | 38,480 | | | |
Telecom Italia Capital S.A. | | | | | | | | | | |
6.00% | | 09/30/34 | | | 74,000 | | | | 61,407 | | | |
Telefonica Emisiones
SAU | | | | | | | | | | |
3.73% | | 04/27/15 | | | 76,000 | | | | 75,393 | | | |
Teva Pharmaceutical
Finance II BV | | | | | | | | | | |
3.00% | | 06/15/15 | | | 132,000 | | | | 134,307 | | | |
Textron Inc. | | | | | | | | | | |
6.20% | | 03/15/15 | | | 97,000 | | | | 105,833 | | | |
The AES Corp. | | | | | | | | | | |
8.00% | | 10/15/17 -
06/01/20 | | | 121,000 | | | | 128,095 | | | |
The Goldman Sachs
Group Inc. | | | | | | | | | | |
3.70% | | 08/01/15 | | | 132,000 | | | | 134,496 | | | |
5.38% | | 03/15/20 | | | 183,000 | | | | 189,105 | | | |
6.75% | | 10/01/37 | | | 32,000 | | | | 32,717 | | | |
The Kroger Co. | | | | | | | | | | |
6.15% | | 01/15/20 | | | 98,000 | | | | 111,050 | | | (f) |
The Potomac Edison Co. | | | | | | | | | | |
5.35% | | 11/15/14 | | | 95,000 | | | | 103,582 | | | (f) |
Time Warner Cable Inc. | | | | | | | | | | |
6.75% | | 07/01/18 | | | 58,000 | | | | 67,609 | | | |
7.50% | | 04/01/14 | | | 31,000 | | | | 35,551 | | | |
Time Warner Inc. | | | | | | | | | | |
3.15% | | 07/15/15 | | | 126,000 | | | | 128,018 | | | |
5.88% | | 11/15/16 | | | 83,000 | | | | 93,684 | | | |
6.20% | | 03/15/40 | | | 68,000 | | | | 72,288 | | | |
TNK-BP Finance S.A. | | | | | | | | | | |
7.25% | | 02/02/20 | | | 15,000 | | | | 16,313 | | | (a) |
Transocean Inc. | | | | | | | | | | |
6.00% | | 03/15/18 | | | 20,000 | | | | 21,006 | | | |
6.80% | | 03/15/38 | | | 13,000 | | | | 13,323 | | | |
UnitedHealth Group Inc. | | | | | | | | | | |
5.80% | | 03/15/36 | | | 48,000 | | | | 48,698 | | | |
UPC Germany GmbH | | | | | | | | | | |
8.13% | | 12/01/17 | | | 100,000 | | | | 104,500 | | | (a) |
USB Capital XIII Trust | | | | | | | | | | |
6.63% | | 12/15/39 | | | 98,000 | | | | 100,100 | | | |
Valero Energy Corp. | | | | | | | | | | |
6.13% | | 02/01/20 | | | 132,000 | | | | 140,193 | | | (f) |
Verizon Communications Inc. | | | | | | | | | | |
6.35% | | 04/01/19 | | | 30,000 | | | | 34,625 | | | |
6.40% | | 02/15/38 | | | 70,000 | | | | 77,433 | | | |
6.90% | | 04/15/38 | | | 76,000 | | | | 88,643 | | | |
Virgin Media Finance PLC | | | | | | | | | | |
8.38% | | 10/15/19 | | | 100,000 | | | | 109,250 | | | (f) |
| | | | | | | | | | | | |
| | | | |
| | | | | Principal
Amount | | | Fair Value | | | |
| | | |
WEA Finance LLC (REIT) | | | | | | | | | | |
6.75% | | 09/02/19 | | $ | 131,000 | | | $ | 145,937 | | | (a,f) |
7.50% | | 06/02/14 | | | 34,000 | | | | 38,589 | | | (a,f) |
Weatherford International Limited Bermuda | | | | | | | | | | |
6.75% | | 09/15/40 | | | 113,000 | | | | 118,681 | | | |
Williams Partners LP | | | | | | | | | | |
5.25% | | 03/15/20 | | | 56,000 | | | | 58,050 | | | |
6.30% | | 04/15/40 | | | 99,000 | | | | 103,048 | | | |
Windstream Corp. | | | | | | | | | | |
7.88% | | 11/01/17 | | | 176,000 | | | | 185,020 | | | (f) |
Woodside Finance Ltd. | | | | | | | | | | |
4.50% | | 11/10/14 | | | 165,000 | | | | 173,427 | | | (a,f) |
Wyeth | | | | | | | | | | |
5.50% | | 03/15/13 | | | 108,000 | | | | 118,085 | | | (f) |
Wynn Las Vegas LLC | | | | | | | | | | |
7.88% | | 05/01/20 | | | 90,000 | | | | 96,300 | | | |
Xstrata Finance Canada Ltd. | | | | | | | | | | |
5.80% | | 11/15/16 | | | 62,873 | | | | 68,968 | | | (a,f) |
| | | | | | | | | 19,644,444 | | | |
| |
Non-Agency Collateralized Mortgage Obligations — 10.5% | | | |
| | | |
Banc of America Commercial Mortgage Inc. | | | | | | | | | | |
5.68% | | 07/10/46 | | | 60,000 | | | | 60,447 | | | |
5.74% | | 02/10/51 | | | 150,000 | | | | 159,777 | | | |
Banc of America Commercial Mortgage Inc. (Class A) | | | | | | | | | | |
5.49% | | 02/10/51 | | | 131,250 | | | | 137,277 | | | (f) |
Banc of America Commercial Mortgage Inc. (Class A4) | | | | | | | | | | |
5.63% | | 07/10/46 | | | 16,000 | | | | 17,167 | | | |
Banc of America Commercial Mortgage Inc. (Class AJ) | | | | | | | | | | |
5.70% | | 07/10/46 | | | 30,000 | | | | 27,369 | | | (g) |
Banc of America Commercial Mortgage Inc. (Class C) | | | | | | | | | | |
5.70% | | 04/10/49 | | | 100,000 | | | | 17,568 | | | (f,k) |
Banc of America Funding Corp. (Class B1) | | | | | | | | | | |
5.44% | | 03/20/36 | | | 65,089 | | | | 1,197 | | | (f,k) |
Banc of America Mortgage Securities Inc. (Class B1) | | | | | | | | | | |
4.62% | | 01/25/36 | | | 48,864 | | | | 3,733 | | | (f,k) |
Banc of America Mortgage Securities Inc. (Class B2) | | | | | | | | | | |
4.62% | | 01/25/36 | | | 24,459 | | | | 110 | | | (f,k) |
Bear Stearns Commercial Mortgage Securities | | | | | | | | | | |
5.58% | | 09/11/41 | | | 100,000 | | | | 101,209 | | | (g) |
5.76% | | 09/11/38 | | | 60,000 | | | | 62,359 | | | (g) |
Bear Stearns Commercial Mortgage Securities (Class A M) | | | | | | | | | | |
5.51% | | 04/12/38 | | | 60,000 | | | | 63,891 | | | |
Bear Stearns Commercial Mortgage Securities (Class A2) | | | | | | | | | | |
5.51% | | 04/12/38 | | | 13,806 | | | | 13,838 | | | |
See Notes to Schedule of Investments and Notes to Financial Statements.
11
Income Fund
| | |
| Schedule of Investments | | December 31, 2010 |
| | | | | | | | | | | | |
| | | | |
| | | | | Principal
Amount | | | Fair Value | | | |
| | | |
Bear Stearns Commercial Mortgage Securities (Class A4) | | | | | | | | | | |
5.47% | | 01/12/45 | | $ | 100,000 | | | $ | 106,729 | | | |
5.69% | | 06/11/50 | | | 295,000 | | | | 312,729 | | | (f) |
Bear Stearns Commercial Mortgage Securities (Class AJ) | | | | | | | | | | |
5.46% | | 03/11/39 | | | 50,000 | | | | 47,103 | | | (g) |
5.72% | | 06/11/40 | | | 60,000 | | | | 43,975 | | | |
Bear Stearns Commercial Mortgage Securities (Class AM) | | | | | | | | | | |
5.92% | | 06/11/50 | | | 80,000 | | | | 81,449 | | | (k) |
Bear Stearns Commercial Mortgage Securities (Series 2007) (Class D) | | | | | | | | | | |
5.99% | | 09/11/42 | | | 20,000 | | | | 8,717 | | | (f,k) |
Citigroup Commercial Mortgage Trust (Class AJ) | | | | | | | | | | |
5.73% | | 03/15/49 | | | 50,000 | | | | 47,090 | | | (g) |
Citigroup Commercial Mortgage Trust (Series 2006) (Class AJ) | | | | | | | | | | |
5.48% | | 10/15/49 | | | 60,000 | | | | 55,477 | | | |
Commercial Mortgage Pass Through Certificates (Class AJ) | | | | | | | | | | |
5.79% | | 06/10/46 | | | 70,000 | | | | 67,578 | | | |
Commercial Mortgage Pass Through Certificates (Class AM) | | | | | | | | | | |
5.79% | | 06/10/46 | | | 90,000 | | | | 93,680 | | | |
Countrywide Commercial Mortgage Trust (Class AJ) | | | | | | | | | | |
5.91% | | 06/12/46 | | | 70,000 | | | | 66,373 | | | (g) |
Countrywide Commercial Mortgage Trust (Class AM) | | | | | | | | | | |
5.46% | | 07/12/46 | | | 25,000 | | | | 25,232 | | | (g) |
Credit Suisse First Boston Mortgage Securities Corp. (Class CB1) | | | | | | | | | | |
5.33% | | 10/25/35 | | | 71,892 | | | | 3,653 | | | (f,k) |
Credit Suisse Mortgage Capital Certificates (Class A3) | | | | | | | | | | |
5.47% | | 09/15/39 | | | 217,000 | | | | 227,586 | | | (f) |
Credit Suisse Mortgage Capital Certificates (Class C) | | | | | | | | | | |
5.54% | | 02/15/39 | | | 150,000 | | | | 109,375 | | | (f) |
Credit Suisse Mortgage Capital Certificates (Class CB1) | | | | | | | | | | |
5.64% | | 02/25/36 | | | 37,641 | | | | 2,912 | | | (f,k) |
Extended Stay America Trust | | | | | | | | | | |
5.50% | | 11/05/27 | | | 130,000 | | | | 127,988 | | | (a) |
Greenwich Capital Commercial Funding Corp. | | | | | | | | | | |
5.88% | | 07/10/38 | | | 240,000 | | | | 261,840 | | | (g) |
Greenwich Capital Commercial Funding Corp. (Class A2) | | | | | | | | | | |
5.60% | | 12/10/49 | | | 50,000 | | | | 52,351 | | | |
Greenwich Capital Commercial Funding Corp. (Class AM) | | | | | | | | | | |
5.88% | | 07/10/38 | | | 110,000 | | | | 113,289 | | | (g) |
Indymac INDA Mortgage Loan Trust (Class B1) | | | | | | | | | | |
4.50% | | 01/25/36 | | | 99,013 | | | | 2,276 | | | (f,k) |
| | | | | | | | | | | | |
| | | | |
| | | | | Principal
Amount | | | Fair Value | | | |
| | | |
Indymac INDA Mortgage Loan Trust (Class B2) | | | | | | | | | | |
4.50% | | 01/25/36 | | $ | 15,131 | | | $ | 14 | | | (f,k) |
JP Morgan Chase Commercial Mortgage Securities Corp. | | | | | | | | | | |
4.07% | | 11/15/43 | | | 50,000 | | | | 47,546 | | | (a) |
5.87% | | 04/15/45 | | | 70,000 | | | | 72,590 | | | (f) |
JP Morgan Chase Commercial Mortgage Securities Corp. (Class A4) | | | | | | | | | | |
5.34% | | 08/12/37 | | | 150,000 | | | | 161,496 | | | (f) |
5.44% | | 06/12/47 | | | 160,000 | | | | 167,669 | | | (f) |
5.79% | | 02/12/51 | | | 160,000 | | | | 170,420 | | | (f) |
JP Morgan Chase Commercial Mortgage Securities Corp. (Class AM) | | | | | | | | | | |
5.44% | | 05/15/45 | | | 140,000 | | | | 141,941 | | | |
5.90% | | 02/12/51 | | | 120,000 | | | | 120,634 | | | (f) |
JP Morgan Chase Commercial Mortgage Securities Corp. (Class B) | | | | | | | | | | |
5.52% | | 04/15/43 | | | 40,000 | | | | 33,711 | | | |
JP Morgan Chase Commercial Mortgage Securities Corp. (Class F) | | | | | | | | | | |
6.19% | | 02/12/51 | | | 40,000 | | | | 9,991 | | | (f,k) |
LB-UBS Commercial Mortgage Trust
( Class A2) | | | | | | | | | | |
6.15% | | 04/15/41 | | | 160,000 | | | | 173,428 | | | (g) |
LB-UBS Commercial Mortgage Trust (Class A4) | | | | | | | | | | |
5.16% | | 02/15/31 | | | 70,000 | | | | 74,772 | | | (f) |
5.66% | | 03/15/39 | | | 250,000 | | | | 268,649 | | | (f,g) |
LB-UBS Commercial Mortgage Trust (Class AJ) | | | | | | | | | | |
6.15% | | 04/15/41 | | | 30,000 | | | | 24,766 | | | (f,g) |
LB-UBS Commercial Mortgage Trust (Series 2001) (Class B) | | | | | | | | | | |
6.65% | | 07/14/16 | | | 34,000 | | | | 34,050 | | | (f,k) |
MASTR Alternative Loans Trust (Class 15 AX) | | | | | | | | | | |
5.00% | | 08/25/18 | | | 86,195 | | | | 9,228 | | | (e,f,k,l) |
Merrill Lynch Mortgage Trust (Class AJ) | | | | | | | | | | |
5.66% | | 05/12/39 | | | 25,000 | | | | 22,911 | | | (g) |
Merrill Lynch Mortgage Trust (Series 2006) (Class B) | | | | | | | | | | |
5.66% | | 05/12/39 | | | 70,000 | | | | 39,849 | | | (f) |
Morgan Stanley Capital I | | | | | | | | | | |
5.19% | | 11/14/42 | | | 30,000 | | | | 32,296 | | | (g) |
5.73% | | 10/15/42 | | | 76,000 | | | | 59,558 | | | (f) |
Morgan Stanley Capital I (Class A3) | | | | | | | | | | |
5.71% | | 07/12/44 | | | 100,000 | | | | 106,662 | | | (f) |
Morgan Stanley Capital I (Class A4) | | | | | | | | | | |
5.33% | | 11/12/41 | | | 30,000 | | | | 31,767 | | | |
5.81% | | 08/12/41 | | | 30,000 | | | | 32,940 | | | (g) |
5.81% | | 12/12/49 | | | 210,000 | | | | 224,391 | | | (f) |
Morgan Stanley Capital I (Class AJ) | | | | | | | | | | |
5.39% | | 11/12/41 | | | 280,000 | | | | 251,237 | | | (f,g) |
5.57% | | 11/12/49 | | | 60,000 | | | | 56,232 | | | (g) |
See Notes to Schedule of Investments and Notes to Financial Statements.
12
Income Fund
| | |
| Schedule of Investments | | December 31, 2010 |
| | | | | | | | | | | | |
| | | | |
| | | | | Principal
Amount | | | Fair Value | | | |
| | | | |
5.73% | | 10/15/42 | | $ | 25,000 | | | $ | 23,916 | | | (g) |
Morgan Stanley Capital I (Class AM) | | | | | | | | | | |
6.11% | | 12/12/49 | | | 60,000 | | | | 61,718 | | | (g) |
6.28% | | 01/11/43 | | | 70,000 | | | | 71,885 | | | (f) |
Morgan Stanley Capital I (Class B) | | | | | | | | | | |
5.73% | | 10/15/42 | | | 50,000 | | | | 44,930 | | | (f) |
Morgan Stanley Capital I (Series 2006) (Class AM) | | | | | | | | | | |
5.44% | | 03/12/44 | | | 100,000 | | | | 103,416 | | | (g) |
OBP Depositor LLC Trust | | | | | | | | | | |
4.65% | | 07/15/45 | | | 50,000 | | | | 51,018 | | | (a) |
Puma Finance Ltd. (Class A) | | | | | | | | | | |
5.28% | | 10/11/34 | | | 41,516 | | | | 41,359 | | | (c,f) |
Residential Funding Mortgage Securities I (Class M1) | | | | | | | | | | |
5.75% | | 01/25/36 | | | 95,134 | | | | 1 | | | (f,k) |
Residential Funding Mortgage Securities I (Class M2) | | | | | | | | | | |
5.75% | | 01/25/36 | | | 19,770 | | | | 2 | | | (f,k) |
Vornado DP LLC | | | | | | | | | | |
6.36% | | 09/13/28 | | | 30,000 | | | | 29,866 | | | (a) |
Wachovia Bank Commercial Mortgage Trust (Class A3) | | | | | | | | | | |
5.25% | | 12/15/43 | | | 120,000 | | | | 121,976 | | | (f) |
Wachovia Bank Commercial Mortgage Trust (Class AJ) | | | | | | | | | | |
5.52% | | 01/15/45 | | | 90,000 | | | | 88,509 | | | (f,g) |
5.74% | | 05/15/43 | | | 70,000 | | | | 66,668 | | | (g) |
Wachovia Bank Commercial Mortgage Trust (Class AM) | | | | | | | | | | |
5.47% | | 01/15/45 | | | 70,000 | | | | 71,614 | | | (f,g) |
Wachovia Bank Commercial Mortgage Trust (Series 2006) (Class AJ) | | | | | | | | | | |
5.99% | | 06/15/45 | | | 30,000 | | | | 26,391 | | | (f,g) |
WAMU Commercial Mortgage Securities Trust (Series 2005) (Class AJ) | | | | | | | | | | |
5.19% | | 05/25/36 | | | 70,000 | | | | 70,574 | | | (a,f) |
Wells Fargo Mortgage Backed Securities Trust (Class B1) | | | | | | | | | | |
5.50% | | 01/25/36 | | | 142,294 | | | | 1,950 | | | (f,k) |
| | | | | | | | | 5,767,885 | | | |
| |
Sovereign Bonds — 1.9% | | | |
| | | |
Government of Argentina | | | | | | | | | | |
2.50% | | 12/31/38 | | | 13,737 | | | | 6,147 | | | (h) |
5.00% | | 08/03/12 | | | 54,700 | | | | 13,046 | | | (c,g) |
7.00% | | 10/03/15 | | | 19,668 | | | | 18,930 | | | |
8.28% | | 12/31/33 | | | 14,120 | | | | 13,097 | | | |
Government of Belize | | | | | | | | | | |
6.00% | | 02/20/29 | | | 38,100 | | | | 33,528 | | | (h) |
Government of Brazil | | | | | | | | | | |
6.00% | | 02/20/29 | | | 11,100 | | | | 9,768 | | | (a,h) |
8.00% | | 01/15/18 | | | 19,167 | | | | 22,425 | | | |
8.25% | | 01/20/34 | | | 26,000 | | | | 34,645 | | | |
Government of Brazilian | | | | | | | | | | |
4.88% | | 01/22/21 | | | 100,000 | | | | 102,000 | �� | | |
Government of Costa Rica | | | | | | | | | | |
10.00% | | 08/01/20 | | | 36,000 | | | | 49,320 | | | (a) |
| | | | | | | | | | | | |
| | | | |
| | | | | Principal
Amount | | | Fair Value | | | |
| | | |
Government of El Salvador | | | | | | | | | | |
7.65% | | 06/15/35 | | $ | 20,000 | | | $ | 21,150 | | | (a) |
Government of Grenada | | | | | | | | | | |
2.50% | | 09/15/25 | | | 25,900 | | | | 13,986 | | | (a,f,h) |
Government of Lebanon | | | | | | | | | | |
6.38% | | 03/09/20 | | | 42,000 | | | | 43,787 | | | |
Government of Panama | | | | | | | | | | |
6.70% | | 01/26/36 | | | 56,000 | | | | 62,440 | | | |
Government of Peruvian | | | | | | | | | | |
6.55% | | 03/14/37 | | | 41,000 | | | | 44,895 | | | |
Government of Poland | | | | | | | | | | |
6.38% | | 07/15/19 | | | 7,000 | | | | 7,841 | | | |
Government of Turkey | | | | | | | | | | |
5.63% | | 03/30/21 | | | 100,000 | | | | 104,000 | | | |
Government of Uruguay | | | | | | | | | | |
6.88% | | 09/28/25 | | | 20,114 | | | | 22,930 | | | |
Government of Venezuela | | | | | | | | | | |
1.29% | | 04/20/11 | | | 13,000 | | | | 12,610 | | | (g) |
10.75% | | 09/19/13 | | | 61,000 | | | | 58,713 | | | |
Government of Vietnam | | | | | | | | | | |
1.30% | | 03/12/16 | | | 5,739 | | | | 5,086 | | | (g) |
Korea National Oil Corp. | | | | | | | | | | |
2.88% | | 11/09/15 | | | 100,000 | | | | 96,021 | | | (a) |
Lebanese Republic | | | | | | | | | | |
5.15% | | 11/12/18 | | | 11,000 | | | | 10,860 | | | |
Republic of Dominican | | | | | | | | | | |
9.50% | | 09/27/11 | | | 25,031 | | | | 25,782 | | | |
Russian Foreign Bond – Eurobond | | | | | | | | | | |
5.00% | | 04/29/20 | | | 100,000 | | | | 100,000 | | | (a) |
7.50% | | 03/31/30 | | | 46,358 | | | | 53,613 | | | (h) |
United Mexican States | | | | | | | | | | |
5.13% | | 01/15/20 | | | 20,000 | | | | 20,850 | | | |
6.05% | | 01/11/40 | | | 50,000 | | | | 51,125 | | | |
| | | | | | | | | 1,058,595 | | | |
| | |
Municipal Bonds and Notes — 0.7% | | | | | | | |
| | | |
American Municipal Power-Ohio Inc. | | | | | | | | | | |
8.08% | | | | | 45,000 | | | | 47,907 | | | |
| | | |
Municipal Electric Authority of Georgia | | | | | | | | | | |
6.64% | | | | | 160,000 | | | | 156,400 | | | (f) |
| | | |
New Jersey State Turnpike Authority | | | | | | | | | | |
7.10% | | | | | 30,000 | | | | 32,515 | | | |
7.41% | | | | | 110,000 | | | | 120,736 | | | |
| | | |
New Jersey Transportation Trust Fund Authority | | | | | | | | | | |
6.88% | | | | | 15,000 | | | | 14,572 | | | |
| | | |
South Carolina State Public Service Authority | | | | | | | | | | |
6.45% | | | | | 30,000 | | | | 30,801 | | | |
| | | | | | | | | 402,931 | | | |
| | | |
Total Bonds and Notes
(Cost $53,431,717) | | | | | | | 54,586,693 | | | |
See Notes to Schedule of Investments and Notes to Financial Statements.
13
Income Fund
| | |
| Schedule of Investments | | December 31, 2010 |
| | | | | | | | | | | | |
| | | | |
| | | | | | | | Fair Value | | | |
Other Investments — 0.5% | | | | | | | |
GEI Investment Fund
(Cost $261,046) | | | | | | $ | 247,993 | | | (i) |
| | | |
Total Investments in Securities
(Cost $53,692,763) | | | | | | | 54,834,686 | | | |
Short-Term Investments — 4.1% | | | | | | | |
| | | |
GE Money Market Fund
Institutional Class
0.00%
(Cost $2,274,961) | | | | | | | 2,274,961 | | | (c,i) |
| | | |
Total Investments
(Cost $55,967,724) | | | | | | | 57,109,647 | | | |
| | | |
Liabilities In Excess of Other Assets,
net — (4.0)% | | | | | | | (2,214,764 | ) | | |
| | | | | | | | | | | | |
NET ASSETS — 100.0% | | | | | | $ | 54,894,883 | | | |
| | | | | | | | | | | | |
The Fund had the following long futures contracts open at December 31, 2010:
| | | | | | | | | | | | | | | | |
| Description | | Expiration
date | | | Number
of
Contracts | | | Current
Notional
Value | | | Unrealized
(Depreciation) | |
2 Yr. U.S.
Treasury Notes
Futures | | | March
2011 | | | | 26 | | | $ | 5,691,563 | | | $ | (7,650 | ) |
5 Yr. U.S.
Treasury Notes
Futures | | | March
2011 | | | | 21 | | | | 2,472,094 | | | | (14,331 | ) |
The Fund had the following short futures contracts open at December 31, 2010:
| | | | | | | | | | | | | | | | |
| Description | | Expiration
Date | | | Number
of
Contracts | | | Current
Notional
Value | | | Unrealized
Appreciation/
(Depreciation) | |
Ultra Long U.S.
Treasury Bond
Futures | | | March
2011 | | | | 12 | | | $ | (1,525,125 | ) | | $ | (18,368 | ) |
10 Yr. U.S.
Treasury Notes
Futures | | | March
2011 | | | | 83 | | | | (9,996,313 | ) | | | 151,966 | |
| | | | | | | | | | | | | | | | |
| | | | | | | | | | | | | | $ | 111,617 | |
| | | | | | | | | | | | | | | | |
See Notes to Schedule of Investments and Notes to Financial Statements.
14
| | |
| Notes to Schedule of Investments | | December 31, 2010 |
The views expressed in this document reflect our judgment as of the publication date and are subject to change at any time without notice. The securities information regarding holdings, allocations and other characteristics are presented as of a particular date to illustrate examples of securities that the Fund has bought and the diversity of areas in which the Fund may invest as of a particular date. It may not be representative of the Fund’s current or future investments and should not be construed as a recommendation to purchase or sell a particular security. See the prospectus for complete descriptions of investment objectives, policies, risks and permissible investments.
| (a) | Pursuant to Rule 144A of the Securities Act of 1933, these securities may be resold in transactions exempt from registration, normally to qualified institutional buyers. At December 31, 2010, these securities amounted to $5,500,371 or 10.02% of the net assets of the GE Investments Income Fund. These securities have been determined to be liquid using procedures established by the Board of Directors (unaudited). |
| (b) | Settlement is on a delayed delivery or when-issued basis with final maturity to be announced (TBA) in the future. |
| (c) | Coupon amount represents effective yield. |
| (d) | Principal only security. These type of securities represent the right to receive the monthly principal payments on an underlying pool of mortgages. No payments of interest on the pool are passed through to the “principal only” holder. |
| (e) | Interest only security. These type of securities represent the right to receive the monthly interest payments on an underlying pool of mortgages. Payments of principal on the pool reduce the value of the “interest only” holding. |
| (f) | At December 31, 2010 , all or a portion of this security was pledged to cover collateral requirements for futures, options, forward foreign currency contracts and/or TBA’s. |
| (g) | Variable or floating rate security. The stated rate represents the rate at December 31, 2010 . |
| (h) | Step coupon bond. Security becomes interest bearing at a future date. |
| (i) | GE Asset Management, the investment adviser of the Fund, also serves as investment adviser of the GEI Investment Fund and the GE Funds-GE Money Market Fund. |
| (j) | Securities at default. |
| (k) | Illiquid securities. At December 31, 2010, these securities amounted to $296,434 or 0.54% of net assets for the GE Investments Income Fund. These securities have been determined to be illiquid using procedures established by the Board of Directors (unaudited). |
| (l) | Coupon amount represents the coupon of the underlying mortgage securities on which monthly interest payments are based. |
| † | Percentages are based on net assets as of December 31, 2010 . |
Abbreviations:
| | |
REIT | | Real Estate Investment Trust |
| |
REMIC | | Real Estate Mortgage Investment Conduit |
| |
TBA | | To be Announced |
15
Financial Highlights
Selected data based on a share outstanding throughout the fiscal years indicated
| | | | | | | | | | | | | | | | | | | | | | | | | | | | | | | | | | | | |
| | | CLASS 1 | | | | | | CLASS 4 | |
| | | 12/31/10 | | | 12/31/09 | | | 12/31/08 | | | 12/31/07 | | | 12/31/06 | | | | | | 12/31/10 | | | 12/31/09 | | | 12/31/08 | |
| Inception date | | | — | | | | — | | | | — | | | | — | | | | 1/3/95 | | | | | | | | — | | | | — | | | | 5/1/08 | |
Net asset value, beginning of period | | $ | 10.62 | | | $ | 10.26 | | | $ | 11.50 | | | $ | 11.80 | | | $ | 11.84 | | | | | | | $ | 10.62 | | | | $10.24 | | | | $11.56 | |
Income/(loss) from investment operations: | | | | | | | | | | | | | | | | | | | | | | | | | | | | | | | | | | | | |
Net investment income (loss) | | | 0.34 | ** | | | 0.37 | | | | 0.56 | | | | 0.81 | | | | 0.56 | | | | | | | | 0.28 | ** | | | 0.16 | | | | 0.37 | ** |
Net realized and unrealized
gains/(losses) on investments | | | 0.46 | | | | 0.45 | | | | (1.16) | | | | (0.25) | | | | (0.04) | | | | | | | | 0.47 | | | | 0.63 | | | | (1.08) | |
Total income/(loss) from investment operations | | | 0.80 | | | | 0.82 | | | | (0.60) | | | | 0.56 | | | | 0.52 | | | | | | | | 0.75 | | | | 0.79 | | | | (0.71) | |
Less distributions from: | | | | | | | | | | | | | | | | | | | | | | | | | | | | | | | | | | | | |
Net investment income | | | 0.37 | | | | 0.46 | | | | 0.64 | | | | 0.82 | | | | 0.56 | | | | | | | | 0.32 | | | | 0.41 | | | | 0.61 | |
Net realized gains | | | — | | | | — | | | | — | | | | — | | | | — | | | | | | | | — | | | | — | | | | — | |
Return of capital | | | — | | | | — | | | | 0.00 | (b) | | | 0.04 | | | | — | | | | | | | | — | | | | — | | | | 0.00 | (b) |
Total distributions | | | 0.37 | | | | 0.46 | | | | 0.64 | | | | 0.86 | | | | 0.56 | | | | | | | | 0.32 | | | | 0.41 | | | | 0.61 | |
Net asset value, end of period | | $ | 11.05 | | | $ | 10.62 | | | $ | 10.26 | | | $ | 11.50 | | | $ | 11.80 | | | | | | | $ | 11.05 | | | | $10.62 | | | | $10.24 | |
TOTAL RETURN (a) | | | 7.56% | | | | 7.88% | | | | (5.21)% | | | | 4.83% | | | | 4.37% | | | | | | | | 7.10% | | | | 7.43% | | | | (6.16)% | |
| | | | | | | | | |
RATIOS/SUPPLEMENTAL DATA: | | | | | | | | | | | | | | | | | | | | | | | | | | | | | | | | | | | | |
Net assets, end of period
(in thousands) | | $ | 54,884 | | | $ | 59,532 | | | $ | 68,731 | | | $ | 93,480 | | | $ | 126,732 | | | | | | | $ | 11 | | | $ | 10 | | | $ | 9 | |
Ratios to average net assets: | | | | | | | | | | | | | | | | | | | | | | | | | | | | | | | | | | | | |
Net investment income | | | 3.07% | | | | 4.01% | | | | 4.63% | | | | 5.07% | | | | 5.07% | | | | | | | | 2.57% | | | | 3.56% | | | | 4.33% | * |
Gross expenses | | | 1.00% | | | | 0.84% | | | | 0.65% | | | | 0.61% | | | | 0.61% | | | | | | | | 1.44% | | | | 1.29% | | | | 1.10% | * |
Net expenses | | | 0.83% | (c) | | | 0.84% | (c) | | | 0.63% | (c) | | | 0.61% | | | | 0.61% | | | | | | | | 1.26% | (c) | | | 1.29% | (c) | | | 1.08% | (c)* |
Portfolio turnover rate | | | 320% | | | | 251% | | | | 385% | | | | 448% | | | | 270% | | | | | | | | 320% | | | | 251% | | | | 385% | |
Notes to Financial Highlights
| (a) | Total returns are historical and assume changes in share price, reinvestment of dividends and capital gains distributions and do not include the effect of insurance contract charges. Past performance does not guarantee future results. |
| (b) | Less than $0.01 per share. |
| (c) | Reflects GE Asset Management’s waiver of a portion of the Fund’s management fee in an amount equal to the management fee earned by GEAM with respect to the Fund’s investment in the GE Funds – GE Money Market Fund. |
| * | Annualized for periods less than one year. |
| ** | Per share values have been calculated using the average share method. |
The accompanying Notes are an integral part of these financial statements.
16
| | | | |
Statement of Assets and Liabilities
December 31, 2010 | | | |
| |
ASSETS | | | | |
Investments in securities, at fair value (cost $53,431,717) | | | $54,586,693 | |
Investments in affiliated securities, at fair value (cost $261,046) | | | 247,993 | |
Short-term affiliated investments (at amortized cost) | | | 2,274,961 | |
Income receivables | | | 543,432 | |
Receivable for fund shares sold | | | 1,461 | |
Other assets | | | 58,606 | |
Total Assets | | | 57,713,146 | |
| |
LIABILITIES | | | | |
Distribution payable to shareholders | | | 16 | |
Payable for investments purchased | | | 2,563,406 | |
Payable for fund shares redeemed | | | 20,539 | |
Payable to GEAM | | | 22,339 | |
Accrued other expenses | | | 166,720 | |
Variation margin payable | | | 45,243 | |
Total Liabilities | | | 2,818,263 | |
NET ASSETS | | | $54,894,883 | |
| |
NET ASSETS CONSIST OF: | | | | |
Capital paid in | | | 64,842,309 | |
Undistributed (distribution in excess of) net investment income | | | (22,381 | ) |
Accumulated net realized gain (loss) | | | (11,178,585 | ) |
Net unrealized appreciation/(depreciation) on: | | | | |
Investments | | | 1,141,923 | |
Futures | | | 111,617 | |
NET ASSETS | | | $54,894,883 | |
| |
Class 1: | | | | |
| |
NET ASSETS | | | 54,884,053 | |
Shares outstanding ($0.01 par value; unlimited shares authorized) | | | 4,964,678 | |
Net asset value per share | | | $11.05 | |
| |
Class 4: | | | | |
| |
NET ASSETS | | | 10,830 | |
Shares outstanding ($0.01 par value; unlimited shares authorized) | | | 980 | |
Net asset value per share | | | $11.05 | |
The accompanying Notes are an integral part of these financial statements.
17
| | | | |
Statement of Operations
For the year ended December 31, 2010 | | | |
| |
INVESTMENT INCOME | | | | |
Income: | | | | |
Dividends | | $ | 2,082 | |
Interest | | | 2,265,531 | |
Interest from affiliated investments | | | 1,154 | |
Total Income | | | 2,268,767 | |
| |
Expenses: | | | | |
Advisory and administrative fees | | | 291,756 | |
Transfer agent | | | 26,033 | |
Directors’ fees | | | 2,189 | |
Custody and accounting expenses | | | 214,972 | |
Professional fees | | | 30,181 | |
Other expenses | | | 18,109 | |
Total expenses before waiver and reimbursement | | | 583,240 | |
Less: Expenses waived or borne by the adviser | | | (12,666 | ) |
Less: Expenses reimbursed by the adviser | | | (85,397 | ) |
Net expenses | | | 485,177 | |
Net investment income (loss) | | | 1,783,590 | |
| |
NET REALIZED AND UNREALIZED GAIN (LOSS)
ON INVESTMENTS | | | | |
| |
Realized gain (loss) on: | | | | |
Investments | | | 2,053,423 | |
Futures | | | (935,661 | ) |
Foreign currency transactions | | | (3,341 | ) |
| |
Increase (decrease) in unrealized appreciation/(depreciation) on: | | | | |
Investments | | | 1,290,422 | |
Futures | | | 39,276 | |
Net realized and unrealized gain (loss) on investments | | | 2,444,119 | |
Net increase (decrease) in net assets resulting from operations | | $ | 4,227,709 | |
The accompanying Notes are an integral part of these financial statements.
18
| | | | | | | | |
Statement of
Changes in Net Assets | | | |
| | | Year Ended
December 31,
2010 | | | Year Ended
December 31,
2009 | |
| | |
INCREASE (DECREASE) IN NET ASSETS | | | | | | | | |
Operations: | | | | | | | | |
Net investments income | | $ | 1,783,590 | | | $ | 2,476,231 | |
Net realized gain (loss) on investments, futures and foreign currency transactions | | | 1,114,421 | | | | (5,280,365 | ) |
Net increase (decrease) in unrealized appreciation / (depreciation) on investments and futures | | | 1,329,698 | | | | 7,431,427 | |
Net increase (decrease) from operations | | | 4,227,709 | | | | 4,627,293 | |
Distributions to shareholders from: | | | | | | | | |
Net investment income | | | | | | | | |
Class 1 | | | (1,793,522 | ) | | | (2,472,834 | ) |
Class 4 | | | (308 | ) | | | (379 | ) |
Total distributions | | | (1,793,830 | ) | | | (2,473,213 | ) |
Increase (decrease) in net assets from operations and distributions | | | 2,433,879 | | | | 2,154,080 | |
Share transactions: | | | | | | | | |
Proceeds from sale of shares | | | | | | | | |
Class 1 | | | 2,086,200 | | | | 1,389,310 | |
Class 4 | | | 111 | | | | — | |
Value of distributions reinvested | | | | | | | | |
Class 1 | | | 1,793,522 | | | | 2,472,834 | |
Class 4 | | | 308 | | | | 379 | |
Cost of shares redeemed | | | | | | | | |
Class 1 | | | (10,961,631 | ) | | | (15,214,264 | ) |
Class 4 | | | (100 | ) | | | — | |
Net increase (decrease) from share transactions | | | (7,081,590 | ) | | | (11,351,741 | ) |
Total increase (decrease) in net assets | | | (4,647,711 | ) | | | (9,197,661 | ) |
| | |
NET ASSETS | | | | | | | | |
Beginning of period | | | 59,542,594 | | | | 68,740,255 | |
End of period | | $ | 54,894,883 | | | $ | 59,542,594 | |
Undistributed (distribution in excess of)
net investment income, end of period | | $ | (22,381 | ) | | $ | 2,589 | |
| | |
CHANGES IN FUND SHARES | | | | | | | | |
| | |
Class 1 | | | | | | | | |
Shares sold | | | 181,456 | | | | 130,515 | |
Issued for distributions reinvested | | | 162,604 | | | | 232,626 | |
Shares redeemed | | | (983,632 | ) | | | (1,460,217 | ) |
Net increase (decrease) in fund shares | | | (639,572 | ) | | | (1,097,076 | ) |
| | |
Class 4 | | | | | | | | |
Shares sold | | | 9 | | | | — | |
Issued for distributions reinvested | | | 28 | | | | 36 | |
Shares redeemed | | | (9 | ) | | | — | |
Net increase (decrease) in fund shares | | | 28 | | | | 36 | |
The accompanying Notes are an integral part of these financial statements.
19
| | |
| Notes to Financial Statements | | December 31, 2010 |
| 1. | Organization of the Company |
GE Investments Funds, Inc. (the “Company”) was incorporated under the laws of the Commonwealth of Virginia on May 14, 1984 and is registered under the Investment Company Act of 1940, as amended (the “1940 Act”), as an open-end management investment company. The Company is composed of fourteen investment portfolios (collectively the “Funds”), although only the following eleven are currently being offered: U.S. Equity Fund, S&P 500 Index Fund, Premier Growth Equity Fund, Core Value Equity Fund, Mid-Cap Equity Fund, Small-Cap Equity Fund, International Equity Fund, Total Return Fund, Income Fund (the “Fund”), Money Market Fund and Real Estate Securities Fund.
Shares of the Funds of the Company are offered only to insurance company separate accounts that fund certain variable life insurance contracts and variable annuity contracts. GE Asset Management Incorporated (“GEAM”) is the investment adviser and administrator of each of the Funds.
The Company offers two share classes (Class 1 and Class 4) of the Fund. Class 4 shares were first offered on May 1, 2008, and Fund shares outstanding prior to May 1, 2008 were designated as Class 1 shares. Each share class has different fees and expenses, and as a result, each share class will have different share price and performance. Not all variable contracts offer both share classes of the Fund.
| 2. | Summary of Significant Accounting Policies |
The preparation of financial statements in conformity with U.S. generally accepted accounting principles (GAAP) requires management to make estimates and assumptions that affect the reported amounts of assets and liabilities and disclosure of contingent assets and liabilities at the date of the financial statements and the reported amounts of increases and decreases in net assets from operations during the reporting period. Actual results may differ from those estimates.
Subsequent events after the balance sheet date through the date the financial statements were issued, have been evaluated in the preparation of the financial statements. There are no items to report.
The following summarizes the significant accounting policies of the Company:
Securities Valuation and Transactions. All investments in securities are recorded at their estimated fair value, as described in Note 3.
Securities transactions are accounted for as of the trade date. Realized gains and losses on investments sold are recorded on the basis of identified cost for both financial statement and federal tax purposes.
The Fund’s income, expenses (other than distribution fees) and realized and unrealized gains and losses are allocated proportionally each day among the share classes based upon the relative net assets of each class.
Repurchase Agreements Fund engages in repurchase agreement transactions with respect to instruments that are consistent with the Fund’s investment objectives or policies. The Fund’s custodian takes possession of the collateral pledged for investments in repurchase agreements on behalf of the Fund. The Fund values the underlying collateral daily on a mark-to-market basis to determine that the value, including accrued interest, is at least equal to 102% for domestic securities and 105% international securities of the repurchase price. In the event the seller defaults and the value of the security declines, or if the seller enters an insolvency proceeding, realization of the collateral by the Fund may be delayed or limited.
Foreign Currency Accounting records of the Fund are maintained in U.S. dollars. Investment securities and other assets and liabilities denominated in a foreign currency are translated to U.S. dollars at the prevailing rates of exchange at period end. Purchases and sales of securities, income receipts and expense payments denominated in foreign currencies are translated into U.S. dollars at the prevailing exchange rate on the respective dates of such transactions.
All assets and liabilities of the Fund initially expressed in foreign currency values will be converted into U.S. dollars at the WM/Reuter exchange rate computed at 11:00 a.m., Eastern time.
The Fund does not isolate the portion of the results of operations resulting from changes in foreign exchange rates from the fluctuations arising from changes in the market prices of securities during the year. Such fluctuations are included in the net realized or unrealized gain or loss from investments. Net realized gains or losses on foreign currency transactions represent net gains or losses on sales and maturities of foreign currency contracts, disposition of foreign currencies, the difference between the amount of net investment income and
20
| | |
| Notes to Financial Statements | | December 31, 2010 |
withholding taxes accrued and the U.S. dollar amount actually received or paid, and gains or losses between the trade and settlement date on purchases and sales of foreign securities. Net unrealized foreign exchange gains and losses arising from changes in the value of other assets and liabilities (including foreign currencies and open foreign currency contracts) as a result of changes in foreign exchange rates are included as increases or decreases in unrealized appreciation/depreciation on foreign currency related transactions.
Derivatives The Fund is subject to equity price risk, interest rate risk, credit risk, and foreign currency exchange rate risk in the normal course of pursuing their investment objectives. The Fund enters into derivative transactions to gain market exposure for residual and accumulating cash positions, and for managing the duration of fixed-income investments.
Futures Contracts A futures contract represents a commitment for the future purchase or sale of an asset at a specified price on a specified date. The Fund invests in interest rate, financial and stock or bond index futures contracts subject to certain limitations. The Fund invests in futures contracts to manage its exposure to the stock and bond markets and fluctuations in currency values. Buying futures tends to increase a Fund’s exposure to the underlying instrument while selling futures tends to decrease a Fund’s exposure to the underlying instrument or to hedge other Fund investments. With futures contracts, there is minimal counterparty credit risk to the Fund since futures contracts are exchange traded and the exchange’s clearinghouse, as counterparty to all traded futures, guarantees the futures against default. A Fund’s risks in using these contracts include changes in the value of the underlying instruments, non- performance of the counterparties under the contracts’ terms and changes in the liquidity of the secondary market for the contracts. Futures contracts are valued at the settlement price established each day by the board of trade or exchange on which they principally trade.
Upon entering into a financial futures contract, the Fund is required to pledge to the broker an amount of cash and/or other assets equal to a certain percentage of the contract amount, known as initial margin deposit. Subsequent payments, known as variation margin, are made or received by the Fund each day, depending on the daily fluctuation in the fair value of the underlying security. The Fund records an unrealized gain or loss equal to the daily variation margin. Should market conditions move
unexpectedly, the Fund may not achieve the anticipated benefits of the futures contracts and may incur a loss. The Fund recognizes a realized gain or loss on the expiration or closing of a futures contract.
Options The Fund purchases and writes options, subject to certain limitations. The Fund invests in options contracts to manage its exposure to the stock and bond markets and fluctuations in foreign currency values. Writing puts and buying calls tend to increase a Fund’s exposure to the underlying instrument while buying puts and writing calls tend to decrease a Fund’s exposure to the underlying instrument, or economically hedge other Fund investments. A Fund’s risks in using these contracts include changes in the value of the underlying instruments, non-performance of the counterparties under the contracts’ terms and changes in the liquidity of the secondary market for the contracts. Options are valued at the last sale price, or if no sales occurred on that day, at the last quoted bid price. When the Fund writes an option, the amount of the premium received is recorded as a liability and is subsequently adjusted to the current fair value of the option written. Premiums received from writing options that expire unexercised are treated by the Fund on the expiration date as realized gains from investments. The difference between the premium and the amount paid on effecting a closing purchase transaction, including brokerage commissions, is also treated as a realized gain, or if the premium is less than the amount paid for the closing purchase, as a realized loss. When an option is exercised, the proceeds from the sale of the underlying security or the cost basis of the securities purchased is adjusted by the original premium received or paid.
Forward Foreign Currency Exchange Contracts The Fund enters into forward foreign currency exchange contracts to facilitate transactions in foreign denominated securities and to manage the Fund’s currency exposure. Forward foreign currency exchange contracts are valued at the mean between the bid and the offered forward rates as last quoted by a recognized dealer. The aggregate principal amounts of the contracts are not recorded in the Funds’ financial statements. Such amounts appear under the caption Forward Foreign Currency Contracts in the Schedule of Investments. Fluctuations in the value of the contracts are recorded in the Statement of Assets and Liabilities as an asset (or liability) and in the Statement of Operations as unrealized appreciation (depreciation) until the contracts are closed, when they are recorded as realized gains or losses on foreign currency related transactions. The Funds risks in using these contracts
21
| | |
| Notes to Financial Statements | | December 31, 2010 |
include changes in the value of foreign currency or the possibility that the counterparties do not perform under the contracts’ terms. When the Fund enters into a forward foreign currency exchange contract, it is required to segregate cash or liquid securities with its custodian in an amount equal to the value of the Fund’s total assets committed to the consummation of the forward contract. If the value of the segregated securities declines, additional cash or securities are segregated so that the value of the account will equal the amount of the Fund’s commitment with respect to the contract.
Investments in Foreign Markets Investments in foreign markets involve special risks and considerations not typically associated with investing in the United States. These risks include revaluation of currencies, high rates of inflation, restrictions on repatriation of income and capital, and adverse political and economic developments. Moreover, securities issued in these markets may be less liquid, subject to government ownership controls, tariffs and taxes, subject to delays in settlements, and their prices may be more volatile.
The Fund may be subject to capital gains and repatriation taxes imposed by certain countries in which they invest. Such taxes are generally based upon income and/or capital gains earned or repatriated. Taxes are accrued based on net investment income, net realized gains and net unrealized appreciation as income and/or capital gains are earned.
Investment Income Corporate actions (including cash dividends) are recorded on the ex-dividend date, net of applicable withholding taxes, except for certain foreign corporate actions which are recorded as soon after the ex-dividend date as such information becomes available. Interest income is recorded on the accrual basis.
Accretion of discounts and amortization of premiums on taxable bonds are to the call or maturity date, whichever is shorter, using the effective yield method. Withholding taxes in foreign dividends have been provided for in accordance with the Fund’s understanding of the applicable country’s tax rules and rates.
Expenses Fund specific expenses are allocated to the Fund that incurs such expense and pro rata across share classes. Expenses, other than those incurred by a specific Fund, are allocated pro rata among Funds and share classes. Such expenses may include custodial fees, legal and accounting fees, printing costs and registration fees. All expenses of the Fund are paid by GEAM and reimbursed by the Fund.
Certain class specific expenses (such as transfer agency fees or distribution fees) are allocated to the class that incurs such expense.
Federal Income Taxes The Fund intends to comply with all sections of the Internal Revenue Code applicable to regulated investment companies including the distribution of substantially all its taxable net investment income and net realized capital gains to its shareholders. Therefore, no provision for federal income tax has been made. The Fund is treated as a separate taxpayer for federal income tax purposes.
The Fund utilizes various methods to measure the fair value of most of its investments on a recurring basis. GAAP establishes a framework for measuring fair value and providing related disclosures. Broadly, the framework requires fair value to be determined based on the exchange price that would be received for an asset or paid to transfer a liability (an exit price) in the principal or most advantageous market for the asset or liability in an orderly transaction between market participants at the measurement date. In the absence of active markets for the identical assets or liabilities, such measurements involve developing assumptions based on market observable data and, in the absence of such data, internal information that is consistent with what market participants would use in a hypothetical transaction that occurs at the measurement date. It also establishes a three-level valuation hierarchy based upon observable and non-observable inputs.
Observable inputs reflect market data obtained from independent sources, while unobservable inputs reflect our market assumptions. Preference is given to observable inputs. These two types of inputs create the following fair value hierarchy:
Level 1 — Quoted prices for identical investments in active markets.
Level 2 — Quoted prices for similar investments in active markets; quoted prices for identical or similar investments in markets that are not active; and model-derived valuations whose inputs are observable or whose significant value drivers are observable.
Level 3 — Significant inputs to the valuation model are unobservable.
22
| | |
| Notes to Financial Statements | | December 31, 2010 |
Policies and procedures are maintained to value investments using the best and most relevant data available. In addition, pricing vendors are utilized to assist in valuing investments. GEAM performs periodic reviews of the methodologies used by independent pricing services including price validation of individual securities.
Fair Value Measurement The following section describes the valuation methodologies the Funds use to measure different financial investments at fair value.
The Fund’s portfolio securities are valued generally on the basis of market quotations. Equity securities generally are valued at the last reported sale price on the primary market in which they are traded. Portfolio securities listed on NASDAQ are valued using the NASDAQ Official Closing Price. Level 1 securities primarily include publicly-traded equity securities which may not necessarily represent the last sale price. If no sales occurred on the exchange or NASDAQ that day, the portfolio security generally is valued using the last reported bid price. In those circumstances the Fund classifies the investment securities in Level 2.
Debt securities (other than short-term securities described below) generally are valued at an evaluated bid as reported by an independent pricing service. Municipal obligations are valued at the quoted bid prices, when available. The pricing vendor uses various pricing models for each asset class that are consistent with what other market participants would use. The inputs and assumptions to the model of the pricing vendor are derived from market observable sources including: benchmark yields, reported trades, broker/dealer quotes, issuer spreads, benchmark securities, bids, offers, and other market related data. Since many fixed income securities do not trade on a daily basis, the methodology of the pricing vendor uses available information as applicable such as benchmark curves, benchmarking of like securities, sector groupings, and matrix pricing. The pricing vendor considers all available market observable inputs in determining the evaluation for a security. Thus, certain securities may not be priced using quoted prices, but rather determined from market observable information. These investments are included in Level 2 and primarily comprise our portfolio of corporate fixed income, government, mortgage and asset-backed securities.
In the absence of a reliable price from such a pricing service, debt securities may be valued based on dealer supplied valuations or quotations. In these infrequent circumstances, pricing vendors may provide the Funds with valuations that are based on significant unobservable
inputs, and in those circumstances we classify the investment securities in Level 3.
The Fund uses non-binding broker quotes as the primary basis for valuation when there is limited, or no, relevant market activity for a specific investment or for other investments that share similar characteristics. The Funds have not adjusted the prices obtained. Investment securities priced using non-binding broker quotes are included in Level 3. As is the case with the primary pricing vendor, third-party brokers do not provide access to their proprietary valuation models, inputs and assumptions. Accordingly, GEAM conducts internal reviews of pricing for all such investment securities periodically to ensure reasonableness of valuations used in the Fund’s financial statements. These reviews are designed to identify prices that appear stale, those that have changed significantly from prior valuations, and other anomalies that may indicate that a price may not be accurate. Based on the information available, GEAM believes that the fair values provided by the brokers are representative of prices that would be received to sell the assets at the measurement date (exit prices).
Any short-term securities of sufficient credit quality held by the Fund with remaining maturities of sixty days or less at the time of purchase are valued on the basis of amortized cost which approximates market value and these are included in Level 2.
The Fund’s written or purchased options are valued at the last sales price, or if no sales occurred that day, at the last reported bid price and those are also included in Level 2.
If prices are not readily available for a portfolio security, or if it is believed that a price for a portfolio security does not represent its fair value, the security may be valued using procedures approved by the Fund’s Board of Directors that are designed to establish its “fair” value. These securities would be classified in Level 3. Those procedures require that the fair value of a security be established by the valuation committee. The valuation committee follows different protocols for different types of investments and circumstances. The fair value procedures may be used to value any investment of the Fund in the appropriate circumstances.
Foreign securities may be valued with the assistance of an independent fair value pricing service in circumstances where it is believed that they have been or would be materially affected by events occurring after the close of
23
| | |
| Notes to Financial Statements | | December 31, 2010 |
the portfolio security’s primary market and before the close of regular trading on the NYSE. In these circumstances the Fund classifies the investment securities in Level 2. This independent fair value pricing service uses a model to identify affected securities and portfolios taking into consideration various factors and the fair value of such securities may be something other than the last available quotation or other market price.
Portfolio securities may be valued using techniques other than market quotations, under the circumstances described above. The value established for a portfolio security may be different than what would be produced through the use of another methodology or if it had been priced using market quotations. Portfolio securities that are valued using techniques other than market quotations, including “fair valued” securities, may be subject to greater fluctuation in their value from one day to the next than would be the case if market quotations were used. In addition, there is no assurance that the Fund could sell a portfolio security for the value established for it at any time and it is possible that the Fund would incur a loss because a portfolio security is sold at a discount to its established value.
Other financial investments are derivative instruments that are not reflected in Total Investments, such as futures, forwards, swaps, and written options contracts, which are valued based on fair value as discussed above.
The Fund uses closing prices for derivatives included in Level 1, which are traded either on exchanges or liquid over-the counter markets. Derivative assets and liabilities included in Level 2 primarily represent interest rate swaps, cross-currency swaps and foreign currency and commodity forward and option contracts. Derivative assets and liabilities included in Level 3 primarily represent interest rate products that contain embedded optionality or prepayment features.
The inputs or methodology used for valuing securities are not an indication of the risk associated with investing in those securities. Fair value determinations are required for securities whose value is affected by a significant event that will materially affect the value of a domestic or foreign security and which occurs subsequent to the time of the close of the principal market on which such domestic or foreign security trades but prior to the calculation of the Fund’s NAV.
The following table presents the Fund’s investments measured at fair value on a recurring basis at December 31, 2010:
| | | | | | | | | | | | | | | | |
| Investments | | Level 1 | | | Level 2 | | | Level 3 | | | Total | |
Investments in Securities | | | | | | | | | | | | | | | | |
U.S. Treasuries | | $ | — | | | $ | 7,447,489 | | | $ | — | | | $ | 7,447,489 | |
Federal Agencies | | | — | | | | 82,749 | | | | — | | | | 82,749 | |
Agency Mortgage Backed | | | — | | | | 16,426,062 | | | | — | | | | 16,426,062 | |
Agency CMOs | | | — | | | | 1,866,312 | | | | 190,530 | | | | 2,056,842 | |
Asset Backed | | | — | | | | 1,688,010 | | | | 11,686 | | | | 1,699,696 | |
Corporate Notes | | | — | | | | 19,644,444 | | | | — | | | | 19,644,444 | |
Non-Agency CMOs | | | — | | | | 5,767,761 | | | | 124 | | | | 5,767,885 | |
Sovereign Bonds | | | — | | | | 1,058,595 | | | | — | | | | 1,058,595 | |
Municipal Notes and Bonds | | | — | | | | 402,931 | | | | — | | | | 402,931 | |
Other Investments | | | — | | | | 247,993 | | | | — | | | | 247,993 | |
Short-Term Investments | | | 2,274,961 | | | | — | | | | — | | | | 2,274,961 | |
Total Investments in Securities | | $ | 2,274,961 | | | $ | 54,632,346 | | | $ | 202,340 | | | $ | 57,109,647 | |
Other Financial Instruments | | | | | | | | | | | | | | | | |
Futures Contracts — Unrealized Appreciation | | $ | 151,966 | | | $ | — | | | $ | — | | | $ | 151,966 | |
Futures Contracts — Unrealized Depreciation | | | (40,349 | ) | | | — | | | | — | | | | (40,349 | ) |
Total Other Financial Instruments | | $ | 111,617 | | | $ | — | | | $ | — | | | $ | 111,617 | |
24
| | |
| Notes to Financial Statements | | December 31, 2010 |
Following is a reconciliation of securities activity based on Level 3 inputs for which unobservable market inputs were used to determine fair value:
| | | | | | | | | | | | | | | | | | | | | | | | |
| | | Agency
Mortgage
Backed | | | Agency
CMOs | | | Asset
Backed | | | Corporate
Notes | | | Non- Agency
CMOs | | | Total | |
Balance at 12/31/09 | | $ | 466,009 | | | $ | 956,816 | | | $ | 11,581 | | | $ | 137,977 | | | $ | 73,481 | | | $ | 1,645,864 | |
Accrued discounts/premiums | | | — | | | | (115,943 | ) | | | — | | | | (1,124 | ) | | | — | | | | (117,067 | ) |
Realized gain (loss) | | | — | | | | (163,604 | ) | | | 62 | | | | (25,084 | ) | | | (194,124 | ) | | | (382,751 | ) |
Change in unrealized gain (loss) | | | — | | | | 193,400 | | | | 2,821 | | | | 104,076 | | | | 234,285 | | | | 534,581 | |
Net purchases (sales) | | | — | | | | (802,148 | ) | | | (2,778 | ) | | | (143,219 | ) | | | (50,549 | ) | | | (998,694 | ) |
Net transfers in and out of Level 3 | | | (466,009 | ) | | | 122,009 | | | | — | | | | (72,625 | ) | | | (62,969 | ) | | | (479,593 | ) |
Balance at 12/31/10 | | $ | — | | | $ | 190,530 | | | $ | 11,686 | | | $ | — | | | $ | 124 | | | $ | 202,340 | |
Change in unrealized gain (loss) relating to securities still held at 12/31/10 | | $ | — | | | $ | 237,287 | | | $ | 2,821 | | | $ | — | | | $ | 80,496 | | | $ | 320,604 | |
Transfers in and out of Level 3 are considered to occur at the beginning of the period.
| 4. | Derivatives Transactions |
Shown below are the derivative contracts entered into by the Fund, summarized by primary risk exposure as they appear on the Statement of Assets and Liabilities, all of which are not accounted for as hedging instruments under FASB Accounting Standards Codification (“ASC”) No. 815 Derivatives and Hedging as of December 31, 2010.
| | | | | | | | | | | | |
| | | Asset Derivatives | | | Liability Derivatives | |
Fund/Contracts | | Location | | Fair Value $ | | | Location | | Fair Value $ | |
| Interest Rate Contracts | | Assets, Net Assets —Net Unrealized Appreciation/ (Depreciation) on Futures | | | 151,966 | * | | Liabilities, Net Assets — Net Unrealized Appreciation/ (Depreciation) on Futures | | | (40,349 | )* |
Shown below are the effects of derivative instruments on the Fund’s Statements of Operations, summarized by primary risk exposure all of which are not accounted for as hedging instruments under ASC 815.
| | | | | | | | | | | | | | |
| | | Location | | Notional Amount of
Futures Contracts
Purchased/(Sold) $ | | | Realized Gain
or (Loss) $ | | | Change in Unrealized
Appreciation/(Depreciation) $ | |
Income Fund | |
Interest Rate Contracts | | Realized gain/(loss) on
futures, Increase/
(decrease) in unrealized appreciation/ (depreciation) on futures | | | 162,580,128/(163,632,063) | | | | (935,661 | ) | | | 39,276 | |
| * | Includes cumulative appreciation/depreciation of futures contracts as reported in the Schedule of Investments and within the components of Net Assets section of the Statement of Assets and Liabilities. Only the current day’s variation margin is reported within the Assets or Liabilities sections of the Statement of Assets and Liabilities. |
The Company shares a revolving credit facility of up to $150 million with a number of its affiliates. The credit facility is with its custodian bank, State Street Bank and Trust Company (“State Street”). The revolving credit facility requires the payment of a commitment fee equal to 0.125% per annum on the daily unused portion of the credit facility, payable quarterly. The portion borne by the Funds generally is borne proportionally based upon net assets. In addition, the Company has a $100 million uncommitted, unsecured line of credit with State Street. Generally, borrowings under the credit facilities would accrue interest at the Federal Funds
Rate plus 50 basis points and would be borne by the borrowing Fund. The maximum amount allowed to be borrowed by any one Fund is the lesser of (i) 33.33% of its total assets or (ii) 20% of its net assets. The credit facilities were not utilized by the Fund during the fiscal year ended December 31, 2010.
| 6. | Fees and Compensation Paid to Affiliates |
Advisory and Administration Fees GEAM, a registered investment adviser, was retained by the Company’s Board of Directors effective November 15, 1997 to act as investment adviser and administrator of the Fund. Compensation of
25
| | |
| Notes to Financial Statements | | December 31, 2010 |
GEAM for investment advisory and administrative services is paid monthly based on the average daily net assets of the Fund at an annualized rate of 0.50%.
GEAM waives a portion of the Fund’s management fee in the amount equal to the management fee earned by GEAM with respect to the Fund’s investment in the GE Funds — GE Money Market Fund.
Distribution and Service (12b-1) Fees The Company has adopted a Distribution and Service (12b-1) Plan (the “Plan”) pursuant to Rule 12b-1 under the 1940 Act with respect to Class 4 shares of the Fund. Under the Plan, the Fund may compensate GE Investment Distributors, Inc. (“GEID”), a wholly-owned subsidiary of GEAM and the Fund’s principal distributor, for certain sales services provided by GEID or other broker dealers and investor services provided by GEID or other service providers relating to the Fund’s Class 4 shares, including services to owners or prospective owners of variable contracts issued by insurance companies that offer such share class as an investment option. The amount of compensation paid under the Plan by the Fund’s Class 4 shares may not exceed 0.45% of the average daily net assets of the Fund attributable to such share class. The Plan continues in effect from year to year for so long as such continuance is approved annually by the Board of Directors, including by those directors who are not interested persons of the Company and who have no direct or indirect financial interest in the operation of the Plan or in any agreement related to it.
Directors’ Compensation The Fund pays no compensation to its directors who are officers or employees of GEAM or its affiliates. Directors who are not such officers or employees also serve in a similar capacity for other funds advised by GEAM. Compensation paid to unaffiliated directors are reflected on the Statement of Operations. These fees are allocated pro rata across all of the mutual fund platforms
and share classes served by the directors, including the Fund, and are based upon the relative net assets of each fund within such platforms.
| 7. | Investment Transactions |
Purchases and Sales of Securities The cost of purchases and the proceeds from sales of investments, other than short-term securities and options, for the year ended December 31, 2010 were as follows:
| | |
| U.S. Government Securities |
| Purchases | | Sales |
$121,272,124 | | $118,308,819 |
|
| Other Securities |
| Purchases | | Sales |
$52,744,651 | | $55,751,652 |
The Fund is subject to ASC 740, Income Taxes. ASC 740 provides guidance for financial accounting and reporting for the effects of income taxes that result from an entity’s activities during the year. ASC 740 also provides guidance regarding how certain tax positions should be recognized, measured, presented and disclosed in the financial statements. ASC 740 requires evaluation of tax positions taken or expected to be taken in the course of preparing the Fund’s tax returns to determine whether the tax positions are “more likely than not” of being sustained by the applicable tax authority. There are no adjustments to the Fund’s net assets required under ASC 740. The Fund’s 2007, 2008, 2009 and 2010 fiscal years tax returns are still open to examination by the Federal and applicable state tax authorities.
At December 31, 2010, information on the tax cost of investments is as follows:
| | | | | | | | | | | | | | |
| | | | | | | Net Tax
Appreciation/(Depreciation) | | | | | | |
Cost for Tax Purposes | | Gross Tax Unrealized Appreciation | | Gross Tax Unrealized Depreciation | | Investments | | Derivatives/
Currency | | Undistributed Income | | Undistributed (Accumulated Capital Loss) | | Post October Losses |
| $56,232,274 | | $2,534,249 | | $(1,656,876) | | $877,373 | | 15 | | $— | | $(10,762,896) | | $(61,918) |
26
| | |
| Notes to Financial Statements | | December 31, 2010 |
As of December 31, 2010, the Fund has capital loss carryovers as indicated below. Capital loss carryovers are available to offset future realized capital gains to the extent provided in the Internal Revenue Code and regulations thereunder. To the extent that these carryover losses are used to offset future capital gains, it is probable that the gains so offset will not be distributed to shareholders because they would be taxable as ordinary income.
| | |
| Amount | | Expires |
$1,044,853 | | 12/31/2014 |
| 1,335,730 | | 12/31/2015 |
| 972,866 | | 12/31/2016 |
| 7,409,447 | | 12/31/2017 |
These amounts will be available to offset future taxable capital gains. Under the recently enacted Regulated Investment Company Modernization Act of 2010, the Fund will be permitted to carry forward capital losses incurred in taxable years beginning after December 22, 2010 for an unlimited period. However, any losses incurred during those future years will be required to be utilized prior to the losses incurred in pre-enactment tax years. As a result of this ordering rule, pre-enactment capital loss carryforwards may be more likely to expire unused. Additionally, post-enactment capital losses that are carried forward will retain their character as either short-term or long-term capital losses rather than being considered all short-term as under previous law.
During the year ended December 31, 2010, the Fund utilized $1,333,223 of prior year capital loss carryovers.
Any net capital and currency losses incurred after October 31, within the Fund’s tax year, are deemed to arise on the first day of the Fund’s next tax year if the Fund so elects to defer such losses.
The Fund elected to defer losses incurred after October 31, 2010 as follows:
| | |
| Capital | | Currency |
| $61,918 | | $— |
The tax composition of distributions paid during the years ended December 31, 2010 and December 31, 2009 were as follows:
| | | | | | |
| | | Ordinary
Income | | Long-Term
Capital
Gains | |
2010 | | $1,793,830 | | | $— | |
2009 | | 2,473,213 | | | — | |
Distributions to Shareholders The Fund declares and pays any dividends from net investment income annually. The Fund declares and pays any net realized capital gains in excess of capital loss carryforwards distributions annually. The character of income and gains to be distributed is determined in accordance with income tax regulations which may differ from generally accepted accounting principles. These differences include (but are not limited to) futures, treatment of realized and unrealized gains and losses on foreign currency contracts, paydown gains and losses on mortgage-backed securities, investments organized as partnerships for tax purposes, losses deferred due to offsetting positions, and losses deferred due to wash sale transactions. Reclassifications due to permanent book/tax differences are made to the Fund’s capital accounts to reflect income and gains available for distribution (or available capital loss carryovers) under income tax regulations. These reclassifications have no impact on net investment income, realized gains or losses, or the net asset value of the Fund. The calculation of net investment income per share in the Financial Highlights table excludes these adjustments.
The reclassifications for the year ended December 31, 2010 were as follows:
| | | | |
Undistributed Net Investment Income | | Accumulated Net Realized
Gain | | Paid in Capital |
| $(14,730) | | $25,809 | | $(11,079) |
27
Report of Independent Registered Public Accounting Firm
The Shareholders and Board of Directors
GE Investments Funds, Inc.
We have audited the accompanying statement of assets and liabilities, including the schedule of investments, of the Income Fund, a series of GE Investments Funds, Inc., as of December 31, 2010, and the related statement of operations for the year then ended, statements of changes in net assets for each of the years in the two-year period then ended, and the financial highlights for each of the years in the five-year period then ended. These financial statements and financial highlights are the responsibility of the Fund’s management. Our responsibility is to express an opinion on these financial statements and financial highlights based on our audits.
We conducted our audits in accordance with the standards of the Public Company Accounting Oversight Board (United States). Those standards require that we plan and perform the audit to obtain reasonable assurance about whether the financial statements and financial highlights are free of material misstatement. An audit includes examining, on a test basis, evidence supporting the amounts and disclosures in the financial statements. Our procedures included confirmation of securities owned as of December 31, 2010 by correspondence with the custodian and brokers, or by other appropriate auditing procedures where replies from brokers were not received. An audit also includes assessing the accounting principles used and significant estimates made by management, as well as evaluating the overall financial statement presentation. We believe that our audits provide a reasonable basis for our opinion.
In our opinion, the financial statements and financial highlights referred to above present fairly, in all material respects, the financial position of the Income Fund as of December 31, 2010, the results of its operations, changes in its net assets and financial highlights for each of the years or periods described above, in conformity with U.S. generally accepted accounting principles.
/s/ KPMG LLP
Boston, Massachusetts
February 25, 2011
28
| | |
| Advisory and Administrative Agreement Renewal | | (unaudited) |
The Board of Directors of the GE Investments Funds, Inc. (the “Board”), including the independent Board members, considered and all those that were present unanimously approved the continuance of the Fund’s Investment Advisory and Administration Agreement with GE Asset Management Incorporated (“GEAM”) at meetings held on December 3 and December 10, 2010.
In considering whether to approve the Fund’s investment advisory agreement, the Board members considered and discussed a substantial amount of information and analysis provided, at the Board's request, by GEAM. The Board members also considered detailed information regarding performance and expenses of other investment companies, including those with similar investment strategies and sizes, which was prepared by independent third party provider Morningstar, Inc. (“Morningstar”). The Board members reviewed the fees charged by GEAM for other mutual funds and investment products other than mutual funds that employ the same investment strategy as the Fund. The Board had the opportunity to ask questions and request additional information in connection with its considerations.
Before approving the Fund’s advisory agreement, the Board members reviewed the information provided with management of GEAM and with independent legal counsel. The Board members also reviewed a memorandum prepared by independent legal counsel discussing the legal standards for the consideration of the proposed continuance. The independent Board members discussed the proposed continuance in detail during a private session with their independent legal counsel at which no representatives of GEAM were present. The independent Board members and their independent legal counsel requested, and received and considered, additional information from GEAM following these sessions.
In advance of the meetings, and in response to their request, the Board members received from GEAM written responses to their inquiries, which included substantial exhibits and other materials related to GEAM's business and the services it provides to the Fund. The Board members took into account their multi-year experience as Board members and particularly their consideration of these types of agreements in recent years. The information was presented in a manner to facilitate comparison to prior periods and to reflect certain enhancements. To focus their review, the Board members asked GEAM management, in its oral presentation, to highlight material differences from the information presented in recent years.
During the meetings, the Board members had an opportunity to discuss this information with GEAM managers, including senior executives, representatives from the legal, compliance and finance departments, and investment personnel. The Board members posed questions to these representatives and engaged in substantive discussions with them concerning GEAM’s investment process.
In reaching their determination relating to continuance of the Fund’s investment advisory agreement, the Board members considered all factors that they deemed relevant, including the factors discussed below. In their deliberations, the Board members did not identify any particular information that was all-important or controlling, and each Board member may have attributed different weights to the various factors. In particular, the Board members focused on the following:
The Nature, Extent And Quality Of Services Provided.
The Board members reviewed the services provided by GEAM, taking into account their extensive past experiences with GEAM. They focused on the favorable attributes of GEAM, including (i) an investment philosophy oriented toward long-term performance; (ii) effective processes used for selecting investments and brokers; (iii) effective processes used for providing Fund administration, including controllership and compliance functions and oversight of the performance of other companies that provide services to the Fund; (iv) highly skilled professionals including analysts, research professionals, traders and portfolio managers with a depth of experience relevant to the Fund; (v) access to significant technological resources from which the Fund may benefit; and (vi) a favorable history and reputation. The Board members noted that the Fund represents only a small portion of the assets managed by GEAM, but benefits from a full array of services and resources provided by GEAM.
In light of these discussions, the Board, including the independent Board members, concluded that GEAM's services continue to be satisfactory.
Investment Performance Of The Fund.
The Board members considered the investment performance of the Fund for various periods. The Board members reviewed detailed comparisons of the performance of the Fund with the relevant securities index and peer groupings of mutual funds prepared by
29
| | |
| Advisory and Administrative Agreement Renewal | | (unaudited) |
Morningstar with respect to various periods. The Board members also engaged in detailed discussions with GEAM management about its investment process and performance results. These discussions focused on the Fund's investment objective, the number and experience of portfolio management and supporting research personnel, the investment style and approach employed, the likely market cycles for the investment style and relative underperformance. The Board members discussed GEAM’s investment approach with respect to the Fund, and the reasons for the Fund's relative underperformance.
The Board, including the independent Board members, concluded that the Fund’s performance was acceptable overall taking into consideration the factors discussed above.
Cost Of The Services Provided And Profits Realized From The Relationship With The Fund.
The Board members considered the fees paid to GEAM by the Fund and the cost of the services provided to the Fund by GEAM. The Board members reviewed the information they had requested from GEAM concerning its profitability. The Board members considered the profit margin information for GEAM's investment company business as a whole, as well as GEAM's profitability data for the Fund. The Board members reviewed GEAM's assumptions and the methods of cost allocation used by GEAM in preparing Fund-specific profitability data. The Board members also discussed with GEAM the basis for its belief that the methods of allocation used were reasonable for each area of its business.
Information was presented regarding the financial condition of GEAM for various past periods. The Board members noted and discussed the additional services provided by GEAM to the Fund compared to other investment products managed by GEAM, and previously had been provided a study conducted by the Investment Company Institute that discusses and compares advisory fees and services for mutual funds and institutional separate accounts. The Board members determined that GEAM should be entitled to earn a reasonable level of profits for the services it provides to the Fund. The Board members also recognized that GEAM had made significant investments in its business and had not fully recovered the sums invested. The Board also considered that GEAM continues to make a substantial investment in fulfilling its obligations to the Fund and supporting its Fund-related activities.
Based on their review, the Board, including the independent Board members, concluded that they were satisfied that the level of profitability achieved by GEAM from its relationship with the Fund was not unreasonable or excessive.
The Extent To Which Economies Of Scale Would Be Realized As The Fund Grows And Whether Fee Levels Would Reflect Such Economies Of Scale.
Although the Board noted that the Fund did not experience significant growth in assets over the past year, the Board members considered the extent to which economies of scale would be realized as the Fund grows, and whether fee levels reflect these economies of scale for the benefit of Fund investors. The Board members considered the substantial infrastructure investments that GEAM has made with respect to its operations and its commitment to continue investing resources to enhance services to Fund shareholders. The Board members recognized the benefits to the Fund of GEAM's past investment in its operations through the expenditure of sums to support its substantial infrastructure, and that, with respect to all GEAM managed mutual funds, GEAM has not yet fully recouped that investment. The Board members also recognized the benefits to the Fund of being able to leverage a favorable cost structure achieved with respect to the Fund’s other operating expenses as a result of GEAM’s large overall base of assets under management and its vendor management practices.
Comparison Of Services To Be Rendered And Fees To Be Paid.
The Board members discussed the services provided to the Fund by GEAM, and the fees charged for those services. The Board members reviewed information concerning the fee and expense ratios for the Fund, and comparative information with respect to peer groupings of mutual funds prepared by Morningstar. They discussed that the Fund’s figures were within the applicable peer group ranges. In light of the foregoing, the Board, including the independent Board members, determined that the advisory fees were reasonable in relation to the services provided to the Fund.
Fall-Out Benefits.
The Board members considered other actual and potential financial benefits that GEAM may derive from its relationship with the Fund, including, to the extent applicable, soft dollar commission benefits generated
30
| | |
| Advisory and Administrative Agreement Renewal | | (unaudited) |
through Fund portfolio transactions. The Board members noted, however, that the Fund benefits from the vast array of resources available through GEAM, and that the Fund represents only a small portion of the assets managed by GEAM.
Conclusion.
No single factor was determinative to the Board’s decision. Based on their discussion and such other matters as were deemed relevant, the Board, including the independent Board members, concluded that renewal of the advisory agreement was in the best interests of the Fund and its shareholders.
31
| | |
| Additional Information | | (unaudited) |
Information about Directors and Executive Officers:
The business and affairs of the Company are managed under the direction of the Company’s Board of Directors. Information pertaining to the Directors and officers of the Company is set forth below.
Interested Directors and Executive Officers
Michael J. Cosgrove
Address c/o GEAM 3001 Summer St. Stamford, CT 06905
Age 61
Position(s) Held with Fund Chairman of the Board and President
Term of Office and Length of Time Served Until successor is elected and qualified – 14 years
Principal Occupation(s) During Past 5 years President and Chief Executive Officer – Mutual Funds and Intermediary Business since March 2007; Executive Vice President of GEAM from February 1997 to March 2007; Director of GEAM since 1988; Vice President, GE Capital Corporation, an indirect wholly-owned subsidiary of GE, since December 1999; Executive Vice President – Sales and Marketing of GEAM, a wholly-owned subsidiary of GE that is registered as an investment adviser under the Investment Advisers Act of 1940, as amended, from March 1993 to March 2007.
Number of Portfolios in Fund Complex Overseen by Director 49
Other Directorships Held by Director Chairman of the Board and President of GE Funds from 1993 to February 2011, and GE Institutional Funds since its inception; Trustee of General Electric Savings & Security Trust, General Electric S&S Income Fund, General Electric S&S Program Mutual Fund (“GE Savings & Security Funds”), Elfun Funds, General Electric Insurance Plan Trust, General Relief Loan Fund, and General Electric Pension Trust since 1988; Trustee of Fordham University since 2002; Trustee of GE Volunteers since 1993; Director, GE Asset Management (Ireland) since February 1999; Director, GE Asset Management Funds Plc., GE Asset Canada Company, and GE Asset Management Limited since 1998.
Matthew J. Simpson
Address c/o GEAM 3001 Summer St. Stamford, CT 06905
Age 49
Position(s) Held with Fund Director and Executive Vice President
Term of Office and Length of Time Served Until successor is elected and qualified – 3 years
Principal Occupation(s) During Past 5 years Executive Vice President, General Counsel and Secretary of GEAM since July 2007; Senior Vice President and General Counsel – Marketing and Client Services (formerly Asset Management Services), at GEAM and Senior Vice President and General Counsel of GEAMS from February 1997 to June 2007; Vice President and Associate General Counsel of GEAM from October 1992 to February 1997; Vice President of GE Funds, GE Institutional Funds and GE LifeStyle Funds from September 2003 to June 2007; Secretary of GE Funds and GE Institutional Funds from 1997 to June 2007; Vice President of Elfun Funds and GE Savings & Security Funds from October 2003 to June 2007; Assistant Secretary of Elfun Funds and GE Savings & Security Funds from 1998 to June 2007.
Number of Portfolios in Fund Complex Overseen by Director 49
Other Directorships Held by Director Trustee of GE Institutional Funds, Elfun Funds and GE Savings & Security Funds since July 2007. Trustee of GE Funds from July 2007 to February 2011
32
| | |
| Additional Information | | (unaudited) |
Joon Won Choe
Address c/o GEAM 3001 Summer St. Stamford, CT 06905
Age 41
Position(s) Held with Fund Vice President & Secretary
Term of Office and Length of Time Served Until successor is elected and qualified – Vice President and Secretary – less than 1 year
Principal Occupation(s) During Past 5 years Senior Vice President and Associate General Counsel at GEAM since June 2010; Vice President and Associate General Counsel at GEAM from November 2005 to June 2010; Vice President and Secretary of GE Funds from September 2010 to February 2011. Vice President and Secretary of GE Institutional Funds and GE Investments Funds, Inc. since September 2010; Vice President and Assistant Secretary of Elfun Funds and GE Savings & Security Funds since September 2010.
Number of Portfolios in Fund Complex Overseen by Officer N/A
Other Directorships Held by Officer N/A
Robert Herlihy
Address c/o GEAM 3001 Summer St. Stamford, CT 06905
Age 43
Position(s) Held with Fund Senior Vice President and Chief Compliance Officer
Term of Office and Length of Time Served Until successor is elected and qualified – 5 years
Principal Occupation(s) During Past 5 years Chief Compliance Officer of GEAM, GE Institutional Funds, Elfun Funds, and GE Savings and Security Funds since July 2005; Chief Compliance Officer of GE Funds from July 2005 to February 2011; Manager of Fund Administration at GEAM from 2002 – 2005.
Number of Portfolios in Fund Complex Overseen by Officer N/A
Other Directorships Held by Officer N/A
Eunice Tsang
Address c/o GEAM 3001 Summer St. Stamford, CT 06905
Age 51
Position(s) Held with Fund Treasurer
Term of Office and Length of Time Served Until successor is elected and qualified – less than one year
Principal Occupations(s) During Past 5 years Treasurer of GE Institutional Funds, Elfun Funds and GE Savings and Security Funds since January 2010; Treasurer of GE Funds from January 2010 to February 2011; GEAM Operational Controllership and Technical Accounting Manager since December 2007; Financial Planning & Analysis Manager – Performance Leader from June 2005 to December 2007; GEAM Quality Black Belt from 2001 to June 2005; Financial Planning & Analysis Manager from 2000 to 2001; and Mutual Fund Assistant Controller from October 1997 to 2000.
Number of Portfolios in Fund Complex Overseen by Officer N/A
Other Directorships Held by Officer N/A
33
| | |
| Additional Information | | (unaudited) |
Non-Interested Directors
John R. Costantino
Address c/o GEAM 3001 Summer St. Stamford, CT 06905
Age 64
Position(s) Held with Fund Director
Term of Office and Length of Time Served Until successor is elected and qualified – 14 years
Principal Occupation(s) During Past 5 years General Partner, NGN Capital LLC since 2006; Managing Director, Vice President of Walden Capital Management since 1996.
Number of Portfolios in Fund Complex Overseen by Director 41
Other Directorships Held by Director Trustee of GE Funds since 1993, GE Institutional Funds since its inception; Trustee of Fordham University from 1989 to 1995 and 2001 to 2007 and Trustee Emeritus since 2007; Trustee of Neuro Science Research Institute since 1986; Trustee of Gregorian University Foundation from 1992 to 2007; Director of Artes Medical from 2006 to 2008.
William J. Lucas
Address c/o GEAM 3001 Summer St. Stamford, CT 06905
Age 61
Position(s) Held with Fund Director
Term of Office and Length of Time Served Until successor is elected and qualified – 13 years (No longer serves as Trustee effective November 4, 2010)
Principal Occupation(s) During Past 5 years Retired since 2010, previously Vice President and Treasurer of Fairfield University since 1983.
Number of Portfolios in Fund Complex Overseen by Director 41
Other Directorships Held by Director Trustee of GE Funds since 1993, and GE Institutional Funds since its inception.
Robert P. Quinn
Address c/o GEAM 3001 Summer St. Stamford, CT 06905
Age 74
Position(s) Held with Fund Director
Term of Office and Length of Time Served Until successor is elected and qualified – 14 years
Principal Occupation(s) During Past 5 years Retired since 1983 from Salomon Brothers Inc.
Number of Portfolios in Fund Complex Overseen by Director 41
Other Directorships Held by Director Trustee of GE Funds since 1993, and GE Institutional Funds since its inception; Trustee, St. Francis Hospital Corp. since 1980.
The Statement of Additional Information for the Fund includes additional information about the Directors and Officers and is available, without charge, upon request by calling 1-800-493-3042.
34
Investment Adviser and Administrator
GE Asset Management Incorporated
Board of Directors
Michael J. Cosgrove, Chairman
John R. Costantino
William J. Lucas*
Robert P. Quinn
Matthew J. Simpson
Secretary
Joon Won Choe
Assistant Secretary
Michelle Matzelle
Treasurer
Eunice Tsang
Assistant Treasurers
Tatyana Begun**
Casey Yantosca
Distributor
GE Investment Distributors, Inc.
Member FINRA and SIPC
Counsel
Sutherland, Asbill & Brennan, LLP
Custodian
State Street Bank & Trust Company
Independent Registered Public Accounting Firm
KPMG LLP
Officers of the Investment Adviser
James W. Ireland, President and Chief Executive Officer
Cheryl H. Beacock, Senior Vice President, Human Resources
Paul M. Colonna, President and Chief Investment Officer – Fixed Income Investments
Michael J. Cosgrove, President and Chief Executive
Officer – Mutual Funds & Intermediary Business
Ralph R. Layman, President and Chief Investment Officer – Public Equity Investments
Maureen B. Mitchell, President – Institutional Sales and Marketing
Steve Rullo, Chief Information Officer (since February 2011)
Matthew J. Simpson, Executive Vice President, General Counsel and Secretary
Don W. Torey, President – Alternative Investments
John J. Walker, Executive Vice President, Chief Operating Officer
David Wiederecht, President and Chief Investment Officer – Investment Strategies
Tracie Winbigler, Executive Vice President, Chief Financial Officer***
| * | | As of November 4, 2010, Mr. Lucas no longer served as a director of the Company. |
| ** | | As of February 18, 2011, Ms. Begun no longer served as an officer of the Company. |
| *** | | Effective January, 2011. |
35
Investment Adviser
GE Asset Management Incorporated
3001 Summer Street
PO Box 7900
Stamford, CT 06904-7900
Distributor
GE Investment Distributors, Inc.
member FINRA and SIPC
3001 Summer Street
PO Box 7900
Stamford, CT 06904-7900
The Fund files its complete schedule of portfolio holdings with the Securities and Exchange Commission for the first and third quarters of each fiscal year on Form N-Q. The Fund’s Forms N-Q, as well as a description of the policies and procedures that the Fund uses to determine how to vote proxies (if any) relating to portfolio securities is available without charge (i) upon request, by calling 1-800-493-3042; (ii) on the Fund’s website at http://www.geam.com; and (iii) on the Commission’s website at http://www.sec.gov. The Fund’s Forms N-Q may be reviewed and copied at the Commission’s Public Reference Room in Washington, DC—information on the operation of the Public Reference Room may be obtained by calling 1-800-SEC-0330.
Information (if any) regarding how the Fund voted proxies relating to portfolio securities during the most recently disclosed 12-month period ended June 30 is available without charge (i) through the Fund’s website at http://www.geam.com; and (ii) on the Commission’s website at http://www.sec.gov.

GE Investments Funds, Inc.
Total Return Fund
Annual Report
December 31, 2010

GE Investments Funds, Inc.
| | |
| |
| Total Return Fund | | Contents |
This report is prepared for Policyholders of certain variable contracts and may be distributed to others only if preceded or accompanied by the variable contract’s current prospectus and the current prospectus of the Fund available for investments thereunder.
| | |
| Notes to Performance | | December 31, 2010 (unaudited) |
The information on the following performance pages relates to the GE Investments Total Return Fund (the “Fund”).
Total returns take into account changes in share price and assume reinvestment of dividends and capital gains distributions, if any. Total returns shown are net of Fund fees and expenses but do not reflect fees and charges associated with the variable contracts such as administrative fees, account charges and surrender charges, which, if reflected, would reduce the Fund’s total returns for all periods shown.
The performance data quoted represent past performance; past performance does not guarantee future results. Investment return and principal value will fluctuate so your shares, when redeemed, may be worth more or less than their original cost. Current performance may be higher or lower than the performance data quoted. Periods less than one year are not annualized. Please call 800-493-3042 or visit the Fund’s website at http://www.geam.com for the most recent month-end performance data.
An investment in the Fund is not a deposit of any bank and is not insured or guaranteed by the Federal Deposit Insurance Corporation (FDIC) or any other government agency. An investment in the Fund is subject to risk, including possible loss of principal invested.
The S&P 500® Index is an unmanaged, market capitalization-weighted index of stocks of 500 large U.S.
companies, which is widely used as a measure of large-cap stock market performance. The Barclays Capital U.S. Aggregate Bond Index is an unmanaged market value-weighted index of taxable investment-grade debt issues, including government, corporate, asset-backed and mortgage-backed securities, with maturities of one year or more. This index is designed to represent the performance of the U.S. investment-grade first rate bond market. The results shown for the foregoing indices assume the reinvestment of net dividends or interest. They do not reflect the actual cost of investing in the instruments that comprise each index.
The peer universe of the underlying annuity funds used for the peer group average annual total return calculation is based on a blend of Morningstar peer categories, as shown. Morningstar is an independent mutual fund rating service. A Fund’s performance may be compared to or ranked within a universe of mutual funds with investment objectives and policies similar but not necessarily identical to that of the Fund.
©2010 Morningstar, Inc. All Rights Reserved. The Morningstar information contained herein: (1) is proprietary to Morningstar and/or its content providers; (2) may not be copied or distributed; and (3) is no warranted to be accurate, complete or timely. Neither Morningstar nor its content providers are responsible for any damage or losses relating from any use of this information. Past performance is no guarantee or future results.
GE Investment Distributors, Inc., Member of FINRA & SIPC, is the principal underwriter and distributor of the GE Investments Funds, Inc. and a wholly owned subsidiary of GE Asset Management Incorporated, the investment adviser of the Fund.
1
| | |
| Total Return Fund | | (unaudited) |

Paul M. Colonna

Ralph R. Layman

Diane M. Wehner

Greg Hartch

Thomas R. Lincoln

David Wiederecht
The Total Return Fund is managed by a team of portfolio managers that includes Paul M. Colonna, Greg Hartch, Ralph R. Layman, Thomas R. Lincoln, Diane M. Wehner and David Wiederecht. Mr. Hartch and Mr. Wiederecht are each vested with oversight authority for determining asset allocations for the Fund, including the full discretion to allocate the Fund’s assets to sub-adviser(s) retained by GE Asset Management. Each of the other portfolio managers is responsible for managing one of the following sub-portfolios: U.S. equity, U.S. mid-cap equity, international equity and fixed income. Mr. Lincoln manages the U.S. equity portion, Ms. Wehner manages the U.S. mid-cap equity portion, Mr. Layman manages the international equity portion and Mr. Colonna manages the fixed income portion, each with a team of portfolio managers and analysts. GE Asset Management has also retained Urdang Securities Management, Inc. (“Urdang”) and Palisade Capital Management, L.L.C. (“Palisade”) to each act as sub-adviser to that portion of the Fund’s assets allocated by Mr. Hartch and Mr. Wiederecht to real estate-related investments and small-cap equity investments, respectively. The sub-portfolios underlying the Fund are managed independently of each other and the portfolio managers and sub-adviser(s) have full discretion over their particular sub-portfolio; however, the portfolio management team is collaborative to ensure strict adherence to the Fund’s objectives. In addition to oversight authority for asset allocation, Mr. Hartch and Mr. Wiederecht may at times adjust the Fund’s investment exposure through the use of various investment techniques such as investments in derivative instruments.
Paul M. Colonna is President and Chief Investment Officer — Fixed Income and a Director at GE Asset Management. Since January 2005, he has been responsible for the fixed income portion of the Total Return Fund. Prior to joining GE Asset Management in February 2000, Mr. Colonna was a senior portfolio manager with the Federal Home Loan Mortgage Corporation, overseeing the Mortgage Investment Group. Mr. Colonna became President — Fixed Income in March 2007.
Greg Hartch is a Senior Vice President — Tactical Asset Allocation at GE Asset Management. He has served as a portfolio manager to the Elfun Diversified Fund since January 2011. Mr. Hartch joined GE Asset Management in 2002 and has held various positions at GE Asset Management including Senior Vice President — Alternative Assets from 2002-2004, Director of Fixed Income Research from 2004-2007 and Managing Director — International Real Estate from 2007 to 2010.
Ralph R. Layman is President and Chief Investment Officer — Public Equities and a Director at GE Asset Management. He manages the overall public equity investments for GE Asset Management. Mr. Layman has been responsible for the international equity portion of the Total Return Fund since 1997. Mr. Layman joined GE Asset Management in 1991 as senior vice president for international investments and became an Executive Vice President in 1992, President — International Equities in March 2007 and President — Public Equities since July 2009.
Thomas R. Lincoln is a Senior Vice President of GE Asset Management. He has been a member of the portfolio management team for the Total Return
2

Fund since May 2007. Mr. Lincoln joined GE Asset Management in 1994 as a financial analyst in U.S. Equities. Mr. Lincoln became part of the investment management team for U.S. Equities in 1997 and portfolio manager for U.S. Equities in 2003.
Diane M. Wehner is a Senior Vice President of GE Asset Management. She has been a portfolio manager of the Total Return Fund since January 2006. Before joining GE Asset Management, Ms. Wehner was a Vice President and senior portfolio manager from January 1997 to June 2001, and associate portfolio manager from May 1995 to January 1997, with Benefit Capital Management Corporation. Ms. Wehner has served as an analyst/ portfolio manager in the investment management industry since 1985.
David Wiederecht is the President and Chief Investment Officer — Investment Strategies and a Director at GE Asset Management. He has served as a portfolio manager to the Elfun Diversified Fund since January 2011. Mr. Wiederecht joined GE Asset Management in 1988 and has held various positions at GE Asset Management including Vice President — Alternative Investments/Private Equity/Hedge Fund from 1998 to 2004, Managing Director — Alternative Investments from 2004 to 2008, and President — Investment Strategies since 2008.
| Q. | How did the GE Total Return Fund perform compared to its benchmark and Morningstar peer group for the twelve-month period ended December 31, 2010 |
| A. | For the twelve-month period ended December 31, 2010, the GE Investments Total Return Fund returned 9.64% for the Class 1 shares, 9.59% for Class 2 shares, and 9.37% for Class 3 shares. The Fund’s broad based benchmarks, the S&P 500 Index and the Barclays Capital U.S. Aggregate Bond Index, returned 15.06% and 6.54%, respectively. The Fund’s Morningstar peer group of 307 U.S. Moderate Allocation funds returned an average of 12.19% for the same period. |
| Q. | What market conditions impacted the performance of the Fund and what were the primary drivers of Fund performance? |
| A. | The absolute performance of the Fund for the twelve month period ended December 31, 2010 was primarily driven by the Fund’s allocation to US and international equity markets and fixed income markets. The Fund’s |
| | top performing asset classes were its exposure to mid cap and small cap U.S. equity markets which posted gains of 27.1% and 27.2% in 2010. All other asset classes provided positive returns, although international equities lagged US large cap equities by several hundred basis points and cash produced only a nominal return. |
The Fund has traditionally had a higher allocation to international equities than its peer group. In 2010, the underperformance of international equities relative to U.S. equities was a key driver in the performance of the Fund relative to its peer group. Other factors that contributed to the relative performance were (i) positive contributions from allocations to mid cap and small cap U.S. equity markets; (ii) negative contributions from security selection within several of the Fund’s equity strategies which underperformed their benchmarks; and (iii) positive contributions from security selection within the Fund’s fixed income and U.S. mid cap strategies which outperformed their benchmarks.
As of December 31, 2010, the Fund’s four largest allocations by asset class were: (i) fixed income core plus (30.9% of the Fund; benchmark Barclays Capital U.S. Aggregate), (ii) U.S. large cap equities (27.9% of the Fund; benchmark S&P 500), (iii) international equities (24.0% of the Fund; benchmark MSCI EAFE), and (iv) U.S. mid cap equities (11.9% of the Fund; benchmark Russell Mid Cap). A summary of these four markets and their contribution to performance are summarized below.
Fixed Income Markets and Performance
The fixed income market benefited from both declining interest rates and spread compression over the last fiscal period, producing positive price returns which added to income generated from coupon interest. U.S. 2-year and 10-year Treasury note yields ended the year at 0.59% and 3.29% respectively, down 54 basis points each. The U.S. 30-year bond finished the year yielding 4.33%, down 31 basis points. As the U.S. economy recovered in 2010 and growth expectations for 2011 picked up, non-treasury securities outperformed treasury securities during the period due to tightening spreads. The Barclays Capital U.S. Credit Index yield spread narrowed 11 basis points, which contributed to a total return of 8.47% last year, while the broader Barclays Capital U.S. Aggregate Index returned 6.54%. Commercial mortgage-backed securities experienced the largest spread compression and led all sectors with an annual return of
3
| | |
| Total Return Fund | | (unaudited) |
20.4%. Yield spreads on high yield and emerging market debt also narrowed contributing to double digit returns for both (BC High Yield Index returned 15.12% and JPM EMBI-GD Index returned 12.24%).
The Fund’s fixed income core plus strategy allocation returned 8.21%, outperforming its benchmark by 1.67%. The largest contributor to the fixed income allocation’s performance on an absolute basis and relative to its benchmark was the overweight positions in investment grade credit and commercial mortgage-backed securities plus non-index allocations to high yield and emerging market debt. Security selection within the agency and commercial MBS sectors added value as did an overweight in financial versus non-corporate issuers in investment grade credit. Duration positioning had a negative effect on performance, primarily in April and May when the fund’s duration was shorter than that of the benchmark and U.S. interest rates fell significantly in a flight to quality away from risky assets brought on by the fiscal crises among the European peripheral countries, namely Greece, Ireland, Portugal and Spain.
U.S Large Cap Equity Markets and Performance
2010’s 15% advance did not feel like an easy climb for the S&P 500, amid ongoing debate around the durability of the economic expansion. Indeed, all U.S. equity indices were in negative territory at mid-year and over much of the summer, beset by concerns about the European debt crisis, persistently high unemployment levels and skyrocketing government debt. However, reassurances that the Fed would purchase additional treasury bonds in a $600B “quantitative easing-2” program ignited a mighty second- half rally. In this environment, cyclical sectors generally outperformed, while defensive sectors lagged. For the year, the S&P 500 consumer discretionary, industrials, materials and energy each advanced over 20%, while health care, utilities and IT lagged.
2010 was a challenging investment environment for large cap, high quality investors. Small and mid cap companies led — typical in the early innings of economic recovery. Smaller companies also benefitted from increased M&A activity as larger companies looked to spend excess balance sheet cash on strategic acquisitions. Low quality also outperformed high quality, with an approximately 22% increase in S&P 500 C-rated companies, while the high-quality A-rated companies rose only 15%. Our large cap
equity portfolio managers generally prefer to invest in high quality companies, and acknowledge that relative performance may be challenged in the early stages of an economic recovery, when higher-risk (i.e., lower quality) companies get re-rated. We continue to believe that higher quality companies make the best long-term investments, and a diversified portfolio of high quality large caps has the potential to outperform over a full market cycle.
Amid the year’s uncertainties, correlations of performance among S&P 500 stocks reached levels unseen since the Great Depression. It was difficult for the active manager to differentiate as top-down factors moved the markets, with fundamentals largely ignored. For example, Microsoft achieved and raised earnings estimates throughout the year, yet suffered severe multiple contraction. This seeming disconnect between fundamentals, valuations and performance created a source of frustration for many large-cap active managers.
In 2010, the Fund had significant allocations to two U.S. large cap equity strategies, large cap growth and U.S. core, both of which underperformed the S&P 500 Index. U.S. large cap growth returned 9.61%, underperforming by 5.45% while U.S. core returned 12.48%, underperforming by 2.58%.
International Equity Markets and Performance
Markets were volatile for much of the year as contradictory forces dampened performance early in the year but gave way to strong gains in the second half. The evolving sovereign debt crisis in Europe negatively affected markets concerned about a growing need for austerity but the persistence of low rates, anecdotal evidence of an improving global economy and strong earnings across the globe pushed stocks higher in all major markets. Similarly, doubts regarding much-needed regulatory reform in the financial sector cast a cloud over markets in the first half but increased clarity from bodies such as the Basel 3 Committee regarding bank capitalization, liquidity and leverage provided much-needed transparency to investors later in the year.
The Fund’s allocation to international equity returned 6.01% while the MSCI EAFE benchmark returned 7.75%. Positive impact was seen from holdings in materials, energy stocks and telecom services. The steady rise of commodity prices throughout the year was highly beneficial to metals and mining stocks and fertilizer companies leveraged to rising
4
crop prices. A somewhat different result was seen in energy where despite rising oil prices, a combination of the BP crisis and low natural gas prices saw that sector underperform. An underweight in the underperforming telecom sector was also beneficial for performance.
Most of the negative performance in the portfolio came from holdings in the financial sector, mainly in European banks. Although underweight, the portfolio was hit by the assumption that all European banks would be dragged down by the sovereign debt crisis, although direct exposure to the troubled markets of Greece, Ireland and Portugal was insignificant. Japanese holdings, especially those in the export markets also suffered due to a strong Yen.
U.S. Mid Cap Equity Markets and Performance.
In general, correlations of performance among midcap stocks reached historically high levels in 2010. It was difficult for active managers to differentiate as top-down factors moved the markets, with fundamentals largely ignored. An offset to this lack of differentiation was increased M&A activity as larger companies looked to spend excess balance sheet cash on strategic acquisitions. The Fund benefited from consolidation with several companies being acquired in the latter part of the year. Growth stocks outperformed Value by a small margin during the year which helped performance given our skew towards companies with growth-at-a-reasonable-price. From a sector perspective, information technology, though it underperformed the overall market was the most additive to performance due to good stock selection. Meanwhile, though new investments in the industrial and basic materials sectors participated in the year-end rally, performance was dominated by lower quality, higher beta, more cyclical companies. Finally, within the financial sector our underweight in regional banks/thrifts detracted from performance along with underperformance in individual stocks within the insurance and exchanges industries.
The Fund’s allocation to mid cap stocks returned 27.1%, outperforming the Russell Mid Cap index which returned 25.5% during the twelve-month period, due to solid stock selection within the information technology, utilities, and consumer staples sectors. Within information technology, several software names meaningfully outperformed the overall market. Specifically, Rovi Corporation (+95%) benefited as investors continue to recognize its strong technology position and view the company as a play on
the future of digital entertainment and connected devices. Citrix Systems (+65%) performed well as the company benefited from the trend towards desktop virtualization. Arcsight Inc. (+65%) a developer of security software was acquired by Hewlett Packard. Also, within information technology, the Fund was positively impacted by Baidu (+135%), a Chinese internet search engine company which benefited from its dominant position within the fast-growing Chinese internet industry. The Fund’s underweight in the utility sector along with good stock selection added to Fund performance with investments such as Northeast Utilities (+28%). Consumer staple stocks were also strong contributors. For example, Mead Johnson Nutrition (+45%), a global leader in the pediatric-nutrition market, outperformed in part due to its large exposure to emerging markets and its attractiveness as a takeout candidate.
Detracting from performance were some of our more defensive investments within the industrial, materials, and financial sectors. Within the industrial sector, Alliant Techsystems (-16%) detracted from performance amid ongoing concerns about its NASA contract and its exposure to defense budgets. In the financial sector, diversified insurance company HCC (+6%) lagged, as overall pricing in the property and casualty industry remains under pressure. Among banks, People’s United Financial (-12%) is considered one of the highest quality thrifts in the industry having avoided the missteps of its competition in the residential real estate debacle. With an increased appetite for risk, investors favored lower quality regional banks with more leverage to an economic recovery. Meanwhile, basic materials company Monsanto (-13%) corrected as the company restructured its chemical business in response to overcapacity and competitive pricing resulting in a near-term hit to earnings.
As of December 31, 2010, the Fund also had smaller allocations to emerging market equities, small cap U.S. equities, REITs, and cash. None of these allocations exceeded 5% of the Fund as of December 31, 2010.
| Q. | Were there any significant changes to the Fund during the period? |
| A. | During the past year, we did make certain tactical changes to the Fund. As the year progressed and we became more confident that the economy would avoid a double dip, we gradually reduced cash in the portfolio, increasing both equity and fixed income |
5
| | |
| Total Return Fund | | (unaudited) |
| | allocations. We used a portion of the cash to add real estate exposure to the Fund in the form of REITs managed by Urdang. The allocation to REITs managed by Urdang returned 11.6% for the year. In September, we made a tactical decision to reduce our exposure slightly to emerging market equities in favor of U.S. large cap equities on the belief that a stronger U.S. recovery would result in U.S. equities outperforming in the 4th quarter of 2010. This change also added to performance as U.S. equities outperformed Emerging Market equities. Finally, in mid December, we added a third U.S. equity large cap strategy, equity yield at a 4% allocation, on the belief that companies with higher existing dividends or with dividends that are likely to grow will outperform in 2011. As of December 31, 2011, the Fund was overweight equities with 67.3% of the Fund invested in equity strategies. |
Finally, Judy Studer, GEAM’s Chief Marktet Strategist and portfolio manager responsible for asset allocation for the Fund, retired from GE Asset Management as of December 31, 2010. She is replaced by David Wiederecht, President and CIO of Investment Strategies for GEAM and Greg Hartch, Senior Vice President, Tactical Asset Allocation and Total Return Fund Portfolio Manager, starting January 1, 2011.
6
| | |
| Total Return Fund | | (unaudited) |
Understanding Your Fund’s Expenses
As a shareholder of the Fund you incur transaction and ongoing expenses. Transaction expenses including sales charges on purchases payments, reinvested dividends (or other distributions), and redemption fees directly reduce the investment return of the Fund. Ongoing costs include portfolio management fees, distribution and services fees, professional fees, administrative fees and other Fund expenses. The following example is intended to help you understand your ongoing costs (in dollars) of investing in the Fund and to compare these costs with the ongoing costs of investing in other mutual funds.
To illustrate these ongoing costs, we have provided an example and calculated the expenses paid by investors during the period. The information in the following table is based on an investment of $1,000, which is invested at the beginning of the period and held for the entire six-month period ended December 31, 2010.
Actual Expenses
The first section of the table provides information about actual account values and actual expenses. You may use the information in this section, together with the amount
you invested, to estimate the expenses that you paid over the period. To do so, simply divide your account value by $1,000 (for example, an $8,600 account value divided by $1,000 = 8.6), then multiply the result by the number given for your class under the heading “Expenses Paid During Period.”
Hypothetical Example for Comparison Purposes
The second section of the table provides information about hypothetical account values and hypothetical expenses based on the Fund’s actual expense ratio and an assumed rate of return of 5% per year before expenses, which is not the Fund’s actual return. You may use this information to compare the ongoing costs of investing in the Fund and other funds. To do so, compare this 5% hypothetical example with the 5% hypothetical examples that appear in the shareholders reports of other funds.
Please note that the expenses shown in the table for both “Actual” and “Hypothetical” do not reflect any transaction costs, such as sales charges or redemption fees. Additionally, the expenses shown do not reflect the fees or charges associated with variable contracts through which shares of the Fund are offered.
July 1, 2010 – December 31, 2010
| | | | | | | | | | | | |
| | | Account value at the
beginning of the period ($) | | | Account value at the
end of the period ($) | | | Expenses paid
during period ($)* | |
Actual Fund Return** | | | | | | | | | |
Class 1 | | | 1,000.00 | | | | 1,167.12 | | | | 3.77 | |
Class 2 | | | 1,000.00 | | | | 1,166.85 | | | | 4.04 | |
Class 3 | | | 1,000.00 | | | | 1,166.00 | | | | 5.13 | |
Hypothetical 5% Return (2.5% for the period) | |
Class 1 | | | 1,000.00 | | | | 1,021.50 | | | | 3.52 | |
Class 2 | | | 1,000.00 | | | | 1,021.25 | | | | 3.77 | |
Class 3 | | | 1,000.00 | | | | 1,020.26 | | | | 4.79 | |
| * | | Expenses are equal to the Fund’s annualized expense ratio of 0.69% for Class 1 shares, 0.74% for Class 2 shares and 0.94% for Class 3 shares, (for the period July 1, 2010 – December 31, 2010), multiplied by the average account value over the period, multiplied by 184/365 (to reflect the six month period) |
| ** | | Actual Fund Returns for the six-month period ended December 31, 2010 were as follows: 16.71% for Class 1 shares, 16.68% for Class 2 shares, and 16.60% for Class 3 shares. Past performance does not guarantee future results. |
7
| | |
| Total Return Fund | | (unaudited) |
Investment Profile
A mutual fund designed for investors who seek the highest total return, composed of current income and capital appreciation, as is consistent with prudent investment risk by investing primarily in a combination of U.S. and foreign equity and debt securities and cash.
Morningstar Performance Comparison
Based on average annual returns for periods ended 12/31/10
| | | | | | | | | | | | | | | | |
| | | | | | One
Year | | | Five
Year | | | Ten
Year | |
Number of Funds in peer group: | | | | | | | 307 | | | | 187 | | | | 144 | |
Peer group average annual total return: | | | | | | | 12.19% | | | | 3.46% | | | | 3.36% | |
Morningstar category in peer group:
U.S. Insurance Moderate Allocation | | | | | | | | | | | | | | | | |
Sector Allocation
as a % of Fair Value of $2,952,148 (in thousands) on December 31, 2010 (b)(c)
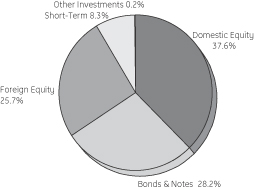
Top Ten Largest Holdings
as of December 31, 2010 (as a % of Fair Value) (b)(c)
| | | | |
U.S. Treasury Notes 2.63%, 08/15/20 | | | 2.72 | % |
Federal National Mortgage Assoc. 4.50%, 05/01/18 - 11/01/40 | | | 2.06 | % |
U.S. Treasury Bonds 3.88%, 08/15/40 | | | 1.41 | % |
Federal National Mortgage Assoc. 5.50%, 04/01/14 - 01/01/39 | | | 1.04 | % |
Federal National Mortgage Assoc. 4.50%, TBA | | | 0.99 | % |
Microsoft Corp. | | | 0.94 | % |
Schlumberger Ltd. | | | 0.80 | % |
Federal National Mortgage Assoc. 4.00%, 05/01/19 - 10/01/40 | | | 0.79 | % |
Federal National Mortgage Assoc. 4.00%, TBA | | | 0.72 | % |
QUALCOMM Inc. | | | 0.72 | % |
Change in Value of a $10,000 Investment
Class 1 Shares
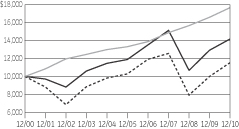
Average Annual Total Return
for the Periods Ended December 31, 2010
Class 1 Shares (Inception date: 7/1/85)
| | | | | | | | | | | | | | | | |
| | | One
Year | | | Five
Year | | | Ten
Year | | | Ending Value of a
$10,000 investment (a) | |
Total Return Fund | | | 9.64% | | | | 3.54% | | | | 3.52% | | | | 14,140 | |
S&P 500 Index | | | 15.06% | | | | 2.29% | | | | 1.41% | | | | 11,508 | |
Barclays Capital U.S. Aggregate Bond Index | | | 6.54% | | | | 5.80% | | | | 5.84% | | | | 17,633 | |
Change in Value of a $10,000 Investment
Class 2 Shares
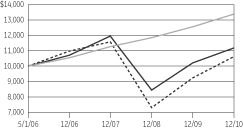
Average Annual Total Return
for the Periods Ended December 31, 2010
Class 2 Shares (Inception date: 5/1/06)
| | | | | | | | | | | | | | | | |
| | | One
Year | | | Three
Year | | | Since
Inception | | | Ending Value of a
$10,000 investment (a) | |
Total Return Fund | | | 9.59% | | | | -2.21% | | | | 2.41% | | | | 11,176 | |
S&P 500 Index | | | 15.06% | | | | -2.85% | | | | 1.26% | | | | 10,605 | |
Barclays Capital U.S. Aggregate Bond Index | | | 6.54% | | | | 5.90% | | | | 6.41% | | | | 13,366 | |
Change in Value of a $10,000 Investment
Class 3 Shares
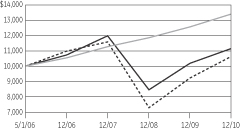
Average Annual Total Return
for the Periods Ended December 31, 2010
Class 3 Shares (Inception date: 5/1/06)
| | | | | | | | | | | | | | | | |
| | | One
Year | | | Three
Year | | | Since
Inception | | | Ending Value of a
$10,000 investment (a) | |
Total Return Fund | | | 9.37% | | | | -2.34% | | | | 2.33% | | | | 11,136 | |
S&P 500 Index | | | 15.06% | | | | -2.85% | | | | 1.26% | | | | 10,605 | |
Barclays Capital U.S. Aggregate Bond Index | | | 6.54% | | | | 5.90% | | | | 6.41% | | | | 13,366 | |
8

[GRAPHIC]
| (a) | Ending value of a $10,000 investment for the ten-year period or since inception, whichever is less. |
| (b) | The securities information regarding holdings, allocations and other characteristics is presented to illustrate examples of securities that the Fund has bought and the diversity of areas in which the Fund may invest as of a particular date. It may not be representative of the Fund’s current or future investments and should not be construed as a recommendation to purchase or sell a particular security. |
| (c) | Fair value basis is inclusive of Short Term Investment in GE Money Market Fund. |
See Notes to Performance on page 1 for further information, including an explanation of Morningstar peer categories.
Past performance does not predict future performance and the graphs and tables do not reflect the deduction of taxes that a shareholder would pay on Fund distributions or the redemption of Fund shares and do not reflect the fees or charges that would be associated with variable contracts through which shares of the Fund are offered.
Total Return Fund
| | |
| Schedule of Investments | | December 31, 2010 |
Total Return Fund
| | | | | | | | | | |
| | | |
| | | Number
of Shares | | | Fair
Value | | | |
Domestic Equity — 38.2%† | | | |
| |
Advertising — 0.5% | | | |
| | | |
Arbitron Inc. | | | 21,000 | | | $ | 871,920 | | | |
Omnicom Group Inc. | | | 314,688 | | | | 14,412,710 | | | |
| | | | | | | 15,284,630 | | | |
| |
Aerospace & Defense — 0.8% | | | |
| | | |
Alliant Techsystems Inc. | | | 50,648 | | | | 3,769,731 | | | (a) |
Hexcel Corp. | | | 283,100 | | | | 5,121,279 | | | (a) |
Honeywell International Inc. | | | 209,621 | | | | 11,143,453 | | | |
Rockwell Collins Inc. | | | 20,880 | | | | 1,216,469 | | | |
Teledyne Technologies Inc. | | | 16,000 | | | | 703,520 | | | (a) |
| | | | | | | 21,954,452 | | | |
| |
Agricultural Products — 0.1% | | | |
| | | |
Archer-Daniels-Midland Co. | | | 95,973 | | | | 2,886,868 | | | |
| |
Air Freight & Logistics — 0.1% | | | |
| | | |
FedEx Corp. | | | 25,695 | | | | 2,389,892 | | | |
UTi Worldwide Inc. | | | 70,329 | | | | 1,490,975 | | | |
| | | | | | | 3,880,867 | | | |
| |
Apparel Retail — 0.2% | | | |
| | | |
Aeropostale Inc. | | | 22,700 | | | | 559,328 | | | (a) |
American Eagle Outfitters Inc. | | | 12,100 | | | | 177,023 | | | |
The Buckle Inc. | | | 14,800 | | | | 558,996 | | | |
Urban Outfitters Inc. | | | 86,849 | | | | 3,110,063 | | | (a) |
| | | | | | | 4,405,410 | | | |
| |
Apparel, Accessories & Luxury Goods — 0.2% | | | |
| | | |
Coach Inc. | | | 102,621 | | | | 5,675,968 | | | |
Maidenform Brands Inc. | | | 12,000 | | | | 285,240 | | | (a) |
| | | | | | | 5,961,208 | | | |
| |
Application Software — 0.3% | | | |
| | | |
ACI Worldwide Inc. | | | 9,100 | | | | 244,517 | | | (a) |
Blackbaud Inc. | | | 29,600 | | | | 766,640 | | | |
Blackboard Inc. | | | 63,456 | | | | 2,620,733 | | | (a) |
Citrix Systems Inc. | | | 72,848 | | | | 4,983,532 | | | (a) |
Ebix Inc. | | | 12,800 | | | | 302,976 | | | (a) |
Parametric Technology Corp. | | | 33,500 | | | | 754,755 | | | (a) |
Solera Holdings Inc. | | | 3,500 | | | | 179,620 | | | |
SS&C Technologies Holdings Inc. | | | 2,800 | | | | 57,428 | | | (a) |
| | | | | | | 9,910,201 | | | |
| |
Asset Management & Custody Banks — 1.6% | | | |
| | | |
Affiliated Managers Group Inc. | | | 58,969 | | | | 5,850,904 | | | (a) |
Ameriprise Financial Inc. | | | 115,565 | | | | 6,650,766 | | | |
Franklin Resources Inc. | | | 4,487 | | | | 498,999 | | | |
Invesco Ltd. | | | 468,294 | | | | 11,267,154 | | | |
| | | | | | | | | | |
| | | |
| | | Number
of Shares | | | Fair
Value | | | |
| | | |
State Street Corp. | | | 368,013 | | | $ | 17,053,722 | | | (e) |
The Bank of New York
Mellon Corp. | | | 139,690 | | | | 4,218,638 | | | |
| | | | | | | 45,540,183 | | | |
| |
Automobile Manufacturers — 0.2% | | | |
| | | |
O’Reilly Automotive Inc. | | | 76,695 | | | | 4,633,912 | | | |
| |
Biotechnology — 1.4% | | | |
| | | |
Alexion Pharmaceuticals Inc. | | | 39,051 | | | | 3,145,558 | | | (a) |
Amgen Inc. | | | 282,068 | | | | 15,485,533 | | | (a,h) |
Cubist Pharmaceuticals Inc. | | | 6,000 | | | | 128,400 | | | (a) |
Gilead Sciences Inc. | | | 432,383 | | | | 15,669,560 | | | (a) |
Human Genome Sciences Inc. | | | 80,985 | | | | 1,934,732 | | | (a) |
Incyte Corp Ltd. | | | 112,436 | | | | 1,861,940 | | | (a) |
Vertex Pharmaceuticals Inc. | | | 78,735 | | | | 2,758,087 | | | (a) |
| | | | | | | 40,983,810 | | | |
| |
Brewers — 0.0%* | | | |
| | | |
Molson Coors Brewing Co. | | | 16,827 | | | | 844,547 | | | |
| |
Broadcasting — 0.1% | | | |
| | | |
Discovery Communications Inc. | | | 28,787 | | | | 1,200,418 | | | (a) |
Discovery Communications Inc. | | | 48,254 | | | | 1,770,439 | | | (a) |
| | | | | | | 2,970,857 | | | |
| |
Cable & Satellite — 0.5% | | | |
| | | |
DIRECTV | | | 214,899 | | | | 8,580,917 | | | (a) |
Liberty Global Inc. | | | 199,609 | | | | 6,764,749 | | | (a) |
| | | | | | | 15,345,666 | | | |
| |
Casinos & Gaming — 0.1% | | | |
| | | |
Penn National Gaming Inc. | | | 113,367 | | | | 3,984,850 | | | (a) |
| |
Coal & Consumable Fuels — 0.1% | | | |
| | | |
Peabody Energy Corp. | | | 61,048 | | | | 3,905,851 | | | |
| |
Communications Equipment — 1.4% | | | |
| | | |
Cisco Systems Inc. | | | 644,474 | | | | 13,037,709 | | | (a,h) |
Juniper Networks Inc. | | | 137,240 | | | | 5,066,901 | | | (a) |
QUALCOMM Inc. | | | 427,808 | | | | 21,172,218 | | | |
| | | | | | | 39,276,828 | | | |
| |
Computer Hardware — 0.7% | | | |
| | | |
Apple Inc. | | | 52,189 | | | | 16,834,084 | | | (a) |
Hewlett-Packard Co. | | | 58,230 | | | | 2,451,483 | | | |
| | | | | | | 19,285,567 | | | |
| |
Computer Storage & Peripherals — 0.2% | | | |
| | | |
Synaptics Inc. | | | 148,150 | | | | 4,352,647 | | | (a) |
| |
Construction & Engineering — 0.1% | | | |
| | | |
Quanta Services Inc. | | | 112,196 | | | | 2,234,944 | | | (a) |
See Notes to Schedule of Investments and Notes to Financial Statements.
9
Total Return Fund
| | |
| Schedule of Investments | | December 31, 2010 |
| | | | | | | | | | |
| | | |
| | | Number
of Shares | | | Fair
Value | | | |
| |
Construction & Farm Machinery & Heavy Trucks — 0.3% | | | |
| | | |
Cummins Inc. | | | 24,781 | | | $ | 2,726,158 | | | |
Deere & Co. | | | 62,601 | | | | 5,199,013 | | | |
| | | | | | | 7,925,171 | | | |
| |
Consumer Finance — 0.1% | | | |
| | | |
American Express Co. | | | 65,422 | | | | 2,807,912 | | | |
| |
Data Processing & Outsourced Services — 0.8% | | | |
| | | |
Automatic Data Processing Inc. | | | 16,827 | | | | 778,754 | | | |
Global Cash Access Holdings Inc. | | | 44,100 | | | | 140,679 | | | (a) |
The Western Union Co. | | | 637,836 | | | | 11,844,615 | | | |
VeriFone Systems Inc. | | | 13,800 | | | | 532,128 | | | (a) |
Visa Inc. | | | 152,789 | | | | 10,753,290 | | | |
| | | | | | | 24,049,466 | | | |
| |
Department Stores — 0.1% | | | |
| | | |
Macy’s Inc. | | | 63,997 | | | | 1,619,124 | | | |
| |
Distributors — 0.1% | | | |
| | | |
Genuine Parts Co. | | | 18,205 | | | | 934,645 | | | |
LKQ Corp. | | | 43,700 | | | | 992,864 | | | (a) |
| | | | | | | 1,927,509 | | | |
| |
Diversified Chemicals — 0.0%* | | | |
| | | |
EI du Pont de Nemours & Co. | | | 21,009 | | | | 1,047,929 | | | |
| |
Diversified Financial Services — 1.0% | | | |
| | | |
Bank of America Corp. | | | 333,306 | | | | 4,446,302 | | | |
Citigroup Inc. | | | 526,748 | | | | 2,491,518 | | | (a) |
JPMorgan Chase & Co. | | | 316,283 | | | | 13,416,724 | | | |
US BanCorp | | | 71,216 | | | | 1,920,696 | | | |
Wells Fargo & Co. | | | 230,282 | | | | 7,136,440 | | | |
| | | | | | | 29,411,680 | | | |
| |
Diversified Metals & Mining — 0.1% | | | |
| | | |
Compass Minerals International Inc. | | | 5,900 | | | | 526,693 | | | |
Freeport-McMoRan Copper & Gold Inc. | | | 26,449 | | | | 3,176,260 | | | |
| | | | | | | 3,702,953 | | | |
| |
Diversified Real Estate Activities — 0.0%* | | | |
| | | |
Coresite Realty Corp. (REIT) | | | 17,290 | | | | 235,836 | | | |
| |
Diversified REITs — 0.1% | | | |
| | | |
Colonial Properties Trust | | | 10,440 | | | | 188,442 | | | |
Cousins Properties Inc. | | | 11,410 | | | | 95,159 | | | |
Vornado Realty Trust | | | 24,080 | | | | 2,006,586 | | | |
| | | | | | | 2,290,187 | | | |
| |
Diversified Support Services — 0.1% | | | |
| | | |
Healthcare Services Group Inc. | | | 25,500 | | | | 414,885 | | | |
Iron Mountain Inc. | | | 93,398 | | | | 2,335,884 | | | |
| | | | | | | 2,750,769 | | | |
| | | | | | | | | | |
| | | |
| | | Number
of Shares | | | Fair
Value | | | |
| |
Drug Retail — 0.0%* | | | |
| | | |
CVS Caremark Corp. | | | 38,544 | | | $ | 1,340,175 | | | |
| |
Education Services — 0.0%* | | | |
| | | |
Lincoln Educational Services Corp. | | | 5,300 | | | | 82,203 | | | |
| |
Electric Utilities — 0.7% | | | |
| | | |
Edison International | | | 51,351 | | | | 1,982,149 | | | |
Entergy Corp. | | | 21,424 | | | | 1,517,462 | | | |
IDACORP Inc. | | | 18,500 | | | | 684,130 | | | |
ITC Holdings Corp. | | | 128,705 | | | | 7,977,136 | | | |
NextEra Energy Inc. | | | 39,901 | | | | 2,074,453 | | | |
Northeast Utilities | | | 157,996 | | | | 5,036,913 | | | |
Southern Co. | | | 35,897 | | | | 1,372,342 | | | |
| | | | | | | 20,644,585 | | | |
| |
Electrical Components & Equipment — 0.3% | | | |
| | | |
Cooper Industries PLC | | | 113,857 | | | | 6,636,724 | | | |
Emerson Electric Co. | | | 36,458 | | | | 2,084,304 | | | |
Woodward Governor Co. | | | 16,700 | | | | 627,252 | | | |
| | | | | | | 9,348,280 | | | |
| |
Electronic Components — 0.1% | | | |
| | | |
Corning Inc. | | | 108,087 | | | | 2,088,241 | | | |
| |
Environmental & Facilities Services — 0.1% | | | |
| | | |
Stericycle Inc. | | | 18,135 | | | | 1,467,484 | | | (a) |
| |
Fertilizers & Agricultural Chemicals — 0.5% | | | |
| | | |
Intrepid Potash Inc. | | | 88,662 | | | | 3,306,206 | | | (a) |
Monsanto Co. | | | 163,488 | | | | 11,385,304 | | | |
| | | | | | | 14,691,510 | | | |
| |
Food Distributors — 0.0%* | | | |
| | | |
Sysco Corp. | | | 30,849 | | | | 906,961 | | | |
| |
Footwear — 0.0%* | | | |
| | | |
Deckers Outdoor Corp. | | | 7,500 | | | | 598,050 | | | (a) |
| |
General Merchandise Stores — 0.5% | | | |
| | | |
Dollar General Corp. | | | 80,680 | | | | 2,474,456 | | | (a) |
Target Corp. | | | 179,473 | | | | 10,791,711 | | | |
| | | | | | | 13,266,167 | | | |
| |
Healthcare Distributors — 0.1% | | | |
| | | |
Cardinal Health Inc. | | | 38,574 | | | | 1,477,770 | | | |
Owens & Minor Inc. | | | 23,000 | | | | 676,890 | | | |
| | | | | | | 2,154,660 | | | |
| |
Healthcare Equipment — 1.0% | | | |
| | | |
Becton Dickinson and Co. | | | 11,150 | | | | 942,398 | | | |
Covidien PLC | | | 281,644 | | | | 12,859,865 | | | |
Gen-Probe Inc. | | | 48,726 | | | | 2,843,162 | | | (a) |
Masimo Corp. | | | 158,200 | | | | 4,598,874 | | | |
ResMed Inc. | | | 207,163 | | | | 7,176,126 | | | (a) |
| | | | | | | 28,420,425 | | | |
See Notes to Schedule of Investments and Notes to Financial Statements.
10
Total Return Fund
| | |
| Schedule of Investments | | December 31, 2010 |
| | | | | | | | | | |
| | | |
| | | Number
of Shares | | | Fair
Value | | | |
| |
Healthcare Facilities — 0.0%* | | | |
| | | |
Sun Healthcare Group Inc. | | | 6,200 | | | $ | 78,492 | | | (a) |
| |
Healthcare Services — 0.9% | | | |
| | | |
Bio-Reference Laboratories Inc. | | | 39,200 | | | | 869,456 | | | (a) |
Catalyst Health Solutions Inc. | | | 113,505 | | | | 5,276,847 | | | (a) |
Express Scripts Inc. | | | 268,509 | | | | 14,512,911 | | | (a) |
HMS Holdings Corp. | | | 9,700 | | | | 628,269 | | | (a) |
Medco Health Solutions Inc. | | | 19,700 | | | | 1,207,019 | | | (a) |
Mednax Inc. | | | 13,100 | | | | 881,499 | | | (a) |
Omnicare Inc. | | | 112,238 | | | | 2,849,723 | | | |
| | | | | | | 26,225,724 | | | |
| |
Healthcare Technology — 0.1% | | | |
| | | |
Computer Programs & Systems Inc. | | | 10,600 | | | | 496,504 | | | |
MedAssets Inc. | | | 159,694 | | | | 3,224,222 | | | (a) |
| | | | | | | 3,720,726 | | | |
| |
Home Entertainment Software — 0.2% | | | |
| | | |
Activision Blizzard Inc. | | | 379,378 | | | | 4,719,462 | | | |
| |
Home Improvement Retail — 0.6% | | | |
| | | |
Home Depot Inc. | | | 39,262 | | | | 1,376,526 | | | |
Lowe’s companies Inc. | | | 587,864 | | | | 14,743,629 | | | |
| | | | | | | 16,120,155 | | | |
| |
Home Building — 0.1% | | | |
| | | |
MDC Holdings Inc. | | | 55,846 | | | | 1,606,690 | | | |
| |
Home Furnishing Retail — 0.2% | | | |
| | | |
Aaron’s Inc. | | | 32,800 | | | | 668,792 | | | |
Bed Bath & Beyond Inc. | | | 117,316 | | | | 5,766,082 | | | (a,h) |
| | | | | | | 6,434,874 | | | |
| |
Hotels, Resorts & Cruise Lines — 0.2% | | | |
| | | |
Carnival Corp. | | | 119,254 | | | | 5,498,802 | | | |
Hyatt Hotels Corp. | | | 7,160 | | | | 327,642 | | | (a) |
Marriott International Inc. | | | 28,094 | | | | 1,167,025 | | | |
| | | | | | | 6,993,469 | | | |
| |
Household Products — 0.6% | | | |
| | | |
Clorox Co. | | | 76,834 | | | | 4,862,055 | | | |
Kimberly-Clark Corp. | | | 22,220 | | | | 1,400,749 | | | |
The Procter & Gamble Co. | | | 151,730 | | | | 9,760,791 | | | |
| | | | | | | 16,023,595 | | | |
| |
Housewares & Specialties — 0.0%* | | | |
| | | |
Jarden Corp. | | | 27,300 | | | | 842,751 | | | |
| |
Hypermarkets & Super Centers — 0.0%* | | | |
| | | |
Wal-Mart Stores Inc. | | | 22,846 | | | | 1,232,085 | | | |
| |
Independent Power Producers & Energy Traders — 0.1% | | | |
| | | |
Calpine Corp. | | | 69,842 | | | | 931,692 | | | (a) |
The AES Corp. | | | 75,373 | | | | 918,043 | | | (a) |
| | | | | | | 1,849,735 | | | |
| | | | | | | | | | |
| | | |
| | | Number
of Shares | | | Fair
Value | | | |
| |
Industrial Conglomerates — 0.0%* | | | |
| | | |
3M Co. | | | 8,694 | | | $ | 750,292 | | | |
| |
Industrial Gases — 0.5% | | | |
| | | |
Praxair Inc. | | | 151,178 | | | | 14,432,963 | | | |
| |
Industrial Machinery — 0.3% | | | |
| | | |
Eaton Corp. | | | 22,665 | | | | 2,300,724 | | | |
Harsco Corp. | | | 219,588 | | | | 6,218,732 | | | |
Mueller Industries Inc. | | | 7,900 | | | | 258,330 | | | |
| | | | | | | 8,777,786 | | | |
| |
Industrial REITs — 0.1% | | | |
| | | |
AMB Property Corp. | | | 9,020 | | | | 286,024 | | | |
DCT Industrial Trust Inc. | | | 20,910 | | | | 111,032 | | | |
ProLogis | | | 79,120 | | | | 1,142,493 | | | |
| | | | | | | 1,539,549 | | | |
| |
Integrated Oil & Gas — 1.1% | | | |
| | | |
Chevron Corp. | | | 136,596 | | | | 12,464,385 | | | |
ConocoPhillips | | | 44,310 | | | | 3,017,511 | | | |
Exxon Mobil Corp. | | | 139,442 | | | | 10,195,999 | | | (h) |
Marathon Oil Corp. | | | 70,109 | | | | 2,596,136 | | | |
Occidental Petroleum Corp. | | | 17,388 | | | | 1,705,763 | | | |
| | | | | | | 29,979,794 | | | |
| |
Integrated Telecommunication Services — 0.5% | | | |
| | | |
AT&T Inc. | | | 243,849 | | | | 7,164,284 | | | |
Verizon Communications Inc. | | | 148,457 | | | | 5,311,792 | | | |
Windstream Corp. | | | 42,659 | | | | 594,666 | | | |
| | | | | | | 13,070,742 | | | |
| |
Internet Software & Services — 0.7% | | | |
| | | |
Art Technology Group Inc. | | | 41,100 | | | | 245,778 | | | (a) |
Equinix Inc. | | | 87,884 | | | | 7,141,453 | | | (a) |
Google Inc. | | | 16,589 | | | | 9,853,368 | | | (a) |
MercadoLibre Inc. | | | 45,599 | | | | 3,039,173 | | | (a) |
| | | | | | | 20,279,772 | | | |
| |
Investment Banking & Brokerage — 0.7% | | | |
| | | |
GFI Group Inc. | | | 47,900 | | | | 224,651 | | | |
Morgan Stanley | | | 91,450 | | | | 2,488,355 | | | |
Raymond James Financial Inc. | | | 27,900 | | | | 912,330 | | | |
The Goldman Sachs Group Inc. | | | 95,929 | | | | 16,131,421 | | | |
| | | | | | | 19,756,757 | | | |
| |
IT Consulting & Other Services — 0.4% | | | |
| | | |
International Business Machines Corp. | | | 85,308 | | | | 12,519,802 | | | (h) |
SRA International Inc. | | | 7,600 | | | | 155,420 | | | (a) |
| | | | | | | 12,675,222 | | | |
| |
Life & Health Insurance — 0.7% | | | |
| | | |
Aflac Inc. | | | 94,571 | | | | 5,336,642 | | | |
MetLife Inc. | | | 96,330 | | | | 4,280,905 | | | |
See Notes to Schedule of Investments and Notes to Financial Statements.
11
Total Return Fund
| | |
| Schedule of Investments | | December 31, 2010 |
| | | | | | | | | | |
| | | |
| | | Number
of Shares | | | Fair
Value | | | |
| | | |
Principal Financial Group Inc. | | | 99,775 | | | $ | 3,248,674 | | | |
Prudential Financial Inc. | | | 100,547 | | | | 5,903,115 | | | |
| | | | | | | 18,769,336 | | | |
| |
Life Sciences Tools & Services — 0.9% | | | |
| | | |
Bruker Corp. | | | 44,000 | | | | 730,400 | | | (a) |
Covance Inc. | | | 72,507 | | | | 3,727,585 | | | (a) |
Illumina Inc. | | | 86,099 | | | | 5,453,511 | | | (a) |
Life Technologies Corp. | | | 62,356 | | | | 3,460,758 | | | (a) |
Mettler-Toledo International Inc. | | | 30,945 | | | | 4,679,193 | | | (a) |
Thermo Fisher Scientific Inc. | | | 141,888 | | | | 7,854,920 | | | (a) |
| | | | | | | 25,906,367 | | | |
| |
Managed Healthcare — 0.0%* | | | |
| | | |
Molina Healthcare Inc. | | | 22,500 | | | | 626,625 | | | (a) |
| |
Movies & Entertainment — 0.6% | | | |
| | | |
News Corp. | | | 256,017 | | | | 3,727,608 | | | |
Regal Entertainment Group | | | 130,764 | | | | 1,535,169 | | | |
The Walt Disney Co. | | | 95,625 | | | | 3,586,894 | | | |
Time Warner Inc. | | | 233,266 | | | | 7,504,167 | | | |
| | | | | | | 16,353,838 | | | |
| |
Multi-Line Insurance — 0.3% | | | |
| | | |
HCC Insurance Holdings Inc. | | | 254,598 | | | | 7,368,066 | | | |
| |
Multi-Utilities — 0.2% | | | |
| | | |
Dominion Resources Inc. | | | 129,667 | | | | 5,539,374 | | | |
Xcel Energy Inc. | | | 26,599 | | | | 626,406 | | | |
| | | | | | | 6,165,780 | | | |
| |
Office Electronics — 0.0%* | | | |
| | | |
Zebra Technologies Corp. | | | 9,600 | | | | 364,704 | | | (a) |
| |
Office REITs — 0.4% | | | |
| | | |
Alexandria Real Estate Equities Inc. | | | 6,350 | | | | 465,201 | | | |
BioMed Realty Trust Inc. | | | 37,200 | | | | 693,780 | | | |
Boston Properties Inc. | | | 10,430 | | | | 898,023 | | | |
Brandywine Realty Trust | | | 27,320 | | | | 318,278 | | | |
CommonWealth | | | 19,720 | | | | 503,057 | | | |
Corporate Office Properties Trust | | | 8,500 | | | | 297,075 | | | |
Digital Realty Trust Inc. | | | 30,170 | | | | 1,554,962 | | | |
Douglas Emmett Inc. | | | 155,299 | | | | 2,577,963 | | | |
Duke Realty Corp. | | | 50,050 | | | | 623,623 | | | |
Kilroy Realty Corp. | | | 11,820 | | | | 431,075 | | | |
Parkway Properties Inc. | | | 10,640 | | | | 186,413 | | | |
SL Green Realty Corp. | | | 40,457 | | | | 2,731,252 | | | |
| | | | | | | 11,280,702 | | | |
| |
Office Services & Supplies — 0.0%* | | | |
| | | |
Herman Miller Inc. | | | 6,600 | | | | 166,980 | | | |
| |
Oil & Gas Drilling — 0.0%* | | | |
| | | |
Pioneer Drilling Co. | | | 49,700 | | | | 437,857 | | | (a) |
| | | | | | | | | | |
| | | |
| | | Number
of Shares | | | Fair
Value | | | |
| |
Oil & Gas Equipment & Services — 1.3% | | | |
| | | |
Dresser-Rand Group Inc. | | | 91,174 | | | $ | 3,883,101 | | | (a) |
Dril-Quip Inc. | | | 6,500 | | | | 505,180 | | | (a) |
Halliburton Co. | | | 24,951 | | | | 1,018,749 | | | |
McDermott International Inc. | | | 99,866 | | | | 2,066,228 | | | (a) |
National Oilwell Varco Inc. | | | 21,423 | | | | 1,440,697 | | | |
Oil States International Inc. | | | 14,500 | | | | 929,305 | | | (a) |
Schlumberger Ltd. | | | 283,846 | | | | 23,701,141 | | | |
Weatherford International Ltd. | | | 222,603 | | | | 5,075,348 | | | (a) |
| | | | | | | 38,619,749 | | | |
| |
Oil & Gas Exploration & Production — 0.9% | | | |
| | | |
Apache Corp. | | | 83,791 | | | | 9,990,401 | | | |
Devon Energy Corp. | | | 23,291 | | | | 1,828,576 | | | |
EQT Corp. | | | 69,249 | | | | 3,105,125 | | | |
Petrohawk Energy Corp. | | | 183,617 | | | | 3,351,010 | | | (a) |
Pioneer Natural Resources Co. | | | 41,840 | | | | 3,632,549 | | | |
Range Resources Corp. | | | 61,393 | | | | 2,761,457 | | | |
SM Energy Co. | | | 16,300 | | | | 960,559 | | | |
Southwestern Energy Co. | | | 40,114 | | | | 1,501,467 | | | (a) |
| | | | | | | 27,131,144 | | | |
| |
Oil & Gas Storage & Transportation — 0.2% | | | |
| | | |
El Paso Corp. | | | 318,619 | | | | 4,384,197 | | | |
Spectra Energy Corp. | | | 93,285 | | | | 2,331,192 | | | |
| | | | | | | 6,715,389 | | | |
| |
Packaged Foods & Meats — 0.5% | | | |
| | | |
Kellogg Co. | | | 21,314 | | | | 1,088,719 | | | |
Kraft Foods Inc. | | | 219,705 | | | | 6,922,904 | | | |
McCormick & Company Inc. | | | 81,745 | | | | 3,803,595 | | | (h) |
Mead Johnson Nutrition Co. | | | 44,561 | | | | 2,773,922 | | | |
Smithfield Foods Inc. | | | 7,800 | | | | 160,914 | | | (a) |
| | | | | | | 14,750,054 | | | |
| |
Paper Packaging — 0.0%* | | | |
| | | |
Packaging Corporation of America | | | 31,900 | | | | 824,296 | | | |
| |
Personal Products — 0.0%* | | | |
| | | |
Avon Products Inc. | | | 48,813 | | | | 1,418,506 | | | |
| |
Pharmaceuticals — 0.9% | | | |
| | | |
Abbott Laboratories | | | 19,631 | | | | 940,521 | | | |
Bristol-Myers Squibb Co. | | | 157,510 | | | | 4,170,865 | | | |
Hospira Inc. | | | 67,804 | | | | 3,776,005 | | | (a) |
Johnson & Johnson | | | 163,633 | | | | 10,120,701 | | | |
Merck & Company Inc. | | | 38,467 | | | | 1,386,351 | | | |
Pfizer Inc. | | | 304,127 | | | | 5,325,264 | | | |
| | | | | | | 25,719,707 | | | |
| |
Property & Casualty Insurance — 0.3% | | | |
| | | |
ACE Ltd. | | | 116,078 | | | | 7,225,855 | | | |
The Travelers companies Inc. | | | 20,192 | | | | 1,124,896 | | | |
| | | | | | | 8,350,751 | | | |
See Notes to Schedule of Investments and Notes to Financial Statements.
12
Total Return Fund
| | |
| Schedule of Investments | | December 31, 2010 |
| | | | | | | | | | |
| | | |
| | | Number
of Shares | | | Fair
Value | | | |
| |
Publishing — 0.0%* | | | |
| | | |
John Wiley & Sons Inc. | | | 5,000 | | | $ | 226,200 | | | |
| |
Railroads — 0.2% | | | |
| | | |
Genesee & Wyoming Inc. | | | 17,800 | | | | 942,510 | | | (a) |
Union Pacific Corp. | | | 62,059 | | | | 5,750,387 | | | |
| | | | | | | 6,692,897 | | | |
| |
Real Estate Operating Companies — 0.0%* | | | |
| | | |
Hudson Pacific Properties Inc. (REIT) | | | 14,090 | | | | 212,055 | | | |
| |
Real Estate Services — 0.4% | | | |
| | | |
CB Richard Ellis Group Inc. (REIT) | | | 486,565 | | | | 9,964,851 | | | (a,h) |
| |
Regional Banks — 0.2% | | | |
| | | |
Cullen Frost Bankers Inc. | | | 9,900 | | | | 605,088 | | | |
Fulton Financial Corp. | | | 18,000 | | | | 186,120 | | | |
Prosperity Bancshares Inc. | | | 14,300 | | | | 561,704 | | | |
Regions Financial Corp. | | | 266,117 | | | | 1,862,819 | | | |
Sterling Bancorp | | | 9,500 | | | | 99,465 | | | |
SVB Financial Group | | | 11,200 | | | | 594,160 | | | (a) |
Westamerica Bancorp. | | | 7,300 | | | | 404,931 | | | |
Zions Bancorp. | | | 98,192 | | | | 2,379,192 | | | |
| | | | | | | 6,693,479 | | | |
| |
Reinsurance — 0.1% | | | |
| | | |
PartnerRe Ltd. | | | 32,420 | | | | 2,604,947 | | | |
| |
Research & Consulting Services — 0.2% | | | |
| | | |
IHS Inc. | | | 57,985 | | | | 4,661,414 | | | (a) |
| |
Residential REITs — 0.2% | | | |
| | | |
American Campus Communities Inc. | | | 5,810 | | | | 184,526 | | | |
AvalonBay Communities Inc. | | | 5,350 | | | | 602,143 | | | |
Camden Property Trust | | | 16,540 | | | | 892,829 | | | |
Equity Lifestyle Properties Inc. | | | 3,710 | | | | 207,500 | | | |
Equity Residential | | | 36,150 | | | | 1,877,993 | | | |
Essex Property Trust Inc. | | | 7,230 | | | | 825,811 | | | |
UDR Inc. | | | 10,660 | | | | 250,723 | | | |
| | | | | | | 4,841,525 | | | |
| |
Restaurants — 0.1% | | | |
| | | |
Cracker Barrel Old Country Store Inc. | | | 15,600 | | | | 854,412 | | | |
McDonald’s Corp. | | | 37,019 | | | | 2,841,578 | | | |
Wendy’s Arby’s Group Inc. | | | 36,000 | | | | 166,320 | | | |
| | | | | | | 3,862,310 | | | |
| |
Retail REITs — 0.2% | | | |
| | | |
Acadia Realty Trust | | | 12,520 | | | | 228,365 | | | |
Federal Realty Investment Trust | | | 5,810 | | | | 452,773 | | | |
General Growth Properties Inc. | | | 40,180 | | | | 621,986 | | | |
Kimco Realty Corp. | | | 54,080 | | | | 975,603 | | | |
| | | | | | | | | | |
| | | |
| | | Number
of Shares | | | Fair
Value | | | |
| | | |
Simon Property Group Inc. | | | 22,400 | | | $ | 2,228,576 | | | |
Taubman Centers Inc. | | | 5,860 | | | | 295,813 | | | |
The Macerich Co. | | | 27,630 | | | | 1,308,833 | | | |
Weingarten Realty Investors | | | 27,040 | | | | 642,470 | | | |
| | | | | | | 6,754,419 | | | |
| |
Security & Alarm Services — 0.3% | | | |
| | | |
Corrections Corporation of America | | | 386,910 | | | | 9,695,965 | | | (a) |
| |
Semiconductor Equipment — 0.2% | | | |
| | | |
KLA-Tencor Corp. | | | 85,339 | | | | 3,297,498 | | | |
Rudolph Technologies Inc. | | | 62,100 | | | | 511,083 | | | (a) |
Varian Semiconductor Equipment Associates Inc. | | | 8,700 | | | | 321,639 | | | (a) |
| | | | | | | 4,130,220 | | | |
| |
Semiconductors — 1.2% | | | |
| | | |
Cree Inc. | | | 27,191 | | | | 1,791,615 | | | (a) |
Hittite Microwave Corp. | | | 80,535 | | | | 4,915,856 | | | (a) |
Intel Corp. | | | 644,761 | | | | 13,559,324 | | | (h) |
Marvell Technology Group Ltd. | | | 248,557 | | | | 4,610,732 | | | (a) |
Microchip Technology Inc. | | | 71,933 | | | | 2,460,828 | | | |
Microsemi Corp. | | | 25,100 | | | | 574,790 | | | (a) |
Semtech Corp. | | | 19,300 | | | | 436,952 | | | (a) |
Texas Instruments Inc. | | | 178,316 | | | | 5,795,270 | | | |
| | | | | | | 34,145,367 | | | |
| |
Soft Drinks — 0.8% | | | |
| | | |
Coca-Cola Enterprises Inc. | | | 118,546 | | | | 2,967,206 | | | |
PepsiCo Inc. | | | 323,832 | | | | 21,155,944 | | | |
| | | | | | | 24,123,150 | | | |
| |
Specialized Consumer Services — 0.0%* | | | |
| | | |
Matthews International Corp. | | | 2,900 | | | | 101,442 | | | |
| |
Specialized Finance — 0.8% | | | |
| | | |
CBOE Holdings Inc. | | | 90,868 | | | | 2,077,242 | | | |
CME Group Inc. | | | 53,317 | | | | 17,154,745 | | | |
MSCI Inc. | | | 60,738 | | | | 2,366,352 | | | (a) |
| | | | | | | 21,598,339 | | | |
| |
Specialized REITs — 0.4% | | | |
| | | |
HCP Inc. | | | 24,760 | | | | 910,920 | | | |
Healthcare Inc. | | | 34,294 | | | | 1,633,766 | | | |
Hospitality Properties Trust | | | 12,540 | | | | 288,922 | | | |
Host Hotels & Resorts Inc. | | | 44,840 | | | | 801,291 | | | |
LaSalle Hotel Properties | | | 11,340 | | | | 299,376 | | | |
Nationwide Health Properties Inc. | | | 25,640 | | | | 932,783 | | | |
Omega Healthcare Investors Inc. | | | 31,100 | | | | 697,884 | | | |
Pebblebrook Hotel Trust | | | 10,220 | | | | 207,670 | | | |
Public Storage | | | 21,893 | | | | 2,220,388 | | | |
Rayonier Inc. | | | 8,730 | | | | 458,500 | | | |
Sabra Healthcare REIT Inc. | | | 6,200 | | | | 114,080 | | | |
Senior Housing Properties Trust | | | 25,550 | | | | 560,567 | | | |
Sunstone Hotel Investors Inc. | | | 15,420 | | | | 159,289 | | | (a) |
See Notes to Schedule of Investments and Notes to Financial Statements.
13
Total Return Fund
| | |
| Schedule of Investments | | December 31, 2010 |
| | | | | | | | | | |
| | | |
| | | Number
of Shares | | | Fair
Value | | | |
| | | |
U-Store-It Trust | | | 24,730 | | | $ | 235,677 | | | |
Ventas Inc. | | | 11,430 | | | | 599,846 | | | |
| | | | | | | 10,120,959 | | | |
| |
Specialty Chemicals — 0.1% | | | |
| | | |
Cytec Industries Inc. | | | 18,421 | | | | 977,418 | | | |
Sensient Technologies Corp. | | | 15,700 | | | | 576,661 | | | |
| | | | | | | 1,554,079 | | | |
| |
Steel — 0.7% | | | |
| | | |
Allegheny Technologies Inc. | | | 282,304 | | | | 15,577,535 | | | |
Commercial Metals Co. | | | 36,200 | | | | 600,558 | | | |
Steel Dynamics Inc. | | | 177,956 | | | | 3,256,595 | | | |
| | | | | | | 19,434,688 | | | |
| |
Systems Software — 1.7% | | | |
| | | |
MICROS Systems Inc. | | | 18,400 | | | | 807,024 | | | (a) |
Microsoft Corp. | | | 993,220 | | | | 27,730,703 | | | (h) |
Oracle Corp. | | | 275,692 | | | | 8,629,160 | | | |
Rovi Corp. | | | 183,112 | | | | 11,354,775 | | | (a) |
| | | | | | | 48,521,662 | | | |
| |
Thrifts & Mortgage Finance — 0.2% | | | |
| | | |
People’s United Financial Inc. | | | 355,753 | | | | 4,984,100 | | | |
| |
Tobacco — 0.1% | | | |
| | | |
Philip Morris International Inc. | | | 35,218 | | | | 2,061,310 | | | |
| |
Trading Companies & Distributors — 0.1% | | | |
| | | |
Applied Industrial Technologies Inc. | | | 19,800 | | | | 643,104 | | | |
MSC Industrial Direct Co. | | | 47,794 | | | | 3,091,794 | | | |
| | | | | | | 3,734,898 | | | |
| |
Trucking — 0.0%* | | | |
| | | |
Old Dominion Freight Line Inc. | | | 22,950 | | | | 734,171 | | | (a) |
| |
Water Utilities — 0.0%* | | | |
| | | |
American Water Works Company Inc. | | | 24,679 | | | | 624,132 | | | |
| |
Wireless Telecommunication Services – 0.9% | | | |
| | | |
American Tower Corp. | | | 109,903 | | | | 5,675,390 | | | (a) |
Crown Castle International Corp. | | | 15,430 | | | | 676,297 | | | (a) |
NII Holdings Inc. | | | 434,314 | | | | 19,396,463 | | | (a) |
| | | | | | | 25,748,150 | | | |
| | | |
Total Domestic Equity
(Cost $933,424,235) | | | | | | | 1,096,327,790 | | | |
| | | | | | | | | | |
| | | |
| | | Number
of Shares | | | Fair
Value | | | |
Foreign Equity — 26.4% | | | |
| |
Common Stock — 25.6% | | | |
| |
Aerospace & Defense — 0.6% | | | |
| | | |
CAE Inc. | | | 459,298 | | | $ | 5,320,304 | | | |
European Aeronautic Defence and Space Company N.V. | | | 211,585 | | | | 4,950,379 | | | |
Safran S.A. | | | 153,604 | | | | 5,460,791 | | | |
| | | | | | | 15,731,474 | | | |
| |
Agricultural Products — 0.1% | | | |
| | | |
China Agri-Industries Holdings Ltd. | | | 461,274 | | | | 525,143 | | | |
Cosan SA Industria e Comercio | | | 69,540 | | | | 1,156,626 | | | |
Global Bio-Chem Technology Group Company Ltd. | | | 2,119,096 | | | | 324,394 | | | |
IOI Corporation Bhd | | | 227,848 | | | | 429,316 | | | |
| | | | | | | 2,435,479 | | | |
| |
Apparel Retail — 0.1% | | | |
| | | |
Esprit Holdings Ltd. | | | 479,976 | | | | 2,278,352 | | | |
| |
Apparel, Accessories & Luxury Goods — 0.2% | | | |
| | | |
Adidas AG | | | 70,896 | | | | 4,649,956 | | | |
China Dongxiang Group Company | | | 498,049 | | | | 217,834 | | | |
Ports Design Ltd. | | | 297,244 | | | | 820,192 | | | |
| | | | | | | 5,687,982 | | | |
| |
Application Software — 0.4% | | | |
| | | |
Autonomy Corporation PLC | | | 159,402 | | | | 3,755,997 | | | (a) |
Longtop Financial Technologies Ltd. ADR | | | 50,117 | | | | 1,813,233 | | | (a) |
SAP AG | | | 89,248 | | | | 4,561,741 | | | |
| | | | | | | 10,130,971 | | | |
| |
Asset Management & Custody Banks — 0.0%* | | | |
| | | |
Mirae Asset Securities Company Ltd. | | | 13,069 | | | | 689,782 | | | |
| |
Automobile Manufacturers — 0.9% | | | |
| | | |
Daimler AG | | | 112,022 | | | | 7,623,867 | | | |
Hyundai Motor Company | | | 3,930 | | | | 600,806 | | | (a) |
Mahindra & Mahindra Ltd. | | | 24,852 | | | | 432,680 | | | |
Suzuki Motor Corp. | | | 490,995 | | | | 12,107,638 | | | |
Toyota Motor Corp. | | | 149,065 | | | | 5,918,122 | | | |
| | | | | | | 26,683,113 | | | |
| |
Brewers — 0.0%* | | | |
| | | |
Anadolu Efes Biracilik Ve Malt Sanayii AS | | | 42,447 | | | | 645,393 | | | |
| |
Broadcasting — 0.1% | | | |
| | | |
Grupo Televisa S.A. ADR | | | 29,498 | | | | 764,883 | | | (a) |
See Notes to Schedule of Investments and Notes to Financial Statements.
14
Total Return Fund
| | |
| Schedule of Investments | | December 31, 2010 |
| | | | | | | | | | |
| | | |
| | | Number
of Shares | | | Fair
Value | | | |
| | | |
Zee Entertainment Enterprises Ltd. | | | 180,138 | | | $ | 592,201 | | | |
Zee Learn Ltd. | | | 22,517 | | | | 14,024 | | | (a) |
| | | | | | | 1,371,108 | | | |
| |
Building Products — 0.1% | | | |
| | | |
Daikin Industries Ltd. | | | 108,000 | | | | 3,835,029 | | | |
| |
Casinos & Gaming — 0.0%* | | | |
| | | |
Genting Bhd | | | 121,700 | | | | 441,254 | | | |
| |
Coal & Consumable Fuels — 0.2% | | | |
| | | |
Paladin Energy Ltd. | | | 1,091,158 | | | | 5,514,164 | | | (a) |
| |
Communications Equipment — 0.6% | | | |
| | | |
HTC Corp. | | | 40,115 | | | | 1,238,266 | | | |
Research In Motion Ltd. | | | 55,284 | | | | 3,213,659 | | | (a) |
Research In Motion Ltd. | | | 112,175 | | | | 6,555,631 | | | (a) |
Telefonaktiebolaget LM Ericsson | | | 418,791 | | | | 4,868,250 | | | |
ZTE Corp. | | | 44,026 | | | | 175,285 | | | |
| | | | | | | 16,051,091 | | | |
| |
Construction & Engineering — 0.5% | | | |
| | | |
China State Construction International Holdings Ltd. | | | 819,790 | | | | 775,113 | | | |
Doosan Heavy Industries and Construction Company Ltd. | | | 14,166 | | | | 1,070,969 | | | (a) |
Larsen & Toubro Ltd. | | | 147,362 | | | | 6,518,663 | | | |
Vinci S.A. | | | 78,908 | | | | 4,306,348 | | | |
| | | | | | | 12,671,093 | | | |
| |
Construction & Farm Machinery & Heavy Trucks — 0.2% | | | |
| | | |
CSR Corp Ltd. | | | 3,432,595 | | | | 4,512,824 | | | |
First Tractor Company Ltd. | | | 265,579 | | | | 296,885 | | | |
Sany Heavy Equipment International Holdings Company Ltd. | | | 840,813 | | | | 1,248,189 | | | |
United Tractors Tbk PT | | | 241,490 | | | | 637,898 | | | |
| | | | | | | 6,695,796 | | | |
| |
Construction Materials — 0.1% | | | |
| | | |
CRH PLC | | | 176,852 | | | | 3,713,055 | | | |
| |
Consumer Electronics — 0.0%* | | | |
| | | |
LG Electronics Inc. | | | 2,224 | | | | 231,238 | | | (a) |
| |
Distillers & Vintners — 0.1% | | | |
| | | |
Diageo PLC | | | 144,685 | | | | 2,684,335 | | | |
Diageo PLC ADR | | | 11,474 | | | | 852,862 | | | |
| | | | | | | 3,537,197 | | | |
| |
Diversified Capital Markets — 0.2% | | | |
| | | |
Credit Suisse Group AG | | | 177,100 | | | | 7,157,340 | | | |
| | | | | | | | | | |
| | | |
| | | Number
of Shares | | | Fair
Value | | | |
| |
Diversified Financial Services — 2.9% | | | |
| | | |
Axis Bank Ltd. | | | 34,316 | | | $ | 1,034,276 | | | |
Banco Santander Brasil S.A. | | | 635,200 | | | | 8,628,771 | | | |
Banco Santander S.A. | | | 938,190 | | | | 9,978,415 | | | |
Bank of China Ltd. | | | 9,863,949 | | | | 5,215,161 | | | |
Bank Rakyat Indonesia Persero Tbk PT | | | 836,498 | | | | 974,831 | | | |
BNP Paribas | | | 187,768 | | | | 11,992,974 | | | |
Credit Agricole S.A. | | | 193,888 | | | | 2,472,091 | | | |
Grupo Financiero Banorte SAB de C.V. | | | 105,374 | | | | 501,496 | | | |
Halyk Savings Bank of Kazakhstan JSC GDR | | | 41,361 | | | | 415,678 | | | (a) |
HSBC Holdings PLC | | | 1,473,528 | | | | 15,021,075 | | | |
ICICI Bank Ltd. | | | 22,178 | | | | 565,076 | | | |
Industrial & Commercial Bank of China | | | 858,546 | | | | 637,257 | | | |
Kasikornbank PCL | | | 281,247 | | | | 1,217,540 | | | |
KB Financial Group Inc. | | | 9,285 | | | | 490,880 | | | (a) |
Lloyds Banking Group PLC | | | 7,332,534 | | | | 7,542,484 | | | (a) |
Metropolitan Bank & Trust | | | 625,479 | | | | 1,027,950 | | | |
Mitsubishi UFJ Financial Group Inc. | | | 1,210,203 | | | | 6,550,510 | | | |
Standard Bank Group Ltd. | | | 50,160 | | | | 815,434 | | | |
UniCredit S.p.A. | | | 2,823,073 | | | | 5,862,734 | | | |
Yapi ve Kredi Bankasi AS | | | 367,174 | | | | 1,159,497 | | | (a) |
| | | | | | | 82,104,130 | | | |
| |
Diversified Metals & Mining — 1.3% | | | |
| | | |
Anglo American PLC | | | 21,007 | | | | 1,097,034 | | | |
Antofagasta PLC | | | 63,522 | | | | 1,603,187 | | | |
BHP Billiton PLC | | | 364,290 | | | | 14,549,653 | | | |
China Molybdenum Company Ltd. | | | 481,255 | | | | 439,550 | | | |
Eurasian Natural Resources Corporation PLC | | | 70,504 | | | | 1,156,831 | | | |
Lynas Corporation Ltd. | | | 2,165,045 | | | | 4,571,716 | | | (a) |
New World Resources N.V. | | | 67,144 | | | | 1,010,242 | | | |
Rio Tinto PLC | | | 194,546 | | | | 13,665,480 | | | |
| | | | | | | 38,093,693 | | | |
| |
Diversified Real Estate Activities — 0.2% | | | |
| | | |
Mitsubishi Estate Company Ltd. (REIT) | | | 190,982 | | | | 3,546,254 | | | |
Sumitomo Realty & Development Company Ltd. (REIT) | | | 126,000 | | | | 3,012,317 | | | |
| | | | | | | 6,558,571 | | | |
| |
Diversified Support Services — 0.2% | | | |
| | | |
Brambles Ltd. | | | 565,296 | | | | 4,125,732 | | | |
| |
Education Services — 0.0%* | | | |
| | | |
MegaStudy Company Ltd. | | | 3,391 | | | | 526,473 | | | (a) |
| |
Electric Utilities — 0.1% | | | |
| | | |
Power Grid Corporation of India Ltd. | | | 856,294 | | | | 1,882,449 | | | |
See Notes to Schedule of Investments and Notes to Financial Statements.
15
Total Return Fund
| | |
| Schedule of Investments | | December 31, 2010 |
| | | | | | | | | | |
| | | |
| | | Number
of Shares | | | Fair
Value | | | |
| |
Electrical Components & Equipment — 0.4% | | | |
| | | |
Schneider Electric S.A. | | | 70,659 | | | $ | 10,616,775 | | | |
Zhuzhou CSR Times Electric Company Ltd. | | | 237,786 | | | | 936,015 | | | |
| | | | | | | 11,552,790 | | | |
| |
Electronic Components — 0.3% | | | |
| | | |
Delta Electronics Inc. | | | 1,665,890 | | | | 8,141,901 | | | |
Samsung SDI Company Ltd. | | | 5,080 | | | | 751,996 | | | (a) |
| | | | | | | 8,893,897 | | | |
| |
Electronic Equipment & Instruments — 0.0%* | | | |
| | | |
China Security & Surveillance Technology Inc. | | | 78,039 | | | | 415,948 | | | (a) |
Elster Group SE ADR | | | 6,000 | | | | 101,400 | | | (a) |
Wasion Group Holdings Ltd. | | | 566,430 | | | | 374,528 | | | |
| | | | | | | 891,876 | | | |
| |
Electronic Manufacturing Services — 0.1% | | | |
| | | |
Hon Hai Precision Industry Company Ltd. | | | 388,725 | | | | 1,566,552 | | | |
| |
Fertilizers & Agricultural Chemicals — 1.0% | | | |
| | | |
Potash Corporation of Saskatchewan Inc. | | | 90,798 | | | | 14,113,371 | | | |
Potash Corporation of Saskatchewan Inc. | | | 15,803 | | | | 2,446,778 | | | |
Sinofert Holdings Ltd. | | | 493,064 | | | | 255,613 | | | |
Sociedad Quimica y Minera de Chile S.A. ADR | | | 53,727 | | | | 3,138,732 | | | |
Syngenta AG | | | 28,486 | | | | 8,358,460 | | | |
Taiwan Fertilizer Company Ltd. | | | 164,176 | | | | 613,763 | | | |
| | | | | | | 28,926,717 | | | |
| |
Food Distributors — 0.0%* | | | |
| | | |
Alliance Global Group Inc. | | | 1,972,291 | | | | 562,740 | | | |
| |
Food Retail — 0.5% | | | |
| | | |
Koninklijke Ahold N.V. | | | 268,058 | | | | 3,551,542 | | | |
Shoprite Holdings Ltd. | | | 57,240 | | | | 862,180 | | | |
Tesco PLC | | | 1,216,561 | | | | 8,095,017 | | | |
X5 Retail Group N.V. GDR | | | 14,504 | | | | 670,810 | | | (a) |
| | | | | | | 13,179,549 | | | |
| |
Gold — 0.1% | | | |
| | | |
Barrick Gold Corp. | | | 46,315 | | | | 2,463,031 | | | |
Kinross Gold Corp. | | | 94,965 | | | | 1,807,264 | | | |
| | | | | | | 4,270,295 | | | |
| |
Healthcare Distributors — 0.0%* | | | |
| | | |
Sinopharm Group Co. | | | 74,800 | | | | 260,763 | | | |
| |
Healthcare Services — 0.0%* | | | |
| | | |
Fleury S.A. | | | 62,200 | | | | 998,572 | | | |
| | | | | | | | | | |
| | | |
| | | Number
of Shares | | | Fair
Value | | | |
| |
Healthcare Supplies — 0.4% | | | |
| | | |
Cie Generale d’Optique Essilor International S.A. | | | 155,087 | | | $ | 10,023,150 | | | |
Shandong Weigao Group Medical Polymer Company Ltd. | | | 202,119 | | | | 572,012 | | | |
| | | | | | | 10,595,162 | | | |
| |
Heavy Electrical Equipment — 0.0%* | | | |
| | | |
Xinjiang Goldwind Science & Technology Company Ltd. | | | 129,196 | | | | 272,231 | | | (a) |
| |
Hotels, Resorts & Cruise Lines — 0.0%* | | | |
| | | |
Minor International PCL | | | 1,211,000 | | | | 474,036 | | | |
| |
Household Appliances — 0.0%* | | | |
| | | |
Techtronic Industries Co. | | | 467,998 | | | | 610,460 | | | |
| |
Household Products — 0.6% | | | |
| | | |
Reckitt Benckiser Group PLC | | | 153,697 | | | | 8,482,413 | | | |
Unicharm Corp. | | | 195,900 | | | | 7,801,702 | | | |
| | | | | | | 16,284,115 | | | |
| |
Human Resource & Employment Services — 0.1% | | | |
| | | |
The Capita Group PLC | | | 340,452 | | | | 3,712,547 | | | |
| |
Hypermarkets & Super Centers — 0.3% | | | |
| | | |
Metro AG | | | 126,535 | | | | 9,146,299 | | | |
| |
Independent Power Producers & Energy Traders — 0.0%* | | | |
| | | |
China WindPower Group Ltd. | | | 1,835,168 | | | | 184,139 | | | (a) |
| |
Industrial Conglomerates — 1.2% | | | |
| | | |
Chongqing Machinery & Electric Company Ltd. | | | 1,827,782 | | | | 681,863 | | | |
Hutchison Whampoa Ltd. | | | 562,631 | | | | 5,804,610 | | | |
Koninklijke Philips Electronics N.V. | | | 338,151 | | | | 10,397,583 | | | |
Siemens AG | | | 132,764 | | | | 16,510,764 | | | |
| | | | | | | 33,394,820 | | | |
| |
Industrial Gases — 0.6% | | | |
| | | |
Linde AG | | | 80,746 | | | | 12,300,288 | | | |
OCI Materials Company Ltd. | | | 9,431 | | | | 852,604 | | | (a) |
Taiyo Nippon Sanso Corp. | | | 342,954 | | | | 3,031,848 | | | |
| | | | | | | 16,184,740 | | | |
| |
Industrial Machinery — 0.4% | | | |
| | | |
FANUC Corp. | | | 34,900 | | | | 5,365,921 | | | |
Mitsubishi Heavy Industries Ltd. | | | 1,000 | | | | 3,761 | | | |
SMC Corp. | | | 29,200 | | | | 5,007,977 | | | |
| | | | | | | 10,377,659 | | | |
| |
Integrated Oil & Gas — 2.0% | | | |
| | | |
BG Group PLC | | | 412,049 | | | | 8,360,818 | | | |
See Notes to Schedule of Investments and Notes to Financial Statements.
16
Total Return Fund
| | |
| Schedule of Investments | | December 31, 2010 |
| | | | | | | | | | |
| | | |
| | | Number of
Shares | | | Fair
Value | | | |
| | | |
ENI S.p.A. | | | 107,943 | | | $ | 2,366,212 | | | |
Gazprom OAO ADR | | | 47,223 | | | | 1,201,353 | | | |
Lukoil OAO ADR | | | 29,102 | | | | 1,665,216 | | | |
Petroleo Brasileiro S.A. ADR | | | 279,555 | | | | 9,552,395 | | | |
Royal Dutch Shell PLC | | | 340,220 | | | | 11,391,057 | | | |
Suncor Energy Inc. | | | 287,883 | | | | 11,023,040 | | | |
Suncor Energy Inc. | | | 132,042 | | | | 5,086,869 | | | |
Total S.A. | | | 125,997 | | | | 6,702,094 | | | |
| | | | | | | 57,349,054 | | | |
| |
Integrated Telecommunication Services — 0.3% | | | |
| | | |
China Unicom Hong Kong Ltd. | | | 578,200 | | | | 827,100 | | | |
Telefonica S.A. | | | 265,646 | | | | 6,045,946 | | | |
Telefonica SA ADR | | | 14,583 | | | | 997,769 | | | |
| | | | | | | 7,870,815 | | | |
| |
Internet Retail — 0.0%* | | | |
| | | |
E-Commerce China Dangdang Inc. ADR | | | 5,952 | | | | 161,121 | | | (a) |
| |
Internet Software & Services — 0.7% | | | |
| | | |
Baidu Inc. ADR | | | 214,553 | | | | 20,710,801 | | | (a) |
Tencent Holdings Ltd. | | | 7,500 | | | | 164,980 | | | |
| | | | | | | 20,875,781 | | | |
| |
Investment Banking & Brokerage — 0.4% | | | |
| | | |
Egyptian Financial Group-Hermes Holding | | | 291,119 | | | | 1,685,531 | | | |
Nomura Holdings Inc. | | | 1,367,038 | | | | 8,680,409 | | | |
| | | | | | | 10,365,940 | | | |
| |
IT Consulting & Other Services — 0.3% | | | |
| | | |
Cap Gemini S.A. | | | 100,284 | | | | 4,699,345 | | | |
HCL Technologies Ltd. | | | 77,982 | | | | 793,510 | | | |
Infosys Technologies Ltd. | | | 10,815 | | | | 830,831 | | | |
Telvent GIT S.A. | | | 59,761 | | | | 1,578,886 | | | |
| | | | | | | 7,902,572 | | | |
| |
Life & Health Insurance — 0.8% | | | |
| | | |
AIA Group Ltd. | | | 1,192,434 | | | | 3,351,666 | | | (a) |
China Life Insurance Company Ltd. | | | 138,689 | | | | 565,557 | | | |
Prudential PLC | | | 1,137,337 | | | | 11,894,893 | | | |
Sony Financial Holdings Inc. | | | 1,893 | | | | 7,667,228 | | | |
Tong Yang Life Insurance | | | 28,466 | | | | 292,210 | | | |
| | | | | | | 23,771,554 | | | |
| |
Life Sciences Tools & Services — 0.0%* | | | |
| | | |
ICON PLC ADR | | | 22,100 | | | | 483,990 | | | (a) |
| |
Marine — 0.1% | | | |
| | | |
AP Moller — Maersk A/S | | | 422 | | | | 3,837,227 | | | |
| |
Multi-Line Insurance — 0.3% | | | |
| | | |
AXA S.A. | | | 336,275 | | | | 5,616,568 | | | |
| | | | | | | | | | |
| | | |
| | | Number of
Shares | | | Fair
Value | | | |
| | | |
Zurich Financial Services AG | | | 12,588 | | | $ | 3,270,908 | | | |
| | | | | | | 8,887,476 | | | |
| |
Multi-Utilities — 0.4% | | | |
| | | |
National Grid PLC | | | 885,841 | | | | 7,669,655 | | | |
Veolia Environnement S.A. | | | 155,293 | | | | 4,556,252 | | | |
| | | | | | | 12,225,907 | | | |
| |
Oil & Gas Drilling — 0.1% | | | |
| | | |
Noble Corp. | | | 71,126 | | | | 2,544,177 | | | |
| |
Oil & Gas Exploration & Production — 0.1% | | | |
| | | |
Afren PLC | | | 686,117 | | | | 1,585,548 | | | (a) |
CNOOC Ltd. | | | 409,000 | | | | 975,457 | | | |
| | | | | | | 2,561,005 | | | |
| |
Oil & Gas Refining & Marketing — 0.0%* | | | |
| | | |
Reliance Industries Ltd. | | | 48,450 | | | | 1,146,374 | | | |
| |
Packaged Foods & Meats — 0.8% | | | |
| | | |
Feihe International Inc. | | | 19,320 | | | | 205,565 | | | (a) |
Nestle S.A. | | | 314,069 | | | | 18,447,889 | | | |
Nestle S.A. ADR | | | 17,143 | | | | 1,008,351 | | | |
Unilever N.V., CVA | | | 141,557 | | | | 4,424,808 | | | |
| | | | | | | 24,086,613 | | | |
| |
Personal Products — 0.0%* | | | |
| | | |
Natura Cosmeticos S.A. | | | 15,000 | | | | 430,934 | | | |
| |
Pharmaceuticals — 0.8% | | | |
| | | |
Aspen Pharmacare Holdings Ltd. | | | 30,479 | | | | 423,893 | | | |
Bayer AG | | | 73,608 | | | | 5,460,813 | | | |
Lijun International Pharmaceutical Holding Ltd. | | | 930,213 | | | | 271,633 | | | |
Novartis AG | | | 120,436 | | | | 7,100,052 | | | |
Novartis AG ADR | | | 46,087 | | | | 2,716,828 | | | |
Roche Holding AG | | | 48,778 | | | | 7,169,387 | | | |
| | | | | | | 23,142,606 | | | |
| |
Real Estate Development — 0.0%* | | | |
| | | |
Glorious Property Holdings Ltd. (REIT) | | | 1,021,103 | | | | 348,089 | | | |
Unitech Ltd. (REIT) | | | 391,651 | | | | 578,521 | | | |
| | | | | | | 926,610 | | | |
| |
Real Estate Operating Companies — 0.0%* | | | |
| | | |
Iguatemi Empresa de Shopping Centers S.A. (REIT) | | | 17,253 | | | | 431,325 | | | |
| |
Regional Banks — 0.2% | | | |
| | | |
The Bank of Yokohama Ltd. | | | 887,981 | | | | 4,609,334 | | | |
| |
Security & Alarm Services — 0.2% | | | |
| | | |
G4S PLC | | | 223,795 | | | | 918,571 | | | |
G4S PLC | | | 859,877 | | | | 3,427,596 | | | |
| | | | | | | 4,346,167 | | | |
See Notes to Schedule of Investments and Notes to Financial Statements.
17
Total Return Fund
| | |
| Schedule of Investments | | December 31, 2010 |
| | | | | | | | | | |
| | | |
| | | Number
of Shares | | | Fair
Value | | | |
| |
Semiconductors — 0.9% | | | |
| | | |
Samsung Electronics Company Ltd. | | | 15,090 | | | $ | 12,618,213 | | | |
Taiwan Semiconductor Manufacturing Company Ltd. | | | 5,358,433 | | | | 13,048,505 | | | |
Taiwan Semiconductor Manufacturing Company Ltd. ADR | | | 90,750 | | | | 1,138,005 | | | |
| | | | | | | 26,804,723 | | | |
| |
Specialized Finance — 0.3% | | | |
| | | |
Deutsche Boerse AG | | | 119,304 | | | | 8,290,713 | | | |
| |
Steel — 0.7% | | | |
| | | |
Mechel ADR | | | 42,892 | | | | 1,253,733 | | | |
Mechel ADR | | | 13,940 | | | | 133,266 | | | |
POSCo. | | | 2,107 | | | | 904,140 | | | |
Sumitomo Metal Industries Ltd. | | | 2,985,049 | | | | 7,360,949 | | | |
Tata Steel Ltd. | | | 33,788 | | | | 514,282 | | | |
ThyssenKrupp AG | | | 108,493 | | | | 4,509,832 | | | |
Vale S.A. ADR | | | 188,697 | | | | 5,702,423 | | | (a) |
| | | | | | | 20,378,625 | | | |
| |
Trading Companies & Distributors — 0.2% | | | |
| | | |
Mitsubishi Corp. | | | 204,000 | | | | 5,528,537 | | | |
| |
Wireless Telecommunication Services — 0.9% | | | |
| | | |
America Movil SAB de C.V. ADR | | | 117,784 | | | | 6,753,734 | | | |
Mobile Telesystems OJSC ADR | | | 228,782 | | | | 4,774,681 | | | |
MTN Group Ltd. | | | 369,923 | | | | 7,516,162 | | | |
Vodafone Group PLC | | | 2,108,973 | | | | 5,474,576 | | | |
| | | | | | | 24,519,153 | | | |
| | | |
Total Common Stock
(Cost $647,572,095) | | | | | | | 734,610,251 | | | |
Preferred Stock — 0.8% | | | |
| |
Automobile Manufacturers — 0.4% | | | |
| | | |
Volkswagen AG | | | 65,880 | | | | 10,729,498 | | | |
| |
Diversified Financial Services — 0.1% | | | |
| | | |
Itau Unibanco Holding S.A. | | | 77,091 | | | | 1,847,862 | | | |
| |
Healthcare Services — 0.2% | | | |
| | | |
Fresenius SE | | | 64,224 | | | | 5,520,256 | | | |
| |
Integrated Oil & Gas — 0.0%* | | | |
| | | |
Petroleo Brasileiro S.A. | | | 86,715 | | | | 1,425,574 | | | |
| |
Steel — 0.1% | | | |
| | | |
Usinas Siderurgicas de Minas Gerais S.A. | | | 48,874 | | | | 564,112 | | | |
Vale S.A. | | | 98,094 | | | | 2,865,999 | | | |
| | | | | | | 3,430,111 | | | |
| | | | | | | | | | |
| | | |
| | | Number
of Shares | | | Fair
Value | | | |
| |
Wireless Telecommunication Services — 0.0%* | | | |
| | | |
Vivo Participacoes S.A. | | | 14,800 | | | $ | 475,205 | | | |
| | | |
Total Preferred Stock
(Cost $17,378,691) | | | | | | | 23,428,506 | | | |
Rights — 0.0%* | | | |
| | | |
Metropolitan Bank & Trust
(Cost $0) | | | 65,447 | | | | 32,865 | | | |
| | | |
Total Foreign Equity
(Cost $664,950,786) | | | | | | | 758,071,622 | | | |
| | | | | | | | | | | | |
| | | | | Principal
Amount | | | Fair
Value | | | |
Bonds and Notes — 29.0% | | | | | | | |
| |
U.S. Treasuries — 4.9% | | | |
| |
U.S. Treasury Bonds | | | |
3.88% | | 08/15/40 | | $ | 45,038,500 | | | $ | 41,484,692 | | | (h) |
U.S. Treasury Notes | | | |
1.25% | | 09/30/15 | | | 12,637,900 | | | | 12,261,720 | | | (h) |
2.63% | | 08/15/20 | | | 84,802,000 | | | | 80,396,282 | | | (h) |
3.25% | | 07/31/16 | | | 5,382,400 | | | | 5,665,396 | | | (h) |
| | | | | | | | | 139,808,090 | | | |
| |
Agency Mortgage Backed — 8.9% | | | |
| | | |
Federal Home Loan Mortgage Corp. | | | | | | | | | | |
4.50% | | 06/01/33 - 02/01/35 | | | 32,865 | | | | 33,900 | | | (h) |
5.00% | | 07/01/35 - 08/01/40 | | | 12,914,767 | | | | 13,556,398 | | | (h) |
5.00% | | 07/01/35 | | | 23,293 | | | | 24,793 | | | (h,n) |
5.50% | | 05/01/20 - 04/01/39 | | | 1,359,290 | | | | 1,454,697 | | | (h,n) |
5.50% | | 05/01/20 - 01/01/38 | | | 1,974,625 | | | | 2,141,352 | | | (h) |
6.00% | | 06/01/37 - 11/01/36 | | | 3,105,191 | | | | 3,420,912 | | | |
6.00% | | 04/01/17 - 05/01/34 | | | 39,325 | | | | 43,309 | | | (h,n) |
6.50% | | 06/01/29 - 03/01/30 | | | 4,329 | | | | 4,866 | | | (h) |
7.00% | | 06/01/29 - 08/01/36 | | | 146,482 | | | | 165,861 | | | (h) |
7.00% | | 07/01/34 | | | 6,658 | | | | 7,571 | | | (h,n) |
7.50% | | 01/01/28 - 09/01/33 | | | 9,860 | | | | 11,277 | | | (h) |
7.50% | | 12/01/30 | | | 9,994 | | | | 11,465 | | | (h,n) |
8.00% | | 01/01/30 - 11/01/30 | | | 11,550 | | | | 13,513 | | | (h) |
9.00% | | 10/01/25 | | | 405 | | | | 481 | | | (h) |
Federal National Mortgage Assoc. | | | |
4.00% | | 05/01/19 - 10/01/40 | | | 23,479,626 | | | | 23,386,880 | | | (h) |
4.50% | | 05/01/18 - 11/01/40 | | | 59,293,244 | | | | 60,955,872 | | | (h) |
5.00% | | 07/01/20 - 11/01/40 | | | 18,963,892 | | | | 19,963,784 | | | (h) |
5.32% | | 03/01/37 | | | 10,082 | | | | 10,657 | | | (i) |
5.50% | | 04/01/14 - 01/01/39 | | | 28,606,570 | | | | 30,766,162 | | | (h) |
5.53% | | 04/01/37 | | | 16,078 | | | | 17,032 | | | (i) |
6.00% | | 09/01/19 - 08/01/35 | | | 5,776,096 | | | | 6,370,852 | | | (h) |
6.50% | | 09/01/17 - 08/01/36 | | | 471,560 | | | | 524,074 | | | (h) |
7.00% | | 04/01/17 - 12/01/33 | | | 8,570 | | | | 9,563 | | | (h) |
7.50% | | 09/01/13 - 03/01/34 | | | 48,273 | | | | 54,557 | | | (h) |
8.00% | | 12/01/11 - 11/01/33 | | | 16,454 | | | | 18,897 | | | (h) |
See Notes to Schedule of Investments and Notes to Financial Statements.
18
Total Return Fund
| | |
| Schedule of Investments | | December 31, 2010 |
| | | | | | | | | | | | |
| | | | |
| | | | | Principal
Amount | | | Fair
Value | | | |
| | | | |
8.50% | | 06/01/30 | | $ | 49 | | | $ | 50 | | | (h) |
9.00% | | 04/01/16 - 12/01/22 | | | 4,167 | | | | 4,608 | | | (h) |
4.00% | | TBA | | | 21,370,000 | | | | 21,256,483 | | | (c) |
4.50% | | TBA | | | 28,600,000 | | | | 29,355,212 | | | (c) |
5.00% | | TBA | | | 13,535,000 | | | | 14,228,669 | | | (c) |
5.50% | | TBA | | | 9,600,000 | | | | 10,320,000 | | | (c) |
6.00% | | TBA | | | 10,767,000 | | | | 11,701,636 | | | (c) |
6.50% | | TBA | | | 5,044,000 | | | | 5,605,145 | | | (c) |
Government National Mortgage Assoc. | | | |
4.50% | | 08/15/33 - 09/15/34 | | | 183,475 | | | | 191,822 | | | (h) |
6.00% | | 04/15/27 - 09/15/36 | | | 391,349 | | | | 438,207 | | | (h) |
6.50% | | 04/15/24 - 09/15/36 | | | 321,478 | | | | 368,310 | | | (h) |
7.00% | | 03/15/12 - 10/15/36 | | | 264,337 | | | | 297,135 | | | (h) |
8.00% | | 03/15/30 | | | 3,173 | | | | 3,372 | | | (h) |
9.00% | | 11/15/16 - 12/15/21 | | | 10,468 | | | | 11,807 | | | (h) |
| | | | | | | | | 256,751,181 | | | |
| |
Agency Collateralized Mortgage Obligations — 0.6% | | | |
| | | |
Fannie Mae Whole Loan | | | | | | | | | | |
0.97% | | 08/25/43 | | | 3,635,538 | | | | 111,327 | | | (g,o) |
Federal Home Loan Mortgage Corp. | | | | | | | | | | |
0.08% | | 09/25/43 | | | 274,362 | | | | 2,399 | | | (g,h,o) |
Federal Home Loan Mortgage Corp. REMIC | | | | | | | | | | |
5.00% | | 02/15/38 | | | 598,100 | | | | 57,302 | | | (g,o) |
5.00% | | 05/15/38 | | | 620,484 | | | | 636,214 | | | |
5.50% | | 04/15/17 | | | 20,644 | | | | 609 | | | (g,h,o) |
Federal Home Loan Mortgage Corp.
REMIC (Series 1980) (Class 1980) |
7.50% | | 07/15/27 | | | 3,484 | | | | 761 | | | (g,h,o) |
Federal Home Loan Mortgage Corp. REMIC (Series 2631)
(Class DI) | | | | | | | | | | |
5.50% | | 06/15/33 | | | 41,876 | | | | 8,510 | | | (g,h,o) |
Federal Home Loan Mortgage Corp. REMIC (Series 2643) (Class IM) | | | | | | | | | | |
4.50% | | 03/15/18 | | | 36,318 | | | | 2,853 | | | (g,h,o) |
Federal Home Loan Mortgage Corp. REMIC (Series 2645)
(Class BI) | | | | | | | | | | |
4.50% | | 02/15/18 | | | 18,191 | | | | 1,292 | | | (g,h,o) |
Federal Home Loan Mortgage Corp. REMIC (Series 2647)
(Class DI) | | | | | | | | | | |
4.50% | | 10/15/16 | | | 7,326 | | | | 115 | | | (g,h,o) |
Federal Home Loan Mortgage Corp. REMIC (Series 2656)
(Class IU) | | | | | | | | | | |
5.00% | | 04/15/28 | | | 4,680 | | | | 2 | | | (g,h,o) |
Federal Home Loan Mortgage Corp. REMIC (Series 2722)
(Class PI) | | | | | | | | | | |
5.00% | | 06/15/28 | | | 8,424 | | | | 197 | | | (g,h,o) |
Federal Home Loan Mortgage Corp. REMIC (Series 2763)
(Class JI) | | | | | | | | | | |
5.00% | | 10/15/18 | | | 49,734 | | | | 4,492 | | | (g,h,o) |
| | | | | | | | | | | | |
| | | | |
| | | | | Principal
Amount | | | Fair
Value | | | |
| | | |
Federal Home Loan Mortgage Corp. REMIC (Series 2781)
(Class IC) | | | | | | | | | | |
5.00% | | 11/15/17 - 05/15/18 | | $ | 46,946 | | | $ | 2,293 | | | (g,h,o) |
Federal Home Loan Mortgage Corp. REMIC (Series 2795)
(Class IC) | | | | | | | | | | |
5.00% | | 07/15/17 | | | 12,735 | | | | 464 | | | (g,h,o) |
Federal Home Loan Mortgage Corp. REMIC (Series 2852)
(Class OJ) | | | | | | | | | | |
14.25% | | 09/15/34 | | | 169,561 | | | | 159,419 | | | (d,f) |
Federal Home Loan Mortgage Corp. REMIC (Series 2990)
(Class TS) | | | | | | | | | | |
6.49% | | 05/15/35 | | | 2,147,808 | | | | 211,613 | | | (g,o) |
Federal Home Loan Mortgage Corp. REMIC (Series 3311)
(Class IA) | | | | | | | | | | |
6.15% | | 05/15/37 | | | 2,648,982 | | | | 412,843 | | | (g,o) |
Federal Home Loan Mortgage Corp. REMIC (Series 3311)
(Class IB) | | | | | | | | | | |
6.15% | | 05/15/37 | | | 2,648,982 | | | | 412,843 | | | (g,o) |
Federal Home Loan Mortgage Corp. REMIC (Series 3311)
(Class IC) | | | | | | | | | | |
6.15% | | 05/15/37 | | | 2,648,982 | | | | 412,843 | | | (g,o) |
Federal Home Loan Mortgage Corp. REMIC (Series 3311)
(Class ID) | | | | | | | | | | |
6.15% | | 05/15/37 | | | 2,648,982 | | | | 412,843 | | | (g,o) |
Federal Home Loan Mortgage Corp. REMIC (Series 3311)
(Class IE) | | | | | | | | | | |
6.15% | | 05/15/37 | | | 3,854,577 | | | | 600,735 | | | (g,o) |
Federal Home Loan Mortgage Corp. STRIPS | | | | | | | | | | |
8.00% | | 02/01/23 - 07/01/24 | | | 2,414 | | | | 514 | | | (g,h,o) |
Federal Home Loan Mortgage STRIPS | | | | | | | | | | |
4.39% | | 08/01/27 | | | 587 | | | | 487 | | | (d,f) |
Federal National Mortgage Assoc. REMIC | | | | | | | | | | |
5.00% | | 08/25/38 | | | 626,396 | | | | 636,197 | | | |
5.00% | | 02/25/40 | | | 631,047 | | | | 113,568 | | | (g,o) |
5.24% | | 01/25/37 | | | 3,291,356 | | | | 397,894 | | | (g,o) |
5.74% | | 07/25/38 - 12/25/40 | | | 7,036,437 | | | | 982,677 | | | (g,o) |
5.79% | | 11/25/40 | | | 4,810,626 | | | | 801,503 | | | (g,o) |
6.07% | | 03/25/40 | | | 4,996,076 | | | | 731,402 | | | (g,o) |
6.14% | | 12/25/36 | | | 2,510,595 | | | | 299,598 | | | (g,o) |
Federal National Mortgage Assoc. REMIC (Class BZ) | | | | | | | | | | |
5.50% | | 01/25/33 | | | 705,772 | | | | 769,425 | | | |
Federal National Mortgage Assoc. REMIC (Class CS) | | | | | | | | | | |
7.44% | | 08/25/16 | | | 7,241 | | | | 127 | | | (g,h,o) |
Federal National Mortgage Assoc. REMIC (Class VZ) | | | | | | | | | | |
5.00% | | 10/25/35 | | | 484,019 | | | | 470,316 | | | |
See Notes to Schedule of Investments and Notes to Financial Statements.
19
Total Return Fund
| | |
| Schedule of Investments | | December 31, 2010 |
| | | | | | | | | | | | |
| | | | |
| | | | | Principal
Amount | | | Fair
Value | | | |
| | | |
Federal National Mortgage Assoc. REMIC (Series 1992) (Class K) | | | | | | | | | | |
12.40% | | 05/25/22 | | $ | 3 | | | $ | 68 | | | (d,g,h,o) |
Federal National Mortgage Assoc. REMIC (Series 2003) (Class HI) | | | | | | | | | | |
5.00% | | 10/25/22 | | | 40,228 | | | | 3,351 | | | (g,h,o) |
Federal National Mortgage Assoc. REMIC (Series 2003) (Class IJ) | | | | | | | | | | |
5.00% | | 02/25/32 | | | 966,549 | | | | 110,403 | | | (g,o) |
Federal National Mortgage Assoc. REMIC (Series 2003) (Class IO) | | | | | | | | | | |
1.19% | | 12/25/42 | | | 141,218 | | | | 6,037 | | | (g,h,o) |
Federal National Mortgage Assoc. REMIC (Series 2003) (Class KI) | | | | | | | | | | |
4.50% | | 05/25/18 | | | 14,295 | | | | 506 | | | (g,h,o) |
Federal National Mortgage Assoc. REMIC (Series 2003) (Class SL) | | | | | | | | | | |
16.04% | | 03/25/31 | | | 32,878 | | | | 37,459 | | | (h) |
Federal National Mortgage Assoc. REMIC (Series 2007) (Class IA) | | | | | | | | | | |
6.15% | | 06/25/37 | | | 1,710,167 | | | | 278,259 | | | (g,o) |
Federal National Mortgage Assoc. REMIC (Series 2007) (Class IB) | | | | | | | | | | |
6.15% | | 06/25/37 | | | 1,710,167 | | | | 278,259 | | | (g,o) |
Federal National Mortgage Assoc. REMIC (Series 2007) (Class IC) | | | | | | | | | | |
6.15% | | 06/25/37 | | | 1,710,167 | | | | 278,259 | | | (g,o) |
Federal National Mortgage Assoc. REMIC (Series 2007) (Class ID) | | | | | | | | | | |
6.15% | | 06/25/37 | | | 1,710,167 | | | | 278,259 | | | (g,o) |
Federal National Mortgage Assoc. REMIC (Series 2007) (Class IE) | | | | | | | | | | |
6.15% | | 06/25/37 | | | 1,710,167 | | | | 278,259 | | | (g,o) |
Federal National Mortgage Assoc. REMIC (Series 2007) (Class IF) | | | | | | | | | | |
6.15% | | 06/25/37 | | | 2,607,468 | | | | 424,258 | | | (g,o) |
Federal National Mortgage Assoc. REMIC (Series 2008) (Class ZW) | | | | | | | | | | |
5.00% | | 07/25/38 | | | 499,360 | | | | 503,890 | | | |
Federal National Mortgage Assoc. STRIPS | | | | | | | | | | |
6.00% | | 01/01/35 | | | 632,203 | | | | 108,073 | | | (g,o) |
Federal National Mortgage Assoc. STRIPS (Class 2) | | | | | | | | | | |
4.50% | | 08/01/35 | | | 957,504 | | | | 173,596 | | | (g,o) |
5.00% | | 03/25/38 | | | 764,969 | | | | 126,667 | | | (g,o) |
5.50% | | 12/01/33 | | | 210,411 | | | | 42,432 | | | (g,o) |
7.50% | | 11/01/23 | | | 10,888 | | | | 1,884 | | | (g,h,o) |
8.00% | | 08/01/23 - 07/01/24 | | | 5,226 | | | | 1,184 | | | (g,h,o) |
Federal National Mortgage Assoc. STRIPS (Series 364) (Class 1) | | | | | | | | | | |
4.50% | | 09/01/35 | | | 1,613,168 | | | | 292,467 | | | (g,o) |
Federal National Mortgage Assoc. STRIPS (Series 378) (Class 1) | | | | | | | | | | |
4.50% | | 01/01/36 | | | 1,205,710 | | | | 218,595 | | | (g,o) |
Federal National Mortgage Assoc. STRIPS (Series 387) (Class 1) | | | | | | | | | | |
5.00% | | 05/25/38 | | | 755,593 | | | | 115,503 | | | (g,o) |
| | | | | | | | | | | | |
| | | | |
| | | | | Principal
Amount | | | Fair
Value | | | |
| | | |
Government National Mortgage Assoc. | | | | | | | | | | |
4.50% | | 05/20/38 | | $ | 864,742 | | | $ | 125,232 | | | (g,o) |
4.50% | | 11/20/39 | | | 1,804,639 | | | | 1,757,607 | | | |
5.00% | | 10/20/37 - 09/20/38 | | | 4,682,979 | | | | 690,690 | | | (g,o) |
5.74% | | 11/20/39 | | | 9,812,357 | | | | 1,490,284 | | | (g,o) |
5.99% | | 10/16/39 | | | 3,454,954 | | | | 473,957 | | | (g,o) |
6.24% | | 01/16/39 | | | 5,856,251 | | | | 919,979 | | | (g,o) |
Government National Mortgage Assoc. (Class IC) | | | | | | | | | | |
5.99% | | 04/16/37 | | | 1,920,581 | | | | 330,863 | | | (g,o) |
Vendee Mortgage Trust | | | | | | | | | | |
0.38% | | 04/15/40 | | | 3,831,864 | | | | 83,918 | | | (g,o) |
Vendee Mortgage Trust (Class 2003) | | | | | | | | | | |
0.86% | | 05/15/33 | | | 2,243,644 | | | | 89,286 | | | (g,o) |
| | | | | | | | | 18,175,161 | | | |
| |
Asset Backed - 0.5% | | | |
| | | |
Bear Stearns Asset Backed Securities Trust (Class 2A2) | | | | | | | | | | |
15.92% | | 02/25/36 | | | 1,116,622 | | | | 1,063,409 | | | (d,h) |
Bear Stearns Asset Backed Securities Trust (Series 2003) (Class A) | | | | | | | | | | |
4.40% | | 01/25/34 | | | 6,052 | | | | 4,998 | | | (d) |
Capital One Multi-Asset Execution Trust (Class B) | | | | | | | | | | |
1.48% | | 01/15/19 | | | 500,000 | | | | 476,378 | | | (d) |
Citicorp Residential Mortgage Securities Inc. (Series 2006) (Class A5) | | | | | | | | | | |
6.04% | | 09/25/36 | | | 3,750,000 | | | | 3,257,760 | | | (h) |
Countrywide Asset-Backed Certificates (Class AF4) | | | | | | | | | | |
5.31% | | 08/25/35 | | | 459,520 | | | | 428,509 | | | |
Countrywide Asset-Backed Certificates (Class AF6) | | | | | | | | | | |
4.74% | | 10/25/35 | | | 601,790 | | | | 546,451 | | | (h) |
Countrywide Asset-Backed Certificates (Class M1T4) | | | | | | | | | | |
1.31% | | 06/26/33 | | | 586,601 | | | | 174,666 | | | (h) |
GSAMP Trust | | | | | | | | | | |
15.42% | | 05/25/46 | | | 156,181 | | | | 153,299 | | | (b,d) |
GSR Mortgage Loan Trust (Class A1) | | | | | | | | | | |
59.08% | | 11/25/30 | | | 1,345,949 | | | | 617,134 | | | (d) |
Hertz Vehicle Financing LLC | | | | | | | | | | |
2.60% | | 02/25/15 | | | 8,000,000 | | | | 8,071,067 | | | (b) |
Indymac Seconds Asset Backed Trust (Class A) | | | | | | | | | | |
1.00% | | 02/25/37 | | | 1,190,989 | | | | 423,889 | | | (d) |
Mid-State Trust (Class A3) | | | | | | | | | | |
7.54% | | 07/01/35 | | | 3,700 | | | | 3,742 | | | (h,n) |
Popular ABS Mortgage Pass-Through Trust (Class AF4) | | | | | | | | | | |
5.30% | | 11/25/35 | | | 700,000 | | | | 583,281 | | | |
See Notes to Schedule of Investments and Notes to Financial Statements.
20
Total Return Fund
| | |
| Schedule of Investments | | December 31, 2010 |
| | | | | | | | | | | | |
| | | | |
| | | | | Principal
Amount | | | Fair
Value | | | |
| | | |
Residential Asset Securities Corp. (Series 2002) (Class AIIB) | | | | | | | | | | |
31.64% | | 07/25/32 | | $ | 4,314 | | | $ | 2,362 | | | (d,h) |
Saxon Asset Securities Trust | | | | | | | | | | |
5.23% | | 08/25/35 | | | 209,535 | | | | 200,961 | | | |
SLM Student Loan Trust (Series 2004) (Class A1) | | | | | | | | | | |
0.82% | | 06/15/18 | | | 516 | | | | 514 | | | (d,h,i) |
| | | | | | | | | 16,008,420 | | | |
| |
Corporate Notes — 9.8% | | | |
| | | |
Abu Dhabi National Energy Co. | | | | | | | | | | |
4.75% | | 09/15/14 | | | 300,000 | | | | 310,863 | | | (b) |
6.25% | | 09/16/19 | | | 300,000 | | | | 310,890 | | | (b) |
AES El Salvador Trust | | | | | | | | | | |
6.75% | | 02/01/16 | | | 300,000 | | | | 290,224 | | | (b) |
AES Panama S.A. | | | | | | | | | | |
6.35% | | 12/21/16 | | | 443,000 | | | | 475,069 | | | (b) |
Agilent Technologies Inc. | | | | | | | | | | |
5.00% | | 07/15/20 | | | 943,000 | | | | 957,270 | | | (h) |
5.50% | | 09/14/15 | | | 472,000 | | | | 512,683 | | | (h) |
Air Jamaica Ltd. | | | | | | | | | | |
9.38% | | 07/08/15 | | | 235,714 | | | | 242,786 | | | |
Akbank TAS | | | | | | | | | | |
5.13% | | 07/22/15 | | | 600,000 | | | | 606,000 | | | (b,h) |
Alcoa Inc. | | | | | | | | | | |
6.15% | | 08/15/20 | | | 1,444,000 | | | | 1,482,845 | | | (h) |
Allergan Inc. | | | | | | | | | | |
3.38% | | 09/15/20 | | | 1,890,000 | | | | 1,782,688 | | | (h) |
Alliance One International Inc. | | | | | | | | | | |
10.00% | | 07/15/16 | | | 942,000 | | | | 965,550 | | | (h) |
ALROSA Finance S.A. | | | | | | | | | | |
7.75% | | 11/03/20 | | | 900,000 | | | | 943,875 | | | (b) |
8.88% | | 11/17/14 | | | 300,000 | | | | 335,250 | | | (b,h) |
Ameren Illinois Co. | | | | | | | | | | |
9.75% | | 11/15/18 | | | 796,000 | | | | 1,021,055 | | | |
American International Group Inc. | | | | | | | | | | |
5.85% | | 01/16/18 | | | 478,000 | | | | 492,886 | | | |
American Tower Corp. | | | | | | | | | | |
4.50% | | 01/15/18 | | | 1,479,000 | | | | 1,466,082 | | | |
Amsted Industries Inc. | | | | | | | | | | |
8.13% | | 03/15/18 | | | 1,110,000 | | | | 1,177,987 | | | (b,h) |
Anadarko Petroleum Corp. | | | | | | | | | | |
6.20% | | 03/15/40 | | | 2,309,000 | | | | 2,254,004 | | | (h) |
6.38% | | 09/15/17 | | | 477,000 | | | | 519,599 | | | |
Anheuser-Busch InBev Worldwide Inc. | | | | | | | | | | |
3.63% | | 04/15/15 | | | 1,433,000 | | | | 1,479,108 | | | (h) |
5.00% | | 04/15/20 | | | 2,245,000 | | | | 2,372,812 | | | (h) |
5.38% | | 11/15/14 | | | 2,246,000 | | | | 2,474,537 | | | (b,h) |
ARAMARK Corp. | | | | | | | | | | |
8.50% | | 02/01/15 | | | 400,000 | | | | 418,000 | | | (h) |
Arizona Public Service Co. | | | | | | | | | | |
6.25% | | 08/01/16 | | | 370,000 | | | | 413,531 | | | (h) |
AT&T Inc. | | | | | | | | | | |
6.40% | | 05/15/38 | | | 3,683,000 | | | | 3,915,044 | | | (h) |
6.70% | | 11/15/13 | | | 934,000 | | | | 1,061,183 | | | (h) |
Avis Budget Car Rental LLC | | | | | | | | | | |
9.63% | | 03/15/18 | | | 532,000 | | | | 573,230 | | | |
| | | | | | | | | | | | |
| | | | |
| | | | | Principal
Amount | | | Fair
Value | | | |
| | | |
Ball Corp. | | | | | | | | | | |
5.75% | | 05/15/21 | | $ | 2,082,000 | | | $ | 2,014,335 | | | (h) |
Banco do Brasil Cayman | | | | | | | | | | |
8.50% | | 10/29/49 | | | 450,000 | | | | 518,040 | | | (b,i) |
Banco Mercantil del Norte S.A. (Series REGS) | | | | | | | | | | |
6.14% | | 10/13/16 | | | 148,000 | | | | 152,070 | | | (i) |
BanColombia S.A. | | | | | | | | | | |
6.13% | | 07/26/20 | | | 170,000 | | | | 174,046 | | | |
Bank of America Corp. | | | | | | | | | | |
4.50% | | 04/01/15 | | | 2,905,000 | | | | 2,952,453 | | | (h) |
5.63% | | 07/01/20 | | | 3,245,000 | | | | 3,308,252 | | | (h) |
5.75% | | 12/01/17 | | | 3,250,000 | | | | 3,382,035 | | | (h) |
6.50% | | 08/01/16 | | | 1,285,000 | | | | 1,394,345 | | | |
BE Aerospace Inc. | | | | | | | | | | |
8.50% | | 07/01/18 | | | 1,330,000 | | | | 1,456,350 | | | (h) |
Boise Paper Holdings LLC | | | | | | | | | | |
8.00% | | 04/01/20 | | | 1,390,000 | | | | 1,487,300 | | | (h) |
Bombardier Inc. | | | | | | | | | | |
7.75% | | 03/15/20 | | | 3,002,000 | | | | 3,234,655 | | | (b,h) |
BP Capital Markets PLC | | | | | | | | | | |
3.13% | | 10/01/15 | | | 473,000 | | | | 472,675 | | | |
4.50% | | 10/01/20 | | | 473,000 | | | | 471,860 | | | |
Braskem Finance Ltd. | | | | | | | | | | |
7.00% | | 05/07/20 | | | 300,000 | | | | 309,750 | | | (b,h) |
Calpine Corp. | | | | | | | | | | |
7.25% | | 10/15/17 | | | 2,344,000 | | | | 2,344,000 | | | (b,h) |
Cantor Fitzgerald LP | | | | | | | | | | |
7.88% | | 10/15/19 | | | 355,000 | | | | 365,587 | | | (b) |
Case New Holland Inc. | | | | | | | | | | |
7.88% | | 12/01/17 | | | 1,225,000 | | | | 1,338,313 | | | (b,h) |
CBS Corp. | | | | | | | | | | |
5.75% | | 04/15/20 | | | 1,175,000 | | | | 1,248,629 | | | |
5.90% | | 10/15/40 | | | 668,000 | | | | 643,468 | | | |
CCO Holdings LLC | | | | | | | | | | |
7.88% | | 04/30/18 | | | 2,140,000 | | | | 2,214,900 | | | |
8.13% | | 04/30/20 | | | 402,000 | | | | 423,105 | | | |
Centrais Eletricas Brasileiras S.A. | | | | | | | | | | |
6.88% | | 07/30/19 | | | 386,000 | | | | 436,180 | | | (b) |
Central American Bank for Economic Integration | | | | | | | | | | |
5.38% | | 09/24/14 | | | 770,000 | | | | 821,616 | | | (b) |
CFG Investment SAC | | | | | | | | | | |
9.25% | | 12/19/13 | | | 400,000 | | | | 419,000 | | | |
Chesapeake Energy Corp. | | | | | | | | | | |
6.63% | | 08/15/20 | | | 1,006,000 | | | | 990,910 | | | |
7.25% | | 12/15/18 | | | 1,000,000 | | | | 1,035,000 | | | (h) |
Cincinnati Bell Inc. | | | | | | | | | | |
8.25% | | 10/15/17 | | | 2,265,000 | | | | 2,242,350 | | | (h) |
8.75% | | 03/15/18 | | | 798,000 | | | | 748,125 | | | (h) |
Citigroup Inc. | | | | | | | | | | |
5.00% | | 09/15/14 | | | 2,278,000 | | | | 2,356,541 | | | (h) |
5.13% | | 05/05/14 | | | 1,763,000 | | | | 1,870,640 | | | (h) |
5.38% | | 08/09/20 | | | 2,003,000 | | | | 2,081,131 | | | (h) |
6.13% | | 11/21/17 | | | 477,000 | | | | 522,738 | | | |
6.38% | | 08/12/14 | | | 1,682,000 | | | | 1,858,958 | | | (h) |
8.50% | | 05/22/19 | | | 825,000 | �� | | | 1,024,184 | | | (h) |
Community Health Systems Inc. | | | | | | | | | | |
8.88% | | 07/15/15 | | | 2,026,000 | | | | 2,127,300 | | | (h) |
See Notes to Schedule of Investments and Notes to Financial Statements.
21
Total Return Fund
| | |
| Schedule of Investments | | December 31, 2010 |
| | | | | | | | | | | | |
| | | | |
| | | | | Principal
Amount | | | Fair
Value | | | |
| | | |
Consolidated Edison Company of New York Inc. | | | | | | | | | | |
6.65% | | 04/01/19 | | $ | 528,000 | | | $ | 629,311 | | | |
Consolidated Edison Company of New York Inc. (Series 2008) | | | | | | | | | | |
5.85% | | 04/01/18 | | | 1,565,000 | | | | 1,797,967 | | | |
Corp Nacional del Cobre de Chile | | | | | | | | | | |
3.75% | | 11/04/20 | | | 1,171,000 | | | | 1,109,563 | | | (b) |
5.63% | | 09/21/35 | | | 134,000 | | | | 136,949 | | | (b) |
Credit Suisse First Boston International for CJSC The EXIM of Ukraine | | | | | | | | | | |
7.65% | | 09/07/11 | | | 600,000 | | | | 608,250 | | | |
Crown Castle International Corp. | | | | | | | | | | |
7.13% | | 11/01/19 | | | 1,338,000 | | | | 1,414,935 | | | |
Crown Castle Towers LLC | | | | | | | | | | |
4.88% | | 08/15/40 | | | 1,250,000 | | | | 1,201,351 | | | (b) |
6.11% | | 01/15/40 | | | 652,000 | | | | 680,245 | | | (b) |
CSN Islands XII Corp. | | | | | | | | | | |
7.00% | | 09/29/49 | | | 200,000 | | | | 197,000 | | | (b) |
CVS Caremark Corp. | | | | | | | | | | |
3.25% | | 05/18/15 | | | 730,000 | | | | 741,893 | | | |
5.75% | | 06/01/17 | | | 264,000 | | | | 293,740 | | | |
6.13% | | 09/15/39 | | | 2,412,000 | | | | 2,577,121 | | | (h) |
Denbury Resources Inc. | | | |
8.25% | | 02/15/20 | | | 662,000 | | | | 718,270 | | | |
Development Bank of Kazakhstan JSC | | | | | | | | | | |
5.50% | | 12/20/15 | | | 200,000 | | | | 201,500 | | | (b) |
Digicel Ltd. | | | |
8.25% | | 09/01/17 | | | 100,000 | | | | 102,500 | | | (b) |
DirecTV Holdings LLC | | | |
4.75% | | 10/01/14 | | | 1,026,000 | | | | 1,093,468 | | | |
5.88% | | 10/01/19 | | | 798,000 | | | | 867,301 | | | |
Dolphin Energy Ltd. | | | |
5.89% | | 06/15/19 | | | 738,320 | | | | 790,002 | | | (b) |
Drummond Company Inc. | | | |
9.00% | | 10/15/14 | | | 898,000 | | | | 958,615 | | | (b) |
DTEK Finance BV | | | |
9.50% | | 04/28/15 | | | 500,000 | | | | 517,500 | | | (b) |
Dubai Electricity & Water Authority | | | |
6.38% | | 10/21/16 | | | 400,000 | | | | 386,952 | | | (b) |
7.38% | | 10/21/20 | | | 400,000 | | | | 374,106 | | | (b) |
El Paso Corp. | | | |
8.05% | | 10/15/30 | | | 664,000 | | | | 673,690 | | | |
Empresa Nacional del Petroleo | | | |
5.25% | | 08/10/20 | | | 703,000 | | | | 702,805 | | | (b,h) |
6.25% | | 07/08/19 | | | 1,300,000 | | | | 1,402,803 | | | (b,h) |
Energy Transfer Equity LP | | | |
7.50% | | 10/15/20 | | | 1,500,000 | | | | 1,545,000 | | | |
European Investment Bank | | | |
4.88% | | 01/17/17 | | | 2,440,000 | | | | 2,719,243 | | | (h) |
Exelon Corp. | | | |
4.90% | | 06/15/15 | | | 978,000 | | | | 1,042,970 | | | |
Exelon Generation Company LLC | | | |
6.25% | | 10/01/39 | | | 1,513,000 | | | | 1,522,709 | | | |
Expedia Inc. | | | |
5.95% | | 08/15/20 | | | 1,116,000 | | | | 1,121,580 | | | |
| | | | | | | | | | | | |
| | | | |
| | | | | Principal
Amount | | | Fair
Value | | | |
| |
Export-Import Bank of Korea | | | |
5.88% | | 01/14/15 | | $ | 87,000 | | | $ | 94,215 | | | |
Fibria Overseas Finance Ltd. | | | |
7.50% | | 05/04/20 | | | 358,000 | | | | 375,900 | | | (b) |
First Horizon National Corp. | | | |
5.38% | | 12/15/15 | | | 990,000 | | | | 999,326 | | | |
Forest Oil Corp. | | | |
7.25% | | 06/15/19 | | | 1,393,000 | | | | 1,413,895 | | | |
FPL Group Capital Inc. | | | |
2.60% | | 09/01/15 | | | 1,886,000 | | | | 1,846,894 | | | |
France Telecom S.A. | | | |
2.13% | | 09/16/15 | | | 945,000 | | | | 919,898 | | | |
Frontier Communications Corp. | | | |
8.25% | | 04/15/17 | | | 936,000 | | | | 1,027,260 | | | |
Gaz Capital SA for Gazprom | | | |
8.13% | | 07/31/14 | | | 100,000 | | | | 113,000 | | | (b) |
9.25% | | 04/23/19 | | | 400,000 | | | | 491,520 | | | |
Gazprom Via Gaz Capital S.A. | | | |
5.09% | | 11/29/15 | | | 400,000 | | | | 410,000 | | | (b) |
Georgia-Pacific LLC | | | |
5.40% | | 11/01/20 | | | 2,300,000 | | | | 2,273,962 | | | (b) |
Globo Comunicacao e Participacoes S.A. | | | | | | | | | | |
6.25% | | 12/31/49 | | | 300,000 | | | | 315,000 | | | (b,j) |
7.25% | | 04/26/22 | | | 300,000 | | | | 322,500 | | | (b) |
Gold Fields Orogen Holding BVI Ltd. | | | | | | | | | | |
4.88% | | 10/07/20 | | | 852,000 | | | | 815,052 | | | (b) |
Goldman Sachs Capital I | | | |
6.35% | | 02/15/34 | | | 982,000 | | | | 935,699 | | | |
Hanesbrands Inc. | | | |
6.38% | | 12/15/20 | | | 763,000 | | | | 724,850 | | | (b) |
Hartford Financial Services Group Inc. | | | | | | | | | | |
5.50% | | 03/30/20 | | | 1,234,000 | | | | 1,251,789 | | | |
HCA Inc. | | | | | | | | | | |
9.25% | | 11/15/16 | | | 1,646,000 | | | | 1,756,076 | | | |
Health Management Associates Inc. | | | | | | | | | | |
6.13% | | 04/15/16 | | | 926,000 | | | | 935,260 | | | |
Hess Corp. | | | |
5.60% | | 02/15/41 | | | 944,000 | | | | 937,140 | | | |
Hidili Industry International Development Ltd. | | | | | | | | | | |
8.63% | | 11/04/15 | | | 350,000 | | | | 347,375 | | | (b) |
Host Hotels & Resorts LP (REIT) | | | |
9.00% | | 05/15/17 | | | 500,000 | | | | 555,000 | | | |
HSBC Finance Corp. | | | |
6.68% | | 01/15/21 | | | 3,683,000 | | | | 3,720,865 | | | (b) |
Huntington BancShares Inc. | | | |
7.00% | | 12/15/20 | | | 693,000 | | | | 729,654 | | | |
Hydro Quebec | | | |
8.05% | | 07/07/24 | | | 820,000 | | | | 1,142,576 | | | (h) |
Indo Integrated Energy BV | | | |
9.00% | | 06/01/12 | | | 300,000 | | | | 315,729 | | | (j) |
Ingles Markets Inc. | | | |
8.88% | | 05/15/17 | | | 2,590,000 | | | | 2,771,300 | | | |
See Notes to Schedule of Investments and Notes to Financial Statements.
22
Total Return Fund
| | |
| Schedule of Investments | | December 31, 2010 |
| | | | | | | | | | | | |
| | | | |
| | | | | Principal
Amount | | | Fair
Value | | | |
| | | |
Intelsat Subsidiary Holding Company S.A. | | | | | | | | | | |
8.88% | | 01/15/15 | | $ | 676,000 | | | $ | 694,590 | | | |
Intergas Finance BV | | | |
6.38% | | 05/14/17 | | | 100,000 | | | | 105,000 | | | (b) |
6.88% | | 11/04/11 | | | 200,000 | | | | 207,500 | | | |
Intergen N.V. | | | |
9.00% | | 06/30/17 | | | 1,500,000 | | | | 1,590,000 | | | (b) |
International Paper Co. | | | |
7.50% | | 08/15/21 | | | 1,624,000 | | | | 1,918,210 | | | |
IPIC GMTN Ltd. | | | |
3.13% | | 11/15/15 | | | 856,000 | | | | 836,832 | | | (b) |
5.00% | | 11/15/20 | | | 856,000 | | | | 838,797 | | | (b) |
Jarden Corp. | | | |
6.13% | | 11/15/22 | | | 758,000 | | | | 723,890 | | | |
JP Morgan Chase Capital XXV (Series Y) | | | | | | | | | | |
6.80% | | 10/01/37 | | | 846,000 | | | | 872,303 | | | |
JPMorgan Chase & Co. | | | |
5.13% | | 09/15/14 | | | 1,839,000 | | | | 1,956,827 | | | |
JPMorgan Chase Bank NA | | | |
5.88% | | 06/13/16 | | | 618,000 | | | | 675,911 | | | |
6.00% | | 10/01/17 | | | 2,300,000 | | | | 2,549,693 | | | |
Kazakhstan Temir Zholy Finance BV | | | | | | | | | | |
6.38% | | 10/06/20 | | | 200,000 | | | | 208,760 | | | (b) |
6.50% | | 05/11/11 | | | 300,000 | | | | 304,125 | | | |
KazMunaiGaz Finance Sub BV | | | |
7.00% | | 05/05/20 | | | 200,000 | | | | 208,000 | | | (b) |
9.13% | | 07/02/18 | | | 100,000 | | | | 117,000 | | | (b) |
11.75% | | 01/23/15 | | | 100,000 | | | | 124,120 | | | (b) |
Korea Development Bank | | | |
3.25% | | 03/09/16 | | | 1,415,000 | | | | 1,376,021 | | | |
Korea Hydro & Nuclear Power Company Ltd. | | | | | | | | | | |
6.25% | | 06/17/14 | | | 400,000 | | | | 438,980 | | | (b) |
Korea National Oil Corp. | | | |
5.38% | | 07/30/14 | | | 500,000 | | | | 534,809 | | | (b) |
Kraft Foods Inc. | | | |
4.13% | | 02/09/16 | | | 981,000 | | | | 1,029,775 | | | |
5.38% | | 02/10/20 | | | 2,761,000 | | | | 2,971,579 | | | |
6.50% | | 02/09/40 | | | 944,000 | | | | 1,057,874 | | | |
Kreditanstalt fuer Wiederaufbau | | | |
3.50% | | 03/10/14 | | | 3,348,000 | | | | 3,562,151 | | | |
4.13% | | 10/15/14 | | | 1,094,000 | | | | 1,189,501 | | | |
4.50% | | 07/16/18 | | | 2,864,000 | | | | 3,115,376 | | | |
LBI Escrow Corp. | | | |
8.00% | | 11/01/17 | | | 629,000 | | | | 695,831 | | | (b) |
Levi Strauss & Co. | | | |
7.63% | | 05/15/20 | | | 1,849,000 | | | | 1,909,093 | | | |
Lincoln National Corp. | | | |
6.25% | | 02/15/20 | | | 1,070,000 | | | | 1,167,137 | | | |
8.75% | | 07/01/19 | | | 1,120,000 | | | | 1,400,950 | | | |
Listrindo Capital BV | | | |
9.25% | | 01/29/15 | | | 400,000 | | | | 451,148 | | | (b) |
Lloyds TSB Bank PLC | | | |
6.50% | | 09/14/20 | | | 1,117,000 | | | | 1,027,676 | | | (b) |
Majapahit Holding BV | | | |
7.25% | | 10/17/11 | | | 348,000 | | | | 360,180 | | | (b) |
| | | | | | | | | | | | |
| | | | |
| | | | | Principal
Amount | | | Fair
Value | | | |
| | | | |
7.75% | | 10/17/16 - 01/20/20 | | $ | 1,125,000 | | | $ | 1,298,375 | | | (b) |
MBPS Finance Co. | | | |
11.25% | | 11/15/15 | | | 200,000 | | | | 197,300 | | | (b) |
MDC-GMTN B.V. | | | |
7.63% | | 05/06/19 | | | 250,000 | | | | 294,397 | | | (b) |
Merrill Lynch & Company Inc. | | | |
6.05% | | 08/15/12 | | | 919,000 | | | | 973,128 | | | |
6.88% | | 04/25/18 | | | 544,000 | | | | 595,331 | | | |
MetroPCS Wireless Inc. | | | |
6.63% | | 11/15/20 | | | 1,368,000 | | | | 1,303,020 | | | |
Midamerican Energy Holdings Co. | | | | | | | | | | |
6.13% | | 04/01/36 | | | 1,000,000 | | | | 1,080,191 | | | |
Morgan Stanley | | | |
5.50% | | 01/26/20 | | | 2,860,000 | | | | 2,882,952 | | | |
5.63% | | 09/23/19 | | | 1,367,000 | | | | 1,393,907 | | | |
6.00% | | 04/28/15 | | | 533,000 | | | | 577,241 | | | |
Morgan Stanley (Series F) | | | |
6.63% | | 04/01/18 | | | 2,440,000 | | | | 2,646,836 | | | |
Mylan Inc. | | | |
7.88% | | 07/15/20 | | | 950,000 | | | | 1,023,625 | | | (b) |
NAK Naftogaz Ukraine | | | |
9.50% | | 09/30/14 | | | 200,000 | | | | 218,000 | | | (l) |
Nalco Company | | | | | | | | | | |
6.63% | | 01/15/19 | | | 429,000 | | | | 438,653 | | | (b) |
National Agricultural Cooperative Federation | | | | | | | | | | |
4.25% | | 01/28/16 | | | 545,000 | | | | 546,440 | | | (b) |
5.00% | | 09/30/14 | | | 389,000 | | | | 408,678 | | | (b) |
National Power Corp. | | | |
4.53% | | 08/23/11 | | | 517,000 | | | | 526,799 | | | (i) |
NET Servicos de Comunicacao S.A. | | | |
7.50% | | 01/27/20 | | | 300,000 | | | | 344,250 | | | |
News America Inc. | | | |
6.65% | | 11/15/37 | | | 1,247,000 | | | | 1,381,166 | | | |
Nexen Inc. | | | |
6.40% | | 05/15/37 | | | 2,404,000 | | | | 2,329,192 | | | |
Nile Finance Ltd. | | | |
5.25% | | 08/05/15 | | | 100,000 | | | | 103,000 | | | |
Nisource Finance Corp. | | | |
6.13% | | 03/01/22 | | | 602,000 | | | | 648,629 | | | |
NRG Energy Inc. | | | |
7.38% | | 02/01/16 | | | 1,095,000 | | | | 1,122,375 | | | |
Odebrecht Drilling Norbe VIII/IX Ltd. | | | | | | | | | | |
6.35% | | 06/30/21 | | | 300,000 | | | | 312,000 | | | (b) |
Oglethorpe Power Corp. | | | |
5.38% | | 11/01/40 | | | 982,000 | | | | 940,331 | | | |
Pacific Gas & Electric Co. | | | |
5.80% | | 03/01/37 | | | 500,000 | | | | 529,911 | | | |
6.05% | | 03/01/34 | | | 2,318,000 | | | | 2,537,976 | | | |
Pacific Rubiales Energy Corp. | | | |
8.75% | | 11/10/16 | | | 100,000 | | | | 112,500 | | | (b) |
PacifiCorp | | | |
6.00% | | 01/15/39 | | | 1,250,000 | | | | 1,378,719 | | | |
6.25% | | 10/15/37 | | | 153,000 | | | | 173,389 | | | |
PAETEC Holding Corp. | | | |
8.88% | | 06/30/17 | | | 424,000 | | | | 452,620 | | | |
Pemex Finance Ltd. | | | |
9.03% | | 02/15/11 | | | 13,250 | | | | 13,361 | | | (h) |
See Notes to Schedule of Investments and Notes to Financial Statements.
23
Total Return Fund
| | |
| Schedule of Investments | | December 31, 2010 |
| | | | | | | | | | | | |
| | | | |
| | | | | Principal
Amount | | | Fair
Value | | | |
| | | |
Pemex Project Funding Master Trust | | | | | | | | | | |
6.63% | | 06/15/35 - 06/15/38 | | $ | 319,000 | | | $ | 324,209 | | | |
Petroleos Mexicanos | | | |
4.88% | | 03/15/15 | | | 880,000 | | | | 926,200 | | | |
6.00% | | 03/05/20 | | | 270,000 | | | | 286,200 | | | |
8.00% | | 05/03/19 | | | 130,000 | | | | 156,650 | | | |
Petroleum Company of Trinidad & Tobago Ltd. | | | | | | | | | | |
6.00% | | 05/08/22 | | | 1,054,167 | | | | 1,056,802 | | | |
Petronas Capital Ltd. | | | |
5.25% | | 08/12/19 | | | 522,000 | | | | 561,092 | | | (b) |
7.88% | | 05/22/22 | | | 200,000 | | | | 257,660 | | | (b) |
Petronas Global Sukuk Ltd. | | | |
4.25% | | 08/12/14 | | | 400,000 | | | | 418,463 | | | (b) |
Pioneer Natural Resources Co. | | | |
7.50% | | 01/15/20 | | | 605,000 | | | | 664,306 | | | |
Plains All American Pipeline LP Corp. | | | | | | | | | | |
3.95% | | 09/15/15 | | | 866,000 | | | | 894,819 | | | |
4.25% | | 09/01/12 | | | 345,000 | | | | 359,765 | | | |
Plains Exploration & Production Co. | | | | | | | | | | |
7.63% | | 06/01/18 | | | 1,006,000 | | | | 1,058,815 | | | |
Power Sector Assets & Liabilities Management Corp. | | | | | | | | | | |
7.25% | | 05/27/19 | | | 1,600,000 | | | | 1,855,218 | | | |
7.39% | | 12/02/24 | | | 100,000 | | | | 118,500 | | | (b) |
Prudential Financial Inc. | | | |
3.63% | | 09/17/12 | | | 342,000 | | | | 354,933 | | | |
3.88% | | 01/14/15 | | | 2,642,000 | | | | 2,725,693 | | | |
6.20% | | 11/15/40 | | | 983,000 | | | | 1,039,868 | | | |
7.38% | | 06/15/19 | | | 685,000 | | | | 807,642 | | | |
PTTEP Australia International Finance Proprietary Ltd. | | | | | | | | | | |
4.15% | | 07/19/15 | | | 1,000,000 | | | | 995,590 | | | (b) |
Qatari Diar Finance QSC (REIT) | | | |
3.50% | | 07/21/15 | | | 200,000 | | | | 199,490 | | | (b) |
5.00% | | 07/21/20 | | | 300,000 | | | | 298,576 | | | (b) |
Qtel International Finance Ltd. | | | |
6.50% | | 06/10/14 | | | 500,000 | | | | 548,061 | | | (b) |
QVC Inc. | | | |
7.50% | | 10/01/19 | | | 1,328,000 | | | | 1,397,720 | | | (b) |
RailAmerica Inc. | | | |
9.25% | | 07/01/17 | | | 796,000 | | | | 874,605 | | | |
Reliance Holdings USA Inc. | | | |
4.50% | | 10/19/20 | | | 250,000 | | | | 238,538 | | | (b) |
Republic Services Inc. | | | |
5.25% | | 11/15/21 | | | 1,087,000 | | | | 1,145,570 | | | |
5.50% | | 09/15/19 | | | 822,000 | | | | 896,421 | | | |
Reynolds Group Issuer Inc. | | | |
7.75% | | 10/15/16 | | | 1,870,000 | | | | 1,977,525 | | | (b) |
Roche Holdings Inc. | | | |
6.00% | | 03/01/19 | | | 1,649,000 | | | | 1,917,522 | | | (b) |
Rockies Express Pipeline LLC | | | |
5.63% | | 04/15/20 | | | 1,542,000 | | | | 1,490,536 | | | (b) |
RR Donnelley & Sons Co. | | | |
7.63% | | 06/15/20 | | | 1,166,000 | | | | 1,248,921 | | | |
| | | | | | | | | | | | |
| | | | |
| | | | | Principal
Amount | | | Fair
Value | | | |
| | | |
RSHB Capital SA for OJSC Russian Agricultural Bank | | | | | | | | | | |
6.30% | | 05/15/17 | | $ | 400,000 | | | $ | 402,000 | | | (b) |
6.97% | | 09/21/16 | | | 200,000 | | | | 199,500 | | | (i) |
Russian Railways | | | |
5.74% | | 04/03/17 | | | 200,000 | | | | 207,840 | | | |
Sinochem Overseas Capital Company Ltd. | | | | | | | | | | |
4.50% | | 11/12/20 | | | 140,000 | | | | 137,989 | | | (b) |
6.30% | | 11/12/40 | | | 140,000 | | | | 143,209 | | | (b) |
Solutia Inc. | | | |
7.88% | | 03/15/20 | | | 665,000 | | | | 711,550 | | | |
Southern Copper Corp. | | | | | | | | | | |
5.38% | | 04/16/20 | | | 1,266,000 | | | | 1,279,903 | | | |
6.75% | | 04/16/40 | | | 1,097,000 | | | | 1,135,940 | | | |
7.50% | | 07/27/35 | | | 500,000 | | | | 554,901 | | | |
Spirit Aerosystems Inc. | | | | | | | | | | |
7.50% | | 10/01/17 | | | 1,467,000 | | | | 1,525,680 | | | |
Suzano Trading Ltd. | | | | | | | | | | |
5.88% | | 01/23/21 | | | 200,000 | | | | 196,000 | | | (b) |
Talecris Biotherapeutics Holdings Corp. | | | | | | | | | | |
7.75% | | 11/15/16 | | | 1,500,000 | | | | 1,627,500 | | | |
Telecom Italia Capital S.A. | | | | | | | | | | |
6.00% | | 09/30/34 | | | 763,000 | | | | 633,153 | | | |
Telefonica Emisiones SAU | | | | | | | | | | |
3.73% | | 04/27/15 | | | 693,000 | | | | 687,468 | | | |
Teva Pharmaceutical Finance II BV | | | | | | | | | | |
3.00% | | 06/15/15 | | | 1,889,000 | | | | 1,922,016 | | | |
Textron Inc. | | | | | | | | | | |
6.20% | | 03/15/15 | | | 1,934,000 | | | | 2,110,124 | | | |
TGI International Ltd. | | | | | | | | | | |
9.50% | | 10/03/17 | | | 100,000 | | | | 112,250 | | | |
The AES Corp. | | | | | | | | | | |
8.00% | | 10/15/17 - 06/01/20 | | | 1,233,000 | | | | 1,305,307 | | | (h) |
The Goldman Sachs Group Inc. | | | | | | | | | | |
3.70% | | 08/01/15 | | | 1,667,000 | | | | 1,698,526 | | | |
5.38% | | 03/15/20 | | | 2,584,000 | | | | 2,670,205 | | | |
6.75% | | 10/01/37 | | | 473,000 | | | | 483,593 | | | |
The Kroger Co. | | | | | | | | | | |
6.15% | | 01/15/20 | | | 1,096,000 | | | | 1,241,944 | | | |
Ticketmaster Entertainment LLC | | | | | | | | | | |
10.75% | | 08/01/16 | | | 500,000 | | | | 541,250 | | | |
Time Warner Cable Inc. | | | | | | | | | | |
6.75% | | 07/01/18 | | | 1,864,000 | | | | 2,172,826 | | | |
7.50% | | 04/01/14 | | | 370,000 | | | | 424,319 | | | |
Time Warner Inc. | | | | | | | | | | |
3.15% | | 07/15/15 | | | 1,924,000 | | | | 1,954,819 | | | |
5.88% | | 11/15/16 | | | 1,582,000 | | | | 1,785,630 | | | |
6.20% | | 03/15/40 | | | 1,240,000 | | | | 1,318,187 | | | |
TNK-BP Finance S.A. | | | | | | | | | | |
6.13% | | 03/20/12 | | | 300,000 | | | | 313,314 | | | |
7.25% | | 02/02/20 | | | 33,000 | | | | 35,887 | | | (b) |
Transocean Inc. | | | | | | | | | | |
6.00% | | 03/15/18 | | | 287,000 | | | | 301,434 | | | |
6.80% | | 03/15/38 | | | 191,000 | | | | 195,748 | | | |
UnitedHealth Group Inc. | | | | | | | | | | |
5.80% | | 03/15/36 | | | 717,000 | | | | 727,419 | | | |
See Notes to Schedule of Investments and Notes to Financial Statements.
24
Total Return Fund
| | |
| Schedule of Investments | | December 31, 2010 |
| | | | | | | | | | | | |
| | | | |
| | | | | Principal
Amount | | | Fair
Value | | | |
| | | |
UPC Germany GmbH | | | | | | | | | | |
8.13% | | 12/01/17 | | $ | 700,000 | | | $ | 731,500 | | | (b) |
USB Capital XIII Trust | | | | | | | | | | |
6.63% | | 12/15/39 | | | 983,000 | | | | 1,004,066 | | | |
Valero Energy Corp. | | | | | | | | | | |
6.13% | | 02/01/20 | | | 2,497,000 | | | | 2,651,979 | | | (h) |
Verizon Communications Inc. | | | | | | | | | | |
6.35% | | 04/01/19 | | | 2,443,000 | | | | 2,819,598 | | | |
6.40% | | 02/15/38 | | | 1,035,000 | | | | 1,144,901 | | | |
6.90% | | 04/15/38 | | | 536,000 | | | | 625,165 | | | |
VIP Finance Ireland Limited for OJSC Vimpel Communications (Class A) | | | | | | | | | | |
8.38% | | 04/30/13 | | | 257,000 | | | | 277,560 | | | (b) |
Virgin Media Finance PLC | | | | | | | | | | |
8.38% | | 10/15/19 | | | 700,000 | | | | 764,750 | | | |
Vnesheconombank Via VEB Finance Ltd. | | | | | | | | | | |
6.80% | | 11/22/25 | | | 400,000 | | | | 399,000 | | | (b) |
VTB Capital S.A. | | | | | | | | | | |
6.47% | | 03/04/15 | | | 400,000 | | | | 416,480 | | | (b) |
WEA Finance LLC (REIT) | | | | | | | | | | |
6.75% | | 09/02/19 | | | 3,045,000 | | | | 3,392,200 | | | (b) |
7.50% | | 06/02/14 | | | 343,000 | | | | 389,291 | | | (b) |
Weatherford International
Limited Bermuda | | | | | | | | | | |
6.75% | | 09/15/40 | | | 1,657,000 | | | | 1,740,311 | | | |
Williams Partners LP | | | | | | | | | | |
5.25% | | 03/15/20 | | | 1,236,000 | | | | 1,281,238 | | | |
6.30% | | 04/15/40 | | | 980,000 | | | | 1,020,069 | | | |
Windstream Corp. | | | | | | | | | | |
7.88% | | 11/01/17 | | | 266,000 | | | | 279,633 | | | |
Woodside Finance Ltd. | | | | | | | | | | |
4.50% | | 11/10/14 | | | 1,517,000 | | | | 1,594,479 | | | (b) |
Wyeth | | | | | | | | | | |
5.50% | | 03/15/13 | | | 1,364,000 | | | | 1,491,366 | | | |
Wynn Las Vegas LLC | | | | | | | | | | |
7.88% | | 05/01/20 | | | 2,383,000 | | | | 2,549,810 | | | |
Xstrata Finance Canada Ltd. | | | | | | | | | | |
5.80% | | 11/15/16 | | | 685,275 | | | | 751,705 | | | (b) |
| | | | | | | | | 281,149,339 | | | |
| |
Non-Agency Collateralized Mortgage Obligations — 3.2% | | | |
| | | |
Banc of America Commercial Mortgage Inc. | | | | | | | | | | |
5.68% | | 07/10/46 | | | 980,000 | | | | 987,306 | | | |
5.74% | | 02/10/51 | | | 2,217,000 | | | | 2,361,511 | | | (h) |
Banc of America Commercial Mortgage Inc. (Class A4) | | | | | | | | | | |
5.63% | | 07/10/46 | | | 2,212,000 | | | | 2,373,363 | | | (h) |
Banc of America Commercial Mortgage Inc. (Class AJ) | | | | | | | | | | |
5.70% | | 07/10/46 | | | 470,000 | | | | 428,778 | | | (i) |
Banc of America Commercial Mortgage Inc. (Class C) | | | | | | | | | | |
5.70% | | 04/10/49 | | | 400,000 | | | | 70,270 | | | (h,n) |
Banc of America Funding Corp.
(Class B1) | | | | | | | | | | |
5.44% | | 03/20/36 | | | 181,319 | | | | 3,334 | | | (h,n) |
| | | | | | | | | | | | |
| | | | |
| | | | | Principal
Amount | | | Fair
Value | | | |
| | | |
Banc of America Mortgage Securities Inc. (Class B1) | | | | | | | | | | |
4.62% | | 01/25/36 | | $ | 152,455 | | | $ | 11,646 | | | (h,n) |
5.46% | | 02/25/36 | | | 156,075 | | | | 13,439 | | | (h,n) |
Banc of America Mortgage Securities Inc. (Class B2) | | | | | | | | | | |
4.62% | | 01/25/36 | | | 43,047 | | | | 194 | | | (h,n) |
Bear Stearns Commercial Mortgage Securities | | | | | | | | | | |
5.58% | | 09/11/41 | | | 1,700,000 | | | | 1,720,551 | | | (i) |
5.76% | | 09/11/38 | | | 860,000 | | | | 893,811 | | | (i) |
Bear Stearns Commercial Mortgage Securities (Class A M) | | | | | | | | | | |
5.51% | | 04/12/38 | | | 1,050,000 | | | | 1,118,094 | | | |
Bear Stearns Commercial Mortgage Securities (Class A2) | | | | | | | | | | |
5.41% | | 03/11/39 | | | 1,000,000 | | | | 999,352 | | | (h,i) |
5.51% | | 04/12/38 | | | 648,863 | | | | 650,364 | | | (h) |
Bear Stearns Commercial Mortgage Securities (Class A4) | | | | | | | | | | |
5.47% | | 01/12/45 | | | 1,125,000 | | | | 1,200,697 | | | (h) |
5.69% | | 06/11/50 | | | 5,950,000 | | | | 6,307,584 | | | (h) |
Bear Stearns Commercial Mortgage Securities (Class AJ) | | | | | | | | | | |
5.46% | | 03/11/39 | | | 600,000 | | | | 565,232 | | | (h,i) |
5.72% | | 06/11/40 | | | 710,000 | | | | 520,373 | | | (h) |
Bear Stearns Commercial Mortgage Securities (Class AM) | | | | | | | | | | |
5.24% | | 12/11/38 | | | 580,000 | | | | 584,926 | | | (h) |
5.92% | | 06/11/50 | | | 1,120,000 | | | | 1,140,289 | | | (h,n) |
Citigroup Commercial Mortgage Trust (Class AJ) | | | | | | | | | | |
5.73% | | 03/15/49 | | | 690,000 | | | | 649,847 | | | (h,i) |
Citigroup Commercial Mortgage Trust (Series 2006) (Class AJ) | | | | | | | | | | |
5.48% | | 10/15/49 | | | 730,000 | | | | 674,967 | | | (h) |
Commercial Mortgage Pass Through Certificates (Class AJ) | | | | | | | | | | |
5.79% | | 06/10/46 | | | 950,000 | | | | 917,132 | | | |
Commercial Mortgage Pass Through Certificates (Class AM) | | | | | | | | | | |
5.79% | | 06/10/46 | | | 5,460,000 | | | | 5,683,274 | | | |
Countrywide Commercial Mortgage Trust (Class AJ) | | | | | | | | | | |
5.49% | | 07/12/46 | | | 500,000 | | | | 456,325 | | | (i) |
5.91% | | 06/12/46 | | | 1,050,000 | | | | 995,595 | | | (i) |
Countrywide Commercial Mortgage Trust (Class AM) | | | | | | | | | | |
5.46% | | 07/12/46 | | | 975,000 | | | | 984,059 | | | (i) |
Credit Suisse First Boston Mortgage Securities Corp. (Class CB1) | | | | | | | | | | |
5.33% | | 10/25/35 | | | 162,954 | | | | 8,281 | | | (h,n) |
Credit Suisse Mortgage Capital Certificates (Class A3) | | | | | | | | | | |
5.47% | | 09/15/39 | | | 682,000 | | | | 715,271 | | | (h) |
Credit Suisse Mortgage Capital Certificates (Class C) | | | | | | | | | | |
5.54% | | 02/15/39 | | | 500,000 | | | | 364,583 | | | |
See Notes to Schedule of Investments and Notes to Financial Statements.
25
Total Return Fund
| | |
| Schedule of Investments | | December 31, 2010 |
| | | | | | | | | | | | |
| | | | |
| | | | | Principal
Amount | | | Fair
Value | | | |
| | | |
Credit Suisse Mortgage Capital Certificates (Class CB1) | | | | | | | | | | |
5.64% | | 02/25/36 | | $ | 108,218 | | | $ | 8,372 | | | (h,n) |
Extended Stay America Trust | | | | | | | | | | |
5.50% | | 11/05/27 | | | 1,970,000 | | | | 1,939,504 | | | (b) |
Greenwich Capital Commercial Funding Corp. | | | | | | | | | | |
5.88% | | 07/10/38 | | | 2,290,000 | | | | 2,498,387 | | | (i) |
Greenwich Capital Commercial Funding Corp. (Class A2) | | | | | | | | | | |
5.60% | | 12/10/49 | | | 1,110,000 | | | | 1,162,185 | | | |
Greenwich Capital Commercial Funding Corp. (Class AM) | | | | | | | | | | |
5.88% | | 07/10/38 | | | 1,720,000 | | | | 1,771,428 | | | (i) |
Impac CMB Trust (Class 1A1) | | | | | | | | | | |
10.83% | | 04/25/35 | | | 218,110 | | | | 174,332 | | | (d,h) |
Indymac INDA Mortgage Loan Trust (Class B1) | | | | | | | | | | |
4.50% | | 01/25/36 | | | 106,934 | | | | 2,458 | | | (h,n) |
Indymac INDA Mortgage Loan Trust (Class B2) | | | | | | | | | | |
4.50% | | 01/25/36 | | | 15,131 | | | | 14 | | | (h,n) |
JP Morgan Chase Commercial Mortgage Securities Corp. | | | | | | | | | | |
4.07% | | 11/15/43 | | | 670,000 | | | | 637,112 | | | (b) |
5.87% | | 04/15/45 | | | 860,000 | | | | 891,822 | | | |
JP Morgan Chase Commercial Mortgage Securities Corp. (Class A4) | | | | | | | | | | |
5.34% | | 08/12/37 | | | 2,860,000 | | | | 3,079,190 | | | |
5.44% | | 06/12/47 | | | 1,950,000 | | | | 2,043,463 | | | |
5.79% | | 02/12/51 | | | 3,460,000 | | | | 3,685,335 | | | |
JP Morgan Chase Commercial Mortgage Securities Corp. (Class AM) | | | | | | | | | | |
5.44% | | 05/15/45 | | | 2,465,000 | | | | 2,499,182 | | | |
5.90% | | 02/12/51 | | | 1,410,000 | | | | 1,417,452 | | | |
JP Morgan Chase Commercial Mortgage Securities Corp. (Class B) | | | | | | | | | | |
5.52% | | 04/15/43 | | | 690,000 | | | | 581,515 | | | |
LB-UBS Commercial Mortgage Trust (Class A2) | | | | | | | | | | |
6.15% | | 04/15/41 | | | 2,460,000 | | | | 2,666,459 | | | (i) |
LB-UBS Commercial Mortgage Trust (Class A4) | | | | | | | | | | |
4.95% | | 09/15/30 | | | 630,000 | | | | 671,965 | | | |
5.16% | | 02/15/31 | | | 860,000 | | | | 918,633 | | | |
5.66% | | 03/15/39 | | | 3,987,000 | | | | 4,284,411 | | | (h,i) |
LB-UBS Commercial Mortgage Trust (Class AJ) | | | | | | | | | | |
6.15% | | 04/15/41 | | | 320,000 | | | | 264,173 | | | (i) |
MASTR Alternative Loans Trust
(Class 15 AX) | | | | | | | | | | |
5.00% | | 08/25/18 | | | 26,936 | | | | 2,884 | | | (g,h,n,o) |
Medallion Trust (Series 2005) (Class A) | | | | | | | | | | |
5.60% | | 08/22/36 | | | 668,267 | | | | 647,972 | | | (d) |
| | | | | | | | | | | | |
| | | | |
| | | | | Principal
Amount | | | Fair
Value | | | |
| | | |
Merrill Lynch Mortgage Trust (Class AJ) | | | | | | | | | | |
5.66% | | 05/12/39 | | $ | 475,000 | | | $ | 435,300 | | | (i) |
Merrill Lynch Mortgage Trust (Series 2006) (Class B) | | | | | | | | | | |
5.66% | | 05/12/39 | | | 768,000 | | | | 437,203 | | | |
Morgan Stanley Capital I | | | | | | | | | | |
5.16% | | 10/12/52 | | | 2,000,000 | | | | 2,132,774 | | | (i) |
5.19% | | 11/14/42 | | | 480,000 | | | | 516,730 | | | (i) |
5.73% | | 10/15/42 | | | 922,000 | | | | 722,527 | | | |
Morgan Stanley Capital I (Class A3) | | | | | | | | | | |
5.71% | | 07/12/44 | | | 300,000 | | | | 319,987 | | | (h) |
Morgan Stanley Capital I (Class A4) | | | | | | | | | | |
5.33% | | 11/12/41 | | | 440,000 | | | | 465,923 | | | |
5.81% | | 08/12/41 | | | 380,000 | | | | 417,238 | | | (i) |
5.81% | | 12/12/49 | | | 4,878,970 | | | | 5,213,314 | | | |
Morgan Stanley Capital I (Class AJ) | | | | | | | | | | |
5.39% | | 11/12/41 | | | 2,000,000 | | | | 1,794,548 | | | (h,i) |
5.57% | | 11/12/49 | | | 980,000 | | | | 918,452 | | | (i) |
5.73% | | 10/15/42 | | | 475,000 | | | | 454,402 | | | (i) |
Morgan Stanley Capital I (Class AM) | | | | | | | | | | |
6.11% | | 12/12/49 | | | 850,000 | | | | 874,333 | | | (i) |
6.28% | | 01/11/43 | | | 910,000 | | | | 934,501 | | | |
Morgan Stanley Capital I (Class B) | | | | | | | | | | |
5.73% | | 10/15/42 | | | 150,000 | | | | 134,791 | | | |
Morgan Stanley Capital I (Series 2006) (Class AM) | | | | | | | | | | |
5.44% | | 03/12/44 | | | 1,375,000 | | | | 1,421,977 | | | (i) |
MortgageIT Trust (Class A1) | | | | | | | | | | |
10.63% | | 08/25/35 | | | 1,527,801 | | | | 1,169,118 | | | (d) |
OBP Depositor LLC Trust | | | | | | | | | | |
4.65% | | 07/15/45 | | | 610,000 | | | | 622,419 | | | (b) |
Opteum Mortgage Acceptance Corp. (Class A1A) | | | | | | | | | | |
4.97% | | 02/25/35 | | | 86,751 | | | | 83,824 | | | (d,h) |
Residential Funding Mortgage Securities I (Class M1) | | | | | | | | | | |
5.75% | | 01/25/36 | | | 126,528 | | | | 1 | | | (h,n) |
Residential Funding Mortgage Securities I (Class M2) | | | | | | | | | | |
5.75% | | 01/25/36 | | | 19,770 | | | | 2 | | | (h,n) |
Vornado DP LLC | | | | | | | | | | |
6.36% | | 09/13/28 | | | 380,000 | | | | 378,300 | | | (b) |
Wachovia Bank Commercial Mortgage Trust | | | | | | | | | | |
6.02% | | 06/15/45 | | | 780,000 | | | | 382,477 | | | |
Wachovia Bank Commercial Mortgage Trust (Class A3) | | | | | | | | | | |
5.25% | | 12/15/43 | | | 1,100,000 | | | | 1,118,114 | | | |
Wachovia Bank Commercial Mortgage Trust (Class AJ) | | | | | | | | | | |
5.52% | | 01/15/45 | | | 1,390,000 | | | | 1,366,979 | | | (i) |
5.74% | | 05/15/43 | | | 940,000 | | | | 895,254 | | | (i) |
Wachovia Bank Commercial Mortgage Trust (Class AM) | | | | | | | | | | |
5.47% | | 01/15/45 | | | 860,000 | | | | 879,827 | | | (i) |
See Notes to Schedule of Investments and Notes to Financial Statements.
26
Total Return Fund
| | |
| Schedule of Investments | | December 31, 2010 |
| | | | | | | | | | | | |
| | | | |
| | | | | Principal
Amount | | | Fair
Value | | | |
| | | |
Wachovia Bank Commercial Mortgage Trust (Series 2006) (Class AJ) | | | | | | | | | | |
5.99% | | 06/15/45 | | $ | 350,000 | | | $ | 307,899 | | | (i) |
WAMU Commercial Mortgage Securities Trust (Series 2005) (Class AJ) | | | | | | | | | | |
5.19% | | 05/25/36 | | | 870,000 | | | | 877,138 | | | (b) |
Wells Fargo Mortgage Backed Securities Trust (Class B1) | | | | | | | | | | |
5.50% | | 01/25/36 - 03/25/36 | | | 1,091,205 | | | | 166,881 | | | (h,n) |
Wells Fargo Mortgage Backed Securities Trust (Class B2) | | | | | | | | | | |
5.50% | | 03/25/36 | | | 280,793 | | | | 3 | | | (h,n) |
| | | | | | | | | 90,690,932 | | | |
| |
Sovereign Bonds — 0.9% | | | |
| | | |
Banco Nacional de Desenvolvimento Economico e Social | | | | | | | | | | |
5.50% | | 07/12/20 | | | 100,000 | | | | 102,750 | | | (b) |
6.50% | | 06/10/19 | | | 500,000 | | | | 548,750 | | | (b) |
Democratic Socialist Republic of Sri Lanka | | | | | | | | | | |
7.40% | | 01/22/15 | | | 100,000 | | | | 110,250 | | | (b) |
8.25% | | 10/24/12 | | | 100,000 | | | | 108,082 | | | |
Financing of Infrastrucural Projects State Enterprise | | | | | | | | | | |
8.38% | | 11/03/17 | | | 171,000 | | | | 178,734 | | | (b) |
Government of 1Malaysia Sukuk Global Berhad | | | | | | | | | | |
3.93% | | 06/04/15 | | | 250,000 | | | | 259,509 | | | (b) |
Government of Argentina | | | | | | | | | | |
2.50% | | 12/31/38 | | | 214,767 | | | | 96,108 | | | (j) |
5.00% | | 08/03/12 | | | 861,100 | | | | 205,372 | | | (d,i) |
7.00% | | 10/03/15 | | | 307,494 | | | | 295,963 | | | |
8.28% | | 12/31/33 | | | 220,750 | | | | 204,746 | | | |
Government of Belize | | | | | | | | | | |
6.00% | | 02/20/29 | | | 443,100 | | | | 389,928 | | | (j) |
Government of Bermuda | | | | | | | | | | |
5.60% | | 07/20/20 | | | 1,000,000 | | | | 1,039,902 | | | (b) |
Government of Brazil | | | | | | | | | | |
5.63% | | 01/07/41 | | | 330,000 | | | | 327,525 | | | |
5.88% | | 01/15/19 | | | 400,000 | | | | 444,000 | | | |
6.00% | | 02/20/29 | | | 171,100 | | | | 150,568 | | | (b,j) |
8.00% | | 01/15/18 | | | 506,671 | | | | 592,806 | | | (h) |
8.25% | | 01/20/34 | | | 266,000 | | | | 354,445 | | | |
Government of Brazilian | | | | | | | | | | |
4.88% | | 01/22/21 | | | 1,323,000 | | | | 1,349,460 | | | (h) |
Government of Colombia | | | | | | | | | | |
6.13% | | 01/18/41 | | | 1,800,000 | | | | 1,845,000 | | | (h) |
7.38% | | 03/18/19 - 09/18/37 | | | 200,000 | | | | 238,500 | | | |
Government of Costa Rica | | | | | | | | | | |
10.00% | | 08/01/20 | | | 446,000 | | | | 611,020 | | | (b) |
Government of Egypt | | | | | | | | | | |
5.75% | | 04/29/20 | | | 300,000 | | | | 309,000 | | | (b,h) |
Government of El Salvador | | | | | | | | | | |
7.65% | | 06/15/35 | | | 280,000 | | | | 296,100 | | | (b) |
| | | | | | | | | | | | |
| | | | |
| | | | | Principal
Amount | | | Fair
Value | | | |
| | | |
Government of Grenada | | | | | | | | | | |
2.50% | | 09/15/25 | | $ | 350,200 | | | $ | 189,108 | | | (b,j) |
Government of Hungary | | | | | | | | | | |
4.75% | | 02/03/15 | | | 1,500,000 | | | | 1,466,229 | | | |
Government of Lebanon | | | | | | | | | | |
6.38% | | 03/09/20 | | | 436,000 | | | | 454,547 | | | |
Government of Lithuania | | | | | | | | | | |
6.75% | | 01/15/15 | | | 200,000 | | | | 216,016 | | | (b) |
7.38% | | 02/11/20 | | | 300,000 | | | | 331,391 | | | (b) |
Government of Peruvian | | | | | | | | | | |
6.55% | | 03/14/37 | | | 447,000 | | | | 489,465 | | | |
7.35% | | 07/21/25 | | | 100,000 | | | | 121,650 | | | |
Government of Philippine | | | | | | | | | | |
6.38% | | 10/23/34 | | | 300,000 | | | | 318,000 | | | |
6.50% | | 01/20/20 | | | 186,000 | | | | 214,830 | | | |
Government of Poland | | | | | | | | | | |
6.38% | | 07/15/19 | | | 74,000 | | | | 82,896 | | | |
Government of Qatar | | | | | | | | | | |
4.00% | | 01/20/15 | | | 100,000 | | | | 103,500 | | | (b) |
5.25% | | 01/20/20 | | | 400,000 | | | | 422,000 | | | (b) |
6.40% | | 01/20/40 | | | 200,000 | | | | 217,000 | | | (b) |
Government of South Africa | | | | | | | | | | |
5.50% | | 03/09/20 | | | 443,000 | | | | 471,241 | | | |
Government of Turkey | | | | | | | | | | |
5.63% | | 03/30/21 | | | 360,000 | | | | 374,400 | | | |
6.75% | | 05/30/40 | | | 2,100,000 | | | | 2,289,000 | | | |
Government of Ukraine | | | | | | | | | | |
6.88% | | 03/04/11 | | | 343,000 | | | | 344,286 | | | (b) |
Government of Uruguay | | | | | | | | | | |
6.88% | | 09/28/25 | | | 220,478 | | | | 251,345 | | | |
Government of Venezuela | | | | | | | | | | |
1.29% | | 04/20/11 | | | 134,000 | | | | 129,980 | | | (i) |
10.75% | | 09/19/13 | | | 946,000 | | | | 910,525 | | | |
Government of Vietnam | | | | | | | | | | |
1.30% | | 03/12/16 | | | 80,348 | | | | 71,197 | | | (i) |
Korea Expressway Corp. | | | | | | | | | | |
4.50% | | 03/23/15 | | | 400,000 | | | | 411,250 | | | (b) |
Korea National Oil Corp. | | | | | | | | | | |
2.88% | | 11/09/15 | | | 1,172,000 | | | | 1,125,363 | | | (b) |
Lebanese Republic | | | | | | | | | | |
5.15% | | 11/12/18 | | | 173,000 | | | | 170,793 | | | |
Province of Manitoba Canada | | | | | | | | | | |
4.90% | | 12/06/16 | | | 330,000 | | | | 367,535 | | | (h) |
Province of Quebec Canada | | | | | | | | | | |
7.50% | | 09/15/29 | | | 495,000 | | | | 679,711 | | | |
Republic of Dominican | | | | | | | | | | |
7.50% | | 05/06/21 | | | 300,000 | | | | 323,250 | | | (b) |
9.50% | | 09/27/11 | | | 114,176 | | | | 117,601 | | | |
Republic of Ghana | | | | | | | | | | |
8.50% | | 10/04/17 | | | 200,000 | | | | 224,500 | | | (b) |
Russian Foreign Bond — Eurobond | | | | | | | | | | |
3.63% | | 04/29/15 | | | 200,000 | | | | 200,260 | | | (b) |
5.00% | | 04/29/20 | | | 300,000 | | | | 300,000 | | | (b) |
7.50% | | 03/31/30 | | | 417,335 | | | | 482,648 | | | (j) |
United Mexican States | | | | | | | | | | |
5.13% | | 01/15/20 | | | 199,000 | | | | 207,457 | | | |
6.05% | | 01/11/40 | | | 400,000 | | | | 409,000 | | | |
| | | | | | | | | 24,546,492 | | | |
See Notes to Schedule of Investments and Notes to Financial Statements.
27
Total Return Fund
| | |
| Schedule of Investments | | December 31, 2010 |
| | | | | | | | | | | | |
| | | | |
| | | | | Principal
Amount | | | Fair
Value | | | |
| | |
Municipal Bonds and Notes — 0.2% | | | | | | | |
American Municipal Power-Ohio Inc. | | | | | | | | | | |
8.08% | | 02/15/50 | | $ | 695,000 | | | $ | 739,897 | | | |
Municipal Electric Authority of Georgia | | | | | | | | | | |
6.64% | | 04/01/57 | | | 1,869,000 | | | | 1,826,947 | | | |
New Jersey State Turnpike Authority | | | | | | | | | | |
7.10% | | 01/01/41 | | | 495,000 | | | | 536,496 | | | |
7.41% | | 01/01/40 | | | 200,000 | | | | 219,520 | | | |
New Jersey Transportation Trust Fund Authority | | | | | | | | | | |
6.88% | | 12/15/39 | | | 620,000 | | | | 602,305 | | | |
South Carolina State Public Service Authority | | | | | | | | | | |
6.45% | | 01/01/50 | | | 495,000 | | | | 508,221 | | | |
| | | | | | | 4,433,386 | | | |
| | | |
Total Bonds and Notes
(Cost $824,045,481) | | | | | | | 831,563,001 | | | |
| | | | | Number of
Shares | | | Fair
Value | | | |
Exchange Traded Funds — 0.5% | | | |
Financial Select Sector SPDR Fund | | | 170,926 | | | $ | 2,726,270 | | | (m) |
Industrial Select Sector SPDR Fund | | | 310,169 | | | | 10,824,898 | | | (m) |
iShares MSCI Emerging Markets Index Fund | | | 12,505 | | | | 595,488 | | | |
| | | |
Total Exchange Traded Funds (Cost $16,190,148) | | | | | | | 14,146,656 | | | |
Other Investments—0.2% | | | | | | | |
GEI Investment Fund
(Cost $5,594,377) | | | | | | | 5,314,658 | | | (k) |
| | | |
Total Investments in Securities (Cost $2,444,205,027) | | | | | | | 2,705,423,727 | | | |
Short-Term Investments — 8.6% | | | |
| |
Short-Term Investments — 5.0% | | | |
| | | |
GE Money Market Fund Institutional Class
0.00% | | | | | | | 142,670,718 | | | (d,k) |
| | | | | | | | | | | | |
| | | | |
| | | | | Principal
Amount | | | Fair
Value | | | |
| |
Time Deposit — 0.1% | | | |
| | | |
State Street Corp. | | | | | | | | | | |
0.01% | | 01/03/11 | | $ | 1,864,637 | | | $ | 1,864,637 | | | (e) |
| |
U.S. Treasuries — 2.8% | | | |
| | | |
U.S. Treasury Bill | | | | | | | | | | |
0.07% | | 02/03/11 | | | 50,000,000 | | | | 49,994,097 | | | (d) |
0.10% | | 02/10/11 | | | 31,200,000 | | | | 31,197,504 | | | (d) |
| | | | | | | | | 81,191,601 | | | |
| |
Federal Agencies — 0.7% | | | |
| | | |
Federal Home Loan Bank Discount Notes | | | | | | | | | | |
0.10% | | 02/16/11 | | | 21,000,000 | | | | 20,997,816 | | | (d) |
| | | |
Total Short-Term Investments
(Cost $246,721,622) | | | | | | | 246,724,772 | | | |
| | | |
Total Investments
(Cost $2,690,926,649) | | | | | | | 2,952,148,499 | | | |
| | | |
Liabilities in Excess Of Other
Assets, net — (2.9)% | | | | | | | (83,607,103 | ) | | |
| | | | | | | | | | | | |
| | | |
NET ASSETS — 100.0% | | | | | | $ | 2,868,541,396 | | | |
| | | | | | | | | | | | |
Other Information | | | | | | | |
The Fund had the following long futures contracts open at December 31, 2010
| | | | | | | | | | | | | | | | |
| Description | | Expiration
Date | | | Number
of
Contracts | | | Current
Notional
Value | | | Unrealized
Appreciation/
(Depreciation) | |
DJ Euro Stoxx 50 Index Futures | | | March
2011 | | | | 92 | | | $ | 3,448,429 | | | $ | (52,344 | ) |
FTSE 100 Index Futures | | | March 2011 | | | | 35 | | | | 3,229,233 | | | | 25,205 | |
Russell 2000 Mini Index Futures | | | March 2011 | | | | 323 | | | | 25,268,290 | | | | 386,631 | |
S&P 500 EMini Index Futures | | | March 2011 | | | | 37 | | | | 2,318,050 | | | | 23,312 | |
S&P Midcap 400 Emini Index Futures | | | March 2011 | | | | 75 | | | | 6,789,750 | | | | 71,420 | |
Topix Index Futures | | | March 2011 | | | | 15 | | | | 1,657,111 | | | | 21,615 | |
2 Yr. U.S.Treasury Notes Futures | | | March 2011 | | | | 500 | | | | 109,453,125 | | | | (148,062 | ) |
5 Yr. U.S.Treasury Notes Futures | | | March 2011 | | | | 129 | | | | 15,185,719 | | | | (230,136 | ) |
See Notes to Schedule of Investments and Notes to Financial Statements.
28
Total Return Fund
| | |
| Schedule of Investments | | December 31, 2010 |
The Fund had the following short futures contracts open at December 31, 2010
| | | | | | | | | | | | | | | | |
| Description | | Expiration
date | | | Number
of
Contracts | | | Current
Notional
Value | | | Unrealized
Appreciation/
(Depreciation) | |
S&P 500 EMini Index Futures | | | March
2011 | | | | 17 | | | $ | (1,065,050 | ) | | $ | (2,351 | ) |
Ultra long U.S.Treasury Bond Futures | | | March 2011 | | | | 255 | | | | (32,408,906 | ) | | | (41,904 | ) |
10 Yr. U.S.Treasury Notes Futures | | | March 2011 | | | | 1100 | | | | (132,481,250 | ) | | | 1,672,285 | |
| | | | | | | | | | | | | | | | |
| | | | | | | | | | | | | | $ | 1,725,671 | |
| | | | | | | | | | | | | | | | |
The Fund was invested in the following countries at December 31, 2010 (unaudited):
| | | | |
| Country | | Percentage (based on
Fair Value) | |
United States | | | 70.97 | % |
United Kingdom | | | 4.60 | % |
Germany | | | 3.32 | % |
Japan | | | 3.05 | % |
France | | | 2.45 | % |
Canada | | | 2.05 | % |
Switzerland | | | 1.96 | % |
China | | | 1.57 | % |
Brazil | | | 1.39 | % |
Taiwan | | | 0.87 | % |
South Korea | | | 0.81 | % |
Netherlands | | | 0.68 | % |
Australia | | | 0.66 | % |
Spain | | | 0.60 | % |
Russian Federation | | | 0.52 | % |
India | | | 0.51 | % |
Hong Kong | | | 0.41 | % |
South Africa | | | 0.37 | % |
Mexico | | | 0.36 | % |
Italy | | | 0.30 | % |
Chile | | | 0.22 | % |
Sweden | | | 0.22 | % |
Turkey | | | 0.17 | % |
Philippines | | | 0.16 | % |
Ireland | | | 0.14 | % |
United Arab Emirates | | | 0.14 | % |
Indonesia | | | 0.14 | % |
Denmark | | | 0.13 | % |
Peru | | | 0.12 | % |
Supranationals | | | 0.12 | % |
Thailand | | | 0.09 | % |
Colombia | | | 0.08 | % |
Malaysia | | | 0.08 | % |
Egypt | | | 0.07 | % |
Israel | | | 0.06 | % |
Kazakhstan | | | 0.06 | % |
| | | | |
| Country | | Percentage (based on
Fair Value) | |
Ukraine | | | 0.06 | % |
Qatar | | | 0.06 | % |
Bermuda | | | 0.06 | % |
Hungary | | | 0.05 | % |
Trinidad And Tobago | | | 0.04 | % |
Bolivarian Republic of Venezuela | | | 0.03 | % |
Czech Republic | | | 0.03 | % |
Argentina | | | 0.03 | % |
Lebanon | | | 0.02 | % |
Costa Rica | | | 0.02 | % |
El Salvador | | | 0.02 | % |
Lithuania | | | 0.02 | % |
Belize | | | 0.02 | % |
Panama | | | 0.02 | % |
Dominican Republic | | | 0.01 | % |
Jamaica | | | 0.01 | % |
Uruguay | | | 0.01 | % |
Ghana | | | 0.01 | % |
Sri Lanka | | | 0.01 | % |
Oman | | | 0.01 | % |
Grenada | | | 0.01 | % |
| | | | |
| | | 100.00 | % |
| | | | |
The Fund’s % share of investment in the various categories, based on Fair Value, is as follows at December 31, 2010 (unaudited):
| | | | | | | | | | | | |
| Industry | | Domestic | | | Foreign | | | Total | |
Diversified Financial Services | | | 1.00 | % | | | 2.84 | % | | | 3.84 | % |
Integrated Oil & Gas | | | 1.02 | % | | | 1.99 | % | | | 3.01 | % |
Semiconductors | | | 1.16 | % | | | 0.91 | % | | | 2.07 | % |
Communications Equipment | | | 1.33 | % | | | 0.54 | % | | | 1.87 | % |
Wireless Telecommunication Services | | | 0.87 | % | | | 0.84 | % | | | 1.71 | % |
Pharmaceuticals | | | 0.87 | % | | | 0.78 | % | | | 1.65 | % |
Systems Software | | | 1.64 | % | | | 0.00 | % | | | 1.64 | % |
Asset Management & Custody Banks | | | 1.54 | % | | | 0.02 | % | | | 1.56 | % |
Fertilizers & Agricultural Chemicals | | | 0.50 | % | | | 0.98 | % | | | 1.48 | % |
Steel | | | 0.66 | % | | | 0.81 | % | | | 1.47 | % |
Life & Health Insurance | | | 0.64 | % | | | 0.81 | % | | | 1.45 | % |
Automobile Manufacturers | | | 0.16 | % | | | 1.27 | % | | | 1.43 | % |
Diversified Metals & Mining | | | 0.12 | % | | | 1.29 | % | | | 1.41 | % |
Internet Software & Services | | | 0.69 | % | | | 0.71 | % | | | 1.40 | % |
Biotechnology | | | 1.39 | % | | | 0.00 | % | | | 1.39 | % |
Packaged Foods & Meats | | | 0.50 | % | | | 0.82 | % | | | 1.32 | % |
Oil & Gas Equipment & Services | | | 1.31 | % | | | 0.00 | % | | | 1.31 | % |
Aerospace & Defense | | | 0.74 | % | | | 0.53 | % | | | 1.27 | % |
Industrial Conglomerates | | | 0.02 | % | | | 1.13 | % | | | 1.15 | % |
Healthcare Services | | | 0.89 | % | | | 0.22 | % | | | 1.11 | % |
Household Products | | | 0.54 | % | | | 0.54 | % | | | 1.08 | % |
Industrial Gases | | | 0.49 | % | | | 0.55 | % | | | 1.04 | % |
Investment Banking & Brokerage | | | 0.67 | % | | | 0.35 | % | | | 1.02 | % |
Specialized Finance | | | 0.73 | % | | | 0.28 | % | | | 1.01 | % |
See Notes to Schedule of Investments and Notes to Financial Statements.
29
Total Return Fund
| | |
| Schedule of Investments | | December 31, 2010 |
| | | | | | | | | | | | |
| Industry | | Domestic | | | Foreign | | | Total | |
Oil & Gas Exploration & Production | | | 0.92 | % | | | 0.09 | % | | | 1.01 | % |
Healthcare Equipment | | | 0.95 | % | | | 0.00 | % | | | 0.95 | % |
Life Sciences Tools & Services | | | 0.88 | % | | | 0.02 | % | | | 0.90 | % |
Soft Drinks | | | 0.82 | % | | | 0.00 | % | | | 0.82 | % |
Data Processing & Outsourced Services | | | 0.80 | % | | | 0.00 | % | | | 0.80 | % |
Electric Utilities | | | 0.70 | % | | | 0.06 | % | | | 0.76 | % |
Integrated Telecommunication Services | | | 0.44 | % | | | 0.27 | % | | | 0.71 | % |
Electrical Components & Equipment | | | 0.32 | % | | | 0.39 | % | | | 0.71 | % |
IT Consulting & Other Services | | | 0.43 | % | | | 0.27 | % | | | 0.70 | % |
Application Software | | | 0.34 | % | | | 0.34 | % | | | 0.68 | % |
Industrial Machinery | | | 0.30 | % | | | 0.35 | % | | | 0.65 | % |
Computer Hardware | | | 0.65 | % | | | 0.00 | % | | | 0.65 | % |
Multi-Utilities | | | 0.21 | % | | | 0.41 | % | | | 0.62 | % |
Movies & Entertainment | | | 0.55 | % | | | 0.00 | % | | | 0.55 | % |
Multi-Line Insurance | | | 0.25 | % | | | 0.30 | % | | | 0.55 | % |
Home Improvement Retail | | | 0.55 | % | | | 0.00 | % | | | 0.55 | % |
Cable & Satellite | | | 0.52 | % | | | 0.00 | % | | | 0.52 | % |
Advertising | | | 0.52 | % | | | 0.00 | % | | | 0.52 | % |
Construction & Engineering | | | 0.08 | % | | | 0.43 | % | | | 0.51 | % |
Construction & Farm Machinery & Heavy Trucks | | | 0.27 | % | | | 0.23 | % | | | 0.50 | % |
Security & Alarm Services | | | 0.33 | % | | | 0.15 | % | | | 0.48 | % |
Exchange Traded Fund | | | 0.48 | % | | | 0.00 | % | | | 0.48 | % |
General Merchandise Stores | | | 0.45 | % | | | 0.00 | % | | | 0.45 | % |
Food Retail | | | 0.00 | % | | | 0.45 | % | | | 0.45 | % |
Apparel, Accessories & Luxury Goods | | | 0.20 | % | | | 0.19 | % | | | 0.39 | % |
Regional Banks | | | 0.23 | % | | | 0.16 | % | | | 0.39 | % |
Office REITs | | | 0.38 | % | | | 0.00 | % | | | 0.38 | % |
Electronic Components | | | 0.07 | % | | | 0.30 | % | | | 0.37 | % |
Healthcare Supplies | | | 0.00 | % | | | 0.36 | % | | | 0.36 | % |
Hypermarkets & Super Centers | | | 0.04 | % | | | 0.31 | % | | | 0.35 | % |
Specialized REITs | | | 0.34 | % | | | 0.00 | % | | | 0.34 | % |
Real Estate Services | | | 0.34 | % | | | 0.00 | % | | | 0.34 | % |
Coal & Consumable Fuels | | | 0.13 | % | | | 0.19 | % | | | 0.32 | % |
Trading Companies & Distributors | | | 0.13 | % | | | 0.19 | % | | | 0.32 | % |
Property & Casualty Insurance | | | 0.28 | % | | | 0.00 | % | | | 0.28 | % |
Hotels, Resorts & Cruise Lines | | | 0.24 | % | | | 0.02 | % | | | 0.26 | % |
Diversified Capital Markets | | | 0.00 | % | | | 0.24 | % | | | 0.24 | % |
Diversified Support Services | | | 0.09 | % | | | 0.14 | % | | | 0.23 | % |
Diversified Real Estate Activities | | | 0.01 | % | | | 0.22 | % | | | 0.23 | % |
Retail REITs | | | 0.23 | % | | | 0.00 | % | | | 0.23 | % |
Oil & Gas Storage & Transportation | | | 0.23 | % | | | 0.00 | % | | | 0.23 | % |
Railroads | | | 0.23 | % | | | 0.00 | % | | | 0.23 | % |
Apparel Retail | | | 0.15 | % | | | 0.08 | % | | | 0.23 | % |
Home Furnishing Retail | | | 0.22 | % | | | 0.00 | % | | | 0.22 | % |
Agricultural Products | | | 0.10 | % | | | 0.08 | % | | | 0.18 | % |
Thrifts & Mortgage Finance | | | 0.17 | % | | | 0.00 | % | | | 0.17 | % |
Residential REITs | | | 0.16 | % | | | 0.00 | % | | | 0.16 | % |
Home Entertainment Software | | | 0.16 | % | | | 0.00 | % | | | 0.16 | % |
Research & Consulting Services | | | 0.16 | % | | | 0.00 | % | | | 0.16 | % |
| | | | | | | | | | | | |
| Industry | | Domestic | | | Foreign | | | Total | |
Computer Storage & Peripherals | | | 0.15 | % | | | 0.00 | % | | | 0.15 | % |
Broadcasting | | | 0.10 | % | | | 0.05 | % | | | 0.15 | % |
Gold | | | 0.00 | % | | | 0.14 | % | | | 0.14 | % |
Semiconductor Equipment | | | 0.14 | % | | | 0.00 | % | | | 0.14 | % |
Casinos & Gaming | | | 0.12 | % | | | 0.01 | % | | | 0.13 | % |
Air Freight & Logistics | | | 0.13 | % | | | 0.00 | % | | | 0.13 | % |
Restaurants | | | 0.13 | % | | | 0.00 | % | | | 0.13 | % |
Marine | | | 0.00 | % | | | 0.13 | % | | | 0.13 | % |
Building Products | | | 0.00 | % | | | 0.13 | % | | | 0.13 | % |
Healthcare Technology | | | 0.13 | % | | | 0.00 | % | | | 0.13 | % |
Construction Materials | | | 0.00 | % | | | 0.13 | % | | | 0.13 | % |
Human Resource & Employment Services | | | 0.00 | % | | | 0.13 | % | | | 0.13 | % |
Distillers & Vintners | | | 0.00 | % | | | 0.12 | % | | | 0.12 | % |
Oil & Gas Drilling | | | 0.01 | % | | | 0.09 | % | | | 0.10 | % |
Consumer Finance | | | 0.10 | % | | | 0.00 | % | | | 0.10 | % |
Reinsurance | | | 0.09 | % | | | 0.00 | % | | | 0.09 | % |
Healthcare Distributors | | | 0.07 | % | | | 0.01 | % | | | 0.08 | % |
Diversified REITs | | | 0.08 | % | | | 0.00 | % | | | 0.08 | % |
Tobacco | | | 0.07 | % | | | 0.00 | % | | | 0.07 | % |
Independent Power Producers & Energy Traders | | | 0.06 | % | | | 0.01 | % | | | 0.07 | % |
Distributors | | | 0.07 | % | | | 0.00 | % | | | 0.07 | % |
Personal Products | | | 0.05 | % | | | 0.01 | % | | | 0.06 | % |
Department Stores | | | 0.05 | % | | | 0.00 | % | | | 0.05 | % |
Home Building | | | 0.05 | % | | | 0.00 | % | | | 0.05 | % |
Electronic Manufacturing Services | | | 0.00 | % | | | 0.05 | % | | | 0.05 | % |
Specialty Chemicals | | | 0.05 | % | | | 0.00 | % | | | 0.05 | % |
Industrial REITs | | | 0.05 | % | | | 0.00 | % | | | 0.05 | % |
Brewers | | | 0.03 | % | | | 0.02 | % | | | 0.05 | % |
Food Distributors | | | 0.03 | % | | | 0.02 | % | | | 0.05 | % |
Environmental & Facilities Services | | | 0.05 | % | | | 0.00 | % | | | 0.05 | % |
Drug Retail | | | 0.05 | % | | | 0.00 | % | | | 0.05 | % |
Oil & Gas Refining & Marketing | | | 0.00 | % | | | 0.04 | % | | | 0.04 | % |
Diversified Chemicals | | | 0.04 | % | | | 0.00 | % | | | 0.04 | % |
Real Estate Development | | | 0.00 | % | | | 0.03 | % | | | 0.03 | % |
Electronic Equipment & Instruments | | | 0.00 | % | | | 0.03 | % | | | 0.03 | % |
Housewares & Specialties | | | 0.03 | % | | | 0.00 | % | | | 0.03 | % |
Paper Packaging | | | 0.03 | % | | | 0.00 | % | | | 0.03 | % |
Trucking | | | 0.02 | % | | | 0.00 | % | | | 0.02 | % |
Real Estate Operating Companies | | | 0.01 | % | | | 0.01 | % | | | 0.02 | % |
Managed Healthcare | | | 0.02 | % | | | 0.00 | % | | | 0.02 | % |
Water Utilities | | | 0.02 | % | | | 0.00 | % | | | 0.02 | % |
Household Appliances | | | 0.00 | % | | | 0.02 | % | | | 0.02 | % |
Education Services | | | 0.00 | % | | | 0.02 | % | | | 0.02 | % |
Footwear | | | 0.02 | % | | | 0.00 | % | | | 0.02 | % |
Office Electronics | | | 0.01 | % | | | 0.00 | % | | | 0.01 | % |
Heavy Electrical Equipment | | | 0.00 | % | | | 0.01 | % | | | 0.01 | % |
Consumer Electronics | | | 0.00 | % | | | 0.01 | % | | | 0.01 | % |
Publishing | | | 0.01 | % | | | 0.00 | % | | | 0.01 | % |
Office Services & Supplies | | | 0.01 | % | | | 0.00 | % | | | 0.01 | % |
Internet Retail | | | 0.00 | % | | | 0.01 | % | | | 0.01 | % |
| | | | | | | | | | | | |
| | | | | | | | | | | 63.29 | % |
| | | | | | | | | | | | |
See Notes to Schedule of Investments and Notes to Financial Statements.
30
Total Return Fund
| | |
| Schedule of Investments | | December 31, 2010 |
| | | | |
| Sector | | Percentage (based on
Fair Value) | |
Corporate Notes | | | 9.52 | % |
Agency Mortgage Backed | | | 8.70 | % |
U.S. Treasuries | | | 4.74 | % |
Non-Agency Collateralized Mortgage Obligations | | | 3.07 | % |
Sovereign Bonds | | | 0.83 | % |
Agency Collateralized Mortgage Obligations | | | 0.62 | % |
Asset Backed | | | 0.54 | % |
Municipal Bonds and Notes | | | 0.15 | % |
| | | | |
| | | 28.17 | % |
| | | | |
| |
Short Term and Other Investments | | | |
Short-Term | | | 8.36 | % |
Other Investments | | | 0.18 | % |
| | | | |
| | | 8.54 | % |
| | | | |
| | | 100.00 | % |
| | | | |
See Notes to Schedule of Investments and Notes to Financial Statements.
31
| | |
| Notes to Schedule of Investments | | December 31, 2010 |
The views expressed in this document reflect our judgment as of the publication date and are subject to change at any time without notice. The securities information regarding holdings, allocations and other characteristics are presented as of a particular date to illustrate examples of securities that the funds have bought and the diversity of areas in which the funds may invest as of a particular date. It may not be representative of the Fund’s current or future investments and should not be construed as a recommendation to purchase or sell a particular security. See the prospectus for complete descriptions of investment objectives, policies, risks and permissible investments
| (a) | Non-income producing security. |
| (b) | Pursuant to Rule 144A of the Securities Act of 1933, these securities may be resold in transactions exempt from registration, normally to qualified institutional buyers. At December 31, 2010, these securities amounted to $86,622,251 or 3.02% of the net assets of the Fund. These securities have been determined to be liquid using procedures established by the Board of Directors (unaudited). |
| (c) | Settlement is on a delayed delivery or when-issued basis with final maturity to be announced (TBA) in the future. |
| (d) | Coupon amount represents effective yield. |
| (e) | State Street Corp. is the parent company of State Street Bank & Trust Co., the Fund’s custodian and accounting agent. |
| (f) | Principal only security. These type of securities represent the right to receive the monthly principal payments on an underlying pool of mortgages. No payments of interest on the pool are passed through to the “principal only” holder. |
| (g) | Interest only security. These type of securities represent the right to receive the monthly interest payments on an underlying pool of mortgages. Payments of principal on the pool reduce the value of the “interest only” holding. |
| (h) | At December 31, 2010 , all or a portion of this security was pledged to cover collateral requirements for futures, options, forward foreign currency contracts and/or TBA’s. |
| (i) | Variable or floating rate security. The stated rate represents the rate at December 31, 2010 . |
| (j) | Step coupon bond. Security becomes interest bearing at a future date. |
| (k) | GE Asset Management, the investment adviser of the Fund, also serves as investment adviser of the GEI Investment Fund and the GE Funds-GE Money Market Fund. |
| (l) | Securities at default. |
| (m) | Sponsored by SSgA Funds Management, Inc., an affiliate of State Street Bank & Trust Co., the Fund’s custodian and accounting agent. |
| (n) | Illiquid securities. At December 31, 2010, these securities amounted to $2,973,654 or 0.10% of net assets for the Fund. These securities have been determined to be illiquid using procedures established by the Board of Directors (unaudited). |
| (o) | Coupon amount represents the coupon of the underlying mortgage securities on which monthly interest payments are based. |
| † | Percentages are based on net assets as of December 31, 2010 . |
Abbreviations:
| | |
ADR | | American Depository Receipt |
| |
GDR | | Global Depository Receipt |
| |
NVDR | | Non-Voting Depository Receipt |
| |
Regd. | | Registered |
| |
REIT | | Real Estate Investment Trust |
| |
REMIC | | Real Estate Mortgage Investment Conduit |
| |
SPDR | | Standard & Poors Depository Receipts |
| |
STRIPS | | Separate Trading of Registered Interest and Principal of Security |
| |
TBA | | To be Announced |
32
Financial Highlights
Selected data based on a share outstanding throughout the fiscal years indicated
| | | | | | | | | | | | | | | | | | | | |
| | | CLASS 1 | |
| | | 12/31/10 | | | 12/31/09 | | | 12/31/08(d) | | | 12/31/07 | | | 12/31/06 | |
| Inception date | | | — | | | | — | | | | — | | | | — | | | | 7/1/85 | |
Net asset value, beginning of period | | $ | 15.18 | | | $ | 12.75 | | | $ | 18.61 | | | $ | 17.69 | | | $ | 16.04 | |
Income/(loss) from investment operations: | | | | | | | | | | | | | | | | | | | | |
Net investment income | | | 0.23 | ** | | | 0.20 | ** | | | 0.35 | ** | | | 0.35 | | | | 0.36 | |
Net realized and unrealized gains/(losses) on investments | | | 1.23 | | | | 2.45 | | | | (5.80) | | | | 1.71 | | | | 1.84 | |
Total income/(loss) from investment operations | | | 1.46 | | | | 2.65 | | | | (5.45) | | | | 2.06 | | | | 2.20 | |
Less distributions from: | | | | | | | | | | | | | | | | | | | | |
Net investment income | | | 0.22 | | | | 0.19 | | | | 0.34 | | | | 0.35 | | | | 0.31 | |
Net realized gains | | | — | | | | — | | | | 0.07 | | | | 0.79 | | | | 0.24 | |
Return of capital | | | — | | | | 0.03 | | | | — | | | | — | | | | — | |
Total distributions | | | 0.22 | | | | 0.22 | | | | 0.41 | | | | 1.14 | | | | 0.55 | |
Net asset value, end of period | | $ | 16.42 | | | $ | 15.18 | | | $ | 12.75 | | | $ | 18.61 | | | $ | 17.69 | |
TOTAL RETURN(a) | | | 9.64% | | | | 20.81% | | | | (29.28)% | | | | 11.68% | (b) | | | 13.75% | |
| | | | | |
RATIOS/SUPPLEMENTAL DATA: | | | | | | | | | | | | | | | | | | | | |
Net assets, end of period (in thousands) | | $ | 1,152,587 | | | $ | 1,131,038 | | | $ | 989,975 | | | $ | 1,525,002 | | | $ | 1,390,230 | |
Ratios to average net assets: | | | | | | | | | | | | | | | | | | | | |
Net investment income | | | 1.51% | | | | 1.47% | | | | 2.16% | | | | 2.20% | | | | 2.33% | |
Net Expenses | | | 0.69% | (b)(c) | | | 0.67% | (b)(c) | | | 0.51% | (b)(c) | | | 0.52% | (c) | | | 0.48% | (c) |
Gross Expenses | | | 0.73% | | | | 0.70% | | | | 0.55% | | | | 0.56% | | | | 0.53% | |
Portfolio turnover rate | | | 148% | | | | 174% | | | | 203% | | | | 176% | | | | 138% | |
| | | | | | | | | | | | | | | | | | | | |
| | | CLASS 2 | |
| | | 12/31/10 | | | 12/31/09 | | | 12/31/08(d) | | | 12/31/07 | | | 12/31/06 | |
| Inception date | | | — | | | | — | | | | — | | | | — | | | | 5/1/06 | |
Net asset value, beginning of period | | $ | 15.13 | | | $ | 12.71 | | | $ | 18.56 | | | $ | 17.68 | | | $ | 17.03 | |
Income/(loss) from investment operations: | | | | | | | | | | | | | | | | | | | | |
Net investment income | | | 0.22 | ** | | | 0.19 | ** | | | 0.35 | ** | | | 0.38 | | | | 0.26 | |
Net realized and unrealized gains/(losses) on investments | | | 1.23 | | | | 2.45 | | | | (5.80) | | | | 1.67 | | | | 0.94 | |
Total income/(loss) from investment operations | | | 1.45 | | | | 2.64 | | | | (5.45) | | | | 2.05 | | | | 1.20 | |
Less distributions from: | | | | | | | | | | | | | | | | | | | | |
Net investment income | | | 0.22 | | | | 0.19 | | | | 0.33 | | | | 0.38 | | | | 0.31 | |
Net realized gains | | | — | | | | — | | | | 0.07 | | | | 0.79 | | | | 0.24 | |
Return of capital | | | — | | | | 0.03 | | | | — | | | | — | | | | — | |
Total distributions | | | 0.22 | | | | 0.22 | | | | 0.40 | | | | 1.17 | | | | 0.55 | |
Net asset value, end of period | | $ | 16.36 | | | $ | 15.13 | | | $ | 12.71 | | | $ | 18.56 | | | $ | 17.68 | |
TOTAL RETURN(a) | | | 9.59% | | | | 20.76% | | | | (29.33)% | | | | 11.63% | (b) | | | 7.05% | |
| | | | | |
RATIOS/SUPPLEMENTAL DATA: | | | | | | | | | | | | | | | | | | | | |
Net assets, end of period (in thousands) | | $ | 24,044 | | | $ | 18,140 | | | $ | 12,830 | | | $ | 15,281 | | | $ | 1 | |
Ratios to average net assets: | | | | | | | | | | | | | | | | | | | | |
Net investment income | | | 1.46% | | | | 1.41% | | | | 2.11% | | | | 1.75% | | | | 2.33% | |
Net Expenses | | | 0.74% | (b)(c) | | | 0.72% | (b)(c) | | | 0.56% | (b)(c) | | | 0.56% | (c) | | | 0.57% | (c) |
Gross Expenses | | | 0.78% | | | | 0.75% | | | | 0.60% | | | | 0.59% | | | | 0.64% | |
Portfolio turnover rate | | | 148% | | | | 174% | | | | 203% | | | | 176% | | | | 138% | |
The accompanying Notes are an integral part of these financial statements.
33
Financial Highlights
Selected data based on a share outstanding throughout the fiscal years indicated
| | | | | | | | | | | | | | | | | | | | |
| | | CLASS 3 | |
| | | 12/31/10 | | | 12/31/09 | | | 12/31/08(d) | | | 12/31/07 | | | 12/31/06 | |
| Inception date | | | — | | | | — | | | | — | | | | — | | | | 5/1/06 | |
Net asset value, beginning of period | | $ | 15.15 | | | $ | 12.73 | | | | $ 18.59 | | | | $ 17.69 | | | | $ 17.03 | |
Income/(loss) from investment operations: | | | | | | | | | | | | | | | | | | | | |
Net investment income | | | 0.19 | ** | | | 0.17 | ** | | | 0.34 | ** | | | 0.35 | | | | 0.12 | |
Net realized and unrealized gains/(losses) on investments | | | 1.23 | | | | 2.45 | | | | (5.80) | | | | 1.69 | | | | 1.10 | |
Total income/(loss) from investment operations | | | 1.42 | | | | 2.62 | | | | (5.46) | | | | 2.04 | | | | 1.22 | |
Less distributions from: | | | | | | | | | | | | | | | | | | | | |
Net investment income | | | 0.19 | | | | 0.17 | | | | 0.33 | | | | 0.35 | | | | 0.32 | |
Net realized gains | | | — | | | | — | | | | 0.07 | | | | 0.79 | | | | 0.24 | |
Return of capital | | | — | | | | 0.03 | | | | — | | | | — | | | | — | |
Total distributions | | | 0.19 | | | | 0.20 | | | | 0.40 | | | | 1.14 | | | | 0.56 | |
Net asset value, end of period | | $ | 16.38 | | | $ | 15.15 | | | | $ 12.73 | | | | $ 18.59 | | | | $ 17.69 | |
TOTAL RETURN(a) | | | 9.37% | | | | 20.57% | | | | (29.37)% | | | | 11.56% | (b) | | | 7.17% | |
| | | | | |
RATIOS/SUPPLEMENTAL DATA: | | | | | | | | | | | | | | | | | | | | |
Net assets, end of period (in thousands) | | $ | 1,691,910 | | | $ | 1,421,191 | | | | $1,110,117 | | | | $1,173,708 | | | | $396,349 | |
Ratios to average net assets: | | | | | | | | | | | | | | | | | | | | |
Net investment income | | | 1.26% | | | | 1.26% | | | | 2.05% | | | | 2.04% | | | | 2.09% | |
Net Expenses | | | 0.94% | (b)(c) | | | 0.87% | (b)(c) | | | 0.61% | (b)(c) | | | 0.61% | (c) | | | 0.62% | (c) |
Gross Expenses | | | 0.98% | | | | 0.91% | | | | 0.65% | | | | 0.65% | | | | 0.69% | |
Portfolio turnover rate | | | 148% | | | | 174% | | | | 203% | | | | 176% | | | | 138% | |
Notes to Financial Highlights
| (a) | Total returns are historical and assume changes in share price, reinvestment of dividends and capital gains distributions and do not include the effect of insurance contract charges. Past performance does not guarantee future results. |
| (b) | Reflects GE Asset Management’s waiver of a portion of the Fund’s management fee in an amount equal to the management fee earned by GEAM with respect to the Fund’s investment in the GE Funds – GE Money Market Fund (“GE Money Market Fund”). |
| (c) | Reflects GE Asset Management’s contractual arrangement with GE Investments Funds, Inc. to limit the Fund’s total operating expenses of each class share (excluding class specific expenses) to 0.32% of the average daily net assets of the Fund attributable to such class share on an annual basis. |
| (d) | Less than $0.01 per share of the distribution paid was from Return of Capital. |
| ** | Per share values have been calculated using the average share method. |
The accompanying Notes are an integral part of these financial statements.
34
| | | | |
Statement of Assets and Liabilities
December 31, 2010 | | | |
| |
ASSETS | | | | |
Investments in securities, at Fair Value (cost $2,438,610,650) | | | $2,700,109,069 | |
Investments in affiliated securities, at Fair Value (cost $5,594,377) | | | 5,314,658 | |
Short-term Investments at Fair Value (cost $104,050,904) | | | 104,054,054 | |
Short-term affiliated investments (at amortized cost) | | | 142,670,718 | |
Foreign cash (cost $183,343) | | | 185,956 | |
Receivable for investments sold | | | 1,185,037 | |
Income receivables | | | 10,050,777 | |
Receivable for fund shares sold | | | 367,149 | |
Variation margin receivable | | | 1,784 | |
Other assets | | | 2,343,895 | |
Total Assets | | | 2,966,283,097 | |
| |
LIABILITIES | | | | |
Payable for investments purchased | | | 93,188,674 | |
Payable for fund shares redeemed | | | 577,710 | |
Payable to GEAM | | | 1,909,632 | |
Accrued other expenses | | | 966,389 | |
Variation margin payable | | | 1,098,629 | |
Other liabilities | | | 667 | |
Total Liabilities | | | 97,741,701 | |
NET ASSETS | | | $2,868,541,396 | |
| |
NET ASSETS CONSIST OF: | | | | |
Capital paid in | | | 2,929,176,252 | |
Undistributed (distribution in excess of) net investment income | | | (435,606 | ) |
Accumulated net realized gain (loss) | | | (323,214,996 | ) |
Net unrealized appreciation/ (depreciation) on: | | | | |
Investments | | | 261,221,850 | |
Futures | | | 1,725,671 | |
Foreign currency related transactions | | | 68,225 | |
NET ASSETS | | | $2,868,541,396 | |
| |
Class 1: | | | | |
| |
NET ASSETS | | | 1,152,587,247 | |
Shares outstanding ($0.01 par value; unlimited shares authorized) | | | 70,211,244 | |
Net asset value per share | | | $16.42 | |
| |
Class 2: | | | | |
| |
NET ASSETS | | | 24,044,011 | |
Shares outstanding ($0.01 par value; unlimited shares authorized) | | | 1,469,997 | |
Net asset value per share | | | $16.36 | |
| |
Class 3: | | | | |
| |
NET ASSETS | | | 1,691,910,138 | |
Shares outstanding ($0.01 par value; unlimited shares authorized) | | | 103,319,600 | |
Net asset value per share | | | $16.38 | |
The accompanying Notes are an integral part of these financial statements.
35
| | | | |
Statement of Operations
For the year ended December 31, 2010 | | | |
| |
INVESTMENT INCOME | | | | |
Income: | | | | |
Dividend | | $ | 30,972,056 | |
Interest | | | 28,630,128 | |
Interest from affiliated investments | | | 39,668 | |
Less: Foreign taxes withheld | | | (1,783,446 | ) |
Total Income | | | 57,858,406 | |
| |
Expenses: | | | | |
Advisory and administrative fees | | | 13,189,403 | |
Distributors Fees (Note 6) | | | | |
Class 1 | | | 2,216,466 | |
Class 2 | | | 49,187 | |
Class 3 | | | 6,767,053 | |
Transfer agent fees | | | 31,109 | |
Directors’ fees | | | 82,428 | |
Custody and accounting expenses | | | 240,058 | |
Professional fees | | | 117,528 | |
Other expenses | | | 281,932 | |
Total expenses before waiver and reimbursement | | | 22,975,164 | |
Less: Expenses Waived or borne by the adviser | | | (455,294 | ) |
Less: Expenses reimbursed by the adviser | | | (490,828 | ) |
Net expenses | | | 22,029,042 | |
Net investment income (loss) | | | 35,829,364 | |
| |
NET REALIZED AND UNREALIZED GAIN (LOSS)
ON INVESTMENTS | | | | |
| |
Realized gain (loss) on: | | | | |
Investments | | | 6,643,668 | |
Futures | | | 10,931,394 | |
Foreign currency transactions | | | (381,092 | ) |
| |
Increase (decrease) in unrealized appreciation/(depreciation) on: | | | | |
Investments | | | 197,207,845 | |
Futures | | | (1,718,964 | ) |
Foreign currency transactions | | | 66,335 | |
Net realized and unrealized gain (loss) on investments | | | 212,749,186 | |
Net increase (decrease) in net assets resulting from operations | | $ | 248,578,550 | |
The accompanying Notes are an integral part of these financial statements.
36
| | | | | | | | |
Statements of
Changes in Net Assets | | | |
| | | Year Ended
December 31,
2010 | | | Year Ended
December 31,
2009 | |
| | |
INCREASE (DECREASE) IN NET ASSETS | | | | | | | | |
Operations: | | | | | | | | |
Net investments income | | $ | 35,829,364 | | | $ | 30,584,208 | |
Net realized gain (loss) on investments, futures and foreign currency transactions | | | 17,193,970 | | | | (210,288,844 | ) |
Net increase (decrease) in unrealized appreciation/(depreciation) on investments, futures and foreign currency transactions | | | 195,555,216 | | | | 613,358,473 | |
Net increase (decrease) from operations | | | 248,578,550 | | | | 433,653,837 | |
Distributions to shareholders from : | | | | | | | | |
Net investment income | | | | | | | | |
Class 1 | | | (15,446,329 | ) | | | (14,381,282 | ) |
Class 2 | | | (317,323 | ) | | | (226,665 | ) |
Class 3 | | | (19,259,147 | ) | | | (16,093,364 | ) |
Return of capital | | | | | | | | |
Class 1 | | | — | | | | (2,092,585 | ) |
Class 2 | | | — | | | | (32,981 | ) |
Class 3 | | | — | | | | (2,341,706 | ) |
Total distributions | | | (35,022,799 | ) | | | (35,168,583 | ) |
Increase (decrease) in net assets from operations and distributions | | | 213,555,751 | | | | 398,485,254 | |
Share transactions : | | | | | | | | |
Proceeds from sale of shares | | | | | | | | |
Class 1 | | | 7,620,320 | | | | 14,984,009 | |
Class 2 | | | 5,626,979 | | | | 3,853,694 | |
Class 3* | | | 192,903,673 | | | | 129,173,281 | |
Class 4 | | | — | | | | 51,043,749 | |
Value of distributions reinvested | | | | | | | | |
Class 1 | | | 15,446,329 | | | | 16,473,867 | |
Class 2 | | | 317,323 | | | | 259,646 | |
Class 3 | | | 19,259,147 | | | | 18,435,070 | |
Class 4 | | | — | | | | — | |
Cost of shares redeemed | | | | | | | | |
Class 1 | | | (89,418,651 | ) | | | (70,379,890 | ) |
Class 2 | | | (1,701,770 | ) | | | (1,548,125 | ) |
Class 3 | | | (65,437,159 | ) | | | (46,736,037 | ) |
Class 4* | | | — | | | | (55,604,507 | ) |
Net increase (decrease) from share transactions | | | 84,616,191 | | | | 59,954,757 | |
Total increase (decrease) in net assets | | | 298,171,942 | | | | 458,440,011 | |
| | |
NET ASSETS | | | | | | | | |
Beginning of period | | | 2,570,369,454 | | | | 2,111,929,443 | |
End of period | | $ | 2,868,541,396 | | | $ | 2,570,369,454 | |
Undistributed (distribution in excess of) net investment income, end of period | | $ | (435,606 | ) | | $ | (388,440 | ) |
| * | Shares of Class 4 ($51,960,307) were transferred to Class 3 on November 9, 2009, the class was also closed. |
The accompanying Notes are an integral part of these financial statements.
37
| | | | | | | | |
Statements of Changes in Net Assets (continued)
Changes in Fund Shares | | | |
| | | Year Ended
December 31,
2010 | | | Year Ended
December 31,
2009 | |
CHANGES IN FUND SHARES | |
| | |
Class 1 | | | | | | | | |
Shares sold | | | 495,434 | | | | 1,110,679 | |
Issued for distributions reinvested | | | 941,849 | | | | 1,079,530 | |
Shares redeemed | | | (5,752,425 | ) | | | (5,243,835 | ) |
Net increase (decrease) in fund shares | | | (4,315,142 | ) | | | (3,053,626 | ) |
| | |
Class 2 | | | | | | | | |
Shares sold | | | 363,249 | | | | 288,188 | |
Issued for distributions reinvested | | | 19,420 | | | | 17,071 | |
Shares redeemed | | | (111,812 | ) | | | (115,478 | ) |
Net increase (decrease) in fund shares | | | 270,857 | | | | 189,781 | |
| | |
Class 3 | | | | | | | | |
Shares sold | | | 12,570,250 | | | | 9,005,295 | |
Issued for distributions reinvested | | | 1,177,209 | | | | 1,210,423 | |
Shares redeemed | | | (4,260,891 | ) | | | (3,600,902 | ) |
Net increase (decrease) in fund shares | | | 9,486,568 | | | | 6,614,816 | |
The accompanying Notes are an integral part of these financial statements.
38
| | |
| Notes to Financial Statements | | December 31, 2010 |
| 1. | Organization of the Company |
GE Investments Funds, Inc. (the “Company”) was incorporated under the laws of the Commonwealth of Virginia on May 14, 1984 and is registered under the Investment Company Act of 1940, as amended (the “1940 Act”), as an open-end management investment company. The Company is composed of fourteen investment portfolios (collectively the “Funds”), although only the following eleven are currently being offered: U.S. Equity Fund, S&P 500 Index Fund, Premier Growth Equity Fund, Core Value Equity Fund, Mid-Cap Equity Fund, Small-Cap Equity Fund, International Equity Fund, Total Return Fund (the “Fund”), Income Fund, Money Market Fund and Real Estate Securities Fund.
Shares of the Funds of the Company are offered only to insurance company separate accounts that fund certain variable life insurance contracts and variable annuity contracts. GE Asset Management Incorporated (“GEAM”) is the investment adviser and administrator of each of the Funds.
The Company currently offers three share classes of the Fund as investment options for variable life insurance and variable annuity contracts — Class 1, Class 2 and Class 3. Classes 2 and 3 shares were first offered on May 1, 2006, and Fund shares outstanding prior to May 1, 2006 were designated as Class 1 shares. Each class of shares has different fees and expenses, and as a result, each class of shares will have different share price and performance. Not all variable contracts offer every class of the Fund’s shares.
| 2. | Summary of Significant Accounting Policies |
The preparation of financial statements in conformity with U.S. generally accepted accounting principles (GAAP) requires management to make estimates and assumptions that affect the reported amounts of assets and liabilities and disclosure of contingent assets and liabilities at the date of the financial statements and the reported amounts of increases and decreases in net assets from operations during the reporting period. Actual results may differ from those estimates.
Subsequent events after the balance sheet date through the date the financial statements were issued, have been evaluated in the preparation of the financial statements. There are no items to report.
The following summarizes the significant accounting policies of the Company:
Securities Valuation and Transactions. All investments in securities are recorded at their estimated fair value, as described in Note 3.
Securities transactions are accounted for as of the trade date. Realized gains and losses on investments sold are recorded on the basis of identified cost for both financial statement and federal tax purposes.
The Fund’s income, expenses (other than distribution fees) and realized and unrealized gains and losses are allocated proportionally each day among the share classes based upon the relative net assets of each class.
Foreign Currency Accounting records of the Fund are maintained in U.S. dollars. Investment securities and other assets and liabilities denominated in a foreign currency are translated to U.S. dollars at the prevailing rates of exchange at period end. Purchases and sales of securities, income receipts and expense payments denominated in foreign currencies are translated into U.S. dollars at the prevailing exchange rate on the respective dates of such transactions.
All assets and liabilities of the Fund initially expressed in foreign currency values will be converted into U.S. dollars at the WM/Reuter exchange rate computed at 11:00 a.m., Eastern time.
The Fund does not isolate the portion of the results of operations resulting from changes in foreign exchange rates from the fluctuations arising from changes in the market prices of securities during the year. Such fluctuations are included in the net realized or unrealized gain or loss from investments. Net realized gains or losses on foreign currency transactions represent net gains or losses on sales and maturities of foreign currency contracts, disposition of foreign currencies, the difference between the amount of net investment income and withholding taxes accrued and the U.S. dollar amount actually received or paid, and gains or losses between the trade and settlement date on purchases and sales of foreign securities. Net unrealized foreign exchange gains and losses arising from changes in the value of other assets and liabilities (including foreign currencies and open foreign currency contracts) as a result of changes in foreign exchange rates are included as increases or decreases in unrealized appreciation/depreciation on foreign currency related transactions.
39
| | |
| Notes to Financial Statements | | December 31, 2010 |
Derivatives The Fund is subject to equity price risk, interest rate risk, and foreign currency exchange rate risk in the normal course of pursuing its investment objective. The Fund may enter into derivative transactions for the purpose of hedging against the effects of changes in the value of portfolio securities due to anticipated changes in market conditions, to gain market exposure for residual and accumulating cash positions, and for managing the duration of fixed-income investments. A futures contract represents a commitment for the future purchase or sale of an asset at a specified price on a specified date. Upon entering into such contracts, the Fund is required to deposit with the broker, either in cash or securities, an initial margin in an amount equal to a certain percentage of the contract amount. Subsequent payments (variation margin) are made or received by the Fund each day, depending on the daily fluctuations in the value of the contract, and are recorded for financial statement purposes as unrealized gains or losses by the Fund. Upon entering into such contracts, the Fund bears the risk of interest or exchange rates and securities prices moving unexpectedly, in which case, the Fund may not achieve the anticipated benefits of the futures contracts and may realize a loss. With futures contracts, there is minimal counterparty credit risk to the Fund since futures contracts are exchange traded and the exchange’s clearinghouse, as counterparty to all traded futures, guarantees the futures against default.
Futures Contracts A futures contract represents a commitment for the future purchase or sale of an asset at a specified price on a specified date. The Fund invests in interest rate, financial and stock or bond index futures contracts subject to certain limitations. The Fund invests in futures contracts to manage its exposure to the stock and bond markets and fluctuations in currency values. Buying futures tends to increase the Fund’s exposure to the underlying instrument while selling futures tends to decrease a Fund’s exposure to the underlying instrument or to hedge other Fund investments. With futures contracts, there is minimal counterparty credit risk to the Funds since futures contracts are exchange traded and the exchange’s clearinghouse, as counterparty to all traded futures, guarantees the futures against default. A Fund’s risks in using these contracts include changes in the value of the underlying instruments, non- performance of the counterparties under the contracts’ terms and changes in the liquidity of the secondary market for the contracts. Futures contracts are valued at the settlement price established each day by the board of trade or exchange on which they principally trade.
Upon entering into a financial futures contract, the Fund is required to pledge to the broker an amount of cash and/or other assets equal to a certain percentage of the contract amount, known as initial margin deposit. Subsequent payments, known as variation margin, are made or received by the Fund each day, depending on the daily fluctuation in the fair value of the underlying security. The Fund records an unrealized gain or loss equal to the daily variation margin. Should market conditions move unexpectedly, the Fund may not achieve the anticipated benefits of the futures contracts and may incur a loss. The Fund recognizes a realized gain or loss on the expiration or closing of a futures contract.
Investments in Foreign Markets Investments in foreign markets involve special risks and considerations not typically associated with investing in the United States. These risks include revaluation of currencies, high rates of inflation, restrictions on repatriation of income and capital, and adverse political and economic developments. Moreover, securities issued in these markets may be less liquid, subject to government ownership controls, tariffs and taxes, subject to delays in settlements, and their prices may be more volatile.
The Fund may be subject to capital gains and repatriation taxes imposed by certain countries in which they invest. Such taxes are generally based upon income and/or capital gains earned or repatriated. Taxes are accrued based on net investment income, net realized gains and net unrealized appreciation as income and/or capital gains are earned.
Investment Income Corporate actions (including cash dividends) are recorded on the ex-dividend date, net of applicable withholding taxes, except for certain foreign corporate actions which are recorded as soon after the ex-dividend date as such information becomes available. Interest income is recorded on the accrual basis.
Accretion of discounts and amortization of premiums on taxable bonds are to the call or maturity date, whichever is shorter, using the effective yield method. Withholding taxes in foreign dividends have been provided for in accordance with the Fund’s understanding of the applicable country’s tax rules and rates.
Expenses Fund specific expenses are allocated to the Fund that incurs such expense and pro rata across share classes. Expenses, other than those incurred by a specific Fund, are allocated pro rata among Funds and share classes. Such expenses may include custodial fees, legal and accounting
40
| | |
| Notes to Financial Statements | | December 31, 2010 |
fees, printing costs and registration fees. All expenses of the Fund are paid by GEAM and reimbursed by the Fund. Certain class specific expenses (such as transfer agency fees or distribution fees) are allocated to the class that incurs such expense.
Federal Income Taxes The Fund intends to comply with all sections of the Internal Revenue Code applicable to regulated investment companies including the distribution of substantially all of its taxable net investment income and net realized capital gains to its shareholders. Therefore, no provision for federal income tax has been made. Each Fund is treated as a separate taxpayer for federal income tax purposes.
The Fund utilizes various methods to measure the fair value of most of its investments on a recurring basis. GAAP establishes a framework for measuring fair value and providing related disclosures. Broadly, the framework requires fair value to be determined based on the exchange price that would be received for an asset or paid to transfer a liability (an exit price) in the principal or most advantageous market for the asset or liability in an orderly transaction between market participants at the measurement date. In the absence of active markets for the identical assets or liabilities, such measurements involve developing assumptions based on market observable data and, in the absence of such data, internal information that is consistent with what market participants would use in a hypothetical transaction that occurs at the measurement date. It also establishes a three-level valuation hierarchy based upon observable and non-observable inputs.
Observable inputs reflect market data obtained from independent sources, while unobservable inputs reflect our market assumptions. Preference is given to observable inputs. These two types of inputs create the following fair value hierarchy:
Level 1 — Quoted prices for identical investments in active markets.
Level 2 — Quoted prices for similar investments in active markets; quoted prices for identical or similar investments in markets that are not active; and model-derived valuations whose inputs are observable or whose significant value drivers are observable.
Level 3 — Significant inputs to the valuation model are unobservable.
Policies and procedures are maintained to value investments using the best and most relevant data available. In addition, pricing vendors are utilized to assist in valuing investments. GEAM performs periodic reviews of the methodologies used by independent pricing services including price validation of individual securities.
Fair Value Measurement The following section describes the valuation methodologies the Fund uses to measure different financial investments at fair value.
The Fund’s portfolio securities are valued generally on the basis of market quotations. Equity securities generally are valued at the last reported sale price on the primary market in which they are traded. Portfolio securities listed on NASDAQ are valued using the NASDAQ Official Closing Price. Level 1 securities primarily include publicly-traded equity securities which may not necessarily represent the last sale price. If no sales occurred on the exchange or NASDAQ that day, the portfolio security generally is valued using the last reported bid price. In those circumstances the Fund classifies the investment securities in Level 2.
Debt securities (other than short-term securities described below) generally are valued at an evaluated bid as reported by an independent pricing service. Municipal obligations are valued at the quoted bid prices, when available. The pricing vendor uses various pricing models for each asset class that are consistent with what other market participants would use. The inputs and assumptions to the model of the pricing vendor are derived from market observable sources including: benchmark yields, reported trades, broker/dealer quotes, issuer spreads, benchmark securities, bids, offers, and other market related data. Since many fixed income securities do not trade on a daily basis, the methodology of the pricing vendor uses available information as applicable such as benchmark curves, benchmarking of like securities, sector groupings, and matrix pricing. The pricing vendor considers all available market observable inputs in determining the evaluation for a security. Thus, certain securities may not be priced using quoted prices, but rather determined from market observable information. These investments are included in Level 2 and primarily comprise our portfolio of corporate fixed income, government, mortgage and asset-backed securities.
In the absence of a reliable price from such a pricing service, debt securities may be valued based on dealer
41
| | |
| Notes to Financial Statements | | December 31, 2010 |
supplied valuations or quotations. In these infrequent circumstances, pricing vendors may provide the Funds with valuations that are based on significant unobservable inputs, and in those circumstances we classify the investment securities in Level 3.
The Fund uses non-binding broker quotes as the primary basis for valuation when there is limited, or no, relevant market activity for a specific investment or for other investments that share similar characteristics. The Fund has not adjusted the prices obtained. Investment securities priced using non-binding broker quotes are included in Level 3. As is the case with the primary pricing vendor, third-party brokers do not provide access to their proprietary valuation models, inputs and assumptions. Accordingly, GEAM conducts internal reviews of pricing for all such investment securities periodically to ensure reasonableness of valuations used in the Fund’s financial statements. These reviews are designed to identify prices that appear stale, those that have changed significantly from prior valuations, and other anomalies that may indicate that a price may not be accurate. Based on the information available, GEAM believes that the fair values provided by the brokers are representative of prices that would be received to sell the assets at the measurement date (exit prices).
Short-term investments of sufficient credit quality with remaining sixty days or less at the time of purchase are valued on a basis of amortized cost, which approximates market value and those are included in Level 2.
The Fund’s written or purchased options are valued at the last sales price, or if no sales occurred that day, at the last reported bid price and those are also included in Level 2.
If prices are not readily available for a portfolio security, or if it is believed that a price for a portfolio security does not represent its fair value, the security may be valued using procedures approved by the Fund’s Board of Directors that are designed to establish its “fair” value. These securities would be classified in Level 3. Those procedures require that the fair value of a security be established by the valuation committee. The valuation committee follows different protocols for different types of investments and circumstances. The fair value procedures may be used to value any investment of any Fund in the appropriate circumstances.
Foreign securities may be valued with the assistance of an independent fair value pricing service in circumstances where it is believed that they have been or would be
materially affected by events occurring after the close of the portfolio security’s primary market and before the close of regular trading on the NYSE. In these circumstances the Fund classifies the investment securities in Level 2. This independent fair value pricing service uses a model to identify affected securities and portfolios taking into consideration various factors and the fair value of such securities may be something other than the last available quotation or other market price.
Portfolio securities may be valued using techniques other than market quotations, under the circumstances described above. The value established for a portfolio security may be different than what would be produced through the use of another methodology or if it had been priced using market quotations. Portfolio securities that are valued using techniques other than market quotations, including “fair valued” securities, may be subject to greater fluctuation in their value from one day to the next than would be the case if market quotations were used. In addition, there is no assurance that the Fund could sell a portfolio security for the value established for it at any time and it is possible that the Fund would incur a loss because a portfolio security is sold at a discount to its established value.
Other financial investments are derivative instruments that are not reflected in Total Investments, such as futures, forwards, swaps, and written options contracts, which are valued based on fair value as discussed above.
The Fund uses closing prices for derivatives included in Level 1, which are traded either on exchanges or liquid over-the counter markets. Derivative assets and liabilities included in Level 2 primarily represent interest rate swaps, cross-currency swaps and foreign currency and commodity forward and option contracts. Derivative assets and liabilities included in Level 3 primarily represent interest rate products that contain embedded optionality or prepayment features.
The inputs or methodology used for valuing securities are not an indication of the risk associated with investing in those securities. Fair value determinations are required for securities whose value is affected by a significant event that will materially affect the value of a domestic or foreign security and which occurs subsequent to the time of the close of the principal market on which such domestic or foreign security trades but prior to the calculation of the Fund’s NAV.
42
| | |
| Notes to Financial Statements | | December 31, 2010 |
The following table presents the Fund’s investments measured at fair value on a recurring basis at December 31, 2010:
| | | | | | | | | | | | | | | | |
Investments | | | Level 1 | | | | Level 2 | | | | Level 3 | | | | Total | |
| | | | |
Investments in Securities | | | | | | | | | | | | | | | | |
Domestic Equity | | $ | 1,096,327,790 | | | $ | — | | | $ | — | | | $ | 1,096,327,790 | |
Foreign Equity | | | 734,610,251 | | | | — | | | | — | | | | 734,610,251 | |
U.S. Treasuries | | | — | | | | 139,808,090 | | | | — | | | | 139,808,090 | |
Agency Mortgage Backed | | | — | | | | 256,751,181 | | | | — | | | | 256,751,181 | |
Agency CMOs | | | — | | | | 17,394,552 | | | | 780,609 | | | | 18,175,161 | |
Asset Backed | | | — | | | | 16,008,420 | | | | — | | | | 16,008,420 | |
Corporate Notes | | | — | | | | 281,149,339 | | | | — | | | | 281,149,339 | |
Non-Agency CMOs | | | — | | | | 90,690,725 | | | | 207 | | | | 90,690,932 | |
Sovereign Bonds | | | — | | | | 24,546,492 | | | | — | | | | 24,546,492 | |
Municipal Notes and Bonds | | | — | | | | 4,433,386 | | | | — | | | | 4,433,386 | |
Exchange Traded Funds | | | 14,146,656 | | | | — | | | | — | | | | 14,146,656 | |
Preferred Stock | | | 23,428,506 | | | | — | | | | — | | | | 23,428,506 | |
Rights | | | — | | | | 32,865 | | | | — | | | | 32,865 | |
Other Investments | | | — | | | | 5,314,658 | | | | — | | | | 5,314,658 | |
Short-Term Investments | | | 142,670,718 | | | | 104,054,054 | | | | — | | | | 246,724,772 | |
| | | | | | | | | | | | | | | | |
Total Investments in Securities | | $ | 2,011,183,921 | | | $ | 940,183,762 | | | $ | 780,816 | | | $ | 2,952,148,499 | |
| | | | | | | | | | | | | | | | |
Other Financial Instruments | | | | | | | | | | | | | | | | |
Futures Contracts — Unrealized Appreciation | | $ | 2,200,468 | | | $ | — | | | $ | — | | | $ | 2,200,468 | |
Futures Contracts — Unrealized Depreciation | | | (474,797 | ) | | | — | | | | — | | | | (474,797 | ) |
| | | | | | | | | | | | | | | | |
Total Other Financial Instruments | | $ | 1,725,671 | | | $ | — | | | $ | — | | | $ | 1,725,671 | |
| | | | | | | | | | | | | | | | |
| | | | |
| | | | | | | | | | | | | | | | | |
Following is a reconciliation of securities activity based on Level 3 inputs for which unobservable market inputs were used to determine fair value:
| | | | | | | | | | | | | | | | | | | | | | | | |
| | | Agency
Mortgage
Backed | | | Agency
CMOs | | | Asset
Backed | | | Corporate
Notes | | | Non-Agency
CMOs | | | Total | |
Balance at 12/31/09 | | $ | 26,508,818 | | | $ | 1,747,108 | | | $ | 317,855 | | | $ | 1,180,014 | | | $ | 125,463 | | | $ | 29,879,258 | |
Accrued discounts/premiums | | | — | | | | (208,544 | ) | | | — | | | | (1,994 | ) | | | — | | | | (210,538 | ) |
Realized gain (loss) | | | 91,655 | | | | (50,124 | ) | | | — | | | | 27,683 | | | | (535,152 | ) | | | (465,938 | ) |
Change in unrealized gain (loss) | | | (64,872 | ) | | | (84,800 | ) | | | — | | | | (20,655 | ) | | | 671,253 | | | | 500,926 | |
Net purchases (sales) | | | (19,172,663 | ) | | | (1,694,749 | ) | | | — | | | | (386,173 | ) | | | (169,181 | ) | | | (21,422,766 | ) |
Net transfers in and out of Level 3 | | | (7,362,938 | ) | | | 1,071,718 | | | | (317,855 | ) | | | (798,875 | ) | | | (92,176 | ) | | | (7,500,126 | ) |
Balance at 12/31/10 | | $ | — | | | $ | 780,609 | | | $ | — | | | $ | — | | | $ | 207 | | | $ | 780,816 | |
Change in unrealized gain (loss) relating to securities still held at 12/31/10 | | $ | — | | | $ | 23,814 | | | $ | — | | | $ | — | | | $ | 80,348 | | | $ | 104,162 | |
Transfers in and out of Level 3 are considered to occur at the beginning of the period.
43
| | |
| Notes to Financial Statements | | December 31, 2010 |
| 4. | Derivatives Transactions |
Shown below are the derivative contracts entered into by the Fund, summarized by primary risk exposure as they appear on the Statement of Assets and Liabilities, all of which are not accounted for as hedging instruments under FASB Accounting Standards Codification (“ASC”) No. 815 Derivatives and Hedging as of December 31, 2010.
| | | | | | | | | | | | |
| | Asset Derivatives | | | Liability Derivatives | |
| Derivatives not accounted for as hedging instruments under ASC 815 | | Location in the Statements of Assets and Liabilities | |
| Fair
Value ($) |
| | Location in the Statements of Assets and Liabilities | |
| Fair
Value ($) |
|
| | | | |
| | | | |
Total Return Fund | | | | | | | | | | | | |
Interest Rate Contracts | | Assets, Net Assets - | | | 1,672,285 | * | | Liabilities, Net Assets - | | | (420,102 | )* |
| | Net Unrealized Appreciation/ | | | | | | Net Unrealized Appreciation/ | | | | |
| | | (Depreciation) on Futures | | | | | | (Depreciation) on Futures | | | | |
Equity Contracts | | Assets, Net Assets - | | | 528,183 | * | | Liabilities, Net Assets - | | | (54,695 | )* |
| | Net Unrealized Appreciation/ | | | | | | Net Unrealized Appreciation/ | | | | |
| | | (Depreciation) on Futures | | | | | | (Depreciation) on Futures | | | | |
| * | Includes cumulative appreciation/depreciation of futures contracts as reported in the Schedule of Investments and within the components of Net Assets section of the Statements of Assets and Liabilities. Only the current day’s variation margin is reported within the Assets or Liabilities sections of the Statement of Assets and Liabilities. |
Shown below are the effects of derivative instruments on the Fund's Statements of Operations, summarized by primary risk exposure all of which are not accounted for as hedging instruments under ASC 815.
| | | | | | | | | | | | |
| Derivatives not accounted for as hedging instruments under ASC 815 | | Location in the Statements of Operations | |
| Notional Amount of
Futures Contracts Purchased/(Sold) ($) |
| | Realized Gain or (Loss) ($) | |
| Change in
Unrealized Appreciation/ (Depreciation) ($) |
|
| | | | |
Total Return Fund | | | | | | | | | | | | |
Equity Contracts | | Realized gain/(loss) on | | | 461,769,051/ | | | 18,643,264 | | | (2,662,543 | ) |
| | futures, Increase/(decrease) | | | (637,188,799 | ) | | | | | | |
| | in unrealized appreciation/ | | | | | | | | | | |
| | | (depreciation) on Futures | | | | | | | | | | |
Interest Rate Contracts | | Realized gain/(loss) on | | | 2,061,611,203/ | | | (7,711,870) | | | 943,579 | |
| | futures, Increase/(decrease) | | | (2,101,276,517 | ) | | | | | | |
| | in unrealized appreciation/ | | | | | | | | | | |
| | | (depreciation) on Futures | | | | | | | | | | |
The Company shares a revolving credit facility of up to $150 million with a number of its affiliates. The credit facility is with its custodian bank, State Street Bank and Trust Company (“State Street”). The revolving credit facility requires the payment of a commitment fee equal to 0.125% per annum on the daily unused portion of the credit facility, payable quarterly. The portion borne by the Funds generally is borne proportionally based upon net assets. In addition, the
Company has a $100 million uncommitted, unsecured line of credit with State Street. Generally, borrowings under the credit facilities would accrue interest at the Federal Funds Rate plus 50 basis points and would be borne by the borrowing Fund. The maximum amount allowed to be borrowed by any one Fund is the lesser of (i) 33.33% of its total assets or (ii) 20% of its net assets. The credit facilities were not utilized by the Fund during the fiscal year ended December 31, 2010.
| 6. | Compensation and Fees Paid to Affiliates |
GEAM, a registered investment adviser, was retained by the Company’s Board of Directors effective May 1, 1997 to act as investment adviser and administrator of the Fund. GEAM’s compensation for investment advisory and administrative services is paid monthly based on the average daily net assets of the Fund. GEAM’s compensation for investment advisory and administrative services is paid monthly based on average daily net assets of the Fund at an annualized rate of 0.50%.
GEAM waives a portion of the Fund’s management fee in the amount equal to the management fee earned by GEAM with respect to the Fund’s investment in the GE Funds – GE Money Market Fund.
For periods prior to May 1, 2010: Pursuant to an expense limitation agreement with the Fund, GEAM had agreed to limit the advisory and administrative fees paid by the Fund
44
| | |
| Notes to Financial Statements | | December 31, 2010 |
on an annual basis to 0.48% of the average daily net assets of the Fund. The advisory and administrative fee reduced by GEAM may however be recouped by GEAM for up to three years from the date reduced, provided that the total operating expense ratio for the Fund’s Class 1 shares, after giving effect to the recoupment, would not exceed 0.80% for the fiscal year in which the recoupment is made. This agreement was terminated on April 30, 2010.
Effective May 1, 2010: GEAM has entered into contractual arrangement with the Company to limit other expenses of each share class of the Fund (excluding applicable Investor Service Plan fee of 0.20%) at or below 0.03% on an annualized basis. Expense borne by GEAM pursuant to the expense limitation agreement may be recouped by GEAM for up to three years from the date the expense was incurred. A reimbursement payment will not be made if it would cause the Company to exceed its expense limit. Unless earlier terminated or cancelled, this agreement will continue in effect until April 30, 2011. The agreement may be terminated or amended by the mutual consent of the Company and GEAM.
Investor Service Plan — Class 1 and Class 3 Shares The Company adopted an Investor Services Plan (the “Services Plan”) on December 9, 2005 for Class 1 shares and on May 1, 2009 for Class 3 shares of the Fund. The Services Plan were not adopted pursuant to Rule 12b-1 under the 1940 Act. Each Services Plan provides that during any fiscal year, the amount of compensation paid under the Services Plan by the Total Return Fund Class 1 or Class 3 shares may not exceed the annual rate of 0.20% of the average daily net assets of the Total Return Fund attributable to each such class shares.
Distribution and Shareholder Service (12b-1) Fees The Company has adopted a Distribution and Service (12b-1) Plan (12b-1 Plan) pursuant to Rule 12b-1 under the 1940 Act with respect to each of Class 1, Class 2 and Class 3 shares of the Total Return Fund. Under the 12b-1 Plan for Class 1 shares that became effective May 1, 2009, payments made under the Class 1 Investor Service Plan are covered in the event that any portion of compensation paid pursuant to the Class 1 Investor Service Plan is determined to be an indirect use of the assets attributable to the Class 1 shares to finance distribution of such shares. Under each 12b-1 Plan for Class 2 and Class 3 shares, the Company, on behalf of the Fund, may compensate GE Investment Distributors, Inc. (GEID), the distributor of the shares of the Fund, for certain sales services provided by GEID or other
broker dealers and investor services provided by GEID or other service providers relating to the Fund’s Class 2 and Class 3 shares, including services to owners or prospective owners of variable contracts issued by insurance companies that offer Class 2 and Class 3 shares as an investment option under such variable contracts. The amount of compensation paid under each 12b-1 Plan may not exceed: 0.25% for Class 2 shares and 0.25% for Class 3 shares, of the average daily net assets of the Fund attributable to such share class. The 12b-1 Plan continues in effect from year to year for so long as such continuance is approved annually by the Board of Directors, including by those directors who are not interested persons of the Company and who have no direct or indirect financial interest in the operation of the 12b-1 Plan or in any agreement related to it. In addition, the Class 3 12b-1 Plan covers payments made under the Class 3 Investor Service Plan in the event that any portion of compensation paid pursuant to the Class 3 Investor Service Plan is determined to be an indirect use of the assets attributable to the Class 3 shares to finance distribution of such shares.
Directors’ Compensation The Fund pays no compensation to its directors who are officers or employees of GEAM or its affiliates. Directors who are not such officers or employees also serve in a similar capacity for other funds advised by GEAM. Compensation paid to unaffiliated directors are reflected on the Statement of Operations. These fees are allocated pro rata across all of the mutual fund platforms and share classes served by the directors, including the Fund, and are based upon the relative net assets of each fund within such platforms.
| 7. | Investment Transactions |
Purchases and Sales of Securities The cost of purchases and the proceeds from sales of investments, other than short-term securities and options, for the period ended December 31, 2010, were as follows:
| | |
| U.S. Government Securities |
| Purchases | | Sales |
| $2,161,483,909 | | $2,054,601,843 |
| | |
| Other Securities |
| Purchases | | Sales |
| $1,592,537,336 | | $1,339,540,717 |
45
| | |
| Notes to Financial Statements | | December 31, 2010 |
The Fund is subject to ASC 740, Income Taxes. ASC 740 provides guidance for financial accounting and reporting for the effects of income taxes that result from an entity’s activities during the year. ASC 740 also provides guidance regarding how certain tax positions should be recognized, measured, presented and disclosed in the financial statements. ASC 740 requires evaluation of tax positions
taken or expected to be taken in the course of preparing the Fund’s tax returns to determine whether the tax positions are “more likely than not” of being sustained by the applicable tax authority. There are no adjustments to the Fund’s net assets required under ASC 740. The Fund’s 2007, 2008, 2009 and 2010 fiscal years tax returns are still open to examination by the Federal and applicable state tax authorities.
At December 31, 2010, information on the tax cost of investments is as follows:
| | | | | | | | | | | | | | |
Cost for Tax Purposes | | Gross Tax Unrealized Appreciation | | Gross Tax Unrealized Depreciation | | Net Tax Appreciation/ (Depreciation) | | Net Tax Appreciation on Derivatives, Currency | | Undistributed Income | | Undistributed (Accumulated Capital Loss) | | Post October Losses |
| $2,751,464,478 | | $321,450,114 | | $(120,766,093) | | $200,684,021 | | $38,481 | | $76,485 | | $(261,349,617) | | $(84,226) |
As of December 31, 2010, the Fund has capital loss carryovers, as indicated below. Capital loss carryovers are available to offset future realized capital gains to the extent provided in the Internal Revenue Code and regulations thereunder. To the extent that these carryover losses are used to offset future capital gains, it is probable that the gains so offset will not be distributed to shareholders because they would be taxable as ordinary income.
| | |
| Amount | | Expires |
| $ 9,200,542 | | 12/31/2016 |
| 252,149,075 | | 12/31/2017 |
These amounts will be available to offset future taxable capital gains. Under the recently enacted Regulated Investment Company Modernization Act of 2010, the Fund will be permitted to carry forward capital losses incurred in taxable years beginning after December 22, 2010 for an unlimited period. However, any losses incurred during those future years will be required to be utilized prior to the losses incurred in pre-enactment tax years. As a result of this ordering rule, pre-enactment capital loss carryforwards may be more likely to expire unused. Additionally, post-enactment capital losses that are carried forward will retain their character as either short-term or long-term capital losses rather than being considered all short-term as under previous law.
During the year ended December 31, 2010, the Fund utilized $12,523,032 of prior year capital loss carryovers.
Any net capital and currency losses incurred after October 31, within the Fund’s tax year, are deemed to arise on the first day of the Fund’s next tax year if the Fund so elects to defer such losses.
The Fund elected to defer losses incurred after October 31, 2010 as follows:
| | |
| Capital | | Currency |
| $— | | $84,226 |
The tax composition of distributions paid during the year ended December 31, 2010 was as follows:
| | | | | | |
| | | Ordinary
Income | | | Long-Term
Capital
Gains |
2010 | | $ | 35,022,799 | | | $— |
2009 | | | 30,701,311 | | | — |
Distributions to Shareholders The Fund declares and pays any net realized capital gains in excess of capital loss carryforwards distributions annually. The character of income and gains to be distributed is determined in accordance with income tax regulations which may differ from generally accepted accounting principles. These differences include (but are not limited to) futures, treatment of realized and unrealized gains and losses on foreign currency transactions, paydown gains and losses on mortgage-backed securities, investments organized as partnerships for tax purposes, losses deferred due to offsetting positions, distributions from Real Estate Investment Trusts (REITs), and losses deferred due to wash sale transactions. Reclassifications due to permanent book/tax differences are made to the Fund’s capital accounts to reflect income and gains available for distribution (or available capital loss carryovers) under income tax regulations. These reclassifications have no impact on net investment income, realized gains or losses, or the net asset value of the Fund. The calculation of net investment income per share in the Financial Highlights table excludes these adjustments.
The reclassifications for the year ended December 31, 2010 were as follows:
| | | | |
Undistributed
Net Investment
Income | | Accumulated
Net Realized Gain | | Paid In Capital |
| $(853,731) | | $765,630 | | $88,101 |
46
Report of Independent Registered Public Accounting Firm
The Shareholders and Board of Directors GE Investments Funds, Inc.
We have audited the accompanying statement of assets and liabilities, including the schedule of investments, of the Total Return Fund, a series of GE Investments Funds, Inc., as of December 31, 2010, and the related statement of operations for the year then ended, statements of changes in net assets for each of the years in the two-year period then ended, and the financial highlights for each of the years in the five-year period then ended. These financial statements and financial highlights are the responsibility of the Fund’s management. Our responsibility is to express an opinion on these financial statements and financial highlights based on our audits.
We conducted our audits in accordance with the standards of the Public Company Accounting Oversight Board (United States). Those standards require that we plan and perform the audit to obtain reasonable assurance about whether the financial statements and financial highlights are free of material misstatement. An audit includes examining, on a test basis, evidence supporting the amounts and disclosures in the financial statements. Our procedures included confirmation of securities owned as of December 31, 2010 by correspondence with the custodian and brokers, or by other appropriate auditing procedures where replies from brokers were not received. An audit also includes assessing the accounting principles used and significant estimates made by management, as well as evaluating the overall financial statement presentation. We believe that our audits provide a reasonable basis for our opinion.
In our opinion, the financial statements and financial highlights referred to above present fairly, in all material respects, the financial position of the Total Return Fund as of December 31, 2010, the results of its operations, changes in its net assets and financial highlights for each of the years described above, in conformity with U.S. generally accepted accounting principles.

Boston, Massachusetts
February 25, 2011
47
| | |
| Advisory and Administrative Agreement Approvals | | (unaudited) |
The Board of Directors of the GE Investments Funds, Inc. (the “Board”), including the independent Board members, considered and all those that were present unanimously approved the continuance of the Fund’s Investment Advisory and Administration Agreement with GE Asset Management Incorporated (“GEAM”) and the Investment Sub-Advisory Agreement with the Fund’s sub-adviser, Urdang Securities Management, Inc. (“Urdang”), at meetings held on December 3 and December 10, 2010.
The Board also was not asked to consider for renewal the Investment Sub-Advisory Agreement with Palisade Capital Management, L.L.C. (“Palisade”) at this time since it was approved by the Board on June 9, 2010 (a description of this approval process is disclosed in the Fund’s semi-annual report to shareholders dated June 30, 2010) and has an initial term of two years. It is expected to be reviewed during next year’s contract renewal process.
In considering whether to approve the Fund’s investment advisory and sub-advisory agreements, the Board members considered and discussed a substantial amount of information and analysis provided, at the Board’s request, by GEAM and Urdang. The Board members also considered detailed information regarding performance and expenses of other investment companies, including those with similar investment strategies and sizes, which was prepared by independent third party provider Morningstar, Inc. (“Morningstar”). The Board members reviewed the fees charged by GEAM for other mutual funds that employ the same investment strategy as the Fund. The Board had the opportunity to ask questions and request additional information in connection with its considerations.
Before approving the Fund’s advisory and sub-advisory agreements, the Board members reviewed the information provided with management of GEAM and with independent legal counsel. The Board members also reviewed a memorandum prepared by independent legal counsel discussing the legal standards for the consideration of the proposed continuances. The independent Board members discussed the proposed continuances in detail during a private session with their independent legal counsel at which no representatives of GEAM or Urdang were present. The independent Board members and their independent legal counsel requested, and received and considered, additional information from GEAM following these sessions.
In advance of the meetings, and in response to their request, the Board members received from GEAM written
responses to their inquiries, which included substantial exhibits and other materials related to GEAM’s business and the services it provides to the Fund. Also in advance of the meetings, the Board members received from Urdang a written response to a letter of inquiry prepared by GEAM at the Board’s request, which included substantial exhibits and other materials related to the business of, and services provided by, Urdang. The Board members took into account their multi-year experience as Board members and particularly their consideration of these types of agreements in recent years. The information was presented in a manner to facilitate comparison to prior periods and to reflect certain enhancements. To focus their review, the Board members asked GEAM management and Urdang, in their oral presentations, to highlight material differences from the information presented in recent years.
During the meetings, the Board members had an opportunity to discuss this information with GEAM managers, including senior executives, representatives from the legal, compliance and finance departments, and investment personnel. The Board members also had an opportunity to hear presentations by representatives of Urdang. The Board members posed questions to these representatives and engaged in substantive discussions with them concerning each of their investment processes.
In reaching their determinations relating to continuance of the Fund’s investment advisory and sub-advisory agreements, the Board members considered all factors that they deemed relevant, including the factors discussed below. In their deliberations, the Board members did not identify any particular information that was all-important or controlling, and each Board member may have attributed different weights to the various factors. In particular, the Board members focused on the following:
The Nature, Extent And Quality Of Services Provided.
The Board members reviewed the services provided by GEAM and Urdang, taking into account their extensive past experiences with GEAM and their multi-year experience with Urdang for another fund the Board oversees. In connection with their consideration of GEAM’s services, they focused on the favorable attributes of GEAM, including (i) an investment philosophy oriented toward long-term performance; (ii) effective processes used for overseeing sub-advisers; (iii) effective processes used for providing Fund administration, including controllership and compliance functions and oversight of the performance of
48
| | |
| Advisory and Administrative Agreement Approvals | | (unaudited) |
other companies that provide services to the Fund; (iv) highly skilled professionals including analysts, research professionals, traders and portfolio managers with a depth of experience relevant to the Fund; (v) access to significant technological resources from which the Fund may benefit; and (vi) a favorable history and reputation. The Board members noted that the Fund represents only a small portion of the assets managed by GEAM, but benefits from a full array of services and resources provided by GEAM.
In connection with their consideration of the services provided by Urdang, the Board members focused on Urdang’s favorable attributes relating to its investment philosophy and discipline, experienced investment and trading personnel, systems and other resources, including research capabilities, and favorable history and reputation.
In light of the foregoing, the Board, including the independent Board members, concluded that the services provided by GEAM and Urdang continue to be satisfactory.
Investment Performance Of The Fund and the Sub-Adviser.
The Board members considered the investment performance of the Fund for various periods. The Board members reviewed detailed comparisons of the performance of the Fund with the relevant securities index and peer groupings of mutual funds prepared by Morningstar with respect to various periods. The Board members also engaged in detailed discussions with GEAM management and representatives of Urdang about each of their investment processes and performance results. These discussions focused on the Fund’s investment objective, GEAM’s asset allocation process, the number and experience of portfolio management and supporting research personnel, the investment style and approach employed, the likely market cycles for the investment style and relative underperformance in certain periods. The Board members discussed GEAM’s investment approach with respect to the Fund, and that the performance of the Fund is consistent with GEAM’s articulated long-term approach and overall investment philosophy.
The Board, including the independent Board members, concluded that the Fund’s performance was acceptable overall taking into consideration the factors discussed above.
Cost Of The Services Provided And Profits Realized From The Relationship With The Fund.
The Board members considered the fees paid to GEAM by the Fund, as well as those paid to Urdang by GEAM, and the cost of the services provided to the Fund by GEAM and Urdang . The Board members reviewed the information they had requested from GEAM and Urdang concerning their profitability. The Board members considered the profit margin information for GEAM’s investment company business as a whole, as well as GEAM’s profitability data for the Fund. The Board members reviewed GEAM’s assumptions and the methods of cost allocation used by GEAM in preparing Fund-specific profitability data. The Board members also discussed with GEAM the basis for its belief that the methods of allocation used were reasonable for each area of its business. The Board members also reviewed the assumptions and cost allocation methods used by Urdang in preparing its profitability data.
Information was presented regarding the financial condition of GEAM and Urdang for various past periods. The Board members noted and discussed the additional services provided by GEAM to the Fund compared to other investment products managed by GEAM, and noted the fact that GEAM, and not the Fund, pays the sub-advisory fees to Urdang. The Board members previously had been provided a study conducted by the Investment Company Institute that discusses and compares advisory fees and services for mutual funds and institutional separate accounts. The Board members determined that GEAM and Urdang should be entitled to earn a reasonable level of profits for the services they provide to the Fund. The Board members also recognized that GEAM had made significant investments in its business and had not fully recovered the sums invested. The Board also considered that, in the face of declining Fund assets over the course of the past year, GEAM continues to make a substantial investment in fulfilling its obligations to the Fund and supporting its Fund-related activities.
Based on their review, the Board, including the independent Board members, concluded that they were satisfied that the level of profitability achieved by GEAM and Urdang from their relationship with the Fund was not unreasonable or excessive.
49
| | |
| Advisory and Administrative Agreement Approvals | | (unaudited) |
The Extent To Which Economies Of Scale Would Be Realized As The Fund Grows And Whether Fee Levels Would Reflect Such Economies Of Scale.
Although the Board noted that the Fund experienced a significant decline in assets over the past year, the Board members considered the extent to which economies of scale would be realized as the Fund grows, and whether fee levels reflect these economies of scale for the benefit of Fund investors.
The Board members considered the substantial infrastructure investments that GEAM has made with respect to its operations and its commitment to continue investing resources to enhance services to Fund shareholders. The Board members recognized the benefits to the Fund of GEAM’s past investment in its operations through the expenditure of sums to support its substantial infrastructure, and that, with respect to all GEAM managed mutual funds, GEAM has not yet fully recouped that investment. The Board members also recognized the benefits to the Fund of being able to leverage a favorable cost structure achieved with respect to the Fund’s other operating expenses as a result of GEAM’s large overall base of assets under management and its vendor management practices.
Comparison Of Services To Be Rendered And Fees To Be Paid.
The Board members discussed the services provided to the Fund by GEAM and Urdang, and the fees charged for those services. The Board members reviewed information
concerning the fee and expense ratios for the Fund, and comparative information with respect to peer groupings of mutual funds prepared by Morningstar. They discussed that the Fund’s figures were within the applicable peer group ranges. The Board members also reviewed comparative fee information with respect to any comparable mutual fund or other client accounts managed by Urdang. The Board, including the independent Board members, concluded that, based on this information, the advisory and sub-advisory fees were reasonable in relation to the services provided to the Fund.
Fall-Out Benefits.
The Board members considered other actual and potential financial benefits that GEAM and Urdang may derive from their respective relationships with the Fund, including, to the extent applicable, soft dollar commission benefits generated through Fund portfolio transactions. The Board members noted, however, that the Fund benefits from the vast array of resources available through GEAM, and that the Fund represents only a small portion of the assets managed by GEAM.
Conclusion.
No single factor was determinative to the Board’s decision. Based on their discussion and such other matters as were deemed relevant, the Board, including the independent Board members, concluded that renewal of the advisory and sub-advisory agreements were in the best interests of the Fund and its shareholders.
50
| | |
| Additional Information | | (unaudited) |
Information about Directors and Executive Officers:
The business and affairs of the Company are managed under the direction of the Company’s Board of Directors. Information pertaining to the Directors and officers of the Company is set forth below.
Interested Directors and Executive Officers
Michael J. Cosgrove
Address c/o GEAM 3001 Summer St. Stamford, CT 06905
Age 61
Position(s) Held with Fund Chairman of the Board and President
Term of Office and Length of Time Served Until successor is elected and qualified – 14 years
Principal Occupation(s) During Past 5 years President and Chief Executive Officer – Mutual Funds and Intermediary Business since March 2007; Executive Vice President of GEAM from February 1997 to March 2007; Director of GEAM since 1988; Vice President, GE Capital Corporation, an indirect wholly-owned subsidiary of GE, since December 1999; Executive Vice President – Sales and Marketing of GEAM, a wholly-owned subsidiary of GE that is registered as an investment adviser under the Investment Advisers Act of 1940, as amended, from March 1993 to March 2007.
Number of Portfolios in Fund Complex Overseen by Director 49
Other Directorships Held by Director Chairman of the Board and President of GE Funds from 1993 to February 2011, and GE Institutional Funds since its inception; Trustee of General Electric Savings & Security Trust, General Electric S&S Income Fund, General Electric S&S Program Mutual Fund (“GE Savings & Security Funds”), Elfun Funds, General Electric Insurance Plan Trust, General Relief Loan Fund, and General Electric Pension Trust since 1988; Trustee of Fordham University since 2002; Trustee of GE Volunteers since 1993; Director, GE Asset Management (Ireland) since February 1999; Director, GE Asset Management Funds Plc., GE Asset Canada Company, and GE Asset Management Limited since 1998.
Matthew J. Simpson
Address c/o GEAM 3001 Summer St. Stamford, CT 06905
Age 49
Position(s) Held with Fund Director and Executive Vice President
Term of Office and Length of Time Served Until successor is elected and qualified – 3 years
Principal Occupation(s) During Past 5 years Executive Vice President, General Counsel and Secretary of GEAM since July 2007; Senior Vice President and General Counsel – Marketing and Client Services (formerly Asset Management Services), at GEAM and Senior Vice President and General Counsel of GEAMS from February 1997 to June 2007; Vice President and Associate General Counsel of GEAM from October 1992 to February 1997; Vice President of GE Funds, GE Institutional Funds and GE LifeStyle Funds from September 2003 to June 2007; Secretary of GE Funds and GE Institutional Funds from 1997 to June 2007; Vice President of Elfun Funds and GE Savings & Security Funds from October 2003 to June 2007; Assistant Secretary of Elfun Funds and GE Savings & Security Funds from 1998 to June 2007.
Number of Portfolios in Fund Complex Overseen by Director 49
Other Directorships Held by Director Trustee of GE Institutional Funds, Elfun Funds and GE Savings & Security Funds since July 2007. Trustee of GE Funds from July 2007 to February 2011.
51
| | |
| Additional Information | | (unaudited) |
Joon Won Choe
Address c/o GEAM 3001 Summer St. Stamford, CT 06905
Age 41
Position(s) Held with Fund Vice President & Secretary
Term of Office and Length of Time Served Until successor is elected and qualified – Vice President and Secretary – less than 1 year
Principal Occupation(s) During Past 5 years Senior Vice President and Associate General Counsel at GEAM since June 2010; Vice President and Associate General Counsel at GEAM from November 2005 to June 2010; Vice President and Secretary of GE Funds from September 2010 to February 2011; Vice President and Secretary of GE Institutional Funds and GE Investments Funds, Inc. since September 2010; Vice President and Assistant Secretary of Elfun Funds and GE Savings & Security Funds since September 2010.
Number of Portfolios in Fund Complex Overseen by Officer N/A
Other Directorships Held by Officer N/A
Robert Herlihy
Address c/o GEAM 3001 Summer St. Stamford, CT 06905
Age 43
Position(s) Held with Fund Senior Vice President and Chief Compliance Officer
Term of Office and Length of Time Served Until successor is elected and qualified – 5 years
Principal Occupation(s) During Past 5 years Chief Compliance Officer of GEAM, GE Institutional Funds, Elfun Funds, and GE Savings and Security Funds since July 2005; Chief Compliance Officer of GE Funds from July 2005 to February 2011; Manager of Fund Administration at GEAM from 2002 – 2005.
Number of Portfolios in Fund Complex Overseen by Officer N/A
Other Directorships Held by Officer N/A
Eunice Tsang
Address c/o GEAM 3001 Summer St. Stamford, CT 06905
Age 51
Position(s) Held with Fund Treasurer
Term of Office and Length of Time Served Until successor is elected and qualified – less than one year
Principal Occupations(s) During Past 5 years Treasurer of GE Institutional Funds, Elfun Funds and GE Savings and Security Funds since January 2010; Treasurer of GE Funds from January 2010 to February 2011; GEAM Operational Controllership and Technical Accounting Manager since December 2007; Financial Planning & Analysis Manager – Performance Leader from June 2005 to December 2007; GEAM Quality Black Belt from 2001 to June 2005; Financial Planning & Analysis Manager from 2000 to 2001; and Mutual Fund Assistant Controller from October 1997 to 2000.
Number of Portfolios in Fund Complex Overseen by Officer N/A
Other Directorships Held by Officer N/A
52
| | |
| Additional Information | | (unaudited) |
Non-Interested Directors
John R. Costantino
Address c/o GEAM 3001 Summer St. Stamford, CT 06905
Age 64
Position(s) Held with Fund Director
Term of Office and Length of Time Served Until successor is elected and qualified – 14 years
Principal Occupation(s) During Past 5 years General Partner, NGN Capital LLC since 2006; Managing Director, Vice President of Walden Capital Management since 1996.
Number of Portfolios in Fund Complex Overseen by Director 41
Other Directorships Held by Director Trustee of GE Funds since 1993, GE Institutional Funds since its inception; Trustee of Fordham University from 1989 to 1995 and 2001 to 2007 and Trustee Emeritus since 2007; Trustee of Neuro Science Research Institute since 1986; Trustee of Gregorian University Foundation from 1992 to 2007; Director of Artes Medical from 2006 to 2008.
William J. Lucas
Address c/o GEAM 3001 Summer St. Stamford, CT 06905
Age 61
Position(s) Held with Fund Director
Term of Office and Length of Time Served Until successor is elected and qualified – 13 years (No longer serves as Trustee effective November 4, 2010)
Principal Occupation(s) During Past 5 years Retired since 2010, previously Vice President and Treasurer of Fairfield University since 1983.
Number of Portfolios in Fund Complex Overseen by Director 41
Other Directorships Held by Director Trustee of GE Funds since 1993, and GE Institutional Funds since its inception.
Robert P. Quinn
Address c/o GEAM 3001 Summer St. Stamford, CT 06905
Age 74
Position(s) Held with Fund Director
Term of Office and Length of Time Served Until successor is elected and qualified – 14 years
Principal Occupation(s) During Past 5 years Retired since 1983 from Salomon Brothers Inc.
Number of Portfolios in Fund Complex Overseen by Director 41
Other Directorships Held by Director Trustee of GE Funds since 1993, and GE Institutional Funds since its inception; Trustee, St. Francis Hospital Corp. since 1980.
The Statement of Additional Information for the Fund includes additional information about the Directors and Officers and is available, without charge, upon request by calling 1-800-493-3042.
53
Investment Adviser and Administrator
GE Asset Management Incorporated
Board of Directors
Michael J. Cosgrove, Chairman
John R. Costantino
William J. Lucas*
Robert P. Quinn
Matthew J. Simpson
Secretary
Joon Won Choe
Assistant Secretary
Michelle Matzelle
Treasurer
Eunice Tsang
Assistant Treasurers
Tatyana Begun**
Casey Yantosca
Distributor
GE Investment Distributors, Inc.
Member FINRA and SIPC
Counsel
Sutherland, Asbill & Brennan, LLP
Custodian
State Street Bank & Trust Company
Independent Registered Public Accounting Firm
KPMG LLP
Officers of the Investment Adviser
James W. Ireland, President and Chief Executive Officer
Cheryl H. Beacock, Senior Vice President, Human Resources
Paul M. Colonna, President and Chief Investment Officer – Fixed Income Investments
Michael J. Cosgrove, President and Chief Executive
Officer – Mutual Funds & Intermediary Business
Ralph R. Layman, President and Chief Investment Officer – Public Equity Investments
Maureen B. Mitchell, President – Institutional Sales and Marketing
Steve Rullo, Chief Information Officer (since February 2011)
Matthew J. Simpson, Executive Vice President, General Counsel and Secretary
Don W. Torey, President – Alternative Investments
John J. Walker, Executive Vice President, Chief Operating Officer
David Wiederecht, President and Chief Investment Officer – Investment Strategies
Tracie Winbigler, Executive Vice President, Chief Financial Officer***
| * | As of November 4, 2010, Mr. Lucas no longer served as a director of the Company. |
| ** | As of February 18, 2011, Ms. Begun no longer served as an officer of the Company. |
| *** | Effective January, 2011. |
54
Investment Adviser
GE Asset Management Incorporated
3001 Summer Street
PO Box 7900
Stamford, CT 06904-7900
Distributor
GE Investment Distributors, Inc.
member FINRA and SIPC
3001 Summer Street
PO Box 7900
Stamford, CT 06904-7900
The Fund files its complete schedule of portfolio holdings with the Securities and Exchange Commission for the first and third quarters of each fiscal year on Form N-Q. The Fund’s Forms N-Q, as well as a description of the policies and procedures that the Fund uses to determine how to vote proxies (if any) relating to portfolio securities is available without charge (i) upon request, by calling 1-800-493-3042; (ii) on the Fund’s website at http://www.geam.com; and (iii) on the Commission’s website at http://www.sec.gov. The Fund’s Forms N-Q may be reviewed and copied at the Commission’s Public Reference Room in Washington, DC—information on the operation of the Public Reference Room may be obtained by calling 1-800-SEC-0330.
Information (if any) regarding how the Fund voted proxies relating to portfolio securities during the most recently disclosed 12-month period ended June 30 is available without charge (i) through the Fund’s website at http://www.geam.com; and (ii) on the Commission’s website at http://www.sec.gov.

GE Investments Funds, Inc.
Money Market Fund
Annual Report
December 31, 2010

GE Investments Funds, Inc.
| | |
| |
| Money Market Fund | | Contents |
This report is prepared for Policyholders of certain variable contracts and may be distributed to others only if preceded or accompanied by the variable contract’s current prospectus and the current prospectus of the Fund available for investments thereunder.
| | |
| Notes to Performance | | December 31, 2010 (unaudited) |
The information on the following performance pages relates to the GE Investments Money Market Fund (the “Fund”).
Total returns take into account changes in share price and assume reinvestment of dividends and capital gains distributions, if any. Total returns shown are net of Fund fees and expenses but do not reflect fees and charges associated with the variable contracts such as administrative fees, account charges and surrender charges, which, if reflected, would reduce the Fund’s total returns for all periods shown.
The performance data quoted represent past performance; past performance does not guarantee future results. Investment return and principal value will fluctuate so your shares, when redeemed, may be worth more or less than their original cost. Current performance may be higher or lower than the performance data quoted. Periods less than one year are not annualized. Please call 800-493-3042 or visit the Fund’s website at http://www.geam.com for the most recent month-end performance data.
An investment in the Fund is not a deposit of any bank and is not insured or guaranteed by the Federal Deposit Insurance Corporation (FDIC) or any other government agency. An investment in the Fund is subject to risk, including possible loss of principal invested.
The 90 Day T-Bill is an unmanaged measure/index of the performance of U.S. Treasury bills currently available in the marketplace having a remaining maturity of 90 days.
The peer universe of the underlying annuity funds used for the peer group average annual total return calculation is based on the blend of Morningstar peer categories, as shown. Morningstar is an independent mutual fund rating service. A Fund’s performance may be compared to or ranked within a universe of mutual funds with investment objectives and policies similar but not necessarily identical to that of the Fund.
©2010 Morningstar, Inc. All Rights Reserved. The Morningstar information contained herein: (1) is proprietary to Morningstar and/or its content providers; (2) may not be copied or distributed; and (3) is no warranted to be accurate, complete or timely. Neither Morningstar nor its content providers are responsible for any damage or losses relating from any use of this information. Past performance is no guarantee or future results.
GE Investment Distributors, Inc., Member of FINRA & SIPC, is the principal underwriter and distributor of the GE Investments Funds, Inc. and a wholly owned subsidiary of GE Asset Management Incorporated, the investment adviser of the Fund.
1
| | |
| Money Market Fund | | (unaudited) |

Michael E. Martini
The Money Market Fund is managed by a team of portfolio managers that includes Adam W. Ackermann, James C. Gannon and Michael E. Martini. As lead portfolio manager for the Money Market Fund, Mr. Martini has oversight responsibilities over the Fund.
Michael E. Martini is a Vice President and a Portfolio Manager at GE Asset Management. He has served on the portfolio management team for the Money Market Fund since joining GE Asset Management in March of 2008. Prior to joining GE Asset Management, Mr. Martini was a Vice President at Ceres Capital Partners LLC, where he worked at the firm’s treasury desk from March 2006 to January 2008, and a Senior Vice President at Pacific Investment Management Company (PIMCO) from 1996 to 2004, where he was a portfolio manager at the firm’s money market/short-term desk.
Adam W. Ackermann is an Assistant Portfolio Manager at GE Asset Management. He has served on the portfolio management team for the Money Market Fund since June 2009. His responsibilities include cash management, including daily money market trade execution, and technical projects. Mr. Ackermann joined GE Asset Management in 2005 through the summer internship program working with the U.S. equity mid-cap portfolio management team. Adam then joined the fixed income team as an analyst, and in 2007 became manager of the global fixed income trading operations until June 2009.
James C. Gannon is an Assistant Portfolio Manager of GE Asset Management. He has served on the portfolio management team for the Money Market Fund since December 2000. Since joining GE Asset Management in 1995, Mr. Gannon served in various positions at GE Asset Management including Trade Operations Specialist in fixed income, and became an Assistant Portfolio Manager in February 2003.
| Q. | How did the GE Investments Money Market Fund perform compared to its benchmark for the twelve-month period ended December 31, 2010? |
| A. | For the twelve-month period ended December 31, 2010, Class 1 shares of the Money Market Fund returned 0.00%. The 90-day Treasury Bill, the Fund’s benchmark, returned 0.14% and the Fund’s Morningstar peer group of 104 US Insurance Money Market Taxable funds returned on average of -0.01% for the same period. |
| Q. | Discuss the factors that materially affected the Fund’s performance during the fiscal period. |
| A. | 2010 was a challenging year for money market funds to provide attractive yields/returns. The Federal Reserve kept its fed funds target at 0-0.25% throughout the entire year. The level and movement of LIBOR rates had a large affect on other short term investment yields (i.e., commercial paper, certificates of deposit and floating rate notes). 3-month LIBOR began to rise in the first quarter after the Treasury announced plans to restart the Supplementary Financing Program effectively removing $200 billion of excess reserves and money market funds lost $300 billion in assets. A confluence of factors pressured LIBOR rates higher in the second quarter including 1) Europe’s banking and sovereign debt crisis, 2) $170 billion decline in money market fund assets and 3) new SEC rules addressing very short-term liquidity requirements becoming effective. By the end of June, 3-month LIBOR had risen to 53 basis points from 25 bps at the beginning of the year and the 3-month LIBOR-OIS spread had widened from 12 to 33 basis points. |
2
LIBOR rates dropped and the LIBOR-OIS spread narrowed back to roughly end of March levels in the third quarter as the drain on money market fund assets subsided. The Fed announced a second round of quantitative easing (QE 2) in November that although directly impacted longer treasury yields, did have residual effects on money market rates, including repo. Although the European sovereign/banking crisis continued unresolved by yearend 2010, LIBOR rates remained unchanged in the fourth quarter. While improving U.S. economic fundamentals caused a repricing in the forward Fed Funds market, money market yields remained depressed at yearend.
| Q. | Were there any significant changes to the Fund during the period? |
| A. | The most significant change to the Fund during 2010 resulted from the new SEC amendments to Rule 2a-7 governing money market mutual funds. Among the amendments were guidelines addressing liquidity, something not done before. These included minimum levels of securities/cash maturing in both 1-day and 7-days. Since the SEC deemed all US Treasury securities to be liquid and hence satisfy the 2 new liquidity requirements, about 10% of the Fund’s assets were allocated to US Treasuries. The US Government/Agency allocation remained at about 25%, so the Fund’s overall “Government” allocation grew to 35%. |
From the credit perspective, purchases of Irish banks (guaranteed by the Republic of Ireland) were curtailed. This was in response to the fallout of the European banking and sovereign debt crisis, and Ireland’s forced bailout.
3
| | |
| Money Market Fund | | (unaudited) |
Understanding Your Fund’s Expenses
As a shareholder of the Fund you incur transaction and ongoing expenses. Transaction expenses including sales charges on purchases payments, reinvested dividends (or other distributions), and redemption fees directly reduce the investment return of the Fund. Ongoing costs include portfolio management fees, distribution and services fees, professional fees, administrative fees and other Fund expenses. The following example is intended to help you understand your ongoing costs (in dollars) of investing in the Fund and to compare these costs with the ongoing costs of investing in other mutual funds.
To illustrate these ongoing costs, we have provided an example and calculated the expenses paid by investors during the period. The information in the following table is based on an investment of $1,000, which is invested at the beginning of the period and held for the entire six-month period ended December 31, 2010.
Actual Expenses
The first section of the table provides information about actual account values and actual expenses. You may use the information in this section, together with the amount you invested, to estimate the expenses that you paid
over the period. To do so, simply divide your account value by $1,000 (for example, an $8,600 account value divided by $1,000 = 8.6), then multiply the result by the number given for your class under the heading “Expenses Paid During Period.”
Hypothetical Example for Comparison Purposes
The second section of the table provides information about hypothetical account values and hypothetical expenses based on the Fund’s actual expense ratio and an assumed rate of return of 5% per year before expenses, which is not the Fund’s actual return. You may use this information to compare the ongoing costs of investing in the Fund and other funds. To do so, compare this 5% hypothetical example with the 5% hypothetical examples that appear in the shareholders reports of other funds.
Please note that the expenses shown in the table for both “Actual” and “Hypothetical” do not reflect any transaction costs, such as sales charges or redemption fees. Additionally, the expenses shown do not reflect the fees or charges associated with variable contracts through which shares of the Fund are offered.
July 1, 2010 - December 31, 2010
| | | | | | | | | | | | |
| | | Account value at the
beginning of the period ($) | | | Account value at the
end of the period ($) | | | Expenses paid
during the period ($)* | |
Actual Fund Return** | | | 1,000.00 | | | | 1,000.00 | | | | 1.41 | |
Hypothetical 5% Return (2.5% for the period) | | | 1,000.00 | | | | 1,023.52 | | | | 1.43 | |
| * | | Expenses are equal to the Fund’s annualized expense ratio of 0.28% (for the period July 1, 2010—December 31, 2010), multiplied by the average account value over the period, multiplied by 184/365 (to reflect the six month period). |
| ** | | Actual Fund Return for the six-month period ended December 31, 2010 was: 0.00%. Past performance does not guarantee future results. |
4
| | |
| Money Market Fund | | (unaudited) |
Investment Profile
A mutual fund designed for investors who seek a high level of current income consistent with the preservation of capital and maintenance of liquidity by investing primarily in short-terms U.S. dollar-denominated money market instruments.
Morningstar Performance Comparison
Based on average annual returns for periods ended 12/31/10
| | | | | | | | | | | | | | | | |
| | | | | | One
Year | | | Five
Year | | | Ten
Year | |
Number of Funds in peer group: | | | | | | | 104 | | | | 103 | | | | 99 | |
Peer group average annual total return: | | | | | | | -0.01 | % | | | 2.26 | % | | | 2.04 | % |
Morningstar category in peer group: U.S. Insurance Money Market Taxable | |
Sector Allocation
as a % of Fair Value of $268,486 (in thousands) on December 31, 2010 (b) (c)
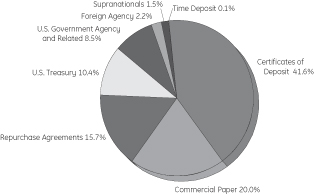
Change in Value of a $10,000 Investment
Class 1 Shares
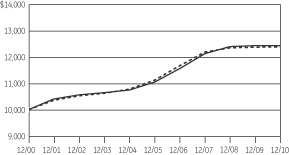
Average Annual Total Returns
for the Periods Ended December 31, 2010
Class 1 Shares (Inception date: 7/1/85)
| | | | | | | | | | | | | | | | |
| | | One
Year | | | Five
Year | | | Ten
Year | | | Ending
value of a
$10,000
investment (a) | |
Money Market Fund | | | 0.00% | | | | 2.40% | | | | 2.19% | | | | 12,423 | |
90 Day T-Bill | | | 0.14% | | | | 2.17% | | | | 2.16% | | | | 12,380 | |

Fund Yield
for the Periods Ended December 31, 2010
| | | | | | | | |
| | | Fund | | | Money Fund Report | |
7-day current | | | 0.00% | | | | 0.07% | |
7-day effective | | | 0.00% | | | | 0.07% | |
Current yield represents income earned on an investment in the Money Market Fund for a seven day period and then annualized.
Effective yield is calculated similarly but could be slightly higher because it reflects the compounding effect of earnings on reinvested dividends.
| † | The seven day current yield, rather than the total return, more closely reflects the current earnings of the Money Market Fund at December 31, 2010. |
| ** | IBC’s Money Fund report provides average yield for all major money market funds. |
| (a) | Ending value of a $10,000 investment for the ten-year period or since inception, whichever is less. |
| (b) | The securities information regarding holdings, allocations and other characteristics is presented to illustrate examples of securities that the Fund has bought and the diversity of areas in which the Fund may invest as of a particular date. It may not be representative of the Fund’s current or future investments and should not be construed as a recommendation to purchase or sell a particular security. |
See Notes to Performance on page 1 for further information, including an explanation of Morningstar peer categories.
Past performance does not predict future performance and the graph and table do not reflect the deduction of taxes that a shareholder would pay on Fund distributions or the redemption of Fund shares and do not reflect the fees or charges that would be associated with variable contracts through which shares of the Fund are offered.
An investment in the Money Market Fund is not insured or guaranteed by the Federal Deposit Insurance Corporation or any other Government agency. Although the Fund seeks to preserve the value of your investment at $1.00 per share, it is possible to lose money by investing in the Fund.
5
Money Market Fund
| | |
| Schedule of Investments | | December 31, 2010 |
Money Market Fund
| | | | | | | | | | | | |
| | | | |
| | | | | Principal
Amount | | | Amortized
Cost | | | |
Short-Term Investments — 100.8% † | | | |
| | | |
U.S. Treasury — 10.5% | | | | | | | | | | |
| | | |
U.S. Treasury Bills | | | | | | | | | | |
0.13% | | 02/17/11 | | $ | 8,250,000 | | | $ | 8,248,600 | | | (a) |
| | | |
U.S. Treasury Notes | | | | | | | | | | |
0.88% | | 02/28/11 -
04/30/11 | | | 13,900,000 | | | | 13,920,365 | | | |
1.00% | | 07/31/11 | | | 5,800,000 | | | | 5,826,381 | | | |
| | | | | | | | | 27,995,346 | | | |
| |
U.S. Government Agency and
Related — 8.6% | | | |
| | | |
FHLB Disc Corp | | | | | | | | | | |
0.17% | | 02/02/11 -
02/16/11 | | | 13,700,000 | | | | 13,697,688 | | | (a) |
| | | |
FNMA Discount Note | | | | | | | | | | |
0.27% | | 01/05/11 | | | 5,150,000 | | | | 5,149,846 | | | (a) |
| | | |
Freddie Mac | | | | | | | | | | |
0.35% | | 04/01/11 | | | 4,050,000 | | | | 4,052,588 | | | (a,c) |
| | | | | | | | | 22,900,122 | | | |
| |
Foreign Agency — 2.3% | | | |
| | | | |
KFW | | | | | | | | | | | | |
3.25% | | 02/15/11 | | | 5,990,000 | | | | 6,011,207 | | | |
| |
Commercial Paper — 20.1% | | | |
| | | |
Banco Bilbao Viz London | | | | | | | | | | |
0.50% | | 02/25/11 | | | 4,250,000 | | | | 4,246,753 | | | (a) |
| | | |
Commonwealth Bank Australia | | | | | | | | | | |
0.27% | | 02/25/11 | | | 8,600,000 | | | | 8,596,453 | | | (a) |
| | | |
Credit Suisse NY | | | | | | | | | | |
0.25% | | 01/19/11 | | | 5,300,000 | | | | 5,299,338 | | | (a) |
| | | |
European Investment Bank | | | | | | | | | | |
0.26% | | 01/05/11 | | | 8,400,000 | | | | 8,399,757 | | | (a) |
| | | |
Nordea North America Inc | | | | | | | | | | |
0.33% | | 01/06/11 | | | 7,600,000 | | | | 7,599,652 | | | (a) |
| | | |
Societe Generale N Amer | | | | | | | | | | |
0.33% | | 02/07/11 | | | 3,200,000 | | | | 3,198,931 | | | (a) |
0.50% | | 02/01/11 | | | 7,200,000 | | | | 7,196,900 | | | (a) |
| | | |
UBS Finance Delaware LLC | | | | | | | | | | |
0.28% | | 02/14/11 | | | 2,850,000 | | | | 2,849,025 | | | (a) |
| | | |
Westpac Banking Corp | | | | | | | | | | |
0.31% | | 04/08/11 | | | 6,300,000 | | | | 6,294,738 | | | (a) |
| | | | | | | | | 53,681,547 | | | |
| | | | | | | | | | | | |
| | | | |
| | | | | Principal
Amount | | | Amortized
Cost | | | |
| |
Repurchase Agreements — 15.8% | | | |
| | | |
Deutsche Bank Secuities, Inc. Gov Agcy Repo
0.22% dated 12/31/10, to be repurchased at $4,600,084 on 01/01/11 collateralized by $4,692,268 U.S. Government Agency Bonds, 0.00% maturing 08/18/11
01/03/11 | | $ | 4,600,000 | | | $ | 4,600,000 | | | (a) |
| | | |
Goldman Sachs & Co. Gov Agcy Repo
0.14% dated 12/31/10, to be repurchased at $14,600,173 on 01/01/11 collateralized by $14,895,257 U.S. Government Agency Bonds, 4.75% , 4.50%, 4.00% maturing on 12/16/16, 09/16/13, 09/06/13, respectively.
01/03/11 | | | 14,600,000 | | | | 14,600,000 | | | (a) |
| | | |
HSBC Securities (USA) Inc. Gov Agcy Repo
0.21% dated 12/31/10, to be repurchased at $12,100,000 on 01/01/11 collateralized by $12,284,546 U.S. Government Agency Bonds, 0.00% maturing 09/30/17
01/03/11 | | | 12,100,000 | | | | 12,100,000 | | | (a) |
| | | |
J.P. Morgan Securities LLC Gov Agcy Repo
0.18% dated 12/31/10, to be repurchased at $10,790,000 on 01/01/11 collateralized by $11,010,044 U.S. Government Agency Bonds, 0.00% maturing 05/04/11
01/03/11 | | | 10,790,000 | | | | 10,790,000 | | | (a) |
| | | | | | | | | 42,090,000 | | | |
| |
Certificates of Deposit — 41.9% | | | |
| | | |
Abbey National Treasury Services | | | | | | | | | | |
0.34% | | 02/25/11 | | | 10,500,000 | | | | 10,500,000 | | | (a,c) |
| | | |
Banco Bilbao Viz Arg NY | | | | | | | | | | |
0.56% | | 03/07/11 | | | 4,500,000 | | | | 4,500,041 | | | (a) |
| | | |
Bank of Montreal | | | | | | | | | | |
0.24% | | 01/20/11 | | | 4,300,000 | | | | 4,300,000 | | | (a) |
| | | |
Bank of Nova Scotia Houston | | | | | | | | | | |
0.30% | | 04/04/11 | | | 5,300,000 | | | | 5,300,000 | | | (a) |
| | | |
Barclays Bank PLC NY | | | | | | | | | | |
0.36% | | 05/03/11 | | | 3,850,000 | | | | 3,850,000 | | | (a,c) |
0.41% | | 06/20/11 | | | 5,850,000 | | | | 5,850,000 | | | (a,c) |
See Notes to Schedule of Investments and Notes to Financial Statements.
6
Money Market Fund
| | |
| Schedule of Investments | | December 31, 2010 |
| | | | | | | | | | | | |
| | | | |
| | | | | Principal
Amount | | | Amortized
Cost | | | |
| | | |
BNP Paribas NY | | | | | | | | | | |
0.33% | | 02/18/11 | | $ | 6,000,000 | | | $ | 6,000,000 | | | (a) |
| | | |
Credit Agricole CIB NY | | | | | | | | | | |
0.29% | | 02/03/11 | | | 8,700,000 | | | | 8,700,000 | | | (a) |
| | | |
Deutsche Bank Ag NY | | | | | | | | | | |
0.47% | | 01/10/11 | | | 9,700,000 | | | | 9,700,000 | | | (a,c) |
| | | |
National Australia BK NY | | | | | | | | | | |
0.32% | | 06/10/11 | | | 5,000,000 | | | | 5,000,000 | | | (a,c) |
| | | |
Nordea Bank Finland NY | | | | | | | | | | |
0.28% | | 03/17/11 | | | 1,400,000 | | | | 1,400,000 | | | (a) |
| | | |
Rabobank Nederland NV NY | | | | | | | | | | |
0.29% | | 01/13/11 | | | 5,550,000 | | | | 5,550,000 | | | (a) |
0.55% | | 02/01/11 | | | 6,800,000 | | | | 6,800,350 | | | (a) |
| | | |
Royal Bank of Canada NY | | | | | | | | | | |
0.26% | | 02/24/11 | | | 3,500,000 | | | | 3,500,000 | | | (a,c) |
0.28% | | 08/26/11 | | | 6,550,000 | | | | 6,550,000 | | | (a,c) |
| | | |
Royal Bk of Scotland CT | | | | | | | | | | |
0.29% | | 01/20/11 | | | 7,300,000 | | | | 7,300,000 | | | (a) |
| | | |
Svenska Handelsbanken NY | | | | | | | | | | |
0.27% | | 02/17/11 | | | 4,200,000 | | | | 4,199,945 | | | (a) |
0.30% | | 02/28/11 | | | 3,300,000 | | | | 3,300,052 | | | (a) |
| | | |
Toronto-Dominion Bank NY | | | | | | | | | | |
0.25% | | 03/03/11 | | | 5,350,000 | | | | 5,350,000 | | | (a) |
| | | |
Westpac Banking Corp NY | | | | | | | | | | |
0.29% | | 05/13/11 | | | 4,050,000 | | | | 4,050,000 | | | (a,c) |
| | | | | | | | | 111,700,388 | | | |
| | | |
Supranationals — 1.5% | | | | | | | | | | |
| | | |
Intl Bk Recon & Develop | | | | | | | | | | |
0.31% | | 07/13/11 | | | 3,950,000 | | | | 3,950,000 | | | (a,c) |
| | | |
Time Deposit — 0.1% | | | | | | | | | | |
| | | |
State Street Corp. | | | | | | | | | | |
0.01% | | 01/03/11 | | | 156,976 | | | | 156,976 | | | (b) |
| | | |
Total Short-Term Investments
(Cost $268,485,586) | | | | | | | 268,485,586 | | | |
| | | |
Liabilities in Excess of Other Assets, net — (0.8)% | | | | | | | (2,043,787 | ) | | |
| | | | | | | | | | | | |
| | | |
NET ASSETS — 100.0% | | | | | | $ | 266,441,799 | | | |
| | | | | | | | | | | | |
See Notes to Schedule of Investments and Notes to Financial Statements.
7
| | |
| Notes to Schedule of Investments | | December 31, 2010 |
The views expressed in this document reflect our judgment as of the publication date and are subject to change at any time without notice. The securities information regarding holdings, allocations and other characteristics are presented as of a particular date to illustrate examples of securities that the Fund has bought and the diversity of areas in which the Fund may invest as of a particular date. It may not be representative of the Fund’s current or future investments and should not be construed as a recommendation to purchase or sell a particular security. See the prospectus for complete descriptions of investment objectives, policies, risks and permissible investments.
| (a) | Coupon amount represents effective yield. |
| (b) | State Street Corp. is the parent company of State Street Bank & Trust Co., the Fund’s custodian and accounting agent. |
| (c) | Variable or floating rate security. The stated rate represents the rate at December 31, 2010. |
| † | Percentages are based on net assets as of December 31, 2010. |
8
Financial Highlights
Selected data based on a share outstanding throughout the fiscal years indicated
| | | | | | | | | | | | | | | | | | | | |
| | | 12/31/10 | | | 12/31/09 | | | 12/31/08 | | | 12/31/07 | | | 12/31/06 | |
| Inception date | | | — | | | | — | | | | — | | | | — | | | | 7/1/85 | |
Net asset value, beginning of period | | $ | 1.00 | | | $ | 1.00 | | | $ | 1.00 | | | $ | 1.00 | | | $ | 1.00 | |
Income (Loss) from investment operations: | | | | | | | | | | | | | | | | | | | | |
Net investment income | | | — | | | | — | | | | 0.02 | | | | 0.05 | | | | 0.05 | |
Net realized and unrealized
gains (losses) on investments | | | 0.00 | † | | | — | | | | — | | | | — | | | | — | |
Total income (loss) from
investment operations | | | 0.00 | † | | | — | | | | 0.02 | | | | 0.05 | | | | 0.05 | |
Less distributions from: | | | | | | | | | | | | | | | | | | | | |
Net investment income | | | — | | | | — | | | | 0.02 | | | | 0.05 | | | | 0.05 | |
Net realized gains | | | — | | | | — | | | | — | | | | — | | | | — | |
Total distributions | | | — | | | | — | | | | 0.02 | | | | 0.05 | | | | 0.05 | |
Net asset value, end of period | | $ | 1.00 | | | $ | 1.00 | | | $ | 1.00 | | | $ | 1.00 | | | $ | 1.00 | |
TOTAL RETURN (a) | | | 0.00% | | | | 0.27% | | | | 2.24% | | | | 4.92% | | | | 4.65% | |
| | | | | |
RATIOS/SUPPLEMENTAL DATA: | | | | | | | | | | | | | | | | | | | | |
Net assets, end of period (in thousands) | | $ | 266,442 | | | $ | 326,072 | | | $ | 547,554 | | | $ | 340,690 | | | $ | 279,622 | |
Ratios to average net assets: | | | | | | | | | | | | | | | | | | | | |
Net investment income (loss) | | | 0.00% | | | | 0.32% | | | | 2.15% | | | | 4.81% | | | | 4.58% | |
Net expenses | | | 0.28% | * | | | 0.43% | | | | 0.45% | | | | 0.48% | | | | 0.49% | |
Gross expenses | | | 0.53% | | | | 0.47% | | | | 0.45% | | | | 0.48% | | | | 0.49% | |
Notes to Financial Highlights
| (a) | Total returns are historical and assume changes in share price, reinvestment of dividends and capital gains distributions and do not include the effect of insurance contract charges. Past performance does not guarantee future results. |
| * | GE Asset Management has voluntarily undertaken to reduce its management fee and/or subsidize certain expenses of the Fund to the extent necessary to maintain a minimum annualized yield of 0.00%. |
The accompanying Notes are an integral part of these financial statements.
9
| | | | |
Statement of Assets
and Liabilities
December 31, 2010 | | | |
| |
ASSETS | | | | |
Short-term Investments at fair value (cost $268,485,586) | | | $268,485,586 | |
Income receivables | | | 190,167 | |
Total Assets | | | 268,675,753 | |
| |
LIABILITIES | | | | |
Payable for fund shares redeemed | | | 2,076,452 | |
Payable to GEAM | | | 19,917 | |
Accrued other expenses | | | 137,585 | |
Total Liabilities | | | 2,233,954 | |
NET ASSETS | | | $266,441,799 | |
| |
NET ASSETS CONSIST OF: | | | | |
Capital paid in | | | 266,589,861 | |
Accumulated net realized gain (loss) | | | (148,062 | ) |
NET ASSETS | | | $266,441,799 | |
| |
NET ASSETS | | | | |
Shares outstanding ($0.01 par value; unlimited shares authorized) | | | 266,618,847 | |
Net asset value per share | | | $1.00 | |
The accompanying Notes are an integral part of these financial statements.
10
| | | | |
Statement of Operations
For the year ended December 31, 2010 | | | |
| |
INVESTMENT INCOME | | | | |
Income: | | | | |
Interest | | | $849,373 | |
Total Income | | | 849,373 | |
| |
Expenses: | | | | |
Advisory and administrative fees | | | 1,376,928 | |
Transfer agent fees | | | 59 | |
Directors’ fees | | | 15,378 | |
Custody and accounting expenses | | | 64,064 | |
Professional fees | | | 59,931 | |
Other expenses | | | 90,222 | |
Total expenses before waiver and reimbursement | | | 1,606,582 | |
Less: Expenses Waived or borne by the adviser | | | (757,209 | ) |
Net expenses | | | 849,373 | |
Net investment income (loss) | | | — | |
| |
NET REALIZED AND UNREALIZED GAIN (LOSS)
ON INVESTMENTS | | | | |
| |
Realized gain (loss) on: | | | | |
Investments | | | 2,038 | |
Net realized and unrealized gain (loss) on investments | | | 2,038 | |
Net increase (decrease) in net assets resulting from operations | | | $2,038 | |
The accompanying Notes are an integral part of these financial statements.
11
| | | | | | | | |
Statements of
Changes in Net Assets | | | |
| | | Year Ended
December 31,
2010 | | | Year Ended
December 31,
2009 | |
| | |
INCREASE (DECREASE) IN NET ASSETS | | | | | | | | |
Operations: | | | | | | | | |
Net investments income | | $ | — | | | $ | 1,361,258 | |
Net realized gain (loss) on investments | | | 2,038 | | | | 24,246 | |
Net increase (decrease) from operations | | | 2,038 | | | | 1,385,504 | |
Distributions to shareholders from: | | | | | | | | |
Net investment income | | | — | | | | (1,362,973 | ) |
Total distributions | | | — | | | | (1,362,973 | ) |
Increase (decrease) in net assets from operations and distributions | | | 2,038 | | | | 22,531 | |
Share transactions: | | | | | | | | |
Proceeds from sale of shares | | | 114,064,232 | | | | 97,640,479 | |
Value of distributions reinvested | | | — | | | | 1,362,974 | |
Cost of shares redeemed | | | (173,696,838 | ) | | | (320,507,263 | ) |
Net increase (decrease) from share transactions | | | (59,632,606 | ) | | | (221,503,810 | ) |
Total increase (decrease) in net assets | | | (59,630,568 | ) | | | (221,481,279 | ) |
| | |
NET ASSETS | | | | | | | | |
Beginning of period | | | 326,072,367 | | | | 547,553,646 | |
End of period | | $ | 266,441,799 | | | $ | 326,072,367 | |
Undistributed (distribution in excess of)
net investment income, end of period | | $ | — | | | $ | — | |
| | |
CHANGES IN FUND SHARES | | | | | | | | |
Shares sold | | | 114,064,232 | | | | 97,640,479 | |
Issued for distributions reinvested | | | — | | | | 1,362,974 | |
Shares redeemed | | | (173,696,838 | ) | | | (320,507,263 | ) |
Net increase (decrease) in fund shares | | | (59,632,606 | ) | | | (221,503,810 | ) |
The accompanying Notes are an integral part of these financial statements.
12
| | |
| Notes to Financial Statements | | December 31, 2010 |
| 1. | Organization of the Company |
GE Investments Funds, Inc. (the “Company”) was incorporated under the laws of the Commonwealth of Virginia on May 14, 1984 and is registered under the Investment Company Act of 1940, as amended (the “1940 Act”), as an open-end management investment company. The Company is composed of fourteen investment portfolios (collectively the “Funds”), although only the following eleven are currently being offered: U.S. Equity Fund, S&P 500 Index Fund, Premier Growth Equity Fund, Core Value Equity Fund, Mid-Cap Equity Fund, Small-Cap Equity Fund, International Equity Fund, Total Return Fund, Income Fund, Money Market Fund (the “Fund”) and Real Estate Securities Fund.
Shares of the Funds of the Company are offered only to insurance company separate accounts that fund certain variable life insurance contracts and variable annuity contracts. GE Asset Management Incorporated (“GEAM”) is the investment adviser and administrator of each of the Funds.
| 2. | Summary of Significant Accounting Policies |
The preparation of financial statements in conformity with U.S. generally accepted accounting principles (GAAP) requires management to make estimates and assumptions that affect the reported amounts of assets and liabilities and disclosure of contingent assets and liabilities at the date of the financial statements and the reported amounts of increases and decreases in net assets from operations during the reporting period. Actual results may differ from those estimates.
Subsequent events after the balance sheet date through the date the financial statements were issued, have been evaluated in the preparation of the financial statements. There are no items to report.
The following summarizes the significant accounting policies of the Company:
Securities Valuation and Transactions. All investments in securities are recorded at their estimated fair value, as described in Note 3.
Securities transactions are accounted for as of the trade date. Realized gains and losses on investments sold are recorded on the basis of identified cost for both financial statement and federal tax purposes.
Repurchase Agreements The Fund engages in repurchase agreement transactions with respect to instruments that are consistent with the Fund’s investment objectives or policies. The Fund’s custodian takes possession of the collateral pledged for investments in repurchase agreements on behalf of the Fund. The Fund values the underlying collateral daily on a mark-to-market basis to determine that the value, including accrued interest, is at least equal to 102% for domestic securities and 105% international securities of the repurchase price. In the event the seller defaults and the value of the security declines, or if the seller enters an insolvency proceeding, realization of the collateral by the Fund may be delayed or limited.
Investment Income Corporate actions (including cash dividends) are recorded on the ex-dividend date, net of applicable withholding taxes. Interest income is recorded on the accrual basis.
Accretion of discounts and amortization of premiums on taxable bonds are to the call or maturity date, whichever is shorter, using the effective yield method.
Expenses Fund specific expenses are allocated to the Fund that incurs such expenses. Expenses, other than those incurred by a specific Fund, are allocated pro rata among Funds. Such expenses may include custodial fees, legal and accounting fees, printing costs and registration fees. All expenses of the Fund are paid by GEAM and reimbursed by the Fund.
Federal Income Taxes The Fund intends to comply with all sections of the Internal Revenue Code applicable to regulated investment companies including the distribution of substantially all of its taxable net investment income and net realized capital gains to its shareholders. Therefore, no provision for federal income tax has been made. The Fund is treated as a separate taxpayer for federal income tax purposes.
The Fund utilizes various methods to measure the fair value of most of its investments on a recurring basis. GAAP establishes a framework for measuring fair value and providing related disclosures. Broadly, the framework requires fair value to be determined based on the exchange price that would be received for an asset or paid to transfer a liability (an exit price) in the principal or most advantageous market for the asset or liability in an orderly transaction between market participants at the measurement date. In the absence of active markets for
13
| | |
| Notes to Financial Statements | | December 31, 2010 |
the identical assets or liabilities, such measurements involve developing assumptions based on market observable data and, in the absence of such data, internal information that is consistent with what market participants would use in a hypothetical transaction that occurs at the measurement date. It also establishes a three-level valuation hierarchy based upon observable and non-observable inputs.
Observable inputs reflect market data obtained from independent sources, while unobservable inputs reflect our market assumptions. Preference is given to observable inputs. These two types of inputs create the following fair value hierarchy:
Level 1 — Quoted prices for identical investments in active markets.
Level 2 — Quoted prices for similar investments in active markets; quoted prices for identical or similar investments in markets that are not active; and model-derived valuations whose inputs are observable or whose significant value drivers are observable.
Level 3 — Significant inputs to the valuation model are unobservable.
Policies and procedures are maintained to value investments using the best and most relevant data
available. In addition, pricing vendors are utilized to assist in valuing investments. GEAM performs periodic reviews of the methodologies used by independent pricing services including price validation of individual securities.
Fair Value Measurement The following section describes the valuation methodologies the Fund uses to measure different financial investments at fair value.
Short term notes held by the Fund are valued on the basis of amortized cost which approximates fair value and these are included in Level 2.
The inputs or methodology used for valuing securities are not an indication of the risk associated with investing in those securities. Fair value determinations are required for securities whose value is affected by a significant event that will materially affect the value of a domestic or foreign security and which occurs subsequent to the time of the close of the principal market on which such domestic or foreign security trades but prior to the calculation of the Fund’s NAV.
The following table presents the Fund’s investments measured at fair value on a recurring basis at December 31, 2010:
| | | | | | | | | | | | | | | | |
| Investments | | Level 1 | | | Level 2 | | | Level 3 | | | Total | |
Short-Term Investments | | | | | | | | | | | | | | | | |
U.S. Treasury | | $ | — | | | $ | 27,995,346 | | | $ | — | | | $ | 27,995,346 | |
U.S. Government Agency and Related | | | — | | | | 22,900,122 | | | | — | | | | 22,900,122 | |
Foreign Agency | | | — | | | | 6,011,207 | | | | — | | | | 6,011,207 | |
Commercial Paper | | | — | | | | 53,681,547 | | | | — | | | | 53,681,547 | |
Repurchase Agreements | | | — | | | | 42,090,000 | | | | — | | | | 42,090,000 | |
Certificates of Deposit | | | — | | | | 111,700,388 | | | | — | | | | 111,700,388 | |
Supranational | | | — | | | | 3,950,000 | | | | — | | | | 3,950,000 | |
Time Deposit | | | — | | | | 156,976 | | | | — | | | | 156,976 | |
| | | | | | | | | | | | | | | | |
Total Short-Term Investments | | $ | — | | | $ | 268,485,586 | | | $ | — | | | $ | 268,485,586 | |
| | | | | | | | | | | | | | | | |
The Company shares a revolving credit facility of up to $150 million with a number of its affiliates. The credit facility is (“State Street”) with its custodian bank, State Street Bank and Trust Company. The revolving credit facility requires the payment of a commitment fee equal to 0.125% per annum on the daily unused portion of the credit facility, payable quarterly. The portion borne by the Funds generally is borne proportionally based upon net assets. In addition, the Company has a $100 million uncommitted, unsecured line of credit with State Street. Generally, borrowings under the
credit facilities would accrue interest at the Federal Funds Rate plus 50 basis points and would be borne by the borrowing Fund. The maximum amount allowed to be borrowed by any one Fund is the lesser of (i) 10% of its total assets or (ii) 20% of its net assets. The credit facilities were not utilized by the Fund during the fiscal year ended December 31, 2010.
| 5. | Fees and Compensation Paid to Affiliates |
Advisory and Administration Fees GEAM, a registered investment adviser, was retained by the Company’s Board
14
| | |
| Notes to Financial Statements | | December 31, 2010 |
of Directors effective May 1, 1997 to act as investment adviser and administrator of the Fund. Compensation of GEAM for investment advisory and administrative services is paid monthly based on the average daily net assets of the Fund. The advisory and administrative fee is stated in the following schedule:
| | | | | | | | |
| | | Average Daily Net Assets of Fund | | | Advisory and Administration Fees | |
Money Market Fund | | First $ | 100 million | | | | .50 | % |
| | Next $ | 100 million | | | | .45 | % |
| | Next $ | 100 million | | | | .40 | % |
| | Next $ | 100 million | | | | .35 | % |
| | Over $ | 400 million | | | | .30 | % |
GEAM has voluntarily undertaken to reduce its management fee and/or subsidize certain expenses of the Fund to the extent necessary to maintain a minimum annualized net yield of 0.00%. This voluntary management fee reduction and/or expense subsidy may be modified or discontinued by GEAM at any time without prior notice. There can be no assurance that this fee reduction will be sufficient to avoid any loss. Management fees reduced by GEAM may be recouped by GEAM for up to three years from the date reduced, provided that the total operating expense ratio for the Fund, after giving effect to the recoupment, would not exceed 0.60% for the fiscal year in which the recoupment is made.
Directors’ Compensation The Fund pays no compensation to its directors who are officers or employees of GEAM or its affiliates. Directors who are not such officers or employees also serve in a similar capacity for other funds advised by GEAM. Compensation paid to unaffiliated directors are reflected on the Statement of Operations. These fees are allocated pro rata across all of the mutual fund platforms and share classes served by the directors, including the Fund, and are based upon the relative net assets of each fund within such platforms.
The Fund is subject to ASC 740, Income Taxes. ASC 740 provides guidance for financial accounting and reporting for the effects of income taxes that result from an entity’s activities during the year. ASC 740 also provides guidance regarding how certain tax positions should be recognized, measured, presented and disclosed in the financial statements. ASC 740 requires evaluation of tax positions taken or expected to be taken in the course of preparing the Fund’s tax returns to determine whether the tax positions are “more likely than not” of being sustained by the applicable tax authority. There are no adjustments to the Fund’s net assets required under ASC 740. The Fund’s 2007, 2008, 2009 and 2010 fiscal years tax returns are still open to examination by the Federal and applicable state tax authorities.
At December 31, 2010, information on the tax components of capital is as follows:
| | | | | | | | |
Cost for Tax Purposes | | Net Tax Appreciation/ (Depreciation) | | Undistributed Income | | Undistributed (Accumulated Capital Loss) | | Post October Losses |
| $268,485,586 | | $— | | $— | | $(148,062) | | $— |
15
As of December 31, 2010, the Fund has capital loss carryovers as indicated below. Capital loss carryovers are available to offset future realized capital gains to the extent provided in the Internal Revenue Code and regulations thereunder. To the extent that these carryover losses are used to offset future capital gains, it is probable that the gains so offset will not be distributed to shareholders because they would be taxable as ordinary income.
During the year ended December 31, 2010, the Fund utilized $2,038 of prior year capital loss carryovers. $37,585 of prior year capital loss carryovers expired on December 31, 2010.
| | |
| Amount | | Expires |
| $148,062 | | 12/31/2016 |
These amounts will be available to offset future taxable capital gains. Under the recently enacted Regulated Investment Company Modernization Act of 2010, the Fund will be permitted to carry forward capital losses incurred in taxable years beginning after December 22, 2010 for an unlimited period. However, any losses incurred during those future years will be required to be utilized prior to the losses incurred in pre-enactment tax years. As a result of this
| | |
| Notes to Financial Statements | | December 31, 2010 |
ordering rule, pre-enactment capital loss carryforwards may be more likely to expire unused. Additionally, post-enactment capital losses that are carried forward will retain their character as either short-term or long-term capital losses rather than being considered all short-term as under previous law.
Any net capital and currency losses incurred after October 31, within the Fund’s tax year, are deemed to arise on the first day of the Fund’s next tax year if the Fund so elects to defer such losses.
The Fund incurred no such losses after October 31, 2010.
The tax composition of distributions paid during the years ended December 31, 2010 and December 31, 2009 were as follows:
| | | | | | | | | | | | |
| | | Ordinary Income | | | Long-Term Capital Gains | | | Total | |
2010 | | $ | — | | | $ | — | | | $ | — | |
2009 | | | 1,362,973 | | | | — | | | | 1,362,973 | |
Distributions to Shareholders The Fund declares any net investment income dividends daily and pays them monthly. The character of income and gains to be distributed is determined in accordance with income tax regulations which may differ from generally accepted accounting principles. Reclassifications due to permanent book/tax differences are made to the Fund’s capital accounts to reflect income and gains available for distribution (or available capital loss carryovers) under income tax regulations. These reclassifications have no impact on net investment income, realized gains or losses, or the net asset value of the Fund. The calculation of net investment income per share in the Financial Highlights table excludes these adjustments.
The reclassification for the year ended December 31, 2010 was as follows:
| | |
Accumulated Net
Realized Loss | | Paid In Capital |
| $37,585 | | $(37,585) |
16
Report of Independent Registered Public Accounting Firm
The Shareholders and Board of Directors
GE Investments Funds, Inc.
We have audited the accompanying statement of assets and liabilities, including the schedule of investments, of the Money Market Fund, a series of GE Investments Funds, Inc., as of December 31, 2010, and the related statement of operations for the year then ended, statements of changes in net assets for each of the years in the two-year period then ended, and the financial highlights for each of the years in the five-year period then ended. These financial statements and financial highlights are the responsibility of the Fund’s management. Our responsibility is to express an opinion on these financial statements and financial highlights based on our audits.
We conducted our audits in accordance with the standards of the Public Company Accounting Oversight Board (United States). Those standards require that we plan and perform the audit to obtain reasonable assurance about whether the financial statements and financial highlights are free of material misstatement. An audit includes examining, on a test basis, evidence supporting the amounts and disclosures in the financial statements. Our procedures included confirmation of securities owned as of December 31, 2010 by correspondence with the custodian. An audit also includes assessing the accounting principles used and significant estimates made by management, as well as evaluating the overall financial statement presentation. We believe that our audits provide a reasonable basis for our opinion.
In our opinion, the financial statements and financial highlights referred to above present fairly, in all material respects, the financial position of the Money Market Fund as of December 31, 2010, the results of its operations, changes in its net assets and financial highlights for each of the years described above, in conformity with U.S. generally accepted accounting principles.

Boston, Massachusetts
February 25, 2011
17
| | |
| Advisory and Administrative Agreement Renewal | | (unaudited) |
The Board of Directors of the GE Investments Funds, Inc. (the “Board”), including the independent Board members, considered and all those that were present unanimously approved the continuance of the Fund’s Investment Advisory and Administration Agreement with GE Asset Management Incorporated (“GEAM”) at meetings held on December 3 and December 10, 2010.
In considering whether to approve the Fund’s investment advisory agreement, the Board members considered and discussed a substantial amount of information and analysis provided, at the Board’s request, by GEAM. The Board members also considered detailed information regarding performance and expenses of other investment companies, including those with similar investment strategies and sizes, which was prepared by independent third party provider Morningstar, Inc. (“Morningstar”). The Board members reviewed the fees charged by GEAM for other mutual funds and investment products other than mutual funds that employ a similar investment strategy as the Fund. The Board had the opportunity to ask questions and request additional information in connection with its considerations.
Before approving the Fund’s advisory agreement, the Board members reviewed the information provided with management of GEAM and with independent legal counsel. The Board members also reviewed a memorandum prepared by independent legal counsel discussing the legal standards for the consideration of the proposed continuance. The independent Board members discussed the proposed continuance in detail during a private session with their independent legal counsel at which no representatives of GEAM were present. The independent Board members and their independent legal counsel requested, and received and considered, additional information from GEAM following these sessions.
In advance of the meetings, and in response to their request, the Board members received from GEAM written responses to their inquiries, which included substantial exhibits and other materials related to GEAM’s business and the services it provides to the Fund. The Board members took into account their multi-year experience as Board members and particularly their consideration of these types of agreements in recent years. The information was presented in a manner to facilitate comparison to prior periods and to reflect certain enhancements. To focus their review, the Board members asked GEAM management, in its oral presentation, to highlight material differences from the information presented in recent years.
During the meetings, the Board members had an opportunity to discuss this information with GEAM managers, including senior executives, representatives from the legal, compliance and finance departments, and investment personnel. The Board members posed questions to these representatives and engaged in substantive discussions with them concerning GEAM’s investment process.
In reaching their determination relating to continuance of the Fund’s investment advisory agreement, the Board members considered all factors that they deemed relevant, including the factors discussed below. In their deliberations, the Board members did not identify any particular information that was all-important or controlling, and each Board member may have attributed different weights to the various factors. In particular, the Board members focused on the following:
The Nature, Extent And Quality Of Services Provided.
The Board members reviewed the services provided by GEAM, taking into account their extensive past experiences with GEAM. They focused on the favorable attributes of GEAM, including (i) an investment philosophy oriented toward long-term performance; (ii) effective processes used for selecting investments and brokers; (iii) effective processes used for providing Fund administration, including controllership and compliance functions and oversight of the performance of other companies that provide services to the Fund; (iv) highly skilled professionals including analysts, research professionals, traders and portfolio managers with a depth of experience relevant to the Fund; (v) access to significant technological resources from which the Fund may benefit; and (vi) a favorable history and reputation. The Board members noted that the Fund represents only a small portion of the assets managed by GEAM, but benefits from a full array of services and resources provided by GEAM.
In light of these discussions, the Board, including the independent Board members, concluded that GEAM’s services continue to be satisfactory.
Investment Performance Of The Fund.
The Board members considered the investment performance of the Fund for various periods. The Board members reviewed detailed comparisons of the performance of the Fund with the relevant market average and peer groupings of mutual funds prepared by
18
| | |
| Advisory and Administrative Agreement Renewal | | (unaudited) |
Morningstar with respect to various periods. The Board members also engaged in detailed discussions with GEAM management about its investment process and performance results. These discussions focused on the Fund’s investment objective, the number and experience of portfolio management and supporting research personnel, the investment style and approach employed and the likely market cycles for the investment style.
The Board, including the independent Board members, concluded that the Fund’s performance was acceptable overall taking into consideration the factors discussed above.
Cost Of The Services Provided And Profits Realized From The Relationship With The Fund.
The Board members considered the fees paid to GEAM by the Fund and the cost of the services provided to the Fund by GEAM. The Board members reviewed the information they had requested from GEAM concerning its profitability. The Board members considered the profit margin information for GEAM’s investment company business as a whole, as well as GEAM’s profitability data for the Fund. The Board members reviewed GEAM’s assumptions and the methods of cost allocation used by GEAM in preparing Fund-specific profitability data. The Board members also discussed with GEAM the basis for its belief that the methods of allocation used were reasonable for each area of its business.
The Board also considered that GEAM has voluntarily undertaken to reduce its management fee charged to the Money Market Fund to the extent necessary to maintain a minimum annualized net yield of 0.00% for the Fund’s Class 1 shares.
Information was presented regarding the financial condition of GEAM for various past periods. The Board members noted and discussed the additional services provided by GEAM to the Fund compared to other investment products managed by GEAM, and previously had been provided a study conducted by the Investment Company Institute that discusses and compares advisory fees and services for mutual funds and institutional separate accounts. The Board members determined that GEAM should be entitled to earn a reasonable level of profits for the services it provides to the Fund. The Board members also recognized that GEAM had made significant investments in its business and had not fully recovered the
sums invested. The Board also considered that, in the face of declining Fund assets over the course of the past year, GEAM continues to make a substantial investment in fulfilling its obligations to the Fund and supporting its Fund-related activities.
Based on their review, the Board, including the independent Board members, concluded that they were satisfied that the level of profitability achieved by GEAM from its relationship with the Fund was not unreasonable or excessive.
The Extent To Which Economies Of Scale Would Be Realized As The Fund Grows And Whether Fee Levels Would Reflect Such Economies Of Scale.
Although the Board noted that the Fund experienced a significant decline in assets over the past year, the Board members considered the extent to which economies of scale would be realized as the Fund grows, and whether fee levels reflect these economies of scale for the benefit of Fund investors. The Board members considered the substantial infrastructure investments that GEAM has made with respect to its operations and its commitment to continue investing resources to enhance services to Fund shareholders. The Board members recognized the benefits to the Fund of GEAM’s past investment in its operations through the expenditure of sums to support its substantial infrastructure, and that, with respect to all GEAM managed mutual funds, GEAM has not yet fully recouped that investment. The Board members reviewed the applicable advisory fee breakpoints for the Fund. The Board members recognized the economies of scale benefits derived by the Fund as a result of this fee structure. The Board members also recognized the benefits to the Fund of being able to leverage a favorable cost structure achieved with respect to the Fund’s other operating expenses as a result of GEAM’s large overall base of assets under management and its vendor management practices.
Comparison Of Services To Be Rendered And Fees To Be Paid.
The Board members discussed the services provided to the Fund by GEAM, and the fees charged for those services. The Board members reviewed information concerning the fee and expense ratios for the Fund, and comparative information with respect to peer groupings of mutual funds prepared by Morningstar. They discussed that the Fund’s figures were within the applicable peer group ranges. In light of the foregoing, the Board, including the independent
19
| | |
| Advisory and Administrative Agreement Renewal | | (unaudited) |
Board members, determined that the advisory fees were reasonable in relation to the services provided to the Fund.
Fall-Out Benefits.
The Board members considered other actual and potential financial benefits that GEAM may derive from its relationship with the Fund, including, to the extent applicable, soft dollar commission benefits generated through Fund portfolio transactions. The Board members noted, however, that the Fund benefits from the vast array of resources available through GEAM, and that the Fund represents only a small portion of the assets managed by GEAM.
Conclusion.
No single factor was determinative to the Board’s decision. Based on their discussion and such other matters as were deemed relevant, the Board, including the independent Board members, concluded that renewal of the advisory agreement was in the best interests of the Fund and its shareholders.
20
| | |
| Additional Information | | (unaudited) |
Information about Directors and Executive Officers:
The business and affairs of the Company are managed under the direction of the Company’s Board of Directors. Information pertaining to the Directors and officers of the Company is set forth below.
Interested Directors and Executive Officers
Michael J. Cosgrove
Address c/o GEAM 3001 Summer St. Stamford, CT 06905
Age 61
Position(s) Held with Fund Chairman of the Board and President
Term of Office and Length of Time Served Until successor is elected and qualified – 14 years
Principal Occupation(s) During Past 5 years President and Chief Executive Officer – Mutual Funds and Intermediary Business since March 2007; Executive Vice President of GEAM from February 1997 to March 2007; Director of GEAM since 1988; Vice President, GE Capital Corporation, an indirect wholly-owned subsidiary of GE, since December 1999; Executive Vice President – Sales and Marketing of GEAM, a wholly-owned subsidiary of GE that is registered as an investment adviser under the Investment Advisers Act of 1940, as amended, from March 1993 to March 2007.
Number of Portfolios in Fund Complex Overseen by Director 49
Other Directorships Held by Director Chairman of the Board and President of GE Funds from 1993 to February 2011, and GE Institutional Funds since its inception; Trustee of General Electric Savings & Security Trust, General Electric S&S Income Fund, General Electric S&S Program Mutual Fund (“GE Savings & Security Funds”), Elfun Funds, General Electric Insurance Plan Trust, General Relief Loan Fund, and General Electric Pension Trust since 1988; Trustee of Fordham University since 2002; Trustee of GE Volunteers since 1993; Director, GE Asset Management (Ireland) since February 1999; Director, GE Asset Management Funds Plc., GE Asset Canada Company, and GE Asset Management Limited since 1998.
Matthew J. Simpson
Address c/o GEAM 3001 Summer St. Stamford, CT 06905
Age 49
Position(s) Held with Fund Director and Executive Vice President
Term of Office and Length of Time Served Until successor is elected and qualified – 3 years
Principal Occupation(s) During Past 5 years Executive Vice President, General Counsel and Secretary of GEAM since July 2007; Senior Vice President and General Counsel – Marketing and Client Services (formerly Asset Management Services), at GEAM and Senior Vice President and General Counsel of GEAMS from February 1997 to June 2007; Vice President and Associate General Counsel of GEAM from October 1992 to February 1997; Vice President of GE Funds, GE Institutional Funds and GE LifeStyle Funds from September 2003 to June 2007; Secretary of GE Funds and GE Institutional Funds from 1997 to June 2007; Vice President of Elfun Funds and GE Savings & Security Funds from October 2003 to June 2007; Assistant Secretary of Elfun Funds and GE Savings & Security Funds from 1998 to June 2007.
Number of Portfolios in Fund Complex Overseen by Director 49
Other Directorships Held by Director Trustee of GE Institutional Funds, Elfun Funds and GE Savings & Security Funds since July 2007. Trustee of GE Funds from July 2007 to February 2011.
21
| | |
| Additional Information | | (unaudited) |
Joon Won Choe
Address c/o GEAM 3001 Summer St. Stamford, CT 06905
Age 41
Position(s) Held with Fund Vice President & Secretary
Term of Office and Length of Time Served Until successor is elected and qualified – Vice President and Secretary – less than 1 year
Principal Occupation(s) During Past 5 years Senior Vice President and Associate General Counsel at GEAM since June 2010; Vice President and Associate General Counsel at GEAM from November 2005 to June 2010; Vice President and Secretary of GE Funds from September 2010 to February 2011. Vice President and Secretary of GE Institutional Funds and GE Investments Funds, Inc. since September 2010; Vice President and Assistant Secretary of Elfun Funds and GE Savings & Security Funds since September 2010.
Number of Portfolios in Fund Complex Overseen by Officer N/A
Other Directorships Held by Officer N/A
Robert Herlihy
Address c/o GEAM 3001 Summer St. Stamford, CT 06905
Age 43
Position(s) Held with Fund Senior Vice President and Chief Compliance Officer
Term of Office and Length of Time Served Until successor is elected and qualified – 5 years
Principal Occupation(s) During Past 5 years Chief Compliance Officer of GEAM, GE Institutional Funds, Elfun Funds, and GE Savings and Security Funds since July 2005; Chief Compliance Officer of GE Funds from July 2005 to February 2011; Manager of Fund Administration at GEAM from 2002 – 2005.
Number of Portfolios in Fund Complex Overseen by Officer N/A
Other Directorships Held by Officer N/A
Eunice Tsang
Address c/o GEAM 3001 Summer St. Stamford, CT 06905
Age 51
Position(s) Held with Fund Treasurer
Term of Office and Length of Time Served Until successor is elected and qualified – less than one year
Principal Occupations(s) During Past 5 years Treasurer of GE Institutional Funds, Elfun Funds and GE Savings and Security Funds since January 2010; Treasurer of GE Funds from January 2010 to February 2011; GEAM Operational Controllership and Technical Accounting Manager since December 2007; Financial Planning & Analysis Manager – Performance Leader from June 2005 to December 2007; GEAM Quality Black Belt from 2001 to June 2005; Financial Planning & Analysis Manager from 2000 to 2001; and Mutual Fund Assistant Controller from October 1997 to 2000.
Number of Portfolios in Fund Complex Overseen by Officer N/A
Other Directorships Held by Officer N/A
22
| | |
| Additional Information | | (unaudited) |
Non-Interested Directors
John R. Costantino
Address c/o GEAM 3001 Summer St. Stamford, CT 06905
Age 64
Position(s) Held with Fund Director
Term of Office and Length of Time Served Until successor is elected and qualified – 14 years
Principal Occupation(s) During Past 5 years General Partner, NGN Capital LLC since 2006; Managing Director, Vice President of Walden Capital Management since 1996.
Number of Portfolios in Fund Complex Overseen by Director 41
Other Directorships Held by Director Trustee of GE Funds since 1993, GE Institutional Funds since its inception; Trustee of Fordham University from 1989 to 1995 and 2001 to 2007 and Trustee Emeritus since 2007; Trustee of Neuro Science Research Institute since 1986; Trustee of Gregorian University Foundation from 1992 to 2007; Director of Artes Medical from 2006 to 2008.
William J. Lucas
Address c/o GEAM 3001 Summer St. Stamford, CT 06905
Age 61
Position(s) Held with Fund Director
Term of Office and Length of Time Served Until successor is elected and qualified – 13 years (No longer serves as Trustee effective November 4, 2010)
Principal Occupation(s) During Past 5 years Retired since 2010, previously Vice President and Treasurer of Fairfield University since 1983.
Number of Portfolios in Fund Complex Overseen by Director 41
Other Directorships Held by Director Trustee of GE Funds since 1993, and GE Institutional Funds since its inception.
Robert P. Quinn
Address c/o GEAM 3001 Summer St. Stamford, CT 06905
Age 74
Position(s) Held with Fund Director
Term of Office and Length of Time Served Until successor is elected and qualified – 14 years
Principal Occupation(s) During Past 5 years Retired since 1983 from Salomon Brothers Inc.
Number of Portfolios in Fund Complex Overseen by Director 41
Other Directorships Held by Director Trustee of GE Funds since 1993, and GE Institutional Funds since its inception; Trustee, St. Francis Hospital Corp. since 1980.
The Statement of Additional Information for the Fund includes additional information about the Directors and Officers and is available, without charge, upon request by calling 1-800-493-3042.
23
Investment Adviser and Administrator
GE Asset Management Incorporated
Board of Directors
Michael J. Cosgrove, Chairman
John R. Costantino
William J. Lucas*
Robert P. Quinn
Matthew J. Simpson
Secretary
Joon Won Choe
Assistant Secretary
Michelle Matzelle
Treasurer
Eunice Tsang
Assistant Treasurers
Tatyana Begun**
Casey Yantosca
Distributor
GE Investment Distributors, Inc.
Member FINRA and SIPC
Counsel
Sutherland, Asbill & Brennan, LLP
Custodian
State Street Bank & Trust Company
Independent Registered Public Accounting Firm
KPMG LLP
Officers of the Investment Adviser
James W. Ireland, President and Chief Executive Officer
Cheryl H. Beacock, Senior Vice President, Human Resources
Paul M. Colonna, President and Chief Investment Officer – Fixed Income Investments
Michael J. Cosgrove, President and Chief Executive
Officer – Mutual Funds & Intermediary Business
Ralph R. Layman, President and Chief Investment Officer – Public Equity Investments
Maureen B. Mitchell, President – Institutional Sales and Marketing
Steve Rullo, Chief Information Officer (since February 2011)
Matthew J. Simpson, Executive Vice President, General Counsel and Secretary
Don W. Torey, President – Alternative Investments
John J. Walker, Executive Vice President, Chief Operating Officer
David Wiederecht, President and Chief Investment Officer – Investment Strategies
Tracie Winbigler, Executive Vice President, Chief Financial Officer***
| * | As of November 4, 2010, Mr. Lucas no longer served as a director of the Company. |
| ** | As of February 18, 2011, Ms. Begun no longer served as an officer of the Company. |
| *** | Effective January, 2011. |
24
Investment Adviser
GE Asset Management Incorporated
3001 Summer Street
PO Box 7900
Stamford, CT 06904-7900
Distributor
GE Investment Distributors, Inc.
member FINRA and SIPC
3001 Summer Street
PO Box 7900
Stamford, CT 06904-7900
The Fund files its complete schedule of portfolio holdings with the Securities and Exchange Commission for the first and third quarters of each fiscal year on Form N-Q. The Fund’s Forms N-Q, as well as a description of the policies and procedures that the Fund uses to determine how to vote proxies (if any) relating to portfolio securities is available without charge (i) upon request, by calling 1-800-493-3042; (ii) on the Fund’s website at http://www.geam.com; and (iii) on the Commission’s website at http://www.sec.gov. The Fund’s Forms N-Q may be reviewed and copied at the Commission’s Public Reference Room in Washington, DC—information on the operation of the Public Reference Room may be obtained by calling 1-800-SEC-0330.
Information (if any) regarding how the Fund voted proxies relating to portfolio securities during the most recently disclosed 12-month period ended June 30 is available without charge (i) through the Fund’s website at http://www.geam.com; and (ii) on the Commission’s website at http://www.sec.gov.

GE Investments Funds, Inc.
Real Estate Securities Fund
Annual Report
December 31, 2010

GE Investments Funds, Inc.
| | |
| |
| Real Estate Securities Fund | | Contents |
This report is prepared for Policyholders of certain variable contracts and may be distributed to others only if preceded or accompanied by the variable contract’s current prospectus and the current prospectus of the Fund available for investments thereunder.
| | |
| Notes to Performance | | December 31, 2010 (unaudited) |
The information on the following performance pages relates to the GE Investments Real Estate Securities Fund (the “Fund”).
Total returns take into account changes in share price and assume reinvestment of dividends and capital gains distributions, if any. Total returns shown are net of Fund fees and expenses but do not reflect fees and charges associated with the variable contracts such as administrative fees, account charges and surrender charges, which, if reflected, would reduce the Fund’s total returns for all periods shown.
The performance data quoted represent past performance; past performance does not guarantee future results. Investment return and principal value will fluctuate so your shares, when redeemed, may be worth more or less than their original cost. Current performance may be higher or lower than the performance data quoted. Periods less than one year are not annualized. Please call 800-493-3042 or visit the Fund’s website at http://www.geam.com for the most recent month-end performance data.
An investment in the Fund is not a deposit of any bank and is not insured or guaranteed by the Federal Deposit Insurance Corporation (FDIC) or any other government agency. An investment in the Fund is subject to risk, including possible loss of principal invested.
FTSE NAREIT U.S. Real Estate Index is an unmanaged index of all tax-qualified real estate investment trusts (REITs) listed on the New York Stock Exchange, American Stock Exchange and NASDAQ which have 75% or more of their gross invested book assets invested directly or indirectly in the equity ownership of real estate. The results shown for the foregoing indices assume the reinvestment of net dividends or interest. They do not reflect the actual cost of investing in the instruments that comprise the index.
The peer universe of the underlying annuity funds used for the peer group average annual total return calculation is based on a blend of Morningstar peer categories, as shown. Morningstar is an independent mutual fund rating service. A Fund’s performance may be compared to or ranked within a universe of mutual funds with investment objectives and policies similar but not necessarily identical to that of the Fund.
©2010 Morningstar, Inc. All Rights Reserved. The Morningstar information contained herein: (1) is proprietary to Morningstar and/or its content providers; (2) may not be copied or distributed; and (3) is no warranted to be accurate, complete or timely. Neither Morningstar nor its content providers are responsible for any damage or losses relating from any use of this information. Past performance is no guarantee or future results.
GE Investment Distributors, Inc., Member of FINRA & SIPC, is the principal underwriter and distributor of the GE Investments Funds, Inc. and a wholly owned subsidiary of GE Asset Management Incorporated, the investment adviser of the Fund.
1
| | |
| Real Estate Securities Fund | | (unaudited) |
Urdang Securities Management, Inc. (Urdang) is the sub-adviser for the Real Estate Securities Fund. Urdang is a wholly owned subsidiary of Urdang Capital Management, Inc. (Urdang Capital). Urdang Capital is wholly owned by The Bank of New York Mellon Corporation (Bank of New York) and operates as part of Bank of New York’s Asset Management Division. As a wholly owned subsidiary of Urdang Capital, Urdang is a second tier subsidiary of Bank of New York. Urdang is a registered investment adviser that was formed in 1995 to focus exclusively on opportunities in the real estate securities market, including publicly traded real estate investment trusts (REITs).
The Real Estate Securities Fund is co-managed by Dean Frankel, CFA and Eric Rothman, CFA.
Dean Frankel is a senior portfolio manager, North America Real Estate Securities strategy, at Urdang and serves as the senior portfolio manager to the Fund. He joined Urdang in 1997 and has over 11 years of real estate securities investment experience. Mr. Frankel is responsible for management of Urdang’s proprietary research process including the firm’s Relative Value Model. In addition, Mr. Frankel analyzes and interprets implications of major events and economic trends while managing the daily operations of the North American Real Estate Securities investment team.
Eric Rothman serves as a portfolio manager to the Fund, where he will help direct Urdang’s U.S. Real Estate Securities strategy. As portfolio manager, Mr. Rothman is responsible for market research, sector allocations, and real estate securities analysis. Additionally he has primary coverage responsibility for the lodging, self storage and retail sectors. Mr. Rothman joined Urdang in 2006 and has over 14 years of real estate securities and real estate investment experience, including being a sell-side REIT analyst at Wachovia Securities from 2001 to 2006 and an analyst at AEW Capital Management, LP from 1997 to 2000.
| Q. | How did the GE Investments Real Estate Securities Fund perform compared to its benchmark for the twelve-month period ended December 31, 2010? |
| A. | For the twelve-month period ended December 31, 2010, the Real Estate Securities Fund returned 28.94% for Class 1 shares and 28.31% for Class 4 shares. The FTSE NAREIT Equity Index, the Fund’s benchmark, returned 27.95% and the Fund’s Morningstar peer group of 51 US Insurance Real Estate funds returned on average of 25.52% for the same period. |
| Q. | What market conditions impacted Fund performance? |
| A. | The stabilization of the global economy combined with a low interest rate environment lifted the REIT market ahead of the broader U.S. equity market in 2010. Property fundamentals for all property types reached bottom and began to improve in 2010. Vacancy rates stabilized, and for some property types there was even emergent rent growth. An important portion of the 2010 total return was generated by the sector’s approximately high-3.0% to low-4.0% dividend yield during the year. |
| | Early in the year all REITs performed well, but performance was disproportionately shifted in favor of a handful of small, “deep value” REITs as risk aversion ebbed and optimism about the economic recovery grew. During the second quarter the European sovereign debt crisis renewed fears about the sustainability of the global economic recovery and prices of all equities retreated and U.S. Treasury bonds rallied. Positive developments related to the European debt crisis coupled with a further rapid decline in U.S. treasury yields in anticipation of the announcement of additional quantitative easing by the U.S. Federal Reserve renewed the optimism felt earlier in the year and the equity markets again rallied. Fourth quarter returns were an extension of this rally. REITs performed well but trailed the broad U.S. equity markets in the fourth quarter as a result of outperformance earlier in the year, as well as an end to the trend of falling yields. |
| Q. | What were the primary drivers of Fund performance? |
| A. | Stock selection was the primary driver of fund performance in 2010 and was responsible for over 80% of the alpha generated in 2010. Cash drag was a significant detractor from relative performance. Some of the most notable alpha generators in 2010 included stock selection within the office, regional mall and healthcare sectors, an overweight position to the self storage and regional mall sectors and an underweight position to the timber, healthcare and shopping center sectors. |
2
| Q. | Were there any significant changes to the Fund during the period? |
| A. | We did not deviate from the investment process, philosophy or approach we have consistently applied since 1995, nor were there any personnel changes during the year. |
| Q. | What is your outlook for next year? |
| A. | We believe REITs remain attractive real estate investment vehicles on both an absolute and risk-adjusted basis for their strong and growing dividends, stable cash flows, access to capital, and favorable near-term internal and external growth opportunities. Looking ahead, we are cautiously optimistic for REITs. To a degree, uncertainty in the broader economy and a slower growth outlook benefits REITs as their long-term leases and strong dividends provided a safe haven for investors seeking yield and stability in earnings. |
| | REITs currently enjoy both above average internal and external growth prospects. With occupancies and rents having bottomed at a level materially below the peak, earnings growth should be above historical trends for the next few years. Capital remains plentiful for the REITs. The widely-predicted slow growth, low interest rate economic environment should allow REITs to continue making accretive acquisitions from distressed private owners. Valuations of REITs compare favorably to the prices paid for real estate assets in the private market and relative to replacement cost. The search for yield is unlikely to abate given the simulative posture of the Federal Reserve which is hesitant to raise rates in the face of high unemployment and an apparent lack of observable inflation risk near-term. REITs, which offered an average dividend yield of approximately 3.6% at year end, stand to benefit disproportionately from investor appetite for yield. |
3
| | |
| Real Estate Securities Fund | | (unaudited) |
Understanding Your Fund’s Expenses
As a shareholder of the Fund you incur transaction and ongoing expenses. Transaction expenses including sales charges on purchases payments, reinvested dividends (or other distributions), and redemption fees directly reduce the investment return of the Fund. Ongoing costs include portfolio management fees, distribution and services fees, professional fees, administrative fees and other Fund expenses. The following example is intended to help you understand your ongoing costs (in dollars) of investing in the Fund and to compare these costs with the ongoing costs of investing in other mutual funds.
To illustrate these ongoing costs, we have provided an example and calculated the expenses paid by investors during the period. The information in the following table is based on an investment of $1,000, which is invested at the beginning of the period and held for the entire six-month period ended December 31, 2010.
Actual Expenses
The first section of the table provides information about actual account values and actual expenses. You may use the information in this section, together with the amount you invested, to estimate the expenses that you paid
over the period. To do so, simply divide your account value by $1,000 (for example, an $8,600 account value
divided by $1,000 = 8.6), then multiply the result by the number given for your class under the heading “Expenses Paid During Period.”
Hypothetical Example for Comparison Purposes
The second section of the table provides information about hypothetical account values and hypothetical expenses based on the Fund’s actual expense ratio and an assumed rate of return of 5% per year before expenses, which is not the Fund’s actual return. You may use this information to compare the ongoing costs of investing in the Fund and other funds. To do so, compare this 5% hypothetical example with the 5% hypothetical examples that appear in the shareholders reports of other funds.
Please note that the expenses shown in the table for both “Actual” and “Hypothetical” do not reflect any transaction costs, such as sales charges or redemption fees. Additionally, the expenses shown do not reflect the fees or charges associated with variable contracts through which shares of the Fund are offered.
July 1, 2010 – December 31, 2010
| | | | | | | | | | | | |
| | | Account value at the
beginning of the period ($) | | | Account value at the
end of the period ($) | | | Expenses paid
during the period ($)* | |
Actual Fund Return** | | | | | | | | | |
Class 1 | | | 1,000.00 | | | | 1,226.70 | | | | 5.16 | |
Class 4 | | | 1,000.00 | | | | 1,223.47 | | | | 7.62 | |
Hypothetical 5% Return (2.5% for the period) | | | | | | | | | |
Class 1 | | | 1,000.00 | | | | 1,020.36 | | | | 4.69 | |
Class 4 | | | 1,000.00 | | | | 1,018.19 | | | | 6.92 | |
| * | | Expenses are equal to the Fund’s annualized expense ratio of 0.92% for Class 1 shares and 1.36% for Class 4 shares (for the period July 1, 2010—December 31, 2010), multiplied by the average account value over the period, multiplied by 184/365 (to reflect the six months period) |
| ** | | Actual Fund Returns for the six-month period ended December 31, 2010 were as follows: 22.67% for Class 1 shares, and 22.35% for Class 4 shares. Past performance does not guarantee future results. |
4
| | |
| Real Estate Securities Fund | | (unaudited) |
Investment Profile
A mutual fund designed for investors who seek maximum total return through current income and capital appreciation by investing at least 80% of its net assets under normal circumstances in common and preferred stocks and other types of equity securities and debt securities of U.S. issuers that are principally engaged in or related to the real estate industry, including those that own significant real estate assets.
Morningstar Performance Comparison
Based on average annual returns for periods ended 12/31/10
| | | | | | | | | | | | | | | | |
| | | | | | One
Year | | | Five
Year | | | Ten
Year | |
Number of Funds in peer group: | | | | | | | 51 | | | | 47 | | | | 34 | |
Peer group average annual total return: | | | | | | | 25.52 | % | | | 2.48 | % | | | 10.04 | % |
Morningstar category in peer group: U.S. Insurance Real Estate | | | | | | | | | | | | | | | | |
Sector Allocation
as a % of Fair Value(c) of $77,537 (in thousands) on December 31, 2010(b)(c)

Top Ten Largest Holdings
as of December 31, 2010 (as a % of Fair Value)(b)(c)
| | | | |
Simon Property Group Inc. | | | 7.52% | |
Vornado Realty Trust | | | 6.77% | |
Equity Residential | | | 6.29% | |
Public Storage | | | 4.61% | |
The Macerich Co. | | | 4.38% | |
ProLogis | | | 3.85% | |
Kimco Realty Corp. | | | 3.29% | |
Nationwide Health Properties Inc. | | | 3.13% | |
Healthcare Inc. | | | 3.07% | |
HCP Inc. | | | 3.07% | |
Change in Value of a $10,000 Investment
Class 1 Shares

Average Annual Total Return
for the Periods Ended December 31, 2010
Class 1 Shares (Inception date: 5/1/95)
| | | | | | | | | | | | | | | | |
| | | One
Year | | | Five
Year | | | Ten
Year | | | Ending
value of a
$10,000
investment(a) | |
Real Estate Securities Fund | | | 28.94% | | | | 4.87% | | | | 11.02% | | | $ | 28,445 | |
NAREIT Equity Index | | | 27.95% | | | | 3.03% | | | | 10.77% | | | $ | 27,798 | |
Change in Value of a $10,000 Investment
Class 4 Shares
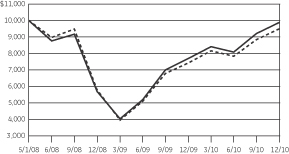
Average Annual Total Returns
for the Periods Ended December 31, 2010
Class 4 Shares (Inception date: 5/1/08)
| | | | | | | | | | | | |
| | | One
Year | | | Since
Inception | | | Ending value of a
$10,000 investment(a) | |
Real Estate Securities Fund | | | 28.31% | | | | -0.43% | | | $ | 9,886 | |
NAREIT Equity Index | | | 27.95% | | | | -1.90% | | | $ | 9,500 | |

| (a) | Ending value of a $10,000 investment for the ten-year period or since inception, whichever is less. |
| (b) | The securities information regarding holdings, allocations and other characteristics is presented to illustrate examples of securities that the Fund has bought and the diversity of areas in which the Fund may invest as of a particular date. It may not be representative of the Fund’s current or future investments and should not be construed as a recommendation to purchase or sell a particular security. |
| (c) | Fair value basis is inclusive of Short Term Investment in GE Money Market Fund. |
See Notes to Performance on page 1 for further information, including an explanation of Morningstar peer categories.
Past performance does not predict future performance and the graph and table do not reflect the deduction of taxes that a shareholder would pay on Fund distributions or the redemption of Fund shares and do not reflect the fees or charges that would be associated with variable contracts through which shares of the Fund are offered.
5
Real Estate Securities Fund
| | |
| Schedule of Investments | | December 31, 2010 |
Real Estate Securities Fund
| | | | | | | | | | |
| | | |
| | | Number
of Shares | | | Fair Value | | | |
Common Stock (REITs) — 94.5% † | | | |
| |
Diversified — 7.3% | | | |
| | | |
Coresite Realty Corp. | | | 18,540 | | | $ | 252,886 | | | |
Cousins Properties Inc. | | | 29,830 | | | | 248,782 | | | |
Vornado Realty Trust | | | 62,960 | | | | 5,246,457 | | | |
| | | | | | | 5,748,125 | | | |
| |
Healthcare — 13.0% | | | |
| | | |
HCP Inc. | | | 64,740 | | | | 2,381,785 | | | |
Healthcare Inc. | | | 50,020 | | | | 2,382,953 | | | |
Nationwide Health Properties Inc. | | | 66,770 | | | | 2,429,093 | | | |
Senior Housing Properties Trust | | | 66,430 | | | | 1,457,474 | | | |
Ventas Inc. | | | 29,900 | | | | 1,569,152 | | | |
| | | | | | | 10,220,457 | | | |
| |
Hotel — 5.9% | | | |
| | | |
Hospitality Properties Trust | | | 32,870 | | | | 757,325 | | | |
Host Hotels & Resorts Inc. | | | 118,030 | | | | 2,109,196 | | | |
LaSalle Hotel Properties | | | 29,400 | | | | 776,160 | | | |
Pebblebrook Hotel Trust | | | 26,740 | | | | 543,357 | | | |
Sunstone Hotel Investors Inc. | | | 40,050 | | | | 413,716 | | | (a) |
| | | | | | | 4,599,754 | | | |
| |
Industrial — 5.2% | | | |
| | | |
AMB Property Corp. | | | 23,580 | | | | 747,722 | | | |
DCT Industrial Trust Inc. | | | 55,231 | | | | 293,277 | | | |
ProLogis | | | 206,940 | | | | 2,988,213 | | | |
| | | | | | | 4,029,212 | | | |
| |
Man. Homes — 0.7% | | | |
| | | |
Equity Lifestyle Properties Inc. | | | 9,710 | | | | 543,080 | | | |
| |
Multifamily — 16.0% | | | |
| | | |
American Campus Communities Inc. | | | 15,180 | | | | 482,117 | | | |
AvalonBay Communities Inc. | | | 13,900 | | | | 1,564,445 | | | |
Camden Property Trust | | | 43,240 | | | | 2,334,095 | | | |
Colonial Properties Trust | | | 27,320 | | | | 493,126 | | | |
Equity Residential | | | 93,930 | | | | 4,879,663 | | | |
Essex Property Trust Inc. | | | 18,910 | | | | 2,159,900 | | | |
UDR Inc. | | | 27,840 | | | | 654,797 | | | |
| | | | | | | 12,568,143 | | | |
| |
Office — 13.7% | | | |
| | | |
Alexandria Real Estate Equities Inc. | | | 16,600 | | | | 1,216,116 | | | |
Boston Properties Inc. | | | 27,280 | | | | 2,348,808 | | | |
Brandywine Realty Trust | | | 71,460 | | | | 832,509 | | | |
CommonWealth | | | 51,560 | | | | 1,315,296 | | | |
Corporate Office Properties Trust | | | 22,240 | | | | 777,288 | | | |
Douglas Emmett Inc. | | | 39,380 | | | | 653,708 | | | |
Kilroy Realty Corp. | | | 30,900 | | | | 1,126,923 | | | (c) |
Parkway Properties Inc. | | | 27,814 | | | | 487,301 | | | |
| | | | | | | | | | |
| | | |
| | | Number
of Shares | | | Fair Value | | | |
| | | |
SL Green Realty Corp. | | | 29,230 | | | $ | 1,973,317 | | | |
| | | | | | | 10,731,266 | | | |
| |
Office/Industrial — 2.1% | | | |
| | | |
Duke Realty Corp. | | | 130,920 | | | | 1,631,263 | | | |
| |
Regional Malls — 14.8% | | | |
| | | |
General Growth Properties Inc. | | | 105,040 | | | | 1,626,019 | | | |
Simon Property Group Inc. | | | 58,580 | | | | 5,828,124 | | | |
Taubman Centers Inc. | | | 15,180 | | | | 766,286 | | | |
The Macerich Co. | | | 71,640 | | | | 3,393,587 | | | |
| | | | | | | 11,614,016 | | | |
| |
Self Storage — 5.4% | | | |
| | | |
Public Storage | | | 35,270 | | | | 3,577,083 | | | |
U-Store-It Trust | | | 64,690 | | | | 616,496 | | | |
| | | | | | | 4,193,579 | | | |
| |
Shopping Centers — 7.7% | | | |
| | | |
Acadia Realty Trust | | | 32,747 | | | | 597,305 | | | |
Federal Realty Investment Trust | | | 15,190 | | | | 1,183,757 | | | |
Kimco Realty Corp. | | | 141,260 | | | | 2,548,330 | | | |
Weingarten Realty Investors | | | 70,722 | | | | 1,680,355 | | | |
| | | | | | | 6,009,747 | | | |
| |
Specialty — 2.7% | | | |
| | | |
Digital Realty Trust Inc. | | | 41,750 | | | | 2,151,795 | | | |
| | | |
Total Common Stock (REIT)
(Cost $59,679,007) | | | | | | | 74,040,437 | | | |
Common Stock — 4.1% | | | |
| |
Hotel — 1.1% | | | |
| | | |
Hyatt Hotels Corp. | | | 18,710 | | | | 856,170 | | | (a) |
| |
Office — 0.7% | | | |
| | | |
Hudson Pacific Properties Inc. (REIT) | | | 36,839 | | | | 554,427 | | | |
| |
Specialty — 2.3% | | | |
| | | |
Crown Castle International Corp. | | | 40,320 | | | | 1,767,226 | | | (a) |
| | | |
Total Common Stock
(Cost $2,904,335) | | | | | | | 3,177,823 | | | |
Other Investments — 0.0%* | | | |
GEI Investment Fund
(Cost $2,974) | | | | | | | 2,825 | | | (d) |
| | | |
Total Investments in Securities
(Cost $62,586,316) | | | | | | | 77,221,085 | | | |
See Notes to Schedule of Investments and Notes to Financial Statements.
6
Real Estate Securities Fund
| | |
| Schedule of Investments | | December 31, 2010 |
| | | | | | | | | | |
| | | |
| | | | | | Fair Value | | | |
Short-Term Investments — 0.4% | | | |
GE Money Market Fund Institutional Class 0.00%
(Cost $315,849) | | | | | | $ | 315,849 | | | (b,d) |
| | | |
Total Investments
(Cost $62,902,165) | | | | | | | 77,536,934 | | | |
| | | |
Other Assets and Liabilities,
net — 1.0% | | | | | | | 788,828 | | | |
| | | | | | | | | | |
| | | |
NET ASSETS — 100.0% | | | | | | $ | 78,325,762 | | | |
| | | | | | | | | | |
See Notes to Schedule of Investments and Notes to Financial Statements.
7
| | |
| Notes to Schedule of Investments | | December 31, 2010 |
The views expressed in this document reflect our judgment as of the publication date and are subject to change at any time without notice. The securities information regarding holdings, allocations and other characteristics are presented as of a particular date to illustrate examples of securities that the Fund has bought and the diversity of areas in which the Fund may invest as of a particular date. It may not be representative of the Fund’s current or future investments and should not be construed as a recommendation to purchase or sell a particular security. See the prospectus for complete descriptions of investment objectives, policies, risks and permissible investments
| (a) | Non-income producing security. |
| (b) | Coupon amount represents effective yield. |
| (c) | At December 31, 2010 , all or a portion of this security was pledged to cover collateral requirements for futures, options, forward foreign currency contracts and/or TBA’s. |
| (d) | GE Asset Management, the investment adviser of the Fund, also serves as investment adviser of the GEI Investment Fund and the GE Funds-GE Money Market Fund. |
| † | Percentages are based on net assets as of December 31, 2010 . |
Abbreviations:
| | |
REIT | | Real Estate Investment Trust |
8
Financial Highlights
Selected data based on a share outstanding throughout the fiscal years indicated
| | | | | | | | | | | | | | | | | | | | | | | | | | | | | | | | | | | | |
| | | CLASS 1 | | | | | | CLASS 4 | |
| | | 12/31/10 | | | 12/31/09 | | | 12/31/08 | | | 12/31/07 | | | 12/31/06 | | | | | | 12/31/10 | | | 12/31/09 | | | 12/31/08 | |
| Inception date | | | — | | | | — | | | | — | | | | — | | | | 5/1/95 | | | | | | | | — | | | | — | | | | 5/1/08 | |
Net asset value, beginning of period | | | $ 8.41 | | | | $6.46 | | | | $10.87 | | | | $21.49 | | | | $19.20 | | | | | | | | $ 8.41 | | | | $6.47 | | | | $12.15 | |
Income/(loss) from investment operations: | | | | | | | | | | | | | | | | | | | | | | | | | | | | | | | | | | | | |
Net investment income (loss) | | | 0.19 | ** | | | 1.03 | | | | 1.11 | | | | 0.72 | | | | 0.65 | | | | | | | | 0.15 | ** | | | 0.29 | | | | 0.39 | ** |
Net realized and unrealized gains/(losses) on investments | | | 2.24 | | | | 1.29 | | | | (5.05) | | | | (3.87) | | | | 5.68 | | | | | | | | 2.23 | | | | 1.99 | | | | (5.63) | |
Total income/(loss) from investment operations | | | 2.43 | | | | 2.32 | | | | (3.94) | | | | (3.15) | | | | 6.33 | | | | | | | | 2.38 | | | | 2.28 | | | | (5.24) | |
Less distributions from: | | | | | | | | | | | | | | | | | | | | | | | | | | | | | | | | | | | | |
Net investment income | | | 0.16 | | | | 0.22 | | | | 0.28 | | | | 0.73 | | | | 0.48 | | | | | | | | 0.12 | | | | 0.19 | | | | 0.25 | |
Return of capital | | | — | | | | 0.15 | | | | 0.19 | | | | 0.02 | | | | — | | | | | | | | — | | | | 0.15 | | | | 0.19 | |
Net realized gains | | | — | | | | — | | | | — | | | | 6.72 | | | | 3.56 | | | | | | | | — | | | | — | | | | — | |
Total distributions | | | 0.16 | | | | 0.37 | | | | 0.47 | | | | 7.47 | | | | 4.04 | | | | | | | | 0.12 | | | | 0.34 | | | | 0.44 | |
Net asset value, end of period | | | $10.68 | | | | $8.41 | | | | $ 6.46 | | | | $10.87 | | | | $21.49 | | | | | | | | $10.67 | | | | $8.41 | | | | $ 6.47 | |
TOTAL RETURN(a) | | | 28.94% | | | | 35.77% | | | | (36.03)% | | | | (14.86)% | | | | 33.03% | | | | | | | | 28.31% | | | | 35.14% | | | | (42.99)% | |
| | | | | | | | | |
RATIOS/SUPPLEMENTAL DATA: | | | | | | | | | | | | | | | | | | | | | | | | | | | | | | | | | | | | |
Net assets, end of period
(in thousands) | | | $78,316 | | | | $70,574 | | | | $59,969 | | | | $96,650 | | | | $178,317 | | | | | | | | $10 | | | | $8 | | | | $6 | |
Ratios to average net assets: | | | | | | | | | | | | | | | | | | | | | | | | | | | | | | | | | | | | |
Net investment income | | | 1.97% | | | | 4.75% | | | | 4.67% | | | | 2.59% | | | | 3.08% | | | | | | | | 1.52% | | | | 4.26% | | | | 4.67% | * |
Net Expenses | | | 0.92% | (b) | | | 1.04% | (b) | | | 0.95% | (b) | | | 0.90% | | | | 0.88% | | | | | | | | 1.36% | (b) | | | 1.49% | (b) | | | 1.40% | (b)* |
Gross Expenses | | | 0.93% | | | | 1.04% | | | | 0.95% | | | | 0.90% | | | | 0.88% | | | | | | | | 1.37% | | | | 1.49% | | | | 1.40% | |
Portfolio turnover rate | | | 113% | | | | 105% | | | | 121% | | | | 106% | | | | 92% | | | | | | | | 113% | | | | 105% | | | | 121% | |
Notes to Financial Highlights
| (a) | Total returns are historical and assume changes in share price, reinvestment of dividends and capital gains distributions and do not include the effect of insurance contract charges. Past performance does not guarantee future results. |
| (b) | Reflects GE Asset Management’s waiver of a portion of the Fund’s management fee in an amount equal to the management fee earned by GEAM with respect to the Fund’s investment in the GE Funds – GE Money Market. |
| * | Annualized for periods less than one year. |
| ** | Per share values have been calculated using the average share method. |
The accompanying Notes are an integral part of these financial statements.
9
| | | | |
Statements of Assets and Liabilities December 31, 2010 | | | |
| |
ASSETS | | | | |
Investments in securities, at fair value (cost $62,583,342) | | | $77,218,260 | |
Investments in affiliated securities, at fair value (cost $2,974) | | | 2,825 | |
Short-term affiliated investments (at amortized cost) | | | 315,849 | |
Receivable for investments sold | | | 1,172,024 | |
Income receivables | | | 279,064 | |
Receivable for fund shares sold | | | 2,538 | |
Total Assets | | | 78,990,560 | |
| |
LIABILITIES | | | | |
Payable for investments purchased | | | 390,855 | |
Payable for fund shares redeemed | | | 117,333 | |
Payable to GEAM | | | 24,719 | |
Accrued other expenses | | | 131,891 | |
Total Liabilities | | | 664,798 | |
NET ASSETS | | | $78,325,762 | |
| |
NET ASSETS CONSIST OF : | | | | |
Capital paid in | | | 88,959,098 | |
Undistributed (distribution in excess of) net investment income | | | 101,232 | |
Accumulated net realized gain (loss) | | | (25,369,337 | ) |
Net unrealized appreciation/(depreciation) on: | | | | |
Investments | | | 14,634,769 | |
NET ASSETS | | | $78,325,762 | |
| |
Class 1: | | | | |
| |
NET ASSETS | | | 78,315,873 | |
Shares outstanding ($0.01 par value; unlimited shares authorized) | | | 7,335,489 | |
Net asset value per share | | | $10.68 | |
| |
Class 4: | | | | |
| |
NET ASSETS | | | 9,889 | |
Shares outstanding ($0.01 par value; unlimited shares authorized) | | | 927 | |
Net asset value per share | | | $10.67 | |
The accompanying Notes are an integral part of these financial statements.
10
| | | | |
Statement of Operations For the year ending December 31, 2010 | | | |
| |
INVESTMENT INCOME | | | | |
Income: | | | | |
Dividends | | $ | 1,927,012 | |
Interest | | | 13,680 | |
Interest from affiliated investments | | | 388 | |
Total Income | | | 1,941,080 | |
| |
Expenses: | | | | |
Advisory and administrative fees | | | 570,411 | |
Transfer agent | | | 13,014 | |
Directors’ fees | | | 1,918 | |
Custody and accounting expenses | | | 11,035 | |
Professional fees | | | 11,444 | |
Other expenses | | | 14,268 | |
Total expenses before waiver and reimbursement | | | 622,090 | |
Less: Expenses reimbursed by the adviser | | | (3,209 | ) |
Net expenses | | | 618,881 | |
Net investment income (loss) | | | 1,322,199 | |
| |
NET REALIZED AND UNREALIZED GAIN (LOSS)
ON INVESTMENTS | | | | |
| |
Realized gain (loss) on: | | | | |
Investments | | | 14,828,808 | |
| |
Increase (decrease) in unrealized appreciation/(depreciation) on: | | | | |
Investments | | | 389,924 | |
Net realized and unrealized gain (loss) on investments | | | 15,218,732 | |
Net increase (decrease) in net assets resulting from operations | | $ | 16,540,931 | |
The accompanying Notes are an integral part of these financial statements.
11
| | | | | | | | |
Statement of
Changes in Net Assets | | | |
| | | Year Ended
December 31,
2010 | | | Year Ended
December 31,
2009 | |
| | |
INCREASE (DECREASE) IN NET ASSETS | | | | | | | | |
Operations: | | | | | | | | |
Net investments income | | $ | 1,322,199 | | | $ | 2,241,130 | |
Net realized gain (loss) on investments | | | 14,828,808 | | | | (17,741,885 | ) |
Net increase (decrease) in unrealized appreciation/(depreciation) on investments | | | 389,924 | | | | 35,228,868 | |
Net increase (decrease) from operations | | | 16,540,931 | | | | 19,728,113 | |
Distributions to shareholders from: | | | | | | | | |
Net investment income | | | | | | | | |
Class 1 | | | (1,190,859 | ) | | | (2,058,561 | ) |
Class 4 | | | (111 | ) | | | (208 | ) |
Return of Capital | | | | | | | | |
Class 1 | | | — | | | | (895,120 | ) |
Class 4 | | | — | | | | (91 | ) |
Total distributions | | | (1,190,970 | ) | | | (2,953,980 | ) |
Increase (decrease) in net assets from operations and distributions | | | 15,349,961 | | | | 16,774,133 | |
Share transactions : | | | | | | | | |
Proceeds from sale of shares | | | | | | | | |
Class 1 | | | 19,664,699 | | | | 4,568,082 | |
Class 4 | | | — | | | | — | |
Value of distributions reinvested | | | | | | | | |
Class 1 | | | 1,190,859 | | | | 2,953,681 | |
Class 4 | | | 111 | | | | 299 | |
Cost of shares redeemed | | | | | | | | |
Class 1 | | | (28,461,964 | ) | | | (13,688,696 | ) |
Class 4 | | | — | | | | — | |
Net increase (decrease) from share transactions | | | (7,606,295 | ) | | | (6,166,634 | ) |
Total increase (decrease) in net assets | | | 7,743,666 | | | | 10,607,499 | |
| | |
NET ASSETS | | | | | | | | |
Beginning of period | | | 70,582,096 | | | | 59,974,597 | |
End of period | | $ | 78,325,762 | | | $ | 70,582,096 | |
Undistributed (distribution in excess of) net investment income, end of period | | $ | 101,232 | | | $ | 145,577 | |
| | |
CHANGES IN FUND SHARES | | | | | | | | |
| | |
Class 1 | | | | | | | | |
Shares sold | | | 2,129,665 | | | | 847,735 | |
Issued for distributions reinvested | | | 111,504 | | | | 345,053 | |
Shares redeemed | | | (3,294,055 | ) | | | (2,086,754 | ) |
Net increase (decrease) in fund shares | | | (1,052,886 | ) | | | (893,966 | ) |
| | |
Class 4 | | | | | | | | |
Shares sold | | | — | | | | — | |
Issued for distributions reinvested | | | 10 | | | | 35 | |
Shares redeemed | | | — | | | | — | |
Net increase (decrease) in fund shares | | | 10 | | | | 35 | |
The accompanying Notes are an integral part of these financial statements.
12
| | |
| Notes to Financial Statements | | December 31, 2010 |
| 1. | Organization of the Company |
GE Investments Funds, Inc. (the “Company”) was incorporated under the laws of the Commonwealth of Virginia on May 14, 1984 and is registered under the Investment Company Act of 1940, as amended (the “1940 Act”), as an open-end management investment company. The Company is composed of fourteen investment portfolios (collectively the “Funds”), although only the following eleven are currently being offered: U.S. Equity Fund, S&P 500 Index Fund, Premier Growth Equity Fund, Core Value Equity Fund, Mid-Cap Equity Fund, Small-Cap Equity Fund, International Equity Fund, Total Return Fund, Income Fund, Money Market Fund and Real Estate Securities Fund (the “Fund”).
Shares of the Funds of the Company are offered only to insurance company separate accounts that fund certain variable life insurance contracts and variable annuity contracts. GE Asset Management Incorporated (“GEAM”) is the investment adviser and administrator of each of the Funds.
The Company offers two share classes (Class 1 and Class 4) of the Fund. Class 4 shares were first offered on May 1, 2008, and Fund shares outstanding prior to May 1, 2008 were designated as Class 1 shares. Each share class has different fees and expenses, and as a result, each share class will have different share price and performance. Not all variable contracts offer both share classes of the Fund.
| 2. | Summary of Significant Accounting Policies |
The preparation of financial statements in conformity with U.S. generally accepted accounting principles (GAAP) requires management to make estimates and assumptions that affect the reported amounts of assets and liabilities and disclosure of contingent assets and liabilities at the date of the financial statements and the reported amounts of increases and decreases in net assets from operations during the reporting period. Actual results may differ from those estimates.
Subsequent events after the balance sheet date through the date the financial statements were issued, have been evaluated in the preparation of the financial statements. There are no items to report.
The following summarizes the significant accounting policies of the Company.
Securities Valuation and Transactions. All investments in securities are recorded at their estimated fair value, as described in Note 3.
Securities transactions are accounted for as of the trade date. Realized gains and losses on investments sold are recorded on the basis of identified cost for both financial statement and federal tax purposes.
The Fund’s income, expenses (other than distribution fees) and realized and unrealized gains and losses are allocated proportionally each day among the share classes based upon the relative net assets of each class.
Real Estate Investment Trusts Dividend income, attributable to real estate investment trusts (“REITs”), is recorded based on management’s estimate of the income included in the distributions received. Distributions received in excess of this amount are recorded as a reduction of the cost of the investments. The actual amounts of income and return of capital are determined by each REIT only after its fiscal year-end and may differ from the estimated amounts.
Investment Income Corporate actions (including cash dividends) are recorded on the ex-dividend date, net of applicable withholding taxes, except for certain foreign corporate actions which are recorded as soon after ex-dividend date as such information becomes available. Interest income is recorded on the accrual basis.
Accretion of discounts and amortization of premiums on taxable bonds are to the call or maturity date, whichever is shorter, using the effective yield method. Withholding taxes in foreign dividends have been provided for in accordance with the Fund’s understanding of the applicable country’s tax rules and rates.
Expenses Fund specific expenses are allocated to the Fund that incurs such expense and pro rata across share classes. Expenses, other than those incurred by a specific Fund, are allocated pro rata among Funds and share classes. Such expenses may include custodial fees, legal and accounting fees, printing costs and registration fees. All expenses of the Fund are paid by GEAM and reimbursed by the Fund. Certain class specific expenses (such as transfer agency fees or distribution fees) are allocated to the class that incurs such expense.
Federal Income Taxes The Fund intends to comply with all sections of the Internal Revenue Code applicable to regulated investment companies including the distribution of substantially all of its taxable net investment income and
13
| | |
| Notes to Financial Statements | | December 31, 2010 |
net realized capital gains to its shareholders. Therefore, no provision for federal income tax has been made. Each Fund is treated as a separate taxpayer for federal income tax purposes.
The Fund utilizes various methods to measure the fair value of most of its investments on a recurring basis. GAAP establishes a framework for measuring fair value and providing related disclosures. Broadly, the framework requires fair value to be determined based on the exchange price that would be received for an asset or paid to transfer a liability (an exit price) in the principal or most advantageous market for the asset or liability in an orderly transaction between market participants at the measurement date. In the absence of active markets for the identical assets or liabilities, such measurements involve developing assumptions based on market observable data and, in the absence of such data, internal information that is consistent with what market participants would use in a hypothetical transaction that occurs at the measurement date. It also establishes a three-level valuation hierarchy based upon observable and non-observable inputs.
Observable inputs reflect market data obtained from independent sources, while unobservable inputs reflect our market assumptions. Preference is given to observable inputs. These two types of inputs create the following fair value hierarchy:
Level 1 — Quoted prices for identical investments in active markets.
Level 2 — Quoted prices for similar investments in active markets; quoted prices for identical or similar investments in markets that are not active; and model-derived valuations whose inputs are observable or whose significant value drivers are observable.
Level 3 — Significant inputs to the valuation model are unobservable.
Policies and procedures are maintained to value investments using the best and most relevant data available. In addition, pricing vendors are utilized to assist in valuing investments. GEAM performs periodic reviews of the methodologies used by independent pricing services including price validation of individual securities.
Fair Value Measurement The following section describes the valuation methodologies the Fund use to measure different financial investments at fair value.
A Fund’s portfolio securities are valued generally on the basis of market quotations. Equity securities generally are valued at the last reported sale price on the primary market in which they are traded. Portfolio securities listed on NASDAQ are valued using the NASDAQ Official Closing Price. Level 1 securities primarily include publicly-traded equity securities which may not necessarily represent the last sale price. If no sales occurred on the exchange or NASDAQ that day, the portfolio security generally is valued using the last reported bid price. In those circumstances the Fund classifies the investment securities in Level 2.
Debt securities (other than short-term securities described below) generally are valued at an evaluated bid as reported by an independent pricing service. Municipal obligations are valued at the quoted bid prices, when available. The pricing vendor uses various pricing models for each asset class that are consistent with what other market participants would use. The inputs and assumptions to the model of the pricing vendor are derived from market observable sources including: benchmark yields, reported trades, broker/dealer quotes, issuer spreads, benchmark securities, bids, offers, and other market related data. Since many fixed income securities do not trade on a daily basis, the methodology of the pricing vendor uses available information as applicable such as benchmark curves, benchmarking of like securities, sector groupings, and matrix pricing. The pricing vendor considers all available market observable inputs in determining the evaluation for a security. Thus, certain securities may not be priced using quoted prices, but rather determined from market observable information. These investments are included in Level 2 and primarily comprise our portfolio of corporate fixed income, government, mortgage and asset-backed securities.
In the absence of a reliable price from such a pricing service, debt securities may be valued based on dealer supplied valuations or quotations. In these infrequent circumstances, pricing vendors may provide the Funds with valuations that are based on significant unobservable inputs, and in those circumstances we classify the investment securities in Level 3.
The Fund uses non-binding broker quotes as the primary basis for valuation when there is limited, or no, relevant market activity for a specific investment or for other investments that share similar characteristics. The Fund has not adjusted the prices obtained. Investment securities priced using non-binding broker quotes are included in Level 3. As is the case with the primary pricing
14
| | |
| Notes to Financial Statements | | December 31, 2010 |
vendor, third-party brokers do not provide access to their proprietary valuation models, inputs and assumptions. Accordingly, GEAM conducts internal reviews of pricing for all such investment securities periodically to ensure reasonableness of valuations used in the Fund’s financial statements. These reviews are designed to identify prices that appear stale, those that have changed significantly from prior valuations, and other anomalies that may indicate that a price may not be accurate. Based on the information available, GEAM believes that the fair values provided by the brokers are representative of prices that would be received to sell the assets at the measurement date (exit prices).
The short-term securities of sufficient credit quality held by the Fund with remaining maturities of sixty days or less at the time of purchase are valued on the basis of amortized cost which approximates market value and these are included in Level 2.
If prices are not readily available for a portfolio security, or if it is believed that a price for a portfolio security does not represent its fair value, the security may be valued using procedures approved by the Fund’s Board of Directors that are designed to establish its “fair” value. These securities would be classified in Level 3. Those procedures require that the fair value of a security be established by the valuation committee. The valuation committee follows different protocols for different types of investments and circumstances. The fair value procedures may be used to value any investment of any Fund in the appropriate circumstances.
Portfolio securities may be valued using techniques other than market quotations, under the circumstances described above. The value established for a portfolio security may be different than what would be produced through the use of another methodology or if it had been priced using market quotations. Portfolio securities that are valued using techniques other than market quotations, including “fair valued” securities, may be subject to greater fluctuation in their value from one day to the next than would be the case if market quotations were used. In addition, there is no assurance that the Fund could sell a portfolio security for the value established for it at any time and it is possible that the Fund would incur a loss because a portfolio security is sold at a discount to its established value.
The inputs or methodology used for valuing securities are not an indication of the risk associated with investing in those securities. Fair value determinations are required for securities whose value is affected by a significant event that will materially affect the value of a domestic or foreign security and which occurs subsequent to the time of the close of the principal market on which such domestic or foreign security trades but prior to the calculation of the Fund’s NAV.
The following table presents the Fund’s investments measured at fair value on a recurring basis at December 31, 2010:
| | | | | | | | | | | | | | | | |
| Investments | | Level 1 | | | Level 2 | | | Level 3 | | | Total | |
Investments in Securities | | | | | | | | | | | | | | | | |
Common Stock | | $ | 77,218,260 | | | $ | — | | | $ | — | | | $ | 77,218,260 | |
Other Investments | | | — | | | | 2,825 | | | | — | | | | 2,825 | |
Short-Term Investments | | | 315,849 | | | | — | | | | — | | | | 315,849 | |
Total Investments in Securities | | $ | 77,534,109 | | | $ | 2,825 | | | $ | — | | | $ | 77,536,934 | |
The Company shares a revolving credit facility of up to $150 million with a number of its affiliates. The credit facility is with its custodian bank, State Street Bank and Trust Company (“State Street”). The revolving credit facility requires the payment of a commitment fee equal to 0.125% per annum on the daily unused portion of the credit facility, payable quarterly. The portion borne by the Funds generally is borne proportionally based upon net assets. In
addition, the Company has a $100 million uncommitted, unsecured line of credit with State Street. Generally, borrowings under the credit facilities would accrue interest at the Federal Funds Rate plus 50 basis points and would be borne by the borrowing Fund. The maximum amount allowed to be borrowed by any one Fund is the lesser of (i)33.33% of the Fund’s assets or (ii) 20% of its net assets. The credit facilities were not utilized by the Fund during the fiscal year ended December 31, 2010.
15
| | |
| Notes to Financial Statements | | December 31, 2010 |
| 5. | Compensation and Fees Paid to Affiliates |
GEAM, a registered investment adviser, was retained by the Company’s Board of Directors effective May 1, 1997 to act as investment adviser and administrator of the Fund. GEAM’s compensation for investment advisory and administrative services is paid monthly based on the average daily net assets of the Fund. The advisory and administrative fee is stated in the following schedule:
| | |
| Average Daily Net Assets of Fund | | Advisory and
Administration
Fees |
| First $100 million | | 0.85% |
| Next $100 million | | 0.80% |
| Over $200 million | | 0.75% |
GEAM waives a portion of the Fund’s management fee in the amount equal to the management fee earned by GEAM with respect to the Funds investment in the GE Funds – GE Money Market Fund.
Distribution and Service (12b-1) Fees The Company has adopted a Distribution and Service (12b-1) Plan (the “Plan”) pursuant to Rule 12b-1 under the 1940 Act with respect to Class 4 shares of the Fund. Under the Plan, the Fund may compensate GE Investment Distributors, Inc. (“GEID”), a wholly-owned subsidiary of GEAM and the Fund’s principal distributor, for certain sales services provided by GEID or other broker dealers and investor services provided by GEID or other service providers relating to the Fund’s Class 4 shares, including services to owners or prospective owners of variable contracts issued by insurance companies that offer such share class as an investment option. The amount of compensation paid under the Plan by the Fund’s Class 4 shares may not exceed 0.45% of the average daily net assets of the Fund attributable to such share class. The Plan continues in effect from year to year for so long as such continuance is approved annually by the Board of Directors, including by those directors who are not interested persons of the Company and who have no direct or indirect financial interest in the operation of the Plan or in any agreement related to it.
Directors’ Compensation The Fund pays no compensation to its directors who are officers or employees of GEAM or its affiliates. Directors who are not such officers or employees also serve in a similar capacity for other funds advised by GEAM. Compensation paid to unaffiliated directors are
reflected on the Statement of Operations. These fees are allocated pro rata across all of the mutual fund platforms and share classes served by the directors, including the Fund, and are based upon the relative net assets of each fund within such platforms.
Pursuant to an investment sub-advisory agreement with GEAM, Urdang Securities Management, Inc. (“Urdang”) is the Sub-Adviser to the Fund. Urdang is responsible for the day-to-day portfolio management of the assets of the Fund, including the responsibility for making decisions to buy, sell or hold a particular security, under the general supervision of GEAM and the Board.
For their services, GEAM pays Urdang monthly sub-advisory fees which are calculated as a percentage of the average daily net assets of the Fund.
| 7. | Investment Transactions |
Purchases and Sales of Securities The cost of purchases and the proceeds from sales of investments, other than short-term securities and short-term options, for the year ended December 31, 2010 were as follows:
| | |
| Non U.S. Gov’t Securities |
| Purchases | | Sales |
| $74,647,714 | | $81,020,551 |
The Fund is subject to ASC 740, Income Taxes. ASC 740 provides guidance for financial accounting and reporting for the effects of income taxes that result from an entity’s activities during the year. ASC 740 also provides guidance regarding how certain tax positions should be recognized, measured, presented and disclosed in the financial statements. ASC 740 requires evaluation of tax positions taken or expected to be taken in the course of preparing the Fund’s tax returns to determine whether the tax positions are “more likely than not” of being sustained by the applicable tax authority. There are no adjustments to the Funds’ net assets required under ASC 740. The Fund’s 2007, 2008, 2009 and 2010 fiscal years tax returns are still open to examination by the Federal and applicable state tax authorities.
16
| | |
| Notes to Financial Statements | | December 31, 2010 |
At December 31, 2010, information on the tax cost of investments is as follows:
| | | | | | | | | | | | |
Cost for
Tax Purposes | | Gross Tax
Unrealized Apprec. | | Gross Tax
Unrealized Deprec. | | Net Tax Apprec/(Deprec) | | Undistributed
Income | | Undistributed
(Accumulated
Capital Loss) | | Post October
Losses (see Detail Below) |
| $71,337,437 | | $14,356,237 | | ($8,156,740) | | $6,199,497 | | $113,442 | | ($16,946,275) | | $— |
As of December 31, 2010, the Fund has capital loss carryovers, as indicated below. Capital loss carryovers are available to offset future realized capital gains to the extent provided in the Internal Revenue Code and regulations thereunder. To the extent that these carryover losses are used to offset future capital gains, it is probable that the gains so offset will not be distributed to shareholders because they would be taxable as ordinary income.
During the year ended December 31, 2010, the Fund utilized $15,410,139 of prior year capital loss carryovers.
| | |
| Amount | | Expires |
$16,946,275 | | 12/31/2017 |
These amounts will be available to offset future taxable capital gains. Under the recently enacted Regulated Investment Company Modernization Act of 2010, the Fund will be permitted to carry forward capital losses incurred in taxable years beginning after December 22, 2010 for an unlimited period. However, any losses incurred during those future years will be required to be utilized prior to the losses incurred in pre-enactment tax years. As a result of this ordering rule, pre-enactment capital loss carryforwards may be more likely to expire unused. Additionally, post-enactment capital losses that are carried forward will retain their character as either short-term or long-term capital losses rather than being considered all short-term as under previous law.
Any net capital and currency losses incurred after October 31, within the Fund’s tax year, are deemed to arise on the first day of the Fund’s next tax year if the Fund so elects to defer such losses.
The Fund did not defer any post-October losses for the year ended December 31, 2010.
The tax composition of distributions paid during the years ended December 31, 2010 and December 31, 2009 were as follows:
| | | | | | | | | | | | | | | | |
| | | Ordinary
Income | | | Long-Term
Capital
Gains | | | Return of
Capital | | | Total | |
| 2010 | | $ | 1,190,970 | | | $ | — | | | $ | — | | | $ | 1,190,970 | |
| 2009 | | $ | 2,058,769 | | | $ | — | | | $ | 895,211 | | | $ | 2,953,980 | |
Distributions to Shareholders The Fund declares and pays any dividends from net investment income annually. The Fund declares and pays any net realized capital gains in excess of capital loss carryforwards distributions annually. The character of income and gains to be distributed is determined in accordance with income tax regulations which may differ from generally accepted accounting principles. These differences include (but are not limited to) distributions from Real Estate Investment Trusts (REITS), and losses deferred due to wash sale transactions. Reclassifications due to permanent book/tax differences are made to the Fund’s capital accounts to reflect income and gains available for distribution (or available capital loss carryovers) under income tax regulations. These reclassifications have no impact on net investment income, realized gains or losses, or the net asset value of the Fund. The calculation of net investment income per share in the Financial Highlights table excludes these adjustments.
The reclassifications for the year ended December 31, 2010 were as follows:
| | | | |
Undistributed
Net Investment
Income | | Accumulated
Net Realized Gain | | Paid in
Capital |
| $(175,573) | | $573,079 | | $(397,506) |
17
Report of Independent Registered Public Accounting Firm
The Shareholders and Board of Directors
GE Investments Funds, Inc.
We have audited the accompanying statement of assets and liabilities, including the schedule of investments, of the Real Estate Securities Fund, a series of GE Investments Funds, Inc., as of December 31, 2010, and the related statement of operations for the year then ended, statements of changes in net assets for each of the years in the two-year period then ended, and the financial highlights for each of the years or periods in the five-year period then ended. These financial statements and financial highlights are the responsibility of the Fund’s management. Our responsibility is to express an opinion on these financial statements and financial highlights based on our audits.
We conducted our audits in accordance with the standards of the Public Company Accounting Oversight Board (United States). Those standards require that we plan and perform the audit to obtain reasonable assurance about whether the financial statements and financial highlights are free of material misstatement. An audit includes examining, on a test basis, evidence supporting the amounts and disclosures in the financial statements. Our procedures included confirmation of securities owned as of December 31, 2010 by correspondence with the custodian and brokers, or by other appropriate auditing procedures where replies from brokers were not received. An audit also includes assessing the accounting principles used and significant estimates made by management, as well as evaluating the overall financial statement presentation. We believe that our audits provide a reasonable basis for our opinion.
In our opinion, the financial statements and financial highlights referred to above present fairly, in all material respects, the financial position of the Real Estate Securities Fund as of December 31, 2010, the results of its operations, changes in its net assets and financial highlights for each of the years or periods described above, in conformity with U.S. generally accepted accounting principles.

Boston, Massachusetts
February 25, 2011
18
| | |
| Advisory and Administrative Agreement Renewal | | (unaudited) |
The Board of Directors of the GE Investments Funds, Inc. (the “Board”), including the independent Board members, considered and all those that were present unanimously approved the continuance of the Fund’s Investment Advisory and Administration Agreement with GE Asset Management Incorporated (“GEAM”) and the Investment Sub-Advisory Agreement with the Fund’s sub-adviser, Urdang Securities Management, Inc. (“Urdang”), at meetings held on December 3 and December 10, 2010.
In considering whether to approve the Fund’s investment advisory and sub-advisory agreements, the Board members considered and discussed a substantial amount of information and analysis provided, at the Board’s request, by GEAM and Urdang. The Board members also considered detailed information regarding performance and expenses of other investment companies, including those with similar investment strategies and sizes, which was prepared by independent third party provider Morningstar, Inc. (“Morningstar”). The Board members noted that GEAM does not manage any other mutual funds or investment products that employ the same investment strategy as the Fund. The Board had the opportunity to ask questions and request additional information in connection with its considerations.
Before approving the Fund’s advisory and sub-advisory agreements, the Board members reviewed the information provided with management of GEAM and with independent legal counsel. The Board members also reviewed a memorandum prepared by independent legal counsel discussing the legal standards for the consideration of the proposed continuances. The independent Board members discussed the proposed continuances in detail during a private session with their independent legal counsel at which no representatives of GEAM or Urdang were present. The independent Board members and their independent legal counsel requested, and received and considered, additional information from GEAM following these sessions.
In advance of the meetings, and in response to their request, the Board members received from GEAM written responses to their inquiries, which included substantial exhibits and other materials related to GEAM’s business and the services it provides to the Fund. Also in advance of the meetings, the Board members received from Urdang a written response to a letter of inquiry prepared by GEAM at the Board’s request, which included substantial exhibits and other materials related to the business of, and services provided by, Urdang. The Board members took into
account their multi-year experience as Board members and particularly their consideration of these types of agreements in recent years. The information was presented in a manner to facilitate comparison to prior periods and to reflect certain enhancements. To focus their review, the Board members asked GEAM management and Urdang, in their oral presentations, to highlight material differences from the information presented in recent years.
During the meetings, the Board members had an opportunity to discuss this information with GEAM managers, including senior executives, representatives from the legal, compliance and finance departments, and investment personnel. The Board members also had an opportunity to hear presentations by representatives of Urdang. The Board members posed questions to these representatives and engaged in substantive discussions with them concerning each of their investment processes.
In reaching their determinations relating to continuance of the Fund’s investment advisory and sub-advisory agreements, the Board members considered all factors that they deemed relevant, including the factors discussed below. In their deliberations, the Board members did not identify any particular information that was all-important or controlling, and each Board member may have attributed different weights to the various factors. In particular, the Board members focused on the following:
The Nature, Extent And Quality Of Services Provided.
The Board members reviewed the services provided by GEAM and Urdang, taking into account their extensive past experiences with GEAM and their multi-year experience with Urdang. In connection with their consideration of GEAM’s services, they focused on the favorable attributes of GEAM, including (i) an investment philosophy oriented toward long-term performance; (ii) effective processes used for overseeing sub-advisers; (iii) effective processes used for providing Fund administration, including controllership and compliance functions and oversight of the performance of other companies that provide services to the Fund; (iv) highly skilled professionals including analysts, research professionals, traders and portfolio managers with a depth of experience relevant to the Fund; (v) access to significant technological resources from which the Fund may benefit; and (vi) a favorable history and reputation. The Board members noted that the Fund represents only a small portion of the assets managed by GEAM, but benefits from a full array of services and resources provided by GEAM.
19
| | |
| Advisory and Administrative Agreement Renewal | | (unaudited) |
In connection with their consideration of the services provided by Urdang, the Board members focused on Urdang’s favorable attributes relating to its investment philosophy and discipline, experienced investment and trading personnel, systems and other resources, including research capabilities, and favorable history and reputation.
In light of the foregoing, the Board, including the independent Board members, concluded that the services provided by GEAM and Urdang continue to be satisfactory.
Investment Performance Of The Fund and the Sub-Adviser.
The Board members considered the investment performance of the Fund for various periods. The Board members reviewed detailed comparisons of the performance of the Fund with the relevant securities index and peer groupings of mutual funds prepared by Morningstar with respect to various periods. The Board members engaged in detailed discussions with GEAM management and representatives of Urdang about each of their investment processes and performance results. These discussions focused on the Fund’s investment objective, the number and experience of portfolio management and supporting research personnel, the investment style and approach employed and the likely market cycles for the investment style.
The Board, including the independent Board members, concluded that the Fund’s performance was acceptable overall taking into consideration the factors discussed above.
Cost Of The Services Provided And Profits Realized From The Relationship With The Fund.
The Board members considered the fees paid to GEAM by the Fund, as well as those paid to Urdang by GEAM, and the cost of the services provided to the Fund by GEAM and Urdang . The Board members reviewed the information they had requested from GEAM and Urdang concerning their profitability. The Board members considered the profit margin information for GEAM’s investment company business as a whole, as well as GEAM’s profitability data for the Fund. The Board members reviewed GEAM’s assumptions and the methods of cost allocation used by GEAM in preparing Fund-specific profitability data. The Board members also discussed with GEAM the basis for its belief that the methods of allocation used were reasonable for each area of its business. The Board members also reviewed the assumptions and cost allocation methods used by Urdang in preparing its profitability data.
Information was presented regarding the financial condition of GEAM and Urdang for various past periods. The Board members noted and discussed the additional services provided by GEAM to the Fund compared to other investment products managed by GEAM, and noted the fact that GEAM, and not the Fund, pays the sub-advisory fees to Urdang. The Board members previously had been provided a study conducted by the Investment Company Institute that discusses and compares advisory fees and services for mutual funds and institutional separate accounts. The Board members determined that GEAM and Urdang should be entitled to earn a reasonable level of profits for the services they provide to the Fund. The Board members also recognized that GEAM had made significant investments in its business and had not fully recovered the sums invested. The Board also considered that GEAM continues to make a substantial investment in fulfilling its obligations to the Fund and supporting its Fund-related activities.
Based on their review, the Board, including the independent Board members, concluded that they were satisfied that the level of profitability achieved by GEAM and Urdang from their relationship with the Fund was not unreasonable or excessive.
The Extent To Which Economies Of Scale Would Be Realized As The Fund Grows And Whether Fee Levels Would Reflect Such Economies Of Scale.
Although the Board noted that the Fund did not experience significant growth in assets over the past year, the Board members considered the extent to which economies of scale would be realized as the Fund grows, and whether fee levels reflect these economies of scale for the benefit of Fund investors.
The Board members considered the substantial infrastructure investments that GEAM has made with respect to its operations and its commitment to continue investing resources to enhance services to Fund shareholders. The Board members recognized the benefits to the Fund of GEAM’s past investment in its operations through the expenditure of sums to support its substantial infrastructure, and that, with respect to all GEAM managed mutual funds, GEAM has not yet fully recouped that investment. The Board members reviewed the applicable advisory fee breakpoints for the Fund. They recognized the economies of scale benefits that would be derived by the Fund as a result of the breakpoint fee structure in the event
20
| | |
| Advisory and Administrative Agreement Renewal | | (unaudited) |
that average daily net assets exceed $100 million. The Board members also recognized the benefits to the Fund of being able to leverage a favorable cost structure achieved with respect to the Fund’s other operating expenses as a result of GEAM’s large overall base of assets under management and its vendor management practices.
Comparison Of Services To Be Rendered And Fees To Be Paid.
The Board members discussed the services provided to the Fund by GEAM and Urdang, and the fees charged for those services. The Board members reviewed information concerning the fee and expense ratios for the Fund, and comparative information with respect to peer groupings of mutual funds prepared by Morningstar. They discussed that the Fund’s figures were within the applicable peer group ranges. The Board members also reviewed comparative fee information with respect to any comparable mutual fund or other client accounts managed by Urdang. The Board, including the independent Board members, concluded that, based on this information, the
advisory and sub-advisory fees were reasonable in relation to the services provided to the Fund.
Fall-Out Benefits.
The Board members considered other actual and potential financial benefits that GEAM and Urdang may derive from their respective relationships with the Fund, including, to the extent applicable, soft dollar commission benefits generated through Fund portfolio transactions. The Board members noted, however, that the Fund benefits from the vast array of resources available through GEAM, and that the Fund represents only a small portion of the assets managed by GEAM.
Conclusion.
No single factor was determinative to the Board’s decision. Based on their discussion and such other matters as were deemed relevant, the Board, including the independent Board members, concluded that renewal of the advisory and sub-advisory agreements were in the best interests of the Fund and its shareholders.
21
| | |
| Additional Information | | (unaudited) |
Information about Directors and Executive Officers:
The business and affairs of the Company are managed under the direction of the Company’s Board of Directors. Information pertaining to the Directors and officers of the Company is set forth below.
Interested Directors and Executive Officers
Michael J. Cosgrove
Address c/o GEAM 3001 Summer St. Stamford, CT 06905
Age 61
Position(s) Held with Fund Chairman of the Board and President
Term of Office and Length of Time Served Until successor is elected and qualified — 14 years
Principal Occupation(s) During Past 5 years President and Chief Executive Officer — Mutual Funds and Intermediary Business since March 2007; Executive Vice President of GEAM from February 1997 to March 2007; Director of GEAM since 1988; Vice President, GE Capital Corporation, an indirect wholly-owned subsidiary of GE, since December 1999; Executive Vice President — Sales and Marketing of GEAM, a wholly-owned subsidiary of GE that is registered as an investment adviser under the Investment Advisers Act of 1940, as amended, from March 1993 to March 2007.
Number of Portfolios in Fund Complex Overseen by Director 49
Other Directorships Held by Director Chairman of the Board and President of GE Funds from 1993 to February 2011, and GE Institutional Funds since its inception; Trustee of General Electric Savings & Security Trust, General Electric S&S Income Fund, General Electric S&S Program Mutual Fund (“GE Savings & Security Funds”), Elfun Funds, General Electric Insurance Plan Trust, General Relief Loan Fund, and General Electric Pension Trust since 1988; Trustee of Fordham University since 2002; Trustee of GE Volunteers since 1993; Director, GE Asset Management (Ireland) since February 1999; Director, GE Asset Management Funds Plc., GE Asset Canada Company, and GE Asset Management Limited since 1998.
Matthew J. Simpson
Address c/o GEAM 3001 Summer St. Stamford, CT 06905
Age 49
Position(s) Held with Fund Director and Executive Vice President
Term of Office and Length of Time Served Until successor is elected and qualified — 3 years
Principal Occupation(s) During Past 5 years Executive Vice President, General Counsel and Secretary of GEAM since July 2007; Senior Vice President and General Counsel — Marketing and Client Services (formerly Asset Management Services), at GEAM and Senior Vice President and General Counsel of GEAMS from February 1997 to June 2007; Vice President and Associate General Counsel of GEAM from October 1992 to February 1997; Vice President of GE Funds, GE Institutional Funds and GE LifeStyle Funds from September 2003 to June 2007; Secretary of GE Funds and GE Institutional Funds from 1997 to June 2007; Vice President of Elfun Funds and GE Savings & Security Funds from October 2003 to June 2007; Assistant Secretary of Elfun Funds and GE Savings & Security Funds from 1998 to June 2007.
Number of Portfolios in Fund Complex Overseen by Director 49
Other Directorships Held by Director Trustee of GE Institutional Funds, Elfun Funds and GE Savings & Security Funds since July 2007 Trustee of GE Funds from July 2007 to February 2011.
22
| | |
| Additional Information | | (unaudited) |
Joon Won Choe
Address c/o GEAM 3001 Summer St. Stamford, CT 06905
Age 41
Position(s) Held with Fund Vice President & Secretary
Term of Office and Length of Time Served Until successor is elected and qualified — Vice President and Secretary — less than 1 year
Principal Occupation(s) During Past 5 years Senior Vice President and Associate General Counsel at GEAM since June 2010; Vice President and Associate General Counsel at GEAM from November 2005 to June 2010; Vice President and Secretary of GE Funds from September 2010 to February 2011; Vice President and Secretary of GE Institutional Funds and GE Investments Funds, Inc. since September 2010; Vice President and Assistant Secretary of Elfun Funds and GE Savings & Security Funds since September 2010.
Number of Portfolios in Fund Complex Overseen by Officer N/A
Other Directorships Held by Officer N/A
Robert Herlihy
Address c/o GEAM 3001 Summer St. Stamford, CT 06905
Age 43
Position(s) Held with Fund Senior Vice President and Chief Compliance Officer
Term of Office and Length of Time Served Until successor is elected and qualified — 5 years
Principal Occupation(s) During Past 5 years Chief Compliance Officer of GEAM, GE Institutional Funds, Elfun Funds, and GE Savings and Security Funds since July 2005; Chief Compliance Officer of GE Funds from July 2005 to February 2011; Manager of Fund Administration at GEAM from 2002 — 2005.
Number of Portfolios in Fund Complex Overseen by Officer N/A
Other Directorships Held by Officer N/A
Eunice Tsang
Address c/o GEAM 3001 Summer St. Stamford, CT 06905
Age 51
Position(s) Held with Fund Treasurer
Term of Office and Length of Time Served Until successor is elected and qualified — less than one year
Principal Occupations(s) During Past 5 years Treasurer of GE Institutional Funds, Elfun Funds and GE Savings and Security Funds since January 2010; Treasurer of GE Funds from January 2010 to February 2011; GEAM Operational Controllership and Technical Accounting Manager since December 2007; Financial Planning & Analysis Manager — Performance Leader from June 2005 to December 2007; GEAM Quality Black Belt from 2001 to June 2005; Financial Planning & Analysis Manager from 2000 to 2001; and Mutual Fund Assistant Controller from October 1997 to 2000.
Number of Portfolios in Fund Complex Overseen by Officer N/A
Other Directorships Held by Officer N/A
23
| | |
| Additional Information | | (unaudited) |
Non-Interested Directors
John R. Costantino
Address c/o GEAM 3001 Summer St. Stamford, CT 06905
Age 64
Position(s) Held with Fund Director
Term of Office and Length of Time Served Until successor is elected and qualified — 14 years
Principal Occupation(s) During Past 5 years General Partner, NGN Capital LLC since 2006; Managing Director, Vice President of Walden Capital Management since 1996.
Number of Portfolios in Fund Complex Overseen by Director 41
Other Directorships Held by Director Trustee of GE Funds since 1993, GE Institutional Funds since its inception; Trustee of Fordham University from 1989 to 1995 and 2001 to 2007 and Trustee Emeritus since 2007; Trustee of Neuro Science Research Institute since 1986; Trustee of Gregorian University Foundation from 1992 to 2007; Director of Artes Medical from 2006 to 2008.
William J. Lucas
Address c/o GEAM 3001 Summer St. Stamford, CT 06905
Age 61
Position(s) Held with Fund Director
Term of Office and Length of Time Served Until successor is elected and qualified — 13 years (No longer serves as Trustee effective November 4, 2010)
Principal Occupation(s) During Past 5 years Retired since 2010, previously Vice President and Treasurer of Fairfield University since 1983.
Number of Portfolios in Fund Complex Overseen by Director 41
Other Directorships Held by Director Trustee of GE Funds since 1993, and GE Institutional Funds since its inception.
Robert P. Quinn
Address c/o GEAM 3001 Summer St. Stamford, CT 06905
Age 74
Position(s) Held with Fund Director
Term of Office and Length of Time Served Until successor is elected and qualified — 14 years
Principal Occupation(s) During Past 5 years Retired since 1983 from Salomon Brothers Inc.
Number of Portfolios in Fund Complex Overseen by Director 41
Other Directorships Held by Director Trustee of GE Funds since 1993, and GE Institutional Funds since its inception; Trustee, St. Francis Hospital Corp. since 1980
The Statement of Additional Information for the Fund includes additional information about the Directors and Officers and is available, without charge, upon request by calling 1-800-493-3042.
24
Investment Adviser and Administrator
GE Asset Management Incorporated
Board of Directors
Michael J. Cosgrove, Chairman
John R. Costantino
William J. Lucas*
Robert P. Quinn
Matthew J. Simpson
Secretary
Joon Won Choe
Assistant Secretary
Michelle Matzelle
Treasurer
Eunice Tsang
Assistant Treasurers
Tatyana Begun**
Casey Yantosca
Distributor
GE Investment Distributors, Inc.
Member FINRA and SIPC
Counsel
Sutherland, Asbill & Brennan, LLP
Custodian
State Street Bank & Trust Company
Independent Registered Public Accounting Firm
KPMG LLP
Officers of the Investment Adviser
James W. Ireland, President and Chief Executive Officer
Cheryl H. Beacock, Senior Vice President, Human Resources
Paul M. Colonna, President and Chief Investment Officer – Fixed Income Investments
Michael J. Cosgrove, President and Chief Executive
Officer – Mutual Funds & Intermediary Business
Ralph R. Layman, President and Chief Investment Officer – Public Equity Investments
Maureen B. Mitchell, President – Institutional Sales and Marketing
Steve Rullo, Chief Information Officer (since February 2011)
Matthew J. Simpson, Executive Vice President, General Counsel and Secretary
Don W. Torey, President – Alternative Investments
John J. Walker, Executive Vice President, Chief Operating Officer
David Wiederecht, President and Chief Investment Officer – Investment Strategies
Tracie Winbigler, Executive Vice President, Chief Financial Officer***
| * | As of November 4, 2010, Mr. Lucas no longer served as a director of the Company. |
| ** | As of February 18, 2011, Ms. Begun no longer served as an officer of the Company. |
| *** | Effective January, 2011. |
25
Investment Adviser
GE Asset Management Incorporated
3001 Summer Street
PO Box 7900
Stamford, CT 06904-7900
Distributor
GE Investment Distributors, Inc.
member FINRA and SIPC
3001 Summer Street
PO Box 7900
Stamford, CT 06904-7900
The Fund files its complete schedule of portfolio holdings with the Securities and Exchange Commission for the first and third quarters of each fiscal year on Form N-Q. The Fund’s Forms N-Q, as well as a description of the policies and procedures that the Fund uses to determine how to vote proxies (if any) relating to portfolio securities is available without charge (i) upon request, by calling 1-800-493-3042; (ii) on the Fund’s website at http://www.geam.com; and (iii) on the Commission’s website at http://www.sec.gov. The Fund’s Forms N-Q may be reviewed and copied at the Commission’s Public Reference Room in Washington, DC—information on the operation of the Public Reference Room may be obtained by calling 1-800-SEC-0330.
Information (if any) regarding how the Fund voted proxies relating to portfolio securities during the most recently disclosed 12-month period ended June 30 is available without charge (i) through the Fund’s website at http://www.geam.com; and (ii) on the Commission’s website at http://www.sec.gov.
Please refer to the Code of Ethics included in the following link:
www.ge.com/files/usa/en/commitment/social/integrity/downloads/english.pdf
| ITEM 3. | AUDIT COMMITTEE FINANCIAL EXPERT. |
The Board of Trustees of the registrant has determined that John R. Costantino is designated as audit committee financial expert for the Funds; and further that it is the finding of the Board of Trustees that Mr. Costantino, the audit committee financial expert, qualify
as being ‘independent’ pursuant to paragraph (a)(2) of Item 3 to Form N-CSR.
| ITEM 4. | PRINCIPAL ACCOUNTANT FEES AND SERVICES. |
(a) AUDIT FEES. The aggregate fees billed for each of the last two fiscal years (the “Reporting Periods”) for professional services rendered by the Registrant’s principal accountant (the “Auditor”) for the audit of the Registrant’s annual financial statements, or services that are normally provide by the Auditor in connection with the statutory and regulatory filings or engagements for the Reporting Periods were $210,900 in 2009 and $214,000 in 2010.
(b) AUDIT RELATED FEES. There were no fees billed by the Auditor for assurance and related services that were related to the performance of the audit for the Registrant during the Reporting Periods.
(c) TAX FEES. There were no fees billed for professional services rendered by the Auditor for tax compliance, tax advice or tax planning for the Registrant during the Reporting Periods.
(d) ALL OTHER FEES. There were no fees billed for products and services provided by the Auditor, other than the services reported in paragraphs (a) through (c) of this Item for the Registrant during the Reporting Periods.
(e) (1) AUDIT COMMITTEE PRE-APPROVAL POLICIES AND PROCEDURES.
The Audit Committee of the GE Investments Funds (the “Funds”) Board of Trustees is responsible, among other things, for the appointment, compensation and oversight of the work of the Fund’s independent accountants/auditors (the “Auditor”). As part of this responsibility and to ensure that the Auditor’s independence is not impaired, the Audit Committee (1) pre-approves the audit and non-audit services provided to the Funds by the Auditor, and (2) all non-audit services provided to the Funds’ investment adviser and covered affiliates (as defined in the Audit Committee Charter) that provide ongoing services to the Funds if the services directly impact the Funds’ operations or financial reporting, in accordance with the Audit Committee Charter. Following are excerpts from the Audit Committee Charter that sets forth the pre-approval policies and procedures:
1. Selection and Pre-Approval of Auditor and Approval of Fees.
(i) The Audit Committee shall pre-approve the selection of the Auditor and shall recommend for ratification the selection, retention or termination of the Auditor by the full Board, including the independent Trustees/Directors, and, in connection therewith, shall evaluate the independence of the Auditor, including: (i) an evaluation of whether the Auditor provides any consulting services to the Fund’s investment adviser and the extent to which the Auditor provides non-audit services to the Fund’s investment adviser and certain other affiliated service providers as defined in Section 2(f) below, which services are not subject to the pre-approval requirements set forth in Section 4 below; (ii) an evaluation of the extent to which the Auditor has any relationships with the Fund or its affiliated persons that are brought to the attention of the Audit Committee by the Auditor in accordance with applicable standards of the Independence Standards Board (“ISB”), because, in the Auditor’s professional judgment, such relationships may reasonably be thought to bear on the Auditor’s independence with respect to the Fund; and (iii) monitoring the Auditor’s compliance with respect to the rotation requirements for the lead and coordinating partners having primary responsibility for the Fund’s audits and any partner responsible for the reviewing the Fund’s audits. The Audit Committee shall review the Auditor’s specific representations as to its independence.
(b) The Audit Committee shall pre-approve and review the fees charged by the Auditor for audit and non-audit services to be provided to the Fund and certain affiliated service providers (as defined in Section 2(f) below) in accordance with the pre-approval requirements set forth in Section 4 below. The Fund shall provide for appropriate funding, as determined by the Audit Committee, to compensate the Auditor for any authorized service provided to the Fund.
2. Meetings with the Auditor. The Audit Committee shall meet with the Auditor, including private meetings, prior to the commencement of substantial work on the audit and following the conclusion of the audit, as well as such other times as the Audit Committee shall deem necessary or appropriate. The Auditor shall report directly to the Audit Committee. The Auditor shall report at least annually, concerning the following and other pertinent matters:
(a) to review the arrangements for and scope of the annual audit and any special audits;
(b) to provide the Auditor the opportunity to report to the Audit Committee, on a timely basis, all critical accounting policies and practices to be used;
(c) to discuss any matters of concern relating to the Fund’s financial statements, including: (i) any adjustments to such statements recommended by the Auditor, or other results of said audit(s), and (ii) any alternative treatments of financial information within GAAP that have been discussed with Fund management, the ramifications of the use of such alternative disclosures and treatments, and the treatment preferred by the Auditor;
(d) to provide the Auditor the opportunity to report to the Audit Committee, on a timely basis, any material written communication between the Auditor and Fund management, such as any management letter or schedule of unadjusted differences;
(e) to discuss the opinion the Auditor has rendered regarding the Fund’s financial statements;
(f) to report all non-audit services that do not require Audit Committee pre-approval and are provided to certain affiliated persons of the Fund, including: (1) the Fund’s investment adviser or sub-advisers (but excluding any investment sub-adviser whose role is primarily portfolio management and is overseen by the investment adviser), (2) the Fund’s principal underwriter, and (3) any entity controlling, controlled by, or under common control with the investment adviser or principal underwriter, that provides “ongoing” services to the Funds in accordance with the pre-approval requirements of paragraph (c)(7)(i) of Rule 2-01 of Regulation S-X (each, a “Covered Affiliate” and collectively, “Covered Affiliates”);
(g) to review, in accordance with current standards of ISB, all relationships between the Auditor and the Fund or its affiliated persons that, in the Auditor’s professional judgment, may reasonably be thought to bear on its independence, and to confirm, in light of such information, whether the Auditor believes, in its professional judgment, that it may properly serve as independent accountants/auditors with respect to the Fund;
(h) to consider the Auditor’s comments with respect to the Fund’s financial policies, procedures and internal accounting controls and responses thereto by the Fund’s officers and Fund management, as well as other personnel;
(i) to investigate any improprieties or suspected improprieties in the operations of the Fund to the extent necessary or appropriate in light of any internal investigations by the Fund’s officers and/or by officers or employees of the Fund management of such improprieties;
(j) to receive periodic reports concerning regulatory changes and new accounting pronouncements that significantly affect the value of the Fund’s assets and their financial reporting;
(k) to report on the Fund’s qualification under Subchapter M of the Internal Revenue Code, amounts distributed and reported to shareholders for Federal tax purposes and the Fund’s tax returns; and
(l) to provide the Auditor the opportunity to report on any other matter that the Auditor deems necessary or appropriate to discuss with the Audit Committee.
If the Auditor’s report on the above-listed (and other pertinent) matters is not made in person to the Audit Committee within 60 days following the end of the Fund’s fiscal year, the Auditor shall deliver a written report to the Audit Committee concerning these matters within such 60 day period.
3. Change in Accounting Principles. The Audit Committee shall consider the effect upon the Fund of any changes in accounting principles or practices proposed by the Auditor or the Fund’s officers.
4. Pre-Approval of Audit Related Services and Permissible Non-Audit Services. The Audit Committee shall pre-approve both audit (including audit, review, and attest) services and permissible non-audit services provided to the Fund and, if the nature of the engagement relates directly to the operations and financial reporting of the Fund, permissible non-audit services provided to any Covered Affiliate.
The Audit Committee may determine to delegate the authority to grant pre-approvals to one or more Audit Committee members, each acting on behalf of the Audit Committee. In this event, the member of the Audit Committee so delegated shall report each delegated pre-approval to the Audit Committee at its next regularly scheduled meeting. The Audit Committee may also adopt and follow, in lieu of explicit pre-approval described above, written policies and procedures detailed as to the particular service, designed to safeguard the continued independence of the Auditor, consistent with the requirements of the Act and SEC regulations there under.
Notwithstanding the foregoing, the pre-approval requirement concerning permissible non-audit services provided to the Fund or any Covered Affiliate is waived if: (1) the aggregate amount of all such non-audit services provided constitutes no more than five percent (5%) of the total amount of revenues paid to the Auditor by the Fund and the Covered Affiliates during the fiscal year in which the services are provided that would have to be pre-approved by the Audit Committee, (2) the non-audit services were not recognized as non-audit services at the time of the engagement, and (3) such non-audit services are promptly brought to the attention of the Audit Committee and approved by the Audit Committee or one or more designated members of the Audit Committee prior to the
completion of the audit.
5. Prohibited Activities of the Auditor. The Audit Committee shall confirm with the Auditor that it is not performing contemporaneously (during the audit and professional engagement period) non-audit services for the Fund that the Audit Committee believes may taint the independence of the Auditor. The Auditor will be responsible for informing the Audit Committee of whether it believes that a particular non-audit service is permissible or prohibited pursuant to applicable regulations and standards.
(2) PERCENTAGE OF SERVICES IN PARAGRAPHS (b) THROUGH (d) APPROVED BY AUDIT COMMITTEE. No fees were charged during 2009 or 2010 for audit related, tax or other services as indicated in sections (b) through (d) of this Item.
(f) Not applicable.
(g) NON-AUDIT FEES. The aggregate non-audit fees billed by the Auditor for services rendered to the Registrant, and rendered to Service Affiliates, for the Reporting Periods were $0 in 2009 and $0 in 2010.
(h) AUDITOR INDEPENDENCE. There were no non-audit services rendered to Service Affiliates those were not pre-approved.
| ITEM 5. | Audit Committee of Listed Registrants |
The Registrant has a separately-designated standing audit committee established in accordance with Section 3(a)(58)(A) of the Exchange Act (15 U.S.C. 78c(a)(58)(A)). The Registrants audit committee members are: John R. Costantino and Robert P. Quinn.
| ITEM 6. | Schedule of Investments. |
Attached as part of ITEM 1.
| ITEM 7. | DISCLOSURE OF PROXY VOTING POLICIES AND PROCEDURES FOR CLOSED-END MANAGEMENT INVESTMENT COMPANIES. |
Applicable only to Closed-End Management Investment Companies.
| ITEM 8. | PORTFOLIO MANAGERS OF CLOSED-END MANAGEMENT INVESTMENT COMPANIES. |
Applicable only to Closed-End Management Investment Companies.
| ITEM 9. | Purchases of Equity Securities by Closed-End Management Investment Company and Affiliated Purchasers. |
Applicable only to Closed-End Management Investment Companies.
| ITEM 10. | Submission of Matters to a Vote of Security Holders. |
No material changes.
| ITEM 11. | CONTROLS AND PROCEDURES. |
The officers providing the certifications in this report in accordance with Rule 30a-3 under the Investment Company Act of 1940 have concluded, based on their evaluation of the registrant’s disclosure controls and procedures (as such term is defined in such rule), that such controls and procedures are adequate and reasonably designed to achieve the purpose described in paragraph (c) of such rule.
There were no significant changes in the registrant’s internal controls or in other factors that could significantly affect these controls subsequent to the date of their last evaluation, including any corrective actions with regard to significant deficiencies and material weaknesses.
(a) Not applicable.
(b) Attached hereto as Exhibit 1 and Exhibit 2 are the Certifications of Michael J. Cosgrove and Eunice Tsang as principal executive officer and principal financial officer, respectively of the Registrant as required by Rule 30a-2(a) under the Act (17 CFR 270.30a-2(a)).
SIGNATURES
Pursuant to the requirements of the Securities Exchange Act of 1934 and the Investment Company Act of 1940, the Registrant has duly caused this Report to be signed on its behalf by the undersigned, thereunto duly authorized.
| | |
| GE INVESTMENTS FUNDS, INC |
| |
| By: | | /S/ MICHAEL J. COSGROVE |
| | Michael J. Cosgrove |
| | Chairman, GE Investments Funds, Inc. |
| |
| Date: | | March 09, 2011 |
Pursuant to the requirements of the Securities Exchange Act of 1934 and the Investment Company Act of 1940, this Report has been signed below by the following persons on behalf of the Registrant and in the capacities and on the dates indicated.
| | |
| |
| By: | | /S/ MICHAEL J. COSGROVE |
| | Michael J. Cosgrove |
| | Chairman, GE Investments Funds, Inc. |
| |
| Date: | | March 09, 2011 |
| |
By: | | /S/ EUNICE TSANG |
| | Eunice Tsang |
| | Treasurer, GE Investments Funds, Inc. |
| |
| Date: | | March 09, 2011 |
EXHIBIT INDEX
(b)(1) Certifications of principal executive officer and principal financial officer as required by Rule 30a-2 under the Investment Company Act of 1940.
(b)(2) Certification of principal executive officer and principal financial officer as required by Section 906 of the Sarbanes-Oxley Act of 2002.