UNITED STATES
SECURITIES AND EXCHANGE COMMISSION
Washington, D.C. 20549
FORMN-CSR
CERTIFIED SHAREHOLDER REPORT OF REGISTERED
MANAGEMENT INVESTMENT COMPANIES
Investment Company Act file number:811-04041
STATE STREET VARIABLE INSURANCE SERIES FUNDS, INC.
(Exact name of registrant as specified in charter)
1600 Summer Street, Stamford, Connecticut 06905
(Address of principal executive offices)(Zip code)
| | |
| (Name and Address of Agent for Service) | | Copy to: |
| |
Joshua A. Weinberg, Esq. Managing Director and Managing Counsel c/o SSGA Funds Management, Inc. One Iron Street Boston, Massachusetts 02210 | | Timothy W. Diggins, Esq. Ropes & Gray LLP 800 Boylston Street Boston, Massachusetts 02110-2624 |
Registrant’s telephone number, including area code:800-242-0134
Date of fiscal year end: December 31
Date of reporting period: December 31, 2018
| Item 1. | Shareholder Reports. |
Annual Report
December 31, 2018
State Street S&P 500 Index V.I.S. Fund
Beginning on January 1, 2021, as permitted by regulations adopted by the Securities and Exchange Commission, paper copies of a Fund’s annual and semi- annual shareholder reports will no longer be sent by mail, unless you specifically request paper copies of the reports from the Fund (or from your financial intermediary, such as a broker-dealer or bank). Instead, the reports will be made available on a Fund’s website (www.ssga.com/geam), and you will be notified by mail each time a report is posted, and provided with a website link to access the report.
Beginning on January 1, 2019, you may elect to receive all future reports in paper free of charge. If you invest through a financial intermediary, you can contact your financial intermediary to request that you continue to receive paper copies of your shareholder reports. Your election to receive reports in paper will apply to all funds held in your account, if you invest through your financial intermediary or all funds held with the fund complex if you invest directly with a Fund.

State Street S&P 500 Index V.I.S. Fund
Annual Report
December 31, 2018
Table of Contents
This report is prepared for Policyholders of certain variable contracts and may be distributed to others only if preceded or accompanied by the variable contract’s current prospectus and the current summary prospectus of the Fund available for investments thereunder.
State Street S&P 500 Index V.I.S. Fund
Notes to Performance — December 31, 2018 (Unaudited)
The information provided on the performance page relates to the State Street S&P 500 Index V.I.S. Fund (the “Fund”).
Total return performance shown in this report for the Fund takes into account changes in share price and assumes reinvestment of dividends and capital gains distributions, if any. Total returns shown are net of Fund fees and expenses but do not reflect fees and charges associated with the variable contracts such as administrative fees, account charges and surrender charges, which, if reflected, would reduce the Fund’s total returns for all periods shown.
The performance data quoted represents past performance; past performance does not guarantee future results. Investment return and principal value will fluctuate so your shares, when redeemed, may be worth more or less than their original cost. Current performance may be higher or lower than the performance data quoted. Periods less than one year are not annualized. Please call toll-free (800) 242-0134 or visit the Fund’s website at http://www.ssga.com/geam for the most recent month-end performance data.
An investment in the Fund is not a deposit of any bank and is not insured or guaranteed by the Federal Deposit Insurance Corporation (“FDIC”) or any other government agency. An investment in the Fund is subject to risk, including possible loss of principal invested.
The S&P 500® Index is an unmanaged, market capitalization-weighted index of stocks of 500 large U.S. companies, which is widely used as a measure of large-cap U.S. stock market performance.
The Fund is not sponsored, endorsed, sold or promoted by S&P Global Ratings (“S&P”), and S&P makes no representation or warranty, express or implied, to the investors of the Fund or any member of the public regarding the advisability of investing in the securities generally or in this Fund particularly or the ability of the Fund to track general stock market performance.
The results shown for the foregoing index assume the reinvestment of net dividends or interest and do not reflect fees, expenses, or taxes. As such, the index returns do not reflect the actual cost of investing in the instruments that comprise the index.
The views expressed in this document reflect our judgement as of the publication date and are subject to change at any time without notice.
State Street Global Advisors Funds Distributors, LLC, member of FINRA & SIPC is the principal underwriter and distributor of the State Street V.I.S. Funds and an indirect wholly-owned subsidiary of State Street Corporation. References to State Street may include State Street Corporation and its affiliates. The Funds pay State Street Bank and Trust Company for its services as custodian and Fund Accounting agent, and pay SSGA Funds Management, Inc. for investment advisory and administrative services.
State Street S&P 500 Index V.I.S. Fund
Management’s Discussion of Fund Performance (Unaudited)
The State Street S&P 500 Index V.I.S. Fund (the “Fund”) seeks growth of capital and accumulation of income that corresponds to the investment return of the S&P 500 Index. The Fund’s benchmark is the S&P 500 Index (the “Index”).
For the12-month period ended December 31, 2018 (the “Reporting Period”), the total return for the Fund was -4.73%, and the Index was-4.38%. The Fund and Index returns reflect the reinvestment of dividends and other income. The Fund’s performance reflects the expenses of managing the Fund, including brokerage and advisory expenses. The Index is unmanaged and Index returns do not reflect fees and expenses of any kind, which would have a negative impact on returns. Fund expenses, cash drag, futures, and cumulative effect of security misweights contributed to the difference between the Fund’s performance and that of the Index.
The Index underperformed in Q1, rallied in Q2 and Q3, before trailing again in Q4 to end down for the year for the first time since 2015. Positive momentum from tax reform, strong earnings and macro data combined with increased M&A activity carried the Index through the third quarter. However in Q4, continued concerns about trade with China, a more hawkish Fed, geopolitical tensions, and the government shutdown concerns led to the overall negative performance of the Index last year. Health Care, Information Technology, and Consumer Discretionary were the positive drivers of Fund performance during the Reporting Period. Financials, Industrials and Energy were the main negative performance drivers in the Fund’s performance in 2018.
The Fund used futures in order to obtain desired market exposure during the Reporting Period. The Fund’s use of futures helped the Fund track the Index.
On an individual security level, the top positive contributors to the Fund’s performance during the Reporting Period were Microsoft Corporation, Amazon.com, Inc., and Merck & Co., Inc. The top negative contributors to the Fund’s performance during the Reporting Period were AT&T Inc., General Electric Company, and Facebook, Inc. Class A.
The views expressed above reflect those of the Fund’s portfolio manager only through the Reporting Period, and do not necessarily represent the views of the Adviser as a whole. Any such views are subject to change at any time based upon market or other conditions and the Adviser disclaims any responsibility to update such views. These views may not be relied on as investment advice and, because investment decisions for a fund are based on numerous factors, may not be relied on as an indication of trading intent on behalf of any fund.
| | |
| 2 | | State Street S&P 500 Index V.I.S. Fund |
State Street S&P 500 Index V.I.S. Fund
Understanding Your Fund’s Expenses (Unaudited)
As a shareholder of the Fund, you incur ongoing costs. Ongoing costs include portfolio management fees, professional fees, administrative fees and other Fund expenses. The following example is intended to help you understand your ongoing costs (in dollars) of investing in the Fund and to compare these costs with the ongoing costs of investing in other mutual funds.
To illustrate these ongoing costs, we have provided an example and calculated the expenses paid by investors in the Fund during the period. The information in the following table is based on an investment of $1,000, which is invested at the beginning of the period and held for the entiresix-month period ended December 31, 2018.
Actual Expenses
The first section of the table provides information about actual account values and actual expenses. You may use the information in this section, together with the amount you invested, to estimate the expenses that you paid over the period. To do so, simply divide your account value by $1,000 (for example, an $8,600 account value divided by $1,000 = 8.6), then multiply the result by the number given under the heading “Expenses paid during the period” to estimate the expenses you paid on your account during the period.
Hypothetical Example for Comparison Purposes
The second section of the table provides information about hypothetical account values and hypothetical expenses based on the Fund’s actual expense ratio and an assumed rate of return of 5% per year before expenses, which is not the Fund’s actual return. The hypothetical account values and expenses may not be used to estimate the actual ending account balance or expenses you paid for the period. You may use this information to compare the ongoing costs of investing in the Fund and other funds. To do so, compare this 5% hypothetical example with the 5% hypothetical examples that appear in the shareholder reports of other funds.
Please note that the expenses shown in the table are meant to highlight and help you compare ongoing costs only and do not reflect transaction costs, such as sales charges or redemption fees, if any. Therefore, the second section of the table is useful in comparing ongoing costs only, and will not help you determine the relative total costs of owning different funds. Additionally, the expenses shown do not reflect the fees or charges associated with variable contracts through which shares of the Fund are offered.
| | | | | | | | |
| | | Actual
Fund Return | | | Hypothetical
5% Return
(2.5% for
the period) | |
Actual Fund Return | | | | | | | | |
Beginning Account Value July 1, 2018 | | $ | 1,000.00 | | | $ | 1,000.00 | |
Ending Account Value December 31, 2018 | | $ | 929.70 | | | $ | 1,023.59 | |
Expenses Paid During the Period* | | $ | 1.56 | | | $ | 1.63 | |
| * | Expenses are equal to the Fund’s annualized expense ratio of 0.32%** (for the period July 1, 2018-December 31, 2018), multiplied by the average account value over the period, multiplied by 184/365 (to reflect theone-half year period). |
| ** | May differ from expense ratio disclosed in the financial highlights, which is calculated based on the entire fiscal year’s data. |
| | | | |
| State Street S&P 500 Index V.I.S. Fund | | | 3 | |
State Street S&P 500 Index V.I.S. Fund
Performance Summary — December 31, 2018 (Unaudited)
Top Ten Largest Holdings
as of December 31, 2018 (as a % of Fair Value)(a)(b)
| | | | |
Microsoft Corp. | | | 3.69 | % |
| |
Apple Inc. | | | 3.35 | % |
| |
Amazon.com Inc. | | | 2.89 | % |
| |
Berkshire Hathaway Inc., Class B | | | 1.88 | % |
| |
Johnson & Johnson | | | 1.63 | % |
| |
JPMorgan Chase & Co. | | | 1.53 | % |
| |
Alphabet Inc., Class C | | | 1.50 | % |
| |
Facebook Inc., Class A | | | 1.49 | % |
| |
Alphabet Inc., Class A | | | 1.47 | % |
| |
Exxon Mobil Corp. | | | 1.35 | % |
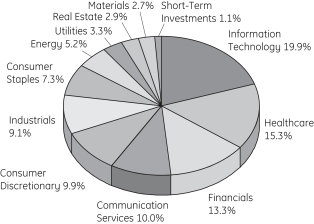
Sector Allocation as of December 31, 2018
Portfolio composition as a % of Fair Value of $160,731 (in thousands) as of December 31, 2018(a)(b)
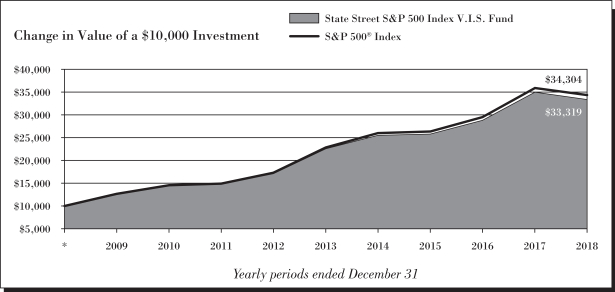
Average Annual Total Return for the periods ended December 31, 2018
Class 1 Shares (Inception date: 4/15/85)
| | | | | | | | | | | | | | | | |
| | | One Year | | | Five Year | | | Ten Year | | | Ending Value
of a $10,000
Investment | |
State Street S&P 500 Index V.I.S. Fund | | | -4.73 | % | | | 8.15 | % | | | 12.79 | % | | $ | 33,319 | |
| | | | |
S&P 500® Index | | | -4.38 | % | | | 8.50 | % | | | 13.12 | % | | $ | 34,304 | |
| (a) | Fair Value basis is inclusive of short-term investment in State Street Institutional U.S. Government Money Market Fund Class G Shares. |
| (b) | The securities information regarding holdings, allocations and other characteristics is presented to illustrate examples of securities that the Fund has bought and the diversity of areas in which the Fund may invest as of a particular date. It may not be representative of the Fund’s current or future investments and should not be construed as a recommendation to purchase or sell a particular security. |
| | |
| 4 | | State Street S&P 500 Index V.I.S. Fund |
State Street S&P 500 Index V.I.S. Fund
Performance Summary, continued — December 31, 2018 (Unaudited)
See Notes to Performance beginning on page 1 for further information.
Past performance does not predict future performance. The performance shown in the graphs and tables does not reflect the deduction of taxes that a shareholder would pay on Fund distributions or the redemption of Fund shares and does not reflect the fees or charges that would be associated with variable contracts through which shares of the Fund are offered.
| | | | |
| State Street S&P 500 Index V.I.S. Fund | | | 5 | |
State Street S&P 500 Index V.I.S. Fund
Schedule of Investments — December 31, 2018
| | | | | | | | |
| | | Number
of Shares | | | Fair
Value
$ | |
| | | | | | | | |
|
| Common Stock - 98.8%† | |
Advertising - 0.1% | |
Omnicom Group Inc. | | | 1,743 | | | | 127,657 | |
The Interpublic Group of Companies Inc. | | | 2,720 | | | | 56,114 | |
| | | | | | | | |
| | | | | | | 183,771 | |
| | | | | | | | |
|
Aerospace & Defense - 2.4% | |
Arconic Inc. | | | 2,788 | | | | 47,006 | |
General Dynamics Corp. | | | 2,112 | | | | 332,028 | |
Harris Corp. | | | 900 | | | | 121,185 | |
Huntington Ingalls Industries Inc. | | | 300 | | | | 57,093 | |
L3 Technologies Inc. | | | 589 | | | | 102,286 | |
Lockheed Martin Corp. | | | 1,868 | | | | 489,117 | |
Northrop Grumman Corp. | | | 1,297 | | | | 317,635 | |
Raytheon Co. | | | 2,161 | | | | 331,389 | |
Textron Inc. | | | 1,925 | | | | 88,531 | |
The Boeing Co. | | | 3,967 | | | | 1,279,357 | |
TransDigm Group Inc. (a) | | | 333 | | | | 113,240 | |
United Technologies Corp. | | | 6,052 | | | | 644,417 | |
| | | | | | | | |
| | | | | | | 3,923,284 | |
| | | | | | | | |
|
Agricultural & Farm Machinery - 0.2% | |
Deere & Co. | | | 2,406 | | | | 358,903 | |
| | | | | | | | |
|
Agricultural Products - 0.1% | |
Archer-Daniels-Midland Co. | | | 4,324 | | | | 177,154 | |
| | | | | | | | |
|
Air Freight & Logistics - 0.6% | |
CH Robinson Worldwide Inc. | | | 1,029 | | | | 86,529 | |
Expeditors International of Washington Inc. | | | 1,399 | | | | 95,258 | |
FedEx Corp. | | | 1,788 | | | | 288,458 | |
United Parcel Service Inc., Class B | | | 5,340 | | | | 520,810 | |
| | | | | | | | |
| | | | | | | 991,055 | |
| | | | | | | | |
|
Airlines - 0.5% | |
Alaska Air Group Inc. | | | 1,000 | | | | 60,850 | |
American Airlines Group Inc. | | | 3,098 | | | | 99,477 | |
Delta Air Lines Inc. | | | 4,832 | | | | 241,117 | |
Southwest Airlines Co. | | | 3,961 | | | | 184,107 | |
United Continental Holdings Inc. (a) | | | 1,650 | | | | 138,154 | |
| | | | | | | | |
| | | | | | | 723,705 | |
| | | | | | | | |
|
Alternative Carriers - 0.1% | |
CenturyLink Inc. | | | 7,333 | | | | 111,095 | |
| | | | | | | | |
|
Aluminum - 0.0%* | |
Alcoa Corp. (a) | | | 1 | | | | 27 | |
| | | | | | | | |
| | | | | | | | |
| | | Number
of Shares | | | Fair
Value
$ | |
Apparel Retail - 0.5% | |
Foot Locker Inc. | | | 800 | | | | 42,560 | |
L Brands Inc. | | | 1,488 | | | | 38,197 | |
Ross Stores Inc. | | | 2,896 | | | | 240,947 | |
The Gap Inc. | | | 1,676 | | | | 43,174 | |
The TJX Companies Inc. | | | 9,538 | | | | 426,730 | |
| | | | | | | | |
| | | | | | | 791,608 | |
| | | | | | | | |
|
Apparel, Accessories & Luxury Goods - 0.3% | |
Hanesbrands Inc. | | | 2,400 | | | | 30,072 | |
Michael Kors Holdings Ltd. (a) | | | 1,222 | | | | 46,338 | |
PVH Corp. | | | 669 | | | | 62,183 | |
Ralph Lauren Corp. | | | 400 | | | | 41,384 | |
Tapestry Inc. | | | 2,289 | | | | 77,254 | |
Under Armour Inc., Class A (a) | | | 1,700 | | | | 30,039 | |
Under Armour Inc., Class C (a) | | | 1,712 | | | | 27,683 | |
VF Corp. | | | 2,502 | | | | 178,493 | |
| | | | | | | | |
| | | | | | | 493,446 | |
| | | | | | | | |
|
Application Software - 1.6% | |
Adobe Inc. (a) | | | 3,709 | | | | 839,124 | |
ANSYS Inc. (a) | | | 600 | | | | 85,764 | |
Autodesk Inc. (a) | | | 1,648 | | | | 211,949 | |
Cadence Design Systems Inc. (a) | | | 2,200 | | | | 95,656 | |
Citrix Systems Inc. | | | 907 | | | | 92,931 | |
Intuit Inc. | | | 1,987 | | | | 391,141 | |
salesforce.com Inc. (a) | | | 5,712 | | | | 782,373 | |
Synopsys Inc. (a) | | | 1,199 | | | | 101,004 | |
Verint Systems Inc. (a) | | | 1 | | | | 42 | |
| | | | | | | | |
| | | | | | | 2,599,984 | |
| | | | | | | | |
|
Asset Management & Custody Banks - 0.9% | |
Affiliated Managers Group Inc. | | | 400 | | | | 38,976 | |
Ameriprise Financial Inc. | | | 1,005 | | | | 104,892 | |
BlackRock Inc. | | | 926 | | | | 363,751 | |
Franklin Resources Inc. | | | 2,000 | | | | 59,320 | |
Invesco Ltd. | | | 3,250 | | | | 54,405 | |
Northern Trust Corp. | | | 1,696 | | | | 141,769 | |
State Street Corp. (b) | | | 2,911 | | | | 183,597 | |
T Rowe Price Group Inc. | | | 1,740 | | | | 160,637 | |
The Bank of New York Mellon Corp. | | | 7,066 | | | | 332,596 | |
| | | | | | | | |
| | | | | | | 1,439,943 | |
| | | | | | | | |
|
Auto Parts & Equipment - 0.1% | |
Aptiv PLC | | | 2,056 | | | | 126,588 | |
BorgWarner Inc. | | | 1,747 | | | | 60,691 | |
| | | | | | | | |
| | | | | | | 187,279 | |
| | | | | | | | |
|
Automobile Manufacturers - 0.4% | |
Ford Motor Co. | | | 29,626 | | | | 226,639 | |
See Notes to Schedule of Investments and Notes to Financial Statements.
| | |
| 6 | | State Street S&P 500 Index V.I.S. Fund |
State Street S&P 500 Index V.I.S. Fund
Schedule of Investments, continued — December 31, 2018
| | | | | | | | |
| | | Number
of Shares | | | Fair
Value
$ | |
| | | | | | | | |
General Motors Co. | | | 9,986 | | | | 334,032 | |
| | | | | | | | |
| | | | | | | 560,671 | |
| | | | | | | | |
|
Automotive Retail - 0.3% | |
Advance Auto Parts Inc. | | | 522 | | | | 82,194 | |
AutoZone Inc. (a) | | | 198 | | | | 165,991 | |
CarMax Inc. (a) | | | 1,390 | | | | 87,195 | |
O’Reilly Automotive Inc. (a) | | | 638 | | | | 219,683 | |
| | | | | | | | |
| | | | | | | 555,063 | |
| | | | | | | | |
|
Biotechnology - 2.6% | |
AbbVie Inc. | | | 11,334 | | | | 1,044,882 | |
Alexion Pharmaceuticals Inc. (a) | | | 1,701 | | | | 165,609 | |
Amgen Inc. | | | 4,872 | | | | 948,432 | |
Biogen Inc. (a) | | | 1,458 | | | | 438,741 | |
Celgene Corp. (a) | | | 5,157 | | | | 330,512 | |
Gilead Sciences Inc. | | | 9,905 | | | | 619,558 | |
Incyte Corp. (a) | | | 1,400 | | | | 89,026 | |
Regeneron Pharmaceuticals Inc. (a) | | | 550 | | | | 205,425 | |
Vertex Pharmaceuticals Inc. (a) | | | 1,900 | | | | 314,849 | |
| | | | | | | | |
| | | | | | | 4,157,034 | |
| | | | | | | | |
|
Brewers - 0.0%* | |
Molson Coors Brewing Co., Class B | | | 1,298 | | | | 72,896 | |
| | | | | | | | |
|
Broadcasting - 0.1% | |
CBS Corp., Class B | | | 2,596 | | | | 113,497 | |
Discovery Inc., Class A (a) | | | 1,497 | | | | 37,036 | |
Discovery Inc., Class C (a) | | | 2,636 | | | | 60,839 | |
| | | | | | | | |
| | | | | | | 211,372 | |
| | | | | | | | |
|
Building Products - 0.3% | |
Allegion PLC | | | 733 | | | | 58,428 | |
AO Smith Corp. | | | 1,300 | | | | 55,510 | |
Fortune Brands Home & Security Inc. | | | 1,000 | | | | 37,990 | |
Johnson Controls International PLC | | | 7,042 | | | | 208,795 | |
Masco Corp. | | | 2,542 | | | | 74,328 | |
| | | | | | | | |
| | | | | | | 435,051 | |
| | | | | | | | |
|
Cable & Satellite - 1.0% | |
Charter Communications Inc., Class A (a) | | | 1,355 | | | | 386,134 | |
Comcast Corp., Class A | | | 34,453 | | | | 1,173,125 | |
DISH Network Corp., Class A (a) | | | 1,500 | | | | 37,455 | |
| | | | | | | | |
| | | | | | | 1,596,714 | |
| | | | | | | | |
| | | | | | | | |
| | | Number
of Shares | | | Fair
Value
$ | |
Casinos & Gaming - 0.1% | |
MGM Resorts International | | | 3,500 | | | | 84,910 | |
Wynn Resorts Ltd. | | | 751 | | | | 74,281 | |
| | | | | | | | |
| | | | | | | 159,191 | |
| | | | | | | | |
|
Commodity Chemicals - 0.1% | |
LyondellBasell Industries N.V., Class A | | | 2,410 | | | | 200,416 | |
| | | | | | | | |
|
Communications Equipment - 1.1% | |
Arista Networks Inc. (a) | | | 350 | | | | 73,745 | |
Cisco Systems Inc. | | | 33,799 | | | | 1,464,510 | |
F5 Networks Inc. (a) | | | 400 | | | | 64,812 | |
Juniper Networks Inc. | | | 2,800 | | | | 75,348 | |
Motorola Solutions Inc. | | | 1,244 | | | | 143,110 | |
| | | | | | | | |
| | | | | | | 1,821,525 | |
| | | | | | | | |
|
Computer & Electronics Retail - 0.1% | |
Best Buy Company Inc. | | | 1,895 | | | | 100,359 | |
| | | | | | | | |
|
Construction & Engineering - 0.1% | |
Fluor Corp. | | | 1,178 | | | | 37,932 | |
Jacobs Engineering Group Inc. | | | 850 | | | | 49,691 | |
Quanta Services Inc. | | | 1,200 | | | | 36,120 | |
| | | | | | | | |
| | | | | | | 123,743 | |
| | | | | | | | |
|
Construction Machinery & Heavy Trucks - 0.5% | |
Caterpillar Inc. | | | 4,408 | | | | 560,125 | |
Cummins Inc. | | | 1,056 | | | | 141,124 | |
PACCAR Inc. | | | 2,703 | | | | 154,449 | |
| | | | | | | | |
| | | | | | | 855,698 | |
| | | | | | | | |
|
Construction Materials - 0.1% | |
Martin Marietta Materials Inc. | | | 500 | | | | 85,935 | |
Vulcan Materials Co. | | | 973 | | | | 96,132 | |
| | | | | | | | |
| | | | | | | 182,067 | |
| | | | | | | | |
|
Consumer Electronics - 0.0%* | |
Garmin Ltd. | | | 1,000 | | | | 63,320 | |
| | | | | | | | |
|
Consumer Finance - 0.7% | |
American Express Co. | | | 5,358 | | | | 510,725 | |
Capital One Financial Corp. | | | 3,626 | | | | 274,089 | |
Discover Financial Services | | | 2,677 | | | | 157,889 | |
Synchrony Financial | | | 5,358 | | | | 125,699 | |
| | | | | | | | |
| | | | | | | 1,068,402 | |
| | | | | | | | |
|
Copper - 0.1% | |
Freeport-McMoRan Inc. | | | 10,498 | | | | 108,234 | |
| | | | | | | | |
See Notes to Schedule of Investments and Notes to Financial Statements.
| | | | |
| State Street S&P 500 Index V.I.S. Fund | | | 7 | |
State Street S&P 500 Index V.I.S. Fund
Schedule of Investments, continued — December 31, 2018
| | | | | | | | |
| | | Number
of Shares | | | Fair
Value
$ | |
| | | | | | | | |
Data Processing & Outsourced Services - 3.4% | |
Alliance Data Systems Corp. | | | 325 | | | | 48,776 | |
Automatic Data Processing Inc. | | | 3,385 | | | | 443,841 | |
Broadridge Financial Solutions Inc. | | | 900 | | | | 86,625 | |
Fidelity National Information Services Inc. | | | 2,400 | | | | 246,120 | |
Fiserv Inc. (a) | | | 3,058 | | | | 224,732 | |
FleetCor Technologies Inc. (a) | | | 700 | | | | 130,004 | |
Global Payments Inc. | | | 1,263 | | | | 130,253 | |
Jack Henry & Associates Inc. | | | 600 | | | | 75,912 | |
Mastercard Inc., Class A | | | 6,844 | | | | 1,291,121 | |
Paychex Inc. | | | 2,534 | | | | 165,090 | |
PayPal Holdings Inc. (a) | | | 8,892 | | | | 747,728 | |
The Western Union Co. | | | 3,224 | | | | 55,002 | |
Total System Services Inc. | | | 1,302 | | | | 105,840 | |
Visa Inc., Class A | | | 13,227 | | | | 1,745,170 | |
| | | | | | | | |
| | | | | | | 5,496,214 | |
| | | | | | | | |
|
Department Stores - 0.1% | |
Kohl’s Corp. | | | 1,273 | | | | 84,451 | |
Macy’s Inc. | | | 2,334 | | | | 69,506 | |
Nordstrom Inc. | | | 992 | | | | 46,237 | |
| | | | | | | | |
| | | | | | | 200,194 | |
| | | | | | | | |
|
Distillers & Vintners - 0.2% | |
Brown-Forman Corp., Class B | | | 1,294 | | | | 61,568 | |
Constellation Brands Inc., Class A | | | 1,279 | | | | 205,689 | |
| | | | | | | | |
| | | | | | | 267,257 | |
| | | | | | | | |
|
Distributors - 0.1% | |
Genuine Parts Co. | | | 1,145 | | | | 109,943 | |
LKQ Corp. (a) | | | 2,452 | | | | 58,186 | |
| | | | | | | | |
| | | | | | | 168,129 | |
| | | | | | | | |
|
Diversified Banks - 4.4% | |
Bank of America Corp. | | | 68,726 | | | | 1,693,409 | |
Citigroup Inc. | | | 18,317 | | | | 953,583 | |
JPMorgan Chase & Co. | | | 25,114 | | | | 2,451,629 | |
U.S. Bancorp | | | 11,549 | | | | 527,789 | |
Wells Fargo & Co. | | | 31,899 | | | | 1,469,906 | |
| | | | | | | | |
| | | | | | | 7,096,316 | |
| | | | | | | | |
|
Diversified Chemicals - 0.6% | |
DowDuPont Inc. | | | 17,525 | | | | 937,237 | |
Eastman Chemical Co. | | | 1,118 | | | | 81,737 | |
| | | | | | | | |
| | | | | | | 1,018,974 | |
| | | | | | | | |
|
Diversified Support Services - 0.1% | |
Cintas Corp. | | | 664 | | | | 111,545 | |
| | | | | | | | |
| | | Number
of Shares | | | Fair
Value
$ | |
Copart Inc. (a) | | | 1,600 | | | | 76,448 | |
| | | | | | | | |
| | | | | | | 187,993 | |
| | | | | | | | |
|
Drug Retail - 0.3% | |
Walgreens Boots Alliance Inc. | | | 6,013 | | | | 410,868 | |
| | | | | | | | |
|
Electric Utilities - 2.0% | |
Alliant Energy Corp. | | | 1,600 | | | | 67,600 | |
American Electric Power Company Inc. | | | 3,683 | | | | 275,268 | |
Duke Energy Corp. | | | 5,404 | | | | 466,365 | |
Edison International | | | 2,442 | | | | 138,632 | |
Entergy Corp. | | | 1,253 | | | | 107,846 | |
Evergy Inc. | | | 1,899 | | | | 107,806 | |
Eversource Energy | | | 2,330 | | | | 151,543 | |
Exelon Corp. | | | 7,334 | | | | 330,763 | |
FirstEnergy Corp. | | | 3,754 | | | | 140,963 | |
NextEra Energy Inc. | | | 3,602 | | | | 626,100 | |
PG&E Corp. (a) | | | 3,754 | | | | 89,158 | |
Pinnacle West Capital Corp. | | | 900 | | | | 76,680 | |
PPL Corp. | | | 5,037 | | | | 142,698 | |
The Southern Co. | | | 7,558 | | | | 331,947 | |
Xcel Energy Inc. | | | 3,780 | | | | 186,241 | |
| | | | | | | | |
| | | | | | | 3,239,610 | |
| | | | | | | | |
|
Electrical Components & Equipment - 0.5% | |
AMETEK Inc. | | | 1,800 | | | | 121,860 | |
Eaton Corporation PLC | | | 3,345 | | | | 229,668 | |
Emerson Electric Co. | | | 4,826 | | | | 288,353 | |
Rockwell Automation Inc. | | | 919 | | | | 138,291 | |
| | | | | | | | |
| | | | | | | 778,172 | |
| | | | | | | | |
|
Electronic Components - 0.2% | |
Amphenol Corp., Class A | | | 2,200 | | | | 178,244 | |
Corning Inc. | | | 5,834 | | | | 176,245 | |
| | | | | | | | |
| | | | | | | 354,489 | |
| | | | | | | | |
|
Electronic Equipment & Instruments - 0.1% | |
FLIR Systems Inc. | | | 1,100 | | | | 47,894 | |
Keysight Technologies Inc. (a) | | | 1,400 | | | | 86,912 | |
| | | | | | | | |
| | | | | | | 134,806 | |
| | | | | | | | |
|
Electronic Manufacturing Services - 0.1% | |
IPG Photonics Corp. (a) | | | 300 | | | | 33,987 | |
TE Connectivity Ltd. | | | 2,654 | | | | 200,722 | |
| | | | | | | | |
| | | | | | | 234,709 | |
| | | | | | | | |
|
Environmental & Facilities Services - 0.3% | |
Republic Services Inc. | | | 1,615 | | | | 116,425 | |
Rollins Inc. | | | 1,200 | | | | 43,320 | |
See Notes to Schedule of Investments and Notes to Financial Statements.
| | |
| 8 | | State Street S&P 500 Index V.I.S. Fund |
State Street S&P 500 Index V.I.S. Fund
Schedule of Investments, continued — December 31, 2018
| | | | | | | | |
| | | Number
of Shares | | | Fair
Value
$ | |
| | | | | | | | |
Waste Management Inc. | | | 2,903 | | | | 258,338 | |
| | | | | | | | |
| | | | | | | 418,083 | |
| | | | | | | | |
|
Fertilizers & Agricultural Chemicals - 0.1% | |
CF Industries Holdings Inc. | | | 1,685 | | | | 73,315 | |
FMC Corp. | | | 1,122 | | | | 82,983 | |
The Mosaic Co. | | | 2,500 | | | | 73,025 | |
| | | | | | | | |
| | | | | | | 229,323 | |
| | | | | | | | |
|
Financial Exchanges & Data - 1.0% | |
Cboe Global Markets Inc. | | | 800 | | | | 78,264 | |
CME Group Inc. | | | 2,674 | | | | 503,033 | |
Intercontinental Exchange Inc. | | | 4,355 | | | | 328,062 | |
Moody’s Corp. | | | 1,329 | | | | 186,113 | |
MSCI Inc. | | | 700 | | | | 103,201 | |
Nasdaq Inc. | | | 968 | | | | 78,960 | |
S&P Global Inc. | | | 1,926 | | | | 327,304 | |
| | | | | | | | |
| | | | | | | 1,604,937 | |
| | | | | | | | |
|
Food Distributors - 0.1% | |
Sysco Corp. | | | 3,749 | | | | 234,912 | |
| | | | | | | | |
|
Food Retail - 0.1% | |
The Kroger Co. | | | 6,090 | | | | 167,475 | |
| | | | | | | | |
|
Footwear - 0.4% | |
NIKE Inc., Class B | | | 9,642 | | | | 714,858 | |
| | | | | | | | |
|
General Merchandise Stores - 0.4% | |
Dollar General Corp. | | | 1,900 | | | | 205,352 | |
Dollar Tree Inc. (a) | | | 1,792 | | | | 161,853 | |
Target Corp. | | | 3,995 | | | | 264,030 | |
| | | | | | | | |
| | | | | | | 631,235 | |
| | | | | | | | |
|
Gold - 0.1% | |
Newmont Mining Corp. | | | 4,011 | | | | 138,981 | |
| | | | | | | | |
|
Health Care REITs - 0.3% | |
HCP Inc. | | | 3,274 | | | | 91,443 | |
Ventas Inc. | | | 2,629 | | | | 154,033 | |
Welltower Inc. | | | 2,800 | | | | 194,348 | |
| | | | | | | | |
| | | | | | | 439,824 | |
| | | | | | | | |
|
Healthcare Distributors - 0.3% | |
AmerisourceBergen Corp. | | | 1,261 | | | | 93,818 | |
Cardinal Health Inc. | | | 2,268 | | | | 101,153 | |
Henry Schein Inc. (a) | | | 1,098 | | | | 86,215 | |
McKesson Corp. | | | 1,489 | | | | 164,490 | |
| | | | | | | | |
| | | | | | | 445,676 | |
| | | | | | | | |
|
Healthcare Equipment - 3.2% | |
Abbott Laboratories | | | 13,314 | | | | 963,002 | |
| | | | | | | | |
| | | Number
of Shares | | | Fair
Value
$ | |
ABIOMED Inc. (a) | | | 300 | | | | 97,512 | |
Baxter International Inc. | | | 3,777 | | | | 248,602 | |
Becton Dickinson and Co. | | | 1,983 | | | | 446,809 | |
Boston Scientific Corp. (a) | | | 10,299 | | | | 363,967 | |
Danaher Corp. | | | 4,700 | | | | 484,664 | |
Edwards Lifesciences Corp. (a) | | | 1,600 | | | | 245,072 | |
Hologic Inc. (a) | | | 1,900 | | | | 78,090 | |
IDEXX Laboratories Inc. (a) | | | 700 | | | | 130,214 | |
Intuitive Surgical Inc. (a) | | | 869 | | | | 416,181 | |
Medtronic PLC | | | 10,106 | | | | 919,242 | |
ResMed Inc. | | | 1,070 | | | | 121,841 | |
Stryker Corp. | | | 2,281 | | | | 357,547 | |
Varian Medical Systems Inc. (a) | | | 634 | | | | 71,838 | |
Zimmer Biomet Holdings Inc. | | | 1,537 | | | | 159,418 | |
| | | | | | | | |
| | | | | | | 5,103,999 | |
| | | | | | | | |
|
Healthcare Facilities - 0.2% | |
HCA Healthcare Inc. | | | 1,991 | | | | 247,780 | |
Universal Health Services Inc., Class B | | | 558 | | | | 65,040 | |
| | | | | | | | |
| | | | | | | 312,820 | |
| | | | | | | | |
|
Healthcare Services - 0.9% | |
Cigna Corp. | | | 2,865 | | | | 544,189 | |
CVS Health Corp. | | | 9,622 | | | | 630,433 | |
DaVita Inc. (a) | | | 858 | | | | 44,153 | |
Laboratory Corporation of America Holdings (a) | | | 800 | | | | 101,088 | |
Quest Diagnostics Inc. | | | 1,000 | | | | 83,270 | |
| | | | | | | | |
| | | | | | | 1,403,133 | |
| | | | | | | | |
|
Healthcare Supplies - 0.2% | |
Align Technology Inc. (a) | | | 561 | | | | 117,490 | |
DENTSPLY SIRONA Inc. | | | 1,532 | | | | 57,006 | |
The Cooper Companies Inc. | | | 315 | | | | 80,167 | |
| | | | | | | | |
| | | | | | | 254,663 | |
| | | | | | | | |
|
Healthcare Technology - 0.1% | |
Cerner Corp. (a) | | | 2,400 | | | | 125,856 | |
| | | | | | | | |
|
Home Building - 0.1% | |
D.R. Horton Inc. | | | 2,400 | | | | 83,184 | |
Lennar Corp., Class A | | | 2,100 | | | | 82,215 | |
PulteGroup Inc. | | | 2,235 | | | | 58,088 | |
| | | | | | | | |
| | | | | | | 223,487 | |
| | | | | | | | |
|
Home Furnishings - 0.1% | |
Leggett & Platt Inc. | | | 1,000 | | | | 35,840 | |
Mohawk Industries Inc. (a) | | | 500 | | | | 58,480 | |
| | | | | | | | |
| | | | | | | 94,320 | |
| | | | | | | | |
See Notes to Schedule of Investments and Notes to Financial Statements.
| | | | |
| State Street S&P 500 Index V.I.S. Fund | | | 9 | |
State Street S&P 500 Index V.I.S. Fund
Schedule of Investments, continued — December 31, 2018
| | | | | | | | |
| | | Number
of Shares | | | Fair
Value
$ | |
| | | | | | | | |
Home Improvement Retail - 1.3% | |
Lowe’s Companies Inc. | | | 6,131 | | | | 566,259 | |
The Home Depot Inc. | | | 8,574 | | | | 1,473,185 | |
| | | | | | | | |
| | | | | | | 2,039,444 | |
| | | | | | | | |
|
Hotel & Resort REITs - 0.1% | |
Host Hotels & Resorts Inc. | | | 5,617 | | | | 93,635 | |
| | | | | | | | |
|
Hotels, Resorts & Cruise Lines - 0.4% | |
Carnival Corp. | | | 2,900 | | | | 142,970 | |
Hilton Worldwide Holdings Inc. | | | 2,100 | | | | 150,780 | |
Marriott International Inc., Class A | | | 2,182 | | | | 236,878 | |
Norwegian Cruise Line Holdings Ltd. (a) | | | 1,500 | | | | 63,585 | |
Royal Caribbean Cruises Ltd. | | | 1,263 | | | | 123,509 | |
| | | | | | | | |
| | | | | | | 717,722 | |
| | | | | | | | |
|
Household Appliances - 0.0%* | |
Whirlpool Corp. | | | 551 | | | | 58,885 | |
| | | | | | | | |
|
Household Products - 1.7% | |
Church & Dwight Company Inc. | | | 1,838 | | | | 120,867 | |
Colgate-Palmolive Co. | | | 6,453 | | | | 384,083 | |
Kimberly-Clark Corp. | | | 2,612 | | | | 297,611 | |
The Clorox Co. | | | 945 | | | | 145,662 | |
The Procter & Gamble Co. | | | 18,751 | | | | 1,723,592 | |
| | | | | | | | |
| | | | | | | 2,671,815 | |
| | | | | | | | |
|
Housewares & Specialties - 0.0%* | |
Newell Brands Inc. | | | 3,534 | | | | 65,697 | |
| | | | | | | | |
|
Human Resource & Employment Services - 0.0%* | |
Robert Half International Inc. | | | 875 | | | | 50,050 | |
| | | | | | | | |
|
Hypermarkets & Super Centers - 1.0% | |
Costco Wholesale Corp. | | | 3,309 | | | | 674,077 | |
Walmart Inc. | | | 10,801 | | | | 1,006,113 | |
| | | | | | | | |
| | | | | | | 1,680,190 | |
| | | | | | | | |
|
Independent Power Producers & Energy Traders - 0.1% | |
AES Corp. | | | 5,500 | | | | 79,530 | |
NRG Energy Inc. | | | 2,038 | | | | 80,705 | |
| | | | | | | | |
| | | | | | | 160,235 | |
| | | | | | | | |
|
Industrial Conglomerates - 1.4% | |
3M Co. | | | 4,406 | | | | 839,519 | |
General Electric Co. | | | 66,094 | | | | 500,332 | |
Honeywell International Inc. | | | 5,591 | | | | 738,683 | |
Roper Technologies Inc. | | | 803 | | | | 214,015 | |
| | | | | | | | |
| | | | | | | 2,292,549 | |
| | | | | | | | |
| | | | | | | | |
| | | Number
of Shares | | | Fair
Value
$ | |
Industrial Gases - 0.6% | |
Air Products & Chemicals Inc. | | | 1,641 | | | | 262,642 | |
Linde PLC | | | 4,162 | | | | 649,439 | |
| | | | | | | | |
| | | | | | | 912,081 | |
| | | | | | | | |
|
Industrial Machinery - 0.7% | |
Dover Corp. | | | 1,009 | | | | 71,589 | |
Flowserve Corp. | | | 900 | | | | 34,218 | |
Fortive Corp. | | | 2,149 | | | | 145,401 | |
Illinois Tool Works Inc. | | | 2,260 | | | | 286,319 | |
Ingersoll-Rand PLC | | | 1,800 | | | | 164,214 | |
Parker-Hannifin Corp. | | | 1,034 | | | | 154,211 | |
Pentair PLC | | | 1,407 | | | | 53,157 | |
Snap-on Inc. | | | 409 | | | | 59,424 | |
Stanley Black & Decker Inc. | | | 1,099 | | | | 131,594 | |
Xylem Inc. | | | 1,281 | | | | 85,468 | |
| | | | | | | | |
| | | | | | | 1,185,595 | |
| | | | | | | | |
|
Industrial REITs - 0.2% | |
Duke Realty Corp. | | | 2,500 | | | | 64,750 | |
Prologis Inc. REIT | | | 4,829 | | | | 283,559 | |
| | | | | | | | |
| | | | | | | 348,309 | |
| | | | | | | | |
|
Insurance Brokers - 0.5% | |
Aon PLC | | | 1,834 | | | | 266,590 | |
Arthur J Gallagher & Co. | | | 1,427 | | | | 105,170 | |
Marsh & McLennan Companies Inc. | | | 3,909 | | | | 311,743 | |
Willis Towers Watson PLC | | | 958 | | | | 145,482 | |
| | | | | | | | |
| | | | | | | 828,985 | |
| | | | | | | | |
|
Integrated Oil & Gas - 2.6% | |
Chevron Corp. | �� | | 14,449 | | | | 1,571,907 | |
Exxon Mobil Corp. | | | 31,944 | | | | 2,178,261 | |
Occidental Petroleum Corp. | | | 5,657 | | | | 347,227 | |
| | | | | | | | |
| | | | | | | 4,097,395 | |
| | | | | | | | |
|
Integrated Telecommunication Services - 2.1% | |
AT&T Inc. | | | 54,766 | | | | 1,563,022 | |
Verizon Communications Inc. | | | 31,192 | | | | 1,753,614 | |
| | | | | | | | |
| | | | | | | 3,316,636 | |
| | | | | | | | |
|
Interactive Home Entertainment - 0.3% | |
Activision Blizzard Inc. | | | 5,800 | | | | 270,106 | |
Electronic Arts Inc. (a) | | | 2,305 | | | | 181,888 | |
Take-Two Interactive Software Inc. (a) | | | 900 | | | | 92,646 | |
| | | | | | | | |
| | | | | | | 544,640 | |
| | | | | | | | |
|
Interactive Media & Services - 4.6% | |
Alphabet Inc., Class A (a) | | | 2,266 | | | | 2,367,880 | |
See Notes to Schedule of Investments and Notes to Financial Statements.
| | |
| 10 | | State Street S&P 500 Index V.I.S. Fund |
State Street S&P 500 Index V.I.S. Fund
Schedule of Investments, continued — December 31, 2018
| | | | | | | | |
| | | Number
of Shares | | | Fair
Value
$ | |
| | | | | | | | |
Alphabet Inc., Class C (a)(c) | | | 2,335 | | | | 2,418,149 | |
Facebook Inc., Class A (a) | | | 18,224 | | | | 2,388,984 | |
TripAdvisor Inc. (a) | | | 650 | | | | 35,061 | |
Twitter Inc. (a) | | | 5,100 | | | | 146,574 | |
| | | | | | | | |
| | | | | | | 7,356,648 | |
| | | | | | | | |
|
Internet & Direct Marketing Retail - 3.4% | |
Amazon.com Inc. (a) | | | 3,092 | | | | 4,644,091 | |
Booking Holdings Inc. (a) | | | 353 | | | | 608,014 | |
eBay Inc. (a) | | | 6,960 | | | | 195,367 | |
Expedia Group Inc. | | | 850 | | | | 95,753 | |
| | | | | | | | |
| | | | | | | 5,543,225 | |
| | | | | | | | |
|
Internet Services & Infrastructure - 0.1% | |
Akamai Technologies Inc. (a) | | | 1,333 | | | | 81,420 | |
VeriSign Inc. (a) | | | 824 | | | | 122,191 | |
| | | | | | | | |
| | | | | | | 203,611 | |
| | | | | | | | |
|
Investment Banking & Brokerage - 0.9% | |
E*TRADE Financial Corp. | | | 2,040 | | | | 89,515 | |
Morgan Stanley | | | 9,929 | | | | 393,685 | |
Raymond James Financial Inc. | | | 1,100 | | | | 81,851 | |
The Charles Schwab Corp. | | | 9,211 | | | | 382,533 | |
The Goldman Sachs Group Inc. | | | 2,603 | | | | 434,831 | |
| | | | | | | | |
| | | | | | | 1,382,415 | |
| | | | | | | | |
|
IT Consulting & Other Services - 1.2% | |
Accenture PLC, Class A | | | 4,845 | | | | 683,194 | |
Cognizant Technology Solutions Corp., Class A | | | 4,519 | | | | 286,866 | |
DXC Technology Co. | | | 2,124 | | | | 112,933 | |
Gartner Inc. (a) | | | 700 | | | | 89,488 | |
International Business Machines Corp. | | | 6,811 | | | | 774,206 | |
| | | | | | | | |
| | | | | | | 1,946,687 | |
| | | | | | | | |
|
Leisure Products - 0.1% | |
Hasbro Inc. | | | 796 | | | | 64,675 | |
Mattel Inc. (a) | | | 3,296 | | | | 32,927 | |
| | | | | | | | |
| | | | | | | 97,602 | |
| | | | | | | | |
|
Life & Health Insurance - 0.7% | |
Aflac Inc. | | | 5,848 | | | | 266,435 | |
Brighthouse Financial Inc. (a) | | | 841 | | | | 25,634 | |
Lincoln National Corp. | | | 1,759 | | | | 90,254 | |
MetLife Inc. | | | 7,360 | | | | 302,202 | |
Principal Financial Group Inc. | | | 2,111 | | | | 93,243 | |
Prudential Financial Inc. | | | 3,201 | | | | 261,041 | |
Torchmark Corp. | | | 666 | | | | 49,637 | |
Unum Group | | | 1,589 | | | | 46,685 | |
| | | | | | | | |
| | | | | | | 1,135,131 | |
| | | | | | | | |
| | | | | | | | |
| | | Number
of Shares | | | Fair
Value
$ | |
Life Sciences Tools & Services - 1.0% | |
Agilent Technologies Inc. | | | 2,538 | | | | 171,213 | |
Illumina Inc. (a) | | | 1,101 | | | | 330,223 | |
IQVIA Holdings Inc. (a) | | | 1,200 | | | | 139,404 | |
Mettler-Toledo International Inc. (a) | | | 207 | | | | 117,075 | |
PerkinElmer Inc. | | | 711 | | | | 55,849 | |
Thermo Fisher Scientific Inc. | | | 3,028 | | | | 677,636 | |
Waters Corp. (a) | | | 584 | | | | 110,172 | |
| | | | | | | | |
| | | | | | | 1,601,572 | |
| | | | | | | | |
|
Managed Healthcare - 1.8% | |
Anthem Inc. | | | 1,981 | | | | 520,270 | |
Centene Corp. (a) | | | 1,600 | | | | 184,480 | |
Humana Inc. | | | 1,027 | | | | 294,215 | |
UnitedHealth Group Inc. | | | 7,248 | | | | 1,805,622 | |
WellCare Health Plans Inc. (a) | | | 400 | | | | 94,436 | |
| | | | | | | | |
| | | | | | | 2,899,023 | |
| | | | | | | | |
|
Metal & Glass Containers - 0.1% | |
Ball Corp. | | | 2,682 | | | | 123,318 | |
| | | | | | | | |
|
Motorcycle Manufacturers - 0.0%* | |
Harley-Davidson Inc. | | | 1,135 | | | | 38,726 | |
| | | | | | | | |
|
Movies & Entertainment - 1.7% | |
Netflix Inc. (a) | | | 3,328 | | | | 890,772 | |
The Walt Disney Co. | | | 11,215 | | | | 1,229,725 | |
Twenty-First Century Fox Inc., Class A | | | 8,190 | | | | 394,103 | |
Twenty-First Century Fox Inc., Class B | | | 3,392 | | | | 162,070 | |
Viacom Inc., Class B | | | 2,846 | | | | 73,142 | |
| | | | | | | | |
| | | | | | | 2,749,812 | |
| | | | | | | | |
|
Multi-Line Insurance - 0.3% | |
American International Group Inc. | | | 6,887 | | | | 271,417 | |
Assurant Inc. | | | 500 | | | | 44,720 | |
Loews Corp. | | | 1,862 | | | | 84,758 | |
The Hartford Financial Services Group Inc. | | | 2,544 | | | | 113,081 | |
| | | | | | | | |
| | | | | | | 513,976 | |
| | | | | | | | |
|
Multi-Sector Holdings - 1.9% | |
Berkshire Hathaway Inc., Class B (a) | | | 14,773 | | | | 3,016,351 | |
Jefferies Financial Group Inc. | | | 2,200 | | | | 38,192 | |
| | | | | | | | |
| | | | | | | 3,054,543 | |
| | | | | | | | |
|
Multi-Utilities - 1.1% | |
Ameren Corp. | | | 1,942 | | | | 126,677 | |
See Notes to Schedule of Investments and Notes to Financial Statements.
| | | | |
| State Street S&P 500 Index V.I.S. Fund | | | 11 | |
State Street S&P 500 Index V.I.S. Fund
Schedule of Investments, continued — December 31, 2018
| | | | | | | | |
| | | Number
of Shares | | | Fair
Value
$ | |
| | | | | | | | |
CenterPoint Energy Inc. | | | 3,718 | | | | 104,959 | |
CMS Energy Corp. | | | 2,000 | | | | 99,300 | |
Consolidated Edison Inc. | | | 2,255 | | | | 172,417 | |
Dominion Energy Inc. | | | 4,982 | | | | 356,014 | |
DTE Energy Co. | | | 1,366 | | | | 150,670 | |
NiSource Inc. | | | 2,515 | | | | 63,755 | |
Public Service Enterprise Group Inc. | | | 3,792 | | | | 197,374 | |
SCANA Corp. | | | 1,100 | | | | 52,558 | |
Sempra Energy | | | 2,100 | | | | 227,199 | |
WEC Energy Group Inc. | | | 2,474 | | | | 171,349 | |
| | | | | | | | |
| | | | | | | 1,722,272 | |
| | | | | | | | |
|
Office REITs - 0.2% | |
Alexandria Real Estate Equities Inc. | | | 800 | | | | 92,192 | |
Boston Properties Inc. | | | 1,098 | | | | 123,580 | |
SL Green Realty Corp. | | | 600 | | | | 47,448 | |
Vornado Realty Trust | | | 1,211 | | | | 75,118 | |
| | | | | | | | |
| | | | | | | 338,338 | |
| | | | | | | | |
|
Oil & Gas Drilling - 0.0%* | |
Helmerich & Payne Inc. | | | 900 | | | | 43,146 | |
| | | | | | | | |
|
Oil & Gas Equipment & Services - 0.5% | |
Baker Hughes a GE Co. | | | 2,981 | | | | 64,091 | |
Halliburton Co. | | | 6,850 | | | | 182,073 | |
National Oilwell Varco Inc. | | | 2,846 | | | | 73,142 | |
Schlumberger Ltd. | | | 10,671 | | | | 385,010 | |
TechnipFMC PLC | | | 3,386 | | | | 66,298 | |
| | | | | | | | |
| | | | | | | 770,614 | |
| | | | | | | | |
|
Oil & Gas Exploration & Production - 1.3% | |
Anadarko Petroleum Corp. | | | 3,657 | | | | 160,323 | |
Apache Corp. | | | 2,948 | | | | 77,385 | |
Cabot Oil & Gas Corp. | | | 3,600 | | | | 80,460 | |
Cimarex Energy Co. | | | 700 | | | | 43,155 | |
Concho Resources Inc. (a) | | | 1,500 | | | | 154,185 | |
ConocoPhillips | | | 8,740 | | | | 544,939 | |
Devon Energy Corp. | | | 3,592 | | | | 80,964 | |
Diamondback Energy Inc. | | | 1,100 | | | | 101,970 | |
EOG Resources Inc. | | | 4,300 | | | | 375,003 | |
Hess Corp. | | | 2,049 | | | | 82,984 | |
Marathon Oil Corp. | | | 5,742 | | | | 82,340 | |
Newfield Exploration Co. (a) | | | 1,300 | | | | 19,058 | |
Noble Energy Inc. | | | 3,700 | | | | 69,412 | |
Pioneer Natural Resources Co. | | | 1,300 | | | | 170,976 | |
| | | | | | | | |
| | | | | | | 2,043,154 | |
| | | | | | | | |
|
Oil & Gas Refining & Marketing - 0.5% | |
HollyFrontier Corp. | | | 1,300 | | | | 66,456 | |
Marathon Petroleum Corp. | | | 4,976 | | | | 293,634 | |
| | | | | | | | |
| | | Number
of Shares | | | Fair
Value
$ | |
Phillips 66 | | | 3,161 | | | | 272,320 | |
Valero Energy Corp. | | | 3,228 | | | | 242,003 | |
| | | | | | | | |
| | | | | | | 874,413 | |
| | | | | | | | |
|
Oil & Gas Storage & Transportation - 0.4% | |
Kinder Morgan Inc. | | | 14,304 | | | | 219,995 | |
ONEOK Inc. | | | 3,000 | | | | 161,850 | |
The Williams Companies Inc. | | | 9,171 | | | | 202,221 | |
| | | | | | | | |
| | | | | | | 584,066 | |
| | | | | | | | |
|
Packaged Foods & Meats - 1.0% | |
Campbell Soup Co. | | | 1,615 | | | | 53,279 | |
Conagra Brands Inc. | | | 3,254 | | | | 69,505 | |
General Mills Inc. | | | 4,436 | | | | 172,738 | |
Hormel Foods Corp. | | | 1,800 | | | | 76,824 | |
Kellogg Co. | | | 1,890 | | | | 107,749 | |
Lamb Weston Holdings Inc. | | | 1,100 | | | | 80,916 | |
McCormick & Company Inc. | | | 900 | | | | 125,316 | |
Mondelez International Inc., Class A | | | 11,135 | | | | 445,734 | |
The Hershey Co. | | | 1,016 | | | | 108,895 | |
The JM Smucker Co. | | | 947 | | | | 88,535 | |
The Kraft Heinz Co. | | | 4,795 | | | | 206,377 | |
Tyson Foods Inc., Class A | | | 2,362 | | | | 126,131 | |
| | | | | | | | |
| | | | | | | 1,661,999 | |
| | | | | | | | |
|
Paper Packaging - 0.2% | |
Avery Dennison Corp. | | | 692 | | | | 62,162 | |
International Paper Co. | | | 3,030 | | | | 122,291 | |
Packaging Corporation of America | | | 800 | | | | 66,768 | |
Sealed Air Corp. | | | 1,331 | | | | 46,372 | |
WestRock Co. | | | 1,775 | | | | 67,024 | |
| | | | | | | | |
| | | | | | | 364,617 | |
| | | | | | | | |
|
Personal Products - 0.2% | |
Coty Inc., Class A | | | 3,445 | | | | 22,599 | |
The Estee Lauder Companies Inc., Class A | | | 1,679 | | | | 218,438 | |
| | | | | | | | |
| | | | | | | 241,037 | |
| | | | | | | | |
|
Pharmaceuticals - 5.2% | |
Allergan PLC (c) | | | 2,451 | | | | 327,601 | |
Bristol-Myers Squibb Co. | | | 12,387 | | | | 643,876 | |
Eli Lilly & Co. | | | 7,154 | | | | 827,861 | |
Johnson & Johnson | | | 20,312 | | | | 2,621,263 | |
Merck & Company Inc. | | | 19,568 | | | | 1,495,191 | |
Mylan N.V. (a) | | | 3,904 | | | | 106,970 | |
Nektar Therapeutics (a) | | | 1,300 | | | | 42,731 | |
Perrigo Company PLC | | | 975 | | | | 37,781 | |
Pfizer Inc. | | | 43,535 | | | | 1,900,303 | |
Zoetis Inc. | | | 3,546 | | | | 303,325 | |
| | | | | | | | |
| | | | | | | 8,306,902 | |
| | | | | | | | |
See Notes to Schedule of Investments and Notes to Financial Statements.
| | |
| 12 | | State Street S&P 500 Index V.I.S. Fund |
State Street S&P 500 Index V.I.S. Fund
Schedule of Investments, continued — December 31, 2018
| | | | | | | | |
| | | Number
of Shares | | | Fair
Value
$ | |
| | | | | | | | |
Property & Casualty Insurance - 0.8% | |
Chubb Ltd. | | | 3,461 | | | | 447,092 | |
Cincinnati Financial Corp. | | | 1,092 | | | | 84,543 | |
The Allstate Corp. | | | 2,586 | | | | 213,681 | |
The Progressive Corp. | | | 4,573 | | | | 275,889 | |
The Travelers Companies Inc. | | | 2,067 | | | | 247,523 | |
| | | | | | | | |
| | | | | | | 1,268,728 | |
| | | | | | | | |
|
Publishing - 0.0%* | |
News Corp., Class A | | | 3,400 | | | | 38,590 | |
| | | | | | | | |
|
Railroads - 0.9% | |
CSX Corp. | | | 5,967 | | | | 370,730 | |
Kansas City Southern | | | 700 | | | | 66,815 | |
Norfolk Southern Corp. | | | 2,045 | | | | 305,809 | |
Union Pacific Corp. | | | 5,580 | | | | 771,323 | |
| | | | | | | | |
| | | | | | | 1,514,677 | |
| | | | | | | | |
|
Real Estate Services - 0.1% | |
CBRE Group Inc., Class A (a) | | | 2,573 | | | | 103,023 | |
| | | | | | | | |
|
Regional Banks - 1.2% | |
BB&T Corp. | | | 5,837 | | | | 252,859 | |
Citizens Financial Group Inc. | | | 3,400 | | | | 101,082 | |
Comerica Inc. | | | 1,356 | | | | 93,144 | |
Fifth Third Bancorp | | | 5,350 | | | | 125,885 | |
First Republic Bank | | | 1,200 | | | | 104,280 | |
Huntington Bancshares Inc. | | | 8,234 | | | | 98,149 | |
KeyCorp | | | 8,028 | | | | 118,654 | |
M&T Bank Corp. | | | 1,090 | | | | 156,012 | |
People’s United Financial Inc. | | | 3,200 | | | | 46,176 | |
Regions Financial Corp. | | | 7,168 | | | | 95,908 | |
SunTrust Banks Inc. | | | 3,529 | | | | 178,003 | |
SVB Financial Group (a) | | | 400 | | | | 75,968 | |
The PNC Financial Services Group Inc. | | | 3,539 | | | | 413,744 | |
Zions Bancorp NA | | | 1,500 | | | | 61,110 | |
| | | | | | | | |
| | | | | | | 1,920,974 | |
| | | | | | | | |
|
Reinsurance - 0.0%* | |
Everest Re Group Ltd. | | | 300 | | | | 65,328 | |
| | | | | | | | |
|
Research & Consulting Services - 0.3% | |
Equifax Inc. | | | 846 | | | | 78,788 | |
IHS Markit Ltd. (a) | | | 2,800 | | | | 134,316 | |
Nielsen Holdings PLC | | | 2,928 | | | | 68,310 | |
Verisk Analytics Inc. (a) | | | 1,200 | | | | 130,848 | |
| | | | | | | | |
| | | | | | | 412,262 | |
| | | | | | | | |
|
Residential REITs - 0.4% | |
Apartment Investment & Management Co., Class A | | | 977 | | | | 42,871 | |
| | | | | | | | |
| | | Number
of Shares | | | Fair
Value
$ | |
AvalonBay Communities Inc. | | | 972 | | | | 169,176 | |
Equity Residential | | | 2,808 | | | | 185,356 | |
Essex Property Trust Inc. | | | 500 | | | | 122,605 | |
Mid-America Apartment Communities Inc. | | | 900 | | | | 86,130 | |
UDR Inc. | | | 1,900 | | | | 75,278 | |
| | | | | | | | |
| | | | | | | 681,416 | |
| | | | | | | | |
|
Restaurants - 1.3% | |
Chipotle Mexican Grill Inc. (a) | | | 160 | | | | 69,086 | |
Darden Restaurants Inc. | | | 1,029 | | | | 102,756 | |
McDonald’s Corp. (c) | | | 5,859 | | | | 1,040,383 | |
Starbucks Corp. | | | 9,362 | | | | 602,913 | |
Yum! Brands Inc. | | | 2,274 | | | | 209,026 | |
| | | | | | | | |
| | | | | | | 2,024,164 | |
| | | | | | | | |
|
Retail REITs - 0.5% | |
Federal Realty Investment Trust | | | 600 | | | | 70,824 | |
Kimco Realty Corp. | | | 3,097 | | | | 45,371 | |
Realty Income Corp. | | | 2,000 | | | | 126,080 | |
Regency Centers Corp. | | | 1,299 | | | | 76,226 | |
Simon Property Group Inc. | | | 2,379 | | | | 399,648 | |
The Macerich Co. | | | 744 | | | | 32,200 | |
| | | | | | | | |
| | | | | | | 750,349 | |
| | | | | | | | |
|
Semiconductor Equipment - 0.3% | |
Applied Materials Inc. | | | 7,438 | | | | 243,520 | |
KLA-Tencor Corp. | | | 1,178 | | | | 105,419 | |
Lam Research Corp. | | | 1,247 | | | | 169,804 | |
| | | | | | | | |
| | | | | | | 518,743 | |
| | | | | | | | |
|
Semiconductors - 3.4% | |
Advanced Micro Devices Inc. (a) | | | 6,600 | | | | 121,836 | |
Analog Devices Inc. | | | 2,787 | | | | 239,208 | |
Broadcom Inc. | | | 3,116 | | | | 792,336 | |
Intel Corp. | | | 34,700 | | | | 1,628,471 | |
Maxim Integrated Products Inc. | | | 2,100 | | | | 106,785 | |
Microchip Technology Inc. | | | 1,800 | | | | 129,456 | |
Micron Technology Inc. (a) | | | 8,726 | | | | 276,876 | |
NVIDIA Corp. | | | 4,638 | | | | 619,173 | |
Qorvo Inc. (a) | | | 1,100 | | | | 66,803 | |
QUALCOMM Inc. | | | 9,168 | | | | 521,751 | |
Skyworks Solutions Inc. | | | 1,342 | | | | 89,941 | |
Texas Instruments Inc. | | | 7,309 | | | | 690,701 | |
Xilinx Inc. | | | 1,787 | | | | 152,199 | |
| | | | | | | | |
| | | | | | | 5,435,536 | |
| | | | | | | | |
|
Soft Drinks - 1.7% | |
Monster Beverage Corp. (a) | | | 3,056 | | | | 150,416 | |
PepsiCo Inc. | | | 10,754 | | | | 1,188,102 | |
The Coca-Cola Co. | | | 28,870 | | | | 1,366,995 | |
| | | | | | | | |
| | | | | | | 2,705,513 | |
| | | | | | | | |
See Notes to Schedule of Investments and Notes to Financial Statements.
| | | | |
| State Street S&P 500 Index V.I.S. Fund | | | 13 | |
State Street S&P 500 Index V.I.S. Fund
Schedule of Investments, continued — December 31, 2018
| | | | | | | | |
| | | Number
of Shares | | | Fair
Value
$ | |
| | | | | | | | |
Specialized Consumer Services - 0.0%* | |
H&R Block Inc. | | | 1,579 | | | | 40,059 | |
| | | | | | | | |
|
Specialized REITs - 1.2% | |
American Tower Corp. | | | 3,391 | | | | 536,422 | |
Crown Castle International Corp. | | | 3,100 | | | | 336,753 | |
Digital Realty Trust Inc. | | | 1,500 | | | | 159,825 | |
Equinix Inc. | | | 596 | | | | 210,126 | |
Extra Space Storage Inc. | | | 1,000 | | | | 90,480 | |
Iron Mountain Inc. | | | 1,886 | | | | 61,125 | |
Public Storage | | | 1,130 | | | | 228,723 | |
SBA Communications Corp. (a) | | | 900 | | | | 145,701 | |
Weyerhaeuser Co. | | | 5,567 | | | | 121,695 | |
| | | | | | | | |
| | | | | | | 1,890,850 | |
| | | | | | | | |
|
Specialty Chemicals - 0.6% | |
Albemarle Corp. | | | 900 | | | | 69,363 | |
Celanese Corp. | | | 900 | | | | 80,973 | |
Ecolab Inc. | | | 1,902 | | | | 280,260 | |
International Flavors & Fragrances Inc. | | | 647 | | | | 86,873 | |
PPG Industries Inc. | | | 1,859 | | | | 190,045 | |
The Sherwin-Williams Co. | | | 613 | | | | 241,191 | |
| | | | | | | | |
| | | | | | | 948,705 | |
| | | | | | | | |
|
Specialty Stores - 0.1% | |
Tiffany & Co. | | | 704 | | | | 56,679 | |
Tractor Supply Co. | | | 837 | | | | 69,839 | |
Ulta Salon Cosmetics & Fragrance Inc. (a) | | | 400 | | | | 97,936 | |
| | | | | | | | |
| | | | | | | 224,454 | |
| | | | | | | | |
|
Steel - 0.1% | |
Nucor Corp. | | | 2,259 | | | | 117,039 | |
| | | | | | | | |
|
Systems Software - 4.5% | |
Fortinet Inc. (a) | | | 1,100 | | | | 77,473 | |
Microsoft Corp. | | | 58,322 | | | | 5,923,766 | |
Oracle Corp. | | | 19,211 | | | | 867,377 | |
Red Hat Inc. (a) | | | 1,300 | | | | 228,332 | |
Symantec Corp. | | | 4,672 | | | | 88,277 | |
| | | | | | | | |
| | | | | | | 7,185,225 | |
| | | | | | | | |
| | | | | | | | |
| | | Number
of Shares | | | Fair
Value
$ | |
Technology Hardware, Storage & Peripherals - 3.8% | |
Apple Inc. | | | 34,160 | | | | 5,388,398 | |
Hewlett Packard Enterprise Co. | | | 10,619 | | | | 140,277 | |
HP Inc. | | | 12,154 | | | | 248,671 | |
NetApp Inc. | | | 1,870 | | | | 111,583 | |
Seagate Technology PLC | | | 2,132 | | | | 82,274 | |
Western Digital Corp. | | | 2,077 | | | | 76,787 | |
Xerox Corp. | | | 1,811 | | | | 35,785 | |
| | | | | | | | |
| | | | | | | 6,083,775 | |
| | | | | | | | |
|
Tires & Rubber - 0.0%* | |
The Goodyear Tire & Rubber Co. | | | 2,019 | | | | 41,208 | |
| | | | | | | | |
|
Tobacco - 0.9% | |
Altria Group Inc. | | | 14,039 | | | | 693,386 | |
Philip Morris International Inc. | | | 11,683 | | | | 779,957 | |
| | | | | | | | |
| | | | | | | 1,473,343 | |
| | | | | | | | |
|
Trading Companies & Distributors - 0.2% | |
Fastenal Co. | | | 2,200 | | | | 115,038 | |
United Rentals Inc. (a) | | | 700 | | | | 71,771 | |
WW Grainger Inc. | | | 282 | | | | 79,626 | |
| | | | | | | | |
| | | | | | | 266,435 | |
| | | | | | | | |
|
Trucking - 0.0%* | |
JB Hunt Transport Services Inc. | | | 720 | | | | 66,989 | |
| | | | | | | | |
|
Water Utilities - 0.1% | |
American Water Works Company Inc. | | | 1,400 | | | | 127,078 | |
| | | | | | | | |
| | |
Total Common Stock
(Cost $73,337,904) | | | | | | | 158,949,496 | |
| | | | | | | | |
|
| Short-Term Investments - 1.1% | |
State Street Institutional U.S. Government Money Market Fund - Class G Shares 2.31%
(Cost $1,781,046) (d)(e) | | | 1,781,046 | | | | 1,781,046 | |
| | | | | | | | |
| |
Total Investments
(Cost $75,118,950) | | | | 160,730,542 | |
| |
| Other Assets and Liabilities, net - 0.1% | | | | 171,729 | |
| | | | | | | | |
| | |
| NET ASSETS - 100.0% | | | | | | | 160,902,271 | |
| | | | | | | | |
Other Information:
The Fund had the following long futures contracts open at December 31, 2018:
| | | | | | | | | | | | | | | | | | | | |
| Description | | Expiration
date | | | Number of
Contracts | | | Notional
Amount | | | Value | | | Unrealized
Depreciation | |
| | | | | | | | | | | | | | | | | | | | |
S&P 500 Emini Index Futures | | | March 2019 | | | | 18 | | | $ | 2,344,770 | | | $ | 2,254,639 | | | $ | (90,131 | ) |
| | | | | | | | | | | | | | | | | | | | |
During the year ended December 31, 2018, average notional value related to long futures contracts was $2,722,424.
See accompanying notes to financial statements.
| | |
| 14 | | State Street S&P 500 Index V.I.S. Fund |
State Street S&P 500 Index V.I.S. Fund
Notes to Schedule of Investments — December 31, 2018
The views expressed in this document reflect our judgment as of the publication date and are subject to change at any time without notice. The securities cited may not be representative of the Fund’s future investments and should not be construed as a recommendation to purchase or sell a particular security. See the Fund’s summary prospectus and statutory prospectus for complete descriptions of investment objectives, policies, risks and permissible investments.
| (a) | Non-income producing security. |
| (b) | State Street Corp. is the parent company of State Street Bank & Trust Co., the Fund’ssub-administrator, custodian and accounting agent. |
| (c) | At December 31, 2018, all or a portion of this security was pledged to cover collateral requirements for futures. |
| (d) | Sponsored by SSGA Funds Management, Inc., the Fund’s investment adviser and administrator, and an affiliate of State Street Bank & Trust Co., the Fund’ssub-administrator, custodian and accounting agent. |
| (e) | Coupon amount represents effective yield. |
| † | Percentages are based on net assets as of December 31, 2018. |
Abbreviations:
REIT - Real Estate Investment Trust
The following table represents the Fund’s investments measured at fair value on a recurring basis at December 31, 2018:
| | | | | | | | | | | | | | | | |
| | | Level 1 | | | Level 2 | | | Level 3 | | | Total | |
| | | | | | | | | | | | | | | | |
Investments in Securities | | | | | | | | | | | | | | | | |
Common Stock | | $ | 158,949,496 | | | $ | — | | | $ | — | | | $ | 158,949,496 | |
Short-Term Investments | | | 1,781,046 | | | | — | | | | — | | | | 1,781,046 | |
| | | | | | | | | | | | | | | | |
Total Investments in Securities | | $ | 160,730,542 | | | $ | — | | | $ | — | | | $ | 160,730,542 | |
| | | | | | | | | | | | | | | | |
Other Financial Instruments | | | | | | | | | | | | | | | | |
Long Futures Contracts - Unrealized Depreciation | | $ | (90,131 | ) | | $ | — | | | $ | — | | | $ | (90,131 | ) |
| | | | | | | | | | | | | | | | |
Affiliate Table
| | | | | | | | | | | | | | | | | | | | | | | | | | | | | | | | | | | | |
| | | Number
of Shares
Held at
12/31/17 | | | Value at
12/31/17 | | | Cost of
Purchases | | | Proceeds
from
Shares
Sold | | | Realized
Gain
(Loss) | | | Change in
Unrealized
Appreciation/
Depreciation | | | Number
of Shares
Held at
12/31/18 | | | Value at
12/31/18 | | | Dividend
Income | |
State Street Corp. | | | 3,111 | | | $ | 303,665 | | | $ | — | | | $ | 20,315 | | | $ | 6,151 | | | $ | (105,904 | ) | | | 2,911 | | | $ | 183,597 | | | $ | 5,182 | |
State Street Institutional U.S. Government Money Market Fund - Class G Shares | | | 2,080,142 | | | | 2,080,142 | | | | 23,715,333 | | | | 24,014,429 | | | | — | | | | — | | | | 1,781,046 | | | $ | 1,781,046 | | | | 41,624 | |
| | | | | | | | | | | | | | | | | | | | | | | | | | | | | | | | | | | | |
| | | | | | | | | |
TOTAL | | | | | | $ | 2,383,807 | | | $ | 23,715,333 | | | $ | 24,034,744 | | | $ | 6,151 | | | $ | (105,904 | ) | | | | | | $ | 1,964,643 | | | $ | 46,806 | |
| | | | | | | | | | | | | | | | | | | | | | | | | | | | | | | | | | | | |
See Notes to Schedule of Investments and Notes to Financial Statements.
| | | | |
| State Street S&P 500 Index V.I.S. Fund | | | 15 | |
State Street S&P 500 Index V.I.S. Fund
Financial Highlights
Selected data based on a share outstanding throughout the fiscal years indicated
| | | | | | | | | | | | | | | | | | | | |
| | | 12/31/18 | �� | | 12/31/17 | | | 12/31/16 | | | 12/31/15* | | | 12/31/14* | |
| Inception date | | | | | | | | | | | | | | | | | | | 4/15/85 | |
| | | | | |
Net asset value, beginning of period | | $ | 44.09 | | | $ | 38.22 | | | $ | 36.16 | | | $ | 36.60 | | | $ | 32.83 | |
| | | | | | | | | | | | | | | | | | | | |
|
Income/(loss) from investment operations: | |
Net investment income | | | 0.74 | (a) | | | 0.71 | (a) | | | 0.72 | | | | 0.69 | | | | 0.61 | |
Net realized and unrealized gains/(losses) on investments | | | (2.86 | ) | | | 7.52 | | | | 3.49 | | | | (0.28 | ) | | | 3.76 | |
| | | | | | | | | | | | | | | | | | | | |
Total income/(loss) from investment operations | | | (2.12 | ) | | | 8.23 | | | | 4.21 | | | | 0.41 | | | | 4.37 | |
| | | | | | | | | | | | | | | | | | | | |
|
Less distributions from: | |
Net investment income | | | 0.80 | | | | 0.79 | | | | 0.73 | | | | 0.85 | | | | 0.60 | |
Net realized gains | | | 3.04 | | | | 1.57 | | | | 1.42 | | | | — | | | | — | |
| | | | | | | | | | | | | | | | | | | | |
Total distributions | | | 3.84 | | | | 2.36 | | | | 2.15 | | | | 0.85 | | | | 0.60 | |
| | | | | | | | | | | | | | | | | | | | |
Net asset value, end of period | | $ | 38.13 | | | $ | 44.09 | | | $ | 38.22 | | | $ | 36.16 | | | $ | 36.60 | |
| | | | | | | | | | | | | | | | | | | | |
Total Return(b) | | | (4.73 | )% | | | 21.50 | % | | | 11.61 | % | | | 1.07 | % | | | 13.28 | % |
|
Ratios/Supplemental Data: | |
Net assets, end of period (in thousands) | | $ | 160,902 | | | $ | 194,117 | | | $ | 180,761 | | | $ | 179,395 | | | $ | 203,262 | |
|
Ratios to average net assets: | |
Net expenses | | | 0.33 | % | | | 0.32 | % | | | 0.34 | %(d) | | | 0.37 | %(d) | | | 0.41 | %(c)(d) |
Gross expenses | | | 0.33 | % | | | 0.32 | % | | | 0.37 | % | | | 0.42 | % | | | 0.46 | % |
Net investment income | | | 1.62 | % | | | 1.69 | % | | | 1.86 | % | | | 1.72 | % | | | 1.65 | % |
Portfolio turnover rate | | | 2 | % | | | 2 | % | | | 2 | % | | | 2 | % | | | 2 | % |
Notes to Financial Highlights
| (a) | | Per share values have been calculated using the average shares method. |
| (b) | | Total returns are historical and assume changes in share price, reinvestment of dividends and capital gains distributions and do not include the effect of insurance contract charges. Past performance does not guarantee future results. |
| (c) | | Includes contractual management fee waiver related to the Fund’s investments in the GE Institutional Money Market Fund (the “Money Market Fund”). The fee waiver agreement was terminated effective June 30, 2014 with the closure of the Money Market Fund. |
| (d) | | Reflects a contractual arrangement with GE Asset Management Incorporated, the Fund’s investment adviser and administrator prior to July 1, 2016, to limit the advisory and administrative fee charged to the Fund to 0.30% of the average daily net assets of the Fund. |
| * | | Beginning with the year ended December 31, 2016, the Fund was audited by Ernst & Young LLP. The previous years were audited by another independent registered public accounting firm. |
The accompanying Notes are an integral part of these financial statements.
State Street S&P 500 Index V.I.S. Fund
Statement of Assets and Liabilities — December 31, 2018
| | | | |
Assets | | | | |
| | | | |
Investments in securities, at fair value (cost $73,169,511) | | $ | 158,765,899 | |
Investments in affiliated securities, at fair value (cost $168,393) | | | 183,597 | |
Short-term affiliated investments, at fair value | | | 1,781,046 | |
Cash | | | 954 | |
Cash collateral on deposit with broker for future contracts | | | 222,796 | |
Receivable for investments sold | | | 44,840 | |
Income receivables | | | 183,239 | |
Receivable for fund shares sold | | | 8,332 | |
Income receivable from affiliated investments | | | 5,051 | |
| | | | |
| |
Total assets | | | 161,195,754 | |
| | | | |
| |
Liabilities | | | | |
Payable for investments purchased | | | 104,240 | |
Payable for fund shares redeemed | | | 17,741 | |
Payable for accumulated variation margin on futures contracts | | | 90,090 | |
Payable to the Adviser | | | 35,229 | |
Payable for custody, fund accounting andsub-administration fees | | | 1,825 | |
Accrued other expenses | | | 44,358 | |
| | | | |
| |
Total liabilities | | | 293,483 | |
| | | | |
| | | | |
| |
Net Assets | | $ | 160,902,271 | |
| | | | |
| |
Net Assets Consist of: | | | | |
Capital paid in | | $ | 79,039,654 | |
Total distributable earnings (loss) | | | 81,862,617 | |
| | | | |
| |
Net Assets | | $ | 160,902,271 | |
| | | | |
| | | | |
Shares outstanding ($0.01 par value; unlimited shares authorized) | | | 4,220,115 | |
Net asset value per share | | $ | 38.13 | |
The accompanying Notes are an integral part of these financial statements.
| | | | |
| Statement of Assets and Liabilities | | | 17 | |
State Street S&P 500 Index V.I.S. Fund
Statement of Operations — For the year ended December 31, 2018
| | | | |
Investment Income | |
| | | | |
Income | |
Dividend | | $ | 3,599,186 | |
Income from affiliated investments | | | 46,806 | |
| | | | |
Total income | | | 3,645,992 | |
| | | | |
|
Expenses | |
Advisory and administration fees | | | 466,521 | |
Directors’ fees | | | 14,787 | |
Custody, fund accounting andsub-administration fees | | | 37,337 | |
Professional fees | | | 55,699 | |
Other expenses | | | 44,868 | |
| | | | |
Total Expenses | | | 619,212 | |
| | | | |
Net investment income | | $ | 3,026,780 | |
| | | | |
|
Net Realized and Unrealized Gain (Loss) on Investments | |
Realized gain (loss) on: | |
Unaffiliated investments | | $ | 13,250,589 | |
Affiliated investments | | | 6,151 | |
Futures | | | (44,384 | ) |
Increase (decrease) in unrealized appreciation/depreciation on: | |
Unaffiliated investments | | | (23,155,676 | ) |
Affiliated investments | | | (105,904 | ) |
Futures | | | (131,513 | ) |
| | | | |
| |
Net realized and unrealized gain (loss) on investments | | | (10,180,737 | ) |
| | | | |
| |
Net Decrease in Net Assets Resulting from Operations | | $ | (7,153,957 | ) |
| | | | |
The accompanying Notes are an integral part of these financial statements.
| | |
| 18 | | Statement of Operations |
State Street S&P 500 Index V.I.S. Fund
Statements of Changes in Net Assets
| | | | | | | | |
| | | Year Ended December 31,
2018 | | | Year Ended December 31,
2017 | |
| | | | | | | | |
Increase (Decrease) in Net Assets | |
|
Operations: | |
Net investment income | | $ | 3,026,780 | | | $ | 3,149,646 | |
Net realized gain (loss) on investments and futures | | | 13,212,356 | | | | 7,133,916 | |
Net increase (decrease) in unrealized appreciation/depreciation on investments and futures | | | (23,393,093 | ) | | | 26,115,746 | |
| | | | | | | | |
Net increase (decrease) from operations | | | (7,153,957 | ) | | | 36,399,308 | |
| | | | | | | | |
|
Distributions to shareholders: | |
Total distributions | | | (14,751,301 | ) | | | (9,845,441 | ) |
| | | | | | | | |
Increase (decrease) in assets from operations and distributions | | | (21,905,258 | ) | | | 26,553,867 | |
| | | | | | | | |
|
Share transactions: | |
Proceeds from sale of shares | | | 2,837,356 | | | | 3,059,520 | |
Value of distributions reinvested | | | 14,751,301 | | | | 9,845,441 | |
Cost of shares redeemed | | | (28,898,496 | ) | | | (26,102,452 | ) |
| | | | | | | | |
Net increase (decrease) from share transactions | | | (11,309,839 | ) | | | (13,197,491 | ) |
| | | | | | | | |
| | |
Total increase (decrease) in net assets | | | (33,215,097 | ) | | | 13,356,376 | |
|
Net Assets | |
Beginning of year | | | 194,117,368 | | | | 180,760,992 | |
| | | | | | | | |
| | |
End of year | | $ | 160,902,271 | | | $ | 194,117,368 | |
| | | | | | | | |
|
Changes in Fund Shares | |
Shares sold | | | 61,494 | | | | 73,043 | |
Issued for distributions reinvested | | | 389,731 | | | | 222,798 | |
Shares redeemed | | | (634,062 | ) | | | (622,096 | ) |
| | | | | | | | |
Net decrease in fund shares | | | (182,837 | ) | | | (326,255 | ) |
| | | | | | | | |
For the year ended December 31, 2017, the source of distributions paid to shareholders was (See Note 10 in the Notes to Financial Statements):
| | | | |
| | | | |
Net investment income | | $ | (3,286,275 | ) |
Net realized gains | | | (6,559,166 | ) |
| | | | |
Total distributions | | | (9,845,441 | ) |
| | | | |
Undistributed net investment income as of December 31, 2017: | | $ | (13,301 | ) |
The accompanying Notes are an integral part of these financial statements.
| | | | |
| Statements of Changes in Net Assets | | | 19 | |
State Street S&P 500 Index V.I.S. Fund
Notes to Financial Statements — December 31, 2018
| 1. | | Organization of the Company |
State Street Variable Insurance Series Funds, Inc. (the “Company”) was incorporated under the laws of the Commonwealth of Virginia on May 14, 1984 and is registered under the Investment Company Act of 1940, as amended (the “1940 Act”), as anopen-end management investment company. The Company is currently composed of the following seven investment portfolios (collectively, the “Funds”): State Street U.S. Equity V.I.S. Fund, State Street S&P 500 Index V.I.S. Fund (the “Fund”), State Street Premier Growth Equity V.I.S. Fund, State StreetSmall-Cap Equity V.I.S. Fund, State Street Total Return V.I.S. Fund, State Street Income V.I.S. Fund and State Street Real Estate Securities V.I.S. Fund. Each Fund is a diversified investment company within the meaning of the 1940 Act. Shares of the Funds of the Company are offered only to insurance company separate accounts that fund certain variable life insurance contracts and variable annuity contracts.
The Company currently offers one share class (Class 1) of the Fund as an investment option for variable life insurance and variable annuity contracts.
Under the Company’s organizational documents, its officers and directors are indemnified against certain liabilities arising out of the performance of their duties to the Company. Additionally, in the normal course of business, the Company enters into contracts with service providers that contain general indemnification clauses. The Company’s maximum exposure under these arrangements is unknown as this would involve future claims that may be made against the Company that have not yet occurred.
| 2. | | Summary of Significant Accounting Policies |
The following is a summary of significant accounting policies followed by the Company in the preparation of its financial statements:
The preparation of financial statements in accordance with U.S. generally accepted accounting principles (“U.S. GAAP”) requires management to make estimates and assumptions that affect the reported amounts and disclosures in the financial statements. Actual results could differ from those estimates. The Fund is an investment company under U.S. GAAP and follows the accounting and reporting guidance applicable to investment companies.
Security Valuation The Fund’s investments are valued at fair value each day that the New York Stock Exchange (“NYSE”) is open and, for financial reporting purposes, as of the report date should the reporting period end on a day that the NYSE is not open. Fair value is generally defined as the price a fund would receive to sell an asset or pay to transfer a liability in an orderly transaction between market participants at the measurement date. By its nature, a fair value price is a good faith estimate of the valuation in a current sale and may not reflect an actual market price. The investments of the Fund are valued pursuant to the policy and procedures developed by the Oversight Committee (the “Committee”) and approved by the Company’s Board of Directors (the “Board”). The Committee provides oversight of the valuation of investments for the Fund. The Board has responsibility for overseeing the determination of the fair value of investments.
Valuation techniques used to value the Fund’s investments by major category are as follows:
| | • | | Equity investments traded on a recognized securities exchange for which market quotations are readily available are valued at the last sale price or official closing price, as applicable, on the primary market or exchange on which they trade. Equity investments traded on a recognized exchange for which there were no sales on that day are valued at the last published sale price or at fair value. |
| | • | | Investments in registered investment companies (including money market funds) or other unitized pooled investment vehicles that are not traded on an exchange are valued at that day’s published net asset value (“NAV”) per share or unit. |
| | • | | Exchange-traded futures contracts are valued at the closing settlement price on the primary market on which they are traded most extensively. Exchange-traded futures contracts traded on a recognized exchange for which there were no sales on that day are valued at the last reported sale price obtained from independent pricing services or brokers or at fair value. |
In the event prices or quotations are not readily available or that the application of these valuation methods results in a price for an investment that is deemed to be not representative of the fair value of such investment, fair value will be determined in good faith by the Committee, in accordance with the valuation policy and procedures approved by the Board.
| | |
| 20 | | Notes to Financial Statements |
State Street S&P 500 Index V.I.S. Fund
Notes to Financial Statements, continued — December 31, 2018
The Fund values its assets and liabilities at fair value using a fair value hierarchy consisting of three broad levels that prioritize the inputs to valuation techniques giving the highest priority to readily available unadjusted quoted prices in active markets for identical assets or liabilities (Level 1 measurements) and the lowest priority to unobservable inputs (Level 3 measurements) when market prices are not readily available or reliable. The categorization of a value determined for an investment within the hierarchy is based upon the pricing transparency of the investment and is not necessarily an indication of the risk associated with investing in it.
The three levels of the fair value hierarchy are as follows:
| | • | | Level 1 — Unadjusted quoted prices in active markets for an identical asset or liability; |
| | • | | Level 2 — Inputs other than quoted prices included within Level 1 that are observable for the asset or liability either directly or indirectly, including quoted prices for similar assets or liabilities in active markets, quoted prices for identical or similar assets or liabilities in markets that are not considered to be active, inputs other than quoted prices that are observable for the asset or liability (such as exchange rates, financing terms, interest rates, yield curves, volatilities, prepayment speeds, loss severities, credit risks and default rates) or other market-corroborated inputs; and |
| | • | | Level 3 — Unobservable inputs for the asset or liability, including the Committee’s assumptions used in determining the fair value of investments. |
The value of the Fund’s investments according to the fair value hierarchy as of December 31, 2018 is disclosed in the Fund’s Schedule of Investments.
Investment Transactions and Income Recognition Investment transactions are accounted for on trade date for financial reporting purposes. Realized gains and losses from the sale or disposition of investments and foreign exchange transactions, if any, are determined using the identified cost method.
Dividend income and capital gain distributions, if any, are recognized on theex-dividend date, net of any foreign taxes withheld at source, if any.
Interest income is recorded daily on an accrual basis. All premiums and discounts are amortized/accreted for financial reporting purposes.
Non-cash dividends received in the form of stock are recorded as dividend income at fair value.
Expenses Certain expenses, which are directly identifiable to a specific Fund, are applied to the Fund within the Company. Other expenses which cannot be attributed to a specific Fund are allocated in such a manner as deemed equitable, taking into consideration the nature and type of expense and the relative net assets of the Fund within the Company.
Distributions The Fund declares and pays any dividends from net investment income annually.
Net realized capital gains, if any, are distributed annually, unless additional distributions are required for compliance with applicable tax regulations. The amount and character of income and capital gains to be distributed are determined in accordance with applicable tax regulations which may differ from net investment income and realized gains recognized for U.S. GAAP purposes.
| 3. | | Derivative Financial Instruments |
Futures Contracts The Fund may enter into futures contracts to meet the Fund’s objectives. A futures contract is a standardized, exchange-traded agreement to buy or sell a financial instrument at a set price on a future date. Upon entering into a futures contract, the Fund is required to deposit with the broker, cash or securities in an amount equal to the minimum initial margin requirements of the clearing house. Subsequent payments are made or received by the Fund equal to the daily change in the contract value and are recorded as variation margin receivable or payable with a corresponding offset to unrealized gains or losses. The Fund recognizes a realized gain or loss when the contract is closed.
Losses may arise if the value of a futures contract decreases due to unfavorable changes in the market rates or values of the underlying instrument during the term of the contract or if the counterparty does not perform under the contract. The use of futures contracts also involves the risk that the movements in the price of the futures contracts do not correlate with the movement of the assets underlying such contracts.
| | | | |
| Notes to Financial Statements | | | 21 | |
State Street S&P 500 Index V.I.S. Fund
Notes to Financial Statements, continued — December 31, 2018
For the fiscal year ended December 31, 2018, the Fund entered into futures contracts for cash equitization.
The following tables summarize the value of the Fund’s derivative instruments as of December 31, 2018 and the related location in the accompanying Statement of Assets and Liabilities and Statement of Operations, presented by primary underlying risk exposure:
Liability Derivatives
| | | | | | | | | | | | | | | | | | | | | | | | |
| | | Interest
Rate
Contracts
Risk | | | Foreign
Exchange
Contracts
Risk | | | Credit
Contracts
Risk | | | Equity
Contracts
Risk | | | Commodity
Contracts
Risk | | | Total | |
| | | | | | | | | | | | | | | | | | | | | | | | |
State Street S&P 500 Index V.I.S. Fund | |
Futures Contracts | | $ | — | | | $ | — | | | $ | — | | | $ | (90,090 | ) | | $ | — | | | $ | (90,090 | ) |
Net Realized Gain (Loss)
| | | | | | | | | | | | | | | | | | | | | | | | |
| | | Interest
Rate
Contracts
Risk | | | Foreign
Exchange
Contracts
Risk | | | Credit
Contracts
Risk | | | Equity
Contracts
Risk | | | Commodity
Contracts
Risk | | | Total | |
| | | | | | | | | | | | | | | | | | | | | | | | |
State Street S&P 500 Index V.I.S. Fund | |
Futures contracts | | $ | — | | | $ | — | | | $ | — | | | $ | (44,384 | ) | | $ | — | | | $ | (44,384 | ) |
Net Change in Unrealized Appreciation (Depreciation)
| | | | | | | | | | | | | | | | | | | | | | | | |
| | | Interest
Rate
Contracts
Risk | | | Foreign
Exchange
Contracts
Risk | | | Credit
Contracts
Risk | | | Equity
Contracts
Risk | | | Commodity
Contracts
Risk | | | Total | |
| | | | | | | | | | | | | | | | | | | | | | | | |
State Street S&P 500 Index V.I.S. Fund | |
Futures contracts | | $ | — | | | $ | — | | | $ | — | | | $ | (131,513 | ) | | $ | — | | | $ | (131,513 | ) |
| 4. | | Fees and Transactions with Affiliates |
Advisory Fee SSGA Funds Management, Inc. (the “Adviser” or “SSGA FM”), a registered investment adviser, was retained by the Board to act as investment adviser and administrator of the Fund. SSGA FM’s compensation for investment advisory and administrative services (“Management Fee”) is paid monthly based on the average daily net assets of the Fund at an annualized rate of 0.25 %.
Custody, Fund Accounting and Sub-Administration Fees State Street Bank and Trust Company (“State Street”) serves as the custodian, fund accountant andsub-administrator to the Fund. Amounts paid by the Fund to State Street for performing such services are included custody, fund accounting andsub-administration fees on the Statement of Operations.
Other Transactions with Affiliates The Fund may invest in affiliated entities, including securities issued by State Street, affiliated funds, or entities deemed to be affiliates as a result of the Fund owning more than five percent of the entity’s voting securities or outstanding shares. Amounts relating to these transactions during the fiscal year ended December 31, 2018 are disclosed in the Schedule of Investments.
The fees and expenses of the Company’s directors who are not “interested persons” of the Company, as defined in the 1940 Act (“Independent Directors”) are paid directly by the Fund. The Independent Directors are reimbursed for travel and otherout-of-pocket expenses in connection with meeting attendance and industry seminars.
| | |
| 22 | | Notes to Financial Statements |
State Street S&P 500 Index V.I.S. Fund
Notes to Financial Statements, continued — December 31, 2018
| 6. | | Investment Transactions |
Purchases and sales of investments (excludingin-kind transactions, short term investments and derivative contracts) for the year ended, December 31, 2018 were as follows:
| | | | | | | | |
| Non-U.S. Government Securities |
| Purchases | | Sales |
| | | | | | | | | |
| | $ | 3,861,023 | | | | $ | 25,444,260 | |
The Fund has qualified and intends to continue to qualify as a regulated investment company under Subchapter M of the Internal Revenue Code of 1986, as amended. The Fund will not be subject to federal income taxes to the extent it distributes its taxable income, including any net realized capital gains, for each fiscal year. Therefore, no provision for federal income tax is required.
The Fund files federal and various state and local tax returns as required. No income tax returns are currently under examination. Generally, the federal returns are subject to examination by the Internal Revenue Service for a period of three years from date of filing, while the state returns may remain open for an additional year depending upon jurisdiction. SSGA FM has analyzed the Fund’s tax positions taken on tax returns for all open years and does not believe there are any uncertain tax positions that would require recognition of a tax liability.
Distributions to shareholders are recorded onex-dividend date. Income dividends and gain distributions are determined in accordance with income tax rules and regulations, which may differ from generally accepted accounting principles. Certain capital accounts in the financial statements have been adjusted for permanentbook-tax differences. These adjustments have no impact on net asset values or results of operations. Temporarybook-tax differences will reverse in the future. These book tax differences are primarily due to differing treatments for character of distributions, REIT basis adjustments, corporate actions, futures contracts, passive foreign investment company inclusions, return of capital distributions received, and wash sale loss deferrals.
The tax character of distributions paid during the year ended December 31, 2018 was as follows:
| | | | | | | | | | | | | |
Ordinary
Income | | Long-Term
Capital Gains | | Total |
| | | | | | | | | | | | | | |
| | $ | 3,417,861 | | | | $ | 11,333,440 | | | | $ | 14,751,301 | |
The tax character of distributions paid during the year ended December 31, 2017 was as follows:
| | | | | | | | | | | | | |
Ordinary
Income | | Long-Term
Capital Gains | | Total |
| | | | | | | | | | | | | | |
| | $ | 3,444,426 | | | | $ | 6,401,015 | | | | $ | 9,845,441 | |
At December 31, 2018 the components of distributable earnings on a tax basis were as follows:
| | | | | | | | | | | | | | | | | | | | | | | | | | | | |
Undistributed
Ordinary
Income | | Capital Loss
Carryforwards | | Undistributed
long term gain | | Net Unrealized
Gains (Losses) | | Qualified
Late-Year
Losses | | Total |
| | | | | | | | | | | | | | | | | | | | | | | | | | | | | |
| | $ | — | | | | $ | — | | | | $ | 1,669,175 | | | | $ | 80,193,442 | | | | | | | | | $ | 81,862,617 | |
As of December 31, 2018, gross unrealized appreciation and gross unrealized depreciation of investments and other financial instruments based on cost for federal income tax purposes were as follows:
| | | | | | | | | | | | | | | | | | |
Tax
Cost | | Gross
Unrealized
Appreciation | | Gross
Unrealized
Depreciation | | Net Unrealized
Appreciation
(Depreciation) |
| | | | | | | | | | | | | | | | | | | |
| | $ | 80,446,410 | | | | $ | 85,222,926 | | | | $ | 5,029,484 | | | | $ | 80,193,442 | |
| | | | |
| Notes to Financial Statements | | | 23 | |
State Street S&P 500 Index V.I.S. Fund
Notes to Financial Statements, continued — December 31, 2018
The Fund and other affiliated funds (each, a “Participant” and collectively, the “Participants”) participate in a $500 million revolving credit facility provided by a syndication of banks under which the Participants may borrow to fund shareholder redemptions. This agreement expires in October 2019 unless otherwise extended or renewed.
The Participants are charged an annual commitment fee which is calculated based on the unused portion of the shared credit line. Commitment fees are allocated among each of the Participants based on relative net assets. Commitment fees are ordinary fund operating expenses paid by the Adviser. A Participant incurs and pays the interest expense related to its borrowing. Interest is calculated at a rate per annum equal to the sum of 1% plus the greater of the New York Fed Bank Rate and1-month LIBOR rate.
The Fund had no outstanding loans as of December 31, 2018.
Concentration Risk As a result of the Fund’s ability to invest a large percentage of its assets in obligations of issuers within the same country, state, region, currency or economic sector, an adverse economic, business or political development may affect the value of the Fund’s investments more than if the Fund were more broadly diversified.
Market and Credit Risk In the normal course of business, the Fund trades financial instruments and enters into financial transactions where risk of potential loss exists due to changes in the general economic conditions and fluctuations of the market (market risk). Additionally, the Fund may also be exposed to credit risk in the event that an issuer or guarantor fails to perform or that an institution or entity with which the Fund has unsettled or open transactions defaults.
| 10. | | New and Recent Accounting Pronouncements |
In August 2018, the Securities and Exchange Commission released its Final Rule on Disclosure Update and Simplification (the “Final Rule”) which is intended to simplify an issuer’s disclosure compliance efforts by removing redundant or outdated disclosure requirements without significantly altering the mix of information provided to investors. The Fund has adopted the Final Rule for the current period with the most notable impacts being that the Fund is no longer required to present components of distributable earnings on the Statement of Assets and Liabilities or the sources of distributions to shareholders and the amount of undistributed net investment income on the Statements of Changes in Net Assets.
Management has evaluated the impact of all subsequent events on the Fund through the date on which the financial statements were available to be issued and has determined that there were no subsequent events requiring adjustment or disclosure in the financial statements.
| | |
| 24 | | Notes to Financial Statements |
State Street S&P 500 Index V.I.S. Fund
Report of Independent Registered Public Accounting Firm
To the Shareholders and the Board of Directors of State Street S&P 500 Index V.I.S. Fund
Opinion on the Financial Statements
We have audited the accompanying statement of assets and liabilities of State Street S&P 500 Index V.I.S. Fund (the “Fund”) (one of the funds constituting State Street Variable Insurance Series Funds, Inc. (the “Company”)), including the schedule of investments, as of December 31, 2018, and the related statement of operations for the year then ended, the statement of changes in net assets for each of the two years in the period then ended, the financial highlights for each of the three years in the period then ended and the related notes (collectively referred to as the “financial statements”). In our opinion, the financial statements present fairly, in all material respects, the financial position of the Fund (one of the funds constituting State Street Variable Insurance Series Funds, Inc.) at December 31, 2018, the results of its operations for the year then ended, the changes in its net assets for each of the two years in the period then ended and its financial highlights for each of the three years in the period then ended, in conformity with U.S. generally accepted accounting principles. The financial highlights for periods ended prior to January 1, 2016 were audited by another independent registered public accounting firm whose report, dated February 19, 2016, expressed an unqualified opinion on those financial highlights.
Basis for Opinion
These financial statements are the responsibility of the Company’s management. Our responsibility is to express an opinion on the Fund’s financial statements based on our audits. We are a public accounting firm registered with the Public Company Accounting Oversight Board (United States) (“PCAOB”) and are required to be independent with respect to the Company in accordance with the U.S. federal securities laws and the applicable rules and regulations of the Securities and Exchange Commission and the PCAOB.
We conducted our audits in accordance with the standards of the PCAOB. Those standards require that we plan and perform the audit to obtain reasonable assurance about whether the financial statements are free of material misstatement, whether due to error or fraud. The Company is not required to have, nor were we engaged to perform, an audit of the Company’s internal control over financial reporting. As part of our audits we are required to obtain an understanding of internal control over financial reporting, but not for the purpose of expressing an opinion on the effectiveness of the Company’s internal control over financials reporting. Accordingly, we express no such opinion.
Our audits included performing procedures to assess the risks of material misstatement of the financial statements, whether due to error or fraud, and performing procedures that respond to those risks. Such procedures included examining, on a test basis, evidence regarding the amounts and disclosures in the financial statements. Our procedures included confirmation of securities owned as of December 31, 2018, by correspondence with the custodian, brokers and others or by other appropriate auditing procedures where replies from brokers and others were not received. Our audits also included evaluating the accounting principles used and significant estimates made by management, as well as evaluating the overall presentation of the financial statements. We believe that our audits provide a reasonable basis for our opinion.

We have served as the auditor of one or more State Street Global Advisors investment companies since 2000.
Boston, Massachusetts
February 19, 2019
| | | | |
| Report of Independent Registered Public Accounting Firm | | | 25 | |
State Street S&P 500 Index V.I.S. Fund
Tax Information — December 31, 2018 (Unaudited)
For federal income tax purposes, the following information is furnished with respect to the distributions of the Fund for its fiscal year ended December 31, 2018.
Dividends Received Deduction
The Fund reports the maximum amount allowable of its net taxable income as eligible for the corporate dividends received deduction.
Long Term Capital Gain Distributions
Long term capital gains dividends were paid from the Fund during the year ended December 31, 2018 in the amount of $11,333,440.
State Street S&P 500 Index V.I.S. Fund
Special Meeting of Shareholders — Voting Results (Unaudited)
A special meeting of shareholders of State Street Variable Insurance Series Funds, Inc. (the “Company”) was held on January 10, 2019 to elect the following six nominees as Directors of the Company: Michael F. Holland, Michael A. Jessee, Ellen M. Needham, Patrick J. Riley, Richard D. Shirk and Rina K. Spence. At the meeting the following votes were recorded:
| | | | | | | | |
| Nominee | | Shares For | | | Shares Withheld | |
Michael F. Holland | | | 91,260,156.834 | | | | 2,655,810.669 | |
Michael A. Jessee | | | 91,345,936.433 | | | | 2,570,031.070 | |
Ellen M. Needham | | | 91,642,423.619 | | | | 2,273,543.884 | |
Patrick J. Riley | | | 91,136,965.946 | | | | 2,779,001.557 | |
Richard D. Shirk | | | 91,293,712.247 | | | | 2,622,255.256 | |
Rina K. Spence | | | 90,957,562.624 | | | | 2,958,404.879 | |
The other Directors whose term of office continued after the meeting are as follows: Jeanne M. La Porta, John R. Costantino and Donna M. Rapaccioli.
| | | | |
| Special Meeting of Shareholders — Voting Results | | | 27 | |
State Street S&P 500 Index V.I.S. Fund
Other Information — December 31, 2018 (Unaudited)
| | | | | | | | | | | | |
| | | | | | |
Name, Address, and Year of Birth | | Position(s) Held with Fund | | Term of
Office and
Length of
Time Served | | Principal Occupation
During Past Five Years and Relevant Experience | | Number of
Funds
in Fund
Complex
Overseen
by Director† | | | Other Directorships
Held by Director During Past Five Years |
INDEPENDENT DIRECTORS |
Michael F. Holland c/o SSGA Funds Management, Inc. One Iron Street Boston, MA 02210 YOB: 1944 | | Director and Co-Chairperson of the Board | | Term: Indefinite Elected: 1/19 | | Chairman, Holland & Company L.L.C. (investment adviser) (1995 – present). | | | 67 | | | Director, the Holland Series Fund, Inc.; Director, The China Fund, Inc.; Director, The Taiwan Fund, Inc. (2007 – 2017); Director, Reaves Utility Income Fund, Inc.; and Director, Blackstone/GSO Loans (and Real Estate) Funds. |
| |
Patrick J. Riley c/o SSGA Funds Management, Inc. One Iron Street Boston, MA 02210 YOB: 1948 | | Director and Co-Chairperson of the Board | | Term: Indefinite Elected: 1/19 | | 2002 to May 2010, Associate Justice of the Superior Court, Commonwealth of Massachusetts; 1985 to 2002, Partner, Riley, Burke & Donahue, L.L.P. (law firm); 1998 to Present, Independent Director, State Street Global Advisers Ireland, Ltd. (investment company); 1998 to Present, Independent Director, SSGA Liquidity plc (formerly, SSGA Cash Management Fund plc); January 2009 to Present, Independent Director, SSGA Fixed Income plc; and January 2009 to Present, Independent Director, SSGA Qualified Funds PLC. | | | 67 | | | Board Director and Chairman, SPDR Europe 1PLC Board (2011 – Present); Board Director and Chairman, SPDR Europe II, PLC (2013 – Present). |
| |
John R. Costantino c/o SSGA Funds Management, Inc. One Iron Street Boston, MA 02210 YOB: 1946 | | Director and Co-Chairperson of the Qualified Legal and Compliance Committee | | Term: Indefinite Elected: 1997 | | Managing General Partner, NGN Capital LLC (2006 – present); and Managing Director, Vice President of Walden Capital Management (1996 – present). | | | 67 | | | Director of Kleinfeld Bridal Corp. (March 2016 – present);Trustee of Neuroscience Research Institute (1986 – present); Trustee of Fordham University (1989 – 1995 and 2001 – 2007) and Trustee Emeritus (2007 – present); Trustee of GE Funds (1993 – February 2011); Director of Artes Medical (2006 – 2008); and Trustee of Gregorian University Foundation (1992 – 2007). |
| |
Donna M. Rapaccioli c/o SSGA Funds Management, Inc. One Iron Street Boston, MA 02210 YOB: 1962 | | Director and Co-Chairperson of the Audit Committee | | Term: Indefinite Elected: 1/12 | | Dean of the Gabelli School of Business (2007 – present) and Accounting Professor (1987 – present) at Fordham University. | | | 67 | | | Director- Graduate Management Admissions Council (2015 – present); Trustee of Emmanuel College (2010 – present). |
State Street S&P 500 Index V.I.S. Fund
Other Information, continued — December 31, 2018 (Unaudited)
| | | | | | | | | | | | |
| | | | | | |
Name, Address, and Year of Birth | | Position(s) Held with Fund | | Term of
Office and
Length of
Time Served | | Principal Occupation
During Past Five Years and Relevant Experience | | Number of
Funds
in Fund
Complex
Overseen
by Director† | | | Other Directorships
Held by Director During Past Five Years |
INDEPENDENT DIRECTORS (continued) |
Richard D. Shirk c/o SSGA Funds Management, Inc. One Iron Street Boston, MA 02210 YOB: 1945 | | Director andCo-Chairperson of the Qualified Legal and Compliance Committee | | Term: Indefinite Elected: 1/19 | | March 2001 to April 2002, Chairman (1996 to March 2001, President and Chief Executive Officer), Cerulean Companies, Inc. (holding company) (Retired); 1992 to March 2001, President and Chief Executive Officer, Blue Cross Blue Shield of Georgia (health insurer, managed healthcare). | | | 67 | | | 1998 to December 2008, Chairman, Board Member and December 2008 to Present, Investment Committee Member, Healthcare Georgia Foundation (private foundation); September 2002 to 2012, Lead Director and Board Member, Amerigroup Corp. (managed health care); 1999 to 2013, Board Member and (since 2001) Investment Committee Member, Woodruff Arts Center; and 2003 to 2009, Trustee, Gettysburg College; Board member, Aerocare Holdings, Regenesis Biomedical Inc. |
| |
Rina K. Spence c/o SSGA Funds Management, Inc. One Iron Street Boston, MA 02210 YOB: 1948 | | Director andCo-Chairperson of the Audit Committee, Chairperson of the Nominating Committee and Chairperson of the Governance Committee | | Term: Indefinite Elected: 1/19 | | President of SpenceCare International LLC (international healthcare consulting) (1999 – present); Chief Executive Officer, IEmily.com (health internet company) (2000 – 2001); Chief Executive Officer of Consensus Pharmaceutical, Inc. (1998 – 1999); Founder, President and Chief Executive Officer of Spence Center for Women’s Health (1994 –1998); President and CEO, Emerson Hospital (1984 – 1994); Honorary Consul for Monaco in Boston (2015 – present). | | | 67 | | | None |
| |
Michael A. Jessee c/o SSGA Funds Management, Inc. One Iron Street Boston, MA 02210 YOB: 1946 | | Director andCo-Chairperson of the Valuation Committee | | Term: Indefinite Elected: 1/19 | | Retired; formerly, President and Chief Executive Officer of the Federal Home Loan Bank of Boston (1989 – 2009); Trustee, Randolph-Macon College (2004 – 2016). | | | 67 | | | None |
State Street S&P 500 Index V.I.S. Fund
Other Information, continued — December 31, 2018 (Unaudited)
| | | | | | | | | | | | |
| | | | | | |
Name, Address, and Year of Birth | | Position(s) Held with Fund | | Term of
Office and
Length of
Time Served | | Principal Occupation
During Past Five Years and Relevant Experience | | Number of
Funds
in Fund
Complex
Overseen
by Director† | | | Other Directorships
Held by Director During Past Five Years |
INTERESTED DIRECTORS(1) |
Jeanne M. La Porta(2) SSGA Funds Management, Inc. 1600 Summer St. Stamford, CT 06905 YOB: 1965 | | Director and President | | Time Indefinite Elected: 3/14 | | Senior Managing Director at State Street Global Advisors (July 2016 – present); Director of State Street Global Advisors Funds Distributors, LLC (May 2017 – present); President of GE Retirement Savings Plan Funds (July 2016 – present); Senior Vice President and Commercial Operations Leader at GE Asset Management Incorporated (“GEAM”) (March 2014 – July 2016); President of State Street Institutional Funds and State Street Variable Insurance Series Funds, Inc. (April 2014 – present); President and Trustee. | | | 18 | | | None |
| |
Ellen M. Needham(3) SSGA Funds Management, Inc. One Iron Street Boston, MA 02210 YOB: 1967 | | Director | | Time Indefinite Elected: 1/19 | | President and Director, SSGA FM (2001 – present)*; Senior Managing Director, State Street Global Advisors (1992 – present)*; Director, State Street Global Advisors Funds Distributors, LLC (May 2017 – present).* | | | 67 | | | None |
| (1) | | The individuals listed below are Directors who are “interested persons,” as defined in the 1940 Act, of the Company (“Interested Directors”). |
| (2) | | Ms. La Porta is an Interested Director because of her employment by SSGA Funds Management, Inc., an affiliate of the Company. |
| (3) | | Ms. Needham is an Interested Director because of her employment by SSGA Funds Management, Inc., an affiliate of the Company. |
| * | | Served in various capacities and/or with various affiliated entities during noted time period |
| † | | For the purpose of determining the number of portfolios overseen by the Directors, “Fund Complex” comprises registered investment companies for which SSGA FM serves as investment adviser. |
The following lists the principal officers for the Company, as well as their mailing addresses and ages, positions with the Company and length of time served, and present and principal occupations:
| | | | | | |
| | | | |
Name, Address, and Year of Birth | | Position(s) Held with Fund | | Term of Office and Length of Time Served | | Principal Occupation During Past Five Years |
OFFICERS: | | | | | | |
Jeanne M. La Porta SSGA Funds Management, Inc. 1600 Summer St. Stamford, CT 06905 YOB: 1965 | | President and Director | | Term: Indefinite Elected: 3/14 | | Senior Managing Director at State Street Global Advisors (July 2016 – present); Director of State Street Global Advisors Funds Distributors, LLC (May 2017 – present); President of GE Retirement Savings Plan Funds (July 2016 – present); Senior Vice President and Commercial Operations Leader at GE Asset Management Incorporated (“GEAM”) (March 2014 – July 2016); President of State Street Institutional Funds and State Street Variable Insurance Series Funds, Inc. (April 2014 – present); President and Trustee. |
State Street S&P 500 Index V.I.S. Fund
Other Information, continued — December 31, 2018 (Unaudited)
| | | | | | |
| | | | |
Name, Address, and Year of Birth | | Position(s) Held with Fund | | Term of Office and Length of Time Served | | Principal Occupation During Past Five Years |
OFFICERS (continued): | | | | | | |
Arthur A. Jensen SSGA Funds Management, Inc. 1600 Summer Street Stamford, CT 06905 YOB: 1966 | | Treasurer | | Term: Indefinite Elected: 6/11 | | Vice President, State Street Global Advisors and SSGA Funds Management, Inc. (July 2016 – present); Deputy Treasurer of Elfun Funds (July 2016 – present); Treasurer of State Street Institutional Funds, State Street Variable Insurance Series Funds, Inc. and GE Retirement Savings Plan Funds (June 2011 – present); Treasurer of Elfun Funds (June 2011 – July 2016); Mutual Funds Controller of GE Asset Management Incorporated (April 2011 – July 2016). |
| |
Brian Harris SSGA Funds Management, Inc. One Iron Street Boston, MA 02210 YOB: 1973 | | Chief Compliance Officer and Anti-Money Laundering Officer | | Term: Indefinite Elected: 6/16 | | Managing Director, State Street Global Advisors and SSGA Funds Management, Inc. (2013 – Present); Senior Vice President and Global Head of Investment Compliance, BofA Global Capital Management (September 2010 – May 2013). |
| |
Bruce S. Rosenberg SSGA Funds Management, Inc. One Iron Street Boston, MA 02210 YOB: 1961 | | Assistant Treasurer | | Term: Indefinite Elected: 6/16 | | Managing Director, State Street Global Advisors and SSGA Funds Management, Inc. (July 2015 – present); Director, Credit Suisse (April 2008 – July 2015). |
| |
Ann M. Carpenter SSGA Funds Management, Inc. One Iron Street Boston, MA 02210 YOB: 1966 | | Assistant Treasurer | | Term: Indefinite Elected: 6/16 | | Chief Operating Officer, SSGA Funds Management, Inc. (April 2005 – present) *; Managing Director, State Street Global Advisors. (2005 – present).* |
| |
Chad C. Hallett SSGA Funds Management, Inc. One Iron Street Boston, MA 02210 YOB: 1969 | | Assistant Treasurer | | Term: Indefinite Elected: 6/16 | | Vice President, State Street Global Advisors and SSGA Funds Management, Inc. (November 2014 – present); Vice President, State Street Bank and Trust Company (2001 – November 2014).* |
| |
Darlene Anderson-Vasquez SSGA Funds Management, Inc. One Iron Street Boston, MA 02210 YOB: 1968 | | Assistant Treasurer | | Term: Indefinite Elected: 3/17 | | Managing Director, State Street Global Advisors and SSGA Funds Management, Inc. (May 2016 – present); Senior Vice President, John Hancock Investments (September 2007 – May 2016). |
| |
Daniel G. Plourde SSGA Funds Management, Inc. One Iron Street Boston, MA 02210 YOB: 1980 | | Assistant Treasurer | | Term: Indefinite Elected: 6/17 | | Vice President, State Street Global Advisors and SSGA Funds Management, Inc. (May 2015 – present); Officer, State Street Bank and Trust Company (March 2009 – May 2015). |
State Street S&P 500 Index V.I.S. Fund
Other Information, continued — December 31, 2018 (Unaudited)
| | | | | | |
| | | | |
Name, Address, and Year of Birth | | Position(s) Held with Fund | | Term of Office and Length of Time Served | | Principal Occupation During Past Five Years |
OFFICERS (continued): | | | | | | |
Jesse D. Hallee State Street Bank and Trust Company 100 Summer Street, 7th Floor Boston, MA 02111-2900 YOB: 1976 | | Secretary | | Term: Indefinite Elected: 3/17 | | Vice President and Managing Counsel, State Street Bank and Trust Company (2013 – present); Vice President and Counsel, Brown Brothers Harriman & Co. (2007 – 2013). |
| * | Served in various capacities and/or with various affiliated entities during noted time period. |
State Street S&P 500 Index V.I.S. Fund
Other Information, continued — December 31, 2018 (Unaudited)
Proxy Voting Policies and Procedures and Record
The Fund has adopted the proxy voting policies of SSGA FM. A description of the policies and procedures that the Fund has adopted to determine how to vote proxies relating to portfolio securities is available (i) without charge, upon request, by calling1-800-242-0134, (ii) on the Fund’s website at http://www.ssga.com/geam, or (iii) on the SEC’s website at www.sec.gov. Information regarding how the Fund voted proxies, if any, during the most recent12-month period ended June 30 is available by August 31 of each year without charge (1) by calling1-800-242-0134 (toll free), and (2) on the website of the SEC at www.sec.gov.
Quarterly Portfolio Schedule
The Fund files its complete schedule of investments with the SEC for the first and third quarters of each fiscal year on FormN-Q. The Fund’s FormsN-Q are available (i) without charge, upon request, by calling1-800-242-013, (ii) on the Fund’s website at http://www.ssga.com/geam, or (iii) on the SEC’s website at www.sec.gov.
Directors
Michael F. Holland, Co-Chairperson
Patrick J. Riley, Co-Chairperson
John R. Costantino
Donna M. Rapaccioli
Michael A. Jessee
Richard D. Shirk
Rina K. Spence
Jeanne M. La Porta
Ellen M. Needham
Officers
Jeanne M. La Porta, President
Arthur Jensen, Treasurer
Brian Harris, Chief Compliance Officer and Anti-Money Laundering Officer
Bruce S. Rosenberg, Assistant Treasurer
Ann M. Carpenter, Assistant Treasurer
Chad C. Hallett, Assistant Treasurer
Darlene Anderson-Vasquez, Assistant Treasurer
Daniel G. Plourde, Assistant Treasurer
Jesse Hallee, Secretary
Investment Adviser and Administrator
SSGA Funds Management, Inc.
One Iron Street
Boston, MA 02210
Custodian andSub-Administrator
State Street Bank and Trust Company
One Lincoln Street
Boston, Massachusetts 02111
Distributor
State Street Global Advisors Funds Distributors, LLC
One Iron Street
Boston, MA 02210
Independent Registered Public Accounting Firm
Ernst & Young LLP
200 Clarendon Street
Boston, Massachusetts 02116
Annual Report
December 31, 2018
State StreetSmall-Cap Equity V.I.S. Fund
Beginning on January 1, 2021, as permitted by regulations adopted by the Securities and Exchange Commission, paper copies of a Fund’s annual and semi- annual shareholder reports will no longer be sent by mail, unless you specifically request paper copies of the reports from the Fund (or from your financial intermediary, such as a broker-dealer or bank). Instead, the reports will be made available on a Fund’s website (www.ssga.com/geam), and you will be notified by mail each time a report is posted, and provided with a website link to access the report.
Beginning on January 1, 2019, you may elect to receive all future reports in paper free of charge. If you invest through a financial intermediary, you can contact your financial intermediary to request that you continue to receive paper copies of your shareholder reports. Your election to receive reports in paper will apply to all funds held in your account, if you invest through your financial intermediary or all funds held with the fund complex if you invest directly with a Fund.

State StreetSmall-Cap Equity V.I.S. Fund
Annual Report
December 31, 2018
Table of Contents
This report is prepared for Policyholders of certain variable contracts and may be distributed to others only if preceded or accompanied by the variable contract’s current prospectus and the current summary prospectus of the Fund available for investments thereunder.
State StreetSmall-Cap Equity V.I.S. Fund
Notes to Performance — December 31, 2018 (Unaudited)
The information provided on the performance page relates to the State Street Small-Cap Equity V.I.S. Fund (the “Fund”).
Total return performance shown in this report for the Fund takes into account changes in share price and assumes reinvestment of dividends and capital gains distributions, if any. Total returns shown are net of Fund fees and expenses but do not reflect fees and charges associated with the variable contracts such as administrative fees, account charges and surrender charges, which, if reflected, would reduce the Fund’s total returns for all periods shown.
The performance data quoted represents past performance; past performance does not guarantee future results. Investment return and principal value will fluctuate so your shares, when redeemed, may be worth more or less than their original cost. Current performance may be higher or lower than the performance data quoted. Periods less than one year are not annualized. Please call toll-free(800) 242-0134 or visit the Fund’s website at http://www.ssga.com/geam for the most recent month-end performance data.
An investment in the Fund is not a deposit of any bank and is not insured or guaranteed by the Federal Deposit Insurance Corporation (“FDIC”) or any other government agency. An investment in the Fund is subject to risk, including possible loss of principal invested.
The Russell 2000® Index is an unmanaged market capitalization-weighted index consisting of 2,000 of the smallest U.S.-domiciled publicly traded common stocks that are included in the Russell 3000® Index. The Russell 3000® Index is comprised of the 3,000 largest U.S. domiciled companies.
Russell Investment Group owns the Russell Index data, including all applicable trademarks and copyrights, used by SSGA Funds Management, Inc. (“SSGA FM”) in these materials. Any unauthorized use or redistribution of such Russell Index data is strictly prohibited. Russell Investment Group is not responsible for the configuration of this material or for any inaccuracy in SSGA FM’s presentation thereof.
The results shown for the foregoing index assume the reinvestment of net dividends or interest and do not reflect fees, expenses, or taxes. As such, the index returns do not reflect the actual cost of investing in the instruments that comprise each index.
The views expressed in this document reflect our judgment as of the publication date and are subject to change at any time without notice.
State Street Global Advisors Funds Distributors, LLC, member of FINRA & SIPC is the principal underwriter and distributor of the State Street V.I.S. Funds and an indirect wholly-owned subsidiary of State Street Corporation. References to State Street may include State Street Corporation and its affiliates. The Funds pay State Street Bank and Trust Company for its services as custodian and Fund Accounting agent, and pay SSGA Funds Management, Inc. for investment advisory and administrative services.
State Street Small-Cap Equity V.I.S. Fund
Management Discussion of Fund Performance — December 31, 2018 (Unaudited)
The State StreetSmall-Cap Equity V.I.S. Fund (the “Fund”) seeks to provide long-term growth of capital. The Fund’s benchmark is the Russell 2000 Index (the “Index”).
For the12-month period ended December 31, 2018 (the “Reporting Period”), the total return for the Fund was-9.70% and the Index was-11.01%. The Fund and Index returns reflect the reinvestment of dividends and other income. The Fund’s performance reflects the expenses of managing the Fund, including brokerage and advisory expenses. The Index is unmanaged and Index returns do not reflect fees and expenses of any kind, which would have a negative impact on returns.
Investment decisions by two of the Fund’ssub-advisers, Champlain Investment Partners and Palisade Capital, were primary drivers of Fund performance during the Reporting Period relative to the Index. Two primary themes drove Champlain’s overall performance, the first being the tectonic shift toward cloud computing. This played out very favorably for the Fund, particularly in names like Okta and New Relic and also in the education space with Blackbaud. The other theme that work well for Champlain was personalized healthcare, where companies like Nuvasive, Insulet and Cardiovascular Systems helped drive performance.
Palisade benefited from similar themes, but its technology focus was on software firms and they benefited from SS&C Technologies, Corelogic and Paylocity among others.
The Fund used Russell 2000E-mini Index Futures in order to maintain exposure to the Russell 2000 Index for the cash sleeve that is used to handle daily liquidity needs during the Reporting Period. The Fund’s use of Index Futures did not materially contribute to Fund performance relative to the Index.
On an individual security level, the top positive contributors to the Fund’s performance on an absolute basis during the Reporting Period were K12, Inc., Darling Ingredients and Argo Group International Holdings. The top negative contributors to the Fund’s performance on an absolute basis during the Reporting Period were Newfield Exploration, Koppers Holdings, and Welbilt Inc.
The views expressed above reflect those of the Fund’s portfolio manager only through the Reporting Period, and do not necessarily represent the views of the Adviser as a whole. Any such views are subject to change at any time based upon market or other conditions and the Adviser disclaims any responsibility to update such views. These views may not be relied on as investment advice and, because investment decisions for a fund are based on numerous factors, may not be relied on as an indication of trading intent on behalf of any fund.
| | |
| 2 | | State Street Small-Cap Equity V.I.S. Fund |
State Street Small-Cap Equity V.I.S. Fund
Understanding Your Fund’s Expenses — December 31, 2018 (Unaudited)
As a shareholder of the Fund, you incur ongoing costs. Ongoing costs include portfolio management fees, professional fees, administrative fees and other Fund expenses. The following example is intended to help you understand your ongoing costs (in dollars) of investing in the Fund and to compare these costs with the ongoing costs of investing in other mutual funds.
To illustrate these ongoing costs, we have provided an example and calculated the expenses paid by investors in the Fund during the period. The information in the following table is based on an investment of $1,000, which is invested at the beginning of the period and held for the entiresix-month period ended December 31, 2018.
Actual Expenses
The first section of the table provides information about actual account values and actual expenses. You may use the information in this section, together with the amount you invested, to estimate the expenses that you paid over the period. To do so, simply divide your account value by $1,000 (for example, an $8,600 account value divided by $1,000 = 8.6), then multiply the result by the number given under the heading “Expenses paid during the period” to estimate the expenses you paid on your account during the period.
Hypothetical Example for Comparison Purposes
The second section of the table provides information about hypothetical account values and hypothetical expenses based on the Fund’s actual expense ratio and an assumed rate of return of 5% per year before expenses, which is not the Fund’s actual return. The hypothetical account values and expenses may not be used to estimate the actual ending account balance or expenses you paid for the period. You may use this information to compare the ongoing costs of investing in the Fund and other funds. To do so, compare this 5% hypothetical example with the 5% hypothetical examples that appear in the shareholder reports of other funds.
Please note that the expenses shown in the table are meant to highlight and help you compare ongoing costs only and do not reflect transaction costs, such as sales charges or redemption fees, if any. Therefore, the second section of the table is useful in comparing ongoing costs only, and will not help you determine the relative total costs of owning different funds. Additionally, the expenses shown do not reflect the fees or charges associated with variable contracts through which shares of the Fund are offered.
July 1, 2018 - December 31, 2018
| | | | | | | | |
| | | Actual
Fund Return | | | Hypothetical
5% Return
(2.5% for
the period) | |
Account value at the beginning of the period | | $ | 1,000.00 | | | $ | 1,000.00 | |
Account value at the end of the period | | $ | 839.20 | | | $ | 1,019.81 | |
Expenses paid during the period* | | $ | 4.96 | | | $ | 5.45 | |
| * | Expenses are equal to the Fund’s annualized expense ratio of 1.07%**(for the period July 1, 2018-December 31, 2018), multiplied by the average account value over the period, multiplied by 184/365 (to reflect theone-half year period). |
| ** | May differ from expense ratio disclosed in the financial highlights, which is calculated based on the entire fiscal year’s data. |
| | | | |
| State Street Small-Cap Equity V.I.S. Fund | | | 3 | |
State Street Small-Cap Equity V.I.S. Fund
Performance Summary — December 31, 2018 (Unaudited)
Top Ten Largest Holdings
as of December 31, 2018 (as a % of Fair Value)(a)(b)
| | | | |
Ritchie Bros Auctioneers Inc. | | | 1.34 | % |
| |
John Wiley & Sons Inc., Class A | | | 1.29 | % |
| |
Sensient Technologies Corp. | | | 1.11 | % |
| |
Argo Group International Holdings Ltd. | | | 1.05 | % |
| |
The Brink’s Co. | | | 1.01 | % |
| |
Woodward Inc. | | | 0.98 | % |
| |
Darling Ingredients Inc. | | | 0.95 | % |
| |
The Timken Co. | | | 0.91 | % |
| |
Integra LifeSciences Holdings Corp. | | | 0.90 | % |
| |
Prosperity Bancshares Inc. | | | 0.89 | % |
Sector Allocation as of December 31, 2018
Portfolio composition as a % of Fair Value of $30,815 (in thousands) as of December 31, 2018(a)(b)
Average Annual Total Return for the periods ended December 31, 2018
Class 1 Shares (Inception Date 4/28/00)
| | | | | | | | | | | | | | | | |
| | | One Year | | | Five Year | | | Ten Year | | | Ending Value
of a $10,000
Investment | |
State StreetSmall-Cap Equity V.I.S. Fund | | | -9.70 | % | | | 4.62 | % | | | 12.96 | % | | $ | 33,818 | |
| | | | |
Russell 2000 Index | | | -11.01 | % | | | 4.41 | % | | | 11.97 | % | | $ | 30,983 | |
| (a) | Fair Value basis is inclusive of short-term investment in State Street Institutional U.S. Government Money Market Fund Class G Shares. |
| (b) | The securities information regarding holdings, allocations and other characteristics is presented to illustrate examples of securities that the Fund has bought and the diversity of areas in which the Fund may invest as of a particular date. It may not be representative of the Fund’s current or future investments and should not be construed as a recommendation to purchase or sell a particular security. |
| | |
| 4 | | State Street Small-Cap Equity V.I.S. Fund |
State Street Small-Cap Equity V.I.S. Fund
Performance Summary, continued — December 31, 2018 (Unaudited)
See Notes to Performance beginning on page 1 for further information.
Past performance does not predict future performance. The performance shown in the graphs and tables does not reflect the deduction of taxes that a shareholder would pay on Fund distributions or the redemption of Fund shares and does not reflect the fees or charges that would be associated with variable contracts through which shares of the Fund are offered.
| | | | |
| State Street Small-Cap Equity V.I.S. Fund | | | 5 | |
State Street Small-Cap Equity V.I.S. Fund
Schedule of Investments — December 31, 2018
| | | | | | | | |
| | | Number
of Shares | | | Fair
Value $ | |
| | | | | | | | |
|
| Common Stock - 96.0%† | |
Aerospace & Defense - 0.8% | | | | | |
Esterline Technologies Corp. (a) | | | 404 | | | | 49,066 | |
Teledyne Technologies Inc. (a) | | | 919 | | | | 190,297 | |
| | | | | | | | |
| | | | | | | 239,363 | |
| | | | | | | | |
| |
Agricultural & Farm Machinery - 0.6% | | | | | |
AGCO Corp. (b) | | | 3,038 | | | | 169,125 | |
| | | | | | | | |
| |
Agricultural Products - 1.0% | | | | | |
Darling Ingredients Inc. (a) | | | 15,211 | | | | 292,660 | |
| | | | | | | | |
| |
Air Freight & Logistics - 0.3% | | | | | |
Air Transport Services Group Inc. (a) | | | 628 | | | | 14,324 | |
Forward Air Corp. | | | 448 | | | | 24,573 | |
Hub Group Inc., Class A (a) | | | 1,156 | | | | 42,853 | |
| | | | | | | | |
| | | | | | | 81,750 | |
| | | | | | | | |
| | |
Airlines - 0.0%* | | | | | | | | |
Hawaiian Holdings Inc. | | | 404 | | | | 10,670 | |
| | | | | | | | |
| | |
Apparel Retail - 0.6% | | | | | | | | |
American Eagle Outfitters Inc. | | | 1,367 | | | | 26,424 | |
Burlington Stores Inc. (a) | | | 488 | | | | 79,383 | |
Chico’s FAS Inc. | | | 1,294 | | | | 7,272 | |
Tailored Brands Inc. | | | 550 | | | | 7,502 | |
The Buckle Inc. | | | 4,054 | | | | 78,405 | |
| | | | | | | | |
| | | | | | | 198,986 | |
| | | | | | | | |
|
Apparel, Accessories & Luxury Goods - 0.4% | |
G-III Apparel Group Ltd. (a) | | | 3,919 | | | | 109,301 | |
| | | | | | | | |
| |
Application Software - 6.8% | | | | | |
ACI Worldwide Inc. (a)(b) | | | 8,583 | | | | 237,492 | |
Blackbaud Inc. (b) | | | 4,117 | | | | 258,959 | |
Blackline Inc. (a) | | | 5,313 | | | | 217,567 | |
Cornerstone OnDemand Inc. (a) | | | 3,484 | | | | 175,698 | |
Envestnet Inc. (a) | | | 2,091 | | | | 102,856 | |
Fair Isaac Corp. (a) | | | 127 | | | | 23,749 | |
LogMeIn Inc. | | | 2,075 | | | | 169,258 | |
New Relic Inc. (a) | | | 2,975 | | | | 240,886 | |
Paylocity Holding Corp. (a) | | | 1,119 | | | | 67,375 | |
Q2 Holdings Inc. (a) | | | 3,300 | | | | 163,515 | |
RealPage Inc. (a) | | | 2,880 | | | | 138,787 | |
SS&C Technologies Holdings Inc. | | | 2,782 | | | | 125,496 | |
Yext Inc. (a) | | | 8,675 | | | | 128,824 | |
Zix Corp. (a) | | | 4,753 | | | | 27,235 | |
| | | | | | | | |
| | | | | | | 2,077,697 | |
| | | | | | | | |
|
Asset Management & Custody Banks - 0.1% | |
BrightSphere Investment Group PLC | | | 1,307 | | | | 13,959 | |
| | | | | | | | |
| | | Number
of Shares | | | Fair
Value $ | |
Cohen & Steers Inc. | | | 729 | | | | 25,019 | |
| | | | | | | | |
| | | | | | | 38,978 | |
| | | | | | | | |
Auto Parts & Equipment - 0.7% | |
Cooper-Standard Holdings Inc. (a) | | | 303 | | | | 18,822 | |
Gentherm Inc. (a) | | | 453 | | | | 18,111 | |
LCI Industries | | | 467 | | | | 31,196 | |
Modine Manufacturing Co. (a) | | | 985 | | | | 10,648 | |
Standard Motor Products Inc. | | | 1,549 | | | | 75,018 | |
Stoneridge Inc. (a) | | | 988 | | | | 24,354 | |
Tenneco Inc. | | | 301 | | | | 8,244 | |
Tower International Inc. | | | 678 | | | | 16,137 | |
| | | | | | | | |
| | | | | | | 202,530 | |
| | | | | | | | |
|
Automobile Manufacturers - 0.7% | |
Thor Industries Inc. | | | 3,653 | | | | 189,956 | |
Winnebago Industries Inc. | | | 433 | | | | 10,483 | |
| | | | | | | | |
| | | | | | | 200,439 | |
| | | | | | | | |
| | |
Automotive Retail - 1.3% | | | | | | | | |
America’sCar-Mart Inc. (a) | | | 497 | | | | 36,008 | |
Asbury Automotive Group Inc. (a) | | | 364 | | | | 24,264 | |
Group 1 Automotive Inc. | | | 1,870 | | | | 98,586 | |
Monro Inc. | | | 1,053 | | | | 72,394 | |
Murphy USA Inc. (a) | | | 2,347 | | | | 179,874 | |
| | | | | | | | |
| | | | | | | 411,126 | |
| | | | | | | | |
| | |
Biotechnology - 0.8% | | | | | | | | |
Heron Therapeutics Inc. (a) | | | 2,128 | | | | 55,200 | |
Myriad Genetics Inc. (a) | | | 531 | | | | 15,436 | |
Repligen Corp. (a) | | | 3,328 | | | | 175,519 | |
| | | | | | | | |
| | | | | | | 246,155 | |
| | | | | | | | |
| | |
Brewers - 0.3% | | | | | | | | |
The Boston Beer Company Inc., Class A (a) | | | 375 | | | | 90,315 | |
| | | | | | | | |
| | |
Building Products - 0.5% | | | | | | | | |
American Woodmark Corp. (a) | | | 201 | | | | 11,191 | |
Apogee Enterprises Inc. | | | 702 | | | | 20,955 | |
Builders FirstSource Inc. (a) | | | 1,166 | | | | 12,721 | |
Continental Building Products Inc. (a) | | | 524 | | | | 13,336 | |
Masonite International Corp. (a) | | | 178 | | | | 7,980 | |
NCI Building Systems Inc. (a) | | | 1,145 | | | | 8,301 | |
Patrick Industries Inc. (a) | | | 359 | | | | 10,630 | |
Trex Company Inc. (a) | | | 628 | | | | 37,278 | |
Universal Forest Products Inc. | | | 1,522 | | | | 39,511 | |
| | | | | | | | |
| | | | | | | 161,903 | |
| | | | | | | | |
| |
Commercial Printing - 0.1% | | | | | |
Deluxe Corp. | | | 425 | | | | 16,337 | |
| | | | | | | | |
See Notes to Schedule of Investments and Notes to Financial Statements.
| | |
| 6 | | State Street Small-Cap Equity V.I.S. Fund |
State Street Small-Cap Equity V.I.S. Fund
Schedule of Investments, continued — December 31, 2018
| | | | | | | | |
| | | Number
of Shares | | | Fair
Value $ | |
| | | | | | | | |
| |
Commodity Chemicals - 1.0% | | | | | |
AdvanSix Inc. (a) | | | 795 | | | | 19,350 | |
Koppers Holdings Inc. (a) | | | 14,732 | | | | 251,033 | |
Trinseo S.A. | | | 485 | | | | 22,204 | |
| | | | | | | | |
| | | | | | | 292,587 | |
| | | | | | | | |
| |
Communications Equipment - 0.4% | | | | | |
ADTRAN Inc. | | | 1,269 | | | | 13,629 | |
Ciena Corp. (a) | | | 521 | | | | 17,667 | |
Extreme Networks Inc. (a) | | | 2,332 | | | | 14,225 | |
Lumentum Holdings Inc. (a) | | | 989 | | | | 41,548 | |
NETGEAR Inc. (a) | | | 158 | | | | 8,221 | |
Plantronics Inc. | | | 374 | | | | 12,379 | |
| | | | | | | | |
| | | | | | | 107,669 | |
| | | | | | | | |
| |
Construction & Engineering - 1.4% | | | | | |
Aegion Corp. (a) | | | 11,845 | | | | 193,311 | |
Dycom Industries Inc. (a) | | | 4,200 | | | | 226,968 | |
EMCOR Group Inc. | | | 270 | | | | 16,116 | |
| | | | | | | | |
| | | | | | | 436,395 | |
| | | | | | | | |
|
Construction Machinery & Heavy Trucks - 1.4% | |
Alamo Group Inc. | | | 415 | | | | 32,088 | |
Astec Industries Inc. | | | 539 | | | | 16,272 | |
Federal Signal Corp. | | | 7,700 | | | | 153,230 | |
The Greenbrier Companies Inc. | | | 382 | | | | 15,104 | |
Trinity Industries Inc. | | | 8,602 | | | | 177,115 | |
Wabash National Corp. | | | 2,045 | | | | 26,749 | |
| | | | | | | | |
| | | | | | | 420,558 | |
| | | | | | | | |
| |
Construction Materials - 0.1% | | | | | |
Eagle Materials Inc. | | | 251 | | | | 15,318 | |
Summit Materials Inc., Class A (a) | | | 992 | | | | 12,301 | |
| | | | | | | | |
| | | | | | | 27,619 | |
| | | | | | | | |
| |
Consumer Electronics - 0.0%* | | | | | |
ZAGG Inc. (a) | | | 897 | | | | 8,773 | |
| | | | | | | | |
| |
Consumer Finance - 0.1% | | | | | |
Enova International Inc. (a) | | | 1,940 | | | | 37,752 | |
| | | | | | | | |
|
Data Processing & Outsourced Services - 1.8% | |
Broadridge Financial Solutions Inc. | | | 1,459 | | | | 140,429 | |
Cass Information Systems Inc. | | | 278 | | | | 14,712 | |
CoreLogic Inc. (a) | | | 2,406 | | | | 80,409 | |
CSG Systems International Inc. | | | 1,787 | | | | 56,773 | |
EVERTEC Inc. | | | 1,216 | | | | 34,899 | |
MAXIMUS Inc. | | | 315 | | | | 20,503 | |
NIC Inc. | | | 4,672 | | | | 58,307 | |
Travelport Worldwide Ltd. | | | 9,183 | | | | 143,438 | |
| | | | | | | | |
| | | | | | | 549,470 | |
| | | | | | | | |
| | | | | | | | |
| | | Number
of Shares | | | Fair
Value $ | |
Distillers & Vintners - 0.4% | | | | | | | | |
MGP Ingredients Inc. | | | 2,075 | | | | 118,379 | |
| | | | | | | | |
Distributors - 0.4% | | | | | | | | |
LKQ Corp. (a) | | | 5,752 | | | | 136,495 | |
| | | | | | | | |
| |
Diversified Metals & Mining - 0.3% | | | | | |
Compass Minerals International Inc. | | | 1,735 | | | | 72,332 | |
Materion Corp. | | | 346 | | | | 15,567 | |
| | | | | | | | |
| | | | | | | 87,899 | |
| | | | | | | | |
Diversified Real Estate Activities - 0.1% | |
The RMR Group Inc., Class A | | | 314 | | | | 16,667 | |
| | | | | | | | |
| | |
Diversified REITs - 0.2% | | | | | | | | |
American Assets Trust Inc. | | | 810 | | | | 32,538 | |
Global Net Lease Inc. | | | 1,109 | | | | 19,540 | |
| | | | | | | | |
| | | | | | | 52,078 | |
| | | | | | | | |
|
Diversified Support Services - 1.9% | |
Healthcare Services Group Inc. | | | 4,006 | | | | 160,961 | |
Ritchie Bros Auctioneers Inc. | | | 12,590 | | | | 411,945 | |
UniFirst Corp. | | | 184 | | | | 26,325 | |
| | | | | | | | |
| | | | | | | 599,231 | |
| | | | | | | | |
| | |
Education Services - 0.6% | | | | | | | | |
K12 Inc. (a) | | | 7,761 | | | | 192,395 | |
| | | | | | | | |
| | |
Electric Utilities - 1.0% | | | | | | | | |
ALLETE Inc. | | | 363 | | | | 27,668 | |
IDACORP Inc. | | | 2,886 | | | | 268,571 | |
| | | | | | | | |
| | | | | | | 296,239 | |
| | | | | | | | |
|
Electrical Components & Equipment - 0.3% | |
Atkore International Group Inc. (a) | | | 735 | | | | 14,582 | |
EnerSys | | | 341 | | | | 26,465 | |
Generac Holdings Inc. (a) | | | 398 | | | | 19,781 | |
Regal Beloit Corp. | | | 533 | | | | 37,337 | |
| | | | | | | | |
| | | | | | | 98,165 | |
| | | | | | | | |
Electronic Components - 1.2% | | | | | |
Belden Inc. | | | 4,767 | | | | 199,118 | |
Littelfuse Inc. | | | 944 | | | | 161,877 | |
| | | | | | | | |
| | | | | | | 360,995 | |
| | | | | | | | |
|
Electronic Equipment & Instruments - 0.7% | |
Control4 Corp. (a) | | | 538 | | | | 9,469 | |
National Instruments Corp. | | | 1,156 | | | | 52,459 | |
Novanta Inc. (a) | | | 425 | | | | 26,775 | |
Zebra Technologies Corp., Class A (a) | | | 818 | | | | 130,250 | |
| | | | | | | | |
| | | | | | | 218,953 | |
| | | | | | | | |
See Notes to Schedule of Investments and Notes to Financial Statements.
| | | | |
| State Street Small-Cap Equity V.I.S. Fund | | | 7 | |
State Street Small-Cap Equity V.I.S. Fund
Schedule of Investments, continued — December 31, 2018
| | | | | | | | |
| | | Number
of Shares | | | Fair
Value $ | |
| | | | | | | | |
|
Electronic Manufacturing Services - 0.3% | |
KEMET Corp. | | | 1,018 | | | | 17,856 | |
Methode Electronics Inc. | | | 997 | | | | 23,220 | |
Plexus Corp. (a) | | | 483 | | | | 24,672 | |
Sanmina Corp. (a) | | | 973 | | | | 23,410 | |
TTM Technologies Inc. (a) | | | 1,301 | | | | 12,659 | |
| | | | | | | | |
| | | | | | | 101,817 | |
| | | | | | | | |
|
Environmental & Facilities Services - 0.7% | |
Clean Harbors Inc. (a) | | | 4,214 | | | | 207,961 | |
| | | | | | | | |
| | |
Food Distributors - 0.7% | | | | | | | | |
Performance Food Group Co. (a) | �� | | 4,393 | | | | 141,762 | |
SpartanNash Co. | | | 5,016 | | | | 86,175 | |
| | | | | | | | |
| | | | | | | 227,937 | |
| | | | | | | | |
| | |
Food Retail - 0.2% | | | | | | | | |
Casey’s General Stores Inc. | | | 154 | | | | 19,733 | |
Sprouts Farmers Market Inc. (a) | | | 1,166 | | | | 27,413 | |
| | | | | | | | |
| | | | | | | 47,146 | |
| | | | | | | | |
| | |
Footwear - 1.0% | | | | | | | | |
Deckers Outdoor Corp. (a) | | | 1,088 | | | | 139,210 | |
Skechers U.S.A. Inc., Class A (a) | | | 650 | | | | 14,878 | |
Wolverine World Wide Inc. | | | 5,125 | | | | 163,436 | |
| | | | | | | | |
| | | | | | | 317,524 | |
| | | | | | | | |
| | |
Forest Products - 0.1% | | | | | | | | |
Boise Cascade Co. | | | 726 | | | | 17,315 | |
Louisiana-Pacific Corp. | | | 812 | | | | 18,043 | |
| | | | | | | | |
| | | | | | | 35,358 | |
| | | | | | | | |
| | |
Gas Utilities - 0.3% | | | | | | | | |
Chesapeake Utilities Corp. | | | 210 | | | | 17,073 | |
South Jersey Industries Inc. | | | 1,365 | | | | 37,947 | |
Spire Inc. | | | 451 | | | | 33,410 | |
| | | | | | | | |
| | | | | | | 88,430 | |
| | | | | | | | |
Health Care REITs - 0.2% | | | | | |
CareTrust REIT Inc. | | | 1,311 | | | | 24,201 | |
Physicians Realty Trust | | | 1,996 | | | | 31,996 | |
| | | | | | | | |
| | | | | | | 56,197 | |
| | | | | | | | |
| |
Healthcare Equipment - 5.4% | | | | | |
Cantel Medical Corp. | | | 1,125 | | | | 83,756 | |
Cardiovascular Systems Inc. (a) | | | 6,925 | | | | 197,293 | |
CONMED Corp. | | | 3,800 | | | | 243,960 | |
Hill-Rom Holdings Inc. | | | 2,783 | | | | 246,435 | |
Insulet Corp. (a) | | | 1,650 | | | | 130,878 | |
Integer Holdings Corp. (a) | | | 242 | | | | 18,455 | |
Integra LifeSciences Holdings Corp. (a) | | | 6,150 | | | | 277,365 | |
IntriCon Corp. (a) | | | 1,369 | | | | 36,114 | |
| | | | | | | | |
| | | Number
of Shares | | | Fair
Value $ | |
LeMaitre Vascular Inc. | | | 447 | | | | 10,567 | |
LivaNova PLC (a) | | | 266 | | | | 24,331 | |
Masimo Corp. (a) | | | 825 | | | | 88,580 | |
NuVasive Inc. (a) | | | 3,415 | | | | 169,248 | |
Orthofix Medical Inc. (a) | | | 296 | | | | 15,537 | |
Penumbra Inc. (a) | | | 850 | | | | 103,870 | |
| | | | | | | | |
| | | | | | | 1,646,389 | |
| | | | | | | | |
| |
Healthcare Facilities - 0.4% | | | | | |
Acadia Healthcare Company Inc.��(a)(b) | | | 3,239 | | | | 83,275 | |
Select Medical Holdings Corp. (a) | | | 1,423 | | | | 21,843 | |
Tenet Healthcare Corp. (a) | | | 432 | | | | 7,404 | |
The Ensign Group Inc. | | | 415 | | | | 16,098 | |
| | | | | | | | |
| | | | | | | 128,620 | |
| | | | | | | | |
| |
Healthcare Services - 1.4% | | | | | |
Amedisys Inc. (a) | | | 461 | | | | 53,988 | |
AMN Healthcare Services Inc. (a) | | | 517 | | | | 29,293 | |
BioTelemetry Inc. (a) | | | 1,859 | | | | 111,020 | |
Chemed Corp. | | | 85 | | | | 24,079 | |
Diplomat Pharmacy Inc. (a) | | | 4,472 | | | | 60,193 | |
MEDNAX Inc. (a) | | | 3,838 | | | | 126,654 | |
RadNet Inc. (a) | | | 1,973 | | | | 20,065 | |
| | | | | | | | |
| | | | | | | 425,292 | |
| | | | | | | | |
| |
Healthcare Supplies - 1.1% | | | | | |
Avanos Medical Inc. (a) | | | 5,620 | | | | 251,720 | |
Endologix Inc. (a) | | | 9,292 | | | | 6,653 | |
ICU Medical Inc. (a) | | | 106 | | | | 24,341 | |
Lantheus Holdings Inc. (a) | | | 1,345 | | | | 21,049 | |
Merit Medical Systems Inc. (a) | | | 691 | | | | 38,565 | |
| | | | | | | | |
| | | | | | | 342,328 | |
| | | | | | | | |
|
Healthcare Technology - 1.9% | |
HMS Holdings Corp. (a) | | | 7,069 | | | | 198,851 | |
Medidata Solutions Inc. (a) | | | 2,975 | | | | 200,574 | |
NextGen Healthcare Inc. (a) | | | 1,018 | | | | 15,423 | |
Omnicell Inc. (a) | | | 1,605 | | | | 98,290 | |
Teladoc Health Inc. (a) | | | 1,675 | | | | 83,030 | |
| | | | | | | | |
| | | | | | | 596,168 | |
| | | | | | | | |
| | |
Home Building - 0.2% | | | | | | | | |
KB Home | | | 780 | | | | 14,898 | |
LGI Homes Inc. (a) | | | 478 | | | | 21,615 | |
TopBuild Corp. (a) | | | 838 | | | | 37,710 | |
| | | | | | | | |
| | | | | | | 74,223 | |
| | | | | | | | |
| |
Home Furnishing Retail - 0.6% | | | | | |
Aaron’s Inc. (b) | | | 3,953 | | | | 166,224 | |
RH (a) | | | 273 | | | | 32,711 | |
| | | | | | | | |
| | | | | | | 198,935 | |
| | | | | | | | |
See Notes to Schedule of Investments and Notes to Financial Statements.
| | |
| 8 | | State Street Small-Cap Equity V.I.S. Fund |
State Street Small-Cap Equity V.I.S. Fund
Schedule of Investments, continued — December 31, 2018
| | | | | | | | |
| | | Number
of Shares | | | Fair
Value $ | |
| | | | | | | | |
Hotel & Resort REITs - 0.5% | | | | | |
Ashford Hospitality Trust Inc. | | | 1,664 | | | | 6,656 | |
Chatham Lodging Trust | | | 1,193 | | | | 21,092 | |
RLJ Lodging Trust | | | 6,764 | | | | 110,930 | |
| | | | | | | | |
| | | | | | | 138,678 | |
| | | | | | | | |
|
Hotels, Resorts & Cruise Lines - 0.8% | |
Extended Stay America Inc. | | | 15,037 | | | | 233,074 | |
Hilton Grand Vacations Inc. (a) | | | 301 | | | | 7,943 | |
| | | | | | | | |
| | | | | | | 241,017 | |
| | | | | | | | |
| |
Household Appliances - 0.5% | | | | | |
Helen of Troy Ltd. (a) | | | 1,084 | | | | 142,199 | |
| | | | | | | | |
| |
Housewares & Specialties - 0.0%* | | | | | |
Tupperware Brands Corp. | | | 235 | | | | 7,419 | |
| | | | | | | | |
|
Human Resource & Employment Services - 0.4% | |
ASGN Inc. (a) | | | 447 | | | | 24,361 | |
Barrett Business Services Inc. | | | 179 | | | | 10,248 | |
Heidrick & Struggles International Inc. | | | 448 | | | | 13,973 | |
Insperity Inc. | | | 622 | | | | 58,070 | |
Kforce Inc. | | | 966 | | | | 29,869 | |
| | | | | | | | |
| | | | | | | 136,521 | |
| | | | | | | | |
|
Hypermarkets & Super Centers - 0.1% | |
BJ’s Wholesale Club Holdings Inc. (a) | | | 941 | | | | 20,853 | |
| | | | | | | | |
| |
Industrial Machinery - 7.8% | | | | | |
Actuant Corp., Class A (b) | | | 10,126 | | | | 212,545 | |
Altra Industrial Motion Corp. | | | 6,094 | | | | 153,264 | |
Barnes Group Inc. | | | 5,093 | | | | 273,087 | |
Crane Co. | | | 2,154 | | | | 155,476 | |
Evoqua Water Technologies Corp. (a) | | | 3,275 | | | | 31,440 | |
Franklin Electric Company Inc. | | | 641 | | | | 27,486 | |
Harsco Corp. (a) | | | 594 | | | | 11,797 | |
Hillenbrand Inc. | | | 489 | | | | 18,548 | |
John Bean Technologies Corp. | | | 2,750 | | | | 197,477 | |
Kennametal Inc. | | | 805 | | | | 26,790 | |
LB Foster Co., Class A (a) | | | 741 | | | | 11,782 | |
Lydall Inc. (a) | | | 3,375 | | | | 68,546 | |
Mueller Industries Inc. | | | 4,698 | | | | 109,745 | |
Standex International Corp. | | | 1,965 | | | | 132,009 | |
The Timken Co. | | | 7,522 | | | | 280,721 | |
TriMas Corp. (a) | | | 3,425 | | | | 93,468 | |
Watts Water Technologies Inc., Class A | | | 1,507 | | | | 97,247 | |
Welbilt Inc. (a) | | | 16,900 | | | | 187,759 | |
Woodward Inc. | | | 4,050 | | | | 300,874 | |
| | | | | | | | |
| | | | | | | 2,390,061 | |
| | | | | | | | |
| | | | | | | | |
| | | Number
of Shares | | | Fair
Value $ | |
Industrial REITs - 0.6% | | | | | | | | |
EastGroup Properties Inc. | | | 1,417 | | | | 129,981 | |
Rexford Industrial Realty Inc. | | | 579 | | | | 17,063 | |
STAG Industrial Inc. | | | 1,562 | | | | 38,863 | |
| | | | | | | | |
| | | | | | | 185,907 | |
| | | | | | | | |
|
Interactive Home Entertainment - 0.1% | |
Glu Mobile Inc. (a) | | | 2,997 | | | | 24,186 | |
| | | | | | | | |
|
Interactive Media & Services - 0.1% | |
Care.com Inc. (a) | | | 1,255 | | | | 24,234 | |
| | | | | | | | |
|
Internet & Direct Marketing Retail - 0.1% | |
Stamps.com Inc. (a) | | | 130 | | | | 20,233 | |
| | | | | | | | |
|
Internet Services & Infrastructure - 0.8% | |
Okta Inc. (a) | | | 4,025 | | | | 256,795 | |
| | | | | | | | |
|
Investment Banking & Brokerage - 0.9% | |
BGC Partners Inc., Class A | | | 2,683 | | | | 13,871 | |
Evercore Inc., Class A | | | 233 | | | | 16,674 | |
Greenhill & Company Inc. | | | 707 | | | | 17,251 | |
Houlihan Lokey Inc. | | | 798 | | | | 29,366 | |
Piper Jaffray Cos. | | | 515 | | | | 33,908 | |
Raymond James Financial Inc. | | | 1,842 | | | | 137,063 | |
Stifel Financial Corp. | | | 781 | | | | 32,349 | |
| | | | | | | | |
| | | | | | | 280,482 | |
| | | | | | | | |
|
IT Consulting & Other Services - 0.1% | |
Perficient Inc. (a) | | | 827 | | | | 18,409 | |
Science Applications International Corp. | | | 248 | | | | 15,798 | |
| | | | | | | | |
| | | | | | | 34,207 | |
| | | | | | | | |
Leisure Products - 0.6% | | | | | | | | |
Acushnet Holdings Corp. | | | 438 | | | | 9,229 | |
Malibu Boats Inc., Class A (a) | | | 628 | | | | 21,854 | |
MasterCraft Boat Holdings Inc. (a) | | | 986 | | | | 18,438 | |
Polaris Industries Inc. | | | 1,594 | | | | 122,228 | |
| | | | | | | | |
| | | | | | | 171,749 | |
| | | | | | | | |
|
Life & Health Insurance - 0.1% | |
Trupanion Inc. (a) | | | 1,421 | | | | 36,179 | |
| | | | | | | | |
|
Life Sciences Tools & Services - 1.7% | |
Bruker Corp. | | | 4,225 | | | | 125,778 | |
Cambrex Corp. (a) | | | 204 | | | | 7,703 | |
ICON PLC (a) | | | 1,401 | | | | 181,023 | |
Medpace Holdings Inc. (a) | | | 448 | | | | 23,713 | |
PRA Health Sciences Inc. (a) | | | 363 | | | | 33,382 | |
Syneos Health Inc. (a) | | | 4,046 | | | | 159,210 | |
| | | | | | | | |
| | | | | | | 530,809 | |
| | | | | | | | |
See Notes to Schedule of Investments and Notes to Financial Statements.
| | | | |
| State Street Small-Cap Equity V.I.S. Fund | | | 9 | |
State Street Small-Cap Equity V.I.S. Fund
Schedule of Investments, continued — December 31, 2018
| | | | | | | | |
| | | Number
of Shares | | | Fair
Value $ | |
| | | | | | | | |
Managed Healthcare - 0.1% | | | | | |
Magellan Health Inc. (a) | | | 269 | | | | 15,303 | |
| | | | | | | | |
| | |
Marine - 0.1% | | | | | | | | |
Kirby Corp. (a) | | | 211 | | | | 14,213 | |
Matson Inc. | | | 625 | | | | 20,012 | |
| | | | | | | | |
| | | | | | | 34,225 | |
| | | | | | | | |
| |
Multi-Line Insurance - 0.4% | | | | | |
Horace Mann Educators Corp. | | | 2,747 | | | | 102,875 | |
National General Holdings Corp. | | | 807 | | | | 19,538 | |
| | | | | | | | |
| | | | | | | 122,413 | |
| | | | | | | | |
| | |
Multi-Utilities - 0.1% | | | | | | | | |
Black Hills Corp. | | | 640 | | | | 40,179 | |
| | | | | | | | |
| | |
Office REITs - 0.7% | | | | | | | | |
Brandywine Realty Trust | | | 1,999 | | | | 25,727 | |
Corporate Office Properties Trust | | | 966 | | | | 20,315 | |
Cousins Properties Inc. | | | 21,592 | | | | 170,577 | |
Franklin Street Properties Corp. | | | 2,053 | | | | 12,790 | |
| | | | | | | | |
| | | | | | | 229,409 | |
| | | | | | | | |
| |
Office Services & Supplies - 1.0% | | | | | |
Herman Miller Inc. | | | 538 | | | | 16,274 | |
HNI Corp. | | | 480 | | | | 17,006 | |
Knoll Inc. | | | 691 | | | | 11,388 | |
MSA Safety Inc. | | | 2,662 | | | | 250,947 | |
Steelcase Inc., Class A | | | 1,243 | | | | 18,434 | |
| | | | | | | | |
| | | | | | | 314,049 | |
| | | | | | | | |
| | |
Oil & Gas Drilling - 0.0%* | | | | | | | | |
Nabors Industries Ltd. | | | 3,783 | | | | 7,566 | |
| | | | | | | | |
|
Oil & Gas Equipment & Services - 0.6% | |
C&J Energy Services Inc. (a) | | | 1,391 | | | | 18,779 | |
Cactus Inc., Class A (a) | | | 736 | | | | 20,174 | |
Forum Energy Technologies Inc. (a) | | | 9,079 | | | | 37,496 | |
Keane Group Inc. (a) | | | 689 | | | | 5,636 | |
Natural Gas Services Group Inc. (a) | | | 1,010 | | | | 16,604 | |
Oil States International Inc. (a) | | | 5,266 | | | | 75,198 | |
| | | | | | | | |
| | | | | | | 173,887 | |
| | | | | | | | |
|
Oil & Gas Exploration & Production - 1.4% | |
Callon Petroleum Co. (a) | | | 4,780 | | | | 31,022 | |
Carrizo Oil & Gas Inc. (a) | | | 5,917 | | | | 66,803 | |
Gulfport Energy Corp. (a) | | | 2,332 | | | | 15,275 | |
Newfield Exploration Co. (a) | | | 11,233 | | | | 164,676 | |
Oasis Petroleum Inc. (a) | | | 1,484 | | | | 8,207 | |
PDC Energy Inc. (a) | | | 344 | | | | 10,237 | |
Range Resources Corp. | | | 1,086 | | | | 10,393 | |
| | | | | | | | |
| | | Number
of Shares | | | Fair
Value $ | |
Ring Energy Inc. (a) | | | 3,464 | | | | 17,597 | |
Rosehill Resources Inc. (a) | | | 1,175 | | | | 2,620 | |
SM Energy Co. | | | 6,627 | | | | 102,586 | |
WildHorse Resource Development Corp. (a) | | | 461 | | | | 6,505 | |
| | | | | | | | |
| | | | | | | 435,921 | |
| | | | | | | | |
|
Oil & Gas Refining & Marketing - 0.1% | |
Renewable Energy Group Inc. (a) | | | 807 | | | | 20,740 | |
| | | | | | | | |
|
Packaged Foods & Meats - 3.6% | |
B&G Foods Inc. | | | 7,700 | | | | 222,607 | |
Calavo Growers Inc. | | | 169 | | | | 12,330 | |
Hostess Brands Inc. (a) | | | 19,950 | | | | 218,253 | |
J&J Snack Foods Corp. | | | 425 | | | | 61,451 | |
John B Sanfilippo & Son Inc. | | | 189 | | | | 10,520 | |
Sanderson Farms Inc. | | | 2,637 | | | | 261,828 | |
The Simply Good Foods Co. (a) | | | 6,850 | | | | 129,465 | |
TreeHouse Foods Inc. (a) | | | 3,960 | | | | 200,811 | |
| | | | | | | | |
| | | | | | | 1,117,265 | |
| | | | | | | | |
| | |
Paper Products - 0.1% | | | | | | | | |
Neenah Inc. | | | 264 | | | | 15,555 | |
Verso Corp., Class A (a) | | | 797 | | | | 17,853 | |
| | | | | | | | |
| | | | | | | 33,408 | |
| | | | | | | | |
| | |
Personal Products - 0.4% | | | | | | | | |
elf Beauty Inc. (a) | | | 9,350 | | | | 80,971 | |
USANA Health Sciences Inc. (a) | | | 309 | | | | 36,379 | |
| | | | | | | | |
| | | | | | | 117,350 | |
| | | | | | | | |
| | |
Pharmaceuticals - 2.1% | | | | | | | | |
Assertio Therapeutics Inc. (a) | | | 2,242 | | | | 8,094 | |
Catalent Inc. (a) | | | 4,887 | | | | 152,377 | |
Endo International PLC (a) | | | 1,166 | | | | 8,512 | |
Horizon Pharma PLC (a) | | | 1,435 | | | | 28,040 | |
Innoviva Inc. (a) | | | 1,345 | | | | 23,470 | |
Phibro Animal Health Corp., Class A | | | 628 | | | | 20,196 | |
Prestige Consumer Healthcare Inc. (a) | | | 8,072 | | | | 249,263 | |
Supernus Pharmaceuticals Inc. (a) | | | 4,688 | | | | 155,735 | |
| | | | | | | | |
| | | | | | | 645,687 | |
| | | | | | | | |
| |
Property & Casualty Insurance - 2.8% | | | | | |
AMERISAFE Inc. | | | 1,987 | | | | 112,643 | |
Argo Group International Holdings Ltd. | | | 4,793 | | | | 322,329 | |
James River Group Holdings Ltd. | | | 1,800 | | | | 65,772 | |
RLI Corp. | | | 1,693 | | | | 116,800 | |
The Navigators Group Inc. | | | 3,325 | | | | 231,054 | |
Universal Insurance Holdings Inc. | | | 531 | | | | 20,136 | |
| | | | | | | | |
| | | | | | | 868,734 | |
| | | | | | | | |
See Notes to Schedule of Investments and Notes to Financial Statements.
| | |
| 10 | | State Street Small-Cap Equity V.I.S. Fund |
State Street Small-Cap Equity V.I.S. Fund
Schedule of Investments, continued — December 31, 2018
| | | | | | | | |
| | | Number
of Shares | | | Fair
Value $ | |
| | | | | | | | |
Publishing - 1.3% | | | | | | | | |
John Wiley & Sons Inc., Class A (b) | | | 8,462 | | | | 397,460 | |
| | | | | | | | |
| | |
Railroads - 0.7% | | | | | | | | |
Genesee & Wyoming Inc., Class A (a) | | | 2,912 | | | | 215,546 | |
| | | | | | | | |
| |
Real Estate Services - 0.0%* | | | | | |
Newmark Group Inc., Class A | | | 748 | | | | 5,999 | |
| | | | | | | | |
| | |
Regional Banks - 8.8% | | | | | | | | |
1st Source Corp. | | | 518 | | | | 20,896 | |
Bank OZK | | | 486 | | | | 11,095 | |
BankUnited Inc. | | | 265 | | | | 7,934 | |
Banner Corp. | | | 369 | | | | 19,734 | |
Bryn Mawr Bank Corp. | | | 2,575 | | | | 88,580 | |
Cadence BanCorp | | | 1,778 | | | | 29,835 | |
Camden National Corp. | | | 537 | | | | 19,316 | |
Cathay General Bancorp | | | 480 | | | | 16,094 | |
Chemical Financial Corp. | | | 891 | | | | 32,620 | |
Columbia Banking System Inc. | | | 902 | | | | 32,734 | |
Community Bank System Inc. | | | 2,150 | | | | 125,345 | |
Cullen/Frost Bankers Inc. | | | 1,513 | | | | 133,053 | |
CVB Financial Corp. | | | 5,900 | | | | 119,357 | |
Enterprise Financial Services Corp. | | | 658 | | | | 24,761 | |
Equity Bancshares Inc., Class A (a) | | | 434 | | | | 15,298 | |
First Financial Bankshares Inc. | | | 675 | | | | 38,941 | |
First Interstate BancSystem Inc., Class A | | | 937 | | | | 34,257 | |
Fulton Financial Corp. | | | 8,536 | | | | 132,137 | |
German American Bancorp Inc. | | | 2,750 | | | | 76,367 | |
Hancock Whitney Corp. | | | 658 | | | | 22,800 | |
Home BancShares Inc. | | | 1,368 | | | | 22,353 | |
IBERIABANK Corp. | | | 2,252 | | | | 144,759 | |
Independent Bank Corp. | | | 2,250 | | | | 158,197 | |
Lakeland Financial Corp. | | | 387 | | | | 15,542 | |
LegacyTexas Financial Group Inc. | | | 1,096 | | | | 35,171 | |
Origin Bancorp Inc. | | | 650 | | | | 22,152 | |
Pinnacle Financial Partners Inc. | | | 584 | | | | 26,922 | |
Prosperity Bancshares Inc. | | | 4,417 | | | | 275,179 | |
Renasant Corp. | | | 5,612 | | | | 169,370 | |
Sandy Spring Bancorp Inc. | | | 758 | | | | 23,756 | |
Simmons First National Corp., Class A | | | 932 | | | | 22,489 | |
Stock Yards Bancorp Inc. | | | 2,290 | | | | 75,112 | |
UMB Financial Corp. | | | 3,800 | | | | 231,686 | |
Umpqua Holdings Corp. | | | 1,871 | | | | 29,749 | |
Union Bankshares Corp. | | | 816 | | | | 23,036 | |
United Community Banks Inc. | | | 1,150 | | | | 24,679 | |
Washington Trust Bancorp Inc. | | | 1,975 | | | | 93,872 | |
Westamerica Bancorporation | | | 2,587 | | | | 144,044 | |
| | | | | | | | |
| | | Number
of Shares | | | Fair
Value $ | |
Western Alliance Bancorp (a) | | | 3,851 | | | | 152,076 | |
Wintrust Financial Corp. | | | 369 | | | | 24,535 | |
| | | | | | | | |
| | | | | | | 2,715,833 | |
| | | | | | | | |
|
Research & Consulting Services - 0.3% | |
Resources Connection Inc. | | | 6,985 | | | | 99,187 | |
| | | | | | | | |
| | |
Restaurants - 1.2% | | | | | | | | |
BJ’s Restaurants Inc. | | | 553 | | | | 27,965 | |
Bloomin’ Brands Inc. | | | 448 | | | | 8,015 | |
Brinker International Inc. | | | 504 | | | | 22,166 | |
Cracker Barrel Old Country Store Inc. | | | 456 | | | | 72,896 | |
Dave & Buster’s Entertainment Inc. | | | 359 | | | | 15,997 | |
El Pollo Loco Holdings Inc. (a) | | | 2,700 | | | | 40,959 | |
Red Robin Gourmet Burgers Inc. (a) | | | 223 | | | | 5,958 | |
Ruth’s Hospitality Group Inc. | | | 1,148 | | | | 26,094 | |
Texas Roadhouse Inc. | | | 1,730 | | | | 103,281 | |
The Cheesecake Factory Inc. | | | 1,268 | | | | 55,171 | |
| | | | | | | | |
| | | | | | | 378,502 | |
| | | | | | | | |
| | |
Retail REITs - 0.1% | | | | | | | | |
Retail Opportunity Investments Corp. | | | 2,050 | | | | 32,554 | |
| | | | | | | | |
|
Security & Alarm Services - 1.0% | |
The Brink’s Co. | | | 4,834 | | | | 312,518 | |
| | | | | | | | |
|
Semiconductor Equipment - 0.6% | |
Advanced Energy Industries Inc. (a) | | | 899 | | | | 38,594 | |
Amkor Technology Inc. (a) | | | 1,883 | | | | 12,353 | |
Ichor Holdings Ltd. (a) | | | 2,091 | | | | 34,083 | |
MKS Instruments Inc. | | | 359 | | | | 23,195 | |
Nanometrics Inc. (a) | | | 628 | | | | 17,163 | |
Rudolph Technologies Inc. (a) | | | 2,835 | | | | 58,033 | |
Versum Materials Inc. | | | 417 | | | | 11,559 | |
| | | | | | | | |
| | | | | | | 194,980 | |
| | | | | | | | |
| | |
Semiconductors - 0.6% | | | | | | | | |
Cirrus Logic Inc. (a) | | | 223 | | | | 7,399 | |
Semtech Corp. (a) | | | 3,454 | | | | 158,435 | |
SMART Global Holdings Inc. (a) | | | 1,026 | | | | 30,472 | |
| | | | | | | | |
| | | | | | | 196,306 | |
| | | | | | | | |
| | |
Soft Drinks - 0.2% | | | | | | | | |
Cott Corp. | | | 4,459 | | | | 62,158 | |
| | | | | | | | |
|
Specialized Consumer Services - 0.0%* | |
Weight Watchers International Inc. (a) | | | 357 | | | | 13,762 | |
| | | | | | | | |
See Notes to Schedule of Investments and Notes to Financial Statements.
| | | | |
| State Street Small-Cap Equity V.I.S. Fund | | | 11 | |
State Street Small-Cap Equity V.I.S. Fund
Schedule of Investments, continued — December 31, 2018
| | | | | | | | |
| | | Number
of Shares | | | Fair
Value $ | |
| | | | | | | | |
Specialized REITs - 0.3% | | | | | |
CoreSite Realty Corp. | | | 800 | | | | 69,784 | |
PotlatchDeltic Corp. | | | 989 | | | | 31,292 | |
| | | | | | | | |
| | | | | | | 101,076 | |
| | | | | | | | |
| |
Specialty Chemicals - 4.5% | | | | | |
Chase Corp. | | | 385 | | | | 38,519 | |
Ferro Corp. (a) | | | 1,236 | | | | 19,380 | |
HB Fuller Co. | | | 5,516 | | | | 235,368 | |
Ingevity Corp. (a) | | | 2,156 | | | | 180,436 | |
Innospec Inc. | | | 2,475 | | | | 152,856 | |
Minerals Technologies Inc. | | | 397 | | | | 20,382 | |
PolyOne Corp. | | | 4,973 | | | | 142,228 | |
PQ Group Holdings Inc. (a) | | | 590 | | | | 8,738 | |
Quaker Chemical Corp. | | | 913 | | | | 162,249 | |
Sensient Technologies Corp. | | | 6,133 | | | | 342,528 | |
Stepan Co. | | | 1,306 | | | | 96,644 | |
| | | | | | | | |
| | | | | | | 1,399,328 | |
| | | | | | | | |
| | |
Specialty Stores - 0.6% | | | | | | | | |
Sally Beauty Holdings Inc. (a) | | | 10,348 | | | | 176,433 | |
| | | | | | | | |
| | |
Steel - 0.4% | | | | | | | | |
Carpenter Technology Corp. | | | 887 | | | | 31,586 | |
Commercial Metals Co. | | | 4,896 | | | | 78,434 | |
| | | | | | | | |
| | | | | | | 110,020 | |
| | | | | | | | |
Systems Software - 1.0% | | | | | |
Progress Software Corp. | | | 693 | | | | 24,595 | |
Qualys Inc. (a) | | | 2,425 | | | | 181,244 | |
Talend S.A. ADR (a) | | | 2,650 | | | | 98,262 | |
| | | | | | | | |
| | | | | | | 304,101 | |
| | | | | | | | |
| |
Technology Distributors - 0.2% | | | | | |
Insight Enterprises Inc. (a) | | | 448 | | | | 18,256 | |
SYNNEX Corp. | | | 206 | | | | 16,653 | |
Tech Data Corp. (a) | | | 466 | | | | 38,124 | |
| | | | | | | | |
| | | | | | | 73,033 | |
| | | | | | | | |
|
Technology Hardware, Storage & Peripherals - 0.7% | |
Diebold Nixdorf Inc. | | | 6,252 | | | | 15,567 | |
Pure Storage Inc., Class A (a) | | | 12,750 | | | | 205,020 | |
| | | | | | | | |
| | | | | | | 220,587 | |
| | | | | | | | |
Thrifts & Mortgage Finance - 0.6% | |
Axos Financial Inc. (a) | | | 876 | | | | 22,058 | |
Essent Group Ltd. (a) | | | 558 | | | | 19,072 | |
| | | | | | | | |
| | | Number
of Shares | | | Fair
Value $ | |
HomeStreet Inc. (a) | | | 1,008 | | | | 21,400 | |
Kearny Financial Corp. | | | 646 | | | | 8,282 | |
NMI Holdings Inc., Class A (a) | | | 1,076 | | | | 19,206 | |
Walker & Dunlop Inc. | | | 444 | | | | 19,203 | |
WSFS Financial Corp. | | | 2,042 | | | | 77,412 | |
| | | | | | | | |
| | | | | | | 186,633 | |
| | | | | | | | |
| | |
Tires & Rubber - 0.1% | | | | | | | | |
Cooper Tire & Rubber Co. | | | 1,412 | | | | 45,650 | |
| | | | | | | | |
| | |
Tobacco - 0.1% | | | | | | | | |
Turning Point Brands Inc. | | | 646 | | | | 17,584 | |
| | | | | | | | |
|
Trading Companies & Distributors - 0.6% | |
Applied Industrial Technologies Inc. | | | 3,162 | | | | 170,558 | |
BMC Stock Holdings Inc. (a) | | | 897 | | | | 13,886 | |
GMS Inc. (a) | | | 571 | | | | 8,485 | |
| | | | | | | | |
| | | | | | | 192,929 | |
| | | | | | | | |
| | |
Trucking - 0.6% | | | | | | | | |
ArcBest Corp. | | | 448 | | | | 15,349 | |
Avis Budget Group Inc. (a) | | | 538 | | | | 12,094 | |
Marten Transport Ltd. | | | 1,200 | | | | 19,428 | |
Old Dominion Freight Line Inc. | | | 1,020 | | | | 125,960 | |
Saia Inc. (a) | | | 293 | | | | 16,355 | |
| | | | | | | | |
| | | | | | | 189,186 | |
| | | | | | | | |
| | |
Total Common Stock
(Cost $26,774,201) | | | | | | | 29,559,009 | |
| | | | | | | | |
| |
| Short-Term Investments - 4.1% | | | | | |
State Street Institutional U.S. Government Money Market Fund - Class G Shares 2.31%
(Cost $1,256,107) (c,d) | | | 1,256,107 | | | | 1,256,107 | |
| | | | | | | | |
| | |
Total Investments
(Cost $28,030,308) | | | | | | | 30,815,116 | |
| | |
| Liabilities in Excess of Other Assets, net - (0.1)% | | | | | | | (33,707 | ) |
| | | | | | | | |
| | |
| NET ASSETS - 100.0% | | | | | | | 30,781,409 | |
| | | | | | | | |
See Notes to Schedule of Investments and Notes to Financial Statements.
| | |
| 12 | | State Street Small-Cap Equity V.I.S. Fund |
State Street Small-Cap Equity V.I.S. Fund
Notes to Schedule of Investments — December 31, 2018
Other Information:
The Fund had the following long futures contracts open at December 31, 2018:
| | | | | | | | | | | | | | | | | | | | |
| Description | | Expiration
date | | | Number of
Contracts | | | Notional
Amount | | | Value | | | Unrealized
Depreciation | |
E-mini Russell 2000 Index Futures | | | March 2019 | | | | 7 | | | $ | 490,332 | | | $ | 472,150 | | | $ | (18,182 | ) |
| | | | | | | | | | | | | | | | | | | | |
During the year ended December 31, 2018, average notional value related to long futures contracts was $649,706.
The views expressed in this document reflect our judgment as of the publication date and are subject to change at any time without notice. The securities cited may not be representative of the Fund’s future investments and should not be construed as a recommendation to purchase or sell a particular security. See the Fund’s summary prospectus and statutory prospectus for complete descriptions of investment objectives, policies, risks and permissible investments.
| (a) | Non-income producing security. |
| (b) | At December 31, 2018, all or a portion of this security was pledged to cover collateral requirements for futures. |
| (c) | Sponsored by SSGA Funds Management, Inc., the Fund’s investment adviser and administrator, and an affiliate of State Street Bank & Trust Co., the Fund’ssub-administrator, custodian and accounting agent. |
| (d) | Coupon amount represents effective yield. |
| † | Percentages are based on net assets as of December 31, 2018. |
Abbreviations:
ADR - American Depositary Receipt
REIT - Real Estate Investment Trust
The following table presents the Fund’s investments measured at fair value on a recurring basis at December 31, 2018:
| | | | | | | | | | | | | | | | |
| | | Level 1 | | | Level 2 | | | Level 3 | | | Total | |
Investments in Securities | | | | | | | | | | | | | | | | |
Common Stock | | $ | 29,559,009 | | | $ | — | | | $ | — | | | $ | 29,559,009 | |
Short-Term Investments | | | 1,256,107 | | | | — | | | | — | | | | 1,256,107 | |
| | | | | | | | | | | | | | | | |
Total Investments in Securities | | $ | 30,815,116 | | | $ | — | | | $ | — | | | $ | 30,815,116 | |
| | | | | | | | | | | | | | | | |
Other Financial Instruments | | | | | | | | | | | | | | | | |
Long Futures Contracts - Unrealized Depreciation | | $ | (18,182 | ) | | $ | — | | | $ | — | | | $ | (18,182 | ) |
| | | | | | | | | | | | | | | | |
Affiliate Table
| | | | | | | | | | | | | | | | | | | | | | | | | | | | |
| | | Number
of Shares
Held at
12/31/17 | | | Value At
12/31/17 | | | Cost of
Purchases | | | Proceeds
from
Shares
Sold | | | Number
of Shares
Held at
12/31/18 | | | Value at
12/31/18 | | | Dividend
Income | |
State Street Institutional U.S. Government Money Market Fund - Class G Shares | | | 2,619,140 | | | $ | 2,619,140 | | | $ | 12,603,910 | | | $ | 13,966,943 | | | | 1,256,107 | | | $ | 1,256,107 | | | $ | 36,501 | |
See Notes to Schedule of Investments and Notes to Financial Statements.
| | | | |
| State Street Small-Cap Equity V.I.S. Fund | | | 13 | |
State Street Small-Cap Equity V.I.S. Fund
Financial Highlights
Selected data based on a share outstanding throughout the fiscal years indicated
| | | | | | | | | | | | | | | | | | | | |
| | | 12/31/18 | | | 12/31/17 | | | 12/31/16 | | | 12/31/15* | | | 12/31/14* | |
| Inception date | | | | | | | | | | | | | | | | | | | 4/28/00 | |
| | | | | |
Net asset value, beginning of period | | $ | 14.73 | | | $ | 14.40 | | | $ | 12.20 | | | $ | 14.39 | | | $ | 16.26 | |
| | | | | | | | | | | | | | | | | | | | |
|
Income/(loss) from investment operations: | |
Net investment loss | | | (0.02 | )(a) | | | (0.02 | )(a) | | | (0.03 | ) | | | (0.04 | ) | | | (0.06 | ) |
Net realized and unrealized gains/(losses) on investments | | | (1.43 | ) | | | 1.86 | | | | 2.93 | | | | (0.52 | ) | | | 0.67 | |
| | | | | | | | | | | | | | | | | | | | |
Total income/(loss) from investment operations | | | (1.45 | ) | | | 1.84 | | | | 2.90 | | | | (0.56 | ) | | | 0.61 | |
| | | | | | | | | | | | | | | | | | | | |
|
Less distributions from: | |
Net investment income | | | — | | | | — | | | | — | | | | — | | | | — | |
Net realized gains | | | 2.04 | | | | 1.51 | | | | 0.70 | | | | 1.63 | | | | 2.48 | |
| | | | | | | | | | | | | | | | | | | | |
Total distributions | | | 2.04 | | | | 1.51 | | | | 0.70 | | | | 1.63 | | | | 2.48 | |
| | | | | | | | | | | | | | | | | | | | |
Net asset value, end of period | | $ | 11.24 | | | $ | 14.73 | | | $ | 14.40 | | | $ | 12.20 | | | $ | 14.39 | |
| | | | | | | �� | | | | | | | | | | | | | |
Total Return(b) | | | (9.70 | )% | | | 12.71 | % | | | 23.77 | % | | | (4.12 | )% | | | 3.77 | % |
|
Ratios/Supplemental Data: | |
Net assets, end of period (in thousands) | | $ | 30,781 | | | $ | 40,711 | | | $ | 42,320 | | | $ | 38,359 | | | $ | 43,460 | |
|
Ratios to average net assets: | |
Net expenses | | | 1.20 | % | | | 1.25 | % | | | 1.40 | % | | | 1.36 | % | | | 1.33 | %(c) |
Gross expenses | | | 1.20 | % | | | 1.25 | % | | | 1.40 | % | | | 1.36 | % | | | 1.33 | % |
Net investment loss | | | (0.13 | )% | | | (0.13 | )% | | | (0.22 | )% | | | (0.30 | )% | | | (0.35 | )% |
Portfolio turnover rate | | | 33 | % | | | 32 | % | | | 36 | % | | | 42 | % | | | 37 | % |
Notes to Financial Highlights
| (a) | | Per share values have been calculated using the average shares method. |
| (b) | | Total returns are historical and assume changes in share price, reinvestment of dividends and capital gains distributions and do not include the effect of insurance contract charges. Past performance does not guarantee future results. |
| (c) | | Includes contractual management fee waiver related to the Fund’s investments in the GE Institutional Money Market Fund (the “Money Market Fund”). The fee waiver agreement was terminated effective June 30, 2014 with the closure of the Money Market Fund. |
| * | | Beginning with the year ended December 31, 2016, the Fund was audited by Ernst & Young LLP. The previous years were audited by another independent registered public accounting firm. |
The accompanying Notes are an integral part of these financial statements.
State Street Small-Cap Equity V.I.S. Fund
Statement of Assets and Liabilities — December 31, 2018
| | | | |
| | | | |
Assets | | | | |
Investments in securities, at fair value (cost $26,774,201) | | $ | 29,559,009 | |
Short-term affiliated investments, at fair value | | | 1,256,107 | |
Cash collateral on deposit with broker for future contracts | | | 72,025 | |
Receivable for investments sold | | | 51,497 | |
Income receivables | | | 28,408 | |
Receivable for fund shares sold | | | 554 | |
Income receivable from affiliated investments | | | 2,925 | |
| | | | |
| |
Total assets | | | 30,970,525 | |
| | | | |
| |
Liabilities | | | | |
Payable for investments purchased | | | 66,553 | |
Payable for fund shares redeemed | | | 31,310 | |
Payable for accumulated variation margin on futures contracts | | | 18,165 | |
Payable to the Adviser | | | 25,634 | |
Payable for custody, fund accounting andsub-administration fees | | | 2,409 | |
Accrued other expenses | | | 45,045 | |
| | | | |
| |
Total liabilities | | | 189,116 | |
| | | | |
| | | | |
| |
Net Assets | | $ | 30,781,409 | |
| | | | |
| |
Net Assets Consist of: | | | | |
Capital paid in | | $ | 28,261,672 | |
Total distributable earnings (loss) | | | 2,519,737 | |
| | | | |
| |
Net Assets | | $ | 30,781,409 | |
| | | | |
Shares outstanding ($0.01 par value; unlimited shares authorized) | | | 2,739,490 | |
Net asset value per share | | $ | 11.24 | |
The accompanying Notes are an integral part of these financial statements.
| | | | |
| Statement of Assets and Liabilities | | | 15 | |
State Street Small-Cap Equity V.I.S. Fund
Statement of Operations — For the year ended December 31, 2018
| | | | |
| | | | |
Investment Income | | | | |
Income | | | | |
Dividend | | $ | 384,285 | |
Income from affiliated investments | | | 36,501 | |
Less: Foreign taxes withheld | | | (1,399 | ) |
| | | | |
Total income | | | 419,387 | |
| | | | |
| |
Expenses | | | | |
Advisory and administration fees | | | 369,578 | |
Directors’ fees | | | 3,294 | |
Custody, fund accounting andsub-administration fees | | | 26,991 | |
Professional fees | | | 42,210 | |
Other expenses | | | 23,323 | |
| | | | |
Total Expenses | | | 465,396 | |
| | | | |
Net investment loss | | $ | (46,009 | ) |
| | | | |
| |
Net Realized and Unrealized Gain (Loss) on Investments | | | | |
Realized gain (loss) on: | | | | |
Unaffiliated investments | | $ | 4,486,906 | |
Futures | | | (46,013 | ) |
Increase (decrease) in unrealized appreciation/depreciation on: | | | | |
Unaffiliated investments | | | (7,484,256 | ) |
Futures | | | (23,882 | ) |
| | | | |
| |
Net realized and unrealized gain (loss) on investments | | | (3,067,245 | ) |
| | | | |
| |
Net Decrease in Net Assets Resulting from Operations | | $ | (3,113,254 | ) |
| | | | |
The accompanying Notes are an integral part of these financial statements.
| | |
| 16 | | Statement of Operations |
State Street Small-Cap Equity V.I.S. Fund
Statements of Changes in Net Assets
| | | | | | | | |
| | | Year Ended December 31,
2018 | | | Year Ended December 31,
2017 | |
| | | | | | | | |
Increase (Decrease) in Net Assets | | | | | | | | |
| | |
Operations: | | | | | | | | |
Net investment loss | | $ | (46,009 | ) | | $ | (52,152 | ) |
Net realized gain (loss) on investments and futures | | | 4,440,893 | | | | 3,516,588 | |
Net increase (decrease) in unrealized appreciation/depreciation on investments and futures | | | (7,508,138 | ) | | | 1,434,489 | |
| | | | | | | | |
Net increase (decrease) from operations | | | (3,113,254 | ) | | | 4,898,925 | |
| | | | | | | | |
|
Distributions to shareholders: | |
Total distributions | | | (4,717,857 | ) | | | (3,784,875 | ) |
| | | | | | | | |
Increase (decrease) in assets from operations and distributions | | | (7,831,111 | ) | | | 1,114,050 | |
| | | | | | | | |
| | |
Share transactions: | | | | | | | | |
Proceeds from sale of shares | | | 513,653 | | | | 1,538,799 | |
Value of distributions reinvested | | | 4,717,857 | | | | 3,784,875 | |
Cost of shares redeemed | | | (7,330,360 | ) | | | (8,046,695 | ) |
| | | | | | | | |
Net increase (decrease) from share transactions | | | (2,098,850 | ) | | | (2,723,021 | ) |
| | | | | | | | |
| | |
Total increase (decrease) in net assets | | | (9,929,961 | ) | | | (1,608,971 | ) |
| | |
Net Assets | | | | | | | | |
Beginning of year | | | 40,711,370 | | | | 42,320,341 | |
| | | | | | | | |
| | |
End of year | | $ | 30,781,409 | | | $ | 40,711,370 | |
| | | | | | | | |
| | |
Changes in Fund Shares | | | | | | | | |
Shares sold | | | 34,303 | | | | 103,389 | |
Issued for distributions reinvested | | | 425,032 | | | | 255,908 | |
Shares redeemed | | | (482,858 | ) | | | (535,089 | ) |
| | | | | | | | |
Net decrease in fund shares | | | (23,523 | ) | | | (175,792 | ) |
| | | | | | | | |
For the year ended December 31, 2017, the source of distributions paid to shareholders was (See Note 11 in the Notes to Financial Statements):
| | | | |
| | | | |
Net realized gains | | $ | (3,784,875 | ) |
| | | | |
Undistributed net investment income as of December 31, 2017: | | $ | — | |
The accompanying Notes are an integral part of these financial statements.
| | | | |
| Statements of Changes in Net Assets | | | 17 | |
State Street Small-Cap Equity V.I.S. Fund
Notes to Financial Statements — December 31, 2018
| 1. | | Organization of the Company |
State Street Variable Insurance Series Funds, Inc. (the “Company”) was incorporated under the laws of the Commonwealth of Virginia on May 14, 1984 and is registered under the Investment Company Act of 1940, as amended (the “1940 Act”), as anopen-end management investment company. The Company is currently composed of the following seven investment portfolios (collectively, the “Funds”): State Street U.S. Equity V.I.S. Fund, State Street S&P 500 Index V.I.S. Fund, State Street Premier Growth Equity V.I.S. Fund, State StreetSmall-Cap Equity V.I.S. Fund (the “Fund”), State Street Total Return V.I.S. Fund, State Street Income V.I.S. Fund and State Street Real Estate Securities V.I.S. Fund. Each Fund is a diversified investment company within the meaning of the 1940 Act.
Shares of the Funds of the Company are offered only to insurance company separate accounts that fund certain variable life insurance contracts and variable annuity contracts.
The Company currently offers one share class (Class 1) of the Fund as an investment option for variable life insurance and variable annuity contracts.
Under the Company’s organizational documents, its officers and directors are indemnified against certain liabilities arising out of the performance of their duties to the Company. Additionally, in the normal course of business, the Company enters into contracts with service providers that contain general indemnification clauses. The Company’s maximum exposure under these arrangements is unknown as this would involve future claims that may be made against the Company that have not yet occurred.
| 2. | | Summary of Significant Accounting Policies |
The following is a summary of significant accounting policies followed by the Company in the preparation of its financial statements:
The preparation of financial statements in accordance with U.S. generally accepted accounting principles (“U.S. GAAP”) requires management to make estimates and assumptions that affect the reported amounts and disclosures in the financial statements. Actual results could differ from those estimates. The Fund is an investment company under U.S. GAAP and follows the accounting and reporting guidance applicable to investment companies.
Security Valuation The Fund’s investments are valued at fair value each day that the New York Stock Exchange (“NYSE”) is open and, for financial reporting purposes, as of the report date should the reporting period end on a day that the NYSE is not open. Fair value is generally defined as the price a fund would receive to sell an asset or pay to transfer a liability in an orderly transaction between market participants at the measurement date. By its nature, a fair value price is a good faith estimate of the valuation in a current sale and may not reflect an actual market price. The investments of the Fund are valued pursuant to the policy and procedures developed by the Oversight Committee (the “Committee”) and approved by the Company’s Board of Directors (the “Board”). The Committee provides oversight of the valuation of investments for the Fund. The Board has responsibility for overseeing the determination the fair value of investments.
Valuation techniques used to value the Fund’s investments by major category are as follows:
| | • | | Equity investments traded on a recognized securities exchange for which market quotations are readily available are valued at the last sale price or official closing price, as applicable, on the primary market or exchange on which they trade. Equity investments traded on a recognized exchange for which there were no sales on that day are valued at the last published sale price or at fair value. |
| | • | | Investments in registered investment companies (including money market funds) or other unitized pooled investment vehicles that are not traded on an exchange are valued at that day’s published net asset value (“NAV”) per share or unit. |
| | • | | Exchange-traded futures contracts are valued at the closing settlement price on the primary market on which they are traded most extensively. Exchange-traded futures contracts traded on a recognized exchange for which there were no sales on that day are valued at the last reported sale price obtained from independent pricing services or brokers or at fair value. |
In the event prices or quotations are not readily available or that the application of these valuation methods results in a price for an investment that is deemed to be not representative of the fair value of such investment, fair value will be determined in good faith by the Committee, in accordance with the valuation policy and procedures approved by the Board.
| | |
| 18 | | Notes to Financial Statements |
State Street Small-Cap Equity V.I.S. Fund
Notes to Financial Statements, continued — December 31, 2018
The Fund values its assets and liabilities at fair value using a fair value hierarchy consisting of three broad levels that prioritize the inputs to valuation techniques giving the highest priority to readily available unadjusted quoted prices in active markets for identical assets or liabilities (Level 1 measurements) and the lowest priority to unobservable inputs (Level 3 measurements) when market prices are not readily available or reliable. The categorization of a value determined for an investment within the hierarchy is based upon the pricing transparency of the investment and is not necessarily an indication of the risk associated with investing in it.
The three levels of the fair value hierarchy are as follows:
| | • | | Level 1 — Unadjusted quoted prices in active markets for an identical asset or liability; |
| | • | | Level 2 — Inputs other than quoted prices included within Level 1 that are observable for the asset or liability either directly or indirectly, including quoted prices for similar assets or liabilities in active markets, quoted prices for identical or similar assets or liabilities in markets that are not considered to be active, inputs other than quoted prices that are observable for the asset or liability (such as exchange rates, financing terms, interest rates, yield curves, volatilities, prepayment speeds, loss severities, credit risks and default rates) or other market-corroborated inputs; and |
| | • | | Level 3 — Unobservable inputs for the asset or liability, including the Committee’s assumptions used in determining the fair value of investments. |
The value of the Fund’s investments according to the fair value hierarchy as of December 31, 2018 is disclosed in the Fund’s Schedule of Investments.
Investment Transactions and Income Recognition Investment transactions are accounted for on trade date for financial reporting purposes. Realized gains and losses from the sale or disposition of investments and foreign exchange transactions, if any, are determined using the identified cost method.
Dividend income and capital gain distributions, if any, are recognized on theex-dividend date, net of any foreign taxes withheld at source, if any.
Interest income is recorded daily on an accrual basis. All premiums and discounts are amortized/accreted for financial reporting purposes.
Non-cash dividends received in the form of stock are recorded as dividend income at fair value.
Expenses Certain expenses, which are directly identifiable to a specific Fund, are applied to the Fund within the Company. Other expenses which cannot be attributed to a specific Fund are allocated in such a manner as deemed equitable, taking into consideration the nature and type of expense and the relative net assets of the Fund within the Company.
Foreign Taxes The Fund may be subject to foreign taxes (a portion of which may be reclaimable) on income, stock dividends, realized and unrealized capital gains on investments or certain foreign currency transactions. Foreign taxes are recorded in accordance with SSGA Funds Management, Inc.’s (the “Adviser” or “SSGA FM”) understanding of the applicable foreign tax regulations and rates that exist in the foreign jurisdictions in which the Fund invests. These foreign taxes, if any, are paid by the Fund and are reflected in the Statement of Operations, if applicable. Foreign taxes payable or deferred as of December 31, 2018, if any, are disclosed in the Fund’s Statement of Assets and Liabilities.
Distributions The Fund declares and pays any dividends from net investment income annually.
Net realized capital gains, if any, are distributed annually, unless additional distributions are required for compliance with applicable tax regulations. The amount and character of income and capital gains to be distributed are determined in accordance with applicable tax regulations which may differ from net investment income and realized gains recognized for U.S. GAAP purposes.
| 3. | | Derivative Financial Instruments |
Futures Contracts The Fund may enter into futures contracts to meet the Fund’s objectives. A futures contract is a standardized, exchange-traded agreement to buy or sell a financial instrument at a set price on a future date. Upon entering into a futures contract, the Fund is required to deposit with the broker, cash or securities in an amount equal to the minimum
| | | | |
| Notes to Financial Statements | | | 19 | |
State Street Small-Cap Equity V.I.S. Fund
Notes to Financial Statements, continued — December 31, 2018
initial margin requirements of the clearing house. Subsequent payments are made or received by the Fund equal to the daily change in the contract value and are recorded as variation margin receivable or payable with a corresponding offset to unrealized gains or losses. The Fund recognizes a realized gain or loss when the contract is closed.
Losses may arise if the value of a futures contract decreases due to unfavorable changes in the market rates or values of the underlying instrument during the term of the contract or if the counterparty does not perform under the contract. The use of futures contracts also involves the risk that the movements in the price of the futures contracts do not correlate with the movement of the assets underlying such contracts.
For the fiscal year ended December 31, 2018, the Fund entered into futures contracts for cash equitization.
The following tables summarize the value of the Fund’s derivative instruments as of December 31, 2018 and the related location in the accompanying Statement of Assets and Liabilities and Statement of Operations, presented by primary underlying risk exposure:
Liability Derivatives
| | | | | | | | | | | | | | | | | | | | | | | | |
| | | Interest
Rate
Contracts
Risk | | | Foreign
Exchange
Contracts
Risk | | | Credit
Contracts
Risk | | | Equity
Contracts
Risk | | | Commodity
Contracts
Risk | | | Total | |
| | | | | | | | | | | | | | | | | | | | | | | | |
State StreetSmall-Cap Equity V.I.S. Fund | | | | | | | | | | | | | | | | | | | | | |
Futures Contracts | | $ | — | | | $ | — | | | $ | — | | | $ | (18,165 | ) | | $ | — | | | $ | (18,165 | ) |
Net Realized Gain (Loss)
| | | | | | | | | | | | | | | | | | | | | | | | |
| | | Interest
Rate
Contracts
Risk | | | Foreign
Exchange
Contracts
Risk | | | Credit
Contracts
Risk | | | Equity
Contracts
Risk | | | Commodity
Contracts
Risk | | | Total | |
| | | | | | | | | | | | | | | | | | | | | | | | |
State StreetSmall-Cap Equity V.I.S. Fund | | | | | | | | | | | | | | | | | | | | | |
Futures contracts | | $ | — | | | $ | — | | | $ | — | | | $ | (46,013 | ) | | $ | — | | | $ | (46,013 | ) |
Net Change in Unrealized Appreciation (Depreciation)
| | | | | | | | | | | | | | | | | | | | | | | | |
| | | Interest
Rate
Contracts
Risk | | | Foreign
Exchange
Contracts
Risk | | | Credit
Contracts
Risk | | | Equity
Contracts
Risk | | | Commodity
Contracts
Risk | | | Total | |
| | | | | | | | | | | | | | | | | | | | | | | | |
State StreetSmall-Cap Equity V.I.S. Fund | | | | | | | | | | | | | | | | | | | | | |
Futures contracts | | $ | — | | | $ | — | | | $ | — | | | $ | (23,882 | ) | | $ | — | | | $ | (23,882 | ) |
| 4. | | Fees and Transactions with Affiliates |
Advisory Fee SSGA FM, a registered investment adviser, was retained by the Board to act as investment adviser and administrator of the Fund. SSGA FM’s compensation for investment advisory and administrative services (“Management Fee”) is paid monthly based on the average daily net assets of the Fund at an annualized rate of 0.95 %.
Custody, Fund Accounting andSub-Administration Fees State Street Bank and Trust Company (“State Street”) serves as the custodian, fund accountant andsub-administrator to the Fund. Amounts paid by the Fund to State Street for performing such services are included custody, fund accounting andsub-administration fees on the Statement of Operations.
Other Transactions with Affiliates The Fund may invest in affiliated entities, including securities issued by State Street, affiliated funds, or entities deemed to be affiliates as a result of the Fund owning more than five percent of the entity’s voting securities or outstanding shares. Amounts relating to these transactions during the fiscal year ended December 31, 2018 are disclosed in the Schedule of Investments.
| | |
| 20 | | Notes to Financial Statements |
State Street Small-Cap Equity V.I.S. Fund
Notes to Financial Statements, continued — December 31, 2018
Pursuant to investmentsub-advisory agreements with SSGA FM, the assets of the Fund are allocated to and managed by each of the followingsub-advisers: (i) Palisade Capital Management, L.L.C.; (ii) Champlain Investment Partners, LLC; (iii) GlobeFlex Capital, L.P.; (iv) Kennedy Capital Management, Inc.; and (v) SouthernSun Asset Management, LLC. SSGA FM is responsible for allocating the Fund’s assets among thesub-advisers in its discretion (“Allocated Assets”), and for managing the Fund’s cash position, while eachsub-adviser is responsible for theday-to-day management of their portion of the Allocated Assets, under the general supervision and oversight of SSGA FM and the Board. For their services, SSGA FM pays eachsub-adviser an investmentsub-advisory fee, which is calculated as a percentage of the average daily net assets of the respective Allocated Assets that it manages.
The fees and expenses of the Company’s directors who are not “interested persons” of the Company, as defined in the 1940 Act (“Independent Directors”) are paid directly by the Fund. The Independent Directors are reimbursed for travel and otherout-of-pocket expenses in connection with meeting attendance and industry seminars.
| 7. | | Investment Transactions |
Purchases and sales of investments (excludingin-kind transactions, short term investments and derivative contracts) for the fiscal year ended December 31, 2018 were as follows:
| | | | | | | | |
| Non-U.S. Government Securities |
| Purchases | | Sales |
| | | | | | | | | |
| | $ | 12,193,458 | | | | $ | 17,854,986 | |
The Fund has qualified and intends to continue to qualify as a regulated investment company under Subchapter M of the Internal Revenue Code of 1986, as amended. The Fund will not be subject to federal income taxes to the extent it distributes its taxable income, including any net realized capital gains, for each fiscal year. Therefore, no provision for federal income tax is required.
The Fund files federal and various state and local tax returns as required. No income tax returns are currently under examination. Generally, the federal returns are subject to examination by the Internal Revenue Service for a period of three years from date of filing, while the state returns may remain open for an additional year depending upon jurisdiction. SSGA FM has analyzed the Fund’s tax positions taken on tax returns for all open years and does not believe there are any uncertain tax positions that would require recognition of a tax liability.
Distributions to shareholders are recorded onex-dividend date. Income dividends and gain distributions are determined in accordance with income tax rules and regulations, which may differ from generally accepted accounting principles. Certain capital accounts in the financial statements have been adjusted for permanentbook-tax differences. These adjustments have no impact on net asset values or results of operations. Temporarybook-tax differences will reverse in the future. These book tax differences are primarily due to differing treatments for futures contracts, return of capital distributions received, and wash sale loss deferrals.
The tax character of distributions paid during the year ended December 31, 2018 was as follows:
| | | | | | | | | | | | | |
Ordinary
Income | | Long-Term
Capital Gains | | Total |
| | | | | | | | | | | | | | |
| | $ | 102,739 | | | | $ | 4,615,118 | | | | $ | 4,717,857 | |
The tax character of distributions paid during the year ended December 31, 2017 was as follows:
| | | | | | | | | | | | | |
Ordinary
Income | | Long-Term
Capital Gains | | Total |
| | | | | | | | | | | | | | |
| | $ | 378,098 | | | | $ | 3,406,777 | | | | $ | 3,784,875 | |
| | | | |
| Notes to Financial Statements | | | 21 | |
State Street Small-Cap Equity V.I.S. Fund
Notes to Financial Statements, continued — December 31, 2018
At December 31, 2018 the components of distributable earnings on a tax basis were as follows:
| | | | | | | | | | | | | | | | | | | | | | | | | | | | |
Undistributed
Ordinary
Income | | Capital Loss
Carryforwards | | Undistributed
long term
gain | | Net
Unrealized
Gains (Losses) | | Qualified
Late-Year
Losses | | Total |
| | | | | | | | | | | | | | | | | | | | | | | | | | | | | |
| | $ | 3,414 | | | | $ | — | | | | $ | 218,461 | | | | $ | 2,297,862 | | | | $ | — | | | | $ | 2,519,737 | |
As of December 31, 2018, gross unrealized appreciation and gross unrealized depreciation of investments and other financial instruments based on cost for federal income tax purposes were as follows:
| | | | | | | | | | | | | | | | | | |
Tax
Cost | | Gross
Unrealized
Appreciation | | Gross
Unrealized
Depreciation | | Net
Unrealized
Appreciation
(Depreciation) |
| | | | | | | | | | | | | | | | | | | |
| | $ | 28,499,072 | | | | $ | 5,648,140 | | | | $ | 3,350,278 | | | | $ | 2,297,862 | |
The Fund and other affiliated funds (each, a “Participant” and collectively, the “Participants”) participate in a $500 million revolving credit facility provided by a syndication of banks under which the Participants may borrow to fund shareholder redemptions. This agreement expires in October 2019 unless otherwise extended or renewed.
The Participants are charged an annual commitment fee which is calculated based on the unused portion of the shared credit line. Commitment fees are allocated among each of the Participants based on relative net assets. Commitment fees are ordinary fund operating expenses paid by the Adviser. A Participant incurs and pays the interest expense related to its borrowing. Interest is calculated at a rate per annum equal to the sum of 1% plus the greater of the New York Fed Bank Rate and1-month LIBOR rate.
The Fund had no outstanding loans as of December 31, 2018.
Concentration Risk As a result of the Fund’s ability to invest a large percentage of its assets in obligations of issuers within the same country, state, region, currency or economic sector, an adverse economic, business or political development may affect the value of the Fund’s investments more than if the Fund were more broadly diversified.
Market and Credit Risk In the normal course of business, the Fund trades financial instruments and enters into financial transactions where risk of potential loss exists due to changes in the general economic conditions and fluctuations of the market (market risk). Additionally, the Fund may also be exposed to credit risk in the event that an issuer or guarantor fails to perform or that an institution or entity with which the Fund has unsettled or open transactions defaults.
| 11. | | New and Recent Accounting Pronouncements |
In August 2018, the Securities and Exchange Commission released its Final Rule on Disclosure Update and Simplification (the “Final Rule”) which is intended to simplify an issuer’s disclosure compliance efforts by removing redundant or outdated disclosure requirements without significantly altering the mix of information provided to investors. The Fund has adopted the Final Rule for the current period with the most notable impacts being that the Fund is no longer required to present components of distributable earnings on the Statement of Assets and Liabilities or the sources of distributions to shareholders and the amount of undistributed net investment income on the Statement of Changes in Net Assets.
Management has evaluated the impact of all subsequent events on the Fund through the date on which the financial statements were available to be issued and has determined that there were no subsequent events requiring adjustment or disclosure in the financial statements.
| | |
| 22 | | Notes to Financial Statements |
State Street Small-Cap Equity V.I.S. Fund
Report of Independent Registered Public Accounting Firm
To the Shareholders and the Board of Directors of State Street Small-Cap Equity V.I.S. Fund
Opinion on the Financial Statements
We have audited the accompanying statement of assets and liabilities of State Street Small-Cap Equity V.I.S. Fund (the “Fund”) (one of the funds constituting State Street Variable Insurance Series Funds, Inc. (the “Company”)), including the schedule of investments, as of December 31, 2018, and the related statement of operations for the year then ended, the statement of changes in net assets for each of the two years in the period then ended, the financial highlights for each of the three years in the period then ended and the related notes (collectively referred to as the “financial statements”). In our opinion, the financial statements present fairly, in all material respects, the financial position of the Fund (one of the funds constituting State Street Variable Insurance Series Funds, Inc.) at December 31, 2018, the results of its operations for the year then ended, the changes in its net assets for each of the two years in the period then ended and its financial highlights for each of the three years in the period then ended, in conformity with U.S. generally accepted accounting principles. The financial highlights for periods ended prior to January 1, 2016 were audited by another independent registered public accounting firm whose report, dated February 19, 2016, expressed an unqualified opinion on those financial highlights.
Basis for Opinion
These financial statements are the responsibility of the Company’s management. Our responsibility is to express an opinion on the Fund’s financial statements based on our audits. We are a public accounting firm registered with the Public Company Accounting Oversight Board (United States) (“PCAOB”) and are required to be independent with respect to the Company in accordance with the U.S. federal securities laws and the applicable rules and regulations of the Securities and Exchange Commission and the PCAOB.
We conducted our audits in accordance with the standards of the PCAOB. Those standards require that we plan and perform the audit to obtain reasonable assurance about whether the financial statements are free of material misstatement, whether due to error or fraud. The Company is not required to have, nor were we engaged to perform, an audit of the Company’s internal control over financial reporting. As part of our audits we are required to obtain an understanding of internal control over financial reporting, but not for the purpose of expressing an opinion on the effectiveness of the Company’s internal control over financials reporting. Accordingly, we express no such opinion.
Our audits included performing procedures to assess the risks of material misstatement of the financial statements, whether due to error or fraud, and performing procedures that respond to those risks. Such procedures included examining, on a test basis, evidence regarding the amounts and disclosures in the financial statements. Our procedures included confirmation of securities owned as of December 31, 2018, by correspondence with the custodian, brokers and others or by other appropriate auditing procedures where replies from brokers and others were not received. Our audits also included evaluating the accounting principles used and significant estimates made by management, as well as evaluating the overall presentation of the financial statements. We believe that our audits provide a reasonable basis for our opinion.

We have served as the auditor of one or more State Street Global Advisors investment companies since 2000.
Boston, Massachusetts
February 19, 2019
| | | | |
| Report of Independent Registered Public Accounting Firm | | | 23 | |
State Street Small-Cap Equity V.I.S. Fund
Tax Information — December 31, 2018 (Unaudited)
For federal income tax purposes, the following information is furnished with respect to the distributions of the Fund for its fiscal year ended December 31, 2018.
Dividends Received Deduction
The Fund reports the maximum amount allowable of its net taxable income as eligible for the corporate dividends received deduction.
Long Term Capital Gain Distributions
Long term capital gains dividends were paid from the Fund during the year ended December 31, 2018 in the amount of $4,615,118.
State Street Small-Cap Equity V.I.S. Fund
Special Meeting of Shareholders — Voting Results
A special meeting of shareholders of State Street Variable Insurance Series Funds, Inc. (the “Company”) was held on January 10, 2019 to elect the following six nominees as Directors of the Company: Michael F. Holland, Michael A. Jessee, Ellen M. Needham, Patrick J. Riley, Richard D. Shirk and Rina K. Spence. At the meeting the following votes were recorded:
| | | | | | | | |
| Nominee | | Shares For | | | Shares Withheld | |
Michael F. Holland | | | 91,260,156.834 | | | | 2,655,810.669 | |
Michael A. Jessee | | | 91,345,936.433 | | | | 2,570,031.070 | |
Ellen M. Needham | | | 91,642,423.619 | | | | 2,273,543.884 | |
Patrick J. Riley | | | 91,136,965.946 | | | | 2,779,001.557 | |
Richard D. Shirk | | | 91,293,712.247 | | | | 2,622,255.256 | |
Rina K. Spence | | | 90,957,562.624 | | | | 2,958,404.879 | |
The other Directors whose term of office continued after the meeting are as follows: Jeanne M. La Porta, John R. Costantino and Donna M. Rapaccioli.
| | | | |
| Special Meeting of Shareholders — Voting Results | | | 25 | |
State Street Small-Cap Equity V.I.S. Fund
Other Information — December 31, 2018 (Unaudited)
| | | | | | | | | | | | |
| | | | | | |
Name, Address, and Year of Birth | | Position(s) Held with Fund | | Term of
Office and
Length of Time Served | | Principal Occupation
During Past Five Years
and Relevant Experience | | Number of
Funds in
Fund
Complex
Overseen
by Director† | | | Other Directorships
Held by Director During Past Five Years |
INDEPENDENT DIRECTORS | | | | | | |
Michael F. Holland c/o SSGA Funds Management, Inc. One Iron Street Boston, MA 02210 YOB: 1944 | | Director and Co-Chairperson of the Board | | Term: Indefinite Elected: 1/19 | | Chairman, Holland & Company L.L.C. (investment adviser) (1995 – present). | | | 67 | | | Director, the Holland Series Fund, Inc.; Director, The China Fund, Inc.; Director, The Taiwan Fund, Inc. (2007-2017); Director, Reaves Utility Income Fund, Inc.; and Director, Blackstone/GSO Loans (and Real Estate) Funds. |
| | | | | | | | | | | | | |
Patrick J. Riley c/o SSGA Funds Management, Inc. One Iron Street Boston, MA 02210 YOB: 1948 | | Director and Co-Chairperson of the Board | | Term: Indefinite Elected: 1/19 | | 2002 to May 2010, Associate Justice of the Superior Court, Commonwealth of Massachusetts; 1985 to 2002, Partner, Riley, Burke & Donahue, L.L.P. (law firm); 1998 to Present, Independent Director, State Street Global Advisers Ireland, Ltd. (investment company); 1998 to Present, Independent Director, SSGA Liquidity plc (formerly, SSGA Cash Management Fund plc); January 2009 to Present, Independent Director, SSGA Fixed Income plc; and January 2009 to Present, Independent Director, SSGA Qualified Funds PLC. | | | 67 | | | Board Director and Chairman, SPDR Europe 1PLC Board (2011 – Present); Board Director and Chairman, SPDR Europe II, PLC (2013 – Present). |
| | | | | | | | | | | | | |
John R. Costantino c/o SSGA Funds Management, Inc. One Iron Street Boston, MA 02210 YOB: 1946 | | Director and Co-Chairperson of the Qualified Legal and Compliance Committee | | Term: Indefinite Elected: 1997 | | Managing General Partner, NGN Capital LLC (2006 – present); and Managing Director, Vice President of Walden Capital Management (1996 – present). | | | 67 | | | Director of Kleinfeld Bridal Corp. (March 2016 – present);Trustee of Neuroscience Research Institute (1986 – present); Trustee of Fordham University (1989 – 1995 and 2001 – 2007) and Trustee Emeritus (2007 – present); Trustee of GE Funds (1993 – February 2011); Director of Artes Medical (2006 – 2008); and Trustee of Gregorian University Foundation (1992 – 2007). |
| | | | | | | | | | | | | |
Donna M. Rapaccioli c/o SSGA Funds Management, Inc. One Iron Street Boston, MA 02210 YOB: 1962 | | Director and Co-Chairperson of the Audit Committee | | Term: Indefinite Elected: 1/12 | | Dean of the Gabelli School of Business (2007 – present) and Accounting Professor (1987 – present) at Fordham University. | | | 67 | | | Director- Graduate Management Admissions Council (2015 – present); Trustee of Emmanuel College (2010 – present). |
State Street Small-Cap Equity V.I.S. Fund
Other Information, continued — December 31, 2018 (Unaudited)
| | | | | | | | | | | | |
| | | | | | |
Name, Address, and Year of Birth | | Position(s) Held with Fund | | Term of
Office and
Length of Time Served | | Principal Occupation
During Past Five Years
and Relevant Experience | | Number of
Funds in
Fund
Complex
Overseen
by Director† | | | Other Directorships
Held by Director During Past Five Years |
INDEPENDENT DIRECTORS (continued) |
Richard D. Shirk c/o SSGA Funds Management, Inc. One Iron Street Boston, MA 02210 YOB: 1945 | | Director andCo-Chairperson of the Qualified Legal and Compliance Committee | | Term: Indefinite Elected: 1/19 | | March 2001 to April 2002, Chairman (1996 to March 2001, President and Chief Executive Officer), Cerulean Companies, Inc. (holding company) (Retired); 1992 to March 2001, President and Chief Executive Officer, Blue Cross Blue Shield of Georgia (health insurer, managed healthcare). | | | 67 | | | 1998 to December 2008, Chairman, Board Member and December 2008 to Present, Investment Committee Member, Healthcare Georgia Foundation (private foundation); September 2002 to 2012, Lead Director and Board Member, Amerigroup Corp. (managed health care); 1999 to 2013, Board Member and (since 2001) Investment Committee Member, Woodruff Arts Center; and 2003 to 2009, Trustee, Gettysburg College; Board member, Aerocare Holdings, Regenesis Biomedical Inc. |
| | | | | | | | | | | | | |
Rina K. Spence c/o SSGA Funds Management, Inc. One Iron Street Boston, MA 02210 YOB: 1948 | | Director andCo-Chairperson of the Audit Committee, Chairperson of the Nominating Committee and Chairperson of the Governance Committee | | Term: Indefinite Elected: 1/19 | | President of SpenceCare International LLC (international healthcare consulting) (1999 – present); Chief Executive Officer, IEmily.com (health internet company) (2000 – 2001); Chief Executive Officer of Consensus Pharmaceutical, Inc. (1998 – 1999); Founder, President and Chief Executive Officer of Spence Center for Women’s Health (1994 – 1998); President and CEO, Emerson Hospital (1984 – 1994); Honorary Consul for Monaco in Boston (2015 – present). | | | 67 | | | None |
| | | | | | | | | | | | | |
Michael A. Jessee c/o SSGA Funds Management, Inc. One Iron Street Boston, MA 02210 YOB: 1946 | | Director andCo-Chairperson of the Valuation Committee | | Term: Indefinite Elected: 1/19 | | Retired; formerly, President and Chief Executive Officer of the Federal Home Loan Bank of Boston (1989 – 2009); Trustee, Randolph-Macon College (2004 – 2016). | | | 67 | | | None |
State Street Small-Cap Equity V.I.S. Fund
Other Information, continued — December 31, 2018 (Unaudited)
| | | | | | | | | | | | |
| | | | | | |
Name, Address, and Year of Birth | | Position(s) Held with Fund | | Term of
Office and
Length of Time Served | | Principal Occupation
During Past Five Years
and Relevant Experience | | Number of
Funds in
Fund
Complex
Overseen
by Director† | | | Other Directorships
Held by Director During Past Five Years |
| |
INTERESTED DIRECTORS(1) |
Jeanne M. La Porta(2) SSGA Funds Management, Inc. 1600 Summer St. Stamford, CT 06905 YOB: 1965 | | Director and President | | Time Indefinite Elected: 3/14 | | Senior Managing Director at State Street Global Advisors (July 2016 – present); Director of State Street Global Advisors Funds Distributors, LLC (May 2017 – present); President of GE Retirement Savings Plan Funds (July 2016 – present); Senior Vice President and Commercial Operations Leader at GE Asset Management Incorporated (“GEAM”) (March 2014 – July 2016); President of State Street Institutional Funds and State Street Variable Insurance Series Funds, Inc. (April 2014 – present); President and Trustee. | | | 18 | | | None |
| | | | | | | | | | | | | |
Ellen M. Needham(3) SSGA Funds Management, Inc. One Iron Street Boston, MA 02210 YOB: 1967 | | Director | | Time Indefinite Elected: 1/19 | | President and Director, SSGA FM (2001 – present)*; Senior Managing Director, State Street Global Advisors (1992 – present)*; Director, State Street Global Advisors Funds Distributors, LLC (May 2017 – present).* | | | 67 | | | None |
| (1) | | The individuals listed below are Directors who are “interested persons,” as defined in the 1940 Act, of the Company (“Interested Directors”). |
| (2) | | Ms. La Porta is an Interested Director because of her employment by SSGA Funds Management, Inc., an affiliate of the Company. |
| (3) | | Ms. Needham is an Interested Director because of her employment by SSGA Funds Management, Inc., an affiliate of the Company. |
| * | | Served in various capacities and/or with various affiliated entities during noted time period |
| † | | For the purpose of determining the number of portfolios overseen by the Directors, “Fund Complex” comprises registered investment companies for which SSGA FM serves as investment adviser. |
State Street Small-Cap Equity V.I.S. Fund
Other Information, continued — December 31, 2018 (Unaudited)
The following lists the principal officers for the Company, as well as their mailing addresses and ages, positions with the Company and length of time served, and present and principal occupations:
| | | | | | |
| | | | |
Name, Address,
and Year of Birth | | Position(s) Held
with Fund | | Term of
Office and
Length of
Time Served | | Principal Occupation During Past Five Years |
OFFICERS: | | | | | | |
Jeanne M. La Porta SSGA Funds Management, Inc. 1600 Summer St. Stamford, CT 06905 YOB: 1965 | | President and Director | | Term: Indefinite Elected: 3/14 | | Senior Managing Director at State Street Global Advisors (July 2016 – present); Director of State Street Global Advisors Funds Distributors, LLC (May 2017 – present); President of GE Retirement Savings Plan Funds (July 2016 – present); Senior Vice President and Commercial Operations Leader at GE Asset Management Incorporated (“GEAM”) (March 2014 – July 2016); President of State Street Institutional Funds and State Street Variable Insurance Series Funds, Inc. (April 2014 – present); President and Trustee. |
| | | | | | | |
Arthur A. Jensen SSGA Funds Management, Inc. 1600 Summer Street Stamford, CT 06905 YOB: 1966 | | Treasurer | | Term: Indefinite Elected: 6/11 | | Vice President, State Street Global Advisors and SSGA Funds Management, Inc. (July 2016 – present); Deputy Treasurer of Elfun Funds (July 2016 – present); Treasurer of State Street Institutional Funds, State Street Variable Insurance Series Funds, Inc. and GE Retirement Savings Plan Funds (June 2011 – present); Treasurer of Elfun Funds (June 2011– July 2016); Mutual Funds Controller of GE Asset Management Incorporated (April 2011 – July 2016). |
| | | | | | | |
Brian Harris SSGA Funds Management, Inc. One Iron Street Boston, MA 02210 YOB: 1973 | | Chief Compliance Officer and Anti-Money Laundering Officer | | Term: Indefinite Elected: 6/16 | | Managing Director, State Street Global Advisors and SSGA Funds Management, Inc. (2013 – Present); Senior Vice President and Global Head of Investment Compliance, BofA Global Capital Management (September 2010 – May 2013). |
State Street Small-Cap Equity V.I.S. Fund
Other Information, continued — December 31, 2018 (Unaudited)
| | | | | | |
| | | | |
Name, Address,
and Year of Birth | | Position(s) Held
with Fund | | Term of
Office and
Length of
Time Served | | Principal Occupation During Past Five Years |
OFFICERS: (continued) | | | | | | |
Bruce S. Rosenberg SSGA Funds Management, Inc. One Iron Street Boston, MA 02210 YOB: 1961 | | Assistant Treasurer | | Term: Indefinite Elected: 6/16 | | Managing Director, State Street Global Advisors and SSGA Funds Management, Inc. (July 2015 – present); Director, Credit Suisse (April 2008 – July 2015). |
| | | | | | | |
Ann M. Carpenter SSGA Funds Management, Inc. One Iron Street Boston, MA 02210 YOB: 1966 | | Assistant Treasurer | | Term: Indefinite Elected: 6/16 | | Chief Operating Officer, SSGA Funds Management, Inc. (April 2005 – present) *; Managing Director, State Street Global Advisors. (2005 – present).* |
| | | | | | | |
Chad C. Hallett SSGA Funds Management, Inc. One Iron Street Boston, MA 02210 YOB: 1969 | | Assistant Treasurer | | Term: Indefinite Elected: 6/16 | | Vice President, State Street Global Advisors and SSGA Funds Management, Inc. (November 2014 – present); Vice President, State Street Bank and Trust Company (2001 – November 2014).* |
| | | | | | | |
Darlene Anderson-Vasquez SSGA Funds Management, Inc. One Iron Street Boston, MA 02210 YOB: 1968 | | Assistant Treasurer | | Term: Indefinite Elected: 3/17 | | Managing Director, State Street Global Advisors and SSGA Funds Management, Inc. (May 2016 – present); Senior Vice President, John Hancock Investments (September 2007 – May 2016). |
| | | | | | | |
Daniel G. Plourde SSGA Funds Management, Inc. One Iron Street Boston, MA 02210 YOB: 1980 | | Assistant Treasurer | | Term: Indefinite Elected: 6/17 | | Vice President, State Street Global Advisors and SSGA Funds Management, Inc. (May 2015 – present); Officer, State Street Bank and Trust Company (March 2009 – May 2015). |
| | | | | | | |
Jesse D. Hallee State Street Bank and Trust Company 100 Summer Street, 7th Floor Boston, MA 02111-2900 YOB: 1976 | | Secretary | | Term: Indefinite Elected: 3/17 | | Vice President and Managing Counsel, State Street Bank and Trust Company (2013 – present); Vice President and Counsel, Brown Brothers Harriman & Co. (2007 – 2013). |
| * | Served in various capacities and/or with various affiliated entities during noted time period. |
State Street Small-Cap Equity V.I.S. Fund
Other Information, continued — December 31, 2018 (Unaudited)
Proxy Voting Policies and Procedures and Record
The Fund has adopted the proxy voting policies of SSGA FM. A description of the policies and procedures that the Fund has adopted to determine how to vote proxies relating to portfolio securities is available (i) without charge, upon request, by calling1-800-242-0134, (ii) on the Fund’s website at http://www.ssga.com/geam, or (iii) on the SEC’s website at www.sec.gov. Information regarding how the Fund voted proxies, if any, during the most recent 12-month period ended June 30 is available by August 31 of each year without charge (1) by calling 1-800-242-0134 (toll free), and (2) on the website of the SEC at www.sec.gov.
Quarterly Portfolio Schedule
The Fund files its complete schedule of investments with the SEC for the first and third quarters of each fiscal year on Form N-Q. The Fund’s Forms N-Q are available (i) without charge, upon request, by calling 1-800-242-013, (ii) on the Fund’s website at http://www.ssga.com/geam, or (iii) on the SEC’s website at www.sec.gov.
Directors
Michael F. Holland, Co-Chairperson
Patrick J. Riley, Co-Chairperson
John R. Costantino
Donna M. Rapaccioli
Michael A. Jessee
Richard D. Shirk
Rina K. Spence
Jeanne M. La Porta
Ellen M. Needham
Officers
Jeanne M. La Porta, President
Arthur Jensen, Treasurer
Brian Harris, Chief Compliance Officer and Anti-Money Laundering Officer
Bruce S. Rosenberg, Assistant Treasurer
Ann M. Carpenter, Assistant Treasurer
Chad C. Hallett, Assistant Treasurer
Darlene Anderson-Vasquez, Assistant Treasurer
Daniel G. Plourde, Assistant Treasurer
Jesse Hallee, Secretary
Investment Adviser and Administrator
SSGA Funds Management, Inc.
One Iron Street
Boston, MA 02210
Custodian and Sub-Administrator
State Street Bank and Trust Company
One Lincoln Street
Boston, Massachusetts 02111
Distributor
State Street Global Advisors Funds Distributors, LLC
One Iron Street
Boston, MA 02210
Independent Registered Public Accounting Firm
Ernst & Young LLP
200 Clarendon Street
Boston, Massachusetts 02116
Annual Report
December 31, 2018
State Street U.S. Equity V.I.S. Fund
Beginning on January 1, 2021, as permitted by regulations adopted by the Securities and Exchange Commission, paper copies of a Fund’s annual and semi-annual shareholder reports will no longer be sent by mail, unless you specifically request paper copies of the reports from the Fund (or from your financial intermediary, such as a broker-dealer or bank). Instead, the reports will be made available on a Fund’s website (www.ssga.com/geam), and you will be notified by mail each time a report is posted, and provided with a website link to access the report.
Beginning on January 1, 2019, you may elect to receive all future reports in paper free of charge. If you invest through a financial intermediary, you can contact your financial intermediary to request that you continue to receive paper copies of your shareholder reports. Your election to receive reports in paper will apply to all funds held in your account, if you invest through your financial intermediary or all funds held with the fund complex if you invest directly with a Fund.

State Street U.S. Equity V.I.S Fund
Annual Report
December 31, 2018
Table of Contents
This report is prepared for Policyholders of certain variable contracts and may be distributed to others only if preceded or accompanied by the variable contract’s current prospectus and the current summary prospectus of the Fund available for investments thereunder.
State Street U.S. Equity V.I.S. Fund
Notes to Performance — December 31, 2018 (Unaudited)
The information provided on the performance pages relates to the State Street U.S. Equity V.I.S. Fund (the “Fund”).
Total return performance shown in this report for the Fund takes into account changes in share price and assumes reinvestment of dividends and capital gains distributions, if any. Total returns shown are net of Fund fees and expenses but do not reflect fees and charges associated with the variable contracts such as administrative fees, account charges and surrender charges, which, if reflected, would reduce the Fund’s total returns for all periods shown.
The performance data quoted represents past performance; past performance does not guarantee future results. Investment return and principal value will fluctuate so your shares, when redeemed, may be worth more or less than their original cost. Current performance may be higher or lower than the performance data quoted. Periods less than one year are not annualized. Please call toll-free (800) 242-0134 or visit the Fund’s website at http://www.ssga.com/geam for the most recentmonth-end performance data.
An investment in the Fund is not a deposit of any bank and is not insured or guaranteed by the Federal Deposit Insurance Corporation (“FDIC”) or any other government agency. An investment in the Fund is subject to risk, including possible loss of principal invested.
The S&P 500® Index is an unmanaged, market capitalization-weighted index of stocks of 500 large U.S. companies, which is widely used as a measure of large-cap U.S. stock market performance. The results shown for the foregoing index assume the reinvestment of net dividends or interest and do not reflect fees, expenses, or taxes. As such, the index returns do not reflect the actual cost of investing in the instruments that comprise the index.
The views expressed in this document reflect our judgment as of the publication date and are subject to change at any time without notice.
State Street Global Advisors Funds Distributors, LLC, member of FINRA & SIPC is the principal underwriter and distributor of the State Street V.I.S. Funds and an indirect wholly-owned subsidiary of State Street Corporation. References to State Street may include State Street Corporation and its affiliates. The Funds pay State Street Bank and Trust Company for its services as custodian and Fund Accounting agent, and pay SSGA Funds Management, Inc. for investment advisory and administrative services.
State Street U.S. Equity V.I.S. Fund
Management Discussion of Fund Performance — December 31, 2018 (Unaudited)
The State Street U.S. Equity V.I.S. Fund (the “Fund”) seeks to provide long-term growth of capital. The Fund’s benchmark is the S&P 500 Index (the “Index”).
For the12-month period ended December 31, 2018 (the “Reporting Period”), the total return for the Fund was-3.40% and the Index was-4.38%. The Fund and Index returns reflect the reinvestment of dividends and other income. The Fund’s performance reflects the expenses of managing the Fund, including brokerage and advisory expenses. The Index is unmanaged and Index returns do not reflect fees and expenses of any kind, which would have a negative impact on returns.
The Fund’s preference for companies with sustainable earnings growth, positive sector allocation and positive stock selection were primary drivers of Fund performance during the Reporting Period relative to the Index. In a year where growth outperformed value, the Fund’s growth tilt contributed to outperformance against the Index. In terms of sector positioning, the Fund benefited both from overweighting the outperforming technology sector and underweighting the consumer staples and industrials sectors, which lagged. Positive stock selection was concentrated in the financials and information technology sectors, with a modest drag from energy-sector and health care holdings trimming outperformance. In late-year volatility, the Fund’s quality bias contributed to down market protection against a falling Index in the fourth quarter.
The Fund used equity futures in order to efficiently manage cash flows during the Reporting Period. The Fund’s use of futures had a negligible impact on Fund performance.
On an individual security level, the top positive contributors to the Fund’s performance on an absolute basis during the Reporting Period were Visa Inc., Boston Scientific Corp. and CME Group. The top negative contributors to the Fund’s performance on an absolute basis during the Reporting Period were Applied Materials Inc., United Rentals Inc., and Schlumberger Limited.
The views expressed above reflect those of the Fund’s portfolio manager only through the Reporting Period, and do not necessarily represent the views of the Adviser as a whole. Any such views are subject to change at any time based upon market or other conditions and the Adviser disclaims any responsibility to update such views. These views may not be relied on as investment advice and, because investment decisions for a fund are based on numerous factors, may not be relied on as an indication of trading intent on behalf of any fund.
| | |
| 2 | | State Street U.S. Equity V.I.S. Fund |
State Street U.S. Equity V.I.S. Fund
Understanding Your Fund’s Expenses — December 31, 2018 (Unaudited)
As a shareholder of the Fund, you incur ongoing costs. Ongoing costs include portfolio management fees, professional fees, administrative fees and other Fund expenses. The following example is intended to help you understand your ongoing costs (in dollars) of investing in the Fund and to compare these costs with the ongoing costs of investing in other mutual funds.
To illustrate these ongoing costs, we have provided an example and calculated the expenses paid by investors in the Fund during the period. The information in the following table is based on an investment of $1,000, which is invested at the beginning of the period and held for the entiresix-month period ended December 31, 2018.
Actual Expenses
The first section of the table provides information about actual account values and actual expenses. You may use the information in this section, together with the amount you invested, to estimate the expenses that you paid over the period. To do so, simply divide your account value by $1,000 (for example, an $8,600 account value divided by $1,000 = 8.6), then multiply the result by the number given under the heading “Expenses paid during the period” to estimate the expenses you paid on your account during the period.
Hypothetical Example for Comparison Purposes
The second section of the table provides information about hypothetical account values and hypothetical expenses based on the Fund’s actual expense ratio and an assumed rate of return of 5% per year before expenses, which is not the Fund’s actual return. The hypothetical account values and expenses may not be used to estimate the actual ending account balance or expenses you paid for the period. You may use this information to compare the ongoing costs of investing in the Fund and other funds. To do so, compare this 5% hypothetical example with the 5% hypothetical examples that appear in the shareholder reports of other funds.
Please note that the expenses shown in the table are meant to highlight and help you compare ongoing costs only and do not reflect transaction costs, such as sales charges or redemption fees, if any. Therefore, the second section of the table is useful in comparing ongoing costs only, and will not help you determine the relative total costs of owning different funds. Additionally, the expenses shown do not reflect the fees or charges associated with variable contracts through which shares of the Fund are offered.
| | | | | | | | |
| | | Actual
Fund Return | | | Hypothetical
5% Return
(2.5% for
the period) | |
Actual Fund Return | | | | | | | | |
Beginning Account Value July 1, 2018 | | $ | 1,000.00 | | | $ | 1,000.00 | |
Ending Account Value December 31, 2018 | | $ | 936.60 | | | $ | 1,021.32 | |
Expenses Paid During Period | | $ | 3.76 | | | $ | 3.92 | |
| * | Expenses are equal to the Fund’s annualized expense ratio of 0.77% (for the period July 1, 2018-December 31, 2018), multiplied by the average account value over the period, multiplied by 184/365 (to reflect theone-half year period). |
| | | | |
| State Street U.S. Equity V.I.S. Fund | | | 3 | |
State Street U.S. Equity V.I.S. Fund
Performance Summary — December 31, 2018 (Unaudited)
Top Ten Largest Holdings
as of December 31, 2018 (as a % of Fair Value)(a)(b)
| | | | |
Microsoft Corp. | | | 4.47 | % |
| |
Amazon.com Inc. | | | 3.56 | % |
| |
Visa Inc., Class A | | | 3.34 | % |
| |
Apple Inc. | | | 3.05 | % |
| |
JPMorgan Chase & Co. | | | 3.04 | % |
| |
Alphabet Inc., Class A | | | 2.71 | % |
| |
PepsiCo Inc. | | | 2.43 | % |
| |
UnitedHealth Group Inc. | | | 2.27 | % |
| |
Gilead Sciences Inc. | | | 1.88 | % |
| |
Mondelez International Inc., Class A | | | 1.85 | % |
Sector Allocation as of December 31, 2018
Portfolio composition as a % of Fair Value of $23,482 (in thousands) on December 31, 2018(a)(b)
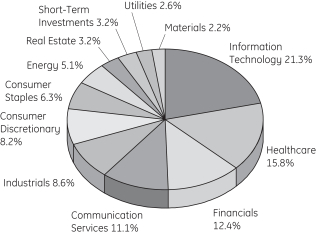
Average Annual Total Return for the periods ended December 31, 2018
Class I Shares (Inception date 1/3/95)
| | | | | | | | | | | | | | | | |
| | | One Year | | | Five Year | | | Ten Year | | | Ending Value
of a $10,000
Investment | |
State Street U.S. Equity V.I.S. Fund | | | -3.40 | % | | | 6.89 | % | | | 11.79 | % | | $ | 30,484 | |
| | | | |
S&P 500® Index | | | -4.38 | % | | | 8.50 | % | | | 13.12 | % | | $ | 34,304 | |
| (a) | Fair Value basis is inclusive of short-term investment in State Street Institutional U.S. Government Money Market Fund Class G Shares. |
| (b) | The securities information regarding holdings, allocations and other characteristics is presented to illustrate examples of securities that the Fund has bought and the diversity of areas in which the Fund may invest as of a particular date. It may not be representative of the Fund’s current or future investments and should not be construed as a recommendation to purchase or sell a particular security. |
| | |
| 4 | | State Street U.S. Equity V.I.S. Fund |
State Street U.S. Equity V.I.S. Fund
Performance Summary, continued — December 31, 2018 (Unaudited)
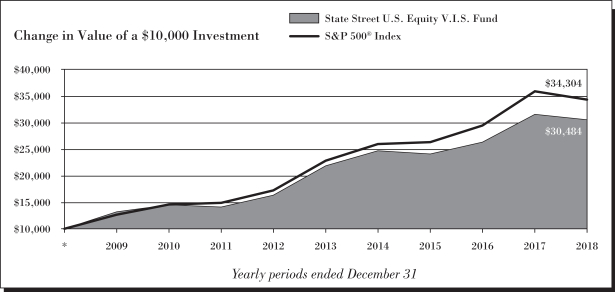
See Notes to Performance beginning on page 1 for further information.
Past performance does not predict future performance. The performance shown in the graphs and tables does not reflect the deduction of taxes that a shareholder would pay on Fund distributions or the redemption of Fund shares and does not reflect the fees or charges that would be associated with variable contracts through which shares of the Fund are offered.
| | | | |
| State Street U.S. Equity V.I.S. Fund | | | 5 | |
State Street U.S. Equity V.I.S. Fund
Schedule of Investments — December 31, 2018
| | | | | | | | |
| | | Number
of Shares | | | Fair
Value $ | |
| | | | | | | | |
|
| Common Stock - 96.8%† | |
Aerospace & Defense - 1.4% | |
General Dynamics Corp. | | | 406 | | | | 63,827 | |
Hexcel Corp. | | | 1,047 | | | | 60,035 | |
Raytheon Co. | | | 759 | | | | 116,393 | |
The Boeing Co. | | | 249 | | | | 80,302 | |
| | | | | | | | |
| | | | | | | 320,557 | |
| | | | | | | | |
|
Air Freight & Logistics - 0.5% | |
FedEx Corp. | | | 256 | | | | 41,300 | |
United Parcel Service Inc., Class B | | | 700 | | | | 68,271 | |
| | | | | | | | |
| | | | | | | 109,571 | |
| | | | | | | | |
|
Airlines - 0.3% | |
Alaska Air Group Inc. | | | 671 | | | | 40,831 | |
JetBlue Airways Corp. (a) | | | 1,438 | | | | 23,094 | |
| | | | | | | | |
| | | | | | | 63,925 | |
| | | | | | | | |
|
Application Software - 1.8% | |
Adobe Inc. (a) | | | 375 | | | | 84,840 | |
Intuit Inc. | | | 264 | | | | 51,968 | |
salesforce.com Inc. (a) | | | 2,166 | | | | 296,677 | |
| | | | | | | | |
| | | | | | | 433,485 | |
| | | | | | | | |
|
Auto Parts & Equipment - 0.3% | |
Aptiv PLC | | | 1,035 | | | | 63,725 | |
| | | | | | | | |
|
Automotive Retail - 0.4% | |
AutoZone Inc. (a) | | | 123 | | | | 103,116 | |
| | | | | | | | |
|
Biotechnology - 4.1% | |
Alexion Pharmaceuticals Inc. (a) | | | 813 | | | | 79,154 | |
Biogen Inc. (a) | | | 990 | | | | 297,911 | |
Gilead Sciences Inc. | | | 7,072 | | | | 442,353 | |
Vertex Pharmaceuticals Inc. (a) | | | 939 | | | | 155,602 | |
| | | | | | | | |
| | | | | | | 975,020 | |
| | | | | | | | |
|
Building Products - 0.3% | |
Allegion PLC | | | 870 | | | | 69,348 | |
| | | | | | | | |
|
Cable & Satellite - 2.0% | |
Charter Communications Inc., Class A (a) | | | 1,061 | | | | 302,353 | |
Comcast Corp., Class A | | | 4,777 | | | | 162,657 | |
| | | | | | | | |
| | | | | | | 465,010 | |
| | | | | | | | |
|
Communications Equipment - 0.7% | |
Cisco Systems Inc. | | | 3,693 | | | | 160,018 | |
| | | | | �� | | | |
|
Construction Materials - 0.1% | |
Vulcan Materials Co. | | | 168 | | | | 16,598 | |
| | | | | | | | |
| | | | | | | | |
| | | Number
of Shares | | | Fair
Value $ | |
Consumer Finance - 0.3% | |
American Express Co. | | | 847 | | | | 80,736 | |
| | | | | | | | |
|
Data Processing & Outsourced Services - 3.9% | |
Mastercard Inc., Class A | | | 706 | | | | 133,187 | |
Visa Inc., Class A | | | 5,937 | | | | 783,328 | |
| | | | | | | | |
| | | | | | | 916,515 | |
| | | | | | | | |
|
Diversified Banks - 4.1% | |
JPMorgan Chase & Co. | | | 7,305 | | | | 713,114 | |
U.S. Bancorp | | | 1,059 | | | | 48,396 | |
Wells Fargo & Co. | | | 4,237 | | | | 195,241 | |
| | | | | | | | |
| | | | | | | 956,751 | |
| | | | | | | | |
|
Diversified Chemicals - 0.6% | |
DowDuPont Inc. | | | 2,497 | | | | 133,540 | |
| | | | | | | | |
|
Electric Utilities - 1.5% | |
American Electric Power Company Inc. | | | 869 | | | | 64,949 | |
Duke Energy Corp. | | | 257 | | | | 22,179 | |
Edison International | | | 456 | | | | 25,887 | |
Exelon Corp. | | | 2,018 | | | | 91,012 | |
NextEra Energy Inc. | | | 796 | | | | 138,361 | |
| | | | | | | | |
| | | | | | | 342,388 | |
| | | | | | | | |
|
Electrical Components & Equipment - 0.4% | |
Emerson Electric Co. | | | 1,787 | | | | 106,773 | |
| | | | | | | | |
|
Electronic Components - 1.3% | |
Corning Inc. | | | 10,243 | | | | 309,441 | |
| | | | | | | | |
|
Environmental & Facilities Services - 0.2% | |
Republic Services Inc. | | | 591 | | | | 42,605 | |
| | | | | | | | |
|
Fertilizers & Agricultural Chemicals - 0.1% | |
The Mosaic Co. | | | 1,220 | | | | 35,636 | |
| | | | | | | | |
|
Financial Exchanges & Data - 2.9% | |
CME Group Inc. | | | 1,639 | | | | 308,329 | |
MSCI Inc. | | | 530 | | | | 78,138 | |
S&P Global Inc. | | | 1,728 | | | | 293,656 | |
| | | | | | | | |
| | | | | | | 680,123 | |
| | | | | | | | |
|
Footwear - 0.7% | |
NIKE Inc., Class B | | | 2,181 | | | | 161,699 | |
| | | | | | | | |
|
General Merchandise Stores - 0.4% | |
Dollar Tree Inc. (a) | | | 937 | | | | 84,630 | |
| | | | | | | | |
|
Gold - 0.1% | |
Newmont Mining Corp. | | | 642 | | | | 22,245 | |
| | | | | | | | |
See Notes to Schedule of Investments and Notes to Financial Statements.
| | |
| 6 | | State Street U.S. Equity V.I.S. Fund |
State Street U.S. Equity V.I.S. Fund
Schedule of Investments, continued — December 31, 2018
| | | | | | | | |
| | | Number
of Shares | | | Fair
Value $ | |
| | | | | | | | |
Healthcare Distributors - 0.2% | |
Henry Schein Inc. (a) | | | 503 | | | | 39,496 | |
| | | | | | | | |
|
Healthcare Equipment - 1.8% | |
Becton Dickinson and Co. | | | 407 | | | | 91,705 | |
Boston Scientific Corp. (a) | | | 5,609 | | | | 198,222 | |
Medtronic PLC | | | 1,511 | | | | 137,441 | |
| | | | | | | | |
| | | | | | | 427,368 | |
| | | | | | | | |
|
Healthcare Services - 1.1% | |
Cigna Corp. | | | 660 | | | | 125,347 | |
DaVita Inc. (a) | | | 1,369 | | | | 70,449 | |
Quest Diagnostics Inc. | | | 829 | | | | 69,031 | |
| | | | | | | | |
| | | | | | | 264,827 | |
| | | | | | | | |
|
Healthcare Supplies - 0.4% | |
The Cooper Companies Inc. | | | 334 | | | | 85,003 | |
| | | | | | | | |
|
Home Improvement Retail - 0.5% | |
The Home Depot Inc. | | | 716 | | | | 123,023 | |
| | | | | | | | |
|
Hotels, Resorts & Cruise Lines - 0.3% | |
Marriott International Inc., Class A | | | 581 | | | | 63,073 | |
| | | | | | | | |
|
Household Products - 1.0% | |
The Procter & Gamble Co. | | | 2,480 | | | | 227,962 | |
| | | | | | | | |
|
Hypermarkets & Super Centers - 0.3% | |
Walmart Inc. | | | 811 | | | | 75,545 | |
| | | | | | | | |
|
Independent Power Producers & Energy Traders - 0.1% | |
NRG Energy Inc. | | | 485 | | | | 19,206 | |
| | | | | | | | |
|
Industrial Conglomerates - 1.1% | |
Honeywell International Inc. | | | 1,208 | | | | 159,601 | |
Roper Technologies Inc. | | | 401 | | | | 106,874 | |
| | | | | | | | |
| | | | | | | 266,475 | |
| | | | | | | | |
|
Industrial Gases - 0.5% | |
Air Products & Chemicals Inc. | | | 565 | | | | 90,428 | |
Linde PLC | | | 201 | | | | 31,364 | |
| | | | | | | | |
| | | | | | | 121,792 | |
| | | | | | | | |
|
Industrial Machinery - 2.5% | |
Ingersoll-Rand PLC | | | 3,261 | | | | 297,501 | |
Xylem Inc. | | | 4,503 | | | | 300,440 | |
| | | | | | | | |
| | | | | | | 597,941 | |
| | | | | | | | |
|
Insurance Brokers - 0.3% | |
Marsh & McLennan Companies Inc. | | | 893 | | | | 71,217 | |
| | | | | | | | |
| | | | | | | | |
| | | Number
of Shares | | | Fair
Value $ | |
Integrated Oil & Gas - 2.4% | |
Chevron Corp. | | | 3,250 | | | | 353,568 | |
Exxon Mobil Corp. | | | 3,101 | | | | 211,457 | |
| | | | | | | | |
| | | | | | | 565,025 | |
| | | | | | | | |
|
Integrated Telecommunication Services - 0.7% | |
AT&T Inc. | | | 1,699 | | | | 48,490 | |
Verizon Communications Inc. | | | 2,183 | | | | 122,728 | |
| | | | | | | | |
| | | | | | | 171,218 | |
| | | | | | | | |
|
Interactive Home Entertainment - 0.3% | |
Activision Blizzard Inc. | | | 885 | | | | 41,214 | |
Electronic Arts Inc. (a) | | | 450 | | | | 35,510 | |
| | | | | | | | |
| | | | | | | 76,724 | |
| | | | | | | | |
|
Interactive Media & Services - 5.6% | |
Alphabet Inc., Class A (a) | | | 608 | | | | 635,336 | |
Alphabet Inc., Class C (a) | | | 325 | | | | 336,573 | |
Facebook Inc., Class A (a) | | | 2,593 | | | | 339,916 | |
| | | | | | | | |
| | | | | | | 1,311,825 | |
| | | | | | | | |
|
Internet & Direct Marketing Retail - 4.3% | |
Amazon.com Inc. (a) | | | 557 | | | | 836,598 | |
Booking Holdings Inc. (a) | | | 103 | | | | 177,409 | |
| | | | | | | | |
| | | | | | | 1,014,007 | |
| | | | | | | | |
|
Investment Banking & Brokerage - 1.0% | |
The Charles Schwab Corp. | | | 5,625 | | | | 233,606 | |
| | | | | | | | |
|
IT Consulting & Other Services - 0.6% | |
Accenture PLC, Class A | | | 487 | | | | 68,672 | |
International Business Machines Corp. | | | 693 | | | | 78,773 | |
| | | | | | | | |
| | | | | | | 147,445 | |
| | | | | | | | |
|
Life & Health Insurance - 0.3% | |
Prudential Financial Inc. | | | 766 | | | | 62,467 | |
| | | | | | | | |
|
Life Sciences Tools & Services - 0.8% | |
IQVIA Holdings Inc. (a) | | | 1,001 | | | | 116,286 | |
Thermo Fisher Scientific Inc. | | | 126 | | | | 28,198 | |
Waters Corp. (a) | | | 233 | | | | 43,955 | |
| | | | | | | | |
| | | | | | | 188,439 | |
| | | | | | | | |
|
Managed Healthcare - 2.8% | |
Humana Inc. | | | 404 | | | | 115,738 | |
UnitedHealth Group Inc. | | | 2,144 | | | | 534,113 | |
| | | | | | | | |
| | | | | | | 649,851 | |
| | | | | | | | |
|
Movies & Entertainment - 2.3% | |
Netflix Inc. (a) | | | 431 | | | | 115,362 | |
See Notes to Schedule of Investments and Notes to Financial Statements.
| | | | |
| State Street U.S. Equity V.I.S. Fund | | | 7 | |
State Street U.S. Equity V.I.S. Fund
Schedule of Investments, continued — December 31, 2018
| | | | | | | | |
| | | Number
of Shares | | | Fair
Value $ | |
| | | | | | | | |
The Walt Disney Co. | | | 3,857 | | | | 422,920 | |
| | | | | | | | |
| | | | | | | 538,282 | |
| | | | | | | | |
|
Multi-Line Insurance - 0.3% | |
American International Group Inc. | | | 734 | | | | 28,927 | |
The Hartford Financial Services Group Inc. | | | 864 | | | | 38,405 | |
| | | | | | | | |
| | | | | | | 67,332 | |
| | | | | | | | |
|
Multi-Sector Holdings - 1.3% | |
Berkshire Hathaway Inc., Class B (a) | | | 1,450 | | | | 296,061 | |
| | | | | | | | |
| | |
Multi-Utilities - 1.1% | | | | | | | | |
Dominion Energy Inc. | | | 685 | | | | 48,950 | |
Sempra Energy | | | 1,840 | | | | 199,070 | |
| | | | | | | | |
| | | | | | | 248,020 | |
| | | | | | | | |
|
Oil & Gas Equipment & Services - 0.9% | |
Schlumberger Ltd. | | | 5,949 | | | | 214,640 | |
| | | | | | | | |
|
Oil & Gas Exploration & Production - 1.6% | |
Concho Resources Inc. (a) | | | 534 | | | | 54,890 | |
ConocoPhillips | | | 1,292 | | | | 80,556 | |
Diamondback Energy Inc. | | | 2,072 | | | | 192,074 | |
EOG Resources Inc. | | | 436 | | | | 38,024 | |
| | | | | | | | |
| | | | | | | 365,544 | |
| | | | | | | | |
|
Oil & Gas Refining & Marketing - 0.3% | |
Marathon Petroleum Corp. | | | 1,025 | | | | 60,485 | |
| | | | | | | | |
|
Packaged Foods & Meats - 2.1% | |
Mondelez International Inc., Class A | | | 10,863 | | | | 434,846 | |
The Kraft Heinz Co. | | | 1,203 | | | | 51,777 | |
| | | | | | | | |
| | | | | | | 486,623 | |
| | | | | | | | |
|
Pharmaceuticals - 4.6% | |
Allergan PLC | | | 2,592 | | | | 346,447 | |
Elanco Animal Health Inc. (a) | | | 1,687 | | | | 53,191 | |
Johnson & Johnson | | | 2,071 | | | | 267,263 | |
Merck & Company Inc. | | | 1,208 | | | | 92,303 | |
Mylan N.V. (a) | | | 5,051 | | | | 138,397 | |
Pfizer Inc. | | | 3,946 | | | | 172,243 | |
| | | | | | | | |
| | | | | | | 1,069,844 | |
| | | | | | | | |
|
Property & Casualty Insurance - 0.4% | |
Chubb Ltd. | | | 719 | | | | 92,880 | |
| | | | | | | | |
|
Railroads - 0.5% | |
Union Pacific Corp. | | | 883 | | | | 122,057 | |
| | | | | | | | |
| | | | | | | | |
| | | Number
of Shares | | | Fair
Value $ | |
Regional Banks - 1.6% | |
First Republic Bank | | | 4,376 | | | | 380,274 | |
| | | | | | | | |
|
Restaurants - 1.0% | |
McDonald’s Corp. | | | 1,385 | | | | 245,934 | |
| | | | | | | | |
|
Semiconductor Equipment - 1.5% | |
Applied Materials Inc. | | | 11,055 | | | | 361,941 | |
| | | | | | | | |
|
Semiconductors - 2.7% | |
Broadcom Inc. | | | 1,611 | | | | 409,645 | |
Intel Corp. | | | 2,844 | | | | 133,469 | |
NVIDIA Corp. | | | 684 | | | | 91,314 | |
| | | | | | | | |
| | | | | | | 634,428 | |
| | | | | | | | |
|
Soft Drinks - 2.4% | |
PepsiCo Inc. | | | 5,168 | | | | 570,961 | |
| | | | | | | | |
|
Specialized REITs - 3.2% | |
American Tower Corp. (b) | | | 2,105 | | | | 332,990 | |
Equinix Inc. | | | 722 | | | | 254,548 | |
Extra Space Storage Inc. | | | 1,765 | | | | 159,697 | |
| | | | | | | | |
| | | | | | | 747,235 | |
| | | | | | | | |
|
Specialty Chemicals - 0.7% | |
Albemarle Corp. | | | 1,504 | | | | 115,914 | |
PPG Industries Inc. | | | 601 | | | | 61,440 | |
| | | | | | | | |
| | | | | | | 177,354 | |
| | | | | | | | |
|
Specialty Stores - 0.3% | |
Ulta Salon Cosmetics & Fragrance Inc. (a) | | | 249 | | | | 60,965 | |
| | | | | | | | |
|
Steel - 0.0%* | |
Steel Dynamics Inc. | | | 340 | | | | 10,214 | |
| | | | | | | | |
|
Systems Software - 5.7% | |
Microsoft Corp. | | | 10,329 | | | | 1,049,117 | |
Oracle Corp. | | | 3,177 | | | | 143,442 | |
Proofpoint Inc. (a) | | | 492 | | | | 41,234 | |
Red Hat Inc. (a) | | | 153 | | | | 26,873 | |
ServiceNow Inc. (a) | | | 407 | | | | 72,466 | |
| | | | | | | | |
| | | | | | | 1,333,132 | |
| | | | | | | | |
|
Technology Hardware, Storage & Peripherals - 3.0% | |
Apple Inc. | | | 4,546 | | | | 717,086 | |
| | | | | | | | |
|
Tobacco - 0.5% | |
Philip Morris International Inc. | | | 1,732 | | | | 115,628 | |
| | | | | | | | |
|
Trading Companies & Distributors - 1.3% | |
United Rentals Inc. (a) | | | 3,091 | | | | 316,920 | |
| | | | | | | | |
See Notes to Schedule of Investments and Notes to Financial Statements.
| | |
| 8 | | State Street U.S. Equity V.I.S. Fund |
State Street U.S. Equity V.I.S. Fund
Schedule of Investments, continued — December 31, 2018
| | | | | | | | |
| | | Number
of Shares | | | Fair
Value $ | |
| | | | | | | | |
Wireless Telecommunication Services - 0.2% | |
T-Mobile US Inc. (a) | | | 744 | | | | 47,327 | |
| | | | | | | | |
| |
Total Common Stock
(Cost $20,077,990) | | | | 22,738,157 | |
| | | | | | | | |
| |
| Short-Term Investments - 3.2% | | | | | |
State Street Institutional U.S. Government Money Market Fund - Class G Shares 2.31% (Cost $743,662) (c)(d) | | | 743,662 | | | | 743,662 | |
| | | | | | | | |
| | |
Total Investments
(Cost $20,821,652) | | | | | | | 23,481,819 | |
| |
Liabilities in Excess of Other Assets,
net - (0.0)%* | | | | (8,446 | ) |
| | | | | | | | |
| | |
| NET ASSETS - 100.0% | | | | | | | 23,473,373 | |
| | | | | | | | |
Other Information:
The Fund had the following long futures contracts open at December 31, 2018:
| | | | | | | | | | | | | | | | | | | | |
| Description | | Expiration
date | | | Number
of
Contracts | | | Notional
Amount | | | Value | | | Unrealized
Depreciation | |
| | | | | | | | | | | | | | | | | | | | |
S&P 500 Emini Index Futures | | | March 2019 | | | | 2 | | | $ | 260,540 | | | $ | 250,520 | | | $ | (10,020 | ) |
| | | | | | | | | | | | | | | | | | | | |
During the year ended December 31, 2018, average notional value related to long futures contracts and short futures contracts was $219,813 and $52,995, respectively.
See Notes to Schedule of Investments and Notes to Financial Statements.
| | | | |
| State Street U.S. Equity V.I.S. Fund | | | 9 | |
State Street U.S. Equity V.I.S. Fund
Notes to Schedule of Investments — December 31, 2018
The views expressed in this document reflect our judgment as of the publication date and are subject to change at any time without notice. The securities cited may not be representative of the Fund’s future investments and should not be construed as a recommendation to purchase or sell a particular security. See the Fund’s summary prospectus and statutory prospectus for complete descriptions of investment objectives, policies, risks and permissible investments.
| (a) | Non-income producing security. |
| (b) | At December 31, 2018, all or a portion of this security was pledged to cover collateral requirements for futures. |
| (c) | Sponsored by SSGA Funds Management, Inc., the Fund’s investment adviser and administrator, and an affiliate of State Street Bank & Trust Co., the Fund’ssub-administrator, custodian and accounting agent. |
| (d) | Coupon amount represents effective yield. |
| † | Percentages are based on net assets as of December 31, 2018. |
Abbreviations:
REIT - Real Estate Investment Trust
| | | | | | | | | | | | | | | | |
| Investments | | Level 1 | | | Level 2 | | | Level 3 | | | Total | |
| | | | | | | | | | | | | | | | |
Investments in Securities | | | | | | | | | | | | | | | | |
Common Stock | | $ | 22,738,157 | | | $ | — | | | $ | — | | | $ | 22,738,157 | |
Short-Term Investments | | | 743,662 | | | | — | | | | — | | | | 743,662 | |
| | | | | | | | | | | | | | | | |
Total Investments in Securities | | $ | 23,481,819 | | | $ | — | | | $ | — | | | $ | 23,481,819 | |
| | | | | | | | | | | | | | | | |
Other Financial Instruments | | | | | | | | | | | | | | | | |
Long Futures Contracts - Unrealized Depreciation | | $ | (10,020 | ) | | $ | — | | | $ | — | | | $ | (10,020 | ) |
| | | | | | | | | | | | | | | | |
Affiliate Table
| | | | | | | | | | | | | | | | | | | | | | | | | | | | |
| | | Number
of Shares
Held at
12/31/17 | | | Value At
12/31/17 | | | Cost of
Purchases | | | Proceeds
from
Shares
Sold | | | Number
of Shares
Held at
12/31/18 | | | Value at
12/31/18 | | | Dividend
Income | |
State Street Institutional U.S. Government Money Market Fund - Class G Shares | | | 1,034,501 | | | $ | 1,034,501 | | | $ | 5,718,026 | | | $ | 6,008,865 | | | | 743,662 | | | $ | 743,662 | | | $ | 12,720 | |
See Notes to Schedule of Investments and Notes to Financial Statements.
| | |
| 10 | | State Street U.S. Equity V.I.S. Fund |
State Street U.S. Equity V.I.S. Fund
Financial Highlights
Selected data based on a share outstanding throughout the fiscal years indicated
| | | | | | | | | | | | | | | | | | | | |
| | | 12/31/18 | | | 12/31/17 | | | 12/31/16 | | | 12/31/15* | | | 12/31/14* | |
| Inception date | | | | | | | | | | | | | | | | | | | 1/3/95 | |
| | | | | |
Net asset value, beginning of period | | $ | 44.20 | | | $ | 42.02 | | | $ | 42.25 | | | $ | 48.44 | | | $ | 46.63 | |
| | | | | | | | | | | | | | | | | | | | |
| | | |
Income/(loss) from investment operations: | | | | | | | | | | | | | |
Net investment income | | | 0.37 | (a) | | | 0.35 | (a) | | | 0.55 | | | | 0.53 | | | | 0.50 | |
Net realized and unrealized gains/(losses) on investments | | | (1.90 | ) | | | 8.03 | | | | 3.41 | | | | (1.56 | ) | | | 5.48 | |
| | | | | | | | | | | | | | | | | | | | |
Total income/(loss) from investment operations | | | (1.53 | ) | | | 8.38 | | | | 3.96 | | | | (1.03 | ) | | | 5.98 | |
| | | | | | | | | | | | | | | | | | | | |
| | | | | |
Less distributions from: | | | | | | | | | | | | | | | | | | | | |
Net investment income | | | 0.41 | | | | 0.38 | | | | 0.54 | | | | 0.53 | | | | 0.46 | |
Net realized gains | | | 4.19 | | | | 5.82 | | | | 3.65 | | | | 4.63 | | | | 3.71 | |
| | | | | | | | | | | | | | | | | | | | |
Total distributions | | | 4.60 | | | | 6.20 | | | | 4.19 | | | | 5.16 | | | | 4.17 | |
| | | | | | | | | | | | | | | | | | | | |
Net asset value, end of period | | $ | 38.07 | | | $ | 44.20 | | | $ | 42.02 | | | $ | 42.25 | | | $ | 48.44 | |
| | | | | | | | | | | | | | | | | | | | |
Total Return(b) | | | (3.40 | )% | | | 19.91 | % | | | 9.31 | % | | | (2.30 | )% | | | 12.77 | % |
| | | | | |
Ratios/Supplemental Data: | | | | | | | | | | | | | | | | | | | | |
Net assets, end of period (in thousands) | | $ | 23,473 | | | $ | 28,308 | | | $ | 27,336 | | | $ | 31,405 | | | $ | 35,178 | |
| | | | | |
Ratios to average net assets: | | | | | | | | | | | | | | | | | | | | |
Net expenses | | | 0.80 | % | | | 0.85 | % | | | 0.83 | % | | | 0.76 | % | | | 0.77 | %(c) |
Gross expenses | | | 0.80 | % | | | 0.85 | % | | | 0.83 | % | | | 0.76 | % | | | 0.77 | % |
Net investment income | | | 0.81 | % | | | 0.75 | % | | | 1.16 | % | | | 1.04 | % | | | 0.99 | % |
Portfolio turnover rate | | | 41 | % | | | 80 | % | | | 37 | % | | | 37 | % | | | 43 | % |
Notes to Financial Highlights
| (a) | | Per share values have been calculated using the average shares method. |
| (b) | | Total returns are historical and assume changes in share price, reinvestment of dividends and capital gains distributions and do not include the effect of insurance contract charges. Past performance does not guarantee future results. |
| (c) | | Includes contractual management fee waiver related to the Fund’s investments in the GE Institutional Money Market Fund (the “Money Market Fund”). The fee waiver agreement was terminated effective June 30, 2014 with the closure of the Money Market Fund. |
| * | | Beginning with the year ended December 31, 2016, the Fund was audited by Ernst & Young LLP. The previous years were audited by another independent registered public accounting firm. |
The accompanying Notes are an integral part of these financial statements.
State Street U.S. Equity V.I.S. Fund
Statement of Assets and Liabilities — December 31, 2018
| | | | |
| | | | |
Assets | | | | |
Investments in securities, at fair value (cost $20,077,990) | | $ | 22,738,157 | |
Short-term affiliated investments, at fair value | | | 743,662 | |
Cash | | | 1,768 | |
Cash collateral on deposit with broker for future contracts | | | 29,258 | |
Income receivables | | | 28,704 | |
Receivable for fund shares sold | | | 415 | |
Income receivable from affiliated investments | | | 1,645 | |
| | | | |
| |
Total assets | | | 23,543,609 | |
| | | | |
| |
Liabilities | | | | |
Payable for fund shares redeemed | | | 10,913 | |
Payable for accumulated variation margin on futures contracts | | | 10,015 | |
Payable to the Adviser | | | 11,247 | |
Payable for custody, fund accounting andsub-administration fees | | | 1,507 | |
Accrued other expenses | | | 36,554 | |
| | | | |
| |
Total liabilities | | | 70,236 | |
| | | | |
| | | | |
| |
Net Assets | | $ | 23,473,373 | |
| | | | |
| |
Net Assets Consist of: | | | | |
Capital paid in | | $ | 20,732,590 | |
Total distributable earnings (loss) | | | 2,740,783 | |
| | | | |
| |
Net Assets | | $ | 23,473,373 | |
| | | | |
| | | | |
Shares outstanding ($0.01 par value; unlimited shares authorized) | | | 616,663 | |
Net asset value per share | | $ | 38.07 | |
The accompanying Notes are an integral part of these financial statements.
| | |
| 12 | | Statement of Assets and Liabilities |
State Street U.S. Equity V.I.S. Fund
Statement of Operations — For the period ended December 31, 2018
| | | | |
| | | | |
Investment Income | | | | |
Income | | | | |
Dividend | | $ | 433,285 | |
Income from affiliated investments | | | 12,720 | |
| | | | |
Total income | | | 446,005 | |
| | | | |
|
Expenses | |
Advisory and administration fees | | | 151,880 | |
Directors’ fees | | | 2,258 | |
Custody, fund accounting andsub-administration fees | | | 13,386 | |
Professional fees | | | 36,116 | |
Other expenses | | | 17,646 | |
| | | | |
Total Expenses | | | 221,286 | |
| | | | |
Net investment income | | $ | 224,719 | |
| | | | |
| |
Net Realized and Unrealized Gain (Loss) on Investments | | | | |
Realized gain (loss) on: | |
Unaffiliated investments | | $ | 2,183,723 | |
Futures | | | 2,165 | |
Foreign currency transactions | | | (37 | ) |
Increase (decrease) in unrealized appreciation/depreciation on: | |
Unaffiliated investments | | | (3,044,544 | ) |
Futures | | | (10,491 | ) |
| | | | |
| |
Net realized and unrealized gain (loss) on investments | | | (869,184 | ) |
| | | | |
| |
Net Decrease in Net Assets Resulting from Operations | | $ | (644,465 | ) |
| | | | |
The accompanying Notes are an integral part of these financial statements.
| | | | |
| Statement of Operations | | | 13 | |
State Street U.S. Equity V.I.S. Fund
Statements of Changes in Net Assets
| | | | | | | | |
| | | Year Ended December 31,
2018 | | | Year Ended December 31,
2017 | |
| | | | | | | | |
Increase (Decrease) in Net Assets | |
|
Operations: | |
Net investment income | | $ | 224,719 | | | $ | 212,471 | |
Net realized gain (loss) on investments and futures transactions | | | 2,185,851 | | | | 3,495,066 | |
Net increase (decrease) in unrealized appreciation/depreciation on investments and futures | | | (3,055,035 | ) | | | 1,432,584 | |
| | | | | | | | |
Net increase (decrease) from operations | | | (644,465 | ) | | | 5,140,121 | |
| | | | | | | | |
| | |
Distributions to shareholders: | | | | | | | | |
Total distributions | | | (2,528,893 | ) | | | (3,484,811 | ) |
| | | | | | | | |
Increase (decrease) in assets from operations and distributions | | | (3,173,358 | ) | | | 1,655,310 | |
| | | | | | | | |
| | |
Share transactions: | | | | | | | | |
Proceeds from sale of shares | | | 241,533 | | | | 272,095 | |
Value of distributions reinvested | | | 2,528,893 | | | | 3,484,811 | |
Cost of shares redeemed | | | (4,431,611 | ) | | | (4,440,611 | ) |
| | | | | | | | |
Net increase (decrease) from share transactions | | | (1,661,185 | ) | | | (683,705 | ) |
| | | | | | | | |
| | |
Total increase (decrease) in net assets | | | (4,834,543 | ) | | | 971,605 | |
| | |
Net Assets | | | | | | | | |
Beginning of year | | | 28,307,916 | | | | 27,336,311 | |
| | | | | | | | |
| | |
End of year | | $ | 23,473,373 | | | $ | 28,307,916 | |
| | | | | | | | |
| | |
Changes in Fund Shares | | | | | | | | |
Shares sold | | | 5,408 | | | | 5,950 | |
Issued for distributions reinvested | | | 66,920 | | | | 78,699 | |
Shares redeemed | | | (96,095 | ) | | | (94,827 | ) |
| | | | | | | | |
Net decrease in fund shares | | | (23,767 | ) | | | (10,178 | ) |
| | | | | | | | |
For the year ended December 31, 2017, the source of distributions paid to shareholders was (See Note 10 in the Notes to Financial Statements):
| | | | |
| | | | |
Net investment income | | $ | (212,881 | ) |
Net realized gains | | | (3,271,930 | ) |
| | | | |
Total distributions | | | (3,484,811 | ) |
| | | | |
Undistributed net investment income as of December 31, 2017: | | $ | — | |
The accompanying Notes are an integral part of these financial statements.
| | |
| 14 | | Statements of Changes in Net Assets |
State Street U.S. Equity V.I.S. Fund
Notes to Financial Statements — December 31, 2018
| 1. | | Organization of the Company |
State Street Variable Insurance Series Funds, Inc. (the “Company”) was incorporated under the laws of the Commonwealth of Virginia on May 14, 1984 and is registered under the Investment Company Act of 1940, as amended (the “1940 Act”), as anopen-end management investment company. The Company is currently composed of the following seven investment portfolios (collectively, the “Funds”): State Street U.S. Equity V.I.S. Fund (the “Fund”), State Street S&P 500 Index V.I.S. Fund, State Street Premier Growth Equity V.I.S. Fund, State StreetSmall-Cap Equity V.I.S. Fund, State Street Total Return V.I.S. Fund, State Street Income V.I.S. Fund and State Street Real Estate Securities V.I.S. Fund. Each Fund is a diversified investment company within the meaning of the 1940 Act.
Shares of the Funds of the Company are offered only to insurance company separate accounts that fund certain variable life insurance contracts and variable annuity contracts.
The Company currently offers one share class (Class 1) of the Fund as an investment option for variable life insurance and variable annuity contracts.
Under the Company’s organizational documents, its officers and directors are indemnified against certain liabilities arising out of the performance of their duties to the Company. Additionally, in the normal course of business, the Company enters into contracts with service providers that contain general indemnification clauses. The Company’s maximum exposure under these arrangements is unknown as this would involve future claims that may be made against the Company that have not yet occurred.
| 2. | | Summary of Significant Accounting Policies |
The following is a summary of significant accounting policies followed by the Company in the preparation of its financial statements:
The preparation of financial statements in accordance with U.S. generally accepted accounting principles (“U.S. GAAP”) requires management to make estimates and assumptions that affect the reported amounts and disclosures in the financial statements. Actual results could differ from those estimates. The Fund is an investment company under U.S. GAAP and follows the accounting and reporting guidance applicable to investment companies.
Security Valuation The Fund’s investments are valued at fair value each day that the New York Stock Exchange (“NYSE”) is open and, for financial reporting purposes, as of the report date should the reporting period end on a day that the NYSE is not open. Fair value is generally defined as the price a fund would receive to sell an asset or pay to transfer a liability in an orderly transaction between market participants at the measurement date. By its nature, a fair value price is a good faith estimate of the valuation in a current sale and may not reflect an actual market price. The investments of the Fund are valued pursuant to the policy and procedures developed by the Oversight Committee (the “Committee”) and approved by the Company’s Board of Directors (the “Board”). The Committee provides oversight of the valuation of investments for the Fund. The Board has responsibility for overseeing the determination of the fair value of investments.
Valuation techniques used to value the Fund’s investments by major category are as follows:
| | • | | Equity investments (including preferred stocks) traded on a recognized securities exchange for which market quotations are readily available are valued at the last sale price or official closing price, as applicable, on the primary market or exchange on which they trade. Equity investments traded on a recognized exchange for which there were no sales on that day are valued at the last published sale price or at fair value. |
| | • | | Exchange-traded futures contracts are valued at the closing settlement price on the primary market on which they are traded most extensively. Exchange-traded futures contracts traded on a recognized exchange for which there were no sales on that day are valued at the last reported sale price obtained from independent pricing services or brokers or at fair value. |
| | • | | Investments in registered investment companies (including money market funds) or other unitized pooled investment vehicles that are not traded on an exchange are valued at that day’s published net asset value (“NAV”) per share or unit. |
In the event prices or quotations are not readily available or that the application of these valuation methods results in a price for an investment that is deemed to be not representative of the fair value of such investment, fair value will be determined in good faith by the Committee, in accordance with the valuation policy and procedures approved by the Board.
| | | | |
| Notes to Financial Statements | | | 15 | |
State Street U.S. Equity V.I.S. Fund
Notes to Financial Statements, continued — December 31, 2018
The Fund values its assets and liabilities at fair value using a fair value hierarchy consisting of three broad levels that prioritize the inputs to valuation techniques giving the highest priority to readily available unadjusted quoted prices in active markets for identical assets or liabilities (Level 1 measurements) and the lowest priority to unobservable inputs (Level 3 measurements) when market prices are not readily available or reliable. The categorization of a value determined for an investment within the hierarchy is based upon the pricing transparency of the investment and is not necessarily an indication of the risk associated with investing in it.
The three levels of the fair value hierarchy are as follows:
| | • | | Level 1 — Unadjusted quoted prices in active markets for an identical asset or liability; |
| | • | | Level 2 — Inputs other than quoted prices included within Level 1 that are observable for the asset or liability either directly or indirectly, including quoted prices for similar assets or liabilities in active markets, quoted prices for identical or similar assets or liabilities in markets that are not considered to be active, inputs other than quoted prices that are observable for the asset or liability (such as exchange rates, financing terms, interest rates, yield curves, volatilities, prepayment speeds, loss severities, credit risks and default rates) or other market-corroborated inputs; and |
| | • | | Level 3 — Unobservable inputs for the asset or liability, including the Committee’s assumptions used in determining the fair value of investments. |
The value of the Fund’s investments according to the fair value hierarchy as of December 31, 2018 is disclosed in the Fund’s Schedule of Investments.
Investment Transactions and Income Recognition Investment transactions are accounted for on trade date for financial reporting purposes. Realized gains and losses from the sale or disposition of investments and foreign exchange transactions, if any, are determined using the identified cost method.
Dividend income and capital gain distributions, if any, are recognized on theex-dividend date, net of any foreign taxes withheld at source, if any.
Interest income is recorded daily on an accrual basis. All premiums and discounts are amortized/accreted for financial reporting purposes.
Non-cash dividends received in the form of stock are recorded as dividend income at fair value.
Expenses Certain expenses, which are directly identifiable to a specific Fund, are applied to the Fund within the Company. Other expenses which cannot be attributed to a specific Fund are allocated in such a manner as deemed equitable, taking into consideration the nature and type of expense and the relative net assets of the Fund within the Company.
Foreign Currency Translation The accounting records of the Fund are maintained in U.S. dollars. Foreign currencies as well as investment securities and other assets and liabilities denominated in a foreign currency are translated to U.S. dollars using exchange rates at period end. Purchases and sales of securities, income receipts and expense payments denominated in foreign currencies are translated into U.S. dollars at the prevailing exchange rate on the respective dates of the transactions.
The effects of exchange rate fluctuations on investments are included with the net realized and unrealized gain (loss) on investment securities. Other foreign currency transactions resulting in realized and unrealized gain (loss) are disclosed separately.
Foreign Taxes The Fund may be subject to foreign taxes (a portion of which may be reclaimable) on income, stock dividends, realized and unrealized capital gains on investments or certain foreign currency transactions. Foreign taxes are recorded in accordance with SSGA Funds Management, Inc.’s (the “Adviser” or “SSGA FM”) understanding of the applicable foreign tax regulations and rates that exist in the foreign jurisdictions in which the Fund invests. These foreign taxes, if any, are paid by the Fund and are reflected in the Statement of Operations, if applicable. Foreign taxes payable or deferred as of December 31, 2018, if any, are disclosed in the Fund’s Statement of Assets and Liabilities.
Distributions The Fund declares and pays any dividends from net investment income annually.
| | |
| 16 | | Notes to Financial Statements |
State Street U.S. Equity V.I.S. Fund
Notes to Financial Statements, continued — December 31, 2018
Net realized capital gains, if any, are distributed annually, unless additional distributions are required for compliance with applicable tax regulations. The amount and character of income and capital gains to be distributed are determined in accordance with applicable tax regulations which may differ from net investment income and realized gains recognized for U.S. GAAP purposes.
| 3. | | Derivative Financial Instruments |
Futures Contracts The Fund may enter into futures contracts to meet the Fund’s objectives. A futures contract is a standardized, exchange-traded agreement to buy or sell a financial instrument at a set price on a future date. Upon entering into a futures contract, the Fund is required to deposit with the broker, cash or securities in an amount equal to the minimum initial margin requirements of the clearing house. Subsequent payments are made or received by the Fund equal to the daily change in the contract value and are recorded as variation margin receivable or payable with a corresponding offset to unrealized gains or losses. The Fund recognizes a realized gain or loss when the contract is closed.
Losses may arise if the value of a futures contract decreases due to unfavorable changes in the market rates or values of the underlying instrument during the term of the contract or if the counterparty does not perform under the contract. The use of futures contracts also involves the risk that the movements in the price of the futures contracts do not correlate with the movement of the assets underlying such contracts.
For the fiscal year ended December 31, 2018, the Fund entered into futures contracts for cash equitization.
The following tables summarize the value of the Fund’s derivative instruments as of December 31, 2018 and the related location in the accompanying Statement of Assets and Liabilities and Statement of Operations, presented by primary underlying risk exposure:
Liability Derivatives
| | | | | | | | | | | | | | | | | | | | | | | | |
| | | Interest
Rate
Contracts
Risk | | | Foreign
Exchange
Contracts
Risk | | | Credit
Contracts
Risk | | | Equity
Contracts
Risk | | | Commodity
Contracts
Risk | | | Total | |
| | | | | | | | | | | | | | | | | | | | | | | | |
State Street U.S. Equity V.I.S. Fund | | | | | | | | | | | | | | | | | | | | | | | | |
Futures Contracts | | $ | — | | | $ | — | | | $ | — | | | $ | (10,020 | ) | | $ | — | | | $ | (10,020 | ) |
Realized Gain (Loss)
| | | | | | | | | | | | | | | | | | | | | | | | |
| | | Interest
Rate
Contracts
Risk | | | Foreign
Exchange
Contracts
Risk | | | Credit
Contracts
Risk | | | Equity
Contracts
Risk | | | Commodity
Contracts
Risk | | | Total | |
| | | | | | | | | | | | | | | | | | | | | | | | |
State Street U.S. Equity V.I.S. Fund | | | | | | | | | | | | | | | | | | | | | | | | |
Futures contracts | | $ | — | | | $ | — | | | $ | — | | | $ | 2,165 | | | $ | — | | | $ | 2,165 | |
Net Change in Unrealized Appreciation (Depreciation)
| | | | | | | | | | | | | | | | | | | | | | | | |
| | | Interest
Rate
Contracts
Risk | | | Foreign
Exchange
Contracts
Risk | | | Credit
Contracts
Risk | | | Equity
Contracts
Risk | | | Commodity
Contracts
Risk | | | Total | |
| | | | | | | | | | | | | | | | | | | | | | | | |
State Street U.S. Equity V.I.S. Fund | | | | | | | | | | | | | | | | | | | | | | | | |
Futures contracts | | $ | — | | | $ | — | | | $ | — | | | $ | (10,491 | ) | | $ | — | | | $ | (10,491 | ) |
| 4. | | Fees and Transactions with Affiliates |
Advisory Fee SSGA FM, a registered investment adviser, was retained by the Board to act as investment adviser and administrator of the Fund. SSGA FM’s compensation for investment advisory and administrative services (“Management Fee”) is paid monthly based on the average daily net assets of the Fund at an annualized rate of 0.55%.
| | | | |
| Notes to Financial Statements | | | 17 | |
State Street U.S. Equity V.I.S. Fund
Notes to Financial Statements, continued — December 31, 2018
Custody, Fund Accounting andSub-Administration Fees State Street Bank and Trust Company (“State Street”) serves as the custodian, fund accountant andsub-administrator to the Fund. Amounts paid by the Fund to State Street for performing such services are included custody, fund accounting andsub-administration fees on the Statement of Operations.
Other Transactions with Affiliates The Fund may invest in affiliated entities, including securities issued by State Street, affiliated funds, or entities deemed to be affiliates as a result of the Fund owning more than five percent of the entity’s voting securities or outstanding shares. Amounts relating to these transactions during the fiscal year ended December 31, 2018 are disclosed in the Schedule of Investments.
The fees and expenses of the Company’s directors who are not “interested persons” of the Company, as defined in the 1940 Act (“Independent Directors”) are paid directly by the Fund. The Independent Directors are reimbursed for travel and otherout-of-pocket expenses in connection with meeting attendance and industry seminars.
| 6. | | Investment Transactions |
Purchases and sales of investments (excludingin-kind transactions, short term investments and derivative contracts) for the fiscal year ended December 31, 2018 were as follows:
| | | | | | | | |
| Non-U.S. Government Securities |
| Purchases | | Sales |
| | | | | | | | | |
| | $ | 10,944,678 | | | | $ | 14,571,772 | |
The Fund has qualified and intends to continue to qualify as a regulated investment company under Subchapter M of the Internal Revenue Code of 1986, as amended. The Fund will not be subject to federal income taxes to the extent it distributes its taxable income, including any net realized capital gains, for each fiscal year. Therefore, no provision for federal income tax is required.
The Fund files federal and various state and local tax returns as required. No income tax returns are currently under examination. Generally, the federal returns are subject to examination by the Internal Revenue Service for a period of three years from date of filing, while the state returns may remain open for an additional year depending upon jurisdiction. SSGA FM has analyzed the Fund’s tax positions taken on tax returns for all open years and does not believe there are any uncertain tax positions that would require recognition of a tax liability.
Distributions to shareholders are recorded onex-dividend date. Income dividends and gain distributions are determined in accordance with income tax rules and regulations, which may differ from generally accepted accounting principles. Certain capital accounts in the financial statements have been adjusted for permanentbook-tax differences. These adjustments have no impact on net asset values or results of operations. Temporarybook-tax differences will reverse in the future. These book tax differences are primarily due to differing treatments for foreign currency gains and losses, futures contracts, nontaxable dividends, and wash sale loss deferrals.
The tax character of distributions paid during the year ended December 31, 2018 was as follows:
| | | | | | | | | | | | | |
Ordinary
Income | | Long-Term
Capital Gains | | Total |
| | | | | | | | | | | | | | |
| | $ | 235,762 | | | | $ | 2,293,131 | | | | $ | 2,528,893 | |
The tax character of distributions paid during the year ended December 31, 2017 was as follows:
| | | | | | | | | | | | | |
Ordinary
Income | | Long-Term
Capital Gains | | Total |
| | | | | | | | | | | | | | |
| | $ | 906,431 | | | | $ | 2,578,380 | | | | $ | 3,484,811 | |
| | |
| 18 | | Notes to Financial Statements |
State Street U.S. Equity V.I.S. Fund
Notes to Financial Statements, continued — December 31, 2018
At December 31, 2018 the components of distributable earnings on a tax basis were as follows:
| | | | | | | | | | | | | | | | | | | | | | | | | | | | |
Undistributed
Ordinary
Income | | Capital Loss
Carryforwards | | Undistributed
long term gain | | Net Unrealized
Gains (Losses) | | Qualified
Late-Year
Losses | | Total |
| | | | | | | | | | | | | | | | | | | | | | | | | | | | | |
| | $ | 6,559 | | | | $ | — | | | | $ | 220,619 | | | | $ | 2,513,605 | | | | $ | — | | | | $ | 2,740,783 | |
As of December 31, 2018, gross unrealized appreciation and gross unrealized depreciation of investments and other financial instruments based on cost for federal income tax purposes were as follows:
| | | | | | | | | | | | | | | | | | |
Tax
Cost | | Gross
Unrealized
Appreciation | | Gross
Unrealized
Depreciation | | Net Unrealized
Appreciation
(Depreciation) |
| | | | | | | | | | | | | | | | | | | |
| | $ | 20,958,194 | | | | $ | 3,910,156 | | | | $ | 1,396,551 | | | | $ | 2,513,605 | |
The Fund and other affiliated funds (each, a “Participant” and collectively, the “Participants”) participate in a $500 million revolving credit facility provided by a syndication of banks under which the Participants may borrow to fund shareholder redemptions. This agreement expires in October 2019 unless otherwise extended or renewed.
The Participants are charged an annual commitment fee which is calculated based on the unused portion of the shared credit line. Commitment fees are allocated among each of the Participants based on relative net assets. Commitment fees are ordinary fund operating expenses paid by the Adviser. A Participant incurs and pays the interest expense related to its borrowing. Interest is calculated at a rate per annum equal to the sum of 1% plus the greater of the New York Fed Bank Rate and1-month LIBOR rate.
The Fund had no outstanding loans as of December 31, 2018.
Concentration Risk As a result of the Fund’s ability to invest a large percentage of its assets in obligations of issuers within the same country, state, region, currency or economic sector, an adverse economic, business or political development may affect the value of the Fund’s investments more than if the Fund were more broadly diversified.
Market and Credit Risk In the normal course of business, the Fund trades financial instruments and enters into financial transactions where risk of potential loss exists due to changes in the general economic conditions and fluctuations of the market (market risk). Additionally, the Fund may also be exposed to credit risk in the event that an issuer or guarantor fails to perform or that an institution or entity with which the Fund has unsettled or open transactions defaults.
| 10. | | New and Recent Accounting Pronouncements |
In August 2018, the Securities and Exchange Commission released its Final Rule on Disclosure Update and Simplification (the “Final Rule”) which is intended to simplify an issuer’s disclosure compliance efforts by removing redundant or outdated disclosure requirements without significantly altering the mix of information provided to investors. The Fund has adopted the Final Rule for the current period with the most notable impacts being that the Fund is no longer required to present components of distributable earnings on the Statement of Assets and Liabilities or the sources of distributions to shareholders and the amount of undistributed net investment income on the Statements of Changes in Net Assets.
Management has evaluated the impact of all subsequent events on the Fund through the date on which the financial statements were available to be issued and has determined that there were no subsequent events requiring adjustment or disclosure in the financial statements.
| | | | |
| Notes to Financial Statements | | | 19 | |
State Street U.S. Equity V.I.S. Fund
Report of Independent Registered Public Accounting Firm
To the Shareholders and the Board of Directors of State Street U.S. Equity V.I.S. Fund
Opinion on the Financial Statements
We have audited the accompanying statement of assets and liabilities of State Street U.S. Equity V.I.S. Fund (the “Fund”) (one of the funds constituting State Street Variable Insurance Series Funds, Inc. (the “Company”)), including the schedule of investments, as of December 31, 2018, and the related statement of operations for the year then ended, the statement of changes in net assets for each of the two years in the period then ended, the financial highlights for each of the three years in the period then ended and the related notes (collectively referred to as the “financial statements”). In our opinion, the financial statements present fairly, in all material respects, the financial position of the Fund (one of the funds constituting State Street Variable Insurance Series Funds, Inc.) at December 31, 2018, the results of its operations for the year then ended, the changes in its net assets for each of the two years in the period then ended and its financial highlights for each of the three years in the period then ended, in conformity with U.S. generally accepted accounting principles. The financial highlights for periods ended prior to January 1, 2016 were audited by another independent registered public accounting firm whose report, dated February 19, 2016, expressed an unqualified opinion on those financial highlights.
Basis for Opinion
These financial statements are the responsibility of the Company’s management. Our responsibility is to express an opinion on the Fund’s financial statements based on our audits. We are a public accounting firm registered with the Public Company Accounting Oversight Board (United States) (“PCAOB”) and are required to be independent with respect to the Company in accordance with the U.S. federal securities laws and the applicable rules and regulations of the Securities and Exchange Commission and the PCAOB.
We conducted our audits in accordance with the standards of the PCAOB. Those standards require that we plan and perform the audit to obtain reasonable assurance about whether the financial statements are free of material misstatement, whether due to error or fraud. The Company is not required to have, nor were we engaged to perform, an audit of the Company’s internal control over financial reporting. As part of our audits we are required to obtain an understanding of internal control over financial reporting, but not for the purpose of expressing an opinion on the effectiveness of the Company’s internal control over financials reporting. Accordingly, we express no such opinion.
Our audits included performing procedures to assess the risks of material misstatement of the financial statements, whether due to error or fraud, and performing procedures that respond to those risks. Such procedures included examining, on a test basis, evidence regarding the amounts and disclosures in the financial statements. Our procedures included confirmation of securities owned as of December 31, 2018, by correspondence with the custodian, brokers and others or by other appropriate auditing procedures where replies from brokers and others were not received. Our audits also included evaluating the accounting principles used and significant estimates made by management, as well as evaluating the overall presentation of the financial statements. We believe that our audits provide a reasonable basis for our opinion.

We have served as the auditor of one or more State Street Global Advisors investment companies since 2000.
Boston, Massachusetts
February 19, 2019
| | |
| 20 | | Report of Independent Registered Public Accounting Firm |
State Street U.S. Equity V.I.S. Fund
Tax Information — December 31, 2018 (Unaudited)
For federal income tax purposes, the following information is furnished with respect to the distributions of the Fund for its fiscal year ended December 31, 2018.
Dividends Received Deduction
The Fund reports the maximum amount allowable of its net taxable income as eligible for the corporate dividends received deduction.
Long Term Capital Gain Distributions
Long term capital gains dividends were paid from the Fund during the year ended December 31, 2018 in the amount of $2,293,131.
State Street U.S. Equity V.I.S. Fund
Special Meeting of Shareholders — Voting Results
A special meeting of shareholders of State Street Variable Insurance Series Funds, Inc. (the “Company”) was held on January 10, 2019 to elect the following six nominees as Directors of the Company: Michael F. Holland, Michael A. Jessee, Ellen M. Needham, Patrick J. Riley, Richard D. Shirk and Rina K. Spence. At the meeting the following votes were recorded:
| | | | | | | | |
| Nominee | | Shares For | | | Shares Withheld | |
Michael F. Holland | | | 91,260,156.834 | | | | 2,655,810.669 | |
Michael A. Jessee | | | 91,345,936.433 | | | | 2,570,031.070 | |
Ellen M. Needham | | | 91,642,423.619 | | | | 2,273,543.884 | |
Patrick J. Riley | | | 91,136,965.946 | | | | 2,779,001.557 | |
Richard D. Shirk | | | 91,293,712.247 | | | | 2,622,255.256 | |
Rina K. Spence | | | 90,957,562.624 | | | | 2,958,404.879 | |
The other Directors whose term of office continued after the meeting are as follows: Jeanne M. La Porta, John R. Costantino and Donna M. Rapaccioli.
| | |
| 22 | | Special Meeting of Shareholders — Voting Results |
State Street U.S. Equity V.I.S. Fund
Other Information — December 31, 2018 (Unaudited)
| | | | | | | | | | | | |
| | | | | | |
Name, Address, and Year of Birth | | Position(s) Held with Fund | | Term of
Office and
Length of
Time Served | | Principal Occupation
During Past Five Years and Relevant Experience | | Number of
Funds
in Fund
Complex
Overseen
by Director† | | | Other Directorships
Held by Director During Past Five Years |
INDEPENDENT DIRECTORS |
Michael F. Holland c/o SSGA Funds Management, Inc. One Iron Street Boston, MA 02210 YOB: 1944 | | Director and Co-Chairperson of the Board | | Term: Indefinite Elected: 1/19 | | Chairman, Holland & Company L.L.C. (investment adviser) (1995 – present). | | | 67 | | | Director, the Holland Series Fund, Inc.; Director, The China Fund, Inc.; Director, The Taiwan Fund, Inc. (2007 – 2017); Director, Reaves Utility Income Fund, Inc.; and Director, Blackstone/GSO Loans (and Real Estate) Funds. |
| |
Patrick J. Riley c/o SSGA Funds Management, Inc. One Iron Street Boston, MA 02210 YOB: 1948 | | Director and Co-Chairperson of the Board | | Term: Indefinite Elected: 1/19 | | 2002 to May 2010, Associate Justice of the Superior Court, Commonwealth of Massachusetts; 1985 to 2002, Partner, Riley, Burke & Donahue, L.L.P. (law firm); 1998 to Present, Independent Director, State Street Global Advisers Ireland, Ltd. (investment company); 1998 to Present, Independent Director, SSGA Liquidity plc (formerly, SSGA Cash Management Fund plc); January 2009 to Present, Independent Director, SSGA Fixed Income plc; and January 2009 to Present, Independent Director, SSGA Qualified Funds PLC. | | | 67 | | | Board Director and Chairman, SPDR Europe 1PLC Board (2011 – Present); Board Director and Chairman, SPDR Europe II, PLC (2013 – Present). |
| |
John R. Costantino c/o SSGA Funds Management, Inc. One Iron Street Boston, MA 02210 YOB: 1946 | | Director and Co-Chairperson of the Qualified Legal and Compliance Committee | | Term: Indefinite Elected: 1997 | | Managing General Partner, NGN Capital LLC (2006 – present); and Managing Director, Vice President of Walden Capital Management (1996 – present). | | | 67 | | | Director of Kleinfeld Bridal Corp. (March 2016 – present);Trustee of Neuroscience Research Institute (1986 – present); Trustee of Fordham University (1989 – 1995 and 2001 – 2007) and Trustee Emeritus (2007 – present); Trustee of GE Funds (1993 – February 2011); Director of Artes Medical (2006 – 2008); and Trustee of Gregorian University Foundation (1992 – 2007). |
| |
Donna M. Rapaccioli c/o SSGA Funds Management, Inc. One Iron Street Boston, MA 02210 YOB: 1962 | | Director and Co-Chairperson of the Audit Committee | | Term: Indefinite Elected: 1/12 | | Dean of the Gabelli School of Business (2007 – present) and Accounting Professor (1987 – present) at Fordham University. | | | 67 | | | Director- Graduate Management Admissions Council (2015 – present); Trustee of Emmanuel College (2010 – present). |
State Street U.S. Equity V.I.S. Fund
Other Information, continued — December 31, 2018 (Unaudited)
| | | | | | | | | | | | |
| | | | | | |
Name, Address, and Year of Birth | | Position(s) Held with Fund | | Term of
Office and
Length of
Time Served | | Principal Occupation
During Past Five Years and Relevant Experience | | Number of
Funds
in Fund
Complex
Overseen
by Director† | | | Other Directorships
Held by Director During Past Five Years |
INDEPENDENT DIRECTORS (continued) |
Richard D. Shirk c/o SSGA Funds Management, Inc. One Iron Street Boston, MA 02210 YOB: 1945 | | Director andCo-Chairperson of the Qualified Legal and Compliance Committee | | Term: Indefinite Elected: 1/19 | | March 2001 to April 2002, Chairman (1996 to March 2001, President and Chief Executive Officer), Cerulean Companies, Inc. (holding company) (Retired); 1992 to March 2001, President and Chief Executive Officer, Blue Cross Blue Shield of Georgia (health insurer, managed healthcare). | | | 67 | | | 1998 to December 2008, Chairman, Board Member and December 2008 to Present, Investment Committee Member, Healthcare Georgia Foundation (private foundation); September 2002 to 2012, Lead Director and Board Member, Amerigroup Corp. (managed health care); 1999 to 2013, Board Member and (since 2001) Investment Committee Member, Woodruff Arts Center; and 2003 to 2009, Trustee, Gettysburg College; Board member, Aerocare Holdings, Regenesis Biomedical Inc. |
| |
Rina K. Spence c/o SSGA Funds Management, Inc. One Iron Street Boston, MA 02210 YOB: 1948 | | Director andCo-Chairperson of the Audit Committee, Chairperson of the Nominating Committee and Chairperson of the Governance Committee | | Term: Indefinite Elected: 1/19 | | President of SpenceCare International LLC (international healthcare consulting) (1999 – present); Chief Executive Officer, IEmily.com (health internet company) (2000 – 2001); Chief Executive Officer of Consensus Pharmaceutical, Inc. (1998 – 1999); Founder, President and Chief Executive Officer of Spence Center for Women’s Health (1994 –1998); President and CEO, Emerson Hospital (1984 – 1994); Honorary Consul for Monaco in Boston (2015 – present). | | | 67 | | | None |
| |
Michael A. Jessee c/o SSGA Funds Management, Inc. One Iron Street Boston, MA 02210 YOB: 1946 | | Director andCo-Chairperson of the Valuation Committee | | Term: Indefinite Elected: 1/19 | | Retired; formerly, President and Chief Executive Officer of the Federal Home Loan Bank of Boston (1989 – 2009); Trustee, Randolph-Macon College (2004 – 2016). | | | 67 | | | None |
State Street U.S. Equity V.I.S. Fund
Other Information, continued — December 31, 2018 (Unaudited)
| | | | | | | | | | | | |
| | | | | | |
Name, Address, and Year of Birth | | Position(s) Held with Fund | | Term of
Office and
Length of
Time Served | | Principal Occupation
During Past Five Years and Relevant Experience | | Number of
Funds
in Fund
Complex
Overseen
by Director† | | | Other Directorships
Held by Director During Past Five Years |
INTERESTED DIRECTORS(1) |
Jeanne M. La Porta(2) SSGA Funds Management, Inc. 1600 Summer St. Stamford, CT 06905 YOB: 1965 | | Director and President | | Time Indefinite Elected: 3/14 | | Senior Managing Director at State Street Global Advisors (July 2016 – present); Director of State Street Global Advisors Funds Distributors, LLC (May 2017 – present); President of GE Retirement Savings Plan Funds (July 2016 – present); Senior Vice President and Commercial Operations Leader at GE Asset Management Incorporated (“GEAM”) (March 2014 – July 2016); President of State Street Institutional Funds and State Street Variable Insurance Series Funds, Inc. (April 2014 – present); President and Trustee. | | | 18 | | | None |
| |
Ellen M. Needham(3) SSGA Funds Management, Inc. One Iron Street Boston, MA 02210 YOB: 1967 | | Director | | Time Indefinite Elected: 1/19 | | President and Director, SSGA FM (2001 – present)*; Senior Managing Director, State Street Global Advisors (1992 – present)*; Director, State Street Global Advisors Funds Distributors, LLC (May 2017 – present).* | | | 67 | | | None |
| (1) | | The individuals listed below are Directors who are “interested persons,” as defined in the 1940 Act, of the Company (“Interested Directors”). |
| (2) | | Ms. La Porta is an Interested Director because of her employment by SSGA Funds Management, Inc., an affiliate of the Company. |
| (3) | | Ms. Needham is an Interested Director because of her employment by SSGA Funds Management, Inc., an affiliate of the Company. |
| * | | Served in various capacities and/or with various affiliated entities during noted time period |
| † | | For the purpose of determining the number of portfolios overseen by the Directors, “Fund Complex” comprises registered investment companies for which SSGA FM serves as investment adviser. |
The following lists the principal officers for the Company, as well as their mailing addresses and ages, positions with the Company and length of time served, and present and principal occupations:
| | | | | | |
| | | | |
Name, Address, and Year of Birth | | Position(s) Held with Fund | | Term of Office and Length of Time Served | | Principal Occupation During Past Five Years |
OFFICERS: | | | | | | |
Jeanne M. La Porta SSGA Funds Management, Inc. 1600 Summer St. Stamford, CT 06905 YOB: 1965 | | President and Director | | Term: Indefinite Elected: 3/14 | | Senior Managing Director at State Street Global Advisors (July 2016 – present); Director of State Street Global Advisors Funds Distributors, LLC (May 2017 – present); President of GE Retirement Savings Plan Funds (July 2016 – present); Senior Vice President and Commercial Operations Leader at GE Asset Management Incorporated (“GEAM”) (March 2014 – July 2016); President of State Street Institutional Funds and State Street Variable Insurance Series Funds, Inc. (April 2014 – present); President and Trustee. |
State Street U.S. Equity V.I.S. Fund
Other Information, continued — December 31, 2018 (Unaudited)
| | | | | | |
| | | | |
Name, Address, and Year of Birth | | Position(s) Held with Fund | | Term of Office and Length of Time Served | | Principal Occupation During Past Five Years |
OFFICERS (continued): | | | | | | |
Arthur A. Jensen SSGA Funds Management, Inc. 1600 Summer Street Stamford, CT 06905 YOB: 1966 | | Treasurer | | Term: Indefinite Elected: 6/11 | | Vice President, State Street Global Advisors and SSGA Funds Management, Inc. (July 2016 – present); Deputy Treasurer of Elfun Funds (July 2016 – present); Treasurer of State Street Institutional Funds, State Street Variable Insurance Series Funds, Inc. and GE Retirement Savings Plan Funds (June 2011 – present); Treasurer of Elfun Funds (June 2011 – July 2016); Mutual Funds Controller of GE Asset Management Incorporated (April 2011 – July 2016). |
| |
Brian Harris SSGA Funds Management, Inc. One Iron Street Boston, MA 02210 YOB: 1973 | | Chief Compliance Officer and Anti-Money Laundering Officer | | Term: Indefinite Elected: 6/16 | | Managing Director, State Street Global Advisors and SSGA Funds Management, Inc. (2013 – Present); Senior Vice President and Global Head of Investment Compliance, BofA Global Capital Management (September 2010 – May 2013). |
| |
Bruce S. Rosenberg SSGA Funds Management, Inc. One Iron Street Boston, MA 02210 YOB: 1961 | | Assistant Treasurer | | Term: Indefinite Elected: 6/16 | | Managing Director, State Street Global Advisors and SSGA Funds Management, Inc. (July 2015 – present); Director, Credit Suisse (April 2008 – July 2015). |
| |
Ann M. Carpenter SSGA Funds Management, Inc. One Iron Street Boston, MA 02210 YOB: 1966 | | Assistant Treasurer | | Term: Indefinite Elected: 6/16 | | Chief Operating Officer, SSGA Funds Management, Inc. (April 2005 – present) *; Managing Director, State Street Global Advisors. (2005 – present).* |
| |
Chad C. Hallett SSGA Funds Management, Inc. One Iron Street Boston, MA 02210 YOB: 1969 | | Assistant Treasurer | | Term: Indefinite Elected: 6/16 | | Vice President, State Street Global Advisors and SSGA Funds Management, Inc. (November 2014 – present); Vice President, State Street Bank and Trust Company (2001 – November 2014).* |
| |
Darlene Anderson-Vasquez SSGA Funds Management, Inc. One Iron Street Boston, MA 02210 YOB: 1968 | | Assistant Treasurer | | Term: Indefinite Elected: 3/17 | | Managing Director, State Street Global Advisors and SSGA Funds Management, Inc. (May 2016 – present); Senior Vice President, John Hancock Investments (September 2007 – May 2016). |
| |
Daniel G. Plourde SSGA Funds Management, Inc. One Iron Street Boston, MA 02210 YOB: 1980 | | Assistant Treasurer | | Term: Indefinite Elected: 6/17 | | Vice President, State Street Global Advisors and SSGA Funds Management, Inc. (May 2015 – present); Officer, State Street Bank and Trust Company (March 2009 – May 2015). |
State Street U.S. Equity V.I.S. Fund
Other Information, continued — December 31, 2018 (Unaudited)
| | | | | | |
| | | | |
Name, Address, and Year of Birth | | Position(s) Held with Fund | | Term of Office and Length of Time Served | | Principal Occupation During Past Five Years |
OFFICERS (continued): | | | | | | |
Jesse D. Hallee State Street Bank and Trust Company 100 Summer Street, 7th Floor Boston, MA 02111-2900 YOB: 1976 | | Secretary | | Term: Indefinite Elected: 3/17 | | Vice President and Managing Counsel, State Street Bank and Trust Company (2013 – present); Vice President and Counsel, Brown Brothers Harriman & Co. (2007 – 2013). |
| * | Served in various capacities and/or with various affiliated entities during noted time period. |
State Street U.S. Equity V.I.S. Fund
Other Information, continued — December 31, 2018 (Unaudited)
Proxy Voting Policies and Procedures and Record
The Fund has adopted the proxy voting policies of SSGA FM. A description of the policies and procedures that the Fund has adopted to determine how to vote proxies relating to portfolio securities is available (i) without charge, upon request, by calling1-800-242-0134, (ii) on the Fund’s website at http://www.ssga.com/geam, or (iii) on the SEC’s website at www.sec.gov. Information regarding how the Fund voted proxies, if any, during the most recent 12-month period ended June 30 is available by August 31 of each year without charge (1) by calling 1-800-242-0134 (toll free), and (2) on the website of the SEC at www.sec.gov.
Quarterly Portfolio Schedule
The Fund files its complete schedule of investments with the SEC for the first and third quarters of each fiscal year on Form N-Q. The Fund’s Forms N-Q are available (i) without charge, upon request, by calling 1-800-242-013, (ii) on the Fund’s website at http://www.ssga.com/geam, or (iii) on the SEC’s website at www.sec.gov.
Directors
Michael F. Holland, Co-Chairperson
Patrick J. Riley, Co-Chairperson
John R. Costantino
Donna M. Rapaccioli
Michael A. Jessee
Richard D. Shirk
Rina K. Spence
Jeanne M. La Porta
Ellen M. Needham
Officers
Jeanne M. La Porta, President
Arthur Jensen, Treasurer
Brian Harris, Chief Compliance Officer and Anti-Money Laundering Officer
Bruce S. Rosenberg, Assistant Treasurer
Ann M. Carpenter, Assistant Treasurer
Chad C. Hallett, Assistant Treasurer
Darlene Anderson-Vasquez, Assistant Treasurer
Daniel G. Plourde, Assistant Treasurer
Jesse Hallee, Secretary
Investment Adviser and Administrator
SSGA Funds Management, Inc.
One Iron Street
Boston, MA 02210
Custodian and Sub-Administrator
State Street Bank and Trust Company
One Lincoln Street
Boston, Massachusetts 02111
Distributor
State Street Global Advisors Funds Distributors, LLC
One Iron Street
Boston, MA 02210
Independent Registered Public Accounting Firm
Ernst & Young LLP
200 Clarendon Street
Boston, Massachusetts 02116
Annual Report
December 31, 2018
State Street Premier Growth Equity V.I.S. Fund
Beginning on January 1, 2021, as permitted by regulations adopted by the Securities and Exchange Commission, paper copies of a Fund’s annual and semi-annual shareholder reports will no longer be sent by mail, unless you specifically request paper copies of the reports from the Fund (or from your financial intermediary, such as a broker-dealer or bank). Instead, the reports will be made available on a Fund’s website (www.ssga.com/geam), and you will be notified by mail each time a report is posted, and provided with a website link to access the report.
Beginning on January 1, 2019, you may elect to receive all future reports in paper free of charge. If you invest through a financial intermediary, you can contact your financial intermediary to request that you continue to receive paper copies of your shareholder reports. Your election to receive reports in paper will apply to all funds held in your account, if you invest through your financial intermediary or all funds held with the fund complex if you invest directly with a Fund.

State Street Premier Growth Equity V.I.S. Fund
Annual Report
December 31, 2018
Table of Contents
This report is prepared for Policyholders of certain variable contracts and may be distributed to others only if preceded or accompanied by the variable contract’s current prospectus and the current summary prospectus of the Fund available for investments thereunder.
State Street Premier Growth Equity V.I.S. Fund
Notes to Performance — December 31, 2018 (Unaudited)
The information provided on the performance pages relates to the State Street Premier Growth Equity V.I.S. Fund (the “Fund”).
Total return performance shown in this report for the Fund takes into account changes in share price and assumes reinvestment of dividends and capital gains distributions, if any. Total returns shown are net of Fund fees and expenses but do not reflect fees and charges associated with the variable contracts such as administrative fees, account charges and surrender charges, which, if reflected, would reduce the Fund’s total returns for all periods shown.
The performance data quoted represents past performance; past performance does not guarantee future results. Investment return and principal value will fluctuate so your shares, when redeemed, may be worth more or less than their original cost. Current performance may be higher or lower than the performance data quoted. Periods less than one year are not annualized. Please call toll-free (800) 242-0134 or visit the Fund’s website at http://www.ssga.com/geam for the most recent month-end performance data.
An investment in the Fund is not a deposit of any bank and is not insured or guaranteed by the Federal Deposit Insurance Corporation (“FDIC”) or any other government agency. An investment in the Fund is subject to risk, including possible loss of principal invested.
The S&P 500® Index is an unmanaged, market capitalization-weighted index of stocks of 500 large U.S. companies, which is widely used as a measure of large-cap U.S. stock market performance.
The Russell 1000® Growth Index measures the performance of the large-cap growth segment of the U.S. equity universe. It includes those companies in the Russell 1000® Index (which measures the entire U.S. equity large-cap segment) with higher price-to-book ratios and higher forecasted growth values. It is a subset of the Russell 3000® Index and includes approximately 1,000 of the largest securities based on a combination of their market cap and current index membership.
The results shown for the foregoing indices assume the reinvestment of net dividends or interest and do not reflect fees, expenses, or taxes. As such, the index returns do not reflect the actual cost of investing in the instruments that comprise each index.
The views expressed in this document reflect our judgment as of the publication date and are subject to change at any time without notice.
State Street Global Advisors Funds Distributors, LLC, member of FINRA & SIPC is the principal underwriter and distributor of the State Street V.I.S. Funds and an indirect wholly-owned subsidiary of State Street Corporation. References to State Street may include State Street Corporation and its affiliates. The Funds pay State Street Bank and Trust Company for its services as custodian and Fund Accounting agent, and pay SSGA Funds Management, Inc. for investment advisory and administrative services.
State Street Premier Growth Equity V.I.S. Fund
Management Discussion of Fund Performance — December 31, 2018 (Unaudited)
The State Street Premier Growth Equity V.I.S. Fund (the “Fund”) seeks to provide long-term growth of capital and future income rather than current income. The Fund’s benchmarks are the Russell 1000 Growth Index and the S&P 500 Index (the “Indices”).
For the12-month period ended December 31, 2018 (the “Reporting Period”), the total return for the Fund was-2.66% and the returns for the Russell 1000 Growth Index and the S&P 500 Index were-1.51% and -4.38%, respectively. The Fund and Indices’ returns reflect the reinvestment of dividends and other income. The Fund’s performance reflects the expenses of managing the Fund, including brokerage and advisory expenses. The Indices are unmanaged and index returns do not reflect fees and expenses of any kind, which would have a negative impact on returns.
The Fund’s preference for companies with sustainable earnings growth, coupled with mixed stock selection were primary performance drivers during the Reporting Period relative to the Indices. While the Fund’s growth tilt helped its performance relative to the broad S&P 500 Index in a growth market, the Fund was underweighted in some of the high flying tech bellwethers and trimmed exposure to these names over the course of the year as the tech sector outperformed the Russell 1000 Growth Index. Early in the year, high-momentum, expensive growth names drove the Indices higher, and the Fund trimmed its growth names as they advanced, including some of the high-flying technology bellwethers. In fact, the Fund was underweighted in the outperforming tech sector over the course of the year, negatively impacting performance relative to the Russell 1000 Growth Index. In late-year volatility, the Fund’s quality bias contributed to down market protection against falling Indices in the fourth quarter — locking in outperformance vs. the S&P 500 but not enough to pull ahead of the Russell 1000 Growth YTD.
While positive stock selection in Financials and Health Care bolstered relative results, underperformance in the Consumer Discretionary, Industrials and Energy Sectors detracted most from returns.
The Fund used equity futures in order to efficiently manage cash flows during the Reporting Period. The Fund’s use of futures had a negligible impact on Fund performance.
On an individual security level, the top positive contributors to the Fund’s performance on an absolute basis during the Reporting Period were CME Group, Boston Scientific Corp. and Salesforce.com. The top negative contributors to the Fund’s performance on an absolute basis during the Reporting Period were United Rentals Inc., Liberty Global, and Applied Materials Inc.
The views expressed above reflect those of the Fund’s portfolio manager only through the Reporting Period, and do not necessarily represent the views of the Adviser as a whole. Any such views are subject to change at any time based upon market or other conditions and the Adviser disclaims any responsibility to update such views. These views may not be relied on as investment advice and, because investment decisions for a fund are based on numerous factors, may not be relied on as an indication of trading intent on behalf of any fund.
| | |
| 2 | | State Street Premier Growth Equity V.I.S. Fund |
State Street Premier Growth Equity V.I.S. Fund
Understanding Your Fund’s Expenses — December 31, 2018 (Unaudited)
As a shareholder of the Fund, you incur ongoing costs. Ongoing costs include portfolio management fees, professional fees, administrative fees and other Fund expenses. The following example is intended to help you understand your ongoing costs (in dollars) of investing in the Fund and to compare these costs with the ongoing costs of investing in other mutual funds.
To illustrate these ongoing costs, we have provided an example and calculated the expenses paid by investors in the Fund during the period. The information in the following table is based on an investment of $1,000, which is invested at the beginning of the period and held for the entiresix-month period ended December 31, 2018.
Actual Expenses
The first section of the table provides information about actual account values and actual expenses. You may use the information in this section, together with the amount you invested, to estimate the expenses that you paid over the period. To do so, simply divide your account value by $1,000 (for example, an $8,600 account value divided by $1,000 = 8.6), then multiply the result by the number given under the heading “Expenses paid during the period” to estimate the expenses you paid on your account during the period.
Hypothetical Example for Comparison Purposes
The second section of the table provides information about hypothetical account values and hypothetical expenses based on the Fund’s actual expense ratio and an assumed rate of return of 5% per year before expenses, which is not the Fund’s actual return. The hypothetical account values and expenses may not be used to estimate the actual ending account balance or expenses you paid for the period. You may use this information to compare the ongoing costs of investing in the Fund and other funds. To do so, compare this 5% hypothetical example with the 5% hypothetical examples that appear in the shareholder reports of other funds.
Please note that the expenses shown in the table are meant to highlight and help you compare ongoing costs only and do not reflect transaction costs, such as sales charges or redemption fees, if any. Therefore, the second section of the table is useful in comparing ongoing costs only, and will not help you determine the relative total costs of owning different funds. Additionally, the expenses shown do not reflect the fees or charges associated with variable contracts through which shares of the Fund are offered.
| | | | | | | | |
| | | Actual
Fund Return | | | Hypothetical
5% Return
(2.5% for
the period) | |
Actual Fund Return | | | | | | | | |
Beginning Account Value July 1, 2018 | | $ | 1,000.00 | | | $ | 1,000.00 | |
Ending Account Value December 31, 2018 | | $ | 921.20 | | | $ | 1,020.72 | |
Expenses Paid During Period* | | $ | 4.31 | | | $ | 4.53 | |
| * | Expenses are equal to the Fund’s annualized expense ratio of 0.89%** (for the period July 1, 2018-December 31, 2018), multiplied by the average account value over the period, multiplied by 184/365 (to reflect theone-half year period). |
| ** | May differ from expense ratio disclosed in the financial highlights, which is calculated based on the entire fiscal year’s data. |
| | | | |
| State Street Premier Growth Equity V.I.S. Fund | | | 3 | |
State Street Premier Growth Equity V.I.S. Fund
Performance Summary — December 31, 2018 (Unaudited)
Top Ten Largest Holdings
as of December 31, 2018 (as a % of Fair Value)(a)(b)
| | | | |
Microsoft Corp. | | | 7.02 | % |
| |
Apple Inc. | | | 5.80 | % |
| |
Alphabet Inc., Class C | | | 5.29 | % |
| |
Amazon.com Inc. | | | 5.02 | % |
| |
Visa Inc., Class A | | | 5.02 | % |
| |
salesforce.com Inc. | | | 3.72 | % |
| |
The Walt Disney Co. | | | 3.64 | % |
| |
PepsiCo Inc. | | | 3.41 | % |
| |
American Tower Corp. | | | 3.36 | % |
| |
Boston Scientific Corp. | | | 3.31 | % |
| (a) | Fair Value basis is inclusive of short-term investment in State Street Institutional U.S. Government Money Market Fund Class G Shares. |
| (b) | The securities information regarding holdings, allocations and other characteristics is presented to illustrate examples of securities that the Fund has bought and the diversity of areas in which the Fund may invest as of a particular date. It may not be representative of the Fund’s current or future investments and should not be construed as a recommendation to purchase or sell a particular security. |
Sector Allocation as of December 31, 2018
Portfolio composition as a % of Fair Value of $30,413 December 31, 2018(a)(b)
Average Annual Total Return for the periods ended December 31, 2018
Class 1 Shares (Inception date: 12/12/97)
| | | | | | | | | | | | | | | | |
| | | One Year | | | Five Year | | | Ten Year | | | Ending Value
of a $10,000
Investment | |
State Street Premier Growth Equity V.I.S. Fund | | | -2.66 | % | | | 8.56 | % | | | 14.36 | % | | $ | 38,255 | |
S&P 500® Index | | | -4.38 | % | | | 8.50 | % | | | 13.12 | % | | $ | 34,304 | |
| | | | |
Russell 1000® Growth Index | | | -1.51 | % | | | 10.41 | % | | | 15.29 | % | | $ | 41,481 | |
| | |
| 4 | | State Street Premier Growth Equity V.I.S. Fund |
State Street Premier Growth Equity V.I.S. Fund
Performance Summary, continued — December 31, 2018 (Unaudited)
See Notes to Performance beginning on page 1 for further information.
Past performance does not predict future performance. The performance shown in the graphs and tables does not reflect the deduction of taxes that a shareholder would pay on Fund distributions or the redemption of Fund shares and does not reflect the fees or charges that would be associated with variable contracts through which shares of the Fund are offered.
| | | | |
| State Street Premier Growth Equity V.I.S. Fund | | | 5 | |
State Street Premier Growth Equity V.I.S. Fund
Schedule of Investments — December 31, 2018
| | | | | | | | |
| | | Number
of Shares | | | Fair
Value $ | |
| | | | | | | | |
|
| Common Stock - 99.1%† | |
Application Software - 3.7% | |
salesforce.com Inc. (a) | | | 8,267 | | | | 1,132,331 | |
| | | | | | | | |
|
Biotechnology - 6.6% | |
Alexion Pharmaceuticals Inc. (a) | | | 8,292 | | | | 807,309 | |
Biogen Inc. (a) | | | 1,424 | | | | 428,510 | |
Vertex Pharmaceuticals Inc. (a) | | | 4,579 | | | | 758,786 | |
| | | | | | | | |
| | | | 1,994,605 | |
| | | | | | | | |
|
Cable & Satellite - 4.8% | |
Charter Communications Inc., Class A (a) | | | 3,307 | | | | 942,396 | |
Liberty Global PLC, Class C (a) | | | 25,437 | | | | 525,020 | |
| | | | | | | | |
| | | | 1,467,416 | |
| | | | | | | | |
|
Data Processing & Outsourced Services - 5.9% | |
Mastercard Inc., Class A (b) | | | 1,470 | | | | 277,316 | |
Visa Inc., Class A | | | 11,563 | | | | 1,525,622 | |
| | | | | | | | |
| | | | 1,802,938 | |
| | | | | | | | |
|
Electronic Components - 2.4% | |
Corning Inc. | | | 24,535 | | | | 741,202 | |
| | | | | | | | |
|
Financial Exchanges & Data - 5.8% | |
CME Group Inc. | | | 5,277 | | | | 992,709 | |
S&P Global Inc. | | | 4,494 | | | | 763,711 | |
| | | | | | | | |
| | | | 1,756,420 | |
| | | | | | | | |
|
Healthcare Equipment - 4.9% | |
Boston Scientific Corp. (a) | | | 28,523 | | | | 1,008,003 | |
Medtronic PLC | | | 5,347 | | | | 486,363 | |
| | | | | | | | |
| | | | 1,494,366 | |
| | | | | | | | |
|
Healthcare Supplies - 2.1% | |
The Cooper Companies Inc. | | | 2,513 | | | | 639,559 | |
| | | | | | | | |
|
Interactive Media & Services - 9.4% | |
Alphabet Inc., Class A (a) | | | 522 | | | | 545,469 | |
Alphabet Inc., Class C (a) | | | 1,553 | | | | 1,608,302 | |
Facebook Inc., Class A (a) | | | 5,393 | | | | 706,969 | |
| | | | | | | | |
| | | | 2,860,740 | |
| | | | | | | | |
|
Internet & Direct Marketing Retail - 8.3% | |
Alibaba Group Holding Ltd. ADR (a) | | | 2,927 | | | | 401,204 | |
Amazon.com Inc. (a) | | | 1,017 | | | | 1,527,504 | |
Booking Holdings Inc. (a) | | | 344 | | | | 592,512 | |
| | | | | | | | |
| | | | 2,521,220 | |
| | | | | | | | |
|
Investment Banking & Brokerage - 3.1% | |
The Charles Schwab Corp. | | | 22,724 | | | | 943,728 | |
| | | | | | | | |
| | | | | | | | |
| | | Number
of Shares | | | Fair
Value $ | |
Managed Healthcare - 2.7% | |
UnitedHealth Group Inc. | | | 3,335 | | | | 830,815 | |
| | | | | | | | |
|
Movies & Entertainment - 3.7% | |
The Walt Disney Co. | | | 10,088 | | | | 1,106,149 | |
| | | | | | | | |
|
Oil & Gas Equipment & Services - 1.1% | |
Schlumberger Ltd. | | | 9,157 | | | | 330,385 | |
| | | | | | | | |
|
Pharmaceuticals - 2.5% | |
Allergan PLC | | | 5,588 | | | | 746,892 | |
| | | | | | | | |
|
Regional Banks - 2.6% | |
First Republic Bank | | | 9,078 | | | | 788,878 | |
| | | | | | | | |
|
Semiconductor Equipment - 3.0% | |
Applied Materials Inc. | | | 27,491 | | | | 900,055 | |
| | | | | | | | |
|
Soft Drinks - 3.4% | |
PepsiCo Inc. | | | 9,399 | | | | 1,038,402 | |
| | | | | | | | |
|
Specialized REITs - 3.4% | |
American Tower Corp. | | | 6,462 | | | | 1,022,224 | |
| | | | | | | | |
|
Specialty Chemicals - 1.4% | |
Albemarle Corp. | | | 5,292 | | | | 407,854 | |
| | | | | | | | |
|
Systems Software - 9.6% | |
Microsoft Corp. | | | 21,006 | | | | 2,133,579 | |
ServiceNow Inc. (a) | | | 4,419 | | | | 786,803 | |
| | | | | | | | |
| | | | 2,920,382 | |
| | | | | | | | |
|
Technology Hardware, Storage & Peripherals - 5.8% | |
Apple Inc. | | | 11,179 | | | | 1,763,375 | |
| | | | | | | | |
|
Trading Companies & Distributors - 2.9% | |
United Rentals Inc. (a) | | | 8,693 | | | | 891,293 | |
| | | | | | | | |
| |
Total Common Stock
(Cost $21,686,396) | | | | 30,101,229 | |
| | | | | | | | |
|
| Short-Term Investments - 1.0% | |
State Street Institutional U.S. Government Money Market Fund - Class G Shares 2.31%
(Cost $311,364) (c)(d) | | | 311,364 | | | | 311,364 | |
| | | | | | | | |
| |
Total Investments
(Cost $21,997,760) | | | | 30,412,593 | |
| |
| Liabilities in Excess of Other Assets,net - (0.1)% | | | | (43,948 | ) |
| | | | | | | | |
| |
| NET ASSETS - 100.0% | | | | 30,368,645 | |
| | | | | | | | |
See Notes to Schedule of Investments and Notes to Financial Statements.
| | |
| 6 | | State Street Premier Growth Equity V.I.S. Fund |
State Street Premier Growth Equity V.I.S. Fund
Schedule of Investments, continued — December 31, 2018
Other Information:
The Fund had the following short futures contracts open at December 31, 2018:
| | | | | | | | | | | | | | | | | | | | |
| Description | | Expiration
date | | | Number of
Contracts | | | Notional
Amount | | | Value | | | Unrealized
Depreciation | |
| | | | | | | | | | | | | | | | | | | | |
S&P 500 Emini Index Futures | | | March 2019 | | | | 1 | | | $ | (124,410 | ) | | $ | (125,260 | ) | | $ | (850 | ) |
| | | | | | | | | | | | | | | | | | | | |
During the year ended December 31, 2018, average notional values related to long and short futures contracts was $181,590 and $179,458, respectively.
See Notes to Schedule of Investments and Notes to Financial Statements.
| | | | |
| State Street Premier Growth Equity V.I.S. Fund | | | 7 | |
State Street Premier Growth Equity V.I.S. Fund
Notes to Schedule of Investments — December 31, 2018
The views expressed in this document reflect our judgment as of the publication date and are subject to change at any time without notice. The securities cited may not be representative of the Fund’s future investments and should not be construed as a recommendation to purchase or sell a particular security. See the Fund’s summary prospectus and statutory prospectus for complete descriptions of investment objectives, policies, risks and permissible investments.
| (a) | Non-income producing security. |
| (b) | At December 31, 2018, all or a portion of this security was pledged to cover collateral requirements for futures. |
| (c) | Coupon amount represents effective yield. |
| (d) | Sponsored by SSGA Funds Management, Inc., the Fund’s investment adviser and administrator, and an affiliate of State Street Bank & Trust Co., the Fund’ssub-administrator, custodian and accounting agent. |
| † | Percentages are based on net assets as of December 31, 2018. |
Abbreviations:
ADR - American Depositary Receipt
REIT - Real Estate Investment Trust
The following table presents the Fund’s investments measured at fair value on a recurring basis at December 31, 2018:
| | | | | | | | | | | | | | | | |
| Investments | | Level 1 | | | Level 2 | | | Level 3 | | | Total | |
| | | | | | | | | | | | | | | | |
Investments in Securities | | | | | | | | | | | | | | | | |
Common Stock | | $ | 30,101,229 | | | $ | — | | | $ | — | | | $ | 30,101,229 | |
Short-Term Investments | | | 311,364 | | | | — | | | | — | | | | 311,364 | |
| | | | | | | | | | | | | | | | |
Total Investments in Securities | | $ | 30,412,593 | | | $ | — | | | $ | — | | | $ | 30,412,593 | |
| | | | | | | | | | | | | | | | |
Other Financial Instruments | | | | | | | | | | | | | | | | |
Short Futures Contracts - Unrealized Depreciation | | $ | (850 | ) | | $ | — | | | $ | — | | | $ | (850 | ) |
| | | | | | | | | | | | | | | | |
Affiliate Table
| | | | | | | | | | | | | | | | | | | | | | | | | | | | | | | | | | | | |
| | | Number
of Shares
Held at
12/31/17 | | | Value At
12/31/17 | | | Cost of
Purchases | | | Proceeds
from
Shares
Sold | | | Realized
Gain (Loss) | | | Change in
Unrealized
Appreciation/
Depreciation | | | Number
of Shares
Held at
12/31/18 | | | Value at
12/31/18 | | | Dividend
Income | |
| | | | | | | | | | | | | | | | | | | | | | | | | | | | | | | | | | | | |
State Street Institutional U.S. Government Money Market Fund - Class G Shares | | | 1,093,520 | | | $ | 1,093,520 | | | $ | 7,182,383 | | | $ | 7,964,539 | | | | — | | | | — | | | | 311,364 | | | $ | 311,364 | | | $ | 16,716 | |
See Notes to Schedule of Investments and Notes to Financial Statements.
| | |
| 8 | | State Street Premier Growth Equity V.I.S. Fund |
State Street Premier Growth Equity V.I.S. Fund
Financial Highlights
Selected data based on a share outstanding throughout the fiscal years indicated
| | | | | | | | | | | | | | | | | | | | |
| | | 12/31/18 | | | 12/31/17 | | | 12/31/16 | | | 12/31/15* | | | 12/31/14* | |
| Inception date | | | | | | | | | | | | | | | | | | | 12/12/97 | |
| | | | | |
Net asset value, beginning of period | | $ | 99.23 | | | $ | 86.08 | | | $ | 94.07 | | | $ | 106.58 | | | $ | 107.84 | |
| | | | | | | | | | | | | | | | | | | | |
| | | |
Income/(loss) from investment operations: | | | | | | | | | | | | | |
Net investment income | | | 0.12 | (a) | | | 0.32 | (a) | | | 0.50 | | | | 0.52 | | | | 0.63 | |
Net realized and unrealized gains/(losses) on investments | | | (2.88 | ) | | | 24.10 | | | | 1.90 | | | | 3.25 | | | | 14.71 | |
| | | | | | | | | | | | | | | | | | | | |
Total income/(loss) from investment operations | | | (2.76 | ) | | | 24.42 | | | | 2.40 | | | | 3.77 | | | | 15.34 | |
| | | | | | | | | | | | | | | | | | | | |
| | | | | |
Less distributions from: | | | | | | | | | | | | | | | | | | | | |
Net investment income | | | 0.15 | | | | 0.34 | | | | 0.48 | | | | 0.53 | | | | 0.58 | |
Net realized gains | | | 13.81 | | | | 10.93 | | | | 9.91 | | | | 15.75 | | | | 16.02 | |
| | | | | | | | | | | | | | | | | | | | |
Total distributions | | | 13.96 | | | | 11.27 | | | | 10.39 | | | | 16.28 | | | | 16.60 | |
| | | | | | | | | | | | | | | | | | | | |
Net asset value, end of period | | $ | 82.51 | | | $ | 99.23 | | | $ | 86.08 | | | $ | 94.07 | | | $ | 106.58 | |
| | | | | | | | | | | | | | | | | | | | |
Total Return(b) | | | (2.66 | )% | | | 28.34 | % | | | 2.47 | % | | | 3.30 | % | | | 14.05 | % |
| | | | | |
Ratios/Supplemental Data: | | | | | | | | | | | | | | | | | | | | |
Net assets, end of period (in thousands) | | $ | 30,369 | | | $ | 36,404 | | | $ | 33,219 | | | $ | 36,858 | | | $ | 39,944 | |
| | | | | |
Ratios to average net assets: | | | | | | | | | | | | | | | | | | | | |
Net expenses | | | 0.87 | % | | | 0.85 | % | | | 0.84 | % | | | 0.81 | % | | | 0.81 | %(c) |
Gross expenses | | | 0.87 | % | | | 0.85 | % | | | 0.84 | % | | | 0.81 | % | | | 0.81 | % |
Net investment income | | | 0.11 | % | | | 0.31 | % | | | 0.52 | % | | | 0.46 | % | | | 0.52 | % |
Portfolio turnover rate | | | 27 | % | | | 21 | % | | | 22 | % | | | 19 | % | | | 19 | % |
Notes to Financial Highlights
| (a) | | Per share values have been calculated using the average shares method. |
| (b) | | Total returns are historical and assume changes in share price, reinvestment of dividends and capital gains distributions and do not include the effect of insurance contract charges. Past performance does not guarantee future results. |
| (c) | | Includes contractual management fee waiver related to the Fund’s investments in the GE Institutional Money Market Fund (the “Money Market Fund”). The fee waiver agreement was terminated effective June 30, 2014 with the closure of the Money Market Fund. |
| * | | Beginning with the year ended December 31, 2016, the Fund was audited by Ernst & Young LLP. The previous years were audited by another independent registered public accounting firm. |
The accompanying Notes are an integral part of these financial statements.
State Street Premier Growth Equity V.I.S. Fund
Statement of Assets and Liabilities — December 31, 2018
| | | | |
| | | | |
Assets | | | | |
Investments in securities, at fair value (cost $21,686,396) | | $ | 30,101,229 | |
Short-term affiliated investments, at fair value | | | 311,364 | |
Cash | | | 58 | |
Cash collateral on deposit with broker for future contracts | | | 11,934 | |
Receivable for investments sold | | | 31,670 | |
Income receivables | | | 42,766 | |
Receivable for fund shares sold | | | 79 | |
Income receivable from affiliated investments | | | 1,270 | |
| | | | |
| |
Total assets | | | 30,500,370 | |
| | | | |
| |
Liabilities | | | | |
Payable for investments purchased | | | 29,226 | |
Payable for fund shares redeemed | | | 44,668 | |
Payable for accumulated variation margin on futures contracts | | | 848 | |
Payable to the Adviser | | | 16,301 | |
Payable for custody, fund accounting andsub-administration fees | | | 1,493 | |
Accrued other expenses | | | 39,189 | |
| | | | |
| |
Total liabilities | | | 131,725 | |
| | | | |
| | | | |
| |
Net Assets | | $ | 30,368,645 | |
| | | | |
| |
Net Assets Consist of: | | | | |
Capital paid in | | $ | 21,819,589 | |
Total distributable earnings (loss) | | | 8,549,056 | |
| | | | |
| |
Net Assets | | $ | 30,368,645 | |
| | | | |
| | | | |
Shares outstanding ($0.01 par value; unlimited shares authorized) | | | 368,062 | |
Net asset value per share | | $ | 82.51 | |
The accompanying Notes are an integral part of these financial statements.
| | |
| 10 | | Statement of Assets and Liabilities |
State Street Premier Growth Equity V.I.S. Fund
Statement of Operations — For the year ended December 31, 2018
| | | | |
| | | | |
Investment Income | |
Income | |
Dividend | | $ | 339,382 | |
Income from affiliated investments | | | 16,716 | |
| | | | |
Total income | | | 356,098 | |
| | | | |
| |
Expenses | | | | |
Advisory and administration fees | | | 234,395 | |
Directors’ fees | | | 2,833 | |
Custody, fund accounting andsub-administration fees | | | 16,815 | |
Professional fees | | | 37,400 | |
Other expenses | | | 23,796 | |
| | | | |
Total Expenses | | | 315,239 | |
| | | | |
Net investment income | | $ | 40,859 | |
| | | | |
| |
Net Realized and Unrealized Gain (Loss) on Investments | | | | |
Realized gain (loss) on: | | | | |
Unaffiliated investments | | $ | 4,427,482 | |
Futures | | | (27,605 | ) |
Increase (decrease) in unrealized appreciation/depreciation on: | |
Unaffiliated investments | | | (4,978,245 | ) |
Futures | | | (679 | ) |
| | | | |
| |
Net realized and unrealized gain (loss) on investments | | | (579,047 | ) |
| | | | |
| |
Net Decrease in Net Assets Resulting from Operations | | $ | (538,188 | ) |
| | | | |
The accompanying Notes are an integral part of these financial statements.
| | | | |
| Statement of Operations | | | 11 | |
State Street Premier Growth Equity V.I.S. Fund
Statements of Changes in Net Assets
| | | | | | | | |
| | | Year Ended December 31,
2018 | | | Year Ended December 31,
2017 | |
| | | | | | | | |
Increase (Decrease) in Net Assets | |
|
Operations: | |
Net investment income | | $ | 40,859 | | | $ | 112,102 | |
Net realized gain (loss) on investments and futures | | | 4,399,877 | | | | 3,745,553 | |
Net increase (decrease) in unrealized appreciation/depreciation on investments and futures | | | (4,978,924 | ) | | | 4,967,942 | |
| | | | | | | | |
Net increase (decrease) from operations | | | (538,188 | ) | | | 8,825,597 | |
| | | | | | | | |
|
Distributions to shareholders: | |
Total distributions | | | (4,400,219 | ) | | | (3,722,159 | ) |
| | | | | | | | |
Increase (decrease) in assets from operations and distributions | | | (4,938,407 | ) | | | 5,103,438 | |
| | | | | | | | |
|
Share transactions: | |
Proceeds from sale of shares | | | 175,763 | | | | 664,651 | |
Value of distributions reinvested | | | 4,400,219 | | | | 3,722,159 | |
Cost of shares redeemed | | | (5,672,877 | ) | | | (6,305,076 | ) |
| | | | | | | | |
Net increase (decrease) from share transactions | | | (1,096,895 | ) | | | (1,918,266 | ) |
| | | | | | | | |
| | |
Total increase (decrease) in net assets | | | (6,035,302 | ) | | | 3,185,172 | |
|
Net Assets | |
Beginning of year | | | 36,403,947 | | | | 33,218,775 | |
| | | | | | | | |
| | |
End of year | | $ | 30,368,645 | | | $ | 36,403,947 | |
| | | | | | | | |
|
Changes in Fund Shares | |
Shares sold | | | 1,683 | | | | 6,781 | |
Issued for distributions reinvested | | | 53,766 | | | | 37,435 | |
Shares redeemed | | | (54,267 | ) | | | (63,263 | ) |
| | | | | | | | |
Net increase (decrease) in fund shares | | | 1,182 | | | | (19,047 | ) |
| | | | | | | | |
For the year ended December 31, 2017, the source of distributions paid to shareholders was (See Note 10 in the Notes to Financial Statements):
| | | | |
| | | | |
Net investment income | | $ | (112,086 | ) |
Net realized gains | | | (3,610,073 | ) |
| | | | |
Total distributions | | | (3,722,159 | ) |
| | | | |
Undistributed net investment income as of December 31, 2017: | | $ | — | |
The accompanying Notes are an integral part of these financial statements.
| | |
| 12 | | Statements of Changes in Net Assets |
State Street Premier Growth Equity V.I.S. Fund
Notes to Financial Statements — December 31, 2018
| 1. | | Organization of the Company |
State Street Variable Insurance Series Funds, Inc. (the “Company”) was incorporated under the laws of the Commonwealth of Virginia on May 14, 1984 and is registered under the Investment Company Act of 1940, as amended (the “1940 Act”), as anopen-end management investment company. The Company is currently composed of the following seven investment portfolios (collectively, the “Funds”): State Street U.S. Equity V.I.S. Fund, State Street S&P 500 Index V.I.S. Fund, State Street Premier Growth Equity V.I.S. Fund (the “Fund”), State StreetSmall-Cap Equity V.I.S. Fund, State Street Total Return V.I.S. Fund, State Street Income V.I.S. Fund and State Street Real Estate Securities V.I.S. Fund. Each Fund is a diversified investment company within the meaning of the 1940 Act.
Shares of the Funds of the Company are offered only to insurance company separate accounts that fund certain variable life insurance contracts and variable annuity contracts.
The Company currently offers one share class (Class 1) of the Fund as an investment option for variable life insurance and variable annuity contracts.
Under the Company’s organizational documents, its officers and directors are indemnified against certain liabilities arising out of the performance of their duties to the Company. Additionally, in the normal course of business, the Company enters into contracts with service providers that contain general indemnification clauses. The Company’s maximum exposure under these arrangements is unknown as this would involve future claims that may be made against the Company that have not yet occurred.
| 2. | | Summary of Significant Accounting Policies |
The following is a summary of significant accounting policies followed by the Company in the preparation of its financial statements:
The preparation of financial statements in accordance with U.S. generally accepted accounting principles (“U.S. GAAP”) requires management to make estimates and assumptions that affect the reported amounts and disclosures in the financial statements. Actual results could differ from those estimates. The Fund is an investment company under U.S. GAAP and follows the accounting and reporting guidance applicable to investment companies.
Security Valuation The Fund’s investments are valued at fair value each day that the New York Stock Exchange (“NYSE”) is open and, for financial reporting purposes, as of the report date should the reporting period end on a day that the NYSE is not open. Fair value is generally defined as the price a fund would receive to sell an asset or pay to transfer a liability in an orderly transaction between market participants at the measurement date. By its nature, a fair value price is a good faith estimate of the valuation in a current sale and may not reflect an actual market price. The investments of the Fund are valued pursuant to the policy and procedures developed by the Oversight Committee (the “Committee”) and approved by the Company’s Board of Directors (the “Board”). The Committee provides oversight of the valuation of investments for the Fund. The Board has responsibility for overseeing the determination of the fair value of investments.
Valuation techniques used to value the Fund’s investments by major category are as follows:
| | • | | Equity investments (including preferred stocks) traded on a recognized securities exchange for which market quotations are readily available are valued at the last sale price or official closing price, as applicable, on the primary market or exchange on which they trade. Equity investments traded on a recognized exchange for which there were no sales on that day are valued at the last published sale price or at fair value. |
| | • | | Investments in registered investment companies (including money market funds) or other unitized pooled investment vehicles that are not traded on an exchange are valued at that day’s published net asset value (“NAV”) per share or unit. |
| | • | | Exchange-traded futures contracts are valued at the closing settlement price on the primary market on which they are traded most extensively. Exchange-traded futures contracts traded on a recognized exchange for which there were no sales on that day are valued at the last reported sale price obtained from independent pricing services or brokers or at fair value. |
| | | | |
| Notes to Financial Statements | | | 13 | |
State Street Premier Growth Equity V.I.S. Fund
Notes to Financial Statements, continued — December 31, 2018
In the event prices or quotations are not readily available or that the application of these valuation methods results in a price for an investment that is deemed to be not representative of the fair value of such investment, fair value will be determined in good faith by the Committee, in accordance with the valuation policy and procedures approved by the Board.
The Fund values its assets and liabilities at fair value using a fair value hierarchy consisting of three broad levels that prioritize the inputs to valuation techniques giving the highest priority to readily available unadjusted quoted prices in active markets for identical assets or liabilities (Level 1 measurements) and the lowest priority to unobservable inputs (Level 3 measurements) when market prices are not readily available or reliable. The categorization of a value determined for an investment within the hierarchy is based upon the pricing transparency of the investment and is not necessarily an indication of the risk associated with investing in it.
The three levels of the fair value hierarchy are as follows:
| | • | | Level 1 — Unadjusted quoted prices in active markets for an identical asset or liability; |
| | • | | Level 2 — Inputs other than quoted prices included within Level 1 that are observable for the asset or liability either directly or indirectly, including quoted prices for similar assets or liabilities in active markets, quoted prices for identical or similar assets or liabilities in markets that are not considered to be active, inputs other than quoted prices that are observable for the asset or liability (such as exchange rates, financing terms, interest rates, yield curves, volatilities, prepayment speeds, loss severities, credit risks and default rates) or other market-corroborated inputs; and |
| | • | | Level 3 — Unobservable inputs for the asset or liability, including the Committee’s assumptions used in determining the fair value of investments. |
The value of the Fund’s investments according to the fair value hierarchy as of December 31, 2018 is disclosed in the Fund’s Schedule of Investments.
Investment Transactions and Income Recognition Investment transactions are accounted for on trade date for financial reporting purposes. Realized gains and losses from the sale or disposition of investments and foreign exchange transactions, if any, are determined using the identified cost method.
Dividend income and capital gain distributions, if any, are recognized on theex-dividend date, net of any foreign taxes withheld at source, if any.
Interest income is recorded daily on an accrual basis. All premiums and discounts are amortized/accreted for financial reporting purposes.
Non-cash dividends received in the form of stock are recorded as dividend income at fair value.
Expenses Certain expenses, which are directly identifiable to a specific Fund, are applied to the Fund within the Company. Other expenses which cannot be attributed to a specific Fund are allocated in such a manner as deemed equitable, taking into consideration the nature and type of expense and the relative net assets of the Fund within the Company.
Distributions The Fund declares and pays any dividends from net investment income annually.
Net realized capital gains, if any, are distributed annually, unless additional distributions are required for compliance with applicable tax regulations. The amount and character of income and capital gains to be distributed are determined in accordance with applicable tax regulations which may differ from net investment income and realized gains recognized for U.S. GAAP purposes.
| 3. | | Derivative Financial Instruments |
Futures Contracts The Fund may enter into futures contracts to meet the Fund’s objectives. A futures contract is a standardized, exchange-traded agreement to buy or sell a financial instrument at a set price on a future date. Upon entering into a futures contract, the Fund is required to deposit with the broker, cash or securities in an amount equal to the minimum initial margin requirements of the clearing house. Subsequent payments are made or received by the Fund equal to the daily change in the contract value and are recorded as variation margin receivable or payable with a corresponding offset to unrealized gains or losses. The Fund recognizes a realized gain or loss when the contract is closed.
| | |
| 14 | | Notes to Financial Statements |
State Street Premier Growth Equity V.I.S. Fund
Notes to Financial Statements, continued — December 31, 2018
Losses may arise if the value of a futures contract decreases due to unfavorable changes in the market rates or values of the underlying instrument during the term of the contract or if the counterparty does not perform under the contract. The use of futures contracts also involves the risk that the movements in the price of the futures contracts do not correlate with the movement of the assets underlying such contracts.
For the fiscal year ended December 31, 2018, the Fund entered into futures contracts for cash equitization.
The following tables summarize the value of the Fund’s derivative instruments as of December 31, 2018 and the related location in the accompanying Statement of Assets and Liabilities and Statement of Operations, presented by primary underlying risk exposure:
Liability Derivatives
| | | | | | | | | | | | | | | | | | | | | | | | |
| | | Interest
Rate
Contracts
Risk | | | Foreign
Exchange
Contracts
Risk | | | Credit
Contracts
Risk | | | Equity
Contracts
Risk | | | Commodity
Contracts
Risk | | | Total | |
| | | | | | | | | | | | | | | | | | | | | | | | |
State Street Premier Growth Equity V.I.S. Fund | | | | | | | | | | | | | | | | | | | | | | | | |
Futures Contracts | | $ | — | | | $ | — | | | $ | — | | | $ | (848 | ) | | $ | — | | | $ | (848 | ) |
Realized Gain (Loss)
| | | | | | | | | | | | | | | | | | | | | | | | |
| | | Interest
Rate
Contracts
Risk | | | Foreign
Exchange
Contracts
Risk | | | Credit
Contracts
Risk | | | Equity
Contracts
Risk | | | Commodity
Contracts
Risk | | | Total | |
| | | | | | | | | | | | | | | | | | | | | | | | |
State Street Premier Growth Equity V.I.S. Fund | | | | | | | | | | | | | | | | | | | | | | | | |
Futures contracts | | $ | — | | | $ | — | | | $ | — | | | $ | (27,605 | ) | | $ | — | | | $ | (27,605 | ) |
Net Change in Unrealized Appreciation (Depreciation)
| | | | | | | | | | | | | | | | | | | | | | | | |
| | | Interest
Rate
Contracts
Risk | | | Foreign
Exchange
Contracts
Risk | | | Credit
Contracts
Risk | | | Equity
Contracts
Risk | | | Commodity
Contracts
Risk | | | Total | |
| | | | | | | | | | | | | | | | | | | | | | | | |
State Street Premier Growth Equity V.I.S. Fund | | | | | | | | | | | | | | | | | | | | | | | | |
Futures contracts | | $ | — | | | $ | — | | | $ | — | | | $ | (679 | ) | | $ | — | | | $ | (679 | ) |
| 4. | | Fees and Transactions with Affiliates |
Advisory Fee SSGA Funds Management, Inc. (the “Adviser” or “SSGA FM”), a registered investment adviser, was retained by the Board to act as investment adviser and administrator of the Fund. SSGA FM’s compensation for investment advisory and administrative services (“Management Fee”) is paid monthly based on the average daily net assets of the Fund at an annualized rate of 0.65 %.
Custody, Fund Accounting andSub-Administration Fees State Street Bank and Trust Company (“State Street”) serves as the custodian, fund accountant andsub-administrator to the Fund. Amounts paid by the Fund to State Street for performing such services are included custody, fund accounting andsub-administration fees on the Statement of Operations.
Other Transactions with Affiliates The Fund may invest in affiliated entities, including securities issued by State Street, affiliated funds, or entities deemed to be affiliates as a result of the Fund owning more than five percent of the entity’s voting securities or outstanding shares. Amounts relating to these transactions during the fiscal year ended December 31, 2018 are disclosed in the Schedule of Investments.
| | | | |
| Notes to Financial Statements | | | 15 | |
State Street Premier Growth Equity V.I.S. Fund
Notes to Financial Statements, continued — December 31, 2018
The fees and expenses of the Company’s directors who are not “interested persons” of the Company, as defined in the 1940 Act (“Independent Directors”) are paid directly by the Fund. The Independent Directors are reimbursed for travel and otherout-of-pocket expenses in connection with meeting attendance and industry seminars.
| 6. | | Investment Transactions |
Purchases and sales of investments (excludingin-kind transactions, short term investments and derivative contracts) for the fiscal year ended December 31, 2018 were as follows:
| | | | | | | | |
| Non-U.S. Government Securities |
| Purchases | | Sales |
| | | | | | | | | |
| | $ | 9,369,773 | | | | $ | 14,022,828 | |
The Fund has qualified and intends to continue to qualify as a regulated investment company under Subchapter M of the Internal Revenue Code of 1986, as amended. The Fund will not be subject to federal income taxes to the extent it distributes its taxable income, including any net realized capital gains, for each fiscal year. Therefore, no provision for federal income tax is required.
The Fund files federal and various state and local tax returns as required. No income tax returns are currently under examination. Generally, the federal returns are subject to examination by the Internal Revenue Service for a period of three years from date of filing, while the state returns may remain open for an additional year depending upon jurisdiction. SSGA FM has analyzed the Fund’s tax positions taken on tax returns for all open years and does not believe there are any uncertain tax positions that would require recognition of a tax liability.
Distributions to shareholders are recorded onex-dividend date. Income dividends and gain distributions are determined in accordance with income tax rules and regulations, which may differ from generally accepted accounting principles. Certain capital accounts in the financial statements have been adjusted for permanentbook-tax differences. These adjustments have no impact on net asset values or results of operations. Temporarybook-tax differences will reverse in the future. These book tax differences are primarily due to differing treatments for character of distributions, futures contracts, return of capital distributions received, and wash sale loss deferrals.
The tax character of distributions paid during the year ended December 31, 2018 was as follows:
| | | | | | | | | | | | | |
Ordinary
Income | | Long-Term
Capital Gains | | Total |
| | | | | | | | | | | | | | |
| | $ | 95,684 | | | | $ | 4,304,535 | | | | $ | 4,400,219 | |
The tax character of distributions paid during the year ended December 31, 2017 was as follows:
| | | | | | | | | | | | | |
Ordinary
Income | | Long-Term
Capital Gains | | Total |
| | | | | | | | | | | | | | |
| | $ | 159,229 | | | | $ | 3,562,930 | | | | $ | 3,722,159 | |
At December 31, 2018 the components of distributable earnings on a tax basis were as follows:
| | | | | | | | | | | | | | | | | | | | | | | | | | | | |
Undistributed
Ordinary
Income | | Capital Loss
Carryforwards | | Undistributed
long term gain | | Net Unrealized
Gains (Losses) | | Qualified
Late- Year
Losses | | Total |
| | | | | | | | | | | | | | | | | | | | | | | | | | | | | |
| | $ | 106,541 | | | | $ | — | | | | $ | 306,823 | | | | $ | 8,135,692 | | | | $ | — | | | | $ | 8,549,056 | |
As of December 31, 2018, gross unrealized appreciation and gross unrealized depreciation of investments and other financial instruments based on cost for federal income tax purposes were as follows:
| | | | | | | | | | | | | | | | | | |
Tax
Cost | | Gross
Unrealized
Appreciation | | Gross
Unrealized
Depreciation | | Net Unrealized
Appreciation
(Depreciation) |
| | | | | | | | | | | | | | | | | | | |
| | $ | 22,276,051 | | | | $ | 9,790,417 | | | | $ | 1,654,725 | | | | $ | 8,135,692 | |
| | |
| 16 | | Notes to Financial Statements |
State Street Premier Growth Equity V.I.S. Fund
Notes to Financial Statements, continued — December 31, 2018
The Fund and other affiliated funds (each, a “Participant” and collectively, the “Participants”) participate in a $500 million revolving credit facility provided by a syndication of banks under which the Participants may borrow to fund shareholder redemptions. This agreement expires in October 2019 unless otherwise extended or renewed.
The Participants are charged an annual commitment fee which is calculated based on the unused portion of the shared credit line. Commitment fees are allocated among each of the Participants based on relative net assets. Commitment fees are ordinary fund operating expenses paid by the Adviser. A Participant incurs and pays the interest expense related to its borrowing. Interest is calculated at a rate per annum equal to the sum of 1% plus the greater of the New York Fed Bank Rate and1-month LIBOR rate.
The Fund had no outstanding loans as of December 31, 2018.
Concentration Risk As a result of the Fund’s ability to invest a large percentage of its assets in obligations of issuers within the same country, state, region, currency or economic sector, an adverse economic, business or political development may affect the value of the Fund’s investments more than if the Fund were more broadly diversified.
Market and Credit Risk In the normal course of business, the Fund trades financial instruments and enters into financial transactions where risk of potential loss exists due to changes in the general economic conditions and fluctuations of the market (market risk). Additionally, the Fund may also be exposed to credit risk in the event that an issuer or guarantor fails to perform or that an institution or entity with which the Fund has unsettled or open transactions defaults.
| 10. | | New and Recent Accounting Pronouncements |
In August 2018, the Securities and Exchange Commission released its Final Rule on Disclosure Update and Simplification (the “Final Rule”) which is intended to simplify an issuer’s disclosure compliance efforts by removing redundant or outdated disclosure requirements without significantly altering the mix of information provided to investors. The Fund has adopted the Final Rule for the current period with the most notable impacts being that the Fund is no longer required to present components of distributable earnings on the Statement of Assets and Liabilities or the sources of distributions to shareholders and the amount of undistributed net investment income on the Statements of Changes in Net Assets.
Management has evaluated the impact of all subsequent events on the Fund through the date on which the financial statements were available to be issued and has determined that there were no subsequent events requiring adjustment or disclosure in the financial statements.
| | | | |
| Notes to Financial Statements | | | 17 | |
State Street Premier Growth Equity V.I.S. Fund
Report of Independent Registered Public Accounting Firm
To the Shareholders and the Board of Directors of State Street Premier Growth Equity V.I.S. Fund
Opinion on the Financial Statements
We have audited the accompanying statement of assets and liabilities of State Street Premier Growth Equity V.I.S. Fund (the “Fund”) (one of the funds constituting State Street Variable Insurance Series Funds, Inc. (the “Company”)), including the schedule of investments, as of December 31, 2018, and the related statement of operations for the year then ended, the statement of changes in net assets for each of the two years in the period then ended, the financial highlights for each of the three years in the period then ended and the related notes (collectively referred to as the “financial statements”). In our opinion, the financial statements present fairly, in all material respects, the financial position of the Fund (one of the funds constituting State Street Variable Insurance Series Funds, Inc.) at December 31, 2018, the results of its operations for the year then ended, the changes in its net assets for each of the two years in the period then ended and its financial highlights for each of the three years in the period then ended, in conformity with U.S. generally accepted accounting principles. The financial highlights for periods ended prior to January 1, 2016 were audited by another independent registered public accounting firm whose report, dated February 19, 2016, expressed an unqualified opinion on those financial highlights.
Basis for Opinion
These financial statements are the responsibility of the Company’s management. Our responsibility is to express an opinion on the Fund’s financial statements based on our audits. We are a public accounting firm registered with the Public Company Accounting Oversight Board (United States) (“PCAOB”) and are required to be independent with respect to the Company in accordance with the U.S. federal securities laws and the applicable rules and regulations of the Securities and Exchange Commission and the PCAOB.
We conducted our audits in accordance with the standards of the PCAOB. Those standards require that we plan and perform the audit to obtain reasonable assurance about whether the financial statements are free of material misstatement, whether due to error or fraud. The Company is not required to have, nor were we engaged to perform, an audit of the Company’s internal control over financial reporting. As part of our audits we are required to obtain an understanding of internal control over financial reporting, but not for the purpose of expressing an opinion on the effectiveness of the Company’s internal control over financials reporting. Accordingly, we express no such opinion.
Our audits included performing procedures to assess the risks of material misstatement of the financial statements, whether due to error or fraud, and performing procedures that respond to those risks. Such procedures included examining, on a test basis, evidence regarding the amounts and disclosures in the financial statements. Our procedures included confirmation of securities owned as of December 31, 2018, by correspondence with the custodian, brokers and others or by other appropriate auditing procedures where replies from brokers and others were not received. Our audits also included evaluating the accounting principles used and significant estimates made by management, as well as evaluating the overall presentation of the financial statements. We believe that our audits provide a reasonable basis for our opinion.

We have served as the auditor of one or more State Street Global Advisors investment companies since 2000.
Boston, Massachusetts
February 19, 2019
| | |
| 18 | | Report of Independent Registered Public Accounting Firm |
State Street Premier Growth Equity V.I.S. Fund
Tax Information — December 31, 2018 (Unaudited)
For federal income tax purposes, the following information is furnished with respect to the distributions of the Fund for its fiscal year ended December 31, 2018.
Dividends Received Deduction
The Fund reports the maximum amount allowable of its net taxable income as eligible for the corporate dividends received deduction.
Long Term Capital Gain Distributions
Long term capital gains dividends were paid from the Fund during the year ended December 31, 2018 in the amount of $ 4,304,535.
State Street Premier Growth Equity V.I.S. Fund
Special Meeting of Shareholders — Voting Results (Unaudited)
A special meeting of shareholders of State Street Variable Insurance Series Funds, Inc. (the “Company”) was held on January 10, 2019 to elect the following six nominees as Directors of the Company: Michael F. Holland, Michael A. Jessee, Ellen M. Needham, Patrick J. Riley, Richard D. Shirk and Rina K. Spence. At the meeting the following votes were recorded:
| | | | | | | | |
| Nominee | | Shares For | | | Shares Withheld | |
Michael F. Holland | | | 91,260,156.834 | | | | 2,655,810.669 | |
Michael A. Jessee | | | 91,345,936.433 | | | | 2,570,031.070 | |
Ellen M. Needham | | | 91,642,423.619 | | | | 2,273,543.884 | |
Patrick J. Riley | | | 91,136,965.946 | | | | 2,779,001.557 | |
Richard D. Shirk | | | 91,293,712.247 | | | | 2,622,255.256 | |
Rina K. Spence | | | 90,957,562.624 | | | | 2,958,404.879 | |
The other Directors whose term of office continued after the meeting are as follows: Jeanne M. La Porta, John R. Costantino and Donna M. Rapaccioli.
| | |
| 20 | | Special Meeting of Shareholders — Voting Results |
State Street Premier Growth Equity V.I.S. Fund
Other Information — December 31, 2018 (Unaudited)
| | | | | | | | | | | | |
| | | | | | |
Name,
Address,
and Year of Birth | | Position(s) Held
with Fund | | Term of
Office and
Length of Time Served | | Principal Occupation
During Past Five Years and Relevant Experience | | Number of
Funds
in Fund
Complex
Overseen
by Director† | | | Other Directorships Held by Director During Past Five Years |
INDEPENDENT DIRECTORS | | | | | | |
Michael F. Holland c/o SSGA Funds Management, Inc. One Iron Street Boston, MA 02210 YOB: 1944 | | Director and Co-Chairperson of the Board | | Term: Indefinite Elected: 1/19 | | Chairman, Holland & Company L.L.C. (investment adviser) (1995 – present). | | | 67 | | | Director, the Holland Series Fund, Inc.; Director, The China Fund, Inc.; Director, The Taiwan Fund, Inc. (2007 – 2017); Director, Reaves Utility Income Fund, Inc.; and Director, Blackstone/GSO Loans (and Real Estate) Funds. |
| |
Patrick J. Riley c/o SSGA Funds Management, Inc. One Iron Street Boston, MA 02210 YOB: 1948 | | Director and Co-Chairperson of the Board | | Term: Indefinite Elected: 1/19 | | 2002 to May 2010, Associate Justice of the Superior Court, Commonwealth of Massachusetts; 1985 to 2002, Partner, Riley, Burke & Donahue, L.L.P. (law firm); 1998 to Present, Independent Director, State Street Global Advisers Ireland, Ltd. (investment company); 1998 to Present, Independent Director, SSGA Liquidity plc (formerly, SSGA Cash Management Fund plc); January 2009 to Present, Independent Director, SSGA Fixed Income plc; and January 2009 to Present, Independent Director, SSGA Qualified Funds PLC. | | | 67 | | | Board Director and Chairman, SPDR Europe 1PLC Board (2011 – Present); Board Director and Chairman, SPDR Europe II, PLC (2013 – Present). |
| |
John R. Costantino c/o SSGA Funds Management, Inc. One Iron Street Boston, MA 02210 YOB: 1946 | | Director and Co-Chairperson of the Qualified Legal and Compliance Committee | | Term: Indefinite Elected: 1997 | | Managing General Partner, NGN Capital LLC (2006 – present); and Managing Director, Vice President of Walden Capital Management (1996 – present). | | | 67 | | | Director of Kleinfeld Bridal Corp. (March 2016 – present);Trustee of Neuroscience Research Institute (1986 – present); Trustee of Fordham University (1989 – 1995 and 2001 – 2007) and Trustee Emeritus (2007 – present); Trustee of GE Funds (1993 – February 2011); Director of Artes Medical (2006 – 2008); and Trustee of Gregorian University Foundation (1992 – 2007). |
| |
Donna M. Rapaccioli c/o SSGA Funds Management, Inc. One Iron Street Boston, MA 02210 YOB: 1962 | | Director and Co-Chairperson of the Audit Committee | | Term: Indefinite Elected: 1/12 | | Dean of the Gabelli School of Business (2007 – present) and Accounting Professor (1987 – present) at Fordham University. | | | 67 | | | Director- Graduate Management Admissions Council (2015 – present); Trustee of Emmanuel College (2010 – present). |
State Street Premier Growth Equity V.I.S. Fund
Other Information, continued — December 31, 2018 (Unaudited)
| | | | | | | | | | | | |
| | | | | | |
Name,
Address,
and Year of Birth | | Position(s) Held
with Fund | | Term of
Office and
Length of Time Served | | Principal Occupation
During Past Five Years and Relevant Experience | | Number of
Funds
in Fund
Complex
Overseen
by Director† | | | Other Directorships Held by Director During Past Five Years |
INDEPENDENT DIRECTORS (continued) |
Richard D. Shirk c/o SSGA Funds Management, Inc. One Iron Street Boston, MA 02210 YOB: 1945 | | Director andCo-Chairperson of the Qualified Legal and Compliance Committee | | Term: Indefinite Elected: 1/19 | | March 2001 to April 2002, Chairman (1996 to March 2001, President and Chief Executive Officer), Cerulean Companies, Inc. (holding company) (Retired); 1992 to March 2001, President and Chief Executive Officer, Blue Cross Blue Shield of Georgia (health insurer, managed healthcare). | | | 67 | | | 1998 to December 2008, Chairman, Board Member and December 2008 to Present, Investment Committee Member, Healthcare Georgia Foundation (private foundation); September 2002 to 2012, Lead Director and Board Member, Amerigroup Corp. (managed health care); 1999 to 2013, Board Member and (since 2001) Investment Committee Member, Woodruff Arts Center; and 2003 to 2009, Trustee, Gettysburg College; Board member, Aerocare Holdings, Regenesis Biomedical Inc. |
| |
Rina K. Spence c/o SSGA Funds Management, Inc. One Iron Street Boston, MA 02210 YOB: 1948 | | Director andCo-Chairperson of the Audit Committee, Chairperson of the Nominating Committee and Chairperson of the Governance Committee | | Term: Indefinite Elected: 1/19 | | President of SpenceCare International LLC (international healthcare consulting) (1999 – present); Chief Executive Officer, IEmily.com (health internet company) (2000 – 2001); Chief Executive Officer of Consensus Pharmaceutical, Inc. (1998 – 1999); Founder, President and Chief Executive Officer of Spence Center for Women’s Health (1994 – 1998); President and CEO, Emerson Hospital (1984 – 1994); Honorary Consul for Monaco in Boston (2015 – present). | | | 67 | | | None |
| |
Michael A. Jessee c/o SSGA Funds Management, Inc. One Iron Street Boston, MA 02210 YOB: 1946 | | Director andCo-Chairperson of the Valuation Committee | | Term: Indefinite Elected: 1/19 | | Retired; formerly, President and Chief Executive Officer of the Federal Home Loan Bank of Boston (1989 – 2009); Trustee, Randolph-Macon College (2004 – 2016). | | | 67 | | | None |
State Street Premier Growth Equity V.I.S. Fund
Other Information, continued — December 31, 2018 (Unaudited)
| | | | | | | | | | | | |
| | | | | | |
Name,
Address,
and Year of Birth | | Position(s) Held
with Fund | | Term of
Office and
Length of Time Served | | Principal Occupation
During Past Five Years and Relevant Experience | | Number of
Funds
in Fund
Complex
Overseen
by Director† | | | Other Directorships Held by Director During Past Five Years |
INTERESTED DIRECTORS(1) | | | | | | | | |
Jeanne M. La Porta(2) SSGA Funds Management, Inc. 1600 Summer St. Stamford, CT 06905 YOB: 1965 | | Director and President | | Time Indefinite Elected: 3/14 | | Senior Managing Director at State Street Global Advisors (July 2016 – present); Director of State Street Global Advisors Funds Distributors, LLC (May 2017 – present); President of GE Retirement Savings Plan Funds (July 2016 – present); Senior Vice President and Commercial Operations Leader at GE Asset Management Incorporated (“GEAM”) (March 2014 – July 2016); President of State Street Institutional Funds and State Street Variable Insurance Series Funds, Inc. (April 2014 – present); President and Trustee. | | | 18 | | | None |
| |
Ellen M. Needham(3) SSGA Funds Management, Inc. One Iron Street Boston, MA 02210 YOB: 1967 | | Director | | Time Indefinite Elected: 1/19 | | President and Director, SSGA FM (2001 – present)*; Senior Managing Director, State Street Global Advisors (1992 – present)*; Director, State Street Global Advisors Funds Distributors, LLC (May 2017 – present).* | | | 67 | | | None |
| (1) | | The individuals listed below are Directors who are “interested persons,” as defined in the 1940 Act, of the Company (“Interested Directors”). |
| (2) | | Ms. La Porta is an Interested Director because of her employment by SSGA Funds Management, Inc., an affiliate of the Company. |
| (3) | | Ms. Needham is an Interested Director because of her employment by SSGA Funds Management, Inc., an affiliate of the Company. |
| * | | Served in various capacities and/or with various affiliated entities during noted time period |
| † | | For the purpose of determining the number of portfolios overseen by the Directors, “Fund Complex” comprises registered investment companies for which SSGA FM serves as investment adviser. |
The following lists the principal officers for the Company, as well as their mailing addresses and ages, positions with the Company and length of time served, and present and principal occupations:
| | | | | | |
| | | | |
Name, Address, and Year of Birth | | Position(s) Held with Fund | | Term of Office and Length of Time Served | | Principal Occupation During Past Five Years |
OFFICERS: | | | | | | |
Jeanne M. La Porta SSGA Funds Management, Inc. 1600 Summer St. Stamford, CT 06905 YOB: 1965 | | President and Director | | Term: Indefinite Elected: 3/14 | | Senior Managing Director at State Street Global Advisors (July 2016 – present); Director of State Street Global Advisors Funds Distributors, LLC (May 2017 – present); President of GE Retirement Savings Plan Funds (July 2016 – present); Senior Vice President and Commercial Operations Leader at GE Asset Management Incorporated (“GEAM”) (March 2014 – July 2016); President of State Street Institutional Funds and State Street Variable Insurance Series Funds, Inc. (April 2014 – present); President and Trustee. |
State Street Premier Growth Equity V.I.S. Fund
Other Information, continued — December 31, 2018 (Unaudited)
| | | | | | |
| | | | |
Name, Address, and Year of Birth | | Position(s) Held with Fund | | Term of Office and Length of Time Served | | Principal Occupation During Past Five Years |
OFFICERS (continued): | | | | | | |
Arthur A. Jensen SSGA Funds Management, Inc. 1600 Summer Street Stamford, CT 06905 YOB: 1966 | | Treasurer | | Term: Indefinite Elected: 6/11 | | Vice President, State Street Global Advisors and SSGA Funds Management, Inc. (July 2016 – present); Deputy Treasurer of Elfun Funds (July 2016 – present); Treasurer of State Street Institutional Funds, State Street Variable Insurance Series Funds, Inc. and GE Retirement Savings Plan Funds (June 2011 – present); Treasurer of Elfun Funds (June 2011 – July 2016); Mutual Funds Controller of GE Asset Management Incorporated (April 2011 – July 2016). |
| |
Brian Harris SSGA Funds Management, Inc. One Iron Street Boston, MA 02210 YOB: 1973 | | Chief Compliance Officer and Anti-Money Laundering Officer | | Term: Indefinite Elected: 6/16 | | Managing Director, State Street Global Advisors and SSGA Funds Management, Inc. (2013 – Present); Senior Vice President and Global Head of Investment Compliance, BofA Global Capital Management (September 2010 – May 2013). |
| |
Bruce S. Rosenberg SSGA Funds Management, Inc. One Iron Street Boston, MA 02210 YOB: 1961 | | Assistant Treasurer | | Term: Indefinite Elected: 6/16 | | Managing Director, State Street Global Advisors and SSGA Funds Management, Inc. (July 2015 – present); Director, Credit Suisse (April 2008 – July 2015). |
| |
Ann M. Carpenter SSGA Funds Management, Inc. One Iron Street Boston, MA 02210 YOB: 1966 | | Assistant Treasurer | | Term: Indefinite Elected: 6/16 | | Chief Operating Officer, SSGA Funds Management, Inc. (April 2005 – present) *; Managing Director, State Street Global Advisors. (2005 – present).* |
| |
Chad C. Hallett SSGA Funds Management, Inc. One Iron Street Boston, MA 02210 YOB: 1969 | | Assistant Treasurer | | Term: Indefinite Elected: 6/16 | | Vice President, State Street Global Advisors and SSGA Funds Management, Inc. (November 2014 – present); Vice President, State Street Bank and Trust Company (2001 – November 2014).* |
| |
Darlene Anderson-Vasquez SSGA Funds Management, Inc. One Iron Street Boston, MA 02210 YOB: 1968 | | Assistant Treasurer | | Term: Indefinite Elected: 3/17 | | Managing Director, State Street Global Advisors and SSGA Funds Management, Inc. (May 2016 – present); Senior Vice President, John Hancock Investments (September 2007 – May 2016). |
| |
Daniel G. Plourde SSGA Funds Management, Inc. One Iron Street Boston, MA 02210 YOB: 1980 | | Assistant Treasurer | | Term: Indefinite Elected: 6/17 | | Vice President, State Street Global Advisors and SSGA Funds Management, Inc. (May 2015 – present); Officer, State Street Bank and Trust Company (March 2009 – May 2015). |
State Street Premier Growth Equity V.I.S. Fund
Other Information, continued — December 31, 2018 (Unaudited)
| | | | | | |
| | | | |
Name, Address, and Year of Birth | | Position(s) Held with Fund | | Term of Office and Length of Time Served | | Principal Occupation During Past Five Years |
OFFICERS (continued): | | | | | | |
Jesse D. Hallee State Street Bank and Trust Company 100 Summer Street, 7th Floor Boston, MA 02111-2900 YOB: 1976 | | Secretary | | Term: Indefinite Elected: 3/17 | | Vice President and Managing Counsel, State Street Bank and Trust Company (2013 – present); Vice President and Counsel, Brown Brothers Harriman & Co. (2007 – 2013). |
| * | Served in various capacities and/or with various affiliated entities during noted time period. |
State Street Premier Growth Equity V.I.S. Fund
Other Information, continued — December 31, 2018 (Unaudited)
Proxy Voting Policies and Procedures and Record
The Fund has adopted the proxy voting policies of SSGA FM. A description of the policies and procedures that the Fund has adopted to determine how to vote proxies relating to portfolio securities is available (i) without charge, upon request, by calling1-800-242-0134, (ii) on the Fund’s website at http://www.ssga.com/geam or (iii) on the SEC’s website at www.sec.gov. Information regarding how the Fund voted proxies, if any, during the most recent12-month period ended June 30 is available by August 31 of each year without charge (1) by calling1-800-242-0134 (toll free), and (2) on the website of the SEC at www.sec.gov.
Quarterly Portfolio Schedule
The Fund files its complete schedule of investments with the SEC for the first and third quarters of each fiscal year on FormN-Q. The Fund’s FormsN-Q are available (i) without charge, upon request, by calling1-800-242-013, (ii) on the Fund’s website at http://www.ssga.com/geam or (iii) on the SEC’s website at www.sec.gov.
Directors
Michael F. Holland, Co-Chairperson
Patrick J. Riley, Co-Chairperson
John R. Costantino
Donna M. Rapaccioli
Michael A. Jessee
Richard D. Shirk
Rina K. Spence
Jeanne M. La Porta
Ellen M. Needham
Officers
Jeanne M. La Porta, President
Arthur Jensen, Treasurer
Brian Harris, Chief Compliance Officer and Anti-Money Laundering Officer
Bruce S. Rosenberg, Assistant Treasurer
Ann M. Carpenter, Assistant Treasurer
Chad C. Hallett, Assistant Treasurer
Darlene Anderson-Vasquez, Assistant Treasurer
Daniel G. Plourde, Assistant Treasurer
Jesse Hallee, Secretary
Investment Adviser and Administrator
SSGA Funds Management, Inc.
One Iron Street
Boston, MA 02210
Custodian andSub-Administrator
State Street Bank and Trust Company
One Lincoln Street
Boston, Massachusetts 02111
Distributor
State Street Global Advisors Funds Distributors, LLC
One Iron Street
Boston, MA 02210
Independent Registered Public Accounting Firm
Ernst & Young LLP
200 Clarendon Street
Boston, Massachusetts 02116
Annual Report
December 31, 2018
State Street Income V.I.S. Fund
Beginning on January 1, 2021, as permitted by regulations adopted by the Securities and Exchange Commission, paper copies of a Fund’s annual and semi- annual shareholder reports will no longer be sent by mail, unless you specifically request paper copies of the reports from the Fund (or from your financial intermediary, such as a broker-dealer or bank). Instead, the reports will be made available on a Fund’s website (www.ssga.com/geam), and you will be notified by mail each time a report is posted, and provided with a website link to access the report.
Beginning on January 1, 2019, you may elect to receive all future reports in paper free of charge. If you invest through a financial intermediary, you can contact your financial intermediary to request that you continue to receive paper copies of your shareholder reports. Your election to receive reports in paper will apply to all funds held in your account, if you invest through your financial intermediary or all funds held with the fund complex if you invest directly with a Fund.

State Street Income V.I.S. Fund
Annual Report
December 31, 2018
Table of Contents
This report is prepared for Policyholders of certain variable contracts and may be distributed to others only if preceded or accompanied by the variable contract’s current prospectus and the current summary prospectus of the Fund available for investments thereunder.
State Street Income V.I.S. Fund
Notes to Performance — December 31, 2018 (Unaudited)
The information provided on the performance pages relates to the State Street Income V.I.S. Fund (the “Fund”).
Total return performance shown in this report for the Fund takes into account changes in share price and assumes reinvestment of dividends and capital gains distributions, if any. Total returns shown are net of Fund fees and expenses but do not reflect fees and charges associated with the variable contracts such as administrative fees, account charges and surrender charges, which, if reflected, would reduce the Fund’s total returns for all periods shown.
The performance data quoted represents past performance; past performance does not guarantee future results. Investment return and principal value will fluctuate so your shares, when redeemed, may be worth more or less than their original cost. Current performance may be higher or lower than the performance data quoted. Periods less than one year are not annualized. Please call toll-free (800) 242-0134 or visit the Fund’s website at http://www.ssga.com/geam for the most recent month-end performance data.
An investment in the Fund is not a deposit of any bank and is not insured or guaranteed by the Federal Deposit Insurance Corporation (“FDIC”) or any other government agency. An investment in the Fund is subject to risk, including possible loss of principal invested.
The Bloomberg Barclays U.S. Aggregate Bond Index is an unmanaged market value-weighted index of taxable investment grade debt issues, including government, corporate, asset-backed and mortgage-backed securities, with maturities of one year or more. This index is designed to represent the performance of the U.S. investment-grade first rate bond market.
The results shown for the foregoing index assume the reinvestment of net dividends or interest and do not reflect fees, expenses, or taxes. As such, the index returns do not reflect the actual cost of investing in the instruments that comprise the index.
The views expressed in this document reflect our judgment as of the publication date and are subject to change at any time without notice.
State Street Global Advisors Funds Distributors, LLC, member of FINRA & SIPC is the principal underwriter and distributor of the State Street V.I.S. Funds and an indirect wholly-owned subsidiary of State Street Corporation. References to State Street may include State Street Corporation and its affiliates. The Funds pay State Street Bank and Trust Company for its services as custodian and Fund Accounting agent, and pay SSGA Funds Management, Inc. for investment advisory and administrative services.
State Street Income V.I.S. Fund
Management Discussion of Fund Performance — December 31, 2018 (Unaudited)
The State Street Income V.I.S. Fund (the “Fund”) seeks to provide the maximum income consistent with prudent investment management and the preservation of capital. The Fund’s benchmark is the Bloomberg Barclays U.S. Aggregate Bond Index (the “Index”).
For the12-month period ended December 31, 2018 (the “Reporting Period”), the total return for the Fund was-1.42% and the Index was 0.01%. The Fund and Index returns reflect the reinvestment of dividends and other income. The Fund’s performance reflects the expenses of managing the Fund, including brokerage and advisory expenses. The Index is unmanaged and Index returns do not reflect fees and expenses of any kind, which would have a negative impact on returns.
The primary drivers of underperformance were the Fund’s over-weights to both high yield and investment grade corporates. The Fund’s underweight to mortgage backed securities offset some underperformance versus the Index.
We expected the credit and economics cycles to continue, which they have. However, trade tensions between the U.S. & China, BREXIT, equity and commodity volatility weighed heavily on the credit markets causing high yield and investment grade corporate spreads to widen 183bps (108bps in December alone) and 47bps, respectively, negatively impacting the Fund’s performance.
The Fund had a large underweight in our mortgage backed securities position anticipating volatility in that asset class as the Federal Reserve would begin reducing its balance sheet exposure. Mortgage spreads did widen in the fourth quarter and the Fund pared its position still maintaining an underweight. This activity provided positive excess returns.
The Fund used treasury futures, interest rate swaps and other derivatives in order to actively manage duration during the Reporting Period. The Fund’s use of these derivatives contributed to fund liquidity and key rate exposure management versus utilizing cash instruments only.
The views expressed above reflect those of the Fund’s portfolio manager only through the Reporting Period, and do not necessarily represent the views of the Adviser as a whole. Any such views are subject to change at any time based upon market or other conditions and the Adviser disclaims any responsibility to update such views. These views may not be relied on as investment advice and, because investment decisions for a fund are based on numerous factors, may not be relied on as an indication of trading intent on behalf of any fund.
| | |
| 2 | | State Street Income V.I.S. Fund |
State Street Income V.I.S. Fund
Understanding Your Fund’s Expenses — December 31, 2018 (Unaudited)
As a shareholder of the Fund, you incur ongoing costs. Ongoing costs include portfolio management fees, professional fees, administrative fees and other Fund expenses. The following example is intended to help you understand your ongoing costs (in dollars) of investing in the Fund and to compare these costs with the ongoing costs of investing in other mutual funds.
To illustrate these ongoing costs, we have provided an example and calculated the expenses paid by investors in the Fund during the period. The information in the following table is based on an investment of $1,000, which is invested at the beginning of the period and held for the entiresix-month period ended December 31, 2018.
Actual Expenses
The first section of the table provides information about actual account values and actual expenses. You may use the information in this section, together with the amount you invested, to estimate the expenses that you paid over the period. To do so, simply divide your account value by $1,000 (for example, an $8,600 account value divided by $1,000 = 8.6), then multiply the result by the number given under the heading “Expenses paid during the period” to estimate the expenses you paid on your account during the period.
Hypothetical Example for Comparison Purposes
The second section of the table provides information about hypothetical account values and hypothetical expenses based on the Fund’s actual expense ratio and an assumed rate of return of 5% per year before expenses, which is not the Fund’s actual return. The hypothetical account values and expenses may not be used to estimate the actual ending account balance or expenses you paid for the period. You may use this information to compare the ongoing costs of investing in the Fund and other funds. To do so, compare this 5% hypothetical example with the 5% hypothetical examples that appear in the shareholder reports of other funds.
Please note that the expenses shown in the table are meant to highlight and help you compare ongoing costs only and do not reflect transaction costs, such as sales charges or redemption fees, if any. Therefore, the second section of the table is useful in comparing ongoing costs only, and will not help you determine the relative total costs of owning different funds. Additionally, the expenses shown do not reflect the fees or charges associated with variable contracts through which shares of the Fund are offered.
| | | | | | | | |
| | | Actual
Fund Return | | | Hypothetical
5% Return
(2.5% for
the period) | |
Actual Fund Return | | | | | | | | |
Beginning Account Value July 1, 2018 | | $ | 1,000.00 | | | $ | 1,000.00 | |
Ending Account Value December 31, 2018 | | $ | 1,011.30 | | | $ | 1,022.58 | |
Expenses Paid During Period* | | $ | 2.64 | | | $ | 2.65 | |
| * | Expenses are equal to the Fund’s annualized expense ratio of 0.52%** (for the period July 1, 2018-December 31, 2018), multiplied by the average account value over the period, multiplied by 184/365 (to reflect theone-half year period). |
| ** | May differ from expense ratio disclosed in the financial highlights, which is calculated based on the entire fiscal year’s data. |
| | | | |
| State Street Income V.I.S. Fund | | | 3 | |
State Street Income V.I.S. Fund
Performance Summary — December 31, 2018 (Unaudited)
Quality Ratings
as of December 31, 2018 as a % of Fair Value(a)(b)
| | | | |
Moody’s / S&P /Rating* | | Percentage of
Fair Value | |
Aaa / AAA | | | 19.0 | % |
| |
Aa / AA | | | 46.2 | % |
| |
A / A | | | 6.1 | % |
| |
Baa / BBB | | | 19.4 | % |
| |
Ba / BB and lower | | | 8.6 | % |
| |
NR / Other | | | 0.7 | % |
| | | | |
| | | 100.0 | % |
| | | | |
Sector Allocation
Portfolio composition as a % of Fair Value of $21,172 (in thousands) as of December 31, 2018(a)(b)
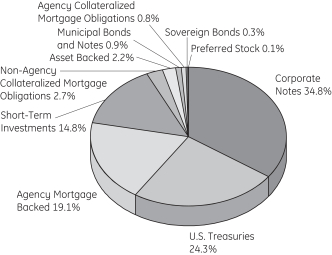
Average Annual Total Return for the periods ended December 31, 2018
Class 1 Shares (Inception date: 1/03/95)
| | | | | | | | | | | | | | | | |
| | | One Year | | | Five Year | | | Ten Year | | | Ending Value
of a $10,000
Investment | |
State Street Income V.I.S. Fund | | | -1.42 | % | | | 1.87 | % | | | 3.59 | % | | $ | 14,232 | |
Bloomberg Barclays U.S. Aggregate Bond Index | | | 0.01 | % | | | 2.52 | % | | | 3.48 | % | | $ | 14,075 | |
| (a) | Fair Value basis is inclusive of short-term investment in State Street Institutional U.S. Government Money Market Fund Class G Shares. |
| (b) | The securities information regarding holdings, allocations and other characteristics is presented to illustrate examples of securities that the Fund has bought and the diversity of areas in which the Fund may invest as of a particular date. It may not be representative of the Fund’s current or future investments and should not be construed as a recommendation to purchase or sell a particular security. |
| * | Moody’s Investors Services, Inc. (“Moody’s”) and S&P Global Ratings (“S&P”) are nationally recognized statistical rating organizations. The quality ratings represent the lower of Moody’s or S&P credit ratings. When a rating from only one of the rating agencies is available, that rating is used. Securities not rated by Moody’s or S&P are categorized as not rated. Credit quality measures a bond issuer’s ability to repay interest and principal in a timely manner. Credit quality ratings assigned by a rating agency are subject to change periodically and are not absolute standards of quality. In formulating investment decisions for the Fund, SSGA Funds Management, Inc. develops its own analysis of the credit quality and risks associated with individual debt instruments, rather than relying exclusively on rating agency ratings. |
| | |
| 4 | | State Street Income V.I.S. Fund |
State Street Income V.I.S. Fund
Performance Summary, continued — December 31, 2018 (Unaudited)
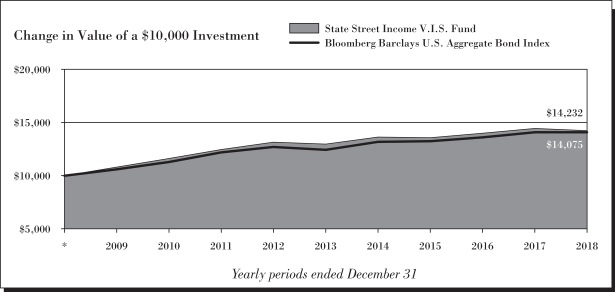
See Notes to Performance beginning on page 1 for further information.
Past performance does not predict future performance. The performance shown in the graphs and tables does not reflect the deduction of taxes that a shareholder would pay on Fund distributions or the redemption of Fund shares and does not reflect the fees or charges that would be associated with variable contracts through which shares of the Fund are offered.
| | | | |
| State Street Income V.I.S. Fund | | | 5 | |
State Street Income V.I.S. Fund
Schedule of Investments — December 31, 2018
| | | | | | | | |
| | | Principal
Amount ($) | | | Fair
Value
$ | |
| | | | | | | | |
|
| Bonds and Notes - 96.4%† | |
U.S. Treasuries - 27.5% | | | | | | | | |
U.S. Treasury Bonds
2.25% 08/15/46 (a) | | | 135,000 | | | | 115,360 | |
3.13% 05/15/48 | | | 135,000 | | | | 137,566 | |
3.75% 11/15/43 (a) | | | 69,000 | | | | 77,919 | |
4.50% 02/15/36 (a) | | | 71,400 | | | | 88,011 | |
U.S. Treasury Notes
1.38% 12/15/19 (a) | | | 726,400 | | | | 717,794 | |
1.50% 11/30/19 - 08/15/20 (a) | | | 1,303,100 | | | | 1,288,203 | |
2.25% 03/31/20 (a) | | | 1,498,600 | | | | 1,492,602 | |
2.75% 11/15/23 | | | 305,600 | | | | 308,991 | |
2.88% 11/30/25 | | | 685,600 | | | | 697,943 | |
2.88% 08/15/28 (a) | | | 216,700 | | | | 220,053 | |
| | | | | | | | |
| | | | | | | 5,144,442 | |
| | | | | | | | |
|
Agency Mortgage Backed - 21.7% | |
Federal Home Loan Mortgage Corp.
4.05% 09/25/28 (a)(b) | | | 86,000 | | | | 90,572 | |
4.50% 06/01/33 - 02/01/35 (a) | | | 4,122 | | | | 4,313 | |
5.00% 07/01/35 (a) | | | 35,650 | | | | 37,921 | |
5.50% 05/01/20 - 01/01/38 (a) | | | 42,741 | | | | 45,917 | |
6.00% 07/01/19 - 11/01/37 (a) | | | 113,566 | | | | 123,579 | |
6.50% 02/01/29 (a) | | | 57 | | | | 63 | |
6.93% 06/01/26 (a)(c) | | | 60,000 | | | | 76,027 | |
7.00% 06/01/29 - 08/01/36 (a) | | | 25,127 | | | | 27,790 | |
7.50% 01/01/30 - 09/01/33 (a) | | | 4,121 | | | | 4,443 | |
8.00% 11/01/30 (a) | | | 4,932 | | | | 5,367 | |
8.50% 04/01/30 (a) | | | 4,501 | | | | 5,503 | |
Federal National Mortgage Assoc.
3.50% 08/01/45 (a) | | | 16,928 | | | | 16,982 | |
4.00% 05/01/19 - 03/01/41 (a) | | | 153,941 | | | | 158,440 | |
4.50% 05/01/19 - 02/01/40 (a) | | | 41,777 | | | | 43,571 | |
5.00% 03/01/34 - 08/01/35 (a) | | | 48,291 | | | | 51,413 | |
5.50% 06/01/20 - 01/01/39 (a) | | | 162,805 | | | | 174,936 | |
6.00% 10/01/19 - 07/01/35 (a) | | | 172,133 | | | | 188,631 | |
6.50% 10/01/28 - 08/01/34 (a) | | | 25,352 | | | | 27,295 | |
7.00% 01/01/30 - 02/01/34 (a) | | | 5,869 | | | | 6,262 | |
7.50% 11/01/22 - 12/01/33 (a) | | | 18,996 | | | | 20,121 | |
8.00% 08/01/25 - 10/01/31 (a) | | | 8,392 | | | | 9,154 | |
9.00% 12/01/22 (a) | | | 268 | | | | 282 | |
Federal National Mortgage Assoc. 1.60% + 12 month USD LIBOR
3.97% 04/01/37 (a)(b) | | | 940 | | | | 962 | |
Federal National Mortgage Assoc. TBA | | | | | | | | |
2.50% TBA (d) | | | 354,000 | | | | 345,814 | |
3.00% TBA (d) | | | 547,232 | | | | 536,068 | |
3.50% TBA (d) | | | 414,000 | | | | 413,870 | |
4.00% TBA (d) | | | 393,000 | | | | 400,620 | |
4.50% TBA (d) | | | 33,000 | | | | 34,162 | |
| | | | | | | | |
| | | Principal
Amount ($) | | | Fair
Value
$ | |
Government National Mortgage Assoc.
4.00% 01/20/41 - 04/20/43 (a) | | | 137,436 | | | | 142,017 | |
4.50% 08/15/33 - 03/20/41 (a) | | | 101,091 | | | | 105,802 | |
6.00% 04/15/27 - 04/15/34 (a) | | | 86,906 | | | | 96,160 | |
6.50% 04/15/19 - 08/15/34 (a) | | | 38,137 | | | | 41,390 | |
7.00% 01/15/28 - 10/15/36 (a) | | | 26,557 | | | | 28,709 | |
7.50% 11/15/31 (a) | | | 205 | | | | 205 | |
9.00% 12/15/21 (a) | | | 135 | | | | 141 | |
Government National Mortgage Assoc. 1.50% + 1 year CMT
3.13% 12/20/24 (a)(b) | | | 793 | | | | 806 | |
3.38% 02/20/23 - 02/20/26 (a)(b) | | | 2,394 | | | | 2,415 | |
Government National Mortgage Assoc. TBA
3.00% TBA (d) | | | 183,000 | | | | 180,164 | |
3.50% TBA (d) | | | 591,000 | | | | 595,078 | |
| | | | | | | | |
| | | | | | | 4,042,965 | |
| | | | | | | | |
|
Agency Collateralized Mortgage Obligations - 0.9% | |
Federal Home Loan Mortgage Corp.
0.08% 09/25/43 (a)(b)(e) | | | 449,429 | | | | 1,159 | |
3.86% 11/25/28 (b) | | | 36,000 | | | | 37,381 | |
4.06% 10/25/28 (b) | | | 62,000 | | | | 65,314 | |
Federal Home Loan Mortgage Corp. REMIC | | | | | | | | |
3.50% 09/15/29 - 11/15/30 (a)(e) | | | 45,147 | | | | 3,460 | |
5.50% 06/15/33 (a)(e) | | | 20,384 | | | | 4,016 | |
7.50% 07/15/27 (a)(e) | | | 1,900 | | | | 375 | |
Federal Home Loan Mortgage Corp. REMIC 6.60% - 1 month USD LIBOR
4.14% 08/15/25 (a)(b)(e) | | | 20,273 | | | | 1,045 | |
Federal Home Loan Mortgage Corp. STRIPS
1.47% 08/01/27 (f)(g) | | | 231 | | | | 203 | |
8.00% 02/01/23 (e) | | | 238 | | | | 27 | |
8.00% 07/01/24 (a)(e) | | | 445 | | | | 68 | |
Federal National Mortgage Assoc. REMIC
0.51% 12/25/22 (a)(f)(g) | | | 10 | | | | 10 | |
1.10% 12/25/42 (a)(b)(e) | | | 23,805 | | | | 1,734 | |
5.00% 09/25/40 (a)(e) | | | 19,900 | | | | 2,149 | |
7.00% 09/25/20 (a) | | | 47 | | | | 53 | |
Federal National Mortgage Assoc. REMIC 6.00% - 1 month USD LIBOR
3.49% 07/25/38 (a)(b)(e) | | | 7,058 | | | | 921 | |
Federal National Mortgage Assoc. REMIC 6.20% - 1 month USD LIBOR
3.69% 06/25/48 (b)(e) | | | 161,864 | | | | 26,495 | |
See Notes to Schedule of Investments and Notes to Financial Statements.
| | |
| 6 | | State Street Income V.I.S. Fund |
State Street Income V.I.S. Fund
Schedule of Investments, continued — December 31, 2018
| | | | | | | | |
| | | Principal
Amount ($) | | | Fair
Value
$ | |
| | | | | | | | |
Federal National Mortgage Assoc. STRIPS
1.87% 12/25/34 (a)(f)(g) | | | 16,663 | | | | 13,916 | |
4.50% 08/25/35 - 01/25/36 (a)(e) | | | 20,878 | | | | 2,592 | |
5.00% 03/25/38 - 05/25/38 (a)(e) | | | 11,651 | | | | 2,492 | |
5.50% 12/25/33 (a)(e) | | | 5,072 | | | | 1,115 | |
6.00% 01/25/35 (a)(e) | | | 8,415 | | | | 1,955 | |
7.50% 11/25/23 (a)(e) | | | 3,120 | | | | 378 | |
8.00% 08/25/23 - 07/25/24 (a)(e) | | | 1,369 | | | | 193 | |
Government National Mortgage Assoc. REMIC
4.50% 08/16/39 (a)(e) | | | 14,017 | | | | 1,015 | |
5.00% 09/20/38 (a)(e) | | | 4,242 | | | | 127 | |
Government National Mortgage Assoc. REMIC 6.80% - 1 month USD LIBOR
4.34% 01/16/40 (a)(b)(e) | | | 23,781 | | | | 3,969 | |
| | | | | | | | |
| | | | | | | 172,162 | |
| | | | | | | | |
| | |
Asset Backed - 2.5% | | | | | | | | |
American Express Credit Account Master Trust2017-6
2.04% 05/15/23 (a) | | | 124,437 | | | | 122,586 | |
American Express Credit Account Master Trust2018-8
3.18% 04/15/24 | | | 104,000 | | | | 104,760 | |
BA Credit Card Trust2018-A1
2.70% 07/17/23 | | | 44,000 | | | | 43,819 | |
Citibank Credit Card Issuance Trust2016-A1
1.75% 11/19/21 (a) | | | 200,000 | | | | 197,921 | |
| | | | | | | | |
| | | | | | | 469,086 | |
| | | | | | | | |
| | |
Corporate Notes - 39.5% | | | | | | | | |
1011778 BC ULC/New Red Finance Inc.
4.25% 05/15/24 (a)(h) | | | 7,000 | | | | 6,428 | |
21st Century Fox America Inc.
3.38% 11/15/26 (a) | | | 5,000 | | | | 4,932 | |
4.50% 02/15/21 (a) | | | 7,000 | | | | 7,181 | |
4.75% 11/15/46 (a) | | | 4,000 | | | | 4,270 | |
6.65% 11/15/37 (a) | | | 8,000 | | | | 10,290 | |
Abbott Laboratories
2.90% 11/30/21 (a) | | | 15,000 | | | | 14,859 | |
3.75% 11/30/26 (a) | | | 8,000 | | | | 7,906 | |
4.90% 11/30/46 (a) | | | 10,000 | | | | 10,512 | |
AbbVie Inc.
3.20% 05/14/26 (a) | | | 4,000 | | | | 3,705 | |
4.45% 05/14/46 (a) | | | 11,000 | | | | 9,669 | |
4.88% 11/14/48 (a) | | | 3,000 | | | | 2,800 | |
Acadia Healthcare Company Inc.
6.50% 03/01/24 (a) | | | 20,000 | | | | 19,253 | |
| | | | | | | | |
| | | Principal
Amount ($) | | | Fair
Value
$ | |
Activision Blizzard Inc.
2.30% 09/15/21 (a) | | | 37,000 | | | | 36,010 | |
AES Corp.
4.88% 05/15/23 (a) | | | 22,000 | | | | 21,514 | |
Aetna Inc.
3.50% 11/15/24 (a) | | | 10,000 | | | | 9,656 | |
Aflac Inc.
4.00% 10/15/46 (a) | | | 3,000 | | | | 2,756 | |
Alexandria Real Estate Equities Inc.
4.70% 07/01/30 (a) | | | 3,000 | | | | 3,038 | |
Alimentation Couche-Tard Inc.
2.70% 07/26/22 (a)(h) | | | 10,000 | | | | 9,668 | |
4.50% 07/26/47 (a)(h) | | | 4,000 | | | | 3,639 | |
Allergan Finance LLC | | | | | | | | |
3.25% 10/01/22 (a) | | | 8,000 | | | | 7,792 | |
4.63% 10/01/42 (a) | | | 2,000 | | | | 1,834 | |
Allergan Funding SCS
3.00% 03/12/20 (a) | | | 24,000 | | | | 23,907 | |
3.45% 03/15/22 (a) | | | 12,000 | | | | 11,811 | |
Allergan Sales LLC
5.00% 12/15/21 (a)(h) | | | 24,000 | | | | 24,705 | |
Altria Group Inc.
2.95% 05/02/23 (a) | | | 5,000 | | | | 4,754 | |
4.50% 05/02/43 (a) | | | 3,000 | | | | 2,497 | |
Amazon.com Inc.
2.80% 08/22/24 (a) | | | 5,000 | | | | 4,860 | |
3.15% 08/22/27 (a) | | | 4,000 | | | | 3,859 | |
3.88% 08/22/37 (a) | | | 2,000 | | | | 1,945 | |
4.05% 08/22/47 (a) | | | 5,000 | | | | 4,900 | |
4.25% 08/22/57 (a) | | | 5,000 | | | | 4,934 | |
Ameren Corp.
3.65% 02/15/26 (a) | | | 5,000 | | | | 4,919 | |
American Axle & Manufacturing Inc.
6.25% 04/01/25 (a) | | | 16,000 | | | | 14,556 | |
American Campus Communities Operating Partnership LP
4.13% 07/01/24 (a) | | | 4,000 | | | | 4,012 | |
American Express Co.
3.00% 10/30/24 (a) | | | 14,000 | | | | 13,395 | |
American International Group Inc.
4.50% 07/16/44 (a) | | | 9,000 | | | | 8,000 | |
6.40% 12/15/20 (a) | | | 7,000 | | | | 7,387 | |
American International Group Inc. (5.75% fixed rate until 04/01/28; 2.87% + 3 month USD LIBOR thereafter)
5.75% 04/01/48 (a)(b) | | | 6,000 | | | | 5,251 | |
American Tower Corp. (REIT)
3.38% 10/15/26 (a) | | | 5,000 | | | | 4,658 | |
3.40% 02/15/19 (a) | | | 36,000 | | | | 35,980 | |
See Notes to Schedule of Investments and Notes to Financial Statements.
| | | | |
| State Street Income V.I.S. Fund | | | 7 | |
State Street Income V.I.S. Fund
Schedule of Investments, continued — December 31, 2018
| | | | | | | | |
| | | Principal
Amount ($) | | | Fair
Value
$ | |
| | | | | | | | |
American Water Capital Corp.
2.95% 09/01/27 (a) | | | 11,000 | | | | 10,367 | |
Amgen Inc. | | | | | | | | |
2.20% 05/22/19 (a) | | | 38,000 | | | | 37,862 | |
2.65% 05/11/22 (a) | | | 15,000 | | | | 14,665 | |
3.20% 11/02/27 (a) | | | 5,000 | | | | 4,700 | |
4.56% 06/15/48 (a) | | | 8,000 | | | | 7,673 | |
AMN Healthcare Inc.
5.13% 10/01/24 (a)(h) | | | 23,000 | | | | 22,030 | |
Anadarko Petroleum Corp.
4.85% 03/15/21 (a) | | | 3,000 | | | | 3,064 | |
6.20% 03/15/40 (a) | | | 5,000 | | | | 5,223 | |
Andeavor Logistics LP/Tesoro Logistics Finance Corp.
5.20% 12/01/47 (a) | | | 3,000 | | | | 2,697 | |
5.25% 01/15/25 (a) | | | 66,000 | | | | 65,916 | |
5.50% 10/15/19 (a) | | | 24,000 | | | | 24,220 | |
6.25% 10/15/22 (a) | | | 16,000 | | | | 16,309 | |
Anheuser-Busch Companies LLC/Anheuser-Busch InBev Worldwide Inc.
4.70% 02/01/36 (a)(h) | | | 8,000 | | | | 7,381 | |
4.90% 02/01/46 (a)(h) | | | 9,000 | | | | 8,328 | |
Anheuser-Busch InBev Worldwide Inc.
2.50% 07/15/22 (a) | | | 31,000 | | | | 29,590 | |
4.00% 04/13/28 (a) | | | 4,000 | | | | 3,826 | |
4.38% 04/15/38 (a) | | | 20,000 | | | | 17,899 | |
4.60% 04/15/48 (a) | | | 9,000 | | | | 8,054 | |
4.75% 04/15/58 (a) | | | 7,000 | | | | 6,087 | |
Anthem Inc.
3.30% 01/15/23 (a) | | | 6,000 | | | | 5,904 | |
Apache Corp.
4.38% 10/15/28 (a) | | | 3,000 | | | | 2,800 | |
5.10% 09/01/40 (a) | | | 7,000 | | | | 6,322 | |
Apple Inc.
2.50% 02/09/22 (a) | | | 9,000 | | | | 8,872 | |
2.85% 05/11/24 (a) | | | 7,000 | | | | 6,824 | |
3.35% 02/09/27 (a) | | | 7,000 | | | | 6,838 | |
3.45% 02/09/45 (a) | | | 15,000 | | | | 13,290 | |
3.85% 08/04/46 (a) | | | 7,000 | | | | 6,585 | |
4.25% 02/09/47 (a) | | | 7,000 | | | | 7,006 | |
Applied Materials Inc.
4.35% 04/01/47 (a) | | | 6,000 | | | | 5,868 | |
Aptiv PLC
4.40% 10/01/46 (a) | | | 7,000 | | | | 6,201 | |
Aramark Services Inc.
5.00% 02/01/28 (a)(h) | | | 14,000 | | | | 13,093 | |
Archer-Daniels-Midland Co.
2.50% 08/11/26 (a) | | | 8,000 | | | | 7,302 | |
Arconic Inc.
5.13% 10/01/24 (a) | | | 16,000 | | | | 15,407 | |
6.15% 08/15/20 (a) | | | 5,000 | | | | 5,101 | |
| | | | | | | | |
| | | Principal
Amount ($) | | | Fair
Value
$ | |
Ascension Health
4.85% 11/15/53 (a) | | | 10,000 | | | | 10,831 | |
Ashland LLC
4.75% 08/15/22 (a) | | | 7,000 | | | | 6,881 | |
AstraZeneca PLC
2.38% 11/16/20 (a) | | | 8,000 | | | | 7,866 | |
3.38% 11/16/25 (a) | | | 4,000 | | | | 3,874 | |
3.50% 08/17/23 (a) | | | 6,000 | | | | 5,943 | |
4.00% 01/17/29 (a) | | | 3,000 | | | | 2,980 | |
4.38% 08/17/48 (a) | | | 5,000 | | | | 4,743 | |
AT&T Inc.
3.00% 06/30/22 (a) | | | 10,000 | | | | 9,761 | |
3.80% 03/15/22 (a) | | | 15,000 | | | | 15,063 | |
4.10% 02/15/28 | | | 9,000 | | | | 8,653 | |
4.45% 04/01/24 (a) | | | 9,000 | | | | 9,132 | |
4.50% 05/15/35 (a) | | | 12,000 | | | | 10,878 | |
4.55% 03/09/49 (a) | | | 4,000 | | | | 3,446 | |
4.75% 05/15/46 (a) | | | 4,000 | | | | 3,556 | |
4.80% 06/15/44 (a) | | | 7,000 | | | | 6,279 | |
5.00% 03/01/21 (a) | | | 12,000 | | | | 12,409 | |
5.15% 11/15/46 | | | 2,000 | | | | 1,862 | |
5.25% 03/01/37 (a) | | | 5,000 | | | | 4,902 | |
5.45% 03/01/47 (a) | | | 7,000 | | | | 6,826 | |
Athene Holding Ltd.
4.13% 01/12/28 (a) | | | 4,000 | | | | 3,632 | |
Avangrid Inc.
3.15% 12/01/24 (a) | | | 16,000 | | | | 15,433 | |
Bank of America Corp.
2.65% 04/01/19 (a) | | | 23,000 | | | | 22,973 | |
3.95% 04/21/25 (a) | | | 11,000 | | | | 10,660 | |
4.25% 10/22/26 (a) | | | 18,000 | | | | 17,510 | |
Bank of America Corp. (2.37% fixed rate until 07/21/20; 0.66% + 3 month USD LIBOR thereafter)
2.37% 07/21/21 (a)(b) | | | 14,000 | | | | 13,762 | |
Bank of America Corp. (3.12% fixed rate until 01/20/22; 1.16% + 3 month USD LIBOR thereafter)
3.12% 01/20/23 (a)(b) | | | 14,000 | | | | 13,757 | |
Bank of America Corp. (3.37% fixed rate until 01/23/25; 0.81% + 3 month USD LIBOR thereafter)
3.37% 01/23/26 (a)(b) | | | 21,000 | | | | 20,074 | |
Bank of America Corp. (3.42% fixed rate until 12/20/27; 1.04% + 3 month USD LIBOR thereafter)
3.42% 12/20/28 (a)(b) | | | 16,000 | | | | 14,900 | |
See Notes to Schedule of Investments and Notes to Financial Statements.
| | |
| 8 | | State Street Income V.I.S. Fund |
State Street Income V.I.S. Fund
Schedule of Investments, continued — December 31, 2018
| | | | | | | | |
| | | Principal
Amount ($) | | | Fair
Value
$ | |
| | | | | | | | |
Bank of America Corp. (3.95% fixed rate until 01/23/48; 1.19% + 3 month USD LIBOR thereafter)
3.95% 01/23/49 (a)(b) | | | 9,000 | | | | 8,011 | |
Bank of America Corp. (4.24% fixed rate until 04/24/37; 1.81% + 3 month USD LIBOR thereafter)
4.24% 04/24/38 (a)(b) | | | 13,000 | | | | 12,325 | |
Bank of America Corp. (4.27% fixed rate until 07/23/28; 1.31% + 3 month USD LIBOR thereafter)
4.27% 07/23/29 (a)(b) | | | 3,000 | | | | 2,984 | |
Bank of Montreal (4.34% fixed rate until 10/05/23; 1.28% + USD 5 year Swap Rate thereafter)
4.34% 10/05/28 (a)(b) | | | 18,000 | | | | 17,920 | |
Barrick North America Finance LLC
5.70% 05/30/41 (a) | | | 3,000 | | | | 3,167 | |
BAT Capital Corp.
2.30% 08/14/20 | | | 31,000 | | | | 30,270 | |
2.76% 08/15/22 | | | 9,000 | | | | 8,496 | |
3.56% 08/15/27 | | | 15,000 | | | | 13,295 | |
4.39% 08/15/37 | | | 3,000 | | | | 2,465 | |
4.54% 08/15/47 | | | 4,000 | | | | 3,201 | |
Bausch Health Companies Inc.
7.00% 03/15/24 (a)(h) | | | 37,000 | | | | 37,478 | |
Baxalta Inc.
2.88% 06/23/20 (a) | | | 5,000 | | | | 4,946 | |
Bayer US Finance II LLC
4.70% 07/15/64 (a)(h) | | | 5,000 | | | | 4,155 | |
Becton Dickinson and Co.
2.89% 06/06/22 (a) | | | 14,000 | | | | 13,554 | |
3.70% 06/06/27 (a) | | | 23,000 | | | | 21,784 | |
3.73% 12/15/24 (a) | | | 2,000 | | | | 1,934 | |
4.67% 06/06/47 (a) | | | 3,000 | | | | 2,823 | |
4.69% 12/15/44 (a) | | | 2,000 | | | | 1,882 | |
Berkshire Hathaway Energy Co.
2.40% 02/01/20 (a) | | | 17,000 | | | | 16,887 | |
3.25% 04/15/28 (a) | | | 4,000 | | | | 3,807 | |
3.80% 07/15/48 (a) | | | 5,000 | | | | 4,472 | |
6.13% 04/01/36 (a) | | | 5,000 | | | | 5,963 | |
Berry Global Inc.
5.13% 07/15/23 (a) | | | 25,000 | | | | 24,755 | |
Biogen Inc.
2.90% 09/15/20 (a) | | | 7,000 | | | | 6,955 | |
BNP Paribas S.A.
5.00% 01/15/21 (a) | | | 7,000 | | | | 7,230 | |
Boston Scientific Corp.
4.00% 03/01/28 (a) | | | 5,000 | | | | 4,865 | |
| | | | | | | | |
| | | Principal
Amount ($) | | | Fair
Value
$ | |
BP Capital Markets America Inc.
3.02% 01/16/27 | | | 28,000 | | | | 26,284 | |
3.22% 11/28/23 | | | 19,000 | | | | 18,748 | |
Brighthouse Financial Inc.
3.70% 06/22/27 (a) | | | 2,000 | | | | 1,690 | |
Broadcom Corp./Broadcom Cayman Finance Ltd.
2.20% 01/15/21 (a) | | | 7,000 | | | | 6,841 | |
2.65% 01/15/23 (a) | | | 3,000 | | | | 2,780 | |
3.13% 01/15/25 (a) | | | 3,000 | | | | 2,692 | |
3.88% 01/15/27 (a) | | | 2,000 | | | | 1,793 | |
Brown-Forman Corp.
4.00% 04/15/38 (a) | | | 2,000 | | | | 1,956 | |
Buckeye Partners LP
5.60% 10/15/44 (a) | | | 7,000 | | | | 6,030 | |
Bunge Limited Finance Corp.
3.75% 09/25/27 (a) | | | 3,000 | | | | 2,667 | |
Burlington Northern Santa Fe LLC
3.75% 04/01/24 | | | 18,000 | | | | 18,457 | |
4.15% 12/15/48 (a) | | | 8,000 | | | | 7,808 | |
Campbell Soup Co.
3.30% 03/15/21 (a) | | | 18,000 | | | | 17,900 | |
Canadian Natural Resources Ltd.
3.85% 06/01/27 (a) | | | 3,000 | | | | 2,838 | |
4.95% 06/01/47 (a) | | | 2,000 | | | | 1,924 | |
Capital One Financial Corp.
3.75% 07/28/26 (a) | | | 5,000 | | | | 4,570 | |
4.20% 10/29/25 (a) | | | 5,000 | | | | 4,807 | |
Cardinal Health Inc.
2.62% 06/15/22 (a) | | | 6,000 | | | | 5,787 | |
3.08% 06/15/24 (a) | | | 4,000 | | | | 3,778 | |
Caterpillar Financial Services Corp.
2.55% 11/29/22 (a) | | | 19,000 | | | | 18,448 | |
Caterpillar Inc.
3.80% 08/15/42 (a) | | | 4,000 | | | | 3,727 | |
Catholic Health Initiatives
4.35% 11/01/42 (a) | | | 16,000 | | | | 14,195 | |
CBL & Associates LP
4.60% 10/15/24 (a) | | | 26,000 | | | | 19,161 | |
CBS Corp.
2.50% 02/15/23 (a) | | | 5,000 | | | | 4,707 | |
2.90% 01/15/27 (a) | | | 5,000 | | | | 4,420 | |
CCO Holdings LLC/CCO Holdings Capital Corp.
5.00% 02/01/28 (a)(h) | | | 23,000 | | | | 21,158 | |
Celgene Corp.
3.45% 11/15/27 (a) | | | 2,000 | | | | 1,821 | |
4.55% 02/20/48 (a) | | | 9,000 | | | | 7,822 | |
5.00% 08/15/45 (a) | | | 5,000 | | | | 4,616 | |
Cenovus Energy Inc.
4.25% 04/15/27 (a) | | | 2,000 | | | | 1,821 | |
See Notes to Schedule of Investments and Notes to Financial Statements.
| | | | |
| State Street Income V.I.S. Fund | | | 9 | |
State Street Income V.I.S. Fund
Schedule of Investments, continued — December 31, 2018
| | | | | | | | |
| | | Principal
Amount ($) | | | Fair
Value
$ | |
| | | | | | | | |
4.45% 09/15/42 (a) | | | 2,000 | | | | 1,535 | |
5.40% 06/15/47 (a) | | | 3,000 | | | | 2,585 | |
CenterPoint Energy Inc.
2.50% 09/01/22 (a) | | | 21,000 | | | | 20,070 | |
3.60% 11/01/21 | | | 10,000 | | | | 9,993 | |
CenturyLink Inc.
5.63% 04/01/25 (a) | | | 7,000 | | | | 6,168 | |
5.80% 03/15/22 (a) | | | 15,000 | | | | 14,406 | |
CF Industries Inc.
7.13% 05/01/20 (a) | | | 16,000 | | | | 16,463 | |
Charter Communications Operating LLC/Charter Communications Operating Capital
3.58% 07/23/20 (a) | | | 16,000 | | | | 15,980 | |
4.91% 07/23/25 (a) | | | 5,000 | | | | 4,963 | |
5.38% 05/01/47 (a) | | | 7,000 | | | | 6,295 | |
5.75% 04/01/48 (a) | | | 3,000 | | | | 2,807 | |
6.38% 10/23/35 (a) | | | 3,000 | | | | 3,073 | |
6.48% 10/23/45 (a) | | | 5,000 | | | | 5,080 | |
Chevron Corp.
2.42% 11/17/20 (a) | | | 7,000 | | | | 6,936 | |
3.19% 06/24/23 (a) | | | 4,000 | | | | 3,993 | |
Church & Dwight Company Inc.
2.45% 08/01/22 (a) | | | 7,000 | | | | 6,759 | |
Cigna Corp.
4.13% 11/15/25 (a)(h) | | | 13,000 | | | | 12,972 | |
4.38% 10/15/28 (a)(h) | | | 3,000 | | | | 3,014 | |
4.80% 08/15/38 (a)(h) | | | 3,000 | | | | 2,951 | |
4.90% 12/15/48 (a)(h) | | | 3,000 | | | | 2,934 | |
Cigna Corp.
3.20% 09/17/20 (a)(h) | | | 17,000 | | | | 16,935 | |
3.40% 09/17/21 (a)(h) | | | 9,000 | | | | 8,982 | |
3.75% 07/15/23 (a)(h) | | | 6,000 | | | | 5,985 | |
Cigna Holding Co.
3.25% 04/15/25 (a) | | | 9,000 | | | | 8,563 | |
3.88% 10/15/47 (a) | | | 6,000 | | | | 5,030 | |
Cimarex Energy Co.
3.90% 05/15/27 (a) | | | 2,000 | | | | 1,864 | |
Cinemark USA Inc.
4.88% 06/01/23 (a) | | | 18,000 | | | | 17,280 | |
Cisco Systems Inc.
5.90% 02/15/39 (a) | | | 5,000 | | | | 6,178 | |
Citigroup Inc.
2.70% 10/27/22 (a) | | | 10,000 | | | | 9,637 | |
2.75% 04/25/22 | | | 32,000 | | | | 31,073 | |
2.90% 12/08/21 (a) | | | 16,000 | | | | 15,713 | |
4.40% 06/10/25 (a) | | | 5,000 | | | | 4,912 | |
4.45% 09/29/27 (a) | | | 4,000 | | | | 3,856 | |
4.65% 07/23/48 (a) | | | 16,000 | | | | 15,645 | |
4.75% 05/18/46 (a) | | | 9,000 | | | | 8,345 | |
| | | | | | | | |
| | | Principal
Amount ($) | | | Fair
Value
$ | |
Citigroup Inc. (2.88% fixed rate until 07/24/22; 0.95% + 3 month USD LIBOR thereafter)
2.88% 07/24/23 (a)(b) | | | 8,000 | | | | 7,734 | |
Citigroup Inc. (3.88% fixed rate until 01/24/38; 1.17% + 3 month USD LIBOR thereafter)
3.88% 01/24/39 (a)(b) | | | 7,000 | | | | 6,259 | |
Citigroup Inc. (4.28% fixed rate until 04/24/47; 1.84% + 3 month USD LIBOR thereafter)
4.28% 04/24/48 (a)(b) | | | 11,000 | | | | 10,263 | |
CME Group Inc.
3.75% 06/15/28 (a) | | | 2,000 | | | | 2,026 | |
CMS Energy Corp.
4.88% 03/01/44 (a) | | | 21,000 | | | | 22,092 | |
CNA Financial Corp.
3.45% 08/15/27 (a) | | | 5,000 | | | | 4,651 | |
5.88% 08/15/20 (a) | | | 32,000 | | | | 33,185 | |
CNH Industrial Capital LLC
3.38% 07/15/19 (a) | | | 10,000 | | | | 9,973 | |
4.38% 11/06/20 (a) | | | 8,000 | | | | 8,044 | |
4.88% 04/01/21 (a) | | | 10,000 | | | | 10,083 | |
CNH Industrial N.V.
4.50% 08/15/23 (a) | | | 13,000 | | | | 13,086 | |
Columbia Pipeline Group Inc.
3.30% 06/01/20 (a) | | | 11,000 | | | | 10,965 | |
Comcast Corp.
3.38% 08/15/25 (a) | | | 5,000 | | | | 4,872 | |
3.97% 11/01/47 (a) | | | 25,000 | | | | 22,447 | |
4.15% 10/15/28 (a) | | | 23,000 | | | | 23,345 | |
4.20% 08/15/34 (a) | | | 4,000 | | | | 3,862 | |
4.25% 10/15/30 (a) | | | 7,000 | | | | 7,076 | |
4.60% 08/15/45 (a) | | | 3,000 | | | | 2,961 | |
4.70% 10/15/48 (a) | | | 4,000 | | | | 4,048 | |
Conagra Brands Inc.
3.80% 10/22/21 (a) | | | 18,000 | | | | 18,000 | |
4.30% 05/01/24 (a) | | | 19,000 | | | | 18,902 | |
5.30% 11/01/38 (a) | | | 3,000 | | | | 2,841 | |
5.40% 11/01/48 (a) | | | 7,000 | | | | 6,455 | |
Conagra Brands Inc. 0.75% + 3 month USD LIBOR
3.22% 10/22/20 (a)(b) | | | 13,000 | | | | 12,933 | |
Concho Resources Inc.
3.75% 10/01/27 (a) | | | 3,000 | | | | 2,828 | |
4.30% 08/15/28 (a) | | | 9,000 | | | | 8,805 | |
4.88% 10/01/47 (a) | | | 4,000 | | | | 3,817 | |
ConocoPhillips Co.
4.30% 11/15/44 (a) | | | 8,000 | | | | 7,890 | |
Consolidated Edison Company of New York Inc.
2.90% 12/01/26 (a) | | | 14,000 | | | | 13,153 | |
3.88% 06/15/47 (a) | | | 4,000 | | | | 3,666 | |
See Notes to Schedule of Investments and Notes to Financial Statements.
| | |
| 10 | | State Street Income V.I.S. Fund |
State Street Income V.I.S. Fund
Schedule of Investments, continued — December 31, 2018
| | | | | | | | |
| | | Principal
Amount ($) | | | Fair
Value
$ | |
| | | | | | | | |
Constellation Brands Inc.
2.70% 05/09/22 (a) | | | 9,000 | | | | 8,690 | |
4.50% 05/09/47 (a) | | | 3,000 | | | | 2,688 | |
Continental Resources Inc.
4.50% 04/15/23 (a) | | | 8,000 | | | | 7,853 | |
Corning Inc.
4.38% 11/15/57 (a) | | | 6,000 | | | | 5,036 | |
Corporation Andina de Fomento
2.20% 07/18/20 (a) | | | 16,000 | | | | 15,757 | |
4.38% 06/15/22 (a) | | | 69,000 | | | | 71,524 | |
Crane Co.
4.20% 03/15/48 (a) | | | 5,000 | | | | 4,630 | |
CSX Corp.
4.50% 08/01/54 (a) | | | 11,000 | | | | 10,416 | |
CVS Health Corp.
2.25% 08/12/19 (a) | | | 17,000 | | | | 16,908 | |
3.13% 03/09/20 (a) | | | 51,000 | | | | 50,900 | |
3.35% 03/09/21 (a) | | | 34,000 | | | | 33,897 | |
3.70% 03/09/23 (a) | | | 7,000 | | | | 6,931 | |
3.88% 07/20/25 (a) | | | 5,000 | | | | 4,876 | |
4.10% 03/25/25 (a) | | | 9,000 | | | | 8,908 | |
4.30% 03/25/28 (a) | | | 2,000 | | | | 1,957 | |
4.78% 03/25/38 (a) | | | 2,000 | | | | 1,922 | |
5.00% 12/01/24 (a) | | | 8,000 | | | | 8,330 | |
5.05% 03/25/48 (a) | | | 6,000 | | | | 5,854 | |
D.R. Horton Inc.
2.55% 12/01/20 (a) | | | 16,000 | | | | 15,592 | |
Dana Financing Luxembourg Sarl
6.50% 06/01/26 (a)(h) | | | 15,000 | | | | 14,406 | |
Dell International LLC/EMC Corp.
3.48% 06/01/19 (a)(h) | | | 32,000 | | | | 31,924 | |
5.45% 06/15/23 (a)(h) | | | 5,000 | | | | 5,095 | |
6.02% 06/15/26 (a)(h) | | | 5,000 | | | | 5,024 | |
8.10% 07/15/36 (a)(h) | | | 2,000 | | | | 2,164 | |
8.35% 07/15/46 (a)(h) | | | 4,000 | | | | 4,333 | |
Deutsche Bank AG
2.70% 07/13/20 (a) | | | 16,000 | | | | 15,518 | |
Devon Energy Corp.
4.00% 07/15/21 (a) | | | 20,000 | | | | 20,044 | |
5.00% 06/15/45 (a) | | | 6,000 | | | | 5,307 | |
Diageo Investment Corp.
2.88% 05/11/22 (a) | | | 20,000 | | | | 19,773 | |
Diamondback Energy Inc.
4.75% 11/01/24 (a)(h) | | | 20,000 | | | | 19,306 | |
Discovery Communications LLC
2.20% 09/20/19 (a) | | | 13,000 | | | | 12,884 | |
3.95% 03/20/28 (a) | | | 5,000 | | | | 4,634 | |
5.00% 09/20/37 (a) | | | 3,000 | | | | 2,771 | |
5.20% 09/20/47 (a) | | | 2,000 | | | | 1,842 | |
DISH DBS Corp.
5.88% 07/15/22 (a) | | | 12,000 | | | | 10,992 | |
| | | | | | | | |
| | | Principal
Amount ($) | | | Fair
Value
$ | |
Dollar Tree Inc.
3.70% 05/15/23 (a) | | | 7,000 | | | | 6,860 | |
4.00% 05/15/25 (a) | | | 7,000 | | | | 6,728 | |
Dominion Energy Inc.
2.58% 07/01/20 (a) | | | 11,000 | | | | 10,835 | |
DowDuPont Inc.
3.77% 11/15/20 (a) | | | 32,000 | | | | 32,295 | |
5.32% 11/15/38 (a) | | | 6,000 | | | | 6,187 | |
5.42% 11/15/48 (a) | | | 6,000 | | | | 6,248 | |
DTE Energy Co.
2.85% 10/01/26 (a) | | | 10,000 | | | | 9,203 | |
3.85% 12/01/23 (a) | | | 8,000 | | | | 8,041 | |
Duke Energy Carolinas LLC
3.95% 03/15/48 (a) | | | 5,000 | | | | 4,783 | |
Duke Energy Corp.
1.80% 09/01/21 | | | 13,000 | | | | 12,423 | |
3.55% 09/15/21 | | | 8,000 | | | | 8,022 | |
3.75% 09/01/46 (a) | | | 3,000 | | | | 2,608 | |
Duke Energy Progress LLC
4.15% 12/01/44 (a) | | | 11,000 | | | | 10,730 | |
Duke Realty LP
3.25% 06/30/26 (a) | | | 4,000 | | | | 3,800 | |
3.38% 12/15/27 (a) | | | 3,000 | | | | 2,847 | |
Duquesne Light Holdings Inc.
3.62% 08/01/27 (a)(h) | | | 11,000 | | | | 10,353 | |
Eastman Chemical Co.
3.50% 12/01/21 (a) | | | 10,000 | | | | 10,048 | |
3.60% 08/15/22 (a) | | | 9,000 | | | | 8,992 | |
4.50% 01/15/21 (a) | | | 18,000 | | | | 18,256 | |
Eaton Corp.
3.10% 09/15/27 (a) | | | 4,000 | | | | 3,774 | |
Ecolab Inc.
3.25% 12/01/27 (a) | | | 2,000 | | | | 1,922 | |
3.95% 12/01/47 (a) | | | 4,000 | | | | 3,756 | |
Ecopetrol S.A.
5.88% 05/28/45 (a) | | | 16,000 | | | | 15,100 | |
Edison International
4.13% 03/15/28 (a) | | | 8,000 | | | | 7,586 | |
EI du Pont de Nemours & Co. 0.53% + 3 month USD LIBOR
3.07% 05/01/20 (a)(b) | | | 13,000 | | | | 13,012 | |
Electricite de France S.A.
2.15% 01/22/19 (a)(h) | | | 46,000 | | | | 45,968 | |
Eli Lilly & Co.
3.70% 03/01/45 (a) | | | 2,000 | | | | 1,882 | |
EMC Corp.
2.65% 06/01/20 (a) | | | 39,000 | | | | 37,452 | |
Emera US Finance LP
4.75% 06/15/46 (a) | | | 3,000 | | | | 2,884 | |
Enbridge Energy Partners LP
5.50% 09/15/40 (a) | | | 4,000 | | | | 4,110 | |
Encana Corp.
3.90% 11/15/21 (a) | | | 16,000 | | | | 15,996 | |
See Notes to Schedule of Investments and Notes to Financial Statements.
| | | | |
| State Street Income V.I.S. Fund | | | 11 | |
State Street Income V.I.S. Fund
Schedule of Investments, continued — December 31, 2018
| | | | | | | | |
| | | Principal
Amount ($) | | | Fair
Value
$ | |
| | | | | | | | |
Energy Transfer LP
4.25% 03/15/23 (a) | | | 8,000 | | | | 7,715 | |
5.88% 01/15/24 (a) | | | 84,000 | | | | 85,603 | |
7.50% 10/15/20 (a) | | | 14,000 | | | | 14,630 | |
Energy Transfer Operating LP
4.95% 06/15/28 (a) | | | 4,000 | | | | 3,924 | |
Energy Transfer Operating LP
5.80% 06/15/38 (a) | | | 5,000 | | | | 4,840 | |
6.13% 12/15/45 (a) | | | 3,000 | | | | 2,909 | |
6.50% 02/01/42 (a) | | | 8,000 | | | | 8,067 | |
Energy Transfer Partners LP/Regency Energy Finance Corp.
4.50% 11/01/23 (a) | | | 4,000 | | | | 3,990 | |
EnLink Midstream Partners LP
4.15% 06/01/25 (a) | | | 15,000 | | | | 13,500 | |
Entergy Louisiana LLC
3.05% 06/01/31 (a) | | | 10,000 | | | | 9,023 | |
4.00% 03/15/33 (a) | | | 3,000 | | | | 3,023 | |
Enterprise Products Operating LLC
4.25% 02/15/48 (a) | | | 19,000 | | | | 16,999 | |
Enterprise Products Operating LLC (5.25% fixed rate until 08/16/27; 3.03% + 3 month USD LIBOR thereafter)
5.25% 08/16/77 (a)(b) | | | 7,000 | | | | 5,834 | |
EOG Resources Inc.
4.10% 02/01/21 (a) | | | 16,000 | | | | 16,215 | |
EPR Properties
4.95% 04/15/28 (a) | | | 4,000 | | | | 3,960 | |
EQM Midstream Partners LP
4.75% 07/15/23 (a) | | | 2,000 | | | | 1,990 | |
5.50% 07/15/28 (a) | | | 2,000 | | | | 1,964 | |
EQT Corp.
3.90% 10/01/27 (a) | | | 4,000 | | | | 3,459 | |
ERP Operating LP
4.50% 07/01/44 (a) | | | 9,000 | | | | 9,056 | |
Exelon Corp.
3.50% 06/01/22 (a) | | | 11,000 | | | | 10,749 | |
4.45% 04/15/46 (a) | | | 7,000 | | | | 6,667 | |
Express Scripts Holding Co.
3.40% 03/01/27 (a) | | | 5,000 | | | | 4,639 | |
Exxon Mobil Corp.
2.22% 03/01/21 (a) | | | 11,000 | | | | 10,861 | |
FedEx Corp.
4.10% 02/01/45 (a) | | | 14,000 | | | | 12,027 | |
FirstEnergy Corp.
3.90% 07/15/27 (a) | | | 2,000 | | | | 1,937 | |
4.85% 07/15/47 (a) | | | 5,000 | | | | 4,982 | |
Florida Power & Light Co.
4.13% 02/01/42 (a) | | | 17,000 | | | | 17,105 | |
Ford Motor Co.
4.35% 12/08/26 (a) | | | 8,000 | | | | 7,140 | |
| | | | | | | | |
| | | Principal
Amount ($) | | | Fair
Value
$ | |
Frontier Communications Corp.
7.13% 03/15/19 (a) | | | 19,000 | | | | 18,390 | |
General Dynamics Corp.
2.13% 08/15/26 (a) | | | 15,000 | | | | 13,535 | |
2.88% 05/11/20 (a) | | | 18,000 | | | | 18,012 | |
3.00% 05/11/21 (a) | | | 24,000 | | | | 24,024 | |
3.50% 05/15/25 (a) | | | 6,000 | | | | 6,010 | |
General Mills Inc.
3.20% 04/16/21 (a) | | | 15,000 | | | | 14,917 | |
3.70% 10/17/23 (a) | | | 5,000 | | | | 4,977 | |
4.55% 04/17/38 (a) | | | 2,000 | | | | 1,831 | |
4.70% 04/17/48 (a) | | | 3,000 | | | | 2,730 | |
General Motors Co.
5.20% 04/01/45 (a) | | | 3,000 | | | | 2,488 | |
5.40% 04/01/48 (a) | | | 2,000 | | | | 1,754 | |
General Motors Financial Company Inc.
2.35% 10/04/19 (a) | | | 17,000 | | | | 16,814 | |
3.15% 01/15/20 (a) | | | 22,000 | | | | 21,859 | |
3.20% 07/13/20 (a) | | | 9,000 | | | | 8,908 | |
3.45% 01/14/22 | | | 20,000 | | | | 19,355 | |
3.55% 04/09/21 (a) | | | 24,000 | | | | 23,702 | |
5.25% 03/01/26 (a) | | | 19,000 | | | | 18,649 | |
Georgia-Pacific LLC
3.60% 03/01/25 (a)(h) | | | 5,000 | | | | 4,999 | |
Gilead Sciences Inc.
2.55% 09/01/20 (a) | | | 7,000 | | | | 6,942 | |
2.95% 03/01/27 (a) | | | 3,000 | | | | 2,789 | |
3.50% 02/01/25 (a) | | | 4,000 | | | | 3,907 | |
3.65% 03/01/26 (a) | | | 2,000 | | | | 1,963 | |
4.15% 03/01/47 (a) | | | 9,000 | | | | 8,264 | |
GlaxoSmithKline Capital Inc.
3.38% 05/15/23 (a) | | | 9,000 | | | | 9,045 | |
3.63% 05/15/25 (a) | | | 6,000 | | | | 6,034 | |
GlaxoSmithKline Capital PLC
3.13% 05/14/21 (a) | | | 12,000 | | | | 12,016 | |
Glencore Finance Canada Ltd.
4.95% 11/15/21 (a)(h) | | | 7,000 | | | | 7,176 | |
Glencore Funding LLC
2.50% 01/15/19 (a)(h) | | | 33,000 | | | | 32,990 | |
Gray Escrow Inc.
7.00% 05/15/27 (a)(h) | | | 9,000 | | | | 8,762 | |
H&E Equipment Services Inc.
5.63% 09/01/25 (a) | | | 27,000 | | | | 24,741 | |
Halliburton Co.
3.80% 11/15/25 (a) | | | 5,000 | | | | 4,848 | |
5.00% 11/15/45 (a) | | | 6,000 | | | | 5,888 | |
HCA Inc.
4.75% 05/01/23 (a) | | | 40,000 | | | | 39,393 | |
5.88% 02/15/26 | | | 8,000 | | | | 8,028 | |
HD Supply Inc.
5.38% 10/15/26 (a)(h) | | | 7,000 | | | | 6,790 | |
See Notes to Schedule of Investments and Notes to Financial Statements.
| | |
| 12 | | State Street Income V.I.S. Fund |
State Street Income V.I.S. Fund
Schedule of Investments, continued — December 31, 2018
| | | | | | | | |
| | | Principal
Amount ($) | | | Fair
Value
$ | |
| | | | | | | | |
Hess Corp.
5.60% 02/15/41 (a) | | | 4,000 | | | | 3,521 | |
5.80% 04/01/47 (a) | | | 2,000 | | | | 1,798 | |
Hewlett Packard Enterprise Co.
6.35% 10/15/45 (a) | | | 5,000 | | | | 4,679 | |
Highwoods Realty LP
4.13% 03/15/28 (a) | | | 7,000 | | | | 6,869 | |
Hilcorp Energy I LP/Hilcorp Finance Co.
5.75% 10/01/25 (a)(h) | | | 24,000 | | | | 21,386 | |
6.25% 11/01/28 (a)(h) | | | 5,000 | | | | 4,396 | |
HSBC Holdings PLC (6.50% fixed rate until 03/23/28; 3.61% + USD 5 yearMid-Market Swap Rate thereafter)
6.50% 12/31/99 (a)(b) | | | 15,000 | | | | 13,745 | |
Hughes Satellite Systems Corp.
6.63% 08/01/26 (a) | | | 7,000 | | | | 6,431 | |
Hyundai Capital America
3.10% 04/05/22 (a)(h) | | | 7,000 | | | | 6,839 | |
Icahn Enterprises LP/Icahn Enterprises Finance Corp.
6.00% 08/01/20 (a) | | | 24,000 | | | | 23,962 | |
Ingersoll-Rand Luxembourg Finance S.A.
3.55% 11/01/24 (a) | | | 7,000 | | | | 6,933 | |
Intel Corp.
2.60% 05/19/26 (a) | | | 10,000 | | | | 9,389 | |
2.88% 05/11/24 (a) | | | 3,000 | | | | 2,926 | |
International Paper Co.
4.40% 08/15/47 (a) | | | 7,000 | | | | 5,932 | |
Interstate Power & Light Co.
3.40% 08/15/25 (a) | | | 8,000 | | | | 7,752 | |
j2 Cloud Services LLC/j2 GlobalCo-Obligor Inc.
6.00% 07/15/25 (a)(h) | | | 14,000 | | | | 13,714 | |
Jabil Inc.
3.95% 01/12/28 (a) | | | 4,000 | | | | 3,551 | |
JBS USA LUX S.A./JBS USA Finance Inc.
6.75% 02/15/28 (a)(h) | | | 15,000 | | | | 14,653 | |
Jefferies Group LLC
5.13% 01/20/23 (a) | | | 10,000 | | | | 10,267 | |
6.50% 01/20/43 (a) | | | 16,000 | | | | 15,651 | |
Johnson & Johnson
3.63% 03/03/37 (a) | | | 5,000 | | | | 4,806 | |
Johnson Controls International PLC
4.50% 02/15/47 (a) | | | 5,000 | | | | 4,606 | |
JPMorgan Chase & Co.
2.30% 08/15/21 (a) | | | 31,000 | | | | 30,190 | |
2.55% 10/29/20 (a) | | | 20,000 | | | | 19,767 | |
| | | | | | | | |
| | | Principal
Amount ($) | | | Fair
Value
$ | |
3.13% 01/23/25 | | | 12,000 | | | | 11,439 | |
3.30% 04/01/26 (a) | | | 5,000 | | | | 4,758 | |
3.63% 12/01/27 (a) | | | 5,000 | | | | 4,663 | |
JPMorgan Chase & Co. (3.51% fixed rate until 01/23/28; 0.95% + 3 month USD LIBOR thereafter)
3.51% 01/23/29 (a)(b) | | | 8,000 | | | | 7,540 | |
JPMorgan Chase & Co. (3.88% fixed rate until 07/24/37; 1.36% + 3 month USD LIBOR thereafter)
3.88% 07/24/38 (a)(b) | | | 4,000 | | | | 3,621 | |
JPMorgan Chase & Co. (3.90% fixed rate until 01/23/48; 1.22% + 3 month USD LIBOR thereafter)
3.90% 01/23/49 (a)(b) | | | 4,000 | | | | 3,513 | |
JPMorgan Chase & Co. (4.01% fixed rate until 04/23/28; 1.12% + 3 month USD LIBOR thereafter)
4.01% 04/23/29 (a)(b) | | | 4,000 | | | | 3,924 | |
JPMorgan Chase & Co. (4.03% fixed rate until 07/24/47; 1.46% + 3 month USD LIBOR thereafter)
4.03% 07/24/48 (a)(b) | | | 5,000 | | | | 4,483 | |
JPMorgan Chase & Co. (4.63% fixed rate until 11/01/22; 2.58% + 3 month USD LIBOR thereafter)
4.63% 12/31/99 (a)(b) | | | 12,000 | | | | 10,271 | |
JPMorgan Chase & Co. (6.10% fixed rate until 10/01/24; 3.33% + 3 month USD LIBOR thereafter)
6.10% 10/29/49 (a)(b) | | | 45,000 | | | | 44,668 | |
JPMorgan Chase & Co. 3.47% + 3 month USD LIBOR
5.99% 12/29/49 (a)(b) | | | 11,000 | | | | 10,863 | |
Keurig Dr Pepper Inc.
3.55% 05/25/21 (a)(h) | | | 51,000 | | | | 50,931 | |
4.06% 05/25/23 (a)(h) | | | 9,000 | | | | 8,973 | |
4.50% 11/15/45 (a) | | | 3,000 | | | | 2,636 | |
4.60% 05/25/28 (a)(h) | | | 6,000 | | | | 5,980 | |
Kimberly-Clark Corp.
3.95% 11/01/28 (a) | | | 18,000 | | | | 18,513 | |
Kinder Morgan Energy Partners LP
3.50% 03/01/21 (a) | | | 24,000 | | | | 23,920 | |
4.70% 11/01/42 (a) | | | 2,000 | | | | 1,773 | |
5.30% 09/15/20 (a) | | | 8,000 | | | | 8,223 | |
6.38% 03/01/41 (a) | | | 9,000 | | | | 9,589 | |
See Notes to Schedule of Investments and Notes to Financial Statements.
| | | | |
| State Street Income V.I.S. Fund | | | 13 | |
State Street Income V.I.S. Fund
Schedule of Investments, continued — December 31, 2018
| | | | | | | | |
| | | Principal
Amount ($) | | | Fair
Value
$ | |
| | | | | | | | |
Kinder Morgan Inc.
3.05% 12/01/19 (a) | | | 8,000 | | | | 7,953 | |
4.30% 03/01/28 (a) | | | 3,000 | | | | 2,939 | |
5.05% 02/15/46 (a) | | | 9,000 | | | | 8,368 | |
5.55% 06/01/45 (a) | | | 10,000 | | | | 9,963 | |
Kraft Heinz Foods Co.
4.38% 06/01/46 (a) | | | 6,000 | | | | 4,964 | |
L Brands Inc.
5.25% 02/01/28 (a) | | | 22,000 | | | | 18,804 | |
L3 Technologies Inc.
3.85% 12/15/26 (a) | | | 8,000 | | | | 7,737 | |
Lamb Weston Holdings Inc.
4.63% 11/01/24 (a)(h) | | | 23,000 | | | | 22,418 | |
Lee Enterprises Inc.
9.50% 03/15/22 (a)(h) | | | 23,000 | | | | 23,425 | |
Lennar Corp.
4.75% 05/30/25 - 11/29/27 (a) | | | 34,000 | | | | 31,245 | |
Lincoln National Corp.
3.63% 12/12/26 (a) | | | 4,000 | | | | 3,856 | |
3.80% 03/01/28 (a) | | | 4,000 | | | | 3,853 | |
4.35% 03/01/48 (a) | | | 7,000 | | | | 6,363 | |
LYB International Finance BV
4.88% 03/15/44 (a) | | | 5,000 | | | | 4,549 | |
Macy’s Retail Holdings Inc.
4.30% 02/15/43 (a) | | | 4,000 | | | | 2,954 | |
Marathon Oil Corp.
2.70% 06/01/20 (a) | | | 19,000 | | | | 18,689 | |
3.85% 06/01/25 (a) | | | 8,000 | | | | 7,501 | |
Marsh & McLennan Companies Inc.
3.50% 03/10/25 (a) | | | 7,000 | | | | 6,845 | |
Masco Corp.
3.50% 11/15/27 (a) | | | 2,000 | | | | 1,841 | |
McDonald’s Corp.
3.70% 01/30/26 (a) | | | 5,000 | | | | 4,912 | |
3.80% 04/01/28 (a) | | | 11,000 | | | | 10,783 | |
4.88% 12/09/45 (a) | | | 8,000 | | | | 8,064 | |
McKesson Corp.
3.65% 11/30/20 | | | 40,000 | | | | 40,164 | |
Medtronic Inc.
2.50% 03/15/20 (a) | | | 18,000 | | | | 17,922 | |
4.63% 03/15/45 (a) | | | 6,000 | | | | 6,309 | |
Memorial Sloan-Kettering Cancer Center
4.13% 07/01/52 (a) | | | 17,000 | | | | 16,866 | |
Merck & Company Inc.
2.75% 02/10/25 (a) | | | 7,000 | | | | 6,773 | |
MetLife Inc.
4.05% 03/01/45 (a) | | | 3,000 | | | | 2,771 | |
4.72% 12/15/44 (a) | | | 10,000 | | | | 10,205 | |
MGM Resorts International
4.63% 09/01/26 (a) | | | 16,000 | | | | 14,380 | |
| | | | | | | | |
| | | Principal
Amount ($) | | | Fair
Value
$ | |
Microsoft Corp.
2.40% 08/08/26 (a) | | | 8,000 | | | | 7,462 | |
3.45% 08/08/36 (a) | | | 5,000 | | | | 4,747 | |
3.50% 02/12/35 (a) | | | 3,000 | | | | 2,881 | |
3.70% 08/08/46 (a) | | | 13,000 | | | | 12,481 | |
4.00% 02/12/55 (a) | | | 7,000 | | | | 6,893 | |
4.10% 02/06/37 (a) | | | 4,000 | | | | 4,109 | |
4.50% 02/06/57 (a) | | | 3,000 | | | | 3,229 | |
Molina Healthcare Inc.
4.88% 06/15/25 (a)(h) | | | 21,000 | | | | 19,180 | |
Molson Coors Brewing Co.
2.10% 07/15/21 (a) | | | 11,000 | | | | 10,598 | |
4.20% 07/15/46 (a) | | | 6,000 | | | | 4,986 | |
Morgan Stanley
2.45% 02/01/19 (a) | | | 54,000 | | | | 53,969 | |
2.63% 11/17/21 (a) | | | 26,000 | | | | 25,356 | |
2.65% 01/27/20 (a) | | | 25,000 | | | | 24,824 | |
2.75% 05/19/22 (a) | | | 34,000 | | | | 33,047 | |
3.70% 10/23/24 (a) | | | 8,000 | | | | 7,875 | |
3.95% 04/23/27 (a) | | | 41,000 | | | | 38,610 | |
Morgan Stanley (3.97% fixed rate until 07/22/37; 1.46% + 3 month USD LIBOR thereafter)
3.97% 07/22/38 (a)(b) | | | 8,000 | | | | 7,295 | |
MPLX LP
3.38% 03/15/23 (a) | | | 5,000 | | | | 4,857 | |
4.50% 04/15/38 (a) | | | 4,000 | | | | 3,513 | |
4.70% 04/15/48 (a) | | | 6,000 | | | | 5,182 | |
5.50% 02/15/49 (a) | | | 8,000 | | | | 7,754 | |
Murphy Oil Corp.
5.75% 08/15/25 (a) | | | 56,000 | | | | 52,509 | |
Mylan Inc.
5.20% 04/15/48 (a)(h) | | | 5,000 | | | | 4,256 | |
Mylan N.V.
3.15% 06/15/21 (a) | | | 9,000 | | | | 8,821 | |
3.95% 06/15/26 (a) | | | 4,000 | | | | 3,610 | |
National Retail Properties Inc.
4.00% 11/15/25 (a) | | | 8,000 | | | | 7,926 | |
Navient Corp.
6.75% 06/15/26 (a) | | | 15,000 | | | | 12,451 | |
8.00% 03/25/20 (a) | | | 16,000 | | | | 16,273 | |
Newell Brands Inc.
3.85% 04/01/23 (a) | | | 7,000 | | | | 6,909 | |
Newfield Exploration Co.
5.38% 01/01/26 (a) | | | 23,000 | | | | 22,766 | |
5.75% 01/30/22 (a) | | | 20,000 | | | | 20,300 | |
Newmark Group Inc.
6.13% 11/15/23 (a)(h) | | | 10,000 | | | | 9,604 | |
Newmont Mining Corp.
4.88% 03/15/42 (a) | | | 7,000 | | | | 6,618 | |
Nexen Energy ULC
6.40% 05/15/37 (a) | | | 7,000 | | | | 8,571 | |
See Notes to Schedule of Investments and Notes to Financial Statements.
| | |
| 14 | | State Street Income V.I.S. Fund |
State Street Income V.I.S. Fund
Schedule of Investments, continued — December 31, 2018
| | | | | | | | |
| | | Principal
Amount ($) | | | Fair
Value
$ | |
| | | | | | | | |
NGPL PipeCo LLC
4.88% 08/15/27 (a)(h) | | | 2,000 | | | | 1,898 | |
Noble Energy Inc.
3.90% 11/15/24 (a) | | | 4,000 | | | | 3,859 | |
5.05% 11/15/44 (a) | | | 3,000 | | | | 2,612 | |
Nordstrom Inc.
5.00% 01/15/44 (a) | | | 2,000 | | | | 1,719 | |
Norfolk Southern Corp.
3.95% 10/01/42 (a) | | | 6,000 | | | | 5,493 | |
Northern States Power Co.
2.20% 08/15/20 (a) | | | 45,000 | | | | 44,382 | |
Northrop Grumman Corp.
2.08% 10/15/20 (a) | | | 7,000 | | | | 6,868 | |
2.55% 10/15/22 (a) | | | 5,000 | | | | 4,842 | |
3.25% 01/15/28 (a) | | | 4,000 | | | | 3,737 | |
3.85% 04/15/45 (a) | | | 4,000 | | | | 3,530 | |
4.03% 10/15/47 (a) | | | 6,000 | | | | 5,452 | |
Novartis Capital Corp.
3.00% 11/20/25 (a) | | | 3,000 | | | | 2,908 | |
Nucor Corp.
3.95% 05/01/28 (a) | | | 6,000 | | | | 5,939 | |
4.13% 09/15/22 (a) | | | 8,000 | | | | 8,236 | |
Nutrien Ltd.
4.00% 12/15/26 (a) | | | 3,000 | | | | 2,903 | |
4.90% 06/01/43 (a) | | | 6,000 | | | | 5,755 | |
Occidental Petroleum Corp.
4.10% 02/15/47 (a) | | | 6,000 | | | | 5,644 | |
4.20% 03/15/48 (a) | | | 3,000 | | | | 2,865 | |
Olin Corp.
5.00% 02/01/30 (a) | | | 23,000 | | | | 20,118 | |
Omnicom Group Inc./Omnicom Capital Inc.
3.63% 05/01/22 (a) | | | 13,000 | | | | 12,825 | |
Oncor Electric Delivery Company LLC
3.80% 09/30/47 (a) | | | 2,000 | | | | 1,885 | |
Oracle Corp.
2.40% 09/15/23 (a) | | | 4,000 | | | | 3,840 | |
3.25% 11/15/27 (a) | | | 5,000 | | | | 4,822 | |
3.80% 11/15/37 (a) | | | 3,000 | | | | 2,803 | |
4.00% 07/15/46 - 11/15/47 (a) | | | 15,000 | | | | 13,981 | |
Oshkosh Corp.
5.38% 03/01/25 (a) | | | 6,000 | | | | 6,033 | |
Owens Corning
4.40% 01/30/48 (a) | | | 5,000 | | | | 3,828 | |
Pacific Gas & Electric Co.
3.40% 08/15/24 (a) | | | 68,000 | | | | 59,246 | |
PacifiCorp
6.25% 10/15/37 (a) | | | 4,000 | | | | 4,969 | |
Packaging Corporation of America
3.40% 12/15/27 (a) | | | 3,000 | | | | 2,805 | |
Parker-Hannifin Corp.
3.25% 03/01/27 (a) | | | 30,000 | | | | 28,740 | |
| | | | | | | | |
| | | Principal
Amount ($) | | | Fair
Value
$ | |
Party City Holdings Inc.
6.63% 08/01/26 (a)(h) | | | 15,000 | | | | 13,642 | |
Penske Automotive Group Inc.
5.38% 12/01/24 (a) | | | 19,000 | | | | 17,791 | |
PepsiCo Inc.
3.45% 10/06/46 (a) | | | 6,000 | | | | 5,370 | |
Petroleos Mexicanos
5.35% 02/12/28 | | | 10,000 | | | | 8,750 | |
5.63% 01/23/46 (a) | | | 10,000 | | | | 7,576 | |
6.35% 02/12/48 | | | 10,000 | | | | 7,989 | |
6.38% 01/23/45 (a) | | | 12,000 | | | | 9,703 | |
6.50% 03/13/27 (a) | | | 15,000 | | | | 14,135 | |
6.75% 09/21/47 (a) | | | 20,000 | | | | 16,573 | |
Pfizer Inc.
3.00% 12/15/26 (a) | | | 5,000 | | | | 4,826 | |
3.20% 09/15/23 (a) | | | 6,000 | | | | 6,015 | |
3.60% 09/15/28 (a) | | | 13,000 | | | | 13,048 | |
4.13% 12/15/46 (a) | | | 7,000 | | | | 7,026 | |
4.40% 05/15/44 (a) | | | 4,000 | | | | 4,162 | |
Philip Morris International Inc.
4.13% 03/04/43 (a) | | | 7,000 | | | | 6,219 | |
Phillips 66
3.90% 03/15/28 (a) | | | 7,000 | | | | 6,736 | |
Phillips 66 Partners LP
3.75% 03/01/28 (a) | | | 3,000 | | | | 2,771 | |
4.68% 02/15/45 (a) | | | 6,000 | | | | 5,338 | |
Pilgrim’s Pride Corp.
5.88% 09/30/27 (a)(h) | | | 26,000 | | | | 23,702 | |
Pioneer Natural Resources Co.
3.95% 07/15/22 | | | 13,000 | | | | 13,031 | |
Plains All American Pipeline LP/PAA Finance Corp.
4.70% 06/15/44 (a) | | | 6,000 | | | | 5,006 | |
5.75% 01/15/20 (a) | | | 10,000 | | | | 10,200 | |
PPL Capital Funding Inc.
3.10% 05/15/26 (a) | | | 19,000 | | | | 17,815 | |
Precision Castparts Corp.
4.38% 06/15/45 (a) | | | 12,000 | | | | 11,988 | |
Prudential Financial Inc. (5.70% fixed rate until 09/15/28; 2.67% + 3 month USD LIBOR thereafter)
5.70% 09/15/48 (a)(b) | | | 12,000 | | | | 11,044 | |
Public Service Company of Colorado
3.70% 06/15/28 (a) | | | 11,000 | | | | 11,111 | |
Public Service Electric & Gas Co.
2.38% 05/15/23 (a) | | | 47,000 | | | | 45,406 | |
PulteGroup Inc.
5.50% 03/01/26 (a) | | | 20,000 | | | | 19,300 | |
QUALCOMM Inc.
2.90% 05/20/24 (a) | | | 2,000 | | | | 1,904 | |
See Notes to Schedule of Investments and Notes to Financial Statements.
| | | | |
| State Street Income V.I.S. Fund | | | 15 | |
State Street Income V.I.S. Fund
Schedule of Investments, continued — December 31, 2018
| | | | | | | | |
| | | Principal
Amount ($) | | | Fair
Value
$ | |
| | | | | | | | |
3.00% 05/20/22 (a) | | | 5,000 | | | | 4,926 | |
3.25% 05/20/27 (a) | | | 2,000 | | | | 1,861 | |
4.30% 05/20/47 (a) | | | 3,000 | | | | 2,670 | |
Quicken Loans Inc.
5.25% 01/15/28 (a)(h) | | | 14,000 | | | | 12,565 | |
Range Resources Corp.
5.00% 08/15/22 (a) | | | 23,000 | | | | 20,592 | |
Realty Income Corp.
3.00% 01/15/27 (a) | | | 5,000 | | | | 4,641 | |
Republic Services Inc.
3.38% 11/15/27 (a) | | | 2,000 | | | | 1,918 | |
Reynolds American Inc.
4.45% 06/12/25 (a) | | | 4,000 | | | | 3,847 | |
Rio Tinto Finance USA PLC
4.13% 08/21/42 (a) | | | 6,000 | | | | 5,783 | |
Rockwell Collins Inc.
3.50% 03/15/27 (a) | | | 3,000 | | | | 2,824 | |
Rogers Communications Inc.
5.00% 03/15/44 (a) | | | 4,000 | | | | 4,157 | |
RPM International Inc.
3.75% 03/15/27 (a) | | | 2,000 | | | | 1,903 | |
Ryder System Inc.
2.45% 09/03/19 (a) | | | 53,000 | | | | 52,694 | |
Sabine Pass Liquefaction LLC
4.20% 03/15/28 (a) | | | 4,000 | | | | 3,806 | |
5.00% 03/15/27 (a) | | | 2,000 | | | | 2,013 | |
salesforce.com Inc.
3.25% 04/11/23 (a) | | | 7,000 | | | | 7,028 | |
3.70% 04/11/28 (a) | | | 11,000 | | | | 11,048 | |
Santander Holdings USA Inc.
2.65% 04/17/20 (a) | | | 27,000 | | | | 26,656 | |
3.70% 03/28/22 (a) | | | 27,000 | | | | 26,515 | |
4.40% 07/13/27 (a) | | | 4,000 | | | | 3,776 | |
Schlumberger Holdings Corp.
3.00% 12/21/20 (a)(h) | | | 10,000 | | | | 9,916 | |
3.63% 12/21/22 (h) | | | 28,000 | | | | 27,872 | |
4.00% 12/21/25 (h) | | | 10,000 | | | | 9,860 | |
Sempra Energy
3.80% 02/01/38 (a) | | | 2,000 | | | | 1,722 | |
4.00% 02/01/48 (a) | | | 4,000 | | | | 3,376 | |
Shell International Finance BV
2.38% 08/21/22 | | | 14,000 | | | | 13,602 | |
3.75% 09/12/46 (a) | | | 7,000 | | | | 6,485 | |
4.13% 05/11/35 (a) | | | 8,000 | | | | 7,966 | |
Shire Acquisitions Investments Ireland DAC
2.40% 09/23/21 (a) | | | 7,000 | | | | 6,763 | |
2.88% 09/23/23 (a) | | | 3,000 | | | | 2,835 | |
3.20% 09/23/26 (a) | | | 3,000 | | | | 2,735 | |
Simon Property Group LP
3.38% 06/15/27 (a) | | | 4,000 | | | | 3,835 | |
Sinclair Television Group Inc.
5.38% 04/01/21 (a) | | | 29,000 | | | | 28,905 | |
| | | | | | | | |
| | | Principal
Amount ($) | | | Fair
Value
$ | |
Sirius XM Radio Inc.
5.00% 08/01/27 (a)(h) | | | 7,000 | | | | 6,393 | |
SM Energy Co.
5.63% 06/01/25 | | | 8,000 | | | | 6,960 | |
Smithfield Foods Inc.
2.70% 01/31/20 (a)(h) | | | 8,000 | | | | 7,900 | |
4.25% 02/01/27 (a)(h) | | | 11,000 | | | | 10,051 | |
South Carolina Electric & Gas Co.
4.10% 06/15/46 (a) | | | 4,000 | | | | 3,796 | |
Southern California Edison Co.
2.40% 02/01/22 (a) | | | 20,000 | | | | 19,265 | |
Southern Company Gas Capital Corp.
4.40% 05/30/47 (a) | | | 2,000 | | | | 1,862 | |
Southern Copper Corp.
5.88% 04/23/45 (a) | | | 8,000 | | | | 8,133 | |
Southwestern Electric Power Co.
2.75% 10/01/26 (a) | | | 7,000 | | | | 6,446 | |
Spectra Energy Partners LP
3.38% 10/15/26 (a) | | | 2,000 | | | | 1,874 | |
4.50% 03/15/45 (a) | | | 3,000 | | | | 2,744 | |
Sprint Corp.
7.63% 02/15/25 (a) | | | 35,000 | | | | 35,330 | |
Standard Industries Inc.
5.38% 11/15/24 (a)(h) | | | 52,000 | | | | 48,959 | |
Starbucks Corp.
4.00% 11/15/28 (a) | | | 6,000 | | | | 5,935 | |
Steel Dynamics Inc.
5.13% 10/01/21 (a) | | | 7,000 | | | | 7,040 | |
Sumitomo Mitsui Financial Group Inc.
2.78% 07/12/22 (a) | | | 18,000 | | | | 17,534 | |
Suncor Energy Inc.
4.00% 11/15/47 (a) | | | 3,000 | | | | 2,660 | |
Sunoco Logistics Partners Operations LP
5.30% 04/01/44 (a) | | | 5,000 | | | | 4,415 | |
Sysco Corp.
3.25% 07/15/27 (a) | | | 4,000 | | | | 3,743 | |
T-Mobile USA Inc.
4.50% 02/01/26 (a) | | | 29,000 | | | | 26,786 | |
Tampa Electric Co.
4.35% 05/15/44 (a) | | | 18,000 | | | | 17,878 | |
Target Corp.
2.50% 04/15/26 (a) | | | 5,000 | | | | 4,666 | |
Teck Resources Ltd.
5.40% 02/01/43 (a) | | | 19,000 | | | | 16,517 | |
6.00% 08/15/40 (a) | | | 11,000 | | | | 10,149 | |
Tenet Healthcare Corp.
4.63% 07/15/24 | | | 10,000 | | | | 9,315 | |
4.75% 06/01/20 (a) | | | 8,000 | | | | 7,994 | |
6.00% 10/01/20 (a) | | | 36,000 | | | | 36,298 | |
See Notes to Schedule of Investments and Notes to Financial Statements.
| | |
| 16 | | State Street Income V.I.S. Fund |
State Street Income V.I.S. Fund
Schedule of Investments, continued — December 31, 2018
| | | | | | | | |
| | | Principal
Amount ($) | | | Fair
Value
$ | |
| | | | | | | | |
Teva Pharmaceutical Finance Netherlands III BV
1.70% 07/19/19 (a) | | | 46,000 | | | | 45,256 | |
2.20% 07/21/21 (a) | | | 8,000 | | | | 7,342 | |
2.80% 07/21/23 (a) | | | 38,000 | | | | 32,712 | |
Texas Instruments Inc.
4.15% 05/15/48 (a) | | | 5,000 | | | | 4,992 | |
The Allstate Corp.
4.20% 12/15/46 (a) | | | 6,000 | | | | 5,830 | |
The Allstate Corp. (5.75% fixed rate until 08/15/23; 2.94% + 3 month USD LIBOR thereafter)
5.75% 08/15/53 (a)(b) | | | 25,000 | | | | 24,229 | |
The Bank of New York Mellon Corp. (2.66% fixed rate until 05/16/22; 0.63% + 3 month USD LIBOR thereafter)
2.66% 05/16/23 (a)(b) | | | 13,000 | | | | 12,672 | |
The Bank of New York Mellon Corp. (4.63% fixed rate until 09/20/26; 3.13% + 3 month USD LIBOR thereafter)
4.63% 12/29/49 (a)(b) | | | 43,000 | | | | 38,553 | |
The Bank of Nova Scotia (4.65% fixed rate until 10/12/22; 2.65% + 3 month USD LIBOR thereafter)
4.65% 12/31/99 (a)(b) | | | 19,000 | | | | 16,815 | |
The Boeing Co.
3.25% 03/01/28 (a) | | | 5,000 | | | | 4,897 | |
3.55% 03/01/38 (a) | | | 5,000 | | | | 4,664 | |
The Chemours Co.
5.38% 05/15/27 (a) | | | 7,000 | | | | 6,307 | |
The Dow Chemical Co.
4.25% 10/01/34 (a) | | | 5,000 | | | | 4,529 | |
5.55% 11/30/48 (h) | | | 6,000 | | | | 6,099 | |
The George Washington University
4.13% 09/15/48 | | | 8,000 | | | | 7,997 | |
The Goldman Sachs Group Inc.
3.85% 01/26/27 (a) | | | 4,000 | | | | 3,769 | |
4.25% 10/21/25 (a) | | | 2,000 | | | | 1,912 | |
4.80% 07/08/44 (a) | | | 6,000 | | | | 5,711 | |
5.15% 05/22/45 (a) | | | 5,000 | | | | 4,711 | |
The Goldman Sachs Group Inc. (2.91% fixed rate until 06/05/22; 1.05% + 3 month USD LIBOR thereafter)
2.91% 06/05/23 (a)(b) | | | 18,000 | | | | 17,209 | |
The Goldman Sachs Group Inc. (3.81% fixed rate until 04/23/28; 1.16% + 3 month USD LIBOR thereafter)
3.81% 04/23/29 (a)(b) | | | 4,000 | | | | 3,725 | |
| | | | | | | | |
| | | Principal
Amount ($) | | | Fair
Value
$ | |
The Goldman Sachs Group Inc. (4.02% fixed rate until 10/31/37; 1.37% + 3 month USD LIBOR thereafter)
4.02% 10/31/38 (a)(b) | | | 6,000 | | | | 5,271 | |
The Goldman Sachs Group Inc. (4.22% fixed rate until 05/01/28; 1.30% + 3 month USD LIBOR thereafter)
4.22% 05/01/29 (a)(b) | | | 5,000 | | | | 4,817 | |
The Hartford Financial Services Group Inc. 2.13% + 3 month USD LIBOR
4.74% 02/12/47 (a)(b)(h) | | | 10,000 | | | | 8,001 | |
The Home Depot Inc.
3.35% 09/15/25 (a) | | | 2,000 | | | | 1,976 | |
3.50% 09/15/56 (a) | | | 7,000 | | | | 5,880 | |
3.90% 12/06/28 | | | 10,000 | | | | 10,230 | |
3.90% 06/15/47 (a) | | | 7,000 | | | | 6,622 | |
4.50% 12/06/48 | | | 8,000 | | | | 8,264 | |
The Interpublic Group of Companies Inc.
3.75% 10/01/21 (a) | | | 17,000 | | | | 17,105 | |
The Kroger Co.
2.95% 11/01/21 (a) | | | 24,000 | | | | 23,611 | |
4.65% 01/15/48 (a) | | | 4,000 | | | | 3,607 | |
The Mosaic Co.
5.63% 11/15/43 (a) | | | 3,000 | | | | 3,030 | |
The Sherwin-Williams Co.
2.25% 05/15/20 (a) | | | 11,000 | | | | 10,828 | |
2.75% 06/01/22 (a) | | | 7,000 | | | | 6,766 | |
The Southern Co.
1.85% 07/01/19 (a) | | | 45,000 | | | | 44,667 | |
4.40% 07/01/46 (a) | | | 4,000 | | | | 3,686 | |
The Toronto-Dominion Bank (3.63% fixed rate until 09/15/26; 2.21% + USD 5 year Swap Rate thereafter)
3.63% 09/15/31 (a)(b) | | | 20,000 | | | | 18,887 | |
The Walt Disney Co.
4.13% 06/01/44 (a) | | | 6,000 | | | | 5,938 | |
The Williams Companies Inc.
3.75% 06/15/27 (a) | | | 3,000 | | | | 2,821 | |
4.85% 03/01/48 (a) | | | 7,000 | | | | 6,361 | |
4.90% 01/15/45 (a) | | | 5,000 | | | | 4,533 | |
5.40% 03/04/44 (a) | | | 4,000 | | | | 3,833 | |
Time Warner Cable LLC
4.50% 09/15/42 (a) | | | 3,000 | | | | 2,384 | |
6.55% 05/01/37 (a) | | | 5,000 | | | | 5,055 | |
TransCanada PipeLines Ltd.
4.25% 05/15/28 (a) | | | 18,000 | | | | 17,816 | |
4.88% 01/15/26 (a) | | | 3,000 | | | | 3,103 | |
See Notes to Schedule of Investments and Notes to Financial Statements.
| | | | |
| State Street Income V.I.S. Fund | | | 17 | |
State Street Income V.I.S. Fund
Schedule of Investments, continued — December 31, 2018
| | | | | | | | |
| | | Principal
Amount ($) | | | Fair
Value
$ | |
| | | | | | | | |
Transcontinental Gas Pipe Line Company LLC
4.00% 03/15/28 (a) | | | 6,000 | | | | 5,796 | |
Tyco Electronics Group S.A.
2.35% 08/01/19 (a) | | | 35,000 | | | | 34,819 | |
3.13% 08/15/27 (a) | | | 5,000 | | | | 4,642 | |
Tyson Foods Inc.
2.65% 08/15/19 (a) | | | 7,000 | | | | 6,964 | |
4.55% 06/02/47 (a) | | | 2,000 | | | | 1,759 | |
U.S. Bancorp
3.15% 04/27/27 | | | 12,000 | | | | 11,518 | |
U.S. Bancorp (5.13% fixed rate until 01/15/21; 3.49% + 3 month USD LIBOR thereafter)
5.13% 12/29/49 (a)(b) | | | 45,000 | | | | 44,655 | |
Union Pacific Corp.
3.20% 06/08/21 (a) | | | 19,000 | | | | 19,069 | |
3.50% 06/08/23 (a) | | | 16,000 | | | | 16,042 | |
3.60% 09/15/37 (a) | | | 3,000 | | | | 2,684 | |
4.10% 09/15/67 (a) | | | 5,000 | | | | 4,204 | |
United Rentals North America Inc.
4.88% 01/15/28 | | | 8,000 | | | | 7,023 | |
United Technologies Corp.
3.65% 08/16/23 (a) | | | 13,000 | | | | 12,951 | |
3.75% 11/01/46 (a) | | | 4,000 | | | | 3,422 | |
3.95% 08/16/25 (a) | | | 2,000 | | | | 1,986 | |
4.13% 11/16/28 (a) | | | 2,000 | | | | 1,982 | |
4.15% 05/15/45 (a) | | | 5,000 | | | | 4,474 | |
4.45% 11/16/38 (a) | | | 4,000 | | | | 3,859 | |
4.50% 06/01/42 (a) | | | 4,000 | | | | 3,802 | |
UnitedHealth Group Inc.
4.45% 12/15/48 | | | 8,000 | | | | 8,240 | |
4.75% 07/15/45 (a) | | | 6,000 | | | | 6,345 | |
Vale Overseas Ltd.
4.38% 01/11/22 (a) | | | 2,000 | | | | 2,037 | |
6.25% 08/10/26 (a) | | | 10,000 | | | | 10,830 | |
6.88% 11/10/39 (a) | | | 8,000 | | | | 9,242 | |
Vale S.A.
5.63% 09/11/42 (a) | | | 5,000 | | | | 5,051 | |
Valero Energy Partners LP
4.38% 12/15/26 (a) | | | 12,000 | | | | 11,791 | |
Ventas Realty LP
3.25% 10/15/26 (a) | | | 20,000 | | | | 18,603 | |
Verizon Communications Inc.
3.38% 02/15/25 (a) | | | 4,000 | | | | 3,880 | |
4.33% 09/21/28 (a) | | | 7,000 | | | | 7,026 | |
4.40% 11/01/34 (a) | | | 5,000 | | | | 4,826 | |
4.67% 03/15/55 (a) | | | 6,000 | | | | 5,523 | |
4.86% 08/21/46 (a) | | | 27,000 | | | | 26,566 | |
5.01% 04/15/49 (a) | | | 5,000 | | | | 4,982 | |
5.25% 03/16/37 (a) | | | 5,000 | | | | 5,235 | |
Viacom Inc.
3.45% 10/04/26 (a) | | | 7,000 | | | | 6,474 | |
| | | | | | | | |
| | | Principal
Amount ($) | | | Fair
Value
$ | |
4.38% 03/15/43 | | | 5,000 | | | | 4,041 | |
5.25% 04/01/44 (a) | | | 3,000 | | | | 2,698 | |
Virginia Electric & Power Co.
4.00% 11/15/46 (a) | | | 7,000 | | | | 6,630 | |
Visa Inc.
3.15% 12/14/25 (a) | | | 4,000 | | | | 3,929 | |
4.30% 12/14/45 (a) | | | 7,000 | | | | 7,249 | |
Vodafone Group PLC
4.38% 05/30/28 (a) | | | 14,000 | | | | 13,571 | |
5.25% 05/30/48 (a) | | | 4,000 | | | | 3,748 | |
Vornado Realty LP
3.50% 01/15/25 (a) | | | 4,000 | | | | 3,851 | |
Vulcan Materials Co.
3.90% 04/01/27 (a) | | | 4,000 | | | | 3,795 | |
Wabtec Corp.
3.45% 11/15/26 (a) | | | 2,000 | | | | 1,786 | |
Walgreens Boots Alliance Inc.
4.65% 06/01/46 (a) | | | 4,000 | | | | 3,611 | |
Walmart Inc.
3.63% 12/15/47 (a) | | | 6,000 | | | | 5,553 | |
3.70% 06/26/28 (a) | | | 11,000 | | | | 11,157 | |
3.95% 06/28/38 (a) | | | 3,000 | | | | 2,981 | |
4.05% 06/29/48 (a) | | | 5,000 | | | | 4,968 | |
Warner Media LLC
5.35% 12/15/43 (a) | | | 7,000 | | | | 6,716 | |
WEC Energy Group Inc.
3.55% 06/15/25 (a) | | | 13,000 | | | | 12,637 | |
WellCare Health Plans Inc.
5.25% 04/01/25 (a) | | | 19,000 | | | | 18,291 | |
Wells Fargo & Co.
2.63% 07/22/22 (a) | | | 24,000 | | | | 23,146 | |
3.90% 05/01/45 (a) | | | 3,000 | | | | 2,753 | |
4.75% 12/07/46 (a) | | | 13,000 | | | | 12,547 | |
Wells Fargo & Co. (5.88% fixed rate until 06/15/25; 3.99% + 3 month USD LIBOR thereafter)
5.88% 12/29/49 (a)(b) | | | 26,000 | | | | 25,722 | |
Wells Fargo & Co. (5.90% fixed rate until 06/15/24; 3.11% + 3 month USD LIBOR thereafter)
5.90% 12/29/49 (a)(b) | | | 25,000 | | | | 23,802 | |
Wells Fargo & Co. 3.77% + 3 month USD LIBOR
6.56% 03/29/49 (a)(b) | | | 16,000 | | | | 15,906 | |
Western Gas Partners LP
4.00% 07/01/22 (a) | | | 25,000 | | | | 24,668 | |
5.38% 06/01/21 (a) | | | 2,000 | | | | 2,060 | |
Westlake Chemical Corp.
3.60% 08/15/26 (a) | | | 3,000 | | | | 2,758 | |
4.38% 11/15/47 (a) | | | 2,000 | | | | 1,660 | |
5.00% 08/15/46 (a) | | | 5,000 | | | | 4,570 | |
Willis North America Inc.
3.60% 05/15/24 (a) | | | 6,000 | | | | 5,843 | |
See Notes to Schedule of Investments and Notes to Financial Statements.
| | |
| 18 | | State Street Income V.I.S. Fund |
State Street Income V.I.S. Fund
Schedule of Investments, continued — December 31, 2018
| | | | | | | | |
| | | Principal
Amount ($) | | | Fair
Value
$ | |
| | | | | | | | |
WPP Finance 2010
3.75% 09/19/24 (a) | | | 12,000 | | | | 11,187 | |
WRKCo Inc.
3.00% 09/15/24 (a)(h) | | | 4,000 | | | | 3,760 | |
Xilinx Inc.
2.95% 06/01/24 (a) | | | 5,000 | | | | 4,774 | |
XPO Logistics Inc.
6.50% 06/15/22 (a)(h) | | | 13,000 | | | | 12,874 | |
Yamana Gold Inc.
4.63% 12/15/27 (a) | | | 8,000 | | | | 7,396 | |
Zoetis Inc.
3.00% 09/12/27 (a) | | | 3,000 | | | | 2,770 | |
3.90% 08/20/28 (a) | | | 6,000 | | | | 5,929 | |
| | | | | | | | |
| | | | | | | 7,376,800 | |
| | | | | | | | |
|
Non-Agency Collateralized Mortgage Obligations - 3.0% | |
BANK 2018-BNK11
4.36% 03/15/61 (a)(b) | | | 12,000 | | | | 12,156 | |
BXP Trust2017-GM
3.38% 06/13/39 (a)(h) | | | 61,000 | | | | 59,649 | |
Citigroup Commercial Mortgage Trust2016-P6
3.72% 12/10/49 (a)(b) | | | 63,309 | | | | 63,796 | |
4.03% 12/10/49 (a)(b) | | | 31,273 | | | | 31,479 | |
Citigroup Commercial Mortgage Trust2018-C5
4.51% 06/10/51 (a) | | | 21,000 | | | | 21,462 | |
COMM 2014-CR14 Mortgage Trust
4.53% 02/10/47 (a)(b) | | | 25,000 | | | | 25,838 | |
GS Mortgage Securities Trust2016-GS3
2.85% 10/10/49 (a) | | | 33,000 | | | | 31,301 | |
GS Mortgage Securities Trust2017-GS5
3.67% 03/10/50 (a) | | | 39,990 | | | | 39,948 | |
GS Mortgage Securities Trust2017-GS8
3.47% 11/10/50 (a) | | | 63,977 | | | | 62,921 | |
GS Mortgage Securities Trust2018-GS9
4.14% 03/10/51 (a)(b) | | | 25,000 | | | | 25,359 | |
JPMBB Commercial Mortgage Securities Trust2013-C12
4.03% 07/15/45 (a)(b) | | | 15,000 | | | | 15,193 | |
LB-UBS Commercial Mortgage Trust2007-C6
6.11% 07/15/40 (a)(b) | | | 712 | | | | 716 | |
6.11% 07/15/40 (a)(h) | | | 1,418 | | | | 1,426 | |
Morgan Stanley Bank of America Merrill Lynch Trust2015-C21
0.94% 03/15/48 (a)(b)(e) | | | 379,815 | | | | 16,666 | |
| | | | | | | | |
| | | Principal
Amount ($) | | | Fair
Value
$ | |
Morgan Stanley Capital I Trust 2006-IQ11
6.25% 10/15/42 (a)(b) | | | 50,000 | | | | 51,012 | |
Morgan Stanley Capital I Trust2006-T21
5.24% 10/12/52 (a)(b) | | | 3,169 | | | | 3,197 | |
UBS Commercial Mortgage Trust2018-C12
4.79% 08/15/51 (a)(b) | | | 17,000 | | | | 17,542 | |
WFRBS Commercial Mortgage Trust2013-C17
4.26% 12/15/46 (a) | | | 25,000 | | | | 25,518 | |
WFRBS Commercial Mortgage Trust 2014-LC14
4.35% 03/15/47 (a)(b) | | | 58,000 | | | | 59,012 | |
| | | | | | | | |
| | | | | | | 564,191 | |
| | | | | | | | |
|
Sovereign Bonds - 0.3% | |
Government of Mexico
4.00% 10/02/23 | | | 12,000 | | | | 11,950 | |
4.75% 03/08/44 (a) | | | 20,000 | | | | 18,155 | |
Government of Peru
5.63% 11/18/50 (a) | | | 11,000 | | | | 12,907 | |
Government of Uruguay
5.10% 06/18/50 | | | 14,040 | | | | 13,800 | |
| | | | | | | | |
| | | | | | | 56,812 | |
| | | | | | | | |
|
Municipal Bonds and Notes - 1.0% | |
American Municipal Power Inc.
6.27% 02/15/50 (a) | | | 15,000 | | | | 18,615 | |
Metropolitan St. Louis Sewer District
5.00% 05/01/47 | | | 35,000 | | | | 39,599 | |
New Jersey Transportation Trust Fund Authority
6.88% 12/15/39 (a) | | | 15,000 | | | | 15,204 | |
Port Authority of New York & New Jersey
4.46% 10/01/62 (a) | | | 40,000 | | | | 40,697 | |
State of California
4.60% 04/01/38 | | | 15,000 | | | | 15,470 | |
5.70% 11/01/21 (a) | | | 40,000 | | | | 43,022 | |
State of Illinois
5.10% 06/01/33 (a) | | | 10,000 | | | | 9,534 | |
The University of Texas System
3.35% 08/15/47 (a) | | | 10,000 | | | | 9,055 | |
| | | | | | | | |
| | | | | | | 191,196 | |
| | | | | | | | |
| | |
Total Bonds and Notes
(Cost $18,099,403) | | | | | | | 18,017,654 | |
| | | | | | | | |
See Notes to Schedule of Investments and Notes to Financial Statements.
| | | | |
| State Street Income V.I.S. Fund | | | 19 | |
State Street Income V.I.S. Fund
Schedule of Investments, continued — December 31, 2018
| | | | | | | | |
| | | Number
of Shares | | | Fair
Value
$ | |
| | | | | | | | |
| | |
| Domestic Equity - 0.1% | | | | | | | | |
Preferred Stock - 0.1% | | | | | | | | |
Wells Fargo & Co. 3.09% + 3 month USD LIBOR
(Cost $23,300) (a)(b) | | | 932 | | | | 22,899 | |
| | | | | | | | |
| |
Total Investments in Securities
(Cost $18,122,703) | | | | 18,040,553 | |
| | | | | | | | |
|
| Short-Term Investments - 16.8% | |
State Street Institutional U.S. Government Money Market Fund - Class G Shares 2.31%
(Cost $3,131,172) (a)(f)(i) | | | 3,131,172 | | | | 3,131,172 | |
| | | | | | | | |
| | |
Total Investments
(Cost $21,253,875) | | | | | | | 21,171,725 | |
| |
Liabilities in Excess of Other Assets,
net - (13.3)% | | | | (2,486,246 | ) |
| | | | | | | | |
| | |
| NET ASSETS - 100.0% | | | | | | | 18,685,479 | |
| | | | | | | | |
Other Information:
Centrally Cleared Credit Default Swaps - Sell Protection
| | | | | | | | | | | | | | | | | | | | | | | | | | |
Reference
Entity | | Counterparty | | Notional
Amount
(000s omitted) | | | Contract
Annual
Fixed Rate/
Payment
Frequency | | | Termination
Date | | | Market
Value | | | Unamortized
Upfront
Payments
Received | | | Unrealized
Depreciation | |
| | | | | | | | | | | | | | | | | | | | | | | | | | |
Markit CDX North America High Yield Index | | CME Group, Inc. | | $ | 211 | | |
| 5.00%/
Quarterly |
| | | 12/20/23 | | | $ | 4,290 | | | $ | 11,616 | | | $ | (7,327 | ) |
| | | | | | | | | | | | | | | | | | | | | | | | | | |
Centrally Cleared Interest Rate Swaps
| | | | | | | | | | | | | | | | | | | | | | | | | | | | | | | | |
| Counterparty | | Notional
Amount
(000s
omitted) | | | Fund
Pays/
Receives
Fixed
Rate/
Payment
Frequency | | | Floating Rate | | | Contract
Annual
Fixed
Rate | | | Termination
Date | | | Market
Value | | | Unamortized
Upfront
Payments
Received | | | Unrealized
Depreciation | |
| | | | | | | | | | | | | | | | | | | | | | | | | | | | | | | | |
CME Group, Inc. | | $ | 883 | | |
| Receives/
Quarterly |
| |
| 3 Month U.S. Dollar
LIBOR |
| | | 3.05% | | | | 11/19/21 | | | $ | (11,381 | ) | | $ | — | | | $ | (11,381 | ) |
CME Group, Inc. | | $ | 884 | | |
| Receives/
Quarterly |
| |
| 3 Month U.S. Dollar
LIBOR |
| | | 3.06% | | | | 11/19/21 | | | $ | (11,494 | ) | | $ | — | | | $ | (11,493 | ) |
| | | | | | | | | | | | | | | | | | | | | | | | | | | | | | | | |
| | | | | | | | | | | | | | | | | | | | | | | | | | | | | | $ | (22,874 | ) |
| | | | | | | | | | | | | | | | | | | | | | | | | | | | | | | | |
| | | | | | | | | | | | | | | | | | | | | | | | | | | | | | $ | (30,201 | ) |
| | | | | | | | | | | | | | | | | | | | | | | | | | | | | | | | |
See Notes to Schedule of Investments and Notes to Financial Statements.
| | |
| 20 | | State Street Income V.I.S. Fund |
State Street Income V.I.S. Fund
Schedule of Investments, continued — December 31, 2018
The Fund had the following long futures contracts open at December 31, 2018:
| | | | | | | | | | | | | | | | | | | | |
| Description | | Expiration
date | | | Number of
Contracts | | | Notional
Amount | | | Value | | | Unrealized
Appreciation | |
| | | | | | | | | | | | | | | | | | | | |
Ultra Long-Term U.S. Treasury Bond Futures | | | March 2019 | | | | 5 | | | $ | 771,158 | | | $ | 803,281 | | | $ | 32,123 | |
2 Yr. U.S. Treasury Notes Futures | | | March 2019 | | | | 13 | | | | 2,742,106 | | | | 2,760,062 | | | | 17,956 | |
5 Yr. U.S. Treasury Notes Futures | | | March 2019 | | | | 13 | | | | 1,467,532 | | | | 1,490,937 | | | | 23,405 | |
10 Yr. U.S. Treasury Notes Futures | | | March 2019 | | | | 10 | | | | 1,197,243 | | | | 1,220,157 | | | | 22,914 | |
| | | | | | | | | | | | | | | | | | | | |
| | | | | | | | | | | | | | | | | | $ | 96,398 | |
| | | | | | | | | | | | | | | | | | | | |
The Fund had the following short futures contracts open at December 31, 2018:
| | | | | | | | | | | | | | | | | | | | |
| Description | | Expiration
date | | | Number of
Contracts | | | Notional
Amount | | | Value | | | Unrealized
Depreciation | |
| | | | | | | | | | | | | | | | | | | | |
U.S. Long Bond Futures | | | March 2019 | | | | 1 | | | $ | (139,216 | ) | | $ | (145,999 | ) | | $ | (6,783 | ) |
10 Yr. U.S. Treasury Ultra Futures | | | March 2019 | | | | 6 | | | | (756,224 | ) | | | (780,469 | ) | | | (24,245 | ) |
| | | | | | | | | | | | | | | | | | | | |
| | | | | | | | | | | | | | | | | | $ | (31,028 | ) |
| | | | | | | | | | | | | | | | | | | | |
| | | | | | | | | | | | | | | | | | $ | 65,370 | |
| | | | | | | | | | | | | | | | | | | | |
During the period ended December 31, 2018, average notional values related to derivative contracts were as follows:
| | | | | | | | | | | | | | | | | | | | | | | | | | | | | | | | |
| | | Purchased Put Options | | | Purchased Call Options | | | Written Put Options | | | Written Call Options | | | Long Futures Contracts | | | Short Futures Contracts | | | Credit Default Swap Contracts | | | Interest Rate Swap Contracts | |
| | | | | | | | | | | | | | | | | | | | | | | | | | | | | | | | |
Average Notional Value | | $ | — | | | $ | 2,596 | | | $ | — | | | $ | 1,161 | | | $ | 6,372,186 | | | $ | 2,293,862 | | | $ | 337,528 | | | $ | 1,738,370 | |
See Notes to Schedule of Investments and Notes to Financial Statements.
| | | | |
| State Street Income V.I.S. Fund | | | 21 | |
State Street Income V.I.S. Fund
Notes to Schedule of Investments — December 31, 2018
The views expressed in this document reflect our judgment as of the publication date and are subject to change at any time without notice. The securities cited may not be representative of the Fund’s future investments and should not be construed as a recommendation to purchase or sell a particular security. See the Fund’s summary prospectus and statutory prospectus for complete descriptions of investment objectives, policies, risks and permissible investments.
| (a) | At December 31, 2018, all or a portion of this security was pledged to cover collateral requirements for futures, options, swaps and/or TBAs. |
| (b) | Variable Rate Security - Interest rate shown is rate in effect at December 31, 2018. For securities based on a published reference rate and spread, the reference rate and spread are indicated in the description above. |
| (d) | Settlement is on a delayed delivery or when-issued basis with final maturity to be announced (TBA) in the future. |
| (e) | Interest only security. These securities represent the right to receive the monthly interest payments on an underlying pool of mortgages. Payments of principal on the pool reduce the value of the “interest only” holding. |
| (f) | Coupon amount represents effective yield. |
| (g) | Principal only security. These securities represent the right to receive the monthly principal payments on an underlying pool of mortgages. No payments of interest on the pool are passed through to the “principal only” holder. |
| (h) | Pursuant to Rule 144A of the Securities Act of 1933, as amended, these securities may be resold in transactions exempt from registration, normally to qualified institutional buyers. At December 31, 2018, these securities amounted to $881,448 or 4.72% of the net assets of the State Street Income V.I.S. Fund. These securities have been determined to be liquid using procedures established by the State Street Variable Insurance Series Funds, Inc.’s Board of Directors. |
| (i) | Sponsored by SSGA Funds Management, Inc., the Fund’s investment adviser and administrator, and an affiliate of State Street Bank & Trust Co., the Fund’ssub-administrator, custodian and accounting agent. |
| † | Percentages are based on net assets as of December 31, 2018. |
Abbreviations:
CMT - Constant Maturity Treasury
LIBOR - London Interbank Offered Rate
REIT - Real Estate Investment Trust
REMIC - Real Estate Mortgage Investment Conduit
STRIPS - Separate Trading of Registered Interest and Principal of Security
TBA - To Be Announced
The following table presents the Fund’s investments measured at fair value on a recurring basis at December 31, 2018:
| | | | | | | | | | | | | | | | |
| Investments | | Level 1 | | | Level 2 | | | Level 3 | | | Total | |
| | | | | | | | | | | | | | | | |
Investments in Securities | |
U.S. Treasuries | | $ | — | | | $ | 5,144,442 | | | $ | — | | | $ | 5,144,442 | |
Agency Mortgage Backed | | | — | | | | 4,042,965 | | | | — | | | | 4,042,965 | |
Agency Collateralized Mortgage Obligations | | | — | | | | 172,162 | | | | — | | | | 172,162 | |
Asset Backed | | | — | | | | 469,086 | | | | — | | | | 469,086 | |
Corporate Notes | | | — | | | | 7,376,800 | | | | — | | | | 7,376,800 | |
Non-Agency Collateralized Mortgage Obligations | | | — | | | | 564,191 | | | | — | | | | 564,191 | |
Sovereign Bonds | | | — | | | | 56,812 | | | | — | | | | 56,812 | |
Municipal Bonds and Notes | | | — | | | | 191,196 | | | | — | | | | 191,196 | |
Preferred Stock | | | 22,899 | | | | — | | | | — | | | | 22,899 | |
Short-Term Investments | | | 3,131,172 | | | | — | | | | — | | | | 3,131,172 | |
| | | | | | | | | | | | | | | | |
Total Investments in Securities | | $ | 3,154,071 | | | $ | 18,017,654 | | | $ | — | | | $ | 21,171,725 | |
| | | | | | | | | | | | | | | | |
Other Financial Instruments | |
Credit Default Swap Contracts - Unrealized Depreciation | | $ | — | | | $ | (7,327 | ) | | $ | — | | | $ | (7,327 | ) |
Interest Rate Swap Contracts - Unrealized Depreciation | | | — | | | | (22,874 | ) | | | — | | | | (22,874 | ) |
Long Futures Contracts - Unrealized Appreciation | | | 96,398 | | | | — | | | | — | | | | 96,398 | |
Short Futures Contracts - Unrealized Depreciation | | | (31,028 | ) | | | — | | | | — | | | | (31,028 | ) |
| | | | | | | | | | | | | | | | |
Total Other Financial Instruments | | $ | 65,370 | | | $ | (30,201 | ) | | $ | — | | | $ | 35,169 | |
| | | | | | | | | | | | | | | | |
See Notes to Schedule of Investments and Notes to Financial Statements.
| | |
| 22 | | State Street Income V.I.S. Fund |
State Street Income V.I.S. Fund
Notes to Schedule of Investments, continued — December 31, 2018
Affiliate Table
| | | | | | | | | | | | | | | | | | | | | | | | | | | | |
| | | Number
of Shares
Held at
12/31/17 | | | Value At
12/31/17 | | | Cost of
Purchases | | | Proceeds
from
Shares
Sold | | | Number
of Shares
Held at
12/31/18 | | | Value at
12/31/18 | | | Dividend
Income | |
State Street Institutional U.S. Government Money Market Fund - Class G Shares | | | 587,481 | | | $ | 587,481 | | | $ | 10,658,680 | | | $ | 8,114,989 | | | | 3,131,172 | | | $ | 3,131,172 | | | $ | 22,938 | |
See Notes to Schedule of Investments and Notes to Financial Statements.
| | | | |
| State Street Income V.I.S. Fund | | | 23 | |
State Street Income V.I.S. Fund
Financial Highlights
Selected data based on a share outstanding throughout the fiscal years indicated
| | | | | | | | | | | | | | | | | | | | |
| | | 12/31/18 | | | 12/31/17 | | | 12/31/16 | | | 12/31/15* | | | 12/31/14* | |
| Inception date | | | | | | | | | | | | | | | | | | | 1/3/95 | |
| | | | | |
Net asset value, beginning of period | | $ | 11.49 | | | $ | 11.37 | | | $ | 11.25 | | | $ | 11.56 | | | $ | 11.25 | |
| | | | | | | | | | | | | | | | | | | | |
|
Income/(loss) from investment operations: | |
Net investment income | | | 0.25 | (a) | | | 0.19 | (a) | | | 0.24 | | | | 0.25 | | | | 0.27 | |
Net realized and unrealized gains/(losses) on investments | | | (0.41 | ) | | | 0.18 | | | | 0.09 | | | | (0.30 | ) | | | 0.31 | |
| | | | | | | | | | | | | | | | | | | | |
Total income/(loss) from investment operations | | | (0.16 | ) | | | 0.37 | | | | 0.33 | | | | (0.05 | ) | | | 0.58 | |
| | | | | | | | | | | | | | | | | | | | |
|
Less distributions from: | |
Net investment income | | | 0.26 | | | | 0.25 | | | | 0.21 | | | | 0.26 | | | | 0.27 | |
| | | | | | | | | | | | | | | | | | | | |
Total distributions | | | 0.26 | | | | 0.25 | | | | 0.21 | | | | 0.26 | | | | 0.27 | |
| | | | | | | | | | | | | | | | | | | | |
Net asset value, end of period | | $ | 11.07 | | | $ | 11.49 | | | $ | 11.37 | | | $ | 11.25 | | | $ | 11.56 | |
| | | | | | | | | | | | | | | | | | | | |
Total Return(b) | | | (1.42 | )% | | | 3.25 | % | | | 2.98 | % | | | (0.42 | )% | | | 5.12 | % |
|
Ratios/Supplemental Data: | |
Net assets, end of period (in thousands) | | $ | 18,685 | | | $ | 21,847 | | | $ | 25,582 | | | $ | 28,375 | | | $ | 32,668 | |
|
Ratios to average net assets: | |
Net expenses | | | 1.00 | % | | | 1.36 | % | | | 1.15 | % | | | 1.06 | %(c) | | | 0.91 | %(d) |
Gross expenses | | | 1.00 | % | | | 1.36 | % | | | 1.15 | % | | | 1.11 | % | | | 0.91 | % |
Net investment income | | | 2.25 | % | | | 1.62 | % | | | 1.98 | % | | | 2.06 | % | | | 2.14 | % |
Portfolio turnover rate | | | 182 | % | | | 255 | % | | | 220 | % | | | 241 | % | | | 282 | % |
Notes to Financial Highlights
| (a) | | Per share values have been calculated using the average shares method. |
| (b) | | Total returns are historical and assume changes in share price, reinvestment of dividends and capital gains distributions and do not include the effect of insurance contract charges. Past performance does not guarantee future results. |
| (c) | | Reflects a voluntary reimbursement of other operating expenses by GE Asset Management, Inc., the Fund’s investment adviser and administrator prior to July 1, 2016. |
| (d) | | Includes contractual management fee waiver related to the Fund’s investments in the GE Institutional Money Market Fund (the “Money Market Fund”). The fee waiver agreement was terminated effective June 30, 2014 with the closure of the Money Market Fund. |
| * | | Beginning with the year ended December 31, 2016, the Fund was audited by Ernst & Young LLP. The previous years were audited by another independent registered public accounting firm. |
The accompanying Notes are an integral part of these financial statements.
State Street Income V.I.S. Fund
Statement of Assets and Liabilities — December 31, 2018
| | | | |
| | | | |
Assets | | | | |
Investments in securities, at fair value (cost $18,122,703) | | $ | 18,040,553 | |
Short-term affiliated investments, at fair value | | | 3,131,172 | |
Cash collateral on deposit with broker for swap contracts | | | 18,335 | |
Receivable for investments sold | | | 1,952,518 | |
Income receivables | | | 120,536 | |
Income receivable from affiliated investments | | | 5,853 | |
Receivable for accumulated variation margin on futures contracts | | | 65,427 | |
Receivable for accumulated variation margin on swap contracts | | | 4,642 | |
| | | | |
| |
Total assets | | | 23,339,036 | |
| | | | |
| |
Liabilities | | | | |
Due to custodian | | | 4,082 | |
Net cash collateral on futures contracts due to broker | | | 56,719 | |
Payable for investments purchased | | | 4,488,654 | |
Payable for fund shares redeemed | | | 18,387 | |
Payable for accumulated variation margin on swap contracts | | | 23,587 | |
Payable to the Adviser | | | 7,907 | |
Payable for custody, fund accounting andsub-administration fees | | | 6,391 | |
Accrued other expenses | | | 47,830 | |
| | | | |
| |
Total liabilities | | | 4,653,557 | |
| | | | |
| | | | |
| |
Net Assets | | $ | 18,685,479 | |
| | | | |
| |
Net Assets Consist of: | | | | |
Capital paid in | | $ | 19,316,758 | |
Total distributable earnings (loss) | | | (631,279 | ) |
| | | | |
| |
Net Assets | | $ | 18,685,479 | |
| | | | |
| | | | |
Shares outstanding ($0.01 par value; unlimited shares authorized) | | | 1,688,184 | |
Net asset value per share | | $ | 11.07 | |
The accompanying Notes are an integral part of these financial statements.
| | | | |
| Statement of Assets and Liabilities | | | 25 | |
State Street Income V.I.S. Fund
Statement of Operations — For the year ended December 31, 2018
| | | | |
| | | | |
Investment Income | | | | |
Income | | | | |
Dividend | | $ | 3,412 | |
Interest | | | 618,944 | |
Income from affiliated investments | | | 22,938 | |
| | | | |
Total income | | | 645,294 | |
| | | | |
| |
Expenses | | | | |
Advisory and administration fees | | | 99,373 | |
Directors’ fees | | | 1,842 | |
Custody, fund accounting andsub-administration fees | | | 34,303 | |
Professional fees | | | 39,267 | |
Other expenses | | | 23,632 | |
| | | | |
Total Expenses | | | 198,417 | |
| | | | |
Net investment income | | $ | 446,877 | |
| | | | |
| |
Net Realized and Unrealized Gain (Loss) on Investments | | | | |
Realized gain (loss) on: | | | | |
Unaffiliated investments | | $ | (407,623 | ) |
Futures | | | (93,507 | ) |
Written options | | | 11,397 | |
Swap contracts | | | 19,237 | |
Increase (decrease) in unrealized appreciation/depreciation on: | |
Unaffiliated investments | | | (351,521 | ) |
Futures | | | 68,478 | |
Swap contracts | | | (23,909 | ) |
| | | | |
| |
Net realized and unrealized gain (loss) on investments | | | (777,448 | ) |
| | | | |
| |
Net Decrease in Net Assets Resulting from Operations | | $ | (330,571 | ) |
| | | | |
The accompanying Notes are an integral part of these financial statements.
| | |
| 26 | | Statement of Operations |
State Street Income V.I.S. Fund
Statements of Changes in Net Assets
| | | | | | | | |
| | | Year Ended December 31,
2018 | | | Year Ended December 31,
2017 | |
| | | | | | | | |
Increase (Decrease) in Net Assets | | | | | | | | |
| | |
Operations: | | | | | | | | |
Net investment income | | $ | 446,877 | | | $ | 378,325 | |
Net realized gain (loss) on investments, futures, written options and swap contracts | | | (470,496 | ) | | | 128,953 | |
Net increase (decrease) in unrealized appreciation/depreciation on investments, futures and swap contracts | | | (306,952 | ) | | | 266,491 | |
| | | | | | | | |
Net increase (decrease) from operations | | | (330,571 | ) | | | 773,769 | |
| | | | | | | | |
| | |
Distributions to shareholders: | | | | | | | | |
Total distributions | | | (420,122 | ) | | | (460,900 | ) |
| | | | | | | | |
Increase (decrease) in assets from operations and distributions | | | (750,693 | ) | | | 312,869 | |
| | | | | | | | |
| | |
Share transactions: | | | | | | | | |
Proceeds from sale of shares | | | 412,104 | | | | 352,577 | |
Value of distributions reinvested | | | 420,122 | | | | 460,900 | |
Cost of shares redeemed | | | (3,243,066 | ) | | | (4,860,905 | ) |
| | | | | | | | |
Net increase (decrease) from share transactions | | | (2,410,840 | ) | | | (4,047,428 | ) |
| | | | | | | | |
| | |
Total increase (decrease) in net assets | | | (3,161,533 | ) | | | (3,734,559 | ) |
| | |
Net Assets | | | | | | | | |
Beginning of year | | | 21,847,012 | | | | 25,581,571 | |
| | | | | | | | |
| | |
End of year | | $ | 18,685,479 | | | $ | 21,847,012 | |
| | | | | | | | |
| | |
Changes in Fund Shares | | | | | | | | |
Shares sold | | | 36,818 | | | | 30,432 | |
Issued for distributions reinvested | | | 38,089 | | | | 40,253 | |
Shares redeemed | | | (288,624 | ) | | | (419,395 | ) |
| | | | | | | | |
Net decrease in fund shares | | | (213,717 | ) | | | (348,710 | ) |
| | | | | | | | |
For the year ended December 31, 2017, the source of distributions paid to shareholders was (See Note 11 in the Notes to Financial Statements):
| | | | |
| | | | |
Net investment income | | $ | (460,900 | ) |
| | | | |
Undistributed net investment income as of December 31, 2017: | | $ | 8,327 | |
The accompanying Notes are an integral part of these financial statements.
| | | | |
| Statements of Changes in Net Assets | | | 27 | |
State Street Income V.I.S. Fund
Notes to Financial Statements — December 31, 2018
| 1. | | Organization of the Company |
State Street Variable Insurance Series Funds, Inc. (the “Company”) was incorporated under the laws of the Commonwealth of Virginia on May 14, 1984 and is registered under the Investment Company Act of 1940, as amended (the “1940 Act”), as anopen-end management investment company. The Company is currently composed of the following seven investment portfolios (collectively, the “Funds”): State Street U.S. Equity V.I.S. Fund, State Street S&P 500 Index V.I.S. Fund, State Street Premier Growth Equity V.I.S. Fund, State StreetSmall-Cap Equity V.I.S. Fund, State Street Total Return V.I.S. Fund, State Street Income V.I.S. Fund (the “Fund”) and State Street Real Estate Securities V.I.S. Fund. Each Fund is a diversified investment company within the meaning of the 1940 Act.
Shares of the Funds of the Company are offered only to insurance company separate accounts that fund certain variable life insurance contracts and variable annuity contracts.
The Company currently offers one share class (Class 1) of the Fund as an investment option for variable life insurance and variable annuity contracts.
Under the Company’s organizational documents, its officers and directors are indemnified against certain liabilities arising out of the performance of their duties to the Company. Additionally, in the normal course of business, the Company enters into contracts with service providers that contain general indemnification clauses. The Company’s maximum exposure under these arrangements is unknown as this would involve future claims that may be made against the Company that have not yet occurred.
| 2. | | Summary of Significant Accounting Policies |
The following is a summary of significant accounting policies followed by the Company in the preparation of its financial statements:
The preparation of financial statements in accordance with U.S. generally accepted accounting principles (“U.S. GAAP”) requires management to make estimates and assumptions that affect the reported amounts and disclosures in the financial statements. Actual results could differ from those estimates. The Fund is an investment company under U.S. GAAP and follows the accounting and reporting guidance applicable to investment companies.
Security Valuation The Fund’s investments are valued at fair value each day that the New York Stock Exchange (“NYSE”) is open and, for financial reporting purposes, as of the report date should the reporting period end on a day that the NYSE is not open. Fair value is generally defined as the price a fund would receive to sell an asset or pay to transfer a liability in an orderly transaction between market participants at the measurement date. By its nature, a fair value price is a good faith estimate of the valuation in a current sale and may not reflect an actual market price. The investments of the Fund are valued pursuant to the policy and procedures developed by the Oversight Committee (the “Committee”) and approved by the Company’s Board of Directors (the “Board”). The Committee provides oversight of the valuation of investments for the Fund. The Board has responsibility for overseeing the determination of the fair value of investments.
Valuation techniques used to value the Fund’s investments by major category are as follows:
| | • | | Equity investments (including preferred stocks) traded on a recognized securities exchange for which market quotations are readily available are valued at the last sale price or official closing price, as applicable, on the primary market or exchange on which they trade. Equity investments traded on a recognized exchange for which there were no sales on that day are valued at the last published sale price or at fair value. |
| | • | | Government and municipal fixed income securities are generally valued using quotations from independent pricing services or brokers. Certain government inflation-indexed securities may require a calculated fair valuation as the cumulative inflation is contained within the price provided by the pricing service or broker. For these securities, the inflation component of the price is “cleaned” from the pricing service or broker price utilizing the published inflation factors in order to ensure proper accrual of income. |
| | • | | Debt obligations (including short term investments and convertible debt securities) are valued using quotations from independent pricing services or brokers or are generally valued at the last reported evaluated prices. |
| | |
| 28 | | Notes to Financial Statements |
State Street Income V.I.S. Fund
Notes to Financial Statements, continued — December 31, 2018
| | • | | Exchange-traded futures contracts are valued at the closing settlement price on the primary market on which they are traded most extensively. Exchange-traded futures contracts traded on a recognized exchange for which there were no sales on that day are valued at the last reported sale price obtained from independent pricing services or brokers or at fair value. |
| | • | | Swap agreements are valued daily based upon prices supplied by Board approved pricing vendors or through brokers. Depending on the product and terms of the transaction, the value of agreements is determined using a series of techniques including valuation models that incorporate a number of market data factors, such as discounted cash flows, yields, curves, trades and values of the underlying reference instruments. In the event SSGA Funds Management, Inc. (the “Adviser” or “SSGA FM”) is unable to obtain an independent, third–party valuation the agreements will be fair valued. |
| | • | | Options on futures are priced at their last sale price on the principal market on which they are traded on the valuation date. If there were no sales on that day, options on futures are valued at either the last reported sale or official closing price on their primary exchange determined in accordance with the valuation policy and procedures approved by the Board. |
In the event prices or quotations are not readily available or that the application of these valuation methods results in a price for an investment that is deemed to be not representative of the fair value of such investment, fair value will be determined in good faith by the Committee, in accordance with the valuation policy and procedures approved by the Board.
The Fund values its assets and liabilities at fair value using a fair value hierarchy consisting of three broad levels that prioritize the inputs to valuation techniques giving the highest priority to readily available unadjusted quoted prices in active markets for identical assets or liabilities (Level 1 measurements) and the lowest priority to unobservable inputs (Level 3 measurements) when market prices are not readily available or reliable. The categorization of a value determined for an investment within the hierarchy is based upon the pricing transparency of the investment and is not necessarily an indication of the risk associated with investing in it.
The three levels of the fair value hierarchy are as follows:
| | • | | Level 1 — Unadjusted quoted prices in active markets for an identical asset or liability; |
| | • | | Level 2 — Inputs other than quoted prices included within Level 1 that are observable for the asset or liability either directly or indirectly, including quoted prices for similar assets or liabilities in active markets, quoted prices for identical or similar assets or liabilities in markets that are not considered to be active, inputs other than quoted prices that are observable for the asset or liability (such as exchange rates, financing terms, interest rates, yield curves, volatilities, prepayment speeds, loss severities, credit risks and default rates) or other market-corroborated inputs; and |
| | • | | Level 3 — Unobservable inputs for the asset or liability, including the Committee’s assumptions used in determining the fair value of investments. |
The value of the Fund’s investments according to the fair value hierarchy as of December 31, 2018 is disclosed in the Fund’s Schedule of Investments.
Investment Transactions and Income Recognition Investment transactions are accounted for on trade date for financial reporting purposes. Realized gains and losses from the sale or disposition of investments and foreign exchange transactions, if any, are determined using the identified cost method.
Dividend income and capital gain distributions, if any, are recognized on theex-dividend date, net of any foreign taxes withheld at source, if any.
Interest income is recorded daily on an accrual basis. All premiums and discounts are amortized/accreted for financial reporting purposes.
Non-cash dividends received in the form of stock are recorded as dividend income at fair value.
Expenses Certain expenses, which are directly identifiable to a specific Fund, are applied to the Fund within the Company. Other expenses which cannot be attributed to a specific Fund are allocated in such a manner as deemed equitable, taking into consideration the nature and type of expense and the relative net assets of the Fund within the Company.
| | | | |
| Notes to Financial Statements | | | 29 | |
State Street Income V.I.S. Fund
Notes to Financial Statements, continued — December 31, 2018
Foreign Currency Translation The accounting records of the Fund are maintained in U.S. dollars. Foreign currencies as well as investment securities and other assets and liabilities denominated in a foreign currency are translated to U.S. dollars using exchange rates at period end. Purchases and sales of securities, income receipts and expense payments denominated in foreign currencies are translated into U.S. dollars at the prevailing exchange rate on the respective dates of the transactions.
The effects of exchange rate fluctuations on investments are included with the net realized and unrealized gain (loss) on investment securities. Other foreign currency transactions resulting in realized and unrealized gain (loss) are disclosed separately.
Foreign Taxes The Fund may be subject to foreign taxes (a portion of which may be reclaimable) on income, stock dividends, realized and unrealized capital gains on investments or certain foreign currency transactions. Foreign taxes are recorded in accordance with SSGA FM’s understanding of the applicable foreign tax regulations and rates that exist in the foreign jurisdictions in which the Fund invests. These foreign taxes, if any, are paid by the Fund and are reflected in the Statement of Operations, if applicable. Foreign taxes payable or deferred as of December 31, 2018, if any, are disclosed in the Fund’s Statement of Assets and Liabilities.
Distributions The Fund declares and pays any dividends from net investment income annually.
Net realized capital gains, if any, are distributed annually, unless additional distributions are required for compliance with applicable tax regulations. The amount and character of income and capital gains to be distributed are determined in accordance with applicable tax regulations which may differ from net investment income and realized gains recognized for U.S. GAAP purposes.
| 3. | | Securities and Other Investments |
Delayed Delivery Transactions and When-Issued Securities During the fiscal year ended December 31, 2018, the Fund transacted in securities on a delayed delivery or when-issued basis. Payment and delivery may take place after the customary settlement period for that security. The price of the underlying securities and the date when the securities will be delivered and paid for are fixed at the time the transaction is negotiated. The securities purchased on a delayed delivery or when-issued basis are identified as such in the Fund’s Schedule of Investments. The Fund may receive compensation for interest forgone in the purchase of a delayed delivery or when-issued security. With respect to such purchase commitments, the Fund identifies securities as segregated in its records with a value at least equal to the amount of the commitment. Losses may arise due to changes in the value of the underlying securities or if the counterparty does not perform under the contract’s terms, or if the issuer does not issue the securities due to political, economic or other factors.
To-Be-Announced Transactions The Fund may seek to obtain exposure to U.S. agency mortgage pass-through securities through the use of“to-be-announced” or “TBA transactions.” “TBA” refers to a commonly used mechanism for the forward settlement of U.S. agency mortgage pass-through securities. In a TBA transaction, the buyer and seller decide on general trade parameters, such as agency, settlement date, coupon, and price.
The Fund may use TBA transactions to “roll over” such agreements prior to the settlement date. This type of TBA transaction is sometimes known as a “TBA roll.” In a TBA roll, the Fund generally will sell the obligation to purchase the pools stipulated in the TBA agreement prior to the settlement date and will enter into a new TBA agreement for future delivery of pools of mortgage pass-through securities. The Fund may also enter into TBA agreements and settle such transactions on the stipulated settlement date by accepting actual receipt or delivery of the pools of mortgage pass-through securities.
Default by or bankruptcy of a counterparty to a TBA transaction would expose the Fund to possible loss because of adverse market action, expenses or delays in connection with the purchase or sale of the pools of mortgage pass-through securities specified in the TBA transaction. To minimize this risk, the Fund will enter into TBA transactions only with established counterparties. The Fund’s use of “TBA rolls” may impact portfolio turnover, transaction costs and capital gain distributions to shareholders.
| 4. | | Derivative Financial Instruments |
Futures Contracts The Fund may enter into futures contracts to meet the Fund’s objectives. A futures contract is a standardized, exchange-traded agreement to buy or sell a financial instrument at a set price on a future date. Upon entering
| | |
| 30 | | Notes to Financial Statements |
State Street Income V.I.S. Fund
Notes to Financial Statements, continued — December 31, 2018
into a futures contract, the Fund is required to deposit with the broker, cash or securities in an amount equal to the minimum initial margin requirements of the clearing house. Subsequent payments are made or received by the Fund equal to the daily change in the contract value and are recorded as variation margin receivable or payable with a corresponding offset to unrealized gains or losses. The Fund recognizes a realized gain or loss when the contract is closed.
Losses may arise if the value of a futures contract decreases due to unfavorable changes in the market rates or values of the underlying instrument during the term of the contract or if the counterparty does not perform under the contract. The use of futures contracts also involves the risk that the movements in the price of the futures contracts do not correlate with the movement of the assets underlying such contracts.
For the fiscal year ended December 31, 2018, the Fund entered into futures contracts to manage exposure to interest rates.
Options on Futures Contracts The Fund may purchase and write options, including options on futures contracts, subject to certain limitations. Writing puts and buying calls tend to increase the Fund’s exposure to the underlying instrument while buying puts and writing calls tend to decrease a Fund’s exposure to the underlying instrument. The Fund will not enter into a transaction involving options for speculative purposes. The Fund’s risks in using these contracts include changes in the value of the underlying instruments,non-performance of the counterparties under the contracts’ terms and changes in the liquidity of the secondary market for the contracts.
When the Fund writes an option, the amount of the premium received is recorded as a liability and is subsequently adjusted to the current fair value of the option written. Premiums received from writing options that expire unexercised are treated by the Fund on the expiration date as realized gain from investments. The difference between the premium and the amount paid on effecting a closing purchase transaction, including brokerage commissions, is also treated as a realized gain, or if the premium is less than the amount paid for the closing purchase, as a realized loss. When an option is exercised, the proceeds from the sale of the underlying instrument or the cost basis of the securities purchased is adjusted by the original premium received or paid. In return for a premium paid, call and put options on futures contracts give the holder the right, but not the obligation, to purchase or sell, respectively, a position in a particular futures contract at a specified exercise price.
For the fiscal year ended December 31, 2018, the Fund purchased and wrote options in order to manage exposure to interest rates.
Credit Default Swaps During the fiscal year ended December 31, 2018, the Fund engaged in credit default swaps to manage credit risk. When the Fund is the buyer in a credit default swap contract, the Fund is entitled to receive the par (or other agreed upon) value (full notional value) of a referenced debt obligation (or basket of debt obligations) from the counterparty (or central clearing party (“CCP”) in the case of a centrally cleared swap) to the contract if a credit event by a third party, such as a U.S. or foreign corporate issuer or sovereign issuer, on the debt obligation occurs. In return, the Fund pays the counterparty a periodic stream of payments over the term of the contract provided that no credit event has occurred. If no credit event occurs, the Fund loses its investment and recovers nothing. However, if a credit event occurs, the Fund receives full notional value for a referenced debt obligation that may have little or no value. When the Fund is the seller of a credit default swap, it receives a fixed rate of income throughout the term of the contract, provided there is no credit event. If a credit event occurs, the Fund is obligated to pay the notional amount of the swap and in certain instances take delivery of securities of the reference entity upon the occurrence of a credit event, as defined under the terms of that particular swap agreement. Credit events are contract specific but may include bankruptcy, failure to pay, restructuring, obligation acceleration and repudiation/moratorium. If the Fund is a seller of protection and a credit event occurs, the maximum potential amount of future payments that the Fund could be required to make would be an amount equal to the notional amount of the agreement. This potential amount would be partially offset by any recovery value of the respective referenced obligation, or net amount received from the settlement of a buy protection credit default swap agreement entered into by the Fund for the same referenced obligation.
As the seller, the Fund may create economic leverage to its portfolio because, in addition to its total net assets, the Fund is subject to investment exposure on the notional amount of the swap. The interest fee paid or received on the swap, which is based on a specified interest rate on a fixed notional amount, is accrued daily as a component of unrealized appreciation (depreciation) and is recorded as realized gain upon receipt or realized loss upon payment. The Fund also records an increase or decrease to unrealized appreciation (depreciation) in an amount equal to the daily valuation. For centrally cleared swaps, the daily change in valuation is recorded as a receivable or payable for variation margin and settled in cash with the CCP daily. All upfront payments, if any, are amortized over the life of the swap as realized gains or losses. Those upfront payments that are paid or received, typically fornon-centrally cleared swaps, are recorded as other assets or other liabilities, respectively, net of amortization. For financial
| | | | |
| Notes to Financial Statements | | | 31 | |
State Street Income V.I.S. Fund
Notes to Financial Statements, continued — December 31, 2018
reporting purposes, unamortized upfront payments, if any, are netted with unrealized appreciation or depreciation on swaps to determine the market value of swaps. The Fund segregates assets in the form of cash or liquid securities in an amount equal to the notional amount of the credit default swaps of which it is the seller. The Fund segregates assets in the form of cash or liquid securities in an amount equal to any unrealized depreciation of the credit default swaps of which it is the buyer, marked to market on a daily basis. Credit default swaps involve greater risks than if the Fund had invested in the referenced debt obligation directly. If the Fund is a buyer of a credit default swap and no credit event occurs, the Fund will not earn any return on its investment. If the Fund is a seller of a credit default swap, the Fund’s risk of loss may be the entire notional amount of the swap. Swaps may also subject the Fund to the risk that the counterparty to the transaction may not fulfill its obligation. In the case of centrally cleared swaps, counterparty risk is minimal due to protections provided by the CCP.
Interest Rate Swaps Interest rate swaps involve the exchange by the Fund with another party of their respective commitments to pay or receive interest, such as an exchange of fixed rate payments for floating rate payments.
During the fiscal year ended December 31, 2018, the Fund entered into interest rate swaps in order to manage exposure to interest rates.
The following tables summarize the value of the Fund’s derivative instruments as of December 31, 2018 and the related location in the accompanying Statement of Assets and Liabilities and Statement of Operations, presented by primary underlying risk exposure:
Asset Derivatives
| | | | | | | | | | | | | | | | | | | | | | | | |
| | | Interest
Rate
Contracts
Risk | | | Foreign
Exchange
Contracts
Risk | | | Credit
Contracts
Risk | | | Equity
Contracts
Risk | | | Commodity
Contracts
Risk | | | Total | |
| | | | | | | | | | | | | | | | | | | | | | | | |
State Street Income V.I.S. Fund | | | | | | | | | | | | | | | | | | | | | |
Futures Contracts | | $ | 65,427 | | | $ | — | | | $ | — | | | $ | — | | | $ | — | | | $ | 65,427 | |
Swap Contracts | | | — | | | | — | | | | 4,642 | | | | — | | | | — | | | | 4,642 | |
Liability Derivatives
| | | | | | | | | | | | | | | | | | | | | | | | |
| | | Interest
Rate
Contracts
Risk | | | Foreign
Exchange
Contracts
Risk | | | Credit
Contracts
Risk | | | Equity
Contracts
Risk | | | Commodity
Contracts
Risk | | | Total | |
| | | | | | | | | | | | | | | | | | | | | | | | |
State Street Income V.I.S. Fund | | | | | | | | | | | | | | | | | | | | | |
Swap Contracts | | $ | (23,587 | ) | | $ | — | | | $ | — | | | $ | — | | | $ | — | | | $ | (23,587 | ) |
Realized Gain (Loss)
| | | | | | | | | | | | | | | | | | | | | | | | |
| | | Interest
Rate
Contracts
Risk | | | Foreign
Exchange
Contracts
Risk | | | Credit
Contracts
Risk | | | Equity
Contracts
Risk | | | Commodity
Contracts
Risk | | | Total | |
| | | | | | | | | | | | | | | | | | | | | | | | |
State Street Income V.I.S. Fund | | | | | | | | | | | | | | | | | | | | | |
Futures Contracts | | $ | (93,507 | ) | | $ | — | | | $ | — | | | $ | — | | | $ | — | | | $ | (93,507 | ) |
Swap Contracts | | | 31,367 | | | | — | | | | (12,130 | ) | | | — | | | | — | | | | 19,237 | |
Purchased Option Contracts(b) | | | (26,254 | ) | | | — | | | | — | | | | — | | | | — | | | | (26,254 | ) |
Written Option Contracts | | | 11,397 | | | | — | | | | — | | | | — | | | | — | | | | 11,397 | |
| | (b) | Purchased options are included in net realized gain (loss) from investments. |
Net Change in Unrealized Appreciation (Depreciation)
| | | | | | | | | | | | | | | | | | | | | | | | |
| | | Interest
Rate
Contracts
Risk | | | Foreign
Exchange
Contracts
Risk | | | Credit
Contracts
Risk | | | Equity
Contracts
Risk | | | Commodity
Contracts
Risk | | | Total | |
| | | | | | | | | | | | | | | | | | | | | | | | |
State Street Income V.I.S. Fund | | | | | | | | | | | | | | | | | | | | | |
Futures Contracts | | $ | 68,478 | | | $ | — | | | $ | — | | | $ | — | | | $ | — | | | $ | 68,478 | |
Swap Contracts | | | (17,996 | ) | | | — | | | | (5,913 | ) | | | — | | | | — | | | | (23,909 | ) |
| | |
| 32 | | Notes to Financial Statements |
State Street Income V.I.S. Fund
Notes to Financial Statements, continued — December 31, 2018
| 5. | | Fees and Transactions with Affiliates |
Advisory Fee SSGA FM, a registered investment adviser, was retained by the Board to act as investment adviser and administrator of the Fund. SSGA FM’s compensation for investment advisory and administrative services (“Management Fee”) is paid monthly based on the average daily net assets of the Fund at an annualized rate of 0.50%.
Custody, Fund Accounting andSub-Administration Fees State Street Bank and Trust Company (“State Street”) serves as the custodian, fund accountant andsub-administrator to the Fund. Amounts paid by the Fund to State Street for performing such services are included in custody, fund accounting andsub-administration fees on the Statement of Operations.
Due to Custodian In certain circumstances, the Fund may have cash overdrafts with the custodian due to expense payments, capital transactions, trading of securities, investment operations or derivative transactions. The due to custodian amount, if any, reflects cash overdrawn with State Street, as custodian, who is an affiliate of the Fund.
Other Transactions with Affiliates The Fund may invest in affiliated entities, including securities issued by State Street, affiliated funds, or entities deemed to be affiliates as a result of the Fund owning more than five percent of the entity’s voting securities or outstanding shares. Amounts relating to these transactions during the fiscal year ended December 31, 2018 are disclosed in the Schedule of Investments.
The fees and expenses of the Company’s directors who are not “interested persons” of the Company, as defined in the 1940 Act (“Independent Directors”) are paid directly by the Fund. The Independent Directors are reimbursed for travel and otherout-of-pocket expenses in connection with meeting attendance and industry seminars.
| 7. | | Investment Transactions |
Purchases and sales of investments (excludingin-kind transactions, short term investments and derivative contracts) for the fiscal year ended December 31, 2018 were as follows:
| | | | | | | | |
| U.S. Government Securities |
| Purchases | | Sales |
| | | | | | | | | |
| | $ | 29,010,681 | | | | $ | 30,810,432 | |
| | | | | | | | |
| Non-U.S. Government Securities |
| Purchases | | Sales |
| | | | | | | | | |
| | $ | 5,561,730 | | | | $ | 6,267,584 | |
The Fund has qualified and intends to continue to qualify as a regulated investment company under Subchapter M of the Internal Revenue Code of 1986, as amended. The Fund will not be subject to federal income taxes to the extent it distributes its taxable income, including any net realized capital gains, for each fiscal year. Therefore, no provision for federal income tax is required.
The Fund files federal and various state and local tax returns as required. No income tax returns are currently under examination. Generally, the federal returns are subject to examination by the Internal Revenue Service for a period of three years from date of filing, while the state returns may remain open for an additional year depending upon jurisdiction. SSGA FM has analyzed the Fund’s tax positions taken on tax returns for all open years and does not believe there are any uncertain tax positions that would require recognition of a tax liability.
Distributions to shareholders are recorded onex-dividend date. Income dividends and gain distributions are determined in accordance with income tax rules and regulations, which may differ from generally accepted accounting principles. Certain capital accounts in the financial statements have been adjusted for permanentbook-tax differences. These adjustments have no impact on net asset values or results of operations. Temporarybook-tax differences will reverse in the future. These book tax differences are primarily due to differing treatments for paydown losses, swap contracts, futures contracts, open straddle adjustments, and wash sale loss deferrals.
| | | | |
| Notes to Financial Statements | | | 33 | |
State Street Income V.I.S. Fund
Notes to Financial Statements, continued — December 31, 2018
The tax character of distributions paid during the year ended December 31, 2018 was as follows:
| | | | | | | | | | | | | |
Ordinary
Income | | Long-Term
Capital Gains | | Total |
| | | | | | | | | | | | | | |
| | $ | 420,122 | | | | $ | — | | | | $ | 420,122 | |
The tax character of distributions paid during the year ended December 31, 2017 was as follows:
| | | | | | | | | | | | | |
Ordinary
Income | | Long-Term
Capital Gains | | Total |
| | | | | | | | | | | | | | |
| | $ | 460,900 | | | | $ | — | | | | $ | 460,900 | |
At December 31, 2018, the components of distributable earnings on a tax basis were as follows:
| | | | | | | | | | | | | | | | | | | | | | | | | | | | |
Undistributed
Ordinary
Income | | Capital Loss
Carryforwards | | Undistributed
long term gain | | Net Unrealized
Gains (Losses) | | Qualified
Late-Year
Losses | | Total |
| | | | | | | | | | | | | | | | | | | | | | | | | | | | | |
| | $ | 75,054 | | | | $ | (558,895 | ) | | | $ | — | | | | $ | (147,438 | ) | | | $ | — | | | | $ | (631,279 | ) |
As of December 31, 2018, the Fund had capital loss carryforwards available to offset future realized capital gains through the indicated expiration dates as follows:
| | | | | | | | |
Non-Expiring Short-Term | | Non-Expiring Long-Term |
| | | | | | | | | |
| | $ | 176,293 | | | | $ | 382,602 | |
As of December 31, 2018, gross unrealized appreciation and gross unrealized depreciation of investments and other financial instruments based on cost for federal income tax purposes were as follows:
| | | | | | | | | | | | | | | | | | |
Tax
Cost | | Gross
Unrealized
Appreciation | | Gross
Unrealized
Depreciation | | Net Unrealized
Appreciation
(Depreciation) |
| | | | | | | | | | | | | | | | | | | |
| | $ | 21,325,356 | | | | $ | 310,143 | | | | $ | 428,550 | | | | $ | (118,407 | ) |
The Fund and other affiliated funds (each, a “Participant” and collectively, the “Participants”) participate in a $500 million revolving credit facility provided by a syndication of banks under which the Participants may borrow to fund shareholder redemptions. This agreement expires in October 2019 unless otherwise extended or renewed.
The Participants are charged an annual commitment fee which is calculated based on the unused portion of the shared credit line. Commitment fees are allocated among each of the Participants based on relative net assets. Commitment fees are ordinary fund operating expenses paid by the Adviser. A Participant incurs and pays the interest expense related to its borrowing. Interest is calculated at a rate per annum equal to the sum of 1% plus the greater of the New York Fed Bank Rate and1-month LIBOR rate.
The Fund had no outstanding loans as of December 31, 2018.
Concentration Risk As a result of the Fund’s ability to invest a large percentage of its assets in obligations of issuers within the same country, state, region, currency or economic sector, an adverse economic, business or political development may affect the value of the Fund’s investments more than if the Fund was more broadly diversified.
Interest Rate Risk Is the risk that fixed income securities will decline in value because of changes in interest rates. Bond prices generally rise when interest rates decline and generally decline when interest rates rise. Although governmental financial regulators, including the U.S. Federal Reserve, have taken steps to maintain historically low interest rates, the U.S. Federal Reserve has recently begun to raise interest rates and may continue to do so. Thus, the Fund currently faces a heightened level of interest rate risk.
| | |
| 34 | | Notes to Financial Statements |
State Street Income V.I.S. Fund
Notes to Financial Statements, continued — December 31, 2018
Foreign and Emerging Markets Risk Investing in foreign markets involves risks and considerations not typically associated with investing in the U.S. Foreign securities may be subject to risk of loss because of government regulation, economic, political and social instability in the countries in which the Fund invests. Foreign markets may be less liquid than investments in the U.S. and may be subject to the risks of currency fluctuations. To the extent that the Fund invests in securities of issuers located in emerging markets, these risks may be even more pronounced.
Market and Credit Risk In the normal course of business, the Fund trades financial instruments and enters into financial transactions where risk of potential loss exists due to changes in the general economic conditions and fluctuations of the market (market risk). Additionally, the Fund may also be exposed to credit risk in the event that an issuer or guarantor fails to perform or that an institution or entity with which the Fund has unsettled or open transactions defaults.
| 11. | | New and Recent Accounting Pronouncements |
In August 2018, the Securities and Exchange Commission released its Final Rule on Disclosure Update and Simplification (the “Final Rule”) which is intended to simplify an issuer’s disclosure compliance efforts by removing redundant or outdated disclosure requirements without significantly altering the mix of information provided to investors. The Fund has adopted the Final Rule for the current period with the most notable impacts being that the Fund is no longer required to present components of distributable earnings on the Statement of Assets and Liabilities or the sources of distributions to shareholders and the amount of undistributed net investment income on the Statement of Changes in Net Assets.
In March 2017, the FASB issued ASUNo. 2017-08, Receivables — Nonrefundable Fees and Other Costs (Subtopic310-20): Premium Amortization on Purchased Callable Debt Securities. The amendments in the ASU shorten the amortization period for certain callable debt securities, held at a premium, to be amortized to the earliest call date. The ASU does not require an accounting change for securities held at a discount; which continues to be amortized to maturity. The ASU is effective for fiscal years and interim periods within those fiscal years beginning after December 15, 2018. Management is currently evaluating the impact, if any, of applying this provision.
Management has evaluated the impact of all subsequent events on the Fund through the date on which the financial statements were available to be issued and has determined that there were no subsequent events requiring adjustment or disclosure in the financial statements.
| | | | |
| Notes to Financial Statements | | | 35 | |
State Street Income V.I.S. Fund
Report of Independent Registered Public Accounting Firm
To the Shareholders and the Board of Directors of State Street Income V.I.S. Fund
Opinion on the Financial Statements
We have audited the accompanying statement of assets and liabilities of State Street Income V.I.S. Fund (the “Fund”) (one of the funds constituting State Street Variable Insurance Series Funds, Inc. (the “Company”)), including the schedule of investments, as of December 31, 2018, and the related statement of operations for the year then ended, the statement of changes in net assets for each of the two years in the period then ended, the financial highlights for each of the three years in the period then ended and the related notes (collectively referred to as the “financial statements”). In our opinion, the financial statements present fairly, in all material respects, the financial position of the Fund (one of the funds constituting State Street Variable Insurance Series Funds, Inc.) at December 31, 2018, the results of its operations for the year then ended, the changes in its net assets for each of the two years in the period then ended and its financial highlights for each of the three years in the period then ended, in conformity with U.S. generally accepted accounting principles. The financial highlights for periods ended prior to January 1, 2016 were audited by another independent registered public accounting firm whose report, dated February 19, 2016, expressed an unqualified opinion on those financial highlights.
Basis for Opinion
These financial statements are the responsibility of the Company’s management. Our responsibility is to express an opinion on the Fund’s financial statements based on our audits. We are a public accounting firm registered with the Public Company Accounting Oversight Board (United States) (“PCAOB”) and are required to be independent with respect to the Company in accordance with the U.S. federal securities laws and the applicable rules and regulations of the Securities and Exchange Commission and the PCAOB.
We conducted our audits in accordance with the standards of the PCAOB. Those standards require that we plan and perform the audit to obtain reasonable assurance about whether the financial statements are free of material misstatement, whether due to error or fraud. The Company is not required to have, nor were we engaged to perform, an audit of the Company’s internal control over financial reporting. As part of our audits we are required to obtain an understanding of internal control over financial reporting, but not for the purpose of expressing an opinion on the effectiveness of the Company’s internal control over financials reporting. Accordingly, we express no such opinion.
Our audits included performing procedures to assess the risks of material misstatement of the financial statements, whether due to error or fraud, and performing procedures that respond to those risks. Such procedures included examining, on a test basis, evidence regarding the amounts and disclosures in the financial statements. Our procedures included confirmation of securities owned as of December 31, 2018, by correspondence with the custodian, brokers and others or by other appropriate auditing procedures where replies from brokers and others were not received. Our audits also included evaluating the accounting principles used and significant estimates made by management, as well as evaluating the overall presentation of the financial statements. We believe that our audits provide a reasonable basis for our opinion.

We have served as the auditor of one or more State Street Global Advisors investment companies since 2000.
Boston, Massachusetts
February 19, 2019
| | |
| 36 | | Report of Independent Registered Public Accounting Firm |
State Street Income V.I.S. Fund
Special Meeting of Shareholders — Voting Results
A special meeting of shareholders of State Street Variable Insurance Series Funds, Inc. (the “Company”) was held on January 10, 2019 to elect the following six nominees as Directors of the Company: Michael F. Holland, Michael A. Jessee, Ellen M. Needham, Patrick J. Riley, Richard D. Shirk and Rina K. Spence. At the meeting the following votes were recorded:
| | | | | | | | |
| Nominee | | Shares For | | | Shares Withheld | |
Michael F. Holland | | | 91,260,156.834 | | | | 2,655,810.669 | |
Michael A. Jessee | | | 91,345,936.433 | | | | 2,570,031.070 | |
Ellen M. Needham | | | 91,642,423.619 | | | | 2,273,543.884 | |
Patrick J. Riley | | | 91,136,965.946 | | | | 2,779,001.557 | |
Richard D. Shirk | | | 91,293,712.247 | | | | 2,622,255.256 | |
Rina K. Spence | | | 90,957,562.624 | | | | 2,958,404.879 | |
The other Directors whose term of office continued after the meeting are as follows: Jeanne M. La Porta, John R. Costantino and Donna M. Rapaccioli.
| | | | |
| Special Meeting of Shareholders — Voting Results | | | 37 | |
State Street Income V.I.S. Fund
Other Information — December 31, 2018 (Unaudited)
| | | | | | | | | | | | |
| | | | | | |
Name,
Address,
and Year of Birth | | Position(s) Held
with Fund | | Term of
Office and
Length of
Time Served | | Principal Occupation
During Past Five Years
and Relevant Experience | | Number of
Funds
in Fund
Complex
Overseen
by Director† | | | Other Directorships
Held by Director During Past Five Years |
INDEPENDENT DIRECTORS | | | | | | |
Michael F. Holland c/o SSGA Funds Management, Inc. One Iron Street Boston, MA 02210 YOB: 1944 | | Director and Co-Chairperson of the Board | | Term: Indefinite Elected: 1/19 | | Chairman, Holland & Company L.L.C. (investment adviser) (1995 – present). | | | 67 | | | Director, the Holland Series Fund, Inc.; Director, The China Fund, Inc.; Director, The Taiwan Fund, Inc. (2007 – 2017); Director, Reaves Utility Income Fund, Inc.; and Director, Blackstone/GSO Loans (and Real Estate) Funds. |
| |
Patrick J. Riley c/o SSGA Funds Management, Inc. One Iron Street Boston, MA 02210 YOB: 1948 | | Director and Co-Chairperson of the Board | | Term: Indefinite Elected: 1/19 | | 2002 to May 2010, Associate Justice of the Superior Court, Commonwealth of Massachusetts; 1985 to 2002, Partner, Riley, Burke & Donahue, L.L.P. (law firm); 1998 to Present, Independent Director, State Street Global Advisers Ireland, Ltd. (investment company); 1998 to Present, Independent Director, SSGA Liquidity plc (formerly, SSGA Cash Management Fund plc); January 2009 to Present, Independent Director, SSGA Fixed Income plc; and January 2009 to Present, Independent Director, SSGA Qualified Funds PLC. | | | 67 | | | Board Director and Chairman, SPDR Europe 1PLC Board (2011-Present); Board Director and Chairman, SPDR Europe II, PLC (2013- Present). |
| |
John R. Costantino c/o SSGA Funds Management, Inc. One Iron Street Boston, MA 02210 YOB: 1946 | | Director and Co-Chairperson of the Qualified Legal and Compliance Committee | | Term: Indefinite Elected: 1997 | | Managing General Partner, NGN Capital LLC (2006 – present); and Managing Director, Vice President of Walden Capital Management (1996 – present). | | | 67 | | | Director of Kleinfeld Bridal Corp. (March 2016 – present);Trustee of Neuroscience Research Institute (1986 – present); Trustee of Fordham University (1989 – 1995 and 2001 – 2007) and Trustee Emeritus (2007 – present); Trustee of GE Funds (1993 – February 2011); Director of Artes Medical (2006 – 2008); and Trustee of Gregorian University Foundation (1992 – 2007). |
| |
Donna M. Rapaccioli c/o SSGA Funds Management, Inc. One Iron Street Boston, MA 02210 YOB: 1962 | | Director and Co-Chairperson of the Audit Committee | | Term: Indefinite Elected: 1/12 | | Dean of the Gabelli School of Business (2007 – present) and Accounting Professor (1987 – present) at Fordham University. | | | 67 | | | Director- Graduate Management Admissions Council (2015 – present); Trustee of Emmanuel College (2010 – present). |
State Street Income V.I.S. Fund
Other Information, continued — December 31, 2018 (Unaudited)
| | | | | | | | | | | | |
| | | | | | |
Name,
Address,
and Year of Birth | | Position(s) Held
with Fund | | Term of
Office and
Length of
Time Served | | Principal Occupation
During Past Five Years
and Relevant Experience | | Number of
Funds
in Fund
Complex
Overseen
by Director† | | | Other Directorships
Held by Director During Past Five Years |
INDEPENDENT DIRECTORS (continued) |
Richard D. Shirk c/o SSGA Funds Management, Inc. One Iron Street Boston, MA 02210 YOB: 1945 | | Director andCo-Chairperson of the Qualified Legal and Compliance Committee | | Term: Indefinite Elected: 1/19 | | March 2001 to April 2002, Chairman (1996 to March 2001, President and Chief Executive Officer), Cerulean Companies, Inc. (holding company) (Retired); 1992 to March 2001, President and Chief Executive Officer, Blue Cross Blue Shield of Georgia (health insurer, managed healthcare). | | | 67 | | | 1998 to December 2008, Chairman, Board Member and December 2008 to Present, Investment Committee Member, Healthcare Georgia Foundation (private foundation); September 2002 to 2012, Lead Director and Board Member, Amerigroup Corp. (managed health care); 1999 to 2013, Board Member and (since 2001) Investment Committee Member, Woodruff Arts Center; and 2003 to 2009, Trustee, Gettysburg College; Board member, Aerocare Holdings, Regenesis Biomedical Inc. |
| |
Rina K. Spence c/o SSGA Funds Management, Inc. One Iron Street Boston, MA 02210 YOB: 1948 | | Director andCo-Chairperson of the Audit Committee, Chairperson of the Nominating Committee and Chairperson of the Governance Committee | | Term: Indefinite Elected: 1/19 | | President of SpenceCare International LLC (international healthcare consulting) (1999 – present); Chief Executive Officer, IEmily.com (health internet company) (2000 – 2001); Chief Executive Officer of Consensus Pharmaceutical, Inc. (1998 – 1999); Founder, President and Chief Executive Officer of Spence Center for Women’s Health (1994 –1998); President and CEO, Emerson Hospital (1984 – 1994); Honorary Consul for Monaco in Boston (2015 – present). | | | 67 | | | None |
| |
Michael A. Jessee c/o SSGA Funds Management, Inc. One Iron Street Boston, MA 02210 YOB: 1946 | | Director andCo-Chairperson of the Valuation Committee | | Term: Indefinite Elected: 1/19 | | Retired; formerly, President and Chief Executive Officer of the Federal Home Loan Bank of Boston (1989 – 2009); Trustee, Randolph-Macon College (2004 – 2016). | | | 67 | | | None |
State Street Income V.I.S. Fund
Other Information, continued — December 31, 2018 (Unaudited)
| | | | | | | | | | | | |
| | | | | | |
Name,
Address,
and Year of Birth | | Position(s) Held
with Fund | | Term of
Office and
Length of
Time Served | | Principal Occupation
During Past Five Years
and Relevant Experience | | Number of
Funds
in Fund
Complex
Overseen
by Director† | | | Other Directorships
Held by Director During Past Five Years |
INTERESTED DIRECTORS(1) | | | | | | | | |
Jeanne M. La Porta(2) SSGA Funds Management, Inc. 1600 Summer St. Stamford, CT 06905 YOB: 1965 | | Director and President | | Time Indefinite Elected: 3/14 | | Senior Managing Director at State Street Global Advisors (July 2016 – present); Director of State Street Global Advisors Funds Distributors, LLC (May 2017 – present); President of GE Retirement Savings Plan Funds (July 2016 – present); Senior Vice President and Commercial Operations Leader at GE Asset Management Incorporated (“GEAM”) (March 2014 – July 2016); President of State Street Institutional Funds and State Street Variable Insurance Series Funds, Inc. (April 2014 – present); President and Trustee. | | | 18 | | | None |
| | | | | | | | | | | | | |
Ellen M. Needham(3) SSGA Funds Management, Inc. One Iron Street Boston, MA 02210 YOB: 1967 | | Director | | Time Indefinite Elected: 1/19 | | President and Director, SSGA FM (2001 – present)*; Senior Managing Director, State Street Global Advisors (1992 – present)*; Director, State Street Global Advisors Funds Distributors, LLC (May 2017 – present).* | | | 67 | | | None |
| (1) | | The individuals listed below are Directors who are “interested persons,” as defined in the 1940 Act, of the Company (“Interested Directors”). |
| (2) | | Ms. La Porta is an Interested Director because of her employment by SSGA Funds Management, Inc., an affiliate of the Company. |
| (3) | | Ms. Needham is an Interested Director because of her employment by SSGA Funds Management, Inc., an affiliate of the Company. |
| * | | Served in various capacities and/or with various affiliated entities during noted time period |
| † | | For the purpose of determining the number of portfolios overseen by the Directors, “Fund Complex” comprises registered investment companies for which SSGA FM serves as investment adviser. |
The following lists the principal officers for the Company, as well as their mailing addresses and ages, positions with the Company and length of time served, and present and principal occupations:
| | | | | | |
| | | | |
Name,
Address,
and Year
of Birth | | Position(s) Held
with Fund | | Term of
Office and
Length of
Time Served | | Principal Occupation During Past Five Years |
OFFICERS: | | | | | | |
Jeanne M. La Porta SSGA Funds Management, Inc. 1600 Summer St. Stamford, CT 06905 YOB: 1965 | | President and Director | | Term: Indefinite Elected: 3/14 | | Senior Managing Director at State Street Global Advisors (July 2016 – present); Director of State Street Global Advisors Funds Distributors, LLC (May 2017 – present); President of GE Retirement Savings Plan Funds (July 2016 – present); Senior Vice President and Commercial Operations Leader at GE Asset Management Incorporated (“GEAM”) (March 2014 – July 2016); President of State Street Institutional Funds and State Street Variable Insurance Series Funds, Inc. (April 2014 – present); President and Trustee. |
State Street Income V.I.S. Fund
Other Information, continued — December 31, 2018 (Unaudited)
| | | | | | |
| | | | |
Name,
Address,
and Year
of Birth | | Position(s) Held
with Fund | | Term of
Office and
Length of
Time Served | | Principal Occupation During Past Five Years |
OFFICERS (continued): | | | | | | |
Arthur A. Jensen SSGA Funds Management, Inc. 1600 Summer Street Stamford, CT 06905 YOB: 1966 | | Treasurer | | Term: Indefinite Elected: 6/11 | | Vice President, State Street Global Advisors and SSGA Funds Management, Inc. (July 2016 – present); Deputy Treasurer of Elfun Funds (July 2016 – present); Treasurer of State Street Institutional Funds, State Street Variable Insurance Series Funds, Inc. and GE Retirement Savings Plan Funds (June 2011 – present); Treasurer of Elfun Funds (June 2011– July 2016); Mutual Funds Controller of GE Asset Management Incorporated (April 2011 – July 2016). |
| | | | | | | |
Brian Harris SSGA Funds Management, Inc. One Iron Street Boston, MA 02210 YOB: 1973 | | Chief Compliance Officer and Anti-Money Laundering Officer | | Term: Indefinite Elected: 6/16 | | Managing Director, State Street Global Advisors and SSGA Funds Management, Inc. (2013 – Present); Senior Vice President and Global Head of Investment Compliance, BofA Global Capital Management (September 2010 – May 2013). |
| | | | | | | |
Bruce S. Rosenberg SSGA Funds Management, Inc. One Iron Street Boston, MA 02210 YOB: 1961 | | Assistant Treasurer | | Term: Indefinite Elected: 6/16 | | Managing Director, State Street Global Advisors and SSGA Funds Management, Inc. (July 2015 – present); Director, Credit Suisse (April 2008 – July 2015). |
| | | | | | | |
Ann M. Carpenter SSGA Funds Management, Inc. One Iron Street Boston, MA 02210 YOB: 1966 | | Assistant Treasurer | | Term: Indefinite Elected: 6/16 | | Chief Operating Officer, SSGA Funds Management, Inc. (April 2005 – present) *; Managing Director, State Street Global Advisors. (2005 – present).* |
| | | | | | | |
Chad C. Hallett SSGA Funds Management, Inc. One Iron Street Boston, MA 02210 YOB: 1969 | | Assistant Treasurer | | Term: Indefinite Elected: 6/16 | | Vice President, State Street Global Advisors and SSGA Funds Management, Inc. (November 2014 – present); Vice President, State Street Bank and Trust Company (2001 – November 2014).* |
| | | | | | | |
Darlene Anderson-Vasquez SSGA Funds Management, Inc. One Iron Street Boston, MA 02210 YOB: 1968 | | Assistant Treasurer | | Term: Indefinite Elected: 3/17 | | Managing Director, State Street Global Advisors and SSGA Funds Management, Inc. (May 2016 – present); Senior Vice President, John Hancock Investments (September 2007 – May 2016). |
| | | | | | | |
Daniel G. Plourde SSGA Funds Management, Inc. One Iron Street Boston, MA 02210 YOB: 1980 | | Assistant Treasurer | | Term: Indefinite Elected: 6/17 | | Vice President, State Street Global Advisors and SSGA Funds Management, Inc. (May 2015 – present); Officer, State Street Bank and Trust Company (March 2009 – May 2015). |
State Street Income V.I.S. Fund
Other Information, continued — December 31, 2018 (Unaudited)
| | | | | | |
| | | | |
Name,
Address,
and Year
of Birth | | Position(s) Held
with Fund | | Term of
Office and
Length of
Time Served | | Principal Occupation During Past Five Years |
OFFICERS (continued): | | | | | | |
Jesse D. Hallee State Street Bank and Trust Company 100 Summer Street, 7th Floor Boston, MA 02111-2900 YOB: 1976 | | Secretary | | Term: Indefinite Elected: 3/17 | | Vice President and Managing Counsel, State Street Bank and Trust Company (2013 – present); Vice President and Counsel, Brown Brothers Harriman & Co. (2007-2013). |
| * | Served in various capacities and/or with various affiliated entities during noted time period. |
State Street Income V.I.S. Fund
Other Information, continued — December 31, 2018 (Unaudited)
Proxy Voting Policies and Procedures and Record
The Fund has adopted the proxy voting policies of SSGA FM. A description of the policies and procedures that the Fund has adopted to determine how to vote proxies relating to portfolio securities is available (i) without charge, upon request, by calling1-800-242-0134, (ii) on the Fund’s website at http://www.ssga.com/geam, or (iii) on the SEC’s website at www.sec.gov. Information regarding how the Fund voted proxies, if any, during the most recent12-month period ended June 30 is available by August 31 of each year without charge (1) by calling1-800-242-0134 (toll free), and (2) on the website of the SEC at www.sec.gov.
Quarterly Portfolio Schedule
The Fund files its complete schedule of investments with the SEC for the first and third quarters of each fiscal year on FormN-Q. The Fund’s FormsN-Q are available (i) without charge, upon request, by calling1-800-242-013, (ii) on the Fund’s website at http://www.ssga.com/geam, or (iii) on the SEC’s website at www.sec.gov.
Directors
Michael F. Holland, Co-Chairperson
Patrick J. Riley, Co-Chairperson
John R. Costantino
Donna M. Rapaccioli
Michael A. Jessee
Richard D. Shirk
Rina K. Spence
Jeanne M. La Porta
Ellen M. Needham
Officers
Jeanne M. La Porta, President
Arthur Jensen, Treasurer
Brian Harris, Chief Compliance Officer and Anti-Money Laundering Officer
Bruce S. Rosenberg, Assistant Treasurer
Ann M. Carpenter, Assistant Treasurer
Chad C. Hallett, Assistant Treasurer
Darlene Anderson-Vasquez, Assistant Treasurer
Daniel G. Plourde, Assistant Treasurer
Jesse Hallee, Secretary
Investment Adviser and Administrator
SSGA Funds Management, Inc.
One Iron Street
Boston, MA 02210
Custodian andSub-Administrator
State Street Bank and Trust Company
One Lincoln Street
Boston, Massachusetts 02111
Distributor
State Street Global Advisors Funds Distributors, LLC
One Iron Street
Boston, MA 02210
Independent Registered Public Accounting Firm
Ernst & Young LLP
200 Clarendon Street
Boston, Massachusetts 02116
Annual Report
December 31, 2018
State Street Real Estate Securities V.I.S. Fund
Beginning on January 1, 2021, as permitted by regulations adopted by the Securities and Exchange Commission, paper copies of a Fund’s annual and semi- annual shareholder reports will no longer be sent by mail, unless you specifically request paper copies of the reports from the Fund (or from your financial intermediary, such as a broker-dealer or bank). Instead, the reports will be made available on a Fund’s website (www.ssga.com/geam), and you will be notified by mail each time a report is posted, and provided with a website link to access the report.
Beginning on January 1, 2019, you may elect to receive all future reports in paper free of charge. If you invest through a financial intermediary, you can contact your financial intermediary to request that you continue to receive paper copies of your shareholder reports. Your election to receive reports in paper will apply to all funds held in your account, if you invest through your financial intermediary or all funds held with the fund complex if you invest directly with a Fund.

State Street Real Estate Securities V.I.S. Fund
Annual Report
December 31, 2018
Table of Contents
This report is prepared for Policyholders of certain variable contracts and may be distributed to others only if preceded or accompanied by the variable contract’s current prospectus and the current summary prospectus of the Fund available for investments thereunder.
State Street Real Estate Securities V.I.S. Fund
Notes to Performance — December 31, 2018 (Unaudited)
The information provided on the performance page relates to the State Street Real Estate Securities V.I.S Fund (the “Fund”).
Total return performance shown in this report for the Fund takes into account changes in share price and assumes reinvestment of dividends and capital gains distributions, if any. Total returns shown are net of Fund fees and expenses but do not reflect fees and charges associated with the variable contracts such as administrative fees, account charges and surrender charges, which, if reflected, would reduce the Fund’s total returns for all periods shown.
The performance data quoted represents past performance; past performance does not guarantee future results. Investment return and principal value will fluctuate so your shares, when redeemed, may be worth more or less than their original cost. Current performance may be higher or lower than the performance data quoted. Periods less than one year are not annualized. Please call toll-free
(800) 242-0134 or visit the Fund’s website at http://www.ssga.com/geam for the most recent month-end performance data.
An investment in the Fund is not a deposit of any bank and is not insured or guaranteed by the Federal Deposit Insurance Corporation (“FDIC”) or any other government agency. An investment in the Fund is subject to risk, including possible loss of principal invested.
FTSE NAREIT Equity REITs Index is an unmanaged index of all tax-qualified equity real estate investment trusts (“REITs”) (except Timber REITs or Infrastructure REITs) listed on the New York Stock Exchange, American Stock Exchange and NASDAQ which have 75% or more of their gross invested book assets invested directly or indirectly in the equity ownership of real estate. The results shown for the foregoing index assume the reinvestment of net dividends or interest and do not reflect fees, expenses, or taxes. As such, the index returns do not reflect the actual cost of investing in the instruments that comprise the index.
The views expressed in this document reflect our judgment as of the publication date and are subject to change at any time without notice.
State Street Global Advisors Funds Distributors, LLC, member of FINRA & SIPC is the principal underwriter and distributor of the State Street V.I.S. Funds and an indirect wholly-owned subsidiary of State Street Corporation. References to State Street may include State Street Corporation and its affiliates. The Funds pay State Street Bank and Trust Company for its services as custodian and Fund Accounting agent, and pay SSGA Funds Management, Inc. for investment advisory and administrative services.
State Street Real Estate Securities V.I.S. Fund
Management Discussion of Fund Performance — December 31, 2018 (Unaudited)
The State Street Real Estate Securities V.I.S. Fund (the “Fund”) seeks to provide the maximum total return through current income and capital appreciation. The Fund’s benchmark is the FTSE NAREIT Equity REITs Index (the “Index”).
For the12-month period ended December 31, 2018 (the “Reporting Period”), the total return for the Fund was-5.71% and the Index was-4.62%. The Fund and Index returns reflect the reinvestment of dividends and other income. The Fund’s performance reflects the expenses of managing the Fund, including brokerage and advisory expenses. The Index is unmanaged and Index returns do not reflect fees and expenses of any kind, which would have a negative impact on returns.
The primary driver of Fund performance during the Reporting Period was an underweight to the Healthcare REIT sector which was the top performing sector of REITs. This underperformance was magnified by the Fund having an underweight to Managed Care Facilities within Healthcare REITs, which performed the strongest of the segments within Healthcare. This performance was somewhat offset by an underweight position in Hotel & Resort REITs, strong security selection within Office REITs and Retail REITs which were drivers of positive Fund performance during the Reporting Period relative to the Index. Hotels & Resorts sold off during the year despite the strong economic backdrop, which was additive to the Fund’s performance because it was underweight that segment of the market. The Fund was also overweight Office REITs, which detracted from overall returns but security selection within that segment positively overwhelmed the negative allocation impact. Security selection within the Retail segment was also a positive contributor to returns with an overweight to Simon Properties, a premier retail operator, being the primary driver.
The Fund did not invest in derivatives during the Reporting Period.
On an individual security level, the top positive contributors to the Fund’s performance on an absolute basis during the Reporting Period were Simon Properties, Cubesmart and Americold Realty. The top negative contributors to the Fund’s performance on an absolute basis during the Reporting Period were Healthcare Trust of America, QTS Realty Inc. and Public Storage.
The views expressed above reflect those of the Fund’s portfolio manager only through the Reporting Period, and do not necessarily represent the views of the Adviser as a whole. Any such views are subject to change at any time based upon market or other conditions and the Adviser disclaims any responsibility to update such views. These views may not be relied on as investment advice and, because investment decisions for a fund are based on numerous factors, may not be relied on as an indication of trading intent on behalf of any fund.
| | |
| 2 | | State Street Real Estate Securities V.I.S. Fund |
State Street Real Estate Securities V.I.S. Fund
Understanding Your Fund’s Expenses — December 31, 2018 (Unaudited)
As a shareholder of the Fund, you incur ongoing costs. Ongoing costs include portfolio management fees, professional fees, administrative fees and other Fund expenses. The following example is intended to help you understand your ongoing costs (in dollars) of investing in the Fund and to compare these costs with the ongoing costs of investing in other mutual funds.
To illustrate these ongoing costs, we have provided an example and calculated the expenses paid by investors in the Fund during the period. The information in the following table is based on an investment of $1,000, which is invested at the beginning of the period and held for the entiresix-month period ended December 31, 2018.
Actual Expenses
The first section of the table provides information about actual account values and actual expenses. You may use the information in this section, together with the amount you invested, to estimate the expenses that you paid over the period. To do so, simply divide your account value by $1,000 (for example, an $8,600 account value divided by $1,000 = 8.6), then multiply the result by the number given under the heading “Expenses paid during the period” to estimate the expenses you paid on your account during the period.
Hypothetical Example for Comparison Purposes
The second section of the table provides information about hypothetical account values and hypothetical expenses based on the Fund’s actual expense ratio and an assumed rate of return of 5% per year before expenses, which is not the Fund’s actual return. The hypothetical account values and expenses may not be used to estimate the actual ending account balance or expenses you paid for the period. You may use this information to compare the ongoing costs of investing in the Fund and other funds. To do so, compare this 5% hypothetical example with the 5% hypothetical examples that appear in the shareholder reports of other funds.
Please note that the expenses shown in the table are meant to highlight and help you compare ongoing costs only and do not reflect transaction costs, such as sales charges or redemption fees, if any. Therefore, the second section of the table is useful in comparing ongoing costs only, and will not help you determine the relative total costs of owning different funds. Additionally, the expenses shown do not reflect the fees or charges associated with variable contracts through which shares of the Fund are offered.
July 1, 2018 - December 31, 2018
| | | | | | | | |
| | | Actual
Fund Return | | | Hypothetical
5% Return
(2.5% for
the period) | |
Account value at the beginning of the period | | $ | 1,000.00 | | | $ | 1,000.00 | |
Account value at the end of the period | | $ | 936.10 | | | $ | 1,020.06 | |
Expenses paid during the period* | | $ | 4.98 | | | $ | 5.19 | |
| * | Expenses are equal to the Fund’s annualized expense ratio of 1.02%** (for the period July 1, 2018-December 31, 2018), multiplied by the average account value over the period, multiplied by 184/365 (to reflect theone-half year period). |
| ** | May differ from expense ratio disclosed in the financial highlights, which is calculated based on the entire fiscal year’s data. |
| | | | |
| State Street Real Estate Securities V.I.S. Fund | | | 3 | |
State Street Real Estate Securities V.I.S. Fund
Performance Summary — December 31, 2018 (Unaudited)
Top Ten Largest Holdings
as of December 31, 2018 (as a % of Fair Value)(a)(b)
| | | | |
Simon Property Group Inc. | | | 6.09 | % |
| |
Prologis Inc. REIT | | | 5.91 | % |
| |
Equinix Inc. | | | 5.24 | % |
| |
AvalonBay Communities Inc. | | | 4.47 | % |
| |
HCP Inc. | | | 3.63 | % |
| |
Ventas Inc. | | | 3.58 | % |
| |
VEREIT Inc. | | | 3.02 | % |
| |
CubeSmart | | | 2.96 | % |
| |
Camden Property Trust | | | 2.76 | % |
| |
Boston Properties Inc. | | | 2.73 | % |
Sector Allocation as of December 31, 2018
Portfolio composition as a % of Fair Value of $$50,050 (in thousands) as of December 31, 2018(a)(b)
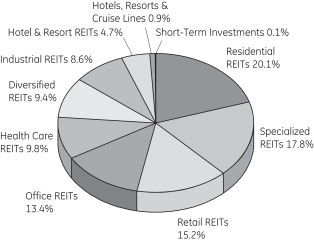
Average Annual Total Return for the periods ended December 31, 2018
Class 1 Shares (Inception date: 5/01/95)
| | | | | | | | | | | | | | | | |
| | | One Year | | | Five Year | | | Ten Year | | | Ending Value
of a $10,000
Investment | |
State Street Real Estate Securities V.I.S. Fund | | | -5.71 | % | | | 8.25 | % | | | 13.10 | % | | $ | 34,255 | |
| | | | |
FTSE NAREIT Equity REITs Index | | | -4.62 | % | | | 7.90 | % | | | 12.12 | % | | $ | 31,382 | |
| (a) | Fair Value basis is inclusive of short-term investment in State Street Institutional U.S. Government Money Market Fund Class G Shares. |
| (b) | The securities information regarding holdings, allocations and other characteristics is presented to illustrate examples of securities that the Fund has bought and the diversity of areas in which the Fund may invest as of a particular date. It may not be representative of the Fund’s current or future investments and should not be construed as a recommendation to purchase or sell a particular security. |
| | |
| 4 | | State Street Real Estate Securities V.I.S. Fund |
State Street Real Estate Securities V.I.S. Fund
Performance Summary, continued — December 31, 2018 (Unaudited)
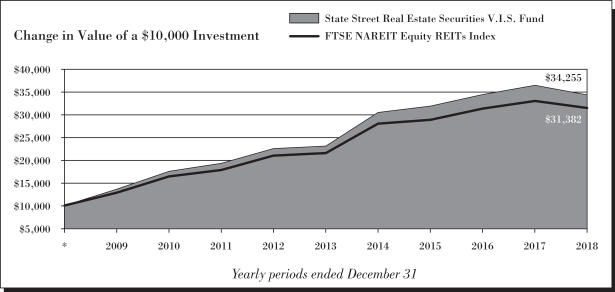
See Notes to Performance beginning on page 1 for further information.
Past performance does not predict future performance. The performance shown in the graphs and tables does not reflect the deduction of taxes that a shareholder would pay on Fund distributions or the redemption of Fund shares and does not reflect the fees or charges that would be associated with variable contracts through which shares of the Fund are offered.
| | | | |
| State Street Real Estate Securities V.I.S. Fund | | | 5 | |
State Street Real Estate Securities V.I.S. Fund
Schedule of Investments — December 31, 2018
| | | | | | | | |
| | | Number
of Shares | | | Fair
Value $ | |
| | | | | | | | |
| |
| Common Stock (REITs) - 99.3%† | | | | | |
Alternate Housing - 7.0% | | | | | |
American Homes 4 Rent, Class A | | | 67,440 | | | | 1,338,684 | |
Invitation Homes Inc. | | | 41,290 | | | | 829,103 | |
Sun Communities Inc. | | | 13,410 | | | | 1,363,931 | |
| | | | | | | | |
| | | | 3,531,718 | |
| | | | | | | | |
| |
Diversified - 5.2% | | | | | |
JBG SMITH Properties | | | 6,240 | | | | 217,214 | |
VEREIT Inc. | | | 211,370 | | | | 1,511,296 | |
WP Carey Inc. | | | 13,700 | | | | 895,158 | |
| | | | | | | | |
| | | | 2,623,668 | |
| | | | | | | | |
|
Freestanding - 2.3% | |
Realty Income Corp. | | | 6,760 | | | | 426,150 | |
STORE Capital Corp. | | | 25,280 | | | | 715,677 | |
| | | | | | | | |
| | | | 1,141,827 | |
| | | | | | | | |
| |
Healthcare - 9.8% | | | | | |
HCP Inc. | | | 65,080 | | | | 1,817,684 | |
Healthcare Trust of America Inc., Class A | | | 52,100 | | | | 1,318,651 | |
Ventas Inc. | | | 30,590 | | | | 1,792,268 | |
| | | | | | | | |
| | | | 4,928,603 | |
| | | | | | | | |
| |
Hotel - 5.6% | | | | | |
Chesapeake Lodging Trust | | | 13,440 | | | | 327,264 | |
Hilton Worldwide Holdings Inc. | | | 6,340 | | | | 455,212 | |
Host Hotels & Resorts Inc. | | | 9,970 | | | | 166,200 | |
Park Hotels & Resorts Inc. | | | 33,800 | | | | 878,124 | |
Pebblebrook Hotel Trust | | | 6,000 | | | | 169,860 | |
Sunstone Hotel Investors Inc. | | | 61,460 | | | | 799,595 | |
| | | | | | | | |
| | | | 2,796,255 | |
| | | | | | | | |
| |
Industrial - 10.1% | | | | | |
Americold Realty Trust | | | 18,930 | | | | 483,472 | |
Duke Realty Corp. | | | 7,810 | | | | 202,279 | |
Liberty Property Trust | | | 19,560 | | | | 819,173 | |
Prologis Inc. REIT | | | 50,340 | | | | 2,955,965 | |
STAG Industrial Inc. | | | 26,040 | | | | 647,875 | |
| | | | | | | | |
| | | | 5,108,764 | |
| | | | | | | | |
| |
Multifamily - 12.9% | | | | | |
AvalonBay Communities Inc. | | | 12,850 | | | | 2,236,542 | |
Camden Property Trust | | | 15,710 | | | | 1,383,266 | |
Equity Residential | | | 20,100 | | | | 1,326,801 | |
Essex Property Trust Inc. | | | 2,290 | | | | 561,531 | |
UDR Inc. | | | 25,190 | | | | 998,028 | |
| | | | | | | | |
| | | | 6,506,168 | |
| | | | | | | | |
| |
Office - 15.8% | | | | | |
Alexandria Real Estate Equities Inc. | | | 9,420 | | | | 1,085,561 | |
| | | | | | | | |
| | | Number
of Shares | | | Fair
Value $ | |
Boston Properties Inc. | | | 12,130 | | | | 1,365,231 | |
Brandywine Realty Trust | | | 26,910 | | | | 346,332 | |
Cousins Properties Inc. | | | 80,720 | | | | 637,688 | |
Empire State Realty Trust Inc., Class A | | | 51,950 | | | | 739,248 | |
Highwoods Properties Inc. | | | 20,410 | | | | 789,663 | |
Kilroy Realty Corp. | | | 20,910 | | | | 1,314,821 | |
Mack-Cali Realty Corp. | | | 36,910 | | | | 723,067 | |
Tier REIT Inc. | | | 11,430 | | | | 235,801 | |
VICI Properties Inc. | | | 38,020 | | | | 714,016 | |
| | | | | | | | |
| | | | 7,951,428 | |
| | | | | | | | |
| |
Regional Malls - 8.3% | | | | | |
Simon Property Group Inc. | | | 18,150 | | | | 3,049,018 | |
Taubman Centers Inc. | | | 8,280 | | | | 376,657 | |
The Macerich Co. | | | 17,860 | | | | 772,981 | |
| | | | | | | | |
| | | | 4,198,656 | |
| | | | | | | | |
| |
Self Storage - 6.2% | | | | | |
CubeSmart | | | 51,650 | | | | 1,481,839 | |
Extra Space Storage Inc. | | | 10,030 | | | | 907,514 | |
Public Storage | | | 3,530 | | | | 714,507 | |
| | | | | | | | |
| | | | 3,103,860 | |
| | | | | | | | |
| |
Shopping Centers - 5.9% | | | | | |
Brixmor Property Group Inc. | | | 34,970 | | | | 513,709 | |
Federal Realty Investment Trust | | | 5,620 | | | | 663,385 | |
Regency Centers Corp. | | | 14,740 | | | | 864,943 | |
Retail Properties of America Inc., Class A | | | 45,390 | | | | 492,481 | |
Urban Edge Properties | | | 15,330 | | | | 254,785 | |
Weingarten Realty Investors | | | 7,670 | | | | 190,293 | |
| | | | | | | | |
| | | | 2,979,596 | |
| | | | | | | | |
| |
Specialty - 10.2% | | | | | |
CyrusOne Inc. | | | 25,020 | | | | 1,323,058 | |
Equinix Inc. | | | 7,440 | | | | 2,623,046 | |
Iron Mountain Inc. | | | 36,000 | | | | 1,166,760 | |
| | | | | | | | |
| | | | 5,112,864 | |
| | | | | | | | |
| |
Total Common Stock (REITs)
(Cost $49,613,566) | | | | 49,983,407 | |
| | | | | | | | |
| |
| Short-Term Investments - 0.1% | | | | | |
State Street Institutional U.S. Government Money Market Fund - Class G Shares 2.31%
(Cost $66,693) (a)(b) | | | 66,693 | | | | 66,693 | |
| | | | | | | | |
| |
Total Investments
(Cost $49,680,259) | | | | 50,050,100 | |
| |
| Other Assets and Liabilities, net - 0.6% | | | | 309,974 | |
| | | | | | | | |
| |
| NET ASSETS - 100.0% | | | | 50,360,074 | |
| | | | | | | | |
See Notes to Schedule of Investments and Notes to Financial Statements
| | |
| 6 | | State Street Real Estate Securities V.I.S. Fund |
State Street Real Estate Securities V.I.S. Fund
Notes to Schedule of Investments — December 31, 2018
The views expressed in this document reflect our judgment as of the publication date and are subject to change at any time without notice. The securities cited may not be representative of the Fund’s future investments and should not be construed as a recommendation to purchase or sell a particular security. See the Fund’s summary prospectus and statutory prospectus for complete descriptions of investment objectives, policies, risks and permissible investments.
| (a) | Coupon amount represents effective yield. |
| (b) | Sponsored by SSGA Funds Management, Inc., the Fund’s investment adviser and administrator, and an affiliate of State Street Bank & Trust Co., the Fund’ssub-administrator, custodian and accounting agent. |
| † | Percentages are based on net assets as of December 31, 2018. |
Abbreviations:
REIT - Real Estate Investment Trust
The following table presents the Fund’s investments measured at fair value on a recurring basis at December 31, 2018:
| | | | | | | | | | | | | | | | |
| Investments | | Level 1 | | | Level 2 | | | Level 3 | | | Total | |
| | | | | | | | | | | | | | | | |
Investments in Securities | |
Common Stock | | $ | 49,983,407 | | | $ | — | | | $ | — | | | $ | 49,983,407 | |
Short-Term Investments | | | 66,693 | | | | — | | | | — | | | | 66,693 | |
| | | | | | | | | | | | | | | | |
Total Investments in Securities | | $ | 50,050,100 | | | $ | — | | | $ | — | | | $ | 50,050,100 | |
| | | | | | | | | | | | | | | | |
Affiliate Table
| | | | | | | | | | | | | | | | | | | | | | | | | | | | | | | | | | | | |
| | | Number of Shares
Held at
12/31/17 | | | Value At
12/31/17 | | | Cost of
Purchases | | | Proceeds
from
Shares
Sold | | | Realized
Gain
(Loss) | | | Change in
Unrealized
Appreciation/ Depreciation | | | Number of Shares
Held at
12/31/18 | | | Value at
12/31/18 | | | Dividend
Income | |
| | | | | | | | | | | | | | | | | | | | | | | | | | | | | | | | | | | | |
State Street Institutional U.S. Government Money Market Fund-Class G Shares | | | 327,393 | | | $ | 327,393 | | | $ | 12,317,533 | | | $ | 12,578,233 | | | $ | — | | | $ | — | | | | 66,693 | | | $ | 66,693 | | | $ | 2,963 | |
See Notes to Schedule of Investments and Notes to Financial Statements
| | | | |
| State Street Real Estate Securities V.I.S. Fund | | | 7 | |
State Street Real Estate Securities V.I.S. Fund
Financial Highlights
Selected data based on a share outstanding throughout the fiscal years indicated
| | | | | | | | | | | | | | | | | | | | |
| | | 12/31/18 | | | 12/31/17 | | | 12/31/16 | | | 12/31/15* | | | 12/31/14* | |
| Inception date | | | | | | | | | | | | | | | | | | | 5/1/95 | |
| | | | | |
Net asset value, beginning of period | | $ | 12.32 | | | $ | 12.37 | | | $ | 13.30 | | | $ | 14.74 | | | $ | 12.68 | |
| | | | | | | | | | | | | | | | | | | | |
|
Income/(loss) from investment operations: | |
Net investment income | | | 0.25 | (a) | | | 0.15 | (a) | | | 0.31 | | | | 0.29 | | | | 0.28 | |
Net realized and unrealized gains/(losses) on investments | | | (0.95 | ) | | | 0.57 | | | | 0.71 | | | | 0.41 | | | | 3.79 | |
| | | | | | | | | | | | | | | | | | | | |
Total income/(loss) from investment operations | | | (0.70 | ) | | | 0.72 | | | | 1.02 | | | | 0.70 | | | | 4.07 | |
| | | | | | | | | | | | | | | | | | | | |
|
Less distributions from: | |
Net investment income | | | 0.28 | | | | 0.22 | | | | 0.35 | | | | 0.28 | | | | 0.29 | |
Net realized gains | | | 0.16 | | | | 0.55 | | | | 1.60 | | | | 1.86 | | | | 1.72 | |
Return of capital | | | 0.04 | | | | — | | | | — | | | | — | | | | — | |
| | | | | | | | | | | | | | | | | | | | |
Total distributions | | | 0.48 | | | | 0.77 | | | | 1.95 | | | | 2.14 | | | | 2.01 | |
| | | | | | | | | | | | | | | | | | | | |
Net asset value, end of period | | $ | 11.14 | | | $ | 12.32 | | | $ | 12.37 | | | $ | 13.30 | | | $ | 14.74 | |
| | | | | | | | | | | | | | | | | | | | |
Total Return(b) | | | (5.71 | )% | | | 5.84 | % | | | 8.00 | % | | | 4.56 | % | | | 31.90 | % |
|
Ratios/Supplemental Data: | |
Net assets, end of period (in thousands) | | $ | 50,360 | | | $ | 61,685 | | | $ | 72,483 | | | $ | 78,912 | | | $ | 91,007 | |
Ratios to average net assets: | |
Net expenses | | | 1.05 | % | | | 1.01 | % | | | 0.97 | % | | | 0.95 | % | | | 0.94 | %(c) |
Gross expenses | | | 1.05 | % | | | 1.01 | % | | | 0.97 | % | | | 0.95 | % | | | 0.94 | % |
Net investment income | | | 2.11 | % | | | 1.16 | % | | | 1.95 | % | | | 1.80 | % | | | 1.57 | % |
Portfolio turnover rate | | | 59 | % | | | 73 | % | | | 67 | % | | | 57 | % | | | 53 | % |
Notes to Financial Highlights
| (a) | | Per share values have been calculated using the average shares method. |
| (b) | | Total returns are historical and assume changes in share price, reinvestment of dividends and capital gains distributions and do not include the effect of insurance contract charges. Past performance does not guarantee future results. |
| (c) | | Includes contractual management fee waiver related to the Fund’s investments in the GE Institutional Money Market Fund (the “Money Market Fund”). The fee waiver agreement was terminated effective June 30, 2014 with the closure of the Money Market Fund. |
| * | | Beginning with the year ended December 31, 2016, the Fund was audited by Ernst & Young LLP. The previous years were audited by another independent registered public accounting firm. |
The accompanying Notes are an integral part of these financial statements.
State Street Real Estate Securities V.I.S. Fund
Statement of Assets and Liabilities — December 31, 2018
| | | | |
Assets | | | | |
Investments in securities, at fair value (cost $49,613,566) | | $ | 49,983,407 | |
Short-term affiliated investments, at fair value | | | 66,693 | |
Receivable for investments sold | | | 75,644 | |
Income receivables | | | 349,440 | |
Receivable for fund shares sold | | | 17,990 | |
Income receivable from affiliated investments | | | 197 | |
| | | | |
| |
Total assets | | | 50,493,371 | |
| | | | |
| |
Liabilities | | | | |
Payable for investments purchased | | | 50,272 | |
Payable for fund shares redeemed | | | 1,872 | |
Payable to the Adviser | | | 38,219 | |
Payable for custody, fund accounting andsub-administration fees | | | 1,584 | |
Accrued other expenses | | | 41,350 | |
| | | | |
| |
Total liabilities | | | 133,297 | |
| | | | |
| | | | |
| |
Net Assets | | $ | 50,360,074 | |
| | | | |
| |
Net Assets Consist of: | | | | |
Capital paid in | | $ | 50,977,723 | |
Total distributable earnings (loss) | | | (617,649 | ) |
| | | | |
| |
Net Assets | | $ | 50,360,074 | |
| | | | |
| | | | |
Shares outstanding ($0.01 par value; unlimited shares authorized) | | | 4,521,194 | |
Net asset value per share | | $ | 11.14 | |
The accompanying Notes are an integral part of these financial statements.
| | | | |
| Statement of Assets and Liabilities | | | 9 | |
State Street Real Estate Securities V.I.S. Fund
Statement of Operations — For the period ended December 31, 2018
| | | | |
Investment Income | |
Income | |
Dividend | | $ | 1,784,974 | |
Income from affiliated investments | | | 2,963 | |
| | | | |
Total income | | | 1,787,937 | |
| | | | |
|
Expenses | |
Advisory and administration fees | | | 481,418 | |
Directors’ fees | | | 6,005 | |
Custody, fund accounting andsub-administration fees | | | 18,674 | |
Professional fees | | | 40,372 | |
Printing and shareholder reports | | | 40,255 | |
Other expenses | | | 5,265 | |
| | | | |
Total Expenses | | | 591,989 | |
| | | | |
Net investment income | | $ | 1,195,948 | |
| | | | |
|
Net Realized and Unrealized Gain (Loss) on Investments | |
Realized gain (loss) on investments | | $ | (571,497 | ) |
Increase (decrease) in unrealized appreciation/depreciation on investments | | | (3,874,624 | ) |
| | | | |
| |
Net realized and unrealized gain (loss) on investments | | | (4,446,121 | ) |
| | | | |
| |
Net Decrease in Net Assets Resulting from Operations | | $ | (3,250,173 | ) |
| | | | |
The accompanying Notes are an integral part of these financial statements.
| | |
| 10 | | Statement of Operations |
State Street Real Estate Securities V.I.S. Fund
Statements of Changes in Net Assets
| | | | | | | | |
| | | | | | | | |
| | | Year Ended December 31,
2018 | | | Year Ended December 31,
2017 | |
| | | | | | | | |
Increase (Decrease) in Net Assets | |
|
Operations: | |
Net investment income | | $ | 1,195,948 | | | $ | 778,423 | |
Net realized gain (loss) on investments | | | (571,497 | ) | | | 2,190,292 | |
Net increase (decrease) in unrealized appreciation/depreciation on investments | | | (3,874,624 | ) | | | 873,041 | |
| | | | | | | | |
Net increase (decrease) from operations | | | (3,250,173 | ) | | | 3,841,756 | |
| | | | | | | | |
|
Distributions to shareholders: | |
Distributions to shareholders | | | (1,861,401 | ) | | | (3,611,632 | ) |
Return of capital | | | (188,993 | ) | | | — | |
| | | | | | | | |
Total distributions | | | (2,050,394 | ) | | | (3,611,632 | ) |
| | | | | | | | |
Increase (decrease) in assets from operations and distributions | | | (5,300,567 | ) | | | 230,124 | |
| | | | | | | | |
|
Share transactions: | |
Proceeds from sale of shares | | | 5,027,170 | | | | 1,252,390 | |
Value of distributions reinvested | | | 2,050,394 | | | | 3,611,632 | |
Cost of shares redeemed | | | (13,101,821 | ) | | | (15,891,981 | ) |
| | | | | | | | |
Net increase (decrease) from share transactions | | | (6,024,257 | ) | | | (11,027,959 | ) |
| | | | | | | | |
| | |
Total increase (decrease) in net assets | | | (11,324,824 | ) | | | (10,797,835 | ) |
|
Net Assets | |
Beginning of year | | | 61,684,898 | | | | 72,482,733 | |
| | | | | | | | |
| | |
End of year | | $ | 50,360,074 | | | $ | 61,684,898 | |
| | | | | | | | |
|
Changes in Fund Shares | |
Shares sold | | | 419,885 | | | | 100,497 | |
Issued for distributions reinvested | | | 185,388 | | | | 295,551 | |
Shares redeemed | | | (1,090,576 | ) | | | (1,250,950 | ) |
| | | | | | | | |
Net decrease in fund shares | | | (485,303 | ) | | | (854,902 | ) |
| | | | | | | | |
For the year ended December 31, 2017, the source of distributions paid to shareholders was (See Note 10 in the Notes to Financial Statements):
| | | | |
| | | | |
| | | | |
Net investment income | | $ | (1,040,860 | ) |
| | | | |
Net realized gains | | | (2,570,772 | ) |
| | | | |
Total distributions | | | (3,611,632 | ) |
| | | | |
| |
Undistributed net investment income as of December 31, 2017: | | $ | — | |
The accompanying Notes are an integral part of these financial statements.
| | | | |
| Statements of Changes in Net Assets | | | 11 | |
State Street Real Estate Securities V.I.S. Fund
Notes to Financial Statements — December 31, 2018
| 1. | | Organization of the Company |
State Street Variable Insurance Series Funds, Inc. (the “Company”) was incorporated under the laws of the Commonwealth of Virginia on May 14, 1984 and is registered under the Investment Company Act of 1940, as amended (the “1940 Act”), as anopen-end management investment company. The Company is currently composed of the following seven investment portfolios (collectively, the “Funds”): State Street U.S. Equity V.I.S. Fund, State Street S&P 500 Index V.I.S. Fund, State Street Premier Growth Equity V.I.S. Fund, State StreetSmall-Cap Equity V.I.S. Fund, State Street Total Return V.I.S. Fund, State Street Income V.I.S. Fund and State Street Real Estate Securities V.I.S. Fund (the “Fund”). Each Fund is a diversified investment company within the meaning of the 1940 Act. Shares of the Funds of the Company are offered only to insurance company separate accounts that fund certain variable life insurance contracts and variable annuity contracts.
The Company currently offers one share class (Class 1) of the Fund as an investment option for variable life insurance and variable annuity contracts.
Under the Company’s organizational documents, its officers and directors are indemnified against certain liabilities arising out of the performance of their duties to the Company. Additionally, in the normal course of business, the Company enters into contracts with service providers that contain general indemnification clauses. The Company’s maximum exposure under these arrangements is unknown as this would involve future claims that may be made against the Company that have not yet occurred.
| 2. | | Summary of Significant Accounting Policies |
The following is a summary of significant accounting policies followed by the Company in the preparation of its financial statements:
The preparation of financial statements in accordance with U.S. generally accepted accounting principles (“U.S. GAAP”) requires management to make estimates and assumptions that affect the reported amounts and disclosures in the financial statements. Actual results could differ from those estimates. The Fund is an investment company under U.S. GAAP and follows the accounting and reporting guidance applicable to investment companies.
Security Valuation The Fund’s investments are valued at fair value each day that the New York Stock Exchange (“NYSE”) is open and, for financial reporting purposes, as of the report date should the reporting period end on a day that the NYSE is not open. Fair value is generally defined as the price a fund would receive to sell an asset or pay to transfer a liability in an orderly transaction between market participants at the measurement date. By its nature, a fair value price is a good faith estimate of the valuation in a current sale and may not reflect an actual market price. The investments of the Fund are valued pursuant to the policy and procedures developed by the Oversight Committee (the “Committee”) and approved by the Company’s Board of Directors (the “Board”). The Committee provides oversight of the valuation of investments for the Fund. The Board has responsibility for overseeing the determination of the fair value of investments.
Valuation techniques used to value the Fund’s investments by major category are as follows:
| | • | | Equity investments traded on a recognized securities exchange for which market quotations are readily available are valued at the last sale price or official closing price, as applicable, on the primary market or exchange on which they trade. Equity investments traded on a recognized exchange for which there were no sales on that day are valued at the last published sale price or at fair value. |
| | • | | Investments in registered investment companies (including money market funds) or other unitized pooled investment vehicles that are not traded on an exchange are valued at that day’s published net asset value (“NAV”) per share or unit. |
In the event prices or quotations are not readily available or that the application of these valuation methods results in a price for an investment that is deemed to be not representative of the fair value of such investment, fair value will be determined in good faith by the Committee, in accordance with the valuation policy and procedures approved by the Board.
The Fund values its assets and liabilities at fair value using a fair value hierarchy consisting of three broad levels that prioritize the inputs to valuation techniques giving the highest priority to readily available unadjusted quoted prices in active markets for identical assets or liabilities (Level 1 measurements) and the lowest priority to unobservable inputs (Level 3
| | |
| 12 | | Notes to Financial Statements |
State Street Real Estate Securities V.I.S. Fund
Notes to Financial Statements, continued — December 31, 2018
measurements) when market prices are not readily available or reliable. The categorization of a value determined for an investment within the hierarchy is based upon the pricing transparency of the investment and is not necessarily an indication of the risk associated with investing in it.
The three levels of the fair value hierarchy are as follows:
| | • | | Level 1 — Unadjusted quoted prices in active markets for an identical asset or liability; |
| | • | | Level 2 — Inputs other than quoted prices included within Level 1 that are observable for the asset or liability either directly or indirectly, including quoted prices for similar assets or liabilities in active markets, quoted prices for identical or similar assets or liabilities in markets that are not considered to be active, inputs other than quoted prices that are observable for the asset or liability (such as exchange rates, financing terms, interest rates, yield curves, volatilities, prepayment speeds, loss severities, credit risks and default rates) or other market-corroborated inputs; and |
| | • | | Level 3 — Unobservable inputs for the asset or liability, including the Committee’s assumptions used in determining the fair value of investments. |
The value of the Fund’s investments according to the fair value hierarchy as of December 31, 2018 is disclosed in the Fund’s Schedule of Investments.
Investment Transactions and Income Recognition Investment transactions are accounted for on trade date for financial reporting purposes. Realized gains and losses from the sale or disposition of investments and foreign exchange transactions, if any, are determined using the identified cost method.
Dividend income and capital gain distributions, if any, are recognized on theex-dividend date, net of any foreign taxes withheld at source, if any.
Interest income is recorded daily on an accrual basis. All premiums and discounts are amortized/accreted for financial reporting purposes.
Non-cash dividends received in the form of stock are recorded as dividend income at fair value.
Expenses Certain expenses, which are directly identifiable to a specific Fund, are applied to the Fund within the Company. Other expenses which cannot be attributed to a specific Fund are allocated in such a manner as deemed equitable, taking into consideration the nature and type of expense and the relative net assets of the Fund within the Company.
Foreign Currency Translation The accounting records of the Fund are maintained in U.S. dollars. Foreign currencies as well as investment securities and other assets and liabilities denominated in a foreign currency are translated to U.S. dollars using exchange rates at period end. Purchases and sales of securities, income receipts and expense payments denominated in foreign currencies are translated into U.S. dollars at the prevailing exchange rate on the respective dates of the transactions.
The effects of exchange rate fluctuations on investments are included with the net realized and unrealized gain (loss) on investment securities. Other foreign currency transactions resulting in realized and unrealized gain (loss) are disclosed separately.
Foreign Taxes The Fund may be subject to foreign taxes (a portion of which may be reclaimable) on income, stock dividends, realized and unrealized capital gains on investments or certain foreign currency transactions. Foreign taxes are recorded in accordance with SSGA Funds Management, Inc.’s (the “Adviser” or “SSGA FM”) understanding of the applicable foreign tax regulations and rates that exist in the foreign jurisdictions in which the Fund invests. These foreign taxes, if any, are paid by the Fund and are reflected in the Statement of Operations, if applicable. Foreign taxes payable or deferred as of December 31, 2018, if any, are disclosed in the Fund’s Statement of Assets and Liabilities.
Distributions The Fund declares and pays any dividends from net investment income annually.
Net realized capital gains, if any, are distributed annually, unless additional distributions are required for compliance with applicable tax regulations. The amount and character of income and capital gains to be distributed are determined in accordance with applicable tax regulations which may differ from net investment income and realized gains recognized for U.S. GAAP purposes.
| | | | |
| Notes to Financial Statements | | | 13 | |
State Street Real Estate Securities V.I.S. Fund
Notes to Financial Statements, continued — December 31, 2018
| 3. | | Fees and Transactions with Affiliates |
Advisory Fee SSGA FM, a registered investment adviser, was retained by the Board to act as investment adviser and administrator of the Fund. SSGA FM’s compensation for investment advisory and administrative services (“Management Fee”) is paid monthly based on the average daily net assets of the Fund. The Management Fee is stated in the following schedule:
| | | | | | | | |
Average Daily Net Assets of the Fund | | Management Fees |
| | First $ | 100 million | | | | | 0.85 | % |
| | Next $ | 100 million | | | | | 0.80 | % |
| | Over $ | 200 million | | | | | 0.75 | % |
Custody, Fund Accounting andSub-Administration Fees State Street Bank and Trust Company (“State Street”) serves as the custodian, fund accountant andsub-administrator to the Fund. Amounts paid by the Fund to State Street for performing such services are included custody, fund accounting andsub-administration fees on the Statement of Operations.
Other Transactions with Affiliates The Fund may invest in affiliated entities, including securities issued by State Street, affiliated funds, or entities deemed to be affiliates as a result of the Fund owning more than five percent of the entity’s voting securities or outstanding shares. Amounts relating to these transactions during the fiscal year ended December 31, 2018 are disclosed in the Schedule of Investments.
Pursuant to an investmentsub-advisory agreement with SSGA FM, CenterSquare Investment Management LLC (“CenterSquare”) is thesub-adviser to the Fund. CenterSquare is responsible for theday-to-day portfolio management of the assets of the Fund, including the responsibility for making decisions to buy, sell or hold a particular security, under the general supervision of SSGA FM and the Board. For its services, SSGA FM pays CenterSquare monthlysub-advisory fees which are calculated as a percentage of the average daily net assets of the Fund.
The fees and expenses of the Company’s directors who are not “interested persons” of the Company, as defined in the 1940 Act (“Independent Directors”) are paid directly by the Fund. The Independent Directors are reimbursed for travel and otherout-of-pocket expenses in connection with meeting attendance and industry seminars.
| 6. | | Investment Transactions |
Purchases and sales of investments (excludingin-kind transactions, short term investments and derivative contracts) for the fiscal year ended December 31, 2018 were as follows:
| | | | | | | | |
| Non-U.S. Government Securities |
| Purchases | | Sales |
| | | | | | | | | |
| | $ | 33,533,737 | | | | $ | 39,104,278 | |
The Fund has qualified and intends to continue to qualify as a regulated investment company under Subchapter M of the Internal Revenue Code of 1986, as amended. The Fund will not be subject to federal income taxes to the extent it distributes its taxable income, including any net realized capital gains, for each fiscal year. Therefore, no provision for federal income tax is required.
The Fund files federal and various state and local tax returns as required. No income tax returns are currently under examination. Generally, the federal returns are subject to examination by the Internal Revenue Service for a period of three years from date of filing, while the state returns may remain open for an additional year depending upon jurisdiction. SSGA FM has analyzed the Fund’s tax positions taken on tax returns for all open years and does not believe there are any uncertain tax positions that would require recognition of a tax liability.
| | |
| 14 | | Notes to Financial Statements |
State Street Real Estate Securities V.I.S. Fund
Notes to Financial Statements, continued — December 31, 2018
Distributions to shareholders are recorded onex-dividend date. Income dividends and gain distributions are determined in accordance with income tax rules and regulations, which may differ from generally accepted accounting principles. Certain capital accounts in the financial statements have been adjusted for permanentbook-tax differences. These adjustments have no impact on net asset values or results of operations. Temporarybook-tax differences will reverse in the future. These book tax differences are primarily due to differing treatments for character of distributions, return of capital distributions received, REIT basis adjustments, and wash sale loss deferrals.
The tax character of distributions paid during the year ended December 31, 2018 was as follows:
| | | | | | | | | | | | | | | | | | |
Ordinary
Income | | Long-Term
Capital Gains | | Return of
Capital | | Total |
| | | | | | | | | | | | | | | | | | | |
| | $ | 1,250,834 | | | | $ | 610,567 | | | | $ | 188,993 | | | | $ | 2,050,394 | |
The tax character of distributions paid during the year ended December 31, 2017 was as follows:
| | | | | | | | | | | | | | | | | | |
Ordinary
Income | | Long-Term
Capital Gains | | Return of
Capital | | Total |
| | | | | | | | | | | | | | | | | | | |
| | $ | 1,040,860 | | | | $ | 2,570,772 | | | | $ | — | | | | $ | 3,611,632 | |
At December 31, 2018 the components of distributable earnings on a tax basis were as follows:
| | | | | | | | | | | | | | | | | | | | | | | | | | | | |
Undistributed
Ordinary Income | | Capital Loss
Carryforwards | | Undistributed
long term gain | | Net Unrealized
Gains (Losses) | | Qualified
Late-Year
Losses | | Total |
| | | | | | | | | | | | | | | | | | | | | | | | | | | | | |
| | $ | — | | | | $ | (537,396) | | | | $ | — | | | | $ | (80,249 | ) | | | $ | — | | | | $ | (617,645 | ) |
As of December 31, 2018, the Fund had capital loss carryforwards available to offset future realized capital gains through the indicated expiration dates as follows:
| | | | | | | | |
Non-Expiring Short-Term | | Non-Expiring Long-Term |
| | | | | | | | | |
| | $ | 181,392 | | | | $ | 356,004 | |
As of December 31, 2018, gross unrealized appreciation and gross unrealized depreciation of investments and other financial instruments based on cost for federal income tax purposes were as follows:
| | | | | | | | | | | | | | | | | | |
Tax
Cost | | Gross
Unrealized
Appreciation | | Gross
Unrealized
Depreciation | | Net Unrealized
Appreciation
(Depreciation) |
| | | | | | | | | | | | | | | | | | | |
| | $ | 50,130,349 | | | | $ | 2,382,757 | | | | $ | 2,463,006 | | | | $ | (80,249 | ) |
The Fund and other affiliated funds (each, a “Participant” and collectively, the “Participants”) participate in a $500 million revolving credit facility provided by a syndication of banks under which the Participants may borrow to fund shareholder redemptions. This agreement expires in October 2019 unless otherwise extended or renewed.
The Participants are charged an annual commitment fee which is calculated based on the unused portion of the shared credit line. Commitment fees are allocated among each of the Participants based on relative net assets. Commitment fees are ordinary fund operating expenses paid by the Adviser. A Participant incurs and pays the interest expense related to its borrowing. Interest is calculated at a rate per annum equal to the sum of 1% plus the greater of the New York Fed Bank Rate and1-month LIBOR rate.
The Fund had no outstanding loans as of December 31, 2018.
Concentration Risk As a result of the Fund’s ability to invest a large percentage of its assets in obligations of issuers within the same country, state, region, currency or economic sector, an adverse economic, business or political development may affect the value of the Fund’s investments more than if the Fund were more broadly diversified.
| | | | |
| Notes to Financial Statements | | | 15 | |
State Street Real Estate Securities V.I.S. Fund
Notes to Financial Statements, continued — December 31, 2018
Market and Credit Risk In the normal course of business, the Fund trades financial instruments and enters into financial transactions where risk of potential loss exists due to changes in the general economic conditions and fluctuations of the market (market risk). Additionally, the Fund may also be exposed to credit risk in the event that an issuer or guarantor fails to perform or that an institution or entity with which the Fund has unsettled or open transactions defaults.
| 10. | | New and Recent Accounting Pronouncements |
In August 2018, the Securities and Exchange Commission released its Final Rule on Disclosure Update and Simplification (the “Final Rule”) which is intended to simplify an issuer’s disclosure compliance efforts by removing redundant or outdated disclosure requirements without significantly altering the mix of information provided to investors. The Fund has adopted the Final Rule for the current period with the most notable impacts being that the Fund is no longer required to present components of distributable earnings on the Statement of Assets and Liabilities or the sources of distributions to shareholders and the amount of undistributed net investment income on the Statements of Changes in Net Assets.
Management has evaluated the impact of all subsequent events on the Fund through the date on which the financial statements were available to be issued and has determined that there were no subsequent events requiring adjustment or disclosure in the financial statements.
| | |
| 16 | | Notes to Financial Statements |
State Street Real Estate Securities V.I.S. Fund
Report of Independent Registered Public Accounting Firm
To the Shareholders and the Board of Directors of State Street Real Estate Securities V.I.S. Fund
Opinion on the Financial Statements
We have audited the accompanying statement of assets and liabilities of State Street Real Estate Securities V.I.S. Fund (the “Fund”) (one of the funds constituting State Street Variable Insurance Series Funds, Inc. (the “Company”)), including the schedule of investments, as of December 31, 2018, and the related statement of operations for the year then ended, the statement of changes in net assets for each of the two years in the period then ended, the financial highlights for each of the three years in the period then ended and the related notes (collectively referred to as the “financial statements”). In our opinion, the financial statements present fairly, in all material respects, the financial position of the Fund (one of the funds constituting State Street Variable Insurance Series Funds, Inc.) at December 31, 2018, the results of its operations for the year then ended, the changes in its net assets for each of the two years in the period then ended and its financial highlights for each of the three years in the period then ended, in conformity with U.S. generally accepted accounting principles. The financial highlights for periods ended prior to January 1, 2016 were audited by another independent registered public accounting firm whose report, dated February 19, 2016, expressed an unqualified opinion on those financial highlights.
Basis for Opinion
These financial statements are the responsibility of the Company’s management. Our responsibility is to express an opinion on the Fund’s financial statements based on our audits. We are a public accounting firm registered with the Public Company Accounting Oversight Board (United States) (“PCAOB”) and are required to be independent with respect to the Company in accordance with the U.S. federal securities laws and the applicable rules and regulations of the Securities and Exchange Commission and the PCAOB.
We conducted our audits in accordance with the standards of the PCAOB. Those standards require that we plan and perform the audit to obtain reasonable assurance about whether the financial statements are free of material misstatement, whether due to error or fraud. The Company is not required to have, nor were we engaged to perform, an audit of the Company’s internal control over financial reporting. As part of our audits we are required to obtain an understanding of internal control over financial reporting, but not for the purpose of expressing an opinion on the effectiveness of the Company’s internal control over financials reporting. Accordingly, we express no such opinion.
Our audits included performing procedures to assess the risks of material misstatement of the financial statements, whether due to error or fraud, and performing procedures that respond to those risks. Such procedures included examining, on a test basis, evidence regarding the amounts and disclosures in the financial statements. Our procedures included confirmation of securities owned as of December 31, 2018, by correspondence with the custodian, brokers and others or by other appropriate auditing procedures where replies from brokers and others were not received. Our audits also included evaluating the accounting principles used and significant estimates made by management, as well as evaluating the overall presentation of the financial statements. We believe that our audits provide a reasonable basis for our opinion.

We have served as the auditor of one or more State Street Global Advisors investment companies since 2000.
Boston, Massachusetts
February 19, 2019
| | | | |
| Report of Independent Registered Public Accounting Firm | | | 17 | |
State Street Real Estate Securities V.I.S. Fund
Tax Information — December 31, 2018 (Unaudited)
For federal income tax purposes, the following information is furnished with respect to the distributions of the Fund for its fiscal year ended December 31, 2018.
Dividends Received Deduction
The Fund reports the maximum amount allowable of its net taxable income as eligible for the corporate dividends received deduction.
Long Term Capital Gain Distributions
Long term capital gains dividends were paid from the Fund during the year ended December 31, 2018 in the amount of $610,567.
State Street Real Estate Securities V.I.S. Fund
Special Meeting of Shareholders — Voting Results (Unaudited)
A special meeting of shareholders of State Street Variable Insurance Series Funds, Inc. (the “Company”) was held on January 10, 2019 to elect the following six nominees as Directors of the Company: Michael F. Holland, Michael A. Jessee, Ellen M. Needham, Patrick J. Riley, Richard D. Shirk and Rina K. Spence. At the meeting the following votes were recorded:
| | | | | | | | |
| Nominee | | Shares For | | | Shares Withheld | |
Michael F. Holland | | | 91,260,156.834 | | | | 2,655,810.669 | |
Michael A. Jessee | | | 91,345,936.433 | | | | 2,570,031.070 | |
Ellen M. Needham | | | 91,642,423.619 | | | | 2,273,543.884 | |
Patrick J. Riley | | | 91,136,965.946 | | | | 2,779,001.557 | |
Richard D. Shirk | | | 91,293,712.247 | | | | 2,622,255.256 | |
Rina K. Spence | | | 90,957,562.624 | | | | 2,958,404.879 | |
The other Directors whose term of office continued after the meeting are as follows: Jeanne M. La Porta, John R. Costantino and Donna M. Rapaccioli.
| | | | |
| Special Meeting of Shareholders — Voting Results | | | 19 | |
State Street Real Estate Securities V.I.S. Fund
Other Information — December 31, 2018 (Unaudited)
| | | | | | | | | | | | |
| | | | | | |
Name,
Address, and Year of Birth | | Position(s) Held
with Fund | | Term of
Office and
Length of
Time Served | | Principal Occupation
During Past Five Years and
Relevant Experience | | Number of
Funds in
Fund
Complex
Overseen
by Director† | | | Other Directorships
Held By Director
During Past Five Years |
INDEPENDENT DIRECTORS | | | | | | |
Michael F. Holland c/o SSGA Funds Management, Inc. One Iron Street Boston, MA 02210 YOB: 1944 | | Director and Co-Chairperson of the Board | | Term: Indefinite Elected: 1/19 | | Chairman, Holland & Company L.L.C. (investment adviser)
(1995 – present). | | | 67 | | | Director, the Holland Series Fund, Inc.; Director, The China Fund, Inc.; Director, The Taiwan Fund, Inc. (2007-2017); Director, Reaves Utility Income Fund, Inc.; and Director, Blackstone/GSO Loans (and Real Estate) Funds. |
| | | | | | | | | | | | | |
Patrick J. Riley c/o SSGA Funds Management, Inc. One Iron Street Boston, MA 02210 YOB: 1948 | | Director and Co-Chairperson of the Board | | Term: Indefinite Elected: 1/19 | | 2002 to May 2010, Associate Justice of the Superior Court, Commonwealth of Massachusetts; 1985 to 2002, Partner, Riley, Burke & Donahue, L.L.P. (law firm); 1998 to Present, Independent Director, State Street Global Advisers Ireland, Ltd. (investment company); 1998 to Present, Independent Director, SSGA Liquidity plc (formerly, SSGA Cash Management Fund plc); January 2009 to Present, Independent Director, SSGA Fixed Income plc; and January 2009 to Present, Independent Director, SSGA Qualified Funds PLC. | | | 67 | | | Board Director and Chairman, SPDR Europe 1PLC Board (2011-Present); Board Director and Chairman, SPDR Europe II, PLC (2013- Present). |
| | | | | | | | | | | | | |
John R. Costantino c/o SSGA Funds Management, Inc. One Iron Street Boston, MA 02210 YOB: 1946 | | Director and Co-Chairperson of the Qualified Legal and Compliance Committee | | Term: Indefinite Elected: 1997 | | Managing General Partner, NGN Capital LLC (2006 – present); and Managing Director, Vice President of Walden Capital Management (1996 – present). | | | 67 | | | Director of Kleinfeld Bridal Corp. (March 2016 – present); Trustee of Neuroscience Research Institute (1986 – present); Trustee of Fordham University (1989 – 1995 and 2001 – 2007) and Trustee Emeritus (2007 – present); Trustee of GE Funds (1993 – February 2011); Director of Artes Medical (2006 – 2008); and Trustee of Gregorian University Foundation (1992 – 2007). |
| | | | | | | | | | | | | |
Donna M. Rapaccioli c/o SSGA Funds Management, Inc. One Iron Street Boston, MA 02210 YOB: 1962 | | Director and Co-Chairperson of the Audit Committee | | Term: Indefinite Elected: 1/12 | | Dean of the Gabelli School of Business (2007 – present) and Accounting Professor
(1987 – present) at Fordham University. | | | 67 | | | Director- Graduate Management Admissions Council (2015 – present); Trustee of Emmanuel College (2010 – present). |
State Street Real Estate Securities V.I.S. Fund
Other Information, continued — December 31, 2018 (Unaudited)
| | | | | | | | | | | | |
| | | | | | |
Name,
Address, and Year of Birth | | Position(s) Held
with Fund | | Term of
Office and
Length of
Time Served | | Principal Occupation
During Past Five Years and
Relevant Experience | | Number of
Funds in
Fund
Complex
Overseen
by Director† | | | Other Directorships
Held By Director
During Past Five Years |
Richard D. Shirk c/o SSGA Funds Management, Inc. One Iron Street Boston, MA 02210 YOB: 1945 | | Director and Co- Chairperson of the Qualified Legal and Compliance Committee | | Term: Indefinite Elected: 1/19 | | March 2001 to April 2002, Chairman (1996 to March 2001, President and Chief Executive Officer), Cerulean Companies, Inc. (holding company) (Retired); 1992 to March 2001, President and Chief Executive Officer, Blue Cross Blue Shield of Georgia (health insurer, managed healthcare). | | | 67 | | | 1998 to December 2008, Chairman, Board Member and December 2008 to Present, Investment Committee Member, Healthcare Georgia Foundation (private foundation); September 2002 to 2012, Lead Director and Board Member, Amerigroup Corp. (managed health care); 1999 to 2013, Board Member and (since 2001) Investment Committee Member, Woodruff Arts Center; and 2003 to 2009, Trustee, Gettysburg College; Board member, Aerocare Holdings, Regenesis Biomedical Inc. |
| | | | | | | | | | | | | |
Rina K. Spence c/o SSGA Funds Management, Inc. One Iron Street Boston, MA 02210 YOB: 1948 | | Director andCo-Chairperson of the Audit Committee, Chairperson of the Nominating Committee and Chairperson of the Governance Committee | | Term: Indefinite Elected: 1/19 | | President of SpenceCare International LLC (international healthcare consulting)
(1999 – present); Chief Executive Officer, IEmily.com (health internet company) (2000 – 2001); Chief Executive Officer of Consensus Pharmaceutical, Inc.
(1998 – 1999); Founder, President and Chief Executive Officer of Spence Center for Women’s Health (1994 –1998); President and CEO, Emerson Hospital (1984 – 1994); Honorary Consul for Monaco in Boston (2015 – present). | | | 67 | | | None |
| | | | | | | | | | | | | |
Michael A. Jessee c/o SSGA Funds Management, Inc. One Iron Street Boston, MA 02210 YOB: 1946 | | Director andCo-Chairperson of the Valuation Committee | | Term: Indefinite Elected: 1/19 | | Retired; formerly, President and Chief Executive Officer of the Federal Home Loan Bank of Boston (1989 – 2009); Trustee, Randolph-Macon College
(2004 – 2016). | | | 67 | | | None |
State Street Real Estate Securities V.I.S. Fund
Other Information, continued — December 31, 2018 (Unaudited)
| | | | | | | | | | | | |
| | | | | | |
Name,
Address, and Year of Birth | | Position(s) Held
with Fund | | Term of
Office and
Length of
Time Served | | Principal Occupation
During Past Five Years and
Relevant Experience | | Number of
Funds in
Fund
Complex
Overseen
by Director† | | | Other Directorships
Held By Director
During Past Five Years |
INTERESTED DIRECTORS(1) | | | | | | | | |
Jeanne M. La Porta(2) SSGA Funds Management, Inc. 1600 Summer St. Stamford, CT 06905 YOB: 1965 | | Director and President | | Time Indefinite Elected: 3/14 | | Senior Managing Director at State Street Global Advisors (July 2016 – present); Director of State Street Global Advisors Funds Distributors, LLC (May 2017 – present); President of GE Retirement Savings Plan Funds (July 2016 – present); Senior Vice President and Commercial Operations Leader at GE Asset Management Incorporated (“GEAM”) (March 2014 – July 2016); President of State Street Institutional Funds and State Street Variable Insurance Series Funds, Inc. (April 2014 – present); President and Trustee. | | | 18 | | | None |
| | | | | | | | | | | | | |
Ellen M. Needham(3) SSGA Funds Management, Inc. One Iron Street Boston, MA 02210 YOB: 1967 | | Director | | Time Indefinite Elected: 1/19 | | President and Director, SSGA FM (2001 – present)*; Senior Managing Director, State Street Global Advisors (1992 – present)*; Director, State Street Global Advisors Funds Distributors, LLC (May 2017 – present).* | | | 67 | | | None |
| (1) | The individuals listed below are Directors who are “interested persons,” as defined in the 1940 Act, of the Company (“Interested Directors”). |
| (2) | Ms. La Porta is an Interested Director because of her employment by SSGA Funds Management, Inc., an affiliate of the Company. |
| (3) | Ms. Needham is an Interested Director because of her employment by SSGA Funds Management, Inc., an affiliate of the Company. |
| * | Served in various capacities and/or with various affiliated entities during noted time period |
| † | For the purpose of determining the number of portfolios overseen by the Directors, “Fund Complex” comprises registered investment companies for which SSGA FM serves as investment adviser. |
State Street Real Estate Securities V.I.S. Fund
Other Information, continued — December 31, 2018 (Unaudited)
The following lists the principal officers for the Company, as well as their mailing addresses and ages, positions with the Company and length of time served, and present and principal occupations:
| | | | | | |
| | | | |
| Name, Address, and Year of Birth | | Position(s) Held
with Fund | | Term of
Office and
Length of
Time Served | | Principal Occupation During Past Five Years |
OFFICERS: | | | | | | |
Jeanne M. La Porta SSGA Funds Management, Inc. 1600 Summer St. Stamford, CT 06905 YOB: 1965 | | President and Director | | Term: Indefinite Elected: 3/14 | | Senior Managing Director at State Street Global Advisors (July 2016 – present); Director of State Street Global Advisors Funds Distributors, LLC (May 2017 – present); President of GE Retirement Savings Plan Funds (July 2016 – present); Senior Vice President and Commercial Operations Leader at GE Asset Management Incorporated (“GEAM”) (March 2014 –July 2016); President of State Street Institutional Funds and State Street Variable Insurance Series Funds, Inc. (April 2014 – present); President and Trustee. |
| | | | | | | |
Arthur A. Jensen SSGA Funds Management, Inc. 1600 Summer Street Stamford, CT 06905 YOB: 1966 | | Treasurer | | Term: Indefinite Elected: 6/11 | | Vice President, State Street Global Advisors and SSGA Funds Management, Inc. (July 2016 – present); Deputy Treasurer of Elfun Funds (July 2016 – present); Treasurer of State Street Institutional Funds, State Street Variable Insurance Series Funds, Inc. and GE Retirement Savings Plan Funds (June 2011 – present); Treasurer of Elfun Funds (June 2011– July 2016); Mutual Funds Controller of GE Asset Management Incorporated (April 2011 – July 2016). |
| | | | | | | |
Brian Harris SSGA Funds Management, Inc. One Iron Street Boston, MA 02210 YOB: 1973 | | Chief Compliance Officer and Anti-Money Laundering Officer | | Term: Indefinite Elected: 6/16 | | Managing Director, State Street Global Advisors and SSGA Funds Management, Inc. (2013 – Present); Senior Vice President and Global Head of Investment Compliance, BofA Global Capital Management (September 2010 – May 2013). |
| | | | | | | |
Bruce S. Rosenberg SSGA Funds Management, Inc. One Iron Street Boston, MA 02210 YOB: 1961 | | Assistant Treasurer | | Term: Indefinite Elected: 6/16 | | Managing Director, State Street Global Advisors and SSGA Funds Management, Inc. (July 2015 – present); Director, Credit Suisse (April 2008 – July 2015). |
| | | | | | | |
Ann M. Carpenter SSGA Funds Management, Inc. One Iron Street Boston, MA 02210 YOB: 1966 | | Assistant Treasurer | | Term: Indefinite Elected: 6/16 | | Chief Operating Officer, SSGA Funds Management, Inc. (April 2005 – present) *; Managing Director, State Street Global Advisors. (2005 –present).* |
| | | | | | | |
Chad C. Hallett SSGA Funds Management, Inc. One Iron Street Boston, MA 02210 YOB: 1969 | | Assistant Treasurer | | Term: Indefinite Elected: 6/16 | | Vice President, State Street Global Advisors and SSGA Funds Management, Inc. (November 2014 – present); Vice President, State Street Bank and Trust Company (2001 –November 2014).* |
State Street Real Estate Securities V.I.S. Fund
Other Information, continued — December 31, 2018 (Unaudited)
| | | | | | |
| | | | |
| Name, Address, and Year of Birth | | Position(s) Held
with Fund | | Term of
Office and
Length of
Time Served | | Principal Occupation During Past Five Years |
Darlene Anderson-Vasquez SSGA Funds Management, Inc. One Iron Street Boston, MA 02210 YOB: 1968 | | Assistant Treasurer | | Term: Indefinite Elected: 3/17 | | Managing Director, State Street Global Advisors and SSGA Funds Management, Inc. (May 2016 – present); Senior Vice President, John Hancock Investments (September 2007 – May 2016). |
| | | | | | | |
Daniel G. Plourde SSGA Funds Management, Inc. One Iron Street Boston, MA 02210 YOB: 1980 | | Assistant Treasurer | | Term: Indefinite Elected: 6/17 | | Vice President, State Street Global Advisors and SSGA Funds Management, Inc. (May 2015 – present); Officer, State Street Bank and Trust Company (March 2009 – May 2015). |
| | | | | | | |
Jesse D. Hallee State Street Bank and Trust Company 100 Summer Street, 7th Floor Boston, MA 02111-2900 YOB: 1976 | | Secretary | | Term: Indefinite Elected: 3/17 | | Vice President and Managing Counsel, State Street Bank and Trust Company (2013 – present); Vice President and Counsel, Brown Brothers Harriman & Co. (2007-2013). |
| * | Served in various capacities and/or with various affiliated entities during noted time period. |
State Street Real Estate Securities V.I.S. Fund
Other Information, continued — December 31, 2018 (Unaudited)
Proxy Voting Policies and Procedures and Record
The Fund has adopted the proxy voting policies of SSGA FM. A description of the policies and procedures that the Fund has adopted to determine how to vote proxies relating to portfolio securities is available (i) without charge, upon request, by calling1-800-242-0134, (ii) on the Fund’s website at http://www.ssga.com/geam, or (iii) on the SEC’s website at www.sec.gov. Information regarding how the Fund voted proxies, if any, during the most recent 12-month period ended June 30 is available by August 31 of each year without charge (1) by calling 1-800-242-0134 (toll free), and (2) on the website of the SEC at www.sec.gov.
Quarterly Portfolio Schedule
The Fund files its complete schedule of investments with the SEC for the first and third quarters of each fiscal year on Form N-Q. The Fund’s Forms N-Q are available (i) without charge, upon request, by calling1-800-242-013, (ii) on the Fund’s website at http://www.ssga.com/geam, or (iii) on the SEC’s website at www.sec.gov.
Directors
Michael F. Holland, Co-Chairperson
Patrick J. Riley, Co-Chairperson
John R. Costantino
Donna M. Rapaccioli
Michael A. Jessee
Richard D. Shirk
Rina K. Spence
Jeanne M. La Porta
Ellen M. Needham
Officers
Jeanne M. La Porta, President
Arthur Jensen, Treasurer
Brian Harris, Chief Compliance Officer and Anti-Money Laundering Officer
Bruce S. Rosenberg, Assistant Treasurer
Ann M. Carpenter, Assistant Treasurer
Chad C. Hallett, Assistant Treasurer
Darlene Anderson-Vasquez, Assistant Treasurer
Daniel G. Plourde, Assistant Treasurer
Jesse Hallee, Secretary
Investment Adviser and Administrator
SSGA Funds Management, Inc.
One Iron Street
Boston, MA 02210
Custodian and Sub-Administrator
State Street Bank and Trust Company
One Lincoln Street
Boston, Massachusetts 02111
Distributor
State Street Global Advisors Funds Distributors, LLC
One Iron Street
Boston, MA 02210
Independent Registered Public Accounting Firm
Ernst & Young LLP
200 Clarendon Street
Boston, Massachusetts 02116
Annual Report
December 31, 2018
State Street Total Return V.I.S. Fund
Beginning on January 1, 2021, as permitted by regulations adopted by the Securities and Exchange Commission, paper copies of a Fund’s annual and semi-annual shareholder reports will no longer be sent by mail, unless you specifically request paper copies of the reports from the Fund (or from your financial intermediary, such as a broker-dealer or bank). Instead, the reports will be made available on a Fund’s website (www.ssga.com/geam), and you will be notified by mail each time a report is posted, and provided with a website link to access the report.
Beginning on January 1, 2019, you may elect to receive all future reports in paper free of charge. If you invest through a financial intermediary, you can contact your financial intermediary to request that you continue to receive paper copies of your shareholder reports. Your election to receive reports in paper will apply to all funds held in your account, if you invest through your financial intermediary or all funds held with the fund complex if you invest directly with a Fund.

State Street Total Return V.I.S Fund
Annual Report
December 31, 2018 (Unaudited)
Table of Contents
This report is prepared for Policyholders of certain variable contracts and may be distributed to others only if preceded or accompanied by the variable contract’s current prospectus and the current summary prospectus of the Fund available for investments thereunder.
State Street Total Return V.I.S. Fund
Notes to Performance — December 31, 2018 (Unaudited)
The information provided on the performance page relates to the State Street Total Return V.I.S Fund (the “Fund”).
Total return performance shown in this report for the Fund takes into account changes in share price and assumes reinvestment of dividends and capital gains distributions, if any. Total returns shown are net of Fund fees and expenses but do not reflect fees and charges associated with the variable contracts such as administrative fees, account charges and surrender charges, which, if reflected, would reduce the Fund’s total returns for all periods shown.
The performance data quoted represents past performance; past performance does not guarantee future results. Investment return and principal value will fluctuate so your shares, when redeemed, may be worth more or less than their original cost. Current performance may be higher or lower than the performance data quoted. Periods less than one year are not annualized. Please call toll-free (800) 242-0134 or visit the Fund’s website at http://www.ssga.com/geam for the most recent month-end performance data.
An investment in the Fund is not a deposit of any bank and is not insured or guaranteed by the Federal Deposit Insurance Corporation (“FDIC”) or any other government agency. An investment in the Fund is subject to risk, including possible loss of principal invested.
The S&P 500® Index is an unmanaged, market capitalization-weighted index of stocks of 500 large U.S. companies, which is widely used as a measure of large-cap U.S. stock market performance.
The MSCI All Country WorldIndex ex-U.S. (“MSCI® ACWI ex-U.S.”) is amarket-capitalization weighted index designed to provide a broad measure of stock performance throughout the world, with the exception of U.S.-based companies. The MSCI® ACWI ex-U.S. Index includes both developed and emerging markets.
The Bloomberg Barclays U.S. Aggregate Bond Index is an unmanaged market value-weighted index of taxable investment grade debt issues, including government, corporate, asset-backed and mortgage-backed securities, with maturities of one year or more. This index is designed to represent the performance of the U.S. investment-grade first rate bond market.
The results shown for the foregoing indices assume the reinvestment of net dividends or interest and do not reflect fees, expenses, or taxes. As such, the index returns do not reflect the actual cost of investing in the instruments that comprise each index.
The views expressed in this document reflect our judgment as of the publication date and are subject to change at any time without notice.
State Street Global Advisors Funds Distributors, LLC, member of FINRA & SIPC is the principal underwriter and distributor of the State Street V.I.S. Funds and an indirect wholly-owned subsidiary of State Street Corporation. References to State Street may include State Street Corporation and its affiliates. The Funds pay State Street Bank and Trust Company for its services as custodian and Fund Accounting agent, and pay SSGA Funds Management, Inc. for investment advisory and administrative services.
State Street Total Return V.I.S. Fund
Management’s Discussion of Fund Performance — December 31, 2018 (Unaudited)
The State Street Total Return V.I.S. Fund (the “Fund”) seeks the highest total return, composed of current income and capital appreciation, as is consistent with prudent investment risk. The Fund’s benchmarks are the S&P 500 Index, the MSCI All Country Worldex-U.S. Index, and the Bloomberg Barclays U.S. Aggregate Bond Index (the “Indices”).
For the12-month period ended December 31, 2018 (the “Reporting Period”), the total return for the Fund’s Class 1 and Class 3 Shares was-6.34% and -6.61%, respectively. The total return for S&P 500 Index was-4.38%. The total return for MSCI All Country Worldex-U.S. Index was-14.20%. The total return for Bloomberg Barclays U.S. Aggregate Bond Index was 0.01%. The Fund and Indices’ returns reflect the reinvestment of dividends and other income. The Fund’s performance reflects the expenses of managing the Fund, including brokerage and advisory expenses. The Indices are unmanaged and index returns do not reflect fees and expenses of any kind, which would have a negative impact on returns.
The Fund (Class 1 Shares) delivered absolute returns of-6.34% for the Reporting Period, trailing the S&P 500 Index. The negative contribution to return was driven primarily by asset allocation decisions, where strategic holdings tonon-US equities and commodities underperformed relative to domestic equities held in the portfolio. An underweight to fixed income securities also proved costly, as both government and corporate bonds experienced less volatility in general over the Reporting Period. Lastly, underperformance of the underlying ETFs relative to their respective benchmarks had an adverse impact.
On the positive side, the overweight to cash in the latter half of the Reporting Period helped provide some stability amid increasing volatility in more growth driven asset classes. Within equities, the Fund benefited from security selection on the core factors strategies, which are designed to provide exposure to certain stock market premia like value, momentum and market capitalization. A modest overweight to high yield bonds also contributed positively to returns overall.
The Fund used equity futures contracts in order to equitize cash in the portfolio during the Reporting Period. The Fund’s use of futures contracts did not have a material impact on Fund performance.
The views expressed above reflect those of the Fund’s portfolio manager only through the Reporting Period, and do not necessarily represent the views of the Adviser as a whole. Any such views are subject to change at any time based upon market or other conditions and the Adviser disclaims any responsibility to update such views. These views may not be relied on as investment advice and, because investment decisions for a fund are based on numerous factors, may not be relied on as an indication of trading intent on behalf of any fund.
| | |
| 2 | | State Street Total Return V.I.S. Fund |
State Street Total Return V.I.S. Fund
Understanding Your Fund’s Expenses — December 31, 2018 (Unaudited)
As a shareholder of the Fund, you incur ongoing costs. Ongoing costs include portfolio management fees, professional fees, administrative fees and other Fund expenses. The following example is intended to help you understand your ongoing costs (in dollars) of investing in the Fund and to compare these costs with the ongoing costs of investing in other mutual funds.
To illustrate these ongoing costs, we have provided an example and calculated the expenses paid by investors in the Fund during the period. The information in the following table is based on an investment of $1,000, which is invested at the beginning of the period and held for the entiresix-month period ended December 31, 2018.
Actual Expenses
The first section of the table provides information about actual account values and actual expenses. You may use the information in this section, together with the amount you invested, to estimate the expenses that you paid over the period. To do so, simply divide your account value by $1,000 (for example, an $8,600 account value divided by $1,000 = 8.6), then multiply the result by the number given under the heading “Expenses paid during the period” to estimate the expenses you paid on your account during the period.
Hypothetical Example for Comparison Purposes
The second section of the table provides information about hypothetical account values and hypothetical expenses based on the Fund’s actual expense ratio and an assumed rate of return of 5% per year before expenses, which is not the Fund’s actual return. The hypothetical account values and expenses may not be used to estimate the actual ending account balance or expenses you paid for the period. You may use this information to compare the ongoing costs of investing in the Fund and other funds. To do so, compare this 5% hypothetical example with the 5% hypothetical examples that appear in the shareholder reports of other funds.
Please note that the expenses shown in the table are meant to highlight and help you compare ongoing costs only and do not reflect transaction costs, such as sales charges or redemption fees, if any. Therefore, the second section of the table is useful in comparing ongoing costs only, and will not help you determine the relative total costs of owning different funds. Additionally, the expenses shown do not reflect the fees or charges associated with variable contracts through which shares of the Fund are offered.
July 1, 2018 — December 31, 2018
| | | | | | | | |
Class 1 | | Actual
Fund Return | | | Hypothetical
5% Return
(2.5% for
the period) | |
Actual Fund Return | | | | | | | | |
Beginning Account Value July 1, 2018 | | $ | 1,000.00 | | | $ | 1,000.00 | |
Ending Account Value December 31, 2018 | | $ | 943.70 | | | $ | 1,022.20 | |
Expenses Paid During Period* | | $ | 2.94 | | | $ | 3.06 | |
| | |
Class 3 | | Actual
Fund Return | | | Hypothetical
5% Return
(2.5% for
the period) | |
Actual Fund Return | | | | | | | | |
Beginning Account Value July 1, 2018 | | $ | 1,000.00 | | | $ | 1,000.00 | |
Ending Account Value December 31, 2018 | | $ | 942.00 | | | $ | 1,020.92 | |
Expenses Paid During Period* | | $ | 4.16 | | | $ | 4.33 | |
| * | Expenses are equal to the Fund’s annualized net expense ratios of 0.60%** for Class 1 and 0.85%** for Class 3 (for the period July 1, 2018-December 31, 2018), multiplied by the average account value over the period, multiplied by 184/365 (to reflect theone-half year period). |
| ** | May differ from expense ratio disclosed in the financial highlights, which is calculated based on the entire fiscal year’s data. |
| | | | |
| State Street Total Return V.I.S. Fund | | | 3 | |
State Street Total Return V.I.S. Fund
Performance Summary — December 31, 2018 (Unaudited)
Top Ten Largest Equity Holdings
as of December 31, 2018 (as a % of Fair Value) (a)(b)
| | | | |
Berkshire Hathaway Inc., Class B | | | 1.18 | % |
| |
Johnson & Johnson | | | 0.99 | % |
| |
Cisco Systems Inc. | | | 0.95 | % |
| |
Intel Corp. | | | 0.76 | % |
| |
Danaher Corp. | | | 0.75 | % |
| |
Aflac Inc. | | | 0.74 | % |
| |
Republic Services Inc. | | | 0.73 | % |
| |
Accenture PLC, Class A | | | 0.68 | % |
| |
Honeywell International Inc. | | | 0.68 | % |
| |
Intuit Inc. | | | 0.67 | % |
Sector Allocation
Portfolio Composition as a % of Fair Value of $1,904,110 (in thousands) as of December 31, 2018 (a)(b)
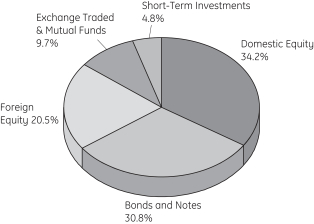
Average Annual Total Return for the periods ended December 31, 2018
Class 1 Shares (Inception date: 7/01/85)
| | | | | | | | | | | | | | |
| | | One Year | | Five Year | | | Ten Year | | | Ending Value
of a $10,000
Investment | |
State Street Total
Return V.I.S Fund | | -6.34% | | | 3.69 | % | | | 7.15 | % | | $ | 19,953 | |
S&P 500® Index | | -4.38% | | | 8.50 | % | | | 13.12 | % | | $ | 34,304 | |
Bloomberg Barclays
U.S. Aggregate
Bond Index | | 0.01% | | | 2.52 | % | | | 3.48 | % | | $ | 14,075 | |
MSCI All Country
World ex.-U.S. | | -14.20% | | | 0.68 | % | | | 6.57 | % | | $ | 18,899 | |
Class 3 Shares (Inception date: 5/01/06)
| | | | | | | | | | | | | | |
| | | One Year | | Five Year | | | Ten Year | | | Ending Value
of a $10,000
Investment | |
State Street Total
Return V.I.S Fund | | -6.61% | | | 3.43 | % | | | 6.89 | % | | $ | 19,464 | |
S&P 500® Index | | -4.38% | | | 8.50 | % | | | 13.12 | % | | $ | 34,304 | |
Bloomberg Barclays U.S. Aggregate Bond Index | | 0.01% | | | 2.52 | % | | | 3.48 | % | | $ | 14,075 | |
MSCI All Country Worldex-U.S. | | -14.20% | | | 0.68 | % | | | 6.57 | % | | $ | 18,899 | |
| (a) | Fair Value basis is inclusive of short-term investment in State Street Institutional U.S. Government Money Market Fund G Class. |
| (b) | The securities information regarding holdings, allocations and other characteristics is presented to illustrate examples of securities that the Fund has bought and the diversity of areas in which the Fund may invest as of a particular date. It may not be representative of the Fund’s current or future investments and should not be construed as a recommendation to purchase or sell a particular security. |
| | |
| 4 | | State Street Total Return V.I.S. Fund |
State Street Total Return V.I.S. Fund
Performance Summary, continued — December 31, 2018 (Unaudited)
Class 1 Shares
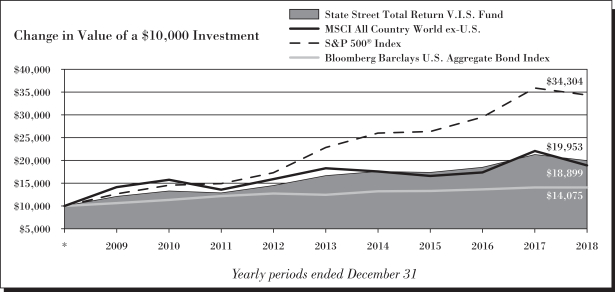
Class 3 Shares

See Notes to Performance beginning on page 1 for further information.
Past performance does not predict future performance. The performance shown in the graphs and tables does not reflect the deduction of taxes that a shareholder would pay on Fund distributions or the redemption of Fund shares and does not reflect the fees or charges that would be associated with variable contracts through which shares of the Fund are offered.
| | | | |
| State Street Total Return V.I.S. Fund | | | 5 | |
State Street Total Return V.I.S. Fund
Summary Schedule of Investments — December 31, 2018
| | | | | | | | |
| | | Principal
Amount ($) or Number
of Shares | | | Fair
Value $ | |
| | | | | | | | |
|
| Equity Securities - 54.8%† | |
Communication Services - 3.2% | |
CenturyLink Inc. | | | 704,400 | | | | 10,671,660 | |
Swisscom AG | | | 15,831 | | | | 7,542,930 | |
Other Securities | | | | | | | 42,259,944 | |
| | | | | | | | |
| | | | | | | 60,474,534 | |
| | | | | | | | |
|
Consumer Discretionary - 6.7% | |
FF Group (a)(b) | | | 1,860 | | | | 5,103 | |
Genuine Parts Co. | | | 89,774 | | | | 8,620,099 | |
Kohl’s Corp. | | | 186,127 | | | | 12,347,665 | |
The TJX Companies Inc. | | | 281,046 | | | | 12,573,998 | |
Urban Outfitters Inc. (a) | | | 273,669 | | | | 9,085,811 | |
Other Securities | | | | | | | 85,443,212 | |
| | | | | | | | |
| | | | | | | 128,075,888 | |
| | | | | | | | |
|
Consumer Staples - 3.9% | |
China Huishan Dairy Holdings Company Ltd. (a)(b) | | | 55,000 | | | | — | |
Colruyt S.A. | | | 94,801 | | | | 6,745,057 | |
Costco Wholesale Corp. | | | 52,919 | | | | 10,780,129 | |
Keurig Dr Pepper Inc. | | | 452,314 | | | | 11,597,331 | |
The Estee Lauder Companies Inc., Class A | | | 69,649 | | | | 9,061,335 | |
Other Securities | | | | | | | 36,433,473 | |
| | | | | | | | |
| | | | | | | 74,617,325 | |
| | | | | | | | |
|
Energy - 3.0% | |
PBF Energy Inc., Class A | | | 216,686 | | | | 7,079,132 | |
Phillips 66 | | | 103,286 | | | | 8,898,089 | |
Valero Energy Corp. | | | 129,181 | | | | 9,684,700 | |
Other Securities | | | | | | | 30,282,953 | |
| | | | | | | | |
| | | | | | | 55,944,874 | |
| | | | | | | | |
|
Financials - 12.1% | |
Aflac Inc. (d) | | | 310,334 | | | | 14,138,817 | |
AGNC Investment Corp. | | | 675,856 | | | | 11,854,514 | |
Allianz SE | | | 34,492 | | | | 6,905,687 | |
Berkshire Hathaway Inc., Class B (a) | | | 110,564 | | | | 22,574,957 | |
Loews Corp. | | | 185,501 | | | | 8,444,006 | |
Royal Bank of Canada | | | 120,230 | | | | 8,225,429 | |
T Rowe Price Group Inc. | | | 110,847 | | | | 10,233,395 | |
Zurich Insurance Group AG | | | 26,174 | | | | 7,782,105 | |
Other Securities | | | | | | | 138,610,640 | |
| | | | | | | | |
| | | | | | | 228,769,550 | |
| | | | | | | | |
|
Healthcare - 4.7% | |
Danaher Corp. | | | 137,968 | | | | 14,227,260 | |
Johnson & Johnson | | | 145,717 | | | | 18,804,779 | |
| | | | | | | | |
| | | Principal
Amount ($) or Number
of Shares | | | Fair
Value $ | |
Pfizer Inc. | | | 232,090 | | | | 10,130,728 | |
Other Securities | | | | | | | 46,157,626 | |
| | | | | | | | |
| | | | | | | 89,320,393 | |
| | | | | | | | |
|
Industrials - 7.2% | |
Expeditors International of Washington Inc. | | | 176,808 | | | | 12,038,857 | |
Honeywell International Inc. | | | 97,981 | | | | 12,945,250 | |
MSC Industrial Direct Company Inc., Class A | | | 153,879 | | | | 11,836,373 | |
Republic Services Inc. | | | 191,737 | | | | 13,822,320 | |
Robert Half International Inc. | | | 187,864 | | | | 10,745,821 | |
Other Securities | | | | | | | 75,998,998 | |
| | | | | | | | |
| | | | | | | 137,387,619 | |
| | | | | | | | |
|
Information Technology - 8.3% | |
Accenture PLC, Class A (d) | | | 92,608 | | | | 13,058,654 | |
ANSYS Inc. (a) | | | 74,747 | | | | 10,684,336 | |
Apple Inc. (d) | | | 51,408 | | | | 8,109,098 | |
Broadridge Financial Solutions Inc. | | | 110,752 | | | | 10,659,880 | |
Cisco Systems Inc. | | | 416,173 | | | | 18,032,776 | |
Hanergy Thin Film Power Group Ltd. (a)(b) | | | 64,000 | | | | — | |
Intel Corp. | | | 308,444 | | | | 14,475,277 | |
Intuit Inc. | | | 64,921 | | | | 12,779,699 | |
Jack Henry & Associates Inc. | | | 55,565 | | | | 7,030,084 | |
Microsoft Corp. | | | 62,558 | | | | 6,354,016 | |
Other Securities | | | | | | | 56,988,334 | |
| | | | | | | | |
| | | | | | | 158,172,154 | |
| | | | | | | | |
Materials - 2.3% | |
Ferroglobe PLC (a)(b) | | | 1,316 | | | | — | |
Linde PLC | | | 73,614 | | | | 11,486,729 | |
Other Securities | | | | | | | 31,944,034 | |
| | | | | | | | |
| | | | | | | 43,430,763 | |
| | | | | | | | |
|
Real Estate - 2.0% | |
Other Securities | | | | | | | 37,840,537 | |
| | | | | | | | |
| | |
Utilities - 1.2% | | | | | | | | |
Other Securities | | | | | | | 22,408,721 | |
| | | | | | | | |
| | |
Total Equity Securities
(Cost $1,100,355,488) | | | | | | | 1,040,465,147 | |
| | | | | | | | |
|
| Bonds and Notes - 30.9% | |
U.S. Treasuries - 17.1% | |
U.S. Treasury Bonds | | | | | | | | |
2.25% 08/15/46 | | | 1,600,000 | | | | 1,367,233 | |
2.50% 02/15/45 - 05/15/46 | | | 4,310,000 | | | | 3,893,116 | |
2.75% 11/15/42 - 11/15/47 | | | 2,150,000 | | | | 2,041,635 | |
See Notes to Summary Schedule of Investments and Notes to Financial Statements.
| | |
| 6 | | State Street Total Return V.I.S. Fund |
State Street Total Return V.I.S. Fund
Summary Schedule of Investments, continued — December 31, 2018
| | | | | | | | |
| | | Principal
Amount ($) or Number
of Shares | | | Fair
Value $ | |
| | | | | | | | |
2.88% 05/15/43 - 11/15/46 | | | 2,400,000 | | | | 2,338,521 | |
3.00% 05/15/42 - 08/15/48 | | | 11,250,000 | | | | 11,219,078 | |
3.13% 08/15/44 - 05/15/48 | | | 3,000,000 | | | | 3,059,887 | |
3.38% 05/15/44 - 11/15/48 | | | 2,400,000 | | | | 2,557,444 | |
3.63% 08/15/43 - 02/15/44 | | | 1,740,000 | | | | 1,927,011 | |
3.75% 11/15/43 | | | 1,400,000 | | | | 1,580,964 | |
4.25% 05/15/39 - 11/15/40 | | | 2,000,000 | | | | 2,415,119 | |
4.38% 02/15/38 - 05/15/40 | | | 2,300,000 | | | | 2,818,851 | |
4.50% 02/15/36 | | | 2,000,000 | | | | 2,465,293 | |
4.63% 02/15/40 | | | 500,000 | | | | 633,631 | |
5.25% 02/15/29 | | | 200,000 | | | | 244,492 | |
5.50% 08/15/28 | | | 200,000 | | | | 247,086 | |
6.00% 02/15/26 | | | 827,000 | | | | 1,008,718 | |
6.38% 08/15/27 | | | 200,000 | | | | 256,916 | |
7.63% 11/15/22 - 02/15/25 | | | 500,000 | | | | 613,063 | |
7.88% 02/15/21 | | | 2,000,000 | | | | 2,220,431 | |
8.75% 05/15/20 | | | 1,200,000 | | | | 1,299,099 | |
U.S. Treasury Inflation Indexed Bonds | | | | | |
0.63% 02/15/43 | | | 1,429,818 | | | | 1,256,595 | |
0.75% 02/15/42 - 02/15/45 | | | 3,659,026 | | | | 3,303,620 | |
0.88% 02/15/47 | | | 576,153 | | | | 529,711 | |
1.00% 02/15/46 - 02/15/48 | | | 4,093,272 | | | | 3,886,620 | |
1.38% 02/15/44 | | | 2,061,519 | | | | 2,134,231 | |
1.75% 01/15/28 | | | 965,632 | | | | 1,026,299 | |
2.13% 02/15/41 | | | 1,096,975 | | | | 1,298,424 | |
2.38% 01/15/25 | | | 2,515,331 | | | | 2,720,635 | |
2.50% 01/15/29 | | | 1,531,127 | | | | 1,744,967 | |
3.38% 04/15/32 | | | 997,234 | | | | 1,281,757 | |
3.88% 04/15/29 | | | 2,307,300 | | | | 2,940,035 | |
U.S. Treasury Inflation Indexed Notes | | | | | |
0.13% 04/15/20 - 07/15/26 | | | 31,872,425 | | | | 30,855,157 | |
0.25% 01/15/25 | | | 6,405,720 | | | | 6,136,939 | |
0.38% 07/15/23 - 07/15/27 | | | 13,514,253 | | | | 13,023,285 | |
0.50% 01/15/28 | | | 3,998,124 | | | | 3,818,026 | |
0.63% 07/15/21 - 01/15/26 | | | 10,487,425 | | | | 10,338,783 | |
0.75% 07/15/28 | | | 4,911,026 | | | | 4,811,039 | |
1.13% 01/15/21 | | | 3,467,910 | | | | 3,453,799 | |
1.25% 07/15/20 | | | 2,319,000 | | | | 2,314,738 | |
1.38% 01/15/20 | | | 818,552 | | | | 813,528 | |
U.S. Treasury Notes | | | | | | | | |
1.13% 03/31/20 - 09/30/21 | | | 6,500,000 | | | | 6,301,904 | |
1.25% 01/31/20 - 10/31/21 | | | 6,500,000 | | | | 6,329,347 | |
1.38% 01/31/20 - 05/31/21 | | | 13,000,000 | | | | 12,756,795 | |
1.50% 01/31/22 - 08/15/26 | | | 2,900,000 | | | | 2,743,313 | |
1.63% 07/31/20 - 05/15/26 | | | 11,540,000 | | | | 11,094,891 | |
1.75% 10/31/20 - 05/15/23 | | | 9,600,000 | | | | 9,393,955 | |
1.88% 12/15/20 - 09/30/22 | | | 19,600,000 | | | | 19,239,230 | |
2.00% 01/31/20 - 11/15/26 | | | 22,644,000 | | | | 22,197,287 | |
2.13% 08/31/20 - 05/15/25 | | | 13,000,000 | | | | 12,823,142 | |
2.25% 03/31/21 - 11/15/27 | | | 17,390,000 | | | | 17,029,843 | |
2.38% 01/31/23 - 05/15/27 | | | 5,000,000 | | | | 4,940,344 | |
2.50% 05/31/20 - 01/31/25 | | | 8,500,000 | | | | 8,492,210 | |
| | | | | | | | |
| | | Principal
Amount ($) or Number
of Shares | | | Fair
Value $ | |
2.63% 07/31/20 - 12/31/25 | | | 10,885,000 | | | | 10,919,156 | |
2.75% 11/30/20 - 02/15/28 | | | 18,800,000 | | | | 18,978,109 | |
2.88% 10/15/21 - 08/15/28 | | | 12,900,000 | | | | 13,101,339 | |
3.00% 10/31/25 | | | 500,000 | | | | 512,970 | |
3.13% 05/15/21 - 11/15/28 | | | 3,000,000 | | | | 3,078,383 | |
3.63% 02/15/20 - 02/15/21 | | | 2,700,000 | | | | 2,737,798 | |
| | | | | | | | |
| | | | | | | 324,565,792 | |
| | | | | | | | |
|
U.S. Government Sponsored Agency - 0.0%* | |
Other Securities | | | | | | | 490,020 | |
| | | | | | | | |
|
Agency Collateralized Mortgage Obligations - 0.1% | |
Federal Home Loan Mortgage Corp. | | | | | |
2.75% 01/25/26 | | | 300,000 | | | | 292,423 | |
3.06% 07/25/23 (e) | | | 600,000 | | | | 602,020 | |
3.30% 04/25/23 (e) | | | 100,000 | | | | 101,340 | |
3.39% 03/25/24 | | | 200,000 | | | | 203,398 | |
3.49% 01/25/24 | | | 300,000 | | | | 306,227 | |
3.85% 06/25/28 | | | 250,000 | | | | 259,335 | |
3.97% 01/25/21 (e) | | | 200,000 | | | | 203,018 | |
4.33% 10/25/20 (e) | | | 50,000 | | | | 50,819 | |
Federal National Mortgage Assoc. | | | | | |
2.78% 06/25/21 (e) | | | 304,743 | | | | 303,314 | |
3.08% 06/25/27 (e) | | | 261,000 | | | | 256,715 | |
3.64% 08/25/30 (e) | | | 200,000 | | | | 201,359 | |
| | | | | | | | |
| | | | | | | 2,779,968 | |
| | | | | | | | |
|
Agency Mortgage Backed - 6.4% | |
Federal Home Loan Mortgage Corp. | | | | | |
1.13% 08/12/21 | | | 637,000 | | | | 615,227 | |
2.38% 01/13/22 | | | 1,100,000 | | | | 1,095,490 | |
2.50% 07/01/28 - 02/01/32 | | | 1,325,061 | | | | 1,295,111 | |
2.51% 11/25/22 | | | 300,000 | | | | 295,464 | |
3.00% 05/01/30 - 03/01/48 | | | 11,866,622 | | | | 11,679,665 | |
3.50% 03/01/26 - 03/01/47 | | | 8,910,749 | | | | 8,954,765 | |
4.00% 06/01/42 - 12/01/48 | | | 5,753,469 | | | | 5,884,844 | |
4.50% 05/01/42 - 01/01/45 | | | 82,026 | | | | 85,818 | |
5.00% 06/01/41 | | | 1,408,176 | | | | 1,507,335 | |
5.50% 01/01/38 - 04/01/39 | | | 347,698 | | | | 374,591 | |
6.00% 06/01/37 - 11/01/37 | | | 326,223 | | | | 360,477 | |
6.25% 07/15/32 | | | 250,000 | | | | 334,500 | |
3.50% TBA (f) | | | 500,000 | | | | 506,235 | |
4.50% TBA (f) | | | 775,000 | | | | 802,086 | |
Federal National Mortgage Assoc. | | | | | |
1.50% 07/30/20 | | | 500,000 | | | | 491,970 | |
1.88% 09/24/26 | | | 1,000,000 | | | | 930,630 | |
2.13% 04/24/26 | | | 700,000 | | | | 667,821 | |
2.50% 09/01/28 - 08/01/30 | | | 1,055,851 | | | | 1,035,717 | |
3.00% 01/01/28 - 05/01/47 | | | 11,025,513 | | | | 10,907,561 | |
3.50% 01/01/27 - 09/01/48 | | | 16,415,942 | | | | 16,502,218 | |
4.00% 10/01/41 - 11/01/48 | | | 10,167,369 | | | | 10,417,597 | |
See Notes to Summary Schedule of Investments and Notes to Financial Statements.
| | | | |
| State Street Total Return V.I.S. Fund | | | 7 | |
State Street Total Return V.I.S. Fund
Summary Schedule of Investments, continued — December 31, 2018
| | | | | | | | |
| | | Principal
Amount ($) or Number
of Shares | | | Fair
Value $ | |
| | | | | | | | |
4.50% 01/01/27 - 03/01/46 | | | 3,904,851 | | | | 4,085,857 | |
5.00% 12/01/39 - 05/01/41 | | | 287,015 | | | | 304,624 | |
5.50% 12/01/35 - 04/01/38 | | | 1,201,340 | | | | 1,294,347 | |
6.00% 03/01/34 - 08/01/37 | | | 1,617,508 | | | | 1,785,954 | |
6.63% 11/15/30 | | | 100,000 | | | | 134,347 | |
4.00% TBA (f) | | | 1,550,000 | | | | 1,583,250 | |
4.50% TBA (f) | | | 1,250,000 | | | | 1,294,000 | |
Government National Mortgage Assoc. | | | | | |
2.50% 05/20/45 | | | 249,227 | | | | 237,805 | |
3.00% 10/15/42 - 06/20/47 | | | 7,491,703 | | | | 7,405,374 | |
3.50% 03/20/45 - 08/20/48 | | | 11,928,847 | | | | 12,038,600 | |
4.00% 12/20/40 - 09/20/47 | | | 6,893,972 | | | | 7,102,040 | |
4.50% 05/20/40 - 11/20/48 | | | 2,449,581 | | | | 2,551,326 | |
5.00% 08/15/41 | | | 2,009,447 | | | | 2,148,218 | |
3.50% TBA (f) | | | 400,000 | | | | 402,760 | |
4.00% TBA (f) | | | 250,000 | | | | 256,050 | |
4.50% TBA (f) | | | 1,100,000 | | | | 1,137,741 | |
Other Securities | | | | | | | 3,117,570 | |
| | | | | | | | |
| | | | | | | 121,624,985 | |
| | | | | | | | |
| | |
Asset Backed - 0.1% | | | | | | | | |
Other Securities | | | | | | | 2,056,986 | |
| | | | | | | | |
| | |
Corporate Notes - 6.4% | | | | | | | | |
Aflac Inc. | | | | | | | | |
3.63% 11/15/24 | | | 150,000 | | | | 149,704 | |
Apple Inc. | | | | | | | | |
1.80% 05/11/20 | | | 200,000 | | | | 197,588 | |
2.00% 11/13/20 | | | 50,000 | | | | 49,334 | |
2.25% 02/23/21 | | | 200,000 | | | | 197,726 | |
2.40% 01/13/23 | | | 50,000 | | | | 48,569 | |
2.50% 02/09/22 | | | 150,000 | | | | 147,873 | |
2.75% 01/13/25 | | | 50,000 | | | | 48,133 | |
3.00% 11/13/27 | | | 100,000 | | | | 95,094 | |
3.25% 02/23/26 | | | 160,000 | | | | 156,042 | |
3.75% 11/13/47 | | | 50,000 | | | | 46,203 | |
4.38% 05/13/45 | | | 165,000 | | | | 168,183 | |
4.50% 02/23/36 | | | 150,000 | | | | 158,122 | |
4.65% 02/23/46 | | | 185,000 | | | | 195,600 | |
Broadridge Financial Solutions Inc. | | | | | |
3.40% 06/27/26 | | | 80,000 | | | | 75,690 | |
Cisco Systems Inc. | | | | | | | | |
2.90% 03/04/21 | | | 125,000 | | | | 125,061 | |
5.90% 02/15/39 | | | 200,000 | | | | 247,130 | |
Costco Wholesale Corp. | | | | | | | | |
2.25% 02/15/22 | | | 85,000 | | | | 83,206 | |
3.00% 05/18/27 | | | 100,000 | | | | 96,342 | |
Honeywell International Inc. | | | | | | | | |
3.35% 12/01/23 | | | 150,000 | | | | 150,688 | |
Intel Corp. | | | | | | | | |
2.60% 05/19/26 | | | 150,000 | | | | 140,838 | |
3.73% 12/08/47 | | | 100,000 | | | | 92,793 | |
| | | | | | | | |
| | | Principal
Amount ($) or Number
of Shares | | | Fair
Value $ | |
4.10% 05/11/47 | | | 100,000 | | | | 97,657 | |
Johnson & Johnson | | | | | | | | |
1.95% 11/10/20 | | | 15,000 | | | | 14,801 | |
2.45% 12/05/21 - 03/01/26 | | | 275,000 | | | | 268,194 | |
2.90% 01/15/28 | | | 50,000 | | | | 47,787 | |
3.40% 01/15/38 | | | 25,000 | | | | 23,338 | |
3.50% 01/15/48 | | | 30,000 | | | | 27,581 | |
4.38% 12/05/33 | | | 150,000 | | | | 161,184 | |
Keurig Dr Pepper Inc. | | | | | | | | |
4.60% 05/25/28 (c) | | | 50,000 | | | | 49,831 | |
Loews Corp. | | | | | | | | |
2.63% 05/15/23 | | | 100,000 | | | | 96,420 | |
Microsoft Corp. | | | | | | | | |
1.55% 08/08/21 | | | 150,000 | | | | 145,716 | |
1.85% 02/06/20 | | | 200,000 | | | | 198,508 | |
2.40% 02/06/22 - 08/08/26 | | | 300,000 | | | | 285,432 | |
2.88% 02/06/24 | | | 150,000 | | | | 148,374 | |
3.45% 08/08/36 | | | 200,000 | | | | 189,896 | |
3.50% 02/12/35 | | | 65,000 | | | | 62,419 | |
3.75% 05/01/43 | | | 150,000 | | | | 145,342 | |
4.10% 02/06/37 | | | 200,000 | | | | 205,470 | |
4.45% 11/03/45 | | | 225,000 | | | | 242,062 | |
Pfizer Inc. | | | | | | | | |
3.00% 09/15/21 - 12/15/26 | | | 220,000 | | | | 217,400 | |
3.20% 09/15/23 | | | 125,000 | | | | 125,321 | |
3.60% 09/15/28 | | | 50,000 | | | | 50,186 | |
4.00% 12/15/36 | | | 100,000 | | | | 99,155 | |
4.13% 12/15/46 | | | 100,000 | | | | 100,373 | |
4.20% 09/15/48 | | | 100,000 | | | | 101,579 | |
4.30% 06/15/43 | | | 100,000 | | | | 102,005 | |
Phillips 66 | | | | | | | | |
3.90% 03/15/28 | | | 50,000 | | | | 48,111 | |
4.88% 11/15/44 | | | 45,000 | | | | 43,875 | |
Royal Bank of Canada | | | | | | | | |
2.15% 03/06/20 - 10/26/20 | | | 275,000 | | | | 271,566 | |
2.30% 03/22/21 | | | 150,000 | | | | 148,083 | |
2.75% 02/01/22 | | | 50,000 | | | | 49,225 | |
Valero Energy Corp. | | | | | | | | |
6.63% 06/15/37 | | | 150,000 | | | | 165,324 | |
Other Securities | | | | | | | 114,708,206 | |
| | | | | | | | |
| | | | | | | 121,310,340 | |
| | | | | | | | |
|
Non-Agency Collateralized Mortgage Obligations - 0.2% | |
Other Securities | | | | | | | 4,761,142 | |
| | | | | | | | |
| | |
Sovereign Bonds - 0.4% | | | | | | | | |
Other Securities | | | | | | | 6,769,703 | |
| | | | | | | | |
| |
Municipal Bonds and Notes - 0.2% | | | | | |
Other Securities | | | | | | | 3,196,326 | |
| | | | | | | | |
| | |
Total Bonds and Notes
(Cost $597,214,355) | | | | | | | 587,555,262 | |
| | | | | | | | |
See Notes to Summary Schedule of Investments and Notes to Financial Statements.
| | |
| 8 | | State Street Total Return V.I.S. Fund |
State Street Total Return V.I.S. Fund
Summary Schedule of Investments, continued — December 31, 2018
| | | | | | | | |
| | | Principal
Amount ($) or Number
of Shares | | | Fair
Value $ | |
| | | | | | | | |
| |
| Exchange Traded Funds - 9.8% | | | | | |
Exchange Traded & Mutual Funds - 9.8% | |
Invesco Optimum Yield Diversified Commodity Strategy No K-1 ETF | | | 3,619,568 | | | | 54,546,890 | |
SPDR Bloomberg Barclays High Yield Bond ETF (h) | | | 2,846,551 | | | | 95,615,648 | |
SPDR Dow Jones REIT ETF (h) | | | 410,485 | | | | 35,301,710 | |
| | | | | | | | |
| |
Total Exchange Traded Funds
(Cost $205,081,032) | | | | 185,464,248 | |
| | | | | | | | |
| |
Total Investments in Securities
(Cost $1,902,650,875) | | | | 1,813,484,657 | |
| | | | | | | | |
| | | | | | | | |
| | | Principal
Amount ($) or Number
of Shares | | | Fair
Value $ | |
| Short-Term Investments - 4.8% | | | | | |
State Street Institutional U.S. Government Money Market Fund - Class G Shares 2.31%
(Cost $90,625,489) (h)(i) | | | 90,625,489 | | | | 90,625,489 | |
| | | | | | | | |
| | |
Total Investments
(Cost $1,993,276,364) | | | | | | | 1,904,110,146 | |
| |
| Liabilities in Excess of Other Assets,net - (0.3)% | | | | (4,883,482 | ) |
| | | | | | | | |
| | |
| NET ASSETS - 100.0% | | | | | | | 1,899,226,664 | |
| | | | | | | | |
Other Information:
The Fund had the following long futures contracts open at December 31, 2018:
| | | | | | | | | | | | | | | | |
| Description | | Expiration
date | | | Number of
Contracts | | | Current
Notional
Value | | | Unrealized
Depreciation | |
| | | | | | | | | | | | | | | | |
E-mini Russell 2000 Index Futures | | | March 2019 | | | | 28 | | | $ | 1,888,600 | | | $ | (81,402 | ) |
MSCI EAFE Mini Index Future | | | March 2019 | | | | 5 | | | | 429,000 | | | | (7,637 | ) |
MSCI Emerging Markets Index Futures | | | March 2019 | | | | 39 | | | | 1,885,260 | | | | (20,832 | ) |
S&P 500 Emini Index Futures | | | March 2019 | | | | 97 | | | | 12,150,220 | | | | (209,697 | ) |
| | | | | | | | | | | | | | | | |
| | | | | | | | | | $ | (319,568 | ) |
| | | | | | | | | | | | | | | | |
During the year ended December 31, 2018, average notional value related to long futures contracts was $11,838,238.
See Notes to Summary Schedule of Investments and Notes to Financial Statements.
| | | | |
| State Street Total Return V.I.S. Fund | | | 9 | |
State Street Total Return V.I.S. Fund
Notes to Summary Schedule of Investments — December 31, 2018
The Summary Schedule of Investments does not reflect the complete portfolio holdings. It includes the Fund’s 50 largest holdings and each investment of any issuer that exceeds 1% of the Fund’s net assets. “Other Securities” represent all issues not required to be disclosed under the rules adopted by the U.S. Securities and Exchange Commission (“SEC”). In certain instances, securities for which footnotes listed above may otherwise apply are included in the Other Securities caption. The complete schedule of portfolio holdings is available (i) without charge, upon request, by calling(800) 242-0134; and ii) on the SEC’s website at http://www.sec.gov.
| (a) | Non-income producing security. |
| (b) | Security is fair valued by the Valuation Committee, in accordance with the procedures approved by the Fund’s Board of Directors . Security value is determined based on level 3 inputs. |
| (c) | Pursuant to Rule 144A of the Securities Act of 1933, as amended, these securities may be resold in transactions exempt from registration, normally to qualified institutional buyers. At December 31, 2018, these securities amounted to $8,909,558 or 0.47% of the net assets of the State Street Total Return V.I.S. Fund. These securities have been determined to be liquid using procedures established by State Street Variable Insurance Series Funds, Inc.’s Board of Directors. |
| (d) | At December 31, 2018, all or a portion of this security was pledged to cover collateral requirements for futures and/or TBAs. |
| (e) | Variable Rate Security - Interest rate shown is rate in effect at December 31, 2018. For securities based on a published reference rate and spread, the reference rate and spread are indicated in the description above. |
| (f) | Settlement is on a delayed delivery or when-issued basis with final maturity to be announced (TBA) in the future. |
| (h) | Sponsored by SSGA Funds Management, Inc., the Fund’s investment adviser and administrator, and an affiliate of State Street Bank & Trust Co., the Fund’s sub-administrator, custodian and accounting agent. |
| (i) | Coupon amount represents effective yield. |
| † | Percentages are based on net assets as of December 31, 2018. |
Abbreviations:
ADR - American Depositary Receipt
ISDA - International Swaps and Derivatives Association
LIBOR - London Interbank Offered Rate
NVDR - Non-Voting Depositary Receipt
REIT - Real Estate Investment Trust
SPDR - Standard and Poor’s Depositary Receipt
TBA - To Be Announced
| | | | | | | | | | | | | | | | |
| Investments | | Level 1 | | | Level 2 | | | Level 3 | | | Total | |
| | | | | | | | | | | | | | | | |
Investments in Securities | | | | | | | | | | | | | | | | |
Domestic Equity | | $ | 650,568,854 | | | $ | 336 | | | $ | — | | | $ | 650,569,190 | |
Foreign Equity | | | 389,479,608 | | | | 411,246 | | | | 5,103 | | | | 389,895,957 | |
U.S. Treasuries | | | — | | | | 324,565,792 | | | | — | | | | 324,565,792 | |
U.S. Government Sponsored Agencies | | | — | | | | 490,020 | | | | — | | | | 490,020 | |
Agency Collateralized Mortgage Obligations | | | — | | | | 2,779,968 | | | | — | | | | 2,779,968 | |
Agency Mortgage Backed | | | — | | | | 121,624,985 | | | | — | | | | 121,624,985 | |
Asset Backed | | | — | | | | 2,056,986 | | | | — | | | | 2,056,986 | |
Corporate Notes | | | — | | | | 121,310,340 | | | | — | | | | 121,310,340 | |
Non-Agency Collateralized Mortgage Obligations | | | — | | | | 4,761,142 | | | | — | | | | 4,761,142 | |
Sovereign Bonds | | | — | | | | 6,769,703 | | | | — | | | | 6,769,703 | |
Municipal Bonds and Notes | | | — | | | | 3,196,326 | | | | — | | | | 3,196,326 | |
Exchange Traded & Mutual Funds | | | 185,464,248 | | | | — | | | | — | | | | 185,464,248 | |
Short-Term Investments | | | 90,625,489 | | | | — | | | | — | | | | 90,625,489 | |
| | | | | | | | | | | | | | | | |
Total Investments in Securities | | $ | 1,316,138,199 | | | $ | 587,966,844 | | | $ | 5,103 | | | $ | 1,904,110,146 | |
| | | | | | | | | | | | | | | | |
Other Financial Instruments | | | | | | | | | | | | | | | | |
Long Futures Contracts - Unrealized Depreciation | | $ | (319,568 | ) | | $ | — | | | $ | — | | | $ | (319,568 | ) |
| | | | | | | | | | | | | | | | |
See Notes to Summary Schedule of Investments and Notes to Financial Statements.
| | |
| 10 | | State Street Total Return V.I.S. Fund |
State Street Total Return V.I.S. Fund
Notes to Summary Schedule of Investments, continued — December 31, 2018
The Fund was invested in the following countries/territories at December 31, 2018 (unaudited):
| | | | |
| Country/Territory | | Percentage
(based on
Fair Value) | |
| | | | |
United States | | | 77.74% | |
Japan | | | 2.87% | |
United Kingdom | | | 2.54% | |
Canada | | | 1.93% | |
Switzerland | | | 1.92% | |
France | | | 1.27% | |
Australia | | | 1.26% | |
Germany | | | 1.13% | |
China | | | 0.91% | |
Singapore | | | 0.86% | |
Hong Kong | | | 0.75% | |
Ireland | | | 0.74% | |
Sweden | | | 0.64% | |
Italy | | | 0.61% | |
Belgium | | | 0.48% | |
Taiwan | | | 0.43% | |
South Korea | | | 0.37% | |
Supranational | | | 0.36% | |
Austria | | | 0.32% | |
South Africa | | | 0.28% | |
Israel | | | 0.26% | |
Netherlands | | | 0.24% | |
India | | | 0.23% | |
Norway | | | 0.19% | |
Brazil | | | 0.18% | |
Mexico | | | 0.16% | |
Russian Federation | | | 0.14% | |
Denmark | | | 0.13% | |
| | | | |
| Country/Territory | | Percentage
(based on
Fair Value) | |
| | | | |
Puerto Rico | | | 0.12% | |
Malaysia | | | 0.10% | |
Spain | | | 0.09% | |
Poland | | | 0.08% | |
New Zealand | | | 0.08% | |
Thailand | | | 0.07% | |
Luxembourg | | | 0.06% | |
Chile | | | 0.06% | |
Indonesia | | | 0.05% | |
Colombia | | | 0.05% | |
Philippines | | | 0.04% | |
Cayman Islands | | | 0.03% | |
Finland | | | 0.03% | |
Turkey | | | 0.03% | |
Greece | | | 0.03% | |
Iraq | | | 0.02% | |
Czech Republic | | | 0.02% | |
Hungary | | | 0.02% | |
Peru | | | 0.02% | |
Panama | | | 0.02% | |
Guernsey | | | 0.01% | |
Uruguay | | | 0.01% | |
Czech | | | 0.01% | |
Pakistan | | | 0.01% | |
Bermuda | | | 0.00% | |
Qatar | | | 0.00% | |
| | | | |
| | | 100.00% | |
| | | | |
The Fund’s % share of investment in the various categories, based on Fair Value, is as follows at December 31, 2018 (unaudited):
| | | | | | | | | | | | |
| Industry | | Domestic | | | Foreign | | | Total | |
| | | | | | | | | | | | |
Exchange Traded Funds | | | 9.74% | | | | 0.00% | | | | 9.74% | |
Multi-Line Insurance | | | 0.77% | | | | 1.28% | | | | 2.05% | |
Pharmaceuticals | | | 1.56% | | | | 0.33% | | | | 1.89% | |
Mortgage REITs | | | 1.78% | | | | 0.00% | | | | 1.78% | |
Multi-Sector Holdings | | | 1.19% | | | | 0.53% | | | | 1.72% | |
Oil & Gas Refining & Marketing | | | 1.44% | | | | 0.20% | | | | 1.64% | |
Life & Health Insurance | | | 0.78% | | | | 0.79% | | | | 1.57% | |
Trading Companies & Distributors | | | 0.97% | | | | 0.59% | | | | 1.56% | |
Apparel Retail | | | 1.47% | | | | 0.08% | | | | 1.55% | |
Diversified Banks | | | 0.00% | | | | 1.53% | | | | 1.53% | |
IT Consulting & Other Services | | | 0.45% | | | | 1.00% | | | | 1.45% | |
Integrated Telecommunication Services | | | 0.00% | | | | 1.43% | | | | 1.43% | |
Application Software | | | 1.34% | | | | 0.00% | | | | 1.34% | |
Department Stores | | | 0.91% | | | | 0.26% | | | | 1.17% | |
Data Processing & Outsourced Services | | | 1.04% | | | | 0.04% | | | | 1.08% | |
Communications Equipment | | | 0.98% | | | | 0.00% | | | | 0.98% | |
Environmental & Facilities Services | | | 0.96% | | | | 0.00% | | | | 0.96% | |
Semiconductors | | | 0.79% | | | | 0.11% | | | | 0.90% | |
Healthcare Equipment | | | 0.86% | | | | 0.00% | | | | 0.86% | |
See Notes to Summary Schedule of Investments and Notes to Financial Statements.
| | | | |
| State Street Total Return V.I.S. Fund | | | 11 | |
State Street Total Return V.I.S. Fund
Notes to Summary Schedule of Investments, continued — December 31, 2018
| | | | | | | | | | | | |
| Industry | | Domestic | | | Foreign | | | Total | |
| | | | | | | | | | | | |
| | | | | | | | | | | | |
Hypermarkets & Super Centers | | | 0.57% | | | | 0.29% | | | | 0.86% | |
Air Freight & Logistics | | | 0.86% | | | | 0.00% | | | | 0.86% | |
Property & Casualty Insurance | | | 0.47% | | | | 0.36% | | | | 0.83% | |
Retail REITs | | | 0.20% | | | | 0.57% | | | | 0.77% | |
Apparel, Accessories & Luxury Goods | | | 0.39% | | | | 0.38% | | | | 0.77% | |
Packaged Foods & Meats | | | 0.25% | | | | 0.51% | | | | 0.76% | |
Industrial Conglomerates | | | 0.68% | | | | 0.07% | | | | 0.75% | |
Personal Products | | | 0.50% | | | | 0.23% | | | | 0.73% | |
Technology Hardware, Storage & Peripherals | | | 0.55% | | | | 0.18% | | | | 0.73% | |
Asset Management & Custody Banks | | | 0.66% | | | | 0.06% | | | | 0.72% | |
Electric Utilities | | | 0.14% | | | | 0.56% | | | | 0.70% | |
Technology Distributors | | | 0.66% | | | | 0.02% | | | | 0.68% | |
Soft Drinks | | | 0.61% | | | | 0.00% | | | | 0.61% | |
Integrated Oil & Gas | | | 0.00% | | | | 0.61% | | | | 0.61% | |
Human Resource & Employment Services | | | 0.61% | | | | 0.00% | | | | 0.61% | |
Alternative Carriers | | | 0.56% | | | | 0.05% | | | | 0.61% | |
Industrial Gases | | | 0.00% | | | | 0.60% | | | | 0.60% | |
Financial Exchanges & Data | | | 0.32% | | | | 0.23% | | | | 0.55% | |
Aerospace & Defense | | | 0.33% | | | | 0.20% | | | | 0.53% | |
Steel | | | 0.46% | | | | 0.06% | | | | 0.52% | |
Specialty Chemicals | | | 0.00% | | | | 0.50% | | | | 0.50% | |
Home Building | | | 0.00% | | | | 0.50% | | | | 0.50% | |
Trucking | | | 0.40% | | | | 0.08% | | | | 0.48% | |
Distributors | | | 0.48% | | | | 0.00% | | | | 0.48% | |
Food Retail | | | 0.07% | | | | 0.40% | | | | 0.47% | |
Airlines | | | 0.00% | | | | 0.45% | | | | 0.45% | |
Healthcare Distributors | | | 0.02% | | | | 0.41% | | | | 0.43% | |
Regional Banks | | | 0.20% | | | | 0.22% | | | | 0.42% | |
Auto Parts & Equipment | | | 0.04% | | | | 0.37% | | | | 0.41% | |
Systems Software | | | 0.38% | | | | 0.00% | | | | 0.38% | |
Biotechnology | | | 0.36% | | | | 0.00% | | | | 0.36% | |
Wireless Telecommunication Services | | | 0.24% | | | | 0.11% | | | | 0.35% | |
Life Sciences Tools & Services | | | 0.16% | | | | 0.17% | | | | 0.33% | |
Coal & Consumable Fuels | | | 0.00% | | | | 0.33% | | | | 0.33% | |
Managed Healthcare | | | 0.32% | | | | 0.00% | | | | 0.32% | |
General Merchandise Stores | | | 0.00% | | | | 0.30% | | | | 0.30% | |
Reinsurance | | | 0.10% | | | | 0.20% | | | | 0.30% | |
Automobile Manufacturers | | | 0.03% | | | | 0.27% | | | | 0.30% | |
Metal & Glass Containers | | | 0.29% | | | | 0.00% | | | | 0.29% | |
Healthcare Services | | | 0.22% | | | | 0.07% | | | | 0.29% | |
Internet & Direct Marketing Retail | | | 0.23% | | | | 0.05% | | | | 0.28% | |
Diversified REITs | | | 0.09% | | | | 0.19% | | | | 0.28% | |
Tobacco | | | 0.03% | | | | 0.25% | | | | 0.28% | |
Research & Consulting Services | | | 0.26% | | | | 0.00% | | | | 0.26% | |
Gas Utilities | | | 0.00% | | | | 0.25% | | | | 0.25% | |
Electronic Components | | | 0.21% | | | | 0.03% | | | | 0.24% | |
Publishing | | | 0.15% | | | | 0.08% | | | | 0.23% | |
Real Estate Operating Companies | | | 0.00% | | | | 0.23% | | | | 0.23% | |
Diversified Real Estate Activities | | | 0.00% | | | | 0.22% | | | | 0.22% | |
Internet Services & Infrastructure | | | 0.21% | | | | 0.00% | | | | 0.21% | |
Electronic Manufacturing Services | | | 0.17% | | | | 0.04% | | | | 0.21% | |
Diversified Support Services | | | 0.21% | | | | 0.00% | | | | 0.21% | |
Investment Banking & Brokerage | | | 0.21% | | | | 0.00% | | | | 0.21% | |
Independent Power Producers & Energy Traders | | | 0.08% | | | | 0.11% | | | | 0.19% | |
See Notes to Summary Schedule of Investments and Notes to Financial Statements.
| | |
| 12 | | State Street Total Return V.I.S. Fund |
State Street Total Return V.I.S. Fund
Notes to Summary Schedule of Investments, continued — December 31, 2018
| | | | | | | | | | | | |
| Industry | | Domestic | | | Foreign | | | Total | |
| | | | | | | | | | | | |
Footwear | | | 0.19% | | | | 0.00% | | | | 0.19% | |
Industrial Machinery | | | 0.03% | | | | 0.16% | | | | 0.19% | |
Specialty Stores | | | 0.18% | | | | 0.01% | | | | 0.19% | |
Thrifts & Mortgage Finance | | | 0.18% | | | | 0.00% | | | | 0.18% | |
Restaurants | | | 0.16% | | | | 0.01% | | | | 0.17% | |
Oil & Gas Exploration & Production | | | 0.15% | | | | 0.02% | | | | 0.17% | |
Broadcasting | | | 0.16% | | | | 0.01% | | | | 0.17% | |
Insurance Brokers | | | 0.16% | | | | 0.00% | | | | 0.16% | |
Cable & Satellite | | | 0.15% | | | | 0.01% | | | | 0.16% | |
Home Furnishing Retail | | | 0.16% | | | | 0.00% | | | | 0.16% | |
Real Estate Development | | | 0.00% | | | | 0.15% | | | | 0.15% | |
Industrial REITs | | | 0.01% | | | | 0.13% | | | | 0.14% | |
Interactive Media & Services | | | 0.03% | | | | 0.11% | | | | 0.14% | |
Electronic Equipment & Instruments | | | 0.13% | | | | 0.01% | | | | 0.14% | |
Commodity Chemicals | | | 0.00% | | | | 0.13% | | | | 0.13% | |
Paper Products | | | 0.12% | | | | 0.00% | | | | 0.12% | |
Leisure Facilities | | | 0.10% | | | | 0.00% | | | | 0.10% | |
Agricultural Products | | | 0.00% | | | | 0.10% | | | | 0.10% | |
Hotel & Resort REITs | | | 0.09% | | | | 0.00% | | | | 0.09% | |
Office Services & Supplies | | | 0.02% | | | | 0.07% | | | | 0.09% | |
Oil & Gas Equipment & Services | | | 0.08% | | | | 0.00% | | | | 0.08% | |
Healthcare Supplies | | | 0.08% | | | | 0.00% | | | | 0.08% | |
Advertising | | | 0.02% | | | | 0.06% | | | | 0.08% | |
Oil & Gas Storage & Transportation | | | 0.00% | | | | 0.08% | | | | 0.08% | |
Healthcare Facilities | | | 0.05% | | | | 0.03% | | | | 0.08% | |
Construction Materials | | | 0.00% | | | | 0.08% | | | | 0.08% | |
Construction & Engineering | | | 0.01% | | | | 0.06% | | | | 0.07% | |
Marine Ports & Services | | | 0.00% | | | | 0.06% | | | | 0.06% | |
Specialized REITs | | | 0.06% | | | | 0.00% | | | | 0.06% | |
Leisure Products | | | 0.03% | | | | 0.02% | | | | 0.05% | |
Automotive Retail | | | 0.05% | | | | 0.00% | | | | 0.05% | |
Household Products | | | 0.00% | | | | 0.04% | | | | 0.04% | |
Healthcare Technology | | | 0.04% | | | | 0.00% | | | | 0.04% | |
Semiconductor Equipment | | | 0.03% | | | | 0.01% | | | | 0.04% | |
Health Care REITs | | | 0.04% | | | | 0.00% | | | | 0.04% | |
Electrical Components & Equipment | | | 0.04% | | | | 0.00% | | | | 0.04% | |
Brewers | | | 0.02% | | | | 0.02% | | | | 0.04% | |
Hotels, Resorts & Cruise Lines | | | 0.00% | | | | 0.03% | | | | 0.03% | |
Education Services | | | 0.03% | | | | 0.00% | | | | 0.03% | |
Marine | | | 0.00% | | | | 0.03% | | | | 0.03% | |
Airport Services | | | 0.00% | | | | 0.03% | | | | 0.03% | |
Other Diversified Financial Services | | | 0.00% | | | | 0.02% | | | | 0.02% | |
Water Utilities | | | 0.00% | | | | 0.02% | | | | 0.02% | |
Motorcycle Manufacturers | | | 0.00% | | | | 0.02% | | | | 0.02% | |
Construction Machinery & Heavy Trucks | | | 0.01% | | | | 0.01% | | | | 0.02% | |
Fertilizers & Agricultural Chemicals | | | 0.02% | | | | 0.00% | | | | 0.02% | |
Building Products | | | 0.02% | | | | 0.00% | | | | 0.02% | |
Oil & Gas Drilling | | | 0.01% | | | | 0.01% | | | | 0.02% | |
Consumer Electronics | | | 0.02% | | | | 0.00% | | | | 0.02% | |
Consumer Finance | | | 0.02% | | | | 0.00% | | | | 0.02% | |
Distillers & Vintners | | | 0.02% | | | | 0.00% | | | | 0.02% | |
Residential REITs | | | 0.02% | | | | 0.00% | | | | 0.02% | |
Gold | | | 0.00% | | | | 0.01% | | | | 0.01% | |
Drug Retail | | | 0.00% | | | | 0.01% | | | | 0.01% | |
See Notes to Summary Schedule of Investments and Notes to Financial Statements.
| | | | |
| State Street Total Return V.I.S. Fund | | | 13 | |
State Street Total Return V.I.S. Fund
Notes to Summary Schedule of Investments, continued — December 31, 2018
| | | | | | | | | | | | |
| Industry | | Domestic | | | Foreign | | | Total | |
| | | | | | | | | | | | |
Textiles | | | 0.00% | | | | 0.01% | | | | 0.01% | |
Renewable Electricity | | | 0.00% | | | | 0.01% | | | | 0.01% | |
Highways & Railtracks | | | 0.00% | | | | 0.01% | | | | 0.01% | |
Diversified Metals & Mining | | | 0.00% | | | | 0.01% | | | | 0.01% | |
Diversified Capital Markets | | | 0.00% | | | | 0.01% | | | | 0.01% | |
Copper | | | 0.00% | | | | 0.01% | | | | 0.01% | |
Interactive Home Entertainment | | | 0.00% | | | | 0.01% | | | | 0.01% | |
Paper Packaging | | | 0.01% | | | | 0.00% | | | | 0.01% | |
Household Appliances | | | 0.00% | | | | 0.00% | | | | 0.00% | |
Aluminum | | | 0.00% | | | | 0.00% | | | | 0.00% | |
Tires & Rubber | | | 0.00% | | | | 0.00% | | | | 0.00% | |
Food Distributors | | | 0.00% | | | | 0.00% | | | | 0.00% | |
Specialized Finance | | | 0.00% | | | | 0.00% | | | | 0.00% | |
| | | | | | | | | | | | |
| | | |
| | | | | | | | | | | 64.38% | |
| | | | | | | | | | | | |
| | | | |
| Sector | | Percentage
(based on
Fair Value) | |
| | | | |
U.S. Treasuries | | | 17.04% | |
Agency Mortgage Backed | | | 6.39% | |
Corporate Notes | | | 6.37% | |
Sovereign Bonds | | | 0.35% | |
Non-Agency Collateralized Mortgage Obligations | | | 0.25% | |
Municipal Bonds and Notes | | | 0.17% | |
Agency Collateralized Mortgage Obligations | | | 0.15% | |
Asset Backed | | | 0.11% | |
U.S. Government Sponsored Agencies | | | 0.03% | |
| | | | |
| | | 30.86% | |
| | | | |
| | | | |
| Sector | | Percentage
(based on
Fair Value) | |
| | | | |
Short-Term Investments | | | | |
Short-Term Investments | | | 4.76% | |
| | | | |
| | | 4.76% | |
| | | | |
| | | 100.00% | |
| | | | |
Affiliate Table
| | | | | | | | | | | | | | | | | | | | | | | | | | | | | | | | | | | | |
| | | Number
of Shares
Held at
12/31/17 | | | Value At
12/31/17 | | | Cost of
Purchases | | | Proceeds
from
Shares
Sold | | | Realized Gain (Loss) | | | Change in
Unrealized
Appreciation/ Depreciation | | | Number
of Shares
Held at
12/31/18 | | | Value at
12/31/18 | | | Dividend
Income | |
SPDR Bloomberg Barclays High Yield Bond ETF | | | 2,022,863 | | | $ | 74,279,529 | | | $ | 35,424,699 | | | $ | 5,772,708 | | | $ | (193,121 | ) | | $ | (8,122,751 | ) | | | 2,846,551 | | | $ | 95,615,648 | | | $ | 4,708,174 | |
SPDR Dow Jones REIT ETF | | | — | | | | — | | | | 43,344,692 | | | | 3,699,772 | | | | (35,252 | ) | | | (4,307,958 | ) | | | 410,485 | | | | 35,301,710 | | | | 964,276 | |
State Street Corp. | | | 13,036 | | | | 1,272,444 | | | | — | | | | 1,146,900 | | | | 622,094 | | | | (747,638 | ) | | | — | | | | — | | | | 10,446 | |
State Street Institutional U.S. Government Money Market Fund - Class G Shares | | | 93,039,371 | | | | 93,039,371 | | | | 738,230,353 | | | | 740,644,235 | | | | — | | | | — | | | | 90,625,489 | | | | 90,625,489 | | | | 1,161,800 | |
| | | | | | | | | | | | | | | | | | | | | | | | | | | | | | | | | | | | |
| | | | | | | | | |
TOTAL | | | | | | $ | 168,591,344 | | | $ | 816,999,744 | | | $ | 751,263,615 | | | $ | 393,721 | | | $ | (13,178,347 | ) | | | | | | $ | 221,542,847 | | | $ | 6,844,696 | |
| | | | | | | | | | | | | | | | | | | | | | | | | | | | | | | | | | | | |
See Notes to Summary Schedule of Investments and Notes to Financial Statements.
| | |
| 14 | | State Street Total Return V.I.S. Fund |
State Street Total Return V.I.S. Fund
Financial Highlights
Selected data based on a share outstanding throughout the fiscal years indicated
| | | | | | | | | | | | | | | | | | | | |
| | | Class 1 | |
| | | 12/31/18 | | | 12/31/17 | | | 12/31/16 | | | 12/31/15* | | | 12/31/14* | |
| Inception date | | | | | | | | | | | | | | | | | | | 7/1/85 | |
| | | | | |
Net asset value, beginning of period | | $ | 19.94 | | | $ | 18.08 | | | $ | 17.66 | | | $ | 18.81 | | | $ | 18.71 | |
| | | | | | | | | | | | | | | | | | | | |
| |
Income/(loss) from investment operations: | | | | | |
Net investment income | | | 0.40 | (a) | | | 0.36 | (a) | | | 0.35 | | | | 0.31 | | | | 0.35 | |
Net realized and unrealized gains/(losses) on investments | | | (1.69 | ) | | | 2.46 | | | | 0.77 | | | | (0.52 | ) | | | 0.65 | |
| | | | | | | | | | | | | | | | | | | | |
Total income/(loss) from investment operations | | | (1.29 | ) | | | 2.82 | | | | 1.12 | | | | (0.21 | ) | | | 1.00 | |
| | | | | | | | | | | | | | | | | | | | |
| | | | | |
Less distributions from: | | | | | | | | | | | | | | | | | | | | |
Net investment income | | | 0.45 | | | | 0.41 | | | | 0.35 | | | | 0.34 | | | | 0.34 | |
Net realized gains | | | 4.14 | | | | 0.55 | | | | 0.35 | | | | 0.60 | | | | 0.56 | |
| | | | | | | | | | | | | | | | | | | | |
Total distributions | | | 4.59 | | | | 0.96 | | | | 0.70 | | | | 0.94 | | | | 0.90 | |
| | | | | | | | | | | | | | | | | | | | |
Net asset value, end of period | | $ | 14.06 | | | $ | 19.94 | | | $ | 18.08 | | | $ | 17.66 | | | $ | 18.81 | |
| | | | | | | | | | | | | | | | | | | | |
Total Return(b) | | | (6.34 | )% | | | 15.58 | % | | | 6.35 | % | | | (1.13 | )% | | | 5.32 | % |
| | | | | |
Ratios/Supplemental Data: | | | | | | | | | | | | | | | | | | | | |
Net assets, end of period (in thousands) | | $ | 733,417 | | | $ | 856,665 | | | $ | 797,448 | | | $ | 807,584 | | | $ | 941,344 | |
| | | | | |
Ratios to average net assets: | | | | | | | | | | | | | | | | | | | | |
Net expenses | | | 0.62 | % | | | 0.62 | % | | | 0.60 | % | | | 0.61 | % | | | 0.62 | %(c) |
Gross expenses | | | 0.62 | % | | | 0.62 | % | | | 0.60 | % | | | 0.61 | % | | | 0.62 | % |
Net investment income | | | 2.01 | % | | | 1.83 | % | | | 1.85 | % | | | 1.56 | % | | | 1.66 | % |
Portfolio turnover rate | | | 97 | % | | | 15 | % | | | 45 | % | | | 70 | % | | | 78 | % |
| | | | | | | | | | | | | | | | | | | | |
| | | Class 3 | |
| | | 12/31/18 | | | 12/31/17 | | | 12/31/16 | | | 12/31/15* | | | 12/31/14* | |
| Inception date | | | | | | | | | | | | | | | | | | | 5/1/06 | |
| | | | | |
Net asset value, beginning of period | | $ | 19.88 | | | $ | 18.03 | | | $ | 17.61 | | | $ | 18.75 | | | $ | 18.65 | |
| | | | | | | | | | | | | | | | | | | | |
| |
Income/(loss) from investment operations: | | | | | |
Net investment income | | | 0.35 | (a) | | | 0.31 | (a) | | | 0.30 | | | | 0.27 | | | | 0.28 | |
Net realized and unrealized gains/(losses) on investments | | | (1.69 | ) | | | 2.44 | | | | 0.77 | | | | (0.51 | ) | | | 0.67 | |
| | | | | | | | | | | | | | | | | | | | |
Total income/(loss) from investment operations | | | (1.34 | ) | | | 2.75 | | | | 1.07 | | | | (0.24 | ) | | | 0.95 | |
| | | | | | | | | | | | | | | | | | | | |
| | | | | |
Less distributions from: | | | | | | | | | | | | | | | | | | | | |
Net investment income | | | 0.39 | | | | 0.35 | | | | 0.30 | | | | 0.30 | | | | 0.29 | |
Net realized gains | | | 4.14 | | | | 0.55 | | | | 0.35 | | | | 0.60 | | | | 0.56 | |
| | | | | | | | | | | | | | | | | | | | |
Total distributions | | | 4.53 | | | | 0.90 | | | | 0.65 | | | | 0.90 | | | | 0.85 | |
| | | | | | | | | | | | | | | | | | | | |
Net asset value, end of period | | $ | 14.01 | | | $ | 19.88 | | | $ | 18.03 | | | $ | 17.61 | | | $ | 18.75 | |
| | | | | | | | | | | | | | | | | | | | |
Total Return(b) | | | (6.61 | )% | | | 15.26 | % | | | 6.08 | % | | | (1.34 | )% | | | 5.07 | % |
| | | | | |
Ratios/Supplemental Data: | | | | | | | | | | | | | | | | | | | | |
Net assets, end of period (in thousands) | | $ | 1,165,809 | | | $ | 1,464,061 | | | $ | 1,508,428 | | | $ | 1,633,723 | | | $ | 1,842,997 | |
| | | | | |
Ratios to average net assets: | | | | | | | | | | | | | | | | | | | | |
Net Expenses | | | 0.87 | % | | | 0.87 | % | | | 0.85 | % | | | 0.86 | % | | | 0.87 | %(c) |
Gross Expenses | | | 0.87 | % | | | 0.87 | % | | | 0.85 | % | | | 0.86 | % | | | 0.87 | % |
Net investment income | | | 1.76 | % | | | 1.59 | % | | | 1.60 | % | | | 1.31 | % | | | 1.40 | % |
Portfolio turnover rate | | | 97 | % | | | 15 | % | | | 45 | % | | | 70 | % | | | 78 | % |
The accompanying Notes are an integral part of these financial statements.
State Street Total Return V.I.S. Fund
Notes to Financial Highlights
| (a) | | Per share values have been calculated using the average shares method. |
| (b) | | Total returns are historical and assume changes in share price, reinvestment of dividends and capital gains distributions and do not include the effect of insurance contract charges. Past performance does not guarantee future results. |
| (c) | | Includes contractual management fee waiver related to the Fund’s investments in the GE Institutional Money Market Fund (the “Money Market Fund”). The fee waiver agreement was terminated effective June 30, 2014 with the closure of the Money Market Fund. |
| * | | Beginning with the year ended December 31, 2016, the Fund was audited by Ernst & Young LLP. The previous years were audited by another independent registered public accounting firm. |
The accompanying Notes are an integral part of these financial statements.
State Street Total Return V.I.S. Fund
Statement of Assets and Liabilities — December 31, 2018
| | | | |
Assets | | | | |
Investments in securities, at fair value (cost $1,761,577,087) | | $ | 1,682,567,299 | |
Investments in affiliated securities, at fair value (cost $141,073,788) | | | 130,917,358 | |
Short-term affiliated investments, at fair value | | | 90,625,489 | |
Cash | | | 933,420 | |
Cash collateral on deposit with broker for future contracts | | | 1,192,866 | |
Foreign currency (cost $332,409) | | | 333,656 | |
Receivable for investments sold | | | 406,078 | |
Income receivables | | | 5,566,025 | |
Receivable for fund shares sold | | | 12,730 | |
Income receivable from affiliated investments | | | 161,934 | |
| | | | |
| |
Total assets | | | 1,912,716,855 | |
| | | | |
| |
Liabilities | | | | |
Payable for investments purchased | | | 10,532,236 | |
Payable for fund shares redeemed | | | 620,251 | |
Payable for accumulated variation margin on futures contracts | | | 319,183 | |
Payable to the Adviser | | | 562,183 | |
Payable or custody, fund accounting andsub-administration fees | | | 60,726 | |
Accrued other expenses | | | 147,299 | |
Distribution and service fees | | | 1,248,313 | |
| | | | |
| |
Total liabilities | | | 13,490,191 | |
| | | | |
| | | | |
| |
Net Assets | | $ | 1,899,226,664 | |
| | | | |
| |
Net Assets Consist of: | | | | |
Capital paid in | | $ | 2,012,367,366 | |
Total distributable earnings (loss) | | | (113,140,702 | ) |
| | | | |
| |
Net Assets | | $ | 1,899,226,664 | |
| | | | |
| | | | |
Class 1 | | | | |
Net Assets | | $ | 733,417,327 | |
Shares outstanding ($0.01 par value, unlimited shares authorized) | | | 52,170,987 | |
Net asset value per share | | $ | 14.06 | |
| | | | |
Class 3 | | | | |
Net Assets | | $ | 1,165,809,337 | |
Shares outstanding ($0.01 par value, unlimited shares authorized) | | | 83,197,843 | |
Net asset value per share | | $ | 14.01 | |
The accompanying Notes are an integral part of these financial statements.
| | | | |
| Statement of Assets and Liabilities | | | 17 | |
State Street Total Return V.I.S. Fund
Statement of Operations — For the period ended December 31, 2018
| | | | |
Investment Income | | | | |
Income | | | | |
Dividend | | $ | 34,486,360 | |
Interest | | | 17,367,213 | |
Income from affiliated investments | | | 6,844,696 | |
Less: Foreign taxes withheld | | | (1,791,184 | ) |
| | | | |
Total income | | | 56,907,085 | |
| | | | |
| |
Expenses | | | | |
Advisory and administration fees | | | 7,581,685 | |
Distribution and service fees | | | | |
Class 1 | | | 1,627,685 | |
Class 3 | | | 6,085,590 | |
Directors’ fees | | | 182,899 | |
Custody, fund accounting andsub-administration fees | | | 558,916 | |
Professional fees | | | 344,131 | |
Other expenses | | | 313,232 | |
| | | | |
Total Expenses | | | 16,694,138 | |
| | | | |
Net investment income | | $ | 40,212,947 | |
| | | | |
| |
Net Realized and Unrealized Gain (Loss) on Investments | | | | |
Realized gain (loss) on: | | | | |
Unaffiliated investments | | $ | 406,278,921 | * |
Affiliated investments | | | 393,721 | |
Futures | | | (904,145 | ) |
Foreign currency transactions | | | (239,176 | ) |
Increase (decrease) in unrealized appreciation/depreciation on: | | | | |
Unaffiliated investments | | | (564,426,964 | )** |
Affiliated investrments | | | (13,178,347 | ) |
Futures | | | (655,361 | ) |
Foreign currency translations | | | (39,901 | ) |
| | | | |
| |
Net realized and unrealized gain (loss) on investments | | | (172,771,252 | ) |
| | | | |
| |
Net Decrease in Net Assets Resulting from Operations | | $ | (132,558,305 | ) |
| | | | |
| * | | Includes $119,381 of net realized gains from foreign capital tax gain. |
| ** | | Includes change in accrued foreign capital gains tax of $59,978. |
The accompanying Notes are an integral part of these financial statements.
| | |
| 18 | | Statement of Operations |
State Street Total Return V.I.S. Fund
Statements of Changes in Net Assets
| | | | | | | | |
| | | Year Ended December 31,
2018 | | | Year Ended December 31,
2017 | |
| | | | | | | | |
Increase (Decrease) in Net Assets | | | | | | | | |
| | |
Operations: | | | | | | | | |
Net investment income | | $ | 40,212,947 | | | $ | 38,873,989 | |
Net realized gain (loss) on investments, futures, and foreign currency transactions | | | 405,529,321 | | | | 69,761,604 | |
Net increase (decrease) in unrealized appreciation/depreciation on investments, futures, and foreign currency translations | | | (578,300,573 | ) | | | 223,146,132 | |
| | | | | | | | |
Net increase (decrease) from operations | | | (132,558,305 | ) | | | 331,781,725 | |
| | | | | | | | |
| | |
Distributions to shareholders: | | | | | | | | |
Total distributions | | | | | | | | |
Class 1 | | | (180,207,716 | ) | | | (39,161,707 | ) |
Class 3 | | | (284,866,389 | ) | | | (63,420,807 | ) |
| | | | | | | | |
Total distributions | | | (465,074,105 | ) | | | (102,582,514 | ) |
| | | | | | | | |
Increase (decrease) in assets from operations and distributions | | | (597,632,410 | ) | | | 229,199,211 | |
| | | | | | | | |
| | |
Share transactions: | | | | | | | | |
Proceeds from sale of shares | | | | | | | | |
Class 1 | | | 20,964,003 | | | | 24,414,624 | |
Class 3 | | | 30,059,171 | | | | 14,991,248 | |
Value of distributions reinvested | | | | | | | | |
Class 1 | | | 180,207,716 | | | | 39,161,707 | |
Class 3 | | | 284,866,389 | | | | 63,420,807 | |
Cost of shares redeemed | | | | | | | | |
Class 1 | | | (94,290,832 | ) | | | (85,382,636 | ) |
Class 3 | | | (245,672,997 | ) | | | (270,955,830 | ) |
| | | | | | | | |
Net increase (decrease) from share transactions | | | 176,133,450 | | | | (214,350,080 | ) |
| | | | | | | | |
| | |
Total increase (decrease) in net assets | | | (421,498,960 | ) | | | 14,849,131 | |
| | |
Net Assets | | | | | | | | |
Beginning of year | | | 2,320,725,624 | | | | 2,305,876,493 | |
| | | | | | | | |
| | |
End of year | | $ | 1,899,226,664 | | | $ | 2,320,725,624 | |
| | | | | | | | |
| | |
Changes in Fund Shares | | | | | | | | |
Class 1 | | | | | | | | |
Shares sold | | | 1,059,253 | | | | 1,257,149 | |
Issued for distributions reinvested | | | 12,899,622 | | | | 1,970,896 | |
Shares redeemed | | | (4,756,048 | ) | | | (4,366,225 | ) |
| | | | | | | | |
Net increase (decrease) in fund shares | | | 9,202,827 | | | | (1,138,180 | ) |
| | | | | | | | |
| | |
Class 3 | | | | | | | | |
Shares sold | | | 1,521,278 | | | | 760,162 | |
Issued for distributions reinvested | | | 20,449,848 | | | | 3,201,454 | |
Shares redeemed | | | (12,429,805 | ) | | | (13,986,760 | ) |
| | | | | | | | |
Net increase (decrease) in fund shares | | | 9,541,321 | | | | (10,025,144 | ) |
| | | | | | | | |
|
| For the year ended December 31, 2017, the source of distributions paid to shareholders was (See Note 11 in the Notes to Financial Statements): | |
Net investment income | | | | | | | | |
Class 1 | | | | | | $ | (16,742,272 | ) |
Class 3 | | | | | | | (24,919,903 | ) |
Net realized gains | | | | | | | | |
Class 1 | | | | | | | (22,419,435 | ) |
Class 3 | | | | | | | (38,500,904 | ) |
| | | | | | | | |
Total distributions | | | | | | | (102,582,514 | ) |
| | | | | | | | |
| | |
Undistributed net investment income as of December 31, 2017: | | | | | | $ | (2,525,960 | ) |
The accompanying Notes are an integral part of these financial statements.
| | | | |
| Statements of Changes in Net Assets | | | 19 | |
State Street Total Return V.I.S. Fund
Notes to Financial Statements — December 31, 2018
| 1. | | Organization of the Company |
State Street Variable Insurance Series Funds, Inc. (the “Company”) was incorporated under the laws of the Commonwealth of Virginia on May 14, 1984 and is registered under the Investment Company Act of 1940, as amended (the “1940 Act”), as anopen-end management investment company. The Company is currently composed of the following seven investment portfolios (collectively, the “Funds”): State Street U.S. Equity V.I.S. Fund, State Street S&P 500 Index V.I.S. Fund, State Street Premier Growth Equity V.I.S. Fund, State StreetSmall-Cap Equity V.I.S. Fund, State Street Total Return V.I.S. Fund (the “Fund”), State Street Income V.I.S. Fund and State Street Real Estate Securities V.I.S. Fund. Each Fund is a diversified investment company within the meaning of the 1940 Act.
Shares of the Funds of the Company are offered only to insurance company separate accounts that fund certain variable life insurance contracts and variable annuity contracts.
The Company currently offers two share classes of the Fund as investment options for variable life insurance and variable annuity contracts — Class 1 and Class 3. Class 3 shares were first offered on May 1, 2006, and Fund shares outstanding prior to May 1, 2006 were designated as Class 1 shares. Each class of shares has different fees and expenses, and as a result, each class of shares will have different share price and performance. Not all variable contracts offer each class of the Fund’s shares.
Under the Company’s organizational documents, its officers and directors are indemnified against certain liabilities arising out of the performance of their duties to the Company. Additionally, in the normal course of business, the Company enters into contracts with service providers that contain general indemnification clauses. The Company’s maximum exposure under these arrangements is unknown as this would involve future claims that may be made against the Company that have not yet occurred.
| 2. | | Summary of Significant Accounting Policies |
The following is a summary of significant accounting policies followed by the Company in the preparation of its financial statements:
The preparation of financial statements in accordance with U.S. generally accepted accounting principles (“U.S. GAAP”) requires management to make estimates and assumptions that affect the reported amounts and disclosures in the financial statements. Actual results could differ from those estimates. The Fund is an investment company under U.S. GAAP and follows the accounting and reporting guidance applicable to investment companies.
Security Valuation The Fund’s investments are valued at fair value each day that the New York Stock Exchange (“NYSE”) is open and, for financial reporting purposes, as of the report date should the reporting period end on a day that the NYSE is not open. Fair value is generally defined as the price a fund would receive to sell an asset or pay to transfer a liability in an orderly transaction between market participants at the measurement date. By its nature, a fair value price is a good faith estimate of the valuation in a current sale and may not reflect an actual market price. The investments of the Fund are valued pursuant to the policy and procedures developed by the Oversight Committee (the “Committee”) and approved by the Company’s Board of Directors (the “Board”). The Committee provides oversight of the valuation of investments for the Fund. The Board has responsibility for overseeing the determination of the fair value of investments.
Valuation techniques used to value the Fund’s investments by major category are as follows:
| | • | | Equity investments (including preferred stocks and registered investment companies that are exchange traded funds) traded on a recognized securities exchange for which market quotations are readily available are valued at the last sale price or official closing price, as applicable, on the primary market or exchange on which they trade. Equity investments traded on a recognized exchange for which there were no sales on that day are valued at the last published sale price or at fair value. |
| | • | | Investments in registered investment companies (including money market funds) or other unitized pooled investment vehicles that are not traded on an exchange are valued at that day’s published net asset value (“NAV”) per share or unit. |
| | • | | Government and municipal fixed income securities are generally valued using quotations from independent pricing services or brokers. Certain government inflation-indexed securities may require a calculated fair valuation as the cumulative inflation is contained within the price provided by the pricing service or broker. For these securities, the inflation component of the price is “cleaned” from the pricing service or broker price utilizing the published inflation factors in order to ensure proper accrual of income. |
| | |
| 20 | | Notes to Financial Statements |
State Street Total Return V.I.S. Fund
Notes to Financial Statements, continued — December 31, 2018
| | • | | Debt obligations (including short term investments and convertible debt securities) are valued using quotations from independent pricing services or brokers or are generally valued at the last reported evaluated prices. |
| | • | | Exchange-traded futures contracts are valued at the closing settlement price on the primary market on which they are traded most extensively. Exchange-traded futures contracts traded on a recognized exchange for which there were no sales on that day are valued at the last reported sale price obtained from independent pricing services or brokers or at fair value. |
In the event prices or quotations are not readily available or that the application of these valuation methods results in a price for an investment that is deemed to be not representative of the fair value of such investment, fair value will be determined in good faith by the Committee, in accordance with the valuation policy and procedures approved by the Board.
A “significant event” is an event that the Board believes, with a reasonably high degree of certainty, has caused the closing market prices of a Fund’s portfolio securities to no longer reflect their value at the time of the Fund’s net asset value calculation. Fair value may be determined using an independent fair value service under valuation procedures approved by the Board. The independent fair value service takes into account multiple factors including, but not limited to, movements in the U.S. securities markets, certain depositary receipts, futures contracts and foreign currency exchange rates that have occurred subsequent to the close of foreign securities exchanges. The use of the independent fair value service or alternative fair valuation methods would result in the investments being classified within Level 2 of the fair value hierarchy.
The Fund values its assets and liabilities at fair value using a fair value hierarchy consisting of three broad levels that prioritize the inputs to valuation techniques giving the highest priority to readily available unadjusted quoted prices in active markets for identical assets or liabilities (Level 1 measurements) and the lowest priority to unobservable inputs (Level 3 measurements) when market prices are not readily available or reliable. The categorization of a value determined for an investment within the hierarchy is based upon the pricing transparency of the investment and is not necessarily an indication of the risk associated with investing in it.
The three levels of the fair value hierarchy are as follows:
| | • | | Level 1 — Unadjusted quoted prices in active markets for an identical asset or liability; |
| | • | | Level 2 — Inputs other than quoted prices included within Level 1 that are observable for the asset or liability either directly or indirectly, including quoted prices for similar assets or liabilities in active markets, quoted prices for identical or similar assets or liabilities in markets that are not considered to be active, inputs other than quoted prices that are observable for the asset or liability (such as exchange rates, financing terms, interest rates, yield curves, volatilities, prepayment speeds, loss severities, credit risks and default rates) or other market-corroborated inputs; and |
| | • | | Level 3 — Unobservable inputs for the asset or liability, including the Committee’s assumptions used in determining the fair value of investments. |
The value of the Fund’s investments according to the fair value hierarchy as of December 31, 2018 is disclosed in the Fund’s Summary Schedule of Investments.
Investment Transactions and Income Recognition Investment transactions are accounted for on trade date for financial reporting purposes. Realized gains and losses from the sale or disposition of investments and foreign exchange transactions, if any, are determined using the identified cost method.
Dividend income and capital gain distributions, if any, are recognized on theex-dividend date, net of any foreign taxes withheld at source, if any.
Interest income is recorded daily on an accrual basis. All premiums and discounts are amortized/accreted for financial reporting purposes.
Non-cash dividends received in the form of stock are recorded as dividend income at fair value.
Expenses Certain expenses, which are directly identifiable to a specific Fund, are applied to the Fund within the Company. Other expenses which cannot be attributed to a specific Fund are allocated in such a manner as deemed equitable, taking into consideration the nature and type of expense and the relative net assets of the Fund within the Company.
| | | | |
| Notes to Financial Statements | | | 21 | |
State Street Total Return V.I.S. Fund
Notes to Financial Statements, continued — December 31, 2018
Foreign Currency Translation The accounting records of the Fund are maintained in U.S. dollars. Foreign currencies as well as investment securities and other assets and liabilities denominated in a foreign currency are translated to U.S. dollars using exchange rates at period end. Purchases and sales of securities, income receipts and expense payments denominated in foreign currencies are translated into U.S. dollars at the prevailing exchange rate on the respective dates of the transactions.
The effects of exchange rate fluctuations on investments are included with the net realized and unrealized gain (loss) on investment securities. Other foreign currency transactions resulting in realized and unrealized gain (loss) are disclosed separately.
Foreign Taxes The Fund may be subject to foreign taxes (a portion of which may be reclaimable) on income, stock dividends, realized and unrealized capital gains on investments or certain foreign currency transactions. Foreign taxes are recorded in accordance with SSGA Funds Management, Inc.’s (the “Adviser” or “SSGA FM”) understanding of the applicable foreign tax regulations and rates that exist in the foreign jurisdictions in which the Fund invests. These foreign taxes, if any, are paid by the Fund and are reflected in the Statement of Operations, if applicable. Foreign taxes payable or deferred as of December 31, 2018, if any, are disclosed in the Fund’s Statement of Assets and Liabilities.
Distributions The Fund declares and pays any dividends from net investment income annually.
Net realized capital gains, if any, are distributed annually, unless additional distributions are required for compliance with applicable tax regulations. The amount and character of income and capital gains to be distributed are determined in accordance with applicable tax regulations which may differ from net investment income and realized gains recognized for U.S. GAAP purposes.
| 3. | | Securities and Other Investments |
Delayed Delivery Transactions and When-Issued Securities During the fiscal year ended December 31, 2018, the Fund transacted in securities on a delayed delivery or when-issued basis. Payment and delivery may take place after the customary settlement period for that security. The price of the underlying securities and the date when the securities will be delivered and paid for are fixed at the time the transaction is negotiated. The securities purchased on a delayed delivery or when-issued basis are identified as such in the Fund’s Summary Schedule of Investments. The Fund may receive compensation for interest forgone in the purchase of a delayed delivery or when-issued security. With respect to such purchase commitments, the Fund identifies securities as segregated in its records with a value at least equal to the amount of the commitment. Losses may arise due to changes in the value of the underlying securities or if the counterparty does not perform under the contract’s terms, or if the issuer does not issue the securities due to political, economic or other factors.
To-Be-Announced Transactions The Fund may seek to obtain exposure to U.S. agency mortgage pass-through securities through the use of“to-be-announced” or “TBA transactions.” “TBA” refers to a commonly used mechanism for the forward settlement of U.S. agency mortgage pass-through securities. In a TBA transaction, the buyer and seller decide on general trade parameters, such as agency, settlement date, coupon, and price.
The Fund may use TBA transactions to “roll over” such agreements prior to the settlement date. This type of TBA transaction is sometimes known as a “TBA roll.” In a TBA roll, the Fund generally will sell the obligation to purchase the pools stipulated in the TBA agreement prior to the settlement date and will enter into a new TBA agreement for future delivery of pools of mortgage pass-through securities. The Fund may also enter into TBA agreements and settle such transactions on the stipulated settlement date by accepting actual receipt or delivery of the pools of mortgage pass-through securities.
Default by or bankruptcy of a counterparty to a TBA transaction would expose the Fund to possible loss because of adverse market action, expenses or delays in connection with the purchase or sale of the pools of mortgage pass-through securities specified in the TBA transaction. To minimize this risk, the Fund will enter into TBA transactions only with established counterparties. The Fund’s use of “TBA rolls” may impact portfolio turnover, transaction costs and capital gain distributions to shareholders.
| | |
| 22 | | Notes to Financial Statements |
State Street Total Return V.I.S. Fund
Notes to Financial Statements, continued — December 31, 2018
| 4. | | Derivative Financial Instruments |
Futures Contracts The Fund may enter into futures contracts to meet the Fund’s objectives. A futures contract is a standardized, exchange-traded agreement to buy or sell a financial instrument at a set price on a future date. Upon entering into a futures contract, the Fund is required to deposit with the broker, cash or securities in an amount equal to the minimum initial margin requirements of the clearing house. Subsequent payments are made or received by the Fund equal to the daily change in the contract value and are recorded as variation margin receivable or payable with a corresponding offset to unrealized gains or losses. The Fund recognizes a realized gain or loss when the contract is closed.
Losses may arise if the value of a futures contract decreases due to unfavorable changes in the market rates or values of the underlying instrument during the term of the contract or if the counterparty does not perform under the contract. The use of futures contracts also involves the risk that the movements in the price of the futures contracts do not correlate with the movement of the assets underlying such contracts.
For the fiscal year ended December 31, 2018, the Fund entered into futures contracts for cash equitization.
The following tables summarize the value of the Fund’s derivative instruments as of December 31, 2018 and the related location in the accompanying Statement of Assets and Liabilities and Statement of Operations, presented by primary underlying risk exposure:
Liability Derivatives
| | | | | | | | | | | | | | | | | | | | | | | | |
| | | Interest
Rate
Contracts
Risk | | | Foreign
Exchange
Contracts
Risk | | | Credit
Contracts
Risk | | | Equity
Contracts
Risk | | | Commodity
Contracts
Risk | | | Total | |
| | | | | | | | | | | | | | | | | | | | | | | | |
State Street Total Return V.I.S. Fund | |
Futures Contracts | | $ | — | | | $ | — | | | $ | — | | | $ | (319,183 | ) | | $ | — | | | $ | (319,183 | ) |
Realized Gain (Loss)
| | | | | | | | | | | | | | | | | | | | | | | | |
| | | Interest
Rate
Contracts
Risk | | | Foreign
Exchange
Contracts
Risk | | | Credit
Contracts
Risk | | | Equity
Contracts
Risk | | | Commodity
Contracts
Risk | | | Total | |
| | | | | | | | | | | | | | | | | | | | | | | | |
State Street Total Return V.I.S. Fund | |
Futures Contracts | | $ | — | | | $ | — | | | $ | — | | | $ | (904,145 | ) | | $ | — | | | $ | (904,145 | ) |
Net Change in Unrealized Appreciation (Depreciation)
| | | | | | | | | | | | | | | | | | | | | | | | |
| | | Interest
Rate
Contracts
Risk | | | Foreign
Exchange
Contracts
Risk | | | Credit
Contracts
Risk | | | Equity
Contracts
Risk | | | Commodity
Contracts
Risk | | | Total | |
| | | | | | | | | | | | | | | | | | | | | | | | |
State Street Total Return V.I.S. Fund | |
Futures Contracts | | $ | — | | | $ | — | | | $ | — | | | $ | (655,361 | ) | | $ | — | | | $ | (655,361 | ) |
| 5. | | Fees and Transactions with Affiliates |
Advisory Fee SSGA FM, a registered investment adviser, was retained by the Board to act as investment adviser and administrator of the Fund. SSGA FM’s compensation for investment advisory and administrative services (“Management Fee”) is paid monthly based on the average daily net assets of the Fund at an annualized rate of 0.35 %.
Investor Service Plan — Class 1 and Class 3 Shares The Company adopted an Investor Service Plan (the “Service Plan”) on December 9, 2005 for Class 1 shares and on May 1, 2009 for Class 3 shares of the Fund. The Service Plan was not adopted pursuant to Rule12b-1 under the 1940 Act. Each Service Plan provides that during any fiscal year, the amount of compensation paid under the Service Plan by the Fund Class 1 or Class 3 shares may not exceed the annual rate of 0.20% of the average daily net assets of the Fund attributable to each such share class.
| | | | |
| Notes to Financial Statements | | | 23 | |
State Street Total Return V.I.S. Fund
Notes to Financial Statements, continued — December 31, 2018
Distribution and Shareholder Service(12b-1) Fees The Company has adopted a Distribution and Service(12b-1) Plan (the“12b-1 Plan”) pursuant to Rule12b-1 under the 1940 Act with respect to each of Class 1 and Class 3 shares of the Fund. Under the12b-1 Plan for Class 1 shares that became effective May 1, 2009, payments made under the Class 1 Investor Service Plan are covered in the event that any portion of compensation paid pursuant to the Class 1 Investor Service Plan is determined to be an indirect use of the assets attributable to the Class 1 shares to finance distribution of such shares. Under the12b-1 Plan for Class 3 shares, the Company, on behalf of the Fund, may have compensated State Street Global Advisors Funds Distributors, LLC (“SSGA FD”), the distributor of the shares of the Fund for certain sales services provided by SSGA FD or other broker dealers and investor services provided by SSGA FD or other service providers relating to the Fund’s Class 3 shares, including services to owners or prospective owners of variable contracts issued by insurance companies that offer Class 3 shares as an investment option under such variable contracts. The amount of compensation paid under the12b-1 Plan for Class 3 shares may not exceed 0.25% of the average daily net assets of the Fund attributable to such share class. The12b-1 Plan continues in effect from year to year for so long as such continuance is approved annually by the Board, including by those Directors who are not interested persons of the Company and who have no direct or indirect financial interest in the operation of the12b-1 Plan or in any agreement related to it. In addition, the Class 312b-1 Plan covers payments made under the Class 3 Investor Service Plan in the event that any portion of compensation paid pursuant to the Class 3 Investor Service Plan is determined to be an indirect use of the assets attributable to the Class 3 shares to finance distribution of such shares.
Custody, Fund Accounting andSub-Administration Fees State Street Bank and Trust Company (“State Street”) serves as the custodian, fund accountant andsub-administrator to the Fund. Amounts paid by the Fund to State Street for performing such services are included custody, fund accounting andsub-administration fees on the Statement of Operations.
Other Transactions with Affiliates The Fund may invest in affiliated entities, including securities issued by State Street, affiliated funds, or entities deemed to be affiliates as a result of the Fund owning more than five percent of the entity’s voting securities or outstanding shares. Amounts relating to these transactions during the fiscal year ended December 31, 2018 are disclosed in the Summary Schedule of Investments.
The fees and expenses of the Company’s directors who are not “interested persons” of the Company, as defined in the 1940 Act (“Independent Directors”) are paid directly by the Fund. The Independent Directors are reimbursed for travel and otherout-of-pocket expenses in connection with meeting attendance and industry seminars.
| 7. | | Investment Transactions |
Purchases and sales of investments (excludingin-kind transactions, short term investments and derivative contracts) for the fiscal year ended December 31, 2018 were as follows:
| | | | | | |
| U.S. Government Securities | |
| Purchases | | | Sales | |
| $ | 507,170,358 | | | $ | 493,086,655 | |
|
| Non-U.S. Government Securities | |
| Purchases | | | Sales | |
| $ | 1,541,284,759 | | | $ | 1,753,393,026 | |
The Fund has qualified and intends to continue to qualify as a regulated investment company under Subchapter M of the Internal Revenue Code of 1986, as amended. The Fund will not be subject to federal income taxes to the extent it distributes its taxable income, including any net realized capital gains, for each fiscal year. Therefore, no provision for federal income tax is required.
The Fund files federal and various state and local tax returns as required. No income tax returns are currently under examination. Generally, the federal returns are subject to examination by the Internal Revenue Service for a period of three years from date of filing, while the state returns may remain open for an additional year depending upon jurisdiction. SSGA FM has analyzed the Fund’s tax positions taken on tax returns for all open years and does not believe there are any uncertain tax positions that would require recognition of a tax liability.
| | |
| 24 | | Notes to Financial Statements |
State Street Total Return V.I.S. Fund
Notes to Financial Statements, continued — December 31, 2018
Distributions to shareholders are recorded onex-dividend date. Income dividends and gain distributions are determined in accordance with income tax rules and regulations, which may differ from generally accepted accounting principles. Certain capital accounts in the financial statements have been adjusted for permanentbook-tax differences. These adjustments have no impact on net asset values or results of operations. Temporarybook-tax differences will reverse in the future. These book tax differences are primarily due to differing treatments for foreign currency gains and losses, litigation, capital gain tax, passive foreign investment company gains and losses, partnership basis adjustments, future contracts, paydown losses, return of capital distributions received, and wash sale loss deferrals.
The tax character of distributions paid during the year ended December 31, 2018 was as follows:
| | | | | | | | | | | | | |
Ordinary
Income | | Long-Term
Capital Gains | | Total |
| | | | | | | | | | | | | | |
| | $ | 42,336,791 | | | | $ | 422,737,314 | | | | $ | 465,074,105 | |
The tax character of distributions paid during the year ended December 31, 2017 was as follows:
| | | | | | | | | | | | | |
Ordinary
Income | | Long-Term
Capital Gains | | Total |
| | | | | | | | | | | | | | |
| | $ | 41,662,175 | | | | $ | 60,920,339 | | | | $ | 102,582,514 | |
At December 31, 2018, the components of distributable earnings on a tax basis were as follows:
| | | | | | | | | | | | | | | | | | | | | | | | | | | | |
Undistributed
Ordinary
Income | | Capital Loss
Carryforwards | | Undistributed
long term gain | | Net Unrealized
Gains (Losses) | | Qualified
Late-Year
Losses* | | Total |
| | | | | | | | | | | | | | | | | | | | | | | | | | | | | |
| | $ | — | | | | $ | — | | | | $ | — | | | | $ | (91,240,515 | ) | | | $ | (21,900,187 | ) | | | $ | (113,140,702 | ) |
| | * | The Fund has elected to defer certain qualified late-year losses in the next taxable year. |
As of December 31, 2018, gross unrealized appreciation and gross unrealized depreciation of investments and other financial instruments based on cost for federal income tax purposes were as follows:
| | | | | | | | | | | | | | | | | | |
Tax
Cost | | Gross
Unrealized
Appreciation | | Gross
Unrealized
Depreciation | | Net Unrealized
Appreciation
(Depreciation) |
| | | | | | | | | | | | | | | | | | | |
| | $ | 1,995,025,114 | | | | $ | 53,096,823 | | | | $ | 144,331,359 | | | | $ | (91,234,536 | ) |
The Fund and other affiliated funds (each, a “Participant” and collectively, the “Participants”) participate in a $500 million revolving credit facility provided by a syndication of banks under which the Participants may borrow to fund shareholder redemptions. This agreement expires in October 2019 unless otherwise extended or renewed.
The Participants are charged an annual commitment fee which is calculated based on the unused portion of the shared credit line. Commitment fees are allocated among each of the Participants based on relative net assets. Commitment fees are ordinary fund operating expenses paid by the Adviser. A Participant incurs and pays the interest expense related to its borrowing. Interest is calculated at a rate per annum equal to the sum of 1% plus the greater of the New York Fed Bank Rate and1-month LIBOR rate.
The Fund had no outstanding loans as of December 31, 2018.
Concentration Risk As a result of the Fund’s ability to invest a large percentage of its assets in obligations of issuers within the same country, state, region, currency or economic sector, an adverse economic, business or political development may affect the value of the Fund’s investments more than if the Fund was more broadly diversified.
Interest Rate Risk Is the risk that fixed income securities will decline in value because of changes in interest rates. Bond prices generally rise when interest rates decline and generally decline when interest rates rise. Although governmental
| | | | |
| Notes to Financial Statements | | | 25 | |
State Street Total Return V.I.S. Fund
Notes to Financial Statements, continued — December 31, 2018
financial regulators, including the U.S. Federal Reserve, have taken steps to maintain historically low interest rates, the U.S. Federal Reserve has recently begun to raise interest rates and may continue to do so. Thus, the Fund currently faces a heightened level of interest rate risk.
Foreign and Emerging Markets Risk Investing in foreign markets involves risks and considerations not typically associated with investing in the U.S. Foreign securities may be subject to risk of loss because of government regulation, economic, political and social instability in the countries in which the Fund invests. Foreign markets may be less liquid than investments in the U.S. and may be subject to the risks of currency fluctuations. To the extent that the Fund invests in securities of issuers located in emerging markets, these risks may be even more pronounced.
Market and Credit Risk In the normal course of business, the Fund trades financial instruments and enters into financial transactions where risk of potential loss exists due to changes in the general economic conditions and fluctuations of the market (market risk). Additionally, the Fund may also be exposed to credit risk in the event that an issuer or guarantor fails to perform or that an institution or entity with which the Fund has unsettled or open transactions defaults.
| 11. | | New and Recent Accounting Pronouncements |
In August 2018, the Securities and Exchange Commission released its Final Rule on Disclosure Update and Simplification (the “Final Rule”) which is intended to simplify an issuer’s disclosure compliance efforts by removing redundant or outdated disclosure requirements without significantly altering the mix of information provided to investors. The Fund has adopted the Final Rule for the current period with the most notable impacts being that the Fund is no longer required to present components of distributable earnings on the Statement of Assets and Liabilities or the sources of distributions to shareholders and the amount of undistributed net investment income on the Statement of Changes in Net Assets.
In March 2017, the FASB issued ASUNo. 2017-08, Receivables — Nonrefundable Fees and Other Costs (Subtopic310-20): Premium Amortization on Purchased Callable Debt Securities. The amendments in the ASU shorten the amortization period for certain callable debt securities, held at a premium, to be amortized to the earliest call date. The ASU does not require an accounting change for securities held at a discount; which continues to be amortized to maturity. The ASU is effective for fiscal years and interim periods within those fiscal years beginning after December 15, 2018. Management is currently evaluating the impact, if any, of applying this provision.
Management has evaluated the impact of all subsequent events on the Fund through the date on which the financial statements were available to be issued and has determined that there were no subsequent events requiring adjustment or disclosure in the financial statements.
| | |
| 26 | | Notes to Financial Statements |
State Street Total Return V.I.S. Fund
Report of Independent Registered Public Accounting Firm
To the Shareholders and the Board of Directors of State Street Total Return V.I.S. Fund
Opinion on the Financial Statements and Schedule of Investments in Securities
We have audited the accompanying statement of assets and liabilities of State Street Total Return V.I.S. Fund (the “Fund”) (one of the funds constituting State Street Variable Insurance Series Funds, Inc. (the “Company”)), including the summary schedule of investments, as of December 31, 2018, and the related statement of operations for the year then ended, the statement of changes in net assets for each of the two years in the period then ended, the financial highlights for each of the three years in the period then ended and the related notes (collectively referred to as the “financial statements”) (the financial statements are included in Item 1 of this Form N-CSR), and the schedule of investments in securities as of December 31, 2018 (included in Item 6 of this Form N-CSR). In our opinion, the financial statements and schedule of investments in securities present fairly, in all material respects, the financial position of the Fund (one of the funds constituting State Street Variable Insurance Series Funds, Inc.) at December 31, 2018, the results of its operations for the year then ended, the changes in its net assets for each of the two years in the period then ended and its financial highlights for each of the three years in the period then ended, in conformity with U.S. generally accepted accounting principles. The financial highlights for periods ended prior to January 1, 2016 were audited by another independent registered public accounting firm whose report, dated February 19, 2016, expressed an unqualified opinion on those financial highlights.
Basis for Opinion
These financial statements and schedule of investments in securities are the responsibility of the Company’s management. Our responsibility is to express an opinion on the Fund’s financial statements and schedule of investments in securities based on our audits. We are a public accounting firm registered with the Public Company Accounting Oversight Board (United States) (“PCAOB”) and are required to be independent with respect to the Company in accordance with the U.S. federal securities laws and the applicable rules and regulations of the Securities and Exchange Commission and the PCAOB.
We conducted our audits in accordance with the standards of the PCAOB. Those standards require that we plan and perform the audit to obtain reasonable assurance about whether the financial statements and schedule of investments in securities are free of material misstatement, whether due to error or fraud. The Company is not required to have, nor were we engaged to perform, an audit of the Company’s internal control over financial reporting. As part of our audits we are required to obtain an understanding of internal control over financial reporting, but not for the purpose of expressing an opinion on the effectiveness of the Company’s internal control over financials reporting. Accordingly, we express no such opinion.
Our audits included performing procedures to assess the risks of material misstatement of the financial statements and schedule of investments in securities, whether due to error or fraud, and performing procedures that respond to those risks. Such procedures included examining, on a test basis, evidence regarding the amounts and disclosures in the financial statements and schedule of investments in securities. Our procedures included confirmation of securities owned as of December 31, 2018, by correspondence with the custodian, brokers and others or by other appropriate auditing procedures where replies from brokers and others were not received. Our audits also included evaluating the accounting principles used and significant estimates made by management, as well as evaluating the overall presentation of the financial statements and schedule of investments in securities. We believe that our audits provide a reasonable basis for our opinion.

We have served as the auditor of one or more State Street Global Advisors investment companies since 2000.
Boston, Massachusetts
February 19, 2019
| | | | |
| Report of Independent Registered Public Accounting Firm | | | 27 | |
State Street Total Return V.I.S. Fund
Tax Information — December 31, 2018 (Unaudited)
For federal income tax purposes, the following information is furnished with respect to the distributions of the Fund for its fiscal year ended December 31, 2018.
Dividends Received Deduction
The Fund reports the maximum amount allowable of its net taxable income as eligible for the corporate dividends received deduction.
Long Term Capital Gain Distributions
Long term capital gains dividends were paid from the Fund during the year ended December 31, 2018 in the amount of $422,737,314.
State Street Total Return V.I.S. Fund
Special Meeting of Shareholders — Voting Results (Unaudited)
A special meeting of shareholders of State Street Variable Insurance Series Funds, Inc. (the “Company”) was held on January 10, 2019 to elect the following six nominees as Directors of the Company: Michael F. Holland, Michael A. Jessee, Ellen M. Needham, Patrick J. Riley, Richard D. Shirk and Rina K. Spence. At the meeting the following votes were recorded:
| | | | | | | | |
| Nominee | | Shares For | | | Shares Withheld | |
Michael F. Holland | | | 91,260,156.834 | | | | 2,655,810.669 | |
Michael A. Jessee | | | 91,345,936.433 | | | | 2,570,031.070 | |
Ellen M. Needham | | | 91,642,423.619 | | | | 2,273,543.884 | |
Patrick J. Riley | | | 91,136,965.946 | | | | 2,779,001.557 | |
Richard D. Shirk | | | 91,293,712.247 | | | | 2,622,255.256 | |
Rina K. Spence | | | 90,957,562.624 | | | | 2,958,404.879 | |
The other Directors whose term of office continued after the meeting are as follows: Jeanne M. La Porta, John R. Costantino and Donna M. Rapaccioli.
| | | | |
| Special Meeting of Shareholders — Voting Results | | | 29 | |
State Street Total Return V.I.S. Fund
Other Information — December 31, 2018 (Unaudited)
| | | | | | | | | | | | |
| | | | | | |
Name, Address, and Year of Birth | | Position(s) Held
with Fund | | Term of
Office and
Length of
Time Served | | Principal Occupation
During Past Five Years and
Relevant Experience | | Number of
Funds in
Fund
Complex
Overseen
by Director† | | | Other Directorships
Held by Director During Past Five Years |
INDEPENDENT DIRECTORS | | | |
Michael F. Holland c/o SSGA Funds Management, Inc. One Iron Street Boston, MA 02210 YOB: 1944 | | Director and Co-Chairperson of the Board | | Term: Indefinite Elected: 1/19 | | Chairman, Holland & Company L.L.C. (investment adviser) (1995 – present). | | | 67 | | | Director, the Holland Series Fund, Inc.; Director, The China Fund, Inc.; Director, The Taiwan Fund, Inc. (2007-2017); Director, Reaves Utility Income Fund, Inc.; and Director, Blackstone/GSO Loans (and Real Estate) Funds. |
| | | | | | | | | | | | | |
Patrick J. Riley c/o SSGA Funds Management, Inc. One Iron Street Boston, MA 02210 YOB: 1948 | | Director and Co-Chairperson of the Board | | Term: Indefinite Elected: 1/19 | | 2002 to May 2010, Associate Justice of the Superior Court, Commonwealth of Massachusetts; 1985 to 2002, Partner, Riley, Burke & Donahue, L.L.P. (law firm); 1998 to Present, Independent Director, State Street Global Advisers Ireland, Ltd. (investment company); 1998 to Present, Independent Director, SSGA Liquidity plc (formerly, SSGA Cash Management Fund plc); January 2009 to Present, Independent Director, SSGA Fixed Income plc; and January 2009 to Present, Independent Director, SSGA Qualified Funds PLC. | | | 67 | | | Board Director and Chairman, SPDR Europe 1PLC Board (2011 – Present); Board Director and Chairman, SPDR Europe II, PLC (2013 – Present). |
| | | | | | | | | | | | | |
John R. Costantino c/o SSGA Funds Management, Inc. One Iron Street Boston, MA 02210 YOB: 1946 | | Director and Co-Chairperson of the Qualified Legal and Compliance Committee | | Term: Indefinite Elected: 1997 | | Managing General Partner, NGN Capital LLC (2006 – present); and Managing Director, Vice President of Walden Capital Management (1996 – present). | | | 67 | | | Director of Kleinfeld Bridal Corp. (March 2016 – present);Trustee of Neuroscience Research Institute (1986 – present); Trustee of Fordham University (1989 – 1995 and 2001 – 2007) and Trustee Emeritus (2007 – present); Trustee of GE Funds (1993 – February 2011); Director of Artes Medical (2006 – 2008); and Trustee of Gregorian University Foundation (1992 – 2007). |
| | | | | | | | | | | | | |
Donna M. Rapaccioli c/o SSGA Funds Management, Inc. One Iron Street Boston, MA 02210 YOB: 1962 | | Director and Co-Chairperson of the Audit Committee | | Term: Indefinite Elected: 1/12 | | Dean of the Gabelli School of Business (2007 – present) and Accounting Professor (1987 – present) at Fordham University. | | | 67 | | | Director- Graduate Management Admissions Council (2015 – present); Trustee of Emmanuel College (2010 – present). |
State Street Total Return V.I.S. Fund
Other Information, continued — December 31, 2018 (Unaudited)
| | | | | | | | | | | | |
| | | | | | |
Name, Address, and Year of Birth | | Position(s) Held
with Fund | | Term of
Office and
Length of
Time Served | | Principal Occupation
During Past Five Years and
Relevant Experience | | Number of
Funds in
Fund
Complex
Overseen
by Director† | | | Other Directorships
Held by Director During Past Five Years |
INDEPENDENT DIRECTORS (continued) | | | |
Richard D. Shirk c/o SSGA Funds Management, Inc. One Iron Street Boston, MA 02210 YOB: 1945 | | Director and Co-Chairperson of the Qualified Legal and Compliance Committee | | Term: Indefinite Elected: 1/19 | | March 2001 to April 2002, Chairman (1996 to March 2001, President and Chief Executive Officer), Cerulean Companies, Inc. (holding company) (Retired); 1992 to March 2001, President and Chief Executive Officer, Blue Cross Blue Shield of Georgia (health insurer, managed healthcare). | | | 67 | | | 1998 to December 2008, Chairman, Board Member and December 2008 to Present, Investment Committee Member, Healthcare Georgia Foundation (private foundation); September 2002 to 2012, Lead Director and Board Member, Amerigroup Corp. (managed health care); 1999 to 2013, Board Member and (since 2001) Investment Committee Member, Woodruff Arts Center; and 2003 to 2009, Trustee, Gettysburg College; Board member, Aerocare Holdings, Regenesis Biomedical Inc. |
| | | | | | | | | | | | | |
Rina K. Spence c/o SSGA Funds Management, Inc. One Iron Street Boston, MA 02210 YOB: 1948 | | Director andCo-Chairperson of the Audit Committee, Chairperson of the Nominating Committee and Chairperson of the Governance Committee | | Term: Indefinite Elected: 1/19 | | President of SpenceCare International LLC (international healthcare consulting) (1999 – present); Chief Executive Officer, IEmily.com (health internet company) (2000 – 2001); Chief Executive Officer of Consensus Pharmaceutical, Inc. (1998 – 1999); Founder, President and Chief Executive Officer of Spence Center for Women’s Health (1994 –1998); President and CEO, Emerson Hospital (1984 – 1994); Honorary Consul for Monaco in Boston (2015 – present). | | | 67 | | | None |
| | | | | | | | | | | | | |
Michael A. Jessee c/o SSGA Funds Management, Inc. One Iron Street Boston, MA 02210 YOB: 1946 | | Director andCo-Chairperson of the Valuation Committee | | Term: Indefinite Elected: 1/19 | | Retired; formerly, President and Chief Executive Officer of the Federal Home Loan Bank of Boston (1989 – 2009); Trustee, Randolph-Macon College (2004 – 2016). | | | 67 | | | None |
State Street Total Return V.I.S. Fund
Other Information, continued — December 31, 2018 (Unaudited)
| | | | | | | | | | | | |
| | | | | | |
Name, Address, and Year of Birth | | Position(s) Held
with Fund | | Term of
Office and
Length of
Time Served | | Principal Occupation
During Past Five Years and
Relevant Experience | | Number of
Funds in
Fund
Complex
Overseen
by Director† | | | Other Directorships
Held by Director During Past Five Years |
INTERESTED DIRECTORS(1) |
Jeanne M. La Porta(2) SSGA Funds Management, Inc. 1600 Summer St. Stamford, CT 06905 YOB: 1965 | | Director and President | | Time Indefinite Elected: 3/14 | | Senior Managing Director at State Street Global Advisors (July 2016 – present); Director of State Street Global Advisors Funds Distributors, LLC (May 2017 – present); President of GE Retirement Savings Plan Funds (July 2016 – present); Senior Vice President and Commercial Operations Leader at GE Asset Management Incorporated (“GEAM”) (March 2014 – July 2016); President of State Street Institutional Funds and State Street Variable Insurance Series Funds, Inc. (April 2014 – present); President and Trustee. | | | 18 | | | None |
| | | | | | | | | | | | | |
Ellen M. Needham(3) SSGA Funds Management, Inc. One Iron Street Boston, MA 02210 YOB: 1967 | | Director | | Time Indefinite Elected: 1/19 | | President and Director, SSGA FM (2001 – present)*; Senior Managing Director, State Street Global Advisors (1992 – present)*; Director, State Street Global Advisors Funds Distributors, LLC (May 2017 – present).* | | | 67 | | | None |
| (1) | | The individuals listed below are Directors who are “interested persons,” as defined in the 1940 Act, of the Company (“Interested Directors”). |
| (2) | | Ms. La Porta is an Interested Director because of her employment by SSGA Funds Management, Inc., an affiliate of the Company. |
| (3) | | Ms. Needham is an Interested Director because of her employment by SSGA Funds Management, Inc., an affiliate of the Company. |
| * | | Served in various capacities and/or with various affiliated entities during noted time period |
| † | | For the purpose of determining the number of portfolios overseen by the Directors, “Fund Complex” comprises registered investment companies for which SSGA FM serves as investment adviser. |
State Street Total Return V.I.S. Fund
Other Information, continued — December 31, 2018 (Unaudited)
The following lists the principal officers for the Company, as well as their mailing addresses and ages, positions with the Company and length of time served, and present and principal occupations:
| | | | | | |
| | | | |
Name,
Address, and
Year of Birth | | Position(s) Held
with Fund | | Term of
Office and
Length of
Time Served | | Principal Occupation
During Past Five Years |
OFFICERS: |
Jeanne M. La Porta SSGA Funds Management, Inc. 1600 Summer St. Stamford, CT 06905 YOB: 1965 | | President and Director | | Term: Indefinite Elected: 3/14 | | Senior Managing Director at State Street Global Advisors (July 2016 – present); Director of State Street Global Advisors Funds Distributors, LLC (May 2017 – present); President of GE Retirement Savings Plan Funds (July 2016 – present); Senior Vice President and Commercial Operations Leader at GE Asset Management Incorporated (“GEAM”) (March 2014 – July 2016); President of State Street Institutional Funds and State Street Variable Insurance Series Funds, Inc. (April 2014 – present); President and Trustee. |
| | | | | | | |
Arthur A. Jensen SSGA Funds Management, Inc. 1600 Summer Street Stamford, CT 06905 YOB: 1966 | | Treasurer | | Term: Indefinite Elected: 6/11 | | Vice President, State Street Global Advisors and SSGA Funds Management, Inc. (July 2016 – present); Deputy Treasurer of Elfun Funds (July 2016 – present); Treasurer of State Street Institutional Funds, State Street Variable Insurance Series Funds, Inc. and GE Retirement Savings Plan Funds (June 2011 – present); Treasurer of Elfun Funds (June 2011 – July 2016); Mutual Funds Controller of GE Asset Management Incorporated (April 2011 – July 2016). |
Brian Harris SSGA Funds Management, Inc. One Iron Street Boston, MA 02210 YOB: 1973 | | Chief Compliance Officer and Anti-Money Laundering Officer | | Term: Indefinite Elected: 6/16 | | Managing Director, State Street Global Advisors and SSGA Funds Management, Inc. (2013 – Present); Senior Vice President and Global Head of Investment Compliance, BofA Global Capital Management (September 2010 – May 2013). |
| | | | | | | |
Bruce S. Rosenberg SSGA Funds Management, Inc. One Iron Street Boston, MA 02210 YOB: 1961 | | Assistant Treasurer | | Term: Indefinite Elected: 6/16 | | Managing Director, State Street Global Advisors and SSGA Funds Management, Inc. (July 2015 – present); Director, Credit Suisse (April 2008 – July 2015). |
| | | | | | | |
Ann M. Carpenter SSGA Funds Management, Inc. One Iron Street Boston, MA 02210 YOB: 1966 | | Assistant Treasurer | | Term: Indefinite Elected: 6/16 | | Chief Operating Officer, SSGA Funds Management, Inc. (April 2005 – present) *; Managing Director, State Street Global Advisors. (2005 – present).* |
State Street Total Return V.I.S. Fund
Other Information, continued — December 31, 2018 (Unaudited)
| | | | | | |
| | | | |
Name,
Address, and
Year of Birth | | Position(s) Held
with Fund | | Term of
Office and
Length of
Time Served | | Principal Occupation
During Past Five Years |
OFFICERS: (continued) |
Chad C. Hallett SSGA Funds Management, Inc. One Iron Street Boston, MA 02210 YOB: 1969 | | Assistant Treasurer | | Term: Indefinite Elected: 6/16 | | Vice President, State Street Global Advisors and SSGA Funds Management, Inc. (November 2014 – present); Vice President, State Street Bank and Trust Company (2001 – November 2014).* |
| | | | | | | |
Darlene Anderson-Vasquez SSGA Funds Management, Inc. One Iron Street Boston, MA 02210 YOB: 1968 | | Assistant Treasurer | | Term: Indefinite Elected: 3/17 | | Managing Director, State Street Global Advisors and SSGA Funds Management, Inc. (May 2016 – present); Senior Vice President, John Hancock Investments (September 2007 – May 2016). |
| | | | | | | |
Daniel G. Plourde SSGA Funds Management, Inc. One Iron Street Boston, MA 02210 YOB: 1980 | | Assistant Treasurer | | Term: Indefinite Elected: 6/17 | | Vice President, State Street Global Advisors and SSGA Funds Management, Inc. (May 2015 – present); Officer, State Street Bank and Trust Company (March 2009 – May 2015). |
| | | | | | | |
Jesse D. Hallee State Street Bank and Trust Company 100 Summer Street, 7th Floor Boston, MA 02111-2900 YOB: 1976 | | Secretary | | Term: Indefinite Elected: 3/17 | | Vice President and Managing Counsel, State Street Bank and Trust Company (2013 – present); Vice President and Counsel, Brown Brothers Harriman & Co. (2007-2013). |
| * | Served in various capacities and/or with various affiliated entities during noted time period. |
State Street Total Return V.I.S. Fund
Other Information, continued — December 31, 2018 (Unaudited)
Proxy Voting Policies and Procedures and Record
The Fund has adopted the proxy voting policies of SSGA FM. A description of the policies and procedures that the Fund has adopted to determine how to vote proxies relating to portfolio securities is available (i) without charge, upon request, by calling1-800-242-0134, (ii) on the Fund’s website at http://www.ssga.com/geam, or (iii) on the SEC’s website at www.sec.gov. Information regarding how the Fund voted proxies, if any, during the most recent12-month period ended June 30 is available by August 31 of each year without charge (1) by calling1-800-242-0134 (toll free), and (2) on the website of the SEC at www.sec.gov.
Quarterly Portfolio Schedule
The Fund files its complete schedule of investments with the SEC for the first and third quarters of each fiscal year on FormN-Q. The Fund’s FormsN-Q are available (i) without charge, upon request, by calling1-800-242-013, (ii) on the Fund’s website at http://www.ssga.com/geam, or (iii) on the SEC’s website at www.sec.gov.
Directors
Michael F. Holland, Co-Chairperson
Patrick J. Riley, Co-Chairperson
John R. Costantino
Donna M. Rapaccioli
Michael A. Jessee
Richard D. Shirk
Rina K. Spence
Jeanne M. La Porta
Ellen M. Needham
Officers
Jeanne M. La Porta, President
Arthur Jensen, Treasurer
Brian Harris, Chief Compliance Officer and Anti-Money Laundering Officer
Bruce S. Rosenberg, Assistant Treasurer
Ann M. Carpenter, Assistant Treasurer
Chad C. Hallett, Assistant Treasurer
Darlene Anderson-Vasquez, Assistant Treasurer
Daniel G. Plourde, Assistant Treasurer
Jesse Hallee, Secretary
Investment Adviser and Administrator
SSGA Funds Management, Inc.
One Iron Street
Boston, MA 02210
Custodian andSub-Administrator
State Street Bank and Trust Company
One Lincoln Street
Boston, Massachusetts 02111
Distributor
State Street Global Advisors Funds Distributors, LLC
One Iron Street
Boston, MA 02210
Independent Registered Public Accounting Firm
Ernst & Young LLP
200 Clarendon Street
Boston, Massachusetts 02116
As of the end of the period covered by this report, State Street Variable Insurance Series Funds, Inc. (the “Company,” “Fund Entity” or “Registrant”) has adopted a code of ethics, as defined in Item 2(b) of FormN-CSR, that applies to the Registrant’s principal executive officer, principal financial officer, principal accounting officer or controller, or persons performing similar functions, regardless of whether these individuals are employed by the Registrant or a third party (the “Code”). That Code comprises written standards that are reasonably designed to deter wrongdoing and to promote: (1) honest and ethical conduct, including the ethical handling of actual or apparent conflicts of interest between personal and professional relationships; (2) full, fair, accurate, timely and understandable disclosure in reports and documents that the Registrant files with, or submits to, the U.S. Securities Exchange Commission (the “SEC”) and in other public communications made by the Registrant; (3) compliance with applicable laws and governmental rules and regulations; (4) the prompt internal reporting to an appropriate person or persons identified in the Code of violations of the Code; and (5) accountability for adherence to the Code. The Code is combined with other mutual funds advised by SSGA Funds Management, Inc. (“SSGA FM” or the “Adviser”). The Registrant has not made any amendments to the Code that relates to any element of the code of ethics definition set forth in Item 2(b) of FormN-CSR during the covered period. The Registrant has not granted any waivers from any provisions of the Code during the covered period. A copy of the Code is filed as Exhibit 13(a)(1) to this FormN-CSR.
| Item 3. | Audit Committee Financial Expert. |
The Company’s Board of Directors (the “Board”) has determined that the Company has the following “audit committee financial experts” as defined in Item 3(b) of FormN-CSR serving on its audit committee (the “Audit Committee”): Messrs. Michael F. Holland, Richard D. Shirk and John R. Costantino and Ms. Donna M. Rapaccioli. Each of the “audit committee financial experts” is “independent” as that term is defined in Item 3(a)(2) of FormN-CSR.
An “audit committee financial expert” is not an “expert” for any purpose, including for purposes of Section 11 of the Securities Act of 1933, as amended, as a result of being designated as an “audit committee financial expert.” Further, the designation of a person as an “audit committee financial expert” does not mean that the person has any greater duties, obligations, or liability than those imposed on the person without the “audit committee financial expert” designation. Similarly, the designation of a person as an “audit committee financial expert” does not affect the duties, obligations, or liability of any other member of the Audit Committee or the Board.
| Item 4. | Principal Accountant Fees and Services. |
| | | For the fiscal years ended December 31, 2018 and December 31, 2017, the aggregate audit fees billed for professional services rendered by Ernst & Young LLP (“E&Y”), the Company’s principal accountant, for the audit of the Company’s annual financial statements or services normally provided by E&Y in connection with the Company’s statutory and regulatory filings and engagements were $195,570 and $195,570, respectively. |
| | | For the fiscal years ended December 31, 2018 and December 31, 2017, there were no fees for assurance and related services by E&Y reasonably related to the performance of the audit of the Company’s financial statements that were not reported under paragraph (a) of this Item. |
| | | For the fiscal years ended December 31, 2018 and December 31, 2017, the aggregate tax fees billed for professional services rendered by E&Y for tax compliance, tax advice, and tax planning in the form of preparation of excise filings and income tax returns were $49,100 and $52,947, respectively. |
| | | For the fiscal years ended December 31, 2018 and December 31, 2017, there were no fees billed for professional services rendered by E&Y for products and services provided by E&Y to the Company, other than the services reported in paragraphs (a) through (c). |
| | | For the fiscal years ended December 31, 2018 and December 31, 2017, the aggregate fees for professional services rendered by E&Y for products and services provided by E&Y to the Adviser and any entity controlling, controlled by, or under common control with the Adviser that provides ongoing services to the Company that (i) relate directly to the operations and financial reporting of the Company and (ii) werepre-approved by the Audit Committee were approximately $6,581,832 and $7,777,372, respectively. |
| | (e)(1) | Audit CommitteePre-Approval Policies and Procedures |
The Company’s Audit Committee Charter states the following with respect topre-approval procedures:
The Audit Committee shall have the following duties and powers:
| | • | | To pre-approve engagements by a Fund Entity’s independent auditor fornon-audit services to be rendered to the Fund’s investment adviser (not including any subadviser whose role is primarily portfolio management and is subcontracted with or overseen by another investment adviser), and any entity controlling, controlled by, or under common control with the investment adviser that provides ongoing services to the Fund, if the engagement relates directly to the operations and financial reporting of the Fund; |
| | • | | To establish, if deemed necessary or appropriate as an alternative to Audit Committeepre-approval of services to be provided by the independent auditor as required by paragraph (b) above, policies and procedures to permit such services to bepre-approved by other means, such as by action of a designated member or members of the Audit Committee, subject to the requirement that the decision of any member to whom authority is delegated topre-approve an activity shall be presented to the full Audit Committee at its next scheduled meeting; |
AlternatePre-Approval Procedure:
| | • | | The Chairperson, or aCo-Chairperson, of the Audit Committee is authorized topre-approve any engagement involving the Fund Entity’s independent auditors to the same extent as the Audit Committee. Anypre-approval decision by the Chairperson, or aCo-Chairperson, under the foregoing authority shall be presented to the Audit Committee at its next scheduled meeting. |
| | (e)(2) | Percentages of Services |
| | | None of the services described in paragraphs (b) through (d) of this Item were performed in reliance on paragraph (c)(7)(i)(C) of Rule2-01 of RegulationS-X during the period of time for which such rule was effective. |
| | (g) | Total Fees Paid By Adviser and Certain Affiliates |
| | | For the fiscal years ended December 31, 2018 and December 31, 2017, the aggregate non-audit fees billed by E&Y for services rendered to the Company and the Adviser and any entity controlling, controlled by, or under common control with the Adviser that provided ongoing services to the Company were approximately $36,297,003 and $40,983,185, respectively. The figure for the fiscal year ended December 31, 2017 was previously reported as $28,718,894 and has been restated to include certain other audit fees totaling $12,264,291, in the aggregate, primarily relating to statutory and financial statement audits, the requirement to opine on the design and operating effectiveness of internal control over financial reporting and accounting consultations. |
| | (h) | E&Y notified the Company’s Audit Committee of allnon-audit services that were rendered by E&Y to the Adviser and any entity controlling, controlled by, or under common control with the Adviser that provides services to the Company, which services were not required to bepre-approved pursuant to paragraph (c)(7)(ii) of Rule2-01 of RegulationS-X, allowing the Company’s Audit Committee to consider whether such services were compatible with maintaining E&Y’s independence. |
| Item 5. | Audit Committee of Listed Registrants. |
Not applicable to the Registrant.
| (a) | The Schedule of Investments for the State Street Total Return V.I.S. Fund is listed below. The Schedules of Investments for the State Street U.S. Equity V.I.S. Fund, State Street S&P 500 Index V.I.S. Fund, State Street Premier Growth V.I.S. Fund, State StreetSmall-Cap Equity V.I.S. Fund, State Street Income V.I.S. Fund and State Street Real Estate Securities V.I.S. Fund and a Summary Schedule of Investments for the State Street Total Return V.I.S. Fund are included as part of the report to shareholders filed under Item 1 of this FormN-CSR. |
| | |
| State Street Total Return V.I.S. Fund | | |
Schedule of Investments | | December 31, 2018 |
State Street Total Return V.I.S. Fund
| | | | | | | | |
| | | Number
of Shares | | | Fair
Value | |
Domestic Equity – 34.3% † | |
Common Stock – 34.3% | |
Advertising – 0.0%* | |
Boston Omaha Corp., Class A | | | 13,769 | | | $ | 322,195 | (a) |
TechTarget Inc. | | | 2,643 | | | | 32,271 | (a) |
| | | | 354,466 | |
Aerospace & Defense – 0.3% | |
National Presto Industries Inc. | | | 9,066 | | | | 1,059,997 | |
Teledyne Technologies Inc. | | | 24,947 | | | | 5,165,775 | (a) |
| | | | 6,225,772 | |
Air Freight & Logistics – 0.9% | |
CH Robinson Worldwide Inc. | | | 45,265 | | | | 3,806,334 | |
Expeditors International of Washington Inc. | | | 176,808 | | | | 12,038,857 | |
Hub Group Inc., Class A | | | 12,222 | | | | 453,069 | (a) |
| | | | 16,298,260 | |
Alternative Carriers – 0.6% | |
CenturyLink Inc. | | | 704,400 | | | | 10,671,660 | |
Apparel Retail – 1.5% | |
Abercrombie & Fitch Co., Class A | | | 8,257 | | | | 165,553 | |
Ascena Retail Group Inc. | | | 214,500 | | | | 538,395 | (a) |
DSW Inc., Class A | | | 28,871 | | | | 713,114 | |
Guess? Inc. | | | 3,759 | | | | 78,074 | |
Shoe Carnival Inc. | | | 46,483 | | | | 1,557,645 | |
The Buckle Inc. | | | 98,279 | | | | 1,900,716 | |
The Cato Corp., Class A | | | 20,137 | | | | 287,355 | |
The TJX Companies Inc. | | | 281,046 | | | | 12,573,998 | |
Tilly’s Inc., Class A | | | 26,146 | | | | 283,945 | |
Urban Outfitters Inc. | | | 273,669 | | | | 9,085,811 | (a) |
Zumiez Inc. | | | 43,092 | | | | 826,074 | (a) |
| | | | 28,010,680 | |
Apparel, Accessories & Luxury Goods – 0.4% | |
Fossil Group Inc. | | | 102,300 | | | | 1,609,179 | (a) |
Movado Group Inc. | | | 7,636 | | | | 241,450 | |
VF Corp. | | | 80,512 | | | | 5,743,726 | |
| | | | 7,594,355 | |
Application Software – 1.3% | |
American Software Inc., Class A | | | 33,438 | | | | 349,427 | |
ANSYS Inc. | | | 74,747 | | | | 10,684,336 | (a) |
Cision Ltd. | | | 133,169 | | | | 1,558,077 | (a) |
Intuit Inc. | | | 64,921 | | | | 12,779,699 | |
ShotSpotter Inc. | | | 3,965 | | | | 123,629 | (a) |
| | | | 25,495,168 | |
Asset Management & Custody Banks – 0.7% | |
Arlington Asset Investment Corp., Class A | | | 42,232 | | | | 305,760 | |
Associated Capital Group Inc., Class A | | | 4,090 | | | | 144,091 | |
Cohen & Steers Inc. | | | 44,815 | | | | 1,538,051 | |
Diamond Hill Investment Group Inc. | | | 1,881 | | | | 281,115 | |
Silvercrest Asset Management Group Inc., Class A | | | 4,764 | | | | 63,028 | |
T Rowe Price Group Inc. | | | 110,847 | | | | 10,233,395 | |
Waddell & Reed Financial Inc., Class A | | | 4,264 | | | | 77,093 | |
| | | | 12,642,533 | |
Auto Parts & Equipment – 0.0%* | |
Gentex Corp. | | | 40,016 | | | | 808,723 | |
Automobile Manufacturers – 0.0%* | |
Ford Motor Co. | | | 74,915 | | | | 573,100 | |
Automotive Retail – 0.1% | |
Sonic Automotive Inc., Class A | | | 69,622 | | | | 957,999 | |
Biotechnology – 0.4% | |
Adverum Biotechnologies Inc. | | | 23,690 | | | | 74,623 | (a) |
Aeglea BioTherapeutics Inc. | | | 9,075 | | | | 67,972 | (a) |
Allena Pharmaceuticals Inc. | | | 18,071 | | | | 98,487 | (a) |
Arcus Biosciences Inc. | | | 24,410 | | | | 262,896 | (a) |
Arrowhead Pharmaceuticals Inc. | | | 51,800 | | | | 643,356 | (a) |
Celcuity Inc. | | | 3,789 | | | | 90,898 | (a) |
Cue Biopharma Inc. | | | 20,703 | | | | 97,304 | (a) |
Denali Therapeutics Inc. | | | 26,113 | | | | 539,495 | (a) |
| | | | | | | | |
| | | Number
of Shares | | | Fair
Value | |
Emergent BioSolutions Inc. | | | 4,613 | | | $ | 273,459 | (a) |
Evelo Biosciences Inc. | | | 24,031 | | | | 312,643 | (a) |
Fate Therapeutics Inc. | | | 30,200 | | | | 387,466 | (a) |
G1 Therapeutics Inc. | | | 7,917 | | | | 151,610 | (a) |
Genomic Health Inc. | | | 33,200 | | | | 2,138,412 | (a) |
Homology Medicines Inc. | | | 4,164 | | | | 93,107 | (a) |
PDL BioPharma Inc. | | | 296,687 | | | | 860,392 | (a) |
Spero Therapeutics Inc. | | | 30,173 | | | | 185,564 | (a) |
Surface Oncology Inc. | | | 31,636 | | | | 134,137 | (a) |
UNITY Biotechnology Inc. | | | 17,352 | | | | 282,143 | (a) |
Unum Therapeutics Inc. | | | 37,984 | | | | 167,130 | (a) |
| | | | 6,861,094 | |
Brewers – 0.0%* | |
The Boston Beer Company Inc., Class A | | | 1,630 | | | | 392,569 | (a) |
Broadcasting – 0.2% | |
Beasley Broadcast Group Inc., Class A | | | 16,084 | | | | 60,315 | |
Discovery Inc., Class A | | | 120,800 | | | | 2,988,592 | (a) |
Media General Inc. | | | 2,076 | | | | 208 | |
| | | | 3,049,115 | |
Building Products – 0.0%* | |
Resideo Technologies Inc. | | | 16,809 | | | | 345,425 | (a) |
Cable & Satellite – 0.2% | |
Cable One Inc. | | | 3,500 | | | | 2,870,350 | |
Coal & Consumable Fuels – 0.0%* | |
Hallador Energy Co. | | | 15,813 | | | | 80,172 | |
NACCO Industries Inc., Class A | | | 2,150 | | | | 72,885 | |
| | | | 153,057 | |
Communications Equipment – 1.0% | |
Cisco Systems Inc. | | | 416,173 | | | | 18,032,776 | |
NETGEAR Inc. | | | 10,949 | | | | 569,677 | (a) |
| | | | 18,602,453 | |
Construction & Engineering – 0.0%* | |
MYR Group Inc. | | | 7,615 | | | | 214,514 | (a) |
Willscot Corp. | | | 5,973 | | | | 56,266 | (a) |
| | | | 270,780 | |
Construction Machinery & Heavy Trucks – 0.0%* | |
Miller Industries Inc. | | | 4,256 | | | | 114,912 | |
Construction Materials – 0.0%* | |
United States Lime & Minerals Inc. | | | 1,127 | | | | 80,017 | |
Consumer Electronics – 0.0%* | |
Roku Inc. | | | 1,761 | | | | 53,957 | (a) |
Turtle Beach Corp. | | | 19,800 | | | | 282,546 | (a) |
| | | | 336,503 | |
Consumer Finance – 0.0%* | |
Curo Group Holdings Corp. | | | 33,755 | | | | 320,335 | (a) |
Data Processing & Outsourced Services – 1.0% | |
Broadridge Financial Solutions Inc. | | | 110,752 | | | | 10,659,880 | |
Jack Henry & Associates Inc. | | | 55,565 | | | | 7,030,084 | |
NIC Inc. | | | 17,369 | | | | 216,765 | |
Paychex Inc. | | | 28,066 | | | | 1,828,500 | |
| | | | 19,735,229 | |
Department Stores – 0.9% | |
Dillard’s Inc., Class A | | | 7,450 | | | | 449,310 | |
Kohl’s Corp. | | | 186,127 | | | | 12,347,665 | |
Macy’s Inc. | | | 152,100 | | | | 4,529,538 | |
| | | | 17,326,513 | |
Distillers & Vintners – 0.0%* | |
Brown-Forman Corp., Class A | | | 6,253 | | | | 296,517 | |
Distributors – 0.5% | |
Funko Inc., Class A | | | 30,900 | | | | 406,335 | (a) |
Genuine Parts Co. | | | 89,774 | | | | 8,620,099 | |
Weyco Group Inc. | | | 2,809 | | | | 81,939 | |
| | | | 9,108,373 | |
Diversified Metals & Mining – 0.0%* | |
Materion Corp. | | | 1,498 | | | | 67,395 | |
Diversified REITs – 0.1% | |
Armada Hoffler Properties Inc. | | | 88,020 | | | | 1,237,561 | |
One Liberty Properties Inc. | | | 12,478 | | | | 302,217 | |
| | | | 1,539,778 | |
Diversified Support Services – 0.2% | |
McGrath RentCorp. | | | 23,318 | | | | 1,200,411 | |
See Notes to Schedules of Investments and Notes to Financial Statements.
| | |
| State Street Total Return V.I.S. Fund | | |
| Schedule of Investments | | December 31, 2018 |
| | | | | | | | |
| | | Number
of Shares | | | Fair
Value | |
UniFirst Corp. | | | 15,889 | | | $ | 2,273,239 | |
Viad Corp. | | | 11,419 | | | | 571,978 | |
| | | | 4,045,628 | |
Education Services – 0.0%* | |
American Public Education Inc. | | | 21,851 | | | | 621,879 | (a) |
Electric Utilities – 0.1% | |
Hawaiian Electric Industries Inc. | | | 74,371 | | | | 2,723,466 | |
Electrical Components & Equipment – 0.0%* | |
Encore Wire Corp. | | | 11,068 | | | | 555,392 | |
Preformed Line Products Co. | | | 2,625 | | | | 142,406 | |
| | | | 697,798 | |
Electronic Components – 0.2% | |
AVX Corp. | | | 62,945 | | | | 959,911 | |
Dolby Laboratories Inc., Class A | | | 49,044 | | | | 3,032,881 | |
| | | | 3,992,792 | |
Electronic Equipment & Instruments – 0.1% | |
Badger Meter Inc. | | | 27,783 | | | | 1,367,201 | |
Electro Scientific Industries Inc. | | | 29,293 | | | | 877,618 | (a) |
Vishay Precision Group Inc. | | | 8,477 | | | | 256,260 | (a) |
| | | | 2,501,079 | |
Electronic Manufacturing Services – 0.2% | |
Benchmark Electronics Inc. | | | 30,507 | | | | 646,138 | |
Park Electrochemical Corp. | | | 38,384 | | | | 693,599 | |
Plexus Corp. | | | 36,485 | | | | 1,863,654 | (a) |
| | | | 3,203,391 | |
Environmental & Facilities Services – 1.0% | |
Republic Services Inc. | | | 191,737 | | | | 13,822,320 | |
Rollins Inc. | | | 125,448 | | | | 4,528,673 | |
| | | | 18,350,993 | |
Fertilizers & Agricultural Chemicals – 0.0%* | |
The Mosaic Co. | | | 11,900 | | | | 347,599 | |
Financial Exchanges & Data – 0.3% | |
CME Group Inc. | | | 21,641 | | | | 4,071,105 | |
Morningstar Inc. | | | 19,845 | | | | 2,179,775 | |
| | | | 6,250,880 | |
Food Retail – 0.1% | |
Natural Grocers by Vitamin Cottage Inc. | | | 8,238 | | | | 126,289 | (a) |
Village Super Market Inc., Class A | | | 5,177 | | | | 138,433 | |
Weis Markets Inc. | | | 19,893 | | | | 950,487 | |
| | | | 1,215,209 | |
Footwear – 0.2% | |
Rocky Brands Inc. | | | 28,315 | | | | 736,190 | |
Steven Madden Ltd. | | | 95,544 | | | | 2,891,161 | |
| | | | 3,627,351 | |
Health Care REITs – 0.0%* | |
Community Healthcare Trust Inc. | | | 24,337 | | | | 701,636 | |
Healthcare Distributors – 0.0%* | |
PetIQ Inc. | | | 20,180 | | | | 473,625 | (a) |
Healthcare Equipment – 0.9% | |
ABIOMED Inc. | | | 1,500 | | | | 487,560 | (a) |
Danaher Corp. | | | 137,968 | | | | 14,227,260 | |
Globus Medical Inc., Class A | | | 2,891 | | | | 125,123 | (a) |
iRadimed Corp. | | | 10,640 | | | | 260,255 | (a) |
Surmodics Inc. | | | 2,882 | | | | 136,203 | (a) |
Tandem Diabetes Care Inc. | | | 24,000 | | | | 911,280 | (a) |
Varian Medical Systems Inc. | | | 2,765 | | | | 313,302 | (a) |
| | | | 16,460,983 | |
Healthcare Facilities – 0.1% | |
Genesis Healthcare Inc. | | | 229,006 | | | | 270,227 | (a) |
HCA Healthcare Inc. | | | 2,200 | | | | 273,790 | |
National HealthCare Corp. | | | 6,642 | | | | 521,065 | |
Tenet Healthcare Corp. | | | 3,091 | | | | 52,980 | (a) |
| | | | 1,118,062 | |
Healthcare Services – 0.2% | |
Cigna Corp. | | | 20,218 | | | | 3,839,807 | |
CorVel Corp. | | | 6,443 | | | | 397,662 | (a) |
| | | | 4,237,469 | |
Healthcare Supplies – 0.1% | |
Anika Therapeutics Inc. | | | 3,976 | | | | 133,633 | (a) |
ICU Medical Inc. | | | 1,256 | | | | 288,415 | (a) |
Meridian Bioscience Inc. | | | 32,523 | | | | 564,599 | |
| | | | | | | | |
| | | Number
of Shares | | | Fair
Value | |
OrthoPediatrics Corp. | | | 4,718 | | | $ | 164,564 | (a) |
Utah Medical Products Inc. | | | 5,245 | | | | 435,755 | |
| | | | 1,586,966 | |
Healthcare Technology – 0.0%* | |
Simulations Plus Inc. | | | 36,922 | | | | 734,748 | |
Home Furnishing Retail – 0.2% | |
Williams-Sonoma Inc. | | | 58,779 | | | | 2,965,401 | |
Hotel & Resort REITs – 0.1% | |
Chesapeake Lodging Trust | | | 72,933 | | | | 1,775,919 | |
Household Appliances – 0.0%* | |
Hamilton Beach Brands Holding Co., Class A | | | 3,357 | | | | 78,755 | |
Human Resource & Employment Services – 0.6% | |
Kelly Services Inc., Class A | | | 29,809 | | | | 610,488 | |
Kforce Inc. | | | 10,333 | | | | 319,496 | |
Robert Half International Inc. | | | 187,864 | | | | 10,745,821 | |
| | | | 11,675,805 | |
Hypermarkets & Super Centers – 0.6% | |
Costco Wholesale Corp. | | | 52,919 | | | | 10,780,130 | |
Independent Power Producers & Energy Traders – 0.1% | |
Vistra Energy Corp. | | | 62,748 | | | | 1,436,302 | (a) |
Industrial Conglomerates – 0.7% | |
Honeywell International Inc. | | | 97,981 | | | | 12,945,250 | |
Industrial Machinery – 0.0%* | |
Hurco Companies Inc. | | | 3,373 | | | | 120,416 | |
The Eastern Co. | | | 2,884 | | | | 69,735 | |
The Gorman-Rupp Co. | | | 13,405 | | | | 434,456 | |
| | | | 624,607 | |
Industrial REITs – 0.0%* | |
Innovative Industrial Properties Inc. | | | 3,169 | | | | 143,841 | |
Insurance Brokers – 0.2% | |
Brown & Brown Inc. | | | 79,663 | | | | 2,195,512 | |
Goosehead Insurance Inc., Class A | | | 35,033 | | | | 921,018 | (a) |
| | | | 3,116,530 | |
Interactive Media & Services – 0.0%* | |
Alphabet Inc., Class C | | | 387 | | | | 400,781 | (a) |
Travelzoo | | | 28,551 | | | | 280,656 | (a) |
| | | | 681,437 | |
Internet & Direct Marketing Retail – 0.2% | |
1-800-Flowers.com Inc., Class A | | | 20,040 | | | | 245,089 | (a) |
Amazon.com Inc. | | | 2,741 | | | | 4,116,900 | (a) |
| | | | 4,361,989 | |
Internet Services & Infrastructure – 0.2% | |
Okta Inc. | | | 63,599 | | | | 4,057,616 | (a) |
Investment Banking & Brokerage – 0.2% | |
Houlihan Lokey Inc. | | | 48,495 | | | | 1,784,616 | |
INTL. FCStone Inc. | | | 14,560 | | | | 532,604 | (a) |
Moelis & Co., Class A | | | 45,089 | | | | 1,550,160 | |
Oppenheimer Holdings Inc., Class A | | | 2,827 | | | | 72,230 | |
Siebert Financial Corp. | | | 5,200 | | | | 75,192 | (a) |
| | | | 4,014,802 | |
IT Consulting & Other Services – 0.4% | |
Amdocs Ltd. | | | 93,837 | | | | 5,496,971 | |
ManTech International Corp., Class A | | | 34,149 | | | | 1,785,822 | |
Perficient Inc. | | | 6,130 | | | | 136,454 | (a) |
Unisys Corp. | | | 95,300 | | | | 1,108,339 | (a) |
| | | | 8,527,586 | |
Leisure Facilities – 0.1% | |
International Speedway Corp., Class A | | | 42,130 | | | | 1,847,822 | |
Speedway Motorsports Inc. | | | 5,617 | | | | 91,388 | |
| | | | 1,939,210 | |
Leisure Products – 0.0%* | |
Johnson Outdoors Inc., Class A | | | 3,214 | | | | 188,790 | |
MasterCraft Boat Holdings Inc. | | | 23,948 | | | | 447,828 | (a) |
| | | | 636,618 | |
Life & Health Insurance – 0.8% | |
Aflac Inc. | | | 310,334 | | | | 14,138,817 | (b) |
FBL Financial Group Inc., Class A | | | 3,413 | | | | 224,063 | |
Independence Holding Co. | | | 2,459 | | | | 86,557 | |
National Western Life Group Inc., Class A | | | 2,095 | | | | 629,967 | |
| | | | 15,079,404 | |
See Notes to Schedules of Investments and Notes to Financial Statements.
| | |
| State Street Total Return V.I.S. Fund | | |
| Schedule of Investments | | December 31, 2018 |
| | | | | | | | |
| | | Number
of Shares | | | Fair
Value | |
Life Sciences Tools & Services – 0.2% | |
Bio-Techne Corp. | | | 14,458 | | | $ | 2,092,362 | |
Luminex Corp. | | | 39,385 | | | | 910,187 | |
Quanterix Corp. | | | 3,515 | | | | 64,360 | (a) |
| | | | 3,066,909 | |
Managed Healthcare – 0.3% | |
Molina Healthcare Inc. | | | 13,400 | | | | 1,557,348 | (a) |
UnitedHealth Group Inc. | | | 18,428 | | | | 4,590,783 | |
| | | | 6,148,131 | |
Metal & Glass Containers – 0.3% | |
AptarGroup Inc. | | | 40,919 | | | | 3,849,250 | |
Silgan Holdings Inc. | | | 73,740 | | | | 1,741,739 | |
| | | | 5,590,989 | |
Mortgage REITs – 1.8% | |
AG Mortgage Investment Trust Inc. | | | 38,754 | | | | 617,351 | |
AGNC Investment Corp. | | | 675,856 | | | | 11,854,514 | |
Apollo Commercial Real Estate Finance Inc. | | | 179,195 | | | | 2,985,389 | |
Arbor Realty Trust Inc. | | | 82,247 | | | | 828,227 | |
Ares Commercial Real Estate Corp. | | | 25,557 | | | | 333,263 | |
Blackstone Mortgage Trust Inc., Class A | | | 33,815 | | | | 1,077,346 | |
Capstead Mortgage Corp. | | | 169,833 | | | | 1,132,786 | |
Cherry Hill Mortgage Investment Corp. | | | 30,174 | | | | 529,252 | |
Chimera Investment Corp. | | | 163,861 | | | | 2,920,003 | |
Dynex Capital Inc. | | | 93,385 | | | | 534,162 | |
MFA Financial Inc. | | | 419,764 | | | | 2,804,024 | |
Starwood Property Trust Inc. | | | 216,119 | | | | 4,259,706 | |
TPG RE Finance Trust Inc. | | | 21,207 | | | | 387,664 | |
Two Harbors Investment Corp. | | | 286,898 | | | | 3,683,770 | |
| | | | 33,947,457 | |
Multi-Line Insurance – 0.8% | |
American Financial Group Inc. | | | 58,779 | | | | 5,321,263 | |
American National Insurance Co. | | | 7,910 | | | | 1,006,468 | |
Loews Corp. | | | 185,501 | | | | 8,444,006 | |
| | | | 14,771,737 | |
Multi-Sector Holdings – 1.2% | |
Berkshire Hathaway Inc., Class B | | | 110,564 | | | | 22,574,958 | (a) |
Office Services & Supplies – 0.0%* | |
Steelcase Inc., Class A | | | 30,041 | | | | 445,508 | |
Oil & Gas Drilling – 0.0%* | |
Rowan Companies PLC, Class A | | | 16,101 | | | | 135,087 | (a) |
Oil & Gas Equipment & Services – 0.1% | |
Dawson Geophysical Co. | | | 19,735 | | | | 66,704 | (a) |
Liberty Oilfield Services Inc., Class A | | | 4,902 | | | | 63,481 | |
Mammoth Energy Services Inc. | | | 26,828 | | | | 482,367 | |
Matrix Service Co. | | | 40,248 | | | | 722,049 | (a) |
Profire Energy Inc. | | | 72,929 | | | | 105,747 | (a) |
Quintana Energy Services Inc. | | | 11,897 | | | | 41,164 | (a) |
Solaris Oilfield Infrastructure Inc., Class A | | | 10,474 | | | | 126,631 | |
| | | | 1,608,143 | |
Oil & Gas Exploration & Production – 0.1% | |
Evolution Petroleum Corp. | | | 9,272 | | | | 63,235 | |
Whiting Petroleum Corp. | | | 113,300 | | | | 2,570,777 | (a) |
WildHorse Resource Development Corp. | | | 9,681 | | | | 136,599 | (a) |
| | | | 2,770,611 | |
Oil & Gas Refining & Marketing – 1.4% | |
Adams Resources & Energy Inc. | | | 2,209 | | | | 85,510 | |
CVR Energy Inc. | | | 7,656 | | | | 263,979 | |
HollyFrontier Corp. | | | 29,235 | | | | 1,494,493 | |
PBF Energy Inc., Class A | | | 216,686 | | | | 7,079,132 | |
Phillips 66 | | | 103,286 | | | | 8,898,089 | |
Valero Energy Corp. | | | 129,181 | | | | 9,684,700 | |
| | | | 27,505,903 | |
Packaged Foods & Meats – 0.3% | |
J&J Snack Foods Corp. | | | 5,711 | | | | 825,753 | |
Lancaster Colony Corp. | | | 19,032 | | | | 3,366,000 | |
Tootsie Roll Industries Inc. | | | 19,329 | | | | 645,589 | |
| | | | 4,837,342 | |
Paper Packaging – 0.0%* | |
UFP Technologies Inc. | | | 3,051 | | | | 91,652 | (a) |
| | | | | | | | |
| | | Number
of Shares | | | Fair
Value | |
Paper Products – 0.1% | |
Verso Corp., Class A | | | 102,983 | | | $ | 2,306,819 | (a) |
Personal Products – 0.5% | |
Medifast Inc. | | | 2,575 | | | | 321,926 | |
The Estee Lauder Companies Inc., Class A | | | 69,649 | | | | 9,061,335 | |
USANA Health Sciences Inc. | | | 746 | | | | 87,827 | (a) |
| | | | 9,471,088 | |
Pharmaceuticals – 1.6% | |
Amneal Pharmaceuticals Inc. | | | 6,068 | | | | 82,100 | (a) |
Evolus Inc. | | | 9,820 | | | | 116,858 | (a) |
Johnson & Johnson | | | 145,717 | | | | 18,804,779 | |
Menlo Therapeutics Inc. | | | 44,902 | | | | 184,996 | (a) |
Pfizer Inc. | | | 232,090 | | | | 10,130,728 | |
resTORbio Inc. | | | 41,815 | | | | 360,445 | (a) |
scPharmaceuticals Inc. | | | 14,502 | | | | 54,528 | (a) |
| | | | 29,734,434 | |
Property & Casualty Insurance – 0.5% | |
AMERISAFE Inc. | | | 15,694 | | | | 889,693 | |
CNA Financial Corp. | | | 32,791 | | | | 1,447,723 | |
Donegal Group Inc., Class A | | | 6,022 | | | | 82,170 | |
Erie Indemnity Co., Class A | | | 5,529 | | | | 737,071 | |
Kinsale Capital Group Inc. | | | 18,239 | | | | 1,013,359 | |
Old Republic International Corp. | | | 130,220 | | | | 2,678,625 | |
Protective Insurance Corp., Class B | | | 2,264 | | | | 37,696 | |
Safety Insurance Group Inc. | | | 5,703 | | | | 466,562 | |
WR Berkley Corp. | | | 24,003 | | | | 1,774,062 | |
| | | | 9,126,961 | |
Publishing – 0.2% | |
John Wiley & Sons Inc., Class A | | | 61,896 | | | | 2,907,255 | |
Regional Banks – 0.3% | |
1st Constitution Bancorp | | | 4,246 | | | | 84,623 | |
ACNB Corp. | | | 2,457 | | | | 96,437 | |
American National Bankshares Inc. | | | 2,128 | | | | 62,372 | |
Ames National Corp. | | | 2,633 | | | | 66,931 | |
Arrow Financial Corp. | | | 3,000 | | | | 96,060 | |
Auburn National Bancorporation Inc. | | | 1,634 | | | | 51,732 | |
Baycom Corp. | | | 14,107 | | | | 325,731 | (a) |
Cambridge Bancorp | | | 2,724 | | | | 226,773 | |
CB Financial Services Inc. | | | 2,510 | | | | 62,198 | |
CenterState Bank Corp. | | | 5,232 | | | | 110,081 | |
Chemung Financial Corp. | | | 2,785 | | | | 115,048 | |
Citizens & Northern Corp. | | | 3,011 | | | | 79,581 | |
City Holding Co. | | | 6,876 | | | | 464,749 | |
Community Trust Bancorp Inc. | | | 8,859 | | | | 350,905 | |
Evans Bancorp Inc. | | | 1,757 | | | | 57,120 | |
Fidelity D&D Bancorp Inc. | | | 1,258 | | | | 80,738 | |
First Choice Bancorp | | | 600 | | | | 13,560 | |
First Community Corp. | | | 3,265 | | | | 63,439 | |
First Financial Corp. | | | 6,595 | | | | 264,789 | |
First Financial Northwest Inc. | | | 17,123 | | | | 264,893 | |
FirstMid-Illinois Bancshares Inc. | | | 8,122 | | | | 259,254 | |
First Savings Financial Group Inc. | | | 1,132 | | | | 58,796 | |
First United Corp. | | | 4,390 | | | | 69,889 | |
LCNB Corp. | | | 5,108 | | | | 77,386 | |
Level One Bancorp Inc. | | | 3,009 | | | | 67,492 | |
MBT Financial Corp. | | | 7,276 | | | | 67,667 | |
Metropolitan Bank Holding Corp. | | | 4,149 | | | | 127,997 | (a) |
Mid Penn Bancorp Inc. | | | 700 | | | | 16,114 | |
Middlefield Banc Corp. | | | 1,750 | | | | 74,252 | |
MutualFirst Financial Inc. | | | 2,252 | | | | 59,836 | |
National Bankshares Inc. | | | 1,756 | | | | 63,971 | |
Northrim BanCorp Inc. | | | 4,556 | | | | 149,756 | |
Norwood Financial Corp. | | | 2,332 | | | | 76,956 | |
Oak Valley Bancorp | | | 3,644 | | | | 66,685 | |
Ohio Valley Banc Corp. | | | 1,991 | | | | 70,461 | |
Orrstown Financial Services Inc. | | | 3,614 | | | | 65,811 | |
Park National Corp. | | | 6,865 | | | | 583,182 | |
Penns Woods Bancorp Inc. | | | 1,879 | | | | 75,611 | |
Premier Financial Bancorp Inc. | | | 4,512 | | | | 67,274 | |
Select Bancorp Inc. | | | 4,109 | | | | 50,869 | (a) |
Shore Bancshares Inc. | | | 4,983 | | | | 72,453 | |
Spirit of Texas Bancshares Inc. | | | 10,868 | | | | 247,573 | (a) |
| | | | 5,407,045 | |
See Notes to Schedules of Investments and Notes to Financial Statements.
| | |
| State Street Total Return V.I.S. Fund | | |
| Schedule of Investments | | December 31, 2018 |
| | | | | | | | |
| | | Number
of Shares | | | Fair
Value | |
Reinsurance – 0.1% | |
Reinsurance Group of America Inc. | | | 13,596 | | | $ | 1,906,567 | |
Research & Consulting Services – 0.3% | |
CBIZ Inc. | | | 45,133 | | | | 889,120 | (a) |
CRA International Inc. | | | 10,375 | | | | 441,456 | |
Exponent Inc. | | | 47,444 | | | | 2,405,885 | |
Forrester Research Inc. | | | 7,522 | | | | 336,234 | |
ICF International Inc. | | | 5,595 | | | | 362,444 | |
Resources Connection Inc. | | | 37,814 | | | | 536,959 | |
| | | | 4,972,098 | |
Residential REITs – 0.0%* | |
BRT Apartments Corp. | | | 25,767 | | | | 294,774 | |
Restaurants – 0.2% | |
Biglari Holdings Inc., Class A | | | 88 | | | | 51,715 | (a) |
Brinker International Inc. | | | 25,796 | | | | 1,134,508 | |
J. Alexander’s Holdings Inc. | | | 7,535 | | | | 62,013 | (a) |
The Cheesecake Factory Inc. | | | 44,870 | | | | 1,952,294 | |
| | | | 3,200,530 | |
Retail REITs – 0.2% | |
Getty Realty Corp. | | | 27,225 | | | | 800,687 | |
Retail Properties of America Inc., Class A | | | 278,583 | | | | 3,022,626 | |
| | | | 3,823,313 | |
Semiconductor Equipment – 0.0%* | |
Photronics Inc. | | | 67,701 | | | | 655,346 | (a) |
Semiconductors – 0.8% | |
Intel Corp. | | | 308,444 | | | | 14,475,277 | |
NVE Corp. | | | 6,526 | | | | 571,286 | |
| | | | 15,046,563 | |
Soft Drinks – 0.6% | |
Keurig Dr Pepper Inc. | | | 452,314 | | | | 11,597,331 | |
Specialized Finance – 0.0%* | |
NewStar Financial Inc. | | | 492 | | | | 128 | |
Specialized REITs – 0.1% | |
Jernigan Capital Inc. | | | 52,531 | | | | 1,041,164 | |
Specialty Stores – 0.2% | |
Dick’s Sporting Goods Inc. | | | 82,774 | | | | 2,582,549 | |
Hibbett Sports Inc. | | | 26,865 | | | | 384,170 | (a) |
MarineMax Inc. | | | 24,401 | | | | 446,782 | (a) |
| | | | 3,413,501 | |
Steel – 0.5% | |
Ramaco Resources Inc. | | | 28,857 | | | | 142,842 | (a) |
Reliance Steel & Aluminum Co. | | | 79,096 | | | | 5,629,262 | |
Warrior Met Coal Inc. | | | 116,261 | | | | 2,803,053 | |
| | | | 8,575,157 | |
Systems Software – 0.4% | |
Fortinet Inc. | | | 3,900 | | | | 274,677 | (a) |
Microsoft Corp. | | | 62,558 | | | | 6,354,016 | |
SecureWorks Corp., Class A | | | 35,100 | | | | 592,839 | (a) |
| | | | 7,221,532 | |
Technology Distributors – 0.7% | |
Arrow Electronics Inc. | | | 67,945 | | | | 4,684,808 | (a) |
Avnet Inc. | | | 172,178 | | | | 6,215,626 | |
Insight Enterprises Inc. | | | 15,597 | | | | 635,578 | (a) |
PC Connection Inc. | | | 12,235 | | | | 363,746 | |
ScanSource Inc. | | | 15,838 | | | | 544,510 | (a) |
| | | | 12,444,268 | |
Technology Hardware, Storage & Peripherals – 0.5% | |
Apple Inc. | | | 51,408 | | | | 8,109,098 | (b) |
Dell Technologies, Class C | | | 2,315 | | | | 113,158 | (a) |
HP Inc. | | | 100,075 | | | | 2,047,534 | |
| | | | 10,269,790 | |
Thrifts & Mortgage Finance – 0.2% | |
Entegra Financial Corp. | | | 10,184 | | | | 211,318 | (a) |
FS Bancorp Inc. | | | 6,229 | | | | 267,100 | |
Luther Burbank Corp. | | | 11,850 | | | | 106,887 | |
Northwest Bancshares Inc. | | | 90,630 | | | | 1,535,272 | |
OP Bancorp | | | 13,561 | | | | 120,286 | (a) |
Oritani Financial Corp. | | | 36,682 | | | | 541,059 | |
Territorial Bancorp Inc. | | | 2,756 | | | | 71,601 | |
| | | | | | | | |
| | | Number
of Shares | | | Fair
Value | |
Timberland Bancorp Inc. | | | 3,387 | | | $ | 75,530 | |
TrustCo Bank Corp. | | | 66,036 | | | | 453,007 | |
| | | | 3,382,060 | |
Tobacco – 0.0%* | |
Turning Point Brands Inc. | | | 23,739 | | | | 646,176 | |
Trading Companies & Distributors – 1.0% | |
BlueLinx Holdings Inc. | | | 39,000 | | | | 963,690 | (a) |
Foundation Building Materials Inc. | | | 8,263 | | | | 68,665 | (a) |
General Finance Corp. | | | 11,500 | | | | 116,265 | (a) |
Kaman Corp. | | | 49,140 | | | | 2,756,263 | |
MSC Industrial Direct Company Inc., Class A | | | 153,879 | | | | 11,836,373 | |
Nexeo Solutions Inc. | | | 47,608 | | | | 408,953 | (a) |
Rush Enterprises Inc., Class B | | | 2,239 | | | | 79,708 | |
Willis Lease Finance Corp. | | | 3,174 | | | | 109,820 | (a) |
WW Grainger Inc. | | | 8,222 | | | | 2,321,564 | |
| | | | 18,661,301 | |
Trucking – 0.4% | |
ArcBest Corp. | | | 11,668 | | | | 399,746 | |
Landstar System Inc. | | | 34,397 | | | | 3,290,761 | |
Marten Transport Ltd. | | | 91,361 | | | | 1,479,135 | |
PAM Transportation Services Inc. | | | 3,947 | | | | 155,551 | (a) |
Schneider National Inc., Class B | | | 44,441 | | | | 829,713 | |
Werner Enterprises Inc. | | | 48,804 | | | | 1,441,670 | |
| | | | 7,596,576 | |
Wireless Telecommunication Services – 0.2% | |
NII Holdings Inc. | | | 215,800 | | | | 951,678 | (a) |
Telephone & Data Systems Inc. | | | 35,600 | | | | 1,158,424 | |
United States Cellular Corp. | | | 46,700 | | | | 2,426,999 | (a) |
| | | | 4,537,101 | |
Total Domestic Equity
(Cost $677,277,547) | | | | 650,569,192 | |
Foreign Equity – 20.5% | |
Common Stock – 20.3% | |
Advertising – 0.1% | |
Hakuhodo DY Holdings Inc. | | | 84,800 | | | | 1,217,336 | |
Aerospace & Defense – 0.2% | |
Thales S.A. | | | 33,886 | | | | 3,951,151 | |
Agricultural Products – 0.1% | |
China Agri-Industries Holdings Ltd. | | | 113,000 | | | | 40,268 | |
Wilmar International Ltd. | | | 770,400 | | | | 1,763,498 | |
| | | | 1,803,766 | |
Airlines – 0.5% | |
China Eastern Airlines Corporation Ltd., Class H | | | 162,000 | | | | 90,214 | |
Japan Airlines Company Ltd. | | | 186,324 | | | | 6,607,909 | |
Korean Air Lines Company Ltd. | | | 2,043 | | | | 60,514 | |
Singapore Airlines Ltd. | | | 259,500 | | | | 1,793,463 | |
| | | | 8,552,100 | |
Airport Services – 0.0%* | |
Grupo Aeroportuario del Sureste SAB de C.V., Class B | | | 17,214 | | | | 258,921 | |
SATS Ltd. | | | 48,200 | | | | 164,793 | |
TAV Havalimanlari Holding A/S | | | 21,321 | | | | 95,866 | |
| | | | 519,580 | |
Alternative Carriers – 0.1% | |
Intelsat S.A. | | | 46,600 | | | | 996,774 | (a) |
Aluminum – 0.0%* | |
China Zhongwang Holdings Ltd. | | | 116,400 | | | | 51,589 | |
Apparel Retail – 0.1% | |
ABC-Mart Inc. | | | 17,600 | | | | 975,327 | |
Mr Price Group Ltd. | | | 12,737 | | | | 217,950 | |
Truworths International Ltd. | | | 51,953 | | | | 318,183 | |
| | | | 1,511,460 | |
Apparel, Accessories & Luxury Goods – 0.4% | |
Burberry Group PLC | | | 170,803 | | | | 3,775,314 | |
FF Group | | | 1,860 | | | | 5,103 | (a,c) |
HUGO BOSS AG | | | 35,345 | | | | 2,178,618 | |
See Notes to Schedules of Investments and Notes to Financial Statements.
| | |
| State Street Total Return V.I.S. Fund | | |
| Schedule of Investments | | December 31, 2018 |
| | | | | | | | |
| | | Number
of Shares | | | Fair
Value | |
Shenzhou International Group Holdings Ltd. | | | 21,000 | | | $ | 238,047 | |
The Swatch Group AG | | | 15,808 | | | | 910,828 | |
| | | | 7,107,910 | |
Asset Management & Custody Banks – 0.1% | |
Hargreaves Lansdown PLC | | | 44,898 | | | | 1,057,297 | |
Auto Parts & Equipment – 0.4% | |
Fuyao Glass Industry Group Company Ltd., Class H | | | 8,800 | | | | 28,156 | (d) |
Garrett Motion Inc. | | | 9,870 | | | | 121,796 | (a) |
Magna International Inc. | | | 125,334 | | | | 5,686,739 | |
Toyoda Gosei Company Ltd. | | | 58,800 | | | | 1,165,656 | |
| | | | 7,002,347 | |
Automobile Manufacturers – 0.2% | |
Astra International Tbk PT | | | 238,536 | | | | 136,437 | |
Dongfeng Motor Group Company Ltd., Class H | | | 318,000 | | | | 288,376 | |
Ford Otomotiv Sanayi A/S | | | 8,238 | | | | 77,426 | |
Isuzu Motors Ltd. | | | 196,445 | | | | 2,772,593 | |
Kia Motors Corp. | | | 18,557 | | | | 560,469 | |
| | | | 3,835,301 | |
Brewers – 0.0%* | |
AMBEV S.A. | | | 20,700 | | | | 82,143 | |
Cia Cervecerias Unidas S.A. | | | 15,595 | | | | 200,344 | |
| | | | 282,487 | |
Broadcasting – 0.0%* | |
Surya Citra Media Tbk PT | | | 678,900 | | | | 88,285 | |
Cable & Satellite – 0.0%* | |
Cyfrowy Polsat S.A. | | | 13,925 | | | | 83,622 | (a) |
Megacable Holdings SAB de C.V. | | | 35,185 | | | | 157,472 | |
| | | | 241,094 | |
Coal & Consumable Fuels – 0.3% | |
Adaro Energy Tbk PT | | | 332,500 | | | | 28,094 | |
Bukit Asam Tbk PT | | | 338,100 | | | | 101,101 | |
China Shenhua Energy Company Ltd., Class H | | | 395,000 | | | | 865,742 | |
Coal India Ltd. | | | 80,150 | | | | 276,389 | |
United Tractors Tbk PT | | | 14,276 | | | | 27,152 | |
Washington H Soul Pattinson & Company Ltd. | | | 277,667 | | | | 4,865,435 | |
| | | | 6,163,913 | |
Commodity Chemicals – 0.1% | |
Kaneka Corp. | | | 31,800 | | | | 1,141,977 | |
Kumho Petrochemical Company Ltd. | | | 868 | | | | 67,912 | |
Mexichem SAB de C.V. | | | 16,840 | | | | 42,703 | |
Petkim Petrokimya Holding AS | | | 31,083 | | | | 29,448 | |
Petronas Chemicals Group Bhd | | | 281,700 | | | | 633,271 | |
Sinopec Shanghai Petrochemical Company Ltd., Class H | | | 171,000 | | | | 74,914 | |
| | | | 1,990,225 | |
Construction & Engineering – 0.1% | |
China Railway Construction Corporation Ltd., Class H | | | 231,500 | | | | 321,111 | |
China Railway Group Ltd., Class H | | | 444,461 | | | | 404,760 | |
Hyundai Engineering & Construction Company Ltd. | | | 2,452 | | | | 119,985 | |
Metallurgical Corporation of China Ltd., Class H | | | 221,000 | | | | 53,067 | |
Sinopec Engineering Group Company Ltd., Class H | | | 154,000 | | | | 126,475 | |
| | | | 1,025,398 | |
Construction Machinery & Heavy Trucks – 0.0%* | |
Sinotruk Hong Kong Ltd. | | | 80,500 | | | | 121,325 | |
Weichai Power Company Ltd., Class H | | | 102,000 | | | | 116,600 | |
| | | | 237,925 | |
Construction Materials – 0.1% | |
Anhui Conch Cement Company Ltd., Class H | | | 63,500 | | | | 308,199 | |
Asia Cement Corp. | | | 61,030 | | | | 67,410 | |
China Resources Cement Holdings Ltd. | | | 287,161 | | | | 258,576 | |
POSCO Chemtech Company Ltd. | | | 2,774 | | | | 158,365 | |
The Siam Cement PCL | | | 5,646 | | | | 75,604 | |
The Siam Cement PCL NVDR | | | 39,400 | | | | 527,592 | |
| | | | 1,395,746 | |
| | | | | | | | |
| | | Number
of Shares | | | Fair
Value | |
Copper – 0.0%* | |
Jiangxi Copper Company Ltd., Class H | | | 146,000 | | | $ | 171,746 | |
Data Processing & Outsourced Services – 0.0%* | |
EVERTEC Inc. | | | 30,800 | | | | 883,960 | |
Department Stores – 0.3% | |
El Puerto de Liverpool SAB de C.V. | | | 22,023 | | | | 141,092 | |
Hyundai Department Store Company Ltd. | | | 1,648 | | | | 133,518 | |
Next PLC | | | 91,819 | | | | 4,667,102 | |
| | | | 4,941,712 | |
Diversified Banks – 1.5% | |
Absa Group Ltd. | | | 79,454 | | | | 893,795 | |
Agricultural Bank of China Ltd., Class H | | | 2,972,000 | | | | 1,302,019 | |
Alliance Bank Malaysia Bhd | | | 29,800 | | | | 28,989 | |
Aozora Bank Ltd. | | | 8,300 | | | | 247,756 | |
Banco de Chile | | | 1,485,844 | | | | 212,321 | |
Banco de Credito e Inversiones S.A. | | | 2,437 | | | | 158,317 | |
Banco Santander Brasil S.A. | | | 34,665 | | | | 381,912 | |
Banco Santander Mexico S.A. Institucion de Banca Multiple Grupo Financiero Santand, Class B | | | 98,949 | | | | 122,595 | |
Bancolombia S.A. | | | 7,747 | | | | 72,520 | |
Bangkok Bank PCL | | | 3,000 | | | | 19,072 | |
Bangkok Bank PCL NVDR | | | 27,000 | | | | 168,335 | |
Bank Handlowy w Warszawie S.A. | | | 1,647 | | | | 30,294 | |
Bank Hapoalim BM | | | 279,442 | | | | 1,768,597 | |
Bank LeumiLe-Israel BM | | | 443,126 | | | | 2,680,042 | |
Bank of China Ltd., Class H | | | 889,631 | | | | 384,062 | |
Bank of Communications Company Ltd., Class H | | | 1,027,000 | | | | 801,468 | |
Bank Polska Kasa Opieki S.A. | | | 20,025 | | | | 581,014 | |
China CITIC Bank Corporation Ltd., Class H | | | 1,047,000 | | | | 636,543 | |
China Construction Bank Corp., Class H | | | 375,049 | | | | 309,453 | |
China Everbright Bank Company Ltd., Class H | | | 297,000 | | | | 128,597 | |
First Financial Holding Company Ltd. | | | 468,707 | | | | 304,979 | |
Grupo Financiero Banorte SAB de C.V., Class O | | | 19,126 | | | | 93,019 | |
Hong Leong Bank Bhd | | | 17,800 | | | | 87,869 | |
Hong Leong Financial Group Bhd | | | 15,300 | | | | 68,716 | |
Industrial & Commercial Bank of China Ltd., Class H | | | 750,178 | | | | 535,612 | |
Industrial Bank of Korea | | | 29,581 | | | | 372,480 | (a) |
Komercni Banka A/S | | | 7,849 | | | | 295,286 | |
Krung Thai Bank PCL NVDR | | | 410,100 | | | | 241,828 | |
MCB Bank Ltd. | | | 23,743 | | | | 33,185 | |
Mega Financial Holding Company Ltd. | | | 566,192 | | | | 478,013 | |
Mizrahi Tefahot Bank Ltd. | | | 34,913 | | | | 589,926 | |
Moneta Money Bank AS | | | 56,991 | | | | 183,523 | (d) |
Nedbank Group Ltd. | | | 46,977 | | | | 897,151 | |
Postal Savings Bank of China Company Ltd., Class H | | | 326,000 | | | | 171,966 | (d) |
RHB Bank Bhd | | | 82,222 | | | | 105,252 | |
Royal Bank of Canada | | | 120,230 | | | | 8,225,429 | |
Santander Bank Polska S.A. | | | 435 | | | | 41,477 | |
SinoPac Financial Holdings Company Ltd. | | | 728,106 | | | | 243,989 | |
Taiwan Business Bank | | | 449,514 | | | | 151,364 | |
Taiwan Cooperative Financial Holding Company Ltd. | | | 421,739 | | | | 242,174 | |
Turkiye Halk Bankasi A/S | | | 64,594 | | | | 85,237 | |
United Overseas Bank Ltd. | | | 196,676 | | | | 3,545,363 | |
| | | | 27,921,539 | |
Diversified Capital Markets – 0.0%* | |
Investec Ltd. | | | 33,693 | | | | 185,036 | |
Diversified Metals & Mining – 0.0%* | |
Ferroglobe PLC | | | 1,316 | | | | — | (c) |
Korea Zinc Company Ltd. | | | 331 | | | | 128,300 | |
| | | | 128,300 | |
Diversified Real Estate Activities – 0.2% | |
Barwa Real Estate Co. | | | 7,908 | | | | 86,676 | |
See Notes to Schedules of Investments and Notes to Financial Statements.
| | |
| State Street Total Return V.I.S. Fund | | |
| Schedule of Investments | | December 31, 2018 |
| | | | | | | | |
| | | Number
of Shares | | | Fair
Value | |
Swire Pacific Ltd., Class A | | | 245,341 | | | $ | 2,591,492 | |
The Wharf Holdings Ltd. | | | 575,000 | | | | 1,498,209 | |
| | | | 4,176,377 | |
Diversified REITs – 0.2% | |
Fibra Uno Administracion S.A. de C.V. | | | 53,000 | | | | 58,776 | |
Growthpoint Properties Ltd. | | | 348,749 | | | | 564,884 | |
Redefine Properties Ltd. | | | 489,390 | | | | 328,981 | |
The GPT Group | | | 740,036 | | | | 2,782,061 | |
| | | | 3,734,702 | |
Drug Retail – 0.0%* | |
Clicks Group Ltd. | | | 18,814 | | | | 250,396 | |
Electric Utilities – 0.6% | |
CEZ A/S | | | 1,452 | | | | 34,504 | |
CLP Holdings Ltd. | | | 145,500 | | | | 1,644,677 | |
Electricite de France S.A. | | | 140,995 | | | | 2,224,262 | |
Manila Electric Co. | | | 11,030 | | | | 79,707 | |
Tokyo Electric Power Company Holdings Inc. | | | 118,000 | | | | 702,310 | (a) |
Verbund AG | | | 140,515 | | | | 5,981,850 | |
| | | | 10,667,310 | |
Electronic Components – 0.0%* | |
Delta Electronics Inc. | | | 30,865 | | | | 130,039 | |
LG Display Company Ltd. | | | 3,476 | | | | 56,230 | (a) |
Samsung Electro-Mechanics Company Ltd. | | | 1,449 | | | | 134,407 | |
Yageo Corp. | | | 5,990 | | | | 62,167 | |
Zhen Ding Technology Holding Ltd. | | | 51,481 | | | | 134,326 | |
| | | | 517,169 | |
Electronic Equipment & Instruments – 0.0%* | |
China Railway Signal & Communication Corporation Ltd. Class H | | | 94,000 | | | | 65,793 | (d) |
Electronic Manufacturing Services – 0.0%* | |
Venture Corporation Ltd. | | | 82,707 | | | | 846,488 | |
Financial Exchanges & Data – 0.2% | |
ASX Ltd. | | | 57,720 | | | | 2,435,654 | |
Singapore Exchange Ltd. | | | 338,300 | | | | 1,774,648 | |
| | | | 4,210,302 | |
Food Distributors – 0.0%* | |
The SPAR Group Ltd. | | | 2,524 | | | | 36,408 | |
Food Retail – 0.4% | |
Colruyt S.A. | | | 94,801 | | | | 6,745,057 | |
J Sainsbury PLC | | | 293,311 | | | | 989,936 | |
| | | | 7,734,993 | |
Gas Utilities – 0.3% | |
Naturgy Energy Group S.A. | | | 45,779 | | | | 1,164,916 | |
Osaka Gas Company Ltd. | | | 166,372 | | | | 3,046,451 | |
Petronas Gas Bhd | | | 47,100 | | | | 218,831 | |
Tokyo Gas Company Ltd. | | | 12,600 | | | | 319,895 | |
| | | | 4,750,093 | |
General Merchandise Stores – 0.3% | |
Harvey Norman Holdings Ltd. | | | 408,326 | | | | 908,378 | |
Wesfarmers Ltd. | | | 212,717 | | | | 4,825,033 | |
| | | | 5,733,411 | |
Gold – 0.0%* | |
Zijin Mining Group Company Ltd., Class H | | | 672,000 | | | | 254,918 | |
Healthcare Distributors – 0.4% | |
Alfresa Holdings Corp. | | | 86,864 | | | | 2,219,203 | |
Medipal Holdings Corp. | | | 130,800 | | | | 2,807,583 | |
Suzuken Company Ltd. | | | 53,800 | | | | 2,741,120 | |
| | | | 7,767,906 | |
Healthcare Facilities – 0.0%* | |
Ryman Healthcare Ltd. | | | 57,465 | | | | 413,846 | |
Healthcare Services – 0.1% | |
Sonic Healthcare Ltd. | | | 78,608 | | | | 1,223,568 | |
Highways & Railtracks – 0.0%* | |
Jasa Marga Persero Tbk PT | | | 87 | | | | 26 | |
Jiangsu Expressway Company Ltd., Class H | | | 142,000 | | | | 198,055 | |
| | | | 198,081 | |
| | | | | | | | |
| | | Number
of Shares | | | Fair
Value | |
Home Building – 0.5% | |
Berkeley Group Holdings PLC | | | 115,149 | | | $ | 5,102,084 | |
Persimmon PLC | | | 178,485 | | | | 4,387,246 | |
| | | | 9,489,330 | |
Hotels, Resorts & Cruise Lines – 0.0%* | |
Flight Centre Travel Group Ltd. | | | 21,764 | | | | 657,614 | |
Household Products – 0.0%* | |
Hindustan Unilever Ltd. | | | 25,852 | | | | 673,804 | |
Unilever Indonesia Tbk PT | | | 37,300 | | | | 117,762 | |
| | | | 791,566 | |
Hypermarkets & Super Centers – 0.3% | |
Aeon Company Ltd. | | | 48,500 | | | | 950,196 | |
Coles Group Ltd. | | | 212,717 | | | | 1,758,097 | (a) |
METRO AG | | | 170,011 | | | | 2,603,292 | |
Sun Art Retail Group Ltd. | | | 131,250 | | | | 133,775 | |
Wal-Mart de Mexico SAB de C.V. | | | 76,413 | | | | 193,887 | |
| | | | 5,639,247 | |
Independent Power Producers & Energy Traders – 0.1% | |
Aboitiz Power Corp. | | | 101,400 | | | | 67,683 | |
Colbun S.A. | | | 127,081 | | | | 25,519 | |
Electricity Generating PCL NVDR | | | 15,400 | | | | 117,297 | |
Huadian Power International Corporation Ltd., Class H | | | 190,000 | | | | 85,665 | |
Uniper SE | | | 76,081 | | | | 1,965,567 | |
| | | | 2,261,731 | |
Industrial Conglomerates – 0.1% | |
DMCI Holdings Inc. | | | 211,600 | | | | 51,426 | |
Far Eastern New Century Corp. | | | 376,982 | | | | 342,187 | |
Grupo Carso SAB de C.V., Class A1 | | | 21,674 | | | | 77,490 | |
NWS Holdings Ltd. | | | 228,653 | | | | 469,025 | |
Shanghai Industrial Holdings Ltd. | | | 57,000 | | | | 115,320 | |
Sime Darby Bhd | | | 279,362 | | | | 162,243 | |
Turkiye Sise ve Cam Fabrikalari A/S | | | 79,242 | | | | 84,457 | |
| | | | 1,302,148 | |
Industrial Gases – 0.6% | |
Linde PLC | | | 73,614 | | | | 11,486,729 | |
Industrial Machinery – 0.2% | |
Atlas Copco AB, Class B | | | 91,886 | | | | 2,003,576 | |
Schindler Holding AG | | | 4,785 | | | | 925,158 | |
| | | | 2,928,734 | |
Industrial REITs – 0.1% | |
Segro PLC | | | 344,026 | | | | 2,578,959 | |
Integrated Oil & Gas – 0.6% | |
China Petroleum & Chemical Corp., Class H | | | 1,360,125 | | | | 971,102 | |
Equinor ASA | | | 83,732 | | | | 1,776,821 | |
Gazprom PJSC ADR | | | 305,961 | | | | 1,355,101 | |
LUKOIL PJSC ADR | | | 13,994 | | | | 998,332 | |
Oil & Natural Gas Corporation Ltd. | | | 117,431 | | | | 252,136 | |
PetroChina Company Ltd., Class H | | | 206,768 | | | | 128,878 | |
Polskie Gornictwo Naftowe i Gazownictwo S.A. | | | 203,476 | | | | 374,265 | |
Total S.A. | | | 110,259 | | | | 5,820,645 | |
| | | | 11,677,280 | |
Integrated Telecommunication Services – 1.4% | |
BCE Inc. | | | 167,971 | | | | 6,632,505 | |
China Communications Services Corporation Ltd., Class H | | | 280,000 | | | | 231,743 | |
China Telecom Corporation Ltd., Class H | | | 1,279,047 | | | | 653,463 | |
Chunghwa Telecom Company Ltd. | | | 372,000 | | | | 1,367,602 | |
Elisa Oyj | | | 14,499 | | | | 598,009 | |
KT Corp. | | | 310 | | | | 8,279 | (a) |
LG Uplus Corp. | | | 11,538 | | | | 182,511 | |
PCCW Ltd. | | | 952,000 | | | | 548,388 | |
Spark New Zealand Ltd. | | | 379,616 | | | | 1,056,389 | |
Swisscom AG | | | 15,831 | | | | 7,542,930 | |
Telenor ASA | | | 84,014 | | | | 1,625,142 | |
Telia Company AB | | | 363,986 | | | | 1,723,482 | |
Telkom S.A. SOC Ltd. | | | 32,997 | | | | 145,178 | |
TELUS Corp. | | | 149,035 | | | | 4,937,644 | |
| | | | 27,253,265 | |
See Notes to Schedules of Investments and Notes to Financial Statements.
| | |
| State Street Total Return V.I.S. Fund | | |
| Schedule of Investments | | December 31, 2018 |
| | | | | | | | |
| | | Number
of Shares | | | Fair
Value | |
Interactive Home Entertainment – 0.0%* | |
CD Projekt S.A. | | | 2,536 | | | $ | 98,287 | (a) |
Interactive Media & Services – 0.1% | |
Autohome Inc. ADR | | | 1,315 | | | | 102,872 | |
Momo Inc. ADR | | | 11,097 | | | | 263,554 | (a) |
Tencent Holdings Ltd. | | | 38,763 | | | | 1,554,610 | |
| | | | 1,921,036 | |
Internet & Direct Marketing Retail – 0.1% | |
Alibaba Group Holding Ltd. ADR | | | 7,647 | | | | 1,048,174 | (a) |
IT Consulting & Other Services – 1.0% | |
Accenture PLC, Class A | | | 92,608 | | | | 13,058,654 | (b) |
HCL Technologies Ltd. | | | 11,200 | | | | 154,705 | |
Infosys Ltd. | | | 71,533 | | | | 675,165 | |
Nomura Research Institute Ltd. | | | 35,610 | | | | 1,322,615 | |
Obic Company Ltd. | | | 32,600 | | | | 2,522,663 | |
Tata Consultancy Services Ltd. | | | 14,558 | | | | 394,744 | |
Tech Mahindra Ltd. | | | 37,518 | | | | 388,615 | |
Wipro Ltd. | | | 97,565 | | | | 462,356 | |
| | | | 18,979,517 | |
Leisure Products – 0.0%* | |
Sankyo Company Ltd. | | | 9,800 | | | | 373,367 | |
Life & Health Insurance – 0.8% | |
CNP Assurances | | | 144,083 | | | | 3,050,400 | |
Great-West Lifeco Inc. | | | 76,240 | | | | 1,573,029 | |
Hanwha Life Insurance Company Ltd. | | | 7,583 | | | | 28,679 | |
Liberty Holdings Ltd. | | | 15,119 | | | | 115,613 | |
MMI Holdings Ltd. | | | 107,774 | | | | 128,340 | (a) |
Poste Italiane S.p.A. | | | 707,874 | | | | 5,651,495 | (d) |
Power Corporation of Canada | | | 101,228 | | | | 1,818,072 | |
Power Financial Corp. | | | 76,958 | | | | 1,455,429 | |
Sun Life Financial Inc. | | | 29,565 | | | | 980,377 | |
| | | | 14,801,434 | |
Life Sciences Tools & Services – 0.2% | |
Divi’s Laboratories Ltd. | | | 9,350 | | | | 198,564 | |
Sartorius Stedim Biotech | | | 30,578 | | | | 3,053,340 | |
| | | | 3,251,904 | |
Marine – 0.0%* | |
COSCO SHIPPING Energy Transportation Company Ltd., Class H | | | 144,000 | | | | 71,914 | |
Costamare Inc. | | | 91,147 | | | | 400,135 | |
MISC Bhd | | | 76,900 | | | | 124,678 | |
| | | | 596,727 | |
Marine Ports & Services – 0.1% | |
COSCO SHIPPING Ports Ltd. | | | 122,746 | | | | 120,718 | |
Kamigumi Company Ltd. | | | 49,500 | | | | 1,017,837 | |
| | | | 1,138,555 | |
Motorcycle Manufacturers – 0.0%* | |
Bajaj Auto Ltd. | | | 5,984 | | | | 233,150 | |
Hero MotoCorp Ltd. | | | 2,799 | | | | 124,455 | |
| | | | 357,605 | |
Multi-Line Insurance – 1.3% | |
Allianz SE | | | 34,492 | | | | 6,905,687 | |
Assicurazioni Generali S.p.A. | | | 340,168 | | | | 5,677,400 | |
Baloise Holding AG | | | 21,726 | | | | 2,984,074 | |
BB Seguridade Participacoes S.A. | | | 82,146 | | | | 584,766 | |
Porto Seguro S.A. | | | 11,383 | | | | 153,164 | |
Sul America S.A. | | | 24,027 | | | | 177,300 | |
Zurich Insurance Group AG | | | 26,174 | | | | 7,782,105 | |
| | | | 24,264,496 | |
Multi-Sector Holdings – 0.5% | |
EXOR N.V. | | | 55,295 | | | | 2,987,327 | |
Groupe Bruxelles Lambert S.A. | | | 28,364 | | | | 2,466,841 | |
Industrivarden AB, Class C | | | 78,517 | | | | 1,587,016 | |
Kinnevik AB, Class B | | | 98,339 | | | | 2,370,336 | |
Pargesa Holding S.A. | | | 10,126 | | | | 727,761 | |
| | | | 10,139,281 | |
Office Services & Supplies – 0.1% | |
Societe BIC S.A. | | | 11,592 | | | | 1,181,362 | |
Oil & Gas Drilling – 0.0%* | |
Noble Corporation PLC | | | 78,466 | | | | 205,581 | (a) |
| | | | | | | | |
| | | Number
of Shares | | | Fair
Value | |
Oil & Gas Exploration & Production – 0.0%* | |
Oil & Gas Development Company Ltd. | | | 75,062 | | | $ | 69,248 | |
Tatneft PJSC ADR | | | 4,730 | | | | 297,990 | |
| | | | 367,238 | |
Oil & Gas Refining & Marketing – 0.2% | |
Cosan S.A. | | | 19,163 | | | | 165,437 | |
Idemitsu Kosan Company Ltd. | | | 12,400 | | | | 408,003 | |
JXTG Holdings Inc. | | | 592,362 | | | | 3,113,660 | |
Tupras Turkiye Petrol Rafinerileri A/S | | | 5,127 | | | | 112,468 | |
| | | | 3,799,568 | |
Oil & Gas Storage & Transportation – 0.1% | |
Ship Finance International Ltd. | | | 148,005 | | | | 1,558,493 | |
Other Diversified Financial Services – 0.0%* | |
RMB Holdings Ltd. | | | 82,855 | | | | 454,450 | |
Packaged Foods & Meats – 0.5% | |
China Huishan Dairy Holdings Company Ltd. | | | 55,000 | | | | — | (a,c) |
Chocoladefabriken Lindt & Spruengli AG | | | 882 | | | | 5,457,699 | |
Chocoladefabriken Lindt & Spruengli AG | | | 11 | | | | 817,914 | |
JBS S.A. | | | 32,821 | | | | 98,148 | |
Nestle Malaysia Bhd | | | 2,800 | | | | 99,872 | |
Nisshin Seifun Group Inc. | | | 129,800 | | | | 2,686,741 | |
PPB Group Bhd | | | 42,960 | | | | 182,755 | |
QL Resources Bhd | | | 76,200 | | | | 125,571 | |
Uni-President China Holdings Ltd. | | | 62,000 | | | | 53,849 | |
Yihai International Holding Ltd. | | | 55,000 | | | | 134,456 | |
| | | | 9,657,005 | |
Paper Products – 0.0%* | |
Indah Kiat Pulp & Paper Corp. Tbk PT | | | 36,300 | | | | 29,156 | |
Personal Products – 0.2% | |
L’Oreal S.A. | | | 18,359 | | | | 4,222,602 | |
Marico Ltd. | | | 47,075 | | | | 251,777 | |
| | | | 4,474,379 | |
Pharmaceuticals – 0.3% | |
Astellas Pharma Inc. | | | 209,008 | | | | 2,669,869 | |
China Traditional Chinese Medicine Holdings Company Ltd. | | | 130,000 | | | | 75,715 | |
Hisamitsu Pharmaceutical Company Inc. | | | 14,300 | | | | 791,150 | |
Luye Pharma Group Ltd. | | | 134,000 | | | | 93,277 | (d) |
SSY Group Ltd. | | | 176,000 | | | | 130,381 | |
Sumitomo Dainippon Pharma Company Ltd. | | | 8,200 | | | | 261,213 | |
Taisho Pharmaceutical Holdings Company Ltd. | | | 21,800 | | | | 2,191,624 | |
Tong Ren Tang Technologies Company Ltd., Class H | | | 21,000 | | | | 27,520 | |
| | | | 6,240,749 | |
Property & Casualty Insurance – 0.4% | |
DB Insurance Company Ltd. | | | 4,849 | | | | 305,941 | |
Direct Line Insurance Group PLC | | | 703,144 | | | | 2,854,035 | |
Hyundai Marine & Fire Insurance Company Ltd. | | | 7,345 | | | | 270,221 | |
Samsung Fire & Marine Insurance Company Ltd. | | | 3,615 | | | | 871,514 | |
Tryg A/S | | | 97,112 | | | | 2,438,232 | |
| | | | 6,739,943 | |
Publishing – 0.1% | |
Singapore Press Holdings Ltd. | | | 833,737 | | | | 1,437,478 | |
Real Estate Development – 0.2% | |
China Jinmao Holdings Group Ltd. | | | 92,000 | | | | 41,362 | |
China Overseas Land & Investment Ltd. | | | 56,000 | | | | 192,404 | |
China Resources Land Ltd. | | | 111,777 | | | | 429,728 | |
China Vanke Company Ltd., Class H | | | 9,645 | | | | 32,769 | |
KWG Group Holdings Ltd. | | | 47,000 | | | | 41,601 | (a) |
Land & Houses PCL NVDR | | | 369,100 | | | | 112,226 | |
Longfor Group Holdings Ltd. | | | 173,500 | | | | 518,549 | |
Shimao Property Holdings Ltd. | | | 136,500 | | | | 364,379 | |
Sino Land Company Ltd. | | | 582,767 | | | | 998,899 | |
See Notes to Schedules of Investments and Notes to Financial Statements.
| | |
| State Street Total Return V.I.S. Fund | | |
| Schedule of Investments | | December 31, 2018 |
| | | | | | | | | | |
| | | Number
of Shares | | | Fair
Value | |
Yuexiu Property Company Ltd. | | | 160,000 | | | $ | 29,428 | |
Yuzhou Properties Company Ltd. | | | 191,000 | | | | 78,797 | |
| | | | 2,840,142 | |
Real Estate Operating Companies – 0.2% | |
First Capital Realty Inc. | | | 85,194 | | | | 1,175,800 | |
Hysan Development Company Ltd. | | | 131,000 | | | | 623,264 | |
Swire Properties Ltd. | | | 525,600 | | | | 1,846,130 | |
Swiss Prime Site AG | | | 8,207 | | | | 662,271 | (a) |
| | | | 4,307,465 | |
Regional Banks – 0.1% | |
DGB Financial Group Inc. | | | 19,856 | | | | 147,879 | |
Popular Inc. | | | 29,200 | | | | 1,378,824 | |
Yamaguchi Financial Group Inc. | | | 115,000 | | | | 1,105,820 | |
| | | | 2,632,523 | |
Reinsurance – 0.2% | |
Hannover Rueck SE | | | 26,354 | | | | 3,545,897 | |
IRB Brasil Resseguros S/A | | | 12,815 | | | | 275,957 | |
| | | | 3,821,854 | |
Renewable Electricity – 0.0%* | |
Engie Brasil Energia S.A. | | | 23,968 | | | | 204,199 | |
Restaurants – 0.0%* | |
Jollibee Foods Corp. | | | 18,650 | | | | 103,491 | |
Retail REITs – 0.6% | |
CapitaLand Mall Trust | | | 2,166,089 | | | | 3,591,608 | |
Hyprop Investments Ltd. | | | 10,436 | | | | 59,126 | |
Link REIT | | | 372,500 | | | | 3,772,887 | |
Scentre Group | | | 143,210 | | | | 393,197 | |
Vicinity Centres | | | 1,674,852 | | | | 3,065,648 | |
| | | | 10,882,466 | |
Semiconductor Equipment – 0.0%* | |
Hanergy Thin Film Power Group Ltd. | | | 64,000 | | | | — | (a,c) |
Xinyi Solar Holdings Ltd. | | | 156,000 | | | | 54,794 | |
| | | | 54,794 | |
Semiconductors – 0.1% | |
Hua Hong Semiconductor Ltd. | | | 52,000 | | | | 96,304 | (d) |
Novatek Microelectronics Corp. | | | 68,000 | | | | 314,149 | |
Realtek Semiconductor Corp. | | | 53,770 | | | | 250,158 | |
SK Hynix Inc. | | | 5,233 | | | | 283,740 | (a) |
Taiwan Semiconductor Manufacturing Company Ltd. | | | 132,943 | | | | 975,328 | |
Vanguard International Semiconductor Corp. | | | 102,000 | | | | 197,449 | |
| | | | 2,117,128 | |
Soft Drinks – 0.0%* | |
Fraser & Neave Holdings Bhd | | | 10,200 | | | | 82,686 | |
Specialty Chemicals – 0.5% | |
Croda International PLC | | | 51,066 | | | | 3,047,014 | |
Givaudan S.A. | | | 1,346 | | | | 3,107,624 | |
Johnson Matthey PLC | | | 94,365 | | | | 3,363,929 | |
| | | | 9,518,567 | |
Specialty Stores – 0.0%* | |
JUMBO S.A. | | | 7,425 | | | | 107,966 | |
Steel – 0.1% | |
Angang Steel Company Ltd., Class H | | | 126,000 | | | | 86,904 | |
China Oriental Group Company Ltd. | | | 130,000 | | | | 77,375 | |
Eregli Demir ve Celik Fabrikalari TAS | | | 63,784 | | | | 86,566 | |
Maanshan Iron & Steel Company Ltd., Class H | | | 202,000 | | | | 89,011 | |
Maruichi Steel Tube Ltd. | | | 31,800 | | | | 1,004,302 | |
| | | | 1,344,158 | |
Technology Distributors – 0.0%* | |
Synnex Technology International Corp. | | | 166,400 | | | | 197,058 | |
WPG Holdings Ltd. | | | 176,920 | | | | 212,681 | |
| | | | 409,739 | |
Technology Hardware, Storage & Peripherals – 0.1% | |
Asustek Computer Inc. | | | 79,000 | | | | 517,894 | |
Chicony Electronics Company Ltd. | | | 68,647 | | | | 139,809 | |
Inventec Corp. | | | 294,000 | | | | 210,908 | |
Legend Holdings Corp., Class H | | | 9,800 | | | | 25,660 | (d) |
Lite-On Technology Corp. | | | 34,669 | | | | 45,794 | |
Micro-Star International Company Ltd. | | | 13,000 | | | | 32,313 | |
Quanta Computer Inc. | | | 300,000 | | | | 514,364 | |
| | | | | | | | | | | | |
| | | | Number
of Shares | | | Fair
Value | |
Samsung Electronics Company Ltd. | | | | 24,529 | | | $ | 850,755 | |
Wistron Corp. | | | | 333,195 | | | | 207,047 | |
| | | | 2,544,544 | |
Textiles – 0.0%* | |
Formosa Taffeta Company Ltd. | | | | 88,000 | | | | 98,917 | |
Ruentex Industries Ltd. | | | | 41,187 | | | | 105,322 | |
| | | | 204,239 | |
Tires & Rubber – 0.0%* | |
Hankook Tire Company Ltd. | | | | 1,125 | | | | 40,481 | |
Tobacco – 0.2% | |
British American Tobacco Malaysia Bhd | | | | 6,000 | | | | 52,385 | |
Gudang Garam Tbk PT | | | | 5,254 | | | | 30,554 | |
Hanjaya Mandala Sampoerna Tbk PT | | | | 573,700 | | | | 148,013 | |
ITC Ltd. | | | | 58,451 | | | | 235,805 | |
Swedish Match AB | | | | 105,681 | | | | 4,161,274 | |
| | | | 4,628,031 | |
Trading Companies & Distributors – 0.6% | |
Ferguson PLC | | | | 79,990 | | | | 5,111,081 | |
Marubeni Corp. | | | | 816,548 | | | | 5,748,545 | |
Posco Daewoo Corp. | | | | 5,793 | | | | 94,491 | |
| | | | 10,954,117 | |
Trucking – 0.1% | |
ComfortDelGro Corporation Ltd. | | | | 970,600 | | | | 1,531,027 | |
Water Utilities – 0.0%* | |
Aguas Andinas S.A., Class A | | | | 221,747 | | | | 121,967 | |
Guangdong Investment Ltd. | | | | 126,000 | | | | 243,653 | |
| | | | 365,620 | |
Wireless Telecommunication Services – 0.1% | |
China Mobile Ltd. | | | | 66,562 | | | | 640,596 | |
Far EasTone Telecommunications Company Ltd. | | | | 19,997 | | | | 49,705 | |
SK Telecom Company Ltd. | | | | 820 | | | | 198,055 | |
Taiwan Mobile Company Ltd. | | | | 176,762 | | | | 612,459 | |
Vodacom Group Ltd. | | | | 70,725 | | | | 648,988 | |
| | | | 2,149,803 | |
Total Common Stock
(Cost $418,582,131) | | | | 385,873,166 | |
Preferred Stock – 0.2% | |
Automobile Manufacturers – 0.1% | |
Bayerische Motoren Werke AG | | | | 13,249 | | | | 940,541 | |
Hyundai Motor Co. | | | | 2,420 | | | | 167,002 | |
Hyundai Motor Co. | | | | 2,290 | | | | 144,074 | |
| | | | 1,251,617 | |
Commodity Chemicals – 0.0%* | |
FUCHS PETROLUB SE | | | | 8,888 | | | | 365,568 | |
LG Chem Ltd. | | | | 464 | | | | 81,298 | |
| | | | 446,866 | |
Diversified Banks – 0.1% | |
Grupo Aval Acciones y Valores S.A. | | | | 202,526 | | | | 62,301 | |
Itausa—Investimentos Itau S.A. | | | | 378,047 | | | | 1,178,303 | |
| | | | 1,240,604 | |
Integrated Telecommunication Services – 0.0%* | |
Telefonica Brasil S.A. | | | | 3,027 | | | | 36,106 | |
Technology Hardware, Storage & Peripherals ��� 0.0%* | |
Samsung Electronics Company Ltd. | | | | 36,816 | | | | 1,047,596 | |
Total Preferred Stock
(Cost $4,185,809) | | | | 4,022,789 | |
Total Foreign Equity
(Cost $422,767,940) | | | | 389,895,955 | |
| | | | Principal
Amount ($) | | | Fair
Value | |
Bonds and Notes – 30.9% | |
U.S. Treasuries – 17.1% | |
U.S. Treasury Bonds | |
2.25% | | | 08/15/46 | | | $ | 1,600,000 | | | | 1,367,233 | |
2.50% | | | 02/15/45 - 05/15/46 | | | | 4,310,000 | | | | 3,893,116 | |
2.75% | | | 11/15/42 - 11/15/47 | | | | 2,150,000 | | | | 2,041,635 | |
See Notes to Schedules of Investments and Notes to Financial Statements.
| | |
| State Street Total Return V.I.S. Fund | | |
| Schedule of Investments | | December 31, 2018 |
| | | | | | | | | | |
| | | Principal
Amount ($) | | | Fair
Value | |
2.88% | | 05/15/43 - 11/15/46 | | $ | 2,400,000 | | | $ | 2,338,521 | |
3.00% | | 05/15/42 - 08/15/48 | | | 11,250,000 | | | | 11,219,078 | |
3.13% | | 08/15/44 - 05/15/48 | | | 3,000,000 | | | | 3,059,887 | |
3.38% | | 05/15/44 - 11/15/48 | | | 2,400,000 | | | | 2,557,444 | |
3.63% | | 08/15/43 - 02/15/44 | | | 1,740,000 | | | | 1,927,011 | |
3.75% | | 11/15/43 | | | 1,400,000 | | | | 1,580,964 | |
4.25% | | 05/15/39 - 11/15/40 | | | 2,000,000 | | | | 2,415,119 | |
4.38% | | 02/15/38 - 05/15/40 | | | 2,300,000 | | | | 2,818,851 | |
4.50% | | 02/15/36 | | | 2,000,000 | | | | 2,465,293 | |
4.63% | | 02/15/40 | | | 500,000 | | | | 633,631 | |
5.25% | | 02/15/29 | | | 200,000 | | | | 244,492 | |
5.50% | | 08/15/28 | | | 200,000 | | | | 247,086 | |
6.00% | | 02/15/26 | | | 827,000 | | | | 1,008,718 | |
6.38% | | 08/15/27 | | | 200,000 | | | | 256,916 | |
7.63% | | 11/15/22 - 02/15/25 | | | 500,000 | | | | 613,063 | |
7.88% | | 02/15/21 | | | 2,000,000 | | | | 2,220,431 | |
8.75% | | 05/15/20 | | | 1,200,000 | | | | 1,299,099 | |
U.S. Treasury Inflation Indexed Bonds | |
0.63% | | 02/15/43 | | | 1,429,818 | | | | 1,256,595 | |
0.75% | | 02/15/42 - 02/15/45 | | | 3,659,026 | | | | 3,303,620 | |
0.88% | | 02/15/47 | | | 576,153 | | | | 529,711 | |
1.00% | | 02/15/46 - 02/15/48 | | | 4,093,272 | | | | 3,886,620 | |
1.38% | | 02/15/44 | | | 2,061,519 | | | | 2,134,231 | |
1.75% | | 01/15/28 | | | 965,632 | | | | 1,026,299 | |
2.13% | | 02/15/41 | | | 1,096,975 | | | | 1,298,424 | |
2.38% | | 01/15/25 | | | 2,515,331 | | | | 2,720,635 | |
2.50% | | 01/15/29 | | | 1,531,127 | | | | 1,744,967 | |
3.38% | | 04/15/32 | | | 997,234 | | | | 1,281,757 | |
3.88% | | 04/15/29 | | | 2,307,300 | | | | 2,940,035 | |
U.S. Treasury Inflation Indexed Notes | |
0.13% | | 04/15/20 - 07/15/26 | | | 31,872,425 | | | | 30,855,157 | |
0.25% | | 01/15/25 | | | 6,405,720 | | | | 6,136,939 | |
0.38% | | 07/15/23 - 07/15/27 | | | 13,514,253 | | | | 13,023,285 | |
0.50% | | 01/15/28 | | | 3,998,124 | | | | 3,818,026 | |
0.63% | | 07/15/21 - 01/15/26 | | | 10,487,425 | | | | 10,338,783 | |
0.75% | | 07/15/28 | | | 4,911,026 | | | | 4,811,039 | |
1.13% | | 01/15/21 | | | 3,467,910 | | | | 3,453,799 | |
1.25% | | 07/15/20 | | | 2,319,000 | | | | 2,314,738 | |
1.38% | | 01/15/20 | | | 818,552 | | | | 813,528 | |
U.S. Treasury Notes | |
1.13% | | 03/31/20 - 09/30/21 | | | 6,500,000 | | | | 6,301,904 | |
1.25% | | 01/31/20 - 10/31/21 | | | 6,500,000 | | | | 6,329,347 | |
1.38% | | 01/31/20 - 05/31/21 | | | 13,000,000 | | | | 12,756,795 | |
1.50% | | 01/31/22 - 08/15/26 | | | 2,900,000 | | | | 2,743,313 | |
1.63% | | 07/31/20 - 05/15/26 | | | 11,540,000 | | | | 11,094,891 | |
1.75% | | 10/31/20 - 05/15/23 | | | 9,600,000 | | | | 9,393,955 | |
1.88% | | 12/15/20 - 09/30/22 | | | 19,600,000 | | | | 19,239,230 | |
2.00% | | 01/31/20 - 11/15/26 | | | 22,644,000 | | | | 22,197,287 | |
2.13% | | 08/31/20 - 05/15/25 | | | 13,000,000 | | | | 12,823,142 | |
2.25% | | 03/31/21 - 11/15/27 | | | 17,390,000 | | | | 17,029,843 | |
2.38% | | 01/31/23 - 05/15/27 | | | 5,000,000 | | | | 4,940,344 | |
2.50% | | 05/31/20 - 01/31/25 | | | 8,500,000 | | | | 8,492,210 | |
2.63% | | 07/31/20 - 12/31/25 | | | 10,885,000 | | | | 10,919,156 | |
2.75% | | 11/30/20 - 02/15/28 | | | 18,800,000 | | | | 18,978,109 | |
2.88% | | 10/15/21 - 08/15/28 | | | 12,900,000 | | | | 13,101,339 | |
3.00% | | 10/31/25 | | | 500,000 | | | | 512,970 | |
3.13% | | 05/15/21 - 11/15/28 | | | 3,000,000 | | | | 3,078,383 | |
3.63% | | 02/15/20 - 02/15/21 | | | 2,700,000 | | | | 2,737,798 | |
| | | | 324,565,792 | |
Agency Mortgage Backed – 6.4% | |
Federal Home Loan Banks | |
2.13% | | 02/11/20 | | | 2,000,000 | | | | 1,992,440 | |
2.38% | | 03/30/20 | | | 1,000,000 | | | | 997,850 | |
3.25% | | 11/16/28 | | | 125,000 | | | | 127,280 | |
Federal Home Loan Mortgage Corp. | |
1.13% | | 08/12/21 | | | 637,000 | | | | 615,227 | |
2.38% | | 01/13/22 | | | 1,100,000 | | | | 1,095,490 | |
2.50% | | 07/01/28 - 02/01/32 | | | 1,325,061 | | | | 1,295,111 | |
2.51% | | 11/25/22 | | | 300,000 | | | | 295,464 | |
3.00% | | 05/01/30 - 03/01/48 | | | 11,866,622 | | | | 11,679,665 | |
3.50% | | 03/01/26 - 03/01/47 | | | 8,910,749 | | | | 8,954,765 | |
4.00% | | 06/01/42 - 12/01/48 | | | 5,753,469 | | | | 5,884,844 | |
4.50% | | 05/01/42 - 01/01/45 | | | 82,026 | | | | 85,818 | |
5.00% | | 06/01/41 | | | 1,408,176 | | | | 1,507,335 | |
5.50% | | 01/01/38 - 04/01/39 | | | 347,698 | | | | 374,591 | |
6.00% | | 06/01/37 - 11/01/37 | | | 326,223 | | | | 360,477 | |
| | | | | | | | | | |
| | | Principal
Amount ($) | | | Fair
Value | |
6.25% | | 07/15/32 | | $ | 250,000 | | | $ | 334,500 | |
3.50% | | TBA | | | 500,000 | | | | 506,235 | (e) |
4.50% | | TBA | | | 775,000 | | | | 802,086 | (e) |
Federal National Mortgage Assoc. | |
1.50% | | 07/30/20 | | | 500,000 | | | | 491,970 | |
1.88% | | 09/24/26 | | | 1,000,000 | | | | 930,630 | |
2.13% | | 04/24/26 | | | 700,000 | | | | 667,821 | |
2.50% | | 09/01/28 - 08/01/30 | | | 1,055,851 | | | | 1,035,717 | |
3.00% | | 01/01/28 - 05/01/47 | | | 11,025,513 | | | | 10,907,561 | |
3.50% | | 01/01/27 - 09/01/48 | | | 16,415,942 | | | | 16,502,218 | |
4.00% | | 10/01/41 - 11/01/48 | | | 10,167,369 | | | | 10,417,597 | |
4.50% | | 01/01/27 - 03/01/46 | | | 3,904,851 | | | | 4,085,857 | |
5.00% | | 12/01/39 - 05/01/41 | | | 287,015 | | | | 304,624 | |
5.50% | | 12/01/35 - 04/01/38 | | | 1,201,340 | | | | 1,294,347 | |
6.00% | | 03/01/34 - 08/01/37 | | | 1,617,508 | | | | 1,785,954 | |
6.63% | | 11/15/30 | | | 100,000 | | | | 134,347 | |
4.00% | | TBA | | | 1,550,000 | | | | 1,583,250 | (e) |
4.50% | | TBA | | | 1,250,000 | | | | 1,294,000 | (e) |
Government National Mortgage Assoc. | |
2.50% | | 05/20/45 | | | 249,227 | | | | 237,805 | |
3.00% | | 10/15/42 - 06/20/47 | | | 7,491,703 | | | | 7,405,374 | |
3.50% | | 03/20/45 - 08/20/48 | | | 11,928,847 | | | | 12,038,600 | |
4.00% | | 12/20/40 - 09/20/47 | | | 6,893,972 | | | | 7,102,040 | |
4.50% | | 05/20/40 - 11/20/48 | | | 2,449,581 | | | | 2,551,326 | |
5.00% | | 08/15/41 | | | 2,009,447 | | | | 2,148,218 | |
3.50% | | TBA | | | 400,000 | | | | 402,760 | (e) |
4.00% | | TBA | | | 250,000 | | | | 256,050 | (e) |
4.50% | | TBA | | | 1,100,000 | | | | 1,137,741 | (e) |
| | | | 121,624,985 | |
Agency Collateralized Mortgage Obligations – 0.1% | |
Federal Home Loan Mortgage Corp. | |
2.75% | | 01/25/26 | | | 300,000 | | | | 292,423 | |
3.06% | | 07/25/23 | | | 600,000 | | | | 602,020 | (f) |
3.30% | | 04/25/23 | | | 100,000 | | | | 101,340 | (f) |
3.39% | | 03/25/24 | | | 200,000 | | | | 203,398 | |
3.49% | | 01/25/24 | | | 300,000 | | | | 306,227 | |
3.85% | | 06/25/28 | | | 250,000 | | | | 259,335 | |
3.97% | | 01/25/21 | | | 200,000 | | | | 203,018 | (f) |
4.33% | | 10/25/20 | | | 50,000 | | | | 50,819 | (f) |
Federal National Mortgage Assoc. | |
2.78% | | 06/25/21 | | | 304,743 | | | | 303,314 | (f) |
3.08% | | 06/25/27 | | | 261,000 | | | | 256,715 | (f) |
3.64% | | 08/25/30 | | | 200,000 | | | | 201,359 | (f) |
| | | | 2,779,968 | |
Asset Backed – 0.1% | |
American Express Credit Account Master Trust2018-8 | |
3.18% | | 04/15/24 | | | 171,000 | | | | 172,250 | |
Americredit Automobile Receivables Trust2018-1 | |
3.50% | | 01/18/24 | | | 75,000 | | | | 75,131 | |
BA Credit Card Trust | |
3.10% | | 12/15/23 | | | 200,000 | | | | 201,047 | |
Citibank Credit Card Issuance Trust | |
3.21% | | 12/07/24 | | | 300,000 | | | | 302,854 | |
Discover Card Execution Note Trust | |
3.32% | | 03/15/24 | | | 65,000 | | | | 65,702 | |
Drive Auto Receivables Trust2018-2 | |
4.14% | | 08/15/24 | | | 150,000 | | | | 151,278 | |
Ford Credit Auto Lease Trust | |
3.19% | | 12/15/21 | | | 40,000 | | | | 40,012 | |
Ford Credit Floorplan Master Owner Trust A | |
2.16% | | 09/15/22 | | | 250,000 | | | | 246,439 | |
GM Financial Automobile Leasing Trust2018-2 | |
3.06% | | 06/21/21 | | | 100,000 | | | | 99,875 | |
Honda Auto Receivables Owner Trust | |
2.60% | | 02/15/22 | | | 180,000 | | | | 178,878 | |
Nissan Auto Receivables2018-B Owner Trust | |
3.06% | | 03/15/23 | | | 115,000 | | | | 115,136 | |
Santander Drive Auto Receivables Trust2018-2 | |
3.03% | | 09/15/22 | | | 60,000 | | | | 59,887 | |
Santander Drive Auto Receivables Trust2018-3 | |
3.03% | | 02/15/22 | | | 50,000 | | | | 49,954 | |
Synchrony Credit Card Master Note Trust2016-2 | |
2.21% | | 05/15/24 | | | 100,000 | | | | 98,009 | |
Toyota Auto Receivables2018-B Owner Trust | |
2.96% | | 09/15/22 | | | 100,000 | | | | 100,043 | |
See Notes to Schedules of Investments and Notes to Financial Statements.
| | |
| State Street Total Return V.I.S. Fund | | |
| Schedule of Investments | | December 31, 2018 |
| | | | | | | | | | |
| | | Principal
Amount ($) | | | Fair
Value | |
World Omni Auto Receivables Trust2018-D | |
3.33% | | 04/15/24 | | $ | 50,000 | | | $ | 50,429 | |
World Omni Automobile Lease Securitization Trust2018-B | |
3.19% | | 12/15/21 | | | 50,000 | | | | 50,062 | |
| | | | 2,056,986 | |
Corporate Notes – 6.4% | |
21st Century Fox America Inc. | |
3.38% | | 11/15/26 | | | 100,000 | | | | 98,637 | |
4.75% | | 11/15/46 | | | 100,000 | | | | 106,755 | |
6.65% | | 11/15/37 | | | 179,000 | | | | 230,248 | |
3M Co. | |
3.00% | | 09/14/21 - 08/07/25 | | | 50,000 | | | | 49,156 | |
3.25% | | 02/14/24 | | | 25,000 | | | | 25,146 | |
3.63% | | 09/14/28 | | | 25,000 | | | | 25,416 | |
4.00% | | 09/14/48 | | | 25,000 | | | | 24,814 | |
Abbott Laboratories | |
2.55% | | 03/15/22 | | | 130,000 | | | | 126,659 | |
3.75% | | 11/30/26 | | | 57,000 | | | | 56,331 | |
4.75% | | 11/30/36 | | | 100,000 | | | | 104,454 | |
4.90% | | 11/30/46 | | | 100,000 | | | | 105,124 | |
AbbVie Inc. | |
2.30% | | 05/14/21 | | | 100,000 | | | | 97,603 | |
3.75% | | 11/14/23 | | | 35,000 | | | | 34,795 | |
4.25% | | 11/14/28 | | | 15,000 | | | | 14,609 | |
4.30% | | 05/14/36 | | | 100,000 | | | | 90,811 | |
4.40% | | 11/06/42 | | | 150,000 | | | | 132,270 | |
4.50% | | 05/14/35 | | | 70,000 | | | | 64,772 | |
4.70% | | 05/14/45 | | | 150,000 | | | | 137,128 | |
4.88% | | 11/14/48 | | | 125,000 | | | | 116,656 | |
Adobe Inc. | |
3.25% | | 02/01/25 | | | 70,000 | | | | 68,868 | |
AerCap Ireland Capital DAC/AerCap Global Aviation Trust | |
4.45% | | 10/01/25 | | | 100,000 | | | | 94,722 | |
AerCap Ireland Capital DAC/AerCap Global Aviation Trust | |
3.95% | | 02/01/22 | | | 100,000 | | | | 98,030 | |
Aetna Inc. | |
2.75% | | 11/15/22 | | | 50,000 | | | | 47,908 | |
Aflac Inc. | |
3.63% | | 11/15/24 | | | 150,000 | | | | 149,704 | |
African Development Bank | |
2.13% | | 11/16/22 | | | 100,000 | | | | 98,112 | |
3.00% | | 09/20/23 | | | 150,000 | | | | 152,074 | |
Air Lease Corp. | |
3.88% | | 04/01/21 - 07/03/23 | | | 150,000 | | | | 149,074 | |
Aircastle Ltd. | |
4.13% | | 05/01/24 | | | 20,000 | | | | 18,833 | |
5.00% | | 04/01/23 | | | 20,000 | | | | 19,973 | |
5.13% | | 03/15/21 | | | 20,000 | | | | 20,315 | |
5.50% | | 02/15/22 | | | 20,000 | | | | 20,490 | |
7.63% | | 04/15/20 | | | 10,000 | | | | 10,459 | |
Alabama Power Co. | |
3.70% | | 12/01/47 | | | 100,000 | | | | 91,601 | |
Alexandria Real Estate Equities Inc. | |
3.45% | | 04/30/25 | | | 100,000 | | | | 96,226 | |
4.70% | | 07/01/30 | | | 15,000 | | | | 15,189 | |
Alibaba Group Holding Ltd. | |
3.13% | | 11/28/21 | | | 200,000 | | | | 198,366 | |
4.20% | | 12/06/47 | | | 60,000 | | | | 53,284 | |
Allergan Finance LLC | |
3.25% | | 10/01/22 | | | 150,000 | | | | 146,109 | |
Allergan Funding SCS | |
4.75% | | 03/15/45 | | | 100,000 | | | | 94,985 | |
Alphabet Inc. | |
3.38% | | 02/25/24 | | | 125,000 | | | | 126,765 | |
Altria Group Inc. | |
2.63% | | 09/16/26 | | | 100,000 | | | | 86,892 | |
4.25% | | 08/09/42 | | | 213,000 | | | | 171,661 | |
5.38% | | 01/31/44 | | | 70,000 | | | | 65,272 | |
Amazon.com Inc. | |
1.90% | | 08/21/20 | | | 100,000 | | | | 98,526 | |
3.15% | | 08/22/27 | | | 100,000 | | | | 96,473 | |
3.88% | | 08/22/37 | | | 100,000 | | | | 97,273 | |
4.25% | | 08/22/57 | | | 100,000 | | | | 98,673 | |
4.80% | | 12/05/34 | | | 150,000 | | | | 161,848 | |
America Movil SAB de C.V. | |
3.13% | | 07/16/22 | | | 150,000 | | | | 147,018 | |
| | | | | | | | | | |
| | | Principal
Amount ($) | | | Fair
Value | |
American Campus Communities Operating Partnership LP | |
3.63% | | 11/15/27 | | $ | 30,000 | | | $ | 28,112 | |
American Electric Power Company Inc. | |
3.20% | | 11/13/27 | | | 100,000 | | | | 94,637 | |
American Express Co. | |
2.20% | | 10/30/20 | | | 120,000 | | | | 117,758 | |
3.00% | | 10/30/24 | | | 100,000 | | | | 95,675 | |
3.38% | | 05/17/21 | | | 50,000 | | | | 50,063 | |
3.40% | | 02/27/23 | | | 100,000 | | | | 99,280 | |
3.63% | | 12/05/24 | | | 150,000 | | | | 146,623 | |
3.70% | | 11/05/21 | | | 25,000 | | | | 25,244 | |
American Financial Group Inc. | |
3.50% | | 08/15/26 | | | 65,000 | | | | 60,927 | |
American Honda Finance Corp. | |
2.15% | | 03/13/20 | | | 200,000 | | | | 197,698 | |
2.60% | | 11/16/22 | | | 100,000 | | | | 97,353 | |
American International Group Inc. | |
4.50% | | 07/16/44 | | | 150,000 | | | | 133,337 | |
4.88% | | 06/01/22 | | | 200,000 | | | | 207,298 | |
American Tower Corp. | |
3.50% | | 01/31/23 | | | 150,000 | | | | 147,570 | |
AmerisourceBergen Corp. | |
3.45% | | 12/15/27 | | | 100,000 | | | | 92,994 | |
Amgen Inc. | |
2.20% | | 05/11/20 | | | 300,000 | | | | 296,307 | |
3.20% | | 11/02/27 | | | 100,000 | | | | 93,995 | |
4.66% | | 06/15/51 | | | 105,000 | | | | 99,438 | |
Anadarko Petroleum Corp. | |
6.20% | | 03/15/40 | | | 142,000 | | | | 148,336 | |
Analog Devices Inc. | |
2.50% | | 12/05/21 | | | 200,000 | | | | 194,916 | |
Andeavor Logistics LP/Tesoro Logistics Finance Corp. | |
4.25% | | 12/01/27 | | | 35,000 | | | | 32,979 | |
Anheuser-Busch Companies LLC/Anheuser-Busch InBev Worldwide Inc. | |
3.65% | | 02/01/26 | | | 200,000 | | | | 188,992 | (d) |
4.70% | | 02/01/36 | | | 150,000 | | | | 138,399 | (d) |
4.90% | | 02/01/46 | | | 220,000 | | | | 203,562 | (d) |
Anheuser-Busch InBev Finance Inc. | |
2.65% | | 02/01/21 | | | 250,000 | | | | 245,732 | |
3.70% | | 02/01/24 | | | 150,000 | | | | 147,100 | |
Anheuser-Busch InBev Worldwide Inc. | |
2.50% | | 07/15/22 | | | 242,000 | | | | 230,991 | |
3.50% | | 01/12/24 | | | 25,000 | | | | 24,308 | |
4.00% | | 04/13/28 | | | 155,000 | | | | 148,271 | |
4.38% | | 04/15/38 | | | 15,000 | | | | 13,424 | |
4.60% | | 04/15/48 | | | 135,000 | | | | 120,809 | |
4.75% | | 04/15/58 | | | 50,000 | | | | 43,482 | |
Anthem Inc. | |
3.30% | | 01/15/23 | | | 100,000 | | | | 98,394 | |
3.70% | | 08/15/21 | | | 237,000 | | | | 238,536 | |
4.38% | | 12/01/47 | | | 65,000 | | | | 60,493 | |
Aon Corp. | |
4.50% | | 12/15/28 | | | 100,000 | | | | 101,209 | |
Apache Corp. | |
4.38% | | 10/15/28 | | | 25,000 | | | | 23,336 | |
5.10% | | 09/01/40 | | | 150,000 | | | | 135,482 | |
Apple Inc. | |
1.80% | | 05/11/20 | | | 200,000 | | | | 197,588 | |
2.00% | | 11/13/20 | | | 50,000 | | | | 49,334 | |
2.25% | | 02/23/21 | | | 200,000 | | | | 197,726 | |
2.40% | | 01/13/23 | | | 50,000 | | | | 48,569 | |
2.50% | | 02/09/22 | | | 150,000 | | | | 147,873 | |
2.75% | | 01/13/25 | | | 50,000 | | | | 48,133 | |
3.00% | | 11/13/27 | | | 100,000 | | | | 95,094 | |
3.25% | | 02/23/26 | | | 160,000 | | | | 156,042 | |
3.75% | | 11/13/47 | | | 50,000 | | | | 46,203 | |
4.38% | | 05/13/45 | | | 165,000 | | | | 168,183 | |
4.50% | | 02/23/36 | | | 150,000 | | | | 158,122 | |
4.65% | | 02/23/46 | | | 185,000 | | | | 195,600 | |
Applied Materials Inc. | |
3.90% | | 10/01/25 | | | 160,000 | | | | 161,141 | |
Aptiv Corp. | |
4.15% | | 03/15/24 | | | 150,000 | | | | 149,530 | |
ArcelorMittal | |
5.25% | | 08/05/20 | | | 30,000 | | | | 30,330 | |
5.50% | | 03/01/21 | | | 25,000 | | | | 25,817 | |
See Notes to Schedules of Investments and Notes to Financial Statements.
| | |
| State Street Total Return V.I.S. Fund | | |
| Schedule of Investments | | December 31, 2018 |
| | | | | | | | | | |
| | | Principal
Amount ($) | | | Fair
Value | |
6.13% | | 06/01/25 | | $ | 20,000 | | | $ | 20,932 | |
6.25% | | 02/25/22 | | | 25,000 | | | | 26,417 | |
7.00% | | 10/15/39 | | | 28,000 | | | | 29,317 | |
Arch Capital Finance LLC | |
4.01% | | 12/15/26 | | | 100,000 | | | | 100,183 | |
5.03% | | 12/15/46 | | | 100,000 | | | | 103,401 | |
Archer-Daniels-Midland Co. | |
4.02% | | 04/16/43 | | | 120,000 | | | | 113,231 | |
Arrow Electronics Inc. | |
4.00% | | 04/01/25 | | | 40,000 | | | | 38,779 | |
Ascension Health | |
3.95% | | 11/15/46 | | | 25,000 | | | | 23,957 | |
Asian Development Bank | |
1.75% | | 01/10/20 | | | 100,000 | | | | 99,176 | |
2.13% | | 03/19/25 | | | 500,000 | | | | 482,350 | |
2.25% | | 01/20/21 | | | 200,000 | | | | 198,714 | |
2.75% | | 03/17/23 | | | 295,000 | | | | 296,000 | |
3.13% | | 09/26/28 | | | 25,000 | | | | 25,542 | |
Assurant Inc. | |
4.90% | | 03/27/28 | | | 50,000 | | | | 49,874 | |
AstraZeneca PLC | |
3.50% | | 08/17/23 | | | 25,000 | | | | 24,762 | |
4.00% | | 01/17/29 | | | 20,000 | | | | 19,866 | |
4.38% | | 08/17/48 | | | 20,000 | | | | 18,973 | |
6.45% | | 09/15/37 | | | 150,000 | | | | 179,550 | |
AT&T Inc. | |
2.45% | | 06/30/20 | | | 200,000 | | | | 197,622 | |
4.10% | | 02/15/28 | | | 206,000 | | | | 198,046 | |
4.30% | | 02/15/30 | | | 120,000 | | | | 113,750 | |
4.35% | | 06/15/45 | | | 150,000 | | | | 127,314 | |
4.50% | | 05/15/35 - 03/09/48 | | | 245,000 | | | | 215,092 | |
4.75% | | 05/15/46 | | | 150,000 | | | | 133,335 | |
5.15% | | 03/15/42 | | | 150,000 | | | | 140,115 | |
5.20% | | 03/15/20 | | | 300,000 | | | | 306,705 | |
5.55% | | 08/15/41 | | | 254,000 | | | | 247,533 | |
Atmos Energy Corp. | |
4.30% | | 10/01/48 | | | 100,000 | | | | 99,587 | |
Australia & New Zealand Banking Group Ltd. | |
3.70% | | 11/16/25 | | | 150,000 | | | | 149,277 | |
AutoNation Inc. | |
3.80% | | 11/15/27 | | | 50,000 | | | | 44,587 | |
AvalonBay Communities Inc. | |
3.20% | | 01/15/28 | | | 40,000 | | | | 37,999 | |
3.45% | | 06/01/25 | | | 115,000 | | | | 113,185 | |
AXA S.A. | |
8.60% | | 12/15/30 | | | 100,000 | | | | 123,595 | |
Baidu Inc. | |
3.88% | | 09/29/23 | | | 100,000 | | | | 99,658 | |
4.38% | | 03/29/28 | | | 100,000 | | | | 98,311 | |
Baker Hughes a GE Company LLC/Baker HughesCo-Obligor Inc. | |
2.77% | | 12/15/22 | | | 50,000 | | | | 48,116 | |
3.34% | | 12/15/27 | | | 50,000 | | | | 45,992 | |
4.08% | | 12/15/47 | | | 50,000 | | | | 41,185 | |
Banco Santander S.A. | |
3.13% | | 02/23/23 | | | 100,000 | | | | 94,595 | |
3.80% | | 02/23/28 | | | 100,000 | | | | 89,057 | |
4.25% | | 04/11/27 | | | 100,000 | | | | 92,845 | |
Bank of America Corp. | |
2.15% | | 11/09/20 | | | 200,000 | | | | 196,146 | |
2.25% | | 04/21/20 | | | 300,000 | | | | 296,637 | |
3.50% | | 04/19/26 | | | 145,000 | | | | 139,464 | |
3.88% | | 08/01/25 | | | 150,000 | | | | 148,461 | |
3.95% | | 04/21/25 | | | 155,000 | | | | 150,215 | |
4.00% | | 04/01/24 | | | 150,000 | | | | 150,880 | |
4.18% | | 11/25/27 | | | 100,000 | | | | 96,020 | |
6.11% | | 01/29/37 | | | 100,000 | | | | 109,908 | |
Bank of America Corp. (2.37% fixed rate until 07/21/20; 0.66% + 3 month USD LIBOR thereafter) | |
2.37% | | 07/21/21 | | | 300,000 | | | | 294,906 | (f) |
Bank of America Corp. (3.42% fixed rate until 12/20/27; 1.04% + 3 month USD LIBOR thereafter) | |
3.42% | | 12/20/28 | | | 107,000 | | | | 99,647 | (f) |
Bank of America Corp. (3.50% fixed rate until 05/17/21; 0.63% + 3 month USD LIBOR thereafter) | |
3.50% | | 05/17/22 | | | 100,000 | | | | 99,966 | (f) |
| | | | | | | | | | |
| | | Principal
Amount ($) | | | Fair
Value | |
Bank of America Corp. (3.55% fixed rate until 03/05/23; 0.78% + 3 month USD LIBOR thereafter) | |
3.55% | | 03/05/24 | | $ | 100,000 | | | $ | 98,688 | (f) |
Bank of America Corp. (3.95% fixed rate until 01/23/48; 1.19% + 3 month USD LIBOR thereafter) | |
3.95% | | 01/23/49 | | | 200,000 | | | | 178,026 | (f) |
Bank of America Corp. (3.97% fixed rate until 03/05/28; 1.07% + 3 month USD LIBOR thereafter) | |
3.97% | | 03/05/29 | | | 100,000 | | | | 97,278 | (f) |
Bank of America Corp. (4.24% fixed rate until 04/24/37; 1.81% + 3 month USD LIBOR thereafter) | |
4.24% | | 04/24/38 | | | 150,000 | | | | 142,215 | (f) |
Bank of Montreal, Series MTN | |
3.10% | | 07/13/20 - 04/13/21 | | | 140,000 | | | | 140,021 | |
Barclays Bank PLC | |
2.65% | | 01/11/21 | | | 200,000 | | | | 195,932 | |
Barclays PLC | |
3.65% | | 03/16/25 | | | 150,000 | | | | 139,422 | |
Barclays PLC (4.61% fixed rate until 02/15/22; 1.40% + 3 month USD LIBOR thereafter) | |
4.61% | | 02/15/23 | | | 200,000 | | | | 198,162 | (f) |
Barclays PLC (4.97% fixed rate until 05/16/28; 1.90% + 3 month USD LIBOR thereafter) | |
4.97% | | 05/16/29 | | | 100,000 | | | | 96,194 | (f) |
BAT Capital Corp. | |
2.30% | | 08/14/20 | | | 100,000 | | | | 97,646 | |
2.76% | | 08/15/22 | | | 100,000 | | | | 94,399 | |
3.22% | | 08/15/24 | | | 100,000 | | | | 91,981 | |
3.56% | | 08/15/27 | | | 100,000 | | | | 88,634 | |
4.39% | | 08/15/37 | | | 100,000 | | | | 82,180 | |
Baxalta Inc. | |
4.00% | | 06/23/25 | | | 30,000 | | | | 29,253 | |
Baxter International Inc. | |
2.60% | | 08/15/26 | | | 130,000 | | | | 118,723 | |
BB&T Corp. | |
2.15% | | 02/01/21 | | | 100,000 | | | | 97,879 | |
2.85% | | 10/26/24 | | | 50,000 | | | | 48,032 | |
3.75% | | 12/06/23 | | | 200,000 | | | | 201,766 | |
Becton Dickinson and Co. | |
3.70% | | 06/06/27 | | | 100,000 | | | | 94,712 | |
3.73% | | 12/15/24 | | | 50,000 | | | | 48,346 | |
Berkshire Hathaway Energy Co. | |
6.13% | | 04/01/36 | | | 194,000 | | | | 231,382 | |
Berkshire Hathaway Finance Corp. | |
3.00% | | 05/15/22 | | | 200,000 | | | | 199,412 | |
4.20% | | 08/15/48 | | | 200,000 | | | | 198,596 | |
Best Buy Company Inc. | |
4.45% | | 10/01/28 | | | 25,000 | | | | 23,893 | |
Biogen Inc. | |
4.05% | | 09/15/25 | | | 80,000 | | | | 79,743 | |
5.20% | | 09/15/45 | | | 150,000 | | | | 153,756 | |
Black Hills Corp. | |
4.35% | | 05/01/33 | | | 30,000 | | | | 30,055 | |
Booking Holdings Inc. | |
2.75% | | 03/15/23 | | | 100,000 | | | | 96,458 | |
3.55% | | 03/15/28 | | | 100,000 | | | | 94,083 | |
Boston Properties LP | |
3.85% | | 02/01/23 | | | 150,000 | | | | 150,202 | |
Boston Scientific Corp. | |
4.00% | | 03/01/28 | | | 100,000 | | | | 97,303 | |
4.13% | | 10/01/23 | | | 100,000 | | | | 101,501 | |
BP Capital Markets America Inc. | |
3.22% | | 11/28/23 | | | 100,000 | | | | 98,673 | |
3.94% | | 09/21/28 | | | 100,000 | | | | 100,134 | |
BP Capital Markets PLC | |
2.32% | | 02/13/20 | | | 150,000 | | | | 148,803 | |
2.50% | | 11/06/22 | | | 100,000 | | | | 96,781 | |
2.52% | | 01/15/20 | | | 115,000 | | | | 114,251 | |
3.06% | | 03/17/22 | | | 210,000 | | | | 208,125 | |
BPCE S.A. | |
4.00% | | 04/15/24 | | | 150,000 | | | | 151,086 | |
Branch Banking & Trust Co. | |
2.10% | | 01/15/20 | | | 100,000 | | | | 98,966 | |
2.63% | | 01/15/22 | | | 100,000 | | | | 98,041 | |
Bristol-Myers Squibb Co. | |
2.00% | | 08/01/22 | | | 150,000 | | | | 144,226 | |
See Notes to Schedules of Investments and Notes to Financial Statements.
| | |
| State Street Total Return V.I.S. Fund | | |
| Schedule of Investments | | December 31, 2018 |
| | | | | | | | | | |
| | | Principal
Amount ($) | | | Fair
Value | |
British Telecommunications PLC | |
9.63% | | 12/15/30 | | $ | 150,000 | | | $ | 203,187 | |
Broadcom Corp./Broadcom Cayman Finance Ltd. | |
2.38% | | 01/15/20 | | | 100,000 | | | | 98,796 | |
2.65% | | 01/15/23 | | | 100,000 | | | | 92,681 | |
3.00% | | 01/15/22 | | | 100,000 | | | | 96,156 | |
3.13% | | 01/15/25 | | | 100,000 | | | | 89,738 | |
3.63% | | 01/15/24 | | | 100,000 | | | | 94,562 | |
Broadridge Financial Solutions Inc. | |
3.40% | | 06/27/26 | | | 80,000 | | | | 75,690 | |
Brookfield Finance Inc. | |
3.90% | | 01/25/28 | | | 100,000 | | | | 93,879 | |
Brown-Forman Corp. | |
4.00% | | 04/15/38 | | | 30,000 | | | | 29,346 | |
Buckeye Partners LP | |
4.15% | | 07/01/23 | | | 150,000 | | | | 145,531 | |
Bunge Limited Finance Corp. | |
4.35% | | 03/15/24 | | | 50,000 | | | | 49,264 | |
Burlington Northern Santa Fe LLC | |
5.75% | | 05/01/40 | | | 300,000 | | | | 350,745 | |
Camden Property Trust | |
4.10% | | 10/15/28 | | | 10,000 | | | | 10,129 | |
Campbell Soup Co. | |
3.65% | | 03/15/23 | | | 50,000 | | | | 48,872 | |
4.15% | | 03/15/28 | | | 50,000 | | | | 46,542 | |
4.80% | | 03/15/48 | | | 20,000 | | | | 16,951 | |
Canadian Imperial Bank of Commerce | |
2.10% | | 10/05/20 | | | 100,000 | | | | 98,075 | |
2.70% | | 02/02/21 | | | 40,000 | | | | 39,601 | |
Canadian National Railway Co. | |
2.95% | | 11/21/24 | | | 155,000 | | | | 150,581 | |
Canadian Natural Resources Ltd. | |
3.80% | | 04/15/24 | | | 150,000 | | | | 146,974 | |
3.85% | | 06/01/27 | | | 100,000 | | | | 94,611 | |
3.90% | | 02/01/25 | | | 50,000 | | | | 48,502 | |
Canadian Pacific Railway Co. | |
2.90% | | 02/01/25 | | | 150,000 | | | | 143,608 | |
Capital One Financial Corp. | |
2.50% | | 05/12/20 | | | 200,000 | | | | 197,516 | |
3.75% | | 07/28/26 - 03/09/27 | | | 230,000 | | | | 211,716 | |
4.20% | | 10/29/25 | | | 90,000 | | | | 86,519 | |
Cardinal Health Inc. | |
3.20% | | 03/15/23 | | | 150,000 | | | | 145,954 | |
Caterpillar Financial Services Corp. | |
2.10% | | 01/10/20 | | | 100,000 | | | | 99,016 | |
2.55% | | 11/29/22 | | | 50,000 | | | | 48,547 | |
2.90% | | 03/15/21 | | | 100,000 | | | | 99,557 | |
3.15% | | 09/07/21 | | | 15,000 | | | | 15,039 | |
3.25% | | 12/01/24 | | | 100,000 | | | | 99,044 | |
3.35% | | 12/07/20 | | | 200,000 | | | | 200,916 | |
CBS Corp. | |
3.38% | | 03/01/22 | | | 150,000 | | | | 148,977 | |
4.00% | | 01/15/26 | | | 150,000 | | | | 144,849 | |
Celgene Corp. | |
2.75% | | 02/15/23 | | | 50,000 | | | | 47,976 | |
3.45% | | 11/15/27 | | | 50,000 | | | | 45,519 | |
4.35% | | 11/15/47 | | | 50,000 | | | | 42,341 | |
5.00% | | 08/15/45 | | | 150,000 | | | | 138,490 | |
5.25% | | 08/15/43 | | | 220,000 | | | | 211,321 | |
Celulosa Arauco y Constitucion S.A. | |
3.88% | | 11/02/27 | | | 100,000 | | | | 91,950 | |
Cenovus Energy Inc. | |
3.00% | | 08/15/22 | | | 35,000 | | | | 33,177 | |
4.25% | | 04/15/27 | | | 100,000 | | | | 91,059 | |
4.45% | | 09/15/42 | | | 75,000 | | | | 57,569 | |
CenterPoint Energy Houston Electric LLC | |
4.50% | | 04/01/44 | | | 150,000 | | | | 157,858 | |
Charter Communications Operating LLC/Charter Communications Operating Capital | |
3.58% | | 07/23/20 | | | 100,000 | | | | 99,874 | |
4.46% | | 07/23/22 | | | 100,000 | | | | 100,963 | |
4.91% | | 07/23/25 | | | 135,000 | | | | 134,002 | |
6.48% | | 10/23/45 | | | 150,000 | | | | 152,388 | |
Chevron Corp. | |
2.41% | | 03/03/22 | | | 45,000 | | | | 43,961 | |
2.43% | | 06/24/20 | | | 75,000 | | | | 74,459 | |
2.90% | | 03/03/24 | | | 150,000 | | | | 146,604 | |
| | | | | | | | | | |
| | | Principal
Amount ($) | | | Fair
Value | |
2.95% | | 05/16/26 | | $ | 100,000 | | | $ | 96,295 | |
Chubb INA Holdings Inc. | |
2.70% | | 03/13/23 | | | 150,000 | | | | 145,977 | |
4.35% | | 11/03/45 | | | 100,000 | | | | 102,311 | |
Cigna Corp. | |
4.38% | | 10/15/28 | | | 40,000 | | | | 40,189 | (d) |
4.80% | | 08/15/38 | | | 30,000 | | | | 29,510 | (d) |
4.90% | | 12/15/48 | | | 330,000 | | | | 322,687 | (d) |
Cigna Corp. | |
3.40% | | 09/17/21 | | | 40,000 | | | | 39,918 | (d) |
3.75% | | 07/15/23 | | | 55,000 | | | | 54,865 | (d) |
Cintas Corporation No. 2 | |
3.70% | | 04/01/27 | | | 100,000 | | | | 97,487 | |
Cisco Systems Inc. | |
2.90% | | 03/04/21 | | | 125,000 | | | | 125,061 | |
5.90% | | 02/15/39 | | | 200,000 | | | | 247,130 | |
Citibank NA | |
2.13% | | 10/20/20 | | | 200,000 | | | | 195,954 | |
2.85% | | 02/12/21 | | | 150,000 | | | | 148,687 | |
Citigroup Inc. | |
2.40% | | 02/18/20 | | | 100,000 | | | | 98,992 | |
2.45% | | 01/10/20 | | | 100,000 | | | | 99,159 | |
2.70% | | 10/27/22 | | | 100,000 | | | | 96,371 | |
2.90% | | 12/08/21 | | | 200,000 | | | | 196,412 | |
3.88% | | 03/26/25 | | | 150,000 | | | | 143,880 | |
4.30% | | 11/20/26 | | | 200,000 | | | | 192,566 | |
4.45% | | 09/29/27 | | | 150,000 | | | | 144,588 | |
4.75% | | 05/18/46 | | | 50,000 | | | | 46,363 | |
5.88% | | 01/30/42 | | | 172,000 | | | | 193,940 | |
6.13% | | 08/25/36 | | | 155,000 | | | | 169,647 | |
Citigroup Inc. (3.52% fixed rate until 10/27/27; 1.15% + 3 month USD LIBOR thereafter) | |
3.52% | | 10/27/28 | | | 100,000 | | | | 93,283 | (f) |
Citizens Bank NA | |
2.25% | | 10/30/20 | | | 150,000 | | | | 146,862 | |
CME Group Inc. | |
3.00% | | 03/15/25 | | | 150,000 | | | | 145,948 | |
CNA Financial Corp. | |
5.88% | | 08/15/20 | | | 181,000 | | | | 187,704 | |
CNH Industrial Capital LLC | |
3.88% | | 10/15/21 | | | 15,000 | | | | 14,911 | |
4.38% | | 11/06/20 - 04/05/22 | | | 35,000 | | | | 35,192 | |
4.88% | | 04/01/21 | | | 15,000 | | | | 15,124 | |
CNH Industrial N.V. | |
3.85% | | 11/15/27 | | | 15,000 | | | | 13,810 | |
Colgate-Palmolive Co. | |
3.25% | | 03/15/24 | | | 150,000 | | | | 150,924 | |
Comcast Corp. | |
3.15% | | 02/15/28 | | | 100,000 | | | | 93,837 | |
3.30% | | 10/01/20 | | | 200,000 | | | | 200,896 | |
3.45% | | 10/01/21 | | | 40,000 | | | | 40,407 | |
3.55% | | 05/01/28 | | | 100,000 | | | | 96,543 | |
3.70% | | 04/15/24 | | | 55,000 | | | | 55,325 | |
3.90% | | 03/01/38 | | | 200,000 | | | | 185,214 | |
3.97% | | 11/01/47 | | | 100,000 | | | | 89,789 | |
4.00% | | 08/15/47 - 11/01/49 | | | 250,000 | | | | 225,930 | |
4.05% | | 11/01/52 | | | 100,000 | | | | 89,535 | |
4.15% | | 10/15/28 | | | 45,000 | | | | 45,676 | |
4.25% | | 01/15/33 | | | 100,000 | | | | 99,453 | |
4.60% | | 10/15/38 | | | 30,000 | | | | 30,348 | |
4.70% | | 10/15/48 | | | 40,000 | | | | 40,476 | |
5.15% | | 03/01/20 | | | 150,000 | | | | 153,565 | |
Comerica Inc. | |
3.70% | | 07/31/23 | | | 25,000 | | | | 24,994 | |
Commonwealth Edison Co. | |
4.60% | | 08/15/43 | | | 150,000 | | | | 157,570 | |
4.70% | | 01/15/44 | | | 175,000 | | | | 186,396 | |
Compass Bank | |
3.88% | | 04/10/25 | | | 150,000 | | | | 144,175 | |
Conagra Brands Inc. | |
3.80% | | 10/22/21 | | | 10,000 | | | | 10,000 | |
4.30% | | 05/01/24 | | | 5,000 | | | | 4,974 | |
4.85% | | 11/01/28 | | | 25,000 | | | | 24,579 | |
5.30% | | 11/01/38 | | | 10,000 | | | | 9,471 | |
5.40% | | 11/01/48 | | | 20,000 | | | | 18,442 | |
Concho Resources Inc. | |
See Notes to Schedules of Investments and Notes to Financial Statements.
| | |
| State Street Total Return V.I.S. Fund | | |
| Schedule of Investments | | December 31, 2018 |
| | | | | | | | | | |
| | | Principal
Amount ($) | | | Fair
Value | |
4.30% | | 08/15/28 | | $ | 25,000 | | | $ | 24,459 | |
4.85% | | 08/15/48 | | | 25,000 | | | | 23,779 | |
ConocoPhillips | |
6.50% | | 02/01/39 | | | 300,000 | | | | 371,238 | |
Consolidated Edison Company of New York Inc. | |
3.88% | | 06/15/47 | | | 100,000 | | | | 91,655 | |
3.95% | | 03/01/43 | | | 150,000 | | | | 139,038 | |
4.00% | | 12/01/28 | | | 25,000 | | | | 25,661 | |
Constellation Brands Inc. | |
3.50% | | 05/09/27 | | | 100,000 | | | | 92,624 | |
4.75% | | 11/15/24 | | | 100,000 | | | | 102,987 | |
5.25% | | 11/15/48 | | | 15,000 | | | | 15,040 | |
Consumers Energy Co. | |
4.05% | | 05/15/48 | | | 150,000 | | | | 148,047 | |
Continental Resources Inc. | |
3.80% | | 06/01/24 | | | 35,000 | | | | 33,075 | |
4.38% | | 01/15/28 | | | 35,000 | | | | 32,995 | |
4.50% | | 04/15/23 | | | 50,000 | | | | 49,083 | |
4.90% | | 06/01/44 | | | 25,000 | | | | 22,210 | |
5.00% | | 09/15/22 | | | 56,000 | | | | 55,556 | |
Cooperatieve Rabobank UA | |
2.50% | | 01/19/21 | | | 150,000 | | | | 147,378 | |
2.75% | | 01/10/22 | | | 100,000 | | | | 97,960 | |
3.95% | | 11/09/22 | | | 100,000 | | | | 99,762 | |
4.63% | | 12/01/23 | | | 150,000 | | | | 152,349 | |
Corning Inc. | |
2.90% | | 05/15/22 | | | 155,000 | | | | 152,687 | |
Corporation Andina de Fomento | |
2.13% | | 09/27/21 | | | 150,000 | | | | 145,713 | |
Costco Wholesale Corp. | |
2.25% | | 02/15/22 | | | 85,000 | | | | 83,206 | |
3.00% | | 05/18/27 | | | 100,000 | | | | 96,342 | |
Council Of Europe Development Bank | |
2.63% | | 02/13/23 | | | 120,000 | | | | 119,779 | |
Credit Suisse AG | |
3.63% | | 09/09/24 | | | 150,000 | | | | 147,120 | |
Credit Suisse Group Funding Guernsey Ltd. | |
2.75% | | 03/26/20 | | | 100,000 | | | | 98,978 | |
4.88% | | 05/15/45 | | | 150,000 | | | | 147,990 | |
Crown Castle International Corp. | |
3.15% | | 07/15/23 | | | 155,000 | | | | 148,904 | |
3.80% | | 02/15/28 | | | 100,000 | | | | 93,899 | |
CSX Corp. | |
2.60% | | 11/01/26 | | | 100,000 | | | | 90,453 | |
4.10% | | 03/15/44 | | | 68,000 | | | | 63,184 | |
4.75% | | 11/15/48 | | | 65,000 | | | | 65,952 | |
CVS Health Corp. | |
2.75% | | 12/01/22 | | | 150,000 | | | | 144,189 | |
3.13% | | 03/09/20 | | | 200,000 | | | | 199,608 | |
3.35% | | 03/09/21 | | | 195,000 | | | | 194,411 | |
3.38% | | 08/12/24 | | | 150,000 | | | | 145,023 | |
3.70% | | 03/09/23 | | | 115,000 | | | | 113,871 | |
4.10% | | 03/25/25 | | | 150,000 | | | | 148,468 | |
4.30% | | 03/25/28 | | | 110,000 | | | | 107,653 | |
4.78% | | 03/25/38 | | | 95,000 | | | | 91,305 | |
5.05% | | 03/25/48 | | | 215,000 | | | | 209,760 | |
Darden Restaurants Inc. | |
4.55% | | 02/15/48 | | | 15,000 | | | | 13,684 | |
Deere & Co. | |
3.90% | | 06/09/42 | | | 71,000 | | | | 68,733 | |
Dell International LLC/EMC Corp. | |
6.02% | | 06/15/26 | | | 190,000 | | | | 190,901 | (d) |
8.10% | | 07/15/36 | | | 100,000 | | | | 108,183 | (d) |
Delmarva Power & Light Co. | |
4.15% | | 05/15/45 | | | 100,000 | | | | 97,553 | |
Delta Air Lines Inc. | |
2.60% | | 12/04/20 | | | 45,000 | | | | 44,096 | |
3.80% | | 04/19/23 | | | 30,000 | | | | 29,165 | |
4.38% | | 04/19/28 | | | 50,000 | | | | 47,500 | |
Deutsche Bank AG | |
2.95% | | 08/20/20 | | | 150,000 | | | | 145,389 | |
3.30% | | 11/16/22 | | | 100,000 | | | | 92,674 | |
3.38% | | 05/12/21 | | | 150,000 | | | | 144,439 | |
Deutsche Telekom International Finance BV | |
8.75% | | 06/15/30 | | | 150,000 | | | | 197,053 | |
Devon Energy Corp. | |
| | | | | | | | | | |
| | | Principal
Amount ($) | | | Fair
Value | |
3.25% | | 05/15/22 | | $ | 150,000 | | | $ | 146,146 | |
5.00% | | 06/15/45 | | | 100,000 | | | | 88,443 | |
Diageo Investment Corp. | |
2.88% | | 05/11/22 | | | 150,000 | | | | 148,294 | |
Digital Realty Trust LP | |
4.45% | | 07/15/28 | | | 150,000 | | | | 149,245 | |
Discover Bank | |
4.20% | | 08/08/23 | | | 150,000 | | | | 150,139 | |
Discovery Communications LLC | |
3.25% | | 04/01/23 | | | 175,000 | | | | 168,411 | |
3.45% | | 03/15/25 | | | 135,000 | | | | 126,117 | |
3.90% | | 11/15/24 | | | 150,000 | | | | 146,206 | (d) |
Dollar General Corp. | |
4.13% | | 05/01/28 | | | 70,000 | | | | 68,097 | |
Dollar Tree Inc. | |
3.70% | | 05/15/23 | | | 20,000 | | | | 19,601 | |
4.00% | | 05/15/25 | | | 50,000 | | | | 48,057 | |
4.20% | | 05/15/28 | | | 25,000 | | | | 23,678 | |
Dominion Energy Inc. | |
2.58% | | 07/01/20 | | | 100,000 | | | | 98,496 | |
DowDuPont Inc. | |
3.77% | | 11/15/20 | | | 100,000 | | | | 100,923 | |
4.21% | | 11/15/23 | | | 50,000 | | | | 51,123 | |
4.73% | | 11/15/28 | | | 50,000 | | | | 51,789 | |
5.32% | | 11/15/38 | | | 15,000 | | | | 15,468 | |
5.42% | | 11/15/48 | | | 40,000 | | | | 41,656 | |
DTE Electric Co. | |
3.70% | | 03/15/45 | | | 145,000 | | | | 134,770 | |
DTE Energy Co. | |
3.85% | | 12/01/23 | | | 150,000 | | | | 150,765 | |
Duke Energy Carolinas LLC | |
3.05% | | 03/15/23 | | | 150,000 | | | | 148,648 | |
3.70% | | 12/01/47 | | | 50,000 | | | | 46,021 | |
3.95% | | 03/15/48 | | | 150,000 | | | | 143,493 | |
Duke Energy Corp. | |
3.05% | | 08/15/22 | | | 139,000 | | | | 136,276 | |
Duke Energy Florida LLC | |
2.10% | | 12/15/19 | | | 10,000 | | | | 9,944 | |
3.20% | | 01/15/27 | | | 100,000 | | | | 97,232 | |
3.40% | | 10/01/46 | | | 100,000 | | | | 87,056 | |
3.80% | | 07/15/28 | | | 50,000 | | | | 50,511 | |
Duke Energy Progress LLC | |
3.70% | | 09/01/28 | | | 100,000 | | | | 100,376 | |
Duke Realty LP | |
3.38% | | 12/15/27 | | | 50,000 | | | | 47,455 | |
Eaton Vance Corp. | |
3.50% | | 04/06/27 | | | 100,000 | | | | 96,359 | |
eBay Inc. | |
3.80% | | 03/09/22 | | | 145,000 | | | | 145,786 | |
Ecolab Inc. | |
2.38% | | 08/10/22 | | | 100,000 | | | | 96,378 | |
3.25% | | 12/01/27 | | | 70,000 | | | | 67,273 | |
Ecopetrol S.A. | |
4.13% | | 01/16/25 | | | 250,000 | | | | 238,145 | |
Edison International | |
4.13% | | 03/15/28 | | | 50,000 | | | | 47,412 | |
EI du Pont de Nemours & Co. | |
2.20% | | 05/01/20 | | | 100,000 | | | | 99,298 | |
Eli Lilly & Co. | |
2.75% | | 06/01/25 | | | 45,000 | | | | 43,291 | |
Emera US Finance LP | |
3.55% | | 06/15/26 | | | 60,000 | | | | 56,685 | |
Emerson Electric Co. | |
2.63% | | 02/15/23 | | | 100,000 | | | | 97,276 | |
Enable Midstream Partners LP | |
4.95% | | 05/15/28 | | | 60,000 | | | | 57,386 | |
Enbridge Energy Partners LP | |
5.88% | | 10/15/25 | | | 125,000 | | | | 135,533 | |
Enbridge Inc. | |
3.50% | | 06/10/24 | | | 65,000 | | | | 62,927 | |
Enel Chile S.A. | |
4.88% | | 06/12/28 | | | 50,000 | | | | 49,811 | |
Energy Transfer Operating LP | |
4.95% | | 06/15/28 | | | 75,000 | | | | 73,571 | |
Energy Transfer Operating LP | |
4.20% | | 09/15/23 | | | 25,000 | | | | 24,694 | |
See Notes to Schedules of Investments and Notes to Financial Statements.
| | |
| State Street Total Return V.I.S. Fund | | |
| Schedule of Investments | | December 31, 2018 |
| | | | | | | | | | |
| | | Principal
Amount ($) | | | Fair
Value | |
6.00% | | 06/15/48 | | $ | 50,000 | | | $ | 48,638 | |
6.50% | | 02/01/42 | | | 150,000 | | | | 151,261 | |
Entergy Louisiana LLC | |
4.05% | | 09/01/23 | | | 150,000 | | | | 153,762 | |
Enterprise Products Operating LLC | |
2.80% | | 02/15/21 | | | 50,000 | | | | 49,446 | |
3.50% | | 02/01/22 | | | 25,000 | | | | 25,016 | |
3.70% | | 02/15/26 | | | 35,000 | | | | 34,194 | |
3.90% | | 02/15/24 | | | 175,000 | | | | 175,983 | |
4.15% | | 10/16/28 | | | 25,000 | | | | 24,858 | |
4.25% | | 02/15/48 | | | 25,000 | | | | 22,367 | |
4.45% | | 02/15/43 | | | 142,000 | | | | 129,724 | |
4.80% | | 02/01/49 | | | 25,000 | | | | 24,190 | |
Enterprise Products Operating LLC (5.38% fixed rate until 02/15/28; 2.57% + 3 month USD LIBOR thereafter) | |
5.38% | | 02/15/78 | | | 50,000 | | | | 41,164 | (f) |
EOG Resources Inc. | |
2.45% | | 04/01/20 | | | 75,000 | | | | 74,185 | |
3.15% | | 04/01/25 | | | 80,000 | | | | 77,009 | |
EPR Properties | |
4.95% | | 04/15/28 | | | 100,000 | | | | 98,999 | |
EQT Corp. | |
3.90% | | 10/01/27 | | | 150,000 | | | | 129,714 | |
Equinor ASA | |
2.45% | | 01/17/23 | | | 250,000 | | | | 242,177 | |
ERP Operating LP | |
3.00% | | 04/15/23 | | | 150,000 | | | | 147,631 | |
Essex Portfolio LP | |
3.63% | | 05/01/27 | | | 100,000 | | | | 96,366 | |
European Bank for Reconstruction & Development | |
1.13% | | 08/24/20 | | | 200,000 | | | | 195,210 | |
1.63% | | 05/05/20 | | | 100,000 | | | | 98,738 | |
European Investment Bank | |
1.38% | | 06/15/20 | | | 300,000 | | | | 294,726 | |
1.63% | | 12/15/20 | | | 500,000 | | | | 490,570 | |
1.75% | | 05/15/20 | | | 300,000 | | | | 296,547 | |
2.00% | | 12/15/22 | | | 200,000 | | | | 195,282 | |
2.38% | | 05/13/21 | | | 250,000 | | | | 248,712 | |
2.88% | | 12/15/21 | | | 115,000 | | | | 115,860 | |
3.13% | | 12/14/23 | | | 200,000 | | | | 204,048 | |
Evergy Inc. | |
4.85% | | 06/01/21 | | | 104,000 | | | | 106,091 | |
Eversource Energy | |
2.90% | | 10/01/24 | | | 100,000 | | | | 95,840 | |
3.15% | | 01/15/25 | | | 125,000 | | | | 120,110 | |
Exelon Generation Company LLC | |
2.95% | | 01/15/20 | | | 150,000 | | | | 148,873 | |
Express Scripts Holding Co. | |
4.75% | | 11/15/21 | | | 174,000 | | | | 179,020 | |
Exxon Mobil Corp. | |
2.71% | | 03/06/25 | | | 150,000 | | | | 144,438 | |
3.04% | | 03/01/26 | | | 50,000 | | | | 48,741 | |
3.18% | | 03/15/24 | | | 150,000 | | | | 150,039 | |
FedEx Corp. | |
3.40% | | 02/15/28 | | | 100,000 | | | | 94,305 | |
4.05% | | 02/15/48 | | | 100,000 | | | | 84,398 | |
4.75% | | 11/15/45 | | | 195,000 | | | | 183,128 | |
Fibria Overseas Finance Ltd. | |
4.00% | | 01/14/25 | | | 50,000 | | | | 47,235 | |
Fidelity National Financial Inc. | |
4.50% | | 08/15/28 | | | 25,000 | | | | 24,975 | (d) |
Fidelity National Information Services Inc. | |
4.25% | | 05/15/28 | | | 80,000 | | | | 79,537 | |
4.75% | | 05/15/48 | | | 100,000 | | | | 93,770 | |
Fifth Third Bank | |
2.20% | | 10/30/20 | | | 100,000 | | | | 98,025 | |
2.88% | | 10/01/21 | | | 80,000 | | | | 79,051 | |
FirstEnergy Corp. | |
4.25% | | 03/15/23 | | | 30,000 | | | | 30,443 | |
7.38% | | 11/15/31 | | | 55,000 | | | | 69,539 | |
Fiserv Inc. | |
3.80% | | 10/01/23 | | | 25,000 | | | | 25,117 | |
4.20% | | 10/01/28 | | | 30,000 | | | | 29,948 | |
Florida Power & Light Co. | |
4.13% | | 02/01/42 | | | 200,000 | | | | 201,232 | |
| | | | | | | | | | |
| | | Principal
Amount ($) | | | Fair
Value | |
Fluor Corp. | |
4.25% | | 09/15/28 | | $ | 50,000 | | | $ | 48,348 | |
FMS Wertmanagement | |
2.00% | | 08/01/22 | | | 200,000 | | | | 195,566 | |
Ford Motor Co. | |
4.35% | | 12/08/26 | | | 100,000 | | | | 89,245 | |
4.75% | | 01/15/43 | | | 150,000 | | | | 116,271 | |
Ford Motor Credit Company LLC | |
2.46% | | 03/27/20 | | | 150,000 | | | | 146,575 | |
2.68% | | 01/09/20 | | | 100,000 | | | | 98,318 | |
3.81% | | 10/12/21 | | | 200,000 | | | | 194,218 | |
GATX Corp. | |
3.50% | | 03/15/28 | | | 100,000 | | | | 91,365 | |
GE Capital International Funding Company Unlimited Co. | |
2.34% | | 11/15/20 | | | 400,000 | | | | 385,876 | |
4.42% | | 11/15/35 | | | 200,000 | | | | 167,620 | |
General Dynamics Corp. | |
3.00% | | 05/11/21 | | | 50,000 | | | | 50,051 | |
3.38% | | 05/15/23 | | | 50,000 | | | | 50,305 | |
3.75% | | 05/15/28 | | | 55,000 | | | | 55,484 | |
General Electric Co. | |
2.70% | | 10/09/22 | | | 100,000 | | | | 92,856 | |
5.50% | | 01/08/20 | | | 200,000 | | | | 202,410 | |
6.75% | | 03/15/32 | | | 100,000 | | | | 104,255 | |
General Mills Inc. | |
3.65% | | 02/15/24 | | | 150,000 | | | | 148,668 | |
General Motors Co. | |
5.20% | | 04/01/45 | | | 150,000 | | | | 124,377 | |
General Motors Financial Company Inc. | |
2.45% | | 11/06/20 | | | 100,000 | | | | 97,354 | |
3.25% | | 01/05/23 | | | 50,000 | | | | 47,131 | |
3.45% | | 01/14/22 | | | 100,000 | | | | 96,777 | |
3.50% | | 11/07/24 | | | 100,000 | | | | 91,520 | |
3.70% | | 05/09/23 | | | 100,000 | | | | 95,710 | |
4.35% | | 01/17/27 | | | 100,000 | | | | 91,911 | |
4.38% | | 09/25/21 | | | 100,000 | | | | 100,449 | |
5.25% | | 03/01/26 | | | 155,000 | | | | 152,137 | |
Georgia Power Co. | |
4.30% | | 03/15/42 | | | 172,000 | | | | 158,536 | |
Georgia-Pacific LLC | |
8.88% | | 05/15/31 | | | 150,000 | | | | 219,075 | |
Gilead Sciences Inc. | |
3.70% | | 04/01/24 | | | 150,000 | | | | 149,923 | |
4.80% | | 04/01/44 | | | 150,000 | | | | 149,761 | |
GlaxoSmithKline Capital Inc. | |
3.38% | | 05/15/23 | | | 100,000 | | | | 100,500 | |
3.63% | | 05/15/25 | | | 55,000 | | | | 55,314 | |
3.88% | | 05/15/28 | | | 100,000 | | | | 101,692 | |
GlaxoSmithKline Capital PLC | |
3.13% | | 05/14/21 | | | 70,000 | | | | 70,091 | |
GLP Capital LP/GLP Financing II Inc. | |
4.88% | | 11/01/20 | | | 30,000 | | | | 30,328 | |
5.25% | | 06/01/25 | | | 10,000 | | | | 9,960 | |
5.38% | | 11/01/23 - 04/15/26 | | | 30,000 | | | | 29,739 | |
5.75% | | 06/01/28 | | | 10,000 | | | | 9,942 | |
Halliburton Co. | |
3.50% | | 08/01/23 | | | 100,000 | | | | 98,657 | |
Harris Corp. | |
3.83% | | 04/27/25 | | | 150,000 | | | | 146,749 | |
4.85% | | 04/27/35 | | | 40,000 | | | | 39,979 | |
HCP Inc. | |
2.63% | | 02/01/20 | | | 150,000 | | | | 148,918 | |
Hewlett Packard Enterprise Co. | |
3.50% | | 10/05/21 | | | 50,000 | | | | 50,095 | |
6.35% | | 10/15/45 | | | 150,000 | | | | 140,368 | |
Honeywell International Inc. | |
3.35% | | 12/01/23 | | | 150,000 | | | | 150,688 | |
Hospitality Properties Trust | |
4.65% | | 03/15/24 | | | 150,000 | | | | 149,706 | |
HP Inc. | |
6.00% | | 09/15/41 | | | 162,000 | | | | 161,036 | |
HSBC Bank USA NA | |
5.88% | | 11/01/34 | | | 150,000 | | | | 167,748 | |
HSBC Holdings PLC | |
3.40% | | 03/08/21 | | | 200,000 | | | | 199,386 | |
3.90% | | 05/25/26 | | | 150,000 | | | | 143,734 | |
See Notes to Schedules of Investments and Notes to Financial Statements.
| | |
| State Street Total Return V.I.S. Fund | | |
| Schedule of Investments | | December 31, 2018 |
| | | | | | | | | | |
| | | Principal
Amount ($) | | | Fair
Value | |
5.10% | | 04/05/21 | | $ | 100,000 | | | $ | 103,281 | |
HSBC Holdings PLC (3.95% fixed rate until 05/18/23; 0.99% + 3 month USD LIBOR thereafter) | |
3.95% | | 05/18/24 | | | 100,000 | | | | 99,419 | (f) |
HSBC Holdings PLC (4.29% fixed rate until 09/12/25; 1.35% + 3 month USD LIBOR thereafter) | |
4.29% | | 09/12/26 | | | 200,000 | | | | 196,502 | (f) |
HSBC Holdings PLC (4.58% fixed rate until 06/19/28; 1.53% + 3 month USD LIBOR thereafter) | |
4.58% | | 06/19/29 | | | 200,000 | | | | 198,282 | (f) |
HSBC USA Inc. | |
2.75% | | 08/07/20 | | | 150,000 | | | | 148,509 | |
Hubbell Inc. | |
3.50% | | 02/15/28 | | | 50,000 | | | | 46,667 | |
Humana Inc. | |
2.50% | | 12/15/20 | | | 50,000 | | | | 49,332 | |
2.90% | | 12/15/22 | | | 100,000 | | | | 96,848 | |
Huntington Bancshares Inc. | |
3.15% | | 03/14/21 | | | 150,000 | | | | 149,334 | |
Husky Energy Inc. | |
4.00% | | 04/15/24 | | | 100,000 | | | | 98,380 | |
IBM Credit LLC | |
2.65% | | 02/05/21 | | | 100,000 | | | | 98,844 | |
3.60% | | 11/30/21 | | | 100,000 | | | | 100,802 | |
Illinois Tool Works Inc. | |
2.65% | | 11/15/26 | | | 100,000 | | | | 93,025 | |
3.50% | | 03/01/24 | | | 50,000 | | | | 50,730 | |
Indiana Michigan Power Co. | |
3.85% | | 05/15/28 | | | 25,000 | | | | 25,174 | |
ING Groep N.V. | |
3.95% | | 03/29/27 | | | 200,000 | | | | 191,292 | |
Ingersoll-Rand Global Holding Company Ltd. | |
4.25% | | 06/15/23 | | | 100,000 | | | | 102,304 | |
Intel Corp. | |
2.60% | | 05/19/26 | | | 150,000 | | | | 140,838 | |
3.73% | | 12/08/47 | | | 100,000 | | | | 92,793 | |
4.10% | | 05/11/47 | | | 100,000 | | | | 97,657 | |
Inter-American Development Bank | |
1.25% | | 09/14/21 | | | 400,000 | | | | 386,068 | |
2.13% | | 01/15/25 | | | 200,000 | | | | 193,176 | |
2.38% | | 07/07/27 | | | 200,000 | | | | 192,882 | |
2.63% | | 04/19/21 | | | 100,000 | | | | 100,087 | |
3.00% | | 09/26/22 | | | 50,000 | | | | 50,631 | |
Intercontinental Exchange Inc. | |
3.45% | | 09/21/23 | | | 90,000 | | | | 90,323 | |
International Bank for Reconstruction & Development | |
1.63% | | 09/04/20 | | | 400,000 | | | | 393,668 | |
1.88% | | 04/21/20 | | | 170,000 | | | | 168,487 | |
2.13% | | 11/01/20 | | | 300,000 | | | | 297,438 | |
2.50% | | 07/29/25 | | | 300,000 | | | | 295,671 | |
2.75% | | 07/23/21 | | | 200,000 | | | | 200,828 | |
3.00% | | 09/27/23 | | | 150,000 | | | | 152,340 | |
International Business Machines Corp. | |
2.50% | | 01/27/22 | | | 150,000 | | | | 146,013 | |
4.00% | | 06/20/42 | | | 150,000 | | | | 135,926 | |
International Finance Corp. | |
2.00% | | 10/24/22 | | | 200,000 | | | | 195,554 | |
2.13% | | 04/07/26 | | | 150,000 | | | | 144,148 | |
2.25% | | 01/25/21 | | | 100,000 | | | | 99,318 | |
International Flavors & Fragrances Inc. | |
5.00% | | 09/26/48 | | | 15,000 | | | | 14,922 | |
International Paper Co. | |
3.65% | | 06/15/24 | | | 150,000 | | | | 150,675 | |
Invesco Finance PLC | |
3.13% | | 11/30/22 | | | 200,000 | | | | 195,768 | |
Jabil Inc. | |
3.95% | | 01/12/28 | | | 100,000 | | | | 88,778 | |
4.70% | | 09/15/22 | | | 23,000 | | | | 23,043 | |
Jefferies Group LLC | |
5.13% | | 01/20/23 | | | 150,000 | | | | 154,008 | |
John Deere Capital Corp. | |
2.35% | | 01/08/21 | | | 100,000 | | | | 98,731 | |
2.70% | | 01/06/23 | | | 100,000 | | | | 97,547 | |
2.88% | | 03/12/21 | | | 50,000 | | | | 49,815 | |
3.05% | | 01/06/28 | | | 100,000 | | | | 95,321 | |
3.45% | | 06/07/23 - 03/13/25 | | | 75,000 | | | | 74,995 | |
| | | | | | | | | | |
| | | Principal
Amount ($) | | | Fair
Value | |
Johnson & Johnson | |
1.95% | | 11/10/20 | | $ | 15,000 | | | $ | 14,801 | |
2.45% | | 12/05/21 - 03/01/26 | | | 275,000 | | | | 268,194 | |
2.90% | | 01/15/28 | | | 50,000 | | | | 47,787 | |
3.40% | | 01/15/38 | | | 25,000 | | | | 23,338 | |
3.50% | | 01/15/48 | | | 30,000 | | | | 27,581 | |
4.38% | | 12/05/33 | | | 150,000 | | | | 161,184 | |
Johnson Controls International PLC | |
3.63% | | 07/02/24 | | | 80,000 | | | | 78,729 | (g) |
JPMorgan Chase & Co. | |
2.25% | | 01/23/20 | | | 150,000 | | | | 148,506 | |
2.75% | | 06/23/20 | | | 150,000 | | | | 148,969 | |
3.13% | | 01/23/25 | | | 150,000 | | | | 142,989 | |
3.25% | | 09/23/22 | | | 236,000 | | | | 234,291 | |
3.38% | | 05/01/23 | | | 150,000 | | | | 146,745 | |
4.50% | | 01/24/22 | | | 203,000 | | | | 209,100 | |
6.40% | | 05/15/38 | | | 100,000 | | | | 122,223 | |
JPMorgan Chase & Co. (3.51% fixed rate until 06/18/21; 0.61% + 3 month USD LIBOR thereafter) | |
3.51% | | 06/18/22 | | | 100,000 | | | | 100,151 | (f) |
JPMorgan Chase & Co. (3.54% fixed rate until 05/01/27; 1.38% + 3 month USD LIBOR thereafter) | |
3.54% | | 05/01/28 | | | 150,000 | | | | 142,816 | (f) |
JPMorgan Chase & Co. (3.80% fixed rate until 07/23/23; 0.89% + 3 month USD LIBOR thereafter) | |
3.80% | | 07/23/24 | | | 200,000 | | | | 200,084 | (f) |
JPMorgan Chase & Co. (3.88% fixed rate until 07/24/37; 1.36% + 3 month USD LIBOR thereafter) | |
3.88% | | 07/24/38 | | | 250,000 | | | | 226,292 | (f) |
JPMorgan Chase & Co. (3.90% fixed rate until 01/23/48; 1.22% + 3 month USD LIBOR thereafter) | |
3.90% | | 01/23/49 | | | 200,000 | | | | 175,644 | (f) |
JPMorgan Chase & Co. (4.02% fixed rate until 12/05/23; 1.00% + 3 month USD LIBOR thereafter) | |
4.02% | | 12/05/24 | | | 150,000 | | | | 151,098 | (f) |
JPMorgan Chase & Co. (4.45% fixed rate until 12/05/28; 1.33% + 3 month USD LIBOR thereafter) | |
4.45% | | 12/05/29 | | | 150,000 | | | | 152,422 | (f) |
JPMorgan Chase Bank NA (2.60% fixed rate until 02/01/20; 0.28% + 3 month USD LIBOR thereafter) | |
2.60% | | 02/01/21 | | | 200,000 | | | | 198,604 | (f) |
JPMorgan Chase Bank NA (3.09% fixed rate until 04/26/20; 0.35% + 3 month USD LIBOR thereafter) | |
3.09% | | 04/26/21 | | | 300,000 | | | | 299,142 | (f) |
Kaiser Foundation Hospitals | |
4.15% | | 05/01/47 | | | 100,000 | | | | 99,856 | |
Kansas City Power & Light Co. | |
4.20% | | 06/15/47 | | | 100,000 | | | | 96,726 | |
Kansas City Southern | |
4.70% | | 05/01/48 | | | 50,000 | | | | 48,892 | |
Kellogg Co. | |
2.65% | | 12/01/23 | | | 100,000 | | | | 94,531 | |
Kennametal Inc. | |
4.63% | | 06/15/28 | | | 25,000 | | | | 24,664 | |
Keurig Dr Pepper Inc. | |
3.13% | | 12/15/23 | | | 100,000 | | | | 95,193 | |
4.99% | | 05/25/38 | | | 25,000 | | | | 24,210 | (d) |
Keurig Dr Pepper Inc. | |
4.60% | | 05/25/28 | | | 50,000 | | | | 49,831 | (d) |
KeyBank NA | |
3.38% | | 03/07/23 | | | 150,000 | | | | 149,824 | |
KeyCorp | |
2.90% | | 09/15/20 | | | 125,000 | | | | 124,103 | |
Kilroy Realty LP | |
3.45% | | 12/15/24 | | | 50,000 | | | | 48,247 | |
Kimberly-Clark Corp. | |
3.20% | | 07/30/46 | | | 125,000 | | | | 106,106 | |
Kinder Morgan Energy Partners LP | |
5.00% | | 08/15/42 | | | 242,000 | | | | 222,904 | |
Kinder Morgan Inc. | |
4.30% | | 06/01/25 | | | 115,000 | | | | 114,401 | |
5.05% | | 02/15/46 | | | 150,000 | | | | 139,462 | |
5.30% | | 12/01/34 | | | 100,000 | | | | 98,242 | |
KLA-Tencor Corp. | |
4.65% | | 11/01/24 | | | 115,000 | | | | 117,769 | |
Kraft Heinz Foods Co. | |
See Notes to Schedules of Investments and Notes to Financial Statements.
| | |
| State Street Total Return V.I.S. Fund | | |
| Schedule of Investments | | December 31, 2018 |
| | | | | | | | | | |
| | | Principal
Amount ($) | | | Fair
Value | |
3.38% | | 06/15/21 | | $ | 15,000 | | | $ | 14,956 | |
4.00% | | 06/15/23 | | | 100,000 | | | | 99,782 | |
4.63% | | 01/30/29 | | | 50,000 | | | | 49,414 | |
5.00% | | 06/04/42 | | | 150,000 | | | | 133,613 | |
5.20% | | 07/15/45 | | | 150,000 | | | | 135,458 | |
Kreditanstalt fuer Wiederaufbau | |
1.63% | | 05/29/20 | | | 300,000 | | | | 295,848 | |
1.75% | | 03/31/20 - 09/15/21 | | | 500,000 | | | | 491,229 | |
1.88% | | 12/15/20 | | | 150,000 | | | | 147,865 | |
2.00% | | 09/29/22 - 05/02/25 | | | 450,000 | | | | 434,327 | |
2.13% | | 03/07/22 | | | 400,000 | | | | 393,848 | |
2.63% | | 04/12/21 | | | 150,000 | | | | 150,079 | |
2.88% | | 04/03/28 | | | 175,000 | | | | 175,665 | |
L3 Technologies Inc. | |
3.85% | | 12/15/26 | | | 100,000 | | | | 96,716 | |
Laboratory Corporation of America Holdings | |
4.00% | | 11/01/23 | | | 100,000 | | | | 100,767 | |
Lam Research Corp. | |
3.80% | | 03/15/25 | | | 115,000 | | | | 114,127 | |
Landwirtschaftliche Rentenbank | |
2.50% | | 11/15/27 | | | 200,000 | | | | 194,230 | |
Leggett & Platt Inc. | |
3.50% | | 11/15/27 | | | 50,000 | | | | 46,756 | |
Lincoln National Corp. | |
3.63% | | 12/12/26 | | | 50,000 | | | | 48,195 | |
4.20% | | 03/15/22 | | | 117,000 | | | | 119,239 | |
Lloyds Bank PLC | |
2.70% | | 08/17/20 | | | 150,000 | | | | 148,113 | |
Lloyds Banking Group PLC | |
3.00% | | 01/11/22 | | | 100,000 | | | | 96,674 | |
4.45% | | 05/08/25 | | | 100,000 | | | | 98,727 | |
4.65% | | 03/24/26 | | | 150,000 | | | | 141,453 | |
Lockheed Martin Corp. | |
3.60% | | 03/01/35 | | | 55,000 | | | | 51,038 | |
4.70% | | 05/15/46 | | | 150,000 | | | | 156,564 | |
Loews Corp. | |
2.63% | | 05/15/23 | | | 100,000 | | | | 96,420 | |
Lowe’s Companies Inc. | |
2.50% | | 04/15/26 | | | 130,000 | | | | 115,608 | |
3.38% | | 09/15/25 | | | 30,000 | | | | 28,479 | |
4.05% | | 05/03/47 | | | 100,000 | | | | 86,223 | |
LYB International Finance II BV | |
3.50% | | 03/02/27 | | | 100,000 | | | | 91,299 | |
LyondellBasell Industries N.V. | |
6.00% | | 11/15/21 | | | 100,000 | | | | 105,843 | |
M&T Bank Corp. | |
3.55% | | 07/26/23 | | | 150,000 | | | | 150,864 | |
Macy’s Retail Holdings Inc. | |
3.88% | | 01/15/22 | | | 150,000 | | | | 148,197 | |
Marathon Petroleum Corp. | |
3.80% | | 04/01/28 | | | 30,000 | | | | 28,177 | (d) |
4.50% | | 04/01/48 | | | 25,000 | | | | 21,159 | (d) |
4.75% | | 12/15/23 | | | 50,000 | | | | 51,312 | (d) |
5.13% | | 12/15/26 | | | 50,000 | | | | 51,045 | (d) |
Markel Corp. | |
3.50% | | 11/01/27 | | | 50,000 | | | | 47,077 | |
Marriott International Inc. | |
4.00% | | 04/15/28 | | | 150,000 | | | | 143,596 | |
Marsh & McLennan Companies Inc. | |
4.20% | | 03/01/48 | | | 100,000 | | | | 91,448 | |
Martin Marietta Materials Inc. | |
3.50% | | 12/15/27 | | | 50,000 | | | | 45,743 | |
Masco Corp. | |
3.50% | | 04/01/21 | | | 60,000 | | | | 59,635 | |
4.38% | | 04/01/26 | | | 40,000 | | | | 39,760 | |
Mastercard Inc. | |
2.95% | | 11/21/26 | | | 100,000 | | | | 96,519 | |
McDonald’s Corp. | |
2.75% | | 12/09/20 | | | 200,000 | | | | 198,530 | |
3.70% | | 02/15/42 | | | 150,000 | | | | 129,315 | |
3.80% | | 04/01/28 | | | 50,000 | | | | 49,014 | |
McKesson Corp. | |
3.80% | | 03/15/24 | | | 150,000 | | | | 148,023 | |
Mead Johnson Nutrition Co. | |
4.13% | | 11/15/25 | | | 110,000 | | | | 112,630 | |
Medtronic Inc. | |
| | | | | | | | | | |
| | | Principal
Amount ($) | | | Fair
Value | |
3.63% | | 03/15/24 | | $ | 100,000 | | | $ | 100,924 | |
4.50% | | 03/15/42 | | | 150,000 | | | | 154,630 | |
4.63% | | 03/15/44 - 03/15/45 | | | 300,000 | | | | 313,272 | |
Memorial Sloan-Kettering Cancer Center | |
4.13% | | 07/01/52 | | | 195,000 | | | | 193,463 | |
Merck & Company Inc. | |
2.40% | | 09/15/22 | | | 128,000 | | | | 124,886 | |
2.75% | | 02/10/25 | | | 70,000 | | | | 67,735 | |
Mercy Health | |
4.30% | | 07/01/28 | | | 100,000 | | | | 101,908 | |
MetLife Inc. | |
4.13% | | 08/13/42 | | | 150,000 | | | | 140,670 | |
6.50% | | 12/15/32 | | | 150,000 | | | | 185,032 | |
Microsoft Corp. | |
1.55% | | 08/08/21 | | | 150,000 | | | | 145,716 | |
1.85% | | 02/06/20 | | | 200,000 | | | | 198,508 | |
2.40% | | 02/06/22 - 08/08/26 | | | 300,000 | | | | 285,432 | |
2.88% | | 02/06/24 | | | 150,000 | | | | 148,374 | |
3.45% | | 08/08/36 | | | 200,000 | | | | 189,896 | |
3.50% | | 02/12/35 | | | 65,000 | | | | 62,419 | |
3.75% | | 05/01/43 | | | 150,000 | | | | 145,342 | |
4.10% | | 02/06/37 | | | 200,000 | | | | 205,470 | |
4.45% | | 11/03/45 | | | 225,000 | | | | 242,062 | |
Mid-America Apartments LP | |
4.20% | | 06/15/28 | | | 100,000 | | | | 100,306 | |
Mitsubishi UFJ Financial Group Inc. | |
2.76% | | 09/13/26 | | | 150,000 | | | | 138,573 | |
3.46% | | 03/02/23 | | | 100,000 | | | | 99,516 | |
3.78% | | 03/02/25 | | | 100,000 | | | | 99,855 | |
3.96% | | 03/02/28 | | | 100,000 | | | | 100,193 | |
4.05% | | 09/11/28 | | | 100,000 | | | | 100,929 | |
Mizuho Financial Group Inc. | |
3.55% | | 03/05/23 | | | 100,000 | | | | 99,747 | |
4.02% | | 03/05/28 | | | 100,000 | | | | 100,967 | |
Molson Coors Brewing Co. | |
3.00% | | 07/15/26 | | | 95,000 | | | | 84,764 | |
Mondelez International Inc. | |
4.13% | | 05/07/28 | | | 100,000 | | | | 99,404 | |
Moody’s Corp. | |
4.88% | | 02/15/24 - 12/17/48 | | | 350,000 | | | | 363,322 | |
Morgan Stanley | |
2.63% | | 11/17/21 | | | 200,000 | | | | 195,050 | |
2.80% | | 06/16/20 | | | 230,000 | | | | 228,411 | |
3.13% | | 01/23/23 | | | 200,000 | | | | 195,516 | |
3.95% | | 04/23/27 | | | 150,000 | | | | 141,255 | |
4.00% | | 07/23/25 | | | 95,000 | | | | 93,756 | |
4.10% | | 05/22/23 | | | 150,000 | | | | 150,339 | |
4.35% | | 09/08/26 | | | 150,000 | | | | 145,494 | |
4.88% | | 11/01/22 | | | 150,000 | | | | 154,336 | |
5.50% | | 07/28/21 | | | 98,000 | | | | 102,634 | |
Morgan Stanley (3.74% fixed rate until 04/24/23; 0.85% + 3 month USD LIBOR thereafter) | |
3.74% | | 04/24/24 | | | 160,000 | | | | 158,610 | (f) |
Morgan Stanley (3.77% fixed rate until 01/24/28; 1.14% + 3 month USD LIBOR thereafter) | |
3.77% | | 01/24/29 | | | 100,000 | | | | 95,665 | (f) |
Morgan Stanley (4.46% fixed rate until 04/22/38; 1.43% + 3 month USD LIBOR thereafter) | |
4.46% | | 04/22/39 | | | 100,000 | | | | 97,376 | (f) |
Motorola Solutions Inc. | |
3.50% | | 09/01/21 | | | 50,000 | | | | 49,745 | |
4.60% | | 02/23/28 | | | 100,000 | | | | 96,881 | |
MPLX LP | |
4.00% | | 03/15/28 | | | 35,000 | | | | 32,843 | |
4.50% | | 04/15/38 | | | 30,000 | | | | 26,346 | |
4.70% | | 04/15/48 | | | 25,000 | | | | 21,591 | |
4.80% | | 02/15/29 | | | 70,000 | | | | 69,799 | |
4.90% | | 04/15/58 | | | 25,000 | | | | 21,092 | |
5.50% | | 02/15/49 | | | 70,000 | | | | 67,843 | |
MUFG Americas Holdings Corp. | |
3.00% | | 02/10/25 | | | 120,000 | | | | 114,520 | |
Mylan Inc. | |
4.55% | | 04/15/28 | | | 100,000 | | | | 93,227 | (d) |
5.20% | | 04/15/48 | | | 100,000 | | | | 85,128 | (d) |
National Australia Bank Ltd. | |
2.13% | | 05/22/20 | | | 150,000 | | | | 147,925 | |
See Notes to Schedules of Investments and Notes to Financial Statements.
| | |
| State Street Total Return V.I.S. Fund | | |
| Schedule of Investments | | December 31, 2018 |
| | | | | | | | | | |
| | | Principal
Amount ($) | | | Fair
Value | |
2.25% | | 01/10/20 | | $ | 100,000 | | | $ | 99,119 | |
2.80% | | 01/10/22 | | | 100,000 | | | | 98,213 | |
National Fuel Gas Co. | |
4.75% | | 09/01/28 | | | 50,000 | | | | 49,141 | |
National Retail Properties Inc. | |
3.60% | | 12/15/26 | | | 200,000 | | | | 192,036 | |
National Rural Utilities Cooperative Finance Corp. | |
2.90% | | 03/15/21 | | | 70,000 | | | | 69,675 | |
3.40% | | 02/07/28 | | | 100,000 | | | | 97,892 | |
4.40% | | 11/01/48 | | | 10,000 | | | | 10,326 | |
NetApp Inc. | |
3.38% | | 06/15/21 | | | 110,000 | | | | 109,567 | |
Newmont Mining Corp. | |
3.50% | | 03/15/22 | | | 150,000 | | | | 148,492 | |
Nexen Energy ULC | |
6.40% | | 05/15/37 | | | 200,000 | | | | 244,880 | |
NextEra Energy Capital Holdings Inc. | |
3.34% | | 09/01/20 | | | 100,000 | | | | 100,029 | |
NIKE Inc. | |
2.38% | | 11/01/26 | | | 150,000 | | | | 138,259 | |
NiSource Inc. | |
2.65% | | 11/17/22 | | | 40,000 | | | | 38,576 | |
3.65% | | 06/15/23 | | | 100,000 | | | | 100,258 | (d) |
4.38% | | 05/15/47 | | | 100,000 | | | | 93,606 | |
Nordic Investment Bank | |
2.25% | | 02/01/21 | | | 200,000 | | | | 198,614 | |
Norfolk Southern Corp. | |
3.80% | | 08/01/28 | | | 30,000 | | | | 29,857 | |
3.94% | | 11/01/47 | | | 160,000 | | | | 144,765 | |
4.15% | | 02/28/48 | | | 100,000 | | | | 93,843 | |
Northern Trust Corp. | |
3.65% | | 08/03/28 | | | 100,000 | | | | 100,326 | |
Northrop Grumman Corp. | |
2.08% | | 10/15/20 | | | 60,000 | | | | 58,870 | |
2.55% | | 10/15/22 | | | 100,000 | | | | 96,849 | |
2.93% | | 01/15/25 | | | 50,000 | | | | 47,426 | |
3.25% | | 01/15/28 | | | 65,000 | | | | 60,730 | |
4.03% | | 10/15/47 | | | 75,000 | | | | 68,150 | |
Northwestern University | |
3.66% | | 12/01/57 | | | 10,000 | | | | 9,639 | |
Novartis Capital Corp. | |
2.40% | | 09/21/22 | | | 202,000 | | | | 197,196 | |
3.00% | | 11/20/25 | | | 150,000 | | | | 145,396 | |
NSTAR Electric Co. | |
3.20% | | 05/15/27 | | | 100,000 | | | | 96,755 | |
Nutrien Ltd. | |
3.63% | | 03/15/24 | | | 150,000 | | | | 146,013 | |
4.00% | | 12/15/26 | | | 100,000 | | | | 96,757 | |
NXP BV/NXP Funding LLC | |
5.55% | | 12/01/28 | | | 200,000 | | | | 204,980 | (d) |
O’Reilly Automotive Inc. | |
4.35% | | 06/01/28 | | | 100,000 | | | | 99,794 | |
Occidental Petroleum Corp. | |
3.40% | | 04/15/26 | | | 140,000 | | | | 136,983 | |
4.10% | | 02/15/47 | | | 100,000 | | | | 94,071 | |
Oesterreichische Kontrollbank AG | |
2.88% | | 09/07/21 | | | 100,000 | | | | 100,622 | |
Ohio Power Co. | |
4.15% | | 04/01/48 | | | 100,000 | | | | 98,515 | |
Omega Healthcare Investors Inc. | |
4.50% | | 04/01/27 | | | 200,000 | | | | 191,692 | |
Omnicom Group Inc./Omnicom Capital Inc. | |
3.63% | | 05/01/22 | | | 100,000 | | | | 98,657 | |
ONE Gas Inc. | |
4.50% | | 11/01/48 | | | 20,000 | | | | 20,642 | |
ONEOK Partners LP | |
6.13% | | 02/01/41 | | | 162,000 | | | | 169,685 | |
Oracle Corp. | |
1.90% | | 09/15/21 | | | 400,000 | | | | 386,936 | |
2.65% | | 07/15/26 | | | 200,000 | | | | 185,668 | |
2.95% | | 11/15/24 | | | 200,000 | | | | 194,372 | |
3.25% | | 05/15/30 | | | 150,000 | | | | 141,567 | |
3.63% | | 07/15/23 | | | 125,000 | | | | 126,893 | |
4.00% | | 07/15/46 | | | 100,000 | | | | 93,276 | |
4.30% | | 07/08/34 | | | 100,000 | | | | 100,395 | |
| | | | | | | | | | |
| | | Principal
Amount ($) | | | Fair
Value | |
Orange S.A. | |
9.00% | | 03/01/31 | | $ | 150,000 | | | $ | 207,027 | |
Owens Corning | |
4.20% | | 12/15/22 | | | 150,000 | | | | 148,774 | |
PACCAR Financial Corp. | |
2.05% | | 11/13/20 | | | 50,000 | | | | 49,107 | |
3.10% | | 05/10/21 | | | 20,000 | | | | 19,981 | |
Pacific Gas & Electric Co. | |
4.25% | | 08/01/23 | | | 100,000 | | | | 92,011 | (d) |
6.05% | | 03/01/34 | | | 111,000 | | | | 103,712 | |
PacifiCorp | |
6.25% | | 10/15/37 | | | 153,000 | | | | 190,061 | |
Packaging Corporation of America | |
2.45% | | 12/15/20 | | | 70,000 | | | | 68,577 | |
3.40% | | 12/15/27 | | | 35,000 | | | | 32,724 | |
Parker-Hannifin Corp. | |
4.20% | | 11/21/34 | | | 100,000 | | | | 99,605 | |
Patterson-UTI Energy Inc. | |
3.95% | | 02/01/28 | | | 100,000 | | | | 90,902 | |
PepsiCo Inc. | |
1.85% | | 04/30/20 | | | 150,000 | | | | 147,958 | |
2.00% | | 04/15/21 | | | 300,000 | | | | 294,201 | |
2.75% | | 03/01/23 | | | 150,000 | | | | 147,391 | |
3.00% | | 10/15/27 | | | 100,000 | | | | 95,627 | |
Petroleos Mexicanos | |
4.50% | | 01/23/26 | | | 100,000 | | | | 86,542 | |
5.50% | | 01/21/21 - 06/27/44 | | | 258,000 | | | | 243,498 | |
6.38% | | 01/23/45 | | | 250,000 | | | | 202,147 | |
6.50% | | 01/23/29 - 06/02/41 | | | 442,000 | | | | 375,629 | |
6.75% | | 09/21/47 | | | 113,000 | | | | 93,636 | |
Pfizer Inc. | |
3.00% | | 09/15/21 - 12/15/26 | | | 220,000 | | | | 217,400 | |
3.20% | | 09/15/23 | | | 125,000 | | | | 125,321 | |
3.60% | | 09/15/28 | | | 50,000 | | | | 50,186 | |
4.00% | | 12/15/36 | | | 100,000 | | | | 99,155 | |
4.13% | | 12/15/46 | | | 100,000 | | | | 100,373 | |
4.20% | | 09/15/48 | | | 100,000 | | | | 101,579 | |
4.30% | | 06/15/43 | | | 100,000 | | | | 102,005 | |
Philip Morris International Inc. | |
2.00% | | 02/21/20 | | | 150,000 | | | | 148,177 | |
3.13% | | 03/02/28 | | | 50,000 | | | | 46,796 | |
3.88% | | 08/21/42 | | | 92,000 | | | | 78,808 | |
Phillips 66 | |
3.90% | | 03/15/28 | | | 50,000 | | | | 48,111 | |
4.88% | | 11/15/44 | | | 45,000 | | | | 43,875 | |
Phillips 66 Partners LP | |
3.75% | | 03/01/28 | | | 10,000 | | | | 9,237 | |
4.68% | | 02/15/45 | | | 10,000 | | | | 8,896 | |
Pinnacle West Capital Corp. | |
2.25% | | 11/30/20 | | | 45,000 | | | | 44,092 | |
Plains All American Pipeline LP/PAA Finance Corp. | |
3.85% | | 10/15/23 | | | 100,000 | | | | 96,709 | |
4.50% | | 12/15/26 | | | 100,000 | | | | 96,154 | |
PNC Bank NA | |
2.00% | | 05/19/20 | | | 200,000 | | | | 196,844 | |
2.55% | | 12/09/21 | | | 150,000 | | | | 146,346 | |
2.95% | | 02/23/25 | | | 100,000 | | | | 96,066 | |
3.10% | | 10/25/27 | | | 100,000 | | | | 95,304 | |
PPG Industries Inc. | |
3.75% | | 03/15/28 | | | 50,000 | | | | 48,213 | |
PPL Electric Utilities Corp. | |
4.15% | | 06/15/48 | | | 100,000 | | | | 99,715 | |
President & Fellows of Harvard College | |
3.15% | | 07/15/46 | | | 50,000 | | | | 44,736 | |
Principal Financial Group Inc. | |
3.40% | | 05/15/25 | | | 150,000 | | | | 146,487 | |
Prologis LP | |
4.25% | | 08/15/23 | | | 150,000 | | | | 154,809 | |
Providence Saint Joseph Health Obligated Group | |
3.93% | | 10/01/48 | | | 20,000 | | | | 18,985 | |
Prudential Financial Inc. | |
3.94% | | 12/07/49 | | | 190,000 | | | | 169,736 | |
Prudential Financial Inc. (5.70% fixed rate until 09/15/28; 2.67% + 3 month USD LIBOR thereafter) | |
5.70% | | 09/15/48 | | | 100,000 | | | | 92,037 | (f) |
Public Service Company of Colorado | |
See Notes to Schedules of Investments and Notes to Financial Statements.
| | |
| State Street Total Return V.I.S. Fund | | |
| Schedule of Investments | | December 31, 2018 |
| | | | | | | | | | |
| | | Principal
Amount ($) | | | Fair
Value | |
3.70% | | 06/15/28 | | $ | 50,000 | | | $ | 50,507 | |
4.10% | | 06/15/48 | | | 30,000 | | | | 29,810 | |
Public Service Electric & Gas Co. | |
2.38% | | 05/15/23 | | | 200,000 | | | | 193,216 | |
3.65% | | 09/01/28 | | | 25,000 | | | | 25,131 | |
Puget Energy Inc. | |
3.65% | | 05/15/25 | | | 150,000 | | | | 145,726 | |
QUALCOMM Inc. | |
4.30% | | 05/20/47 | | | 100,000 | | | | 89,015 | |
4.65% | | 05/20/35 | | | 150,000 | | | | 145,159 | |
Quest Diagnostics Inc. | |
4.25% | | 04/01/24 | | | 150,000 | | | | 152,187 | |
Raytheon Co. | |
3.15% | | 12/15/24 | | | 90,000 | | | | 89,582 | |
Realty Income Corp. | |
4.65% | | 08/01/23 | | | 100,000 | | | | 104,016 | |
Regency Centers LP | |
4.13% | | 03/15/28 | | | 50,000 | | | | 49,293 | |
Regions Bank (3.37% fixed rate until 08/13/20; 0.50% + 3 month USD LIBOR thereafter) | |
3.37% | | 08/13/21 | | | 50,000 | | | | 49,765 | (f) |
Regions Financial Corp. | |
3.80% | | 08/14/23 | | | 50,000 | | | | 50,028 | |
RELX Capital Inc. | |
3.50% | | 03/16/23 | | | 30,000 | | | | 29,688 | |
Reynolds American Inc. | |
4.45% | | 06/12/25 | | | 100,000 | | | | 96,184 | |
Rio Tinto Finance USA Ltd. | |
5.20% | | 11/02/40 | | | 250,000 | | | | 276,572 | |
Rogers Communications Inc. | |
2.90% | | 11/15/26 | | | 100,000 | | | | 92,772 | |
3.00% | | 03/15/23 | | | 50,000 | | | | 49,025 | |
3.63% | | 12/15/25 | | | 60,000 | | | | 58,512 | |
Roper Technologies Inc. | |
3.80% | | 12/15/26 | | | 100,000 | | | | 97,104 | |
Royal Bank of Canada | |
2.15% | | 03/06/20 - 10/26/20 | | | 275,000 | | | | 271,566 | |
2.30% | | 03/22/21 | | | 150,000 | | | | 148,083 | |
2.75% | | 02/01/22 | | | 50,000 | | | | 49,225 | |
Royal Bank of Scotland Group PLC | |
3.88% | | 09/12/23 | | | 100,000 | | | | 95,855 | |
5.13% | | 05/28/24 | | | 80,000 | | | | 77,630 | |
6.00% | | 12/19/23 | | | 75,000 | | | | 75,905 | |
6.10% | | 06/10/23 | | | 35,000 | | | | 35,545 | |
6.13% | | 12/15/22 | | | 85,000 | | | | 86,423 | |
Royal Bank of Scotland Group PLC (4.89% fixed rate until 05/18/28; 1.75% + 3 month USD LIBOR thereafter) | |
4.89% | | 05/18/29 | | | 100,000 | | | | 95,514 | (f) |
RPM International Inc. | |
4.25% | | 01/15/48 | | | 50,000 | | | | 42,552 | |
Ryder System Inc. | |
3.40% | | 03/01/23 | | | 150,000 | | | | 147,888 | |
S&P Global Inc. | |
4.40% | | 02/15/26 | | | 100,000 | | | | 103,046 | |
Sabine Pass Liquefaction LLC | |
5.63% | | 02/01/21 - 03/01/25 | | | 310,000 | | | | 320,830 | |
5.75% | | 05/15/24 | | | 35,000 | | | | 36,566 | |
San Diego Gas & Electric Co. | |
3.60% | | 09/01/23 | | | 100,000 | | | | 100,310 | |
Sanofi | |
3.63% | | 06/19/28 | | | 100,000 | | | | 100,822 | |
Santander Holdings USA Inc. | |
2.65% | | 04/17/20 | | | 50,000 | | | | 49,363 | |
3.40% | | 01/18/23 | | | 50,000 | | | | 48,083 | |
4.40% | | 07/13/27 | | | 50,000 | | | | 47,199 | |
4.45% | | 12/03/21 | | | 200,000 | | | | 202,818 | |
Santander UK Group Holdings PLC (3.37% fixed rate until 01/05/23; 1.08% + 3 month USD LIBOR thereafter) | |
3.37% | | 01/05/24 | | | 100,000 | | | | 94,627 | (f) |
Santander UK PLC | |
2.38% | | 03/16/20 | | | 150,000 | | | | 148,195 | |
Seagate HDD Cayman | |
4.75% | | 06/01/23 | | | 150,000 | | | | 141,060 | |
Sempra Energy | |
3.80% | | 02/01/38 | | | 100,000 | | | | 86,083 | |
4.05% | | 12/01/23 | | | 150,000 | | | | 150,577 | |
| | | | | | | | | | |
| | | Principal
Amount ($) | | | Fair
Value | |
Shell International Finance BV | |
3.50% | | 11/13/23 | | $ | 140,000 | | | $ | 141,555 | |
4.00% | | 05/10/46 | | | 150,000 | | | | 145,285 | |
4.13% | | 05/11/35 | | | 150,000 | | | | 149,365 | |
4.38% | | 03/25/20 - 05/11/45 | | | 200,000 | | | | 204,243 | |
Shire Acquisitions Investments Ireland DAC | |
3.20% | | 09/23/26 | | | 150,000 | | | | 136,731 | |
Simon Property Group LP | |
2.75% | | 02/01/23 | | | 121,000 | | | | 117,393 | |
SL Green Operating Partnership LP | |
3.25% | | 10/15/22 | | | 30,000 | | | | 28,987 | |
South Carolina Electric & Gas Co. | |
5.10% | | 06/01/65 | | | 150,000 | | | | 154,701 | |
Southern California Edison Co. | |
3.40% | | 06/01/23 | | | 100,000 | | | | 98,956 | |
3.60% | | 02/01/45 | | | 125,000 | | | | 107,435 | |
Southern Copper Corp. | |
5.88% | | 04/23/45 | | | 155,000 | | | | 157,585 | |
Southwest Airlines Co. | |
3.00% | | 11/15/26 | | | 100,000 | | | | 92,569 | |
Southwestern Electric Power Co. | |
3.85% | | 02/01/48 | | | 100,000 | | | | 88,438 | |
Spectra Energy Partners LP | |
3.50% | | 03/15/25 | | | 150,000 | | | | 143,064 | |
SSM Health Care Corp. | |
3.69% | | 06/01/23 | | | 10,000 | | | | 10,099 | |
Stanley Black & Decker Inc. | |
2.90% | | 11/01/22 | | | 150,000 | | | | 147,466 | |
Starbucks Corp. | |
2.20% | | 11/22/20 | | | 20,000 | | | | 19,671 | |
3.10% | | 03/01/23 | | | 50,000 | | | | 49,216 | |
3.50% | | 03/01/28 | | | 50,000 | | | | 47,723 | |
3.75% | | 12/01/47 | | | 35,000 | | | | 29,185 | |
Stryker Corp. | |
3.65% | | 03/07/28 | | | 150,000 | | | | 144,991 | |
Sumitomo Mitsui Banking Corp. | |
2.45% | | 01/16/20 | | | 150,000 | | | | 148,764 | |
Sumitomo Mitsui Financial Group Inc. | |
2.78% | | 10/18/22 | | | 200,000 | | | | 194,228 | |
3.01% | | 10/19/26 | | | 100,000 | | | | 93,862 | |
3.35% | | 10/18/27 | | | 50,000 | | | | 47,902 | |
3.94% | | 10/16/23 | | | 100,000 | | | | 101,527 | |
4.31% | | 10/16/28 | | | 100,000 | | | | 102,965 | |
Suncor Energy Inc. | |
6.85% | | 06/01/39 | | | 150,000 | | | | 178,569 | |
Sunoco Logistics Partners Operations LP | |
5.95% | | 12/01/25 | | | 150,000 | | | | 156,829 | |
SunTrust Bank | |
2.25% | | 01/31/20 | | | 100,000 | | | | 98,794 | |
3.00% | | 02/02/23 | | | 100,000 | | | | 98,039 | |
SunTrust Banks Inc. | |
4.00% | | 05/01/25 | | | 50,000 | | | | 50,111 | |
Svensk Exportkredit AB | |
1.75% | | 05/18/20 | | | 200,000 | | | | 197,536 | |
Svenska Handelsbanken AB | |
3.35% | | 05/24/21 | | | 150,000 | | | | 149,856 | |
Synchrony Financial | |
3.95% | | 12/01/27 | | | 100,000 | | | | 83,941 | |
Sysco Corp. | |
3.55% | | 03/15/25 | | | 100,000 | | | | 98,112 | |
4.45% | | 03/15/48 | | | 100,000 | | | | 94,728 | |
Takeda Pharmaceutical Company Ltd. | |
3.80% | | 11/26/20 | | | 100,000 | | | | 100,722 | (d) |
4.40% | | 11/26/23 | | | 50,000 | | | | 50,570 | (d) |
5.00% | | 11/26/28 | | | 50,000 | | | | 51,078 | (d) |
Tampa Electric Co. | |
4.30% | | 06/15/48 | | | 50,000 | | | | 48,384 | |
Target Corp. | |
3.90% | | 11/15/47 | | | 50,000 | | | | 45,988 | |
4.00% | | 07/01/42 | | | 150,000 | | | | 141,516 | |
TC PipeLines LP | |
3.90% | | 05/25/27 | | | 100,000 | | | | 94,823 | |
TD Ameritrade Holding Corp. | |
2.95% | | 04/01/22 | | | 150,000 | | | | 148,441 | |
Telefonica Emisiones SA | |
5.13% | | 04/27/20 | | | 300,000 | | | | 306,594 | |
See Notes to Schedules of Investments and Notes to Financial Statements.
| | |
| State Street Total Return V.I.S. Fund | | |
| Schedule of Investments | | December 31, 2018 |
| | | | | | | | | | |
| | | Principal
Amount ($) | | | Fair
Value | |
TELUS Corp. | |
4.60% | | 11/16/48 | | $ | 50,000 | | | $ | 49,662 | |
Texas Instruments Inc. | |
1.75% | | 05/01/20 | | | 150,000 | | | | 147,861 | |
The Allstate Corp. | |
4.20% | | 12/15/46 | | | 100,000 | | | | 97,162 | |
The Allstate Corp. (5.75% fixed rate until 08/15/23; 2.94% + 3 month USD LIBOR thereafter) | |
5.75% | | 08/15/53 | | | 50,000 | | | | 48,458 | (f) |
The Bank of New York Mellon Corp. | |
2.80% | | 05/04/26 | | | 30,000 | | | | 28,101 | |
3.00% | | 02/24/25 | | | 105,000 | | | | 101,092 | |
3.45% | | 08/11/23 | | | 200,000 | | | | 200,704 | |
3.50% | | 04/28/23 | | | 100,000 | | | | 100,288 | |
3.85% | | 04/28/28 | | | 100,000 | | | | 100,758 | |
The Bank of Nova Scotia | |
2.50% | | 01/08/21 | | | 200,000 | | | | 197,654 | |
3.13% | | 04/20/21 | | | 100,000 | | | | 99,829 | |
The Boeing Co. | |
3.38% | | 06/15/46 | | | 150,000 | | | | 132,021 | |
The Charles Schwab Corp. | |
3.85% | | 05/21/25 | | | 150,000 | | | | 152,748 | |
The Clorox Co. | |
3.50% | | 12/15/24 | | | 150,000 | | | | 149,362 | |
The Coca-Cola Co. | |
2.45% | | 11/01/20 | | | 150,000 | | | | 148,938 | |
The Dow Chemical Co. | |
3.00% | | 11/15/22 | | | 137,000 | | | | 133,090 | |
4.38% | | 11/15/42 | | | 237,000 | | | | 208,451 | |
The George Washington University | |
4.13% | | 09/15/48 | | | 50,000 | | | | 49,983 | |
The Goldman Sachs Group Inc. | |
2.60% | | 12/27/20 | | | 200,000 | | | | 196,306 | |
2.75% | | 09/15/20 | | | 150,000 | | | | 148,303 | |
3.00% | | 04/26/22 | | | 100,000 | | | | 97,227 | |
3.50% | | 11/16/26 | | | 150,000 | | | | 139,113 | |
3.85% | | 07/08/24 | | | 150,000 | | | | 146,139 | |
4.80% | | 07/08/44 | | | 200,000 | | | | 190,356 | |
5.38% | | 03/15/20 | | | 100,000 | | | | 102,193 | |
5.75% | | 01/24/22 | | | 100,000 | | | | 104,704 | |
6.25% | | 02/01/41 | | | 150,000 | | | | 170,731 | |
6.75% | | 10/01/37 | | | 200,000 | | | | 226,538 | |
The Goldman Sachs Group Inc. (2.88% fixed rate until 10/31/21; 0.82% + 3 month USD LIBOR thereafter) | |
2.88% | | 10/31/22 | | | 200,000 | | | | 193,896 | (f) |
The Goldman Sachs Group Inc. (4.02% fixed rate until 10/31/37; 1.37% + 3 month USD LIBOR thereafter) | |
4.02% | | 10/31/38 | | | 200,000 | | | | 175,716 | (f) |
The Hartford Financial Services Group Inc. | |
4.40% | | 03/15/48 | | | 100,000 | | | | 93,053 | |
The Hershey Co. | |
3.38% | | 05/15/23 | | | 50,000 | | | | 50,404 | |
The Home Depot Inc. | |
2.13% | | 09/15/26 | | | 45,000 | | | | 40,489 | |
2.63% | | 06/01/22 | | | 190,000 | | | | 187,853 | |
3.90% | | 12/06/28 | | | 100,000 | | | | 102,302 | |
4.20% | | 04/01/43 | | | 150,000 | | | | 147,780 | |
4.40% | | 04/01/21 | | | 150,000 | | | | 154,587 | |
5.88% | | 12/16/36 | | | 200,000 | | | | 240,122 | |
The Interpublic Group of Companies Inc. | |
4.65% | | 10/01/28 | | | 10,000 | | | | 9,876 | |
The JM Smucker Co. | |
3.38% | | 12/15/27 | | | 100,000 | | | | 93,026 | |
The Kroger Co. | |
3.85% | | 08/01/23 | | | 150,000 | | | | 150,507 | |
The Mosaic Co. | |
3.25% | | 11/15/22 | | | 50,000 | | | | 48,566 | |
4.05% | | 11/15/27 | | | 50,000 | | | | 48,086 | |
The Procter & Gamble Co. | |
1.70% | | 11/03/21 | | | 200,000 | | | | 193,974 | |
2.45% | | 11/03/26 | | | 100,000 | | | | 93,592 | |
The Progressive Corp. | |
4.35% | | 04/25/44 | | | 100,000 | | | | 100,645 | |
The Sherwin-Williams Co. | |
3.95% | | 01/15/26 | | | 100,000 | | | | 97,338 | |
4.20% | | 01/15/22 | | | 100,000 | | | | 100,982 | |
| | | | | | | | | | |
| | | Principal
Amount ($) | | | Fair
Value | |
4.50% | | 06/01/47 | | $ | 100,000 | | | $ | 90,166 | |
The Southern Co. (5.50% fixed rate until 03/15/22; 3.63% + 3 month USD LIBOR thereafter) | |
5.50% | | 03/15/57 | | | 100,000 | | | | 96,351 | (f) |
The Timken Co. | |
4.50% | | 12/15/28 | | | 20,000 | | | | 19,672 | |
The Toronto-Dominion Bank | |
3.15% | | 09/17/20 | | | 100,000 | | | | 100,268 | |
3.25% | | 06/11/21 | | | 100,000 | | | | 100,372 | |
The Travelers Companies Inc. | |
4.00% | | 05/30/47 | | | 100,000 | | | | 96,316 | |
5.35% | | 11/01/40 | | | 100,000 | | | | 113,885 | |
The Walt Disney Co. | |
2.30% | | 02/12/21 | | | 130,000 | | | | 128,337 | |
3.00% | | 07/30/46 | | | 60,000 | | | | 48,946 | |
3.15% | | 09/17/25 | | | 165,000 | | | | 161,109 | |
The Western Union Co. | |
3.60% | | 03/15/22 | | | 150,000 | | | | 149,971 | |
The Williams Companies Inc. | |
3.70% | | 01/15/23 | | | 10,000 | | | | 9,757 | |
4.55% | | 06/24/24 | | | 40,000 | | | | 40,380 | |
4.85% | | 03/01/48 | | | 70,000 | | | | 63,609 | |
5.10% | | 09/15/45 | | | 150,000 | | | | 139,395 | |
5.75% | | 06/24/44 | | | 15,000 | | | | 14,868 | |
5.80% | | 11/15/43 | | | 150,000 | | | | 152,188 | |
Thermo Fisher Scientific Inc. | |
3.30% | | 02/15/22 | | | 80,000 | | | | 79,392 | |
4.15% | | 02/01/24 | | | 25,000 | | | | 25,371 | |
Time Warner Cable LLC | |
4.50% | | 09/15/42 | | | 150,000 | | | | 119,222 | |
Torchmark Corp. | |
4.55% | | 09/15/28 | | | 25,000 | | | | 25,395 | |
Total Capital International S.A. | |
2.75% | | 06/19/21 | | | 150,000 | | | | 148,800 | |
Total Capital S.A. | |
3.88% | | 10/11/28 | | | 25,000 | | | | 25,668 | |
Total System Services Inc. | |
4.45% | | 06/01/28 | | | 100,000 | | | | 98,369 | |
Toyota Motor Credit Corp. | |
1.95% | | 04/17/20 | | | 100,000 | | | | 98,551 | |
2.60% | | 01/11/22 | | | 100,000 | | | | 98,380 | |
2.70% | | 01/11/23 | | | 100,000 | | | | 97,216 | |
3.05% | | 01/11/28 | | | 100,000 | | | | 96,052 | |
3.45% | | 09/20/23 | | | 50,000 | | | | 50,110 | |
TransAlta Corp. | |
4.50% | | 11/15/22 | | | 123,000 | | | | 119,410 | |
TransCanada PipeLines Ltd. | |
4.25% | | 05/15/28 | | | 50,000 | | | | 49,488 | |
5.10% | | 03/15/49 | | | 50,000 | | | | 49,908 | |
7.63% | | 01/15/39 | | | 100,000 | | | | 125,586 | |
Transcontinental Gas Pipe Line Company LLC | |
4.00% | | 03/15/28 | | | 100,000 | | | | 96,605 | |
Tucson Electric Power Co. | |
4.85% | | 12/01/48 | | | 50,000 | | | | 52,039 | |
Tyson Foods Inc. | |
4.88% | | 08/15/34 | | | 70,000 | | | | 66,854 | |
5.10% | | 09/28/48 | | | 30,000 | | | | 28,873 | |
U.S. Bancorp | |
2.63% | | 01/24/22 | | | 100,000 | | | | 98,390 | |
UDR Inc. | |
4.40% | | 01/26/29 | | | 50,000 | | | | 50,303 | |
Unilever Capital Corp. | |
2.00% | | 07/28/26 | | | 150,000 | | | | 134,504 | |
2.90% | | 05/05/27 | | | 100,000 | | | | 95,197 | |
Union Electric Co. | |
2.95% | | 06/15/27 | | | 100,000 | | | | 95,349 | |
3.65% | | 04/15/45 | | | 135,000 | | | | 123,705 | |
Union Pacific Corp. | |
3.00% | | 04/15/27 | | | 100,000 | | | | 94,564 | |
3.20% | | 06/08/21 | | | 200,000 | | | | 200,726 | |
3.50% | | 06/08/23 | | | 50,000 | | | | 50,131 | |
3.95% | | 09/10/28 | | | 30,000 | | | | 29,983 | |
4.38% | | 09/10/38 | | | 15,000 | | | | 14,778 | |
4.50% | | 09/10/48 | | | 30,000 | | | | 29,653 | |
4.80% | | 09/10/58 | | | 25,000 | | | | 24,944 | |
See Notes to Schedules of Investments and Notes to Financial Statements.
| | |
| State Street Total Return V.I.S. Fund | | |
| Schedule of Investments | | December 31, 2018 |
| | | | | | | | | | |
| | | Principal
Amount ($) | | | Fair
Value | |
United Airlines2013-1 Class A Pass Through Trust | |
4.30% | | 08/15/25 | | $ | 200,622 | | | $ | 201,420 | |
United Parcel Service Inc. | |
2.45% | | 10/01/22 | | | 175,000 | | | | 170,809 | |
3.05% | | 11/15/27 | | | 50,000 | | | | 47,601 | |
3.75% | | 11/15/47 | | | 50,000 | | | | 45,114 | |
United Technologies Corp. | |
1.90% | | 05/04/20 | | | 200,000 | | | | 196,556 | |
3.35% | | 08/16/21 | | | 110,000 | | | | 109,674 | |
3.65% | | 08/16/23 | | | 20,000 | | | | 19,924 | |
3.95% | | 08/16/25 | | | 15,000 | | | | 14,897 | |
4.13% | | 11/16/28 | | | 30,000 | | | | 29,726 | |
4.45% | | 11/16/38 | | | 110,000 | | | | 106,123 | |
4.50% | | 06/01/42 | | | 158,000 | | | | 150,160 | |
4.63% | | 11/16/48 | | | 15,000 | | | | 14,493 | |
UnitedHealth Group Inc. | |
2.95% | | 10/15/27 | | | 200,000 | | | | 189,706 | |
3.10% | | 03/15/26 | | | 150,000 | | | | 144,888 | |
3.50% | | 02/15/24 | | | 10,000 | | | | 10,077 | |
3.70% | | 12/15/25 | | | 10,000 | | | | 10,142 | |
3.75% | | 10/15/47 | | | 100,000 | | | | 91,845 | |
3.88% | | 12/15/28 | | | 15,000 | | | | 15,208 | |
4.45% | | 12/15/48 | | | 10,000 | | | | 10,300 | |
4.63% | | 07/15/35 | | | 45,000 | | | | 47,638 | |
6.88% | | 02/15/38 | | | 100,000 | | | | 130,633 | |
University of Notre Dame du Lac | |
3.39% | | 02/15/48 | | | 25,000 | | | | 23,690 | |
US Bancorp | |
3.95% | | 11/17/25 | | | 100,000 | | | | 102,379 | |
US Bank NA | |
2.05% | | 10/23/20 | | | 150,000 | | | | 147,345 | |
2.80% | | 01/27/25 | | | 150,000 | | | | 143,865 | |
Vale Overseas Ltd. | |
6.88% | | 11/10/39 | | | 100,000 | | | | 115,531 | |
Valero Energy Corp. | |
6.63% | | 06/15/37 | | | 150,000 | | | | 165,324 | |
Valero Energy Partners LP | |
4.38% | | 12/15/26 | | | 100,000 | | | | 98,260 | |
Ventas Realty LP | |
4.00% | | 03/01/28 | | | 150,000 | | | | 145,242 | |
4.40% | | 01/15/29 | | | 100,000 | | | | 99,578 | |
VEREIT Operating Partnership LP | |
4.13% | | 06/01/21 | | | 15,000 | | | | 15,125 | |
4.60% | | 02/06/24 | | | 20,000 | | | | 20,182 | |
4.88% | | 06/01/26 | | | 25,000 | | | | 24,972 | |
Verizon Communications Inc. | |
2.63% | | 02/21/20 | | | 150,000 | | | | 149,425 | |
3.85% | | 11/01/42 | | | 236,000 | | | | 203,826 | |
4.33% | | 09/21/28 | | | 109,000 | | | | 109,399 | |
4.40% | | 11/01/34 | | | 150,000 | | | | 144,783 | |
4.52% | | 09/15/48 | | | 150,000 | | | | 140,499 | |
4.81% | | 03/15/39 | | | 189,000 | | | | 185,917 | |
5.25% | | 03/16/37 | | | 350,000 | | | | 366,429 | |
Viacom Inc. | |
5.85% | | 09/01/43 | | | 100,000 | | | | 97,894 | |
Virginia Electric & Power Co. | |
3.80% | | 04/01/28 | | | 100,000 | | | | 100,385 | |
4.60% | | 12/01/48 | | | 60,000 | | | | 62,719 | |
4.65% | | 08/15/43 | | | 100,000 | | | | 104,388 | |
Visa Inc. | |
2.15% | | 09/15/22 | | | 200,000 | | | | 193,760 | |
4.30% | | 12/14/45 | | | 100,000 | | | | 103,556 | |
Vodafone Group PLC | |
2.50% | | 09/26/22 | | | 226,000 | | | | 216,250 | |
4.38% | | 05/30/28 - 02/19/43 | | | 205,000 | | | | 179,908 | |
5.25% | | 05/30/48 | | | 50,000 | | | | 46,851 | |
Vornado Realty LP | |
3.50% | | 01/15/25 | | | 50,000 | | | | 48,142 | |
Vulcan Materials Co. | |
4.70% | | 03/01/48 | | | 50,000 | | | | 43,003 | |
Wabtec Corp. | |
3.45% | | 11/15/26 | | | 100,000 | | | | 89,277 | |
Walgreens Boots Alliance Inc. | |
3.45% | | 06/01/26 | | | 55,000 | | | | 51,718 | |
4.50% | | 11/18/34 | | | 155,000 | | | | 145,232 | |
Walmart Inc. | |
| | | | | | | | | | |
| | | Principal
Amount ($) | | | Fair
Value | |
1.90% | | 12/15/20 | | $ | 100,000 | | | $ | 98,402 | |
2.35% | | 12/15/22 | | | 100,000 | | | | 97,348 | |
2.65% | | 12/15/24 | | | 100,000 | | | | 96,696 | |
3.13% | | 06/23/21 | | | 50,000 | | | | 50,364 | |
3.40% | | 06/26/23 | | | 50,000 | | | | 50,569 | |
3.63% | | 12/15/47 | | | 125,000 | | | | 115,694 | |
3.70% | | 06/26/28 | | | 100,000 | | | | 101,428 | |
3.95% | | 06/28/38 | | | 40,000 | | | | 39,748 | |
4.05% | | 06/29/48 | | | 35,000 | | | | 34,774 | |
Warner Media LLC | |
3.60% | | 07/15/25 | | | 100,000 | | | | 94,872 | |
6.10% | | 07/15/40 | | | 150,000 | | | | 155,091 | |
Waste Management Inc. | |
2.90% | | 09/15/22 | | | 150,000 | | | | 147,651 | |
WEC Energy Group Inc. | |
3.38% | | 06/15/21 | | | 65,000 | | | | 64,841 | |
Wells Fargo & Co. | |
2.15% | | 01/30/20 | | | 220,000 | | | | 217,668 | |
2.50% | | 03/04/21 | | | 240,000 | | | | 235,714 | |
4.13% | | 08/15/23 | | | 150,000 | | | | 150,723 | |
4.40% | | 06/14/46 | | | 150,000 | | | | 138,247 | |
4.65% | | 11/04/44 | | | 150,000 | | | | 141,726 | |
4.75% | | 12/07/46 | | | 100,000 | | | | 96,512 | |
5.61% | | 01/15/44 | | | 169,000 | | | | 183,213 | |
Wells Fargo Bank NA | |
2.40% | | 01/15/20 | | | 100,000 | | �� | | 99,133 | |
3.55% | | 08/14/23 | | | 150,000 | | | | 149,416 | |
Wells Fargo Bank NA (3.33% fixed rate until 07/23/20; 0.49% + 3 month USD LIBOR thereafter) | |
3.33% | | 07/23/21 | | | 150,000 | | | | 149,701 | (f) |
Welltower Inc. | |
4.25% | | 04/15/28 | | | 115,000 | | | | 113,814 | |
Western Gas Partners LP | |
5.45% | | 04/01/44 | | | 150,000 | | | | 132,240 | |
Westlake Chemical Corp. | |
4.38% | | 11/15/47 | | | 50,000 | | | | 41,505 | |
Westpac Banking Corp. | |
2.00% | | 08/19/21 | | | 100,000 | | | | 96,707 | |
2.80% | | 01/11/22 | | | 100,000 | | | | 98,197 | |
3.35% | | 03/08/27 | | | 100,000 | | | | 96,353 | |
Westpac Banking Corp. (4.32% fixed rate until 11/23/26; 2.24% + 5 Year US ISDA thereafter) | |
4.32% | | 11/23/31 | | | 100,000 | | | | 94,429 | (f) |
Westrock Co. | |
4.65% | | 03/15/26 | | | 100,000 | | | | 101,289 | (d) |
Weyerhaeuser Co. (REIT) | |
7.38% | | 03/15/32 | | | 100,000 | | | | 122,081 | |
Whirlpool Corp. | |
3.70% | | 05/01/25 | | | 150,000 | | | | 143,332 | |
Willis North America Inc. | |
4.50% | | 09/15/28 | | | 50,000 | | | | 48,824 | |
Wisconsin Electric Power Co. | |
4.30% | | 10/15/48 | | | 10,000 | | | | 10,268 | |
Wisconsin Power & Light Co. | |
3.05% | | 10/15/27 | | | 100,000 | | | | 95,324 | |
WPP Finance 2010 | |
5.13% | | 09/07/42 | | | 191,000 | | | | 175,433 | |
Xcel Energy Inc. | |
3.30% | | 06/01/25 | | | 150,000 | | | | 146,206 | |
4.00% | | 06/15/28 | | | 100,000 | | | | 100,611 | |
Zimmer Biomet Holdings Inc. | |
3.70% | | 03/19/23 | | | 75,000 | | | | 73,918 | |
Zoetis Inc. | |
4.70% | | 02/01/43 | | | 150,000 | | | | 152,152 | |
| | | | 121,310,340 | |
Non-Agency Collateralized Mortgage Obligations – 0.2% | |
BANK 2018-BNK14 | |
4.23% | | 09/15/60 | | | 191,106 | | | | 198,948 | |
BBCMS Mortgage Trust2018-C2 | |
4.31% | | 12/15/51 | | | 50,000 | | | | 52,238 | |
Benchmark2018-B5 Mortgage Trust | |
4.21% | | 07/15/51 | | | 100,000 | | | | 103,943 | |
Benchmark Mortgage Trust | |
4.12% | | 07/15/51 | | | 100,000 | | | | 103,053 | |
CD2017-CD6 Mortgage Trust | |
3.46% | | 11/13/50 | | | 150,000 | | | | 147,078 | |
See Notes to Schedules of Investments and Notes to Financial Statements.
| | |
| State Street Total Return V.I.S. Fund | | |
| Schedule of Investments | | December 31, 2018 |
| | | | | | | | | | |
| | | Principal
Amount ($) | | | Fair
Value | |
Citigroup Commercial Mortgage Trust 2014-GC21 | |
4.03% | | 05/10/47 | | $ | 100,000 | | | $ | 101,323 | |
Citigroup Commercial Mortgage Trust 2014-GC25 | |
4.02% | | 10/10/47 | | | 300,000 | | | | 303,166 | |
COMM 2012-CCRE 1 Mortgage Trust | |
3.39% | | 05/15/45 | | | 468,712 | | | | 468,519 | |
COMM 2013-CCRE12 Mortgage Trust | |
4.05% | | 10/10/46 | | | 200,000 | | | | 206,199 | |
CSAIL 2018-CX12 Commercial Mortgage Trust | |
4.22% | | 08/15/51 | | | 300,000 | | | | 311,106 | |
GS Mortgage Securities Trust 2015-GC28 | |
3.98% | | 02/10/48 | | | 150,000 | | | | 147,597 | |
GS Mortgage Securities Trust2016-GS3 | |
2.78% | | 10/10/49 | | | 80,000 | | | | 78,053 | |
GS Mortgage Securities Trust2017-GS5 | |
3.67% | | 03/10/50 | | | 204,729 | | | | 204,511 | |
JP Morgan Chase Commercial Mortgage Securities Trust2014-C20 | |
3.80% | | 07/15/47 | | | 250,000 | | | | 254,299 | |
JPMBB Commercial Mortgage Securities Trust2013-C14 | |
3.76% | | 08/15/46 | | | 228,926 | | | | 230,917 | (f) |
JPMBB Commercial Mortgage Securities Trust2014-C22 | |
3.80% | | 09/15/47 | | | 75,000 | | | | 76,137 | |
Morgan Stanley Bank of America Merrill Lynch Trust2016-C29 | |
3.14% | | 05/15/49 | | | 500,000 | | | | 495,190 | |
Morgan Stanley Capital I Trust 2016-UBS12 | |
3.60% | | 12/15/49 | | | 150,000 | | | | 149,614 | |
UBS Commercial Mortgage Trust2017-C4 | |
3.56% | | 10/15/50 | | | 185,000 | | | | 183,190 | |
Wells Fargo Commercial Mortgage Trust2012-LC5 | |
2.92% | | 10/15/45 | | | 158,783 | | | | 156,861 | |
4.69% | | 10/15/45 | | | 220,000 | | | | 223,494 | (f) |
Wells Fargo Commercial Mortgage Trust2017-C41 | |
3.47% | | 11/15/50 | | | 300,000 | | | | 295,352 | |
WFRBS Commercial Mortgage Trust2012-C7 | |
3.43% | | 06/15/45 | | | 200,000 | | | | 201,069 | |
WFRBS Commercial Mortgage Trust2014-C23 | |
3.65% | | 10/15/57 | | | 68,545 | | | | 69,285 | |
| | | | 4,761,142 | |
Sovereign Bonds – 0.4% | |
Export Development Canada | |
2.50% | | 01/24/23 | | | 200,000 | | | | 198,820 | |
Export-Import Bank of Korea | |
3.00% | | 11/01/22 | | | 200,000 | | | | 197,730 | |
3.63% | | 11/27/23 | | | 200,000 | | | | 201,402 | |
Government of Canada | |
2.00% | | 11/15/22 | | | 125,000 | | | | 122,419 | |
Government of Chile | |
3.88% | | 08/05/20 | | | 200,000 | | | | 202,308 | |
Government of Colombia | |
5.00% | | 06/15/45 | | | 250,000 | | | | 238,380 | |
6.13% | | 01/18/41 | | | 250,000 | | | | 270,547 | |
Government of Hungary | |
5.38% | | 03/25/24 | | | 300,000 | | | | 322,005 | |
Government of Indonesia | |
4.75% | | 02/11/29 | | | 200,000 | | | | 203,570 | |
Government of Italy | |
5.38% | | 06/15/33 | | | 250,000 | | | | 262,483 | |
Government of Mexico | |
3.50% | | 01/21/21 | | | 200,000 | | | | 199,230 | |
4.35% | | 01/15/47 | | | 200,000 | | | | 171,894 | |
4.75% | | 03/08/44 | | | 102,000 | | | | 92,591 | |
5.75% | | 10/12/10 | | | 172,000 | | | | 161,702 | |
6.05% | | 01/11/40 | | | 130,000 | | | | 137,821 | |
Government of Panama | |
6.70% | | 01/26/36 | | | 250,000 | | | | 306,177 | |
Government of Peru | |
6.55% | | 03/14/37 | | | 147,000 | | | | 185,424 | |
7.35% | | 07/21/25 | | | 100,000 | | | | 121,731 | |
Government of Philippines | |
3.70% | | 03/01/41 | | | 200,000 | | | | 189,430 | |
4.00% | | 01/15/21 | | | 100,000 | | | | 101,149 | |
4.20% | | 01/21/24 | | | 200,000 | | | | 205,716 | |
Government of Poland | |
3.00% | | 03/17/23 | | | 147,000 | | | | 145,442 | |
3.25% | | 04/06/26 | | | 100,000 | | | | 98,181 | |
5.00% | | 03/23/22 | | | 100,000 | | | | 105,483 | |
| | | | | | | | | | |
| | | Principal
Amount ($) | | | Fair
Value | |
Government of Uruguay | |
4.50% | | 08/14/24 | | $ | 200,000 | | | $ | 204,808 | |
Iraq Government AID Bond | |
2.15% | | 01/18/22 | | | 480,000 | | | | 473,947 | |
Japan Bank for International Cooperation | |
2.13% | | 07/21/20 | | | 400,000 | | | | 395,972 | |
2.88% | | 07/21/27 | | | 200,000 | | | | 195,244 | |
3.38% | | 10/31/23 | | | 200,000 | | | | 203,800 | |
Province of Alberta Canada | |
3.35% | | 11/01/23 | | | 150,000 | | | | 152,903 | |
Province of Ontario Canada | |
2.55% | | 02/12/21 | | | 150,000 | | | | 149,388 | |
3.40% | | 10/17/23 | | | 150,000 | | | | 153,228 | |
Province of Quebec Canada | |
3.50% | | 07/29/20 | | | 200,000 | | | | 202,508 | |
The Korea Development Bank | |
2.63% | | 02/27/22 | | | 200,000 | | | | 196,270 | |
| | | | 6,769,703 | |
Municipal Bonds and Notes – 0.2% | |
American Municipal Power Inc. | |
6.27% | | 02/15/50 | | | 200,000 | | | | 248,200 | |
Bay Area Toll Authority | |
6.26% | | 04/01/49 | | | 100,000 | | | | 136,098 | |
Chicago O’Hare International Airport | |
4.47% | | 01/01/49 | | | 100,000 | | | | 101,451 | |
Chicago Transit Authority | |
6.90% | | 12/01/40 | | | 75,000 | | | | 95,812 | |
Commonwealth of Massachusetts | |
4.50% | | 08/01/31 | | | 100,000 | | | | 106,986 | |
Dallas Area Rapid Transit | |
5.02% | | 12/01/48 | | | 75,000 | | | | 87,395 | |
6.00% | | 12/01/44 | | | 100,000 | | | | 129,709 | |
East Bay Municipal Utility District | |
5.87% | | 06/01/40 | | | 100,000 | | | | 128,634 | |
Florida Hurricane Catastrophe Fund Finance Corp. | |
3.00% | | 07/01/20 | | | 100,000 | | | | 100,131 | |
Los Angeles Department of Water & Power | |
6.57% | | 07/01/45 | | | 100,000 | | | | 138,663 | |
6.60% | | 07/01/50 | | | 90,000 | | | | 127,021 | |
Los Angeles Unified School District | |
5.76% | | 07/01/29 | | | 110,000 | | | | 127,298 | |
Metropolitan Transportation Authority | |
6.81% | | 11/15/40 | | | 150,000 | | | | 199,240 | |
Municipal Electric Authority of Georgia | |
6.64% | | 04/01/57 | | | 125,000 | | | | 132,155 | |
New York City Water & Sewer System | |
6.01% | | 06/15/42 | | | 50,000 | | | | 64,536 | |
North Texas Tollway Authority | |
6.72% | | 01/01/49 | | | 100,000 | | | | 137,606 | |
Port Authority of New York & New Jersey | |
4.46% | | 10/01/62 | | | 100,000 | | | | 101,741 | |
5.31% | | 08/01/46 | | | 200,000 | | | | 215,926 | |
San Diego County Water Authority Financing Corp. | |
6.14% | | 05/01/49 | | | 100,000 | | | | 131,088 | |
South Carolina State Public Service Authority | |
6.45% | | 01/01/50 | | | 150,000 | | | | 190,117 | |
State of California | |
7.60% | | 11/01/40 | | | 100,000 | | | | 145,621 | |
University of California | |
4.60% | | 05/15/31 | | | 100,000 | | | | 107,365 | |
6.58% | | 05/15/49 | | | 100,000 | | | | 132,271 | |
University of Texas System | |
4.79% | | 08/15/46 | | | 100,000 | | | | 111,262 | |
| | | | 3,196,326 | |
U.S. Government Sponsored Agency – 0.0%* | |
Tennessee Valley Authority | |
3.50% | | 12/15/42 | | | 500,000 | | | | 490,020 | |
Total Bonds and Notes
(Cost $597,214,355) | | | | 587,555,262 | |
See Notes to Schedules of Investments and Notes to Financial Statements.
| | |
| State Street Total Return V.I.S. Fund | | |
| Schedule of Investments | | December 31, 2018 |
| | | | | | | | |
| | | Number
of Shares | | | Fair
Value | |
Exchange Traded & Mutual Funds – 9.8% | |
Invesco Optimum Yield Diversified Commodity Strategy NoK-1 ETF | | | 3,619,568 | | | | 54,546,890 | |
SPDR Bloomberg Barclays High Yield Bond ETF | | | 2,846,551 | | | $ | 95,615,648 | (h) |
SPDR Dow Jones REIT ETF | | | 410,485 | | | | 35,301,710 | (h) |
| | | | 185,464,248 | |
Total Exchange Traded & Mutual Funds
(Cost $205,081,032) | | | | 185,464,248 | |
Total Investments in Securities
(Cost $1,902,340,874) | | | | 1,813,484,657 | |
| | | | | | | | |
| | | | | | Fair
Value | |
Short-Term Investments – 4.8% | |
State Street Institutional U.S. Government Money MarketFund - Class G Shares 2.31%
(Cost $90,625,489) | | | 90,625,489 | | | $ | 90,625,489 | (h,i) |
Total Investments
(Cost $1,992,966,363) | | | | 1,904,110,146 | |
Liabilities in Excess of Other Assets, net – (0.3)% | | | | (4,883,482 | ) |
| | | | | | | | |
NET ASSETS – 100.0% | | | $ | 1,899,226,664 | |
| | | | | | | | |
The Fund had the following long futures contracts open at December 31, 2018:
| | | | | | | | | | | | | | | | |
Description | | Expiration
date | | Number
of
Contracts | | Notional Amount | | |
Value | | | Unrealized
Depreciation | |
E-mini Russell 2000 Index Futures | | March 2019 | | 28 | | | 1,970,002 | | | $ | 1,888,600 | | | $ | (81,402 | ) |
MSCI EAFE Mini Index Future | | March 2019 | | 5 | | | 436,637 | | | | 429,000 | | | | (7,637 | ) |
MSCI Emerging Markets Index Futures | | March 2019 | | 39 | | | 1,906,092 | | | | 1,885,260 | | | | (20,832 | ) |
S&P 500 Emini Index Futures | | March 2019 | | 97 | | | 12,359,917 | | | | 12,150,220 | | | | (209,697 | ) |
| | | | | | | | | | | | | | $ | (319,568 | ) |
The views expressed in this document reflect our judgment as of the publication date and are subject to change at any time without notice. The securities cited may not be representative of the Fund’s future investments and should not be construed as a recommendation to purchase or sell a particular security. See the Fund’s summary prospectus and statutory prospectus for complete descriptions of investment objectives, policies, risks and permissible investments.
| (a) | Non-income producing security. |
| (b) | At December 31, 2018, all or a portion of this security was pledged to cover collateral requirements for futures and/or TBA’s. |
| (c) | Security is fair valued by the Valuation Committee, in accordance with the procedures approved by the Fund’s Board of Directors . Security value is determined based on level 3 inputs. |
| (d) | Pursuant to Rule 144A of the Securities Act of 1933, as amended, these securities may be resold in transactions exempt from registration, normally to qualified institutional buyers. At December 31, 2018, these securities amounted to $8,909,558 or 0.47% of the net assets of the State Street Total Return V.I.S. Fund. These securities have been determined to be liquid using procedures established by the Fund’s Board of Directors. |
| (e) | Settlement is on a delayed delivery or when-issued basis with final maturity to be announced (TBA) in the future. |
| (f) | Variable Rate Security - Interest rate shown is rate in effect at December 31, 2018. For securities based on a published reference rate and spread, the reference rate and spread are indicated in the description above. |
| (h) | Sponsored by SSGA Funds Management, Inc., the Fund’s investment adviser and administrator, and an affiliate of State Street Bank & Trust Co., the Fund’ssub-administrator, custodian and accounting agent. |
| (i) | Coupon amount represents effective yield. |
| † | Percentages are based on net assets as of December 31, 2018. |
| | |
| ADR | | American Depositary Receipt |
| ISDA | | International Swaps and Derivatives Association |
| LIBOR | | London Interbank Offered Rate |
| NVDR | | Non-Voting Depositary Receipt |
| REIT | | Real Estate Investment Trust |
| SPDR | | Standard and Poor’s Depositary Receipt |
| TBA | | To Be Announced |
See Notes to Schedules of Investments and Notes to Financial Statements.
| | |
| State Street Total Return V.I.S. Fund | | |
| Schedule of Investments | | December 31, 2018 |
The following table represents the Fund’s investments measured at fair value on a recurring basis at December 31, 2018:
| | | | | | | | | | | | | | | | |
Investments | | Level 1 | | | Level 2 | | | Level 3 | | | Total | |
Investments in Securities | |
Domestic Equity | | $ | 650,568,856 | | | $ | 336 | | | $ | — | | | $ | 650,569,192 | |
Foreign Equity | | | 389,815,248 | | | | 75,604 | | | | 5,103 | | | | 389,895,955 | |
U.S. Treasuries | | | — | | | | 324,565,792 | | | | — | | | | 324,565,792 | |
Agency Mortgage Backed | | | — | | | | 121,624,985 | | | | — | | | | 121,624,985 | |
Agency Collateralized Mortgage Obligations | | | — | | | | 2,779,968 | | | | — | | | | 2,779,968 | |
Asset Backed | | | — | | | | 2,056,986 | | | | — | | | | 2,056,986 | |
Corporate Notes | | | — | | | | 121,310,340 | | | | — | | | | 121,310,340 | |
Non-Agency Collateralized Mortgage Obligations | | | — | | | | 4,761,142 | | | | — | | | | 4,761,142 | |
Sovereign Bonds | | | — | | | | 6,769,703 | | | | — | | | | 6,769,703 | |
Municipal Bonds and Notes | | | — | | | | 3,196,326 | | | | — | | | | 3,196,326 | |
U.S. Government Sponsored Agencies | | | — | | | | 490,020 | | | | — | | | | 490,020 | |
Exchange Traded & Mutual Funds | | | 185,464,248 | | | | — | | | | — | | | | 185,464,248 | |
Short-Term Investments | | | 90,625,489 | | | | — | | | | — | | | | 90,625,489 | |
| | | | | | | | | | | | | | | | |
Total Investments in Securities | | $ | 1,316,473,841 | | | $ | 587,631,202 | | | $ | 5,103 | | | $ | 1,904,110,146 | |
| | | | | | | | | | | | | | | | |
Other Financial Instruments | | | | | | | | | | | | | | | | |
Long Futures Contracts - Unrealized Depreciation | | $ | (319,568 | ) | | $ | — | | | $ | — | | | $ | (319,568 | ) |
| | | | | | | | | | | | | | | | |
The Fund was invested in the following countries/territories at December 31, 2018 (unaudited):
| | | | |
Country/Territory | | Percentage (based on
Fair Value) | |
United States | | | 77.74 | % |
Japan | | | 2.87 | % |
United Kingdom | | | 2.54 | % |
Canada | | | 1.93 | % |
Switzerland | | | 1.92 | % |
France | | | 1.27 | % |
Australia | | | 1.26 | % |
Germany | | | 1.13 | % |
China | | | 0.91 | % |
Singapore | | | 0.86 | % |
Hong Kong | | | 0.75 | % |
Ireland | | | 0.74 | % |
Sweden | | | 0.64 | % |
Italy | | | 0.61 | % |
Belgium | | | 0.48 | % |
Taiwan | | | 0.43 | % |
South Korea | | | 0.37 | % |
Supranational | | | 0.36 | % |
Austria | | | 0.32 | % |
South Africa | | | 0.28 | % |
Israel | | | 0.26 | % |
Netherlands | | | 0.24 | % |
India | | | 0.23 | % |
Norway | | | 0.19 | % |
Brazil | | | 0.18 | % |
Mexico | | | 0.16 | % |
Russian Federation | | | 0.14 | % |
Denmark | | | 0.13 | % |
Puerto Rico | | | 0.12 | % |
Malaysia | | | 0.10 | % |
Spain | | | 0.09 | % |
Poland | | | 0.08 | % |
New Zealand | | | 0.08 | % |
Thailand | | | 0.07 | % |
Luxembourg | | | 0.06 | % |
Chile | | | 0.06 | % |
Indonesia | | | 0.05 | % |
Colombia | | | 0.05 | % |
Philippines | | | 0.04 | % |
Cayman Islands | | | 0.03 | % |
Finland | | | 0.03 | % |
Turkey | | | 0.03 | % |
Greece | | | 0.03 | % |
Iraq | | | 0.02 | % |
Czech Republic | | | 0.02 | % |
Hungary | | | 0.02 | % |
Peru | | | 0.02 | % |
Panama | | | 0.02 | % |
Guernsey | | | 0.01 | % |
Uruguay | | | 0.01 | % |
Czech | | | 0.01 | % |
Pakistan | | | 0.01 | % |
Bermuda | | | 0.00 | % |
Qatar | | | 0.00 | % |
| | | | |
| | | 100.00 | % |
| | | | |
See Notes to Schedules of Investments and Notes to Financial Statements.
| | |
| State Street Total Return V.I.S. Fund | | |
| Schedule of Investments | | December 31, 2018 |
The Fund’s % share of investment in the various categories, based on Fair Value, is as follows at December 31, 2018 (unaudited):
| | | | | | | | | | | | |
Industry | | Domestic | | | Foreign | | | Total | |
Exchange Traded Funds | | | 9.74 | % | | | 0.00 | % | | | 9.74 | % |
Multi-Line Insurance | | | 0.77 | % | | | 1.28 | % | | | 2.05 | % |
Pharmaceuticals | | | 1.56 | % | | | 0.33 | % | | | 1.89 | % |
Mortgage REITs | | | 1.78 | % | | | 0.00 | % | | | 1.78 | % |
Multi-Sector Holdings | | | 1.19 | % | | | 0.53 | % | | | 1.72 | % |
Oil & Gas Refining & Marketing | | | 1.44 | % | | | 0.20 | % | | | 1.64 | % |
Life & Health Insurance | | | 0.78 | % | | | 0.79 | % | | | 1.57 | % |
Trading Companies & Distributors | | | 0.97 | % | | | 0.59 | % | | | 1.56 | % |
Apparel Retail | | | 1.47 | % | | | 0.08 | % | | | 1.55 | % |
Diversified Banks | | | 0.00 | % | | | 1.53 | % | | | 1.53 | % |
IT Consulting & Other Services | | | 0.45 | % | | | 1.00 | % | | | 1.45 | % |
Integrated Telecommunication Services | | | 0.00 | % | | | 1.43 | % | | | 1.43 | % |
Application Software | | | 1.34 | % | | | 0.00 | % | | | 1.34 | % |
Department Stores | | | 0.91 | % | | | 0.26 | % | | | 1.17 | % |
Data Processing & Outsourced Services | | | 1.04 | % | | | 0.04 | % | | | 1.08 | % |
Communications Equipment | | | 0.98 | % | | | 0.00 | % | | | 0.98 | % |
Environmental & Facilities Services | | | 0.96 | % | | | 0.00 | % | | | 0.96 | % |
Semiconductors | | | 0.79 | % | | | 0.11 | % | | | 0.90 | % |
Healthcare Equipment | | | 0.86 | % | | | 0.00 | % | | | 0.86 | % |
Hypermarkets & Super Centers | | | 0.57 | % | | | 0.29 | % | | | 0.86 | % |
Air Freight & Logistics | | | 0.86 | % | | | 0.00 | % | | | 0.86 | % |
Property & Casualty Insurance | | | 0.47 | % | | | 0.36 | % | | | 0.83 | % |
Retail REITs | | | 0.20 | % | | | 0.57 | % | | | 0.77 | % |
Apparel, Accessories & Luxury Goods | | | 0.39 | % | | | 0.38 | % | | | 0.77 | % |
Packaged Foods & Meats | | | 0.25 | % | | | 0.51 | % | | | 0.76 | % |
Industrial Conglomerates | | | 0.68 | % | | | 0.07 | % | | | 0.75 | % |
Personal Products | | | 0.50 | % | | | 0.23 | % | | | 0.73 | % |
Technology Hardware, Storage & Peripherals | | | 0.55 | % | | | 0.18 | % | | | 0.73 | % |
Asset Management & Custody Banks | | | 0.66 | % | | | 0.06 | % | | | 0.72 | % |
Electric Utilities | | | 0.14 | % | | | 0.56 | % | | | 0.70 | % |
Technology Distributors | | | 0.66 | % | | | 0.02 | % | | | 0.68 | % |
Soft Drinks | | | 0.61 | % | | | 0.00 | % | | | 0.61 | % |
Integrated Oil & Gas | | | 0.00 | % | | | 0.61 | % | | | 0.61 | % |
Human Resource & Employment Services | | | 0.61 | % | | | 0.00 | % | | | 0.61 | % |
Alternative Carriers | | | 0.56 | % | | | 0.05 | % | | | 0.61 | % |
Industrial Gases | | | 0.00 | % | | | 0.60 | % | | | 0.60 | % |
Financial Exchanges & Data | | | 0.32 | % | | | 0.23 | % | | | 0.55 | % |
Aerospace & Defense | | | 0.33 | % | | | 0.20 | % | | | 0.53 | % |
Steel | | | 0.46 | % | | | 0.06 | % | | | 0.52 | % |
Specialty Chemicals | | | 0.00 | % | | | 0.50 | % | | | 0.50 | % |
Home Building | | | 0.00 | % | | | 0.50 | % | | | 0.50 | % |
Trucking | | | 0.40 | % | | | 0.08 | % | | | 0.48 | % |
Distributors | | | 0.48 | % | | | 0.00 | % | | | 0.48 | % |
Food Retail | | | 0.07 | % | | | 0.40 | % | | | 0.47 | % |
Airlines | | | 0.00 | % | | | 0.45 | % | | | 0.45 | % |
Healthcare Distributors | | | 0.02 | % | | | 0.41 | % | | | 0.43 | % |
Regional Banks | | | 0.20 | % | | | 0.22 | % | | | 0.42 | % |
Auto Parts & Equipment | | | 0.04 | % | | | 0.37 | % | | | 0.41 | % |
Systems Software | | | 0.38 | % | | | 0.00 | % | | | 0.38 | % |
Biotechnology | | | 0.36 | % | | | 0.00 | % | | | 0.36 | % |
Wireless Telecommunication Services | | | 0.24 | % | | | 0.11 | % | | | 0.35 | % |
Life Sciences Tools & Services | | | 0.16 | % | | | 0.17 | % | | | 0.33 | % |
Coal & Consumable Fuels | | | 0.00 | % | | | 0.33 | % | | | 0.33 | % |
Managed Healthcare | | | 0.32 | % | | | 0.00 | % | | | 0.32 | % |
General Merchandise Stores | | | 0.00 | % | | | 0.30 | % | | | 0.30 | % |
Reinsurance | | | 0.10 | % | | | 0.20 | % | | | 0.30 | % |
Automobile Manufacturers | | | 0.03 | % | | | 0.27 | % | | | 0.30 | % |
Metal & Glass Containers | | | 0.29 | % | | | 0.00 | % | | | 0.29 | % |
Healthcare Services | | | 0.22 | % | | | 0.07 | % | | | 0.29 | % |
Internet & Direct Marketing Retail | | | 0.23 | % | | | 0.05 | % | | | 0.28 | % |
Diversified REITs | | | 0.09 | % | | | 0.19 | % | | | 0.28 | % |
Tobacco | | | 0.03 | % | | | 0.25 | % | | | 0.28 | % |
Research & Consulting Services | | | 0.26 | % | | | 0.00 | % | | | 0.26 | % |
Gas Utilities | | | 0.00 | % | | | 0.25 | % | | | 0.25 | % |
Electronic Components | | | 0.21 | % | | | 0.03 | % | | | 0.24 | % |
Publishing | | | 0.15 | % | | | 0.08 | % | | | 0.23 | % |
See Notes to Schedules of Investments and Notes to Financial Statements.
| | |
| State Street Total Return V.I.S. Fund | | |
| Schedule of Investments | | December 31, 2018 |
| | | | | | | | | | | | |
Industry | | Domestic | | | Foreign | | | Total | |
Real Estate Operating Companies | | | 0.00 | % | | | 0.23 | % | | | 0.23 | % |
Diversified Real Estate Activities | | | 0.00 | % | | | 0.22 | % | | | 0.22 | % |
Internet Services & Infrastructure | | | 0.21 | % | | | 0.00 | % | | | 0.21 | % |
Electronic Manufacturing Services | | | 0.17 | % | | | 0.04 | % | | | 0.21 | % |
Diversified Support Services | | | 0.21 | % | | | 0.00 | % | | | 0.21 | % |
Investment Banking & Brokerage | | | 0.21 | % | | | 0.00 | % | | | 0.21 | % |
Independent Power Producers & Energy Traders | | | 0.08 | % | | | 0.11 | % | | | 0.19 | % |
Footwear | | | 0.19 | % | | | 0.00 | % | | | 0.19 | % |
Industrial Machinery | | | 0.03 | % | | | 0.16 | % | | | 0.19 | % |
Specialty Stores | | | 0.18 | % | | | 0.01 | % | | | 0.19 | % |
Thrifts & Mortgage Finance | | | 0.18 | % | | | 0.00 | % | | | 0.18 | % |
Restaurants | | | 0.16 | % | | | 0.01 | % | | | 0.17 | % |
Oil & Gas Exploration & Production | | | 0.15 | % | | | 0.02 | % | | | 0.17 | % |
Broadcasting | | | 0.16 | % | | | 0.01 | % | | | 0.17 | % |
Insurance Brokers | | | 0.16 | % | | | 0.00 | % | | | 0.16 | % |
Cable & Satellite | | | 0.15 | % | | | 0.01 | % | | | 0.16 | % |
Home Furnishing Retail | | | 0.16 | % | | | 0.00 | % | | | 0.16 | % |
Real Estate Development | | | 0.00 | % | | | 0.15 | % | | | 0.15 | % |
Industrial REITs | | | 0.01 | % | | | 0.13 | % | | | 0.14 | % |
Interactive Media & Services | | | 0.03 | % | | | 0.11 | % | | | 0.14 | % |
Electronic Equipment & Instruments | | | 0.13 | % | | | 0.01 | % | | | 0.14 | % |
Commodity Chemicals | | | 0.00 | % | | | 0.13 | % | | | 0.13 | % |
Paper Products | | | 0.12 | % | | | 0.00 | % | | | 0.12 | % |
Leisure Facilities | | | 0.10 | % | | | 0.00 | % | | | 0.10 | % |
Agricultural Products | | | 0.00 | % | | | 0.10 | % | | | 0.10 | % |
Hotel & Resort REITs | | | 0.09 | % | | | 0.00 | % | | | 0.09 | % |
Office Services & Supplies | | | 0.02 | % | | | 0.07 | % | | | 0.09 | % |
Oil & Gas Equipment & Services | | | 0.08 | % | | | 0.00 | % | | | 0.08 | % |
Healthcare Supplies | | | 0.08 | % | | | 0.00 | % | | | 0.08 | % |
Advertising | | | 0.02 | % | | | 0.06 | % | | | 0.08 | % |
Oil & Gas Storage & Transportation | | | 0.00 | % | | | 0.08 | % | | | 0.08 | % |
Healthcare Facilities | | | 0.05 | % | | | 0.03 | % | | | 0.08 | % |
Construction Materials | | | 0.00 | % | | | 0.08 | % | | | 0.08 | % |
Construction & Engineering | | | 0.01 | % | | | 0.06 | % | | | 0.07 | % |
Marine Ports & Services | | | 0.00 | % | | | 0.06 | % | | | 0.06 | % |
Specialized REITs | | | 0.06 | % | | | 0.00 | % | | | 0.06 | % |
Leisure Products | | | 0.03 | % | | | 0.02 | % | | | 0.05 | % |
Automotive Retail | | | 0.05 | % | | | 0.00 | % | | | 0.05 | % |
Household Products | | | 0.00 | % | | | 0.04 | % | | | 0.04 | % |
Healthcare Technology | | | 0.04 | % | | | 0.00 | % | | | 0.04 | % |
Semiconductor Equipment | | | 0.03 | % | | | 0.01 | % | | | 0.04 | % |
Health Care REITs | | | 0.04 | % | | | 0.00 | % | | | 0.04 | % |
Electrical Components & Equipment | | | 0.04 | % | | | 0.00 | % | | | 0.04 | % |
Brewers | | | 0.02 | % | | | 0.02 | % | | | 0.04 | % |
Hotels, Resorts & Cruise Lines | | | 0.00 | % | | | 0.03 | % | | | 0.03 | % |
Education Services | | | 0.03 | % | | | 0.00 | % | | | 0.03 | % |
Marine | | | 0.00 | % | | | 0.03 | % | | | 0.03 | % |
Airport Services | | | 0.00 | % | | | 0.03 | % | | | 0.03 | % |
Other Diversified Financial Services | | | 0.00 | % | | | 0.02 | % | | | 0.02 | % |
Water Utilities | | | 0.00 | % | | | 0.02 | % | | | 0.02 | % |
Motorcycle Manufacturers | | | 0.00 | % | | | 0.02 | % | | | 0.02 | % |
Construction Machinery & Heavy Trucks | | | 0.01 | % | | | 0.01 | % | | | 0.02 | % |
Fertilizers & Agricultural Chemicals | | | 0.02 | % | | | 0.00 | % | | | 0.02 | % |
Building Products | | | 0.02 | % | | | 0.00 | % | | | 0.02 | % |
Oil & Gas Drilling | | | 0.01 | % | | | 0.01 | % | | | 0.02 | % |
Consumer Electronics | | | 0.02 | % | | | 0.00 | % | | | 0.02 | % |
Consumer Finance | | | 0.02 | % | | | 0.00 | % | | | 0.02 | % |
Distillers & Vintners | | | 0.02 | % | | | 0.00 | % | | | 0.02 | % |
Residential REITs | | | 0.02 | % | | | 0.00 | % | | | 0.02 | % |
Gold | | | 0.00 | % | | | 0.01 | % | | | 0.01 | % |
Drug Retail | | | 0.00 | % | | | 0.01 | % | | | 0.01 | % |
Textiles | | | 0.00 | % | | | 0.01 | % | | | 0.01 | % |
Renewable Electricity | | | 0.00 | % | | | 0.01 | % | | | 0.01 | % |
Highways & Railtracks | | | 0.00 | % | | | 0.01 | % | | | 0.01 | % |
Diversified Metals & Mining | | | 0.00 | % | | | 0.01 | % | | | 0.01 | % |
Diversified Capital Markets | | | 0.00 | % | | | 0.01 | % | | | 0.01 | % |
Copper | | | 0.00 | % | | | 0.01 | % | | | 0.01 | % |
Interactive Home Entertainment | | | 0.00 | % | | | 0.01 | % | | | 0.01 | % |
Paper Packaging | | | 0.01 | % | | | 0.00 | % | | | 0.01 | % |
Household Appliances | | | 0.00 | % | | | 0.00 | % | | | 0.00 | % |
Aluminum | | | 0.00 | % | | | 0.00 | % | | | 0.00 | % |
Tires & Rubber | | | 0.00 | % | | | 0.00 | % | | | 0.00 | % |
Food Distributors | | | 0.00 | % | | | 0.00 | % | | | 0.00 | % |
Specialized Finance | | | 0.00 | % | | | 0.00 | % | | | 0.00 | % |
| | | | | | | | | | | | |
| | | | | | | | | | | 64.38 | % |
| | | | | | | | | | | | |
See Notes to Schedules of Investments and Notes to Financial Statements.
| | |
| State Street Total Return V.I.S. Fund | | |
| Schedule of Investments | | December 31, 2018 |
| | | | |
Sector | | Percentage (based on
Fair Value) | |
U.S. Treasuries | | | 17.04 | % |
Agency Mortgage Backed | | | 6.39 | % |
Corporate Notes | | | 6.37 | % |
Sovereign Bonds | | | 0.35 | % |
Non-Agency Collateralized Mortgage Obligations | | | 0.25 | % |
Municipal Bonds and Notes | | | 0.17 | % |
Agency Collateralized Mortgage Obligations | | | 0.15 | % |
Asset Backed | | | 0.11 | % |
U.S. Government Sponsored Agencies | | | 0.03 | % |
| | | | |
| | | 30.86 | % |
| | | | |
Short-Term Investments | | | |
Short-Term Investments | | | 4.76 | % |
| | | | |
| | | 4.76 | % |
| | | | |
| | | 100.00 | % |
| | | | |
Affiliate Table
| | | | | | | | | | | | | | | | | | | | | | | | | | | | | | | | | | | | |
| | | | | | | | | |
| | | Number of
Shares Held
at 12/31/17 | | | Value At
12/31/17 | | | Cost of
Purchases | | | Proceeds from
Shares Sold | | | Realized
Gain (Loss) | | | Change in
Unrealized
Appreciation/
Depreciation | | | Number of
Shares Held
at 12/31/18 | | | Value at
12/31/18 | | | Dividend
Income | |
SPDR Bloomberg Barclays High Yield Bond ETF | | | 2,022,863 | | | | 74,279,529 | | | | 35,424,700 | | | | 5,772,708 | | | | (193,121 | ) | | | (8,122,752 | ) | | | 2,846,551 | | | $ | 95,615,648 | | | | 4,708,174 | |
SPDR Dow Jones REIT ETF | | | — | | | | — | | | | 43,344,692 | | | | 3,699,772 | | | | (35,252 | ) | | | (4,307,958 | ) | | | 410,485 | | | | 35,301,710 | | | | 964,276 | |
State Street Corp. | | | 13,036 | | | | 1,272,444 | | | | — | | | | 1,146,900 | | | | 622,094 | | | | (747,638 | ) | | | — | | | | — | | | | 10,446 | |
State Street Institutional U.S. Government Money Market Fund - Class G Shares | | | 93,039,371 | | | | 93,039,371 | | | | 738,230,353 | | | | 740,644,235 | | | | — | | | | — | | | | 90,625,489 | | | | 90,625,489 | | | | 1,161,800 | |
| | | | | | | | | | | | | | | | | | | | | | | | | | | | | | | | | | | | |
TOTAL | | | | | | $ | 168,591,344 | | | $ | 816,999,745 | | | $ | 751,263,615 | | | $ | 393,721 | | | $ | (13,178,348 | ) | | | | | | $ | 221,542,847 | | | $ | 6,844,696 | |
| | | | | | | | | | | | | | | | | | | | | | | | | | | | | | | | | | | | |
See Notes to Schedules of Investments and Notes to Financial Statements.
| (b) | Not applicable to the Registrant. |
| Item 7. | Disclosure of Proxy Voting Policies and Procedures forClosed-End Management Investment Companies. |
Not applicable to the Registrant.
| Item 8. | Portfolio Managers ofClosed-End Management Investment Companies. |
Not applicable to the Registrant.
| Item 9. | Purchases of Equity Securities byClosed-End Management Investment Company and Affiliated Purchasers. |
Not applicable to the Registrant.
| Item 10. | Submission of Matters to a Vote of Security Holders. |
There were no material changes to the procedures by which shareholders may recommend nominees to the Registrant’s Board.
| Item 11. | Controls and Procedures. |
(a) The Registrant’s principal executive officer and principal financial officer have concluded that the Registrant’s disclosure controls and procedures (as defined in Rule30a-3(c) under the Investment Company Act of 1940, as amended (the “1940 Act”)) are effective to provide reasonable assurance that information required to be disclosed by the Registrant on FormN-CSR is recorded, processed, summarized and reported as of a date within 90 days of the filing date of this report, based on their evaluation of these controls and procedures required by Rule30a-3(b) under the 1940 Act and Rules13a-15(b) or15d-15(b) under the Securities Exchange Act of 1934, as amended.
(b) There were no changes in the Registrant’s internal control over financial reporting (as defined in Rule30a-3(d) under the 1940 Act) that occurred during the Registrant’s last fiscal quarter of the period covered by this FormN-CSR filing that have materially affected, or are reasonably likely to materially affect, the Registrant’s internal control over financial reporting.
| Item 12. | Disclosure of Securities Lending Activities forClosed-End Management Investment Companies. |
(a) Not applicable to the Registrant.
(b) Not applicable to the Registrant.
| (a)(1) | Code of Ethics pursuant to Item 2 of FormN-CSR is attached hereto. |
| (a)(2) | Certifications of principal executive officer and principal financial and accounting officer of the Registrant as required by Rule30a-2(a) under the 1940 Act are attached hereto. |
| (a)(3) | Not applicable to the Registrant. |
| (b) | Certifications of principal executive officer and principal financial and accounting officer of the Registrant as required by Rule30a-2(b) under the 1940 Act and Section 906 of the Sarbanes-Oxley Act of 2002 are attached hereto. |
SIGNATURES
Pursuant to the requirements of the Securities Exchange Act of 1934 and the Investment Company Act of 1940, the Registrant has duly caused this report to be signed on its behalf by the undersigned, thereunto duly authorized.
Registrant: STATE STREET VARIABLE INSURANCE SERIES FUNDS, INC.
| | |
| By: | | /s/ Jeanne M. La Porta |
| | Jeanne M. La Porta President |
| |
| Date: | | March 1, 2019 |
Pursuant to the requirements of the Securities Exchange Act of 1934 and the Investment Company Act of 1940, this report has been signed below by the following persons on behalf of the Registrant and in the capacities and on the dates indicated.
| | |
| By: | | /s/ Jeanne M. La Porta |
| | Jeanne M. La Porta |
| | President (Principal Executive Officer) |
| |
| Date: | | March 1, 2019 |
| | |
| By: | | /s/ Arthur A. Jensen |
| | Arthur A. Jensen Treasurer (Principal Financial Officer) |
Date: March 1, 2019