UNITED STATES
SECURITIES AND EXCHANGE COMMISSION
WASHINGTON, D.C. 20549
FORM N-CSR
CERTIFIED SHAREHOLDER REPORT OF REGISTERED MANAGEMENT
INVESTMENT COMPANIES
Investment Company Act file number 811-4250
Seligman Municipal Series Trust
(Exact name of Registrant as specified in charter)
100 Park Avenue
New York, New York 10017
(Address of principal executive offices) (Zip code)
Lawrence P. Vogel
100 Park Avenue
New York, New York 10017
(Name and address of agent for service)
Registrant’s telephone number, including area code: (212) 850-1864
Date of fiscal year end: 9/30
Date of reporting period: 9/30/03
FORM N-CSR
ITEM 1. REPORTS TO STOCKHOLDERS.
SELIGMAN MUNICIPAL SERIES TRUST
Annual Report September 30, 2003
| Seligman |
| Municipal Series Trust |
California High-Yield Series California Quality Series Florida Series North Carolina Series | |
| | |
| | Annual Report |
| | September 30, 2003 |
| | Seeking Income Exempt |
| | From Regular Income Tax |
| | |
| |  |
Seligman
139 Years of Investment Experience
J. & W. Seligman & Co. Incorporated is a firm with a long tradition of investment expertise, offering a broad array of investment choices to help today’s investors seek their long-term financial goals.
Established in 1864, Seligman has a history of providing financial services marked not by fanfare, but rather by a quiet and firm adherence to financial prudence. While the world has changed dramatically in the 139 years since Seligman first opened its doors, the firm has continued to offer its clients high-quality investment solutions through changing times.
In the late 19th century, as the country grew, Seligman helped finance the westward expansion of the railroads, the construction of the Panama Canal, and the launching of urban transit systems. In the early 20th century, the firm helped fund the growing capital needs of new industries, including the nascent automobile and steel industries.
With the formation of Tri-Continental Corporation in 1929 — today, the nation’s largest diversified publicly- traded closed-end equity investment company — Seligman began shifting its emphasis to investment management. In 1930, Seligman established what would be the first in an impressive lineup of mutual funds.
Seligman is proud of its distinctive past and of the traditional values that continue to shape the firm’s business decisions and investment judgment. While much has changed over the years, the firm’s commitment to providing prudent investment management that seeks to build wealth for clients over time is an enduring value that will continue to guide Seligman.
Table of Contents | | |
| | | |
| | 1 |
| | | |
| | 2 |
| | | |
| | 4 |
| | | |
| | 10 |
| | | |
| | 15 |
| | | |
| | 17 |
| | | |
| | 18 |
| | | |
| | 22 |
| | | |
| | 30 |
| | | |
| | 42 |
| | | |
| | 43 |
| | | |
| | 47 |
| | | |
| | back cover |
We are pleased to present the annual report for Seligman Municipal Series Trust, covering the fiscal year ended September 30, 2003. This report contains a discussion with your Portfolio Managers, performance information, as well as the Series’ investment results and audited financial statements, including their portfolios of investments.
We appreciate your confidence in Seligman Municipal Series Trust and look forward to serving your investment needs for many years to come.
By Order of the Trustees,
William C. Morris Chairman
Brian T. Zino President
November 14, 2003
1
Thomas G. Moles and Eileen A. Comerford
Q: What market conditions and events materially affected the performance of the Series in Seligman Municipal Series Trust during the fiscal year ended September 30, 2003?
A: At this time last year, the US economy was exhibiting signs of strengthening which provided a needed boost to investor confidence and sparked a strong stock market rally. Hopes for a more vigorous recovery soon faded, though, as the growing prospect of military action in Iraq caused consumers and businesses to curtail spending and investment, resulting in sharp reductions in growth forecasts. The collapse of the ruling regime in Iraq triggered a brief period of optimism but failed to provide the anticipated boost to economic activity. The pace of the recovery remained sluggish throughout the second quarter of 2003, contributing to a steady decline in bond yields. The bond rally intensified in May after the Federal Reserve Board in dicated that the possibility of deflation, while remote, was a concern. By mid-June, long-term municipal yields had fallen to the lowest level in 35 years. Just two weeks later, however, the Federal Reserve Board surprised the markets by reducing the federal funds rate less than generally expected. The Fed’s more favorable economic outlook caused a dramatic shift in market sentiment, spurring a powerful bond market reversal that sent municipal bond yields almost a full percentage point higher. Long-term municipal yields, as measured by the Bond Buyer 20-Bond General Obligation Index, reached a 12- month high in mid-August then gradually declined, ending the recently completed fiscal year approximately 1/8 point higher than at the start of the period.
The attractive interest rate environment continues to spur heavy municipal bond issuance. Through September 30th, supply totaled $286 billion, an increase of 12.9% over the same period last year. Refunding bonds, which are typically issued to retire outstanding, higher-cost debt, comprised a significant percentage of total volume.
Among the largest state issuers, volume varied widely—issuance increased 60% in California, decreased 18.6% in New York and was unchanged in Texas. Increasingly, states and municipalities are resorting to deficit financing as a means of closing budget gaps, which includes the issuance of controversial tobacco securitization bonds and pension obligation bonds.
Demand for municipal bonds, both retail and institutional, has been strong over the past year, supporting the increased supply as well as providing stability to the market during periods of interest rate volatility. For many investors, municipal bonds offer a yield advantage compared with the after-tax returns of Treasury bonds. In addition, municipals continue to offer diversification from equity market volatility. While the stock market has historically provided superior investment returns in comparison to municipal investments, investors have been exposed to considerably higher risk in exchange for the extra performance. By including municipal securities in an investment portfolio, risk profiles can be reduced.
The recent recession and lackluster recovery resulted in significant state and local revenue shortfalls. The fiscal and political difficulties of the states have been headline news throughout the year. At present, a substantial number of US states have negative outlooks. Budget deficits for fiscal year 2004 were estimated at $80-100 billion and a return to balanced budgets for the majority of states is not expected until at least fiscal year 2005. Despite the severity of the states’ fiscal crises, we believe that, with few exceptions, state general obligation debt continues to be a good investment option. According to Standard & Poor’s Rating Services "state ratings remain S&P’s most creditworthy sector in public finance with an average rating of ‘AA’ or better."
Q: What investment strategies or techniques materially affected the Series’ performance during the period?
2
Interview With Your Portfolio Managers
Thomas G. Moles and Eileen A. Comerford
A: Over the past fiscal year, we expected economic growth to accelerate and lead to a modest increase in yields. We were also concerned that a rising stock market would lessen demand for municipal bonds, putting additional upward pressure on yields. Portfolio cash balances were generally maintained at higher than normal levels in anticipation of a gradual increase in yields as conditions improved, although there were periods where cash diverged from targeted levels. During the first three quarters of the current fiscal-year, long-term municipal bond yields trended lower, reaching a 35- year low in mid-June (in general, prices on fixed-coupon bonds rise as yields fall). Much of the decline in yields can be attributed to a flight-to-quality r esponse prompted by prolonged economic weakness, geopolitical concerns, and stock market volatility. Long-term municipal yields did not begin to move meaningfully higher until the Trust’s fourth fiscal quarter, later than we had forecast. Still, the sharp increase in yields during July and August provided us with an opportunity to re-deploy a portion of cash holdings in each of the Series at more attractive levels than had been available during most of the year. New purchases were concentrated in the 20-year maturity range, somewhat shorter than typical. The municipal yield curve had flattened at approximately this point, which enabled the Trust to capture maximum yields while reducing interest rate risk (in general, the longer the maturity, the greater the price sensitivity to changes in interest rates).
Our investment strategy during the past fiscal year was more defensive than was warranted by actual market conditions. Nevertheless, all of the Series outperformed their peer-group average (Lipper Analytical Services, Inc.) for the 12-month period ended September 30, 2003. The Series’ positive investment performance was primarily attributable to interest income. However, the increase in yields during the period resulted in price return that was slightly negative for each Series except the Florida Series, for which it was flat.
The Series in Seligman Municipal Series Trust place considerable emphasis on credit research. All portfolio holdings are carefully analyzed prior to purchase and are regularly monitored to ensure that they continue to meet our credit criteria. The Trust does not own tobacco securitization bonds—tobacco bonds, as they are currently structured, do not meet our credit criteria and have never been approved for purchase. The nation’s airlines continue to struggle, and their outlook remains negative. The Trust has no exposure to airline debt. The California Quality, Florida, and North Carolina Series own airport bonds, which have a broader source of revenue than airline bonds. All airport holdings are insured and rated "AAA." Credit quality in the Trust remains high with the exception of the California High-Yield Series, at least 86% of each Series’ holdings are rated "A" or higher.
______________
The views and opinions expressed are those of the Portfolio Manager(s), are provided for general information only, and do not constitute specific tax, legal, or investment advice to, or recommendations for, any person. There can be no guarantee as to the accuracy of market forecasts. Opinions, estimates, and forecasts may be changed without notice.
A Team Approach
Seligman Municipal Series Trust is managed by the Seligman Municipals Team, headed by Thomas G. Moles. Mr. Moles and Co-Portfolio Manager Eileen Comerford are assisted in the management of the Trust by a group of seasoned professionals who are responsible for research and trading consistent with the Trust’s investment objective. Team members include Senior Credit Analyst Audrey Kuchtyak, Theresa Barion, and Debra McGuinness.
3
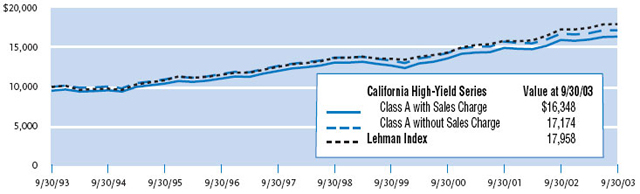
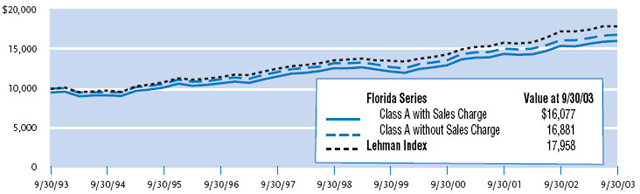
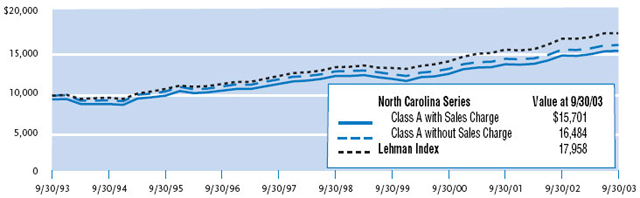
The following charts compare a $10,000 hypothetical investment made in each Series of Seligman Municipal Series Trust Class A shares, with and without the initial 4.75% maximum sales charge, to a $10,000 investment in the Lehman Brothers Municipal Bond Index (Lehman Index), for the ten-year period ended September 30, 2003. Calculations assume reinvestment of distributions. The performances of each Series of Seligman Municipal Series Trust Class C and Class D shares are not shown in the charts but are included in the table following each chart. Performance data quoted does not reflect the deduction of taxes that an investor may pay on Trust distributions or the redemption of Trust shares. Past performance i s not indicative of future investment results. It is important to keep in mind that the Lehman Index does not include the effect of taxes, or sales charges, and does not reflect state-specific bond market performance. The table following each chart also includes relevant portfolio characteristics for each Series.
California High-Yield Series
The performance of Class C and Class D shares will differ from the performance shown for Class A shares, based on the difference in sales charges and fees paid by shareholders.
(Continued on next page.)
4
Performance Overview and Portfolio Summary
California High-Yield Series (continued)
Investment Results
Total Returns
For Periods Ended September 30, 2003
| | | | | | Average Annual |
| | | | |
|
|
|
|
|
|
|
|
|
| | | | | | | | | | | | | | | Class C | | Class D |
| | | | | | | | | | | | | | | Since | | Since |
| | | Six | | One | | Five | | Ten | | Inception | | Inception |
Class A ** | | Months * | | Year | | Years | | Years | | 5/27/99 | | 2/1/94 |
|
|
|
|
|
|
|
|
|
|
|
|
|
| With Sales Charge | | (2.87 | )% | | (2.44 | )% | | 3.57 | % | | 5.04 | % | | n/a | | | n/a | |
| Without Sales Charge | | 1.99 | | | 2.48 | | | 4.58 | | | 5.56 | | | n/a | | | n/a | |
Class C ** | | | | | | | | | | | | | | | | | | |
|
|
|
|
|
|
|
|
|
|
|
|
|
| With Sales Charge and CDSC# | | (0.37 | ) | | (0.45 | ) | | n/a | | | n/a | | | 3.96 | % | | n/a | |
| Without Sales Charge and CDSC | | 1.68 | | | 1.56 | | | n/a | | | n/a | | | 4.22 | | | n/a | |
Class D ** | | | | | | | | | | | | | | | | | | |
|
|
|
|
|
|
|
|
|
|
|
|
|
| With 1% CDSC | | 0.68 | | | 0.58 | | | 3.68 | | | n/a | | | n/a | | | n/a | |
| Without CDSC | | 1.68 | | | 1.56 | | | 3.68 | | | n/a | | | n/a | | | 4.56 | % |
Lehman Index *** | | 2.66 | | | 3.89 | | | 5.67 | | | 6.03 | | | 6.28 | ‡ | | 5.97 | ‡‡ |
|
|
|
|
|
|
|
|
|
|
|
|
|
| | | | | | | | | Dividend, Capital Gain, and Yield Information Per Share |
| Net Asset Value Per Share | | For Periods Ended September 30, 2003 |
| |
|
| | | 9/30/03 | | 3/31/03 | | 9/30/02 | | Dividends † | | Capital Gain † | | SEC Yield †† |
| |
|
| Class A | | $6.59 | | $6.60 | | $6.74 | | $0.281 | | $0.029 | | 3.80% |
| Class C | | 6.60 | | 6.60 | | 6.75 | | 0.221 | | 0.029 | | 3.06 |
| Class D | | 6.60 | | 6.60 | | 6.75 | | 0.221 | | 0.029 | | 3.10 |
Holdings By Market Sector ø | | Moody’s/S&P Ratings ø |
| |
|
| Revenue Bonds | | 92% | | Aaa/AAA | | 10% |
| General Obligation Bondsøø | | 8 | | Aa/AA | | 8 |
| | | | | A/A | | 54 |
| Weighted Average Maturity | | 23.8 years | | Baa/BBB | | 22 |
| | Ca/CCC | | 6 |
_________
See footnotes on page 9.
5
Performance Overview and Portfolio Summary
California Quality Series
The performance of Class C and Class D shares will differ from the performance shown for Class A shares, based on the difference in sales charges and fees paid by shareholders.
Investment Results
Total Returns
For Periods Ended September 30, 2003
| | | | | | Average Annual |
| | | | |
|
|
|
|
|
|
|
|
|
| | | | | | | | | | | | | | | Class C | | Class D |
| | | | | | | | | | | | | | | Since | | Since |
| | | Six | | One | | Five | | Ten | | Inception | | Inception |
Class A ** | | Months * | | Year | | Years | | Years | | 5/27/99 | | 2/1/94 |
|
|
|
|
|
|
|
|
|
|
|
|
|
| With Sales Charge | | (3.18 | )% | | (3.19 | )% | | 3.63 | % | | 4.69 | % | | n/a | | | n/a | |
| Without Sales Charge | | 1.58 | | | 1.63 | | | 4.65 | | | 5.19 | | | n/a | | | n/a | |
Class C ** | | | | | | | | | | | | | | | | | | |
|
|
|
|
|
|
|
|
|
|
|
|
|
| With Sales Charge and CDSC# | | (1.02 | ) | | (1.24 | ) | | n/a | | | n/a | | | 4.18 | % | | n/a | |
| Without Sales Charge and CDSC | | 0.98 | | | 0.72 | | | n/a | | | n/a | | | 4.43 | | | n/a | |
Class D ** | | | | | | | | | | | | | | | | | | |
|
|
|
|
|
|
|
|
|
|
|
|
| With 1% CDSC | | (0.01 | ) | | (0.26 | ) | | n/a | | | n/a | | | n/a | | | n/a | |
| Without CDSC | | 0.98 | | | 0.72 | | | 3.70 | | | n/a | | | n/a | | | 4.23 | % |
Lehman Index *** | | 2.66 | | | 3.89 | | | 5.67 | | | 6.03 | | | 6.28 | ‡ | | 5.97 | ‡‡ |
|
|
|
|
|
|
|
|
|
|
|
|
|
| | | | | | | | | Dividend and Yield Information Per Share |
| Net Asset Value Per Share | | For Periods Ended September 30, 2003 |
| |
|
| | | 9/30/03 | | 3/31/03 | | 9/30/02 | | Dividends † | | SEC Yield †† |
|
|
|
|
|
|
| |
|
|
|
| Class A | | $6.88 | | $6.91 | | $7.04 | | $0.270 | | 3.13% |
| Class C | | 6.85 | | 6.89 | | 7.01 | | 0.208 | | 2.38 |
| Class D | | 6.85 | | 6.89 | | 7.01 | | 0.208 | | 2.41 |
Holdings By Market Sector ø | | Moody’s/S&P Ratings ø |
| |
|
| Revenue Bonds | | 85% | | Aaa/AAA | | 70% |
| General Obligation Bonds øø | | 15 | | Aa/AA | | 12 |
| | | | | A/A | | 12 |
| Weighted Average Maturity | | 21.9 years | | Baa/BBB | | 6 |
|
|
| | | | |
_____________
See footnotes on page 9.
6
Performance Overview and Portfolio Summary
Florida Series
The performance of Class C and Class D shares will differ from the performance shown for Class A shares, based on the difference in sales charges and fees paid by shareholders.
Investment Results
Total Returns
For Periods Ended September 30, 2003
| | | | | | Average Annual |
| | | | | |
|
| | | | | | | | | | | | | | | Class C | | Class D |
| | | | | | | | | | | | | | | Since | | Since |
| | | Six | | One | | Five | | Ten | | Inception | | Inception |
Class A ** | | Months * | | Year | | Years | | Years | | 5/27/99 | | 2/1/94 |
|
|
|
|
|
|
|
|
|
|
|
|
|
| With Sales Charge | | (2.48 | )% | | (0.76 | )% | | 3.96 | % | | 4.86 | % | | n/a | | | n/a | |
| Without Sales Charge | | 2.36 | | | 4.16 | | | 4.97 | | | 5.38 | | | n/a | | | n/a | |
Class C ** | | | | | | | | | | | | | | | | | | |
|
|
|
|
|
|
|
|
|
|
|
|
|
| With Sales Charge and CDSC# | | (0.14 | ) | | 1.24 | | | n/a | | | n/a | | | 4.63 | % | | n/a | |
| Without Sales Charge and CDSC | | 1.85 | | | 3.24 | | | n/a | | | n/a | | | 4.87 | | | n/a | |
Class D ** | | | | | | | | | | | | | | | | | | |
|
|
|
|
|
|
|
|
|
|
|
|
|
| With 1% CDSC | | 0.98 | | | 2.37 | | | n/a | | | n/a | | | n/a | | | n/a | |
| Without CDSC | | 1.98 | | | 3.37 | | | 4.21 | | | n/a | | | n/a | | | 4.55 | % |
Lehman Index *** | | 2.66 | | | 3.89 | | | 5.97 | | | 6.03 | | | 6.28 | ‡ | | 5.97 | ‡‡ |
|
|
|
|
|
|
|
|
|
|
| |
|
|
| | | | | | | | | Dividend, Capital Gain, and Yield Information Per Share |
| Net Asset Value Per Share | | For Periods Ended September 30, 2003 |
| |
|
| | | 9/30/03 | | 3/31/03 | | 9/30/02 | | Dividends † | | Capital Gain † | | SEC Yield †† |
|
|
|
|
|
|
| |
|
|
|
|
|
| Class A | | $8.08 | | $8.05 | | $8.08 | | $0.316 | | $0.011 | | 2.75% |
| Class C | | 8.09 | | 8.07 | | 8.10 | | 0.255 | | 0.011 | | 2.13 |
| Class D | | 8.10 | | 8.07 | | 8.10 | | 0.255 | | 0.011 | | 2.15 |
Holdings By Market Sector ø | | Moody’s/S&P Ratings ø |
| |
|
| Revenue Bonds | | 70% | | Aaa/AAA | | 71% |
| General Obligation Bonds øø | | 30 | | Aa/AA | | 8 |
| | | | | A/A | | 21 |
| Weighted Average Maturity | | 18.5 years | | | | |
|
|
| | | | |
______________
See footnotes on page 9.
7
Performance Overview and Portfolio Summary
North Carolina Series
The performance of Class C and Class D shares will differ from the performance shown for Class A shares, based on the difference in sales charges and fees paid by shareholders.
Investment Results
Total Returns
For Periods Ended September 30, 2003
| | | | | | Average Annual |
| | | | | |
|
| | | | | | | | | | | | | | | Class C | | Class D |
| | | | | | | | | | | | | | | Since | | Since |
| | | Six | | One | | Five | | Ten | | Inception | | Inception |
Class A ** | | Months * | | Year | | Years | | Years | | 5/27/99 | | 2/1/94 |
|
|
|
|
|
|
|
|
|
|
|
|
|
| With Sales Charge | | (2.33 | )% | | (1.43 | )% | | 3.61 | % | | 4.61 | % | | n/a | | | n/a | |
| Without Sales Charge | | 2.51 | | | 3.51 | | | 4.61 | | | 5.12 | | | n/a | | | n/a | |
Class C ** | | | | | | | | | | | | | | | | | | |
|
|
|
|
|
|
|
|
|
|
|
|
|
| With Sales Charge and CDSC# | | 0.01 | | | 0.76 | | | n/a | | | n/a | | | 4.23 | % | | n/a | |
| Without Sales Charge and CDSC | | 2.00 | | | 2.74 | | | n/a | | | n/a | | | 4.47 | | | n/a | |
Class D ** | | | | | | | | | | | | | | | | | | |
|
|
|
|
|
|
|
|
|
|
|
|
|
| With 1% CDSC | | 1.00 | | | 1.75 | | | n/a | | | n/a | | | n/a | | | n/a | |
| Without CDSC | | 2.00 | | | 2.74 | | | 3.81 | | | n/a | | | n/a | | | 4.31 | % |
Lehman Index *** | | 2.66 | | | 3.89 | | | 5.67 | | | 6.03 | | | 6.28 | ‡ | | 5.97 | ‡‡ |
|
|
|
|
|
|
|
|
|
|
|
|
|
| | | | | | | | | Dividend, Capital Gain, and Yield Information Per Share |
| Net Asset Value Per Share | | For Periods Ended September 30, 2003 |
| |
|
| | | 9/30/03 | | 3/31/03 | | 9/30/02 | | Dividends † | | Capital Gain † | | SEC Yield †† |
|
|
|
|
|
|
| |
|
|
|
|
|
| Class A | | $8.14 | | $8.08 | | $8.19 | | $0.291 | | $0.037 | | 2.85% |
| Class C | | 8.13 | | 8.08 | | 8.18 | | 0.230 | | 0.037 | | 2.23 |
| Class D | | 8.13 | | 8.08 | | 8.18 | | 0.230 | | 0.037 | | 2.26 |
Holdings By Market Sector ø | | Moody’s/S&P Ratings ø |
| |
|
| Revenue Bonds | | 72% | | Aaa/AAA | | 45% |
| General Obligation Bonds øø | | 28 | | Aa/AA | | 31 |
| | | | | A/A | | 10 |
| Weighted Average Maturity | | 17.6 years | | Baa/BBB | | 14 |
|
|
| | | | |
_____________
See footnotes on page 9.
8
Performance Overview and Portfolio Summary
______________
| * | | Returns for periods of less than one year are not annualized. |
| | | |
| ** | | Return figures reflect any change in price and assume all distributions within the period are reinvested in additional shares. Returns for Class A shares are calculated with and without the effect of the initial 4.75% maximum sales charge. Returns for Class C shares are calculated with and without the effect of the initial 1% maximum sales charge and the 1% contingent deferred sales charge ("CDSC") that is charged on redemptions made within 18 months of purchase. Returns for Class D shares are calculated with and without the effect of the 1% CDSC, charged on redemptions made within one year of purchase. The rates of return will vary and the principal value of an investment will fluctuate. Shares, if redeemed, may be worth more or less than their original cost. A portion of each Series’ income may be s ubject to applicable state and local taxes, and any amount may be subject to the federal alternative minimum tax. An investment in the Trust is not insured by the Federal Deposit Insurance Corporation or any other government agency. Past performance is not indicative of future investment results. During the periods presented, the Manager, at its discretion, waived a portion of its management fee for the California High-Yield and Florida Series. Absent such waivers, returns would have been lower. |
| | | |
| *** | | The Lehman Index is an unmanaged index that does not include any fees or sales charges. It is composed of approximately 60% revenue bonds and 40% state government obligations. Investors cannot invest directly in an index. |
| | | |
| # | | The CDSC is 1% for periods of 18 months or less. |
| | | |
| ‡ | | From 5/31/99. |
| | | |
| ‡‡ | | From 1/31/94. |
| | | |
| † | | Represents per share amount paid or declared for the year ended September 30, 2003. |
| | | |
| †† | | Current yield, representing the annualized yield for the 30-day period ended September 30, 2003, has been computed in accordance with SEC regulations and will vary. During the period, the Manager, at its discretion, waived a portion of its management fee for the California High-Yield and Florida Series. Without these waivers the yields would be as follows: |
| | | Class A | | Class C | | Class D | |
|
| California High-Yield Series | | 3.70% | | 2.96% | | 3.00% | |
| Florida Series | | 2.60 | | 1.98 | | 2.00 | |
ø | | Percentages based on current market values of long-term holdings at September 30, 2003. |
øø | | Includes pre-refunded and escrowed-to-maturity securities. |
9
September 30, 2003
California High-Yield Series
Face Amount | | Municipal Bonds | | Ratings Moody’s/S&P † | | Market Value |
|
|
|
|
|
|
|
| $1,000,000 | | California Department of Veterans’Affairs (Home Purchase Rev.), 5 1/2% due 12/1/2018* | | Aa2/AA | | $ 1,045,070 |
| 1,500,000 | | California Department of Veterans’Affairs (Home Purchase Rev.), 5.60% due 12/1/2028 | | Aaa/AAA | | 1,534,860 |
| 1,000,000 | | California Educational Facilities Authority Rev. (Loyola Marymount University), 5 3/4% due 10/1/2024ø | | Aaa/NR | | 1,043,870 |
| 275,000 | | California Educational Facilities Authority Rev. (Loyola Marymount University), 5 3/4% due 10/1/2024 | | A2/NR | | 285,651 |
| 2,500,000 | | California Educational Facilities Authority Rev. (Scripps College), 5% due 8/1/2031 | | A1/NR | | 2,488,650 |
| 3,000,000 | | California Health Facilities Financing Authority Rev. (Cedars-Sinai Medical Center), 6 1/4% due 12/1/2034 | | A3/NR | | 3,212,400 |
| 2,750,000 | | California Health Facilities Financing Authority Rev. (Kaiser Permanente), 5.40% due 5/1/2028 | | A3/A | | 2,776,235 |
| 2,500,000 | | California Housing Finance Agency (Multi-Family Housing Rev.), 5 3/8% due 2/1/2036* | | Aa3/AA- | | 2,506,250 |
| 1,775,000 | | California Housing Finance Agency (Single Family Mortgage), 5.40% due 8/1/2028* | | Aaa/AAA | | 1,802,246 |
| 2,500,000 | | California Infrastructure and Economic Development Bank Rev. (The J. David Gladstone Institutes), 51/4% due 10/1/2034 | | NR/A- | | 2,521,950 |
| 1,750,000 | | California Pollution Control Financing Authority Rev. (Pacific Gas & Electric Co.), 5 7/8% due 6/1/2023* | | B3/CCC | | 1,701,368 |
| 1,000,000 | | California Pollution Control Financing Authority Rev. (Pacific Gas & Electric Co.), 5.85% due 12/1/2023* | | B3/CCC | | 972,240 |
| 2,500,000 | | California Statewide Communities Development Authority Rev., (Sutter Health), 5 5/8% due 8/15/2042 | | A1/A+ | | 2,554,450 |
| 1,500,000 | | Foothill/Eastern Transportation Corridor Agency, CA Toll Road Rev., 5 3/4% due 1/15/2040 | | Baa3/BBB- | | 1,523,565 |
| 2,870,000 | | Modesto, CA Irrigation District Certificates of Participation, 5.30% due 7/1/2022 | | A2/A+ | | 2,871,119 |
| 2,005,000 | | Pleasanton, CA Joint Powers Financing Authority Reassessment Rev., 6.15% due 9/2/2012 | | | | |
| 3,000,000 | | Puerto Rico Highway & Transportation Authority Rev., 5 1/2% due 7/1/2036 | | Baa1/A | | 3,169,560 |
| 1,795,000 | | Sacramento, CA Municipal Utility District Electric Rev., 5 1/4% due 7/1/2028ø | | A2/A | | 1,870,139 |
| 705,000 | | Sacramento, CA Municipal Utility District Electric Rev., 5 1/4% due 7/1/2028ø | | A2/A | | 734,398 |
| 3,000,000 | | San Bernardino, CA Joint Powers Financing Authority (California Dept. of Transportation Lease), 5 1/2% due 12/1/2020 | | Baa1/BBB- | | 3,102,330 |
| 2,160,000 | | San Francisco, CA City & County Public Utilities Commission Rev., 5% due 11/1/2026 | | A1/A+ | | 2,166,631 |
| 2,000,000 | | Washington Township, CA Hospital District Hospital Healthcare System Rev., 5 1/4% due 7/1/2029 | | A2/NR | | 2,020,120 |
|
|
|
|
|
|
|
Total Municipal Bonds (Cost $42,498,641) —93.3% | | | | 43,955,280 |
|
|
|
|
|
_____________
See footnotes on page 14.
10
Portfolios of Investments
September 30, 2003
California High-Yield Series(continued)
| $ 450,000 | | Lehigh County, PA General Purpose Authority Rev. (Lehigh Valley Hospital) due 7/1/2029 | | VMIG 1/NR | | $ 450,000 |
| 1,200,000 | | New York City, NY GOs Subseries E-5 due 8/1/2015 | | VMIG 1/A-1+ | | 1,200,000 |
| 900,000 | | New York City, NY Municipal Water Finance Authority, Water & Sewer System Rev. due 6/15/2025 | | VMIG 1/A-1+ | | 900,000 |
|
|
|
|
|
|
|
Total Variable Rate Demand Notes (Cost $2,550,000) —5.4% | | | | 2,550,000 |
|
|
|
|
|
Total Investments (Cost $45,048,641) —98.7% | | | | 46,505,280 |
|
|
|
|
|
Other Assets Less Liabilities —1.3% | | | | 606,032 |
|
|
|
|
|
Net Assets —100.0% | | | | $47,111,312 |
|
California Quality Series
Face Amount | | Municipal Bonds | | Ratings Moody’s/S&P † | | Market Value |
|
|
|
|
|
|
|
| $3,000,000 | | California Department of Water Resources Water System Rev. (Central Valley Project), 6.10% due 12/1/2029ø | | Aaa/AA | | $ 3,406,620 |
| 3,000,000 | | California Educational Facilities Authority Rev. (Pepperdine University), 5% due 11/1/2029 | | A1/NR | | 3,017,700 |
| 2,000,000 | | California Educational Facilities Authority Rev. (Stanford University), 5.35% due 6/1/2027 | | Aaa/AAA | | 2,105,500 |
| 3,000,000 | | California Educational Facilities Authority Rev. (University of San Diego), 5% due 10/1/2028 | | Aaa/NR | | 3,035,490 |
| 3,000,000 | | California Educational Facilities Authority Rev. (University of Southern California), 5% due 10/1/2028 | | Aa1/AA+ | | 3,019,380 |
| 1,000,000 | | California Infrastructure & Economic Development Bank Rev. (Bay Area Toll Bridges Seismic Retrofit Bonds), 5% due 7/1/2023 | | Aaa/AAA | | 1,027,120 |
| 4,000,000 | | California Pollution Control Financing Authority Rev. (Mobil Oil Corporation Project), 51/2% due 12/1/2029* | | Aaa/AAA | | 4,217,480 |
| 4,000,000 | | California State GOs, 5 3/8% due 10/1/2027 | | A3/BBB | | 4,057,960 |
| 2,420,000 | | California State Veterans' GOs, 5.70% due 12/1/2032* | | A3/A | | 2,473,361 |
| 3,000,000 | | California Statewide Communities Development Authority Certificates of Participation (The Trustees of the J. Paul Getty Trust), 5% due 10/1/2023 | | Aaa/AAA | | 3,027,450 |
| 2,000,000 | | California Statewide Communities Development Authority Rev., (Kaiser Permanente), 51/2% due 11/1/2032 | | A3/A | | 2,024,560 |
| 3,000,000 | | East Bay, CA Municipal Utility District Water System Rev., 5% due 6/1/2026 | | Aaa/AAA | | 3,024,630 |
| 2,500,000 | | Eastern Municipal Water District, CA Water and Sewer Rev., 63/4% due 7/1/2012 | | Aaa/AAA | | 3,060,250 |
| 3,000,000 | | Fresno, CA Sewer System Rev., 5 1/4% due 9/1/2019 | | Aaa/AAA | | 3,377,820 |
| 4,000,000 | | Los Angeles, CA Department of Water & Power Water System Rev., 5 1/8% due 7/1/2041 | | Aa3/AA | | 4,028,680 |
| 3,000,000 | | Orange County, CA Local Transportation Authority (Measure M Sales Tax Rev.), 6% due 2/15/2009 | | Aaa/AAA | | 3,534,840 |
_____________
See footnotes on page 14.
11
Portfolios of Investments
September 30, 2003
California Quality Series (continued)
Face Amount | | Municipal Bonds | | Ratings Moody’s/S&P † | | Market Value |
|
| $1,000,000 | | Rancho, CA Water District Financing Authority Rev., 5.90% due 11/1/2015 | | Aaa/AAA | | $ 1,106,110 |
| 4,000,000 | | Regents of the University of California Rev. (Multiple Purpose Projects), 5 3/8% due 9/1/2024 | | | | |
| 4,000,000 | | Sacramento County, CA Sanitation Districts Financing Authority Rev. (Sacramento Regional County Sanitation District), 5% due 12/1/2027 | | Aaa/AAA | | 4,053,120 |
| 1,000,000 | | Sacramento County, CA Sanitation Districts Financing Authority Rev. (Sacramento Regional County Sanitation District), 5 7/8% due 12/1/2027 ø | | Aa3/AA | | 1,094,470 |
| 4,250,000 | | San Francisco Bay Area Rapid Transit District, CA (Sales Tax Rev.), 5% due 7/1/2028 | | Aaa/AAA | | 4,288,463 |
| 3,000,000 | | San Francisco, CA City and County Airports Commission Rev. (International Airport), 6.60% due 5/1/2024* | | Aaa/AAA | | 3,151,860 |
|
Total Municipal Bonds (Cost $62,262,942) —96.4% | | 66,352,624 |
|
Variable Rate Demand Notes (Cost $1,500,000) —2.2% | | 1,500,000 |
|
Total Investments (Cost $63,762,942) —98.6% | | 67,852,624 |
|
Other Assets Less Liabilities —1.4% | | 997,766 |
|
Net Assets —100.0% | | $68,850,390 |
|
Florida Series
Face Amount | | Municipal Bonds | | Ratings Moody’s/S&P † | | Market Value |
|
|
|
|
|
|
|
| $2,000,000 | | Broward County, FL Airport System Rev., 5 1/4% due 10/1/2026* | | Aaa/AAA | | $ 2,041,700 |
| 1,000,000 | | Dade County, FL Aviation Rev., 6 1/8% due 10/1/2020*ø | | Aaa/AAA | | 1,066,820 |
| 2,000,000 | | Dade County, FL Public Improvement GOs, 5 3/4% due 10/1/2016 | | Aaa/AAA | | 2,225,800 |
| 1,750,000 | | Escambia County, FL Health Facilities Authority Rev. (Ascension Health Credit Group), 6% due 11/15/2031ø | | Aa2/AAA | | 2,096,028 |
| 720,000 | | Florida Housing Finance Agency Rev. (General Mortgage), 6.20% due 7/1/2027* | | Aa2/AA | | 747,583 |
| 710,000 | | Florida Housing Finance Agency Rev. (Homeowner Mortgage), 6.35% due 6/1/2014* | | NR/AAA | | 725,201 |
| 645,000 | | Florida Housing Finance Agency Rev. (Homeowner Mortgage), 5.95% due 1/1/2032* | | Aaa/AAA | | 667,840 |
| 375,000 | | Florida Housing Finance Agency Rev. (Single Family Mortgage), 6.55% due 7/1/2014* | | Aaa/AAA | | 388,421 |
| 2,500,000 | | Florida Ports Financing Commission Rev. (State Transportation Trust Fund), 5 3/8% due 6/1/2027* | | Aaa/AAA | | 2,555,000 |
| 2,500,000 | | Florida State Turnpike Authority Rev., 5 5/8% due 7/1/2025ø | | Aaa/AAA | | 2,719,400 |
| 2,000,000 | | Greater Orlando Aviation Authority, FL Airport Facilities Rev., 5 1/4% due 10/1/2023* | | Aaa/AAA | | 2,042,380 |
| 2,000,000 | | Hillsborough County, FL School Board (Certificates of Participation), 6% due 7/1/2025 ø | | Aaa/AAA | | 2,388,380 |
See footnotes on page 14.
12
Portfolios of Investments
September 30, 2003
Florida Series (continued)
Face Amount | | Municipal Bonds | | Ratings Moody’s/S&P † | | Market Value |
| $2,000,000 | | Jacksonville Electric Authority, FL (Electric System Rev.), 5 1/2% due 10/1/2041 | | Aa2/AA | | $ 2,130,200 |
| 2,000,000 | | Jacksonville Electric Authority, FL (Water & Sewer System Rev.), 5 5/8% due 10/1/2030 | | Aaa/AAA | | 2,098,260 |
| 1,000,000 | | Jacksonville, FL Port Authority Airport Rev., 6 1/4% due 10/1/2024* | | Aaa/AAA | | 1,101,620 |
| 2,000,000 | | Jacksonville, FL Sewage & Solid Waste Disposal Facilities Rev. (Anheuser-Busch Project), 5 7/8% due 2/1/2036* | | A1/A+ | | 2,075,740 |
| 1,000,000 | | Lee County, FL (Water & Sewer Rev.), 5% due 10/1/2023 | | Aaa/AAA | | 1,033,400 |
| 2,000,000 | | Marion County, FL Hospital District Health System Rev. (Munroe Regional Health System), 5 5/8% due 10/1/2024 | | A2/NR | | 2,036,440 |
| 1,750,000 | | Orange County, FL Health Facilities Authority Hospital Rev. (Adventist Health System/Sunbelt Obligation Group), 6 3/8% due 11/15/2020 | | A3/A | | 1,934,835 |
| 2,000,000 | | Pinellas County, FL Health Facilities Authority Rev. (Baycare Health System), 5 1/2% due 11/15/2033 | | A1/NR | | 2,014,720 |
| 2,000,000 | | Reedy Creek Improvement District, FL Utilities Rev., 5 1/8% due 10/1/2019 | | Aaa/AAA | | 2,136,780 |
| 1,750,000 | | Tampa Bay, FL Regional Water Supply Utility System Authority Rev., 5 3/4% due 10/1/2029 ø | | Aaa/AAA | | 2,070,320 |
|
|
|
|
|
|
|
Total Municipal Bonds (Cost $35,348,670) —94.8% | | 38,296,868 |
|
|
|
Variable Rate Demand Notes (Cost $1,200,000) —3.0% | | 1,200,000 |
|
|
|
Total Investments (Cost $36,548,670) —97.8% | | 39,496,868 |
|
|
|
Other Assets Less Liabilities —2.2% | | 887,606 |
|
|
|
Net Assets —100.0% | | $40,384,474 |
|
North Carolina Series
Face Amount | | Municipal Bonds | | Ratings Moody’s/S&P † | | Market Value |
|
|
|
|
|
|
|
| $1,250,000 | | Appalachian State University, NC Housing & Student Center System Rev., 5.60% due 7/15/2020 | | Aaa/NR | | $ 1,391,912 |
| 1,250,000 | | Asheville, NC Water System Rev., 5.70% due 8/1/2025 | | Aaa/AAA | | 1,361,525 |
| 1,185,000 | | Buncombe County, NC Metropolitan Sewer District Sewer System Rev., 5% due 7/1/2020 | | Aaa/AAA | | 1,254,311 |
| 1,000,000 | | Charlotte, NC Storm Water Fee Rev., 6% due 6/1/2025ø | | Aa2/AA+ | | 1,196,850 |
| 1,000,000 | | Charlotte, NC Water & Sewer GOs, 5.90% due 2/1/2017ø | | Aaa/AAA | | 1,036,560 |
| 1,250,000 | | Charlotte, NC Water & Sewer System Rev., 5 1/4% due 6/1/2025ø | | Aa1/AAA | | 1,441,188 |
| 2,000,000 | | Charlotte-Mecklenburg Hospital Authority, NC Health Care System Rev., 5 3/4% due 1/15/2021 | | Aa3/AA | | 2,175,020 |
| 250,000 | | City of Winston-Salem, NC Water & Sewer System Rev., 5 1/8% due 6/1/2028ø | | Aa2/AAA | | 285,402 |
| 215,000 | | Greensboro, NC Combined Enterprise System Rev., 5 1/4% due 6/1/2022 | | Aa3/AA+ | | 229,254 |
_____________
See footnotes on page 14.
13
Portfolios of Investments
September 30, 2003
North Carolina Series (continued)
Face Amount | | Municipal Bonds | | Ratings Moody’s/S&P † | | Market Value |
|
|
|
|
|
|
|
| $2,500,000 | | Martin County Industrial Facilities and Pollution Control Financing Authority, NC Solid Waste Disposal Rev.(Weyerhaeuser Company Project), 6% due 11/1/2025* | | Baa2/BBB | | $ 2,518,700 |
| 1,250,000 | | North Carolina Capital Facilities Finance Agency Rev., (Duke University Project), 5 1/8% due 10/1/2041 | | Aa1/AA+ | | 1,267,775 |
| 735,000 | | North Carolina Housing Finance Agency Rev. (Home Ownership), 6.40% due 7/1/2028* | | Aa2/AA | | 778,600 |
| 605,000 | | North Carolina Housing Finance Agency Rev. (Single Family), 6 1/2% due 3/1/2018 | | Aa2/AA | | 618,141 |
| 1,500,000 | | North Carolina Medical Care Commission Hospital Rev. (First Health of the Carolinas Project), 5% due 10/1/2028 | | Aa3/AA | | 1,503,510 |
| 1,500,000 | | North Carolina Medical Care Commission Hospital Rev. (Gaston Health Care), 5% due 2/15/2029 | | A1/A+ | | 1,457,895 |
| 1,750,000 | | North Carolina Municipal Power Agency No. 1 Catawba Electric Rev., 5% due 1/1/2020 †† | | Aaa/AAA | | 1,912,225 |
| 1,000,000 | | Puerto Rico Electric Power Authority Rev., 5 1/4% due 7/1/2021 | | Aaa/AAA | | 1,118,380 |
| 1,000,000 | | University of North Carolina at Chapel Hill Hospital Rev., 5 1/4% due 2/15/2026ø | | A1/AA | | 1,110,080 |
| 1,250,000 | | University of North Carolina at Charlotte Rev. (Student Activity Center), 5 1/2% due 6/1/2021 | | Aaa/AAA | | 1,343,250 |
| 1,000,000 | | Wake County Industrial Facilities & Pollution Control Financing Authority Rev., NC (Carolina Power & Light), 5 3/8% due 2/1/2017 | | A3/BBB | | 1,070,700 |
|
|
|
|
|
|
|
Total Municipal Bonds (Cost $23,151,057) —95.0% | | 25,071,278 |
|
|
|
Variable Rate Demand Notes (Cost $700,000) —2.7% | | 700,000 |
|
|
|
Total Investments (Cost $23,851,057) —97.7% | | 25,771,278 |
|
|
|
Other Assets Less Liabilities —2.3% | | 608,552 |
|
|
|
Net Assets —100.0% | | $26,379,830 |
|
_______________
† Ratings have not been audited by Deloitte & Touche LLP.
†† Escrowed-to-maturity security.
ø Pre-refunded security.
* Interest income earned from this security is subject to the federal alternative minimum tax.
See Notes to Financial Statements.
14
Statements of Assets and LiabilitiesSeptember 30, 2003| | | California | | California | | | | | North | |
| | | High-Yield | | Quality | | Florida | | Carolina | |
| | | Series | | Series | | Series | | Series | |
| |
| Assets: | | | | | | | | | | | | | |
| |
| Investments, at value:* | | | | | | | | | | | | | |
| Long-term holdings | | $ | 43,955,280 | | $ | 66,352,624 | | $ | 38,296,868 | | $ | 25,071,278 | |
| Short-term holdings | | | 2,550,000 | | | 1,500,000 | | | 1,200,000 | | | 700,000 | |
| | | | 46,505,280 | | | 67,852,624 | | | 39,496,868 | | | 25,771,278 | |
| Cash | | | 88,030 | | | 69,847 | | | 52,546 | | | 95,620 | |
| Interest receivable | | | 672,043 | | | 1,110,175 | | | 799,261 | | | 347,863 | |
| Expenses prepaid to shareholder | | | | | | | | | | | | | |
| service agent | | | 16,242 | | | 18,153 | | | 12,420 | | | 7,643 | |
| Receivable for Shares of | | | | | | | | | | | | | |
| Beneficial Interest sold | | | 16,000 | | | — | | | 151,049 | | | — | |
| Receivable for securities sold | | | — | | | — | | | — | | | 313,320 | |
| Other | | | 2,118 | | | 3,138 | | | 1,846 | | | 1,191 | |
| |
| Total Assets | | | 47,299,713 | | | 69,053,937 | | | 40,513,990 | | | 26,536,915 | |
| |
| | | | | | | | | | | | | | |
| Liabilities: | | | | | | | | | | | | | |
| |
| Dividends payable | | | 78,654 | | | 105,785 | | | 61,302 | | | 45,201 | |
| Payable for Shares | | | | | | | | | | | | | |
| of Beneficial Interest repurchased | | | 41,249 | | | 6,000 | | | 10,490 | | | 65,170 | |
| Management fee payable | | | 15,354 | | | 27,945 | | | 11,602 | | | 10,830 | |
| Distribution and service fees payable | | | 9,277 | | | 10,286 | | | 11,437 | | | 7,163 | |
| Accrued expenses and other | | | 43,867 | | | 53,531 | | | 34,685 | | | 28,721 | |
| Total Liabilities | | | 188,401 | | | 203,547 | | | 129,516 | | | 157,085 | |
| |
| Net Assets | | $ | 47,111,312 | | $ | 68,850,390 | | $ | 40,384,474 | | $ | 26,379,830 | |
| |
| | | | | | | | | | | | | | |
| Composition of Net Assets: | | | | | | | | | | | | | |
| |
| Shares of Beneficial Interest, at par: | | | | | | | | | | | | | |
| Class A | | $ | 5,888 | | $ | 8,952 | | $ | 4,224 | | $ | 2,798 | |
| Class C | | | 528 | | | 842 | | | 579 | | | 342 | |
| Class D | | | 733 | | | 221 | | | 194 | | | 101 | |
| Additional paid-in capital | | | 45,518,125 | | | 64,738,764 | | | 37,286,379 | | | 24,365,158 | |
| Undistributed net investment income | | | 116,767 | | | 180,123 | | | 67,995 | | | 43,575 | |
| Undistributed/accumulated net | | | | | | | | | | | | | |
| realized gain (loss) | | | 12,632 | | | (168,194 | ) | | 76,905 | | | 47,635 | |
| Net unrealized appreciation | | | | | | | | | | | | | |
| of investments | | | 1,456,639 | | | 4,089,682 | | | 2,948,198 | | | 1,920,221 | |
| |
| Net Assets | | $ | 47,111,312 | | $ | 68,850,390 | | $ | 40,384,474 | | $ | 26,379,830 | |
| |
(Continued on page 16. )
______________
See footnotes on page 16.
15
Statements of Assets and Liabilities
(continued)
| | | California | | California | | | | | North | |
| | | High-Yield | | Quality | | Florida | | Carolina | |
| | | Series | | Series | | Series | | Series | |
|
| |
| Net Assets: | | | | | | | | | | | | | |
| |
| Class A | | $ | 38,797,689 | | $ | 61,565,685 | | $ | 34,130,985 | | $ | 22,778,362 | |
| Class C | | $ | 3,482,097 | | $ | 5,772,456 | | $ | 4,686,308 | | $ | 2,777,909 | |
| Class D | | $ | 4,831,526 | | $ | 1,512,249 | | $ | 1,567,181 | | $ | 823,559 | |
| | | | | | | | | | | | | | |
Shares of Beneficial Interest Outstanding (unlimited shares authorized; $0.001 par value) : | | | | | | | | | | | | | |
| |
| Class A | | | 5,888,220 | | | 8,952,255 | | | 4,224,358 | | | 2,797,815 | |
| Class C | | | 527,959 | | | 842,199 | | | 578,930 | | | 341,595 | |
| Class D | | | 732,527 | | | 220,627 | | | 193,598 | | | 101,270 | |
| | | | | | | | | | | | | | |
| Net Asset Value per Share: | | | | | | | | | | | | | |
| |
| Class A | | $ | 6.59 | | $ | 6.88 | | $ | 8.08 | | $ | 8.14 | |
| Class C | | $ | 6.60 | | $ | 6.85 | | $ | 8.09 | | $ | 8.13 | |
| Class D | | $ | 6.60 | | $ | 6.85 | | $ | 8.10 | | $ | 8.13 | |
| | | | | | | | | | | | | | |
| _____________ |
| * Cost of investments | | $ | 45,048,641 | | $ | 63,762,942 | | $ | 36,548,670 | | $ | 23,851,057 | |
See Notes to Financial Statements.
16
| | | California | | California | | | | | North | |
| | | High-Yield | | Quality | | Florida | | Carolina | |
| | | Series | | Series | | Series | | Series | |
| |
| Investment Income: | | | | | | | | | | | | | |
| |
| Interest | | $ | 2,669,152 | | $ | 3,659,813 | | $ | 2,126,989 | | $ | 1,356,999 | |
| |
| | | | | | | | | | | | | | |
| Expenses: | | | | | | | | | | | | | |
| |
| Management fees | | | 255,537 | | | 374,016 | | | 213,775 | | | 140,411 | |
| Distribution and service fees | | | 126,079 | | | 138,683 | | | 153,592 | | | 98,525 | |
| Shareholder account services | | | 117,045 | | | 141,904 | | | 94,048 | | | 59,749 | |
| Auditing and legal fees | | | 27,138 | | | 34,142 | | | 25,506 | | | 19,192 | |
| Custody and related services | | | 25,422 | | | 30,056 | | | 19,542 | | | 15,036 | |
| Registration | | | 14,515 | | | 14,945 | | | 12,638 | | | 12,071 | |
| Trustee’s fees and expenses | | | 8,815 | | | 9,564 | | | 7,860 | | | 7,220 | |
| Shareholder reports | | | | | | | | | | | | | |
| and communications | | | 6,236 | | | 10,693 | | | 5,696 | | | 5,808 | |
| Miscellaneous | | | 4,636 | | | 5,734 | | | 3,776 | | | 3,204 | |
| |
| Total Expenses | | | | | | | | | | | | | |
| Before Management Fee Waiver | | | 585,423 | | | 759,737 | | | 536,433 | | | 361,216 | |
| |
| Fee Waiver (Note 4) | | | (51,109 | ) | | — | | | (64,132 | ) | | — | |
| |
| Total Expenses | | | | | | | | | | | | | |
| After Management Fee Waiver | | | 534,314 | | | 759,737 | | | 472,301 | | | 361,216 | |
| |
| Net Investment Income | | | 2,134,838 | | | 2,900,076 | | | 1,654,688 | | | 995,783 | |
| |
| | | | | | | | | | | | | | |
| Net Realized and Unrealized Gain (Loss) on Investments: | | | | | | | | | | | | | |
| |
| Net realized gain on investments | | | 140,138 | | | 22,618 | | | 66,794 | | | 41,191 | |
| Net change in unrealized appreciation of investments | | | (1,238,128 | ) | | (1,945,933 | ) | | (76,255 | ) | | (109,179 | ) |
| |
| Net Loss on Investments | | | (1,097,990 | ) | | (1,923,315 | ) | | (9,461 | ) | | (67,988 | ) |
| |
| Increase in Net Assets from Operations | | $ | 1,036,848 | | $ | 976,761 | | $ | 1,645,227 | | $ | 927,795 | |
| |
_______________
See footnotes on page 16.
17
| | | California High-Yield Series | | California Quality Series | |
| | |
| |
| | | Year Ended September 30, | | Year Ended September 30, | |
| | |
| |
| |
| | | 2003 | | 2002 | | 2003 | | 2002 | |
|
| |
| Operations: | | | | | | | | | | | | | |
| |
| Net investment income | | $ | 2,134,838 | | $ | 2,415,922 | | $ | 2,900,076 | | $ | 3,335,069 | |
| Net realized gain (loss) on investments | | | 140,138 | | | 161,411 | | | 22,618 | | | (52,470 | ) |
| Net change in unrealized appreciation of investments | | | (1,238,128 | ) | | 1,073,987 | | | (1,945,933 | ) | | 2,173,479 | |
| |
| Increase in Net Assets from Operations | | | 1,036,848 | | | 3,651,320 | | | 976,761 | | | 5,456,078 | |
| |
| Distributions to Shareholders: | | | | | | | | | | | | | |
| |
| Net investment income: | | | | | | | | | | | | | |
| Class A | | | (1,822,424 | ) | | (2,084,717 | ) | | (2,650,341 | ) | | (3,138,850 | ) |
| Class C | | | (112,043 | ) | | (120,977 | ) | | (160,286 | ) | | (96,892 | ) |
| Class D | | | (168,572 | ) | | (191,021 | ) | | (55,316 | ) | | (72,824 | ) |
| |
| Total | | | (2,103,039 | ) | | (2,396,715 | ) | | (2,865,943 | ) | | (3,308,566 | ) |
| |
| Net realized short-term gain on investments: † | | | | | | | | | | | | | |
| Class A | | | (125,405 | ) | | — | | | — | | | — | |
| Class C | | | (8,656 | ) | | — | | | — | | | — | |
| Class D | | | (13,453 | ) | | — | | | — | | | — | |
| |
| Total | | | (147,514 | ) | | — | | | — | | | — | |
| |
| Net realized long-term gain on investments: | | | | | | | | | | | | | |
| Class A | | | (88,522 | ) | | (136,035 | ) | | — | | | (669,363 | ) |
| Class C | | | (6,110 | ) | | (9,158 | ) | | — | | | (17,701 | ) |
| Class D | | | (9,496 | ) | | (15,440 | ) | | — | | | (28,044 | ) |
| |
| Total | | | (104,128 | ) | | (160,633 | ) | | — | | | (715,108 | ) |
| |
| Decrease in Net Assets from | | | | | | | | | | | | | |
| |
| Distributions | | | (2,354,681 | ) | | (2,557,348 | ) | | (2,865,943 | ) | | (4,023,674 | ) |
| |
(Continued on page 19. )
____________
See footnotes on page 19.
18
Statements of Changes in Net Assets
(continued)
| | | California High-Yield Series | | California Quality Series | |
| |
| |
| | | Year Ended September 30, | | Year Ended September 30, | |
| |
| |
| |
| | | 2003 | | 2002 | | 2003 | | 2002 | |
| |
| Capital Share Transactions: | | | | | | | | | | | | | |
| |
| Net proceeds from sales of shares | | $ | 1,532,392 | | $ | 2,990,070 | | $ | 4,974,059 | | $ | 16,952,913 | |
| Investment of dividends | | | 1,243,133 | | | 1,388,559 | | | 1,478,061 | | | 1,614,524 | |
| Exchanged from associated funds | | | 15,772,060 | | | 14,607,950 | | | 1,676,737 | | | 1,235,384 | |
Shares issued in payment of gain distributions | | | 182,579 | | | 117,873 | | | — | | | 460,051 | |
| |
| Total | | | 18,730,164 | | | 19,104,452 | | | 8,128,857 | | | 20,262,872 | |
| |
| Cost of shares repurchased | | | (6,600,451 | ) | | (5,037,549 | ) | | (16,337,268 | ) | | (18,363,638 | ) |
| Exchanged into associated funds | | | (23,587,901 | ) | | (14,743,265 | ) | | (2,788,344 | ) | | (1,476,492 | ) |
| |
| Total | | | (30,188,352 | ) | | (19,780,814 | ) | | (19,125,612 | ) | | (19,840,130 | ) |
| |
| Increase (Decrease) in Net Assets | | | | | | | | | | | | | |
| from Capital Share Transactions | | | (11,458,188 | ) | | (676,362 | ) | | (10,996,755 | ) | | 422,742 | |
|
| |
| Increase (Decrease) in Net Assets | | | (12,776,021 | ) | | 417,610 | | | (12,885,937 | ) | | 1,855,146 | |
| |
| Net Assets: | | | | | | | | | | | | | |
| |
| Beginning of year | | | 59,887,333 | | | 59,469,723 | | | 81,736,327 | | | 79,881,181 | |
| |
End of Year * | | $ | 47,111,312 | | $ | 59,887,333 | | $ | 68,850,390 | | $ | 81,736,327 | |
| |
| | | | | | | | | | | | | | |
__________________ |
| * Including undistributed net investment income as follows: | | $ | 116,767 | | $ | 102,692 | | $ | 180,123 | | $ | 156,808 | |
| † �� For tax purposes, these distributions are considered ordinary income. | | | | | | | | | | | | | |
See Notes to Financial Statements.
19
Statements of Changes in Net Assets
(continued)
| | | Florida Series | | North Carolina Series | |
| | |
| |
| | | Year Ended September 30, | | Year Ended September 30, | |
| | |
| |
| |
| | | | 2003 | | | 2002 | | | 2003 | | | 2002 | |
| |
| Operations: | | | | | | | | | | | | | |
| |
| Net investment income | | $ | 1,654,688 | | $ | 1,745,510 | | $ | 995,783 | | $ | 1,175,377 | |
| Net realized gain on investments | | | 66,794 | | | 74,668 | | | 41,191 | | | 117,215 | |
| Net change in unrealized appreciation of investments | | | (76,255 | ) | | 993,334 | | | (109,179 | ) | | 987,590 | |
| |
| Increase in Net Assets from Operations | | | 1,645,227 | | | 2,813,512 | | | 927,795 | | | 2,280,182 | |
| |
| | | | | | | | | | | | | | |
| Distributions to Shareholders: | | | | | | | | | | | | | |
| |
| Net investment income: | | | | | | | | | | | | | |
| Class A | | | (1,439,063 | ) | | (1,568,880 | ) | | (875,583 | ) | | (1,028,081 | ) |
| Class C | | | (140,805 | ) | | (98,276 | ) | | (82,387 | ) | | (90,604 | ) |
| Class D | | | (57,918 | ) | | (63,496 | ) | | (25,624 | ) | | (45,412 | ) |
| |
| Total | | | (1,637,786 | ) | | (1,730,652 | ) | | (983,594 | ) | | (1,164,097 | ) |
| |
| Net realized short-term gain on investments: † | | | | | | | | | | | | | |
| |
| Class A | | | — | | | — | | | (21,521 | ) | | — | |
| Class C | | | — | | | — | | | (2,424 | ) | | — | |
| Class D | | | — | | | — | | | (803 | ) | | — | |
| |
| Total | | | — | | | — | | | (24,748 | ) | | — | |
| |
| Net realized long-term gain on investments: | | | | | | | | | | | | | |
| Class A | | | (50,295 | ) | | — | | | (92,232 | ) | | (22,817 | ) |
| Class C | | | (5,431 | ) | | — | | | (10,386 | ) | | (2,204 | ) |
| Class D | | | (2,384 | ) | | — | | | (3,440 | ) | | (1,347 | ) |
| |
| Total | | | (58,110 | ) | | — | | | (106,058 | ) | | (26,368 | ) |
| |
Decrease in Net Assets from Distributions | | | (1,695,896 | ) | | (1,730,652 | ) | | (1,114,400 | ) | | (1,190,465 | ) |
| |
(Continued on page 21. )
______________
See footnotes on page 21.
20
Statements of Changes in Net Assets
(continued)
| | | Florida Series | | North Carolina Series | |
| | |
| |
| | | Year Ended September 30, | | Year Ended September 30, | |
| | |
| |
| |
| | | 2003 | | 2002 | | 2003 | | 2002 | |
| |
| Capital Share Transactions: | | | | | | | | | | | | | |
| |
| Net proceeds from sales of shares | | $ | 4,358,821 | | $ | 4,543,758 | | $ | 3,745,650 | | $ | 4,829,290 | |
| Investment of dividends | | | 759,368 | | | 788,699 | | | 588,430 | | | 649,812 | |
| Exchanged from associated funds | | | 1,566,632 | | | 2,433,758 | | | 4,162,491 | | | 3,051,795 | |
| Shares issued in payment of | | | | | | | | | | | | | |
| gain distributions | | | 27,939 | | | — | | | 93,143 | | | 18,346 | |
| |
| Total | | | 6,712,760 | | | 7,766,215 | | | 8,589,714 | | | 8,549,243 | |
| |
| Cost of shares repurchased | | | (8,503,284 | ) | | (4,409,030 | ) | | (5,956,929 | ) | | (5,006,154 | ) |
| Exchanged into associated funds | | | (1,030,121 | ) | | (1,963,962 | ) | | (5,355,336 | ) | | (4,644,798 | ) |
| |
| Total | | | (9,533,405 | ) | | (6,372,992 | ) | | (11,312,265 | ) | | (9,650,952 | ) |
| |
| Increase (Decrease) in Net Assets from Capital Share Transactions | | | (2,820,645 | ) | | 1,393,223 | | | (2,722,551 | ) | | (1,101,709 | ) |
| |
| Increase (Decrease) in Net Assets | | | (2,871,314 | ) | | 2,476,083 | | | (2,909,156 | ) | | (11,992 | ) |
| |
| Net Assets: | | | | | | | | | | | | | |
| Beginning of year | | | 43,255,788 | | | 40,779,705 | | | 29,288,986 | | | 29,300,978 | |
| |
End of Year * | | $ | 40,384,474 | | $ | 43,255,788 | | $ | 26,379,830 | | $ | 29,288,986 | |
| |
| | | | | | | | | | | | | | |
| _________________ |
| * Including undistributed net investment income as follows: | | $ | 67,995 | | $ | 67,360 | | $ | 43,575 | | $ | 53,226 | |
† For tax purposes, these distributions are considered ordinary income.
See Notes to Financial Statements.
21
Notes to Financial Statements
1. Multiple Classes of Shares — Seligman Municipal Series Trust (the "Trust") consists of four separate series: the "California High-Yield Series," the "California Quality Series," the "Florida Series," and the "North Carolina Series." Each Series of the Trust offers three classes of shares. Class A shares are sold with an initial sales charge of up to 4.75% and a continuing service fee of up to 0.25% on an annual basis. Class A shares purchased in an amount of $1,000,000 or more are sold without an initial sales charge but are subject to a contingent deferred sales charge ("CDSC") of 1% on redemptions within 18 months of purchase. Class C shares are sold with an initial sales charge of up to 1% and are subject to a distributio n fee of up to 0.75% and a service fee of up to 0.25% on an annual basis, and a CDSC, if applicable, of 1% imposed on redemptions made within 18 months of purchase. Class D shares are sold without an initial sales charge but are subject to a distribution fee of up to 0.75% and a service fee of up to 0.25% on an annual basis, and a CDSC, if applicable, of 1% imposed on redemptions made within one year of purchase. The three classes of shares for each Series represent interests in the same portfolio of investments, have the same rights and are generally identical in all respects except that each class bears its separate distribution and certain other class-specific expenses, and has exclusive voting rights with respect to any matter on which a separate vote of any class is required.
2. Significant Accounting Policies — The financial statements have been prepared in conformity with accounting principles generally accepted in the United States of America, which require management to make certain estimates and assumptions at the date of the financial statements. The following summarizes the significant accounting policies of the Trust:
a. Security Valuation — All municipal securities and other short-term holdings maturing in more than 60 days are valued based upon quotations provided by an independent pricing service or, in their absence, at fair value determined in accordance with procedures approved by the Trustees. Short- term holdings maturing in 60 days or less are generally valued at amortized cost.
b. Federal Taxes — There is no provision for federal income tax. Each Series has elected to be taxed as a regulated investment company and intends to distribute substantially all taxable net income and net realized gains.
c. Security Transactions and Related Investment Income — Investment transactions are recorded on trade dates. Identified cost of investments sold is used for both financial reporting and federal income tax purposes. Interest income is recorded on the accrual basis. The Trust amortizes discounts and premiums paid on bonds and other debt securities for financial reporting purposes.
Variable rate demand notes purchased by the Trust may be put back to the designated remarketing agent for the issue at par on any day, for settlement within seven days, and, accordingly, are treated as short-term holdings. These notes bear interest at a rate that resets daily or weekly. At September 30, 2003, the interest rates paid on these notes ranged from 1.14% to 1.23%.
d. Multiple Class Allocations — Each Series’ income, expenses (other than class-specific expenses), and realized and unrealized gains or losses are allocated daily to each class of shares of that Series based upon the relative value of the shares of each class. Class-specific expenses, which include distribution and service fees and any other items that are specifically attributable to a particular class, are charged directly to such class. For the year ended September 30, 2003, distribution and service fees were the only class-specific expenses.
e. Distributions to Shareholders — Dividends are declared daily and paid monthly. Other distributions paid by the Trust are recorded on the ex-dividend date. The treatment for financial reporting purposes of distributions made to shareholders during the year from net investment income or net realized gains may differ from their ultimate treatment for federal income tax purposes. These differences
22
Notes to Financial Statements
are caused primarily by differences in the timing of the recognition of certain components of income, expense, or realized capital gain for federal income tax purposes. Where such differences are permanent in nature, they are reclassified in the components of net assets based on their ultimate characterization for federal income tax purposes. Any such reclassifications will have no effect on net assets, results of operations, or net asset values per share of any Series of the Trust.
3. Purchases and Sales of Securities — Purchases and sales of portfolio securities, excluding short-term investments, for the year ended September 30, 2003, were as follows:
| Series | | Purchases | | Sales |
|
| California High-Yield | | $2,133,648 | | $10,547,700 |
| California Quality | | 993,710 | | 5,844,095 |
| Florida | | 4,859,495 | | 4,938,140 |
| North Carolina | | 2,524,227 | | 3,748,800 |
At September 30, 2003, the tax basis cost of investments for federal income tax purposes of each Series was less than the cost for financial reporting purposes due to the amortization of market discount for financial reporting purposes, offset, in part, for the California Quality Series by the tax deferral of losses on wash sales of $149,160. The tax basis cost and gross unrealized appreciation and depreciation of portfolio securities were as follows:
| | | | | Total | | Total |
| | | Tax | | Unrealized | | Unrealized |
| Series | | Basis Cost | | Appreciation | | Depreciation |
|
|
|
|
|
|
|
| California High-Yield | | $44,931,874 | | $1,699,300 | | $125,894 |
| California Quality | | 63,731,979 | | 4,120,645 | | — |
| Florida | | 36,480,675 | | 3,016,193 | | — |
| North Carolina | | 23,807,482 | | 1,963,796 | | — |
4. Management Fee, Distribution Services, and Other Transactions — J. & W. Seligman & Co. Incorporated (the "Manager") manages the affairs of the Trust and provides the necessary personnel and facilities. Compensation of all officers of the Trust, all trustees of the Trust who are employees of the Manager, and all personnel of the Trust and the Manager is paid by the Manager. The Manager’s fee is calculated daily and payable monthly, equal to 0.50% per annum of each Series’ average daily net assets. The Manager, at its discretion, agreed to waive a portion of its fees for the year ended September 30, 2003 to limit the per annum fee of California High-Yield Series and Florida Series to 0.40% and 0.35%, respectivel y. For the year ended September 30, 2003, the amount of fees waived by the Manager was $51,109 and $64,132, respectively.
Seligman Advisors, Inc. (the "Distributor"), agent for the distribution of the Trust’s shares and an affiliate of the Manager, received the following concessions from sales of Class A shares, after commissions were paid to dealers for sales of Class A and Class C shares:
| | | Distributor | | Dealer |
| Series | | Concessions | | Commissions |
|
|
|
|
|
| California High-Yield | | $2,679 | | $23,030 |
| California Quality | | 8,394 | | 70,908 |
| Florida | | 7,633 | | 64,910 |
| North Carolina | | 4,473 | | 38,073 |
23
Notes to Financial Statements
The Trust has an Administration, Shareholder Services and Distribution Plan (the "Plan") with respect to distribution of its shares. Under the Plan, with respect to Class A shares, service organizations can enter into agreements with the Distributor and receive continuing fees of up to 0.25% on an annual basis of the average daily net assets of the Class A shares attributable to the particular service organizations for providing personal services and/or the maintenance of shareholder accounts. The Distributor charges such fees to the Trust monthly pursuant to the Plan. For the year ended September 30, 2003, for California High-Yield Series, California Quality Series, Florida Series, and North Carolina Series, fees incurred under the Plan aggregated $42,554, $67,597, $91,158, and $60,609, respectively, or 0.10%, 0.10%, 0.25%, and 0.25%, respectiv ely, per annum of average daily net assets of Class A shares.
Under the Plan, with respect to Class C shares and Class D shares, service organizations can enter into agreements with the Distributor and receive continuing fees for providing personal services and/or the maintenance of shareholder accounts of up to 0.25% on an annual basis of the average daily net assets of the Class C and Class D shares for which the organizations are responsible, and fees for providing other distribution assistance of up to 0.75% on an annual basis of such average daily net assets. Such fees are paid monthly by the Trust to the Distributor pursuant to the Plan. For the year ended September 30, 2003, fees incurred under the Plan equivalent to 1% per annum of the average daily net assets of Class C and Class D shares were as follows:
| Series | | Class C | | Class D |
|
|
|
|
|
| California High-Yield | | $33,337 | | $50,188 |
| California Quality | | 52,769 | | 18,317 |
| Florida | | 44,216 | | 18,218 |
| North Carolina | | 28,948 | | 8,968 |
The Distributor is entitled to retain any CDSC imposed on certain redemptions of Class A and Class C shares occurring within 18 months of purchase and on redemptions of Class D shares occurring within one year of purchase. For the year ended September 30, 2003, such charges amounted to $0 for California High-Yield Series, $6,423 for California Quality Series, $5,239 for Florida Series, and $7,496 for North Carolina Series.
Seligman Services, Inc., an affiliate of the Manager, is eligible to receive commissions from certain sales of Trust shares, as well as distribution and service fees pursuant to the Plan. For the year ended September 30, 2003, Seligman Services, Inc. received commissions from the sales of shares of each Series and distribution and service fees, pursuant to the Plan, as follows:
| | | | | Distribution and |
| Series | | Commissions | | Service Fees |
|
|
|
|
|
| California High-Yield | | $ 534 | | $4,423 |
| California Quality | | 3,361 | | 3,699 |
| Florida | | 417 | | 4,269 |
| North Carolina | | — | | 2,055 |
Seligman Data Corp., which is owned by certain associated investment companies, charged each Series at cost for shareholder account services in accordance with a methodology approved by the Trust’s trustees as follows:
Series | | | |
|
|
|
|
| California High-Yield | | $117,045 | |
| California Quality | | 141,904 | |
| Florida | | 94,048 | |
| North Carolina | | 59,749 | |
24
Notes to Financial Statements
Costs of Seligman Data Corp. directly attributable to a Series were charged to that Series. The remaining charges were allocated to each Series by Seligman Data Corp. pursuant to a formula based on each Series’ net assets, shareholder transaction volume and number of shareholder accounts.
The Trust and certain other associated investment companies (together, the "Guarantors") have severally but not jointly guaranteed the performance and observance of all the terms and conditions of two leases entered into by Seligman Data Corp., including the payment of rent by Seligman Data Corp. (the "Guaranties"). The leases and the Guaranties expire in September 2008 and January 2009. The obligation of the Trust to pay any amount due under either Guaranty is limited to a specified percentage of the full amount, which generally is based on the Trust’s percentage of the expenses billed by Seligman Data Corp. to all Guarantors in the preceding calendar quarter. As of September 30, 2003, the Trust’s potential obligation under the Guaranties is $87,400. As of September 30, 2003, no event has occurred which would result in the Trust becom ing liable to make any payment under a Guaranty. Each Series would bear a portion of any payments made by the Trust under the Guaranties. A portion of rent paid by Seligman Data Corp. is charged to the Trust as part of Seligman Data Corp.’s shareholder account services cost.
Certain officers and trustees of the Trust are officers or directors of the Manager, the Distributor, Seligman Services, Inc., and/or Seligman Data Corp.
The Trust has a compensation agreement under which trustees who receive fees may elect to defer receiving such fees. Trustees may elect to have their deferred fees accrue interest or earn a return based on the performance of selected Series of the Trust or other funds in the Seligman Group of Investment Companies. Deferred fees and related accrued earnings are not deductible for federal income tax purposes until such amounts are paid. The cost of such fees and earnings/losses accrued thereon is included in trustees’ fees and expenses, and the accumulated balances thereof at September 30, 2003, are included in accrued expenses and other liabilities as follows:
Series | | | |
|
|
|
|
| California High-Yield | | $11,318 | |
| California Quality | | 11,497 | |
| Florida | | 6,797 | |
| North Carolina | | 5,539 | |
5. Committed Line of Credit — The Trust is a participant in a joint $420 million committed line of credit that is shared by substantially all open-end funds in the Seligman Group of Investment Companies. Each Series’ borrowings are limited to 10% of its net assets. Borrowings pursuant to the credit facility are subject to interest at a per annum rate equal to the overnight federal funds rate plus 0.50%. Each Series incurs a commitment fee of 0.10% per annum on its share of the unused portion of the credit facility. The credit facility may be drawn upon only for temporary purposes and is subject to certain other customary restrictions. The credit facility commitment expires in June 2004, but is renewable annually with the c onsent of the participating banks. For the year ended September 30, 2003, the Trust did not borrow from the credit facility.
6. Capital Loss Carryforward and Other Tax Adjustments — At September 30, 2003, the California Quality Series had a net capital loss carryforward for federal income tax purposes of $19,034, expiring in 2011, which is available for offset against future taxable net capital gains. Accordingly, no capital gain distributions are expected to be paid to shareholders of this Series until net capital gains have been realized in excess of the available capital loss carryforward.
25
Notes to Financial Statements
7. Transactions in Shares of Beneficial Interest — Transactions in Shares of Beneficial Interest were as follows:
California High-Yield Series
|
| |
| | | Year Ended September 30, | |
| |
| | | | 2003 | | 2002 | |
| |
| Class A | | | Shares | | | Amount | | | Shares | | | Amount | |
| |
| Net proceeds from sales of shares | | | 124,441 | | $ | 818,547 | | | 320,139 | | $ | 2,102,918 | |
| Investment of dividends | | | 157,158 | | | 1,034,298 | | | 180,008 | | | 1,177,632 | |
| Exchanged from associated funds | | | 2,378,200 | | | 15,699,417 | | | 2,242,274 | | | 14,514,200 | |
Shares issued in payment of gain distributions | | | 23,350 | | | 152,707 | | | 14,874 | | | 98,617 | |
| |
| Total | | | 2,683,149 | | | 17,704,969 | | | 2,757,295 | | | 17,893,367 | |
| |
| Cost of shares repurchased | | | (818,165 | ) | | (5,389,247 | ) | | (550,019 | ) | | (3,608,289 | ) |
| Exchanged into associated funds | | | (3,546,399 | ) | | (23,415,548 | ) | | (2,219,063 | ) | | (14,464,774 | ) |
| |
| Total | | | (4,364,564 | ) | | (28,804,795 | ) | | (2,769,082 | ) | | (18,073,063 | ) |
| |
| Decrease | | | (1,681,415 | ) | $ | (11,099,826 | ) | | (11,787 | ) | $ | (179,696 | ) |
| |
| Class C | | | Shares | | | Amount | | | Shares | | | Amount | |
| |
| Net proceeds from sales of shares | | | 87,104 | | $ | 579,047 | | | 101,708 | | $ | 665,889 | |
| Investment of dividends | | | 12,010 | | | 79,055 | | | 12,133 | | | 79,356 | |
| Exchanged from associated funds | | | 145 | | | 980 | | | 635 | | | 4,168 | |
| Shares issued in payment of gain | | | | | | | | | | | | | |
| distributions | | | 1,861 | | | 12,188 | | | 1,061 | | | 7,042 | |
| |
| Total | | | 101,120 | | | 671,270 | | | 115,537 | | | 756,455 | |
| |
| Cost of shares repurchased | | | (84,856 | ) | | (561,520 | ) | | (99,497 | ) | | (650,192 | ) |
| Exchanged into associated funds | | | (654 | ) | | (4,386 | ) | | — | | | — | |
| |
| Total | | | (85,510 | ) | | (565,906 | ) | | (99,497 | ) | | (650,192 | ) |
| |
| Increase | | | 15,610 | | $ | 105,364 | | | 16,040 | | $ | 106,263 | |
| |
| Class D | | | Shares | | | Amount | | | Shares | | | Amount | |
| |
| Net proceeds from sales of shares | | | 20,466 | | $ | 134,798 | | | 33,741 | | $ | 221,263 | |
| Investment of dividends | | | 19,706 | | | 129,780 | | | 20,128 | | | 131,571 | |
| Exchanged from associated funds | | | 10,918 | | | 71,663 | | | 13,470 | | | 89,582 | |
| Shares issued in payment of gain distributions | | | 2,700 | | | 17,684 | | | 1,839 | | | 12,214 | |
| |
| Total | | | 53,790 | | | 353,925 | | | 69,178 | | | 454,630 | |
| |
| Cost of shares repurchased | | | (98,831 | ) | | (649,684 | ) | | (119,047 | ) | | (779,068 | ) |
| Exchanged into associated funds | | | (25,719 | ) | | (167,967 | ) | | (41,820 | ) | | (278,491 | ) |
| |
| Total | | | (124,550 | ) | | (817,651 | ) | | (160,867 | ) | | (1,057,559 | ) |
| |
| Decrease | | | (70,760 | ) | $ | (463,726 | ) | | (91,689 | ) | $ | (602,929 | ) |
| |
26
Notes to Financial Statements
| California Quality Series |
| |
| | | | Year Ended September 30, | |
|
| | | | 2003 | | | 2002 |
| |
| Class A | | | Shares | | | Amount | | | Shares | | | Amount | |
| |
| Net proceeds from sales of shares | | | 454,386 | | $ | 3,116,697 | | | 1,961,711 | | $ | 13,403,676 | |
| Investment of dividends | | | 197,996 | | | 1,362,841 | | | 224,654 | | | 1,529,185 | |
| Exchanged from associated funds | | | 203,496 | | | 1,398,476 | | | 170,580 | | | 1,155,749 | |
Shares issued in payment of gain distributions | | | — | | | — | | | 64,258 | | | 442,096 | |
| |
| Total | | | 855,878 | | | 5,878,014 | | | 2,421,203 | | | 16,530,706 | |
| |
| Cost of shares repurchased | | | (2,189,530 | ) | | (15,075,151 | ) | | (2,423,487 | ) | | (16,398,180 | ) |
| Exchanged into associated funds | | | (330,355 | ) | | (2,269,490 | ) | | (189,932 | ) | | (1,283,088 | ) |
| |
| Total | | | (2,519,885 | ) | | (17,344,641 | ) | | (2,613,419 | ) | | (17,681,268 | ) |
| |
| Decrease | | | (1,664,007 | ) | $ | (11,466,627 | ) | | (192,216 | ) | $ | (1,150,562 | ) |
| |
| Class C | | | Shares | | | Amount | | | Shares | | | Amount | |
| |
| Net proceeds from sales of shares | | | 265,193 | | $ | 1,852,962 | | | 501,589 | | $ | 3,387,528 | |
| Investment of dividends | | | 12,819 | | | 87,959 | | | 7,914 | | | 53,629 | |
| Exchanged from associated funds | | | 33,331 | | | 228,840 | | | 8,740 | | | 59,200 | |
| Shares issued in payment of gain distributions | | | — | | | — | | | 1,352 | | | 9,277 | |
| |
| Total | | | 311,343 | | | 2,169,761 | | | 519,595 | | | 3,509,634 | |
| |
| Cost of shares repurchased | | | (118,463 | ) | | (807,896 | ) | | (52,181 | ) | | (357,388 | ) |
| Exchanged into associated funds | | | (72,952 | ) | | (497,851 | ) | | (28,712 | ) | | (193,404 | ) |
| |
| Total | | | (191,415 | ) | | (1,305,747 | ) | | (80,893 | ) | | (550,792 | ) |
| |
| Increase | | | 119,928 | | $ | 864,014 | | | 438,702 | | $ | 2,958,842 | |
| |
| Class D | | | Shares | | | Amount | | | Shares | | | Amount | |
| |
| Net proceeds from sales of shares | | | 642 | | $ | 4,400 | | | 23,952 | | $ | 161,709 | |
| Investment of dividends | | | 3,975 | | | 27,261 | | | 4,683 | | | 31,710 | |
| Exchanged from associated funds | | | 7,117 | | | 49,421 | | | 3,017 | | | 20,435 | |
Shares issued in payment of gain distributions | | | — | | | — | | | 1,265 | | | 8,678 | |
| |
| Total | | | 11,734 | | | 81,082 | | | 32,917 | | | 222,532 | |
| |
| Cost of shares repurchased | | | (66,877 | ) | | (454,221 | ) | | (240,192 | ) | | (1,608,070 | ) |
| Exchanged into associated funds | | | (3,098 | ) | | (21,003 | ) | | — | | | — | |
| |
| Total | | | (69,975 | ) | | (475,224 | ) | | (240,192 | ) | | (1,608,070 | ) |
| |
| Decrease | | | (58,241 | ) | $ | (394,142 | ) | | (207,275 | ) | $ | (1,385,538 | ) |
| |
27
Notes to Financial Statements
| Florida Series |
|
| |
| | | | Year Ended September 30, | |
| |
| | | | 2003 | | | 2002 | |
| |
| Class A | | | Shares | | | Amount | | | Shares | | | Amount | |
| |
| Net proceeds from sales of shares | | | 330,311 | | $ | 2,643,315 | | | 354,258 | | $ | 2,773,212 | |
| Investment of dividends | | | 82,805 | | | 663,209 | | | 92,289 | | | 723,506 | |
| Exchanged from associated funds | | | 91,095 | | | 728,063 | | | 271,819 | | | 2,111,014 | |
| Shares issued in payment of gain distributions | | | 3,134 | | | 24,817 | | | — | | | — | |
| |
| Total | | | 507,345 | | | 4,059,404 | | | 718,366 | | | 5,607,732 | |
| |
| Cost of shares repurchased | | | (896,691 | ) | | (7,170,449 | ) | | (485,845 | ) | | (3,811,354 | ) |
| Exchanged into associated funds | | | (27,024 | ) | | (214,892 | ) | | (246,999 | ) | | (1,918,108 | ) |
| |
| Total | | | (923,715 | ) | | (7,385,341 | ) | | (732,844 | ) | | (5,729,462 | ) |
| |
| Decrease | | | (416,370 | ) | $ | (3,325,937 | ) | | (14,478 | ) | $ | (121,730 | ) |
| |
| Class C | | | Shares | | | Amount | | | Shares | | | Amount | |
| |
| Net proceeds from sales of shares | | | 183,875 | | $ | 1,476,270 | | | 218,807 | | $ | 1,720,394 | |
| Investment of dividends | | | 8,646 | | | 69,506 | | | 4,186 | | | 32,923 | |
| Exchanged from associated funds | | | 90,205 | | | 720,768 | | | 8,768 | | | 69,304 | |
| Shares issued in payment of gain distributions | | | 326 | | | 2,587 | | | — | | | — | |
| |
| Total | | | 283,052 | | | 2,269,131 | | | 231,761 | | | 1,822,621 | |
| |
| Cost of shares repurchased | | | (87,747 | ) | | (708,656 | ) | | (39,712 | ) | | (310,033 | ) |
| Exchanged into associated funds | | | (90,461 | ) | | (722,729 | ) | | (5,924 | ) | | (45,854 | ) |
| |
| Total | | | (178,208 | ) | | (1,431,385 | ) | | (45,636 | ) | | (355,887 | ) |
| |
| Increase | | | 104,844 | | $ | 837,746 | | | 186,125 | | $ | 1,466,734 | |
| |
| Class D | | | Shares | | | Amount | | | Shares | | | Amount | |
| |
| Net proceeds from sales of shares | | | 29,901 | | $ | 239,236 | | | 6,356 | | $ | 50,152 | |
| Investment of dividends | | | 3,324 | | | 26,653 | | | 4,106 | | | 32,270 | |
| Exchanged from associated funds | | | 14,714 | | | 117,801 | | | 32,091 | | | 253,440 | |
| Shares issued in payment of gain distributions | | | 67 | | | 535 | | | — | | | — | |
| |
| Total | | | 48,006 | | | 384,225 | | | 42,553 | | | 335,862 | |
| |
| Cost of shares repurchased | | | (78,115 | ) | | (624,179 | ) | | (36,756 | ) | | (287,643 | ) |
| Exchanged into associated funds | | | (11,394 | ) | | (92,500 | ) | | — | | | — | |
| |
| Total | | | (89,509 | ) | | (716,679 | ) | | (36,756 | ) | | (287,643 | ) |
| |
| Increase (decrease) | | | (41,503 | ) | $ | (332,454 | ) | | 5,797 | | $ | 48,219 | |
| |
28
Notes to Financial Statements
| North Carolina Series |
|
| | | Year Ended September 30, | |
| |
| | | | 2003 | | | 2002 | |
| |
| Class A | | | Shares | | | Amount | | | Shares | | | Amount | |
| |
| Net proceeds from sales of shares | | | 366,967 | | $ | 2,960,033 | | | 456,442 | | $ | 3,594,349 | |
| Investment of dividends | | | 65,938 | | | 531,292 | | | 74,746 | | | 590,015 | |
| Exchanged from associated funds | | | 511,231 | | | 4,106,760 | | | 376,602 | | | 2,980,430 | |
| Shares issued in payment of gain distributions | | | 10,034 | | | 79,874 | | | 1,984 | | | 15,631 | |
| |
| Total | | | 954,170 | | | 7,677,959 | | | 909,774 | | | 7,180,425 | |
| |
| Cost of shares repurchased | | | (628,493 | ) | | (5,067,401 | ) | | (484,707 | ) | | (3,824,732 | ) |
| Exchanged into associated funds | | | (626,979 | ) | | (5,052,939 | ) | | (588,192 | ) | | (4,644,798 | ) |
| |
| Total | | | (1,255,472 | ) | | (10,120,340 | ) | | (1,072,899 | ) | | (8,469,530 | ) |
| |
| Decrease | | | (301,302 | ) | $ | (2,442,381 | ) | | (163,125 | ) | $ | (1,289,105 | ) |
| |
| Class C | | | Shares | | | Amount | | | Shares | | | Amount | |
| |
| Net proceeds from sales of shares | | | 87,410 | | $ | 703,100 | | | 152,325 | | $ | 1,203,569 | |
| Investment of dividends | | | 5,449 | | | 43,875 | | | 5,199 | | | 41,043 | |
| Exchanged from associated funds | | | 3,641 | | | 29,724 | | | 7,663 | | | 60,350 | |
| Shares issued in payment of gain distributions | | | 1,375 | | | 10,933 | | | 201 | | | 1,581 | |
| |
| Total | | | 97,875 | | | 787,632 | | | 165,388 | | | 1,306,543 | |
| |
| Cost of shares repurchased | | | (80,597 | ) | | (651,703 | ) | | (63,489 | ) | | (505,894 | ) |
| Exchanged into associated funds | | | (37,696 | ) | | (302,397 | ) | | — | | | — | |
| |
| Total | | | (118,293 | ) | | (954,100 | ) | | (63,489 | ) | | (505,894 | ) |
| |
| Increase (decrease) | | | (20,418 | ) | $ | (166,468 | ) | | 101,899 | | $ | 800,649 | |
| |
| Class D | | | Shares | | | Amount | | | Shares | | | Amount | |
| |
| Net proceeds from sales of shares | | | 10,332 | | $ | 82,517 | | | 3,978 | | $ | 31,372 | |
| Investment of dividends | | | 1,648 | | | 13,263 | | | 2,380 | | | 18,754 | |
| Exchanged from associated funds | | | 3,251 | | | 26,007 | | | 1,393 | | | 11,015 | |
| Shares issued in payment of gain distributions | | | 294 | | | 2,336 | | | 144 | | | 1,134 | |
| |
| Total | | | 15,525 | | | 124,123 | | | 7,895 | | | 62,275 | |
| |
| Cost of shares repurchased | | | (29,233 | ) | | (237,825 | ) | | (84,993 | ) | | (675,528 | ) |
| Exchanged into associated funds | | | — | | | — | | | — | | | — | |
| |
| Total | | | (29,233 | ) | | (237,825 | ) | | (84,993 | ) | | (675,528 | ) |
| |
| Decrease | | | (13,708 | ) | $ | (113,702 | ) | | (77,098 | ) | $ | (613,253 | ) |
| |
29
The tables below are intended to help you understand the financial performance of each Class of each Series for the past five years or from its inception if less than five years. Certain information reflects financial results for a single share of a Class that was held throughout the periods shown. Per share amounts are calculated using average shares outstanding during the period. "Total return" shows the rate that you would have earned (or lost) on an investment in each Class, assuming you reinvested all your dividend and capital gain distributions. Total returns do not reflect any sales charges or taxes investors may incur on distributions or on the redemption of shares, and are not annualized for periods of less than one year.
| California High-Yield Series |
| Class A |
| |
| | | Year Ended September 30, | |
| | |
| |
| | | | 2003 | | | 2002 ø | | | 2001 | | | 2000 | | | 1999 | |
| |
| Per Share Data: | | | | | | | | | | | | | | | | |
| |
| Net Asset Value, Beginning of Year | | $ | 6.74 | | $ | 6.63 | | $ | 6.33 | | $ | 6.28 | | $ | 6.80 | |
| |
| Income from Investment Operations: | | | | | | | | | | | | | | | | |
| Net investment income | | | 0.28 | | | 0.29 | | | 0.30 | | | 0.32 | | | 0.31 | |
| Net realized and unrealized gain (loss) on investments | | | (0.12 | ) | | 0.13 | | | 0.30 | | | 0.13 | | | (0.50 | ) |
| |
| Total from Investment Operations | | | 0.16 | | | 0.42 | | | 0.60 | | | 0.45 | | | (0.19 | ) |
| |
| Less Distributions: | | | | | | | | | | | | | | | | |
| Dividends from net investment income | | | (0.28 | ) | | (0.29 | ) | | (0.30 | ) | | (0.32 | ) | | (0.31 | ) |
| Distributions from net realized capital gain | | | (0.03 | ) | | (0.02 | ) | | — | | | (0.08 | ) | | (0.02 | ) |
| |
| Total Distributions | | | (0.31 | ) | | (0.31 | ) | | (0.30 | ) | | (0.40 | ) | | (0.33 | ) |
| |
| Net Asset Value, End of Year | | $ | 6.59 | | $ | 6.74 | | $ | 6.63 | | $ | 6.33 | | $ | 6.28 | |
| |
| Total Return: | | | 2.48 | % | | 6.50 | % | | 9.74 | % | | 7.49 | % | | (2.82) | % |
| |
| Ratios/Supplemental Data: | | | | | | | | | | | | | | | | |
| |
| Net assets, end of year (000s omitted) | | $ | 38,798 | | $ | 51,011 | | $ | 50,239 | | $ | 47,915 | | $ | 57,807 | |
| Ratio of expenses to average net assets | | | 0.88 | % | | 0.84 | % | | 0.70 | % | | 0.71 | % | | 0.84 | % |
| Ratio of net investment income to average net assets | | | 4.24 | % | | 4.41 | % | | 4.69 | % | | 5.23 | % | | 4.71 | % |
| Portfolio turnover rate | | | 4.43 | % | | 11.72 | % | | 2.95 | % | | 5.20 | % | | 27.61 | % |
| Without management fee waiver:** | | | | | | | | | | | | | | | | |
| Ratio of expenses to average net assets | | | 0.98 | % | | 0.94 | % | | 0.95 | % | | 0.91 | % | | | |
| Ratio of net investment income to average net assets | | | 4.14 | % | | 4.31 | % | | 4.44 | % | | 5.04 | % | | | |
See footnotes on page 41.
30
Financial Highlights
California High-Yield Series
| Class C |
| |
| | | Year Ended September 30, | |
| | |
| |
| | | | 2003 | | | 2002ø | | | 2001 | | | 2000 | | | 5/27/99* to 9/30/99 | |
| |
| Per Share Data: | | | | | | | | | | | | | | | | |
| |
| Net Asset Value, Beginning of Period | | $ | 6.75 | | $ | 6.64 | | $ | 6.34 | | $ | 6.29 | | $ | 6.62 | |
| |
| Income from Investment Operations: | | | | | | | | | | | | | | | | |
| Net investment income | | | 0.22 | | | 0.23 | | | 0.25 | | | 0.27 | | | 0.09 | |
| Net realized and unrealized gain (loss) on investments | | | (0.12 | ) | | 0.13 | | | 0.30 | | | 0.13 | | | (0.33 | ) |
| |
Total from Investment Operations | | | 0.10 | | | 0.36 | | | 0.55 | | | 0.40 | | | (0.24 | ) |
| |
Less Distributions: | | | | | | | | | | | | | | | | |
| Dividends from net investment income | | | (0.22 | ) | | (0.23 | ) | | (0.25 | ) | | (0.27 | ) | | (0.09 | ) |
| Distributions from net realized capital gain | | | (0.03 | ) | | (0.02 | ) | | — | | | (0.08 | ) | | — | |
| |
| Total Distributions | | | (0.25 | ) | | (0.25 | ) | | (0.25 | ) | | (0.35 | ) | | (0.09 | ) |
| |
| Net Asset Value, End of Period | | $ | 6.60 | | $ | 6.75 | | $ | 6.64 | | $ | 6.34 | | $ | 6.29 | |
| |
| Total Return: | | | 1.56 | % | | 5.57 | % | | 8.74 | % | | 6.53 | % | | (3.79) | % |
| |
| Ratios/Supplemental Data: | | | | | | | | | | | | | | | | |
| |
| Net assets, end of period (000s omitted) | | $ | 3,482 | | $ | 3,457 | | $ | 3,293 | | $ | 1,546 | | $ | 1,041 | |
| Ratio of expenses to average net assets | | | 1.78 | % | | 1.74 | % | | 1.60 | % | | 1.61 | % | | 1.72 | %† |
| Ratio of net investment income | | | | | | | | | | | | | | | | |
| to average net assets | | | 3.34 | % | | 3.51 | % | | 3.79 | % | | 4.33 | % | | 3.95 | %† |
| Portfolio turnover rate | | | 4.43 | % | | 11.72 | % | | 2.95 | % | | 5.20 | % | | 27.61 | %†† |
| Without management fee waiver:** | | | | | | | | | | | | | | | | |
| Ratio of expenses to average net assets | | | 1.88 | % | | 1.84 | % | | 1.85 | % | | 1.81 | % | | | |
| Ratio of net investment income to average net assets | | | 3.24 | % | | 3.41 | % | | 3.54 | % | | 4.13 | % | | | |
_____________
See footnotes on page 41.
31
Financial Highlights
| California High-Yield Series | | | | | | |
| Class D | | | | | | |
| |
| | | Year Ended September 30, | |
| | |
| |
| | | | 2003 | | | 2002 ø | | | 2001 | | | 2000 | | | 1999 | |
| |
| Per Share Data: | | | | | | | | | | | | | | | | |
| |
| | | | | | | | | | | | | | | | | |
| Net Asset Value, Beginning of Year | | $ | 6.75 | | $ | 6.64 | | $ | 6.34 | | $ | 6.29 | | $ | 6.80 | |
| |
| Income from Investment Operations: | | | | | | | | | | | | | | | | |
| Net investment income | | | 0.22 | | | 0.23 | | | 0.25 | | | 0.27 | | | 0.25 | |
| Net realized and unrealized gain (loss) on investments | | | (0.12 | ) | | 0.13 | | | 0.30 | | | 0.13 | | | (0.49 | ) |
| |
| Total from Investment Operations | | | 0.10 | | | 0.36 | | | 0.55 | | | 0.40 | | | (0.24 | ) |
| |
| Less Distributions: | | | | | | | | | | | | | | | | |
| Dividends from net investment income | | | (0.22 | ) | | (0.23 | ) | | (0.25 | ) | | (0.27 | ) | | (0.25 | ) |
| Distributions from net realized capital gain | | | (0.03 | ) | | (0.02 | ) | | — | | | (0.08 | ) | | (0.02 | ) |
| |
| Total Distributions | | | (0.25 | ) | | (0.25 | ) | | (0.25 | ) | | (0.35 | ) | | (0.27 | ) |
| |
| Net Asset Value, End of Year | | $ | 6.60 | | $ | 6.75 | | $ | 6.64 | | $ | 6.34 | | $ | 6.29 | |
| |
| | | | | | | | | | | | | | | | | |
| Total Return: | | | 1.56 | % | | 5.57 | % | | 8.74 | % | | 6.53 | % | | (3.54) | % |
| |
| | | | | | | | | | | | | | | | | |
| Ratios/Supplemental Data: | | | | | | | | | | | | | | | | |
| |
| | | | | | | | | | | | | | | | | |
| Net assets, end of year (000s omitted) | | $ | 4,832 | | $ | 5,419 | | $ | 5,938 | | $ | 5,880 | | $ | 7,658 | |
| Ratio of expenses to average net assets | | | 1.78 | % | | 1.74 | % | | 1.60 | % | | 1.61 | % | | 1.74 | % |
| Ratio of net investment income | | | | | | | | | | | | | | | | |
| to average net assets | | | 3.34 | % | | 3.51 | % | | 3.79 | % | | 4.33 | % | | 3.81 | % |
| Portfolio turnover rate | | | 4.43 | % | | 11.72 | % | | 2.95 | % | | 5.20 | % | | 27.61 | % |
| Without management fee waiver:** | | | | | | | | | | | | | | | | |
| Ratio of expenses to average net assets | | | 1.88 | % | | 1.84 | % | | 1.85 | % | | 1.81 | % | | | |
Ratio of net investment income to average net assets | | | 3.24 | % | | 3.41 | % | | 3.54 | % | | 4.13 | % | | | |
____________
See footnotes on page 41.
32
Financial Highlights
California Quality Series
| Class A |
| |
| | | Year Ended September 30, | |
| | |
| |
| | | | 2003 | | | 2002ø | | | 2001 | | | 2000 | | | 1999 | |
| |
| Per Share Data: | | | | | | | | | | | | | | | | |
| Net Asset Value, Beginning of Year | | $ | 7.04 | | $ | 6.90 | | $ | 6.53 | | $ | 6.42 | | $ | 7.21 | |
| |
| Income from Investment Operations: | | | | | | | | | | | | | | | | |
| Net investment income | | | 0.27 | | | 0.29 | | | 0.30 | | | 0.30 | | | 0.31 | |
| Net realized and unrealized gain (loss) on investments | | | (0.16 | ) | | 0.20 | | | 0.39 | | | 0.18 | | | (0.56 | ) |
| |
| Total from Investment Operations | | | 0.11 | | | 0.49 | | | 0.69 | | | 0.48 | | | (0.25 | ) |
| |
| Less Distributions: | | | | | | | | | | | | | | | | |
| Dividends from net investment income | | | (0.27 | ) | | (0.29 | ) | | (0.30 | ) | | (0.30 | ) | | (0.31 | ) |
| Distributions from net realized capital gain | | | — | | | (0.06 | ) | | (0.02 | ) | | (0.07 | ) | | (0.23 | ) |
| |
| Total Distributions | | | (0.27 | ) | | (0.35 | ) | | (0.32 | ) | | (0.37 | ) | | (0.54 | ) |
| |
| Net Asset Value, End of Year | | $ | 6.88 | | $ | 7.04 | | $ | 6.90 | | $ | 6.53 | | $ | 6.42 | |
| |
| Total Return: | | | 1.63 | % | | 7.29 | % | | 10.72 | % | | 7.95 | % | | (3.68) | % |
| |
| Ratios/Supplemental Data: | | | | | | | | | | | | | | | | |
| |
| Net assets, end of year (000s omitted) | | $ | 61,566 | | $ | 74,713 | | $ | 74,585 | | $ | 70,905 | | $ | 74,793 | |
| Ratio of expenses to average net assets | | | 0.93 | % | | 0.87 | % | | 0.87 | % | | 0.87 | % | | 0.82 | % |
| Ratio of net investment income to average net assets | | | 3.96 | % | | 4.23 | % | | 4.42 | % | | 4.83 | % | | 4.56 | % |
| Portfolio turnover rate | | | 1.43 | % | | 6.40 | % | | 19.83 | % | | 1.33 | % | | 20.24 | % |
_____________
See footnotes on page 41.
33
Financial Highlights
California Quality Series
Class C
| |
| | | Year Ended September 30, | | | |
| | |
| | | |
| | | | 2003 | | | 2002ø | | | 2001 | | | 2000 | | | 5/27/99* to 9/30/99 | |
| |
| Per Share Data: | | | | | | | | | | | | | | | | |
| |
| Net Asset Value, Beginning of Period | | $ | 7.01 | | $ | 6.88 | | $ | 6.51 | | $ | 6.40 | | $ | 6.75 | |
| |
| Income from Investment Operations: | | | | | | | | | | | | | | | | |
| Net investment income | | | 0.21 | | | 0.23 | | | 0.24 | | | 0.25 | | | 0.09 | |
| Net realized and unrealized gain (loss) on investments | | | (0.16 | ) | | 0.18 | | | 0.39 | | | 0.18 | | | (0.35 | ) |
| |
| Total from Investment Operations | | | 0.05 | | | 0.41 | | | 0.63 | | | 0.43 | | | (0.26 | ) |
| |
| Less Distributions: | | | | | | | | | | | | | | | | |
| Dividends from net investment income | | | (0.21 | ) | | (0.22 | ) | | (0.24 | ) | | (0.25 | ) | | (0.09 | ) |
| Distributions from net realized capital gain | | | — | | | (0.06 | ) | | (0.02 | ) | | (0.07 | ) | | — | |
| Total Distributions | | | (0.21 | ) | | (0.28 | ) | | (0.26 | ) | | (0.32 | ) | | (0.09 | ) |
| Net Asset Value, End of Period | | $ | 6.85 | | $ | 7.01 | | $ | 6.88 | | $ | 6.51 | | $ | 6.40 | |
| |
| Total Return: | | | 0.72 | % | | 6.20 | % | | 9.81 | % | | 7.00 | % | | (4.04) | % |
| |
| Ratios/Supplemental Data: | | | | | | | | | | | | | | | | |
| |
| Net assets, end of period (000s omitted) | | $ | 5,772 | | $ | 5,067 | | $ | 1,952 | | $ | 204 | | $ | 10 | |
| Ratio of expenses to average net assets | | | 1.83 | % | | 1.77 | % | | 1.77 | % | | 1.77 | % | | 1.72 | %† |
| Ratio of net investment income to average net assets | | | 3.06 | % | | 3.33 | % | | 3.52 | % | | 3.93 | % | | 3.80 | %† |
| Portfolio turnover rate | | | 1.43 | % | | 6.40 | % | | 19.83 | % | | 1.33 | % | | 20.24 | %†† |
See footnotes on page 41.
34
Financial Highlights
California Quality Series | | | |
Class D | | | |
| |
| | Year Ended September 30, | |
| | |
| |
| | | | 2003 | | | 2002ø | | | 2001 | | | 2000 | | | 1999 | |
| |
| Per Share Data: | | | | | | | | | | | | | | | | |
| |
| Net Asset Value, Beginning of Year | | $ | 7.01 | | $ | 6.88 | | $ | 6.51 | | $ | 6.40 | | $ | 7.19 | |
| |
| Income from Investment Operations: | | | | | | | | | | | | | | | | |
| Net investment income | | | 0.21 | | | 0.23 | | | 0.24 | | | 0.25 | | | 0.25 | |
| Net realized and unrealized gain (loss) on investments | | | (0.16 | ) | | 0.18 | | | 0.39 | | | 0.18 | | | (0.56 | ) |
| |
| Total from Investment Operations | | | 0.05 | | | 0.41 | | | 0.63 | | | 0.43 | | | (0.31 | ) |
| |
| Less Distributions: | | | | | | | | | | | | | | | | |
| Dividends from net investment income | | | (0.21 | ) | | (0.22 | ) | | (0.24 | ) | | (0.25 | ) | | (0.25 | ) |
| Distributions from net realized capital gain | | | — | | | (0.06 | ) | | (0.02 | ) | | (0.07 | ) | | (0.23 | ) |
| |
| Total Distributions | | | (0.21 | ) | | (0.28 | ) | | (0.26 | ) | | (0.32 | ) | | (0.48 | ) |
| |
| Net Asset Value, End of Year | | $ | 6.85 | | $ | 7.01 | | $ | 6.88 | | $ | 6.51 | | $ | 6.40 | |
| |
| Total Return: | | | 0.72 | % | | 6.20 | % | | 9.81 | % | | 7.00 | % | | (4.58) | % |
| |
| Ratios/Supplemental Data: | | | | | | | | | | | | | | | | |
| |
| Net assets, end of year (000s omitted) | | $ | 1,512 | | $ | 1,956 | | $ | 3,344 | | $ | 3,666 | | $ | 4,286 | |
| Ratio of expenses to average net assets | | | 1.83 | % | | 1.77 | % | | 1.77 | % | | 1.77 | % | | 1.72 | % |
| Ratio of net investment income to average net assets | | | 3.06 | % | | 3.33 | % | | 3.52 | % | | 3.93 | % | | 3.66 | % |
| Portfolio turnover rate | | | 1.43 | % | | 6.40 | % | | 19.83 | % | | 1.33 | % | | 20.24 | % |
_____________
See footnotes on page 41.
35
Financial Highlights
| Class A |
| |
| | | Year Ended September 30, | |
| | |
| |
| | | | 2003 | | | 2002ø | | | 2001 | | | 2000 | | | 1999 | |
| |
| Per Share Data: | | | | | | | | | | | | | | | | |
| |
| Net Asset Value, Beginning of Year | | $ | 8.08 | | $ | 7.88 | | $ | 7.48 | | $ | 7.41 | | $ | 8.07 | |
| |
| Income from Investment Operations: | | | | | | | | | | | | | | | | |
| Net investment income | | | 0.32 | | | 0.34 | | | 0.36 | | | 0.37 | | | 0.34 | |
| Net realized and unrealized gain (loss) on investments | | | 0.01 | | | 0.20 | | | 0.43 | | | 0.11 | | | (0.61 | ) |
| |
| Total from Investment Operations | | | 0.33 | | | 0.54 | | | 0.79 | | | 0.48 | | | (0.27 | ) |
| |
| Less Distributions: | | | | | | | | | | | | | | | | |
| Dividends from net investment income | | | (0.32 | ) | | (0.34 | ) | | (0.36 | ) | | (0.37 | ) | | (0.34 | ) |
| Distributions from net realized capital gain | | | (0.01 | ) | | — | | | (0.03 | ) | | (0.04 | ) | | (0.05 | ) |
| |
| Total Distributions | | | (0.33 | ) | | (0.34 | ) | | (0.39 | ) | | (0.41 | ) | | (0.39 | ) |
| |
| Net Asset Value, End of Year | | $ | 8.08 | | $ | 8.08 | | $ | 7.88 | | $ | 7.48 | | $ | 7.41 | |
| |
| Total Return: | | | 4.16 | % | | 7.08 | % | | 10.78 | % | | 6.78 | % | | (3.42) | % |
| |
| Ratios/Supplemental Data: | | | | | | | | | | | | | | | | |
| |
| Net assets, end of year (000s omitted) | | $ | 34,131 | | $ | 37,513 | | $ | 36,695 | | $ | 34,949 | | $ | 37,606 | |
| Ratio of expenses to average net assets | | | 1.00 | % | | 0.94 | % | | 0.70 | % | | 0.72 | % | | 1.03 | % |
| Ratio of net investment income to average net assets | | | 3.98 | % | | 4.37 | % | | 4.70 | % | | 5.08 | % | | 4.38 | % |
| Portfolio turnover rate | | | 12.51 | % | | 10.19 | % | | 9.57 | % | | 12.68 | % | | 18.31 | % |
| Without management fee waiver:** | | | | | | | | | | | | | | | | |
| Ratio of expenses to average net assets | | | 1.15 | % | | 1.09 | % | | 1.08 | % | | 1.09 | % | | | |
| Ratio of net investment income to average net assets | | | 3.83 | % | | 4.22 | % | | 4.32 | % | | 4.71 | % | | | |
_____________
See footnotes on page 41.
36
Financial Highlights
Florida Series
| Class C |
| |
| | | Year Ended September 30, | | | |
| | |
| | | |
| | | | 2003 | | | 2002ø | | | 2001 | | | 2000 | | | 5/27/99* to 9/30/99 | |
| |
| Per Share Data: |
|
| Net Asset Value, Beginning of Period | | $ | 8.10 | | $ | 7.90 | | $ | 7.50 | | $ | 7.43 | | $ | 7.83 | |
| |
| Income from Investment Operations: | | | | | | | | | | | | | | | | |
| Net investment income | | | 0.26 | | | 0.29 | | | 0.31 | | | 0.32 | | | 0.10 | |
| Net realized and unrealized gain (loss) on investments | | | — | | | 0.19 | | | 0.43 | | | 0.11 | | | (0.40 | ) |
| |
| Total from Investment Operations | | | 0.26 | | | 0.48 | | | 0.74 | | | 0.43 | | | (0.30 | ) |
| |
| Less Distributions: | | | | | | | | | | | | | | | | |
| Dividends from net investment income | | | (0.26 | ) | | (0.28 | ) | | (0.31 | ) | | (0.32 | ) | | (0.10 | ) |
| Distributions from net realized capital gain | | | (0.01 | ) | | — | | | (0.03 | ) | | (0.04 | ) | | — | |
| |
| Total Distributions | | | (0.27 | ) | | (0.28 | ) | | (0.34 | ) | | (0.36 | ) | | (0.10 | ) |
| |
| Net Asset Value, End of Period | | $ | 8.09 | | $ | 8.10 | | $ | 7.90 | | $ | 7.50 | | $ | 7.43 | |
| |
| Total Return: | | | 3.24 | % | | 6.26 | % | | 9.97 | % | | 5.98 | % | | (3.96) | % |
| |
| Ratios/Supplemental Data: | | | | | | | | | | | | | | | | |
| |
| Net assets, end of period (000s omitted) | | $ | 4,686 | | $ | 3,839 | | $ | 2,274 | | $ | 699 | | $ | 254 | |
| Ratio of expenses to average net assets | | | 1.75 | % | | 1.69 | % | | 1.45 | % | | 1.47 | % | | 1.78 | %† |
| Ratio of net investment income to average net assets | | | 3.23 | % | | 3.62 | % | | 3.95 | % | | 4.33 | % | | 3.82 | %† |
| Portfolio turnover rate | | | 12.51 | % | | 10.19 | % | | 9.57 | % | | 12.68 | % | | 18.31 | %†† |
| Without management fee waiver:** | | | | | | | | | | | | | | | | |
| Ratio of expenses to average net assets | | | 1.90 | % | | 1.84 | % | | 1.83 | % | | 1.84 | % | | | |
| Ratio of net investment income to average net assets | | | 3.08 | % | | 3.47 | % | | 3.57 | % | | 3.96 | % | | | |
_____________
See footnotes on page 41.
37
Financial Highlights
Florida Series
Class D
| |
| | | Year Ended September 30, | |
| |
| |
| | | | 2003 | | | 2002ø | | | 2001 | | | 2000 | | | 1999 | |
| |
| Per Share Data: | | | | | | | | | | | | | | | | |
| |
| Net Asset Value, Beginning of Year | | $ | 8.10 | | $ | 7.90 | | $ | 7.50 | | $ | 7.43 | | $ | 8.08 | |
| |
| Income from Investment Operations: | | | | | | | | | | | | | | | | |
| Net investment income | | | 0.26 | | | 0.29 | | | 0.31 | | | 0.32 | | | 0.28 | |
| Net realized and unrealized gain (loss) on investments | | | 0.01 | | | 0.19 | | | 0.43 | | | 0.11 | | | (0.60 | ) |
| |
| Total from Investment Operations | | | 0.27 | | | 0.48 | | | 0.74 | | | 0.43 | | | (0.32 | ) |
| |
| Less Distributions: | | | | | | | | | | | | | | | | |
| Dividends from net investment income | | | (0.26 | ) | | (0.28 | ) | | (0.31 | ) | | (0.32 | ) | | (0.28 | ) |
| Distributions from net realized capital gain | | | (0.01 | ) | | — | | | (0.03 | ) | | (0.04 | ) | | (0.05 | ) |
| |
| Total Distributions | | | (0.27 | ) | | (0.28 | ) | | (0.34 | ) | | (0.36 | ) | | (0.33 | ) |
| |
| Net Asset Value, End of Year | | $ | 8.10 | | $ | 8.10 | | $ | 7.90 | | $ | 7.50 | | $ | 7.43 | |
| |
| Total Return: | | | 3.37 | % | | 6.26 | % | | 9.97 | % | | 5.98 | % | | (4.01) | % |
| |
| Ratios/Supplemental Data: | | | | | | | | | | | | | | | | |
| |
| Net assets, end of year (000s omitted) | | $ | 1,567 | | $ | 1,904 | | $ | 1,811 | | $ | 1,463 | | $ | 1,843 | |
| Ratio of expenses to average net assets | | | 1.75 | % | | 1.69 | % | | 1.45 | % | | 1.47 | % | | 1.78 | % |
| Ratio of net investment income to average net assets | | | 3.23 | % | | 3.62 | % | | 3.95 | % | | 4.33 | % | | 3.63 | % |
| Portfolio turnover rate | | | 12.51 | % | | 10.19 | % | | 9.57 | % | | 12.68 | % | | 18.31 | % |
| Without management fee waiver:** | | | | | | | | | | | | | | | | |
| Ratio of expenses to average net assets | | | 1.90 | % | | 1.84 | % | | 1.83 | % | | 1.84 | % | | | |
| Ratio of net investment income to average net assets | | | 3.08 | % | | 3.47 | % | | 3.57 | % | | 3.96 | % | | | |
_____________
See footnotes on page 41.
38
Financial Highlights
North Carolina Series
| Class A |
| |
| | | Year Ended September 30, | |
| | |
| |
| | | | 2003 | | | 2002ø | | | 2001 | | | 2000 | | | 1999 | |
| |
| Per Share Data: | | | | | | | | | | | | | | | | |
| |
| Net Asset Value, Beginning of Year | | $ | 8.19 | | $ | 7.89 | | $ | 7.54 | | $ | 7.59 | | $ | 8.30 | |
| |
| Income from Investment Operations: | | | | | | | | | | | | | | | | |
| Net investment income | | | 0.29 | | | 0.32 | | | 0.33 | | | 0.34 | | | 0.35 | |
| Net realized and unrealized gain (loss) on investments | | | (0.01 | ) | | 0.31 | | | 0.37 | | | 0.05 | | | (0.59 | ) |
| |
| Total from Investment Operations | | | 0.28 | | | 0.63 | | | 0.70 | | | 0.39 | | | (0.24 | ) |
| |
| Less Distributions: | | | | | | | | | | | | | | | | |
| Dividends from net investment income | | | (0.29 | ) | | (0.32 | ) | | (0.33 | ) | | (0.34 | ) | | (0.35 | ) |
| Distributions from net realized capital gain | | | (0.04 | ) | | (0.01 | ) | | (0.02 | ) | | (0.10 | ) | | (0.12 | ) |
| |
| Total Distributions | | | (0.33 | ) | | (0.33 | ) | | (0.35 | ) | | (0.44 | ) | | (0.47 | ) |
| |
| Net Asset Value, End of Year | | $ | 8.14 | | $ | 8.19 | | $ | 7.89 | | $ | 7.54 | | $ | 7.59 | |
| |
| Total Return: | | | 3.51 | % | | 8.21 | % | | 9.52 | % | | 5.36 | % | | (3.07) | % |
| |
| Ratios/Supplemental Data: | | | | | | | | | | | | | | | | |
| |
| Net assets, end of year (000s omitted) | | $ | 22,778 | | $ | 25,386 | | $ | 25,737 | | $ | 24,987 | | $ | 27,224 | |
| Ratio of expenses to average net assets | | | 1.19 | % | | 1.11 | % | | 1.13 | % | | 1.13 | % | | 1.06 | % |
| Ratio of net investment income to average net assets | | | 3.65 | % | | 4.11 | % | | 4.29 | % | | 4.63 | % | | 4.38 | % |
| Portfolio turnover rate | | | 10.00 | % | | 7.96 | % | | 5.61 | % | | 11.96 | % | | 1.52 | % |
_____________
See footnotes on page 41.
39
Financial Highlights
North Carolina Series
| Class C |
| |
| | | Year Ended September 30, | | | |
| | |
| | | |
| | | | 2003 | | | 2002ø | | | 2001 | | | 2000 | | | 5/27/99* to 9/30/99 | |
| |
| Per Share Data: | | | | | | | | | | | | | | | | |
| |
| Net Asset Value, Beginning of Period | | $ | 8.18 | | $ | 7.88 | | $ | 7.54 | | $ | 7.59 | | $ | 7.97 | |
| |
| Income from Investment Operations: | | | | | | | | | | | | | | | | |
| Net investment income | | | 0.23 | | | 0.27 | | | 0.27 | | | 0.29 | | | 0.10 | |
| Net realized and unrealized gain (loss) on investments | | | (0.01 | ) | | 0.30 | | | 0.36 | | | 0.05 | | | (0.38 | ) |
| |
| Total from Investment Operations | | | 0.22 | | | 0.57 | | | 0.63 | | | 0.34 | | | (0.28 | ) |
| |
| Less Distributions: | | | | | | | | | | | | | | | | |
| Dividends from net investment income | | | (0.23 | ) | | (0.26 | ) | | (0.27 | ) | | (0.29 | ) | | (0.10 | ) |
| Distributions from net realized capital gain | | | (0.04 | ) | | (0.01 | ) | | (0.02 | ) | | (0.10 | ) | | — | |
| |
| Total Distributions | | | (0.27 | ) | | (0.27 | ) | | (0.29 | ) | | (0.39 | ) | | (0.10 | ) |
| |
| Net Asset Value, End of Period | | $ | 8.13 | | $ | 8.18 | | $ | 7.88 | | $ | 7.54 | | $ | 7.59 | |
| |
| Total Return: | | | 2.74 | % | | 7.41 | % | | 8.59 | % | | 4.58 | % | | (3.62) | % |
| |
| Ratios/Supplemental Data: | | | | | | | | | | | | | | | | |
| |
| Net Assets, end of period (000s omitted) | | $ | 2,778 | | $ | 2,962 | | $ | 2,049 | | $ | 544 | | $ | 10 | |
| Ratio of expenses to average net assets | | | 1.94 | % | | 1.86 | % | | 1.88 | % | | 1.88 | % | | 1.80 | %† |
| Ratio of net investment income to average net assets | | | 2.90 | % | | 3.36 | % | | 3.54 | % | | 3.88 | % | | 3.77 | %† |
| Portfolio turnover rate | | | 10.00 | % | | 7.96 | % | | 5.61 | % | | 11.96 | % | | 1.52 | %†† |
_____________
See footnotes on page 41.
40
Financial Highlights
North Carolina Series
| Class D |
| |
| | | Year Ended September 30, | |
| | |
| |
| | | | 2003 | | | 2002ø | | | 2001 | | | 2000 | | | 1999 | |
| |
| Per Share Data: | | | | | | | | | | | | | | | | |
| |
| Net Asset Value, Beginning of Year | | $ | 8.18 | | $ | 7.88 | | $ | 7.54 | | $ | 7.59 | | $ | 8.30 | |
| |
| Income from Investment Operations: | | | | | | | | | | | | | | | | |
| Net investment income | | | 0.23 | | | 0.27 | | | 0.27 | | | 0.29 | | | 0.29 | |
| Net realized and unrealized gain (loss) on investments | | | (0.01 | ) | | 0.30 | | | 0.36 | | | 0.05 | | | (0.59 | ) |
| |
| Total from Investment Operations | | | 0.22 | | | 0.57 | | | 0.63 | | | 0.34 | | | (0.30 | ) |
| |
| Less Distributions: | | | | | | | | | | | | | | | | |
| Dividends from net investment income | | | (0.23 | ) | | (0.26 | ) | | (0.27 | ) | | (0.29 | ) | | (0.29 | ) |
| Distributions from net realized capital gain | | | (0.04 | ) | | (0.01 | ) | | (0.02 | ) | | (0.10 | ) | | (0.12 | ) |
| |
| Total Distributions | | | (0.27 | ) | | (0.27 | ) | | (0.29 | ) | | (0.39 | ) | | (0.41 | ) |
| |
| Net Asset Value, End of Year | | $ | 8.13 | | $ | 8.18 | | $ | 7.88 | | $ | 7.54 | | $ | 7.59 | |
| |
| Total Return: | | | 2.74 | % | | 7.41 | % | | 8.59 | % | | 4.58 | % | | (3.79) | % |
| |
| Ratios/Supplemental Data: | | | | | | | | | | | | | | | | |
| |
| Net assets, end of year (000s omitted) | | $ | 824 | | $ | 941 | | $ | 1,514 | | $ | 1,250 | | $ | 1,682 | |
| Ratio of expenses to average net assets | | | 1.94 | % | | 1.86 | % | | 1.88 | % | | 1.88 | % | | 1.81 | % |
| Ratio of net investment income to average net assets | | | 2.90 | % | | 3.36 | % | | 3.54 | % | | 3.88 | % | | 3.63 | % |
| Portfolio turnover rate | | | 10.00 | % | | 7.96 | % | | 5.61 | % | | 11.96 | % | | 1.52 | % |
_____________
* | | Commencement of offering of Class C shares. |
** | | During the periods stated, the Manager, at its discretion, waived portions of its management fees for California High-Yield Series and Florida Series (Note 4). |
† | | Annualized. |
†† | | For the year ended September 30, 1999. |
ø | | As required, effective October 1, 2001, the Trust adopted the provisions of the AICPA Audit and Accounting Guide for Investment Companies and began amortizing market discounts on portfolio securities for financial reporting purposes. The effect of this change, for the year ended September 30, 2002, was to increase net investment income and decrease net realized and unrealized gain on investments per share by less than $0.01 for each share class of each Series and to increase the ratio of net investment income to average net assets of each share class of the California High-Yield and Florida Series by 0.04% and each share class of the California Quality and North Carolina Series by 0.05%. The per share data and ratios for periods prior to October 1, 2001, have not been restated. |
See Notes to Financial Statements.
41
Report of Independent Auditors
The Trustees and Shareholders
Seligman Municipal Series Trust:
We have audited the accompanying statements of assets and liabilities, including the portfolios of investments, of Seligman Municipal Series Trust (the "Trust" comprising, respectively, the California High-Yield, California Quality, Florida, and North Carolina Series) as of September 30, 2003, and the related statements of operations for the year then ended, the statements of changes in net assets for each of the two years in the period then ended, and the financial highlights for each of the periods presented. These financial statements and financial highlights are the responsibility of the Trust’s management. Our responsibility is to express an opinion on these financial statements and financial highlights based on our audits.
We conducted our audits in accordance with auditing standards generally accepted in the United States of America. Those standards require that we plan and perform the audit to obtain reasonable assurance about whether the financial statements and financial highlights are free of material misstatement. An audit includes examining, on a test basis, evidence supporting the amounts and disclosures in the financial statements. Our procedures included confirmation of securities owned as of September 30, 2003, by correspondence with the Trust’s custodian. An audit also includes assessing the accounting principles used and significant estimates made by management, as well as evaluating the overall financial statement presentation. We believe that our audits provide a reasonable basis for our opinion.
In our opinion, the financial statements and financial highlights referred to above present fairly, in all material respects, the financial position of each of the respective Series constituting the Seligman Municipal Series Trust as of September 30, 2003, the results of their operations for the year then ended, the changes in their net assets for each of the two years in the period then ended, and the financial highlights for the respective stated periods, in conformity with accounting principles generally accepted in the United States of America.
DELOITTE & TOUCHE LLP
New York, New York
November 14, 2003
42
Information pertaining to the Trustees and Officers of Seligman Pennsylvania Municipal Fund Series is set forth below.
Independent Trustees
Name, (Age), Position(s) held with Fund ø | | Principal Occupation(s) During Past Five Years, Directorships and Other Information |
|
Robert B. Catell (67) 3,4 | | Chairman and Chief Executive Officer of KeySpan Corporation (diversified energy, gas and electric company); Director or Trustee of each of the investment companies of the Seligman Group of Funds † (except Seligman Cash Management Fund, Inc.); Director, Alberta Northeast Gas, Ltd., Boundary Gas Inc., Taylor Gas Liquids, Ltd., and The Houston Exploration Company (oil and gas exploration, development and production companies); Edison Electric Institute, New York State Energy Research and Development Authority, Independence Community Bank, Business Council of New York State, Inc., New York City Partnership, and the Long Island Association (business and civic organizations). |
|
John R. Galvin (74) 2,4 | | Dean Emeritus, Fletcher School of Law and Diplomacy at Tufts University; Director or Trustee of each of the investment companies of the Seligman Group of Funds † ; and Chairman Emeritus, American Council on Germany. Formerly, Governor of the Center for Creative Leadership; Director, Raytheon Co. (defense and commercial electronics) and USLIFE Corporation (life insurance), and a Trustee of the Institute for Defense Analysis. From June 1987 to June 1992, Mr. Galvin was the Supreme Allied Commander, Europe and the Commander-in-Chief, United States European Command. |
|
Alice S. Ilchman (68) 3,4 | | President Emerita, Sarah Lawrence College; Director or Trustee of each of the investment companies of the Seligman Group of Funds † ; Trustee, Save the Children (non-profit child-assistance organization) and the Committee for Economic Development; a Governor of the Court of Governors, London School of Economics; and Director, Public Broadcasting Service (PBS). Formerly, Chairman, The Rockefeller Foundation (charitable foundation) and Director, New York Telephone Company and Jeannette K.Watson Summer Fellowsh ips (summer intern ships for college students). |
|
Frank A. McPherson (70) 3,4 | | Retired Chairman of the Board and Chief Executive Officer of Kerr-McGee Corporation (diversified energy company); Director or Trustee of each of the investment companies of the Seligman Group of Funds † ; Director, ConocoPhillips (oil and gas exploration and production); Integris Health (owner of various hospitals); BOK Financial (bank holding company); Oklahoma Chapter of the Nature Conservancy; Oklahoma Medical Research Foundation; Boys and Girls Clubs of Oklahoma; Oklahoma City Public Schools Foundation and Oklahoma Foundation for Excellence in Education. Formerly, Director, Kimberly-Clark Corporation (consumer products) and Director of the Federal Reserve System’s Kansas City Reserve Bank. |
|
| | | |
See footnotes on page 46.
Trustees and Officers of the Trust
Information pertaining to the Trustees and Officers of Seligman Pennsylvania Municipal Fund Series is set forth below.
Independent Trustees
Name, (Age), Position(s) held with Fund ø | | Principal Occupation(s) During Past Five Years, Directorships and Other Information |
|
John E. Merow (73) 2,4 | | Retired Chairman and Senior Partner, Sullivan & Cromwell LLP (law firm); Director or Trustee of each of the investment companies of the Seligman Group of Funds † ; Director, Commonwealth Industries, Inc. (manufacturers of aluminum sheet products); Director and Treasurer, the Foreign Policy Association; Director Emeritus, Municipal Art Society of New York; Trustee and Secretary, the U.S. Council for International Business; Trustee and Vice Chairman, New York-Presbyterian Healthcare System, Inc.; Trustee, New York-Presbyterian Hospital; and Member of the American Law Institute and Council on Foreign Relations. |
|
Betsy S. Michel (61) 2,4 | | Attorney; Director or Trustee of each of the investment companies of the Seligman Group of Funds † ; Trustee, The Geraldine R. Dodge Foundation (charitable foundation) and World Learning, Inc. (international education and training). Formerly, Chairman of the Board of Trustees of St. George’s School (Newport, RI). |
|
Leroy C. Richie (62) 2,4 | | Chairman and Chief Executive Officer, Q Standards Worldwide, Inc.(library of technical standards); Director or Trustee of each of the investment companies of the Seligman Group of Funds (except Seligman Cash Management Fund, Inc.) † ; Director, Kerr-McGee Corporation (diversified energy company) and Infinity, Inc.(oil and gas services and exploration); Director and Chairman, Highland Park Michigan Economic Development Corp. Formerly, Trustee, New York University Law Center Foundation; Vice Chairman, Detroit Medical Center and the Detroit Economic Growth Corp. ; and Chairman and Chief Executive Officer, Capital Coating Technologies, Inc.(applied coating technologies); and Vice President and General Counsel, Automotive Legal Affairs, of Chrysler Corporation. |
|
Robert L. Shafer (71) 3,4 | | Retired Vice President, Pfizer Inc.(pharmaceuticals); Director or Trustee of each of the investment companies of the Seligman Group of Funds † . Formerly, Director, USLIFE Corporation (life insurance). |
|
James N. Whitson (68) 2,4 | | Retired Executive Vice President and Chief Operating Officer, Sammons Enterprises, Inc.(a diversified holding company); Director or Trustee of each of the investment companies of the Seligman Group of Funds † ; Director, C-SPAN (cable television network) and CommScope, Inc.(manufacturer of coaxial cable). Formerly, Director and Consultant, Sammons Enterprises, Inc. |
|
| |
See footnotes on page 46.
Trustees and Officers of the Trust
Information pertaining to the Trustees and Officers of Seligman Pennsylvania Municipal Fund Series is set forth below.
Interested Trustees and Principal Officers
| Name, (Age), Position(s) held with Fund ø | | Principal Occupation(s) During Past Five Years, Directorships and Other Information |
|
William C. Morris (65) * 1 | | Chairman, J. & W. Seligman & Co. Incorporated, Chairman of the Board and Director or Trustee of each of the investment companies of the Seligman Group of Funds † ; Chairman, Seligman Advisors, Inc., Seligman Services, Inc., and Carbo Ceramics Inc. (ceramic proppants for oil and gas industry); and Director, Seligman Data Corp. Formerly, Director, Kerr-McGee Corporation (diversified energy company) and Chief Executive Officer of each of the investment companies of the Seligman Group of Funds. |
|
Brian T. Zino (51) * 1 | | Director and President, J. & W. Seligman & Co. Incorporated; Chief Executive Officer, President and Director or Trustee of each of the investment companies of the Seligman Group of Funds † ; Director, Seligman Advisors, Inc. and Seligman Services, Inc.; Chairman, Seligman Data Corp.; Member of the Board of Governors of the Investment Company Institute; and Chairman, ICI Mutual Insurance Company. |
|
Paul C. Guidone (45) * 1 | | Managing Director and Chief Investment Officer, J. & W. Seligman & Co. Incorporated; Director or Trustee of each of the investment companies of the Seligman Group of Funds (except Seligman Cash Management Fund, Inc.) † ; Member of the Association of Investment Management and Research, the New York Society of Security Analysts and the London Society of Investment Professionals.Formerly, Deputy Chairman and Group Chief Executive Officer, HSBC Asset Management; and Managing Director and Chief Investment Officer, Prudential Diversified Investments. |
|
Thomas G. Moles (61) | | Director and Managing Director, J. & W. Seligman & Co. Incorporated; Vice President and Co-Portfolio Manager, Seligman Municipal Fund Series, Inc., Seligman New Jersey Municipal Fund, Inc. and Seligman Pennsylvania Municipal Fund Series; Executive Vice President and Co-Portfolio Manager, Seligman Quality Municipal Fund, Inc. and Seligman Select Municipal Fund, Inc., closed-end investment companies; and Director, Seligman Advisors, Inc. and Seligman Services, Inc. |
|
Eileen A. Comerford (45) | | Senior Vice President and Investment Officer, J. & W. Seligman & Co. Incorporated; Vice President and Co-Portfolio Manager, Seligman Municipal Fund Series, Inc., Seligman Municipal Series Trust, Seligman New Jersey Municipal Fund, Inc., Seligman Pennsylvania Municipal Fund Series, Seligman Quality Municipal Fund, Inc. and Seligman Select Municipal Fund, Inc. |
|
| | | |
See footnotes on page 46.
Trustees and Officers of the Trust
Information pertaining to the Trustees and Officers of Seligman Pennsylvania Municipal Fund Series is set forth below.
Interested Trustees and Principal Officers
Name, (Age), Position(s) held with Fund ø | | Principal Occupation(s) During Past Five Years, Directorships and Other Information |
|
Thomas G. Rose (45) | | Senior Vice President, Finance, J. & W. Seligman & Co. Incorporated, Seligman Advisors, Inc., and Seligman Data Corp.; Vice President of each of the investment companies of the Seligman Group of Funds †, Seligman Services, Inc. and Seligman International, Inc. Formerly, Treasurer of each of the investment companies of the Seligman Group of Funds and Seligman Data Corp. |
|
Lawrence P. Vogel (47) | | Senior Vice President and Treasurer, Investment Companies, J. & W. Seligman & Co. Incorporated; Vice President and Treasurer of each of the investment companies of the Seligman Group of Funds † ; Treasurer, Seligman Data Corp. Formerly, Senior Vice President, Finance, J. & W. Seligman & Co. Incorporated, Seligman Advisors, Inc. and Seligman Data Corp.; Vice President, Seligman Services, Inc. and Vice President and Treasurer, Seligman International, Inc. and Treasurer, Seligman Henderson Co. |
|
Frank J. Nasta (38) | | Managing Director, General Counsel and Corporate Secretary, J. & W. Seligman & Co. Incorporated; Secretary of each of the investment companies of the Seligman Group of Funds † , Seligman Advisors, Inc., Seligman Services, Inc., Seligman International, Inc. and Seligman Data Corp. Formerly, Senior Vice President, Law and Regulation, J. & W. Seligman & Co. Incorporated, and Corporate Secretary, Seligman Henderson Co. |
|
The Trust’s Statement of Additional Information (SAI) includes additional information about the trustees and is available, without charge, upon request. You may call toll-free (800) 221-2450 in the US or collect (212) 682-7600 outside the US to request a copy of the SAI, to request other information about the Trust, or to make shareholder inquiries.
Ø | | The address for each of the Trustees and officers is 100 Park Avenue, 8th floor, New York, NY 10017. Each Trustee serves for an indefinite term, until the election and qualification of a successor or until his or her earlier death, resignation or removal. Each officer is elected annually by the Trustees. |
| | | |
| | The Seligman Group of Funds consists of 23 registered investment companies. |
| | | |
| * | | Mr. Morris, Mr. Zino, and Mr. Guidone are considered "interested persons" of the Fund, as defined in the Investment Company Act of 1940, as amended, by virtue of their positions with J. & W. Seligman & Co. Incorporated and its affiliates. |
| Member: | | 1 Executive Committee |
| | | 2 Audit Committee |
| | | 3 Trustee Nominating Committee |
| | | 4 Board Operations Committee |
Capital Gain Distribution — A payment to mutual fund shareholders of profits realized on the sale of securities in a fund’s portfolio.
Capital Appreciation/Depreciation — An increase or decrease in the market value of a mutual fund’s portfolio securities, which is reflected in the net asset value of the fund’s shares. Capital appreciation/depreciation of an individual security is in relation to the original purchase price.
Compounding — The change in the value of an investment as shareholders receive earnings on their investment’s earnings. For example, if $1,000 is invested at a fixed rate of 7% a year, the initial investment is worth $1,070 after one year. If the return is compounded, second year earnings will not be based on the original $1,000, but on the $1,070, which includes the first year’s earnings.
Expense Ratio — The cost of doing business for a mutual fund, expressed as a percent of the fund’s net assets.
Investment Objective — The shared investment goal of a fund and its shareholders.
Management Fee — The amount paid by a mutual fund to its investment advisor(s).
Multiple Classes of Shares — Although an individual mutual fund invests in only one portfolio of securities, it may offer investors several purchase options which are "classes" of shares. Multiple classes permit shareholders to choose the fee structure that best meets their needs and goals. Generally, each class will differ in terms of how and when sales charges and certain fees are assessed.
National Association of Securities Dealers, Inc. (NASD) — A self-regulatory body with authority over firms that distribute mutual funds.
Net Asset Value (NAV) Per Share — The market worth of one fund share, obtained by adding a mutual fund’s total assets (securities, cash, and any accrued earnings), subtracting liabilities, and dividing the resulting net assets by the number of shares outstanding.
Offering Price — The price at which a mutual fund’s share can be purchased. The offering price per share is the current net asset value plus any sales charge.
Contingent Deferred Sales Charge (CDSC) — Depending on the class of shares owned, a fee charged by a mutual fund when shares are sold back to the fund. The CDSC expires after a fixed time period.
Dividend — A payment by a mutual fund, usually derived from the fund’s net investment income (dividends and interest less expenses).
Dividend Yield — A measurement of a fund’s dividend as a percentage of the maximum offering price or net asset value.
47
Glossary of Financial Terms
Portfolio Turnover — A measure of the trading activity in a mutual fund’s investment portfolio that reflects how often securities are bought and sold.
Prospectus — The legal document describing a mutual fund to all prospective shareholders. It contains information required by the Securities and Exchange Commission (SEC), such as a fund’s investment objective and policies, services, investment restrictions, how shares are bought and sold, fund fees and other charges, and the fund’s financial highlights.
SEC Yield — SEC Yield refers to the net income earned by a fund during a recent 30 day period. This income is annualized and then divided by the maximum offering price per share on the last day of the 30-day period. The SEC Yield formula reflects semiannual compounding.
Securities and Exchange Commission — The primary US federal agency that regulates the registration and distribution of mutual fund shares.
Statement of Additional Information — A document that contains more detailed information about an investment company and that supplements the prospectus. It is available at no charge upon request.
Total Return — A measure of a fund’s performance encompassing all elements of return. Reflects the change in share price over a given period and assumes all distributions are taken in additional fund shares. The Average Annual Total Return represents the average annual compounded rate of return for the periods presented.
Wash Sale — A sale of securities in which a taxpayer has acquired substantially identical securities within a period beginning thirty days before and ending thirty days after the date of the sale (a sixty-one day period). A loss resulting from such a sale is not currently deductible for federal income tax purposes, but a gain is taxable.
Yield on Securities — For bonds, the current yield is the coupon rate of interest, divided by the purchase price. For stocks, the yield is measured by dividing dividends paid by the market price of the stock.
___________
Adapted from the Investment Company Institute’s 2002 Mutual Fund Fact Book and the AICPA Audit and Accounting Guide: Audits of Investment Companies dated May 1, 2001.
48
[This Page Left Blank Intentionally]
J. & W. Seligman & Co. Incorporated
100 Park Avenue • New York, NY 10017
www.seligman.com
General Distributor
Seligman Advisors, Inc.
100 Park Avenue • New York, NY 10017
Shareholder Service Agent
Seligman Data Corp.
100 Park Avenue • New York, NY 10017
www.seligman.com
(on-line account information available)
General Counsel
Sullivan & Cromwell LLP
Independent Auditors
Deloitte &Touche LLP
For More Information
Important Telephone Numbers
(800) 221-2450 Shareholder Services
(212) 682-7600 Outside the United States
(800) 622-4597 24-Hour Automated Telephone Access Service
This report is intended only for the information of shareholders or those who have received the offering prospectus covering shares of Beneficial Interest of each Series of Seligman Municipal Series Trust, which contains information about the sales charges, management fee, and other costs. Please read the prospectus carefully before investing or sending money.
ITEM 2. CODE OF ETHICS.
As of September 30, 2003, the registrant has adopted a code of ethics that applies to its principal executive and principal financial officers.
ITEM 3. AUDIT COMMITTEE FINANCIAL EXPERT.
The registrant’s board of trustees has determined that Mr. James N. Whitson, a member of its audit committee, is an audit committee financial expert. Mr. Whitson is "independent" as such term is defined in Form N-CSR.
ITEM 4. PRINCIPAL ACCOUNTANT FEES AND SERVICES.
Not applicable.
ITEM 5. AUDIT COMMITTEE OF LISTED REGISTRANTS.
Not applicable.
ITEM 6. [RESERVED]
ITEM 7. DISCLOSURE OF PROXY VOTING POLICIES AND PROCEDURES FOR CLOSED-END MANAGEMENT INVESTMENT COMPANIES.
Not applicable.
ITEM 8. [RESERVED]
ITEM 9. CONTROLS AND PROCEDURES.
(a) The registrant's principal executive officer and principal financial officer have concluded, based upon their evaluation of the registrant's disclosure controls and procedures as conducted within 90 days of the filing date of this report, that these disclosure controls and procedures provide reasonable assurance that material information required to be disclosed by the registrant in the report it files or submits on Form N-CSR is recorded, processed, summarized and reported, within the time periods specified in the Commission's rules and forms and that such material information is accumulated and communicated to the registrant's management, including its pri ncipal executive officer and principal financial officer, as appropriate, in order to allow timely decisions regarding required disclosure.
(b) The registrant’s principal executive officer and principal financial officer are aware of no changes in the registrant’s internal control over financial reporting that occurred during the registrant’s most recent fiscal half-year that has materially affected, or is reasonably likely to materially affect, the registrant’s internal control over financial reporting.
ITEM 10. EXHIBITS.
(a)(1) Code of Ethics for Principal Executive and Principal Financial Officers.
(a)(2) Certifications of principal executive officer and principal financial officer as required by Rule 30a-2(a) under the Investment Company Act of 1940.
(b) Certifications of principal executive officer and principal financial officer as required by Rule 30a-2(b) under the Investment Company Act of 1940.
SIGNATURES
Pursuant to the requirements of the Securities Exchange Act of 1934 and the Investment Company Act of 1940, the registrant has duly caused this report to be signed on its behalf by the undersigned, thereunto duly authorized.
SELIGMAN MUNICIPAL SERIES TRUST
By: /S/ BRIAN T. ZINO
Brian T. Zino
President and Chief Executive Officer
Date: December 2, 2003
Pursuant to the requirements of the Securities Exchange Act of 1934 and the Investment Company Act of 1940, this report has been signed below by the following persons on behalf of the registrant in the capacities and on the dates indicated.
By: /S/ BRIAN T. ZINO
Brian T. Zino
President and Chief Executive Officer
Date: December 2, 2003
By: /S/ LAWRENCE P. VOGEL
Lawrence P. Vogel
Vice President, Treasurer and Chief Financial Officer
Date: December 2, 2003
SELIGMAN MUNICIPAL SERIES TRUST
EXHIBIT INDEX:
Item 10(a)(1) Code of Ethics for Principal Executive and Principal Financial Officers.
Item 10(a)(2) Certifications of principal executive officer and principal financial officer as required by Rule 30a-2(a) under the Investment Company Act of 1940.
Item 10(b) Certification of chief executive officer and chief financial officer as required by Rule 30a-2(b) of the Investment Company Act of 1940.