May, 2016
Dear Fellow Shareholder:
For nearly three decades we have sought to give you as comprehensive a picture of your Fund as possible by highlighting, in each report letter, a topic we believe you will find of interest.
This year’s focus will be upon benefits not only to you, as individual shareholders, but also to the overall quality of life in Hawaii – infrastructure development and enhancement.
More than likely, when you decided to invest in Hawaiian Tax-Free Trust, you were seeking double tax-free income and capital preservation - the two components of your Fund’s investment objective.
The benefit you may not have considered -- when you invested in the Fund --was that Hawaiian Tax-Free Trust would not only provide you with tax-free income, but it would also provide benefits to others within your community and throughout Hawaii. These broader benefits are derived from the fact that municipal bonds, such as those in which your Fund invests, serve as the primary source of funding for our infrastructure.
While infrastructure is a relatively vague term, it is, in fact, vital to our economy. Infrastructure comprises the fundamental structures, systems and facilities that serve our nation and local communities and enable our economy to function smoothly. When you translate the word “infrastructure” into such commonly used words as roads, bridges, water facilities, pollution control, airports, schools, hospitals and fire and police stations, then you begin to more fully appreciate its significance.
We oftentimes take for granted a broad variety of public projects, fully expecting them to be there, day after day and year after year. We never really think about the fact that they might not be available were it not for municipal bond financing.
These projects and facilities are not the kind of items which are expendable or used up in a year or so and which towns and cities put in their yearly operating budgets. Rather, because they are there for the longer-term convenience, economic development and quality of life of the citizens of the community, they are rightfully financed by intermediate to long-term municipal obligations.
Your money invested in Hawaiian Tax-Free Trust goes toward buying those municipal bonds, which in turn finance these long-term facilities and projects from which we all benefit.
NOT A PART OF THE ANNUAL REPORT
Given the criticality of infrastructure to our daily needs and our overall economy, it is important to not only maintain our current infrastructure but to enhance it in anticipation of future population growth. So, for example, by maintaining and enhancing our roadways, we can improve traffic flow and reduce consumption of fuel. Furthermore, by maintaining and enhancing our infrastructure, we can hopefully avoid future crises that could result from decrepit infrastructure.
A number of organizations have commented upon or assessed the state of our nation’s infrastructure. One such group is the American Society of Civil Engineers (“ASCE”), the oldest national engineering society in the U.S.
Every four years, ASCE publishes a comprehensive assessment – a report card – of the nation’s major infrastructure. The most recent 2013 report gives an overall grade of D+. This was a slight improvement over the 2009 overall grade of D, which is defined as poor: at risk, with many elements approaching the end of their service life. The report also provides grades across 16 categories, including roads, bridges, dams, drinking water, wastewater, schools, inland waterways, rail and ports, taking into consideration such factors as capacity, condition, future need and public safety.
Now, some might view this type of report with skepticism. For example, is it really appropriate to rate old infrastructure using current health and safety standards that are significantly different from those that existed when much of our infrastructure was originally built? And, clearly there is the potential for conflicts of interest with a report written by engineers on matters which may impact their livelihood.
At the same time, such reports can be useful in that they may serve as a wake-up call or reminder to us all. Similar reports of note include
| | • | a 60 Minutes report entitled “Falling Apart: America’s Neglected Infrastructure;” |
| | • | Move: Putting America’s Infrastructure Back in the Lead by Rosabeth Moss Kanter of Harvard Business School; |
| | • | The Road Taken: The History and Future of America’s Infrastructure by Duke University’s Henry Petrowski; and, |
| | • | It’s Time for States to Invest in Infrastructure by the Center on Budget and Policy Priorities. |
As the population and economy of Hawaii grow, new and additional municipal projects are needed for the benefit of the citizens of Hawaii and the various communities throughout the state. Without prioritization of infrastructure needs, conditions could very well deteriorate and, ultimately, this could place a drag on our economy.
These projects include a whole array of useful public purpose works and are financed through municipal bond investments, such as your investments in the Fund. In essence, your money has helped pay for that new road, airport, school, etc. that you and your neighbors now depend upon and enjoy.
NOT A PART OF THE ANNUAL REPORT
Just as the needs of Hawaii are many and varied, so, too, are the securities that make up Hawaiian Tax-Free Trust’s portfolio of investments. You might be interested to know that included in the Trust’s March 31, 2016 portfolio were 256 separate municipal issues representing participation in many of Hawaii’s major municipal projects throughout the state. So, as an investor in Hawaiian Tax-Free Trust, you can take pride in knowing that you are playing a vital role and a very real part in maintaining, and enhancing, the quality of life for your family, friends, neighbors and future generations of Hawaiians.
In summary, we are very proud of the fact that Hawaiian Tax-Free Trust has, in our view, not only met its investment objective of providing you with as high a level of tax-free income as is consistent with preservation of capital, but that your Fund has also served thousands of residents and local projects very well over the years through its support of Hawaii’s vital infrastructure.
Sincerely,
Diana P. Herrmann, Vice Chair and President
Any information in this Shareholder Letter regarding market or economic trends or the factors influencing the Trust’s historical or future performance are statements of opinion as of the date of this report. These statements should not be relied upon for any other purposes. Past performance is no guarantee of future results, and there is no guarantee that any market forecasts discussed will be realized.
NOT A PART OF THE ANNUAL REPORT
| Hawaiian Tax-Free Trust ANNUAL REPORT Management Discussion Serving Hawaii investors since 1985
| |
Hawaiian Tax-Free Trust (the “Trust”) had a total return without sales charges of 2.05% for Class A shares, 1.24% for Class C shares, and 2.26% for Class Y shares for the calendar year ending December 31, 2015. For the fiscal year ending March 31, 2016, the total return, without sales charges, was 2.93% for Class A shares, 2.11% for Class C shares, and 3.14% for Class Y shares. The Barclays Capital Quality Intermediate Municipal Bond Index had a total return of 2.71% for the calendar year 2015, and 3.16% for the Trust’s fiscal year. We believe the Trust continues to provide competitive performance while achieving a balance of high tax free income commensurate with principal preservation.
Municipal Market
During a year marked by extreme volatility in the financial markets, the municipal bond market like the Treasury bond market, provided a safe haven for investors. A modestly improving U.S. economy and an unemployment rate close to 5% prompted the Federal Reserve (the “Fed”) to remove its accommodative stance, and raise the Fed Funds rate by 25 basis points (a basis point is equal to 1/100th of 1%, or 0.01%) in December 2015. Further rate hikes were anticipated, however, weak global economic growth and a significant drop in commodity and oil prices kept deflationary concerns alive, sending rates lower in the bond market. In an attempt to stimulate growth, and prevent currency and trade imbalance, the central banks in many countries had to lower interest rates. Japan and Switzerland had to resort to negative interest rates.
The combination of greater investor demand for higher after-tax yields and decreasing inventory of municipal bonds boosted the performance of the municipal bond market. As a result, it was the best performing asset class, outperforming Treasuries. Year over year ending March 31, 2016,1-year AAA rated municipal bond yields increased by 34 basis points (0.25% to 0.59%) compared to 1-year Treasury yields which increased by 31 basis points (0.25% to 0.56%). In contrast, the yield of longer maturity AAA rated municipal bonds declined by 10 to 33 basis points along the curve. Comparable maturity Treasury bond yields only declined 8 to 10 basis points. The yield of AAA rated 30 year municipal bonds declined by 29 basis points, from 2.95% to 2.66% compared to the yield of the 30-year Treasury bond which actually increased by 9 basis points (2.56% to 2.65%).
Hawaii Municipal bond issuance for the year totaled about $3 billion in par amount, a 15% higher volume compared to the previous fiscal year end. The low interest rate environment continued to provide opportunities for issuers to refund existing debt and fund projects at a low interest cost. Hawaii municipal bonds improved in performance reflecting the progress in the State's economy on various fronts. Several Hawaii municipal bond issues saw their ratings upgraded or their outlook improved. This helped the performance of Hawaii Municipal bonds as they now trade at narrower spreads relative to AAA rated bonds.
1 | Hawaiian Tax-Free Trust
MANAGEMENT DISCUSSION (continued)
U.S. Economy
The U.S. economy continued to grow at a modest pace resulting in real gross domestic product (“GDP”) growth of 2% for 2015. Improvement in job growth helped push the unemployment rate to a low of 4.9%. The rate bounced back to 5% as labor growth began outpacing job growth, a sign that the labor force participation rate is improving. This has led to improved earnings and consumer spending which had been lackluster in spite of savings from reduced energy costs. In the housing sector, prices and home sales continued to show improvement as inventory declined. On the manufacturing front, the declining strength of the U.S. dollar coupled with recovery from a steep decline in commodity and oil prices helped to improve activity in U.S. factories. Global economic growth is expected to remain subdued, as China, Japan and the Eurozone continue to struggle in spite of central bank easing to stimulate their respective economies. We expect U.S. economic growth to continue on a modest path. Any further rate increases will , in our view, be dependent on the trajectory of domestic economic growth which will be restrained ultimately by performance in the rest of the world.
Hawaii Economy
Similar to the nation, Hawaii’s economy continued to gain momentum from the previous year and ended 2015 with real GDP growth of 2.0% for the year compared to 1.3% in 2014. Contributing to that were marked improvements in the tourism and construction sectors (both private and public). Labor market improvements, especially in the construction sector, led the unemployment rate to decline to 3.1% in February compared to 3.9%% the previous year. With job growth outpacing labor force growth, real personal income improved by 3.6% for the year. The state’s Council of Revenues has projected continued economic growth in the range of 5% to 6% for the next four fiscal years. The Department of Business and Economic Development and Tourism (DBEDT) projects that real GDP growth will continue to grow around 2.5% for the next few years. With Hawaii's economy being heavily reliant on the U.S. economy and key international economies (Japan, Canada and China), any fallout from external factors, such as concerns over global financial/economic turmoil, could very well disrupt the growth trajectory in the local economy.
Outlook and Strategy
We seek to continue to manage the Trust in a prudent manner to achieve its objectives of providing high tax-free income while preserving principal. We intend to maintain high credit quality in the portfolio to dampen volatility and risk during uncertain times. We also intend to continue to opportunistically seek higher yields to replace maturing and called bonds in this low rate environment.
2 | Hawaiian Tax-Free Trust
Mutual fund investing involves risk and loss of principal is possible.
The market prices of the Fund’s securities may rise or decline in value due to general market conditions, such as real or perceived adverse economic or political conditions, inflation, changes in interest rates, lack of liquidity in the bond markets or adverse investor sentiment. When market prices fall, the value of your investment may go down. In the past several years, financial markets have experienced increased volatility, depressed valuations, decreased liquidity and heightened uncertainty. These conditions may continue, recur, worsen or spread.
The value of your investment may go down when interest rates rise. A rise in interest rates tends to have a greater impact on the prices of longer term securities. Conversely, when interest rates fall, the value of your investment may rise. Interest rates in the U.S. recently have been historically low, so the Fund faces a heightened risk that interest rates may rise. A general rise in interest rates may cause investors to move out of fixed income securities and could result in increased redemptions from the Fund.
Investments in the Fund are subject to possible loss due to the financial failure of the issuers of underlying securities and their inability to meet their debt obligations.
The value of municipal securities can be adversely a ected by changes in the financial condition of one or more individual municipal issuers or insurers of municipal issuers, regulatory developments, legislative actions, and by uncertainties and public perceptions concerning these and other factors. The Fund may be a ected significantly by adverse economic, political or other events a ecting state and other municipal issuers in which it invests, and may be more volatile than a more geographically diverse fund.
If interest rates fall, an issuer may exercise its right to prepay its securities, and the Fund could be forced to reinvest prepayment proceeds at a time when yields on securities available in the market are lower than the yield on the prepaid security.
A portion of income may be subject to local, state, Federal and/or alternative minimum tax. Capital gains, if any, are subject to capital gains tax.
These risks may result in share price volatility.
Past performance is no guarantee of future results, and there is no guarantee that any market forecasts discussed will be realized.
Any information in this Annual Report regarding market or economic trends or the factors influencing the Fund’s historical or future performance are statements of opinion as of the date of this report. These statements should not be relied upon for any other purposes.
3 | Hawaiian Tax-Free Trust
PERFORMANCE REPORT
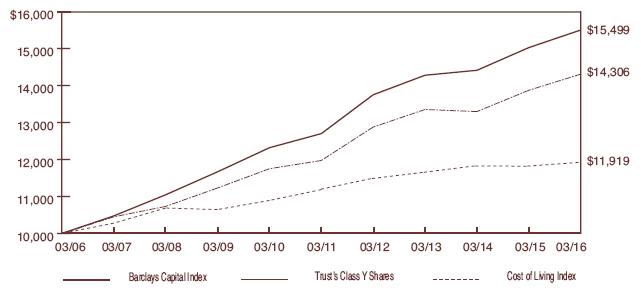
The following graph illustrates the value of $10,000 invested in the Class Y shares of Hawaiian Tax-Free Trust for the 10-year period ended March 31, 2016 as compared with the Barclays Capital Quality Intermediate Municipal Bond Index (the “Barclays Capital Index”) and the Consumer Price Index (a cost of living index). The performance of each of the other classes is not shown in the graph but is included in the table below. It should be noted that the Barclays Capital Index does not include any operating expenses nor sales charges, and being nationally oriented, does not reflect state-specific bond market performance.
| | | Average Annual Total Return | | |
| | | for periods ended March 31, 2016 | | |
| | | | | | | | | | | | Since | | |
| Class and Inception Date | | 1 Year | | | 5 Years | | | 10 Years | | | Inception | | |
| Class A since 2/20/85 | | | | | | | | | | | | | |
| With Maximum Sales Charge | | | (1.19 | )% | | | 2.57 | % | | | 3.02 | % | | | 5.46 | % | |
| Without Sales Charge | | | 2.93 | | | | 3.42 | | | | 3.44 | | | | 5.60 | | |
| | | | | | | | | | | | | | | | | | |
| Class C since 4/01/96 | | | | | | | | | | | | | | | | | |
| With CDSC** | | | 1.09 | | | | 2.60 | | | | 2.62 | | | | 3.25 | | |
| Without CDSC | | | 2.11 | | | | 2.60 | | | | 2.62 | | | | 3.25 | | |
| | | | | | | | | | | | | | | | | | |
| Class Y since 4/01/96 | | | | | | | | | | | | | | | | | |
| No Sales Charge | | | 3.14 | | | | 3.63 | | | | 3.65 | | | | 4.40 | | |
| | | | | | | | | | | | | | | | | | |
| Barclays Capital Index | | | 3.16 | | | | 4.07 | | | | 4.48 | | | 5.26 | * | (Class A) |
| | | | | | | | | | | | | | | 4.41 | | (Class C & Y) |
Total return figures shown for the Trust reflect any change in price and assume all distributions, including capital gains, within the period were invested in additional shares. The returns shown do not reflect the deduction of taxes that a shareholder would pay on Trust distributions or the redemption of Trust Shares. The rates of return will vary and the principal value of an investment will fluctuate with market conditions. Shares, if redeemed, may be worth more or less than their original cost. A portion of each class’s income may be subject to Federal and state income taxes and/or the Federal Alternative Minimum Tax (“AMT”). Past performance is not predictive of future investment results.
* From commencement of the index on 1/1/87.
** CDSC = 1% contingent deferred sales charge imposed on redemptions made withing the first 12 months after purcchase.
4 | Hawaiian Tax-Free Trust
REPORT OF INDEPENDENT REGISTERED PUBLIC ACCOUNTING FIRM
To the Board of Trustees and Shareholders of
Hawaiian Tax-Free Trust:
We have audited the accompanying statement of assets and liabilities, including the schedule of investments, of Hawaiian Tax-Free Trust as of March 31, 2016 and the related statement of operations for the year then ended, the statements of changes in net assets for each of the two years in the period then ended, and the financial highlights for each of the five years in the period then ended. These financial statements and financial highlights are the responsibility of the Trust’s management. Our responsibility is to express an opinion on these financial statements and financial highlights based on our audits.
We conducted our audits in accordance with the standards of the Public Company Accounting Oversight Board (United States). Those standards require that we plan and perform the audit to obtain reasonable assurance about whether the financial statements and financial highlights are free of material misstatement. The Trust is not required to have, nor were we engaged to perform, an audit of the Trust’s internal control over financial reporting. Our audits included consideration of internal control over financial reporting as a basis for designing audit procedures that are appropriate in the circumstances, but not for the purpose of expressing an opinion on the effectiveness of the Trust’s internal control over financial reporting. Accordingly, we express no such opinion. An audit also includes examining, on a test basis, evidence supporting the amounts and disclosures in the financial statements. Our procedures included confirmation of securities owned as of March 31, 2016, by correspondence with the custodian and brokers, or by other appropriate auditing procedures where replies from brokers were not received. An audit also includes assessing the accounting principles used and significant estimates made by management, as well as evaluating the overall financial statement presentation. We believe that our audits provide a reasonable basis for our opinion.
In our opinion, the financial statements and financial highlights referred to above present fairly, in all material respects, the financial position of Hawaiian Tax-Free Trust as of March 31, 2016, the results of its operations for the year then ended, the changes in its net assets for each of the two years in the period then ended, and the financial highlights for each of the five years in the period then ended, in conformity with accounting principles generally accepted in the United States of America.
TAIT, WELLER & BAKER LLP
Philadelphia, Pennsylvania
May 27, 2016
5 | Hawaiian Tax-Free Trust
| HAWAIIAN TAX-FREE TRUST |
| SCHEDULE OF INVESTMENTS |
| MARCH 31, 2016 |
| | | | | Rating | | | |
| | | | | Moody’s, S&P | | | |
| Principal | | | | and Fitch | | | |
| Amount | | General Obligation Bonds (45.4%) | | (unaudited) | | Value | |
| | |
| | | City & County (29.1%) | | | | | |
| | | City and County of Honolulu, Hawaii, | | | | | |
| | | Refunding, Series B | | | | | |
| $ | 5,000,000 | | 5.000%, 12/01/30 | | Aa1/NR/AA+ | | $ | 5,818,250 | |
| | 3,000,000 | | 5.000%, 12/01/33 | | Aa1/NR/AA+ | | | 3,473,310 | |
| | 5,000,000 | | 4.750%, 12/01/35 | | Aa1/NR/AA+ | | | 5,658,150 | |
| | | | City and County of Honolulu, Hawaii, | | | | | | |
| | | | Series A | | | | | | |
| | 2,000,000 | | 5.000%, 10/01/20 | | Aa1/NR/AA+ | | | 2,339,760 | |
| | 2,000,000 | | 5.000%, 10/01/21 | | Aa1/NR/AA+ | | | 2,396,660 | |
| | 2,000,000 | | 5.000%, 10/01/22 | | Aa1/NR/AA+ | | | 2,442,340 | |
| | 2,000,000 | | 5.000%, 10/01/23 | | Aa1/NR/AA+ | | | 2,489,300 | |
| | 5,000,000 | | 5.000%, 10/01/24 | | Aa1/NR/AA+ | | | 6,303,650 | |
| | 5,000,000 | | 5.000%, 10/01/25 | | Aa1/NR/AA+ | | | 6,420,050 | |
| | 5,000,000 | | 5.000%, 10/01/26 | | Aa1/NR/AA+ | | | 6,325,100 | |
| | 2,000,000 | | 5.000%, 11/01/26 | | Aa1/NR/AA+ | | | 2,449,140 | |
| | 5,000,000 | | 5.000%, 11/01/27 | | Aa1/NR/AA+ | | | 6,046,050 | |
| | 5,000,000 | | 5.000%, 11/01/31 | | Aa1/NR/AA+ | | | 5,997,800 | |
| | 5,000,000 | | 5.000%, 11/01/32 | | Aa1/NR/AA+ | | | 6,001,200 | |
| | 5,000,000 | | 4.000%, 11/01/35 | | Aa1/NR/AA+ | | | 5,296,150 | |
| | | | City and County of Honolulu, Hawaii, | | | | | | |
| | | | Series A, Refunding | | | | | | |
| | 2,000,000 | | 5.250%, 04/01/17 | | Aa1/NR/AA+ | | | 2,090,140 | |
| | 5,000,000 | | 5.000%, 04/01/19 | | Aa1/NR/AA+ | | | 5,607,950 | |
| | | | City and County of Honolulu, Hawaii, | | | | | | |
| | | | Series B | | | | | | |
| | 4,430,000 | | 5.000%, 11/01/21 | | Aa1/NR/AA+ | | | 5,318,791 | |
| | 5,000,000 | | 5.000%, 11/01/22 | | Aa1/NR/AA+ | | | 6,115,850 | |
| | 5,000,000 | | 4.000%, 11/01/27 | | Aa1/NR/AA+ | | | 5,554,350 | |
| | 5,000,000 | | 4.500%, 11/01/28 | | Aa1/NR/AA+ | | | 5,829,800 | |
| | 5,000,000 | | 4.500%, 11/01/29 | | Aa1/NR/AA+ | | | 5,792,850 | |
| | | | City and County of Honolulu, Hawaii, | | | | | | |
| | | | Series C | | | | | | |
| | 2,860,000 | | 5.000%, 10/01/23 | | Aa1/NR/AA+ | | | 3,559,699 | |
| | 2,615,000 | | 5.000%, 10/01/26 | | Aa1/NR/AA+ | | | 3,308,027 | |
| | 2,000,000 | | 5.000%, 10/01/27 | | Aa1/NR/AA+ | | | 2,506,400 | |
| | | | City and County of Honolulu, Hawaii, | | | | | | |
| | | | Series D | | | | | | |
| | 3,500,000 | | 5.250%, 09/01/26 | | Aa1/NR/AA+ | | | 4,006,940 | |
| | 3,820,000 | | 5.250%, 09/01/27 | | Aa1/NR/AA+ | | | 4,371,875 | |
6 | Hawaiian Tax-Free Trust
| HAWAIIAN TAX-FREE TRUST |
| SCHEDULE OF INVESTMENTS (continued) |
| MARCH 31, 2016 |
| | | | | Rating | | | |
| | | | | Moody’s, S&P | | | |
| Principal | | | | and Fitch | | | |
| Amount | | General Obligation Bonds (continued) | | (unaudited) | | Value | |
| | |
| | | City & County (continued) | | | | | |
| | | City and County of Honolulu, Hawaii, | | | | | |
| | | Series D (Continued) | | | | | |
| $ | 7,390,000 | | 5.250%, 09/01/28 | | Aa1/NR/AA+ | | $ | 8,454,973 | |
| | 8,585,000 | | 5.250%, 09/01/30 | | Aa1/NR/AA+ | | | 9,797,374 | |
| | 9,105,000 | | 5.250%, 09/01/31 | | Aa1/NR/AA+ | | | 10,377,606 | |
| | | | City and County of Honolulu, Hawaii, | | | | | | |
| | | | Series F | | | | | | |
| | 5,000,000 | | 5.000%, 09/01/19 | | Aa1/NR/AA+ | | | 5,682,350 | |
| | 5,000,000 | | 5.000%, 09/01/20 | | Aa1/NR/AA+ | | | 5,693,200 | |
| | | | County of Hawaii, Series A | | | | | | |
| | 1,500,000 | | 5.000%, 09/01/30 | | Aa2/AA-/AA- | | | 1,787,145 | |
| | | | County of Hawaii, Series A | | | | | | |
| | 2,000,000 | | 5.000%, 07/15/17 AMBAC Insured | | Aa2/AA-/AA- | | | 2,108,920 | |
| | | | County of Hawaii, Series B | | | | | | |
| | 750,000 | | 5.000%, 07/15/17 AMBAC Insured | | Aa2/AA-/AA- | | | 790,845 | |
| | | | County of Hawaii, Series B | | | | | | |
| | 1,185,000 | | 4.000%, 09/01/19 | | Aa2/AA-/AA- | | | 1,303,310 | |
| | | | County of Hawaii, 2010-Series A | | | | | | |
| | 1,650,000 | | 5.000%, 03/01/19 | | Aa2/AA-/AA- | | | 1,840,542 | |
| | | | County of Hawaii, 2013-Series A | | | | | | |
| | 500,000 | | 5.000%, 09/01/23 | | Aa2/AA-/AA- | | | 609,565 | |
| | 1,000,000 | | 5.000%, 09/01/24 | | Aa2/AA-/AA- | | | 1,213,670 | |
| | 1,000,000 | | 5.000%, 09/01/25 | | Aa2/AA-/AA- | | | 1,212,990 | |
| | 1,575,000 | | 5.000%, 09/01/26 | | Aa2/AA-/AA- | | | 1,899,765 | |
| | 1,000,000 | | 5.000%, 09/01/27 | | Aa2/AA-/AA- | | | 1,198,790 | |
| | 1,000,000 | | 5.000%, 09/01/28 | | Aa2/AA-/AA- | | | 1,196,780 | |
| | | | County of Kauai, Hawaii, 2005-Series A, | | | | |
| | | | Unrefunded | | | | | | |
| | 715,000 | | 5.000%, 08/01/16 NPFG/ FGIC Insured | | Aa2/AA/NR | | | 717,345 | |
| | 930,000 | | 5.000%, 08/01/17 NPFG/ FGIC Insured | | Aa2/AA/NR | | | 933,190 | |
| | 760,000 | | 5.000%, 08/01/18 NPFG/ FGIC Insured | | Aa2/AA/NR | | | 762,584 | |
| | 510,000 | | 5.000%, 08/01/19 NPFG/ FGIC Insured | | Aa2/AA/NR | | | 511,739 | |
| | | | County of Kauai, Hawaii, Refunding, | | | | | | |
| | | | Series A | | | | | | |
| | 1,000,000 | | 3.250%, 08/01/21 | | Aa2/AA/AA- | | | 1,099,410 | |
| | 1,445,000 | | 4.000%, 08/01/22 | | Aa2/AA/AA- | | | 1,632,258 | |
| | 1,240,000 | | 4.000%, 08/01/24 | | Aa2/AA/AA- | | | 1,399,935 | |
| | 1,000,000 | | 3.625%, 08/01/25 | | Aa2/AA/AA- | | | 1,082,160 | |
| | 970,000 | | 3.000%, 08/01/25 | | Aa2/AA/AA- | | | 1,029,102 | |
7 | Hawaiian Tax-Free Trust
| HAWAIIAN TAX-FREE TRUST |
| SCHEDULE OF INVESTMENTS (continued) |
| MARCH 31, 2016 |
| | | | | Rating | | | |
| | | | | Moody’s, S&P | | | |
| Principal | | | | and Fitch | | | |
| Amount | | General Obligation Bonds (continued) | | (unaudited) | | Value | |
| | |
| | | City & County (continued) | | | | | |
| | | County of Kauai, Hawaii, Refunding, | | | | | |
| | | Series A (continued) | | | | | |
| $ | 600,000 | | 3.000%, 08/01/26 | | Aa2/AA/AA- | | $ | 632,532 | |
| | 2,280,000 | | 4.500%, 08/01/28 | | Aa2/AA/AA- | | | 2,644,777 | |
| | 345,000 | | 5.000%, 08/01/29 | | Aa2/AA/AA- | | | 414,569 | |
| | | | County of Kauai, Hawaii, Series A | | | | | | |
| | 855,000 | | 2.250%, 08/01/17 | | Aa2/AA/AA- | | | 872,177 | |
| | | | County of Maui, Hawaii | | | | | | |
| | 1,000,000 | | 4.000%, 06/01/16 | | Aa1/AA+/AA+ | | | 1,005,650 | |
| | 1,035,000 | | 3.000%, 06/01/27 | | Aa1/AA+/AA+ | | | 1,089,524 | |
| | 2,000,000 | | 3.000%, 06/01/28 | | Aa1/AA+/AA+ | | | 2,095,900 | |
| | | | County of Maui, Hawaii, Refunding, | | | | | | |
| | | | Series B | | | | | | |
| | 3,950,000 | | 4.000%, 06/01/19 | | Aa1/AA+/AA+ | | | 4,335,283 | |
| | 4,620,000 | | 4.000%, 06/01/20 | | Aa1/AA+/AA+ | | | 5,184,749 | |
| | 2,385,000 | | 4.000%, 06/01/21 | | Aa1/AA+/AA+ | | | 2,664,140 | |
| | | | County of Maui, Hawaii, Series 2012 | | | | | | |
| | 270,000 | | 5.000%, 06/01/21 | | Aa1/AA+/AA+ | | | 322,483 | |
| | | | County of Maui, Hawaii, Series 2014 | | | | | | |
| | 4,065,000 | | 5.000%, 06/01/20 | | Aa1/AA+/AA+ | | | 4,726,985 | |
| | | | County of Maui, Hawaii, Series 2014 | | | | | | |
| | | | Refunding | | | | | | |
| | 1,000,000 | | 5.000%, 06/01/18 | | Aa1/AA+/AA+ | | | 1,090,920 | |
| | 1,500,000 | | 5.000%, 06/01/19 | | Aa1/AA+/AA+ | | | 1,692,900 | |
| | 1,900,000 | | 5.000%, 06/01/22 | | Aa1/AA+/AA+ | | | 2,319,577 | |
| | 1,000,000 | | 5.000%, 06/01/23 | | Aa1/AA+/AA+ | | | 1,245,830 | |
| | 4,015,000 | | 5.000%, 06/01/24 | | Aa1/AA+/AA+ | | | 5,072,270 | |
| | | | Total City & County | | | | | 225,265,396 | |
| | |
| | | | State (16.3%) | | | | | | |
| | | | State of Hawaii, Series DK, Unrefunded | | | | | | |
| | | | balance | | | | | | |
| | 140,000 | | 5.000%, 05/01/19 | | Aa2/AA/NR | | | 151,999 | |
| | 15,000 | | 5.000%, 05/01/20 | | Aa2/AA/NR | | | 16,286 | |
| | | | State of Hawaii, Series DN, Unrefunded | | | | | | |
| | | | balance | | | | | | |
| | 335,000 | | 5.250%, 08/01/25 | | Aa2/AA/AA | | | 369,227 | |
| | | | State of Hawaii, Series DQ | | | | | | |
| | 500,000 | | 5.000%, 06/01/17 | | Aa2/AA/AA | | | 524,695 | |
8 | Hawaiian Tax-Free Trust
| HAWAIIAN TAX-FREE TRUST |
| SCHEDULE OF INVESTMENTS (continued) |
| MARCH 31, 2016 |
| | | | | Rating | | | |
| | | | | Moody’s, S&P | | | |
| Principal | | | | and Fitch | | | |
| Amount | | General Obligation Bonds (continued) | | (unaudited) | | Value | |
| | |
| | | State (continued) | | | | | |
| | | State of Hawaii, Series DQ, Unrefunded | | | | | |
| | | balance | | | | | |
| $ | 3,380,000 | | 5.000%, 06/01/23 | | Aa2/AA/AA | | $ | 3,800,033 | |
| | 400,000 | | 5.000%, 06/01/25 | | Aa2/AA/AA | | | 449,440 | |
| | | | State of Hawaii, Series DR | | | | | | |
| | 1,075,000 | | 5.000%, 06/01/17 | | Aa2/AA/AA | | | 1,128,094 | |
| | | | State of Hawaii, Series DY, Refunding | | | | | | |
| | 3,765,000 | | 5.000%, 02/01/20 | | Aa2/AA/AA | | | 4,316,121 | |
| | | | State of Hawaii, Series DZ | | | | | | |
| | 5,000,000 | | 5.000%, 12/01/28 | | Aa2/AA/AA | | | 5,888,950 | |
| | 10,575,000 | | 5.000%, 12/01/29 | | Aa2/AA/AA | | | 12,423,933 | |
| | 6,500,000 | | 5.000%, 12/01/30 | | Aa2/AA/AA | | | 7,617,350 | |
| | | | State of Hawaii, Series DZ, Unrefunded | | | | | | |
| | | | balance | | | | | | |
| | 1,490,000 | | 5.000%, 12/01/19 | | Aa2/AA/AA | | | 1,702,817 | |
| | 7,460,000 | | 5.000%, 12/01/26 | | Aa2/AA/AA | | | 8,830,551 | |
| | | | State of Hawaii, Series EA | | | | | | |
| | 4,520,000 | | 5.000%, 12/01/16 | | Aa2/AA/AA | | | 4,651,713 | |
| | | | State of Hawaii, Series EE | | | | | | |
| | 1,195,000 | | 5.000%, 11/01/21 | | Aa2/AA/AA | | | 1,431,909 | |
| | 5,000,000 | | 5.000%, 11/01/22 | | Aa2/AA/AA | | | 6,112,350 | |
| | 1,000,000 | | 5.000%, 11/01/24 | | Aa2/AA/AA | | | 1,206,440 | |
| | 5,300,000 | | 5.000%, 11/01/25 | | Aa2/AA/AA | | | 6,375,847 | |
| | 1,000,000 | | 5.000%, 11/01/27 | | Aa2/AA/AA | | | 1,196,130 | |
| | | | State of Hawaii, Series EH | | | | | | |
| | 1,500,000 | | 5.000%, 08/01/18 | | Aa2/AA/AA | | | 1,643,190 | |
| | 1,500,000 | | 5.000%, 08/01/20 | | Aa2/AA/AA | | | 1,744,875 | |
| | 1,800,000 | | 5.000%, 08/01/27 | | Aa2/AA/AA | | | 2,196,216 | |
| | | | State of Hawaii, Series EK, Refunding | | | | | | |
| | 1,500,000 | | 5.000%, 08/01/16 | | Aa2/AA/AA | | | 1,521,645 | |
| | | | State of Hawaii, Series EL, Refunding | | | | | | |
| | 2,000,000 | | 5.000%, 08/01/23 | | Aa2/AA/AA | | | 2,472,720 | |
| | | | State of Hawaii, Series EO, Refunding | | | | | | |
| | 2,000,000 | | 5.000%, 08/01/27 | | Aa2/AA/AA | | | 2,468,180 | |
| | 2,000,000 | | 5.000%, 08/01/28 | | Aa2/AA/AA | | | 2,454,400 | |
| | 1,000,000 | | 5.000%, 08/01/29 | | Aa2/AA/AA | | | 1,220,340 | |
| | 1,000,000 | | 5.000%, 08/01/30 | | Aa2/AA/AA | | | 1,215,240 | |
| | | | State of Hawaii, Series EP, Refunding | | | | | | |
| | 2,000,000 | | 5.000%, 08/01/22 | | Aa2/AA/AA | | | 2,431,440 | |
9 | Hawaiian Tax-Free Trust
| HAWAIIAN TAX-FREE TRUST |
| SCHEDULE OF INVESTMENTS (continued) |
| MARCH 31, 2016 |
| | | | | Rating | | | |
| | | | | Moody’s, S&P | | | |
| Principal | | | | and Fitch | | | |
| Amount | | General Obligation Bonds (continued) | | (unaudited) | | Value | |
| | |
| | | State (continued) | | | | | |
| | | State of Hawaii, Series EP, Refunding | | | | | |
| | | (continued) | | | | | |
| $ | 5,000,000 | | 5.000%, 08/01/23 | | Aa2/AA/AA | | $ | 6,181,800 | |
| | 5,000,000 | | 5.000%, 08/01/24 | | Aa2/AA/AA | | | 6,266,500 | |
| | 5,000,000 | | 5.000%, 08/01/25 | | Aa2/AA/AA | | | 6,240,100 | |
| | 5,245,000 | | 5.000%, 08/01/26 | | Aa2/AA/AA | | | 6,518,381 | |
| | | | State of Hawaii, Series EU | | | | | | |
| | 1,690,000 | | 3.000%, 10/01/25 | | Aa2/AA/AA | | | 1,835,408 | |
| | | | State of Hawaii, Series EZ Refunding | | | | | | |
| | 2,000,000 | | 5.000%, 10/01/26 | | Aa2/AA/AA | | | 2,534,020 | |
| | | | State of Hawaii, Series FB | | | | | | |
| | 5,000,000 | | 5.000%, 04/01/27 | | Aa2/AA/AA | | | 6,338,600 | |
| | 2,255,000 | | 4.000%, 04/01/29 | | Aa2/AA/AA | | | 2,566,618 | |
| | | | Total State | | | | | 126,043,558 | |
| | | | Total General Obligation Bonds | | | | | 351,308,954 | |
| | |
| | | | Revenue Bonds (37.3%) | | | | | | |
| | |
| | | | Airport (4.4%) | | | | | | |
| | | | State of Hawaii Airport System Revenue | | | | | | |
| | | | Refunding, AMT | | | | | | |
| | 13,000,000 | | 5.000%, 07/01/21 | | A1/A+/A | | | 15,141,230 | |
| | 5,000,000 | | 5.000%, 07/01/22 | | A1/A+/A | | | 5,780,100 | |
| | 1,500,000 | | 5.000%, 07/01/23 | | A1/A+/A | | | 1,722,720 | |
| | 2,000,000 | | 5.000%, 07/01/24 | | A1/A+/A | | | 2,290,520 | |
| | | | State of Hawaii Airport System Revenue | | | | | | |
| | | | Refunding, AMT Series B | | | | | | |
| | 1,000,000 | | 5.000%, 07/01/16 | | A1/A+/A | | | 1,010,060 | |
| | | | State of Hawaii Airport System Revenue | | | | | | |
| | | | Refunding, Series A | | | | | | |
| | 1,150,000 | | 5.250%, 07/01/21 | | A1/A+/A | | | 1,348,409 | |
| | 1,000,000 | | 5.250%, 07/01/23 | | A1/A+/A | | | 1,170,940 | |
| | | | State of Hawaii Airport System Revenue, | | | | | | |
| | | | Series A | | | | | | |
| | 2,000,000 | | 4.000%, 07/01/20 | | A1/A+/A | | | 2,240,420 | |
| | 3,000,000 | | 5.000%, 07/01/22 | | A1/A+/A | | | 3,484,560 | |
| | | | Total Airport | | | | | 34,188,959 | |
10 | Hawaiian Tax-Free Trust
| HAWAIIAN TAX-FREE TRUST |
| SCHEDULE OF INVESTMENTS (continued) |
| MARCH 31, 2016 |
| | | | | Rating | | | |
| | | | | Moody’s, S&P | | | |
| Principal | | | | and Fitch | | | |
| Amount | | Revenue Bonds (continued) | | (unaudited) | | Value | |
| | |
| | | Education (4.3%) | | | | | |
| | | University of Hawaii | | | | | |
| $ | 5,000,000 | | 5.000%, 07/15/21 NPFG Insured | | Aa2/AA-/AA | | $ | 5,063,050 | |
| | | | University of Hawaii, Revenue | | | | | | |
| | | | Refunding, Series A | | | | | | |
| | 775,000 | | 5.000%, 07/15/22 NPFG Insured | | Aa2/AA-/AA | | | 784,773 | |
| | 1,000,000 | | 4.500%, 07/15/23 NPFG Insured | | Aa2/AA-/AA | | | 1,011,220 | |
| | 4,840,000 | | 4.500%, 07/15/25 NPFG Insured | | Aa2/AA-/AA | | | 4,894,305 | |
| | | | University of Hawaii, Series A | | | | | | |
| | 1,510,000 | | 5.000%, 10/01/17 | | Aa2/A+/AA | | | 1,605,070 | |
| | | | University of Hawaii, Series A | | | | | | |
| | 1,000,000 | | 4.000%, 10/01/18 | | Aa2/A+/AA | | | 1,071,260 | |
| | 2,725,000 | | 5.500%, 10/01/22 | | Aa2/A+/AA | | | 3,138,328 | |
| | 5,225,000 | | 5.250%, 10/01/34 | | Aa2/A+/AA | | | 5,884,813 | |
| | | | University of Hawaii, Series A-2 | | | | | | |
| | 1,125,000 | | 4.000%, 10/01/16 | | Aa2/A+/AA | | | 1,144,035 | |
| | 2,175,000 | | 4.000%, 10/01/17 | | Aa2/A+/AA | | | 2,279,792 | |
| | 1,000,000 | | 4.000%, 10/01/19 | | Aa2/A+/AA | | | 1,096,470 | |
| | | | University of Hawaii, Series B | | | | | | |
| | 750,000 | | 4.000%, 10/01/23 | | Aa2/A+/AA | | | 872,535 | |
| | 1,250,000 | | 4.000%, 10/01/24 | | Aa2/A+/AA | | | 1,459,163 | |
| | 1,050,000 | | 5.000%, 10/01/25 | | Aa2/A+/AA | | | 1,328,271 | |
| | 1,000,000 | | 5.000%, 10/01/26 | | Aa2/A+/AA | | | 1,251,250 | |
| | | | Total Education | | | | | 32,884,335 | |
| | |
| | | | Housing (0.9%) | | | | | | |
| | | | Hawaii State Department of Hawaiian | | | | | | |
| | | | Home Lands | | | �� | | | |
| | 715,000 | | 5.000%, 04/01/17 | | A1/NR/A | | | 742,063 | |
| | 1,000,000 | | 5.500%, 04/01/20 | | A1/NR/A | | | 1,125,870 | |
| | | | State of Hawaii Housing Finance and | | | | | | |
| | | | Development Corp., Iwilei | | | | | | |
| | | | Apartments, Series A | | | | | | |
| | 2,000,000 | | 3.750%, 01/01/31 FHLMC Insured | | NR/AA+/NR | | | 2,062,380 | |
| | | | State of Hawaii Housing Finance and | | | | | | |
| | | | Development Corp., Kalani Gardens, | | | | | | |
| | | | Series A | | | | | | |
| | 1,900,000 | | 0.700%, 04/01/17 | | NR/AAA/NR | | | 1,900,095 | |
11 | Hawaiian Tax-Free Trust
| HAWAIIAN TAX-FREE TRUST |
| SCHEDULE OF INVESTMENTS (continued) |
| MARCH 31, 2016 |
| | | | | Rating | | | |
| | | | | Moody’s, S&P | | | |
| Principal | | | | and Fitch | | | |
| Amount | | Revenue Bonds (continued) | | (unaudited) | | Value | |
| | |
| | | Housing (continued) | | | | | |
| | | State of Hawaii Housing Finance and | | | | | |
| | | Development Corp. Single Family | | | | | |
| | | Mortgage, Series B | | | | | |
| $ | 1,290,000 | | 4.500%, 01/01/26 FNMA/GNMA | | | | | |
| | | | Collateralized | | Aaa/AA+/AAA | | $ | 1,352,488 | |
| | | | Total Housing | | | | | 7,182,896 | |
| | |
| | | | Medical (5.6%) | | | | | | |
| | | | Hawaii State Department of Budget and | | | | | | |
| | | | Finance, Special Purpose Revenue | | | | | | |
| | | | (Hawaii Pacific Health) Series A | | | | | | |
| | 690,000 | | 5.000%, 07/01/19 | | A1/A/A+ | | | 773,973 | |
| | 695,000 | | 5.000%, 07/01/20 | | A1/A/A+ | | | 800,709 | |
| | 750,000 | | 5.000%, 07/01/21 | | A1/A/A+ | | | 885,495 | |
| | 1,000,000 | | 5.000%, 07/01/24 | | A1/A/A+ | | | 1,203,460 | |
| | 685,000 | | 5.000%, 07/01/25 | | A1/A/A+ | | | 817,739 | |
| | 1,355,000 | | 5.000%, 07/01/27 | | A1/A/A+ | | | 1,581,895 | |
| | | | Hawaii State Department of Budget and | | | | | | |
| | | | Finance, Special Purpose Revenue | | | | | | |
| | | | (Hawaii Pacific Health) Series B | | | | | | |
| | 420,000 | | 5.000%, 07/01/20 | | A1/A/A+ | | | 483,882 | |
| | | | Hawaii State Department of Budget and | | | | | | |
| | | | Finance, Special Purpose Revenue | | | | | | |
| | | | (Queens Health System) Series A | | | | | | |
| | 2,015,000 | | 5.000%, 07/01/20 | | A1/AA-/NR | | | 2,317,875 | |
| | 1,250,000 | | 5.000%, 07/01/21 | | A1/AA-/NR | | | 1,471,675 | |
| | 1,500,000 | | 5.000%, 07/01/22 | | A1/AA-/NR | | | 1,798,680 | |
| | 865,000 | | 5.000%, 07/01/23 | | A1/AA-/NR | | | 1,054,677 | |
| | 2,760,000 | | 5.000%, 07/01/24 | | A1/AA-/NR | | | 3,411,967 | |
| | 1,310,000 | | 5.000%, 07/01/25 | | A1/AA-/NR | | | 1,638,718 | |
| | 1,715,000 | | 5.000%, 07/01/26 | | A1/AA-/NR | | | 2,138,794 | |
| | 2,000,000 | | 5.000%, 07/01/27 | | A1/AA-/NR | | | 2,473,360 | |
| | 850,000 | | 5.000%, 07/01/28 | | A1/AA-/NR | | | 1,044,778 | |
| | 12,790,000 | | 5.000%, 07/01/35 | | A1/AA-/NR | | | 15,157,685 | |
| | | | Hawaii State Department of Budget and | | | | | | |
| | | | Finance, Special Purpose Revenue | | | | | | |
| | | | (Senior Living Revenue, Kahala Nui) | | | | | | |
| | 3,575,000 | | 5.125%, 11/15/32 | | NR/NR/BBB | | | 3,895,284 | |
| | | | Total Medical | | | | | 42,950,646 | |
12 | Hawaiian Tax-Free Trust
| HAWAIIAN TAX-FREE TRUST |
| SCHEDULE OF INVESTMENTS (continued) |
| MARCH 31, 2016 |
| | | | | Rating | | | |
| | | | | Moody’s, S&P | | | |
| Principal | | | | and Fitch | | | |
| Amount | | Revenue Bonds (continued) | | (unaudited) | | Value | |
| | |
| | | Transportation (8.9%) | | | | | |
| | | State of Hawaii Harbor System, Series A | | | | | |
| $ | 16,500,000 | | 5.750%, 07/01/35 | | A2/A+/A+ | | $ | 19,287,675 | |
| | 4,025,000 | | 5.625%, 07/01/40 | | A2/A+/A+ | | | 4,639,819 | |
| | | | State of Hawaii Harbor System, Series | | | | | | |
| | | | A 2006, AMT | | | | | | |
| | 4,910,000 | | 5.250%, 01/01/25 AGM Insured | | A2/AA/A+ | | | 4,925,810 | |
| | 1,450,000 | | 5.250%, 01/01/27 AGM Insured | | A2/AA/A+ | | | 1,454,611 | |
| | | | State of Hawaii Harbor System, Series | | | | | | |
| | | | A-AMT | | | | | | |
| | 2,215,000 | | 5.250%, 07/01/17 AGM Insured | | A2/AA/A+ | | | 2,330,867 | |
| | | | State of Hawaii Highway Revenue | | | | | | |
| | 1,000,000 | | 5.250%, 01/01/17 | | Aa2/AA+/AA | | | 1,033,920 | |
| | 1,000,000 | | 5.250%, 01/01/18 | | Aa2/AA+/AA | | | 1,077,220 | |
| | 5,135,000 | | 5.500%, 07/01/18 | | Aa2/AA+/AA | | | 5,662,159 | |
| | 5,220,000 | | 6.000%, 01/01/23 | | Aa2/AA+/AA | | | 5,932,426 | |
| | | | State of Hawaii Highway Revenue, | | | | | | |
| | | | Series A | | | | | | |
| | 500,000 | | 5.000%, 01/01/24 | | Aa2/AA+/AA | | | 622,445 | |
| | 1,500,000 | | 5.000%, 01/01/25 | | Aa2/AA+/AA | | | 1,886,895 | |
| | 6,000,000 | | 5.000%, 01/01/28 | | Aa2/AA+/AA | | | 7,114,200 | |
| | 4,100,000 | | 5.000%, 01/01/29 | | Aa2/AA+/AA | | | 4,853,949 | |
| | 3,980,000 | | 5.000%, 01/01/30 | | Aa2/AA+/AA | | | 4,704,718 | |
| | 3,040,000 | | 5.000%, 01/01/32 | | Aa2/AA+/AA | | | 3,578,962 | |
| | | | Total Transportation | | | | | 69,105,676 | |
| | |
| | | | Utility (0.5%) | | | | | | |
| | | | State of Hawaii, Department of Business, | | | | |
| | | | Economic Development and Tourism | | | | | | |
| | | | Green Energy Market Securitization | | | | | | |
| | | | Bonds, Series A (Federally Taxable) | | | | | | |
| | 4,125,000 | | 1.467%, 07/01/22 | | Aaa/AAA/AAA | | | 4,118,235 | |
| | |
| | | | Water & Sewer (12.7%) | | | | | | |
| | | | City and County of Honolulu, Hawaii, | | | | | | |
| | | | Board of Water Supply Water System, | | | | | | |
| | | | Series A | | | | | | |
| | 1,000,000 | | 5.000%, 07/01/23 | | Aa2/NR/AA+ | | | 1,237,670 | |
| | 1,000,000 | | 5.000%, 07/01/24 | | Aa2/NR/AA+ | | | 1,258,800 | |
13 | Hawaiian Tax-Free Trust
| HAWAIIAN TAX-FREE TRUST |
| SCHEDULE OF INVESTMENTS (continued) |
| MARCH 31, 2016 |
| | | | | Rating | | | |
| | | | | Moody’s, S&P | | | |
| Principal | | | | and Fitch | | | |
| Amount | | Revenue Bonds (continued) | | (unaudited) | | Value | |
| | |
| | | Water & Sewer (continued) | | | | | |
| | | City and County of Honolulu, Hawaii, | | | | | |
| | | Board of Water Supply Water System, | | | | | |
| | | Series A (continued) | | | | | |
| $ | 1,700,000 | | 5.000%, 07/01/26 | | Aa2/NR/AA+ | | $ | 2,107,422 | |
| | 800,000 | | 5.000%, 07/01/27 | | Aa2/NR/AA+ | | | 984,176 | |
| | | | City and County of Honolulu, Hawaii, | | | | | | |
| | | | Board of Water Supply Water System, | | | | | | |
| | | | Refunding Series A | | | | | | |
| | 4,795,000 | | 4.500%, 07/01/29 | | Aa2/NR/AA+ | | | 5,549,541 | |
| | 4,955,000 | | 4.500%, 07/01/30 | | Aa2/NR/AA+ | | | 5,678,034 | |
| | 5,020,000 | | 5.000%, 07/01/31 | | Aa2/NR/AA+ | | | 5,963,860 | |
| | 3,040,000 | | 5.000%, 07/01/32 | | Aa2/NR/AA+ | | | 3,597,779 | |
| | 3,495,000 | | 5.000%, 07/01/33 | | Aa2/NR/AA+ | | | 4,111,483 | |
| | | | City and County of Honolulu, Hawaii, | | | | | | |
| | | | Wastewater System | | | | | | |
| | 5,360,000 | | 4.500%, 07/01/28 | | Aa2/NR/AA | | | 6,088,906 | |
| | 4,480,000 | | 4.500%, 07/01/30 | | Aa2/NR/AA | | | 5,029,562 | |
| | 1,000,000 | | 4.000%, 07/01/31 | | Aa2/NR/AA | | | 1,080,860 | |
| | 2,000,000 | | 5.250%, 07/01/36 | | Aa2/NR/AA | | | 2,344,520 | |
| | | | City and County of Honolulu, Hawaii, | | | | | | |
| | | | Wastewater System (First Bond | | | | | | |
| | | | Resolution) Senior Series 2009 A, | | | | | | |
| | | | Prerefunded to 07/01/19 @100 | | | | | | |
| | 445,000 | | 5.000%, 07/01/20 | | Aa2/NR/AA | | | 502,040 | |
| | | | City and County of Honolulu, Hawaii, | | | | | | |
| | | | Wastewater System (First Bond | | | | | | |
| | | | Resolution) Senior Series 2009 A, | | | | | | |
| | | | Unrefunded Balance | | | | | | |
| | 530,000 | | 5.000%, 07/01/21 | | Aa2/NR/AA | | | 597,755 | |
| | 1,235,000 | | 5.000%, 07/01/22 | | Aa2/NR/AA | | | 1,392,450 | |
| | 1,455,000 | | 5.000%, 07/01/23 | | Aa2/NR/AA | | | 1,640,498 | |
| | 1,105,000 | | 5.000%, 07/01/24 | | Aa2/NR/AA | | | 1,245,501 | |
| | | | City and County of Honolulu, Hawaii, | | | | | | |
| | | | Wastewater System (First Bond | | | | | | |
| | | | Resolution) Senior Series 2012 A | | | | | | |
| | 1,000,000 | | 5.000%, 07/01/30 | | Aa2/NR/AA | | | 1,203,070 | |
| | 1,000,000 | | 5.000%, 07/01/31 | | Aa2/NR/AA | | | 1,201,090 | |
| | 1,500,000 | | 5.000%, 07/01/32 | | Aa2/NR/AA | | | 1,799,655 | |
| | 2,500,000 | | 5.000%, 07/01/42 | | Aa2/NR/AA | | | 2,896,425 | |
14 | Hawaiian Tax-Free Trust
| HAWAIIAN TAX-FREE TRUST |
| SCHEDULE OF INVESTMENTS (continued) |
| MARCH 31, 2016 |
| | | | | Rating | | | |
| | | | | Moody’s, S&P | | | |
| Principal | | | | and Fitch | | | |
| Amount | | Revenue Bonds (continued) | | (unaudited) | | Value | |
| | |
| | | Water & Sewer (continued) | | | | | |
| | | City and County of Honolulu, Hawaii, | | | | | |
| | | Wastewater System (First Bond | | | | | |
| | | Resolution) Senior Series 2012 B | | | | | |
| $ | 2,500,000 | | 5.000%, 07/01/22 | | Aa2/NR/AA | | $ | 3,027,525 | |
| | 2,000,000 | | 4.000%, 07/01/28 | | Aa2/NR/AA | | | 2,217,360 | |
| | 3,000,000 | | 4.000%, 07/01/30 | | Aa2/NR/AA | | | 3,300,240 | |
| | | | City and County of Honolulu, Hawaii, | | | | | | |
| | | | Wastewater System (First Bond | | | | | | |
| | | | Resolution) Senior Series 2015 B | | | | | | |
| | 1,000,000 | | 5.000%, 07/01/22 | | Aa2/NR/AA | | | 1,211,010 | |
| | 2,000,000 | | 5.000%, 07/01/23 | | Aa2/NR/AA | | | 2,467,620 | |
| | 2,000,000 | | 5.000%, 07/01/24 | | Aa2/NR/AA | | | 2,496,640 | |
| | 2,000,000 | | 5.000%, 07/01/25 | | Aa2/NR/AA | | | 2,536,600 | |
| | 2,000,000 | | 5.000%, 07/01/30 | | Aa2/NR/AA | | | 2,452,680 | |
| | 2,000,000 | | 5.000%, 07/01/31 | | Aa2/NR/AA | | | 2,437,780 | |
| | | | City and County of Honolulu, Hawaii, | | | | | | |
| | | | Wastewater System (Second Bond | | | | | | |
| | | | Resolution) Junior Series 2009 A | | | | | | |
| | 1,080,000 | | 5.000%, 07/01/22 | | Aa3/NR/AA- | | | 1,212,905 | |
| | | | City and County of Honolulu, Hawaii, | | | | | | |
| | | | Wastewater System (Second Bond | | | | | | |
| | | | Resolution) Junior Series 2010 A | | | | | | |
| | 7,400,000 | | 4.500%, 07/01/27 | | Aa3/NR/AA- | | | 8,272,756 | |
| | | | City and County of Honolulu, Hawaii, | | | | | | |
| | | | Wastewater System (Second Bond | | | | | | |
| | | | Resolution) Junior Series 2015 A | | | | | | |
| | 850,000 | | 5.000%, 07/01/21 | | Aa3/NR/AA- | | | 1,005,924 | |
| | 2,000,000 | | 5.000%, 07/01/22 | | Aa3/NR/AA- | | | 2,416,700 | |
| | 500,000 | | 5.000%, 07/01/24 | | Aa3/NR/AA- | | | 623,290 | |
| | 4,000,000 | | 5.000%, 07/01/25 | | Aa3/NR/AA- | | | 5,049,920 | |
| | | | Total Water & Sewer | | | | | 98,240,047 | |
| | | | Total Revenue Bonds | | | | | 288,670,794 | |
15 | Hawaiian Tax-Free Trust
| HAWAIIAN TAX-FREE TRUST |
| SCHEDULE OF INVESTMENTS (continued) |
| MARCH 31, 2016 |
| | | | | Rating | | | |
| | | | | Moody’s, S&P | | | |
| Principal | | Pre-Refunded\ | | and Fitch | | | |
| Amount | | Escrowed to Maturity Bonds (15.2%) †† | | (unaudited) | | Value | |
| | |
| | | Pre-Refunded\Escrowed to Maturity | | | | | |
| | | General Obligation Bonds (10.3%) | | | | | |
| | | City & County (4.6%) | | | | | |
| | | City and County of Honolulu, Hawaii, | | | | | |
| | | Series A, Prerefunded to 4/01/19 @100 | | | | | |
| $ | 3,930,000 | | 5.000%, 04/01/20 | | Aa1/NR/AA+ | | $ | 4,404,115 | |
| | 460,000 | | 5.000%, 04/01/25 | | Aa1/NR/AA+ | | | 515,494 | |
| | 1,875,000 | | 5.250%, 04/01/32 | | Aa1/NR/AA+ | | | 2,115,000 | |
| | | | City and County of Honolulu, Hawaii, | | | | | | |
| | | | Series A, Prerefunded to 7/01/17 @100 | | | | | | |
| | 230,000 | | 5.000%, 07/01/22 AGM Insured | | Aa1/AA/AA+ | | | 242,323 | |
| | 3,000,000 | | 5.000%, 07/01/29 AGM Insured | | Aa1/AA/AA+ | | | 3,160,740 | |
| | 2,470,000 | | 5.000%, 07/01/30 AGM Insured | | Aa1/AA/AA+ | | | 2,602,343 | |
| | | | County of Hawaii, Prerefunded to | | | | | | |
| | | | 7/15/18 @100 | | | | | | |
| | 1,890,000 | | 5.500%, 07/15/22 | | Aa2/AA-/AA- | | | 2,090,529 | |
| | 2,245,000 | | 5.500%, 07/15/23 | | Aa2/AA-/AA- | | | 2,483,194 | |
| | 1,990,000 | | 5.750%, 07/15/24 | | Aa2/AA-/AA- | | | 2,212,343 | |
| | 2,370,000 | | 5.750%, 07/15/25 | | Aa2/AA-/AA- | | | 2,634,800 | |
| | 3,585,000 | | 6.000%, 07/15/27 | | Aa2/AA-/AA- | | | 4,005,771 | |
| | | | County of Hawaii, Series A , Prerefunded | | | | | | |
| | | | to 7/15/16 @100 | | | | | | |
| | 2,850,000 | | 5.000%, 07/15/20 AGC Insured | | Aa2/AA/NR | | | 2,885,938 | |
| | | | County of Hawaii, Series A, Prerefunded | | | | | | |
| | | | to 3/01/20 @100 | | | | | | |
| | 1,000,000 | | 5.000%, 03/01/26 | | Aa2/AA-/AA- | | | 1,149,920 | |
| | | | County of Hawaii, 2010-Series A, | | | | | | |
| | | | Prerefunded to 3/01/20 @100 | | | | | | |
| | 2,870,000 | | 5.000%, 03/01/29 | | Aa2/AA-/AA- | | | 3,300,270 | |
| | | | County of Maui, Hawaii, Series A | | | | | | |
| | | | Prerefunded to 07/01/16 @100 | | | | | | |
| | 1,165,000 | | 4.375%, 07/01/19 NPFG Insured | | Aa1/AA+/AA+ | | | 1,175,893 | |
| | 750,000 | | 5.000%, 07/01/20 NPFG Insured | | Aa1/AA+/AA+ | | | 758,130 | |
| | | | Total City & County | | | | | 35,736,803 | |
| | |
| | | | State (5.7%) | | | | | | |
| | | | Guam Government, Series A, Prerefunded | | | | | | |
| | | | to 11/15/19 @100 | | | | | | |
| | 5,000,000 | | 6.750%, 11/15/29 | | NR/NR/NR* | | | 6,019,100 | |
16 | Hawaiian Tax-Free Trust
| HAWAIIAN TAX-FREE TRUST |
| SCHEDULE OF INVESTMENTS (continued) |
| MARCH 31, 2016 |
| | | | | Rating | | | |
| | | | | Moody’s, S&P | | | |
| Principal | | Pre-Refunded \ | | and Fitch | | | |
| Amount | | Escrowed to Maturity Bonds (continued) | | (unaudited) | | Value | |
| | | State (continued) | | | | | |
| | | State of Hawaii, Prerefunded to 05/01/18 | | | | | |
| | | @100 | | | | | |
| $ | 715,000 | | 5.000%, 05/01/19 | | NR/NR/NR* | | $ | 776,283 | |
| | | | State of Hawaii, Series DJ, Prerefunded | | | | | | |
| | | | to 04/01/17 @100 | | | | | | |
| | 5,000,000 | | 5.000%, 04/01/23 AGM - CR AMBAC | | | | | | |
| | | | Insured | | Aa2/AA/NR | | | 5,212,500 | |
| | 1,605,000 | | 5.000%, 04/01/26 AMBAC Insured | | Aa2/AA/AA | | | 1,674,031 | |
| | | | State of Hawaii, Series DJ, Prerefunded | | | | | | |
| | | | to 04/01/17 @100 | | | | | | |
| | 3,040,000 | | 5.000%, 04/01/23 AMBAC Insured | | Aa2/AA/NR | | | 3,170,750 | |
| | 2,465,000 | | 5.000%, 04/01/23 AMBAC Insured | | Aa2/AA/NR | | | 2,571,020 | |
| | 6,130,000 | | 5.000%, 04/01/25 AMBAC Insured | | Aa2/NR/NR | | | 6,393,651 | |
| | | | State of Hawaii, Series DK, ETM 5/01/18 | | | | | | |
| | 470,000 | | 5.000%, 05/01/18 | | NR/NR/NR* | | | 510,284 | |
| | | | State of Hawaii, Series DK, Prerefunded | | | | | | |
| | | | to 05/01/18 @100 | | | | | | |
| | 930,000 | | 5.000%, 05/01/20 | | NR/NR/NR* | | | 1,009,710 | |
| | | | State of Hawaii, Series DK, Prerefunded | | | | | | |
| | | | to 05/01/18 @100 | | | | | | |
| | 6,145,000 | | 5.000%, 05/01/19 | | NR/NR/NR* | | | 6,671,688 | |
| | 55,000 | | 5.000%, 05/01/20 | | NR/NR/NR* | | | 59,714 | |
| | | | State of Hawaii, Series DN, Prerefunded | | | | | | |
| | | | to 08/01/18 @100 | | | | | | |
| | 665,000 | | 5.250%, 08/01/25 | | NR/NR/NR* | | | 732,783 | |
| | | | State of Hawaii, Series DQ, Prerefunded | | | | | | |
| | | | to 06/01/19 @100 | | | | | | |
| | 6,620,000 | | 5.000%, 06/01/23 | | NR/NR/NR* | | | 7,460,277 | |
| | 600,000 | | 5.000%, 06/01/25 | | NR/NR/NR* | | | 676,158 | |
| | | | State of Hawaii, Series DZ, ETM | | | | | | |
| | 10,000 | | 5.000%, 12/01/19 | | NR/NR/NR* | | | 11,440 | |
| | | | State of Hawaii, Series DZ, Prerefunded | | | | | | |
| | | | to 12/01/21 @100 | | | | | | |
| | 930,000 | | 5.000%, 12/01/26 | | NR/NR/NR* | | | 1,119,841 | |
| | | | Total State | | | | | 44,069,230 | |
| | | | Total Pre-Refunded\Escrowed to Maturity | | | | | | |
| | | | General Obligation Bonds | | | | | 79,806,033 | |
17 | Hawaiian Tax-Free Trust
| HAWAIIAN TAX-FREE TRUST |
| SCHEDULE OF INVESTMENTS (continued) |
| MARCH 31, 2016 |
| | | | | Rating | | | |
| | | | | Moody’s, S&P | | | |
| Principal | | Pre-Refunded \ | | and Fitch | | | |
| Amount | | Escrowed to Maturity Bonds (continued) | | (unaudited) | | Value | |
| | | Pre-Refunded\ | | | | | |
| | | Escrowed to Maturity Revenue Bonds (4.9%) | | | | |
| | |
| | | Education (0.3%) | | | | | |
| | | University of Hawaii, Prerefunded to | | | | | |
| | | 10/01/16 @100 | | | | | |
| $ | 2,325,000 | | 5.000%, 10/01/23 AGC-ICC NPFG Insured | | Aa2/AA/NR | | $ | 2,376,592 | |
| | |
| | | | Water & Sewer (4.6%) | | | | | | |
| | | | City and County of Honolulu, Hawaii, | | | | | | |
| | | | Board of Water Supply Water System | | | | | | |
| | | | Prerefunded 7/01/16 @100 | | | | | | |
| | 2,005,000 | | 4.500%, 07/01/22 NPFG Insured | | Aa2/AA-/NR | | | 2,024,348 | |
| | 5,000,000 | | 5.000%, 07/01/26 NPFG Insured | | Aa2/AA-/NR | | | 5,054,200 | |
| | | | City and County of Honolulu, Hawaii, | | | | | | |
| | | | Board of Water Supply Water System, | | | | | | |
| | | | Refunding Series A, Prerefunded to | | | | | | |
| | | | 7/01/16 @100 | | | | | | |
| | 640,000 | | 5.000%, 07/01/21 NPFG Insured | | Aa2/AA-/NR | | | 646,938 | |
| | 4,525,000 | | 4.500%, 07/01/24 NPFG Insured | | Aa2/AA-/NR | | | 4,568,666 | |
| | | | City and County of Honolulu, Hawaii, | | | | | | |
| | | | Board of Water Supply Water System, | | | | | | |
| | | | AMT, Refunding Series A Prerefunded | | | | | | |
| | | | 7/01/16 @100 | | | | | | |
| | 3,205,000 | | 5.250%, 07/01/18 NPFG Insured | | Aa2/AA-/NR | | | 3,240,479 | |
| | | | City and County of Honolulu, Hawaii, | | | | | | |
| | | | Board of Water Supply Water System, | | | | | | |
| | | | Refunding Series A Prerefunded | | | | | | |
| | | | 7/01/16 @100 | | | | | | |
| | 3,010,000 | | 4.750%, 07/01/31 NPFG Insured | | Aa2/AA-/NR | | | 3,040,852 | |
| | | | City and County of Honolulu, Hawaii, | | | | | | |
| | | | Wastewater System, Prerefunded to | | | | | | |
| | | | 7/1/16@100 | | | | | | |
| | 3,000,000 | | 5.000%, 07/01/32 NPFG Insured | | Aa3/NR/NR | | | 3,032,910 | |
| | | | City and County of Honolulu, Hawaii, | | | | | | |
| | | | Wastewater System (First Bond | | | | | | |
| | | | Resolution) Senior Series 2009 A, | | | | | | |
| | | | Prerefunded to 07/01/19 @100 | | | | | | |
| | 555,000 | | 5.000%, 07/01/20 | | NR/NR/NR* | | | 628,038 | |
| | 1,925,000 | | 5.000%, 07/01/21 | | NR/NR/NR* | | | 2,178,330 | |
| | 1,565,000 | | 5.000%, 07/01/22 | | NR/NR/NR* | | | 1,770,954 | |
18 | Hawaiian Tax-Free Trust
| HAWAIIAN TAX-FREE TRUST |
| SCHEDULE OF INVESTMENTS (continued) |
| MARCH 31, 2016 |
| | | | | Rating | | | |
| | | | | Moody’s, S&P | | | |
| Principal | | Pre-Refunded \ | | and Fitch | | | |
| Amount | | Escrowed to Maturity Bonds (continued) | | (unaudited) | | Value | |
| | |
| | | Water & Sewer (continued) | | | | | |
| | | City and County of Honolulu, Hawaii, | | | | | |
| | | Wastewater System (First Bond | | | | | |
| | | Resolution) Senior Series 2009 A, | | | | | |
| | | Prerefunded to 07/01/19 @100 | | | | | |
| | | (continued) | | | | | |
| $ | 1,845,000 | | 5.000%, 07/01/23 | | NR/NR/NR* | | $ | 2,087,802 | |
| | 1,395,000 | | 5.000%, 07/01/24 | | NR/NR/NR* | | | 1,578,582 | |
| | | | City and County of Honolulu, Hawaii, | | | | | | |
| | | | Wastewater System (Second Bond | | | | | | |
| | | | Resolution) Junior Series B-1 Remarket | | | | |
| | | | 09/15/06, Prerefunded to 07/01/16 @100 | | | | | | |
| | 1,340,000 | | 5.000%, 07/01/18 NPFG Insured | | Aa3/NR/NR | | | 1,354,700 | |
| | 1,935,000 | | 5.000%, 07/01/19 NPFG Insured | | Aa3/NR/NR | | | 1,956,227 | |
| | 2,035,000 | | 5.000%, 07/01/20 NPFG Insured | | Aa3/NR/NR | | | 2,057,324 | |
| | | | Total Water & Sewer | | | | | 35,220,350 | |
| | | | Total Pre-Refunded\ Escrowed to Maturity | | | | |
| | | | Revenue Bonds | | | | | 37,596,942 | |
| | | | Total Pre-Refunded\ Escrowed to Maturity | | | 117,402,975 | |
| | | | Total Municipal Bonds (cost $714,017,271) | | | 757,382,723 | |
| | |
| Shares | | Short-Term Investment (2.1%) | | | | | | |
| | 16,516,695 | | Dreyfus Government Cash Management, | | | | |
| | | | Institutional Shares, 0.21%**(cost | | | | | | |
| | | | $16,516,695) | | Aaa-mf/AAAm/NR | | | 16,516,695 | |
| | |
| | | | Total Investments (cost $730,533,966 | | | | | | |
| | | | note 4) - 100.1% | | | | | 773,899,418 | |
| | | | Other assets less liabilities - (0.1)% | | | | | (514,685 | ) |
| | | | Net Assets - 100.0% | | | | $ | 773,384,733 | |
| | | | | | | | Percent of | |
| | | | Portfolio Distribution By Quality Rating (unaudited) | | | Investments † | |
| | | | Aaa of Moody’s or AAA of S&P | | | | | | | 1.0 | % |
| | | | Prerefunded bonds\ ETM bonds †† | | | | | | | 15.2 | |
| | | | Aa of Moody’s or AA of S&P/Fitch | | | | | | | 67.3 | |
| | | | A of Moody’s | | | | | | | 13.9 | |
| | | | BBB of Fitch | | | | | | | 0.5 | |
| | | | Short-Term Investment Aaa-mf of Moody’s | | | | 2.1 | |
| | | | | | | | | | | 100.0 | % |
19 | Hawaiian Tax-Free Trust
| HAWAIIAN TAX-FREE TRUST |
| SCHEDULE OF INVESTMENTS (continued) |
| MARCH 31, 2016 |
| PORTFOLIO ABBREVIATIONS: |
| AGC | Assured Guaranty Corp. |
| AGM | Assured Guaranty Municipal Corp. |
| AMBAC | American Municipal Bond Assurance Corp. |
| AMT | Alternative Minimum Tax |
| CR | Custodial Receipts |
| ETM | Escrowed to Maturity |
| FGIC | Financial Guaranty Insurance Co. |
| FHLMC | Federal Home Loan Mortgage Corp. |
| FNMA | Federal National Mortgage Association |
| GNMA | Government National Mortgage Association |
| ICC | Insured Custody Certificate |
| NPFG | National Public Finance Guarantee |
| NR | Not Rated |
| * | | Any security not rated (“NR”) by any of the Nationally Recognized Statistical Rating Organizations (“NRSRO”) has been determined by the Investment Adviser to have sufficient quality to be ranked in the top four credit ratings if a credit rating were to be assigned by a NRSRO. |
| | | |
| ** | | The rate is an annualized seven-day yield at period end. |
| | | |
| † | | Calculated using the Moody’s rating unless otherwise noted. |
| | | |
| †† | | Pre-refunded bonds are bonds for which U.S. Government Obligations usually have been placed in escrow to retire the bonds at their earliest call date. Escrowed to Maturity Bonds are bonds where money has been placed in the escrow account which is used to pay principal and interest through the bond’s originally scheduled maturity date. Escrowed to Maturity are shown as ETM. All other securities in the category are pre-refunded. |
See accompanying notes to financial statements.
20 | Hawaiian Tax-Free Trust
| HAWAIIAN TAX-FREE TRUST |
| STATEMENT OF ASSETS AND LIABILITIES |
| MARCH 31, 2016 |
| ASSETS | | | |
| Investments at value (cost $730,533,966) | | $ | 773,899,418 | |
| Interest receivable | | | 9,337,969 | |
| Receivable for Trust shares sold | | | 541,841 | |
| Other assets | | | 88,776 | |
| Total assets | | | 783,868,004 | |
| LIABILITIES | | | | |
| Payable for investment securities purchased | | | 8,782,696 | |
| Payable for Trust shares redeemed | | | 1,141,562 | |
| Advisory and Administrative fees payable | | | 293,714 | |
| Dividends payable | | | 154,491 | |
| Distribution and service fees payable | | | 5,411 | |
| Accrued expenses payable | | | 105,397 | |
| Total liabilities | | | 10,483,271 | |
| NET ASSETS | | $ | 773,384,733 | |
| Net Assets consist of: | | | | |
| Capital Stock – Authorized an unlimited number of shares, | | | | |
| par value $0.01 per share | | $ | 666,168 | |
| Additional paid-in capital | | | 733,750,025 | |
| Net unrealized appreciation on investments (note 4) | | | 43,365,452 | |
| Accumulated net realized loss on investments | | | (4,396,912 | ) |
| | | $ | 773,384,733 | |
| CLASS A | | | | |
| Net Assets | | $ | 672,420,528 | |
| Capital shares outstanding | | | 57,922,938 | |
| Net asset value and redemption price per share | | $ | 11.61 | |
| Maximum offering price per share (100/96 of $11.61) | | $ | 12.09 | |
| CLASS C | | | | |
| Net Assets | | $ | 54,698,099 | |
| Capital shares outstanding | | | 4,714,803 | |
| Net asset value and offering price per share | | $ | 11.60 | |
| Redemption price per share (*a charge of 1% is imposed | | | | |
| on the redemption proceeds, or on the original price, | | | | |
| whichever is lower, if redeemed during the first 12 | | | | |
| months after purchase) | | $ | 11.60 | * |
| CLASS Y | | | | |
| Net Assets | | $ | 46,266,106 | |
| Capital shares outstanding | | | 3,979,070 | |
| Net asset value, offering and redemption price per share | | $ | 11.63 | |
See accompanying notes to financial statements.
21 | Hawaiian Tax-Free Trust
| HAWAIIAN TAX-FREE TRUST |
| STATEMENT OF OPERATIONS |
| YEAR ENDED MARCH 31, 2016 |
| Investment Income: | | | | | | |
| | | | | | | |
| Interest income | | | | | $ | 23,356,652 | |
| | | | | | | | |
| Expenses: | | | | | | | |
| | |
| Investment Adviser fees (note 3) | | $ | 1,775,998 | | | | | |
| Distribution and service fees (note 3) | | | 1,920,251 | | | | | |
| Administrator/Business Manager fees (note 3) | | | 1,698,774 | | | | | |
| Transfer and shareholder servicing agent fees | | | 422,243 | | | | | |
| Trustees’ fees and expenses (note 8) | | | 221,683 | | | | | |
| Legal fees | | | 194,725 | | | | | |
| Fund accounting fees | | | 156,839 | | | | | |
| Shareholders’ reports and proxy statements | | | 146,748 | | | | | |
| Insurance | | | 39,027 | | | | | |
| Custodian fees (note 6) | | | 37,211 | | | | | |
| Registration fees and dues | | | 33,552 | | | | | |
| Auditing and tax fees | | | 27,401 | | | | | |
| Chief compliance officer services (note 3) | | | 7,395 | | | | | |
| Miscellaneous | | | 87,077 | | | | | |
| Total expenses | | | 6,768,924 | | | | | |
| | |
| Expenses paid indirectly (note 6) | | | (577 | ) | | | | |
| Net expenses | | | | | | | 6,768,347 | |
| Net investment income | | | | | | | 16,588,305 | |
| | |
| Realized and Unrealized Gain (Loss) on Investments: | | | | | | | | |
| | |
| Net realized gain (loss) from securities | | | | | | | | |
| transactions | | | 591,989 | | | | | |
| Change in unrealized appreciation on | | | | | | | | |
| investments | | | 4,686,317 | | | | | |
| | |
| Net realized and unrealized gain | | | | | | | | |
| on investments | | | | | | | 5,278,306 | |
| Net change in net assets resulting from | | | | | | | | |
| operations | | | | | | $ | 21,866,611 | |
See accompanying notes to financial statements.
22 | Hawaiian Tax-Free Trust
| HAWAIIAN TAX-FREE TRUST |
| STATEMENTS OF CHANGES IN NET ASSETS |
| | | Year Ended | | | Year Ended | |
| | | March 31, 2016 | | | March 31, 2015 | |
| OPERATIONS: | | | | | | |
| Net investment income | | $ | 16,588,305 | | | $ | 19,728,778 | |
| Net realized gain (loss) from securities | | | | | | | | |
| transactions | | | 591,989 | | | | 601,455 | |
| Change in unrealized appreciation on | | | | | | | | |
| investments | | | 4,686,317 | | | | 10,986,723 | |
| Net change in net assets resulting from | | | | | | | | |
| operations | | | 21,866,611 | | | | 31,316,956 | |
| | |
| DISTRIBUTIONS TO SHAREHOLDERS (note 10): | | | | | | | | |
| Class A Shares: | | | | | | | | |
| Net investment income | | | (14,673,321 | ) | | | (17,511,442 | ) |
| | |
| Class C Shares: | | | | | | | | |
| Net investment income | | | (818,194 | ) | | | (1, 163,585 | ) |
| | |
| Class Y Shares: | | | | | | | | |
| Net investment income | | | (1,096,785 | ) | | | (1,053,751 | ) |
| Change in net assets from distributions | | | (16,588,300 | ) | | | (19,728,778 | ) |
| | |
| CAPITAL SHARE TRANSACTIONS (note 7): | | | | | | | | |
| Proceeds from shares sold | | | 61,458,941 | | | | 65,472,325 | |
| Reinvested dividends and distributions | | | 12,973,689 | | | | 14,718,601 | |
| Cost of shares redeemed | | | (93,222,507 | ) | | | (94,484,783 | ) |
| Change in net assets from capital share | | | | | | | | |
| transactions | | | (18,789,877 | ) | | | (14,293,857 | ) |
| | |
| Change in net assets | | | (13,511,566 | ) | | | (2,705,679 | ) |
| | |
| NET ASSETS: | | | | | | | | |
| Beginning of period | | | 786,896,299 | | | | 789,601,978 | |
| | |
| End of period | | $ | 773,384,733 | | | $ | 786,896,299 | |
See accompanying notes to financial statements.
23 | Hawaiian Tax-Free Trust
| HAWAIIAN TAX-FREE TRUST |
| NOTES TO FINANCIAL STATEMENTS |
| MARCH 31, 2016 |
1. Organization
Hawaiian Tax-Free Trust (the “Trust”), a non-diversified, open-end investment company, was organized on May 7, 1984, as a Massachusetts business trust and commenced operations on February 20, 1985. The Trust is authorized to issue an unlimited number of shares. Class A Shares are sold at net asset value plus a sales charge of varying size (depending upon a variety of factors) paid at the time of purchase and bear a distribution fee. Class C Shares are sold at net asset value with no sales charge payable at the time of purchase but with a level charge for service and distribution fees for six years thereafter. Class C Shares automatically convert to Class A Shares after six years. Class Y Shares are sold only through authorized financial institutions acting for investors in a fiduciary, advisory, agency, custodial or similar capacity, and are not offered directly to retail customers. Class Y Shares are sold at net asset value with no sales charge, no redemption fee, no contingent deferred sales charge (“CDSC”) and no distribution fee. Class I Shares are offered and sold only through financial intermediaries and are not offered directly to retail customers. Class I Shares are sold at net asset value with no sales charge and no redemption fee or CDSC, although a financial intermediary may charge a fee for effecting a purchase or other transaction on behalf of its customers. Class I Shares carry a distribution and a service fee. As of the report date, there were no Class I Shares outstanding. All classes of shares represent interests in the same portfolio of investments and are identical as to rights and privileges but differ with respect to the effect of sales charges, the distribution and/or service fees borne by each class, expenses specific to each class, voting rights on matters affecting a single class and the exchange privileges of each class.
2. Significant Accounting Policies
The following is a summary of significant accounting policies followed by the Trust in the preparation of its financial statements. The policies are in conformity with accounting principles generally accepted in the United States of America for investment companies.
| a) | Portfolio valuation: Municipal securities are valued each business day based upon information provided by a nationally prominent independent pricing service and periodically verified through other pricing services. In the case of securities for which market quotations are readily available, securities are valued by the pricing service at the mean of bid and asked quotations. If a market quotation or a valuation from the pricing service is not readily available, the security is valued at fair value determined in good faith under procedures established by and under the general supervision of the Board of Trustees. |
| b) | Fair value measurements: The Trust follows a fair value hierarchy that distinguishes between market data obtained from independent sources (observable inputs) and the Trust’s own market assumptions (unobservable inputs). These inputs are used in determining the value of the Trust’s investments and are summarized in the following fair value hierarchy: |
24 | Hawaiian Tax-Free Trust
| HAWAIIAN TAX-FREE TRUST |
| NOTES TO FINANCIAL STATEMENTS (continued) |
| MARCH 31, 2016 |
Level 1 – Unadjusted quoted prices in active markets for identical assets or liabilities that the Trust has the ability to access.
Level 2 – Observable inputs other than quoted prices included in Level 1 that are observable for the asset or liability, either directly or indirectly. These inputs may include quoted prices for the identical instrument on an inactive market, prices for similar instruments, interest rates, prepayment speeds, credit risk, yield curves, default rates and similar data.
Level 3 – Unobservable inputs for the asset or liability, to the extent relevant observable inputs are not available, representing the Trust’s own assumptions about the assumptions a market participant would use in valuing the asset or liability, based on the best information available.
The inputs or methodology used for valuing securities are not an indication of the risk associated with investing in those securities.
The following is a summary of the valuation inputs, representing 100% of the Trust’s investments, used to value the Trust’s net assets as of March 31, 2016:
| Valuation Inputs* | | | Investments in Securities | |
| Level 1 – Quoted Prices - Short-Term Investment | | $ | 16,516,695 | |
| Level 2 – Other Significant Observable | | | | |
| Inputs – Municipal Bonds | | | 757,382,723 | |
| Level 3 – Significant Unobservable Inputs | | | – | |
| Total | | $ | 773,899,418 | |
*See schedule of investments for a detailed listing of securities.
| c) | Subsequent events: In preparing these financial statements, the Trust has evaluated events and transactions for potential recognition or disclosure through the date these financial statements were issued. |
| d) | Securities transactions and related investment income: Securities transactions are recorded on the trade date. Realized gains and losses from securities transactions are reported on the identified cost basis. Interest income is recorded daily on the accrual basis and is adjusted for amortization of premium and accretion of original issue discount and market discount. |
| e) | Federal income taxes: It is the policy of the Trust to continue to qualify as a regulated investment company by complying with the provisions of the Internal Revenue Code applicable to certain investment companies. The Trust intends to make distributions of income and securities profits sufficient to relieve it from all, or substantially all, Federal income and excise taxes. |
Management has reviewed the tax positions for each of the open tax years (2013–2015) or expected to be taken in the Fund’s 2016 tax returns and has concluded that there are no significant uncertain tax positions that would require recognition in the financial statements.
25 | Hawaiian Tax-Free Trust
HAWAIIAN TAX-FREE TRUST
NOTES TO FINANCIAL STATEMENTS (continued)
MARCH 31, 2016
| f) | Multiple class allocations: All income, expenses (other than class-specific expenses), and realized and unrealized gains or losses are allocated daily to each class of shares based on the relative net assets of each class. Class-specific expenses, which include distribution and service fees and any other items that are specifically attributed to a particular class, are also charged directly to such class on a daily basis. |
| g) | Use of estimates: The preparation of financial statements in conformity with accounting principles generally accepted in the United States of America requires management to make estimates and assumptions that affect the reported amounts of assets and liabilities and disclosure of contingent assets and liabilities at the date of the financial statements and the reported amounts of increases and decreases in net assets from operations during the reporting period. Actual results could differ from those estimates. |
| h) | Reclassification of capital accounts: Accounting principles generally accepted in the United States of America require that certain components of net assets relating to permanent differences be reclassified between financial and tax reporting. On March 31, 2016, the Trust decreased additional paid-in capital by $1,251,412 and decreased accumulated net realized loss by $1,251,412. These reclassifications had no effect on net assets or net asset value per share. |
| i) | The Trust is an investment company and accordingly follows the investment company accounting and reporting guidance of the Financial Accounting Standards Board (“FASB”) Accounting Standard Codification Topic 946 “Financial Services-Investment Companies”. |
| j) | In May 2015, FASB issued Accounting Standards Update (“ASU”) N0. 2015-07 “Disclosure for Investments in Certain Entities that Calculate Net Asset Value (“NAV”) per Share (or Its Equivalent).” The amendments in ASU No. 2015-07 remove the requirement to categorize within the fair value hierarchy investments measured using the NAV practical expedient. The ASU also removes certain disclosure requirements for investments that qualify, but do not utilize, the NAV practical expedient. The amendments in the ASU are effective for fiscal years beginning after December 15, 2015, and interim periods within those fiscal years. Management is currently evaluating the impact these changes will have on the Trust’s financial statements and related disclosures. |
3. Fees and Related Party Transactions
a) Management Arrangements:
The Asset Management Group of Bank of Hawaii (“the Adviser”), serves as Investment Adviser to the Trust. In this role, under an Investment Advisory Agreement, the Adviser supervises the Trust’s investments. Aquila Investment Management LLC (the “Administrator/ Business Manager”), a wholly-owned subsidiary of Aquila Management Corporation, the Trust’s founder and sponsor, serves as the Administrator/Business Manager for the Trust under an Administration and Business Management Agreement with the Trust. The Administrator/Business Manager provides all administrative services to the Trust other than those relating to its investment portfolio. These include providing the office of the Trust and all related services as well as overseeing the activities of all the various support organizations to the Trust such as the shareholder servicing agent, fund accounting agent, custodian, legal counsel, auditors and distributor.
26 | Hawaiian Tax-Free Trust
| HAWAIIAN TAX-FREE TRUST |
| NOTES TO FINANCIAL STATEMENTS (continued) |
| MARCH 31, 2016 |
The Trust pays the Adviser a fee which is payable monthly and computed on the net assets of the Trust as of the close of business each day at the annual rate of 0.23% of the Trust’s net assets up to and including $875 million; 0.17% of the Trust’s net assets between $875 million and $1.5 billion; and 0.155% of the Trust’s net assets over $1.5 billion. For its services, the Administrator/Business Manager is entitled to receive a fee which is payable monthly and computed as of the close of business each day at the annual rate of 0.22% of the Trust’s net assets.
Under a Compliance Agreement with the Administrator/Business Manager, the Administrator/Business Manager is additionally compensated by the Trust for Chief Compliance Officer related services provided to enable the Trust to comply with Rule 38a-1 of the Investment Company Act of 1940.
Specific details as to the nature and extent of the services provided by the Adviser and the Administrator/Business Manager are more fully defined in the Trust’s Prospectus and Statement of Additional Information.
b) Distribution and Service Fees:
Effective March 1, 2016, Aquila Distributors, Inc. merged its assets, liabilities and operations with and into Aquila Distributors LLC, which at such time, became the principal underwriter of the Trust. There was no change in control or management, no automatic assignment or termination of agreements, and no change in the capitalization, operations, business or business plans as a result of the merger (individually and collectively both firms shall be referred to as the “Distributor”).
The Trust has adopted a Distribution Plan (the “Plan”) pursuant to Rule 12b-1 (the “Rule”) under the Investment Company Act of 1940. Under one part of the Plan, with respect to Class A Shares, the Trust is authorized to make distribution fee payments to broker-dealers or others (“Qualified Recipients”) selected by the Distributor, including, but not limited to, any principal underwriter of the Trust, with which the Distributor has entered into written agreements contemplated by the Rule and which have rendered assistance in the distribution and/or retention of the Trust’s shares or servicing of shareholder accounts. The Trust makes payment of this distribution fee at the annual rate of 0.20% of the Trust’s average net assets represented by Class A Shares. For the year ended March 31, 2016, service fees on Class A Shares amounted to $1,336,016 of which the Distributor retained $63,310.
Under another part of the Plan, the Trust is authorized to make payments with respect to Class C Shares to Qualified Recipients which have rendered assistance in the distribution and/or retention of the Trust’s Class C shares or servicing of shareholder accounts. These payments are made at the annual rate of 0.75% of the Trust’s average net assets represented by Class C Shares and for the year ended March 31, 2016, amounted to $438,176. In addition, under a Shareholder Services Plan, the Trust is authorized to make service fee payments with respect to Class C Shares to Qualified Recipients for providing personal services and/or maintenance of shareholder accounts. These payments are made at the annual rate of 0.25% of the Trust’s average net assets represented by Class C Shares and for the year ended March 31, 2016, amounted to $146,059. The total of these payments made with respect to Class C Shares amounted to $584,235 of which the Distributor retained $136,160.
27 | Hawaiian Tax-Free Trust
| HAWAIIAN TAX-FREE TRUST |
| NOTES TO FINANCIAL STATEMENTS (continued) |
| MARCH 31, 2016 |
Specific details about the Plans are more fully defined in the Trust’s Prospectus and Statement of Additional Information.
Under a Distribution Agreement, the Distributor serves as the exclusive distributor of the Trust’s shares. Through agreements between the Distributor and various brokerage and advisory firms (“intermediaries”), the Trust’s shares are sold primarily through the facilities of these intermediaries having offices within Hawaii, with the bulk of any sales commissions inuring to such intermediaries. For the year ended March 31, 2016, total commissions on sales of Class A Shares amounted to $674,152, of which the Distributor received $62,439.
4. Purchases and Sales of Securities
During the year ended March 31, 2016, purchases of securities and proceeds from the sales of securities aggregated $120,956,981 and $137,318,928, respectively.
At March 31, 2016, the aggregate tax cost for all securities was $730,533,966. At March 31, 2016, the aggregate gross unrealized appreciation for all securities in which there is an excess of value over tax cost amounted to $43,405,902 and aggregate gross unrealized depreciation for all securities in which there is an excess of tax cost over value amounted to $40,450 for a net unrealized appreciation of $43,365,452.
5. Portfolio Orientation
Since the Trust invests principally and may invest entirely in double tax-free municipal obligations of issuers within Hawaii, it is subject to possible risks associated with economic, political, or legal developments or industrial or regional matters specifically affecting Hawaii and whatever effects these may have upon Hawaii issuers’ ability to meet their obligations.
6. Expenses
The Trust negotiated an expense offset arrangement with its prior custodian wherein it received credit toward the reduction of custodian fees and other Trust expenses whenever there were uninvested cash balances. The Statement of Operations reflects the total expenses before any offset, the amount of offset, if any, and the net expenses.
28 | Hawaiian Tax-Free Trust
| HAWAIIAN TAX-FREE TRUST |
| NOTES TO FINANCIAL STATEMENTS (continued) |
| MARCH 31, 2016 |
7. Capital Share Transactions
Transactions in Capital Shares of the Trust were as follows:
| | | Year Ended | | | Year Ended | |
| | | March 31, 2016 | | | March 31, 2015 | |
| | | Shares | | | Amount | | | Shares | | | Amount | |
| Class A Shares: | | | | | | | | | | | | |
| Proceeds from shares sold | | | 3,613,385 | | | $ | 41,467,038 | | | $ | 3,296,636 | | | | 37,983,177 | |
| Reinvested distributions | | | 1,022,981 | | | | 11,747,048 | | | | 1,161,983 | | | | 13,386,967 | |
| Cost of shares redeemed | | | (5,545,670 | ) | | | (63,587,511 | ) | | | (6,131,972 | ) | | | (70,513,812 | ) |
| Net change | | | (909,304 | ) | | | (10,373,425 | ) | | | (1,673,353 | ) | | | (19,143,668 | ) |
| Class C Shares: | | | | | | | | | | | | | | | | |
| Proceeds from shares sold | | | 820,429 | | | | 9,416,234 | | | | 783,599 | | | | 9,041,520 | |
| Reinvested distributions | | | 53,508 | | | | 613,860 | | | | 71,487 | | | | 822,946 | |
| Cost of shares redeemed | | | (1,655,772 | ) | | | (18,969,125 | ) | | | (1,491,645 | ) | | | (17,154,535 | ) |
| Net change | | | (781,835 | ) | | | (8,939,031 | ) | | | (636,559 | ) | | | (7,290,069 | ) |
| Class Y Shares: | | | | | | | | | | | | | | | | |
| Proceeds from shares sold | | | 919,425 | | | | 10,575,669 | | | | 1,595,937 | | | | 18,447,628 | |
| Reinvested distributions | | | 53,255 | | | | 612,781 | | | | 44,025 | | | | 508,688 | |
| Cost of shares redeemed | | | (929,623 | ) | | | (10,665,871 | ) | | | (589,630 | ) | | | (6,816,436 | ) |
| Net change | | | 43,057 | | | | 522,579 | | | | 1,050,332 | | | | 12,139,880 | |
| Total transactions in Trust | | | | | | | | | | | | | | | | |
| shares | | | (1,648,082 | ) | | $ | (18,789,877 | ) | | | (1,259,580 | ) | | $ | (14,293,857 | ) |
8. Trustees’ Fees and Expenses
At March 31, 2016, there were 5 Trustees, one of whom is affiliated with the Administrator/Business Manager and is not paid any fees. The total amount of Trustees’ service fees (for carrying out their responsibilities) and attendance fees paid during the year ended March 31, 2016 was $182,381. Attendance fees are paid to those in attendance at regularly scheduled quarterly Board Meetings and meetings of the Independent Trustees held prior to each quarterly Board Meeting, as well as additional meetings (such as Audit, Nominating, Shareholder and special meetings). Trustees are reimbursed for their expenses such as travel, accommodations and meals incurred in connection with attendance at Board Meetings and the Annual and Outreach Meetings of Shareholders. For the year ended March 31, 2016, such meeting-related expenses amounted to $39,302.
9. Securities Traded on a When-Issued Basis
The Trust may purchase or sell securities on a when-issued basis. When-issued transactions arise when securities are purchased or sold by the Trust with payment and delivery taking place in the future in order to secure what is considered to be an advantageous price and yield to the Trust at the time of entering into the transaction. Beginning on the date the Trust enters into a when-issued transaction, cash or other liquid securities are segregated in an amount equal to or greater than the value of the when-issued transaction. These transactions are subject to market fluctuations and their current value is determined in the same manner as for other securities.
29 | Hawaiian Tax-Free Trust
| HAWAIIAN TAX-FREE TRUST |
| NOTES TO FINANCIAL STATEMENTS (continued) |
| MARCH 31, 2016 |
10. Income Tax Information and Distributions
The Trust declares dividends daily from net investment income and makes payments monthly. Net realized capital gains, if any, are distributed annually and are taxable. These distributions are paid in additional shares at the net asset value per share, in cash, or in a combination of both, at the shareholder’s option.
The Trust intends to maintain, to the maximum extent possible, the tax-exempt status of interest payments received from portfolio municipal securities in order to allow dividends paid to shareholders from net investment income to be exempt from regular Federal and State of Hawaii income taxes. Due to differences between financial statement reporting and Federal income tax reporting requirements, distributions made by the Trust may not be the same as the Trust’s net investment income, and/or net realized securities gains. Further, a portion of the dividends and distributions may, under some circumstances, be subject to taxes at ordinary income and/or capital gain rates. For certain shareholders, some dividend income may, under some circumstances, be subject to the alternative minimum tax. As a result of the passage of the Regulated Investment Company Act of 2010 (the “Act”), losses incurred in this fiscal year and beyond retain their character as short-term or long-term, have no expiration date and are utilized before capital losses incurred prior to the enactment of the Act. At March 31, 2016 the Trust had a capital loss carryover of $4,396,912, of which, $1,089,808 expires in 2017, $3,244,561 expires in 2018, and $62,543 expires in 2019. This carryover is available to offset future net realized gains on securities transactions to the extent provided for in the Internal Revenue Code.
The tax character of distributions was as follows:
| | | Year Ended | | | Year Ended | |
| | | March 31, | | | March 31, | |
| | | 2016 | | | 2015 | |
| Net tax-exempt income | | $ | 16,494,404 | | | $ | 19,630,531 | |
| Ordinary income | | | 93,896 | | | | 98,247 | |
| | | $ | 16,588,300 | | | $ | 19,728,778 | |
As of March 31, 2016, the components of distributable earnings on a tax basis were as follows:
| Unrealized appreciation | | $ | 43,365,452 | | | | | |
| Undistributed tax-exempt income | | | 154,496 | | | | | |
| Other accumulated losses | | | (4,396,912 | ) | | | | |
| Other temporary differences | | | (154,491 | ) | | | | |
| | | $ | 38,968,545 | | | | | |
The difference between book basis and tax basis undistributed income is due to the timing difference, and other temporary differences, in recognizing dividends paid.
30 | Hawaiian Tax-Free Trust
| HAWAIIAN TAX-FREE TRUST |
| FINANCIAL HIGHLIGHTS |
For a share outstanding throughout each period
| | | Class A | |
| | | Year Ended March 31, | |
| | | 2016 | | | 2015 | | | 2014 | | | 2013 | | | 2012 | |
| Net asset value, beginning of period | | $ | 11.53 | | | $ | 11.36 | | | $ | 11.74 | | | $ | 11.64 | | | $ | 11.17 | |
| Income (loss) from investment operations: | | | | | | | | | | | | | | | | | | | | |
Net investment income(1) | | | 0.25 | | | | 0.30 | | | | 0.30 | | | | 0.30 | | | | 0.34 | |
| Net gain (loss) on securities (both | | | | | | | | | | | | | | | | | | | | |
| realized and unrealized) | | | 0.08 | | | | 0.17 | | | | (0.38 | ) | | | 0.10 | | | | 0.47 | |
| Total from investment operations | | | 0.33 | | | | 0.47 | | | | (0.08 | ) | | | 0.40 | | | | 0.81 | |
| Less distributions (note 10): | | | | | | | | | | | | | | | | | | | | |
| Dividends from net investment income | | | (0.25 | ) | | | (0.30 | ) | | | (0.30 | ) | | | (0.30 | ) | | | (0.34 | ) |
| Distributions from capital gains | | | – | | | | – | | | | – | | | | – | | | | – | |
| Total distributions | | | (0.25 | ) | | | (0.30 | ) | | | (0.30 | ) | | | (0.30 | ) | | | (0.34 | ) |
| Net asset value, end of period | | $ | 11.61 | | | $ | 11.53 | | | $ | 11.36 | | | $ | 11.74 | | | $ | 11.64 | |
| Total return (not reflecting sales charge) | | | 2.93 | % | | | 4.14 | % | | | (0.63 | )% | | | 3.49 | % | | | 7.34 | % |
| Ratios/supplemental data | | | | | | | | | | | | | | | | | | | | |
| Net assets, end of period (in millions) | | $ | 672 | | | $ | 678 | | | $ | 687 | | | $ | 774 | | | $ | 751 | |
| Ratio of expenses to average net assets | | | 0.83 | % | | | 0.81 | % | | | 0.82 | % | | | 0.79 | % | | | 0.74 | % |
| Ratio of net investment income to | | | | | | | | | | | | | | | | | | | | |
| average net assets | | | 2.20 | % | | | 2.57 | % | | | 2.65 | % | | | 2.58 | % | | | 2.97 | % |
| Portfolio turnover rate | | | 16 | % | | | 14 | % | | | 4 | % | | | 9 | % | | | 20 | % |
| | |
| The expense ratios after giving effect to the expense offset for uninvested cash balances were: | |
| | |
| Ratio of expenses to average net assets | | | 0.83 | % | | | 0.81 | % | | | 0.82 | % | | | 0.79 | % | | | 0.74 | % |
__________________
| (1) | Per share amounts have been calculated using the daily average shares method. |
See accompanying notes to financial statements.
31 | Hawaiian Tax-Free Trust
| HAWAIIAN TAX-FREE TRUST |
| FINANCIAL HIGHLIGHTS (continued) |
For a share outstanding throughout each period
| | | Class C | |
| | | Year Ended March 31, | |
| | | 2016 | | | 2015 | | | 2014 | | | 2013 | | | 2012 | |
| Net asset value, beginning of period | | $ | 11.52 | | | $ | 11.35 | | | $ | 11.73 | | | $ | 11.63 | | | $ | 11.16 | |
| Income (loss) from investment operations: | | | | | | | | | | | | | | | | | | | | |
Net investment income(1) | | | 0.16 | | | | 0.20 | | | | 0.21 | | | | 0.21 | | | | 0.25 | |
| Net gain (loss) on securities (both | | | | | | | | | | | | | | | | | | | | |
| realized and unrealized) | | | 0.08 | | | | 0.17 | | | | (0.37 | ) | | | 0.10 | | | | 0.47 | |
| Total from investment operations | | | 0.24 | | | | 0.37 | | | | (0.16 | ) | | | 0.31 | | | | 0.72 | |
| Less distributions (note 10): | | | | | | | | | | | | | | | | | | | | |
| Dividends from net investment income | | | (0.16 | ) | | | (0.20 | ) | | | (0.22 | ) | | | (0.21 | ) | | | (0.25 | ) |
| Distributions from capital gains | | | – | | | | – | | | | – | | | | – | | | | – | |
| Total distributions | | | (0.16 | ) | | | (0.20 | ) | | | (0.22 | ) | | | (0.21 | ) | | | (0.25 | ) |
| Net asset value, end of period | | $ | 11.60 | | | $ | 11.52 | | | $ | 11.35 | | | $ | 11.73 | | | $ | 11.63 | |
| Total return (not reflecting CDSC) | | | 2.11 | % | | | 3.31 | % | | | (1.38 | )% | | | 2.67 | % | | | 6.49 | % |
| Ratios/supplemental data | | | | | | | | | | | | | | | | | | | | |
| Net assets, end of period (in millions) | | $ | 55 | | | $ | 63 | | | $ | 70 | | | $ | 92 | | | $ | 79 | |
| Ratio of expenses to average net assets | | | 1.63 | % | | | 1.61 | % | | | 1.62 | % | | | 1.59 | % | | | 1.54 | % |
| Ratio of net investment income to | | | | | | | | | | | | | | | | | | | | |
| average net assets | | | 1.40 | % | | | 1.78 | % | | | 1.85 | % | | | 1.77 | % | | | 2.15 | % |
| Portfolio turnover rate | | | 16 | % | | | 14 | % | | | 4 | % | | | 9 | % | | | 20 | % |
| | |
| The expense ratios after giving effect to the expense offset for uninvested cash balances were: | |
| | |
| Ratio of expenses to average net assets | | | 1.63 | % | | | 1.61 | % | | | 1.62 | % | | | 1.58 | % | | | 1.54 | % |
__________________
| (1) | Per share amounts have been calculated using the daily average shares method. |
See accompanying notes to financial statements.
32 | Hawaiian Tax-Free Trust
| HAWAIIAN TAX-FREE TRUST |
| FINANCIAL HIGHLIGHTS (continued) |
For a share outstanding throughout each period
| | | Class Y | |
| | | Year Ended March 31, | |
| | | 2016 | | | 2015 | | | 2014 | | | 2013 | | | 2012 | |
| Net asset value, beginning of period | | $ | 11.55 | | | $ | 11.38 | | | $ | 11.76 | | | $ | 11.66 | | | $ | 11.19 | |
| Income (loss) from investment operations: | | | | | | | | | | | | | | | | | | | | |
Net investment income(1) | | | 0.28 | | | | 0.32 | | | | 0.33 | | | | 0.33 | | | | 0.36 | |
| Net gain (loss) on securities (both | | | | | | | | | | | | | | | | | | | | |
| realized and unrealized) | | | 0.08 | | | | 0.17 | | | | (0.38 | ) | | | 0.10 | | | | 0.47 | |
| Total from investment operations | | | 0.36 | | | | 0.49 | | | | (0.05 | ) | | | 0.43 | | | | 0.83 | |
| Less distributions (note 10): | | | | | | | | | | | | | | | | | | | | |
| Dividends from net investment income | | | (0.28 | ) | | | (0.32 | ) | | | (0.33 | ) | | | (0.33 | ) | | | (0.36 | ) |
| Distributions from capital gains | | | – | | | | – | | | | – | | | | – | | | | – | |
| Total distributions | | | (0.28 | ) | | | (0.32 | ) | | | (0.33 | ) | | | (0.33 | ) | | | (0.36 | ) |
| Net asset value, end of period | | $ | 11.63 | | | $ | 11.55 | | | $ | 11.38 | | | $ | 11.76 | | | $ | 11.66 | |
| Total return | | | 3.14 | % | | | 4.34 | % | | | (0.43 | )% | | | 3.69 | % | | | 7.55 | % |
| Ratios/supplemental data | | | | | | | | | | | | | | | | | | | | |
| Net assets, end of period (in millions) | | $ | 46 | | | $ | 45 | | | $ | 33 | | | $ | 39 | | | $ | 30 | |
| Ratio of expenses to average net assets | | | 0.63 | % | | | 0.61 | % | | | 0.62 | % | | | 0.59 | % | | | 0.54 | % |
| Ratio of net investment income to | | | | | | | | | | | | | | | | | | | | |
| average net assets | | | 2.40 | % | | | 2.77 | % | | | 2.85 | % | | | 2.77 | % | | | 3.17 | % |
| Portfolio turnover rate | | | 16 | % | | | 14 | % | | | 4 | % | | | 9 | % | | | 20 | % |
| | |
| The expense ratios after giving effect to the expense offset for uninvested cash balances were: | |
| | |
| Ratio of expenses to average net assets | | | 0.63 | % | | | 0.61 | % | | | 0.62 | % | | | 0.59 | % | | | 0.54 | % |
__________________
| (1) | Per share amounts have been calculated using the daily average shares method. |
See accompanying notes to financial statements.
33 | Hawaiian Tax-Free Trust
Additional Information (unaudited)
Trustees(1)
and Officers
Name, Address(2) and Year of Birth | | Positions Held with Fund and Length of Service(3) | | Principal Occupation(s) During Past 5 Years | | Number of Portfolios In Fund Complex(4) Overseen by Trustee | | Other Directorships Held by Trustee During Past 5 Years |
| | | | | | | | | |
Interested Trustee | | | | | | | | |
| | | | | | | | | |
Diana P. Herrmann New York, NY (1958) (5) | | Vice Chair of the Board of Trustees since 2003, President since 1998 and Trustee since 1994 | | Vice Chair and Chief Executive Officer of Aquila Management Corporation, Founder and Sponsor of the Aquila Group of Funds(6) and parent of Aquila Investment Management LLC, Administrator, since 2004, President since 1997, Chief Operating Officer, 1997-2008, a Director since 1984, Secretary since 1986 and previously its Executive Vice President, Senior Vice President or Vice President, 1986-1997; Chief Executive Officer and Vice Chair since 2004, President and Manager since 2003, and Chief Operating Officer (2003-2008), of the Administrator; Chair, Vice Chair, President, Executive Vice President and/or Senior Vice President of funds in the Aquila Group of Funds since 1986; Manager of the Distributor since 1997; Governor, Investment Company Institute (the U.S. mutual fund industry trade organization dedicated to protecting shareholder interests and educating the public about investing) for various periods since 2004, and Chair of its Small Funds Committee, 2004-2009; active in charitable and volunteer organizations. | | 11 | | ICI Mutual Insurance Company, a Risk Retention Group, for various periods since 2006; formerly Vice Chair and Trustee of Pacific Capital Funds of Cash Assets Trust (three money-market funds in the Aquila Group of Funds) 2004-2012 |
34 | Hawaiian Tax-Free Trust
Name, Address(2) and Year of Birth | | Positions Held with Fund and Length of Service(3) | | Principal Occupation(s) During Past 5 Years | | Number of Portfolios In Fund Complex(4) Overseen by Trustee | | Other Directorships Held by Trustee During Past 5 Years |
| | | | | | | | | |
Non-Interested Trustees | | | | | | | | |
| | | | | | | | | |
Richard L. Humphreys Kaneohe, HI (1943) | | Chair of the Board since 2013 and Trustee since 2009 | | President, Hawaii Receivables Management, LLC (a factoring company) since 2001; President, Lynk Payment Systems Hawaii, LLC (credit card processing) since 2002; formerly Chairman, Bank of America, Hawaii; President, Hawaiian Trust Co.; President, First Federal S&L; and, E.V.P., Bank of Hawaii. | | 1 | | Board of Directors, The Castle Group, Inc.; Board of Directors, Kahua Ranch Ltd.; formerly Trustee, Pacific Capital Funds®; formerly Trustee of Pacific Capital Funds of Cash Assets Trust (three money-market funds in the Aquila Group of Funds) 2009-2012; formerly Board of Directors, Bishop Museum; formerly Board of Directors, Friends of the Cancer Research Center. |
| | | | | | | | | |
Bert A. Kobayashi, Jr. Honolulu, HI (1970) | | Trustee since 2009 | | Managing Partner, BlackSand Capital, LLC (private equity real estate investment company) since 2010; Partner, Kobayashi Group, LLC (a group of companies primarily engaged in real estate enterprises) since 2001; Managing Director, KG Holdings, LLC (real estate investment) since 2009; Vice President, Nikken Holdings, LLC (real estate investment) from 2003 to 2010; interested in a number of other real estate companies in Hawaii. | | 1 | | Hawaiian Electric Company, Inc.; formerly Trustee of Pacific Capital Funds of Cash Assets Trust (three money-market funds in the Aquila Group of Funds) 2009-2012 |
35 | Hawaiian Tax-Free Trust
Name, Address(2) and Year of Birth | | Positions Held with Fund and Length of Service(3) | | Principal Occupation(s) During Past 5 Years | | Number of Portfolios In Fund Complex(4) Overseen by Trustee | | Other Directorships Held by Trustee During Past 5 Years |
| | | | | | | | | |
Glenn P. O’Flaherty Denver, CO (1958) | | Trustee since 2009 | | Chief Financial Officer and Chief Operating Officer of Lizard Investors, LLC, 2008; Co-Founder, Chief Financial Officer and Chief Compliance Officer of Three Peaks Capital Management, LLC, 2003-2005; Vice President – Investment Accounting, Global Trading and Trade Operations, Janus Capital Corporation, and Chief Financial Officer and Treasurer, Janus Funds, 1991-2002. | | 8 | | Formerly Trustee of Pacific Capital Funds of Cash Assets Trust (three money-market funds in the Aquila Group of Funds) 2009-2012 |
| | | | | | | | | |
Russell K. Okata Honolulu, HI (1944) | | Trustee since 1992 | | Executive Director, Hawaii Government Employees Association AFSCME Local 152, AFL-CIO 1981-2007; International Vice President, American Federation of State, County and Municipal Employees, AFL-CIO 1981-2007; Hawaii Democratic Party National Committeeman; member, State of Hawaii Long-term Care Commission; director of various civic and charitable organizations. | | 5 | | Hawaii Client Services (part of Hawaii Dental Services Group); formerly Trustee and Chairman, Pacific Capital Funds®; past Chair of the Royal State Group (insurance); formerly Trustee of Pacific Capital Funds of Cash Assets Trust (three money-market funds in the Aquila Group of Funds) 1993-2012 |
(1) The Trust’s Statement of Additional Information includes additional information about the Trustees and is available, without charge, upon request by calling 800-437-1020 (toll-free) or by visiting www.aquilafunds.com or the EDGAR Database at the SEC’s internet site at www.sec.gov.
(2) The mailing address of each Trustee is c/o Aquila Municipal Trust, 120 West 45th Street, Suite 3600, New York, NY 10036.
(3) Each Trustee holds office until his or her successor is elected or his or her earlier retirement or removal.
(4) Includes certain Aquila-sponsored funds that are dormant and have no public shareholders.
(5) Ms. Herrmann is an “interested person” of the Trust, as that term is defined in the Investment Company Act of 1940, as amended (the “1940 Act”), as an officer of the Trust, as a director, officer and shareholder of the Manager’s corporate parent, as an officer and Manager of the Manager, and as a shareholder and Manager of the Distributor.
(6) The “Aquila Group of Funds” includes: Aquila Tax-Free Trust of Arizona, Aquila Tax-Free Fund of Colorado, Hawaiian Tax-Free Trust, Aquila Churchill Tax-Free Fund of Kentucky, Aquila Tax-Free Trust of Oregon, Aquila Narragansett Tax-Free Income Fund (Rhode Island) and Aquila Tax-Free Fund For Utah, each of which is a tax-free municipal bond fund and are called the “Aquila Municipal Bond Funds”; Aquila Three Peaks Opportunity Growth Fund, which is an equity fund; and Aquila Three Peaks High Income Fund, which is a high-income corporate bond fund.
36 | Hawaiian Tax-Free Trust
Name and Year of Birth (2) | | Positions Held with Trust and Length of Service(2) | | Principal Occupation(s) During Past 5 Years(3) |
| | | | | |
| Officers(1) | | | | |
| | | | | |
Charles E. Childs, III New York, NY (1957) | | Executive Vice President since 2003 and Secretary since 2011 | | Executive Vice President of all funds in the Aquila Group of Funds and the Administrator and the Administrator’s parent since 2003; Chief Operating Officer of the Administrator and the Administrator’s parent since 2008; Secretary of all funds in the Aquila Group of Funds since 2011; formerly Senior Vice President, corporate development, Vice President, Assistant Vice President and Associate of the Administrator’s parent since 1987; Executive Vice President, Senior Vice President, Vice President or Assistant Vice President of the Aquila money-market funds, 1988-2012; Manager of the Distributor since 2012. |
| | | | | |
Marie E. Aro Denver, CO (1955) | | Senior Vice President since 2010 | | Co-President, Aquila Distributors LLC since 2010, Vice President, 1993-1997; Senior Vice President of various funds in the Aquila Group of Funds: Senior Vice President, Aquila Municipal Trust since 2013; Senior Vice President, Aquila Funds Trust since 2013; Aquila Tax-Free Trust of Arizona since 2010 and Vice President, 2004-2010; Aquila Three Peaks High Income Fund since 2006; Hawaiian Tax-Free Trust and Aquila Tax-Free Trust of Oregon since 2010; Aquila Three Peaks Opportunity Growth Fund 2004-2013; Aquila Churchill Tax-Free Fund of Kentucky, Aquila Narragansett Tax-Free Income Fund, Aquila Tax-Free Fund For Utah, and Aquila Tax-Free Fund of Colorado 2010-2013; Vice President, INVESCO Funds Group, 1998-2003. |
| | | | | |
Sherri Foster Lahaina, HI (1950) | | Senior Vice President since 1993 | | Senior Vice President, Hawaiian Tax-Free Trust since 1993 and formerly Vice President or Assistant Vice President; Vice President 1997-2012 and formerly Assistant Vice President of three money-market funds in the Aquila Group of Funds; Vice President, Aquila Three Peaks Opportunity Growth Fund 2006-2013. |
| | | | | |
Paul G. O’Brien
Charlotte, NC (1959) | | Senior Vice President since 2010 | | Co-President, Aquila Distributors LLC since 2010, Managing Director, 2009-2010; Senior Vice President of various funds in the Aquila Group of Funds since 2010; Senior Vice President, Aquila Municipal Trust since 2013; Senior Vice President, Aquila Funds Trust since 2013; held various positions to Senior Vice President and Chief Administrative Officer of Evergreen Investments Services, Inc., 1997-2008; Mergers and Acquisitions Coordinator for Wachovia Corporation, 1994-1997. |
| | | | | |
Stephen J. Caridi New York, NY (1961) | | Vice President since 1998 | | Vice President of the Distributor since 1995; Vice President, Hawaiian Tax-Free Trust since 1998; Senior Vice President, Aquila Municipal Trust since 2013; Vice President, Aquila Funds Trust since 2013; Senior Vice President, Aquila Narragansett Tax-Free Income Fund 1998-2013, Vice President 1996-1997; Senior Vice President, Tax-Free Fund of Colorado 2004-2009; Vice President, Aquila Three Peaks Opportunity Growth Fund 2006-2013. |
| | | | | |
Randall S. Fillmore New York, NY (1960) | | Chief Compliance Officer since 2012 | | Chief Compliance Officer of all funds in the Aquila Group of Funds, the Administrator and the Distributor since 2012; Managing Director, Fillmore & Associates, 2009-2012; Fund and Adviser Chief Compliance Officer (2002-2009), Senior Vice President - Broker Dealer Compliance (2004-2009), Schwab Funds Anti Money Laundering Officer and Identity Theft Prevention Officer (2004-2009), Vice President - Internal Audit (2000-2002), Charles Schwab Corporation; National Director, Information Systems Risk Management - Consulting Services (1999-2000), National Director, Investment Management Audit and Business Advisory Services (1992-1999), Senior Manager, Manager, Senior and Staff Roles (1983-1992), PricewaterhouseCoopers LLP. |
37 | Hawaiian Tax-Free Trust
Name and Year of Birth (1) | | Positions Held with Trust and Length of Service(2) | | Principal Occupation(s) During Past 5 Years(3) |
| | | | | |
Joseph P. DiMaggio New York, NY (1956) | | Chief Financial Officer since 2003 and Treasurer since 2000 | | Chief Financial Officer of all funds in the Aquila Group of Funds since 2003 and Treasurer since 2000. |
| | | | | |
Yolonda S. Reynolds New York, NY (1960) | | Assistant Treasurer since 2010 | | Assistant Treasurer of all funds in the Aquila Group of Funds since 2010; Director of Fund Accounting for the Aquila Group of Funds since 2007; Investment Accountant, TIAA-CREF, 2007; Senior Fund Accountant, JP Morgan Chase, 2003-2006. |
| | | | | |
Lori A. Vindigni New York, NY (1966) | | Assistant Treasurer since 2000 | | Assistant Treasurer of all funds in the Aquila Group of Funds since 2000; Assistant Vice President of the Administrator or its predecessor and current parent since 1998; Fund Accountant for the Aquila Group of Funds, 1995-1998. |
(1) The mailing address of each officer is c/o Aquila Municipal Trust, 120 West 45th Street, Suite 3600, New York, NY 10036.
(2) The term of office of each officer is one year.
(3) The Trust’s Statement of Additional Information includes additional information about the officers and is available, without charge, upon request by calling 800-437-1020 (toll-free) or by visiting www.aquilafunds.com or the EDGAR Database at the SEC’s internet site at www.sec.gov.
38 | Hawaiian Tax-Free Trust
Analysis of Expenses (unaudited)
As a shareholder of the Trust, you may incur two types of costs: (1) transaction costs, including front-end sales charges with respect to Class A shares or contingent deferred sales charges (“CDSC”) with respect to Class C shares; and (2) ongoing costs, including management fees; distribution (“12b-1”) and/or service fees; and other Trust expenses. The table below is intended to help you understand your ongoing costs (in dollars) of investing in the Trust and to compare these costs with the ongoing costs of investing in other mutual funds.
The table below is based on an investment of $1,000 invested on October 1, 2015 and held for the six months ended March 31, 2016.
Actual Expenses
This table provides information about actual account values and actual expenses. You may use the information provided in this table, together with the amount you invested, to estimate the expenses that you paid over the period. To estimate the expenses you paid on your account, divide your ending account value by $1,000 (for example, an $8,600 ending account value divided by $1,000 = 8.6), then multiply the result by the number under the heading “Expenses Paid During the Period”.
Six months ended March 31, 2016
| | Actual | | | |
| | Total Return | Beginning | Ending | Expenses |
| | Without | Account | Account | Paid During |
| | Sales Charges(1) | Value | Value | the Period(2) |
| |
| Class A | 2.30% | $1,000.00 | $1,023.00 | $4.20 |
| |
| Class C | 1.89% | $1,000.00 | $1,018.90 | $8.23 |
| |
| Class Y | 2.40% | $1,000.00 | $1,024.00 | $3.19 |
| (1) | Assumes reinvestment of all dividends and capital gain distributions, if any, at net asset value and does not reflect the deduction of the applicable sales charges with respect to Class A shares or the applicable CDSC with respect to Class C shares. Total return is not annualized; as such, it may not be representative of the total return for the year. |
| (2) | Expenses are equal to the annualized expense ratio of 0.83%, 1.63% and 0.63% for the Trust’s Class A, C and Y shares, respectively, multiplied by the average account value over the period, multiplied by 183/366 (to reflect the one-half year period). |
39 | Hawaiian Tax-Free Trust
Analysis of Expenses (unaudited) (continued)
Hypothetical Example for Comparison Purposes
The table below provides information about hypothetical account values and hypothetical expenses based on the actual expense ratio and an assumed rate of return of 5.00% per year before expenses, which is not the Trust’s actual return. The hypothetical account values and expenses may not be used to estimate the actual ending account balance or expenses you paid for the period. You may use the information provided in this table to compare the ongoing costs of investing in the Trust and other mutual funds. To do so, compare this 5.00% hypothetical example relating to the Trust with the 5.00% hypothetical examples that appear in the shareholder reports of other mutual funds.
Please note that the expenses shown in the table below are meant to highlight your ongoing costs only and do not reflect any transactional costs, with respect to Class A shares. The example does not reflect the deduction of CDSC with respect to Class C shares. Therefore, the table is useful in comparing ongoing costs only, and will not help you determine the relative total costs of owning different mutual funds. In addition, if these transaction costs were included, your costs would have been higher.
Six months ended March 31, 2016
| | Hypothetical | | | |
| | Annualized | Beginning | Ending | Expenses |
| | Total | Account | Account | Paid During |
| | Return | Value | Value | the Period(1) |
| |
| Class A | 5.00% | $1,000.00 | $1,020.85 | $4.19 |
| |
| Class C | 5.00% | $1,000.00 | $1,016.85 | $8.22 |
| |
| Class Y | 5.00% | $1,000.00 | $1,021.85 | $3.18 |
| (1) | Expenses are equal to the annualized expense ratio of 0.83%, 1.63% and 0.63% for the Trust’s Class A, C and Y shares, respectively, multiplied by the average account value over the period, multiplied by 183/366 (to reflect the one-half year period). |
40 | Hawaiian Tax-Free Trust
Information Available (unaudited)
Much of the information that the funds in the Aquila Group of Funds produce is automatically sent to you and all other shareholders. Specifically, you are routinely sent your Trust’s entire list of portfolio securities twice a year in the semi-annual and annual reports you receive. Additionally, under Trust policies, the Administrator/Business Manager publicly discloses the complete schedule of the Trust’s portfolio holdings, as of each calendar quarter, generally by the 15th day after the end of each calendar quarter. Such information remains accessible until the next schedule is made publicly available. You may obtain a copy of the Trust’s portfolio holdings schedule for the most recently completed period by visiting the Trust’s website at www.aquilafunds.com. Whenever you wish to see a listing of your Trust’s portfolio other than in your shareholder reports, please check our website at www.aquilafunds.com or call us at 1-800-437-1020.
The Trust additionally files a complete list of its portfolio holdings with the SEC for the first and third quarter ends of each fiscal year on Form N-Q. Forms N-Q are available free of charge on the SEC website at www.sec.gov. You may also review or, for a fee, copy the forms at the SEC’s Public Reference Room in Washington, D.C. or by calling 1-800-SEC-0330.
Proxy Voting Record (unaudited)
During the 12 month period ended June 30, 2015, the Trust did not hold any portfolio securities for which the Trust was entitled to participate in proxy voting. Applicable regulations require us to inform you that the Trust’s proxy voting information is available on the SEC website at www.sec.gov.
Federal Tax Status of Distributions (unaudited)
This information is presented in order to comply with a requirement of the Internal Revenue Code. No current action on the part of shareholders is required.
For the fiscal year ended March 31, 2016, $16,494,404 of dividends paid by Hawaiian Tax-Free Trust, constituting 99.4% of total dividends paid, were exempt-interest dividends, exempt from regular Federal income tax and Hawaii state income tax; and the balance was ordinary dividend income.
Prior to February 15, 2017, shareholders will be mailed the appropriate tax form(s) which will contain information on the status of distributions paid for the 2016 calendar year.
41 | Hawaiian Tax-Free Trust
(THIS PAGE INTENTIONALLY LEFT BLANK)
Founders
Lacy B. Herrmann (1929-2012)
Aquila Management Corporation, Sponsor
Administrator/Business Manager
AQUILA INVESTMENT MANAGEMENT LLC
120 West 45th Street, Suite 3600
New York, New York 10036
Investment Adviser
ASSET MANAGEMENT GROUP of
BANK of HAWAII
130 Merchant Street, Suite 370
Honolulu, Hawaii 96813
Board of Trustees
Richard L. Humphreys, Chair
Diana P. Herrmann, Vice Chair
Bert A. Kobayashi, Jr.
Glenn P. O’Flaherty
Russell K. Okata
Officers
Diana P. Herrmann, President
Charles E. Childs, III, Executive Vice President and Secretary
Marie E. Aro, Senior Vice President
Sherri Foster, Senior Vice President
Paul G. O’Brien, Senior Vice President
Stephen J. Caridi, Vice President
Randall S. Fillmore, Chief Compliance Officer
Joseph P. DiMaggio, Chief Financial Officer and Treasurer
Distributor
AQUILA DISTRIBUTORS LLC
120 West 45th Street, Suite 3600
New York, New York 10036
Transfer and Shareholder Servicing Agent
BNY MELLON
4400 Computer Drive
Westborough, Massachusetts 01581
Custodian
BNY MELLON
225 Liberty Street
New York, New York 10286
Independent Registered Public Accounting Firm
TAIT, WELLER & BAKER LLP
1818 Market Street, Suite 2400
Philadelphia, Pennsylvania 19103
Further information is contained in the Prospectus,
which must precede or accompany this report.
(a) As of March 31, 2015 (the end of the reporting period) the Trust has adopted a code of ethics that applies to the Trust's principal executive officer(s)and principal financial officer(s) and persons performing similar functions ("Covered Officers") as defined in the Aquila Group of Funds Code of Ethics for Principal Executive and Senior Financial Officers under Section 406 of the Sarbanes-Oxley Act of 2002, as amended;
(f)(1) Pursuant to Item 10(a)(1), a copy of the Trust's Code of Ethics that applies to the Trust's principal executive officer(s) and principal financial officer(s) and persons performing similar functions is included as an exhibit to its annual report on this Form N-CSR;
(f)(2) The text of the Trust's Code of Ethics that applies to the Trust's principal executive officer(s) and principal financial officer(s) and persons performing similar functions has been posted on its Internet website which can be found at the Trust's Internet address at aquilafunds.com.
| ITEM 3. | AUDIT COMMITTEE FINANCIAL EXPERT. |
(a)(1)(i) The Registrant's board of trustees has determined that Mr. Glenn O'Flaherty, a member of its audit committee, is an audit committee financial expert. Mr. O'Flaherty is 'independent' as such term is defined in Form N-CSR.
| ITEM 4. | PRINCIPAL ACCOUNTANT FEES AND SERVICES. |
a) Audit Fees - The aggregate fees billed for professional services rendered by the principal accountant for the audit of the Registrant's annual financial statements were $ $23,300 in 2015 and $23,900 in 2016.
b) Audit Related Fees - There were no amounts billed for audit-related fees over the past two years.
c) Tax Fees - The Registrant was billed by the principal accountant $3,500 and $3,500 in 2015 and 2016, respectively, for return preparation and tax compliance.
d) All Other Fees - There were no additional fees paid for audit and non-audit services other than those disclosed in a) thorough c) above.
e)(1) Currently, the audit committee of the Registrant pre-approves audit services and fees on an engagement-by-engagement basis
e)(2) None of the services described in b) through d) above were approved by the audit committee pursuant to paragraph (c)(7)(i)(C) of Rule 2-01 of Regulation S-X, all were pre-approved on an engagement-by-engagement basis.
f) No applicable.
g) There were no non-audit services fees billed by the Registrant's accountant to the Registrant's investment adviser or distributor over the past two years
h) Not applicable.
| ITEM 5. | AUDIT COMMITTEE OF LISTED REGISTRANTS. |
Not applicable
| ITEM 6. | SCHEDULE OF INVESTMENTS. |
Included in Item 1 above
| ITEM 7. | DISCLOSURE OF PROXY VOTING POLICIES AND PROCEDURES FORCLOSED-END MANAGEMENT INVESTMENT COMPANIES. |
Not applicable
| ITEM 8. | PORTFOLIO MANAGERS OF CLOSED-END MANAGEMENT INVESTMENT COMPANIES. |
Not applicable
| ITEM 9. | PURCHASES OF EQUITY SECURITIES BY CLOSED-END MANAGEMENT INVESTMENTCOMPANY AND AFFILIATED PURCHASERS. |
Not applicable
| ITEM 10. | SUBMISSION OF MATTERS TO A VOTE OF SECURITY HOLDERS. |
The Board of Directors of the Registrant has adopted a Nominating Committee Charter which provides that the Nominating Committee (the 'Committee') may consider and evaluate nominee candidates properly submitted by shareholders if a vacancy among the Independent Trustees of the Registrant occurs and if, based on the Board's then current size, composition and structure, the Committee determines that the vacancy should be filled. The Committee will consider candidates submitted by shareholders on the same basis as it considers and evaluates candidates recommended by other sources. A copy of the qualifications and procedures that must be met or followed by shareholders to properly submit a nominee candidate to the Committee may be obtained by submitting a request in writing to the Secretary of the Registrant.
| ITEM 11. | CONTROLS AND PROCEDURES. |
(a) Based on their evaluation of the registrant's disclosure controls and procedures (as defined in Rule 30a-2(c) under the Investment Company Act of 1940) as of a date within 90 days of the filing of this report, the registrant's chief financial and executive officers have concluded that the disclosure controls and procedures of the registrant are appropriately designed to ensure that information required to be disclosed in the registrant's reports that are filed under the Securities Exchange Act of 1934 are accumulated and communicated to registrant's management, including its principal executive officer(s) and principal financial officer(s), to allow timely decisions regarding required disclosure and is recorded, processed, summarized and reported, within the time periods specified in the rules and forms adopted by the Securities and Exchange Commission.
(b) There have been no significant changes in registrant's internal controls or in other factors that could significantly affect registrant's internal controls subsequent to the date of the most recent evaluation, including no significant deficiencies or material weaknesses that required corrective action.
(a)(1) Aquila Group of Funds Code of Ethics for Principal Executive and Senior Financial Officers under Section 406 of the Sarbanes-Oxley Act of 2002, as amended.
(a)(2) Certifications of principal executive officer and principal financial officer as required by Rule 30a-2(a) under the Investment Company Act of 1940.
(b) Certifications of principal executive officer and principal financial officer as required by Rule 30a-2(b) under the Investment Company Act of 1940.
SIGNATURES
Pursuant to the requirements of the Securities Exchange Act of 1934 and the Investment Company Act of 1940, the registrant has duly caused this report to be signed on its behalf by the undersigned thereunto duly authorized.
HAWAIIAN TAX-FREE TRUST
| By: | /s/ Diana P. Herrmann | |
| | Vice Chair, Trustee and President June 9, 2016 | |
| | | |
| | | |
| By: | /s/ Joseph P. DiMaggio | |
| | Chief Financial Officer and Treasurer June 9, 2016 | |
Pursuant to the requirements of the Securities Exchange Act of 1934 and the Investment Company Act of 1940, this report has been signed below by the following persons on behalf of the registrant and in the capacities and on the dates indicated.
| By: | /s/ Diana P. Herrmann | |
| | Diana P. Herrmann Vice Chair, Trustee and President June 9, 2016 | |
| | | |
| | | |
| By: | /s/ Joseph P. DiMaggio | |
| | Joseph P. DiMaggio Chief Financial Officer and Treasurer June 9, 2016 | |
HAWAIIAN TAX-FREE TRUST
EXHIBIT INDEX
(a)(1) Aquila Group of Funds Code of Ethics for Principal Executive and Senior Financial Officers under Section 406 of the Sarbanes-Oxley Act of 2002, as amended.
(a)(2) Certifications of principal executive officer and principal financial officer as required by Rule 30a-2(a) under the Investment Company Act of 1940.
(b) Certification of chief executive officer and chief financial officer as required by Rule 30a-2(b) of the Investment Company Act of 1940.