UNITED STATES
SECURITIES AND EXCHANGE COMMISSION
Washington, D.C. 20549
FORM N-CSR
CERTIFIED SHAREHOLDER REPORT OF REGISTERED MANAGEMENT INVESTMENT COMPANIES
Investment Company Act file number 811-04087
--------------------------------------------------
Manning & Napier Fund, Inc.
------------------------------------------------------------------------------------
(Exact name of registrant as specified in charter)
290 Woodcliff Drive, Fairport, NY 14450
------------------------------------------------------------------------------------
(Address of principal executive offices)(Zip Code)
B. Reuben Auspitz 290 Woodcliff Drive, Fairport, NY 14450
------------------------------------------------------------------------------------
(Name and address of agent for service)
Registrant’s telephone number, including area code: 585-325-6880
----------------------------------
Date of fiscal year end: December 31
------------------------------------------------------------
Date of reporting period: January 1, 2013 through June 30, 2013
Form N-CSR is to be used by management investment companies to file reports with the Commission not later than 10 days after the transmission to stockholders of any report that is required to be transmitted to stockholders under Rule 30e-1 under the Investment Company Act of 1940 (17 CFR 270.30e-1). The Commission may use the information provided on Form N-CSR in its regulatory, disclosure review, inspection, and policymaking roles.
A registrant is required to disclose the information specified by Form N-CSR, and the Commission will make this information public. A registrant is not required to respond to the collection of information contained in Form N-CSR unless the Form displays a currently valid Office of Management and Budget (“OMB”) control number. Please direct comments concerning the accuracy of the information collection burden estimate and any suggestions for reducing the burden to Secretary, Securities and Exchange Commission, 100 F Street, NE, Washington, DC 20549. The OMB has reviewed this collection of information under the clearance requirements of 44 U.S.C. § 3507.
ITEM 1: | REPORTS TO STOCKHOLDERS. |

| | | | | | |
| | | | LIFE SCIENCES SERIES | | |
www.manning-napier.com | | | |  |
Life Sciences Series
Shareholder Expense Example
(unaudited)
As a shareholder of the Series, you may incur two types of costs: (1) transaction costs and (2) ongoing costs, including management fees and other Series expenses. This example is intended to help you understand your ongoing costs (in dollars) of investing in the Series and to compare these costs with the ongoing costs of investing in other mutual funds.
The example is based on an investment of $1,000 invested at the beginning of the period and held for the entire period (January 1, 2013 to June 30, 2013).
Actual Expenses
The first line of the table below provides information about actual account values and actual expenses. You may use the information in this line, together with the amount you invested, to estimate the expenses that you paid over the period. Simply divide your account value by $1,000 (for example, an $8,600 account value divided by $1,000 = 8.6), then multiply the result by the number in the first line under the heading entitled “Expenses Paid During Period” to estimate the expenses you paid on your account during this period.
Hypothetical Example for Comparison Purposes
The second line of the table below provides information about hypothetical account values and hypothetical expenses based on the Series’ actual expense ratio and an assumed rate of return of 5% per year before expenses, which is not the Series’ actual return. The hypothetical account values and expenses may not be used to estimate the actual ending account balance or expenses you paid during the period. You may use this information to compare the ongoing costs of investing in the Series and other funds. To do so, compare this 5% hypothetical example with the 5% hypothetical examples that appear in the shareholder reports of the other funds.
Please note that the expenses shown in the table are meant to highlight your ongoing costs only and do not reflect any transaction costs. Therefore, the second line of the table is useful in comparing ongoing costs only, and will not help you determine the relative total costs of owning different funds. In addition, if these transaction costs were included, your costs would have been higher.
| | | | | | |
| | | BEGINNING ACCOUNT VALUE 1/1/13 | | ENDING ACCOUNT VALUE 6/30/13 | | EXPENSES PAID
DURING PERIOD*
1/1/13-6/30/13 |
Actual | | $1,000.00 | | $1,060.60 | | $6.03 |
Hypothetical (5% return before expenses) | | $1,000.00 | | $1,018.94 | | $5.91 |
*Expenses are equal to the Series’ annualized expense ratio (for the six-month period) of 1.18%, multiplied by the average account value over the period, multiplied by 181/365 (to reflect the one-half year period). Expenses are based on the most recent fiscal half year.
1
Life Sciences Series
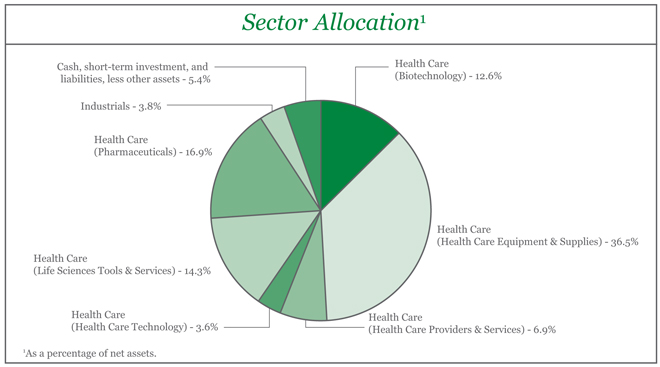
Portfolio Composition as of June 30, 2013
(unaudited)
| | | | | | | | | | | | |
| Top Ten Stock Holdings2 | |
Oxford Nanopore Technologies Ltd. (United Kingdom) | | | 6.1 | % | | | | Volcano Corp. | | | 4.4% | |
Lonza Group AG (Switzerland) | | | 5.1 | % | | | | Johnson & Johnson | | | 4.0% | |
Green Cross Corp. (South Korea) | | | 4.7 | % | | | | Becton, Dickinson and Co. | | | 4.0% | |
The Cooper Companies, Inc. | | | 4.5 | % | | | | Pall Corp. | | | 3.8% | |
Sirona Dental Systems, Inc. | | | 4.5 | % | | | | Greenway Medical Technologies, Inc. | | | 3.5% | |
2As a percentage of total investments. | | | | | | | | | | | | |
2
Life Sciences Series
Investment Portfolio - June 30, 2013
(unaudited)
| | | | | | | | | | |
| | | SHARES | | | VALUE (NOTE 2) | | | |
| | | |
COMMON STOCKS - 94.6% | | | | | | | | | | |
| | | |
Health Care - 90.8% | | | | | | | | | | |
Biotechnology - 12.6% | | | | | | | | | | |
Green Cross Corp. (South Korea)1 | | | 81,525 | | | $ | 8,727,035 | | | |
Incyte Corp. Ltd.* | | | 236,000 | | | | 5,192,000 | | | |
Myriad Genetics, Inc.* | | | 181,000 | | | | 4,863,470 | | | |
Seattle Genetics, Inc.* | | | 137,000 | | | | 4,310,020 | | | |
| | | | | | | | | | |
| | | |
| | | | | | | 23,092,525 | | | |
| | | | | | | | | | |
Health Care Equipment & Supplies - 36.5% | | | | | | | | | | |
Becton, Dickinson and Co. | | | 75,000 | | | | 7,412,250 | | | |
The Cooper Companies, Inc. | | | 71,000 | | | | 8,452,550 | | | |
DexCom, Inc.* | | | 155,000 | | | | 3,479,750 | | | |
GN Store Nord A/S (Denmark)1 | | | 197,000 | | | | 3,720,460 | | | |
HeartWare International, Inc.* | | | 55,900 | | | | 5,316,649 | | | |
Insulet Corp.* | | | 200,000 | | | | 6,282,000 | | | |
Mindray Medical International Ltd. - ADR (China) | | | 137,000 | | | | 5,130,650 | | | |
Quidel Corp.* | | | 10,245 | | | | 261,555 | | | |
Sirona Dental Systems, Inc.* | | | 128,100 | | | | 8,439,228 | | | |
Sonova Holding AG (Switzerland)1 | | | 54,500 | | | | 5,765,863 | | | |
Thoratec Corp.* | | | 148,000 | | | | 4,633,880 | | | |
Volcano Corp.* | | | 447,000 | | | | 8,104,110 | | | |
| | | | | | | | | | |
| | | |
| | | | | | | 66,998,945 | | | |
| | | | | | | | | | |
Health Care Providers & Services - 6.9% | | | | | | | | | | |
Diagnosticos da America S.A. (Brazil) | | | 995,500 | | | | 5,152,945 | | | |
Life Healthcare Group Holdings Ltd. (South Africa)1 | | | 1,100,000 | | | | 4,172,132 | | | |
Qualicorp S.A. (Brazil)* | | | 445,000 | | | | 3,388,330 | | | |
| | | | | | | | | | |
| | | |
| | | | | | | 12,713,407 | | | |
| | | | | | | | | | |
Health Care Technology - 3.6% | | | | | | | | | | |
Greenway Medical Technologies, Inc.* | | | 525,450 | | | | 6,484,053 | | | |
| | | | | | | | | | |
Life Sciences Tools & Services - 14.3% | | | | | | | | | | |
Lonza Group AG (Switzerland)1 | | | 126,200 | | | | 9,482,354 | | | |
Oxford Nanopore Technologies Ltd. (United Kingdom)*2,3,4 | | | 45,464 | | | | 11,330,044 | | | |
QIAGEN N.V. - ADR (Netherlands)* | | | 273,000 | | | | 5,435,430 | | | |
| | | | | | | | | | |
| | | |
| | | | | | | 26,247,828 | | | |
| | | | | | | | | | |
Pharmaceuticals - 16.9% | | | | | | | | | | |
Glenmark Pharmaceuticals Ltd. (India)1 | | | 567,000 | | | | 5,212,952 | | | |
Johnson & Johnson | | | 87,000 | | | | 7,469,820 | | | |
Lupin Ltd. (India)1 | | | 259,150 | | | | 3,399,584 | | | |
Novo Nordisk A/S - Class B (Denmark)1 | | | 22,500 | | | | 3,497,905 | | | |
UCB S.A. (Belgium)1 | | | 105,000 | | | | 5,636,455 | �� | | |
The accompanying notes are an integral part of the financial statements.
3
Life Sciences Series
Investment Portfolio - June 30, 2013
(unaudited)
| | | | | | | | |
| | | SHARES | | | VALUE (NOTE 2) | |
| | |
COMMON STOCKS (continued) | | | | | | | | |
| | |
Health Care (continued) | | | | | | | | |
Pharmaceuticals (continued) | | | | | | | | |
ViroPharma, Inc.* | | | 200,300 | | | $ | 5,738,595 | |
| | | | | | | | |
| | |
| | | | | | | 30,955,311 | |
| | | | | | | | |
| | |
Total Health Care | | | | | | | 166,492,069 | |
| | | | | | | | |
Industrials - 3.8% | | | | | | | | |
Machinery - 3.8% | | | | | | | | |
Pall Corp. | | | 106,000 | | | | 7,041,580 | |
| | | | | | | | |
TOTAL COMMON STOCKS | | | | | | | | |
(Identified Cost $147,908,401) | | | | | | | 173,533,649 | |
| | | | | | | | |
| | |
SHORT-TERM INVESTMENT - 6.8% | | | | | | | | |
Dreyfus Cash Management, Inc. - Institutional Shares5, 0.05%, | | | | | | | | |
(Identified Cost $12,369,576) | | | 12,369,576 | | | | 12,369,576 | |
| | | | | | | | |
| | |
TOTAL INVESTMENTS - 101.4% | | | | | | | | |
(Identified Cost $160,277,977) | | | | | | | 185,903,225 | |
LIABILITIES, LESS OTHER ASSETS - (1.4%) | | | | | | | (2,513,540 | ) |
| | | | | | | | |
| | |
NET ASSETS - 100% | | | | | | $ | 183,389,685 | |
| | | | | | | | |
ADR - American Depository Receipt
*Non-income producing security.
1A factor from a third party vendor was applied to determine the security’s fair value following the close of local trading.
2This security was acquired on April 26, 2011 at a cost of $6,149,543 ($150.34 per share) and on May 2, 2012 at a cost of $1,209,529 ($265.31 per share) and has been determined to be illiquid under guidelines established by the Board of Directors.
3Restricted securities - Investment in securities that are restricted as to public resale under the Securities Act of 1933, as amended. These securities amount to $11,330,044 or 6.2% of the Series’ net assets as of June 30, 2013 (see Note 2 to the financial statements).
4Security has been valued at fair value as determined in good faith by the Advisor.
5Rate shown is the current yield as of June 30, 2013.
The accompanying notes are an integral part of the financial statements.
4
Life Sciences Series
Statement of Assets and Liabilities
June 30, 2013 (unaudited)
| | | | |
ASSETS: | | | | |
| |
Investments, at value (identified cost $160,277,977) (Note 2) | | $ | 185,903,225 | |
Cash | | | 1,979,718 | |
Receivable for securities sold | | | 2,118,042 | |
Receivable for fund shares sold | | | 114,062 | |
Foreign tax reclaims receivable | | | 30,593 | |
Dividends receivable | | | 535 | |
Prepaid expenses | | | 1,081 | |
| | | | |
| |
TOTAL ASSETS | | | 190,147,256 | |
| | | | |
| |
LIABILITIES: | | | | |
| |
Accrued foreign capital gains tax (Note 2) | | | 312,530 | |
Foreign capital gains tax payable (Note 2) | | | 2,234 | |
Accrued management fees (Note 3) | | | 151,474 | |
Accrued fund accounting and administration fees (Note 3) | | | 7,291 | |
Accrued transfer agent fees (Note 3) | | | 3,120 | |
Accrued Chief Compliance Officer service fees (Note 3) | | | 339 | |
Payable for securities purchased | | | 5,678,520 | |
Payable for fund shares repurchased | | | 465,291 | |
Other payables and accrued expenses | | | 136,772 | |
| | | | |
| |
TOTAL LIABILITIES | | | 6,757,571 | |
| | | | |
| |
TOTAL NET ASSETS | | $ | 183,389,685 | |
| | | | |
| |
NET ASSETS CONSIST OF: | | | | |
| |
Capital stock | | $ | 134,397 | |
Additional paid-in-capital | | | 132,402,344 | |
Accumulated net investment loss | | | (549,199 | ) |
Accumulated net realized gain on investments, foreign currency and translation of other assets and liabilities | | | 26,089,583 | |
Net unrealized appreciation on investments (net of foreign capital gains tax of $312,530), foreign currency and translation of other assets and liabilities | | | 25,312,560 | |
| | | | |
| |
TOTAL NET ASSETS | | $ | 183,389,685 | |
| | | | |
| |
NET ASSET VALUE, OFFERING PRICE AND REDEMPTION PRICE PER SHARE - CLASS A ($183,389,685/13,439,685 shares) | | $ | 13.65 | |
| | | | |
The accompanying notes are an integral part of the financial statements.
5
Life Sciences Series
Statement of Operations
For the Six Months Ended June 30, 2013 (unaudited)
| | | | |
INVESTMENT INCOME: | | | | |
| |
Dividends (net of foreign taxes withheld, $40,151) | | $ | 782,620 | |
| | | | |
| |
EXPENSES: | | | | |
| |
Management fees (Note 3) | | | 1,129,596 | |
Fund accounting and administration fees (Note 3) | | | 26,426 | |
Transfer agent fees (Note 3) | | | 8,278 | |
Directors’ fees (Note 3) | | | 2,664 | |
Chief Compliance Officer service fees (Note 3) | | | 1,117 | |
Custodian fees | | | 103,557 | |
Miscellaneous | | | 60,181 | |
| | | | |
| |
Total Expenses | | | 1,331,819 | |
| | | | |
| |
NET INVESTMENT LOSS | | | (549,199 | ) |
| | | | |
| |
REALIZED AND UNREALIZED GAIN (LOSS) ON INVESTMENTS AND FOREIGN CURRENCY: | | | | |
| |
Net realized gain (loss) on-
Investments (net of India tax of $423,407) | | | 24,118,936 | |
Foreign currency and translation of other assets and liabilities | | | (143,671 | ) |
| | | | |
| |
| | | 23,975,265 | |
| | | | |
Net change in unrealized appreciation (depreciation) on-
Investments (net of decrease in accrued foreign capital gains tax of $654,858) | | | (7,623,021 | ) |
Foreign currency and translation of other assets and liabilities | | | 3,479 | |
| | | | |
| |
| | | (7,619,542 | ) |
| | | | |
| |
NET REALIZED AND UNREALIZED GAIN (LOSS) ON INVESTMENTS AND FOREIGN CURRENCY | | | 16,355,723 | |
| | | | |
| |
NET INCREASE IN NET ASSETS RESULTING FROM OPERATIONS | | $ | 15,806,524 | |
| | | | |
The accompanying notes are an integral part of the financial statements.
6
Life Sciences Series
Statements of Changes in Net Assets
| | | | | | | | |
| | | FOR THE SIX MONTHS ENDED 6/30/13
(UNAUDITED) | | | FOR THE YEAR ENDED
12/31/12 | |
INCREASE (DECREASE) IN NET ASSETS: | | | | | | | | |
| | |
OPERATIONS: | | | | | | | | |
| | |
Net investment loss | | $ | (549,199 | ) | | $ | (1,343,685 | ) |
Net realized gain (loss) on investments and foreign currency | | | 23,975,265 | | | | 16,082,256 | |
Net change in unrealized appreciation (depreciation) on investments and foreign currency | | | (7,619,542 | ) | | | 35,502,919 | |
| | | | | | | | |
| | |
Net increase from operations | | | 15,806,524 | | | | 50,241,490 | |
| | | | | | | | |
| | |
DISTRIBUTIONS TO SHAREHOLDERS (Note 9): | | | | | | | | |
| | |
From net realized gain on investments | | | — | | | | (15,587,617 | ) |
| | | | | | | | |
| | |
CAPITAL STOCK ISSUED AND REPURCHASED: | | | | | | | | |
| | |
Net increase (decrease) from capital share transactions (Note 5) | | | (65,009,522 | ) | | | 1,388,522 | |
| | | | | | | | |
| | |
Net increase (decrease) in net assets | | | (49,202,998 | ) | | | 36,042,395 | |
| | |
NET ASSETS: | | | | | | | | |
| | |
Beginning of period | | | 232,592,683 | | | | 196,550,288 | |
| | | | | | | | |
| | |
End of period (including accumulated net investment loss of $549,199 and $0, respectively) | | $ | 183,389,685 | | | $ | 232,592,683 | |
| | | | | | | | |
The accompanying notes are an integral part of the financial statements.
7
Life Sciences Series
Financial Highlights
| | | | | | | | | | | | | | | | | | | | | | | | |
| | | FOR THE SIX MONTHS ENDED
6/30/13
(UNAUDITED) | | | FOR THE YEARS ENDED | |
| | | | 12/31/12 | | | 12/31/11 | | | 12/31/10 | | | 12/31/09 | | | 12/31/08 | |
Per share data (for a share outstanding throughout each period): | | | | | | | | | | | | | | | | | | | | | | | | |
Net asset value - Beginning of period | | $ | 12.87 | | | $ | 10.95 | | | $ | 12.18 | | | $ | 10.61 | | | $ | 6.99 | | | $ | 11.54 | |
| | | | | | | | | | | | | | | | | | | | | | | | |
Income (loss) from investment operations: | | | | | | | | | | | | | | | | | | | | | | | | |
Net investment loss | | | (0.03 | )1 | | | (0.08 | )1 | | | (0.07 | )1 | | | (0.04 | )1 | | | (0.05 | )1 | | | (0.06 | ) |
Net realized and unrealized gain (loss) on investments | | | 0.81 | | | | 2.91 | | | | (0.84 | ) | | | 1.61 | | | | 3.67 | | | | (4.38 | ) |
| | | | | | | | | | | | | | | | | | | | | | | | |
| | | | | | |
Total from investment operations | | | 0.78 | | | | 2.83 | | | | (0.91 | ) | | | 1.57 | | | | 3.62 | | | | (4.44 | ) |
| | | | | | | | | | | | | | | | | | | | | | | | |
| | | | | | |
Less distributions to shareholders: | | | | | | | | | | | | | | | | | | | | | | | | |
From net realized gain on investments | | | — | | | | (0.91 | ) | | | (0.32 | ) | | | — | | | | — | | | | (0.11 | ) |
| | | | | | | | | | | | | | | | | | | | | | | | |
| | | | | | |
Net asset value - End of period | | $ | 13.65 | | | $ | 12.87 | | | $ | 10.95 | | | $ | 12.18 | | | $ | 10.61 | | | $ | 6.99 | |
| | | | | | | | | | | | | | | | | | | | | | | | |
| | | | | | |
Net assets - End of period (000’s omitted) | | $ | 183,390 | | | $ | 232,593 | | | $ | 196,550 | | | $ | 247,564 | | | $ | 272,944 | | | $ | 182,704 | |
| | | | | | | | | | | | | | | | | | | | | | | | |
| | | | | | |
Total return2 | | | 6.06 | % | | | 25.89 | % | | | (7.33 | %) | | | 14.80 | % | | | 51.79 | % | | | (38.77 | %) |
Ratios (to average net assets)/ | | | | | | | | | | | | | | | | | | | | | | | | |
Supplemental Data: | | | | | | | | | | | | | | | | | | | | | | | | |
Expenses* | | | 1.18 | %3 | | | 1.16 | % | | | 1.11 | % | | | 1.09 | % | | | 1.11 | % | | | 1.12 | % |
Net investment loss | | | (0.49 | %)3 | | | (0.60 | %) | | | (0.60 | %) | | | (0.41 | %) | | | (0.55 | %) | | | (0.65 | %) |
Portfolio turnover | | | 50 | % | | | 75 | % | | | 84 | % | | | 67 | % | | | 95 | % | | | 94 | % |
|
| * The investment advisor did not impose all or a portion of its management and/or other fees, and in some periods may have paid a portion of the Series’ expenses. If these expenses had been incurred by the Series, the expense ratio (to average net assets) would have increased by the following amount: | |
| | | | | | |
| | | N/A | | | | N/A | | | | N/A | | | | 0.00 | %4 | | | 0.01 | % | | | N/A | |
1Calculated based on average shares outstanding during the periods.
2Represents aggregate total return for the periods indicated, and assumes reinvestment of all distributions. Total return would have been lower had certain expenses not been waived or reimbursed during certain periods. Periods less than one year are not annualized.
3Annualized.
4Less than 0.01%.
The accompanying notes are an integral part of the financial statements.
8
Life Sciences Series
Notes to Financial Statements
(unaudited)
Life Sciences Series (the “Series”) is a no-load diversified series of Manning & Napier Fund, Inc. (the “Fund”). The Fund is organized in Maryland and is registered under the Investment Company Act of 1940, as amended, as an open-end management investment company.
The Series’ investment objective is to provide long-term growth by investing principally in the common stocks of companies in the life sciences industry.
The Fund’s advisor is Manning & Napier Advisors, LLC (the “Advisor”). Shares of the Series are offered to advisory clients and employees of the Advisor and its affiliates. The total authorized capital stock of the Fund consists of 15 billion shares of common stock each having a par value of $0.01. As of June 30, 2013, 10.3 billion shares have been designated in total among 42 series, of which 100 million have been designated as Life Sciences Series Class A common stock.
| 2. | Significant Accounting Policies |
Security Valuation
Portfolio securities, including domestic equities, foreign equities, warrants and options, listed on an exchange other than the NASDAQ Stock Market are valued at the latest quoted sales price of the exchange on which the security is primarily traded. Securities not traded on valuation date or securities not listed on an exchange are valued at the latest quoted bid price provided by the Fund’s pricing service. Securities listed on the NASDAQ Stock Market are valued in accordance with the NASDAQ Official Closing Price.
Short-term investments that mature in sixty days or less are valued at amortized cost, which approximates fair value. Investments in open-end investment companies are valued at their net asset value per share on valuation date.
Volume and level of activity in established markets for an asset or liability are evaluated to determine whether recent transactions and quoted prices are determinative of fair value. Where there have been significant decreases in volume and level of activity, further analysis and adjustment may be necessary to estimate fair value. The Series measures fair value in these instances by the use of inputs and valuation techniques which may be based upon current market prices of securities that are comparable in coupon, rating, maturity and industry and/or expectation of future cash flows. As a result of trading in relatively thin markets and/or markets that experience significant volatility, the prices used by the Series to value these securities may differ from the value that would be realized if these securities were sold, and the differences could be material.
Securities for which representative valuations or prices are not available from the Series’ pricing service may be valued at fair value as determined in good faith by the Advisor under procedures approved by and under the general supervision and responsibility of the Fund’s Board of Directors (the “Board”). The Fair Value Committee (the “Committee”) is responsible for carrying out the valuation procedures approved by the Board. The Committee consists of senior members from various groups within the Advisor’s organization, including operations, accounting, trading, and research/investments. The Committee meets at least annually to review and approve valuation matters, which may include data regarding pricing information received from approved pricing vendors and brokers and the results of Board-approved valuation control policies and procedures (the “Policies”). The Policies address, among other things, instances when market quotations are readily available, including recommendations of third party pricing vendors and a determination of appropriate pricing methodologies; events that require specific valuation determinations and assessment of fair value techniques; and securities with a potential for stale pricing. The Committee meets more frequently, as needed, to discuss additional valuation matters, which may include the need to review back-testing results, review time-sensitive information or approve related valuation actions. The Committee reports to the Board, with members of the Committee available at each of the Board’s regularly scheduled meetings to discuss valuation matters and actions during the period, similar to those described earlier. For investments categorized as Level 3, the Committee monitors information similar to that described above, which may include: (i) data specific to the issuer or comparable issuers, (ii) general market or specific sector news and (iii) quoted prices and specific or similar security transactions. The Committee considers this data and any changes from prior periods in order to assess the reasonableness of observable and unobservable inputs, any assumptions used to value those securities and changes in fair value. This data is also used to corroborate, when available, information received from approved pricing vendors and brokers. Various factors impact the frequency of monitoring this
9
Life Sciences Series
Notes to Financial Statements (continued)
(unaudited)
| 2. | Significant Accounting Policies (continued) |
Security Valuation (continued)
information. However, the Committee may determine that changes to inputs and assumptions are not required as a result of the monitoring procedures performed. Due to the inherent uncertainty of valuations of such securities, the fair value may differ significantly from the values that would have been used had a ready market for such securities existed. If trading or events occurring after the close of the principal market in which securities are traded are expected to materially affect the value of those securities, then they may be valued at their fair value, taking this trading or these events into account. In accordance with the procedures approved by the Board, the values of certain securities trading outside the U.S. were adjusted following the close of local trading using a factor from a third party vendor. The third party vendor uses statistical analyses and quantitative models, which consider among other things subsequent movement and changes in the prices of indices, securities and exchange rates in other markets, to determine the factors which are used to adjust local market prices. The value of securities used for net asset value calculation under these procedures may differ from published prices for the same securities. It is the Fund’s policy to classify each foreign equity security where a factor from a third party vendor is provided as a Level 2 security.
Various inputs are used in determining the value of the Series’ assets or liabilities carried at fair value. These inputs are summarized in three broad levels. Level 1 includes quoted prices in active markets for identical assets and liabilities. Level 2 includes other significant observable inputs (including quoted prices for similar securities, interest rates, prepayment speeds, credit risk, etc.). Level 3 includes significant unobservable inputs (including the Series’ own assumptions in determining the fair value of investments). A financial instrument’s level within the fair value hierarchy is based on the lowest level of any input both individually and in aggregate that is significant to the fair value measurement. The inputs or methodology used for valuing securities are not necessarily an indication of the risk associated with investing in those securities.
The following is a summary of the valuation levels used for major security types as of June 30, 2013 in valuing the Series’ assets or liabilities carried at fair value:
| | | | | | | | | | | | | | | | |
| DESCRIPTION | | TOTAL | | | LEVEL 1 | | | LEVEL 2 | | | LEVEL 3 | |
Assets: | | | | | | | | | | | | | | | | |
Equity securities: | | | | | | | | | | | | | | | | |
Health Care | | $ | 166,492,069 | | | $ | 105,547,285 | | | $ | 49,614,740 | | | $ | 11,330,044 | * |
Industrials | | | 7,041,580 | | | | 7,041,580 | | | | — | | | | — | |
Mutual fund | | | 12,369,576 | | | | 12,369,576 | | | | — | | | | — | |
| | | | | | | | | | | | | | | | |
Total assets | | $ | 185,903,225 | | | $ | 124,958,441 | | | $ | 49,614,740 | | | $ | 11,330,044 | |
| | | | | | | | | | | | | | | | |
The following table is a reconciliation of Level 3 investments for which significant unobservable inputs were used to determine fair value:
| | | | |
| LEVEL 3 RECONCILIATION | | EQUITY
SECURITIES | |
Balance as of December 31, 2012 (market value) | | $ | 12,101,037 | |
Net realized gain (loss) | | | — | |
Change in unrealized appreciation (depreciation) | | | (770,993 | ) |
Purchases | | | | |
Sales | | | — | |
Transfers in | | | — | |
Transfers out | | | — | |
| | | | |
Balance as of June 30, 2013 (market value) | | $ | 11,330,044 | |
| | | | |
Please see the Investment Portfolio for foreign securities where a factor from a third party vendor was applied to determine the security’s fair value following the close of local trading. Such securities are included in Level 2 in the table above.
*Amount represents the Series’ investment in Oxford Nanopore Technologies Ltd. (“Oxford”). Oxford was initially valued at transaction price, which is considered the best initial estimate of fair value. On April 10, 2012, the Fund adjusted its valuation of
10
Life Sciences Series
Notes to Financial Statements (continued)
(unaudited)
| 2. | Significant Accounting Policies (continued) |
Security Valuation (continued)
the fair value holding to 163.85 GBP per share (from 91.39 GBP per share) as a result of a subsequent round of financing of the investee company. Subsequently, the Series uses, or will use, other methodologies and significant inputs to determine fair value. Such methodologies and significant inputs include: subsequent rounds of financing for Oxford; recent transactions in similar instruments; discounted cash flow techniques; third-party appraisals; industry multiples and public comparables; and Oxford’s current financial performance compared to projected performance.
The Fund’s policy is to recognize transfers in and transfers out of the valuation levels as of the beginning of the reporting period. There were no transfers between Level 1 and Level 2 during the six months ended June 30, 2013.
The following table summarizes the quantitative inputs and assumptions used for items categorized in Level 3 of the fair value hierarchy as of June 30, 2013.
| | | | | | | | |
| QUANTITATIVE INFORMATION ABOUT LEVEL 3 FAIR VALUE MEASUREMENTS |
| | | FAIR
VALUE AT
6/30/13 | | VALUATION TECHNIQUE(S) | | UNOBSERVABLE
INPUT | | RANGE (WEIGHTED
AVERAGE) |
Equity securities | | $11,330,044 | | Acquisition cost | | Premium/ | | 0%-0% |
| | | | adjusted for | | Discount | | |
| | | | premiums or | | | | |
| | | | discounts | | | | |
The significant unobservable inputs used in the fair value measurement of the Fund’s equity securities are premiums and discounts to the acquisition cost. Significant increases in the premium (or discount) in isolation would result in a significantly higher (lower) fair value measurement.
Security Transactions, Investment Income and Expenses
Security transactions are accounted for on trade date. Dividend income is recorded on the ex-dividend date, except that if the ex-dividend date has passed, certain dividends from foreign securities are recorded as soon as the Series is informed of the ex-dividend date. Non-cash dividends, if any, are recorded at the fair value of the securities received. Interest income, including amortization of premium and accretion of discounts using the effective interest method, is earned from settlement date and accrued daily.
Expenses are recorded on an accrual basis. Most expenses of the Fund can be attributed to a specific series. Expenses which cannot be directly attributed are apportioned among the series in the Fund in such a manner as deemed equitable by the Fund’s Board, taking into consideration, among other things, the nature and type of expense.
The Series uses the identified cost method for determining realized gain or loss on investments for both financial statement and federal income tax reporting purposes.
Foreign Currency Translation
The books and records of the Series are maintained in U.S. dollars. Foreign currencies, investments and other assets and liabilities are translated into U.S. dollars at the current exchange rates. Purchases and sales of investment securities and income and expenses are translated on the respective dates of such transactions. The Series does not isolate realized and unrealized gains and losses attributable to changes in the exchange rates from gains and losses that arise from changes in the fair value of investments. Such fluctuations are included with net realized and unrealized gain or loss on investments. Net realized foreign currency gains and losses represent foreign currency gains and losses between trade date and settlement date on securities transactions, gains and losses on disposition of foreign currencies and the difference between the amount of income and foreign withholding taxes recorded on the books of the Series and the amounts actually received or paid.
11
Life Sciences Series
Notes to Financial Statements (continued)
(unaudited)
| 2. | Significant Accounting Policies (continued) |
Restricted Securities
Restricted securities are purchased in private placement transactions, are not registered under the Securities Act of 1933, as amended, and may have contractual restrictions on resale. Information regarding restricted securities is included at the end of the Series’ Investment Portfolio.
Illiquid Securities
A security may be considered illiquid if so deemed in good faith by the Advisor under procedures approved by and under the general supervision and responsibility of the Fund’s Board. Securities that are illiquid are marked with the applicable footnote on the Investment Portfolio.
Federal Taxes
The Series’ policy is to comply with the provisions of the Internal Revenue Code applicable to regulated investment companies. The Series is not subject to federal income tax or excise tax to the extent that the Series distributes to shareholders each year its taxable income, including any net realized gains on investments, in accordance with requirements of the Internal Revenue Code. Accordingly, no provision for federal income tax or excise tax has been made in the financial statements.
Management evaluates its tax positions to determine if the tax positions taken meet the minimum recognition threshold in connection with accounting for uncertainties in income tax positions taken or expected to be taken for the purposes of measuring and recognizing tax liabilities in the financial statements. Recognition of tax benefits of an uncertain tax position is required only when the position is “more likely than not” to be sustained assuming examination by taxing authorities. At June 30, 2013, the Series has recorded no liability for net unrecognized tax benefits relating to uncertain income tax positions taken or expected to be taken in future tax returns.
The Series files income tax returns in the U.S. federal jurisdiction, various states and foreign jurisdictions, as required. No income tax returns are currently under investigation. The statute of limitations on the Series’ tax returns remains open for the years ended December 31, 2009 through December 31, 2012. The Series is not aware of any tax positions for which it is reasonably possible that the total amounts of unrecognized tax benefits will significantly change in the next twelve months.
Foreign Taxes
Based on the Series’ understanding of the tax rules and rates related to income, gains and currency purchase/repatriation transactions for foreign jurisdictions in which it invests, the Series will provide for foreign taxes, and where appropriate, deferred foreign tax. The Series is subject to a tax imposed on short term capital gains on securities of issuers domiciled in India. The Series records an estimated deferred tax liability for securities that have been held for less than a year at the end of the reporting period, assuming those positions were disposed of at the end of the period. This amount is reported in Accrued foreign capital gains tax in the accompanying Statement of Assets and Liabilities. Realized losses on the sale of securities of issuers domiciled in India can be carried forward for eight years to offset potential future short term realized capital gains.
Distributions of Income and Gains
Distributions to shareholders of net investment income and net realized gains are made annually. An additional distribution may be necessary to avoid taxation of the Series. Distributions are recorded on the ex-dividend date.
Indemnifications
The Fund’s organizational documents provide former and current directors and officers with a limited indemnification against liabilities arising in connection with the performance of their duties to the Fund. In the normal course of business, the Fund may also enter into contracts that provide general indemnifications. The Fund’s maximum exposure under these arrangements is unknown as this would be dependent on future claims that may be made against the Fund. The risk of material loss from such claims is considered remote.
Other
The preparation of financial statements in conformity with accounting principles generally accepted in the United States of America requires management to make estimates and assumptions that affect the reported amounts of assets and liabilities and
12
Life Sciences Series
Notes to Financial Statements (continued)
(unaudited)
| 2. | Significant Accounting Policies (continued) |
Other (continued)
the disclosure of contingent assets and liabilities at the date of the financial statements and the reported amounts of income and expenses during the reporting period. Actual results could differ from those estimates.
| 3. | Transactions with Affiliates |
The Fund has an Investment Advisory Agreement (the “Agreement”) with the Advisor, for which the Series pays a fee, computed daily and payable monthly, at an annual rate of 1.00% of the Series’ average daily net assets.
Under the Agreement, personnel of the Advisor provide the Series with advice and assistance in the choice of investments and the execution of securities transactions, and otherwise maintain the Series’ organization. The Advisor also provides the Fund with necessary office space and fund administration and support services. The salaries of all officers of the Fund (except a percentage of the Fund’s Chief Compliance Officer’s salary, which is paid by the Fund), and of all Directors who are “affiliated persons” of the Fund, or of the Advisor, and all personnel of the Fund, or of the Advisor, performing services relating to research, statistical and investment activities, are paid by the Advisor. Each “non-affiliated” Director receives an annual stipend, which is allocated among all the active series of the Fund. In addition, these Directors also receive a fee per Board meeting attended plus a fee for each committee meeting attended.
Manning & Napier Investor Services, Inc., a registered broker-dealer affiliate of the Advisor, acts as distributor for the Fund’s shares. The services of Manning & Napier Investor Services, Inc. are provided at no additional cost to the Series.
The Advisor did not waive any fees for the six months ended June 30, 2013. The Advisor is not eligible to recoup any expenses that have been waived or reimbursed in prior years.
The Advisor has agreements with BNY Mellon Investment Servicing (U.S.) Inc. (“BNY”) under which BNY serves as sub-accountant services agent and sub-transfer agent. The Fund pays the Advisor an annual fee related to fund accounting and administration of 0.0175% on the first $3 billion of average daily net assets (excluding Target Series and Strategic Income Series); 0.015% on the next $3 billion of average daily net assets (excluding Target Series and Strategic Income Series); and 0.01% of the average daily net assets in excess of $6 billion (excluding Target Series and Strategic Income Series); plus a base fee of $25,500 per series. Transfer Agent fees are charged to the Fund on a per account basis. Additionally, certain transaction and cusip-based fees and out-of-pocket expenses, including charges for reporting relating to the Fund’s compliance program, are charged. Effective October 1, 2012, the aforementioned agreements were modified to reduce the annual fee related to fund accounting and administration, as well as transfer agent fees, by 10%, excluding out-of-pocket expenses.
Expenses not directly attributable to a series are allocated based on each series’ relative net assets or number of accounts, depending on the expense.
| 4. | Purchases and Sales of Securities |
For the six months ended June 30, 2013, purchases and sales of securities, other than U.S. Government securities and short-term securities, were $105,784,558 and $181,734,882 respectively. There were no purchases or sales of U.S. Government securities.
13
Life Sciences Series
Notes to Financial Statements (continued)
(unaudited)
| 5. | Capital Stock Transactions |
Transactions in shares of Life Sciences Series were:
| | | | | | | | | | | | | | | | |
| | | FOR THE SIX MONTHS ENDED 6/30/13 | | | FOR THE YEAR ENDED 12/31/12 | |
| | | SHARES | | | AMOUNT | | | SHARES | | | AMOUNT | |
Sold | | | 555,294 | | | $ | 7,536,175 | | | | 910,690 | | | $ | 11,481,196 | |
Reinvested | | | — | | | | — | | | | 1,200,003 | | | | 15,448,274 | |
Repurchased | | | (5,181,147 | ) | | | (72,545,697 | ) | | | (1,988,833 | ) | | | (25,540,948 | ) |
| | | | | | | | | | | | | | | | |
Total | | | (4,625,853 | ) | | $ | (65,009,522 | ) | | | 121,860 | | | $ | 1,388,522 | |
| | | | | | | | | | | | | | | | |
Substantially all of the Series’ shares represent investments by fiduciary accounts over which the Advisor has sole investment discretion.
The Series may trade in instruments including written and purchased options, forward foreign currency exchange contracts and futures contracts and other derivatives in the normal course of investing activities to assist in managing exposure to various market risks. The Series may be subject to various elements of risk, which may involve, to a varying degree, elements of risk in excess of the amounts recognized for financial statement purposes. These risks include: the risk that changes in the value of a derivative may not correlate perfectly with the underlying asset, rate or index; counterparty credit risk related to over the counter derivative counterparties’ failure to perform under contract terms; liquidity risk related to the lack of a liquid market for these contracts allowing the fund to close out its position(s); and documentation risk relating to disagreement over contract terms. No such investments were held by the Series as of June 30, 2013.
Investing in securities of foreign companies and foreign governments involves special risks and considerations not typically associated with investing in securities of domestic companies and the U.S. Government. These risks include revaluation of currencies and future adverse political and economic developments. Moreover, securities of foreign companies and foreign governments and their markets may be less liquid and their prices more volatile than those of comparable domestic companies and the U.S. Government.
| 8. | Life Sciences Securities |
The Series may focus its investments in certain related life sciences industries; hence, the Series may subject itself to a greater degree of risk than a series that is more diversified.
| 9. | Federal Income Tax Information |
The amount and characterization of certain income and capital gains to be distributed are determined in accordance with federal income tax regulations, which may differ from accounting principles generally accepted in the United States of America. The Series may periodically make reclassifications among its capital accounts to reflect income and gains available for distribution (or available capital loss carryovers) under income tax regulations, without impacting the Series’ net asset value. Any such reclassifications are not reflected in the financial highlights.
The final determination of the tax character of current year distributions will be made at the conclusion of the fiscal year. The tax character of distributions paid for the year ended December 31, 2012, was as follows:
| | | | |
Ordinary income | | $ | 5,917,652 | |
Long-term capital gains | | | 9,669,965 | |
14
Life Sciences Series
Notes to Financial Statements (continued)
(unaudited)
| 9. | Federal Income Tax Information (continued) |
At June 30, 2013, the identified cost of investments for federal income tax purposes, the resulting gross unrealized appreciation and depreciation, and the net unrealized appreciation were as follows:
| | | | |
Cost for federal income tax purposes | | $ | 160,665,852 | |
Unrealized appreciation | | | 29,198,826 | |
Unrealized depreciation | | | (3,961,453 | ) |
| | | | |
Net unrealized appreciation | | $ | 25,237,373 | |
| | | | |
15
{This page intentionally left blank}
16
{This page intentionally left blank}
17
Life Sciences Series
Literature Requests
(unaudited)
Proxy Voting Policies and Procedures
A description of the policies and procedures that the Fund uses to determine how to vote proxies relating to portfolio securities is available, without charge, upon request:
| | | | |
| By phone | | 1-800-466-3863 | | |
On the Securities and Exchange Commission’s (SEC) web site | | http://www.sec.gov | | |
Proxy Voting Record
Information regarding how the Fund voted proxies relating to portfolio securities during the most recent 12-month period ended June 30th is available, without charge, upon request:
| | | | |
| By phone | | 1-800-466-3863 | | |
| On the SEC’s web site | | http://www.sec.gov | | |
Quarterly Portfolio Holdings
The Series’ complete schedule of portfolio holdings for the 1st and 3rd quarters of each fiscal year are provided on Form N-Q, and are available, without charge, upon request:
| | | | |
| By phone | | 1-800-466-3863 | | |
| On the SEC’s web site | | http://www.sec.gov | | |
The Series’ Form N-Q may be reviewed and copied at the SEC’s Public Reference Room in Washington, D.C. Information on the operation of the Public Reference Room may be obtained by calling 1-800-SEC-0330.
Prospectus and Statement of Additional Information (SAI)
The prospectus and SAI provide additional information about each Series, including charges, expenses and risks. These documents are available, without charge, upon request:
| | | | |
| By phone | | 1-800-466-3863 | | |
| On the SEC’s web site | | http://www.sec.gov | | |
| On our web site | | http://www.manning-napier.com | | |
Additional information available at www.manning-napier.com
1. Fund Holdings - Month-End
2. Fund Holdings - Quarter-End
3. Shareholder Report - Annual
4. Shareholder Report - Semi-Annual
The Fund also offers electronic notification or “e-delivery” when certain documents are available on-line to be downloaded or reviewed. Direct shareholders can elect to receive electronic notification when shareholder reports, prospectus updates, and/or statements are available. If you do not currently have on-line access to your account, you can establish access by going to www.manning-napier.com, click on “Login” in the top corner of the page, and follow the prompts to self-enroll. Once enrolled, you can set your electronic notification preferences by clicking on the Account Options tab located within the green toolbar and then select E-Delivery Option. Should you have any questions on either how to establish on-line access or how to update your account settings, please contact Investor Services at 1-800-466-3863.
MNLFS-6/13-SAR
| | | | | | |
| | | | SMALL CAP SERIES | | |
www.manning-napier.com | | | | |
Small Cap Series
Shareholder Expense Example
(unaudited)
As a shareholder of the Series, you may incur two types of costs: (1) transaction costs and (2) ongoing costs, including management fees and other Series expenses. This example is intended to help you understand your ongoing costs (in dollars) of investing in the Series and to compare these costs with the ongoing costs of investing in other mutual funds.
The example is based on an investment of $1,000 invested at the beginning of the period and held for the entire period (January 1, 2013 to June 30, 2013).
Actual Expenses
The first line of the table below provides information about actual account values and actual expenses. You may use the information in this line, together with the amount you invested, to estimate the expenses that you paid over the period. Simply divide your account value by $1,000 (for example, an $8,600 account value divided by $1,000 = 8.6), then multiply the result by the number in the first line under the heading entitled “Expenses Paid During Period” to estimate the expenses you paid on your account during this period.
Hypothetical Example for Comparison Purposes
The second line of the table below provides information about hypothetical account values and hypothetical expenses based on the Series’ actual expense ratio and an assumed rate of return of 5% per year before expenses, which is not the Series’ actual return. The hypothetical account values and expenses may not be used to estimate the actual ending account balance or expenses you paid during the period. You may use this information to compare the ongoing costs of investing in the Series and other funds. To do so, compare this 5% hypothetical example with the 5% hypothetical examples that appear in the shareholder reports of the other funds.
Please note that the expenses shown in the table are meant to highlight your ongoing costs only and do not reflect any transaction costs. Therefore, the second line of the table is useful in comparing ongoing costs only, and will not help you determine the relative total costs of owning different funds. In addition, if these transaction costs were included, your costs would have been higher.
| | | | | | |
| | | BEGINNING
ACCOUNT VALUE
1/1/13 | | ENDING
ACCOUNT VALUE
6/30/13 | | EXPENSES PAID
DURING PERIOD*
1/1/13-6/30/13 |
Actual | | $1,000.00 | | $1,167.30 | | $5.91 |
Hypothetical (5% return before expenses) | | $1,000.00 | | $1,019.34 | | $5.51 |
*Expenses are equal to the Series annualized expense ratio (for the six-month period) of 1.10%, multiplied by the average account value over the period, multiplied by 181/365 to reflect the one-half year period. Expenses are based on the most recent fiscal half year.
1
Small Cap Series
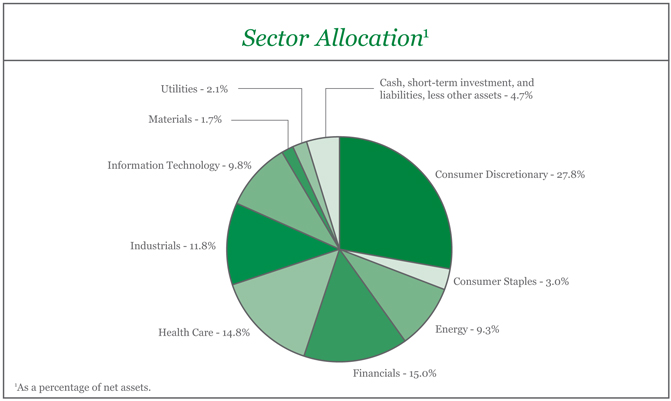
Portfolio Composition as of June 30, 2013
(unaudited)
| | | | |
Market Capitalization | |
Average | | $ | 1,803.79 Million | |
Median | | | 1,560.65 Million | |
Weighted Average | | | 1,851.03 Million | |
| | | | |
Top Ten Stock Holdings2 | |
Ocado Group plc (United Kingdom) | | | 3.5 | % |
US Airways Group, Inc. | | | 3.4 | % |
Cloud Peak Energy, Inc. | | | 2.5 | % |
JSE Ltd. (South Africa) | | | 2.4 | % |
Spirit Airlines, Inc. | | | 2.4 | % |
Starz - Class A | | | 2.2 | % |
Calfrac Well Services Ltd. (Canada) | | | 2.2 | % |
Valassis Communications, Inc. | | | 2.2 | % |
Dynegy, Inc. | | | 2.1 | % |
DexCom, Inc. | | | 2.1 | % |
2As a percentage of total investments. | | | | |
2
Small Cap Series
Investment Portfolio - June 30, 2013
(unaudited)
| | | | | | | | | | |
| | | SHARES | | | VALUE (NOTE 2) | | | |
| | | |
COMMON STOCKS - 95.3% | | | | | | | | | | |
| | | |
Consumer Discretionary - 27.8% | | | | | | | | | | |
Automobiles - 0.9% | | | | | | | | | | |
Tesla Motors, Inc.* | | | 19,410 | | | $ | 2,085,216 | | | |
| | | | | | | | | | |
Distributors - 1.0% | | | | | | | | | | |
Inchcape plc (United Kingdom)1 | | | 300,081 | | | | 2,284,688 | | | |
| | | | | | | | | | |
Hotels, Restaurants & Leisure - 3.4% | | | | | | | | | | |
BJ’s Restaurants, Inc.* | | | 125,120 | | | | 4,641,952 | | | |
Orient-Express Hotels Ltd. - ADR - Class A* | | | 238,080 | | | | 2,895,053 | | | |
| | | | | | | | | | |
| | | |
| | | | | | | 7,537,005 | | | |
| | | | | | | | | | |
Internet & Catalog Retail - 6.4% | | | | | | | | | | |
HomeAway, Inc.* | | | 116,140 | | | | 3,755,968 | | | |
Ocado Group plc (United Kingdom)*1 | | | 1,721,640 | | | | 7,811,116 | | | |
Shutterfly, Inc.* | | | 49,640 | | | | 2,769,416 | | | |
| | | | | | | | | | |
| | | |
| | | | | | | 14,336,500 | | | |
| | | | | | | | | | |
Media - 7.4% | | | | | | | | | | |
Imax Corp. (Canada)* | | | 170,490 | | | | 4,238,381 | | | |
Starz - Class A* | | | 228,210 | | | | 5,043,441 | | | |
Valassis Communications, Inc. | | | 198,110 | | | | 4,871,525 | | | |
Zon Multimedia Servicos de Telecomunicacoes e Multimedia SGPS S.A. (Portugal)1 | | | 531,740 | | | | 2,567,823 | | | |
| | | | | | | | | | |
| | | |
| | | | | | | 16,721,170 | | | |
| | | | | | | | | | |
Specialty Retail - 8.7% | | | | | | | | | | |
Aeropostale, Inc.* | | | 216,810 | | | | 2,991,978 | | | |
American Eagle Outfitters, Inc. | | | 111,430 | | | | 2,034,712 | | | |
Chico’s FAS, Inc. | | | 102,870 | | | | 1,754,962 | | | |
Dick’s Sporting Goods, Inc. | | | 40,780 | | | | 2,041,447 | | | |
Group 1 Automotive, Inc. | | | 31,370 | | | | 2,018,032 | | | |
Penske Automotive Group, Inc. | | | 63,570 | | | | 1,941,428 | | | |
Rent-A-Center, Inc. | | | 88,980 | | | | 3,341,199 | | | |
Select Comfort Corp.* | | | 45,602 | | | | 1,142,786 | | | |
Sonic Automotive, Inc. - Class A | | | 105,400 | | | | 2,228,156 | | | |
| | | | | | | | | | |
| | | |
| | | | | | | 19,494,700 | | | |
| | | | | | | | | | |
| | | |
Total Consumer Discretionary | | | | | | | 62,459,279 | | | |
| | | | | | | | | | |
| | | |
Consumer Staples - 3.0% | | | | | | | | | | |
Beverages - 1.8% | | | | | | | | | | |
C&C Group plc (Ireland)*1 | | | 762,710 | | | | 4,137,219 | | | |
| | | | | | | | | | |
Food & Staples Retailing - 0.5% | | | | | | | | | | |
Distribuidora Internacional de Alimentacion S.A. (Spain)1 | | | 160,700 | | | | 1,213,965 | | | |
| | | | | | | | | | |
Food Products - 0.7% | | | | | | | | | | |
Tootsie Roll Industries, Inc. | | | 46,948 | | | | 1,492,007 | | | |
| | | | | | | | | | |
| | | |
Total Consumer Staples | | | | | | | 6,843,191 | | | |
| | | | | | | | | | |
The accompanying notes are an integral part of the financial statements.
3
Small Cap Series
Investment Portfolio - June 30, 2013
(unaudited)
| | | | | | | | | | |
| | | SHARES | | | VALUE (NOTE 2) | | | |
| | | |
COMMON STOCKS (continued) | | | | | | | | | | |
| | | |
Energy - 9.3% | | | | | | | | | | |
Energy Equipment & Services - 5.6% | | | | | | | | | | |
Calfrac Well Services Ltd. (Canada) | | | 171,080 | | | $ | 4,930,526 | | | |
CARBO Ceramics, Inc. | | | 11,020 | | | | 743,079 | | | |
Global Geophysical Services, Inc.* | | | 153,680 | | | | 725,370 | | | |
ION Geophysical Corp.* | | | 303,010 | | | | 1,824,120 | | | |
Key Energy Services, Inc.* | | | 133,470 | | | | 794,147 | | | |
Petroleum Geo-Services ASA (Norway)1 | | | 72,340 | | | | 883,272 | | | |
Trican Well Service Ltd. (Canada) | | | 191,910 | | | | 2,551,014 | | | |
| | | | | | | | | | |
| | | |
| | | | | | | 12,451,528 | | | |
| | | | | | | | | | |
Oil, Gas & Consumable Fuels - 3.7% | | | | | | | | | | |
Cloud Peak Energy, Inc.* | | | 347,710 | | | | 5,730,261 | | | |
Paladin Energy Ltd.*1 | | | 1,220,000 | | | | 971,788 | | | |
Paladin Energy Ltd. (Australia)*2 | | | 2,052,100 | | | | 1,678,051 | | | |
| | | | | | | | | | |
| | | |
| | | | | | | 8,380,100 | | | |
| | | | | | | | | | |
| | | |
Total Energy | | | | | | | 20,831,628 | | | |
| | | | | | | | | | |
| | | |
Financials - 15.0% | | | | | | | | | | |
Commercial Banks - 1.0% | | | | | | | | | | |
Cathay General Bancorp. | | | 107,590 | | | | 2,189,457 | | | |
| | | | | | | | | | |
Consumer Finance - 1.9% | | | | | | | | | | |
DFC Global Corp.* | | | 310,730 | | | | 4,291,181 | | | |
| | | | | | | | | | |
Diversified Financial Services - 4.0% | | | | | | | | | | |
JSE Ltd. (South Africa)1 | | | 764,540 | | | | 5,491,357 | | | |
MarketAxess Holdings, Inc. | | | 77,750 | | | | 3,634,813 | | | |
| | | | | | | | | | |
| | | |
| | | | | | | 9,126,170 | | | |
| | | | | | | | | | |
Insurance - 1.6% | | | | | | | | | | |
Brasil Insurance Participacoes e Administracao S.A. (Brazil) | | | 361,270 | | | | 3,550,609 | | | |
| | | | | | | | | | |
Real Estate Investment Trusts (REITS) - 5.9% | | | | | | | | | | |
AmREIT, Inc. - Class B | | | 64,000 | | | | 1,237,760 | | | |
Associated Estates Realty Corp. | | | 46,300 | | | | 744,504 | | | |
Cedar Realty Trust, Inc. | | | 207,440 | | | | 1,074,539 | | | |
Coresite Realty Corp. | | | 37,210 | | | | 1,183,650 | | | |
Corporate Office Properties Trust | | | 42,440 | | | | 1,082,220 | | | |
DuPont Fabros Technology, Inc. | | | 34,700 | | | | 838,005 | | | |
Education Realty Trust, Inc. | | | 140,020 | | | | 1,432,405 | | | |
Healthcare Realty Trust, Inc. | | | 44,680 | | | | 1,139,340 | | | |
Mack-Cali Realty Corp. | | | 37,130 | | | | 909,314 | | | |
Mid-America Apartment Communities, Inc. | | | 11,280 | | | | 764,446 | | | |
Pebblebrook Hotel Trust | | | 111,580 | | | | 2,884,343 | | | |
| | | | | | | | | | |
| | | |
| | | | | | | 13,290,526 | | | |
| | | | | | | | | | |
The accompanying notes are an integral part of the financial statements.
4
Small Cap Series
Investment Portfolio - June 30, 2013
(unaudited)
| | | | | | | | | | |
| | | SHARES | | | VALUE (NOTE 2) | | | |
| | | |
COMMON STOCKS (continued) | | | | | | | | | | |
| | | |
Financials (continued) | | | | | | | | | | |
Real Estate Management & Development - 0.6% | | | | | | | | | | |
General Shopping Brasil S.A. (Brazil)* | | | 328,590 | | | $ | 1,267,914 | | | |
| | | | | | | | | | |
| | | |
Total Financials | | | | | | | 33,715,857 | | | |
| | | | | | | | | | |
| | | |
Health Care - 14.8% | | | | | | | | | | |
Biotechnology - 5.2% | | | | | | | | | | |
Green Cross Corp. (South Korea)1 | | | 28,571 | | | | 3,058,396 | | | |
Myriad Genetics, Inc.* | | | 156,260 | | | | 4,198,706 | | | |
Seattle Genetics, Inc.* | | | 142,820 | | | | 4,493,117 | | | |
| | | | | | | | | | |
| | | |
| | | | | | | 11,750,219 | | | |
| | | | | | | | | | |
Health Care Equipment & Supplies - 7.6% | | | | | | | | | | |
DexCom, Inc.* | | | 210,140 | | | | 4,717,643 | | | |
HeartWare International, Inc.* | | | 47,730 | | | | 4,539,600 | | | |
Insulet Corp.* | | | 146,910 | | | | 4,614,443 | | | |
Thoratec Corp.* | | | 99,990 | | | | 3,130,687 | | | |
| | | | | | | | | | |
| | | |
| | | | | | | 17,002,373 | | | |
| | | | | | | | | | |
Health Care Technology - 1.4% | | | | | | | | | | |
Greenway Medical Technologies, Inc.* | | | 253,390 | | | | 3,126,833 | | | |
| | | | | | | | | | |
Pharmaceuticals - 0.6% | | | | | | | | | | |
ViroPharma, Inc.* | | | 44,900 | | | | 1,286,385 | | | |
| | | | | | | | | | |
| | | |
Total Health Care | | | | | | | 33,165,810 | | | |
| | | | | | | | | | |
| | | |
Industrials - 11.8% | | | | | | | | | | |
Airlines - 5.8% | | | | | | | | | | |
Spirit Airlines, Inc.* | | | 168,520 | | | | 5,353,880 | | | |
US Airways Group, Inc.* | | | 468,090 | | | | 7,686,038 | | | |
| | | | | | | | | | |
| | | |
| | | | | | | 13,039,918 | | | |
| | | | | | | | | | |
Commercial Services & Supplies - 0.5% | | | | | | | | | | |
Interface, Inc. | | | 61,360 | | | | 1,041,279 | | | |
| | | | | | | | | | |
Machinery - 3.8% | | | | | | | | | | |
Titan International, Inc. | | | 107,480 | | | | 1,813,188 | | | |
Wabash National Corp.* | | | 226,840 | | | | 2,309,231 | | | |
Westport Innovations, Inc. - ADR (Canada)* | | | 133,870 | | | | 4,488,661 | | | |
| | | | | | | | | | |
| | | |
| | | | | | | 8,611,080 | | | |
| | | | | | | | | | |
Marine - 1.7% | | | | | | | | | | |
Baltic Trading Ltd. | | | 411,730 | | | | 1,527,518 | | | |
D/S Norden A/S (Denmark)1 | | | 44,790 | | | | 1,519,214 | | | |
Sinotrans Shipping Ltd. (China)1 | | | 3,579,000 | | | | 854,668 | | | |
| | | | | | | | | | |
| | | |
| | | | | | | 3,901,400 | | | |
| | | | | | | | | | |
| | | |
Total Industrials | | | | | | | 26,593,677 | | | |
| | | | | | | | | | |
The accompanying notes are an integral part of the financial statements.
5
Small Cap Series
Investment Portfolio - June 30, 2013
(unaudited)
| | | | | | | | | | |
| | | SHARES | | | VALUE (NOTE 2) | | | |
| | | |
COMMON STOCKS (continued) | | | | | | | | | | |
| | | |
Information Technology - 9.8% | | | | | | | | | | |
Communications Equipment - 2.0% | | | | | | | | | | |
Infinera Corp.* | | | 307,570 | | | $ | 3,281,772 | | | |
Polycom, Inc.* | | | 117,490 | | | | 1,238,345 | | | |
| | | | | | | | | | |
| | | |
| | | | | | | 4,520,117 | | | |
| | | | | | | | | | |
Computers & Peripherals - 0.3% | | | | | | | | | | |
Fusion-io, Inc.* | | | 52,110 | | | | 742,046 | | | |
| | | | | | | | | | |
Electronic Equipment, Instruments & Components - 1.0% | | | | | | | | | | |
Rofin-Sinar Technologies, Inc.* | | | 86,410 | | | | 2,155,065 | | | |
| | | | | | | | | | |
Internet Software & Services - 3.2% | | | | | | | | | | |
Liquidity Services, Inc.* | | | 36,680 | | | | 1,271,696 | | | |
LogMeIn, Inc.* | | | 175,070 | | | | 4,282,212 | | | |
SciQuest, Inc.* | | | 69,520 | | | | 1,741,476 | | | |
| | | | | | | | | | |
| | | |
| | | | | | | 7,295,384 | | | |
| | | | | | | | | | |
IT Services - 2.5% | | | | | | | | | | |
InterXion Holding N.V. - ADR (Netherlands)* | | | 31,570 | | | | 824,924 | | | |
Wirecard AG (Germany)1 | | | 172,090 | | | | 4,682,536 | | | |
| | | | | | | | | | |
| | | |
| | | | | | | 5,507,460 | | | |
| | | | | | | | | | |
Software - 0.8% | | | | | | | | | | |
RealPage, Inc.* | | | 101,660 | | | | 1,864,444 | | | |
| | | | | | | | | | |
| | | |
Total Information Technology | | | | | | | 22,084,516 | | | |
| | | | | | | | | | |
| | | |
Materials - 1.7% | | | | | | | | | | |
Chemicals - 1.0% | | | | | | | | | | |
Tronox Ltd. - Class A | | | 108,400 | | | | 2,184,260 | | | |
| | | | | | | | | | |
Metals & Mining - 0.7% | | | | | | | | | | |
Noranda Aluminum Holding Corp. | | | 481,260 | | | | 1,554,470 | | | |
| | | | | | | | | | |
| | | |
Total Materials | | | | | | | 3,738,730 | | | |
| | | | | | | | | | |
| | | |
Utilities - 2.1% | | | | | | | | | | |
Independent Power Producers & Energy Traders - 2.1% | | | | | | | | | | |
Dynegy, Inc.* | | | 212,890 | | | | 4,800,669 | | | |
| | | | | | | | | | |
TOTAL COMMON STOCKS | | | | | | | | | | |
(Identified Cost $186,185,516) | | | | | | | 214,233,357 | | | |
| | | | | | | | | | |
| | | |
SHORT-TERM INVESTMENT - 5.3% | | | | | | | | | | |
| | | |
Dreyfus Cash Management, Inc. - Institutional Shares3, 0.05% (Identified Cost $11,860,977) | | | 11,860,977 | | | | 11,860,977 | | | |
| | | | | | | | | | |
The accompanying notes are an integral part of the financial statements.
6
Small Cap Series
Investment Portfolio - June 30, 2013
(unaudited)
| | | | | | |
| | | VALUE (NOTE 2) | | | |
| | |
TOTAL INVESTMENTS - 100.6% | | | | | | |
(Identified Cost $198,046,493) | | $ | 226,094,334 | | | |
LIABILITIES, LESS OTHER ASSETS - (0.6%) | | | (1,389,005 | ) | | |
| | | | | | |
| | |
NET ASSETS - 100% | | $ | 224,705,329 | | | |
| | | | | | |
ADR - American Depository Receipt
*Non-income producing security.
1 A factor from a third party vendor was applied to determine the security’s fair value following the close of local trading.
2 Traded on Canadian Stock Exchange.
3 Rate shown is the current yield as of June 30, 2013.
The accompanying notes are an integral part of the financial statements.
7
Small Cap Series
Statement of Assets and Liabilities
June 30, 2013 (unaudited)
| | | | |
ASSETS: | | | | |
| |
Investments (identified cost $198,046,493) (Note 2) | | $ | 226,094,334 | |
Cash | | | 1,394 | |
Receivable for securities sold | | | 2,071,169 | |
Dividends receivable | | | 251,411 | |
Receivable for fund shares sold | | | 108,424 | |
Foreign tax reclaims receivable | | | 47,555 | |
Prepaid expenses | | | 955 | |
| | | | |
| |
TOTAL ASSETS | | | 228,575,242 | |
| | | | |
| |
LIABILITIES: | | | | |
| |
Accrued management fees (Note 3) | | | 186,749 | |
Accrued fund accounting and administration fees (Note 3) | | | 8,049 | |
Accrued transfer agent fees (Note 3) | | | 3,201 | |
Accrued Chief Compliance Officer service fees (Note 3) | | | 340 | |
Payable for securities purchased | | | 3,075,397 | |
Payable for fund shares repurchased | | | 547,572 | |
Other payables and accrued expenses | | | 48,605 | |
| | | | |
| |
TOTAL LIABILITIES | | | 3,869,913 | |
| | | | |
| |
TOTAL NET ASSETS | | $ | 224,705,329 | |
| | | | |
| |
NET ASSETS CONSIST OF: | | | | |
| |
Capital stock | | $ | 194,108 | |
Additional paid-in-capital | | | 200,837,871 | |
Accumulated net investment loss | | | (6,417 | ) |
Accumulated net realized loss on investments, foreign currency and translation of other assets and liabilities | | | (4,367,389 | ) |
Net unrealized appreciation on investments, foreign currency and translation of other assets and liabilities | | | 28,047,156 | |
| | | | |
| |
TOTAL NET ASSETS | | $ | 224,705,329 | |
| | | | |
| |
NET ASSET VALUE, OFFERING PRICE AND REDEMPTION PRICE PER SHARE - CLASS A ($224,705,329/19,410,787 shares) | | $ | 11.58 | |
| | | | |
The accompanying notes are an integral part of the financial statements.
8
Small Cap Series
Statement of Operations
For the Six Months Ended June 30, 2013 (unaudited)
| | | | |
INVESTMENT INCOME: | | | | |
| |
Dividends (net of foreign taxes withheld, $61,380) | | $ | 1,073,763 | |
| | | | |
| |
EXPENSES: | | | | |
| |
Management fees (Note 3) | | | 1,084,512 | |
Fund accounting and administration fees (Note 3) | | | 25,956 | |
Transfer agent fees (Note 3) | | | 8,657 | |
Directors’ fees (Note 3) | | | 2,311 | |
Chief Compliance Officer service fees (Note 3) | | | 1,117 | |
Custodian fees | | | 15,218 | |
Miscellaneous | | | 52,395 | |
| | | | |
| |
Total Expenses | | | 1,190,166 | |
| | | | |
| |
NET INVESTMENT LOSS | | | (116,403 | ) |
| | | | |
| |
REALIZED AND UNREALIZED GAIN (LOSS) ON INVESTMENTS AND FOREIGN CURRENCY: | | | | |
| |
Net realized gain (loss) on-
Investments | | | 16,567,600 | |
Foreign currency and translation of other assets and liabilities | | | (12,408 | ) |
| | | | |
| |
| | | 16,555,192 | |
| | | | |
Net change in unrealized appreciation (depreciation) on-
Investments | | | 16,704,631 | |
Foreign currency and translation of other assets and liabilities | | | (231 | ) |
| | | | |
| |
| | | 16,704,400 | |
| | | | |
| |
NET REALIZED AND UNREALIZED GAIN (LOSS) ON INVESTMENTS AND FOREIGN CURRENCY | | | 33,259,592 | |
| | | | |
| |
NET INCREASE IN NET ASSETS RESULTING FROM OPERATIONS | | $ | 33,143,189 | |
| | | | |
The accompanying notes are an integral part of the financial statements.
9
Small Cap Series
Statements of Changes in Net Assets
| | | | | | | | |
| | | FOR THE SIX
MONTHS ENDED
6/30/13
(UNAUDITED) | | | FOR THE YEAR ENDED
12/31/12 | |
INCREASE IN NET ASSETS: | | | | | | | | |
| | |
OPERATIONS: | | | | | | | | |
| | |
Net investment income (loss) | | $ | (116,403 | ) | | $ | 154,493 | |
Net realized gain (loss) on investments and foreign currency | | | 16,555,192 | | | | 17,697,218 | |
Net change in unrealized appreciation (depreciation) on investments and foreign currency | | | 16,704,400 | | | | 15,044,668 | |
| | | | | | | | |
| | |
Net increase from operations | | | 33,143,189 | | | | 32,896,379 | |
| | | | | | | | |
| | |
CAPITAL STOCK ISSUED AND REPURCHASED: | | | | | | | | |
| | |
Net decrease from capital share transactions (Note 5) | | | (11,723,973 | ) | | | (8,935,366 | ) |
| | | | | | | | |
| | |
Net increase in net assets | | | 21,419,216 | | | | 23,961,013 | |
| | |
NET ASSETS: | | | | | | | | |
| | |
Beginning of period | | | 203,286,113 | | | | 179,325,100 | |
| | | | | | | | |
| | |
End of period (including accumulated net investment loss of $6,417 and undistributed net investment income of $109,986, respectively) | | $ | 224,705,329 | | | $ | 203,286,113 | |
| | | | | | | | |
The accompanying notes are an integral part of the financial statements.
10
Small Cap Series
Financial Highlights
| | | | | | | | | | | | | | | | | | | | | | | | |
| | | FOR THE SIX MONTHS ENDED
6/30/13
(UNAUDITED) | | | FOR THE YEARS ENDED | |
| | | | 12/31/12 | | | 12/31/11 | | | 12/31/10 | | | 12/31/09 | | | 12/31/08 | |
Per share data (for a share outstanding throughout each period): | | | | | | | | | | | | | | | | | | | | | | | | |
Net asset value - Beginning of period | | $ | 9.92 | | | $ | 8.36 | | | $ | 9.29 | | | $ | 7.39 | | | $ | 4.98 | | | $ | 10.21 | |
| | | | | | | | | | | | | | | | | | | | | | | | |
Income (loss) from investment operations: | | | | | | | | | | | | | | | | | | | | | | | | |
Net investment income (loss) | | | (0.01 | )1 | | | 0.01 | 1 | | | (0.02 | )1 | | | (0.01 | )1 | | | (0.02 | )1 | | | (0.02 | ) |
Net realized and unrealized gain (loss) on investments | | | 1.67 | | | | 1.55 | | | | (0.91 | ) | | | 1.91 | | | | 2.43 | | | | (5.12 | ) |
| | | | | | | | | | | | | | | | | | | | | | | | |
| | | | | | |
Total from investment operations | | | 1.66 | | | | 1.56 | | | | (0.93 | ) | | | 1.90 | | | | 2.41 | | | | (5.14 | ) |
| | | | | | | | | | | | | | | | | | | | | | | | |
| | | | | | |
Less distributions to shareholders: | | | | | | | | | | | | | | | | | | | | | | | | |
From net realized gain on investments | | | — | | | | — | | | | — | | | | — | | | | — | | | | (0.09 | ) |
| | | | | | | | | | | | | | | | | | | | | | | | |
| | | | | | |
Net asset value - End of period | | $ | 11.58 | | | $ | 9.92 | | | $ | 8.36 | | | $ | 9.29 | | | $ | 7.39 | | | $ | 4.98 | |
| | | | | | | | | | | | | | | | | | | | | | | | |
| | | | | | |
Net assets - End of period (000’s omitted) | | $ | 224,705 | | | $ | 203,286 | | | $ | 179,325 | | | $ | 208,397 | | | $ | 171,910 | | | $ | 120,162 | |
| | | | | | | | | | | | | | | | | | | | | | | | |
| | | | | | |
Total return2 | | | 16.73 | % | | | 18.66 | % | | | (10.01 | %) | | | 25.71 | % | | | 48.39 | % | | | (50.68 | %) |
Ratios (to average net assets)/ | | | | | | | | | | | | | | | | | | | | | | | | |
Supplemental Data: | | | | | | | | | | | | | | | | | | | | | | | | |
Expenses* | | | 1.10 | %3 | | | 1.10 | % | | | 1.11 | % | | | 1.12 | % | | | 1.15 | % | | | 1.15 | % |
Net investment income (loss) | | | (0.11 | %)3 | | | 0.08 | % | | | (0.27 | %) | | | (0.13 | %) | | | (0.34 | %) | | | (0.39 | %) |
Portfolio turnover | | | 25 | % | | | 65 | % | | | 75 | % | | | 75 | % | | | 76 | % | | | 68 | % |
|
| * For certain periods presented, the investment advisor did not impose all or a portion of its management and/or other fees, and in some periods may have paid a portion of the Series’ expenses. If these expenses had been incurred by the Series, the expense ratio (to average net assets) would have increased by the following amounts: | |
| | | | | | |
| | | N/A | | | | N/A | | | | N/A | | | | 0.00 | %4 | | | 0.00 | %4 | | | N/A | |
1Calculated based on average shares outstanding during the periods.
2Represents aggregate total return for the periods indicated, and assumes reinvestment of all distributions. Total return would have been lower had certain expenses not been waived or reimbursed during the periods. Periods less than one year are not annualized.
3Annualized.
4Less than 0.01%.
The accompanying notes are an integral part of the financial statements.
11
Small Cap Series
Notes to Financial Statements
(unaudited)
Small Cap Series (the “Series”) is a no-load diversified series of Manning & Napier Fund, Inc. (the “Fund”). The Fund is organized in Maryland and is registered under the Investment Company Act of 1940, as amended, as an open-end management investment company.
The Series’ investment objective is to provide long-term growth by investing principally in the common stocks of companies with small market capitalizations.
The Series is authorized to issue five classes of shares (Class A, B, D, E and Z). Currently, only Class A shares have been issued. Each class of shares is substantially the same, except that class-specific distribution and shareholder servicing expenses are borne by the specific class of shares to which they relate.
The Fund’s advisor is Manning & Napier Advisors, LLC (the “Advisor”). Shares of the Series are offered to investors, clients and employees of the Advisor and its affiliates. The total authorized capital stock of the Fund consists of 15 billion shares of common stock each having a par value of $0.01. As of June 30, 2013, 10.3 billion shares have been designated in total among 42 series, of which 87.5 million have been designated as Small Cap Series Class A common stock.
| 2. | Significant Accounting Policies |
Security Valuation
Portfolio securities, including domestic equities, foreign equities, warrants and options, listed on an exchange other than the NASDAQ Stock Market are valued at the latest quoted sales price of the exchange on which the security is primarily traded. Securities not traded on valuation date or securities not listed on an exchange are valued at the latest quoted bid price provided by the Fund’s pricing service. Securities listed on the NASDAQ Stock Market are valued in accordance with the NASDAQ Official Closing Price.
Short-term investments that mature in sixty days or less are valued at amortized cost, which approximates fair value. Investments in open-end investment companies are valued at their net asset value per share on valuation date.
Volume and level of activity in established markets for an asset or liability are evaluated to determine whether recent transactions and quoted prices are determinative of fair value. Where there have been significant decreases in volume and level of activity, further analysis and adjustment may be necessary to estimate fair value. The Series measures fair value in these instances by the use of inputs and valuation techniques which may be based upon current market prices of securities that are comparable in coupon, rating, maturity and industry and/or expectation of future cash flows. As a result of trading in relatively thin markets and/or markets that experience significant volatility, the prices used by the Series to value these securities may differ from the value that would be realized if these securities were sold, and the differences could be material.
Securities for which representative valuations or prices are not available from the Series’ pricing service may be valued at fair value as determined in good faith by the Advisor under procedures approved by and under the general supervision and responsibility of the Fund’s Board of Directors (the “Board”). Due to the inherent uncertainty of valuations of such securities, the fair value may differ significantly from the values that would have been used had a ready market for such securities existed. If trading or events occurring after the close of the principal market in which securities are traded are expected to materially affect the value of those securities, then they may be valued at their fair value, taking this trading or these events into account. In accordance with the procedures approved by the Board, the values of certain securities trading outside the U.S. were adjusted following the close of local trading using a factor from a third party vendor. The third party vendor uses statistical analyses and quantitative models, which consider among other things subsequent movement and changes in the prices of indices, securities and exchange rates in other markets, to determine the factors which are used to adjust local market prices. The value of securities used for net asset value calculation under these procedures may differ from published prices for the same securities. It is the Fund’s policy to classify each foreign equity security where a factor from a third party vendor is provided as a Level 2 security.
12
Small Cap Series
Notes to Financial Statements (continued)
(unaudited)
| 2. | Significant Accounting Policies (continued) |
Security Valuation (continued)
Various inputs are used in determining the value of the Series’ assets or liabilities carried at fair value. These inputs are summarized in three broad levels. Level 1 includes quoted prices in active markets for identical assets and liabilities. Level 2 includes other significant observable inputs (including quoted prices for similar securities, interest rates, prepayment speeds, credit risk, etc.). Level 3 includes significant unobservable inputs (including the Series’ own assumptions in determining the fair value of investments). A financial instrument’s level within the fair value hierarchy is based on the lowest level of any input both individually and in aggregate that is significant to the fair value measurement. The inputs or methodology used for valuing securities are not necessarily an indication of the risk associated with investing in those securities.
The following is a summary of the valuation levels used for major security types as of June 30, 2013 in valuing the Series’ assets or liabilities carried at fair value:
| | | | | | | | | | | | | | | | |
| DESCRIPTION | | TOTAL | | | LEVEL 1 | | | LEVEL 2 | | | LEVEL 3 | |
Assets: | | | | | | | | | | | | | | | | |
Equity securities: | | | | | | | | | | | | | | | | |
Consumer Discretionary | | $ | 62,459,279 | | | $ | 49,795,652 | | | $ | 12,663,627 | | | $ | — | |
Consumer Staples | | | 6,843,191 | | | | 1,492,007 | | | | 5,351,184 | | | | — | |
Energy | | | 20,831,628 | | | | 18,976,568 | | | | 1,855,060 | | | | — | |
Financials | | | 33,715,857 | | | | 28,224,500 | | | | 5,491,357 | | | | — | |
Health Care | | | 33,165,810 | | | | 30,107,414 | | | | 3,058,396 | | | | — | |
Industrials | | | 26,593,677 | | | | 24,219,795 | | | | 2,373,882 | | | | — | |
Information Technology | | | 22,084,516 | | | | 17,401,980 | | | | 4,682,536 | | | | — | |
Materials | | | 3,738,730 | | | | 3,738,730 | | | | — | | | | — | |
Utilities | | | 4,800,669 | | | | 4,800,669 | | | | — | | | | — | |
Mutual fund | | | 11,860,977 | | | | 11,860,977 | | | | — | | | | — | |
| | | | | | | | | | | | | | | | |
Total assets | | $ | 226,094,334 | | | $ | 190,618,292 | | | $ | 35,476,042 | | | $ | — | |
| | | | | | | | | | | | | | | | |
Please see the Investment Portfolio for foreign securities where a factor from a third party vendor was applied to determine the securities’ fair value following the close of local trading. Such securities are included in Level 2 in the table above.
There were no Level 3 securities held by the Series as of December 31, 2012 or June 30, 2013.
The Fund’s policy is to recognize transfers in and transfers out of the valuation levels as of the beginning of the reporting period. There were no transfers between Level 1 and Level 2 during the six months ended June 30, 2013.
Security Transactions, Investment Income and Expenses
Security transactions are accounted for on trade date. Dividend income is recorded on the ex-dividend date, except that if the ex-dividend date has passed, certain dividends from foreign securities are recorded as soon as the Series is informed of the ex-dividend date. Non-cash dividends, if any, are recorded at the fair value of the securities received. Interest income, including amortization of premium and accretion of discounts using the effective interest method, is earned from settlement date and accrued daily.
Expenses are recorded on an accrual basis. Most expenses of the Fund can be attributed to a specific series. Expenses which cannot be directly attributed are apportioned among the series in the Fund in such a manner as deemed equitable by the Fund’s Board, taking into consideration, among other things, the nature and type of expense.
The Fund records distributions received in excess of income from underlying investments as a reduction of cost of investments and/or realized gain. Such amounts are based on estimates if actual amounts are not available and actual amounts of income, realized gain and return of capital may differ from the estimated amounts. The Fund adjusts the estimated amounts of components of distributions (and consequently its net investment income) as necessary once the issuers provide information about the actual composition of the distributions.
13
Small Cap Series
Notes to Financial Statements (continued)
(unaudited)
| 2. | Significant Accounting Policies (continued) |
Security Transactions, Investment Income and Expenses (continued)
The Series uses the identified cost method for determining realized gain or loss on investments for both financial statement and federal income tax reporting purposes.
Foreign Currency Translation
The books and records of the Series are maintained in U.S. dollars. Foreign currencies, investments and other assets and liabilities are translated into U.S. dollars at the current exchange rates. Purchases and sales of investment securities and income and expenses are translated on the respective dates of such transactions. The Series does not isolate realized and unrealized gains and losses attributable to changes in the exchange rates from gains and losses that arise from changes in the fair value of investments. Such fluctuations are included with net realized and unrealized gain or loss on investments. Net realized foreign currency gains and losses represent foreign currency gains and losses between trade date and settlement date on securities transactions, gains and losses on disposition of foreign currencies and the difference between the amount of income and foreign withholding taxes recorded on the books of the Series and the amounts actually received or paid.
Federal Taxes
The Series’ policy is to comply with the provisions of the Internal Revenue Code applicable to regulated investment companies. The Series is not subject to federal income tax or excise tax to the extent that the Series distributes to shareholders each year its taxable income, including any net realized gains on investments, in accordance with requirements of the Internal Revenue Code. Accordingly, no provision for federal income tax or excise tax has been made in the financial statements.
Management evaluates its tax positions to determine if the tax positions taken meet the minimum recognition threshold in connection with accounting for uncertainties in income tax positions taken or expected to be taken for the purposes of measuring and recognizing tax liabilities in the financial statements. Recognition of tax benefits of an uncertain tax position is required only when the position is “more likely than not” to be sustained assuming examination by taxing authorities. At June 30, 2013, the Series has recorded no liability for net unrecognized tax benefits relating to uncertain income tax positions taken or expected to be taken in future tax returns.
The Series files income tax returns in the U.S. federal jurisdiction, various states and foreign jurisdictions, as required. No income tax returns are currently under investigation. The statute of limitations on the Series’ tax returns remains open for the years ended December 31, 2009 through December 31, 2012. The Series is not aware of any tax positions for which it is reasonably possible that the total amounts of unrecognized tax benefits will significantly change in the next twelve months.
Foreign Taxes
Based on the Series’ understanding of the tax rules and rates related to income, gains and currency purchase/repatriation transactions for foreign jurisdictions in which it invests, the Series will provide for foreign taxes, and where appropriate, deferred foreign tax.
Distributions of Income and Gains
Distributions to shareholders of net investment income and net realized gains are made annually. An additional distribution may be necessary to avoid taxation of the Series. Distributions are recorded on the ex-dividend date.
Indemnifications
The Fund’s organizational documents provide former and current directors and officers with a limited indemnification against liabilities arising in connection with the performance of their duties to the Fund. In the normal course of business, the Fund may also enter into contracts that provide general indemnifications. The Fund’s maximum exposure under these arrangements is unknown as this would be dependent on future claims that may be made against the Fund. The risk of material loss from such claims is considered remote.
Other
The preparation of financial statements in conformity with accounting principles generally accepted in the United States of America requires management to make estimates and assumptions that affect the reported amounts of assets and liabilities and
14
Small Cap Series
Notes to Financial Statements (continued)
(unaudited)
| 2. | Significant Accounting Policies (continued) |
Other (continued)
the disclosure of contingent assets and liabilities at the date of the financial statements and the reported amounts of income and expenses during the reporting period. Actual results could differ from those estimates.
| 3. | Transactions with Affiliates |
The Fund has an Investment Advisory Agreement (the “Agreement”) with the Advisor, for which the Series pays a fee, computed daily and payable monthly, at an annual rate of 1.00% of the Series’ average daily net assets.
Under the Agreement, personnel of the Advisor provide the Series with advice and assistance in the choice of investments and the execution of securities transactions, and otherwise maintain the Series’ organization. The Advisor also provides the Fund with necessary office space and fund administration and support services. The salaries of all officers of the Fund (except a percentage of the Fund’s Chief Compliance Officer’s salary, which is paid by the Fund), and of all Directors who are “affiliated persons” of the Fund, or of the Advisor, and all personnel of the Fund, or of the Advisor, performing services relating to research, statistical and investment activities, are paid by the Advisor. Each “non-affiliated” Director receives an annual stipend, which is allocated among all the active series of the Fund. In addition, these Directors also receive a fee per Board meeting attended plus a fee for each committee meeting attended.
Manning & Napier Investor Services, Inc., a registered broker-dealer affiliate of the Advisor, acts as distributor for the Fund’s shares. The services of Manning & Napier Investor Services, Inc. are provided at no additional cost to the Series.
The Advisor has agreements with BNY Mellon Investment Servicing (U.S.) Inc. (“BNY”) under which BNY serves as sub-accountant services agent and sub-transfer agent. The Fund pays the Advisor an annual fee related to fund accounting and administration of 0.0175% on the first $3 billion of average daily net assets (excluding Target Series and Strategic Income Series); 0.015% on the next $3 billion of average daily net assets (excluding Target Series and Strategic Income Series); and 0.01% of the average daily net assets in excess of $6 billion (excluding Target Series and Strategic Income Series); plus a base fee of $25,500 per series. Transfer Agent fees are charged to the Fund on a per account basis. Additionally, certain transaction and cusip-based fees and out-of-pocket expenses, including charges for reporting relating to the Fund’s compliance program, are charged. Effective October 1, 2012, the aforementioned agreements were modified to reduce the annual fee related to fund accounting and administration, as well as transfer agent fees, by 10%, excluding out-of-pocket expenses.
Expenses not directly attributable to a series are allocated based on each series’ relative net assets or number of accounts, depending on the expense.
| 4. | Purchases and Sales of Securities |
For the six months ended June 30, 2013, purchases and sales of securities, other than U.S. Government securities and short-term securities, were $52,696,880 and $70,407,341 respectively. There were no purchases or sales of U.S. Government securities.
| 5. | Capital Stock Transactions |
Transactions in Class A shares of Small Cap Series were:
| | | | | | | | | | | | | | | | |
| | | FOR THE SIX MONTHS ENDED 6/30/13 | | | FOR THE YEAR ENDED 12/31/12 | |
| | | SHARES | | | AMOUNT | | | SHARES | | | AMOUNT | |
Sold | | | 672,486 | | | $ | 7,367,462 | | | | 1,257,616 | | | $ | 11,832,582 | |
Repurchased | | | (1,749,687 | ) | | | (19,091,435 | ) | | | (2,207,178 | ) | | | (20,767,948 | ) |
| | | | | | | | | | | | | | | | |
Total | | | (1,077,201 | ) | | $ | (11,723,973 | ) | | | (949,562 | ) | | $ | (8,935,366 | ) |
| | | | | | | | | | | | | | | | |
15
Small Cap Series
Notes to Financial Statements (continued)
(unaudited)
| 5. | Capital Stock Transactions (continued) |
Approximately 95% of the Series’ shares represent investments by fiduciary accounts over which the Advisor has sole investment discretion. At June 30, 2013, the retirement plan of the Advisor and its affiliates owned 59,927 shares (0.31% of shares outstanding) valued at $693,960.
The Series may trade in instruments including written and purchased options, forward foreign currency exchange contracts and futures contracts and other derivatives in the normal course of investing activities to assist in managing exposure to various market risks. The Series may be subject to various elements of risk, which may involve, to a varying degree, elements of risk in excess of the amounts recognized for financial statement purposes. These risks include: the risk that changes in the value of a derivative may not correlate perfectly with the underlying asset, rate or index; counterparty credit risk related to over the counter derivative counterparties’ failure to perform under contract terms; liquidity risk related to the lack of a liquid market for these contracts allowing the fund to close out its position(s); and documentation risk relating to disagreement over contract terms. No such investments were held by the Series as of June 30, 2013.
Investing in securities of foreign companies and foreign governments involves special risks and considerations not typically associated with investing in securities of domestic companies and the U.S. Government. These risks include revaluation of currencies and future adverse political and economic developments. Moreover, securities of foreign companies and foreign governments and their markets may be less liquid and their prices more volatile than those of comparable domestic companies and the U.S. Government.
| 8. | Federal Income Tax Information |
The amount and characterization of certain income and capital gains to be distributed are determined in accordance with federal income tax regulations, which may differ from accounting principles generally accepted in the United States of America. The Series may periodically make reclassifications among its capital accounts to reflect income and gains available for distribution (or available capital loss carryovers) under income tax regulations, without impacting the Series’ net asset value. Any such reclassifications are not reflected in the financial highlights.
Under the Regulated Investment Company Modernization Act of 2010 (the “Act”), net capital losses recognized by the Series after December 31, 2010, may get carried forward indefinitely, and will retain their character as short-term and/or long-term losses. Prior to the Act, net capital losses incurred by the Series were carried forward for eight years and treated as short-term losses. The Act requires that post-enactment net capital losses be used before pre-enactment net capital losses.
As of December 31, 2012, the Series had the following pre-enactment net capital loss carryforwards, expiring during the year indicated, which are available to offset future realized gains to the extent allowed by the tax law:
| | | | | | | | |
| LOSS CARRYOVER | | EXPIRATION DATE | | | | | |
$19,830,385 | | | December 31, 2017 | | | | | |
16
Small Cap Series
Notes to Financial Statements (continued)
(unaudited)
| 8. | Federal Income Tax Information (continued) |
At June 30, 2013, the identified cost for federal income tax purposes, the resulting gross unrealized appreciation and depreciation, and the net unrealized appreciation were as follows:
| | | | |
Cost for federal income tax purposes | | $ | 198,046,493 | |
Unrealized appreciation | | | 42,245,850 | |
Unrealized depreciation | | | (14,198,009 | ) |
| | | | |
Net unrealized appreciation | | $ | 28,047,841 | |
| | | | |
17
{This page intentionally left blank}
18
Small Cap Series
Literature Requests
(unaudited)
Proxy Voting Policies and Procedures
A description of the policies and procedures that the Fund uses to determine how to vote proxies relating to portfolio securities is available, without charge, upon request:
| | | | |
| By phone | | 1-800-466-3863 | | |
| On the Securities and Exchange | | | | |
| Commission’s (SEC) web site | | http://www.sec.gov | | |
Proxy Voting Record
Information regarding how the Fund voted proxies relating to portfolio securities during the most recent 12-month period ended June 30th is available, without charge, upon request:
| | | | |
| By phone | | 1-800-466-3863 | | |
| On the SEC’s web site | | http://www.sec.gov | | |
Quarterly Portfolio Holdings
The Series’ complete schedule of portfolio holdings for the 1st and 3rd quarters of each fiscal year are provided on Form N-Q, and are available, without charge, upon request:
| | | | |
| By phone | | 1-800-466-3863 | | |
| On the SEC’s web site | | http://www.sec.gov | | |
The Series’ Form N-Q may be reviewed and copied at the SEC’s Public Reference Room in Washington, D.C. Information on the operation of the Public Reference Room may be obtained by calling 1-800-SEC-0330.
Prospectus and Statement of Additional Information (SAI)
The prospectus and SAI provide additional information about each Series, including charges, expenses and risks. These documents are available, without charge, upon request:
| | | | |
| By phone | | 1-800-466-3863 | | |
| On the SEC’s web site | | http://www.sec.gov | | |
| On our web site | | http://www.manning-napier.com | | |
Additional information available at www.manning-napier.com
1. Fund Holdings - Month-End
2. Fund Holdings - Quarter-End
3. Shareholder Report - Annual
4. Shareholder Report - Semi-Annual
The Fund also offers electronic notification or “e-delivery” when certain documents are available on-line to be downloaded or reviewed. Direct shareholders can elect to receive electronic notification when shareholder reports, prospectus updates, and/or statements are available. If you do not currently have on-line access to your account, you can establish access by going to www.manning-napier.com, click on “Login” in the top corner of the page, and follow the prompts to self-enroll. Once enrolled, you can set your electronic notification preferences by clicking on the Account Options tab located within the green toolbar and then select E-Delivery Option. Should you have any questions on either how to establish on-line access or how to update your account settings, please contact Investor Services at 1-800-466-3863.
MNSCS-6/13-SAR
| | | | | | |
| | | | TECHNOLOGY SERIES | | |
www.manning-napier.com | | | | |
Technology Series
Shareholder Expense Example
(unaudited)
As a shareholder of the Series, you may incur two types of costs: (1) transaction costs and (2) ongoing costs, including management fees and other Series expenses. This example is intended to help you understand your ongoing costs (in dollars) of investing in the Series and to compare these costs with the ongoing costs of investing in other mutual funds.
The example is based on an investment of $1,000 invested at the beginning of the period and held for the entire period (January 1, 2013 to June 30, 2013).
Actual Expenses
The first line of the table below provides information about actual account values and actual expenses. You may use the information in this line, together with the amount you invested, to estimate the expenses that you paid over the period. Simply divide your account value by $1,000 (for example, an $8,600 account value divided by $1,000 = 8.6), then multiply the result by the number in the first line under the heading entitled “Expenses Paid During Period” to estimate the expenses you paid on your account during this period.
Hypothetical Example for Comparison Purposes
The second line of the table below provides information about hypothetical account values and hypothetical expenses based on the Series’ actual expense ratio and an assumed rate of return of 5% per year before expenses, which is not the Series’ actual return. The hypothetical account values and expenses may not be used to estimate the actual ending account balance or expenses you paid during the period. You may use this information to compare the ongoing costs of investing in the Series and other funds. To do so, compare this 5% hypothetical example with the 5% hypothetical examples that appear in the shareholder reports of the other funds.
Please note that the expenses shown in the table are meant to highlight your ongoing costs only and do not reflect any transaction costs. Therefore, the second line of the table is useful in comparing ongoing costs only, and will not help you determine the relative total costs of owning different funds. In addition, if these transaction costs were included, your costs would have been higher.
| | | | | | |
| | | BEGINNING ACCOUNT VALUE 1/1/13 | | ENDING ACCOUNT VALUE 6/30/13 | | EXPENSES PAID
DURING PERIOD*
1/1/13-6/30/13 |
Actual | | $1,000.00 | | $1,121.10 | | $5.89 |
Hypothetical (5% return before expenses) | | $1,000.00 | | $1,019.24 | | $5.61 |
*Expenses are equal to the Series’ annualized expense ratio (for the six-month period) of 1.12%, multiplied by the average account value over the period, multiplied by 181/365 to reflect the one-half year period. Expenses are based on the most recent fiscal half year.
1
Technology Series
Portfolio Composition as of June 30, 2013
(unaudited)

| | | | | | | | | | | | |
| Top Ten Stock Holdings2 | |
Electronic Arts, Inc. | | | 4.7 | % | | | | Shutterfly, Inc. | | | 3.6% | |
EMC Corp. | | | 4.6 | % | | | | LinkedIn Corp. - Class A | | | 3.5% | |
Google, Inc. - Class A | | | 4.0 | % | | | | Amdocs Ltd. - ADR | | | 3.5% | |
Qualcomm, Inc. | | | 3.9 | % | | | | DIRECTV | | | 3.3% | |
RealPage, Inc. | | | 3.6 | % | | | | Monsanto Co. | | | 3.2% | |
| | | | | |
2As a percentage of total investments. | | | | | | | | | | | | |
2
Technology Series
Investment Portfolio - June 30, 2013
(unaudited)
| | | | | | | | | | |
| | | |
| | | SHARES | | | VALUE
(NOTE 2) | | | |
| | | |
COMMON STOCKS - 99.1% | | | | | | | | | | |
| | | |
Consumer Discretionary - 15.5% | | | | | | | | | | |
Automobiles - 2.5% | | | | | | | | | | |
Tesla Motors, Inc.* | | | 39,000 | | | $ | 4,189,770 | | | |
| | | | | | | | | | |
Internet & Catalog Retail - 9.7% | | | | | | | | | | |
Amazon.com, Inc.* | | | 19,000 | | | | 5,276,110 | | | |
HomeAway, Inc.* | | | 157,000 | | | | 5,077,380 | | | |
Shutterfly, Inc.* | | | 109,000 | | | | 6,081,110 | | | |
| | | | | | | | | | |
| | | |
| | | | | | | 16,434,600 | | | |
| | | | | | | | | | |
Media - 3.3% | | | | | | | | | | |
DIRECTV* | | | 92,000 | | | | 5,669,040 | | | |
| | | | | | | | | | |
| | | |
Total Consumer Discretionary | | | | | | | 26,293,410 | | | |
| | | | | | | | | | |
| | | |
Health Care - 2.9% | | | | | | | | | | |
Health Care Technology - 2.9% | | | | | | | | | | |
Cerner Corp.* | | | 51,000 | | | | 4,900,590 | | | |
| | | | | | | | | | |
Industrials - 2.0% | | | | | | | | | | |
Electrical Equipment - 2.0% | | | | | | | | | | |
Polypore International, Inc.* | | | 85,120 | | | | 3,430,336 | | | |
| | | | | | | | | | |
Information Technology - 75.5% | | | | | | | | | | |
Communications Equipment - 18.7% | | | | | | | | | | |
F5 Networks, Inc.* | | | 65,000 | | | | 4,472,000 | | | |
Infinera Corp.* | | | 518,000 | | | | 5,527,060 | | | |
Juniper Networks, Inc.* | | | 281,000 | | | | 5,426,110 | | | |
Polycom, Inc.* | | | 457,000 | | | | 4,816,780 | | | |
Qualcomm, Inc. | | | 108,000 | | | | 6,596,640 | | | |
Riverbed Technology, Inc.* | | | 320,000 | | | | 4,979,200 | | | |
| | | | | | | | | | |
| | | |
| | | | | | | 31,817,790 | | | |
| | | | | | | | | | |
Computers & Peripherals - 7.4% | | | | | | | | | | |
Apple, Inc. | | | 12,170 | | | | 4,820,294 | | | |
EMC Corp. | | | 331,000 | | | | 7,818,220 | | | |
| | | | | | | | | | |
| | | |
| | | | | | | 12,638,514 | | | |
| | | | | | | | | | |
Electronic Equipment, Instruments & Components - 3.1% | | | | | | | | | | |
Rofin-Sinar Technologies, Inc.* | | | 211,000 | | | | 5,262,340 | | | |
| | | | | | | | | | |
Internet Software & Services - 19.3% | | | | | | | | | | |
eBay, Inc.* | | | 94,600 | | | | 4,892,712 | | | |
Google, Inc. - Class A* | | | 7,740 | | | | 6,814,064 | | | |
LinkedIn Corp. - Class A* | | | 33,600 | | | | 5,990,880 | | | |
Liquidity Services, Inc.* | | | 49,198 | | | | 1,705,695 | | | |
LogMeIn, Inc.* | | | 208,000 | | | | 5,087,680 | | | |
SciQuest, Inc.* | | | 135,000 | | | | 3,381,750 | | | |
Tencent Holdings Ltd. (China)1 | | | 127,000 | | | | 4,958,999 | | | |
| | | | | | | | | | |
| | | |
| | | | | | | 32,831,780 | | | |
| | | | | | | | | | |
The accompanying notes are an integral part of the financial statements.
3
Technology Series
Investment Portfolio - June 30, 2013
(unaudited)
| | | | | | | | | | |
| | | |
| | | SHARES | | | VALUE
(NOTE 2) | | | |
COMMON STOCKS (continued) | | | | | | | | | | |
| | | |
Information Technology (continued) | | | | | | | | | | |
IT Services - 7.9% | | | | | | | | | | |
Amdocs Ltd. - ADR | | | 160,000 | | | $ | 5,934,400 | | | |
Cap Gemini S.A. (France)1 | | | 48,000 | | | | 2,330,954 | | | |
VeriFone Systems, Inc.* | | | 306,000 | | | | 5,143,860 | | | |
| | | | | | | | | | |
| | | |
| | | | | | | 13,409,214 | | | |
| | | | | | | | | | |
Semiconductors & Semiconductor Equipment - 2.8% | | | | | | | | | | |
Skyworks Solutions, Inc.* | | | 215,000 | | | | 4,706,350 | | | |
| | | | | | | | | | |
Software - 16.3% | | | | | | | | | | |
Autodesk, Inc.* | | | 125,000 | | | | 4,242,500 | | | |
Electronic Arts, Inc.* | | | 352,200 | | | | 8,090,034 | | | |
Fortinet, Inc.* | | | 261,350 | | | | 4,573,625 | | | |
MICROS Systems, Inc.* | | | 109,000 | | | | 4,703,350 | | | |
RealPage, Inc.* | | | 334,881 | | | | 6,141,717 | | | |
| | | | | | | | | | |
| | | |
| | | | | | | 27,751,226 | | | |
| | | | | | | | | | |
| | | |
Total Information Technology | | | | | | | 128,417,214 | | | |
| | | | | | | | | | |
| | | |
Materials - 3.2% | | | | | | | | | | |
Chemicals - 3.2% | | | | | | | | | | |
Monsanto Co. | | | 56,000 | | | | 5,532,800 | | | |
| | | | | | | | | | |
TOTAL COMMON STOCKS | | | | | | | | | | |
(Identified Cost $139,361,448) | | | | | | | 168,574,350 | | | |
| | | | | | | | | | |
| | | |
SHORT-TERM INVESTMENT - 1.1% | | | | | | | | | | |
| | | |
Dreyfus Cash Management, Inc. - Institutional Shares2, 0.05% | | | | | | | | | | |
(Identified Cost $1,816,221) | | | 1,816,221 | | | | 1,816,221 | | | |
| | | | | | | | | | |
| | | |
TOTAL INVESTMENTS - 100.2% | | | | | | | | | | |
(Identified Cost $141,177,669) | | | | | | | 170,390,571 | | | |
LIABILITIES, LESS OTHER ASSETS - (0.2%) | | | | | | | (356,900 | ) | | |
| | | | | | | | | | |
| | | |
NET ASSETS - 100% | | | | | | $ | 170,033,671 | | | |
| | | | | | | | | | |
ADR - American Depository Receipt
*Non-income producing security.
1A factor from a third party vendor was applied to determine the security’s fair value following the close of local trading.
2Rate shown is the current yield as of June 30, 2013.
The accompanying notes are an integral part of the financial statements.
4
Technology Series
Statement of Assets and Liabilities
June 30, 2013 (unaudited)
| | | | |
ASSETS: | | | | |
| |
Investments (identified cost $141,177,669) (Note 2) | | $ | 170,390,571 | |
Receivable for fund shares sold | | | 111,732 | |
Dividends receivable | | | 54,032 | |
Foreign tax reclaims receivable | | | 8,863 | |
Prepaid expenses | | | 741 | |
| | | | |
| |
TOTAL ASSETS | | | 170,565,939 | |
| | | | |
| |
LIABILITIES: | | | | |
| |
Accrued management fees (Note 3) | | | 140,353 | |
Accrued fund accounting and administration fees (Note 3) | | | 6,509 | |
Accrued transfer agent fees (Note 3) | | | 2,606 | |
Accrued Chief Compliance Officer service fees (Note 3) | | | 339 | |
Payable for fund shares repurchased | | | 357,290 | |
Other payables and accrued expenses | | | 25,171 | |
| | | | |
| |
TOTAL LIABILITIES | | | 532,268 | |
| | | | |
| |
TOTAL NET ASSETS | | $ | 170,033,671 | |
| | | | |
| |
NET ASSETS CONSIST OF: | | | | |
| |
Capital stock | | $ | 139,186 | |
Additional paid-in-capital | | | 142,696,800 | |
Accumulated net investment loss | | | (579,693 | ) |
Accumulated net realized loss on investments, foreign currency and translation of other assets and liabilities | | | (1,435,148 | ) |
Net unrealized appreciation on investments, foreign currency and translation of other assets and liabilities | | | 29,212,526 | |
| | | | |
| |
TOTAL NET ASSETS | | $ | 170,033,671 | |
| | | | |
| |
NET ASSET VALUE, OFFERING PRICE AND REDEMPTION PRICE PER SHARE - CLASS A ($170,033,671/13,918,646 shares) | | $ | 12.22 | |
| | | | |
The accompanying notes are an integral part of the financial statements.
5
Technology Series
Statement of Operations
For the Six Months Ended June 30, 2013 (unaudited)
| | | | |
INVESTMENT INCOME: | | | | |
| |
Dividends (net of foreign taxes withheld, $9,381) | | $ | 322,654 | |
| | | | |
| |
EXPENSES: | | | | |
| |
Management fees (Note 3) | | | 804,001 | |
Fund accounting and administration fees (Note 3) | | | 22,323 | |
Transfer agent fees (Note 3) | | | 7,182 | |
Directors’ fees (Note 3) | | | 1,716 | |
Chief Compliance Officer service fees (Note 3) | | | 1,118 | |
Custodian fees | | | 8,471 | |
Miscellaneous | | | 57,536 | |
| | | | |
| |
Total Expenses | | | 902,347 | |
| | | | |
| |
NET INVESTMENT LOSS | | | (579,693 | ) |
| | | | |
| |
REALIZED AND UNREALIZED GAIN (LOSS) ON INVESTMENTS AND FOREIGN CURRENCY: | | | | |
| |
Net realized gain on-
Investments | | | 5,979,932 | |
Foreign currency and translation of other assets and liabilities | | | 674 | |
| | | | |
| |
| | | 5,980,606 | |
| | | | |
| |
Net change in unrealized appreciation (depreciation) on-
Investments | | | 12,828,171 | |
Foreign currency and translation of other assets and liabilities | | | (101 | ) |
| | | | |
| |
| | | 12,828,070 | |
| | | | |
| |
NET REALIZED AND UNREALIZED GAIN (LOSS) ON INVESTMENTS AND FOREIGN CURRENCY | | | 18,808,676 | |
| | | | |
| |
NET INCREASE IN NET ASSETS RESULTING FROM OPERATIONS | | $ | 18,228,983 | |
| | | | |
The accompanying notes are an integral part of the financial statements.
6
Technology Series
Statements of Changes in Net Assets
| | | | | | | | |
| | | FOR THE SIX
MONTHS ENDED
6/30/13
(UNAUDITED) | | | FOR THE
YEAR ENDED
12/31/12 | |
INCREASE IN NET ASSETS: | | | | | | | | |
| | |
OPERATIONS: | | | | | | | | |
| | |
Net investment loss | | $ | (579,693 | ) | | $ | (1,015,092 | ) |
Net realized gain (loss) on investments and foreign currency | | | 5,980,606 | | | | (2,932,050 | ) |
Net change in unrealized appreciation (depreciation) on investments and foreign currency | | | 12,828,070 | | | | 17,839,248 | |
| | | | | | | | |
| | |
Net increase from operations | | | 18,228,983 | | | | 13,892,106 | |
| | | | | | | | |
| | |
DISTRIBUTIONS TO SHAREHOLDERS (Note 9): | | | | | | | | |
| | |
From net realized gain on investments | | | — | | | | (6,344,833 | ) |
| | | | | | | | |
| | |
CAPITAL STOCK ISSUED AND REPURCHASED: | | | | | | | | |
| | |
Net increase from capital share transactions (Note 5) | | | 2,908,740 | | | | 2,703,467 | |
| | | | | | | | |
| | |
Net increase in net assets | | | 21,137,723 | | | | 10,250,740 | |
| | |
NET ASSETS: | | | | | | | | |
| | |
Beginning of period | | | 148,895,948 | | | | 138,645,208 | |
| | | | | | | | |
| | |
End of period (including accumulated net investment loss of $579,693 and $0, respectively) | | $ | 170,033,671 | | | $ | 148,895,948 | |
| | | | | | | | |
The accompanying notes are an integral part of the financial statements.
7
Technology Series
Financial Highlights
| | | | | | | | | | | | | | | | | | | | | | | | |
| | | FOR THE SIX | | | FOR THE YEARS ENDED | |
| | | MONTHS ENDED 6/30/13 (UNAUDITED) | | | 12/31/12 | | | 12/31/11 | | | 12/31/10 | | | 12/31/09 | | | 12/31/08 | |
Per share data (for a share outstanding throughout each period): | | | | | | | | | | | | | | | | | | | | | | | | |
Net asset value - Beginning of period | | $ | 10.90 | | | $ | 10.33 | | | $ | 11.63 | | | $ | 9.73 | | | $ | 6.01 | | | $ | 11.29 | |
| | | | | | | | | | | | | | | | | | | | | | | | |
Income (loss) from investment operations: | | | | | | | | | | | | | | | | | | | | | | | | |
Net investment loss | | | (0.04 | )1 | | | (0.08 | )1 | | | (0.05 | )1 | | | (0.06 | )1 | | | (0.05 | )1 | | | (0.05 | ) |
Net realized and unrealized gain (loss) on investments | | | 1.36 | | | | 1.13 | | | | (1.15 | ) | | | 1.96 | | | | 3.77 | | | | (5.09 | ) |
| | | | | | | | | | | | | | | | | | | | | | | | |
| | | | | | |
Total from investment operations | | | 1.32 | | | | 1.05 | | | | (1.20 | ) | | | 1.90 | | | | 3.72 | | | | (5.14 | ) |
| | | | | | | | | | | | | | | | | | | | | | | | |
| | | | | | |
Less distributions to shareholders: | | | | | | | | | | | | | | | | | | | | | | | | |
From net realized gain on investments | | | — | | | | (0.48 | ) | | | (0.10 | ) | | | — | | | | — | | | | (0.14 | ) |
| | | | | | | | | | | | | | | | | | | | | | | | |
| | | | | | |
Net asset value - End of period | | $ | 12.22 | | | $ | 10.90 | | | $ | 10.33 | | | $ | 11.63 | | | $ | 9.73 | | | $ | 6.01 | |
| | | | | | | | | | | | | | | | | | | | | | | | |
| | | | | | |
Net assets - End of period (000’s omitted) | | $ | 170,034 | | | $ | 148,896 | | | $ | 138,645 | | | $ | 167,400 | | | $ | 157,731 | | | $ | 123,112 | |
| | | | | | | | | | | | | | | | | | | | | | | | |
| | | | | | |
Total return2 | | | 12.11 | % | | | 10.11 | % | | | (10.31 | %) | | | 19.53 | % | | | 61.90 | % | | | (45.86 | %) |
| Ratios (to average net assets)/Supplemental Data: | | | | | | | | | | | | | | | | | | | | | | | | |
Expenses* | | | 1.12 | %3 | | | 1.12 | % | | | 1.13 | % | | | 1.12 | % | | | 1.13 | % | | | 1.13 | % |
Net investment loss | | | (0.72 | %)3 | | | (0.67 | %) | | | (0.46 | %) | | | (0.58 | %) | | | (0.68 | %) | | | (0.53 | %) |
Portfolio turnover | | | 24 | % | | | 55 | % | | | 81 | % | | | 70 | % | | | 55 | % | | | 65 | % |
|
| *For certain periods presented, the investment advisor did not impose all or a portion of its management and/or other fees, and in some periods may have paid a portion of the Series’ expenses. If these expenses had been incurred by the Series, the expense ratio (to average net assets) would have increased by the following amounts: | |
| | | | | | |
| | | N/A | | | | N/A | | | | N/A | | | | 0.00 | %4 | | | 0.00 | %4 | | | N/A | |
1Calculated based on average shares outstanding during the periods.
2Represents aggregate total return for the periods indicated, and assumes reinvestment of all distributions. Total return would have been lower had certain expenses not been waived during certain periods. Periods less than one year are not annualized.
3Annualized.
4Less than 0.01%.
The accompanying notes are an integral part of the financial statements.
8
Technology Series
Notes to Financial Statements
(unaudited)
Technology Series (the “Series”) is a no-load diversified series of Manning & Napier Fund, Inc. (the “Fund”). The Fund is organized in Maryland and is registered under the Investment Company Act of 1940, as amended, as an open-end management investment company.
The Series’ investment objective is to provide long-term growth by investing principally in the common stocks of companies in technology-based industries.
The Fund’s advisor is Manning & Napier Advisors, LLC (the “Advisor”). Shares of the Series are offered to advisory clients and employees of the Advisor and its affiliates. The total authorized capital stock of the Fund consists of 15 billion shares of common stock each having a par value of $0.01. As of June 30, 2013, 10.3 billion shares have been designated in total among 42 series, of which 100 million have been designated as Technology Series Class A common stock.
| 2. | Significant Accounting Policies |
Security Valuation
Portfolio securities, including domestic equities, foreign equities, warrants and options, listed on an exchange other than the NASDAQ Stock Market are valued at the latest quoted sales price of the exchange on which the security is primarily traded. Securities not traded on valuation date or securities not listed on an exchange are valued at the latest quoted bid price provided by the Fund’s pricing service. Securities listed on the NASDAQ Stock Market are valued in accordance with the NASDAQ Official Closing Price.
Debt securities, including corporate bonds, will normally be valued on the basis of evaluated bid prices provided by an independent pricing service. Certain investments in securities held by the Series may be valued on a basis of a price provided directly by a principal market maker. These prices may differ from the value that would have been used had a broader market for securities existed.
Short-term investments that mature in sixty days or less are valued at amortized cost, which approximates fair value. Investments in open-end investment companies are valued at their net asset value per share on valuation date.
Volume and level of activity in established markets for an asset or liability are evaluated to determine whether recent transactions and quoted prices are determinative of fair value. Where there have been significant decreases in volume and level of activity, further analysis and adjustment may be necessary to estimate fair value. The Series measures fair value in these instances by the use of inputs and valuation techniques which may be based upon current market prices of securities that are comparable in coupon, rating, maturity and industry and/or expectation of future cash flows. As a result of trading in relatively thin markets and/or markets that experience significant volatility, the prices used by the Series to value these securities may differ from the value that would be realized if these securities were sold, and the differences could be material.
Securities for which representative valuations or prices are not available from the Series’ pricing service may be valued at fair value as determined in good faith by the Advisor under procedures approved by and under the general supervision and responsibility of the Fund’s Board of Directors (the “Board”). Due to the inherent uncertainty of valuations of such securities, the fair value may differ significantly from the values that would have been used had a ready market for such securities existed. If trading or events occurring after the close of the principal market in which securities are traded are expected to materially affect the value of those securities, then they may be valued at their fair value, taking this trading or these events into account. In accordance with the procedures approved by the Board, the values of certain securities trading outside the U.S. were adjusted following the close of local trading using a factor from a third party vendor. The third party vendor uses statistical analyses and quantitative models, which consider among other things subsequent movement and changes in the prices of indices, securities and exchange rates in other markets, to determine the factors which are used to adjust local market prices. The value of securities used for net asset value calculation under these procedures may differ from published prices for the same securities. It is the Fund’s policy to classify each foreign equity security where a factor from a third party vendor is provided as a Level 2 security.
9
Technology Series
Notes to Financial Statements (continued)
(unaudited)
| 2. | Significant Accounting Policies (continued) |
Security Valuation (continued)
Various inputs are used in determining the value of the Series’ assets or liabilities carried at fair value. These inputs are summarized in three broad levels. Level 1 includes quoted prices in active markets for identical assets and liabilities. Level 2 includes other significant observable inputs (including quoted prices for similar securities, interest rates, prepayment speeds, credit risk, etc.). Level 3 includes significant unobservable inputs (including the Series’ own assumptions in determining the fair value of investments). A financial instrument’s level within the fair value hierarchy is based on the lowest level of any input both individually and in aggregate that is significant to the fair value measurement. The inputs or methodology used for valuing securities are not necessarily an indication of the risk associated with investing in those securities.
The following is a summary of the valuation levels used for major security types as of June 30, 2013 in valuing the Series’ assets or liabilities carried at fair value:
| | | | | | | | | | | | | | | | |
| DESCRIPTION | | TOTAL | | | LEVEL 1 | | | LEVEL 2 | | | LEVEL 3 | |
Assets: | | | | | | | | | | | | | | | | |
Equity securities: | | | | | | | | | | | | | | | | |
Consumer Discretionary | | $ | 26,293,410 | | | $ | 26,293,410 | | | $ | — | | | $ | — | |
Health Care | | | 4,900,590 | | | | 4,900,590 | | | | — | | | | — | |
Industrials | | | 3,430,336 | | | | 3,430,336 | | | | — | | | | — | |
Information Technology | | | 128,417,214 | | | | 121,127,261 | | | | 7,289,953 | | | | — | |
Materials | | | 5,532,800 | | | | 5,532,800 | | | | — | | | | — | |
Mutual fund | | | 1,816,221 | | | | 1,816,221 | | | | — | | | | — | |
| | | | | | | | | | | | | | | | |
Total assets | | $ | 170,390,571 | | | $ | 163,100,618 | | | $ | 7,289,953 | | | $ | — | |
| | | | | | | | | | | | | | | | |
Please see the Investment Portfolio for foreign securities where a factor from a third party vendor was applied to determine the securities’ fair value following the close of local trading. Such securities are included in Level 2 in the table above.
There were no Level 3 securities held by the Series as of December 31, 2012 or June 30, 2013.
The Fund’s policy is to recognize transfers in and transfers out of the valuation levels as of the beginning of the reporting period. There were no transfers between Level 1 and Level 2 during the six months ended June 30, 2013.
Security Transactions, Investment Income and Expenses
Security transactions are accounted for on trade date. Dividend income is recorded on the ex-dividend date, except that if the ex-dividend date has passed, certain dividends from foreign securities are recorded as soon as the Series is informed of the ex-dividend date. Non-cash dividends, if any, are recorded at the fair value of the securities received. Interest income, including amortization of premium and accretion of discounts using the effective interest method, is earned from settlement date and accrued daily.
Expenses are recorded on an accrual basis. Most expenses of the Fund can be attributed to a specific series. Expenses which cannot be directly attributed are apportioned among the series in the Fund in such a manner as deemed equitable by the Fund’s Board, taking into consideration, among other things, the nature and type of expense.
The Series uses the identified cost method for determining realized gain or loss on investments for both financial statement and federal income tax reporting purposes.
Foreign Currency Translation
The books and records of the Series are maintained in U.S. dollars. Foreign currencies, investments and other assets and liabilities are translated into U.S. dollars at the current exchange rates. Purchases and sales of investment securities and income and expenses are translated on the respective dates of such transactions. The Series does not isolate realized and unrealized gains and losses attributable to changes in the exchange rates from gains and losses that arise from changes in the fair value of investments. Such fluctuations are included with net realized and unrealized gain or loss on investments. Net realized foreign currency gains and losses represent foreign currency gains and losses between trade date and settlement date
10
Technology Series
Notes to Financial Statements (continued)
(unaudited)
| 2. | Significant Accounting Policies (continued) |
Foreign Currency Translation (continued)
on securities transactions, gains and losses on disposition of foreign currencies and the difference between the amount of income and foreign withholding taxes recorded on the books of the Series and the amounts actually received or paid.
Federal Taxes
The Series’ policy is to comply with the provisions of the Internal Revenue Code applicable to regulated investment companies. The Series is not subject to federal income tax or excise tax to the extent that the Series distributes to shareholders each year its taxable income, including any net realized gains on investments, in accordance with requirements of the Internal Revenue Code. Accordingly, no provision for federal income tax or excise tax has been made in the financial statements.
Management evaluates its tax positions to determine if the tax positions taken meet the minimum recognition threshold in connection with accounting for uncertainties in income tax positions taken or expected to be taken for the purposes of measuring and recognizing tax liabilities in the financial statements. Recognition of tax benefits of an uncertain tax position is required only when the position is “more likely than not” to be sustained assuming examination by taxing authorities. At June 30, 2013, the Series has recorded no liability for net unrecognized tax benefits relating to uncertain income tax positions taken or expected to be taken in future tax returns.
The Series files income tax returns in the U.S. federal jurisdiction, various states and foreign jurisdictions, as required. No income tax returns are currently under investigation. The statute of limitations on the Series’ tax returns remains open for the years ended December 31, 2009 through December 31, 2012. The Series is not aware of any tax positions for which it is reasonably possible that the total amounts of unrecognized tax benefits will significantly change in the next twelve months.
Foreign Taxes
Based on the Series’ understanding of the tax rules and rates related to income, gains and currency purchase/repatriation transactions for foreign jurisdictions in which it invests, the Series will provide for foreign taxes, and where appropriate, deferred foreign tax.
Distributions of Income and Gains
Distributions to shareholders of net investment income and net realized gains are made annually. An additional distribution may be necessary to avoid taxation of the Series. Distributions are recorded on the ex-dividend date.
Indemnifications
The Fund’s organizational documents provide former and current directors and officers with a limited indemnification against liabilities arising in connection with the performance of their duties to the Fund. In the normal course of business, the Fund may also enter into contracts that provide general indemnifications. The Fund’s maximum exposure under these arrangements is unknown as this would be dependent on future claims that may be made against the Fund. The risk of material loss from such claims is considered remote.
Other
The preparation of financial statements in conformity with accounting principles generally accepted in the United States of America requires management to make estimates and assumptions that affect the reported amounts of assets and liabilities and the disclosure of contingent assets and liabilities at the date of the financial statements and the reported amounts of income and expenses during the reporting period. Actual results could differ from those estimates.
| 3. | Transactions with Affiliates |
The Fund has an Investment Advisory Agreement (the ���Agreement”) with the Advisor, for which the Series pays a fee, computed daily and payable monthly, at an annual rate of 1.00% of the Series’ average daily net assets.
Under the Agreement, personnel of the Advisor provide the Series with advice and assistance in the choice of investments and the execution of securities transactions, and otherwise maintain the Series’ organization. The Advisor also provides the Fund with necessary office space and fund administration and support services. The salaries of all officers of the Fund (except a
11
Technology Series
Notes to Financial Statements (continued)
(unaudited)
| 3. | Transactions with Affiliates (continued) |
percentage of the Fund’s Chief Compliance Officer’s salary, which is paid by the Fund), and of all Directors who are “affiliated persons” of the Fund, or of the Advisor, and all personnel of the Fund, or of the Advisor, performing services relating to research, statistical and investment activities, are paid by the Advisor. Each “non-affiliated” Director receives an annual stipend, which is allocated among all the active series of the Fund. In addition, these Directors also receive a fee per Board meeting attended plus a fee for each committee meeting attended.
The Advisor has contractually agreed, until at least April 30, 2014, to waive its management fee and, if necessary, pay other operating expenses of the Series in order to maintain total direct annual fund operating expenses for the Series at no more than 1.20% of average daily net assets each year. The Advisor did not waive any fees for the six months ended June 30, 2013. The Advisor is not eligible to recoup any expenses that have been waived or reimbursed in prior years.
Manning & Napier Investor Services, Inc., a registered broker-dealer affiliate of the Advisor, acts as distributor for the Fund’s shares. The services of Manning & Napier Investor Services, Inc. are provided at no additional cost to the Series.
The Advisor has agreements with BNY Mellon Investment Servicing (U.S.) Inc. (“BNY”) under which BNY serves as sub-accountant services agent and sub-transfer agent. The Fund pays the Advisor an annual fee related to fund accounting and administration of 0.0175% on the first $3 billion of average daily net assets (excluding Target Series and Strategic Income Series); 0.015% on the next $3 billion of average daily net assets (excluding Target Series and Strategic Income Series); and 0.01% of the average daily net assets in excess of $6 billion (excluding Target Series and Strategic Income Series); plus a base fee of $25,500 per series. Transfer Agent fees are charged to the Fund on a per account basis. Additionally, certain transaction and cusip-based fees and out-of-pocket expenses, including charges for reporting relating to the Fund’s compliance program, are charged. Effective October 1, 2012, the aforementioned agreements were modified to reduce the annual fee related to fund accounting and administration, as well as transfer agent fees, by 10%, excluding out-of-pocket expenses.
Expenses not directly attributable to a series are allocated based on each series’ relative net assets or number of accounts, depending on the expense.
| 4. | Purchases and Sales of Securities |
For the six months ended June 30, 2013, purchases and sales of securities, other than U.S. Government securities and short-term securities, were $49,551,721 and $37,518,567 respectively. There were no purchases or sales of U.S. Government securities.
| 5. | Capital Stock Transactions |
Transactions in shares of Technology Series were:
| | | | | | | | | | | | | | | | |
| | | FOR THE SIX MONTHS ENDED 6/30/13 | | | FOR THE YEAR ENDED 12/31/12 | |
| | | SHARES | | | AMOUNT | | | SHARES | | | AMOUNT | |
Sold | | | 697,972 | | | $ | 8,101,723 | | | | 1,038,900 | | | $ | 11,671,657 | |
Reinvested | | | — | | | | — | | | | 566,953 | | | | 6,285,210 | |
Repurchased | | | (443,926 | ) | | | (5,192,983 | ) | | | (1,364,916 | ) | | | (15,253,400 | ) |
| | | | | | | | | | | | | | | | |
Total | | | 254,046 | | | $ | 2,908,740 | | | | 240,937 | | | | 2,703,467 | |
| | | | | | | | | | | | | | | | |
Substantially all of the Series’ shares represent investments by fiduciary accounts over which the Advisor has sole investment discretion.
The Series may trade in instruments including written and purchased options, forward foreign currency exchange contracts and futures contracts and other derivatives in the normal course of investing activities to assist in managing exposure to various
12
Technology Series
Notes to Financial Statements (continued)
(unaudited)
| 6. | Financial Instruments (continued) |
market risks. The Series may be subject to various elements of risk, which may involve, to a varying degree, elements of risk in excess of the amounts recognized for financial statement purposes. These risks include: the risk that changes in the value of a derivative may not correlate perfectly with the underlying asset, rate or index; counterparty credit risk related to over the counter derivative counterparties’ failure to perform under contract terms; liquidity risk related to the lack of a liquid market for these contracts allowing the fund to close out its position(s); and documentation risk relating to disagreement over contract terms. No such investments were held by the Series during the year ended June 30, 2013.
Investing in securities of foreign companies and foreign governments involves special risks and considerations not typically associated with investing in securities of domestic companies and the U.S. Government. These risks include revaluation of currencies and future adverse political and economic developments. Moreover, securities of foreign companies and foreign governments and their markets may be less liquid and their prices more volatile than those of comparable domestic companies and the U.S. Government.
The Series may focus its investments in certain related technology industries; hence, the Series may subject itself to a greater degree of risk than a series that is more diversified.
| 9. | Federal Income Tax Information |
The amount and characterization of certain income and capital gains to be distributed are determined in accordance with federal income tax regulations, which may differ from accounting principles generally accepted in the United States of America. The Series may periodically make reclassifications among its capital accounts to reflect income and gains available for distribution (or available capital loss carryovers) under income tax regulations, without impacting the Series’ net asset value. Any such reclassifications are not reflected in the financial highlights.
The final determination of the tax character of current year distributions will be made at the conclusion of the fiscal year. The tax character of distributions paid for the year ended December 31, 2012 was as follows:
| | | | | | | | |
Long-term capital gains | | $ | 6,344,833 | | | | | |
At June 30, 2013, the identified cost for federal income tax purposes, the resulting gross unrealized appreciation and depreciation, and the net unrealized appreciation were as follows:
| | | | |
Cost for federal income tax purposes | | $ | 141,177,669 | |
Unrealized appreciation | | | 37,621,373 | |
Unrealized depreciation | | | (8,408,471 | ) |
| | | | |
Net unrealized appreciation | | $ | 29,212,902 | |
| | | | |
13
Technology Series
Literature Requests
(unaudited)
Proxy Voting Policies and Procedures
A description of the policies and procedures that the Fund uses to determine how to vote proxies relating to portfolio securities is available, without charge, upon request:
| | | | |
| By phone | | 1-800-466-3863 | | |
| On the Securities and Exchange | | | | |
| Commission’s (SEC) web site | | http://www.sec.gov | | |
Proxy Voting Record
Information regarding how the Fund voted proxies relating to portfolio securities during the most recent 12-month period ended June 30th is available, without charge, upon request:
| | | | |
| By phone | | 1-800-466-3863 | | |
| On the SEC’s web site | | http://www.sec.gov | | |
Quarterly Portfolio Holdings
The Series’ complete schedule of portfolio holdings for the 1st and 3rd quarters of each fiscal year are provided on Form N-Q, and are available, without charge, upon request:
| | | | |
| By phone | | 1-800-466-3863 | | |
| On the SEC’s web site | | http://www.sec.gov | | |
The Series’ Form N-Q may be reviewed and copied at the SEC’s Public Reference Room in Washington, D.C. Information on the operation of the Public Reference Room may be obtained by calling 1-800-SEC-0330.
Prospectus and Statement of Additional Information (SAI)
The prospectus and SAI provide additional information about each Series, including charges, expenses and risks. These documents are available, without charge, upon request:
| | | | |
| By phone | | 1-800-466-3863 | | |
| On the SEC’s web site | | http://www.sec.gov | | |
| On our web site | | http://www.manning-napier.com | | |
Additional information available at www.manning-napier.com
1. Fund Holdings - Month-End
2. Fund Holdings - Quarter-End
3. Shareholder Report - Annual
4. Shareholder Report - Semi-Annual
The Fund also offers electronic notification or “e-delivery” when certain documents are available on-line to be downloaded or reviewed. Direct shareholders can elect to receive electronic notification when shareholder reports, prospectus updates, and/or statements are available. If you do not currently have on-line access to your account, you can establish access by going to www.manning-napier.com, click on “Login” in the top corner of the page, and follow the prompts to self-enroll. Once enrolled, you can set your electronic notification preferences by clicking on the Account Options tab located within the green toolbar and then select E-Delivery Option. Should you have any questions on either how to establish on-line access or how to update your account settings, please contact Investor Services at 1-800-466-3863.
MNTEC-6/13-SAR
| | | | | | |
| | | | REAL ESTATE SERIES | | |
www.manning-napier.com | | | | |
Real Estate Series
Shareholder Expense Example
(unaudited)
As a shareholder of the Series, you may incur two types of costs: (1) transaction costs and (2) ongoing costs, including management fees and other Series expenses. This example is intended to help you understand your ongoing costs (in dollars) of investing in the Series and to compare these costs with the ongoing costs of investing in other mutual funds.
The example is based on an investment of $1,000 invested in each class at the beginning of the period and held for the entire period (January 1, 2013 to June 30, 2013).
Actual Expenses
The Actual lines of the table below provide information about actual account values and actual expenses. You may use the information in this line, together with the amount you invested, to estimate the expenses that you paid over the period. Simply divide your account value by $1,000 (for example, an $8,600 account value divided by $1,000 = 8.6), then multiply the result by the number in the Actual line for the Class in which you have invested under the heading entitled “Expenses Paid During Period” to estimate the expenses you paid on your account during this period.
Hypothetical Example for Comparison Purposes
The Hypothetical lines of each Class in the table below provide information about hypothetical account values and hypothetical expenses based on the Class’ actual expense ratio and an assumed rate of return of 5% per year before expenses, which is not the Class’ actual return. The hypothetical account values and expenses may not be used to estimate the actual ending account balance or expenses you paid during the period. You may use this information to compare the ongoing costs of investing in the class of the Series and other funds. To do so, compare this 5% hypothetical example with the 5% hypothetical examples that appear in the shareholder reports of the other funds.
Please note that the expenses shown in the table are meant to highlight your ongoing costs only and do not reflect any transaction costs. Therefore, the Hypothetical lines for each Class in the table are useful in comparing ongoing costs only, and will not help you determine the relative total costs of owning different funds. In addition, if these transaction costs were included, your costs would have been higher.
| | | | | | | | |
| | | BEGINNING
ACCOUNT VALUE 1/1/13 | | ENDING
ACCOUNT VALUE 6/30/13 | | EXPENSES PAID
DURING PERIOD* 1/1/13-6/30/13 | | ANNUALIZED
EXPENSE RATIO |
Class S | | | | | | | | |
Actual | | $1,000.00 | | $1,036.40 | | $5.71 | | 1.13% |
Hypothetical (5% return before expenses) | | $1,000.00 | | $1,019.19 | | $5.66 | | 1.13% |
Class I | | | | | | | | |
Actual | | $1,000.00 | | $1,037.70 | | $4.45 | | 0.88% |
Hypothetical (5% return before expenses) | | $1,000.00 | | $1,020.43 | | $4.41 | | 0.88% |
*Expenses are equal to each Class’ annualized expense ratio (for the six-month period), multiplied by the average account value over the period, multiplied by 181/365 (to reflect the one-half year period). Expenses are based on the most recent fiscal half year.
1
Real Estate Series
Portfolio Composition as of June 30, 2013
(unaudited)
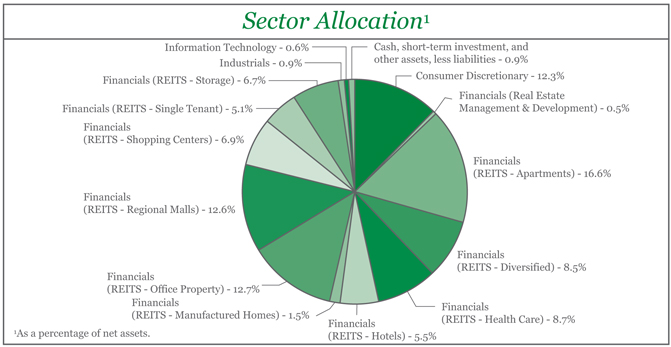
| | | | | | | | | | |
| Top Ten Stock Holdings2 | |
Simon Property Group, Inc. | | | 5.7 | % | | Host Hotels & Resorts, Inc. | | | 3.0 | % |
Health Care REIT, Inc. | | | 4.3 | % | | Kimco Realty Corp. | | | 2.9 | % |
General Growth Properties, Inc. | | | 3.9 | % | | Sovran Self Storage, Inc. | | | 2.9 | % |
Accor S.A. (France) | | | 3.7 | % | | Boston Properties, Inc. | | | 2.8 | % |
BioMed Realty Trust, Inc. | | | 3.4 | % | | UDR, Inc. | | | 2.8 | % |
| | | | |
| 2As a percentage of total investments. | | | | | | | | | | |
2
Real Estate Series
Investment Portfolio - June 30, 2013
(unaudited)
| | | | | | | | | | |
| | | |
| | | SHARES | | | VALUE (NOTE 2) | | | |
| | | |
COMMON STOCKS - 99.1% | | | | | | | | | | |
| | | |
Consumer Discretionary - 12.3% | | | | | | | | | | |
Hotels, Restaurants & Leisure - 8.7% | | | | | | | | | | |
Accor S.A. (France)1 | | | 217,000 | | | $ | 7,627,668 | | | |
Hyatt Hotels Corp. - Class A* | | | 82,010 | | | | 3,309,924 | | | |
InterContinental Hotels Group plc (United Kingdom)1 | | | 189,578 | | | | 5,210,055 | | | |
Orient-Express Hotels Ltd. - ADR - Class A* | | | 168,190 | | | | 2,045,190 | | | |
| | | | | | | | | | |
| | | |
| | | | | | | 18,192,837 | | | |
| | | | | | | | | | |
Household Durables - 3.6% | | | | | | | | | | |
DR Horton, Inc. | | | 114,000 | | | | 2,425,920 | | | |
Lennar Corp. - Class A | | | 28,466 | | | | 1,025,915 | | | |
NVR, Inc.* | | | 1,621 | | | | 1,494,562 | | | |
Toll Brothers, Inc.* | | | 74,932 | | | | 2,445,031 | | | |
| | | | | | | | | | |
| | | |
| | | | | | | 7,391,428 | | | |
| | | | | | | | | | |
| | | |
Total Consumer Discretionary | | | | | | | 25,584,265 | | | |
| | | | | | | | | | |
| | | |
Financials - 85.3% | | | | | | | | | | |
Real Estate Management & Development - 0.5% | | | | | | | | | | |
General Shopping Brasil S.A. (Brazil)* | | | 291,000 | | | | 1,122,867 | | | |
| | | | | | | | | | |
| | | |
REITS - Apartments - 16.6% | | | | | | | | | | |
American Campus Communities, Inc. | | | 80,940 | | | | 3,291,020 | | | |
Apartment Investment & Management Co. - Class A | | | 125,610 | | | | 3,773,324 | | | |
Associated Estates Realty Corp. | | | 219,738 | | | | 3,533,387 | | | |
AvalonBay Communities, Inc. | | | 25,150 | | | | 3,392,987 | | | |
Camden Property Trust | | | 49,610 | | | | 3,430,035 | | | |
Education Realty Trust, Inc. | | | 160,090 | | | | 1,637,721 | | | |
Equity Residential | | | 60,250 | | | | 3,498,115 | | | |
Home Properties, Inc. | | | 41,440 | | | | 2,708,933 | | | |
Mid-America Apartment Communities, Inc. | | | 51,400 | | | | 3,483,378 | | | |
UDR, Inc. | | | 227,730 | | | | 5,804,838 | | | |
| | | | | | | | | | |
| | | |
| | | | | | | 34,553,738 | | | |
| | | | | | | | | | |
REITS - Diversified - 8.5% | | | | | | | | | | |
Coresite Realty Corp. | | | 145,870 | | | | 4,640,125 | | | |
Digital Realty Trust, Inc. | | | 81,052 | | | | 4,944,172 | | | |
DuPont Fabros Technology, Inc. | | | 189,182 | | | | 4,568,745 | | | |
Unibail-Rodamco SE (France)1 | | | 10,825 | | | | 2,521,186 | | | |
Vornado Realty Trust | | | 11,730 | | | | 971,831 | | | |
| | | | | | | | | | |
| | | |
| | | | | | | 17,646,059 | | | |
| | | | | | | | | | |
REITS - Health Care - 8.7% | | | | | | | | | | |
HCP, Inc. | | | 88,560 | | | | 4,024,166 | | | |
Health Care REIT, Inc. | | | 133,000 | | | | 8,914,990 | | | |
Healthcare Realty Trust, Inc. | | | 40,800 | | | | 1,040,400 | | | |
Healthcare Trust of America, Inc.* | | | 282,490 | | | | 3,172,363 | | | |
The accompanying notes are an integral part of the financial statements.
3
Real Estate Series
Investment Portfolio - June 30, 2013
(unaudited)
| | | | | | | | | | |
| | | SHARES | | | VALUE (NOTE 2) | | | |
| | | |
COMMON STOCKS (continued) | | | | | | | | | | |
| | | |
Financials (continued) | | | | | | | | | | |
REITS - Health Care (continued) | | | | | | | | | | |
Ventas, Inc. | | | 15,290 | | | $ | 1,062,043 | | | |
| | | | | | | | | | |
| | | | | | | 18,213,962 | | | |
| | | | | | | | | | |
REITS - Hotels - 5.5% | | | | | | | | | | |
Host Hotels & Resorts, Inc. | | | 366,120 | | | | 6,176,444 | | | |
Pebblebrook Hotel Trust | | | 202,344 | | | | 5,230,592 | | | |
| | | | | | | | | | |
| | | | | | | 11,407,036 | | | |
| | | | | | | | | | |
REITS - Manufactured Homes - 1.5% | | | | | | | | | | |
Equity Lifestyle Properties, Inc. | | | 39,030 | | | | 3,067,368 | | | |
| | | | | | | | | | |
| | | |
REITS - Office Property - 12.7% | | | | | | | | | | |
Alexandria Real Estate Equities, Inc. | | | 75,920 | | | | 4,989,462 | | | |
BioMed Realty Trust, Inc. | | | 353,337 | | | | 7,148,007 | | | |
Boston Properties, Inc. | | | 56,150 | | | | 5,922,141 | | | |
Corporate Office Properties Trust | | | 193,214 | | | | 4,926,957 | | | |
Mack-Cali Realty Corp. | | | 147,420 | | | | 3,610,316 | | | |
| | | | | | | | | | |
| | | | | | | 26,596,883 | | | |
| | | | | | | | | | |
REITS - Regional Malls - 12.6% | | | | | | | | | | |
CBL & Associates Properties, Inc. | | | 87,480 | | | | 1,873,822 | | | |
General Growth Properties, Inc. | | | 405,820 | | | | 8,063,643 | | | |
The Macerich Co. | | | 32,910 | | | | 2,006,523 | | | |
Simon Property Group, Inc. | | | 74,930 | | | | 11,832,946 | | | |
Taubman Centers, Inc. | | | 26,740 | | | | 2,009,511 | | | |
Trade Street Residential, Inc.* | | | 58,540 | | | | 515,152 | | | |
| | | | | | | | | | |
| | | | | | | 26,301,597 | | | |
| | | | | | | | | | |
REITS - Shopping Centers - 6.9% | | | | | | | | | | |
AmREIT, Inc. - Class B | | | 31,870 | | | | 616,366 | | | |
Cedar Realty Trust, Inc. | | | 716,938 | | | | 3,713,739 | | | |
Equity One, Inc. | | | 87,540 | | | | 1,981,030 | | | |
Hammerson plc (United Kingdom)1 | | | 282,090 | | | | 2,091,619 | | | |
Kimco Realty Corp. | | | 282,870 | | | | 6,061,904 | | | |
| | | | | | | | | | |
| | | | | | | 14,464,658 | | | |
| | | | | | | | | | |
REITS - Single Tenant - 5.1% | | | | | | | | | | |
Agree Realty Corp. | | | 151,950 | | | | 4,485,564 | | | |
National Retail Properties, Inc. | | | 118,710 | | | | 4,083,624 | | | |
Realty Income Corp. | | | 48,690 | | | | 2,041,085 | | | |
| | | | | | | | | | |
| | | | | | | 10,610,273 | | | |
| | | | | | | | | | |
REITS - Storage - 6.7% | | | | | | | | | | |
CubeSmart | | | 173,770 | | | | 2,776,845 | | | |
Extra Space Storage, Inc. | | | 51,480 | | | | 2,158,556 | | | |
Public Storage | | | 20,000 | | | | 3,066,600 | | | |
The accompanying notes are an integral part of the financial statements.
4
Real Estate Series
Investment Portfolio - June 30, 2013
(unaudited)
| | | | | | | | | | |
| | | SHARES | | | VALUE (NOTE 2) | | | |
| | | |
COMMON STOCKS (continued) | | | | | | | | | | |
| | | |
Financials (continued) | | | | | | | | | | |
REITS - Storage (continued) | | | | | | | | | | |
Sovran Self Storage, Inc. | | | 93,141 | | | $ | 6,034,605 | | | |
| | | | | | | | | | |
| | | |
| | | | | | | 14,036,606 | | | |
| | | | | | | | | | |
| | | |
Total Financials | | | | | | | 178,021,047 | | | |
| | | | | | | | | | |
| | | |
Industrials - 0.9% | | | | | | | | | | |
Transportation Infrastructure - 0.9% | | | | | | | | | | |
Groupe Eurotunnel S.A. (France)1 | | | 248,100 | | | | 1,886,535 | | | |
| | | | | | | | | | |
| | | |
Information Technology - 0.6% | | | | | | | | | | |
IT Services - 0.6% | | | | | | | | | | |
InterXion Holding N.V. - ADR (Netherlands)* | | | 45,440 | | | | 1,187,347 | | | |
| | | | | | | | | | |
| | | |
Utilities - 0.0%** | | | | | | | | | | |
Electric Utilities - 0.0%** | | | | | | | | | | |
Prime AET&D Holdings No.1 Ltd (Australia)*2 | | | 125,000 | | | | — | | | |
| | | | | | | | | | |
| | | |
TOTAL COMMON STOCKS | | | | | | | | | | |
(Identified Cost $168,364,529) | | | | | | | 206,679,194 | | | |
| | | | | | | | | | |
| | | |
SHORT-TERM INVESTMENT - 0.7% | | | | | | | | | | |
| | | |
Dreyfus Cash Management, Inc. - Institutional Shares3 , 0.05% | | | | | | | | | | |
(Identified Cost $1,440,777) | | | 1,440,777 | | | | 1,440,777 | | | |
| | | | | | | | | | |
| | | |
TOTAL INVESTMENTS - 99.8% | | | | | | | | | | |
(Identified Cost $169,805,306) | | | | | | | 208,119,971 | | | |
OTHER ASSETS, LESS LIABILITIES - 0.2% | | | | | | | 433,028 | | | |
| | | | | | | | | | |
| | | |
NET ASSETS - 100% | | | | | | $ | 208,552,999 | | | |
| | | | | | | | | | |
No. - Number
ADR - American Depository Receipt
REITS - Real Estate Investment Trusts
*Non-income producing security.
**Less than 0.1%
1A factor from a third party vendor was applied to determine the security’s fair value following the close of local trading.
2Security has been valued at fair value as determined in good faith by the Advisor.
3Rate shown is the current yield as of June 30, 2013.
The accompanying notes are an integral part of the financial statements.
5
Real Estate Series
Statement of Assets and Liabilities
June 30, 2013 (unaudited)
| | | | |
ASSETS: | | | | |
| |
Investments (identified cost $169,805,306) (Note 2) | | $ | 208,119,971 | |
Dividends receivable | | | 595,788 | |
Receivable for fund shares sold | | | 359,624 | |
Foreign tax reclaims receivable | | | 6,744 | |
Prepaid expenses | | | 1,015 | |
| | | | |
| |
TOTAL ASSETS | | | 209,083,142 | |
| | | | |
| |
LIABILITIES: | | | | |
| |
Accrued management fees (Note 3) | | | 128,572 | |
Accrued shareholder services fees (Class S)(Note 3) | | | 35,322 | |
Accrued fund accounting and administration fees (Note 3) | | | 8,601 | |
Accrued transfer agent fees (Note 3) | | | 2,521 | |
Accrued Chief Compliance Officer service fees (Note 3) | | | 339 | |
Payable for fund shares repurchased | | | 339,636 | |
Other payables and accrued expenses | | | 15,152 | |
| | | | |
| |
TOTAL LIABILITIES | | | 530,143 | |
| | | | |
| |
TOTAL NET ASSETS | | $ | 208,552,999 | |
| | | | |
| |
NET ASSETS CONSIST OF: | | | | |
| |
Capital stock | | $ | 150,991 | |
Additional paid-in-capital | | | 153,642,108 | |
Undistributed net investment income | | | 1,291,474 | |
Accumulated net realized gain on investments, foreign currency and translation of other assets and liabilities | | | 15,154,035 | |
Net unrealized appreciation on investments, foreign currency and translation of other assets and liabilities | | | 38,314,391 | |
| | | | |
| |
TOTAL NET ASSETS | | $ | 208,552,999 | |
| | | | |
| |
NET ASSET VALUE, OFFERING PRICE AND REDEMPTION PRICE PER SHARE - Class S
($171,406,158/ 11,351,043 shares) | | $ | 15.10 | |
| | | | |
| |
NET ASSET VALUE, OFFERING PRICE AND REDEMPTION PRICE PER SHARE - Class I
($37,146,841/ 3,748,077 shares) | | $ | 9.91 | |
| | | | |
The accompanying notes are an integral part of the financial statements.
6
Real Estate Series
Statement of Operations
For the Six Months Ended June 30, 2013 (unaudited)
| | | | |
INVESTMENT INCOME: | | | | |
| |
Dividends (net of foreign taxes withheld, $58,334) | | $ | 3,370,420 | |
| | | | |
| |
EXPENSES: | | | | |
| |
Management fees (Note 3) | | | 788,043 | |
Shareholder services fees (Class S) (Note 3) | | | 220,640 | |
Fund accounting and administration fees (Note 3) | | | 28,160 | |
Transfer agent fees (Note 3) | | | 8,431 | |
Directors’ fees (Note 3) | | | 2,215 | |
Chief Compliance Officer service fees (Note 3) | | | 1,117 | |
Custodian fees | | | 8,113 | |
Miscellaneous | | | 88,418 | |
| | | | |
| |
Total Expenses | | | 1,145,137 | |
| | | | |
| |
NET INVESTMENT INCOME | | | 2,225,283 | |
| | | | |
| |
REALIZED AND UNREALIZED GAIN (LOSS) ON INVESTMENTS AND FOREIGN CURRENCY: | | | | |
| |
Net realized gain on- | | | | |
Investments | | | 12,239,460 | |
Foreign currency and translation of other assets and liabilities | | | 755 | |
| | | | |
| |
| | | 12,240,215 | |
| | | | |
Net change in unrealized depreciation on- | | | | |
Investments | �� | | (7,364,823 | ) |
Foreign currency and translation of other assets and liabilities | | | (540 | ) |
| | | | |
| |
| | | (7,365,363 | ) |
| | | | |
| |
NET REALIZED AND UNREALIZED GAIN (LOSS) ON INVESTMENTS AND FOREIGN CURRENCY | | | 4,874,852 | |
| | | | |
| |
NET INCREASE IN NET ASSETS RESULTING FROM OPERATIONS | | $ | 7,100,135 | |
| | | | |
The accompanying notes are an integral part of the financial statements.
7
Real Estate Series
Statements of Changes in Net Assets
| | | | | | | | |
| | | FOR THE SIX
MONTHS ENDED
6/30/13
(UNAUDITED) | | | FOR THE
YEAR ENDED
12/31/12 | |
INCREASE (DECREASE) IN NET ASSETS: | | | | | | | | |
| | |
OPERATIONS: | | | | | | | | |
| | |
Net investment income | | $ | 2,225,283 | | | $ | 2,873,154 | |
Net realized gain (loss) on investments and foreign currency | | | 12,240,215 | | | | 9,630,318 | |
Net change in unrealized appreciation (depreciation) on investments and foreign currency | | | (7,365,363 | ) | | | 24,019,054 | |
| | | | | | | | |
| | |
Net increase from operations | | | 7,100,135 | | | | 36,522,526 | |
| | | | | | | | |
| | |
DISTRIBUTIONS TO SHAREHOLDERS (Note 9): | | | | | | | | |
| | |
From net investment income (Class S) | | | — | | | | (3,293,301 | ) |
From net investment income (Class I) | | | — | | | | (782,269 | ) |
From net realized gain on investments (Class S) | | | — | | | | (6,086,539 | ) |
From net realized gain on investments (Class I) | | | — | | | | (1,381,511 | ) |
| | | | | | | | |
| | |
Total distributions to shareholders | | | — | | | | (11,543,620 | ) |
| | | | | | | | |
| | |
CAPITAL STOCK ISSUED AND REPURCHASED: | | | | | | | | |
| | |
Net increase from capital share transactions (Note 5) | | | 4,158,878 | | | | 5,162,387 | |
| | | | | | | | |
| | |
Net increase in net assets | | | 11,259,013 | | | | 30,141,293 | |
| | |
NET ASSETS: | | | | | | | | |
| | |
Beginning of period | | | 197,293,986 | | | | 167,152,693 | |
| | | | | | | | |
| | |
End of period (including undistributed net investment income of $1,291,474 and distributions in excess of net investment income of $933,809, respectively) | | $ | 208,552,999 | | | $ | 197,293,986 | |
| | | | | | | | |
The accompanying notes are an integral part of the financial statements.
8
Real Estate Series
Financial Highlights - Class S
| | | | | | | | | | | | | | | | | | | | |
| | | FOR THE SIX
MONTHS ENDED
6/30/2013 (UNAUDITED) | | | FOR THE YEARS ENDED | | | FOR THE PERIOD
11/10/091 TO
12/31/09 | |
| | | | 12/31/12 | | | 12/31/11 | | | 12/31/10 | | |
Per share data (for a share outstanding throughout each period): | | | | | | | | | | | | | | | | | | | | |
Net asset value - Beginning of period | | $ | 14.57 | | | $ | 12.65 | | | $ | 12.58 | | | $ | 10.61 | | | $ | 10.00 | |
| | | | | | | | | | | | | | | | | | | | |
Income from investment operations: | | | | | | | | | | | | | | | | | | | | |
Net investment income2 | | | 0.16 | | | | 0.21 | | | | 0.15 | | | | 0.12 | | | | 0.02 | |
Net realized and unrealized gain on investments | | | 0.37 | | | | 2.54 | | | | 0.49 | | | | 2.44 | | | | 0.62 | |
| | | | | | | | | | | | | | | | | | | | |
| | | | | |
Total from investment operations | | | 0.53 | | | | 2.75 | | | | 0.64 | | | | 2.56 | | | | 0.64 | |
| | | | | | | | | | | | | | | | | | | | |
| | | | | |
Less distributions to shareholders: | | | | | | | | | | | | | | | | | | | | |
From net investment income | | | — | | | | (0.29 | ) | | | (0.15 | ) | | | (0.12 | ) | | | (0.02 | ) |
From net realized gain on investments | | | — | | | | (0.54 | ) | | | (0.42 | ) | | | (0.47 | ) | | | (0.01 | ) |
| | | | | | | | | | | | | | | | | | | | |
| | | | | |
Total distributions to shareholders | | | — | | | | (0.83 | ) | | | (0.57 | ) | | | (0.59 | ) | | | (0.03 | ) |
| | | | | | | | | | | | | | | | | | | | |
| | | | | |
Net asset value - End of period | | $ | 15.10 | | | $ | 14.57 | | | $ | 12.65 | | | $ | 12.58 | | | $ | 10.61 | |
| | | | | | | | | | | | | | | | | | | | |
| | | | | |
Net assets - End of period (000’s omitted) | | $ | 171,406 | | | $ | 170,898 | | | $ | 167,153 | | | $ | 89,136 | | | $ | 69,179 | |
| | | | | | | | | | | | | | | | | | | | |
| | | | | |
Total return3 | | | 3.64 | % | | | 21.93 | % | | | 5.29 | % | | | 24.40 | % | | | 6.36 | % |
Ratios (to average net assets)/Supplemental Data: | | | | | | | | | | | | | | | | | | | | |
Expenses* | | | 1.13 | %4 | | | 1.10 | % | | | 1.18 | % | | | 1.20 | % | | | 1.20 | %4 |
Net investment income | | | 2.07 | %4 | | | 1.49 | % | | | 1.21 | % | | | 1.02 | % | | | 1.43 | %4 |
Portfolio turnover | | | 19 | % | | | 14 | % | | | 34 | % | | | 34 | % | | | 3 | % |
|
| *For certain periods presented, the investment advisor did not impose all or a portion of its management and/or other fees, and in some periods may have paid a portion of the Series’ expenses. If these expenses had been incurred by the Series, the expense ratio (to average net assets) would have increased by the following amounts: | |
| | | | | |
| | | N/A | | | | N/A | | | | N/A | | | | 0.01 | % | | | 0.38 | %4 |
1Commencement of operations.
2Calculated based on average shares outstanding during the periods.
3Represents aggregate total return for the periods indicated, and assumes reinvestment of all distributions. Total return would have been lower had certain expenses not been waived or reimbursed during certain periods. Periods less than one year are not annualized.
4Annualized.
The accompanying notes are an integral part of the financial statements.
9
Real Estate Series
Financial Highlights - Class I
| | | | | | | | |
| | | FOR THE SIX
MONTHS ENDED
6/30/12
(UNAUDITED) | | | FOR THE PERIOD
8/1/121 TO
12/31/12 | |
Per share data (for a share outstanding throughout each period): | | | | | | | | |
Net asset value - Beginning of period | | $ | 9.55 | | | $ | 10.00 | |
| | | | | | | | |
Income (loss) from investment operations: | | | | | | | | |
Net investment income2 | | | 0.12 | | | | 0.08 | |
Net realized and unrealized gain (loss) on investments | | | 0.24 | | | | 0.32 | |
| | | | | | | | |
| | |
Total from investment operations | | | 0.36 | | | | 0.40 | |
| | | | | | | | |
| | |
Less distributions to shareholders: | | | | | | | | |
From net investment income | | | — | | | | (0.31 | ) |
From net realized gain on investments | | | — | | | | (0.54 | ) |
| | | | | | | | |
Total distributions to shareholders | | | — | | | | (0.85 | ) |
| | | | | | | | |
| | |
Net asset value - End of period | | $ | 9.91 | | | $ | 9.55 | |
| | | | | | | | |
| | |
Net assets - End of period (000’s omitted) | | $ | 37,147 | | | $ | 26,396 | |
| | | | | | | | |
| | |
Total return3 | | | 3.77 | % | | | 4.16 | % |
Ratios (to average net assets)/Supplemental Data: | | | | | | | | |
Expenses*4 | | | 0.88 | % | | | 0.87 | % |
Net investment income4 | | | 2.37 | % | | | 1.95 | % |
Portfolio turnover | | | 19 | % | | | 14 | % |
1Commencement of operations.
2Calculated based on average shares outstanding during the periods.
3Represents aggregate total return for the periods indicated, and assumes reinvestment of all distributions. Periods less than one year are not annualized.
4Annualized.
The accompanying notes are an integral part of the financial statements.
10
Real Estate Series
Notes to Financial Statements
(unaudited)
Real Estate Series (the “Series”) is a no-load diversified series of Manning & Napier Fund, Inc. (the “Fund”). The Fund is organized in Maryland and is registered under the Investment Company Act of 1940, as amended, as an open-end management investment company.
The Series’ investment objective is to provide high current income and long-term capital appreciation by investing principally in companies in the real estate industry.
The Fund’s advisor is Manning & Napier Advisors, LLC (the “Advisor”). Shares of the Series are offered to investors, clients and employees of the Advisor and its affiliates. The total authorized capital stock of the Fund consists of 15 billion shares of common stock each having a par value of $0.01. The series is authorized to issue two classes of shares (Class S and Class I). Each class of shares is substantially the same, except that Class S shares bear shareholder service fees. As of June 30, 2013, 10.3 billion shares have been designated in total among 42 series, of which 100 million shares have been designated as Real Estate Series Class S common stock and 100 million have been designated as Real Estate Series Class I common stock.
| 2. | Significant Accounting Policies |
Security Valuation
Portfolio securities, including domestic equities, foreign equities, warrants and options, listed on an exchange other than the NASDAQ Stock Market are valued at the latest quoted sales price of the exchange on which the security is primarily traded. Securities not traded on valuation date or securities not listed on an exchange are valued at the latest quoted bid price provided by the Fund’s pricing service. Securities listed on the NASDAQ Stock Market are valued in accordance with the NASDAQ Official Closing Price.
Short-term investments that mature in sixty days or less are valued at amortized cost, which approximates fair value. Investments in open-end investment companies are valued at their net asset value per share on valuation date.
Volume and level of activity in established markets for an asset or liability are evaluated to determine whether recent transactions and quoted prices are determinative of fair value. Where there have been significant decreases in volume and level of activity, further analysis and adjustment may be necessary to estimate fair value. The Series measures fair value in these instances by the use of inputs and valuation techniques which may be based upon current market prices of securities that are comparable in coupon, rating, maturity and industry and/or expectation of future cash flows. As a result of trading in relatively thin markets and/or markets that experience significant volatility, the prices used by the Series to value these securities may differ from the value that would be realized if these securities were sold, and the differences could be material.
Securities for which representative valuations or prices are not available from the Series’ pricing service may be valued at fair value as determined in good faith by the Advisor under procedures approved by and under the general supervision and responsibility of the Fund’s Board of Directors (the “Board”). Due to the inherent uncertainty of valuations of such securities, the fair value may differ significantly from the values that would have been used had a ready market for such securities existed. If trading or events occurring after the close of the principal market in which securities are traded are expected to materially affect the value of those securities, then they may be valued at their fair value, taking this trading or these events into account. In accordance with the procedures approved by the Board, the values of certain securities trading outside the U.S. were adjusted following the close of local trading using a factor from a third party vendor. The third party vendor uses statistical analyses and quantitative models, which consider among other things subsequent movement and changes in the prices of indices, securities and exchange rates in other markets, to determine the factors which are used to adjust local market prices. The value of securities used for net asset value calculation under these procedures may differ from published prices for the same securities. It is the Fund’s policy to classify each foreign equity security where a factor from a third party vendor is provided as a Level 2 security.
Various inputs are used in determining the value of the Series’ assets or liabilities carried at fair value. These inputs are summarized in three broad levels. Level 1 includes quoted prices in active markets for identical assets and liabilities. Level 2 includes other significant observable inputs (including quoted prices for similar securities, interest rates, prepayment speeds,
11
Real Estate Series
Notes to Financial Statements (continued)
(unaudited)
| 2. | Significant Accounting Policies (continued) |
Security Valuation (continued)
credit risk, etc.). Level 3 includes significant unobservable inputs (including the Series’ own assumptions in determining the fair value of investments). A financial instrument’s level within the fair value hierarchy is based on the lowest level of any input both individually and in aggregate that is significant to the fair value measurement. The inputs or methodology used for valuing securities are not necessarily an indication of the risk associated with investing in those securities.
The following is a summary of the valuation levels used for major security types as of June 30, 2013 in valuing the Series’ assets or liabilities carried at fair value:
| | | | | | | | | | | | | | | | |
| DESCRIPTION | | TOTAL | | | LEVEL 1 | | | LEVEL 2 | | | LEVEL 3 | |
Assets: | | | | | | | | | | | | | | | | |
Equity securities: | | | | | | | | | | | | | | | | |
Consumer Discretionary | | $ | 25,584,265 | | | $ | 12,746,542 | | | $ | 12,837,723 | | | $ | — | |
Financials | | | 178,021,047 | | | | 173,408,242 | | | | 4,612,805 | | | | — | |
Industrials | | | 1,886,535 | | | | — | | | | 1,886,535 | | | | — | |
Information Technology | | | 1,187,347 | | | | 1,187,347 | | | | — | | | | — | |
Utilities | | | — | | | | — | | | | — | | | | — | * |
Mutual fund | | | 1,440,777 | | | | 1,440,777 | | | | — | | | | — | |
| | | | | | | | | | | | | | | | |
Total assets | | $ | 208,119,971 | | | $ | 188,782,908 | | | $ | 19,337,063 | | | $ | — | |
| | | | | | | | | | | | | | | | |
*Prime AET&D Holdings No.1 Ltd. is a Level 3 security as of June 30, 2013. However, there is no cost or market value for this security reported in the financial statements. There was no activity in this security for the six months ended June 30, 2013.
Please see the Investment Portfolio for foreign securities where a factor from a third party vendor was applied to determine the securities’ fair value following the close of local trading. Such securities are included in Level 2 in the table above.
The Fund’s policy is to recognize transfers in and transfers out of the valuation levels as of the beginning of the reporting period. There were no transfers between Level 1 and Level 2 during the six months ended June 30, 2013.
Security Transactions, Investment Income and Expenses
Security transactions are accounted for on trade date. Dividend income is recorded on the ex-dividend date, except that if the ex-dividend date has passed, certain dividends from foreign securities are recorded as soon as the Series is informed of the ex-dividend date. Non-cash dividends, if any, are recorded at the fair value of the securities received. Interest income, including amortization of premium and accretion of discounts using the effective interest method, is earned from settlement date and accrued daily.
Expenses are recorded on an accrual basis. Most expenses of the Fund can be attributed to a specific series. Expenses which cannot be directly attributed are apportioned among the series in the Fund in such a manner as deemed equitable by the Fund’s Board, taking into consideration, among other things, the nature and type of expense.
The Fund records distributions received in excess of income from underlying investments as a reduction of cost of investments and/or realized gain. Such amounts are based on estimates if actual amounts are not available and actual amounts of income, realized gain and return of capital may differ from the estimated amounts. The Fund adjusts the estimated amounts of components of distributions (and consequently its net investment income) as necessary once the issuers provide information about the actual composition of the distributions.
The Series uses the identified cost method for determining realized gain or loss on investments for both financial statement and federal income tax reporting purposes.
12
Real Estate Series
Notes to Financial Statements (continued)
(unaudited)
| 2. | Significant Accounting Policies (continued) |
Foreign Currency Translation
The books and records of the Series are maintained in U.S. dollars. Foreign currencies, investments and other assets and liabilities are translated into U.S. dollars at the current exchange rates. Purchases and sales of investment securities and income and expenses are translated on the respective dates of such transactions. The Series does not isolate realized and unrealized gains and losses attributable to changes in the exchange rates from gains and losses that arise from changes in the market value of investments. Such fluctuations are included with net realized and unrealized gain or loss on investments. Net realized foreign currency gains and losses represent foreign currency gains and losses between trade date and settlement date on securities transactions, gains and losses on disposition of foreign currencies and the difference between the amount of income and foreign withholding taxes recorded on the books of the Series and the amounts actually received or paid.
Federal Taxes
The Series’ policy is to comply with the provisions of the Internal Revenue Code applicable to regulated investment companies. The Series is not subject to federal income tax or excise tax to the extent that the Series distributes to shareholders each year its taxable income, including any net realized gains on investments, in accordance with requirements of the Internal Revenue Code. Accordingly, no provision for federal income tax or excise tax has been made in the financial statements.
Management evaluates its tax positions to determine if the tax positions taken meet the minimum recognition threshold in connection with accounting for uncertainties in income tax positions taken or expected to be taken for the purposes of measuring and recognizing tax liabilities in the financial statements. Recognition of tax benefits of an uncertain tax position is required only when the position is “more likely than not” to be sustained assuming examination by taxing authorities. At June 30, 2013, the Series has recorded no liability for net unrecognized tax benefits relating to uncertain income tax positions taken or expected to be taken in future tax returns.
The Series files income tax returns in the U.S. federal jurisdiction, various states and foreign jurisdictions, as required. No income tax returns are currently under investigation. The statute of limitations on the Series’ tax returns remains open for the period ended December 31, 2009 and the years ended December 31, 2010 through December 31, 2012. The Series is not aware of any tax positions for which it is reasonably possible that the total amounts of unrecognized tax benefits will significantly change in the next twelve months.
Foreign Taxes
Based on the Series’ understanding of the tax rules and rates related to income, gains and currency purchase/repatriation transactions for foreign jurisdictions in which it invests, the Series will provide for foreign taxes, and where appropriate, deferred foreign tax.
Distributions of Income and Gains
Distributions to shareholders of net investment income and net realized gains are made annually. An additional distribution may be necessary to avoid taxation of the Series. Distributions are recorded on the ex-dividend date.
Indemnifications
The Fund’s organizational documents provide former and current directors and officers with a limited indemnification against liabilities arising in connection with the performance of their duties to the Fund. In the normal course of business, the Fund may also enter into contracts that provide general indemnifications. The Fund’s maximum exposure under these arrangements is unknown as this would be dependent on future claims that may be made against the Fund. The risk of material loss from such claims is considered remote.
Other
The preparation of financial statements in conformity with accounting principles generally accepted in the United States of America requires management to make estimates and assumptions that affect the reported amounts of assets and liabilities and the disclosure of contingent assets and liabilities at the date of the financial statements and the reported amounts of income and expenses during the reporting period. Actual results could differ from those estimates.
13
Real Estate Series
Notes to Financial Statements (continued)
(unaudited)
| 3. | Transactions with Affiliates |
The Fund has an Investment Advisory Agreement (the “Agreement”) with the Advisor, for which the Series pays a fee, computed daily and payable monthly, at an annual rate of 0.75% of the Series’ average daily net assets.
Under the Agreement, personnel of the Advisor provide the Series with advice and assistance in the choice of investments and the execution of securities transactions, and otherwise maintain the Series’ organization. The Advisor also provides the Fund with necessary office space and fund administration and support services. The salaries of all officers of the Fund (except a percentage of the Fund’s Chief Compliance Officer’s salary, which is paid by the Fund), and of all Directors who are “affiliated persons” of the Fund, or of the Advisor, and all personnel of the Fund, or of the Advisor, performing services relating to research, statistical and investment activities, are paid by the Advisor. Each “non-affiliated” Director receives an annual stipend, which is allocated among all the active series of the Fund. In addition, these Directors also receive a fee per Board meeting attended plus a fee for each committee meeting attended.
The Class S shares of the Series are subject to a shareholder service fee in accordance with a shareholder service plan adopted by the Fund’s Board. The shareholder service fee is intended to compensate financial intermediaries, including affiliates of the Fund, in connection with the provision of direct client service, personal services, maintenance of shareholder accounts and reporting services. For these services, Class S of the Series pays a fee, computed daily and payable monthly, at an annual rate of 0.25% of the average daily net assets of Class S. The Fund has a Shareholder Services Agreement with the Advisor, for which the Advisor receives the shareholder services fee as stated above.
The Advisor has contractually agreed, until at least April 30, 2014, to waive its management fee and, if necessary, pay other operating expenses of the Series in order to maintain total direct annual fund operating expenses for the Series, exclusive of shareholder service fees, at no more than 0.95% of average daily net assets. The Advisor did not waive any fees for the six months ended June 30, 2013. The Advisor is not eligible to recoup any expenses that have been waived or reimbursed in prior years.
Manning & Napier Investor Services, Inc., a registered broker-dealer affiliate of the Advisor, acts as distributor for the Fund’s shares. The services of Manning & Napier Investor Services, Inc. are provided at no additional cost to the Series.
The Advisor has agreements with BNY Mellon Investment Servicing (U.S.) Inc. (“BNY”) under which BNY serves as sub-accountant services agent and sub-transfer agent. The Fund pays the Advisor an annual fee related to fund accounting and administration of 0.0175% on the first $3 billion of average daily net assets (excluding Target Series and Strategic Income Series); 0.015% on the next $3 billion of average daily net assets (excluding Target Series and Strategic Income Series); and 0.01% of the average daily net assets in excess of $6 billion (excluding Target Series and Strategic Income Series); plus a base fee of $25,500 per series. Transfer Agent fees are charged to the Fund on a per account basis. Additionally, certain transaction and cusip-based fees and out-of-pocket expenses, including charges for reporting relating to the Fund’s compliance program, are charged. Effective October 1, 2012, the aforementioned agreements were modified to reduce the annual fee related to fund accounting and administration, as well as transfer agent fees, by 10%, excluding out-of-pocket expenses.
Expenses not directly attributable to a Series are allocated based on each Series’ relative net assets or number of accounts, depending on the expense.
| 4. | Purchases and Sales of Securities |
For the six months ended June 30, 2013, purchases and sales of securities, other than U.S. Government securities and short-term securities, were $45,284,475 and $39,318,941 respectively. There were no purchases or sales of U.S. Government securities.
14
Real Estate Series
Notes to Financial Statements (continued)
(unaudited)
| 5. | Capital Stock Transactions |
Transactions in shares of Class S and I shares of Real Estate Series were:
| | | | | | | | | | | | | | | | |
| CLASS S | | FOR THE SIX MONTHS ENDED 6/30/2013 | | | FOR THE YEAR ENDED 12/31/12 | |
| | SHARES | | | AMOUNT | | | SHARES | | | AMOUNT | |
Sold | | | 693,976 | | | $ | 10,793,381 | | | | 942,190 | | | $ | 13,440,671 | |
Reinvested | | | — | | | | — | | | | 641,521 | | | | 9,205,525 | |
Repurchased | | | (1,074,805 | ) | | | (16,651,124 | ) | | | (3,067,077 | ) | | | (45,004,040 | ) |
| | | | | | | | | | | | | | | | |
Total | | | (380,829 | ) | | $ | (5,857,743 | ) | | | (1,483,366 | ) | | $ | (22,357,844 | ) |
| | | | | | | | | | | | | | | | |
| | | | | | | | | | | | | | | | |
| CLASS I | | FOR THE SIX MONTHS ENDED 6/30/13 | | | FOR THE PERIOD 8/1/12
(COMMENCEMENT OF
OPERATIONS) TO 12/31/12 | |
| | SHARES | | | AMOUNT | | | SHARES | | | AMOUNT | |
Sold | | | 986,361 | | | $ | 10,043,118 | | | | 2,540,161 | | | $ | 25,408,795 | |
Reinvested | | | — | | | | — | | | | 225,474 | | | | 2,125,283 | |
Repurchased | | | (2,562 | ) | | | (26,497 | ) | | | (1,357 | ) | | | (13,847 | ) |
| | | | | | | | | | | | | | | | |
Total | | | 983,799 | | | $ | 10,016,621 | | | | 2,764,278 | | | $ | 27,520,231 | |
| | | | | | | | | | | | | | | | |
Substantially all of the Series’ shares represent investments by fiduciary accounts over which the Advisor has sole investment discretion.
The Series may trade in instruments including written and purchased options, forward foreign currency exchange contracts and futures contracts and other derivatives in the normal course of investing activities to assist in managing exposure to various market risks. The Series may be subject to various elements of risk, which may involve, to a varying degree, elements of risk in excess of the amounts recognized for financial statement purposes. These risks include: the risk that changes in the value of a derivative may not correlate perfectly with the underlying asset, rate or index; counterparty credit risk related to over the counter derivative counterparties’ failure to perform under contract terms; liquidity risk related to the lack of a liquid market for these contracts allowing the fund to close out its position(s); and documentation risk relating to disagreement over contract terms. No such investments were held by the Series as of June 30, 2013.
Investing in securities of foreign companies and foreign governments involves special risks and considerations not typically associated with investing in securities of domestic companies and the U.S. Government. These risks include revaluation of currencies and future adverse political and economic developments. Moreover, securities of foreign companies and foreign governments and their markets may be less liquid and their prices more volatile than those of comparable domestic companies and the U.S. Government.
The Series may focus its investments in certain real estate related industries; hence, the Series may subject itself to a greater degree of risk than a series that is more diversified.
| 9. | Federal Income Tax Information |
The amount and characterization of certain income and capital gains to be distributed are determined in accordance with federal income tax regulations, which may differ from accounting principles generally accepted in the United States of America. The Series may periodically make reclassifications among its capital accounts to reflect income and gains available for distribution
15
Real Estate Series
Notes to Financial Statements (continued)
(unaudited)
| 9. | Federal Income Tax Information (continued) |
(or available capital loss carryovers) under income tax regulations, without impacting the Series’ net asset value. Any such reclassifications are not reflected in the financial highlights.
The final determination of the tax character of current year distributions will be made at the conclusion of the fiscal year. The tax character of distributions paid for the year ended December 31, 2012 was as follows:
| | | | |
Ordinary income | | $ | 5,584,073 | |
Long-term capital gains | | | 5,959,547 | |
At June 30, 2013, the identified cost for federal income tax purposes, the resulting gross unrealized appreciation and depreciation, and the net unrealized appreciation were as follows:
| | | | |
Cost for federal income tax purposes | | $ | 169,867,566 | |
Unrealized appreciation | | | 41,285,581 | |
Unrealized depreciation | | | (3,033,176 | ) |
| | | | |
Net unrealized appreciation | | $ | 38,252,405 | |
| | | | |
16
{This page intentionally left blank}
17
Real Estate Series
Literature Requests
(unaudited)
Proxy Voting Policies and Procedures
A description of the policies and procedures that the Fund uses to determine how to vote proxies relating to portfolio securities is available, without charge, upon request:
| | | | |
| By phone | | 1-800-466-3863 | | |
| On the Securities and Exchange Commission’s (SEC) web site | | http://www.sec.gov | | |
Proxy Voting Record
Information regarding how the Fund voted proxies relating to portfolio securities during the most recent 12-month period ended June 30th is available, without charge, upon request:
| | | | |
| By phone | | 1-800-466-3863 | | |
| On the SEC’s web site | | http://www.sec.gov | | |
Quarterly Portfolio Holdings
The Series’ complete schedule of portfolio holdings for the 1st and 3rd quarters of each fiscal year are provided on Form N-Q, and are available, without charge, upon request:
| | | | |
| By phone | | 1-800-466-3863 | | |
| On the SEC’s web site | | http://www.sec.gov | | |
The Series’ Form N-Q may be reviewed and copied at the SEC’s Public Reference Room in Washington, D.C. Information on the operation of the Public Reference Room may be obtained by calling 1-800-SEC-0330.
Prospectus and Statement of Additional Information (SAI)
The prospectus and SAI provide additional information about each Series, including charges, expenses and risks. These documents are available, without charge, upon request:
| | | | |
| By phone | | 1-800-466-3863 | | |
| On the SEC’s web site | | http://www.sec.gov | | |
| On our web site | | http://www.manning-napier.com | | |
Additional information available at www.manning-napier.com
1. Fund Holdings - Month-End
2. Fund Holdings - Quarter-End
3. Shareholder Report - Annual
4. Shareholder Report - Semi-Annual
The Fund also offers electronic notification or “e-delivery” when certain documents are available on-line to be downloaded or reviewed. Direct shareholders can elect to receive electronic notification when shareholder reports, prospectus updates, and/or statements are available. If you do not currently have on-line access to your account, you can establish access by going to www.manning-napier.com, click on “Login” in the top corner of the page, and follow the prompts to self-enroll. Once enrolled, you can set your electronic notification preferences by clicking on the Account Options tab located within the green toolbar and then select E-Delivery Option. Should you have any questions on either how to establish on-line access or how to update your account settings, please contact Investor Services at 1-800-466-3863.
MNRES-6/13-SAR
| | | | | | |
| | | | INTERNATIONAL SERIES | | |
www.manning-napier.com | | | | |
International Series
Shareholder Expense Example
(unaudited)
As a shareholder of the Series, you may incur two types of costs: (1) transaction costs and (2) ongoing costs, including management fees and other Series expenses. This example is intended to help you understand your ongoing costs (in dollars) of investing in the Series and to compare these costs with the ongoing costs of investing in other mutual funds.
The example is based on an investment of $1,000 invested in each class at the beginning of the period and held for the entire period (January 1, 2013 to June 30, 2013).
Actual Expenses
The Actual lines of the table below provide information about actual account values and actual expenses. You may use the information in this line, together with the amount you invested, to estimate the expenses that you paid over the period. Simply divide your account value by $1,000 (for example, an $8,600 account value divided by $1,000 = 8.6), then multiply the result by the number in the Actual line for the Class in which you have invested under the heading entitled “Expenses Paid During Period” to estimate the expenses you paid on your account during this period.
Hypothetical Example for Comparison Purposes
The Hypothetical lines of each Class in the table below provide information about hypothetical account values and hypothetical expenses based on the Class’ actual expense ratio and an assumed rate of return of 5% per year before expenses, which is not the Class’ actual return. The hypothetical account values and expenses may not be used to estimate the actual ending account balance or expenses you paid during the period. You may use this information to compare the ongoing costs of investing in the class of the Series and other funds. To do so, compare this 5% hypothetical example with the 5% hypothetical examples that appear in the shareholder reports of the other funds.
Please note that the expenses shown in the table are meant to highlight your ongoing costs only and do not reflect any transaction costs. Therefore, the Hypothetical lines for each Class in the table are useful in comparing ongoing costs only, and will not help you determine the relative total costs of owning different funds. In addition, if these transaction costs were included, your costs would have been higher.
| | | | | | | | |
| | | BEGINNING
ACCOUNT VALUE
1/1/13 | | ENDING
ACCOUNT VALUE
6/30/13 | | EXPENSES PAID
DURING PERIOD*
1/1/13-6/30/13 | | ANNUALIZED
EXPENSE RATIO |
Class S | | | | | | | | |
Actual | | $1,000.00 | | $1,013.80 | | $5.49 | | 1.10% |
Hypothetical (5% return before expenses) | | $1,000.00 | | $1,019.34 | | $5.51 | | 1.10% |
Class I | | | | | | | | |
Actual | | $1,000.00 | | $1,015.30 | | $4.25 | | 0.85% |
Hypothetical (5% return before expenses) | | $1,000.00 | | $1,020.58 | | $4.26 | | 0.85% |
*Expenses are equal to the Class’ annualized expense ratio (for the six-month period), multiplied by the average account value over the period, multiplied by 181/365 to reflect the one-half year period. Expenses are based on the most recent fiscal half year. The Class’ total return would have been lower had certain expenses not been waived during the period.
1
International Series
Portfolio Composition as of June 30, 2013
(unaudited)
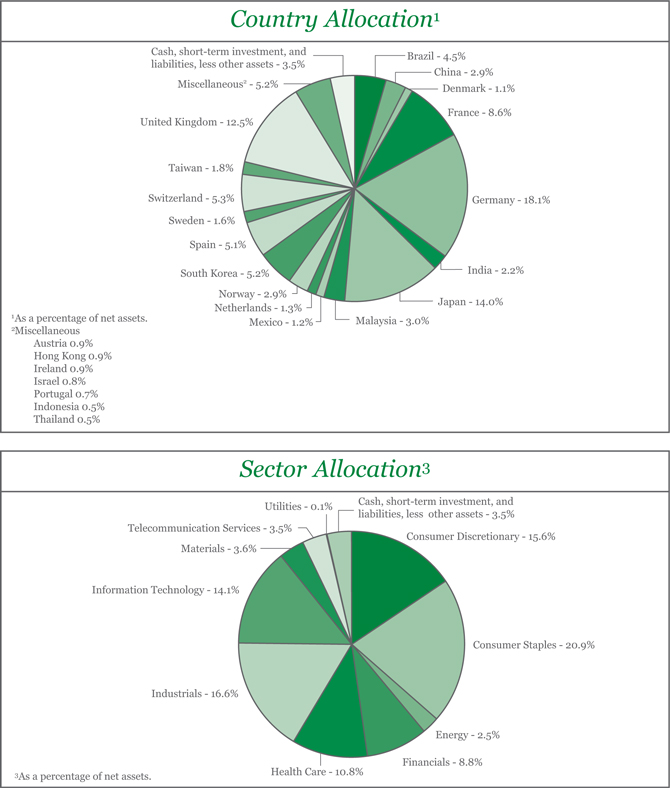
2
International Series
Investment Portfolio - June 30, 2013
(unaudited)
| | | | | | | | | | |
| | | SHARES | | | VALUE (NOTE 2) | | | |
| | | |
COMMON STOCKS - 96.5% | | | | | | | | | | |
| | | |
Consumer Discretionary - 15.6% | | | | | | | | | | |
Auto Components - 2.8% | | | | | | | | | | |
F.C.C. Co. Ltd. (Japan)1 | | | 158,000 | | | $ | 3,725,840 | | | |
Hankook Tire Co. Ltd. (South Korea)1 | | | 145,591 | | | | 6,705,105 | | | |
Musashi Seimitsu Industry Co. Ltd. (Japan)1 | | | 168,000 | | | | 4,043,096 | | | |
Nissin Kogyo Co. Ltd. (Japan)1 | | | 226,000 | | | | 4,092,360 | | | |
| | | | | | | | | | |
| | | |
| | | | | | | 18,566,401 | | | |
| | | | | | | | | | |
| | | |
Automobiles - 0.5% | | | | | | | | | | |
Hero Motocorp Ltd. (India)1 | | | 87,000 | | | | 2,426,956 | | | |
Maruti Suzuki India Ltd. (India)1 | | | 44,940 | | | | 1,160,260 | | | |
| | | | | | | | | | |
| | | |
| | | | | | | 3,587,216 | | | |
| | | | | | | | | | |
| | | |
Hotels, Restaurants & Leisure - 0.6% | | | | | | | | | | |
Indian Hotels Co. Ltd. (India)1 | | | 5,361,450 | | | | 4,330,662 | | | |
| | | | | | | | | | |
| | | |
Household Durables - 1.1% | | | | | | | | | | |
LG Electronics, Inc. (South Korea)1 | | | 74,000 | | | | 4,703,346 | | | |
Rodobens Negocios Imobiliarios S.A. (Brazil) | | | 367,000 | | | | 2,398,037 | | | |
| | | | | | | | | | |
| | | |
| | | | | | | 7,101,383 | | | |
| | | | | | | | | | |
| | | |
Leisure Equipment & Products - 0.8% | | | | | | | | | | |
Nikon Corp. (Japan)1 | | | 224,000 | | | | 5,233,535 | | | |
| | | | | | | | | | |
| | | |
Media - 4.5% | | | | | | | | | | |
Mediaset Espana Comunicacion S.A. (Spain)*1 | | | 2,208,600 | | | | 19,238,393 | | | |
Reed Elsevier plc - ADR (United Kingdom) | | | 60,311 | | | | 2,751,991 | | | |
Societe Television Francaise 1 (France)1 | | | 327,530 | | | | 3,922,718 | | | |
Zon Multimedia Servicos de Telecomunicacoes e Multimedia SGPS S.A. (Portugal)1 | | | 945,000 | | | | 4,563,494 | | | |
| | | | | | | | | | |
| | | |
| | | | | | | 30,476,596 | | | |
| | | | | | | | | | |
| | | |
Multiline Retail - 0.9% | | | | | | | | | | |
Kering (France)1 | | | 31,130 | | | | 6,334,522 | | | |
| | | | | | | | | | |
| | | |
Specialty Retail - 2.2% | | | | | | | | | | |
Belle International Holdings Ltd. (Hong Kong)1 | | | 4,300,000 | | | | 5,878,441 | | | |
Groupe Fnac S.A. (France)*1 | | | 3,891 | | | | 82,560 | | | |
Hennes & Mauritz AB - Class B (Sweden)1 | | | 129,000 | | | | 4,244,279 | | | |
Komeri Co. Ltd. (Japan)1 | | | 188,800 | | | | 4,728,406 | | | |
| | | | | | | | | | |
| | | |
| | | | | | | 14,933,686 | | | |
| | | | | | | | | | |
| | | |
Textiles, Apparel & Luxury Goods - 2.2% | | | | | | | | | | |
Burberry Group plc (United Kingdom)1 | | | 184,000 | | | | 3,785,361 | | | |
Daphne International Holdings Ltd. (China)1 | | | 6,600,000 | | | | 5,625,225 | | | |
Hugo Boss AG (Germany)1 | | | 47,000 | | | | 5,168,053 | | | |
| | | | | | | | | | |
| | | |
| | | | | | | 14,578,639 | | | |
| | | | | | | | | | |
| | | |
Total Consumer Discretionary | | | | | | | 105,142,640 | | | |
| | | | | | | | | | |
The accompanying notes are an integral part of the financial statements.
3
International Series
Investment Portfolio - June 30, 2013
(unaudited)
| | | | | | | | | | |
| | | SHARES | | | VALUE (NOTE 2) | | | |
| | | |
COMMON STOCKS (continued) | | | | | | | | | | |
| | | |
Consumer Staples - 20.9% | | | | | | | | | | |
Beverages - 6.7% | | | | | | | | | | |
Carlsberg A/S - Class B (Denmark)1 | | | 80,000 | | | $ | 7,153,290 | | | |
Cia de Bebidas das Americas (AmBev) - ADR (Brazil) | | | 270,000 | | | | 10,084,500 | | | |
Diageo plc (United Kingdom)1 | | | 322,810 | | | | 9,257,057 | | | |
Kirin Holdings Co. Ltd. (Japan)1 | | | 600,000 | | | | 9,398,579 | | | |
Tsingtao Brewery Co. Ltd. - Class H (China)1 | | | 1,300,000 | | | | 9,263,558 | | | |
| | | | | | | | | | |
| | | |
| | | | | | | 45,156,984 | | | |
| | | | | | | | | | |
| | | |
Food & Staples Retailing - 3.0% | | | | | | | | | | |
Carrefour S.A. (France)1 | | | 169,962 | | | | 4,668,266 | | | |
Casino Guichard-Perrachon S.A. (France)1 | | | 34,170 | | | | 3,201,918 | | | |
President Chain Store Corp. (Taiwan)1 | | | 901,320 | | | | 5,891,767 | | | |
Tesco plc (United Kingdom)1 | | | 1,217,410 | | | | 6,130,690 | | | |
| | | | | | | | | | |
| | | |
| | | | | | | 19,892,641 | | | |
| | | | | | | | | | |
| | | |
Food Products - 7.0% | | | | | | | | | | |
Barry Callebaut AG (Switzerland)1 | | | 4,400 | | | | 4,027,052 | | | |
Charoen Pokphand Foods PCL (Thailand)1 | | | 3,841,800 | | | | 3,180,971 | | | |
Danone S.A. (France)1 | | | 107,012 | | | | 8,054,577 | | | |
Grupo Bimbo S.A.B. de C.V. - Class A (Mexico) | | | 2,604,000 | | | | 7,897,943 | | | |
Nestle S.A. (Switzerland)1 | | | 105,220 | | | | 6,904,579 | | | |
Unilever plc - ADR (United Kingdom) | | | 420,230 | | | | 16,998,304 | | | |
| | | | | | | | | | |
| | | |
| | | | | | | 47,063,426 | | | |
| | | | | | | | | | |
| | | |
Household Products - 1.7% | | | | | | | | | | |
Reckitt Benckiser Group plc (United Kingdom)1 | | | 164,270 | | | | 11,619,958 | | | |
| | | | | | | | | | |
| | | |
Personal Products - 0.9% | | | | | | | | | | |
Kao Corp. (Japan)1 | | | 188,000 | | | | 6,399,808 | | | |
| | | | | | | | | | |
| | | |
Tobacco - 1.6% | | | | | | | | | | |
Gudang Garam Tbk PT (Indonesia)1 | | | 730,000 | | | | 3,711,435 | | | |
Swedish Match AB (Sweden)1 | | | 191,000 | | | | 6,779,456 | | | |
| | | | | | | | | | |
| | | |
| | | | | | | 10,490,891 | | | |
| | | | | | | | | | |
| | | |
Total Consumer Staples | | | | | | | 140,623,708 | | | |
| | | | | | | | | | |
| | | |
Energy - 2.5% | | | | | | | | | | |
Oil, Gas & Consumable Fuels - 2.5% | | | | | | | | | | |
Petroleo Brasileiro S.A. - ADR (Brazil) | | | 240,000 | | | | 3,518,400 | | | |
Royal Dutch Shell plc - Class B (Netherlands)1 | | | 88,430 | | | | 2,928,726 | | | |
Royal Dutch Shell plc - Class B - ADR (Netherlands) | | | 87,780 | | | | 5,817,181 | | | |
Statoil ASA (Norway)1 | | | 237,000 | | | | 4,895,963 | | | |
| | | | | | | | | | |
| | | |
Total Energy | | | | | | | 17,160,270 | | | |
| | | | | | | | | | |
| | | |
Financials - 8.8% | | | | | | | | | | |
Capital Markets - 1.2% | | | | | | | | | | |
Daiwa Securities Group, Inc. (Japan)1 | | | 830,000 | | | | 6,951,186 | | | |
The accompanying notes are an integral part of the financial statements.
4
International Series
Investment Portfolio - June 30, 2013
(unaudited)
| | | | | | | | |
| | | SHARES | | | VALUE (NOTE 2) | |
| | |
COMMON STOCKS (continued) | | | | | | | | |
| | |
Financials (continued) | | | | | | | | |
Capital Markets (continued) | | | | | | | | |
OSK Holdings Berhad (Malaysia)1 | | | 2,141,737 | | | $ | 1,115,562 | |
| | | | | | | | |
| | |
| | | | | | | 8,066,748 | |
| | | | | | | | |
| | |
Commercial Banks - 2.3% | | | | | | | | |
Hong Leong Financial Group Berhad (Malaysia)1 | | | 1,462,800 | | | | 6,672,433 | |
Sumitomo Mitsui Trust Holdings, Inc. (Japan)1 | | | 1,907,000 | | | | 8,897,791 | |
| | | | | | | | |
| | |
| | | | | | | 15,570,224 | |
| | | | | | | | |
| | |
Insurance - 3.9% | | | | | | | | |
Allianz SE (Germany)1 | | | 40,870 | | | | 5,965,407 | |
AXA S.A. (France)1 | | | 211,372 | | | | 4,166,693 | |
Mapfre S.A. (Spain)1 | | | 1,877,000 | | | | 6,106,981 | |
Muenchener Rueckversicherungs AG (MunichRe) (Germany)1 | | | 40,610 | | | | 7,460,534 | |
Zurich Insurance Group AG (Switzerland)1 | | | 10,500 | | | | 2,721,696 | |
| | | | | | | | |
| | |
| | | | | | | 26,421,311 | |
| | | | | | | | |
| | |
Real Estate Investment Trusts (REITS) - 1.0% | | | | | | | | |
Alstria Office REIT AG (Germany)1 | | | 595,480 | | | | 6,511,633 | |
| | | | | | | | |
| | |
Thrifts & Mortgage Finance - 0.4% | | | | | | | | |
Aareal Bank AG (Germany)*1 | | | 115,790 | | | | 2,696,126 | |
| | | | | | | | |
| | |
| Total Financials | | | | | | | 59,266,042 | |
| | | | | | | | |
| | |
| Health Care - 10.8% | | | | | | | | |
Health Care Equipment & Supplies - 1.7% | | | | | | | | |
Carl Zeiss Meditec AG (Germany)1 | | | 232,000 | | | | 7,686,971 | |
Straumann Holding AG (Switzerland)1 | | | 25,776 | | | | 3,854,046 | |
| | | | | | | | |
| | |
| | | | | | | 11,541,017 | |
| | | | | | | | |
| | |
Health Care Providers & Services - 2.1% | | | | | | | | |
Fresenius Medical Care AG & Co. KGaA - ADR (Germany) | | | 200,000 | | | | 7,054,000 | |
Odontoprev S.A. (Brazil) | | | 726,000 | | | | 2,990,091 | |
Qualicorp S.A. (Brazil)* | | | 529,000 | | | | 4,027,925 | |
| | | | | | | | |
| | |
| | | | | | | 14,072,016 | |
| | | | | | | | |
| | |
Life Sciences Tools & Services - 0.5% | | | | | | | | |
Gerresheimer AG (Germany)1 | | | 58,000 | | | | 3,349,171 | |
| | | | | | | | |
| | |
Pharmaceuticals - 6.5% | | | | | | | | |
AstraZeneca plc (United Kingdom)1 | | | 27,960 | | | | 1,321,925 | |
AstraZeneca plc - ADR (United Kingdom) | | | 229,150 | | | | 10,838,795 | |
Bayer AG (Germany)1 | | | 100,000 | | | | 10,647,005 | |
GlaxoSmithKline plc (United Kingdom)1 | | | 172,980 | | | | 4,323,875 | |
Novartis AG - ADR (Switzerland) | | | 49,000 | | | | 3,464,790 | |
Shire plc (Ireland)1 | | | 195,160 | | | | 6,184,698 | |
Takeda Pharmaceutical Co. Ltd. (Japan)1 | | | 34,900 | | | | 1,573,780 | |
The accompanying notes are an integral part of the financial statements.
5
International Series
Investment Portfolio - June 30, 2013
(unaudited)
| | | | | | | | | | |
| | | SHARES | | | VALUE (NOTE 2) | | | |
| | | |
COMMON STOCKS (continued) | | | | | | | | | | |
| | | |
Health Care (continued) | | | | | | | | | | |
Pharmaceuticals (continued) | | | | | | | | | | |
Teva Pharmaceutical Industries Ltd. - ADR (Israel) | | | 140,000 | | | $ | 5,488,000 | | | |
| | | | | | | | | | |
| | | |
| | | | | | | 43,842,868 | | | |
| | | | | | | | | | |
| | | |
| Total Health Care | | | | | | | 72,805,072 | | | |
| | | | | | | | | | |
| | | |
| Industrials - 16.6% | | | | | | | | | | |
Commercial Services & Supplies - 1.8% | | | | | | | | | | |
Aggreko plc (United Kingdom)1 | | | 258,600 | | | | 6,463,613 | | | |
Taiwan Secom Co. Ltd. (Taiwan)1 | | | 777,210 | | | | 1,882,638 | | | |
Tomra Systems ASA (Norway)1 | | | 420,964 | | | | 3,569,048 | | | |
| | | | | | | | | | |
| | | |
| | | | | | | 11,915,299 | | | |
| | | | | | | | | | |
| | | |
Construction & Engineering - 0.7% | | | | | | | | | | |
Larsen & Toubro Ltd. (India)1 | | | 206,270 | | | | 4,868,102 | | | |
| | | | | | | | | | |
| | | |
Electrical Equipment - 3.9% | | | | | | | | | | |
ABB Ltd. (Asea Brown Boveri) - ADR (Switzerland) | | | 342,000 | | | | 7,407,720 | | | |
Alstom S.A. (France)1 | | | 295,560 | | | | 9,695,426 | | | |
Bharat Heavy Electricals Ltd. (India)1 | | | 150,400 | | | | 438,812 | | | |
Schneider Electric S.A. (France)1 | | | 66,000 | | | | 4,793,337 | | | |
Teco Electric and Machinery Co. Ltd. (Taiwan)1 | | | 4,084,000 | | | | 4,065,306 | | | |
| | | | | | | | | | |
| | | |
| | | | | | | 26,400,601 | | | |
| | | | | | | | | | |
| | | |
Industrial Conglomerates - 3.6% | | | | | | | | | | |
Siemens AG (Germany)1 | | | 237,600 | | | | 24,060,087 | | | |
| | | | | | | | | | |
| | | |
Machinery - 2.7% | | | | | | | | | | |
Andritz AG (Austria)1 | | | 123,000 | | | | 6,310,788 | | | |
FANUC Corp. (Japan)1 | | | 71,000 | | | | 10,275,611 | | | |
Jain Irrigation Systems Ltd. - DVR (India)1 | | | 44,872 | | | | 19,331 | | | |
Jain Irrigation Systems Ltd. (India)1 | | | 2,125,900 | | | | 1,849,500 | | | |
| | | | | | | | | | |
| | | |
| | | | | | | 18,455,230 | | | |
| | | | | | | | | | |
| | | |
Professional Services - 1.1% | | | | | | | | | | |
Experian plc (United Kingdom)1 | | | 405,980 | | | | 7,055,879 | | | |
| | | | | | | | | | |
| | | |
Trading Companies & Distributors - 1.0% | | | | | | | | | | |
Mills Estruturas e Servicos de Engenharia S.A. (Brazil) | | | 519,400 | | | | 7,039,082 | | | |
| | | | | | | | | | |
| | | |
Transportation Infrastructure - 1.8% | | | | | | | | | | |
Malaysia Airports Holdings Berhad (Malaysia)1 | | | 6,083,700 | | | | 12,150,070 | | | |
| | | | | | | | | | |
| | | |
| Total Industrials | | | | | | | 111,944,350 | | | |
| | | | | | | | | | |
| | | |
Information Technology - 14.1% | | | | | | | | | | |
Communications Equipment - 1.1% | | | | | | | | | | |
Alcatel-Lucent - ADR (France)* | | | 4,100,000 | | | | 7,462,000 | | | |
| | | | | | | | | | |
| | | |
Electronic Equipment, Instruments & Components - 3.9% | | | | | | | | | | |
Hitachi Ltd. (Japan)1 | | | 3,247,000 | | | | 20,805,155 | | | |
The accompanying notes are an integral part of the financial statements.
6
International Series
Investment Portfolio - June 30, 2013
(unaudited)
| | | | | | | | | | |
| | | SHARES | | | VALUE (NOTE 2) | | | |
| | | |
COMMON STOCKS (continued) | | | | | | | | | | |
| | | |
Information Technology (continued) | | | | | | | | | | |
Electronic Equipment, Instruments & Components (continued) | | | | | | | | | | |
Keyence Corp. (Japan)1 | | | 17,209 | | | $ | 5,482,973 | | | |
| | | | | | | | | | |
| | | |
| | | | | | | 26,288,128 | | | |
| | | | | | | | | | |
| | | |
Internet Software & Services - 1.6% | | | | | | | | | | |
NetEase.com, Inc. - ADR (China) | | | 14,400 | | | | 909,648 | | | |
NHN Corp. (South Korea)1 | | | 23,950 | | | | 6,080,558 | | | |
Tencent Holdings Ltd. (China)1 | | | 88,400 | | | | 3,451,776 | | | |
| | | | | | | | | | |
| | | |
| | | | | | | 10,441,982 | | | |
| | | | | | | | | | |
| | | |
IT Services - 0.7% | | | | | | | | | | |
Cap Gemini S.A. (France)1 | | | 102,000 | | | | 4,953,278 | | | |
| | | | | | | | | | |
| | | |
Office Electronics - 0.5% | | | | | | | | | | |
Canon, Inc. (Japan)1 | | | 95,000 | | | | 3,113,462 | | | |
| | | | | | | | | | |
| | | |
Semiconductors & Semiconductor Equipment - 2.1% | | | | | | | | | | |
Samsung Electronics Co. Ltd. (South Korea)1 | | | 12,260 | | | | 14,329,785 | | | |
| | | | | | | | | | |
| | | |
Software - 4.2% | | | | | | | | | | |
Aveva Group plc (United Kingdom)1 | | | 103,000 | | | | 3,531,044 | | | |
SAP AG (Germany)1 | | | 239,440 | | | | 17,484,543 | | | |
Temenos Group AG (Switzerland)1 | | | 307,000 | | | | 7,481,103 | | | |
| | | | | | | | | | |
| | | |
| | | | | | | 28,496,690 | | | |
| | | | | | | | | | |
| | | |
Total Information Technology | | | | | | | 95,085,325 | | | |
| | | | | | | | | | |
| | | |
Materials - 3.6% | | | | | | | | | | |
Chemicals - 3.6% | | | | | | | | | | |
BASF SE (Germany)1 | | | 76,100 | | | | 6,787,594 | | | |
Linde AG (Germany)1 | | | 92,500 | | | | 17,237,045 | | | |
| | | | | | | | | | |
| | | |
Total Materials | | | | | | | 24,024,639 | | | |
| | | | | | | | | | |
| | | |
Telecommunication Services - 3.5% | | | | | | | | | | |
Diversified Telecommunication Services - 3.0% | | | | | | | | | | |
Telefonica S.A. - ADR (Spain)* | | | 707,000 | | | | 9,056,670 | | | |
Telenor ASA - ADR (Norway)2 | | | 184,380 | | | | 10,972,454 | | | |
| | | | | | | | | | |
| | | |
| | | | | | | 20,029,124 | | | |
| | | | | | | | | | |
| | | |
Wireless Telecommunication Services - 0.5% | | | | | | | | | | |
SK Telecom Co. Ltd. - ADR (South Korea) | | | 169,190 | | | | 3,439,633 | | | |
| | | | | | | | | | |
| | | |
Total Telecommunication Services | | | | | | | 23,468,757 | | | |
| | | | | | | | | | |
| | | |
Utilities - 0.1% | | | | | | | | | | |
| | | |
Multi-Utilities - 0.1% | | | | | | | | | | |
GDF Suez (France)1 | | | 51,850 | | | | 1,017,024 | | | |
| | | | | | | | | | |
| | | |
TOTAL COMMON STOCKS | | | | | | | | | | |
(Identified Cost $611,506,745) | | | | | | | 650,537,827 | | | |
| | | | | | | | | | |
The accompanying notes are an integral part of the financial statements.
7
International Series
Investment Portfolio - June 30, 2013
(unaudited)
| | | | | | | | | | |
| | | SHARES | | | VALUE (NOTE 2) | | | |
| | | |
SHORT-TERM INVESTMENT - 4.2% | | | | | | | | | | |
| | | |
Dreyfus Cash Management, Inc. - Institutional Shares3 , 0.05%, | | | | | | | | | | |
(Identified Cost $ 28,126,156) | | | 28,126,156 | | | $ | 28,126,156 | | | |
| | | | | | | | | | |
TOTAL INVESTMENTS - 100.7% | | | | | | | | | | |
(Identified Cost $ 639,632,901) | | | | | | | 678,663,983 | | | |
LIABILITIES, LESS OTHER ASSETS - (0.7%) | | | | | | | (4,631,752 | ) | | |
| | | | | | | | | | |
| | | |
NET ASSETS - 100% | | | | | | $ | 674,032,231 | | | |
| | | | | | | | | | |
ADR - American Depository Receipt
DVR - Differential Voting Rights
*Non-income producing security.
1A factor from a third party vendor was applied to determine the security’s fair value following the close of local trading.
2Latest quoted sales price is not available and the latest quoted bid price was used to value the security.
3Rate shown is the current yield as of June 30, 2013.
The Series’ portfolio holds, as a percentage of net assets, greater than 10% in the following countries:
Germany 18.1%; Japan 14.0%; United Kingdom 12.5%.
The accompanying notes are an integral part of the financial statements.
8
International Series
Statement of Assets & Liabilities
June 30, 2013 (unaudited)
| | | | |
ASSETS: | | | | |
| |
Investments, at value (identified cost $639,632,901) (Note 2) | | $ | 678,663,983 | |
Foreign currency (identified cost $3,933,889) | | | 3,925,043 | |
Receivable for securities sold | | | 6,382,724 | |
Foreign tax reclaims receivable | | | 1,322,028 | |
Receivable for fund shares sold | | | 444,134 | |
Dividends receivable | | | 309,600 | |
Prepaid expenses | | | 8,688 | |
| | | | |
| |
TOTAL ASSETS | | | 691,056,200 | |
| | | | |
| |
LIABILITIES: | | | | |
| |
Payable to custodian | | | 841 | |
Foreign capital gains tax payable (Note 2) | | | 16,918 | |
Accrued management fees (Note 3) | | | 397,681 | |
Accrued shareholder services fees (Class S) (Note 3) | | | 115,655 | |
Accrued transfer agent fees (Note 3) | | | 45,012 | |
Accrued fund accounting and administration fees (Note 3) | | | 20,947 | |
Accrued Chief Compliance Officer service fees (Note 3) | | | 339 | |
Payable for securities purchased | | | 14,968,758 | |
Payable for fund shares repurchased | | | 1,181,432 | |
Other payables and accrued expenses | | | 276,386 | |
| | | | |
| |
TOTAL LIABILITIES | | | 17,023,969 | |
| | | | |
| |
TOTAL NET ASSETS | | $ | 674,032,231 | |
| | | | |
| |
NET ASSETS CONSIST OF: | | | | |
Capital stock | | $ | 740,858 | |
Additional paid-in-capital | | | 623,221,961 | |
Undistributed net investment income | | | 7,069,632 | |
Accumulated net realized gain on investments, foreign currency and translation of other assets and liabilities | | | 4,029,136 | |
Net unrealized appreciation on investments, foreign currency and translation of other assets and liabilities | | | 38,970,644 | |
| | | | |
| |
TOTAL NET ASSETS | | $ | 674,032,231 | |
| | | | |
| |
NET ASSET VALUE, OFFERING PRICE AND REDEMPTION PRICE PER SHARE - Class S ($552,229,560/62,626,052 shares) | | $ | 8.82 | |
| | | | |
| |
NET ASSET VALUE, OFFERING PRICE AND REDEMPTION PRICE PER SHARE - Class I ($121,802,671/11,459,793 shares) | | $ | 10.63 | |
| | | | |
The accompanying notes are an integral part of the financial statements.
9
International Series
Statement of Operations
For the Six Months Ended June 30, 2013 (unaudited)
| | | | |
INVESTMENT INCOME: | | | | |
| |
Dividends (net of foreign taxes withheld, $1,438,511) | | $ | 10,779,506 | |
| | | | |
| |
EXPENSES: | | | | |
| |
Management fees (Note 3) | | | 2,571,973 | |
Shareholder services fees (Class S)(Note 3) | | | 715,074 | |
Transfer agent fees (Note 3) | | | 115,239 | |
Fund accounting and administration fees (Note 3) | | | 58,426 | |
Directors’ fees (Note 3) | | | 7,338 | |
Chief Compliance Officer service fees (Note 3) | | | 1,117 | |
Custodian fees | | | 196,971 | |
Miscellaneous | | | 130,722 | |
| | | | |
| |
Total Expenses | | | 3,796,860 | |
Less reduction of expenses (Note 3) | | | (166,883 | ) |
| | | | |
| |
Net Expenses | | | 3,629,977 | |
| | | | |
| |
NET INVESTMENT INCOME | | | 7,149,529 | |
| | | | |
| |
REALIZED AND UNREALIZED GAIN (LOSS) ON INVESTMENTS AND FOREIGN CURRENCY: | | | | |
| |
Net realized gain (loss) on- | | | | |
Investments | | | 11,528,870 | |
Foreign currency and translation of other assets and liabilities | | | (2,268,590 | ) |
| | | | |
| |
| | | 9,260,280 | |
| | | | |
| |
Net change in unrealized appreciation (depreciation) on- | | | | |
Investments (net of decrease in accrued foreign capital gains tax of $88,432) | | | (6,934,773 | ) |
Foreign currency and translation of other assets and liabilities | | | (45,264 | ) |
| | | | |
| |
| | | (6,980,037 | ) |
| | | | |
| |
NET REALIZED AND UNREALIZED GAIN (LOSS) ON INVESTMENTS AND FOREIGN CURRENCY | | | 2,280,243 | |
| | | | |
| |
NET INCREASE IN NET ASSETS RESULTING FROM OPERATIONS | | $ | 9,429,772 | |
| | | | |
The accompanying notes are an integral part of the financial statements.
10
International Series
Statements of Changes in Net Assets
| | | | | | | | |
| | | FOR THE SIX
MONTHS ENDED
6/30/13
(UNAUDITED) | | | FOR THE YEAR ENDED
12/31/12 | |
INCREASE (DECREASE) IN NET ASSETS: | | | | | | | | |
| | |
OPERATIONS: | | | | | | | | |
| | |
Net investment income | | $ | 7,149,529 | | | $ | 8,155,713 | |
Net realized gain (loss) on investments and foreign currency | | | 9,260,280 | | | | (1,401,057 | ) |
Net change in unrealized appreciation (depreciation) on investments and foreign currency | | | (6,980,037 | ) | | | 79,568,578 | |
| | | | | | | | |
| | |
Net increase from operations | | | 9,429,772 | | | | 86,323,234 | |
| | | | | | | | |
| | |
DISTRIBUTIONS TO SHAREHOLDERS (Note 8): | | | | | | | | |
| | |
From net investment income (Class S) | | | — | | | | (6,468,512 | ) |
From net investment income (Class I) | | | — | | | | (965,618 | ) |
From return of capital (Class S) | | | — | | | | (577,095 | ) |
From return of capital (Class I) | | | — | | | | (86,357 | ) |
| | | | | | | | |
| | |
Total distributions to shareholders | | | — | | | | (8,097,582 | ) |
| | | | | | | | |
| | |
CAPITAL STOCK ISSUED AND REPURCHASED: | | | | | | | | |
| | |
Net increase from capital share transactions (Note 5) | | | 3,068,419 | | | | 70,041,655 | |
| | | | | | | | |
| | |
Net increase in net assets | | | 12,498,191 | | | | 148,267,307 | |
| | |
NET ASSETS: | | | | | | | | |
| | |
Beginning of period | | | 661,534,040 | | | | 513,266,733 | |
| | | | | | | | |
| | |
End of period (including undistributed net investment income of $7,069,632 and distributions in excess of net investment income of $79,897, respectively) | | $ | 674,032,231 | | | $ | 661,534,040 | |
| | | | | | | | |
The accompanying notes are an integral part of the financial statements.
11
International Series
Financial Highlights - Class S
| | | | | | | | | | | | | | | | | | | | | | | | |
| | | FOR THE SIX
MONTHS ENDED | | | FOR THE YEARS ENDED | |
| | 6/30/2013
(UNAUDITED) | | | 12/31/12 | | | 12/31/11 | | | 12/31/10 | | | 12/31/09 | | | 12/31/08 | |
Per share data (for a share outstanding throughout each period): | | | | | | | | | | | | | | | | | | | | | | | | |
Net asset value - Beginning of period | | $ | 8.70 | | | $ | 7.61 | | | $ | 8.85 | | | $ | 8.39 | | | $ | 6.57 | | | $ | 10.87 | |
| | | | | | | | | | | | | | | | | | | | | | | | |
| | | | | | |
Income (loss) from investment operations: | | | | | | | | | | | | | | | | | | | | | | | | |
Net investment income | | | 0.09 | 1 | | | 0.10 | 1 | | | 0.13 | 1 | | | 0.14 | 1 | | | 0.14 | 1 | | | 0.22 | |
Net realized and unrealized gain (loss) on investments | | | 0.03 | | | | 1.10 | | | | (1.26 | ) | | | 0.86 | | | | 2.10 | | | | (3.82 | ) |
| | | | | | | | | | | | | | | | | | | | | | | | |
| | | | | | |
Total from investment operations | | | 0.12 | | | | 1.20 | | | | (1.13 | ) | | | 1.00 | | | | 2.24 | | | | (3.60 | ) |
| | | | | | | | | | | | | | | | | | | | | | | | |
| | | | | | |
Less distributions to shareholders: | | | | | | | | | | | | | | | | | | | | | | | | |
From net investment income | | | — | | | | (0.10 | ) | | | (0.10 | ) | | | (0.19 | ) | | | (0.16 | ) | | | (0.21 | ) |
From return of capital | | | — | | | | (0.01 | ) | | | — | | | | — | | | | — | | | | — | |
From net realized gain on investments | | | — | | | | — | | | | (0.01 | ) | | | (0.35 | ) | | | (0.26 | ) | | | (0.49 | ) |
| | | | | | | | | | | | | | | | | | | | | | | | |
Total distributions to shareholders | | | — | | | | (0.11 | ) | | | (0.11 | ) | | | (0.54 | ) | | | (0.42 | ) | | | (0.70 | ) |
| | | | | | | | | | | | | | | | | | | | | | | | |
| | | | | | |
Net asset value - End of period | | $ | 8.82 | | | $ | 8.70 | | | $ | 7.61 | | | $ | 8.85 | | | $ | 8.39 | | | $ | 6.57 | |
| | | | | | | | | | | | | | | | | | | | | | | | |
| | | | | | |
Net assets - End of period (000’s omitted) | | $ | 552,230 | | | $ | 565,609 | | | $ | 513,267 | | | $ | 317,199 | | | $ | 267,100 | | | $ | 182,273 | |
| | | | | | | | | | | | | | | | | | | | | | | | |
| | | | | | |
Total return2 | | | 1.38 | % | | | 15.78 | % | | | (12.82 | %) | | | 12.04 | % | | | 34.23 | % | | | (33.25 | %) |
Ratios (to average net assets)/Supplemental Data: | | | | | | | | | | | | | | | | | | | | | | | | |
Expenses* | | | 1.10 | %3 | | | 1.10 | % | | | 1.16 | % | | | 1.15 | % | | | 1.15 | % | | | 1.15 | % |
Net investment income | | | 2.02 | %3 | | | 1.30 | % | | | 1.49 | % | | | 1.68 | % | | | 1.90 | % | | | 2.49 | % |
Portfolio turnover | | | 10 | % | | | 22 | % | | | 7 | % | | | 13 | % | | | 17 | % | | | 9 | % |
|
| *The investment advisor did not impose all or a portion of its management and/or other fees, and in some periods may have paid a portion of the Series’ expenses. If these expenses had been incurred by the Class, the expense ratio (to average net assets) would have increased by the following amount: | |
| | | | | | |
| | | 0.05 | %3 | | | 0.07 | % | | | N/A | | | | 0.00 | %4 | | | 0.00 | %4 | | | N/A | |
1Calculated based on average shares outstanding during the periods.
2Represents aggregate total return for the periods indicated, and assumes reinvestment of all distributions. Total return would have been lower had certain expenses not been waived or reimbursed during the periods. Periods less than one year are not annualized.
3Annualized.
4Less than 0.01%.
The accompanying notes are an integral part of the financial statements.
12
International Series
Financial Highlights - Class I
| | | | | | | | |
| | | FOR THE SIX
MONTHS ENDED
6/30/13
(UNAUDITED) | | | FOR THE PERIOD
3/15/121 TO
12/31/12 | |
Per share data (for a share outstanding throughout each period): | | | | | | | | |
Net asset value - Beginning of period | | $ | 10.47 | | | $ | 10.00 | |
| | | | | | | | |
| | |
Income (loss) from investment operations: | | | | | | | | |
Net investment income2 | | | 0.13 | | | | 0.13 | |
Net realized and unrealized gain (loss) on investments | | | 0.03 | | | | 0.46 | |
| | | | | | | | |
| | |
Total from investment operations | | | 0.16 | | | | 0.59 | |
| | | | | | | | |
| | |
Less distributions to shareholders: | | | | | | | | |
From net investment income | | | — | | | | (0.11 | ) |
From return of capital | | | — | | | | (0.01 | ) |
| | | | | | | | |
| | |
Total distributions to shareholders | | | — | | | | (0.12 | ) |
| | | | | | | | |
| | |
Net asset value - End of period | | $ | 10.63 | | | $ | 10.47 | |
| | | | | | | | |
| | |
Net assets - End of period (000’s omitted) | | $ | 121,803 | | | $ | 95,925 | |
| | | | | | | | |
| | |
Total return3 | | | 1.53 | % | | | 5.88 | % |
Ratios (to average net assets)/Supplemental Data: | | | | | | | | |
Expenses*4 | | | 0.85 | % | | | 0.85 | % |
Net investment income4 | | | 2.41 | % | | | 1.67 | % |
Portfolio turnover | | | 10 | % | | | 22 | % |
|
| *The investment advisor did not impose all or a portion of its management and/or other fees during the period, and may have paid a portion of the Series’ expenses. If these expenses had been incurred by the Class, the expense ratio (to average net assets) would have increased by the following amount: | |
| | |
| | | 0.05 | %4 | | | 0.09 | %4 |
1Commencement of operations.
2Calculated based on average shares outstanding during the periods.
3Represents aggregate total return for the periods indicated, and assumes reinvestment of all distributions. Total return would have been lower had certain expenses not been waived during certain periods. Periods less than one year are not annualized.
4Annualized.
The accompanying notes are an integral part of the financial statements.
13
International Series
Notes to Financial Statements
International Series (the “Series”) is a no-load diversified series of Manning & Napier Fund, Inc. (the “Fund”). The Fund is organized in Maryland and is registered under the Investment Company Act of 1940, as amended, as an open-end management investment company.
The Series’ investment objective is to provide long-term growth by investing principally in the common stocks of companies located outside the United States.
The Fund’s advisor is Manning & Napier Advisors, LLC (the “Advisor”). Shares of the Series are offered to investors, clients and employees of the Advisor and its affiliates. The Series is authorized to issue two classes of shares (Class S and Class I). Each class of shares is substantially the same, except that Class S shares bear shareholder services fees. The total authorized capital stock of the Fund consists of 15 billion shares of common stock each having a par value of $0.01. As of June 30, 2013, 10.3 billion shares have been designated in total among 42 series, of which 250 million have been designated as International Series Class S common stock and 100 million have been designated as International Series Class I common stock.
| 2. | Significant Accounting Policies |
Security Valuation
Portfolio securities, including domestic equities, foreign equities, warrants and options, listed on an exchange other than the NASDAQ Stock Market are valued at the latest quoted sales price of the exchange on which the security is primarily traded. Securities not traded on valuation date or securities not listed on an exchange are valued at the latest quoted bid price provided by the Fund’s pricing service. Securities listed on the NASDAQ Stock Market are valued in accordance with the NASDAQ Official Closing Price.
Short-term investments that mature in sixty days or less are valued at amortized cost, which approximates fair value. Investments in open-end investment companies are valued at their net asset value per share on valuation date.
Volume and level of activity in established markets for an asset or liability are evaluated to determine whether recent transactions and quoted prices are determinative of fair value. Where there have been significant decreases in volume and level of activity, further analysis and adjustment may be necessary to estimate fair value. The Series measures fair value in these instances by the use of inputs and valuation techniques which may be based upon current market prices of securities that are comparable in coupon, rating, maturity and industry and/or expectation of future cash flows. As a result of trading in relatively thin markets and/or markets that experience significant volatility, the prices used by the Series to value these securities may differ from the value that would be realized if these securities were sold, and the differences could be material.
Securities for which representative valuations or prices are not available from the Series’ pricing service may be valued at fair value as determined in good faith by the Advisor under procedures approved by and under the general supervision and responsibility of the Fund’s Board of Directors (the “Board”). Due to the inherent uncertainty of valuations of such securities, the fair value may differ significantly from the values that would have been used had a ready market for such securities existed. If trading or events occurring after the close of the principal market in which securities are traded are expected to materially affect the value of those securities, then they may be valued at their fair value, taking this trading or these events into account. In accordance with the procedures approved by the Board, the values of certain securities trading outside the U.S. were adjusted following the close of local trading using a factor from a third party vendor. The third party vendor uses statistical analyses and quantitative models, which consider among other things subsequent movement and changes in the prices of indices, securities and exchange rates in other markets, to determine the factors which are used to adjust local market prices. The value of securities used for net asset value calculation under these procedures may differ from published prices for the same securities. It is the Fund’s policy to classify each foreign equity security where a factor from a third party vendor is provided as a Level 2 security.
Various inputs are used in determining the value of the Series’ assets or liabilities carried at fair value. These inputs are summarized in three broad levels. Level 1 includes quoted prices in active markets for identical assets and liabilities. Level 2
14
International Series
Notes to Financial Statements (continued)
| 2. | Significant Accounting Policies (continued) |
Security Valuation (continued)
includes other significant observable inputs (including quoted prices for similar securities, interest rates, prepayment speeds, credit risk, etc.). Level 3 includes significant unobservable inputs (including the Series’ own assumptions in determining the fair value of investments). A financial instrument’s level within the fair value hierarchy is based on the lowest level of any input both individually and in aggregate that is significant to the fair value measurement. The inputs or methodology used for valuing securities are not necessarily an indication of the risk associated with investing in those securities.
The following is a summary of the valuation levels used for major security types as of June 30, 2013 in valuing the Series’ assets or liabilities carried at fair value:
| | | | | | | | | | | | | | | | |
| DESCRIPTION | | TOTAL | | | LEVEL 1 | | | LEVEL 2 | | | LEVEL 3 | |
Assets: | | | | | | | | | | | | | | | | |
Equity securities: | | | | | | | | | | | | | | | | |
Consumer Discretionary | | $ | 105,142,640 | | | $ | 5,150,028 | | | $ | 99,992,612 | | | $ | — | |
Consumer Staples | | | 140,623,708 | | | | 34,980,747 | | | | 105,642,961 | | | | — | |
Energy | | | 17,160,270 | | | | 9,335,581 | | | | 7,824,689 | | | | — | |
Financials | | | 59,266,042 | | | | — | | | | 59,266,042 | | | | — | |
Health Care | | | 72,805,072 | | | | 33,863,601 | | | | 38,941,471 | | | | — | |
Industrials | | | 111,944,350 | | | | 14,446,802 | | | | 97,497,548 | | | | — | |
Information Technology | | | 95,085,325 | | | | 8,371,648 | | | | 86,713,677 | | | | — | |
Materials | | | 24,024,639 | | | | — | | | | 24,024,639 | | | | — | |
Telecommunication Services | | | 23,468,757 | | | | 12,496,303 | | | | 10,972,454 | | | | — | |
Utilities | | | 1,017,024 | | | | — | | | | 1,017,024 | | | | — | |
Mutual fund | | | 28,126,156 | | | | 28,126,156 | | | | — | | | | — | |
| | | | | | | | | | | | | | | | |
Total assets | | $ | 678,663,983 | | | $ | 146,770,866 | | | $ | 531,893,117 | | | $ | — | |
| | | | | | | | | | | | | | | | |
Please see the Investment Portfolio for foreign securities where a factor from a third party vendor was applied to determine the security’s fair value following close of local trading. Such securities are included in Level 2 in the table above.
There were no Level 3 securities held by the Series as of December 31, 2012 or June 30, 2013.
The Fund’s policy is to recognize transfers in and transfers out of the valuation levels as of the beginning of the reporting period. There were no transfers between Level 1 and Level 2 during the six months ended June 30, 2013.
Security Transactions, Investment Income and Expenses
Security transactions are accounted for on trade date. Dividend income is recorded on the ex-dividend date, except that if the ex-dividend date has passed, certain dividends from foreign securities are recorded as soon as the Series is informed of the ex-dividend date. Non-cash dividends, if any, are recorded at the fair value of the securities received. Interest income, including amortization of premium and accretion of discounts using the effective interest method, is earned from settlement date and accrued daily.
Expenses are recorded on an accrual basis. Most expenses of the Fund can be attributed to a specific series. Expenses which cannot be directly attributed are apportioned among the series in the Fund in such a manner as deemed equitable by the Fund’s Board, taking into consideration, among other things, the nature and type of expense.
The Series uses the identified cost method for determining realized gain or loss on investments for both financial statement and federal income tax reporting purposes.
Foreign Currency Translation
The books and records of the Series are maintained in U.S. dollars. Foreign currencies, investments and other assets and liabilities are translated into U.S. dollars at the current exchange rates. Purchases and sales of investment securities and income and expenses are translated on the respective dates of such transactions. The Series does not isolate realized and
15
International Series
Notes to Financial Statements (continued)
| 2. | Significant Accounting Policies (continued) |
Foreign Currency Translation (continued)
unrealized gains and losses attributable to changes in the exchange rates from gains and losses that arise from changes in the fair value of investments. Such fluctuations are included with net realized and unrealized gain or loss on investments. Net realized foreign currency gains and losses represent foreign currency gains and losses between trade date and settlement date on securities transactions, gains and losses on disposition of foreign currencies and the difference between the amount of income and foreign withholding taxes recorded on the books of the Series and the amounts actually received or paid.
Forward Foreign Currency Exchange Contracts
The Series may purchase or sell forward foreign currency exchange contracts in order to hedge a portfolio position or specific transaction. Risks may arise if the counterparties to a contract are unable to meet the terms of the contract or if the value of the foreign currency moves unfavorably.
All forward foreign currency exchange contracts are adjusted daily by the exchange rate of the underlying currency and, for financial statement purposes, any gain or loss is recorded as unrealized gain or loss until a contract has been closed.
The Series may regularly trade forward foreign currency exchange contracts with off-balance sheet risk in the normal course of its investing activities to assist in managing exposure to changes in foreign currency exchange rates.
The notional or contractual amount of these instruments represents the investment the Series has in forward foreign currency exchange contracts and does not necessarily represent the amounts potentially at risk. The measurement of the risks associated with forward foreign currency exchange contracts is meaningful only when all related and offsetting transactions are considered. During the period of March 27, 2013 through April 24, 2013, the period for which foreign currency contracts were held, the average volume of derivative activity (measured in terms of the notional amount) was $111,171,793.
The following table presents the effect of the derivative instruments on the Statement of Operations at June 30, 2013:
| | | | |
| STATEMENT OF OPERATIONS |
Derivative | | | | |
Foreign forward currency exchange contracts | | Net realized gain (loss) on foreign currency transactions and translation of other assets and liabilities | | $(1,955,099) |
As of June 30, 2013, no investments in forward foreign currency exchange contracts were held by the Series.
Federal Taxes
The Series’ policy is to comply with the provisions of the Internal Revenue Code applicable to regulated investment companies. The Series is not subject to federal income tax or excise tax to the extent that the Series distributes to shareholders each year its taxable income, including any net realized gains on investments, in accordance with requirements of the Internal Revenue Code. Accordingly, no provision for federal income tax or excise tax has been made in the financial statements.
Management evaluates its tax positions to determine if the tax positions taken meet the minimum recognition threshold in connection with accounting for uncertainties in income tax positions taken or expected to be taken for the purposes of measuring and recognizing tax liabilities in the financial statements. Recognition of tax benefits of an uncertain tax position is required only when the position is “more likely than not” to be sustained assuming examination by taxing authorities. At June 30, 2013, the Series has recorded no liability for net unrecognized tax benefits relating to uncertain income tax positions taken or expected to be taken in future tax returns.
The Series files income tax returns in the U.S. federal jurisdiction, various states and foreign jurisdictions, as required. No income tax returns are currently under investigation. The statute of limitations on the Series’ tax returns remains open for the years ended December 31, 2009 through December 31, 2012. The Series is not aware of any tax positions for which it is reasonably possible that the total amounts of unrecognized tax benefits will significantly change in the next twelve months.
16
International Series
Notes to Financial Statements (continued)
| 2. | Significant Accounting Policies (continued) |
Foreign Taxes
Based on the Series’ understanding of the tax rules and rates related to income, gains and currency purchase/repatriation transactions for foreign jurisdictions in which it invests, the Series will provide for foreign taxes, and where appropriate, deferred foreign tax. The Series is subject to a tax imposed on short term capital gains on securities of issuers domiciled in India. The Series records an estimated deferred tax liability for securities that have been held for less than a year at the end of the reporting period, assuming those positions were disposed of at the end of the period. This amount is reported in Accrued foreign capital gains tax in the accompanying Statement of Assets and Liabilities. Realized losses on the sale of securities of issuers domiciled in India can be carried forward for eight years to offset potential future short term realized capital gains.
Distributions of Income and Gains
Distributions to shareholders of net investment income and net realized gains are made annually. An additional distribution may be necessary to avoid taxation of the Series. Distributions are recorded on the ex-dividend date.
Indemnifications
The Fund’s organizational documents provide former and current directors and officers with a limited indemnification against liabilities arising in connection with the performance of their duties to the Fund. In the normal course of business, the Fund may also enter into contracts that provide general indemnifications. The Fund’s maximum exposure under these arrangements is unknown as this would be dependent on future claims that may be made against the Fund. The risk of material loss from such claims is considered remote.
Other
The preparation of financial statements in conformity with accounting principles generally accepted in the United States of America requires management to make estimates and assumptions that affect the reported amounts of assets and liabilities and the disclosure of contingent assets and liabilities at the date of the financial statements and the reported amounts of income and expenses during the reporting period. Actual results could differ from those estimates.
| 3. | Transactions with Affiliates |
The Fund has an Investment Advisory Agreement (the “Agreement”) with the Advisor, for which the Series pays a fee, computed daily and payable monthly, at an annual rate of 0.75% of the Series’ average daily net assets.
Under the Agreement, personnel of the Advisor provide the Series with advice and assistance in the choice of investments and the execution of securities transactions, and otherwise maintain the Series’ organization. The Advisor also provides the Fund with necessary office space and fund administration and support services. The salaries of all officers of the Fund (except a percentage of the Fund’s Chief Compliance Officer’s salary, which is paid by the Fund), and of all Directors who are “affiliated persons” of the Fund, or of the Advisor, and all personnel of the Fund, or of the Advisor, performing services relating to research, statistical and investment activities, are paid by the Advisor. Each “non-affiliated” Director receives an annual stipend, which is allocated among all the active series of the Fund. In addition, these Directors also receive a fee per Board meeting attended plus a fee for each committee meeting attended.
The Class S shares of the Series are subject to a shareholder services fee in accordance with a shareholder services plan adopted by the Board. The shareholder service fee is intended to compensate financial intermediaries, including affiliates of the Fund, in connection with the provision of direct client service, personal services, maintenance of shareholder accounts and reporting services. For these services, Class S of the Series pays a fee, computed daily and payable monthly, at an annual rate of 0.25% of the average daily net assets of Class S. The Fund has a Shareholder Services Agreement with the Advisor, for which the Advisor receives the shareholder services fee as stated above.
The Advisor has contractually agreed, until at least April 30, 2014, to waive its management fee and, if necessary, pay other operating expenses of the Series in order to maintain total direct annual fund operating expenses for the Series, exclusive of each share class’s shareholder service fee, at no more than 0.85% of average daily net assets. Accordingly, the Advisor waived
17
International Series
Notes to Financial Statements (continued)
| 3. | Transactions with Affiliates (continued) |
fees of $166,883 for the six months ended June 30, 2013, which is included as a reduction of expenses on the Statement of Operations. The Advisor is not eligible to recoup any expenses that have been waived or reimbursed in prior years.
Manning & Napier Investor Services, Inc., a registered broker-dealer affiliate of the Advisor, acts as distributor for the Fund’s shares. The services of Manning & Napier Investor Services, Inc. are provided at no additional cost to the Series.
The Advisor has agreements with BNY Mellon Investment Servicing (U.S.) Inc. (“BNY”) under which BNY serves as sub-accountant services agent and sub-transfer agent. The Fund pays the Advisor an annual fee related to fund accounting and administration of 0.0175% on the first $3 billion of average daily net assets (excluding Target Series and Strategic Income Series); 0.015% on the next $3 billion of average daily net assets (excluding Target Series and Strategic Income Series); and 0.01% of the average daily net assets in excess of $6 billion (excluding Target Series and Strategic Income Series); plus a base fee of $25,500 per series. Transfer Agent fees are charged to the Fund on a per account basis. Additionally, certain transaction and cusip-based fees and out-of-pocket expenses, including charges for reporting relating to the Fund’s compliance program, are charged. Effective October 1, 2012, the aforementioned agreements were modified to reduce the annual fee related to fund accounting and administration, as well as transfer agent fees, by 10%, excluding out-of-pocket expenses.
Expenses not directly attributable to a series are allocated based on each series’ relative net assets or number of accounts, depending on the expense.
| 4. | Purchases and Sales of Securities |
For the six months ended June 30, 2013, purchases and sales of securities, other than U.S. Government securities and short-term securities, were $110,255,722 and $67,169,571 respectively. There were no purchases or sales of U.S. Government securities.
| 5. | Capital Stock Transactions |
Transactions in shares of Class S and I shares of International Series were:
| | | | | | | | | | | | | | | | |
| CLASS S | | FOR THE SIX MONTHS ENDED 6/30/13 | | | FOR THE YEAR ENDED 12/31/12 | |
| | SHARES | | | AMOUNT | | | SHARES | | | AMOUNT | |
Sold | | | 4,697,691 | | | $ | 42,128,514 | | | | 26,541,777 | | | $ | 213,267,622 | |
Reinvested | | | — | | | | — | | | | 763,100 | | | | 6,598,467 | |
Repurchased | | | (7,117,603 | ) | | | (63,915,954 | ) | | | (29,704,876 | ) | | | (240,426,328 | ) |
| | | | | | | | | | | | | | | | |
Total | | | (2,419,912 | ) | | $ | (21,787,440 | ) | | | (2,399,999 | ) | | $ | (20,560,239 | ) |
| | | | | | | | | | | | | | | | |
| | | | | | | | | | | | | | | | |
| CLASS I | | FOR THE SIX MONTHS ENDED 6/30/13 | | | FOR THE PERIOD 3/15/12
(COMMENCEMENT OF
OPERATIONS) TO 12/31/12 | |
| | SHARES | | | AMOUNT | | | SHARES | | | AMOUNT | |
Sold | | | 2,702,274 | | | $ | 29,284,252 | | | | 9,564,837 | | | $ | 94,375,423 | |
Reinvested | | | — | | | | — | | | | 101,087 | | | | 1,051,975 | |
Repurchased | | | (405,963) | | | | (4,428,393) | | | | (502,442) | | | | (4,825,504) | |
| | | | | | | | | | | | | | | | |
Total | | | 2,296,311 | | | $ | 24,855,859 | | | | 9,163,482 | | | $ | 90,601,894 | |
| | | | | | | | | | | | | | | | |
Approximately 49% of the Series’ shares represent investments by fiduciary accounts over which the Advisor has sole investment discretion.
18
International Series
Notes to Financial Statements (continued)
The Series may trade in instruments including written and purchased options, forward foreign currency exchange contracts and futures contracts and other derivatives in the normal course of investing activities to assist in managing exposure to various market risks. The Series may be subject to various elements of risk, which may involve, to a varying degree, elements of risk in excess of the amounts recognized for financial statement purposes. These risks include: the risk that changes in the value of a derivative may not correlate perfectly with the underlying asset, rate or index; counterparty credit risk related to over the counter derivative counterparties’ failure to perform under contract terms; liquidity risk related to the lack of a liquid market for these contracts allowing the fund to close out its position(s); and documentation risk relating to disagreement over contract terms. No such investments were held by the Series as of June 30, 2013.
Investing in securities of foreign companies and foreign governments involves special risks and considerations not typically associated with investing in securities of domestic companies and the U.S. Government. These risks include revaluation of currencies and future adverse political and economic developments. Moreover, securities of foreign companies and foreign governments and their markets may be less liquid and their prices more volatile than those of comparable domestic companies and the U.S. Government.
| 8. | Federal Income Tax Information |
The amount and characterization of certain income and capital gains to be distributed are determined in accordance with federal income tax regulations, which may differ from accounting principles generally accepted in the United States of America. The Series may periodically make reclassifications among its capital accounts to reflect income and gains available for distribution (or available capital loss carryovers) under income tax regulations, without impacting the Series’ net asset value. Any such reclassifications are not reflected in the financial highlights.
The final determination of the tax character of current year distributions will be made at the conclusion of the fiscal year. The tax character of distributions paid for the year ended December 31, 2012 was as follows:
| | | | | | |
Ordinary income | | $ | 7,434,130 | | | |
Return of capital | | | 663,452 | | | |
At June 30, 2013, the identified cost of investments for federal income tax purposes, the resulting gross unrealized appreciation and depreciation, and the net unrealized appreciation were as follows:
| | | | |
Cost for federal income tax purposes | | $ | 639,632,901 | |
Unrealized appreciation | | | 99,286,043 | |
Unrealized depreciation | | | (60,254,961 | ) |
| | | | |
Net unrealized appreciation | | $ | 39,031,082 | |
| | | | |
19
{This page intentionally left blank}
20
{This page intentionally left blank}
21
International Series
Literature Requests
(unaudited)
Proxy Voting Policies and Procedures
A description of the policies and procedures that the Fund uses to determine how to vote proxies relating to portfolio securities is available, without charge, upon request:
| | | | |
| By phone | | 1-800-466-3863 | | |
| On the Securities and Exchange | | | | |
| Commission’s (SEC) web site | | http://www.sec.gov | | |
Proxy Voting Record
Information regarding how the Fund voted proxies relating to portfolio securities during the most recent 12-month period ended June 30th is available, without charge, upon request:
| | | | |
| By phone | | 1-800-466-3863 | | |
| On the SEC’s web site | | http://www.sec.gov | | |
Quarterly Portfolio Holdings
The Series’ complete schedule of portfolio holdings for the 1st and 3rd quarters of each fiscal year are provided on Form N-Q, and are available, without charge, upon request:
| | | | |
| By phone | | 1-800-466-3863 | | |
| On the SEC’s web site | | http://www.sec.gov | | |
The Series’ Form N-Q may be reviewed and copied at the SEC’s Public Reference Room in Washington, D.C. Information on the operation of the Public Reference Room may be obtained by calling 1-800-SEC-0330.
Prospectus and Statement of Additional Information (SAI)
The prospectus and SAI provide additional information about each Series, including charges, expenses and risks. These documents are available, without charge, upon request:
| | | | |
| By phone | | 1-800-466-3863 | | |
| On the SEC’s web site | | http://www.sec.gov | | |
| On our web site | | http://www.manning-napier.com | | |
Additional information available at www.manning-napier.com
1. Fund Holdings - Month-End
2. Fund Holdings - Quarter-End
3. Shareholder Report - Annual
4. Shareholder Report - Semi-Annual
The Fund also offers electronic notification or “e-delivery” when certain documents are available on-line to be downloaded or reviewed. Direct shareholders can elect to receive electronic notification when shareholder reports, prospectus updates, and/or statements are available. If you do not currently have on-line access to your account, you can establish access by going to www.manning-napier.com, click on “Login” in the top corner of the page, and follow the prompts to self-enroll. Once enrolled, you can set your electronic notification preferences by clicking on the Account Options tab located within the green toolbar and then select E-Delivery Option. Should you have any questions on either how to establish on-line access or how to update your account settings, please contact Investor Services at 1-800-466-3863.
MNINT-6/13-SAR
| | | | | | |
| | | | WORLD OPPORTUNITIES SERIES | | |
www.manning-napier.com | | | | |
World Opportunities Series
Shareholder Expense Example
(unaudited)
As a shareholder of the Series, you may incur two types of costs: (1) transaction costs and (2) ongoing costs, including management fees and other Series expenses. This example is intended to help you understand your ongoing costs (in dollars) of investing in the Series and to compare these costs with the ongoing costs of investing in other mutual funds.
The example is based on an investment of $1,000 invested at the beginning of the period and held for the entire period (January 1, 2013 to June 30, 2013).
Actual Expenses
The first line of the table below provides information about actual account values and actual expenses. You may use the information in this line, together with the amount you invested, to estimate the expenses that you paid over the period. Simply divide your account value by $1,000 (for example, an $8,600 account value divided by $1,000 = 8.6), then multiply the result by the number in the first line under the heading entitled “Expenses Paid During Period” to estimate the expenses you paid on your account during this period.
Hypothetical Example for Comparison Purposes
The second line of the table below provides information about hypothetical account values and hypothetical expenses based on the Series’ actual expense ratio and an assumed rate of return of 5% per year before expenses, which is not the Series’ actual return. The hypothetical account values and expenses may not be used to estimate the actual ending account balance or expenses you paid during the period. You may use this information to compare the ongoing costs of investing in the Series and other funds. To do so, compare this 5% hypothetical example with the 5% hypothetical examples that appear in the shareholder reports of the other funds.
Please note that the expenses shown in the table are meant to highlight your ongoing costs only and do not reflect any transaction costs. Therefore, the second line of the table is useful in comparing ongoing costs only, and will not help you determine the relative total costs of owning different funds. In addition, if these transaction costs were included, your costs would have been higher.
| | | | | | |
| | | BEGINNING
ACCOUNT VALUE
1/1/13 | | ENDING
ACCOUNT VALUE
6/30/13 | | EXPENSES PAID
DURING PERIOD*
1/1/13-6/30/13 |
Actual | | $1,000.00 | | $1,037.40 | | $5.35 |
Hypothetical (5% return before expenses) | | $1,000.00 | | $1,019.54 | | $5.31 |
*Expenses are equal to the Series’ annualized expense ratio (for the six-month period) of 1.06%, multiplied by the average account value over the period, multiplied by 181/365 to reflect the one-half year period. Expenses are based on the most recent fiscal half year.
1
World Opportunities Series
Portfolio Composition as of June 30, 2013
(unaudited)
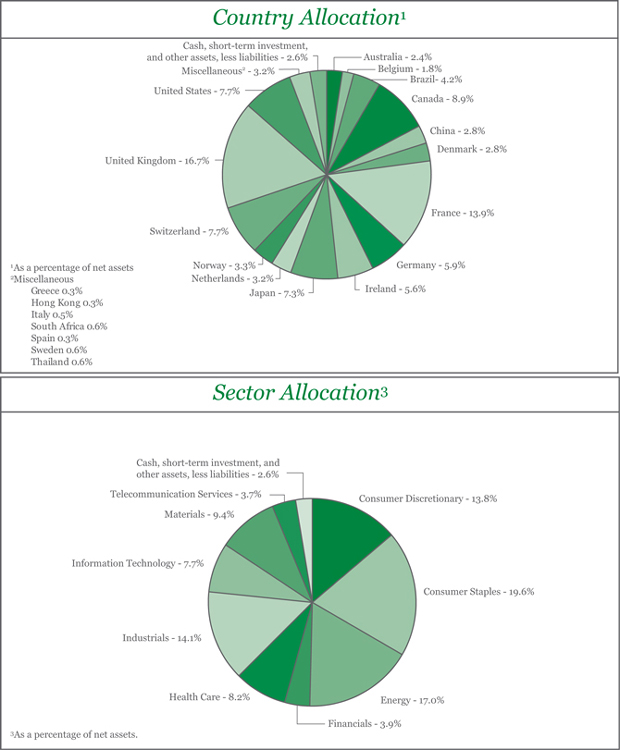
2
World Opportunities Series
Investment Portfolio - June 30, 2013
(unaudited)
| | | | | | | | | | |
| | | SHARES | | | VALUE (NOTE 2) | | | |
| | | |
COMMON STOCKS - 97.4% | | | | | | | | | | |
| | | |
Consumer Discretionary - 13.8% | | | | | | | | | | |
Automobiles - 2.2% | | | | | | | | | | |
Toyota Motor Corp. (Japan)1 | | | 2,526,400 | | | $ | 152,387,002 | | | |
| | | | | | | | | | |
Diversified Consumer Services - 0.8% | | | | | | | | | | |
Anhanguera Educacional Participacoes S.A. (Brazil) | | | 10,061,040 | | | | 58,886,854 | | | |
| | | | | | | | | | |
Hotels, Restaurants & Leisure - 2.4% | | | | | | | | | | |
Accor S.A. (France)1 | | | 4,899,120 | | | | 172,206,727 | | | |
| | | | | | | | | | |
Internet & Catalog Retail - 0.7% | | | | | | | | | | |
Ocado Group plc (United Kingdom)*1 | | | 11,067,360 | | | | 50,212,841 | | | |
| | | | | | | | | | |
Media - 4.4% | | | | | | | | | | |
British Sky Broadcasting Group plc (United Kingdom)1 | | | 15,070,270 | | | | 181,551,850 | | | |
ProsiebenSat.1 Media AG (Germany)1 | | | 971,860 | | | | 41,683,129 | | | |
Societe Television Francaise 1 (France)1 | | | 7,329,610 | | | | 87,784,306 | | | |
| | | | | | | | | | |
| | | |
| | | | | | | 311,019,285 | | | |
| | | | | | | | | | |
Multiline Retail - 1.3% | | | | | | | | | | |
Marks & Spencer Group plc (United Kingdom)1 | | | 13,974,510 | | | | 91,439,000 | | | |
| | | | | | | | | | |
Textiles, Apparel & Luxury Goods - 2.0% | | | | | | | | | | |
Adidas AG (Germany)1 | | | 855,670 | | | | 92,496,442 | | | |
Burberry Group plc (United Kingdom)1 | | | 2,189,510 | | | | 45,043,945 | | | |
| | | | | | | | | | |
| | | |
| | | | | | | 137,540,387 | | | |
| | | | | | | | | | |
| | | |
Total Consumer Discretionary | | | | | | | 973,692,096 | | | |
| | | | | | | | | | |
| | | |
Consumer Staples - 19.6% | | | | | | | | | | |
Beverages - 4.5% | | | | | | | | | | |
Anheuser-Busch InBev N.V. (Belgium)1 | | | 804,960 | | | | 72,472,732 | | | |
Carlsberg A/S - Class B (Denmark)1 | | | 767,750 | | | | 68,649,227 | | | |
Cia de Bebidas das Americas (AmBev) - ADR (Brazil) | | | 3,304,450 | | | | 123,421,208 | | | |
SABMiller plc (United Kingdom)1 | | | 1,097,620 | | | | 52,623,924 | | | |
| | | | | | | | | | |
| | | |
| | | | | | | 317,167,091 | | | |
| | | | | | | | | | |
Food & Staples Retailing - 6.6% | | | | | | | | | | |
Carrefour S.A. (France)1 | | | 5,026,155 | | | | 138,051,022 | | | |
Distribuidora Internacional de Alimentacion S.A. (Spain)1 | | | 2,641,760 | | | | 19,956,470 | | | |
Koninklijke Ahold N.V. (Netherlands)1 | | | 5,610,610 | | | | 83,445,938 | | | |
Tesco plc (United Kingdom)1 | | | 43,309,300 | | | | 218,098,990 | | | |
| | | | | | | | | | |
| | | |
| | | | | | | 459,552,420 | | | |
| | | | | | | | | | |
Food Products - 6.0% | | | | | | | | | | |
Charoen Pokphand Foods PCL (Thailand)1 | | | 50,300,860 | | | | 41,648,596 | | | |
Danone S.A. (France)1 | | | 2,051,970 | | | | 154,447,641 | | | |
Nestle S.A. (Switzerland)1 | | | 2,305,740 | | | | 151,303,582 | | | |
Unilever plc - ADR (United Kingdom) | | | 1,833,250 | | | | 74,154,964 | | | |
| | | | | | | | | | |
| | | |
| | | | | | | 421,554,783 | | | |
| | | | | | | | | | |
The accompanying notes are an integral part of the financial statements.
3
World Opportunities Series
Investment Portfolio - June 30, 2013
(unaudited)
| | | | | | | | | | |
| | | SHARES | | | VALUE (NOTE 2) | | | |
| | | |
COMMON STOCKS (continued) | | | | | | | | | | |
| | | |
Consumer Staples (continued) | | | | | | | | | | |
Personal Products - 0.8% | | | | | | | | | | |
Beiersdorf AG (Germany)1 | | | 646,756 | | | $ | 56,337,958 | | | |
| | | | | | | | | | |
Tobacco - 1.7% | | | | | | | | | | |
Imperial Tobacco Group plc (United Kingdom)1 | | | 2,191,940 | | | | 76,005,142 | | | |
Swedish Match AB (Sweden)1 | | | 1,251,350 | | | | 44,416,087 | | | |
| | | | | | | | | | |
| | | |
| | | | | | | 120,421,229 | | | |
| | | | | | | | | | |
| | | |
Total Consumer Staples | | | | | | | 1,375,033,481 | | | |
| | | | | | | | | | |
| | | |
Energy - 17.0% | | | | | | | | | | |
Energy Equipment & Services - 7.5% | | | | | | | | | | |
Cie Generale de Geophysique - Veritas (CGG - Veritas) (France)*1 | | | 5,087,030 | | | | 112,712,808 | | | |
Petroleum Geo-Services ASA (Norway)1 | | | 2,414,580 | | | | 29,482,032 | | | |
Schlumberger Ltd. (United States) | | | 4,408,680 | | | | 315,926,009 | | | |
Trican Well Service Ltd. (Canada) | | | 5,492,310 | | | | 73,007,981 | | | |
| | | | | | | | | | |
| | | |
| | | | | | | 531,128,830 | | | |
| | | | | | | | | | |
Oil, Gas & Consumable Fuels - 9.5% | | | | | | | | | | |
Cameco Corp. (Canada) | | | 6,593,280 | | | | 136,217,165 | | | |
Encana Corp. (Canada) | | | 10,326,510 | | | | 174,931,079 | | | |
Petroleo Brasileiro S.A. - ADR (Brazil) | | | 7,771,850 | | | | 113,935,321 | | | |
Talisman Energy, Inc. (Canada) | | | 17,790,140 | | | | 202,987,240 | | | |
Whitehaven Coal Ltd. (Australia)1 | | | 18,790,150 | | | | 39,534,331 | | | |
| | | | | | | | | | |
| | | |
| | | | | | | 667,605,136 | | | |
| | | | | | | | | | |
| | | |
Total Energy | | | | | | | 1,198,733,966 | | | |
| | | | | | | | | | |
| | | |
Financials - 3.9% | | | | | | | | | | |
Commercial Banks - 1.6% | | | | | | | | | | |
HSBC Holdings plc (United Kingdom)1 | | | 10,619,200 | | | | 109,932,202 | | | |
| | | | | | | | | | |
Insurance - 1.4% | | | | | | | | | | |
Admiral Group plc (United Kingdom)1 | | | 4,921,290 | | | | 99,134,836 | | | |
| | | | | | | | | | |
Real Estate Investment Trusts (REITS) - 0.9% | | | | | | | | | | |
Land Securities Group plc (United Kingdom)1 | | | 4,864,580 | | | | 65,335,302 | | | |
| | | | | | | | | | |
| | | |
Total Financials | | | | | | | 274,402,340 | | | |
| | | | | | | | | | |
| | | |
Health Care - 8.2% | | | | | | | | | | |
Health Care Equipment & Supplies - 3.1% | | | | | | | | | | |
BioMerieux (France)1 | | | 277,655 | | | | 26,903,181 | | | |
GN Store Nord A/S (Denmark)1 | | | 1,832,180 | | | | 34,601,786 | | | |
Mindray Medical International Ltd. - ADR (China) | | | 1,969,001 | | | | 73,739,087 | | | |
Shandong Weigao Group Medical Polymer Co. Ltd. - Class H (China)1 | | | 39,112,000 | | | | 42,611,962 | | | |
Sonova Holding AG (Switzerland)1 | | | 406,200 | | | | 42,974,197 | | | |
| | | | | | | | | | |
| | | |
| | | | | | | 220,830,213 | | | |
| | | | | | | | | | |
Health Care Providers & Services - 1.7% | | | | | | | | | | |
Life Healthcare Group Holdings Ltd. (South Africa)1 | | | 11,016,850 | | | | 41,785,230 | | | |
The accompanying notes are an integral part of the financial statements.
4
World Opportunities Series
Investment Portfolio - June 30, 2013
(unaudited)
| | | | | | | | | | |
| | | SHARES | | | VALUE (NOTE 2) | | | |
| | | |
COMMON STOCKS (continued) | | | | | | | | | | |
| | | |
Health Care (continued) | | | | | | | | | | |
Health Care Providers & Services (continued) | | | | | | | | | | |
Sonic Healthcare Ltd. (Australia)1 | | | 5,459,810 | | | $ | 74,173,211 | | | |
| | | | | | | | | | |
| | | |
| | | | | | | 115,958,441 | | | |
| | | | | | | | | | |
Life Sciences Tools & Services - 2.3% | | | | | | | | | | |
Lonza Group AG (Switzerland)1 | | | 813,071 | | | | 61,092,131 | | | |
QIAGEN N.V. (Netherlands)*1 | | | 5,285,240 | | | | 103,418,180 | | | |
| | | | | | | | | | |
| | | |
| | | | | | | 164,510,311 | | | |
| | | | | | | | | | |
Pharmaceuticals - 1.1% | | | | | | | | | | |
Novo Nordisk A/S - Class B (Denmark)1 | | | 479,850 | | | | 74,598,655 | | | |
| | | | | | | | | | |
| | | |
Total Health Care | | | | | | | 575,897,620 | | | |
| | | | | | | | | | |
| | | |
Industrials - 14.1% | | | | | | | | | | |
Airlines - 3.0% | | | | | | | | | | |
Ryanair Holdings plc - ADR (Ireland) | | | 4,032,330 | | | | 207,785,965 | | | |
| | | | | | | | | | |
Commercial Services & Supplies - 0.5% | | | | | | | | | | |
Aggreko plc (United Kingdom)1 | | | 1,412,740 | | | | 35,310,922 | | | |
| | | | | | | | | | |
Electrical Equipment - 1.8% | | | | | | | | | | |
Nexans S.A. (France)1 | | | 1,217,530 | | | | 57,773,299 | | | |
Prysmian S.p.A. (Italy)1 | | | 1,734,350 | | | | 32,353,955 | | | |
Schneider Electric S.A. (France)1 | | | 493,513 | | | | 35,842,036 | | | |
| | | | | | | | | | |
| | | |
| | | | | | | 125,969,290 | | | |
| | | | | | | | | | |
Industrial Conglomerates - 1.0% | | | | | | | | | | |
Siemens AG (Germany)1 | | | 723,060 | | | | 73,219,221 | | | |
| | | | | | | | | | |
Machinery - 3.1% | | | | | | | | | | |
FANUC Corp. (Japan)1 | | | 1,255,100 | | | | 181,646,750 | | | |
Westport Innovations, Inc. - ADR (Canada)* | | | 1,081,790 | | | | 36,272,419 | | | |
| | | | | | | | | | |
| | | |
| | | | | | | 217,919,169 | | | |
| | | | | | | | | | |
Marine - 1.4% | | | | | | | | | | |
D/S Norden A/S (Denmark)1 | | | 594,660 | | | | 20,170,038 | | | |
Diana Shipping, Inc. - ADR (Greece) | | | 2,209,670 | | | | 22,185,087 | | | |
Mitsui OSK Lines Ltd. (Japan)*1 | | | 4,905,058 | | | | 19,061,722 | | | |
Nippon Yusen Kabushiki Kaisha (Japan)1 | | | 7,471,000 | | | | 19,767,308 | | | |
Pacific Basin Shipping Ltd. (Hong Kong)1 | | | 34,197,086 | | | | 19,331,163 | | | |
| | | | | | | | | | |
| | | |
| | | | | | | 100,515,318 | | | |
| | | | | | | | | | |
Professional Services - 1.2% | | | | | | | | | | |
Adecco S.A. (Switzerland)1 | | | 1,437,350 | | | | 81,859,885 | | | |
| | | | | | | | | | |
Trading Companies & Distributors - 1.6% | | | | | | | | | | |
Brenntag AG (Germany)1 | | | 725,820 | | | | 110,318,694 | | | |
| | | | | | | | | | |
The accompanying notes are an integral part of the financial statements.
5
World Opportunities Series
Investment Portfolio - June 30, 2013
(unaudited)
| | | | | | | | | | |
| | | SHARES | | | VALUE (NOTE 2) | | | |
| | | |
COMMON STOCKS (continued) | | | | | | | | | | |
| | | |
Industrials (continued) | | | | | | | | | | |
Transportation Infrastructure - 0.5% | | | | | | | | | | |
Groupe Eurotunnel S.A. (France)1 | | | 4,854,990 | | | $ | 36,917,002 | | | |
| | | | | | | | | | |
| | | |
Total Industrials | | | | | | | 989,815,466 | | | |
| | | | | | | | | | |
| | | |
Information Technology - 7.7% | | | | | | | | | | |
Internet Software & Services - 1.1% | | | | | | | | | | |
Tencent Holdings Ltd. (China)1 | | | 2,048,059 | | | | 79,971,048 | | | |
| | | | | | | | | | |
IT Services - 4.6% | | | | | | | | | | |
Amdocs Ltd. - ADR (United States) | | | 6,136,970 | | | | 227,620,217 | | | |
Cap Gemini S.A. (France)1 | | | 1,127,660 | | | | 54,760,921 | | | |
Wirecard AG (Germany)1 | | | 1,508,100 | | | | 41,035,109 | | | |
| | | | | | | | | | |
| | | | | | | 323,416,247 | | | |
| | | | | | | | | | |
Semiconductors & Semiconductor Equipment - 2.0% | | | | | | | | | | |
Tokyo Electron Ltd. (Japan)1 | | | 2,792,898 | | | | 141,207,564 | | | |
| | | | | | | | | | |
| | | |
Total Information Technology | | | | | | | 544,594,859 | | | |
| | | | | | | | | | |
| | | |
Materials - 9.4% | | | | | | | | | | |
Chemicals - 3.3% | | | | | | | | | | |
Johnson Matthey plc (United Kingdom)1 | | | 1,920,290 | | | | 76,725,552 | | | |
Syngenta AG (Switzerland)1 | | | 267,510 | | | | 104,317,882 | | | |
Umicore S.A. (Belgium)1 | | | 1,291,790 | | | | 53,641,066 | | | |
| | | | | | | | | | |
| | | |
| | | | | | | 234,684,500 | | | |
| | | | | | | | | | |
Construction Materials - 4.2% | | | | | | | | | | |
CRH plc (Ireland)1 | | | 9,341,880 | | | | 189,559,056 | | | |
Holcim Ltd. (Switzerland)1 | | | 1,461,770 | | | | 101,748,408 | | | |
| | | | | | | | | | |
| | | |
| | | | | | | 291,307,464 | | | |
| | | | | | | | | | |
Metals & Mining - 1.9% | | | | | | | | | | |
Alumina Ltd. (Australia)*1 | | | 60,863,360 | | | | 54,166,887 | | | |
Norsk Hydro ASA (Norway)1 | | | 19,701,536 | | | | 79,001,916 | | | |
| | | | | | | | | | |
| | | |
| | | | | | | 133,168,803 | | | |
| | | | | | | | | | |
| | | |
Total Materials | | | | | | | 659,160,767 | | | |
| | | | | | | | | | |
| | | |
Telecommunication Services - 3.7% | | | | | | | | | | |
Diversified Telecommunication Services - 3.7% | | | | | | | | | | |
Telenor ASA (Norway)1 | | | 6,102,440 | | | | 121,212,851 | | | |
Vivendi S.A. (France)1 | | | 5,266,730 | | | | 99,812,520 | | | |
Ziggo N.V. (Netherlands)1 | | | 960,873 | | | | 38,595,373 | | | |
| | | | | | | | | | |
| | | |
Total Telecommunication Services | | | | | | | 259,620,744 | | | |
| | | | | | | | | | |
| | | |
TOTAL COMMON STOCKS | | | | | | | | | | |
(Identified Cost $6,685,200,396) | | | | | | | 6,850,951,339 | | | |
| | | | | | | | | | |
The accompanying notes are an integral part of the financial statements.
6
World Opportunities Series
Investment Portfolio - June 30, 2013
(unaudited)
| | | | | | | | | | |
| | | SHARES | | | VALUE (NOTE 2) | | | |
| | | |
SHORT-TERM INVESTMENT - 2.4% | | | | | | | | | | |
| | | |
Dreyfus Cash Management, Inc. - Institutional Shares2, 0.05%, | | | | | | | | | | |
(Identified Cost $ 169,695,907) | | | 169,695,907 | | | $ | 169,695,907 | | | |
| | | | | | | | | | |
| | | |
TOTAL INVESTMENTS - 99.8% | | | | | | | | | | |
(Identified Cost $ 6,854,896,303) | | | | | | | 7,020,647,246 | | | |
OTHER ASSETS, LESS LIABILITIES - 0.2% | | | | | | | 12,330,633 | | | |
| | | | | | | | | | |
| | | |
NET ASSETS - 100% | | | | | | $ | 7,032,977,879 | | | |
| | | | | | | | | | |
ADR - American Depository Receipt
*Non-income producing security.
1A factor from a third party vendor was applied to determine the security’s fair value following the close of local trading.
2Rate shown is the current yield as of June 30, 2013.
The Series’ portfolio holds, as a percentage of net assets, greater than 10% in the following countries: United Kingdom - 16.7%; France - 13.9%.
The accompanying notes are an integral part of the financial statements.
7
World Opportunities Series
Statement of Assets and Liabilities
June 30, 2013 (unaudited)
| | | | |
ASSETS: | | | | |
| |
Investments, at value (identified cost $6,854,896,303) (Note 2) | | $ | 7,020,647,246 | |
Foreign currency (identified cost $5,296,043) | | | 5,288,290 | |
Cash | | | 45,635 | |
Dividends receivable | | | 17,291,541 | |
Receivable for fund shares sold | | | 16,103,404 | |
Foreign tax reclaims receivable | | | 15,266,115 | |
Prepaid expenses | | | 48,730 | |
| | | | |
| |
TOTAL ASSETS | | | 7,074,690,961 | |
| | | | |
| |
LIABILITIES: | | | | |
| |
Accrued management fees (Note 3) | | | 5,884,210 | |
Accrued transfer agent fees (Note 3) | | | 328,081 | |
Accrued fund accounting and administration fees (Note 3) | | | 173,857 | |
Accrued Chief Compliance Officer service fees (Note 3) | | | 339 | |
Payable for securities purchased | | | 29,929,335 | |
Payable for fund shares repurchased | | | 4,622,031 | |
Other payables and accrued expenses | | | 775,229 | |
| | | | |
| |
TOTAL LIABILITIES | | | 41,713,082 | |
| | | | |
| |
TOTAL NET ASSETS | | $ | 7,032,977,879 | |
| | | | |
| |
NET ASSETS CONSIST OF: | | | | |
| |
Capital stock | | $ | 8,743,688 | |
Additional paid-in-capital | | | 7,017,170,732 | |
Undistributed net investment income | | | 70,939,913 | |
Accumulated net realized loss on investments, foreign currency and translation of other assets and liabilities | | | (229,434,710 | ) |
Net unrealized appreciation on investments, foreign currency and translation of other assets and liabilities | | | 165,558,256 | |
| | | | |
| |
TOTAL NET ASSETS | | $ | 7,032,977,879 | |
| | | | |
| |
NET ASSET VALUE, OFFERING PRICE AND REDEMPTION PRICE PER SHARE - Class A ($7,032,977,879/874,368,794 shares) | | $ | 8.04 | |
| | | | |
The accompanying notes are an integral part of the financial statements.
8
World Opportunities Series
Statement of Operations
For the Six Months Ended June 30, 2013 (unaudited)
| | | | |
INVESTMENT INCOME: | | | | |
| |
Dividends (net of foreign taxes withheld, $13,780,216) | | $ | 116,362,663 | |
| | | | |
| |
EXPENSES: | | | | |
| |
Management fees (Note 3) | | | 36,035,098 | |
Transfer agent fees (Note 3) | | | 584,053 | |
Fund accounting and administration fees (Note 3) | | | 435,874 | |
Directors’ fees (Note 3) | | | 77,012 | |
Chief Compliance Officer service fees (Note 3) | | | 1,117 | |
Custodian fees | | | 645,087 | |
Miscellaneous | | | 592,611 | |
| | | | |
| |
Total Expenses | | | 38,370,852 | |
| | | | |
| |
NET INVESTMENT INCOME | | | 77,991,811 | |
| | | | |
| |
REALIZED AND UNREALIZED GAIN (LOSS) ON INVESTMENTS AND FOREIGN CURRENCY: | | | | |
| |
Net realized gain (loss) on-
Investments | | | 269,774,587 | |
Foreign currency and translation of other assets and liabilities | | | (23,160,549 | ) |
| | | | |
| |
| | | 246,614,038 | |
| | | | |
Net change in unrealized appreciation (depreciation) on-
Investments | | | (50,118,502 | ) |
Foreign currency and translation of other assets and liabilities | | | (541,795 | ) |
| | | | |
| |
| | | (50,660,297 | ) |
| | | | |
| |
NET REALIZED AND UNREALIZED GAIN (LOSS) ON INVESTMENTS AND FOREIGN CURRENCY | | | 195,953,741 | |
| | | | |
| |
NET INCREASE IN NET ASSETS RESULTING FROM OPERATIONS | | $ | 273,945,552 | |
| | | | |
The accompanying notes are an integral part of the financial statements.
9
World Opportunities Series
Statements of Changes in Net Assets
| | | | | | | | |
| | | FOR THE SIX
MONTHS ENDED
6/30/13
(UNAUDITED) | | | FOR THE YEAR ENDED
12/31/12 | |
INCREASE (DECREASE) IN NET ASSETS: | | | | | | | | |
| | |
OPERATIONS: | | | | | | | | |
| | |
Net investment income | | $ | 77,991,811 | | | $ | 106,386,291 | |
Net realized gain (loss) on investments and foreign currency | | | 246,614,038 | | | | (348,977,392 | ) |
Net change in unrealized appreciation (depreciation) on investments and foreign currency | | | (50,660,297 | ) | | | 1,366,512,686 | |
| | | | | | | | |
| | |
Net increase from operations | | | 273,945,552 | | | | 1,123,921,585 | |
| | | | | | | | |
| | |
DISTRIBUTIONS TO SHAREHOLDERS (Note 9): | | | | | | | | |
| | |
From net investment income | | | — | | | | (112,268,392 | ) |
| | | | | | | | |
| | |
CAPITAL STOCK ISSUED AND REPURCHASED: | | | | | | | | |
| | |
Net decrease from capital share transactions (Note 5) | | | (166,745,590 | ) | | | (52,904,127 | ) |
| | | | | | | | |
| | |
Net increase in net assets | | | 107,199,962 | | | | 958,749,066 | |
| | |
NET ASSETS: | | | | | | | | |
| | |
Beginning of period | | | 6,925,777,917 | | | | 5,967,028,851 | |
| | | | | | | | |
| | |
End of period (including undistributed net investment income of $70,939,913 and distribution in excess of net investment income $7,051,898, respectively) | | $ | 7,032,977,879 | | | $ | 6,925,777,917 | |
| | | | | | | | |
The accompanying notes are an integral part of the financial statements.
10
World Opportunities Series
Financial Highlights
| | | | | | | | | | | | | | | | | | | | | | | | |
| | | FOR THE SIX
MONTHS ENDED
6/30/2013
(UNAUDITED) | | | FOR THE YEARS ENDED | |
| | | 12/31/12 | | | 12/31/11 | | | 12/31/10 | | | 12/31/09 | | | 12/31/08 | |
Per share data (for a share outstanding throughout each period): | | | | | | | | | | | | | | | | | | | | | | | | |
Net asset value - Beginning of period | | $ | 7.75 | | | $ | 6.63 | | | $ | 8.61 | | | $ | 8.12 | | | $ | 5.88 | | | $ | 10.07 | |
| | | | | | | | | | | | | | | | | | | | | | | | |
Income (loss) from investment operations: | | | | | | | | | | | | | | | | | | | | | | | | |
Net investment income | | | 0.09 | 1 | | | 0.12 | 1 | | | 0.24 | 1,2 | | | 0.07 | 1 | | | 0.04 | 1 | | | 0.10 | |
Net realized and unrealized gain (loss) on investments | | | 0.20 | | | | 1.13 | | | | (1.64 | ) | | | 0.67 | | | | 2.26 | | | | (4.08 | ) |
| | | | | | | | | | | | | | | | | | | | | | | | |
Total from investment operations | | | 0.29 | | | | 1.25 | | | | (1.40 | ) | | | 0.74 | | | | 2.30 | | | | (3.98 | ) |
| | | | | | | | | | | | | | | | | | | | | | | | |
Less distributions to shareholders: | | | | | | | | | | | | | | | | | | | | | | | | |
From net investment income | | | — | | | | (0.13 | ) | | | (0.24 | ) | | | (0.07 | ) | | | (0.06 | ) | | | (0.03 | ) |
From net realized gain on investments | | | — | | | | — | | | | (0.34 | ) | | | (0.18 | ) | | | — | | | | (0.18 | ) |
| | | | | | | | | | | | | | | | | | | | | | | | |
Total distributions to shareholders | | | — | | | | (0.13 | ) | | | (0.58 | ) | | | (0.25 | ) | | | (0.06 | ) | | | (0.21 | ) |
| | | | | | | | | | | | | | | | | | | | | | | | |
Net asset value - End of period | | $ | 8.04 | | | $ | 7.75 | | | $ | 6.63 | | | $ | 8.61 | | | $ | 8.12 | | | $ | 5.88 | |
| | | | | | | | | | | | | | | | | | | | | | | | |
| | | | | | |
Net assets - End of period (000’s omitted) | | $ | 7,032,978 | | | $ | 6,925,778 | | | $ | 5,967,029 | | | $ | 6,455,426 | | | $ | 4,917,459 | | | $ | 1,340,057 | |
| | | | | | | | | | | | | | | | | | | | | | | | |
| | | | | | |
Total return3 | | | 3.74 | % | | | 18.81 | % | | | (16.14 | %) | | | 9.23 | % | | | 39.12 | % | | | (40.07 | %) |
Ratios (to average net assets)/ | | | | | | | | | | | | | | | | | | | | | | | | |
Supplemental Data: | | | | | | | | | | | | | | | | | | | | | | | | |
Expenses* | | | 1.06 | %4 | | | 1.08 | % | | | 1.09 | % | | | 1.11 | % | | | 1.17 | % | | | 1.16 | % |
Net investment income | | | 2.16 | %4 | | | 1.64 | % | | | 2.84 | %2 | | | 0.92 | % | | | 0.60 | % | | | 2.17 | % |
Portfolio turnover | | | 25 | % | | | 45 | % | | | 52 | % | | | 39 | % | | | 42 | % | | | 34 | % |
|
| * For certain periods presented, the investment advisor did not impose all or a portion of its management and/or other fees, and in some periods may have paid a portion of the Series’ expenses. If these expenses had been incurred by the Series, the expense ratio (to average net assets) would have increased by the following amounts: | |
| | | | | | |
| | | N/A | | | | N/A | | | | N/A | | | | 0.00 | %5 | | | 0.00 | %5 | | | N/A | |
1Calculated based on average shares outstanding during the periods.
2Includes a special dividend paid by one of the Series’ securities during the year. Without the special dividend, the Series’ net investment income per share, total return and net investment income ratio would have been $0.11, (17.71%) and 1.30%, respectively.
3Represents aggregate total return for the periods indicated, and assumes reinvestment of all distributions. Total return would have been lower had certain expenses not been waived or reimbursed during certain periods. Periods less than one year are not annualized.
4Annualized.
5Less than 0.01%.
The accompanying notes are an integral part of the financial statements.
11
World Opportunities Series
Notes to Financial Statements
(unaudited)
World Opportunities Series (the “Series”) is a no-load diversified series of Manning & Napier Fund, Inc. (the “Fund”). The Fund is organized in Maryland and is registered under the Investment Company Act of 1940 (the “1940 Act”), as amended, as an open-end management investment company.
The Series’ investment objective is to provide long-term growth by investing principally in the common stocks of companies located around the world.
The Series is authorized to issue five classes of shares (Class A, B, D, E and Z). Currently, only Class A shares have been issued. Each class of shares is substantially the same, except that class-specific distribution and shareholder servicing expenses are borne by the specific class of shares to which they relate.
The Fund’s advisor is Manning & Napier Advisors, LLC (the “Advisor”). Shares of the Series are offered to investors, clients and employees of the Advisor and its affiliates. The total authorized capital stock of the Fund consists of 15 billion shares of common stock each having a par value of $0.01. As of June 30, 2013, 10.3 billion shares have been designated in total among 42 series, of which 2.5 billion have been designated as World Opportunities Series Class A common stock.
| 2. | Significant Accounting Policies |
Security Valuation
Portfolio securities, including domestic equities, foreign equities, warrants and options, listed on an exchange other than the NASDAQ Stock Market are valued at the latest quoted sales price of the exchange on which the security is primarily traded. Securities not traded on valuation date or securities not listed on an exchange are valued at the latest quoted bid price provided by the Fund’s pricing service. Securities listed on the NASDAQ Stock Market are valued in accordance with the NASDAQ Official Closing Price.
Short-term investments that mature in sixty days or less are valued at amortized cost, which approximates fair value. Investments in open-end investment companies are valued at their net asset value per share on valuation date.
Volume and level of activity in established markets for an asset or liability are evaluated to determine whether recent transactions and quoted prices are determinative of fair value. Where there have been significant decreases in volume and level of activity, further analysis and adjustment may be necessary to estimate fair value. The Series measures fair value in these instances by the use of inputs and valuation techniques which may be based upon current market prices of securities that are comparable in coupon, rating, maturity and industry and/or expectation of future cash flows. As a result of trading in relatively thin markets and/or markets that experience significant volatility, the prices used by the Series to value these securities may differ from the value that would be realized if these securities were sold, and the differences could be material.
Securities for which representative valuations or prices are not available from the Series’ pricing service may be valued at fair value as determined in good faith by the Advisor under procedures approved by and under the general supervision and responsibility of the Fund’s Board of Directors (the “Board”). Due to the inherent uncertainty of valuations of such securities, the fair value may differ significantly from the values that would have been used had a ready market for such securities existed. If trading or events occurring after the close of the principal market in which securities are traded are expected to materially affect the value of those securities, then they may be valued at their fair value, taking this trading or these events into account. In accordance with the procedures approved by the Board, the values of certain securities trading outside the U.S. were adjusted following the close of local trading using a factor from a third party vendor. The third party vendor uses statistical analyses and quantitative models, which consider among other things subsequent movement and changes in the prices of indices, securities and exchange rates in other markets, to determine the factors which are used to adjust local market prices. The value of securities used for net asset value calculation under these procedures may differ from published prices for the same securities. It is the Fund’s policy to classify each foreign equity security where a factor from a third party vendor is provided as a Level 2 security.
12
World Opportunities Series
Notes to Financial Statements (continued)
(unaudited)
| 2. | Significant Accounting Policies (continued) |
Security Valuation (continued)
Various inputs are used in determining the value of the Series’ assets or liabilities carried at fair value. These inputs are summarized in three broad levels. Level 1 includes quoted prices in active markets for identical assets and liabilities. Level 2 includes other significant observable inputs (including quoted prices for similar securities, interest rates, prepayment speeds, credit risk, etc.). Level 3 includes significant unobservable inputs (including the Series’ own assumptions in determining the fair value of investments). A financial instrument’s level within the fair value hierarchy is based on the lowest level of any input both individually and in aggregate that is significant to the fair value measurement. The inputs or methodology used for valuing securities are not necessarily an indication of the risk associated with investing in those securities.
The following is a summary of the valuation levels used for major security types as of June 30, 2013 in valuing the Series’ assets or liabilities carried at fair value:
| | | | | | | | | | | | | | | | |
| DESCRIPTION | | TOTAL | | | LEVEL 1 | | | LEVEL 2 | | | LEVEL 3 | |
Assets: | | | | | | | | | | | | | | | | |
Equity securities: | | | | | | | | | | | | | | | | |
Consumer Discretionary | | $ | 973,692,096 | | | $ | 58,886,854 | | | $ | 914,805,242 | | | $ | — | |
Consumer Staples | | | 1,375,033,481 | | | | 197,576,172 | | | | 1,177,457,309 | | | | — | |
Energy | | | 1,198,733,966 | | | | 1,017,004,795 | | | | 181,729,171 | | | | — | |
Financials | | | 274,402,340 | | | | — | | | | 274,402,340 | | | | — | |
Health Care | | | 575,897,620 | | | | 73,739,087 | | | | 502,158,533 | | | | — | |
Industrials | | | 989,815,466 | | | | 266,243,471 | | | | 723,571,995 | | | | — | |
Information Technology | | | 544,594,859 | | | | 227,620,217 | | | | 316,974,642 | | | | — | |
Materials | | | 659,160,767 | | | | — | | | | 659,160,767 | | | | — | |
Telecommunication Services | | | 259,620,744 | | | | — | | | | 259,620,744 | | | | — | |
Mutual fund | | | 169,695,907 | | | | 169,695,907 | | | | — | | | | — | |
| | | | | | | | | | | | | | | | |
Total assets | | $ | 7,020,647,246 | | | $ | 2,010,766,503 | | | $ | 5,009,880,743 | | | $ | — | |
| | | | | | | | | | | | | | | | |
Please see the Investment Portfolio for foreign securities where a factor from a third party vendor was applied to determine the securities’ fair value following the close of local trading. Such securities are included in Level 2 in the table above.
There were no Level 3 securities held by the Series as of December 31, 2012 or June 30, 2013.
The Fund’s policy is to recognize transfers in and transfers out of the valuation levels as of the beginning of the reporting period. There were no transfers between Level 1 and Level 2 during the six months ended June 30, 2013.
Security Transactions, Investment Income and Expenses
Security transactions are accounted for on trade date. Dividend income is recorded on the ex-dividend date, except that if the ex-dividend date has passed, certain dividends from foreign securities are recorded as soon as the Series is informed of the ex-dividend date. Non-cash dividends, if any, are recorded at the fair value of the securities received. Interest income, including amortization of premium and accretion of discounts using the effective interest method, is earned from settlement date and accrued daily.
Expenses are recorded on an accrual basis. Most expenses of the Fund can be attributed to a specific series. Expenses which cannot be directly attributed are apportioned among the series in the Fund in such a manner as deemed equitable by the Fund’s Board, taking into consideration, among other things, the nature and type of expense.
The Series uses the identified cost method for determining realized gain or loss on investments for both financial statement and federal income tax reporting purposes.
Foreign Currency Translation
The books and records of the Series are maintained in U.S. dollars. Foreign currencies, investments and other assets and liabilities are translated into U.S. dollars at the current exchange rates. Purchases and sales of investment securities and
13
World Opportunities Series
Notes to Financial Statements (continued)
(unaudited)
| 2. | Significant Accounting Policies (continued) |
Foreign Currency Translation (continued)
income and expenses are translated on the respective dates of such transactions. The Series does not isolate realized and unrealized gains and losses attributable to changes in the exchange rates from gains and losses that arise from changes in the fair market value of investments. Such fluctuations are included with net realized and unrealized gain or loss on investments. Net realized foreign currency gains and losses represent foreign currency gains and losses between trade date and settlement date on securities transactions, gains and losses on disposition of foreign currencies and the difference between the amount of income and foreign withholding taxes recorded on the books of the Series and the amounts actually received or paid.
Forward Foreign Currency Exchange Contracts
The Series may purchase or sell forward foreign currency exchange contracts in order to hedge a portfolio position or specific transaction. Risks may arise if the counterparties to a contract are unable to meet the terms of the contract or if the value of the foreign currency moves unfavorably.
All forward foreign currency exchange contracts are adjusted daily by the exchange rate of the underlying currency and, for financial statement purposes, any gain or loss is recorded as unrealized gain or loss until a contract has been closed.
The Series may regularly trade forward foreign currency exchange contracts with off-balance sheet risk in the normal course of its investing activities to assist in managing exposure to changes in foreign currency exchange rates.
The notional or contractual amount of these instruments represents the investment the Series has in forward foreign currency exchange contracts and does not necessarily represent the amounts potentially at risk. The measurement of the risks associated with forward foreign currency exchange contracts is meaningful only when all related and offsetting transactions are considered. During the period of March 27, 2013 through April 24, 2013, the period for which foreign currency contracts were held, the average volume of derivative activity (measured in terms of the notional amount) was approximately $1,236,752,017.
The following table presents the effect of the derivative instruments on the Statement of Operations at June 30, 2013:
| | | | |
| STATEMENT OF OPERATIONS |
Derivative | | | | |
Foreign forward currency exchange contracts | | Net realized gain (loss) on foreign currency transactions and translation of other assets and liabilities | | $(21,675,107) |
As of June 30, 2013, no investments in forward foreign currency exchange contracts were held by the Series.
Affiliated Companies
The 1940 Act defines “affiliated companies” to include securities in which a series owns 5% or more of the outstanding voting securities of the issuer. The following transactions were effected in securities of affiliated companies for the six months ended June 30, 2013:
| | | | | | | | | | | | | | | | | | | | | | | | | | |
| NAME OF ISSUER | | VALUE AT
12/31/12 | | | PURCHASE
COST | | SALES
PROCEEDS | | | VALUE AT
6/30/13 | | | SHARES
HELD AT
6/30/13 | | | DIVIDEND
INCOME
1/1/13
THROUGH
6/30/13 | | | NET
REALIZED
GAIN (LOSS)
1/1/13
THROUGH
6/30/13 | |
Societe Television | | | | | | | | | | | | | | | | | | | | | | | | | | |
Francaise 1 (France)* | | $ | 125,993,897 | | | $ — | | $ | 37,614,345 | | | $ | 87,784,306 | | | | 7,329,610 | | | $ | 6,447,289 | | | $ | (258,902 | ) |
* Security was an affiliated company for the period January 1, 2013 - February 21, 2013. Amounts in the table include the six months ended June 30, 2013.
Federal Taxes
The Series’ policy is to comply with the provisions of the Internal Revenue Code applicable to regulated investment companies. The Series is not subject to federal income tax or excise tax to the extent that the Series distributes to shareholders each year
14
World Opportunities Series
Notes to Financial Statements (continued)
(unaudited)
| 2. | Significant Accounting Policies (continued) |
Federal Taxes (continued)
its taxable income, including any net realized gains on investments, in accordance with requirements of the Internal Revenue Code. Accordingly, no provision for federal income tax or excise tax has been made in the financial statements.
Management evaluates its tax positions to determine if the tax positions taken meet the minimum recognition threshold in connection with accounting for uncertainties in income tax positions taken or expected to be taken for the purposes of measuring and recognizing tax liabilities in the financial statements. Recognition of tax benefits of an uncertain tax position is required only when the position is “more likely than not” to be sustained assuming examination by taxing authorities. At June 30, 2013, the Series has recorded no liability for net unrecognized tax benefits relating to uncertain income tax positions taken or expected to be taken in future tax returns.
The Series files income tax returns in the U.S. federal jurisdiction, various states and foreign jurisdictions, as required. No income tax returns are currently under investigation. The statute of limitations on the Series’ tax returns remains open for the years ended December 31, 2009 through December 31, 2012. The Series is not aware of any tax positions for which it is reasonably possible that the total amounts of unrecognized tax benefits will significantly change in the next twelve months.
Foreign Taxes
Based on the Series’ understanding of the tax rules and rates related to income, gains and currency purchase/repatriation transactions for foreign jurisdictions in which it invests, the Series will provide for foreign taxes, and where appropriate, deferred foreign tax.
Distributions of Income and Gains
Distributions to shareholders of net investment income and net realized gains are made annually. An additional distribution may be necessary to avoid taxation of the Series. Distributions are recorded on the ex-dividend date.
Indemnifications
The Fund’s organizational documents provide former and current directors and officers with a limited indemnification against liabilities arising in connection with the performance of their duties to the Fund. In the normal course of business, the Fund may also enter into contracts that provide general indemnifications. The Fund’s maximum exposure under these arrangements is unknown as this would be dependent on future claims that may be made against the Fund. The risk of material loss from such claims is considered remote.
Other
The preparation of financial statements in conformity with accounting principles generally accepted in the United States of America requires management to make estimates and assumptions that affect the reported amounts of assets and liabilities and the disclosure of contingent assets and liabilities at the date of the financial statements and the reported amounts of income and expenses during the reporting period. Actual results could differ from those estimates.
| 3. | Transactions with Affiliates |
The Fund has an Investment Advisory Agreement (the “Agreement”) with the Advisor, for which the Series pays a fee, computed daily and payable monthly, at an annual rate of 1.00% of the Series’ average daily net assets.
Under the Agreement, personnel of the Advisor provide the Series with advice and assistance in the choice of investments and the execution of securities transactions, and otherwise maintain the Series’ organization. The Advisor also provides the Fund with necessary office space and fund administration and support services. The salaries of all officers of the Fund (except a percentage of the Fund’s Chief Compliance Officer’s salary, which is paid by the Fund), and of all Directors who are “affiliated persons” of the Fund, or of the Advisor, and all personnel of the Fund, or of the Advisor, performing services relating to research, statistical and investment activities, are paid by the Advisor. Each “non-affiliated” Director receives an annual stipend, which is allocated among all the active series of the Fund. In addition, these Directors also receive a fee per Board meeting attended plus a fee for each committee meeting attended.
15
World Opportunities Series
Notes to Financial Statements (continued)
(unaudited)
| 3. | Transactions with Affiliates (continued) |
Manning & Napier Investor Services, Inc., a registered broker-dealer affiliate of the Advisor, acts as distributor for the Fund’s shares. The services of Manning & Napier Investor Services, Inc. are provided at no additional cost to the Series.
The Advisor has agreements with BNY Mellon Investment Servicing (U.S.) Inc. (“BNY”) under which BNY serves as sub-accountant services agent and sub-transfer agent. The Fund pays the Advisor an annual fee related to fund accounting and administration of 0.0175% on the first $3 billion of average daily net assets (excluding Target Series and Strategic Income Series); 0.015% on the next $3 billion of average daily net assets (excluding Target Series and Strategic Income Series); and 0.01% of the average daily net assets in excess of $6 billion (excluding Target Series and Strategic Income Series); plus a base fee of $25,500 per series. Transfer Agent fees are charged to the Fund on a per account basis. Additionally, certain transaction and cusip-based fees and out-of-pocket expenses, including charges for reporting relating to the Fund’s compliance program, are charged. Effective October 1, 2012, the aforementioned agreements were modified to reduce the annual fee related to fund accounting and administration, as well as transfer agent fees, by 10%, excluding out-of-pocket expenses.
Expenses not directly attributable to a series are allocated based on each series’ relative net assets or number of accounts, depending on the expense.
| 4. | Purchases and Sales of Securities |
For the six months ended June 30, 2013, purchases and sales of securities, other than U.S. Government securities and short-term securities, were $1,736,445,828 and $1,867,260,469 respectively. There were no purchases or sales of U.S. Government securities.
| 5. | Capital Stock Transactions |
Transactions in Class A shares of World Opportunities Series were:
| | | | | | | | | | | | | | | | |
| | | FOR THE SIX MONTHS ENDED 6/30/13 | | | FOR THE YEAR ENDED 12/31/12 | |
| | SHARES | | | AMOUNT | | | SHARES | | | AMOUNT | |
Sold | | | 129,097,927 | | | $ | 1,050,961,846 | | | | 251,477,784 | | | $ | 1,826,327,603 | |
Reinvested | | | — | | | | — | | | | 12,218,471 | | | | 93,720,261 | |
Repurchased | | | (148,020,645 | ) | | | (1,217,707,436 | ) | | | (270,735,953 | ) | | | (1,972,951,991 | ) |
| | | | | | | | | | | | | | | | |
Total | | | (18,922,718 | ) | | $ | (166,745,590 | ) | | | (7,039,698 | ) | | $ | (52,904,127 | ) |
| | | | | | | | | | | | | | | | |
Approximately 2% of the Series’ shares represent investments by fiduciary accounts over which the Advisor has sole investment discretion. In addition, one shareholder owned 134,830,977 shares (15.42% of shares outstanding) valued at $1,084,041,058. Investment activities of this shareholder may have a material effect on the Series.
The Series has entered into a $50 million credit facility (the “line of credit”) with Bank of New York Mellon. The Series may borrow under the line of credit for temporary or emergency purposes, including funding shareholder redemptions and other short-term liquidity purposes. The Series pays an annual commitment fee on the unused portion of the line of credit which amounted to $34,923 for the six months ended June 30, 2013, which is included in miscellaneous expenses in the Statement of Operations. Interest on the used portion is charged to the Series based on rates determined pursuant to the terms of the agreement at the time of borrowing. During the six months ended June 30, 2013, the Series did not borrow under the line of credit. The line of credit has a termination date of June 6, 2014 and may be renewed annually.
The Series may trade in instruments including written and purchased options, forward foreign currency exchange contracts and futures contracts and other derivatives in the normal course of investing activities to assist in managing exposure to various
16
World Opportunities Series
Notes to Financial Statements (continued)
(unaudited)
| 7. | Financial Instruments (continued) |
market risks. The Series may be subject to various elements of risk, which may involve, to a varying degree, elements of risk in excess of the amounts recognized for financial statement purposes. These risks include: the risk that changes in the value of a derivative may not correlate perfectly with the underlying asset, rate or index; counterparty credit risk related to over the counter derivative counterparties’ failure to perform under contract terms; liquidity risk related to the lack of a liquid market for these contracts allowing the fund to close out its position(s); and documentation risk relating to disagreement over contract terms. No such investments were held by the Series on June 30, 2013.
Investing in securities of foreign companies and foreign governments involves special risks and considerations not typically associated with investing in securities of domestic companies and the U.S. Government. These risks include revaluation of currencies and future adverse political and economic developments. Moreover, securities of foreign companies and foreign governments and their markets may be less liquid and their prices more volatile than those of comparable domestic companies and the U.S. Government.
| 9. | Federal Income Tax Information |
The amount and characterization of certain income and capital gains to be distributed are determined in accordance with federal income tax regulations, which may differ from accounting principles generally accepted in the United States of America. The Series may periodically make reclassifications among its capital accounts to reflect income and gains available for distribution (or available capital loss carryovers) under income tax regulations, without impacting the Series’ net asset value. Any such reclassifications are not reflected in the financial highlights.
The final determination of the tax character of current year distributions will be made at the conclusion of the fiscal year. The tax character of distributions paid for the year ended December 31, 2012 was as follows:
Ordinary income $112,268,392
Under the Regulated Investment Company Modernization Act of 2010 (the “Act”), net capital losses recognized by the Series after December 31, 2010, may get carried forward indefinitely, and will retain their character as short-term and/or long-term losses. Prior to the Act, net capital losses incurred by the Series were carried forward for eight years and treated as short-term losses. The Act requires that post-enactment net capital losses be used before pre-enactment net capital losses.
As of December 31, 2012, the Series had no pre-enactment net capital losses and had post-enactment net short-term capital loss carryforwards of $175,264,492 and net long-term capital loss carryforwards of $232,315,543 respectively.
At June 30, 2013, the identified cost for federal income tax purposes, the resulting gross unrealized appreciation and depreciation, and the net unrealized appreciation were as follows:
| | | | |
Cost for federal income tax purposes | | $ | 6,863,479,870 | |
Unrealized appreciation | | | 625,576,423 | |
Unrealized depreciation | | | (468,409,047 | ) |
| | | | |
Net unrealized appreciation | | $ | 157,167,376 | |
| | | | |
17
World Opportunities Series
Literature Requests
(unaudited)
Proxy Voting Policies and Procedures
A description of the policies and procedures that the Fund uses to determine how to vote proxies relating to portfolio securities is available, without charge, upon request:
| | | | |
| By phone | | 1-800-466-3863 | | |
| On the Securities and Exchange Commission’s (SEC) web site | | http://www.sec.gov | | |
Proxy Voting Record
Information regarding how the Fund voted proxies relating to portfolio securities during the most recent 12-month period ended June 30th is available, without charge, upon request:
| | | | |
| By phone | | 1-800-466-3863 | | |
| On the SEC’s web site | | http://www.sec.gov | | |
Quarterly Portfolio Holdings
The Series’ complete schedule of portfolio holdings for the 1st and 3rd quarters of each fiscal year are provided on Form N-Q, and are available, without charge, upon request:
| | | | |
| By phone | | 1-800-466-3863 | | |
| On the SEC’s web site | | http://www.sec.gov | | |
The Series’ Form N-Q may be reviewed and copied at the SEC’s Public Reference Room in Washington, D.C. Information on the operation of the Public Reference Room may be obtained by calling 1-800-SEC-0330.
Prospectus and Statement of Additional Information (SAI)
The prospectus and SAI provide additional information about each Series, including charges, expenses and risks. These documents are available, without charge, upon request:
| | | | |
| By phone | | 1-800-466-3863 | | |
| On the SEC’s web site | | http://www.sec.gov | | |
| On our web site | | http://www.manning-napier.com | | |
Additional information available at www.manning-napier.com
1. Fund Holdings - Month-End
2. Fund Holdings - Quarter-End
3. Shareholder Report - Annual
4. Shareholder Report - Semi-Annual
The Fund also offers electronic notification or “e-delivery” when certain documents are available on-line to be downloaded or reviewed. Direct shareholders can elect to receive electronic notification when shareholder reports, prospectus updates, and/or statements are available. If you do not currently have on-line access to your account, you can establish access by going to www.manning-napier.com, click on “Login” in the top corner of the page, and follow the prompts to self-enroll. Once enrolled, you can set your electronic notification preferences by clicking on the Account Options tab located within the green toolbar and then select E-Delivery Option. Should you have any questions on either how to establish on-line access or how to update your account settings, please contact Investor Services at 1-800-466-3863.
MNWOP-6/13-SAR
| | | | | | |
| | | | OHIO TAX EXEMPT SERIES | | |
www.manning-napier.com | | | | |
Ohio Tax Exempt Series
Shareholder Expense Example
(unaudited)
As a shareholder of the Series, you may incur two types of costs: (1) transaction costs and (2) ongoing costs, including management fees and other Series expenses. This example is intended to help you understand your ongoing costs (in dollars) of investing in the Series and to compare these costs with the ongoing costs of investing in other mutual funds.
The example is based on an investment of $1,000 invested at the beginning of the period and held for the entire period (January 1, 2013 to June 30, 2013).
Actual Expenses
The first line of the table below provides information about actual account values and actual expenses. You may use the information in this line, together with the amount you invested, to estimate the expenses that you paid over the period. Simply divide your account value by $1,000 (for example, an $8,600 account value divided by $1,000 = 8.6), then multiply the result by the number in the first line under the heading entitled “Expenses Paid During Period” to estimate the expenses you paid on your account during this period.
Hypothetical Example for Comparison Purposes
The second line of the table below provides information about hypothetical account values and hypothetical expenses based on the Series’ actual expense ratio and an assumed rate of return of 5% per year before expenses, which is not the Series’ actual return. The hypothetical account values and expenses may not be used to estimate the actual ending account balance or expenses you paid during the period. You may use this information to compare the ongoing costs of investing in the Series and other funds. To do so, compare this 5% hypothetical example with the 5% hypothetical examples that appear in the shareholder reports of the other funds.
Please note that the expenses shown in the table are meant to highlight your ongoing costs only and do not reflect any transaction costs. Therefore, the second line of the table is useful in comparing ongoing costs only, and will not help you determine the relative total costs of owning different funds. In addition, if these transaction costs were included, your costs would have been higher.
| | | | | | |
| | | BEGINNING
ACCOUNT VALUE
1/1/13 | | ENDING
ACCOUNT VALUE
6/30/13 | | EXPENSES PAID
DURING PERIOD*
1/1/13-6/30/13 |
Actual | | $1,000.00 | | $ 980.70 | | $3.83 |
Hypothetical (5% return before expenses) | | $1,000.00 | | $1,020.93 | | $3.91 |
*Expenses are equal to the Series’ annualized expense ratio (for the six-month period) of 0.78%, multiplied by the average account value over the period, multiplied by 181/365 to reflect the one-half year period. Expenses are based on the most recent fiscal half year.
1
Ohio Tax Exempt Series
Portfolio Composition as of June 30, 2013
(unaudited)
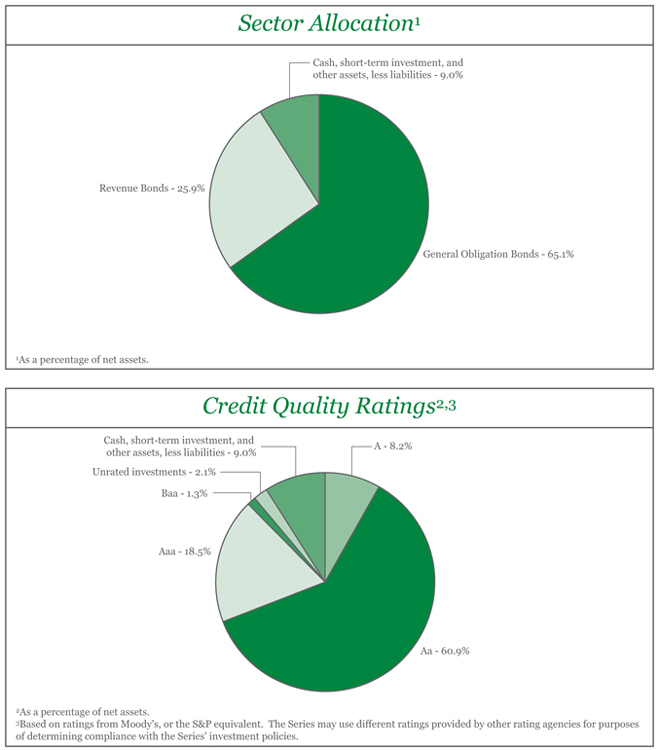
2
Ohio Tax Exempt Series
Investment Portfolio - June 30, 2013
(unaudited)
| | | | | | | | | | | | | | | | | | | | | | |
| | | COUPON
RATE | | | MATURITY
DATE | | | CREDIT
RATING1
(UNAUDITED) | | | PRINCIPAL
AMOUNT | | | VALUE
(NOTE 2) | | | |
| | | | | | |
OHIO MUNICIPAL SECURITIES - 91.0% | | | | | | | | | | | | | | | | | | | | | | |
| | | | | | |
Akron, Recreational Facilities Impt., Prerefunded Balance, G.O. Bond | | | 6.500% | | | | 11/1/2015 | | | | Aa3 | | | $ | 300,000 | | | $ | 341,568 | | | |
Akron, Various Purposes Impt., G.O. Bond | | | 4.250% | | | | 12/1/2028 | | | | AA2 | | | | 200,000 | | | | 200,474 | | | |
Allen East Local School District, Prerefunded Balance, G.O. Bond, AMBAC | | | 4.300% | | | | 12/1/2017 | | | | WR3 | | | | 285,000 | | | | 301,288 | | | |
American Municipal Power, Inc., Fremont Energy Center Project, Series B, Revenue Bond | | | 5.000% | | | | 2/15/2019 | | | | A1 | | | | 720,000 | | | | 826,207 | | | |
American Municipal Power, Inc., Prairie State Energy Campus Project, Series A, Revenue Bond, AGC | | | 4.375% | | | | 2/15/2020 | | | | A1 | | | | 100,000 | | | | 110,232 | | | |
Batavia Local School District, G.O. Bond, NATL | | | 5.625% | | | | 12/1/2022 | | | | A2 | | | | 200,000 | | | | 227,668 | | | |
Beaver Local School District, G.O. Bond | | | 4.000% | | | | 12/1/2029 | | | | Aa2 | | | | 230,000 | | | | 225,110 | | | |
Bedford Heights, Series A, G.O. Bond, AMBAC | | | 5.650% | | | | 12/1/2014 | | | | Aa3 | | | | 10,000 | | | | 10,426 | | | |
Brunswick, Limited Tax, Capital Impt., G.O. Bond | | | 4.000% | | | | 12/1/2025 | | | | Aa2 | | | | 100,000 | | | | 105,046 | | | |
Butler County, Water & Sewer, G.O. Bond | | | 2.500% | | | | 12/1/2014 | | | | Aa1 | | | | 100,000 | | | | 102,956 | | | |
Canal Winchester Local School District, G.O. Bond, AGM | | | 4.250% | | | | 12/1/2027 | | | | Aa3 | | | | 500,000 | | | | 504,865 | | | |
Canal Winchester Local School District, Prerefunded Balance, Series B, G.O. Bond, NATL | | | 5.000% | | | | 12/1/2025 | | | | Aa3 | | | | 1,355,000 | | | | 1,470,202 | | | |
Cincinnati City School District, Construction & Impt., Prerefunded Balance, G.O. Bond, AGM | | | 5.000% | | | | 12/1/2020 | | | | Aa2 | | | | 315,000 | | | | 321,325 | | | |
Cincinnati City School District, Construction & Impt., Prerefunded Balance, G.O. Bond, AGM | | | 5.000% | | | | 12/1/2024 | | | | Aa2 | | | | 500,000 | | | | 510,040 | | | |
Cincinnati City School District, Construction & Impt., Prerefunded Balance, G.O. Bond, AGM | | | 5.000% | | | | 12/1/2031 | | | | Aa2 | | | | 1,170,000 | | | | 1,193,494 | | | |
Cincinnati Water Systems, Series A, Revenue Bond | | | 5.000% | | | | 12/1/2014 | | | | Aaa | | | | 200,000 | | | | 213,400 | | | |
Cincinnati Water Systems, Series A, Revenue Bond | | | 5.000% | | | | 12/1/2018 | | | | Aaa | | | | 230,000 | | | | 270,006 | | | |
Cincinnati Water Systems, Series A, Revenue Bond | | | 4.250% | | | | 12/1/2019 | | | | Aaa | | | | 200,000 | | | | 227,992 | | | |
Cincinnati Water Systems, Series A, Revenue Bond | | | 5.000% | | | | 12/1/2036 | | | | Aaa | | | | 400,000 | | | | 428,656 | | | |
Cincinnati Water Systems, Water Utility Impt., Series A, Revenue Bond | | | 5.000% | | | | 12/1/2037 | | | | Aaa | | | | 400,000 | | | | 428,064 | | | |
Cincinnati, Various Purposes Impt., Series A, G.O. Bond | | | 2.000% | | | | 12/1/2014 | | | | Aa1 | | | | 250,000 | | | | 256,020 | | | |
Cincinnati, Various Purposes Impt., Series B, G.O. Bond | | | 1.500% | | | | 12/1/2014 | | | | Aa1 | | | | 360,000 | | | | 366,109 | | | |
Cincinnati, Various Purposes Impt., Series B, G.O. Bond | | | 4.250% | | | | 12/1/2026 | | | | Aa1 | | | | 170,000 | | | | 179,200 | | | |
Cleveland Department of Public Utilities Division of Water, Series A, Revenue Bond | | | 5.000% | | | | 1/1/2019 | | | | Aa2 | | | | 235,000 | | | | 273,462 | | | |
Cleveland Department of Public Utilities Division of Water, Series W, Revenue Bond | | | 4.000% | | | | 1/1/2014 | | | | Aa1 | | | | 500,000 | | | | 509,650 | | | |
Cleveland Department of Public Utilities Division of Water, Series W, Revenue Bond | | | 5.000% | | | | 1/1/2016 | | | | Aa1 | | | | 150,000 | | | | 165,495 | | | |
Columbus City School District, Facilities Construction & Impt., G.O. Bond, AGM | | | 4.250% | | | | 12/1/2032 | | | | Aa2 | | | | 500,000 | | | | 489,620 | | | |
Columbus City School District, Facilities Construction & Impt., Prerefunded Balance, G.O. Bond, AGM | | | 5.250% | | | | 12/1/2026 | | | | Aa2 | | | | 250,000 | | | | 267,590 | | | |
The accompanying notes are an integral part of the financial statements.
3
Ohio Tax Exempt Series
Investment Portfolio - June 30, 2013
(unaudited)
| | | | | | | | | | | | | | | | | | | | | | |
| | | COUPON
RATE | | | MATURITY
DATE | | | CREDIT
RATING1
(UNAUDITED) | | | PRINCIPAL
AMOUNT | | | VALUE
(NOTE 2) | | | |
| | | | | |
OHIO MUNICIPAL SECURITIES (continued) | | | | | | | | | | | | | | | | | | | |
| | | | | | |
Columbus City School District, Facilities Construction & Impt., Prerefunded Balance, G.O. Bond, AGM | | | 5.000% | | | | 12/1/2032 | | | | Aa2 | | | $ | 300,000 | | | $ | 320,040 | | | |
Columbus, Limited Tax, Public Impt., Prerefunded Balance, Series 2, G.O. Bond | | | 5.000% | | | | 7/1/2017 | | | | Aaa | | | | 250,000 | | | | 261,613 | | | |
Columbus, Limited Tax, Public Impt., Prerefunded Balance, Series 2, G.O. Bond | | | 5.000% | | | | 7/1/2019 | | | | Aaa | | | | 895,000 | | | | 936,573 | | | |
Columbus, Various Purposes Impt., Series B, G.O. Bond | | | 5.000% | | | | 9/1/2014 | | | | Aaa | | | | 400,000 | | | | 422,340 | | | |
Columbus, Various Purposes Impt., Series D, G.O. Bond | | | 5.000% | | | | 12/15/2013 | | | | Aaa | | | | 100,000 | | | | 102,224 | | | |
Cuyahoga County, Limited Tax, Various Purposes Impt., Series A, G.O. Bond | | | 4.000% | | | | 12/1/2018 | | | | Aa1 | | | | 400,000 | | | | 448,892 | | | |
Delaware County, Public Impt., Series A, G.O. Bond | | | 4.000% | | | | 12/1/2015 | | | | Aa1 | | | | 250,000 | | | | 270,473 | | | |
Delaware County, Series B, G.O. Bond | | | 4.000% | | | | 12/1/2015 | | | | Aa1 | | | | 200,000 | | | | 216,378 | | | |
Eaton Community City School District, G.O. Bond, FGRNA | | | 4.125% | | | | 12/1/2026 | | | | Aa2 | | | | 500,000 | | | | 503,590 | | | |
Fairfield City School District, G.O. Bond | | | 5.000% | | | | 12/1/2020 | | | | Aa3 | | | | 200,000 | | | | 233,894 | | | |
Fairview Park City School District, Prerefunded Balance, G.O. Bond, NATL | | | 5.000% | | | | 12/1/2029 | | | | Aa2 | | | | 185,000 | | | | 200,990 | | | |
Fairview Park City School District, Prerefunded Balance, G.O. Bond, NATL | | | 5.000% | | | | 12/1/2029 | | | | Aa2 | | | | 130,000 | | | | 141,289 | | | |
Franklin County, Various Purposes Impt., G.O. Bond | | | 5.000% | | | | 12/1/2027 | | | | Aaa | | | | 500,000 | | | | 551,345 | | | |
Gahanna, Public Impt., G.O. Bond, NATL | | | 4.250% | | | | 12/1/2014 | | | | Aa1 | | | | 100,000 | | | | 105,499 | | | |
Green, G.O. Bond | | | 2.000% | | | | 12/1/2014 | | | | AA2 | | | | 285,000 | | | | 291,321 | | | |
Greene County Water System, Revenue Bond | | | 3.500% | | | | 12/1/2026 | | | | Aa2 | | | | 300,000 | | | | 294,990 | | | |
Greene County Water System, Series A, Revenue Bond, NATL | | | 5.250% | | | | 12/1/2020 | | | | Aa2 | | | | 100,000 | | | | 117,374 | | | |
Hamilton County, Sewer Impt., Series A, Revenue Bond | | | 3.750% | | | | 12/1/2015 | | | | Aa2 | | | | 200,000 | | | | 215,454 | | | |
Hamilton County, Sewer Impt., Series A, Revenue Bond | | | 5.000% | | | | 12/1/2020 | | | | Aa2 | | | | 500,000 | | | | 594,430 | | | |
Hamilton County, Sewer Impt., Series A, Revenue Bond | | | 5.000% | | | | 12/1/2032 | | | | Aa2 | | | | 100,000 | | | | 106,830 | | | |
Hamilton Waterworks System, Series A, Revenue Bond, AGC | | | 4.125% | | | | 10/15/2023 | | | | Aa3 | | | | 120,000 | | | | 126,709 | | | |
Hamilton Waterworks System, Series A, Revenue Bond, AGC | | | 4.625% | | | | 10/15/2029 | | | | Aa3 | | | | 100,000 | | | | 102,659 | | | |
Hancock County, Various Purposes Impt., G.O. Bond, NATL | | | 4.000% | | | | 12/1/2016 | | | | Aa2 | | | | 200,000 | | | | 214,204 | | | |
Harrison, Various Purposes Impt., G.O. Bond, AGM | | | 5.250% | | | | 12/1/2038 | | | | A1 | | | | 275,000 | | | | 297,209 | | | |
Ironton City School District, Prerefunded Balance, G.O. Bond, NATL | | | 4.250% | | | | 12/1/2028 | | | | Baa1 | | | | 200,000 | | | | 221,948 | | | |
Ironton City School District, Unrefunded Balance, G.O. Bond, NATL | | | 4.250% | | | | 12/1/2028 | | | | Baa1 | | | | 300,000 | | | | 297,312 | | | |
Lakewood City School District, Prerefunded Balance, G.O. Bond, AGM | | | 5.250% | | | | 12/1/2015 | | | | Aa2 | | | | 225,000 | | | | 240,730 | | | |
The accompanying notes are an integral part of the financial statements.
4
Ohio Tax Exempt Series
Investment Portfolio - June 30, 2013
(unaudited)
| | | | | | | | | | | | | | | | | | | | | | |
| | | COUPON
RATE | | | MATURITY
DATE | | | CREDIT
RATING1
(UNAUDITED) | | | PRINCIPAL
AMOUNT | | | VALUE
(NOTE 2) | | | |
| | | | | |
OHIO MUNICIPAL SECURITIES (continued) | | | | | | | | | | | | | | | | | | | |
| | | | | | |
Lakewood City School District, Prerefunded Balance, G.O. Bond, AGM | | | 5.250% | | | | 12/1/2019 | | | | Aa2 | | | $ | 705,000 | | | $ | 754,286 | | | |
Lakewood, Water System, Revenue Bond, AMBAC | | | 4.500% | | | | 7/1/2028 | | | | WR3 | | | | 500,000 | | | | 503,070 | | | |
Licking Heights Local School District, Prerefunded Balance, G.O. Bond, FGIC | | | 5.250% | | | | 12/1/2023 | | | | Aa2 | | | | 1,140,000 | | | | 1,192,189 | | | |
Lima, Sewer Impt., Revenue Bond, AGM | | | 4.300% | | | | 12/1/2029 | | | | A2 | | | | 200,000 | | | | 207,266 | | | |
Loveland City School District, G.O. Bond, AGM | | | 5.000% | | | | 12/1/2015 | | | | Aa2 | | | | 300,000 | | | | 330,249 | | | |
Lucas County, Sewer & Water District Impt., G.O. Bond | | | 4.100% | | | | 12/1/2027 | | | | AA2 | | | | 100,000 | | | | 103,937 | | | |
Mahoning Valley Sanitary District, Revenue Bond, AGC | | | 2.125% | | | | 12/1/2015 | | | | A3 | | | | 100,000 | | | | 103,232 | | | |
Marion, Limited Tax, Various Purposes Impt., Series A, G.O. Bond, AGM | | | 4.300% | | | | 12/1/2030 | | | | A2 | | | | 100,000 | | | | 103,468 | | | |
Marysville, Sewer & Wastewater, Revenue Bond, AGC, XLCA | | | 4.750% | | | | 12/1/2046 | | | | A3 | | | | 180,000 | | | | 179,719 | | | |
Marysville, Various Purposes Impt., G.O. Bond | | | 2.000% | | | | 12/1/2013 | | | | Aa3 | | | | 155,000 | | | | 155,980 | | | |
Mason, Limited Tax, Various Purposes Impt., G.O. Bond | | | 4.250% | | | | 12/1/2027 | | | | Aaa | | | | 925,000 | | | | 952,380 | | | |
Maumee City School District, Prerefunded Balance, G.O. Bond, AGM | | | 4.600% | | | | 12/1/2031 | | | | A2 | | | | 260,000 | | | | 264,755 | | | |
Mentor, Public Impt., G.O. Bond | | | 2.000% | | | | 12/1/2014 | | | | Aa1 | | | | 200,000 | | | | 204,302 | | | |
Miami County, Various Purposes Impt., G.O. Bond | | | 2.000% | | | | 12/1/2013 | | | | Aa2 | | | | 300,000 | | | | 301,713 | | | |
Miamisburg City School District, G.O. Bond | | | 5.000% | | | | 12/1/2033 | | | | Aa2 | | | | 250,000 | | | | 265,540 | | | |
Middletown, Various Purposes Impt., G.O. Bond, AGM | | | 4.500% | | | | 12/1/2018 | | | | Aa2 | | | | 100,000 | | | | 113,346 | | | |
Middletown, Various Purposes Impt., G.O. Bond, AGM | | | 5.000% | | | | 12/1/2021 | | | | Aa2 | | | | 230,000 | | | | 260,834 | | | |
Mount Healthy City School District, G.O. Bond, AGM | | | 5.000% | | | | 12/1/2031 | | | | A1 | | | | 200,000 | | | | 213,466 | | | |
Muskingum County, Limited Tax, Various Purposes Impt., G.O. Bond, AGC | | | 4.300% | | | | 12/1/2028 | | | | Aa3 | | | | 145,000 | | | | 150,351 | | | |
North Royalton, Various Purposes Impt., G.O. Bond | | | 5.250% | | | | 12/1/2028 | | | | Aa2 | | | | 1,025,000 | | | | 1,126,629 | | | |
Northeast Ohio Regional Sewer District, Revenue Bond | | | 5.000% | | | | 11/15/2021 | | | | Aa1 | | | | 750,000 | | | | 890,730 | | | |
Ohio State Water Development Authority, Fresh Water, Prerefunded Balance, Revenue Bond | | | 5.250% | | | | 12/1/2017 | | | | AAA2 | | | | 270,000 | | | | 282,361 | | | |
Ohio State Water Development Authority, Fresh Water, Revenue Bond | | | 5.500% | | | | 12/1/2018 | | | | Aaa | | | | 100,000 | | | | 120,210 | | | |
Ohio State Water Development Authority, Fresh Water, Revenue Bond | | | 5.500% | | | | 12/1/2021 | | | | Aaa | | | | 125,000 | | | | 154,943 | | | |
Ohio State Water Development Authority, Pollution Control, Revenue Bond | | | 5.250% | | | | 12/1/2015 | | | | Aaa | | | | 200,000 | | | | 222,234 | | | |
Ohio State Water Development Authority, Pollution Control, Series C, Revenue Bond | | | 3.000% | | | | 12/1/2021 | | | | Aaa | | | | 300,000 | | | | 312,969 | | | |
Ohio State Water Development Authority, Pure Water, Prerefunded Balance, Series I, Revenue Bond, AMBAC | | | 6.000% | | | | 12/1/2016 | | | | Aaa | | | | 25,000 | | | | 27,186 | | | |
The accompanying notes are an integral part of the financial statements.
5
Ohio Tax Exempt Series
Investment Portfolio - June 30, 2013
(unaudited)
| | | | | | | | | | | | | | | | | | | | | | |
| | | COUPON
RATE | | | MATURITY
DATE | | | CREDIT
RATING1
(UNAUDITED) | | | PRINCIPAL
AMOUNT | | | VALUE
(NOTE 2) | | | |
| | | | | |
OHIO MUNICIPAL SECURITIES (continued) | | | | | | | | | | | | | | | | | | | |
| | | | | | |
Ohio State Water Development Authority, Revenue Bond | | | 5.000% | | | | 6/1/2018 | | | | Aaa | | | $ | 350,000 | | | $ | 407,753 | | | |
Ohio State Water Development Authority, Series A, Revenue Bond | | | 5.000% | | | | 6/1/2018 | | | | Aaa | | | | 100,000 | | | | 116,501 | | | |
Ohio State Water Development Authority, Water Utility Impt., Prerefunded Balance, Revenue Bond | | | 5.000% | | | | 12/1/2023 | | | | AAA2 | | | | 575,000 | | | | 624,697 | | | |
Ohio State Water Development Authority, Water Utility Impt., Prerefunded Balance, Revenue Bond, NATL | | | 5.000% | | | | 12/1/2030 | | | | Aa1 | | | | 180,000 | | | | 183,598 | | | |
Ohio State, Conservation Project, Series A, G.O. Bond | | | 5.000% | | | | 9/1/2013 | | | | Aa1 | | | | 350,000 | | | | 352,919 | | | |
Ohio State, Public Impt., Series A, G.O. Bond | | | 5.000% | | | | 2/1/2014 | | | | Aa1 | | | | 250,000 | | | | 257,085 | | | |
Ohio State, School Impt., Prerefunded Balance, Series A, G.O. Bond | | | 5.000% | | | | 6/15/2015 | | | | Aa1 | | | | 300,000 | | | | 313,650 | | | |
Ohio State, Series A, G.O. Bond | | | 5.000% | | | | 9/15/2021 | | | | Aa1 | | | | 500,000 | | | | 597,945 | | | |
Olentangy Local School District, Series A, G.O. Bond, AGM | | | 4.500% | | | | 12/1/2032 | | | | Aa1 | | | | 800,000 | | | | 816,000 | | | |
Otsego Local School District, Prerefunded Balance, G.O. Bond, AGM | | | 4.300% | | | | 12/1/2016 | | | | Aa3 | | | | 100,000 | | | | 105,715 | | | |
Princeton City School District, Prerefunded Balance, G.O. Bond, NATL | | | 5.000% | | | | 12/1/2030 | | | | AA2 | | | | 200,000 | | | | 204,016 | | | |
South Range Local School District, G.O. Bond, XLCA | | | 4.500% | | | | 12/1/2035 | | | | A2 | | | | 225,000 | | | | 220,939 | | | |
Springboro, Limited Tax, Public Impt., G.O. Bond | | | 3.250% | | | | 12/1/2014 | | | | Aa1 | | | | 100,000 | | | | 104,079 | | | |
Springboro, Limited Tax, Public Impt., G.O. Bond | | | 5.000% | | | | 12/1/2019 | | | | Aa1 | | | | 100,000 | | | | 114,715 | | | |
Springboro, Sewer System, Revenue Bond | | | 4.000% | | | | 6/1/2018 | | | | Aa3 | | | | 100,000 | | | | 110,019 | | | |
Summit County, Various Purposes Impt., Series R, G.O. Bond, FGRNA | | | 5.500% | | | | 12/1/2019 | | | | Aa1 | | | | 100,000 | | | | 119,509 | | | |
Sylvania City School District, G.O. Bond, AGC | | | 5.000% | | | | 12/1/2025 | | | | Aa2 | | | | 270,000 | | | | 293,555 | | | |
Sylvania, Public Impt., G.O. Bond | | | 2.000% | | | | 12/1/2014 | | | | AA2 | | | | 300,000 | | | | 306,237 | | | |
Symmes Township, Limited Tax, Parkland Acquisition & Impt., G.O. Bond | | | 5.250% | | | | 12/1/2037 | | | | Aa1 | | | | 100,000 | | | | 108,964 | | | |
Talawanda School District, Prerefunded Balance, G.O. Bond, AMBAC | | | 5.000% | | | | 12/1/2021 | | | | Aa2 | | | | 200,000 | | | | 208,772 | | | |
Tallmadge, G.O. Bond | | | 4.250% | | | | 12/1/2030 | | | | Aa2 | | | | 180,000 | | | | 194,089 | | | |
Toledo Water System, Revenue Bond | | | 5.000% | | | | 11/15/2018 | | | | Aa3 | | | | 500,000 | | | | 581,595 | | | |
Toledo, Limited Tax, Capital Impt., G.O. Bond | | | 3.375% | | | | 12/1/2028 | | | | A2 | | | | 200,000 | | | | 179,762 | | | |
Twinsburg City School District, G.O. Bond, FGRNA | | | 5.000% | | | | 12/1/2018 | | | | Aa2 | | | | 100,000 | | | | 105,945 | | | |
Vandalia, G.O. Bond, AMBAC | | | 5.000% | | | | 12/1/2015 | | | | Aa2 | | | | 235,000 | | | | 248,935 | | | |
Wadsworth City School District, G.O. Bond, AGC | | | 5.000% | | | | 12/1/2037 | | | | AA2 | | | | 180,000 | | | | 186,710 | | | |
Warren, Limited Tax, G.O. Bond, AGM | | | 3.250% | | | | 12/1/2032 | | | | A1 | | | | 285,000 | | | | 251,367 | | | |
West Chester Township, Public Impt., G.O. Bond, NATL | | | 4.000% | | | | 12/1/2013 | | | | Aaa | | | | 100,000 | | | | 101,596 | | | |
The accompanying notes are an integral part of the financial statements.
6
Ohio Tax Exempt Series
Investment Portfolio - June 30, 2013
(unaudited)
| | | | | | | | | | | | | | | | | | | | | | |
| | | COUPON
RATE | | | MATURITY
DATE | | | CREDIT
RATING1
(UNAUDITED) | | | PRINCIPAL
AMOUNT/
SHARES | | | VALUE (NOTE 2) | | | |
| | | | | |
OHIO MUNICIPAL SECURITIES (continued) | | | | | | | | | | | | | | | | | | | |
| | | | | | |
Wood County, G.O. Bond | | | 5.400% | | | | 12/1/2013 | | | | Aa2 | | | $ | 5,000 | | | $ | 5,018 | | | |
| | | | | | | | | | | | | | | | | | | | | | |
| | | | | | | | | | | | | | | | | | | | | | |
TOTAL MUNICIPAL BONDS | | | | | | | | | | | | | | | | | | | | | | |
(Identified Cost $35,048,835) | | | | | | | | | | | | | | | | | | | 35,281,505 | | | |
| | | | | | | | | | | | | | | | | | | | | | |
| | | | | | | | | | | | | | | | | | | | | | |
SHORT-TERM INVESTMENT - 7.4% | | | | | | | | | | | | | | | | | | | | | | |
| | | | | | |
Dreyfus AMT - Free Municipal Reserves - Class R | | | | | | | | | | | | | | | | | | | | | | |
(Identified Cost $2,869,973) | | | | | | | | | | | | | | | 2,869,973 | | | | 2,869,973 | | | |
| | | | | | | | | | | | | | | | | | | | | | |
TOTAL INVESTMENTS - 98.4% | | | | | | | | | | | | | | | | | | | | | | |
(Identified Cost $37,918,808) | | | | | | | | | | | | | | | | | | | 38,151,478 | | | |
OTHER ASSETS, LESS LIABILITIES - 1.6% | | | | | | | | | | | | | | | | | | | 631,795 | | | |
| | | | | | | | | | | | | | | | | | | | | | |
NET ASSETS - 100% | | | | | | | | | | | | | | | | | | $ | 38,783,273 | | | |
| | | | | | | | | | | | | | | | | | | | | | |
KEY:
G.O. Bond - General Obligation Bond
Impt. - Improvement
Scheduled principal and interest payments are guaranteed by:
AGC (Assured Guaranty Corp.)
AGM (Assurance Guaranty Municipal Corp.)
AMBAC (AMBAC Assurance Corp.)
FGIC (Financial Guaranty Insurance Co.)
FGRNA (FGIC reinsured by NATL)
NATL (National Public Finance Guarantee Corp.)
XLCA (XL Capital Assurance)
The insurance does not guarantee the market value of the municipal bonds.
1Credit ratings from Moody’s (unaudited).
2Credit ratings from S&P (unaudited).
3Credit rating has been withdrawn. As of June 30, 2013, there is no rating available (unaudited).
The Series’ portfolio holds, as a percentage of net assets, greater than 10% in bonds insured by the following companies: AGM - 19.5%; NATL - 10.9%.
The accompanying notes are an integral part of the financial statements.
7
Ohio Tax Exempt Series
Statement of Assets and Liabilities
June 30, 2013 (unaudited)
| | | | |
ASSETS: | | | | |
| |
Investments (identified cost $37,918,808) (Note 2) | | $ | 38,151,478 | |
Receivable for securities sold | | | 1,037,929 | |
Interest receivable | | | 211,695 | |
Receivable for fund shares sold | | | 16,969 | |
Prepaid expenses | | | 113 | |
| | | | |
| |
TOTAL ASSETS | | | 39,418,184 | |
| | | | |
| |
LIABILITIES: | | | | |
| |
Accrued management fees (Note 3) | | | 16,036 | |
Accrued fund accounting and administration fees (Note 3) | | | 6,670 | |
Accrued transfer agent fees (Note 3) | | | 446 | |
Accrued Chief Compliance Officer service fees (Note 3) | | | 340 | |
Payable for securities purchased | | | 588,225 | |
Other payables and accrued expenses | | | 23,194 | |
| | | | |
| |
TOTAL LIABILITIES | | | 634,911 | |
| | | | |
| |
TOTAL NET ASSETS | | $ | 38,783,273 | |
| | | | |
| |
NET ASSETS CONSIST OF: | | | | |
| |
Capital stock | | $ | 36,369 | |
Additional paid-in-capital | | | 38,150,882 | |
Undistributed net investment income | | | 76,799 | |
Accumulated net realized gain on investments | | | 286,553 | |
Net unrealized appreciation on investments | | | 232,670 | |
| | | | |
| |
TOTAL NET ASSETS | | $ | 38,783,273 | |
| | | | |
| |
NET ASSET VALUE, OFFERING PRICE AND REDEMPTION PRICE PER SHARE - Class A ($38,783,273/3,636,943 shares) | | $ | 10.66 | |
| | | | |
The accompanying notes are an integral part of the financial statements.
8
Ohio Tax Exempt Series
Statement of Operations
For the Six Months Ended June 30, 2013 (unaudited)
| | | | |
INVESTMENT INCOME: | | | | |
| |
Interest | | $ | 432,120 | |
Dividends | | | 2 | |
| | | | |
| |
Total Investment Income | | | 432,122 | |
| | | | |
| |
EXPENSES: | | | | |
| |
Management fees (Note 3) | | | 97,094 | |
Fund accounting and administration fees (Note 3) | | | 24,255 | |
Transfer agent fees (Note 3) | | | 1,234 | |
Chief Compliance Officer service fees (Note 3) | | | 1,117 | |
Directors’ fees (Note 3) | | | 453 | |
Audit fees | | | 14,674 | |
Custodian fees | | | 991 | |
Miscellaneous | | | 11,796 | |
| | | | |
| |
Total Expenses | | | 151,614 | |
| | | | |
| |
NET INVESTMENT INCOME | | | 280,508 | |
| | | | |
| |
UNREALIZED GAIN (LOSS) ON INVESTMENTS: | | | | |
| |
Net realized gain (loss) on investments | | | 286,375 | |
Net change in unrealized appreciation (depreciation) on investments | | | (1,323,603 | ) |
| | | | |
| |
NET REALIZED AND UNREALIZED GAIN (LOSS) ON INVESTMENTS | | | (1,037,228 | ) |
| | | | |
| |
NET DECREASE IN NET ASSETS RESULTING FROM OPERATIONS | | $ | (756,720 | ) |
| | | | |
The accompanying notes are an integral part of the financial statements.
9
Ohio Tax Exempt Series
Statements of Changes in Net Assets
| | | | | | | | |
| | | FOR THE SIX
MONTHS ENDED
6/30/13
(UNAUDITED) | | | FOR THE
YEAR ENDED
12/31/12 | |
INCREASE (DECREASE) IN NET ASSETS: | | | | | | | | |
| | |
OPERATIONS: | | | | | | | | |
| | |
Net investment income | | $ | 280,508 | | | $ | 560,640 | |
Net realized gain on investments | | | 286,375 | | | | 6,693 | |
Net change in unrealized appreciation (depreciation) on investments | | | (1,323,603 | ) | | | 605,489 | |
| | | | | | | | |
| | |
Net increase (decrease) from operations | | | (756,720 | ) | | | 1,172,822 | |
| | | | | | | | |
| | |
DISTRIBUTIONS TO SHAREHOLDERS (Note 8): | | | | | | | | |
| | |
From net investment income | | | (216,838 | ) | | | (605,183 | ) |
From net realized gain on investments | | | — | | | | (5,319 | ) |
| | | | | | | | |
| | |
Total distributions to shareholders | | | (216,838 | ) | | | (610,502 | ) |
| | | | | | | | |
| | |
CAPITAL STOCK ISSUED AND REPURCHASED: | | | | | | | | |
| | |
Net increase from capital share transactions (Note 5) | | | 1,007,878 | | | | 510,706 | |
| | | | | | | | |
| | |
Net increase in net assets | | | 34,320 | | | | 1,073,026 | |
| | |
NET ASSETS: | | | | | | | | |
| | |
Beginning of period | | | 38,748,953 | | | | 37,675,927 | |
| | | | | | | | |
| | |
End of period (including undistributed net investment income of $76,799 and $13,129, respectively) | | $ | 38,783,273 | | | $ | 38,748,953 | |
| | | | | | | | |
The accompanying notes are an integral part of the financial statements.
10
Ohio Tax Exempt Series
Financial Highlights
| | | | | | | | | | | | | | | | | | | | | | | | |
| | | FOR THE SIX
MONTHS ENDED
6/30/13
(UNAUDITED) | | | FOR THE YEARS ENDED | |
| | | 12/31/12 | | | 12/31/11 | | | 12/31/10 | | | 12/31/09 | | | 12/31/08 | |
Per share data (for a share outstanding throughout each period): | | | | | | | | | | | | | | | | | | | | | | | | |
Net asset value - Beginning of period | | $ | 10.93 | | | $ | 10.77 | | | $ | 10.30 | | | $ | 10.62 | | | $ | 9.82 | | | $ | 10.43 | |
| | | | | | | | | | | | | | | | | | | | | | | | |
Income (loss) from investment operations: | | | | | | | | | | | | | | | | | | | | | | | | |
Net investment income | | | 0.08 | 1 | | | 0.16 | 1 | | | 0.26 | 1 | | | 0.35 | 1 | | | 0.36 | 1 | | | 0.38 | |
Net realized and unrealized gain (loss) on investments | | | (0.29 | ) | | | 0.17 | | | | 0.62 | | | | (0.33 | ) | | | 0.91 | | | | (0.57 | ) |
| | | | | | | | | | | | | | | | | | | | | | | | |
| | | | | | |
Total from investment operations | | | (0.21 | ) | | | 0.33 | | | | 0.88 | | | | 0.02 | | | | 1.27 | | | | (0.19 | ) |
| | | | | | | | | | | | | | | | | | | | | | | | |
| | | | | | |
Less distributions to shareholders: | | | | | | | | | | | | | | | | | | | | | | | | |
From net investment income | | | (0.06 | ) | | | (0.17 | ) | | | (0.25 | ) | | | (0.34 | ) | | | (0.37 | ) | | | (0.36 | ) |
From net realized gain on investments | | | — | | | | — | 2 | | | (0.16 | ) | | | — | | | | (0.10 | ) | | | (0.06 | ) |
| | | | | | | | | | | | | | | | | | | | | | | | |
| | | | | | |
Total distributions to shareholders | | | (0.06 | ) | | | (0.17 | ) | | | (0.41 | ) | | | (0.34 | ) | | | (0.47 | ) | | | (0.42 | ) |
| | | | | | | | | | | | | | | | | | | | | | | | |
| | | | | | |
Net asset value - End of period | | $ | 10.66 | | | $ | 10.93 | | | $ | 10.77 | | | $ | 10.30 | | | $ | 10.62 | | | $ | 9.82 | |
| | | | | | | | | | | | | | | | | | | | | | | | |
| | | | | | |
Net assets - End of period (000’s omitted) | | $ | 38,783 | | | $ | 38,749 | | | $ | 37,676 | | | $ | 34,370 | | | $ | 24,875 | | | $ | 20,844 | |
| | | | | | | | | | | | | | | | | | | | | | | | |
| | | | | | |
Total return3 | | | (1.93 | %) | | | 3.09 | % | | | 8.65 | % | | | 0.14 | % | | | 13.09 | % | | | (1.74 | %) |
Ratios (to average net assets)/ | | | | | | | | | | | | | | | | | | | | | | | | |
Supplemental Data: | | | | | | | | | | | | | | | | | | | | | | | | |
Expenses* | | | 0.78 | %4 | | | 0.76 | % | | | 0.80 | % | | | 0.85 | % | | | 0.85 | % | | | 0.85 | % |
Net investment income | | | 1.44 | %4 | | | 1.45 | % | | | 2.41 | % | | | 3.25 | % | | | 3.39 | % | | | 3.58 | % |
Portfolio turnover | | | 11 | % | | | 9 | % | | | 60 | % | | | 0 | %5 | | | 11 | % | | | 15 | % |
|
| * For certain periods presented, the investment advisor did not impose all or a portion of its management and/or other fees, and in some periods may have paid a portion of the Series’ expenses. If these expenses had been incurred by the Series, the expense ratio (to average net assets) would have increased by the following amounts: | |
| | | | | | |
| | | N/A | | | | N/A | | | | N/A | | | | 0.00 | %6 | | | 0.03 | % | | | 0.01 | % |
1Calculated based on average shares outstanding during the periods.
2Less than $0.01 per share.
3Represents aggregate total return for the periods indicated, and assumes reinvestment of all distributions. Total return would have been lower had certain expenses not been waived or reimbursed during certain periods. Periods less than one year are not annualized.
4Annualized.
5Less than 1%.
6Less than 0.01%.
The accompanying notes are an integral part of the financial statements.
11
Ohio Tax Exempt Series
Notes to Financial Statements
(unaudited)
Ohio Tax Exempt Series (the “Series”) is a no-load diversified series of Manning & Napier Fund, Inc. (the “Fund”). The Fund is organized in Maryland and is registered under the Investment Company Act of 1940, as amended, as an open-end management investment company.
The Series’ investment objective is to provide as high a level of current income exempt from federal income tax and Ohio State personal income tax as the Advisor believes is consistent with the preservation of capital.
The Fund’s advisor is Manning & Napier Advisors, LLC (the “Advisor”). Shares of the Series are offered to investors, clients and employees of the Advisor and its affiliates. The total authorized capital stock of the Fund consists of 15 billion shares of common stock each having a par value of $0.01. As of June 30, 2013, 10.3 billion shares have been designated in total among 42 series, of which 100 million have been designated as Ohio Tax Exempt Series Class A common stock.
| 2. | Significant Accounting Policies |
Security Valuation
Municipal securities will normally be valued on the basis of market valuations provided by an independent pricing service (the “Service”). The Service utilizes the latest price quotations and a matrix system (which considers such factors as security prices of similar securities, yields, maturities and ratings). The Service has been approved by the Fund’s Board of Directors (the “Board”).
Short-term investments that mature in sixty days or less are valued at amortized cost, which approximates fair value. Investments in open-end investment companies are valued at their net asset value per share on valuation date.
Volume and level of activity in established markets for an asset or liability are evaluated to determine whether recent transactions and quoted prices are determinative of fair value. Where there have been significant decreases in volume and level of activity, further analysis and adjustment may be necessary to estimate fair value. The Series measures fair value in these instances by the use of inputs and valuation techniques which may be based upon current market prices of securities that are comparable in coupon, rating, maturity and industry and/or expectation of future cash flows. As a result of trading in relatively thin markets and/or markets that experience significant volatility, the prices used by the Series to value these securities may differ from the value that would be realized if these securities were sold, and the differences could be material.
Securities for which representative valuations or prices are not available from the Series’ pricing service may be valued at fair value as determined in good faith by the Advisor under procedures approved by and under the general supervision and responsibility of the Board. Due to the inherent uncertainty of valuations of such securities, the fair value may differ significantly from the values that would have been used had a ready market for such securities existed. If trading or events occurring after the close of the principal market in which securities are traded are expected to materially affect the value of those securities, then they may be valued at their fair value, taking this trading or these events into account.
Various inputs are used in determining the value of the Series’ assets or liabilities carried at fair value. These inputs are summarized in three broad levels. Level 1 includes quoted prices in active markets for identical assets and liabilities. Level 2 includes other significant observable inputs (including quoted prices for similar securities, interest rates, prepayment speeds, credit risk, etc.). Level 3 includes significant unobservable inputs (including the Series’ own assumptions in determining the fair value of investments). A financial instrument’s level within the fair value hierarchy is based on the lowest level of any input both individually and in aggregate that is significant to the fair value measurement. The inputs or methodology used for valuing securities are not necessarily an indication of the risk associated with investing in those securities.
12
Ohio Tax Exempt Series
Notes to Financial Statements (continued)
(unaudited)
| 2. | Significant Accounting Policies (continued) |
Security Valuation (continued)
The following is a summary of the valuation levels used for major security types as of June 30, 2013 in valuing the Series’ assets or liabilities carried at fair value:
| | | | | | | | | | | | | | | | |
| DESCRIPTION | | TOTAL | | | LEVEL 1 | | | LEVEL 2 | | | LEVEL 3 | |
Assets: | | | | | | | | | | | | | | | | |
Debt securities: | | | | | | | | | | | | | | | | |
States and political subdivisions (municipals) | | $ | 35,281,505 | | | $ | — | | | $ | 35,281,505 | | | $ | — | |
Mutual fund | | | 2,869,973 | | | | 2,869,973 | | | | — | | | | — | |
| | | | | | | | | | | | | | | | |
Total assets | | $ | 38,151,478 | | | $ | 2,869,973 | | | $ | 35,281,505 | | | $ | — | |
| | | | | | | | | | | | | | | | |
There were no Level 3 securities held by the Series as of December 31, 2012 or June 30, 2013.
The Fund’s policy is to recognize transfers in and transfers out of the valuation levels as of the beginning of the reporting period. There were no transfers between Level 1 and Level 2 during the six months ended June 30, 2013.
Security Transactions, Investment Income and Expenses
Security transactions are accounted for on trade date. Dividend income is recorded on the ex-dividend date, except that if the ex-dividend date has passed, certain dividends from foreign securities are recorded as soon as the Series is informed of the ex-dividend date. Non-cash dividends, if any, are recorded at the fair value of the securities received. Interest income, including amortization of premium and accretion of discounts using the effective interest method, is earned from settlement date and accrued daily.
Expenses are recorded on an accrual basis. Most expenses of the Fund can be attributed to a specific series. Expenses which cannot be directly attributed are apportioned among the series in the Fund in such a manner as deemed equitable by the Fund’s Board, taking into consideration, among other things, the nature and type of expense.
The Series uses the identified cost method for determining realized gain or loss on investments for both financial statement and federal income tax reporting purposes.
Federal Taxes
The Series’ policy is to comply with the provisions of the Internal Revenue Code applicable to regulated investment companies. The Series is not subject to federal income tax or excise tax to the extent that the Series distributes to shareholders each year its taxable income, including any net realized gains on investments, in accordance with requirements of the Internal Revenue Code. Accordingly, no provision for federal income tax or excise tax has been made in the financial statements.
Management evaluates its tax positions to determine if the tax positions taken meet the minimum recognition threshold in connection with accounting for uncertainties in income tax positions taken or expected to be taken for the purposes of measuring and recognizing tax liabilities in the financial statements. Recognition of tax benefits of an uncertain tax position is required only when the position is “more likely than not” to be sustained assuming examination by taxing authorities. At June 30, 2013, the Series has recorded no liability for net unrecognized tax benefits relating to uncertain income tax positions taken or expected to be taken in future tax returns.
The Series files income tax returns in the U.S. federal jurisdiction and various states, as required. No income tax returns are currently under investigation. The statute of limitations on the Series’ tax returns remains open for the years ended December 31, 2009 through December 31, 2012. The Series is not aware of any tax positions for which it is reasonably possible that the total amounts of unrecognized tax benefits will significantly change in the next twelve months.
Distributions of Income and Gains
Distributions to shareholders of net investment income are made quarterly. Distributions of net realized gains are made annually. An additional distribution may be necessary to avoid taxation of the Series. Distributions are recorded on the ex-dividend date.
13
Ohio Tax Exempt Series
Notes to Financial Statements (continued)
(unaudited)
| 2. | Significant Accounting Policies (continued) |
Indemnifications
The Fund’s organizational documents provide former and current directors and officers with a limited indemnification against liabilities arising in connection with the performance of their duties to the Fund. In the normal course of business, the Fund may also enter into contracts that provide general indemnifications. The Fund’s maximum exposure under these arrangements is unknown as this would be dependent on future claims that may be made against the Fund. The risk of material loss from such claims is considered remote.
Other
The preparation of financial statements in conformity with accounting principles generally accepted in the United States of America requires management to make estimates and assumptions that affect the reported amounts of assets and liabilities and the disclosure of contingent assets and liabilities at the date of the financial statements and the reported amounts of income and expenses during the reporting period. Actual results could differ from those estimates.
| 3. | Transactions with Affiliates |
The Fund has an Investment Advisory Agreement (the “Agreement”) with the Advisor, for which the Series pays a fee, computed daily and payable monthly, at an annual rate of 0.50% of the Series’ average daily net assets.
Under the Agreement, personnel of the Advisor provide the Series with advice and assistance in the choice of investments and the execution of securities transactions, and otherwise maintain the Series’ organization. The Advisor also provides the Fund with necessary office space and fund administration and support services. The salaries of all officers of the Fund (except a percentage of the Fund’s Chief Compliance Officer’s salary, which is paid by the Fund), and of all Directors who are “affiliated persons” of the Fund, or of the Advisor, and all personnel of the Fund, or of the Advisor, performing services relating to research, statistical and investment activities, are paid by the Advisor. Each “non-affiliated” Director receives an annual stipend, which is allocated among all the active series of the Fund. In addition, these Directors also receive a fee per Board meeting attended plus a fee for each committee meeting attended.
The Advisor has contractually agreed, until at least April 30, 2014, to waive its management fee and, if necessary, pay other operating expenses of the Series in order to maintain total direct annual fund operating expenses for the Series at no more than 0.85% of average daily net assets each year. The Advisor did not waive any fees for the six months ended June 30, 2013. The Advisor is not eligible to recoup any expenses that have been waived or reimbursed in prior years.
Manning & Napier Investor Services, Inc., a registered broker-dealer affiliate of the Advisor, acts as distributor for the Fund’s shares. The services of Manning & Napier Investor Services, Inc. are provided at no additional cost to the Series.
The Advisor has agreements with BNY Mellon Investment Servicing (U.S.) Inc. (“BNY”) under which BNY serves as sub-accountant services agent and sub-transfer agent. The Fund pays the Advisor an annual fee related to fund accounting and administration of 0.0175% on the first $3 billion of average daily net assets (excluding Target Series and Strategic Income Series); 0.015% on the next $3 billion of average daily net assets (excluding Target Series and Strategic Income Series); and 0.01% of the average daily net assets in excess of $6 billion (excluding Target Series and Strategic Income Series); plus a base fee of $25,500 per series. Transfer Agent fees are charged to the Fund on a per account basis. Additionally, certain transaction and cusip-based fees and out-of-pocket expenses, including charges for reporting relating to the Fund’s compliance program, are charged. Effective October 1, 2012, the aforementioned agreements were modified to reduce the annual fee related to fund accounting and administration, as well as transfer agent fees, by 10%, excluding out-of-pocket expenses.
Expenses not directly attributable to a series are allocated based on each series’ relative net assets or number of accounts, depending on the expense.
14
Ohio Tax Exempt Series
Notes to Financial Statements (continued)
(unaudited)
| 4. | Purchases and Sales of Securities |
For the six months ended June 30, 2013, purchases and sales of securities, other than U.S. Government securities and short-term securities, were $4,125,759 and $4,521,994 respectively. There were no purchases or sales of U.S. Government securities.
| 5. | Capital Stock Transactions |
Transactions in shares of Ohio Tax Exempt Series were:
| | | | | | | | | | | | | | | | |
| | | FOR THE SIX MONTHS ENDED 6/30/13 | | | FOR THE YEAR ENDED 12/31/12 | |
| | | SHARES | | | AMOUNT | | | SHARES | | | AMOUNT | |
Sold | | | 209,107 | | | $ | 2,281,815 | | | | 391,877 | | | $ | 4,283,787 | |
Reinvested | | | 19,567 | | | | 211,605 | | | | 54,363 | | | | 592,114 | |
Repurchased | | | (136,244 | ) | | | (1,485,542 | ) | | | (399,797 | ) | | | (4,365,195 | ) |
| | | | | | | | | | | | | | | | |
Total | | | 92,430 | | | $ | 1,007,878 | | | | 46,443 | | | $ | 510,706 | |
| | | | | | | | | | | | | | | | |
Substantially all of the Series’ shares represent investments by fiduciary accounts over which the Advisor has sole investment discretion.
The Series may trade in instruments including written and purchased options, forward foreign currency exchange contracts and futures contracts and other derivatives in the normal course of investing activities to assist in managing exposure to various market risks. The Series may be subject to various elements of risk, which may involve, to a varying degree, elements of risk in excess of the amounts recognized for financial statement purposes. These risks include: the risk that changes in the value of a derivative may not correlate perfectly with the underlying asset, rate or index; counterparty credit risk related to over the counter derivative counterparties’ failure to perform under contract terms; liquidity risk related to the lack of a liquid market for these contracts allowing the fund to close out its position(s); and documentation risk relating to disagreement over contract terms. No such investments were held by the Series as of June 30, 2013.
| 7. | Concentration of Credit |
The Series primarily invests in debt obligations issued by the State of Ohio and its political subdivisions, agencies and public authorities to obtain funds for various public purposes. The Series is more susceptible to factors adversely affecting issues of Ohio municipal securities than is a municipal bond fund that is not concentrated in these issues to the same extent.
| 8. | Federal Income Tax Information |
The amount and characterization of certain income and capital gains to be distributed are determined in accordance with federal income tax regulations, which may differ from accounting principles generally accepted in the United States of America. The Series may periodically make reclassifications among its capital accounts to reflect income and gains available for distribution (or available capital loss carryovers) under income tax regulations without impacting the Series’ net asset value. Any such reclassifications are not reflected in the financial highlights.
The final determination of the tax character of current year distributions will be made at the conclusion of the fiscal year. The tax character of distributions paid for the year ended December 31, 2012 was as follows:
| | | | |
Ordinary income | | $ | 5,319 | |
Tax exempt income | | | 605,183 | |
15
Ohio Tax Exempt Series
Notes to Financial Statements (continued)
(unaudited)
| 8. | Federal Income Tax Information (continued) |
At June 30, 2013, the identified cost for federal income tax purposes, the resulting gross unrealized appreciation and depreciation, and the net unrealized appreciation were as follows:
| | | | |
Cost for federal income tax purposes | | $ | 37,918,808 | |
Unrealized appreciation | | | 574,852 | |
Unrealized depreciation | | | (342,182 | ) |
| | | | |
Net unrealized appreciation | | $ | 232,670 | |
| | | | |
16
{This page intentionally left blank}
17
Ohio Tax Exempt Series
Literature Requests
(unaudited)
Proxy Voting Policies and Procedures
A description of the policies and procedures that the Fund uses to determine how to vote proxies relating to portfolio securities is available, without charge, upon request:
| | | | |
| By phone | | 1-800-466-3863 | | |
| On the Securities and Exchange | | | | |
| Commission’s (SEC) web site | | http://www.sec.gov | | |
Proxy Voting Record
Information regarding how the Fund voted proxies relating to portfolio securities during the most recent 12-month period ended June 30th is available, without charge, upon request:
| | | | |
| By phone | | 1-800-466-3863 | | |
| On the SEC’s web site | | http://www.sec.gov | | |
Quarterly Portfolio Holdings
The Series’ complete schedule of portfolio holdings for the 1st and 3rd quarters of each fiscal year are provided on Form N-Q, and are available, without charge, upon request:
| | | | |
| By phone | | 1-800-466-3863 | | |
| On the SEC’s web site | | http://www.sec.gov | | |
The Series’ Form N-Q may be reviewed and copied at the SEC’s Public Reference Room in Washington, D.C. Information on the operation of the Public Reference Room may be obtained by calling 1-800-SEC-0330.
Prospectus and Statement of Additional Information (SAI)
The prospectus and SAI provide additional information about each Series, including charges, expenses and risks. These documents are available, without charge, upon request:
| | | | |
| By phone | | 1-800-466-3863 | | |
| On the SEC’s web site | | http://www.sec.gov | | |
| On our web site | | http://www.manning-napier.com | | |
Additional information available at www.manning-napier.com
1. Fund Holdings - Month-End
2. Fund Holdings - Quarter-End
3. Shareholder Report - Annual
4. Shareholder Report - Semi-Annual
The Fund also offers electronic notification or “e-delivery” when certain documents are available on-line to be downloaded or reviewed. Direct shareholders can elect to receive electronic notification when shareholder reports, prospectus updates, and/or statements are available. If you do not currently have on-line access to your account, you can establish access by going to www.manning-napier.com, click on “Login” in the top corner of the page, and follow the prompts to self-enroll. Once enrolled, you can set your electronic notification preferences by clicking on the Account Options tab located within the green toolbar and then select E-Delivery Option. Should you have any questions on either how to establish on-line access or how to update your account settings, please contact Investor Services at 1-800-466-3863.
MNOTE-6/13-SAR
| | | | | | |
| | | | DIVERSIFIED TAX EXEMPT SERIES | | |
www.manning-napier.com | | | | |
Diversified Tax Exempt Series
Shareholder Expense Example
(unaudited)
As a shareholder of the Series, you may incur two types of costs: (1) transaction costs and (2) ongoing costs, including management fees and other Series expenses. This example is intended to help you understand your ongoing costs (in dollars) of investing in the Series and to compare these costs with the ongoing costs of investing in other mutual funds.
The example is based on an investment of $1,000 invested at the beginning of the period and held for the entire period (January 1, 2013 to June 30, 2013).
Actual Expenses
The first line of the table below provides information about actual account values and actual expenses. You may use the information in this line, together with the amount you invested, to estimate the expenses that you paid over the period. Simply divide your account value by $1,000 (for example, an $8,600 account value divided by $1,000 = 8.6), then multiply the result by the number in the first line under the heading entitled “Expenses Paid During Period” to estimate the expenses you paid on your account during this period.
Hypothetical Example for Comparison Purposes
The second line of the table below provides information about hypothetical account values and hypothetical expenses based on the Series’ actual expense ratio and an assumed rate of return of 5% per year before expenses, which is not the Series’ actual return. The hypothetical account values and expenses may not be used to estimate the actual ending account balance or expenses you paid during the period. You may use this information to compare the ongoing costs of investing in the Series and other funds. To do so, compare this 5% hypothetical example with the 5% hypothetical examples that appear in the shareholder reports of the other funds.
Please note that the expenses shown in the table are meant to highlight your ongoing costs only and do not reflect any transaction costs. Therefore, the second line of the table is useful in comparing ongoing costs only, and will not help you determine the relative total costs of owning different funds. In addition, if these transaction costs were included, your costs would have been higher.
| | | | | | |
| | | BEGINNING
ACCOUNT VALUE
1/1/13 | | ENDING
ACCOUNT VALUE
6/30/13 | | EXPENSES PAID
DURING PERIOD*
1/1/13-6/30/13 |
Actual | | $1,000.00 | | $ 983.20 | | $2.80 |
Hypothetical (5% return before expenses) | | $1,000.00 | | $1,021.97 | | $2.86 |
*Expenses are equal to the Series’ annualized expense ratio (for the six-month period) of 0.57%, multiplied by the average account value over the period, multiplied by 181/365 (to reflect the one-half year period). Expenses are based on the most recent fiscal half year.
1
Diversified Tax Exempt Series
Portfolio Composition as of June 30, 2013
(unaudited)
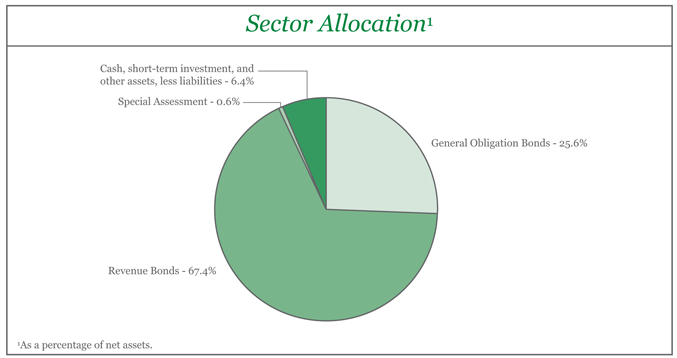
| | | | |
Credit Quality Ratings2,3 | |
Aaa | | | 16.9% | |
Aa | | | 55.3% | |
A | | | 18.9% | |
Baa | | | 2.0% | |
Unrated investments | | | 0.5% | |
Cash, short-term investment, and other assets, less liabilities | | | 6.4% | |
2 As a percentage of net assets. | |
| 3 Based on ratings from Moody’s, or the S&P equivalent. The Series may use different ratings provided by other rating agencies for purposes of determining compliance with the Series’ investment policies. | |
| | | | |
Top Ten States4 | |
Texas | | | 7.2% | |
Washington | | | 6.5% | |
Georgia | | | 6.1% | |
Florida | | | 6.0% | |
Tennessee | | | 5.4% | |
Nebraska | | | 4.9% | |
South Carolina | | | 4.8% | |
Virginia | | | 4.6% | |
Indiana | | | 4.4% | |
North Carolina | | | 4.4% | |
4 As a percentage of total investments. | | | | |
2
Diversified Tax Exempt Series
Investment Portfolio - June 30, 2013
(unaudited)
| | | | | | | | | | | | | | | | | | | | | | |
| | | COUPON
RATE | | | MATURITY
DATE | | | CREDIT
RATING1
(UNAUDITED) | | | PRINCIPAL
AMOUNT | | | VALUE (NOTE 2) | | | |
| | | | | | |
MUNICIPAL BONDS - 93.6% | | | | | | | | | | | | | | | | | | | | | | |
| | | | | | |
ALABAMA - 0.2% | | | | | | | | | | | | | | | | | | | | | | |
| | | | | | |
Fort Payne Waterworks Board, Revenue Bond, AMBAC | | | 3.500% | | | | 7/1/2015 | | | | WR2 | | | $ | 665,000 | | | $ | 665,173 | | | |
| | | | | | | | | | | | | | | | | | | | | | |
| | | | | | |
ALASKA - 0.2% | | | | | | | | | | | | | | | | | | | | | | |
| | | | | | |
Alaska Municipal Bond Bank Authority, Series 2, Revenue Bond | | | 5.000% | | | | 9/1/2022 | | | | Aa2 | | | | 500,000 | | | | 581,250 | | | |
| | | | | | | | | | | | | | | | | | | | | | |
| | | | | | |
ARIZONA - 2.1% | | | | | | | | | | | | | | | | | | | | | | |
| | | | | | |
Pima County Sewer System, Series B, Revenue Bond | | | 5.000% | | | | 7/1/2020 | | | | A3 | | | | 1,400,000 | | | | 1,631,574 | | | |
Salt River Project Agricultural Improvement & Power District, Series B, Revenue Bond | | | 4.000% | | | | 1/1/2018 | | | | Aa1 | | | | 1,000,000 | | | | 1,109,510 | | | |
Salt River Project Agricultural Improvement & Power District, Series B, Revenue Bond | | | 5.000% | | | | 12/1/2020 | | | | Aa1 | | | | 400,000 | | | | 478,264 | | | |
Salt River Project Agricultural Impt. & Power District, Series A, Revenue Bond | | | 5.000% | | | | 1/1/2035 | | | | Aa1 | | | | 1,700,000 | | | | 1,794,622 | | | |
Tucson Water Systems, Revenue Bond, NATL | | | 4.000% | | | | 7/1/2016 | | | | Aa2 | | | | 1,000,000 | | | | 1,086,680 | | | |
Yavapai County Industrial Development Authority, Northern Arizona Healthcare System, Revenue Bond | | | 5.000% | | | | 10/1/2020 | | | | AA3 | | | | 460,000 | | | | 537,045 | | | |
| | | | | | | | | | | | | | | | | | | | | | |
| | | | | | | | | | | | | | | | | | | 6,637,695 | | | |
| | | | | | | | | | | | | | | | | | | | | | |
| | | | | | |
ARKANSAS - 1.0% | | | | | | | | | | | | | | | | | | | | | | |
| | | | | | |
Arkansas State, G.O. Bond | | | 4.000% | | | | 8/1/2014 | | | | Aa1 | | | | 2,340,000 | | | | 2,436,291 | | | |
El Dorado Water & Sewer Revenue, Water Utility Impt., Revenue Bond | | | 3.000% | | | | 10/1/2030 | | | | A1 | | | | 870,000 | | | | 756,726 | | | |
| | | | | | | | | | | | | | | | | | | | | | |
| | | | | | | | | | | | | | | | | | | 3,193,017 | | | |
| | | | | | | | | | | | | | | | | | | | | | |
| | | | | | |
COLORADO - 3.0% | | | | | | | | | | | | | | | | | | | | | | |
| | | | | | |
Boulder Water & Sewer, Revenue Bond | | | 5.000% | | | | 12/1/2019 | | | | Aa1 | | | | 1,500,000 | | | | 1,796,595 | | | |
Colorado Springs Utilities System, Series C-1, Revenue Bond | | | 5.000% | | | | 11/15/2019 | | | | Aa2 | | | | 2,435,000 | | | | 2,869,745 | | | |
Colorado Water Resources & Power Development Authority, Water Resource, Series D, Revenue Bond, AGM | | | 4.375% | | | �� | 8/1/2035 | | | | Aa2 | | | | 1,420,000 | | | | 1,421,221 | | | |
Denver Wastewater Management Division Department of Public Works, Revenue Bond | | | 4.000% | | | | 11/1/2020 | | | | Aa2 | | | | 1,500,000 | | | | 1,695,990 | | | |
Platte River Power Authority, Series GG, Revenue Bond, AGM | | | 5.000% | | | | 6/1/2018 | | | | Aa2 | | | | 1,210,000 | | | | 1,404,048 | | | |
The accompanying notes are an integral part of the financial statements.
3
Diversified Tax Exempt Series
Investment Portfolio - June 30, 2013
(unaudited)
| | | | | | | | | | | | | | | | | | | | | | |
| | | COUPON
RATE | | | MATURITY
DATE | | | CREDIT
RATING1
(UNAUDITED) | | | PRINCIPAL
AMOUNT | | | VALUE (NOTE 2) | | | |
| |
MUNICIPAL BONDS (continued) | | | |
| |
COLORADO (continued) | | | |
| | | | | | |
Southlands Metropolitan District No. 1, Water Utility Impt., Prerefunded Balance, G.O. Bond | | | 7.125% | | | | 12/1/2034 | | | | AA3 | | | $ | 500,000 | | | $ | 548,210 | | | |
| | | | | | | | | | | | | | | | | | | | | | |
| | | | | | | | | | | | | | | | | | | 9,735,809 | | | |
| | | | | | | | | | | | | | | | | | | | | | |
| |
CONNECTICUT - 0.1% | | | |
| | | | | | |
Connecticut Municipal Electric Energy Cooperative, Series A, Revenue Bond | | | 4.000% | | | | 1/1/2017 | | | | Aa3 | | | | 420,000 | | | | 459,526 | | | |
| | | | | | | | | | | | | | | | | | | | | | |
| |
DELAWARE - 1.3% | | | |
| | | | | | |
Delaware State, Public Impt., G.O. Bond | | | 5.000% | | | | 3/1/2014 | | | | Aaa | | | | 1,000,000 | | | | 1,032,480 | | | |
Delaware State, Public Impt., G.O. Bond | | | 5.000% | | | | 3/1/2015 | | | | Aaa | | | | 1,710,000 | | | | 1,840,199 | | | |
New Castle County, Public Impt., Series A, G.O. Bond | | | 4.250% | | | | 7/15/2026 | | | | Aaa | | | | 1,265,000 | | | | 1,361,292 | | | |
| | | | | | | | | | | | | | | | | | | | | | |
| | | | | | | | | | | | | | | | | | | 4,233,971 | | | |
| | | | | | | | | | | | | | | | | | | | | | |
| |
DISTRICT OF COLUMBIA - 1.2% | | | |
| | | | | | |
District of Columbia Water & Sewer Authority, Water Utility Impt., Revenue Bond, AGM | | | 6.000% | | | | 10/1/2014 | | | | Aa2 | | | | 1,500,000 | | | | 1,606,800 | | | |
District of Columbia, Public Impt., Prerefunded Balance, Series A, G.O. Bond, AMBAC | | | 5.000% | | | | 6/1/2017 | | | | Aa2 | | | | 2,000,000 | | | | 2,172,460 | | | |
| | | | | | | | | | | | | | | | | | | | | | |
| | | | | | | | | | | | | | | | | | | 3,779,260 | | | |
| | | | | | | | | | | | | | | | | | | | | | |
| |
FLORIDA - 6.0% | | | |
| | | | | | |
Cape Coral, Water Utility Impt., Special Assessment, NATL | | | 4.500% | | | | 7/1/2021 | | | | A2 | | | | 1,805,000 | | | | 1,887,109 | | | |
Daytona Beach Utility System, Revenue Bond, AGM | | | 5.000% | | | | 11/1/2019 | | | | A2 | | | | 1,010,000 | | | | 1,173,893 | | | |
Florida State Department of Transportation, Series B, G.O. Bond | | | 6.375% | | | | 7/1/2014 | | | | Aa1 | | | | 1,000,000 | | | | 1,061,640 | | | |
Fort Lauderdale, Water & Sewer, Revenue Bond | | | 5.000% | | | | 9/1/2020 | | | | Aa1 | | | | 1,545,000 | | | | 1,832,478 | | | |
JEA Electric System, Series B, Revenue Bond | | | 5.000% | | | | 10/1/2015 | | | | Aa3 | | | | 1,000,000 | | | | 1,093,680 | | | |
JEA Electric System, Series B, Revenue Bond | | | 5.000% | | | | 10/1/2019 | | | | Aa3 | | | | 1,500,000 | | | | 1,752,375 | | | |
JEA Electric System, Series C, Revenue Bond | | | 3.000% | | | | 10/1/2017 | | | | Aa3 | | | | 1,085,000 | | | | 1,155,004 | | | |
Miami-Dade County, Water & Sewer System, Series C, Revenue Bond, BHAC | | | 5.000% | | | | 10/1/2015 | | | | Aa1 | | | | 700,000 | | | | 766,318 | | | |
Orlando Utilities Commission, Prerefunded Balance, Revenue Bond | | | 5.250% | | | | 10/1/2014 | | | | Aa2 | | | | 650,000 | | | | 690,547 | | | |
Orlando Utilities Commission, Revenue Bond | | | 5.000% | | | | 10/1/2019 | | | | Aa2 | | | | 740,000 | | | | 823,250 | | | |
Orlando Utilities Commission, Series A, Revenue Bond | | | 4.000% | | | | 10/1/2017 | | | | Aa2 | | | | 400,000 | | | | 445,340 | | | |
Orlando Utilities Commission, Series B, Revenue Bond | | | 5.000% | | | | 10/1/2018 | | | | Aa2 | | | | 1,175,000 | | | | 1,375,197 | | | |
The accompanying notes are an integral part of the financial statements.
4
Diversified Tax Exempt Series
Investment Portfolio - June 30, 2013
(unaudited)
| | | | | | | | | | | | | | | | | | | | | | |
| | | COUPON
RATE | | | MATURITY
DATE | | | CREDIT
RATING1
(UNAUDITED) | | | PRINCIPAL
AMOUNT | | | VALUE (NOTE 2) | | | |
| |
MUNICIPAL BONDS (continued) | | | |
| |
FLORIDA (continued) | | | |
| | | | | | |
Orlando Utilities Commission, Series C, Revenue Bond | | | 5.000% | | | | 10/1/2016 | | | | Aa2 | | | $ | 1,000,000 | | | $ | 1,129,620 | | | |
Palm Beach County, FPL Reclaimed Water Project, Revenue Bond | | | 5.000% | | | | 10/1/2040 | | | | Aaa | | | | 1,020,000 | | | | 1,086,963 | | | |
Panama City Beach, Water Utility Impt., Revenue Bond, AGC | | | 5.000% | | | | 6/1/2039 | | | | AA3 | | | | 1,000,000 | | | | 1,038,890 | | | |
Tampa Bay Water Utility System, Revenue Bond | | | 5.000% | | | | 10/1/2038 | | | | Aa2 | | | | 1,000,000 | | | | 1,056,230 | | | |
Tampa, Baycare Health System, Revenue Bond | | | 5.000% | | | | 11/15/2018 | | | | Aa2 | | | | 500,000 | | | | 574,910 | | | |
Winter Park, Water Utility Impt., Revenue Bond | | | 5.000% | | | | 12/1/2034 | | | | Aa2 | | | | 250,000 | | | | 260,865 | | | |
| | | | | | | | | | | | | | | | | | | | | | |
| | | | | | | | | | | | | | | | | | | 19,204,309 | | | |
| | | | | | | | | | | | | | | | | | | | | | |
| |
GEORGIA - 6.1% | | | |
| | | | | | |
Atlanta, Water & Wastewater, Revenue Bond, AGM | | | 5.000% | | | | 11/1/2043 | | | | A1 | | | | 1,500,000 | | | | 1,513,980 | | | |
Augusta Water & Sewer, Revenue Bond, AGM | | | 5.000% | | | | 10/1/2016 | | | | Aa3 | | | | 1,050,000 | | | | 1,184,295 | | | |
Augusta Water & Sewer, Water Utility Impt., Revenue Bond | | | 4.000% | | | | 10/1/2028 | | | | A1 | | | | 1,000,000 | | | | 1,001,490 | | | |
Catoosa County School District, School Impt., G.O. Bond | | | 4.000% | | | | 8/1/2014 | | | | AA3 | | | | 1,000,000 | | | | 1,041,130 | | | |
Cobb County, Water Utility Impt., Revenue Bond | | | 4.250% | | | | 7/1/2028 | | | | Aaa | | | | 1,000,000 | | | | 1,069,960 | | | |
Dekalb County, Water & Sewer, Series A, Revenue Bond | | | 5.000% | | | | 10/1/2018 | | | | Aa3 | | | | 1,585,000 | | | | 1,841,152 | | | |
DeKalb County, Water & Sewer, Series A, Revenue Bond | | | 5.000% | | | | 10/1/2035 | | | | Aa2 | | | | 1,000,000 | | | | 1,007,910 | | | |
Fulton County Water & Sewer, Revenue Bond | | | 5.000% | | | | 1/1/2017 | | | | Aa3 | | | | 1,000,000 | | | | 1,132,010 | | | |
Fulton County Water & Sewer, Revenue Bond | | | 5.000% | | | | 1/1/2019 | | | | Aa3 | | | | 1,200,000 | | | | 1,398,456 | | | |
Fulton County, Water Utility Impt., Prerefunded Balance, Revenue Bond, FGRNA | | | 5.000% | | | | 1/1/2035 | | | | Aa3 | | | | 1,000,000 | | | | 1,024,010 | | | |
Georgia State, Public Impt., Series D, G.O. Bond | | | 5.000% | | | | 7/1/2013 | | | | Aaa | | | | 1,100,000 | | | | 1,100,440 | | | |
Gwinnett County Water & Sewerage Authority, Water Utility Impt., Series A, Revenue Bond | | | 4.000% | | | | 8/1/2028 | | | | Aaa | | | | 1,000,000 | | | | 1,032,180 | | | |
Madison, Water & Sewer, Revenue Bond, AMBAC | | | 4.625% | | | | 7/1/2030 | | | | WR2 | | | | 1,000,000 | | | | 1,092,440 | | | |
Municipal Electric Authority of Georgia, Series A, Revenue Bond | | | 5.250% | | | | 1/1/2019 | | | | A2 | | | | 1,500,000 | | | | 1,751,370 | | | |
Municipal Electric Authority of Georgia, Series A, Revenue Bond | | | 5.250% | | | | 1/1/2019 | | | | A2 | | | | 500,000 | | | | 583,790 | | | |
Municipal Electric Authority of Georgia, Series A, Revenue Bond | | | 5.000% | | | | 11/1/2019 | | | | A1 | | | | 485,000 | | | | 564,637 | | | |
Municipal Electric Authority of Georgia, Series A, Revenue Bond | | | 5.000% | | | | 11/1/2020 | | | | A1 | | | | 1,000,000 | | | | 1,178,170 | | | |
| | | | | | | | | | | | | | | | | | | | | | |
| | | | | | | | | | | | | | | | | | | 19,517,420 | | | |
| | | | | | | | | | | | | | | | | | | | | | |
The accompanying notes are an integral part of the financial statements.
5
Diversified Tax Exempt Series
Investment Portfolio - June 30, 2013
(unaudited)
| | | | | | | | | | | | | | | | | | | | | | |
| | | COUPON
RATE | | | MATURITY
DATE | | | CREDIT
RATING1
(UNAUDITED) | | | PRINCIPAL
AMOUNT | | | VALUE
(NOTE 2) | | | |
| |
MUNICIPAL BONDS (continued) | | | |
| | | | | | |
HAWAII - 1.6% | | | | | | | | | | | | | | | | | | | | | | |
| | | | | | |
Hawaii State, Series DB, G.O. Bond, NATL | | | 5.250% | | | | 9/1/2013 | | | | Aa2 | | | $ | 875,000 | | | $ | 882,709 | | | |
Hawaii State, Series DG, G.O. Bond, AMBAC | | | 5.000% | | | | 7/1/2014 | | | | Aa2 | | | | 500,000 | | | | 524,060 | | | |
Hawaii State, Series DT, G.O. Bond | | | 5.000% | | | | 11/1/2014 | | | | Aa2 | | | | 550,000 | | | | 584,733 | | | |
Honolulu County, Sewer Impt., Series A, Revenue Bond, FGRNA | | | 5.000% | | | | 7/1/2035 | | | | Aa2 | | | | 500,000 | | | | 525,850 | | | |
Honolulu County, Sewer Impt., Series B, Revenue Bond | | | 5.000% | | | | 7/1/2020 | | | | Aa2 | | | | 820,000 | | | | 977,473 | | | |
Honolulu County, Sewer Impt., Series B, Revenue Bond | | | 3.000% | | | | 7/1/2024 | | | | Aa2 | | | | 1,000,000 | | | | 983,850 | | | |
Honolulu County, Water Utility Impt., Prerefunded Balance, G.O. Bond, FGIC | | | 6.000% | | | | 12/1/2014 | | | | Aa1 | | | | 750,000 | | | | 809,993 | | | |
| | | | | | | | | | | | | | | | | | | | | | |
| | | | | | | | | | | | | | | | | | | 5,288,668 | | | |
| | | | | | | | | | | | | | | | | | | | | | |
| | | | | | |
ILLINOIS - 0.3% | | | | | | | | | | | | | | | | | | | | | | |
| | | | | | |
Springfield, Electric Light & Power Impt., Revenue Bond, NATL | | | 5.000% | | | | 3/1/2035 | | | | A3 | | | | 1,000,000 | | | | 1,000,430 | | | |
| | | | | | | | | | | | | | | | | | | | | | |
| | | | | | |
INDIANA - 4.3% | | | | | | | | | | | | | | | | | | | | | | |
| | | | | | |
Avon Community School Building Corp., Revenue Bond, AMBAC | | | 4.250% | | | | 7/15/2018 | | | | A3 | | | | 1,450,000 | | | | 1,579,891 | | | |
Avon Community School Building Corp., Revenue Bond, AMBAC | | | 4.750% | | | | 1/15/2032 | | | | A3 | | | | 1,015,000 | | | | 1,028,012 | | | |
Fort Wayne Sewage Works, Sewer Impt., Series B, Revenue Bond | | | 2.000% | | | | 8/1/2022 | | | | Aa3 | | | | 1,125,000 | | | | 1,025,921 | | | |
Fort Wayne Waterworks, Water Utility Impt., Revenue Bond | | | 2.000% | | | | 12/1/2020 | | | | Aa3 | | | | 745,000 | | | | 714,656 | | | |
Indiana Finance Authority, Beacon Health System, Series A, Revenue Bond | | | 5.000% | | | | 8/15/2017 | | | | AA3 | | | | 500,000 | | | | 569,055 | | | |
Indiana Municipal Power Agency, Series A, Revenue Bond, NATL | | | 5.000% | | | | 1/1/2042 | | | | A1 | | | | 1,000,000 | | | | 1,015,270 | | | |
Indiana Transportation Finance Authority, Highway Impt., Prerefunded Balance, Series A, Revenue Bond, FGIC | | | 5.250% | | | | 6/1/2026 | | | | Aa1 | | | | 1,380,000 | | | | 1,443,176 | | | |
Indianapolis Local Public Impt. Bond Bank, Waterworks Project, Series A, Revenue Bond, AGC | | | 5.500% | | | | 1/1/2038 | | | | A2 | | | | 1,000,000 | | | | 1,066,370 | | | |
Lafayette, Sewage Works, Revenue Bond | | | 4.000% | | | | 7/1/2017 | | | | AA3 | | | | 500,000 | | | | 550,410 | | | |
Lafayette, Sewer Impt., Revenue Bond | | | 3.000% | | | | 1/1/2017 | | | | AA3 | | | | 470,000 | | | | 496,818 | | | |
Lafayette, Sewer Impt., Revenue Bond | | | 3.000% | | | | 7/1/2018 | | | | AA3 | | | | 475,000 | | | | 503,248 | | | |
Plainfield Sewage Works, Series A, Revenue Bond | | | 4.650% | | | | 1/1/2027 | | | | AA3 | | | | 645,000 | | | | 669,355 | | | |
The accompanying notes are an integral part of the financial statements.
6
Diversified Tax Exempt Series
Investment Portfolio - June 30, 2013
(unaudited)
| | | | | | | | | | | | | | | | | | | | | | |
| | | COUPON
RATE | | | MATURITY
DATE | | | CREDIT
RATING1
(UNAUDITED) | | | PRINCIPAL
AMOUNT | | | VALUE (NOTE 2) | | | |
| | | | | | |
MUNICIPAL BONDS (continued) | | | | | | | | | | | | | | | | | | | | | | |
| | | | | | |
INDIANA (continued) | | | | | | | | | | | | | | | | | | | | | | |
| | | | | | |
Shelbyville Central Renovation School Building Corp., Revenue Bond, NATL | | | 5.000% | | | | 7/15/2018 | | | | Baa1 | | | $ | 3,000,000 | | | $ | 3,216,390 | | | |
| | | | | | | | | | | | | | | | | | | | | | |
| | | | | | | | | | | | | | | | | | | 13,878,572 | | | |
| | | | | | | | | | | | | | | | | | | | | | |
| | | | | | |
IOWA - 2.0% | | | | | | | | | | | | | | | | | | | | | | |
| | | | | | |
Cedar Rapids, Series E, G.O. Bond | | | 3.000% | | | | 6/1/2014 | | | | Aaa | | | | 1,000,000 | | | | 1,025,030 | | | |
Des Moines Waterworks Board, Series B, Revenue Bond | | | 3.000% | | | | 12/1/2025 | | | | Aa1 | | | | 1,000,000 | | | | 980,950 | | | |
Dubuque, Series D, Revenue Bond | | | 4.000% | | | | 6/1/2030 | | | | Aa3 | | | | 470,000 | | | | 466,560 | | | |
Linn-Mar Community School District, School Impt., Revenue Bond | | | 4.625% | | | | 7/1/2029 | | | | A2 | | | | 1,000,000 | | | | 1,068,730 | | | |
Polk County, Public Impt., Series C, G.O. Bond | | | 4.000% | | | | 6/1/2017 | | | | Aaa | | | | 995,000 | | | | 1,027,566 | | | |
Sioux City, Public Impt., Series A, G.O. Bond | | | 2.000% | | | | 6/1/2014 | | | | Aa1 | | | | 940,000 | | | | 954,777 | | | |
West Des Moines, Series B, G.O. Bond | | | 2.000% | | | | 6/1/2014 | | | | AAA3 | | | | 1,000,000 | | | | 1,016,660 | | | |
| | | | | | | | | | | | | | | | | | | | | | |
| | | | | | | | | | | | | | | | | | | 6,540,273 | | | |
| | | | | | | | | | | | | | | | | | | | | | |
| | | | | | |
KANSAS - 0.7% | | | | | | | | | | | | | | | | | | | | | | |
| | | | | | |
Johnson County Water District No. 1, Revenue Bond | | | 3.250% | | | | 12/1/2030 | | | | Aaa | | | | 1,000,000 | | | | 911,220 | | | |
Kansas Development Finance Authority, Series D, Revenue Bond | | | 5.000% | | | | 11/15/2020 | | | | Aa3 | | | | 500,000 | | | | 568,350 | | | |
Topeka Combined Utility Revenue, Series A, Revenue Bond | | | 4.000% | | | | 8/1/2019 | | | | Aa3 | | | | 845,000 | | | | 936,015 | | | |
| | | | | | | | | | | | | | | | | | | | | | |
| | | | | | | | | | | | | | | | | | | 2,415,585 | | | |
| | | | | | | | | | | | | | | | | | | | | | |
| | | | | | |
LOUISIANA - 0.6% | | | | | | | | | | | | | | | | | | | | | | |
| | | | | | |
Caddo Parish Parishwide School District, Prerefunded Balance, G.O. Bond, NATL | | | 4.350% | | | | 3/1/2026 | | | | Aa2 | | | | 660,000 | | | | 702,636 | | | |
Caddo Parish Parishwide School District, Prerefunded Balance, G.O. Bond, NATL | | | 4.375% | | | | 3/1/2027 | | | | Aa2 | | | | 1,090,000 | | | | 1,160,872 | | | |
| | | | | | | | | | | | | | | | | | | | | | |
| | | | | | | | | | | | | | | | | | | 1,863,508 | | | |
| | | | | | | | | | | | | | | | | | | | | | |
| | | | | | |
MAINE - 0.5% | | | | | | | | | | | | | | | | | | | | | | |
| | | | | | |
Falmouth, School Impt., G.O. Bond | | | 2.000% | | | | 11/15/2014 | | | | Aa1 | | | | 1,000,000 | | | | 1,022,180 | | | |
Maine Municipal Bond Bank, Various Purposes Impt., Series E, Revenue Bond | | | 4.000% | | | | 11/1/2021 | | | | Aa2 | | | | 570,000 | | | | 632,706 | | | |
| | | | | | | | | | | | | | | | | | | | | | |
| | | | | | | | | | | | | | | | | | | 1,654,886 | | | |
| | | | | | | | | | | | | | | | | | | | | | |
| | | | | | |
MARYLAND - 1.6% | | | | | | | | | | | | | | | | | | | | | | |
| | | | | | |
Frederick County, Series C, G.O. Bond | | | 4.000% | | | | 12/1/2014 | | | | Aa1 | | | | 1,410,000 | | | | 1,484,392 | | | |
The accompanying notes are an integral part of the financial statements.
7
Diversified Tax Exempt Series
Investment Portfolio - June 30, 2013
(unaudited)
| | | | | | | | | | | | | | | | | | | | | | |
| | | COUPON
RATE | | | MATURITY
DATE | | | CREDIT
RATING1
(UNAUDITED) | | | PRINCIPAL
AMOUNT | | | VALUE (NOTE 2) | | | |
| | | | | |
MUNICIPAL BONDS (continued) | | | | | | | | | | | | | | | | | | | |
| | | | | |
MARYLAND (continued) | | | | | | | | | | | | | | | | | | | |
| | | | | | |
Maryland Health & Higher Educational Facilities Authority, Revenue Bond | | | 5.000% | | | | 7/1/2019 | | | | A2 | | | $ | 500,000 | | | $ | 570,540 | | | |
Maryland State, Public Impt., Prerefunded Balance, Second Series, G.O. Bond | | | 5.000% | | | | 8/1/2015 | | | | Aaa | | | | 1,000,000 | | | | 1,004,350 | | | |
Maryland State, Public Impt., Second Series, G.O. Bond | | | 5.000% | | | | 7/15/2014 | | | | Aaa | | | | 1,000,000 | | | | 1,050,120 | | | |
Prince George’s County, Public Impt., Series A, G.O. Bond | | | 4.000% | | | | 9/15/2014 | | | | Aaa | | | | 550,000 | | | | 575,097 | | | |
Prince George’s County, School Impt., G.O. Bond | | | 5.500% | | | | 10/1/2013 | | | | Aaa | | | | 400,000 | | | | 405,492 | | | |
| | | | | | | | | | | | | | | | | | | | | | |
| | | | | | | | | | | | | | | | | | | 5,089,991 | | | |
| | | | | | | | | | | | | | | | | | | | | | |
| | | | | | |
MASSACHUSETTS - 3.7% | | | | | | | | | | | | | | | | | | | | | | |
| | | | | | |
Boston Water & Sewer Commission, Series A, Revenue Bond | | | 5.000% | | | | 11/1/2031 | | | | Aa1 | | | | 1,000,000 | | | | 1,095,320 | | | |
Boston, Public Impt., Series A, G.O. Bond | | | 5.000% | | | | 1/1/2015 | | | | Aaa | | | | 500,000 | | | | 534,315 | | | |
Commonwealth of Massachusetts, Prerefunded Balance, Series D, G.O. Bond, AGM | | | 5.000% | | | | 12/1/2023 | | | | Aa1 | | | | 1,000,000 | | | | 1,066,980 | | | |
Commonwealth of Massachusetts, Public Impt., Prerefunded Balance, Series A, G.O. Bond, AGM | | | 5.000% | | | | 3/1/2021 | | | | Aa1 | | | | 500,000 | | | | 537,715 | | | |
Commonwealth of Massachusetts, Public Impt., Series C, G.O. Bond | | | 5.000% | | | | 9/1/2013 | | | | Aa1 | | | | 1,790,000 | | | | 1,805,018 | | | |
Commonwealth of Massachusetts, Public Impt., Series D, G.O. Bond, NATL | | | 6.000% | | | | 11/1/2013 | | | | Aa1 | | | | 520,000 | | | | 530,260 | | | |
Commonwealth of Massachusetts, Series B, G.O. Bond | | | 4.000% | | | | 7/1/2013 | | | | Aa1 | | | | 590,000 | | | | 590,189 | | | |
Commonwealth of Massachusetts, Series B, G.O. Bond | | | 3.000% | | | | 7/1/2013 | | | | Aa1 | | | | 500,000 | | | | 500,115 | | | |
Commonwealth of Massachusetts, Series D, G.O. Bond | | | 5.250% | | | | 10/1/2014 | | | | Aa1 | | | | 1,000,000 | | | | 1,061,920 | | | |
Hanover, Public Impt., G.O. Bond | | | 3.000% | | | | 5/15/2015 | | | | Aa2 | | | | 910,000 | | | | 950,486 | | | |
Massachusetts Health & Educational Facilities Authority, Series G, Revenue Bond | | | 5.000% | | | | 7/1/2018 | | | | Aa2 | | | | 600,000 | | | | 673,938 | | | |
Massachusetts Municipal Wholesale Electric Co., Series A, Revenue Bond | | | 5.000% | | | | 7/1/2015 | | | | A3 | | | | 500,000 | | | | 541,760 | | | |
Massachusetts Water Resources Authority, Series A, Revenue Bond, AGM | | | 4.375% | | | | 8/1/2032 | | | | Aa1 | | | | 2,000,000 | | | | 2,038,880 | | | |
| | | | | | | | | | | | | | | | | | | | | | |
| | | | | | | | | | | | | | | | | | | 11,926,896 | | | |
| | | | | | | | | | | | | | | | | | | | | | |
| | | | | | |
MINNESOTA - 1.3% | | | | | | | | | | | | | | | | | | | | | | |
| | | | | | |
Hennepin County, Series B, G.O. Bond | | | 4.000% | | | | 12/1/2014 | | | | Aaa | | | | 1,000,000 | | | | 1,052,910 | | | |
Minnesota State, Public Impt., Prerefunded Balance, G.O. Bond | | | 5.000% | | | | 8/1/2013 | | | | Aa1 | | | | 2,000,000 | | | | 2,008,620 | | | |
The accompanying notes are an integral part of the financial statements.
8
Diversified Tax Exempt Series
Investment Portfolio - June 30, 2013
(unaudited)
| | | | | | | | | | | | | | | | | | | | | | |
| | | COUPON
RATE | | | MATURITY
DATE | | | CREDIT
RATING1
(UNAUDITED) | | | PRINCIPAL
AMOUNT | | | VALUE (NOTE 2) | | | |
| | | | | | |
MUNICIPAL BONDS (continued) | | | | | | | | | | | | | | | | | | | | | | |
| | | | | | |
MINNESOTA (continued) | | | | | | | | | | | | | | | | | | | | | | |
| | | | | | |
Minnesota State, Series C, G.O. Bond | | | 5.000% | | | | 8/1/2014 | | | | Aa1 | | | $ | 1,000,000 | | | $ | 1,052,050 | | | |
Western Minnesota Municipal Power Agency, Prerefunded Balance, Revenue Bond | | | 6.625% | | | | 1/1/2016 | | | | Aaa | | | | 95,000 | | | | 103,651 | | | |
| | | | | | | | | | | | | | | | | | | | | | |
| | | | | | | | | | | | | | | | | | | 4,217,231 | | | |
| | | | | | | | | | | | | | | | | | | | | | |
| | | | | | |
MISSOURI - 3.6% | | | | | | | | | | | | | | | | | | | | | | |
| | | | | | |
Columbia, Electric Light & Power Impt., Series A, Revenue Bond | | | 5.000% | | | | 10/1/2013 | | | | AA3 | | | | 1,000,000 | | | | 1,012,200 | | | |
Columbia, Water Utility Impt., Series A, Revenue Bond | | | 4.125% | | | | 10/1/2033 | | | | AA3 | | | | 995,000 | | | | 1,017,606 | | | |
Kansas City, Sanitary Sewer System, Revenue Bond | | | 4.000% | | | | 1/1/2017 | | | | Aa2 | | | | 2,155,000 | | | | 2,366,362 | | | |
Kansas City, Sanitary Sewer System, Series A, Revenue Bond | | | 2.000% | | | | 1/1/2018 | | | | Aa2 | | | | 2,425,000 | | | | 2,477,671 | | | |
Metropolitan St. Louis Sewer District, Series B, Revenue Bond | | | 5.000% | | | | 5/1/2033 | | | | Aa1 | | | | 940,000 | | | | 1,031,396 | | | |
Missouri Joint Municipal Electric Utility Commission, Series A, Revenue Bond, AMBAC | | | 5.000% | | | | 1/1/2021 | | | | A3 | | | | 1,535,000 | | | | 1,695,760 | | | |
Missouri State, Series A, G.O. Bond | | | 5.000% | | | | 10/1/2014 | | | | Aaa | | | | 830,000 | | | | 879,493 | | | |
Springfield, Electric Light & Power Impt., Revenue Bond, FGRNA | | | 4.750% | | | | 8/1/2031 | | | | Aa3 | | | | 1,015,000 | | | | 1,055,093 | | | |
| | | | | | | | | | | | | | | | | | | | | | |
| | | | | | | | | | | | | | | | | | | 11,535,581 | | | |
| | | | | | | | | | | | | | | | | | | | | | |
| | | | | | |
NEBRASKA - 4.9% | | | | | | | | | | | | | | | | | | | | | | |
| | | | | | |
Lincoln Electric System, Revenue Bond | | | 5.000% | | | | 9/1/2021 | | | | AA3 | | | | 2,000,000 | | | | 2,381,100 | | | |
Municipal Energy Agency of Nebraska, Series A, Revenue Bond | | | 5.000% | | | | 4/1/2018 | | | | A2 | | | | 630,000 | | | | 724,254 | | | |
Nebraska Public Power District, Series A, Revenue Bond | | | 5.000% | | | | 1/1/2019 | | | | A1 | | | | 500,000 | | | | 580,415 | | | |
Nebraska Public Power District, Series B, Revenue Bond | | | 3.000% | | | | 1/1/2016 | | | | A1 | | | | 905,000 | | | | 951,110 | | | |
Nebraska Public Power District, Series B, Revenue Bond | | | 5.000% | | | | 1/1/2019 | | | | A1 | | | | 600,000 | | | | 681,390 | | | |
Nebraska Public Power District, Series B, Revenue Bond | | | 5.000% | | | | 1/1/2020 | | | | A1 | | | | 1,000,000 | | | | 1,164,970 | | | |
Nebraska Public Power District, Series C, Revenue Bond | | | 5.000% | | | | 1/1/2018 | | | | A1 | | | | 2,160,000 | | | | 2,484,302 | | | |
Omaha Metropolitan Utilities District, Series A, Revenue Bond, AGM | | | 4.375% | | | | 12/1/2031 | | | | A1 | | | | 2,640,000 | | | | 2,649,504 | | | |
Omaha Public Power District, Series AA, Revenue Bond, FGRNA | | | 4.500% | | | | 2/1/2034 | | | | Aa2 | | | | 1,950,000 | | | | 1,950,527 | | | |
Omaha Public Power District, Series B, Revenue Bond | | | 3.000% | | | | 2/1/2018 | | | | Aa1 | | | | 600,000 | | | | 639,660 | | | |
The accompanying notes are an integral part of the financial statements.
9
Diversified Tax Exempt Series
Investment Portfolio - June 30, 2013
(unaudited)
| | | | | | | | | | | | | | | | | | | | | | |
| | | COUPON
RATE | | | MATURITY
DATE | | | CREDIT
RATING1
(UNAUDITED) | | | PRINCIPAL
AMOUNT | | | VALUE (NOTE 2) | | | |
| |
MUNICIPAL BONDS (continued) | | | |
| |
NEBRASKA (continued) | | | |
| | | | | | |
Omaha Public Power District, Series C, Revenue Bond | | | 5.000% | | | | 2/1/2019 | | | | Aa1 | | | $ | 1,265,000 | | | $ | 1,483,288 | | | |
| | | | | | | | | | | | | | | | | | | | | | |
| | | | | | | | | | | | | | | | | | | 15,690,520 | | | |
| | | | | | | | | | | | | | | | | | | | | | |
| | | | | | |
NEW HAMPSHIRE - 1.4% | | | | | | | | | | | | | | | | | | | | | | |
| | | | | | |
New Hampshire State, Public Impt., Series B, G.O. Bond | | | 5.000% | | | | 2/1/2015 | | | | Aa1 | | | | 2,000,000 | | | | 2,143,420 | | | |
New Hampshire State, Series A, G.O. Bond, NATL | | | 5.000% | | | | 10/15/2014 | | | | Aa1 | | | | 1,500,000 | | | | 1,591,485 | | | |
Portsmouth, Public Impt., G.O. Bond | | | 2.500% | | | | 5/15/2015 | | | | Aa1 | | | | 820,000 | | | | 847,306 | | | |
| | | | | | | | | | | | | | | | | | | | | | |
| | | | | | | | | | | | | | | | | | | 4,582,211 | | | |
| | | | | | | | | | | | | | | | | | | | | | |
| | | | | | |
NEW JERSEY - 0.1% | | | | | | | | | | | | | | | | | | | | | | |
| | | | | | |
New Jersey Health Care Facilities Financing Authority, Kennedy Health System, Revenue Bond | | | 2.000% | | | | 7/1/2018 | | | | A3 | | | | 455,000 | | | | 454,468 | | | |
| | | | | | | | | | | | | | | | | | | | | | |
| | | | | | |
NEW MEXICO - 0.3% | | | | | | | | | | | | | | | | | | | | | | |
| | | | | | |
Santa Fe County, Public Impt., G.O. Bond | | | 2.500% | | | | 7/1/2013 | | | | Aaa | | | | 915,000 | | | | 915,174 | | | |
| | | | | | | | | | | | | | | | | | | | | | |
| | | | | | |
NEW YORK - 1.6% | | | | | | | | | | | | | | | | | | | | | | |
| | | | | | |
New York City Municipal Water Finance Authority, Water & Sewer Systems, Series A, Revenue Bond | | | 5.750% | | | | 6/15/2040 | | | | Aa1 | | | | 2,590,000 | | | | 2,918,982 | | | |
New York State Dormitory Authority, Series 1, Revenue Bond | | | 4.000% | | | | 7/1/2020 | | | | Aa3 | | | | 420,000 | | | | 467,128 | | | |
New York State Power Authority, Series A, Revenue Bond, NATL | | | 4.500% | | | | 11/15/2047 | | | | Aa2 | | | | 1,000,000 | | | | 1,005,090 | | | |
New York State Thruway Authority, Highway Impt., Series H, Revenue Bond, NATL | | | 5.000% | | | | 1/1/2017 | | | | A1 | | | | 600,000 | | | | 675,456 | | | |
| | | | | | | | | | | | | | | | | | | | | | |
| | | | | | | | | | | | | | | | | | | 5,066,656 | | | |
| | | | | | | | | | | | | | | | | | | | | | |
| | | | | | |
NORTH CAROLINA - 4.3% | | | | | | | | | | | | | | | | | | | | | | |
| | | | | | |
Charlotte, G.O. Bond | | | 5.000% | | | | 8/1/2014 | | | | Aaa | | | | 750,000 | | | | 789,037 | | | |
Charlotte, Water & Sewer, Revenue Bond | | | 5.000% | | | | 12/1/2020 | | | | Aaa | | | | 1,400,000 | | | | 1,691,018 | | | |
Charlotte, Water & Sewer, Revenue Bond | | | 5.000% | | | | 7/1/2038 | | | | Aaa | | | | 1,000,000 | | | | 1,063,690 | | | |
Charlotte, Water & Sewer, Series B, Revenue Bond | | | 4.625% | | | | 7/1/2039 | | | | Aaa | | | | 1,000,000 | | | | 1,043,460 | | | |
Charlotte-Mecklenburg Hospital Authority, Series A, Revenue Bond | | | 5.000% | | | | 1/15/2017 | | | | Aa3 | | | | 415,000 | | | | 467,236 | | | |
Concord, Utilities Systems, Revenue Bond, AGC | | | 4.000% | | | | 12/1/2017 | | | | Aa2 | | | | 880,000 | | | | 981,605 | | | |
Forsyth County, G.O. Bond | | | 3.000% | | | | 3/1/2015 | | | | Aaa | | | | 1,000,000 | | | | 1,042,450 | | | |
Gaston County, School Impt., G.O. Bond, AGM | | | 5.000% | | | | 4/1/2014 | | | | Aa2 | | | | 1,000,000 | | | | 1,035,880 | | | |
The accompanying notes are an integral part of the financial statements.
10
Diversified Tax Exempt Series
Investment Portfolio - June 30, 2013
(unaudited)
| | | | | | | | | | | | | | | | | | | | | | |
| | | COUPON
RATE | | | MATURITY
DATE | | | CREDIT
RATING1
(UNAUDITED) | | | PRINCIPAL
AMOUNT | | | VALUE (NOTE 2) | | | |
| |
MUNICIPAL BONDS (continued) | | | |
| |
NORTH CAROLINA (continued) | | | |
| | | | | | |
North Carolina Eastern Municipal Power Agency, Series A, Revenue Bond , AGC | | | 5.250% | | | | 1/1/2019 | | | | A3 | | | $ | 1,265,000 | | | $ | 1,444,326 | | | |
North Carolina Medical Care Commission, Moses Cone Health System, Revenue Bond | | | 5.000% | | | | 10/1/2020 | | | | AA3 | | | | 580,000 | | | | 666,443 | | | |
North Carolina Municipal Power Agency No. 1 Catawba, Series A, Revenue Bond | | | 5.000% | | | | 1/1/2030 | | | | A2 | | | | 1,000,000 | | | | 1,060,660 | | | |
North Carolina Municipal Power Agency No. 1, Series A, Revenue Bond | | | 5.250% | | | | 1/1/2017 | | | | A2 | | | | 1,000,000 | | | | 1,132,830 | | | |
North Carolina Municipal Power Agency No. 1, Series A, Revenue Bond | | | 5.000% | | | | 1/1/2020 | | | | A2 | | | | 400,000 | | | | 463,104 | | | |
Wake County, School Impt., G.O. Bond | | | 5.000% | | | | 3/1/2015 | | | | Aaa | | | | 890,000 | | | | 957,453 | | | |
| | | | | | | | | | | | | | | | | | | | | | |
| | | | | | | | | | | | | | | | | | | 13,839,192 | | | |
| | | | | | | | | | | | | | | | | | | | | | |
| | | | | | |
NORTH DAKOTA - 0.2% | | | | | | | | | | | | | | | | | | | | | | |
| | | | | | |
Fargo, Health System, Revenue Bond | | | 5.500% | | | | 11/1/2016 | | | | A1 | | | | 450,000 | | | | 510,381 | | | |
| | | | | | | | | | | | | | | | | | | | | | |
| | | | | | |
OHIO - 0.2% | | | | | | | | | | | | | | | | | | | | | | |
| | | | | | |
American Municipal Power, Inc., Prairie State Energy Campus Project, Series A, Revenue Bond | | | 5.250% | | | | 2/15/2023 | | | | A1 | | | | 450,000 | | | | 499,671 | | | |
| | | | | | | | | | | | | | | | | | | | | | |
| | | | | | |
OKLAHOMA - 0.9% | | | | | | | | | | | | | | | | | | | | | | |
| | | | | | |
Oklahoma City Water Utilities Trust, Series B, Revenue Bond | | | 3.000% | | | | 7/1/2013 | | | | Aa1 | | | | 500,000 | | | | 500,115 | | | |
Oklahoma Development Finance Authority, Series C, Revenue Bond | | | 5.000% | | | | 8/15/2018 | | | | Aa3 | | | | 500,000 | | | | 571,615 | | | |
Tulsa, Public Impt., G.O. Bond | | | 4.000% | | | | 12/1/2013 | | | | Aa1 | | | | 1,700,000 | | | | 1,727,064 | | | |
| | | | | | | | | | | | | | | | | | | | | | |
| | | | | | | | | | | | | | | | | | | 2,798,794 | | | |
| | | | | | | | | | | | | | | | | | | | | | |
| | | | | | |
OREGON - 1.3% | | | | | | | | | | | | | | | | | | | | | | |
| | | | | | |
Medford Hospital Facilities Authority, Asante Health System, Revenue Bond, AGM | | | 5.000% | | | | 8/15/2019 | | | | AA3 | | | | 440,000 | | | | 504,090 | | | |
Portland Sewer System, Series A, Revenue Bond | | | 5.000% | | | | 6/15/2018 | | | | Aa2 | | | | 585,000 | | | | 680,244 | | | |
Portland, Water Utility Impt., Series A, Revenue Bond | | | 5.000% | | | | 5/1/2034 | | | | Aaa | | | | 1,000,000 | | | | 1,084,200 | | | |
Portland, Water Utility Impt., Series A, Revenue Bond, NATL | | | 4.500% | | | | 10/1/2031 | | | | Aa1 | | | | 550,000 | | | | 613,800 | | | |
Washington County Clean Water Services, Sewer Impt., Series B, Revenue Bond | | | 5.000% | | | | 10/1/2021 | | | | Aa2 | | | | 1,015,000 | | | | 1,208,459 | | | |
| | | | | | | | | | | | | | | | | | | | | | |
| | | | | | | | | | | | | | | | | | | 4,090,793 | | | |
| | | | | | | | | | | | | | | | | | | | | | |
The accompanying notes are an integral part of the financial statements.
11
Diversified Tax Exempt Series
Investment Portfolio - June 30, 2013
(unaudited)
| | | | | | | | | | | | | | | | | | | | | | |
| | | COUPON
RATE | | | MATURITY
DATE | | | CREDIT
RATING1
(UNAUDITED) | | | PRINCIPAL
AMOUNT | | | VALUE
(NOTE 2) | | | |
| | | | | |
MUNICIPAL BONDS (continued) | | | | | | | | | | | | | | | | | | | |
| | | | | | |
PENNSYLVANIA - 2.3% | | | | | | | | | | | | | | | | | | | | | | |
| | | | | | |
Allegheny County Hospital Development Authority, University of Pittsburgh Medical Center, Series A, Revenue Bond | | | 5.000% | | | | 5/15/2018 | | | | Aa3 | | | $ | 500,000 | | | $ | 572,055 | | | |
Central Bradford Progress Authority, Guthrie Healthcare System, Revenue Bond | | | 5.250% | | | | 12/1/2018 | | | | AA3 | | | | 600,000 | | | | 695,418 | | | |
North Wales Water Authority, Series A, Revenue Bond | | | 5.000% | | | | 11/1/2020 | | | | AA3 | | | | 1,000,000 | | | | 1,180,390 | | | |
Philadelphia, Water & Wastewater, Prerefunded Balance, Revenue Bond, NATL | | | 5.600% | | | | 8/1/2018 | | | | A3 | | | | 20,000 | | | | 23,343 | | | |
Philadelphia, Water & Wastewater, Series B, Revenue Bond | | | 5.000% | | | | 11/1/2018 | | | | A1 | | | | 1,370,000 | | | | 1,580,679 | | | |
Philadelphia, Water & Wastewater, Series B, Revenue Bond | | | 5.000% | | | | 11/1/2022 | | | | A1 | | | | 1,115,000 | | | | 1,276,653 | | | |
Philadelphia, Water & Wastewater, Series C, Revenue Bond, AGM | | | 5.000% | | | | 8/1/2017 | | | | A1 | | | | 1,000,000 | | | | 1,143,060 | | | |
Plum Boro School District, Prerefunded Balance, Series A, G.O. Bond, FGRNA | | | 4.500% | | | | 9/15/2030 | | | | A3 | | | | 855,000 | | | | 862,686 | | | |
| | | | | | | | | | | | | | | | | | | | | | |
| | | | | | | | | | | | | | | | | | | 7,334,284 | | | |
| | | | | | | | | | | | | | | | | | | | | | |
| | | | | | |
RHODE ISLAND - 0.6% | | | | | | | | | | | | | | | | | | | | | | |
| | | | | | |
Narragansett Bay Commission, Sewer Impt., Series A, Revenue Bond, NATL | | | 5.000% | | | | 8/1/2035 | | | | Baa1 | | | | 1,000,000 | | | | 1,042,320 | | | |
Rhode Island Clean Water Finance Agency, Series A, Revenue Bond, NATL | | | 5.000% | | | | 10/1/2035 | | | | Baa1 | | | | 1,000,000 | | | | 1,000,700 | | | |
| | | | | | | | | | | | | | | | | | | | | | |
| | | | | | | | | | | | | | | | | | | 2,043,020 | | | |
| | | | | | | | | | | | | | | | | | | | | | |
| | | | | | |
SOUTH CAROLINA - 4.8% | | | | | | | | | | | | | | | | | | | | | | |
| | | | | | |
Anderson, Water & Sewer Revenue Bond, AGM | | | 5.000% | | | | 7/1/2026 | | | | Aa3 | | | | 1,715,000 | | | | 1,924,985 | | | |
Charleston, Water Utility & Capital Impt., Revenue Bond | | | 5.000% | | | | 1/1/2022 | | | | Aa1 | | | | 530,000 | | | | 626,158 | | | |
South Carolina Public Service Authority, Series C, Revenue Bond | | | 5.000% | | | | 12/1/2020 | | | | Aa3 | | | | 1,000,000 | | | | 1,186,610 | | | |
South Carolina Public Service Authority, Water Utility Impt., Series A, Revenue Bond, AMBAC | | | 4.250% | | | | 1/1/2017 | | | | Aa3 | | | | 1,550,000 | | | | 1,715,881 | | | |
South Carolina State Public Service Authority, Public Impt., Prerefunded Balance, Series A, Revenue Bond, AGM | | | 5.000% | | | | 1/1/2017 | | | | Aa3 | | | | 1,000,000 | | | | 1,024,010 | | | |
South Carolina State Public Service Authority, Series A, Revenue Bond | | | 4.000% | | | | 12/1/2017 | | | | Aa3 | | | | 1,860,000 | | | | 2,076,448 | | | |
South Carolina State Public Service Authority, Series B, Revenue Bond, NATL | | | 5.000% | | | | 1/1/2019 | | | | Aa3 | | | | 1,000,000 | | | | 1,165,380 | | | |
The accompanying notes are an integral part of the financial statements.
12
Diversified Tax Exempt Series
Investment Portfolio - June 30, 2013
(unaudited)
| | | | | | | | | | | | | | | | | | | | | | |
| | | COUPON
RATE | | | MATURITY
DATE | | | CREDIT
RATING1
(UNAUDITED) | | | PRINCIPAL
AMOUNT | | | VALUE (NOTE 2) | | | |
| | | | | | |
MUNICIPAL BONDS (continued) | | | | | | | | | | | | | | | | | | | | | | |
| | | | | | |
SOUTH CAROLINA (continued) | | | | | | | | | | | | | | | | | | | | | | |
| | | | | | |
South Carolina Transportation Infrastructure Bank, Series B, Revenue Bond, AMBAC | | | 4.250% | | | | 10/1/2027 | | | | A1 | | | $ | 2,000,000 | | | $ | 2,009,560 | | | |
South Carolina, State Institutional - South Carolina State University, Series B, G.O. Bond | | | 5.250% | | | | 4/1/2014 | | | | Aaa | | | | 1,000,000 | | | | 1,038,210 | | | |
Spartanburg Sanitation Sewer District, Prerefunded Balance, Series B, Revenue Bond, NATL | | | 5.000% | | | | 3/1/2032 | | | | A1 | | | | 1,500,000 | | | | 1,546,980 | | | |
Sumter, Water Utility Impt., Revenue Bond, XLCA | | | 4.500% | | | | 12/1/2032 | | | | A1 | | | | 1,000,000 | | | | 1,002,360 | | | |
| | | | | | | | | | | | | | | | | | | | | | |
| | | | | | | | | | | | | | | | | | | 15,316,582 | | | |
| | | | | | | | | | | | | | | | | | | | | | |
| | | | | | |
SOUTH DAKOTA - 0.1% | | | | | | | | | | | | | | | | | | | | | | |
| | | | | | |
Rapid City, Water Utility Impt., Revenue Bond | | | 5.250% | | | | 11/1/2039 | | | | Aa3 | | | | 450,000 | | | | 479,651 | | | |
| | | | | | | | | | | | | | | | | | | | | | |
| | | | | | |
TENNESSEE - 5.3% | | | | | | | | | | | | | | | | | | | | | | |
| | | | | | |
Clarksville City Water, Sewer and Gas, Revenue Bond | | | 5.000% | | | | 2/1/2019 | | | | Aa3 | | | | 2,740,000 | | | | 3,181,387 | | | |
Franklin, Water & Sewer, G.O. Bond | | | 5.000% | | | | 4/1/2014 | | | | Aaa | | | | 1,000,000 | | | | 1,036,230 | | | |
Knoxville Wastewater System, Series A, Revenue Bond | | | 4.000% | | | | 4/1/2018 | | | | Aa2 | | | | 410,000 | | | | 457,256 | | | |
Knoxville Wastewater System, Series A, Revenue Bond | | | 4.000% | | | | 4/1/2019 | | | | Aa2 | | | | 660,000 | | | | 743,325 | | | |
Knoxville Wastewater System, Series A, Revenue Bond | | | 4.000% | | | | 4/1/2020 | | | | Aa2 | | | | 685,000 | | | | 772,461 | | | |
Memphis, G.O. Bond, AGC | | | 4.000% | | | | 4/1/2014 | | | | Aa2 | | | | 2,000,000 | | | | 2,057,400 | | | |
Metropolitan Government of Nashville & Davidson County, Series A, Revenue Bond | | | 5.000% | | | | 7/1/2016 | | | | Aa3 | | | | 750,000 | | | | 838,447 | | | |
Metropolitan Government of Nashville & Davidson County, Series A, Revenue Bond, AGM | | | 4.000% | | | | 1/1/2018 | | | | Aa2 | | | | 445,000 | | | | 493,732 | | | |
Metropolitan Government of Nashville & Davidson County, Series A, Revenue Bond, AGM | | | 5.250% | | | | 1/1/2019 | | | | Aa2 | | | | 665,000 | | | | 786,329 | | | |
Metropolitan Government of Nashville & Davidson County, Series B, G.O. Bond | | | 5.000% | | | | 1/1/2014 | | | | Aa1 | | | | 1,000,000 | | | | 1,024,530 | | | |
Metropolitan Government of Nashville & Davidson County, Series B, Revenue Bond | | | 5.000% | | | | 5/15/2016 | | | | AA3 | | | | 400,000 | | | | 446,140 | | | |
Metropolitan Government of Nashville & Davidson County, Series B, Revenue Bond, BHAC | | | 5.500% | | | | 5/15/2017 | | | | Aa1 | | | | 1,000,000 | | | | 1,164,100 | | | |
Montgomery County, G.O. Bond | | | 4.000% | | | | 4/1/2015 | | | | AA3 | | | | 1,000,000 | | | | 1,058,920 | | | |
Montgomery County, School Impt., G.O. Bond | | | 2.000% | | | | 4/1/2014 | | | | AA3 | | | | 500,000 | | | | 506,300 | | | |
Rutherford County, G.O. Bond | | | 5.000% | | | | 4/1/2014 | | | | Aa1 | | | | 500,000 | | | | 517,785 | | | |
Tennessee State, Series C, G.O. Bond | | | 5.250% | | | | 9/1/2013 | | | | Aaa | | | | 1,500,000 | | | | 1,513,245 | | | |
Williamson County, Series A, G.O. Bond | | | 3.000% | | | | 3/1/2015 | | | | Aaa | | | | 550,000 | | | | 573,161 | | | |
| | | | | | | | | | | | | | | | | | | | | | |
| | | | | | | | | | | | | | | | | | | 17,170,748 | | | |
| | | | | | | | | | | | | | | | | | | | | | |
The accompanying notes are an integral part of the financial statements.
13
Diversified Tax Exempt Series
Investment Portfolio - June 30, 2013
(unaudited)
| | | | | | | | | | | | | | | | | | | | | | |
| | | COUPON
RATE | | | MATURITY
DATE | | | CREDIT
RATING1
(UNAUDITED) | | | PRINCIPAL
AMOUNT | | | VALUE (NOTE 2) | | | |
| | | | | | |
MUNICIPAL BONDS (continued) | | | | | | | | | | | | | | | | | | | | | | |
| | | | | | |
TEXAS - 7.1% | | | | | | | | | | | | | | | | | | | | | | |
| | | | | | |
Alvin Independent School District, Prerefunded Balance, Series A, G.O. Bond | | | 5.000% | | | | 2/15/2022 | | | | Aaa | | | $ | 500,000 | | | $ | 514,890 | | | |
Austin Electric Utility, Revenue Bond | | | 5.000% | | | | 11/15/2020 | | | | A1 | | | | 1,600,000 | | | | 1,881,008 | | | |
Austin Electric Utility, Revenue Bond, AGM | | | 5.000% | | | | 11/15/2018 | | | | A1 | | | | 500,000 | | | | 565,100 | | | |
Austin Electric Utility, Series A, Revenue Bond, AMBAC | | | 5.500% | | | | 11/15/2016 | | | | A1 | | | | 1,000,000 | | | | 1,144,670 | | | |
Austin Electric Utility, Series A, Revenue Bond, AMBAC | | | 5.000% | | | | 11/15/2016 | | | | A1 | | | | 600,000 | | | | 676,878 | | | |
Collin County, Public Impt., G.O. Bond | | | 2.000% | | | | 2/15/2014 | | | | Aaa | | | | 545,000 | | | | 550,891 | | | |
Fort Worth, Water & Sewer, Revenue Bond | | | 5.000% | | | | 2/15/2020 | | | | Aa1 | | | | 550,000 | | | | 651,937 | | | |
Fort Worth, Water Utility Impt., Series C, Revenue Bond | | | 5.000% | | | | 2/15/2014 | | | | Aa1 | | | | 1,595,000 | | | | 1,642,754 | | | |
Frisco, Public Impt., G.O. Bond, AGM | | | 5.000% | | | | 2/15/2015 | | | | Aa1 | | | | 520,000 | | | | 557,487 | | | |
Harris County Cultural Education Facilities Finance Corp., Revenue Bond | | | 4.000% | | | | 12/1/2019 | | | | A1 | | | | 500,000 | | | | 548,505 | | | |
Harris County Flood Control District, Public Impt., Prerefunded Balance, Series A, G.O. Bond | | | 5.250% | | | | 10/1/2018 | | | | Aaa | | | | 600,000 | | | | 637,032 | | | |
Houston, Public Impt., Series A, G.O. Bond | | | 5.000% | | | | 3/1/2015 | | | | AA3 | | | | 1,000,000 | | | | 1,074,800 | | | |
Houston, Utility System, Series D, Revenue Bond | | | 4.000% | | | | 11/15/2017 | | | | AA3 | | | | 525,000 | | | | 585,197 | | | |
Irving, Water Utility Impt., Revenue Bond | | | 4.000% | | | | 8/15/2018 | | | | Aa1 | | | | 1,110,000 | | | | 1,240,381 | | | |
Lower Colorado River Authority, Series B, Revenue Bond | | | 4.000% | | | | 5/15/2018 | | | | A1 | | | | 1,250,000 | | | | 1,375,400 | | | |
North East Independent School District, School Impt., Prerefunded Balance, G.O. Bond | | | 5.000% | | | | 8/1/2022 | | | | AAA3 | | | | 550,000 | | | | 578,193 | | | |
North Texas Municipal Water District, Revenue Bond | | | 5.250% | | | | 9/1/2020 | | | | Aa2 | | | | 2,000,000 | | | | 2,433,340 | | | |
San Antonio, Water System, Revenue Bond, FGRNA | | | 4.375% | | | | 5/15/2029 | | | | Aa1 | | | | 1,400,000 | | | | 1,432,298 | | | |
San Marcos Consolidated Independent School District, School Impt., Prerefunded Balance, G.O. Bond | | | 5.625% | | | | 8/1/2026 | | | | Aaa | | | | 475,000 | | | | 502,417 | | | |
Tarrant Regional Water District, Revenue Bond | | | 5.000% | | | | 3/1/2017 | | | | AAA3 | | | | 900,000 | | | | 1,024,407 | | | |
Texas Water Development Board, Series B, Prerefunded Balance, Revenue Bond | | | 5.625% | | | | 7/15/2014 | | | | AAA3 | | | | 2,000,000 | | | | 2,111,880 | | | |
University of Texas, Financing System, Series F, Revenue Bond | | | 4.750% | | | | 8/15/2028 | | | | Aaa | | | | 1,000,000 | | | | 1,066,870 | | | |
| | | | | | | | | | | | | | | | | | | | | | |
| | | | | | | | | | | | | | | | | | | 22,796,335 | | | |
| | | | | | | | | | | | | | | | | | | | | | |
| | | | | | |
UTAH - 2.7% | | | | | | | | | | | | | | | | | | | | | | |
| | | | | | |
Intermountain Power Agency, Series A, Revenue Bond | | | 5.000% | | | | 7/1/2020 | | | | A1 | | | | 2,000,000 | | | | 2,279,420 | | | |
Mountain Regional Water Special Service District, Prerefunded Balance, Revenue Bond, NATL | | | 5.000% | | | | 12/15/2030 | | | | Baa1 | | | | 1,240,000 | | | | 1,266,908 | | | |
The accompanying notes are an integral part of the financial statements.
14
Diversified Tax Exempt Series
Investment Portfolio - June 30, 2013
(unaudited)
| | | | | | | | | | | | | | | | | | | | | | |
| | | COUPON
RATE | | | MATURITY
DATE | | | CREDIT
RATING1
(UNAUDITED) | | | PRINCIPAL
AMOUNT | | | VALUE (NOTE 2) | | | |
| | | | | | |
MUNICIPAL BONDS (continued) | | | | | | | | | | | | | | | | | | | | | | |
| | | | | | |
UTAH (continued) | | | | | | | | | | | | | | | | | | | | | | |
| | | | | | |
North Davis County Sewer District, Sewer Impt., Series B, Revenue Bond | | | 2.000% | | | | 3/1/2023 | | | | AA3 | | | $ | 1,030,000 | | | $ | 929,204 | | | |
North Davis County Sewer District, Sewer Impt., Series B, Revenue Bond | | | 2.125% | | | | 3/1/2025 | | | | AA3 | | | | 500,000 | | | | 428,400 | | | |
Provo City School District, Series B, G.O. Bond | | | 4.000% | | | | 6/15/2014 | | | | Aaa | | | | 1,100,000 | | | | 1,139,270 | | | |
Salt Lake City, Water Utility Impt., Revenue Bond | | | 3.250% | | | | 2/1/2015 | | | | Aa1 | | | | 400,000 | | | | 416,884 | | | |
Salt Lake County, Public Impt., Series A, G.O. Bond | | | 4.000% | | | | 12/15/2014 | | | | Aaa | | | | 400,000 | | | | 421,824 | | | |
Utah State, Highway Impt., Series A, G.O. Bond | | | 5.000% | | | | 7/1/2014 | | | | Aaa | | | | 460,000 | | | | 482,278 | | | |
Utah State, Highway Impt., Series A, G.O. Bond | | | 3.000% | | | | 7/1/2015 | | | | Aaa | | | | 500,000 | | | | 525,155 | | | |
Utah State, Public Impt., Series B, G.O. Bond | | | 4.000% | | | | 7/1/2013 | | | | Aaa | | | | 450,000 | | | | 450,144 | | | |
Utah State, Series A, G.O. Bond | | | 5.000% | | | | 7/1/2014 | | | | Aaa | | | | 415,000 | | | | 435,098 | | | |
| | | | | | | | | | | | | | | | | | | | | | |
| | | | | | | | | | | | | | | | | | | 8,774,585 | | | |
| | | | | | | | | | | | | | | | | | | | | | |
| | | | | | |
VIRGINIA - 4.5% | | | | | | | | | | | | | | | | | | | | | | |
| | | | | | |
Arlington County, Public Impt., Series B, G.O. Bond | | | 4.000% | | | | 8/15/2014 | | | | Aaa | | | | 1,000,000 | | | | 1,042,890 | | | |
Chesterfield County, Public Impt., G.O. Bond | | | 3.500% | | | | 1/1/2015 | | | | Aaa | | | | 1,000,000 | | | | 1,046,260 | | | |
Commonwealth of Virginia, School Impt., Series A, G.O. Bond | | | 5.000% | | | | 6/1/2014 | | | | Aaa | | | | 2,450,000 | | | | 2,558,633 | | | |
Fairfax County Water Authority, Revenue Bond | | | 5.000% | | | | 4/1/2024 | | | | Aaa | | | | 1,000,000 | | | | 1,179,790 | | | |
Fairfax County Water Authority, Series B, Revenue Bond | | | 4.000% | | | | 4/1/2032 | | | | Aaa | | | | 1,000,000 | | | | 1,014,160 | | | |
Fairfax County, Public Impt., Prerefunded Balance, Series A, G.O. Bond | | | 4.000% | | | | 4/1/2017 | | | | Aaa | | | | 2,000,000 | | | | 2,123,120 | | | |
Fairfax County, Public Impt., Series A, G.O. Bond | | | 5.000% | | | | 4/1/2014 | | | | Aaa | | | | 400,000 | | | | 414,540 | | | |
Norfolk, Water Revenue, Revenue Bond | | | 5.000% | | | | 11/1/2016 | | | | Aa2 | | | | 1,075,000 | | | | 1,217,717 | | | |
Norfolk, Water Utility Impt., Revenue Bond | | | 3.750% | | | | 11/1/2040 | | | | Aa2 | | | | 1,000,000 | | | | 906,870 | | | |
Prince William County, Public Impt., Series A, G.O. Bond | | | 3.000% | | | | 8/1/2014 | | | | Aaa | | | | 1,060,000 | | | | 1,092,192 | | | |
Richmond, Public Impt., Series B, G.O. Bond, AGM | | | 5.000% | | | | 7/15/2014 | | | | Aa2 | | | | 670,000 | | | | 703,433 | | | |
Rivanna Water & Sewer Authority, Water Utility Impt., Series B, Revenue Bond | | | 4.000% | | | | 10/1/2023 | | | | Aa2 | | | | 755,000 | | | | 828,416 | | | |
Upper Occoquan Sewage Authority, Series B, Revenue Bond | | | 4.500% | | | | 7/1/2038 | | | | Aa1 | | | | 470,000 | | | | 481,773 | | | |
| | | | | | | | | | | | | | | | | | | | | | |
| | | | | | | | | | | | | | | | | | | 14,609,794 | | | |
| | | | | | | | | | | | | | | | | | | | | | |
| | | | | | |
WASHINGTON - 6.4% | | | | | | | | | | | | | | | | | | | | | | |
| | | | | | |
Benton County Public Utility District No. 1, Revenue Bond | | | 5.000% | | | | 11/1/2018 | | | | Aa3 | | | | 400,000 | | | | 459,144 | | | |
Everett, Water & Sewer, Revenue Bond | | | 5.000% | | | | 12/1/2018 | | | | AA3 | | | | 1,730,000 | | | | 2,026,020 | | | |
Everett, Water & Sewer, Revenue Bond | | | 5.000% | | | | 12/1/2020 | | | | AA3 | | | | 1,330,000 | | | | 1,584,203 | | | |
King County School District No. 411 Issaquah, Series A, G.O. Bond, AGM | | | 5.250% | | | | 12/1/2018 | | | | Aaa | | | | 2,420,000 | | | | 2,589,957 | | | |
The accompanying notes are an integral part of the financial statements.
15
Diversified Tax Exempt Series
Investment Portfolio - June 30, 2013
(unaudited)
| | | | | | | | | | | | | | | | | | | | | | |
| | | COUPON
RATE | | | MATURITY
DATE | | | CREDIT
RATING1
(UNAUDITED) | | | PRINCIPAL
AMOUNT | | | VALUE (NOTE 2) | | | |
| | | | | | |
MUNICIPAL BONDS (continued) | | | | | | | | | | | | | | | | | | | | | | |
| | | | | | |
WASHINGTON (continued) | | | | | | | | | | | | | | | | | | | | | | |
| | | | | | |
King County, Sewer Impt., Revenue Bond | | | 5.000% | | | | 1/1/2038 | | | | Aa2 | | | $ | 2,155,000 | | | $ | 2,300,678 | | | |
Pierce County, Sewer Impt., Revenue Bond | | | 3.250% | | | | 8/1/2032 | | | | Aa3 | | | | 1,000,000 | | | | 859,140 | | | |
Pierce County, Sewer Impt., Revenue Bond | | | 4.000% | | | | 8/1/2037 | | | | Aa3 | | | | 1,700,000 | | | | 1,628,821 | | | |
Seattle Municipal Light & Power, Series B, Revenue Bond | | | 4.000% | | | | 2/1/2016 | | | | Aa2 | | | | 550,000 | | | | 593,989 | | | |
Seattle Municipal Light & Power, Series B, Revenue Bond | | | 5.000% | | | | 2/1/2017 | | | | Aa2 | | | | 1,585,000 | | | | 1,796,423 | | | |
Seattle, Sewer Impt., Revenue Bond | | | 5.000% | | | | 9/1/2021 | | | | Aa1 | | | | 2,000,000 | | | | 2,379,460 | | | |
Snohomish County Public Utility District No. 1, Revenue Bond | | | 5.000% | | | | 12/1/2016 | | | | Aa3 | | | | 740,000 | | | | 841,151 | | | |
Tacoma, Sewer Impt., Revenue Bond, FGRNA | | | 5.125% | | | | 12/1/2036 | | | | Aa2 | | | | 1,275,000 | | | | 1,336,544 | | | |
Tacoma, Water Revenue, Series A, Revenue Bond | | | 4.000% | | | | 12/1/2018 | | | | Aa2 | | | | 1,000,000 | | | | 1,117,820 | | | |
Washington Health Care Facilities Authority, Multicare Health System, Series A, Revenue Bond, AGC | | | 4.000% | | | | 8/15/2016 | | | | A1 | | | | 525,000 | | | | 567,126 | | | |
Washington Health Care Facilities Authority, Providence Health & Services, Series A, Revenue Bond | | | 5.000% | | | | 10/1/2018 | | | | Aa2 | | | | 475,000 | | | | 547,314 | | | |
| | | | | | | | | | | | | | | | | | | | | | |
| | | | | | | | | | | | | | | | | | | 20,627,790 | | | |
| | | | | | | | | | | | | | | | | | | | | | |
| | | | | | |
WISCONSIN - 3.0% | | | | | | | | | | | | | | | | | | | | | | |
| | | | | | |
Central Brown County Water Authority, Water Systems, Revenue Bond, AMBAC | | | 5.000% | | | | 12/1/2035 | | | | A3 | | | | 1,500,000 | | | | 1,545,045 | | | |
Madison, Water Utility Impt., Series A, Revenue Bond | | | 4.250% | | | | 1/1/2030 | | | | Aa1 | | | | 1,000,000 | | | | 1,015,340 | | | |
Milwaukee Sewer System, Sewer Impt., Series S1, Revenue Bond | | | 5.000% | | | | 6/1/2021 | | | | Aa2 | | | | 470,000 | | | | 549,430 | | | |
Northland Pines School District, Prerefunded Balance, G.O. Bond, AGM | | | 5.250% | | | | 4/1/2018 | | | | Aa3 | | | | 850,000 | | | | 881,909 | | | |
Wilmot Union High School District, Prerefunded Balance, G.O. Bond, AGM | | | 5.500% | | | | 3/1/2019 | | | | Aa2 | | | | 500,000 | | | | 517,620 | | | |
Wisconsin Health & Educational Facilities Authority, Froedtert Health, Series A, Revenue Bond | | | 4.000% | | | | 4/1/2017 | | | | AA3 | | | | 565,000 | | | | 614,211 | | | |
Wisconsin Health & Educational Facilities Authority, Revenue Bond | | | 3.000% | | | | 8/15/2019 | | | | A1 | | | | 510,000 | | | | 529,416 | | | |
Wisconsin Health & Educational Facilities Authority, Series A, Revenue Bond | | | 5.000% | | | | 11/15/2018 | | | | Aa2 | | | | 600,000 | | | | 692,874 | | | |
Wisconsin Public Power, Inc., Series A, Revenue Bond, AGM | | | 5.000% | | | | 7/1/2016 | | | | A1 | | | | 515,000 | | | | 573,622 | | | |
Wisconsin Public Power, Inc., Series A, Revenue Bond, AMBAC | | | 5.000% | | | | 7/1/2035 | | | | A1 | | | | 870,000 | | | | 919,547 | | | |
Wisconsin State, Public Impt., Prerefunded Balance, Series E, G.O. Bond, FGIC | | | 5.000% | | | | 5/1/2019 | | | | Aa2 | | | | 1,000,000 | | | | 1,083,030 | | | |
The accompanying notes are an integral part of the financial statements.
16
Diversified Tax Exempt Series
Investment Portfolio - June 30, 2013
(unaudited)
| | | | | | | | | | | | | | | | | | | | | | |
| | | COUPON
RATE | | | MATURITY
DATE | | | CREDIT
RATING1
(UNAUDITED) | | | PRINCIPAL
AMOUNT/
SHARES | | | VALUE (NOTE 2) | | | |
| | | | | | |
MUNICIPAL BONDS (continued) | | | | | | | | | | | | | | | | | | | | | | |
| | | | | | |
WISCONSIN (continued) | | | | | | | | | | | | | | | | | | | | | | |
| | | | | | |
WPPI Energy, Series A, Revenue Bond | | | 4.000% | | | | 7/1/2017 | | | | A1 | | | $ | 750,000 | | | $ | 827,153 | | | |
| | | | | | | | | | | | | | | | | | | | | | |
| | | | | | | | | | | | | | | | | | | 9,749,197 | | | |
| | | | | | | | | | | | | | | | | | | | | | |
| | | | | | |
WYOMING - 0.2% | | | | | | | | | | | | | | | | | | | | | | |
| | | | | | |
Wyoming Municipal Power Agency, Inc., Series A, Revenue Bond | | | 5.375% | | | | 1/1/2042 | | | | A2 | | | | 710,000 | | | | 764,947 | | | |
| | | | | | | | | | | | | | | | | | | | | | |
| | | | | | | | | | | | | | | | | | | | | | |
TOTAL MUNICIPAL BONDS | | | | | | | | | | | | | | | | | | | | | | |
(Identified Cost $302,816,538) | | | | | | | | | | | | | | | | | | | 301,533,844 | | | |
| | | | | | | | | | | | | | | | | | | | | | |
| | | | | | | | | | | | | | | | | | | | | | |
SHORT-TERM INVESTMENT - 5.1% | | | | | | | | | | | | | | | | | | | | | | |
| | | | | | |
Dreyfus AMT - Free Municipal Reserves - Class R | | | | | | | | | | | | | | | | | | | | | | |
(Identified Cost $16,258,140) | | | | | | | | | | | | | | | 16,258,140 | | | | 16,258,140 | | | |
| | | | | | | | | | | | | | | | | | | | | | |
TOTAL INVESTMENTS - 98.7% | | | | | | | | | | | | | | | | | | | | | | |
(Identified Cost $319,074,678) | | | | | | | | | | | | | | | | | | | 317,791,984 | | | |
OTHER ASSETS, LESS LIABILITIES - 1.3% | | | | | | | | | | | | | | | | | | | 4,255,945 | | | |
| | | | | | | | | | | | | | | | | | | | | | |
NET ASSETS - 100% | | | | | | | | | | | | | | | | | | $ | 322,047,929 | | | |
| | | | | | | | | | | | | | | | | | | | | | |
KEY:
G.O. Bond - General Obligation Bond
Impt. - Improvement
No. - Number
Scheduled principal and interest payments are guaranteed by:
AGC (Assurance Guaranty Corp.)
AGM (Assurance Guaranty Municipal Corp.)
AMBAC (AMBAC Assurance Corp.)
BHAC (Berkshire Hathaway Assurance Corp.)
FGIC (Financial Guaranty Insurance Co.)
FGRNA (FGIC reinsured by NATL)
NATL (National Public Finance Guarantee Corp.)
XLCA (XL Capital Assurance)
The insurance does not guarantee the market value of the municipal bonds.
1Credit ratings from Moody’s (unaudited).
2Credit rating has been withdrawn. As of June 30, 2013, there is no rating available (unaudited).
3Credit ratings from S&P (unaudited).
The accompanying notes are an integral part of the financial statements.
17
Diversified Tax Exempt Series
Statement of Assets and Liabilities
June 30, 2013 (unaudited)
| | | | |
ASSETS: | | | | |
| |
Investments, at value (identified cost $319,074,678) (Note 2) | | $ | 317,791,984 | |
Interest receivable | | | 3,881,703 | |
Receivable for fund shares sold | | | 1,834,803 | |
Prepaid expenses | | | 834 | |
| | | | |
| |
TOTAL ASSETS | | | 323,509,324 | |
| | | | |
| |
LIABILITIES: | | | | |
| |
Accrued management fees (Note 3) | | | 133,998 | |
Accrued fund accounting and administration fees (Note 3) | | | 18,413 | |
Accrued transfer agent fees (Note 3) | | | 758 | |
Accrued Chief Compliance Officer service fees (Note 3) | | | 340 | |
Payable for fund shares repurchased | | | 1,265,803 | |
Other payables and accrued expenses | | | 42,083 | |
| | | | |
| |
TOTAL LIABILITIES | | | 1,461,395 | |
| | | | |
| |
TOTAL NET ASSETS | | $ | 322,047,929 | |
| | | | |
| |
NET ASSETS CONSIST OF: | | | | |
| |
Capital stock | | $ | 289,444 | |
Additional paid-in-capital | | | 316,903,757 | |
Undistributed net investment income | | | 582,980 | |
Accumulated net realized gain on investments | | | 5,554,442 | |
Net unrealized depreciation on investments | | | (1,282,694 | ) |
| | | | |
| |
TOTAL NET ASSETS | | $ | 322,047,929 | |
| | | | |
| |
NET ASSET VALUE, OFFERING PRICE AND REDEMPTION PRICE PER SHARE - Class A
($322,047,929/28,944,417 shares) | | $ | 11.13 | |
| | | | |
The accompanying notes are an integral part of the financial statements.
18
Diversified Tax Exempt Series
Statement of Operations
For the Six Months Ended June 30, 2013 (unaudited)
| | | | |
INVESTMENT INCOME: | | | | |
| |
Interest | | $ | 3,192,640 | |
Dividends | | | 18 | |
| | | | |
| |
Total Investment Income | | | 3,192,658 | |
| | | | |
| |
EXPENSES: | | | | |
| |
Management fees (Note 3) | | | 803,120 | |
Fund accounting and administration fees (Note 3) | | | 53,688 | |
Directors’ fees (Note 3) | | | 3,802 | |
Transfer agent fees (Note 3) | | | 2,131 | |
Chief Compliance Officer service fees (Note 3) | | | 1,117 | |
Custodian fees | | | 8,400 | |
Miscellaneous | | | 49,859 | |
| | | | |
| |
Total Expenses | | | 922,117 | |
| | | | |
| |
NET INVESTMENT INCOME | | | 2,270,541 | |
| | | | |
| |
REALIZED AND UNREALIZED GAIN (LOSS) ON INVESTMENTS: | | | | |
| |
Net realized gain (loss) on investments | | | 4,633,868 | |
Net change in unrealized appreciation (depreciation) on investments | | | (12,670,085 | ) |
| | | | |
| |
NET REALIZED AND UNREALIZED GAIN (LOSS) ON INVESTMENTS | | | (8,036,217 | ) |
| | | | |
| |
NET DECREASE IN NET ASSETS RESULTING FROM OPERATIONS | | $ | (5,765,676 | ) |
| | | | |
The accompanying notes are an integral part of the financial statements.
19
Diversified Tax Exempt Series
Statements of Changes in Net Assets
| | | | | | | | |
| | | FOR THE SIX
MONTHS ENDED
6/30/13
(UNAUDITED) | | | FOR THE YEAR ENDED
12/31/12 | |
INCREASE (DECREASE) IN NET ASSETS: | | | | | | | | |
| | |
OPERATIONS: | | | | | | | | |
| | |
Net investment income | | $ | 2,270,541 | | | $ | 5,631,521 | |
Net realized gain (loss) on investments | | | 4,633,868 | | | | 1,705,195 | |
Net change in unrealized appreciation (depreciation) on investments | | | (12,670,085 | ) | | | 2,363,150 | |
| | | | | | | | |
| | |
Net increase (decrease) from operations | | | (5,765,676 | ) | | | 9,699,866 | |
| | | | | | | | |
| | |
DISTRIBUTIONS TO SHAREHOLDERS (Note 7): | | | | | | | | |
| | |
From net investment income | | | (1,996,067 | ) | | | (5,736,636 | ) |
From net realized gain on investments | | | — | | | | (787,467 | ) |
| | | | | | | | |
| | |
Total distributions to shareholders | | | (1,996,067 | ) | | | (6,524,103 | ) |
| | | | | | | | |
| | |
CAPITAL STOCK ISSUED AND REPURCHASED: | | | | | | | | |
| | |
Net increase (decrease) from capital share transactions (Note 5) | | | (2,418,668 | ) | | | 22,612,484 | |
| | | | | | | | |
| | |
Net increase (decrease) in net assets | | | (10,180,411 | ) | | | 25,788,247 | |
| | |
NET ASSETS: | | | | | | | | |
| | |
Beginning of period | | | 332,228,340 | | | | 306,440,093 | |
| | | | | | | | |
| | |
End of period (including undistributed net investment income of $582,980 and $308,506, respectively) | | $ | 322,047,929 | | | $ | 332,228,340 | |
| | | | | | | | |
The accompanying notes are an integral part of the financial statements.
20
Diversified Tax Exempt Series
Financial Highlights
| | | | | | | | | | | | | | | | | | | | | | | | |
| | | FOR THE SIX
MONTHS ENDED | | | FOR THE YEARS ENDED | |
| | | 6/30/2013
(UNAUDITED) | | | 12/31/12 | | | 12/31/11 | | | 12/31/10 | | | 12/31/09 | | | 12/31/08 | |
Per share data (for a share outstanding throughout each period): | | | | | | | | | | | | | | | | | | | | | | | | |
Net asset value - Beginning of period | | $ | 11.39 | | | $ | 11.28 | | | $ | 10.77 | | | $ | 11.17 | | | $ | 10.34 | | | $ | 10.92 | |
| | | | | | | | | | | | | | | | | | | | | | | | |
Income (loss) from investment operations: | | | | | | | | | | | | | | | | | | | | | | | | |
Net investment income | | | 0.08 | 1 | | | 0.20 | 1 | | | 0.30 | 1 | | | 0.40 | 1 | | | 0.40 | 1 | | | 0.42 | |
Net realized and unrealized gain (loss) on investments | | | (0.27 | ) | | | 0.14 | | | | 0.58 | | | | (0.35 | ) | | | 0.90 | | | | (0.62 | ) |
| | | | | | | | | | | | | | | | | | | | | | | | |
| | | | | | |
Total from investment operations | | | (0.19 | ) | | | 0.34 | | | | 0.88 | | | | 0.05 | | | | 1.30 | | | | (0.20 | ) |
| | | | | | | | | | | | | | | | | | | | | | | | |
| | | | | | |
Less distributions to shareholders: | | | | | | | | | | | | | | | | | | | | | | | | |
From net investment income | | | (0.07 | ) | | | (0.20 | ) | | | (0.29 | ) | | | (0.45 | ) | | | (0.44 | ) | | | (0.36 | ) |
From net realized gain on investments | | | — | | | | (0.03 | ) | | | (0.08 | ) | | | — | 2 | | | (0.03 | ) | | | (0.02 | ) |
| | | | | | | | | | | | | | | | | | | | | | | | |
| | | | | | |
Total distributions to shareholders | | | (0.07 | ) | | | (0.23 | ) | | | (0.37 | ) | | | (0.45 | ) | | | (0.47 | ) | | | (0.38 | ) |
| | | | | | | | | | | | | | | | | | | | | | | | |
| | | | | | |
Net asset value - End of period | | $ | 11.13 | | | $ | 11.39 | | | $ | 11.28 | | | $ | 10.77 | | | $ | 11.17 | | | $ | 10.34 | |
| | | | | | | | | | | | | | | | | | | | | | | | |
| | | | | | |
Net assets - End of period (000’s omitted) | | $ | 322,048 | | | $ | 332,228 | | | $ | 306,440 | | | $ | 276,970 | | | $ | 234,486 | | | $ | 197,736 | |
| | | | | | | | | | | | | | | | | | | | | | | | |
| | | | | | |
Total return3 | | | (1.68 | %) | | | 3.01 | % | | | 8.25 | % | | | 0.41 | % | | | 12.75 | % | | | (1.79 | %) |
Ratios (to average net assets)/ Supplemental Data: | | | | | | | | | | | | | | | | | | | | | | | | |
Expenses* | | | 0.57 | %4 | | | 0.57 | % | | | 0.58 | % | | | 0.58 | % | | | 0.60 | % | | | 0.61 | % |
Net investment income | | | 1.41 | %4 | | | 1.71 | % | | | 2.67 | % | | | 3.51 | % | | | 3.65 | % | | | 3.75 | % |
Portfolio turnover | | | 38 | % | | | 9 | % | | | 53 | % | | | 3 | % | | | 8 | % | | | 7 | % |
|
| * The investment advisor did not impose all or a portion of its management and/or other fees, and in some periods may have paid a portion of the Series’ expenses. If these expenses had been incurred by the Series, the expense ratio (to average net assets) would have increased by the following amount: | |
| | | | | | |
| | | N/A | | | | N/A | | | | N/A | | | | 0.00 | %5 | | | 0.01 | % | | | N/A | |
1Calculated based on average shares outstanding during the periods.
2Less than $0.01 per share.
3Represents aggregate total return for the periods indicated, and assumes reinvestment of all distributions. Total return would have been lower had certain expenses not been waived or reimbursed during certain periods. Periods less than one year are not annualized.
4Annualized.
5Less than 0.01%.
The accompanying notes are an integral part of the financial statements.
21
Diversified Tax Exempt Series
Notes to Financial Statements
(unaudited)
Diversified Tax Exempt Series (the “Series”) is a no-load diversified series of Manning & Napier Fund, Inc. (the “Fund”). The Fund is organized in Maryland and is registered under the Investment Company Act of 1940, as amended, as an open-end management investment company.
The Series’ investment objective is to provide as high a level of current income exempt from federal income tax as the Advisor believes is consistent with the preservation of capital.
The Fund’s advisor is Manning & Napier Advisors, LLC (the “Advisor”). Shares of the Series are offered to investors, clients and employees of the Advisor and its affiliates. The total authorized capital stock of the Fund consists of 15 billion shares of common stock each having a par value of $0.01. As of June 30, 2013, 10.3 billion shares have been designated in total among 42 series, of which 100 million have been designated as Diversified Tax Exempt Series Class A common stock.
| 2. | Significant Accounting Policies |
Security Valuation
Municipal securities will normally be valued on the basis of market valuations provided by an independent pricing service (the “Service”). The Service utilizes the latest price quotations and a matrix system (which considers such factors as security prices of similar securities, yields, maturities and ratings). The Service has been approved by the Fund’s Board of Directors (the “Board”).
Short-term investments that mature in sixty days or less are valued at amortized cost, which approximates fair value. Investments in open-end investment companies are valued at their net asset value per share on valuation date.
Volume and level of activity in established markets for an asset or liability are evaluated to determine whether recent transactions and quoted prices are determinative of fair value. Where there have been significant decreases in volume and level of activity, further analysis and adjustment may be necessary to estimate fair value. The Series measures fair value in these instances by the use of inputs and valuation techniques which may be based upon current market prices of securities that are comparable in coupon, rating, maturity and industry and/or expectation of future cash flows. As a result of trading in relatively thin markets and/or markets that experience significant volatility, the prices used by the Series to value these securities may differ from the value that would be realized if these securities were sold, and the differences could be material.
Securities for which representative valuations or prices are not available from the Series’ pricing service may be valued at fair value as determined in good faith by the Advisor under procedures approved by and under the general supervision and responsibility of the Board. Due to the inherent uncertainty of valuations of such securities, the fair value may differ significantly from the values that would have been used had a ready market for such securities existed. If trading or events occurring after the close of the principal market in which securities are traded are expected to materially affect the value of those securities, then they may be valued at their fair value, taking this trading or these events into account.
Various inputs are used in determining the value of the Series’ assets or liabilities carried at fair value. These inputs are summarized in three broad levels. Level 1 includes quoted prices in active markets for identical assets and liabilities. Level 2 includes other significant observable inputs (including quoted prices for similar securities, interest rates, prepayment speeds, credit risk, etc.). Level 3 includes significant unobservable inputs (including the Series’ own assumptions in determining the fair value of investments). A financial instrument’s level within the fair value hierarchy is based on the lowest level of any input both individually and in aggregate that is significant to the fair value measurement. The inputs or methodology used for valuing securities are not necessarily an indication of the risk associated with investing in those securities.
22
Diversified Tax Exempt Series
Notes to Financial Statements (continued)
(unaudited)
| 2. | Significant Accounting Policies (continued) |
Security Valuation (continued)
The following is a summary of the valuation levels used for major security types as of June 30, 2013 in valuing the Series’ assets or liabilities carried at fair value:
| | | | | | | | | | | | | | | | |
| DESCRIPTION | | TOTAL | | | LEVEL 1 | | | LEVEL 2 | | | LEVEL 3 | |
Assets: | | | | | | | | | | | | | | | | |
Debt securities: | | | | | | | | | | | | | | | | |
States and political subdivisions (municipals) | | $ | 301,533,844 | | | $ | — | | | $ | 301,533,844 | | | $ | — | |
Mutual fund | | | 16,258,140 | | | | 16,258,140 | | | | — | | | | — | |
| | | | | | | | | | | | | | | | |
Total assets | | $ | 317,791,984 | | | $ | 16,258,140 | | | $ | 301,533,844 | | | $ | — | |
| | | | | | | | | | | | | | | | |
There were no Level 3 securities held by the Series as of December 31, 2012 or June 30, 2013.
The Fund’s policy is to recognize transfers in and transfers out of the valuation levels as of the beginning of the reporting period. There were no transfers between Level 1 and Level 2 during the six months ended June 30, 2013.
Security Transactions, Investment Income and Expenses
Security transactions are accounted for on trade date. Dividend income is recorded on the ex-dividend date, except that if the ex-dividend date has passed, certain dividends from foreign securities are recorded as soon as the Series is informed of the ex-dividend date. Non-cash dividends, if any, are recorded at the fair value of the securities received. Interest income, including amortization of premium and accretion of discounts using the effective interest method, is earned from settlement date and accrued daily.
Expenses are recorded on an accrual basis. Most expenses of the Fund can be attributed to a specific series. Expenses which cannot be directly attributed are apportioned among the series in the Fund in such a manner as deemed equitable by the Fund’s Board, taking into consideration, among other things, the nature and type of expense.
The Series uses the identified cost method for determining realized gain or loss on investments for both financial statement and federal income tax reporting purposes.
Federal Taxes
The Series’ policy is to comply with the provisions of the Internal Revenue Code applicable to regulated investment companies. The Series is not subject to federal income tax or excise tax to the extent that the Series distributes to shareholders each year its taxable income, including any net realized gains on investments, in accordance with requirements of the Internal Revenue Code. Accordingly, no provision for federal income tax or excise tax has been made in the financial statements.
Management evaluates its tax positions to determine if the tax positions taken meet the minimum recognition threshold in connection with accounting for uncertainties in income tax positions taken or expected to be taken for the purposes of measuring and recognizing tax liabilities in the financial statements. Recognition of tax benefits of an uncertain tax position is required only when the position is “more likely than not” to be sustained assuming examination by taxing authorities. At June 30, 2013, the Series has recorded no liability for net unrecognized tax benefits relating to uncertain income tax positions taken or expected to be taken in future tax returns.
The Series files income tax returns in the U.S. federal jurisdiction and various states, as required. No income tax returns are currently under investigation. The statute of limitations on the Series’ tax returns remains open for the years ended December 31, 2009 through December 31, 2012. The Series is not aware of any tax positions for which it is reasonably possible that the total amounts of unrecognized tax benefits will significantly change in the next twelve months.
Distributions of Income and Gains
Distributions to shareholders of net investment income are made quarterly. Distributions of net realized gains are made annually. An additional distribution may be necessary to avoid taxation of the Series. Distributions are recorded on the ex-dividend date.
23
Diversified Tax Exempt Series
Notes to Financial Statements (continued)
(unaudited)
| 2. | Significant Accounting Policies (continued) |
Indemnifications
The Fund’s organizational documents provide former and current directors and officers with a limited indemnification against liabilities arising in connection with the performance of their duties to the Fund. In the normal course of business, the Fund may also enter into contracts that provide general indemnifications. The Fund’s maximum exposure under these arrangements is unknown as this would be dependent on future claims that may be made against the Fund. The risk of material loss from such claims is considered remote.
Other
The preparation of financial statements in conformity with accounting principles generally accepted in the United States of America requires management to make estimates and assumptions that affect the reported amounts of assets and liabilities and the disclosure of contingent assets and liabilities at the date of the financial statements and the reported amounts of income and expenses during the reporting period. Actual results could differ from those estimates.
| 3. | Transactions with Affiliates |
The Fund has an Investment Advisory Agreement (the “Agreement”) with the Advisor, for which the Series pays a fee, computed daily and payable monthly, at an annual rate of 0.50% of the Series’ average daily net assets.
Under the Agreement, personnel of the Advisor provide the Series with advice and assistance in the choice of investments and the execution of securities transactions, and otherwise maintain the Series’ organization. The Advisor also provides the Fund with necessary office space and fund administration and support services. The salaries of all officers of the Fund (except a percentage of the Fund’s Chief Compliance Officer’s salary, which is paid by the Fund), and of all Directors who are “affiliated persons” of the Fund, or of the Advisor, and all personnel of the Fund, or of the Advisor, performing services relating to research, statistical and investment activities, are paid by the Advisor. Each “non-affiliated” Director receives an annual stipend, which is allocated among all the active series of the Fund. In addition, these Directors also receive a fee per Board meeting attended plus a fee for each committee meeting attended.
The Advisor has contractually agreed, until at least April 30, 2014, to waive its management fee and, if necessary, pay other operating expenses of the Series in order to maintain total direct annual fund operating expenses for the Series at no more than 0.85% of average daily net assets each year. The Advisor did not waive any fees for the six months ended June 30, 2013. The Advisor is not eligible to recoup any expenses that have been waived or reimbursed in prior years.
Manning & Napier Investor Services, Inc., a registered broker-dealer affiliate of the Advisor, acts as distributor for the Fund’s shares. The services of Manning & Napier Investor Services, Inc. are provided at no additional cost to the Series.
The Advisor has agreements with BNY Mellon Investment Servicing (U.S.) Inc. (“BNY”) under which BNY serves as sub-accountant services agent and sub-transfer agent. The Fund pays the Advisor an annual fee related to fund accounting and administration of 0.0175% on the first $3 billion of average daily net assets (excluding Target Series and Strategic Income Series); 0.015% on the next $3 billion of average daily net assets (excluding Target Series and Strategic Income Series); and 0.01% of the average daily net assets in excess of $6 billion (excluding Target Series and Strategic Income Series); plus a base fee of $25,500 per series. Transfer Agent fees are charged to the Fund on a per account basis. Additionally, certain transaction and cusip-based fees and out-of-pocket expenses, including charges for reporting relating to the Fund’s compliance program, are charged. Effective October 1, 2012, the aforementioned agreements were modified to reduce the annual fee related to fund accounting and administration, as well as transfer agent fees, by 10%, excluding out-of-pocket expenses.
Expenses not directly attributable to a series are allocated based on each series’ relative net assets or number of accounts, depending on the expense.
24
Diversified Tax Exempt Series
Notes to Financial Statements (continued)
(unaudited)
| 4. | Purchases and Sales of Securities |
For the six months ended June 30, 2013, purchases and sales of securities, other than U.S. Government securities and short-term securities, were $116,001,546 and $119,996,896 respectively. There were no purchases or sales of U.S. Government securities.
| 5. | Capital Stock Transactions |
Transactions in shares of Diversified Tax Exempt Series were:
| | | | | | | | | | | | | | | | |
| | | FOR THE SIX MONTHS ENDED 6/30/13 | | | FOR THE YEAR ENDED 12/31/12 | |
| | SHARES | | | AMOUNT | | | SHARES | | | AMOUNT | |
Sold | | | 2,830,313 | | | $ | 32,157,136 | | | | 5,266,396 | | | $ | 59,994,173 | |
Reinvested | | | 165,482 | | | | 1,867,815 | | | | 538,349 | | | | 6,128,831 | |
Repurchased | | | (3,210,664 | ) | | | (36,443,619 | ) | | | (3,805,220 | ) | | | (43,510,520 | ) |
| | | | | | | | | | | | | | | | |
Total | | | (214,869 | ) | | $ | (2,418,668 | ) | | | 1,999,525 | | | $ | 22,612,484 | |
| | | | | | | | | | | | | | | | |
Substantially all of the Series’ shares represent investments by fiduciary accounts over which the Advisor has sole investment discretion.
The Series may trade in instruments including written and purchased options, forward foreign currency exchange contracts and futures contracts and other derivatives in the normal course of investing activities to assist in managing exposure to various market risks. The Series may be subject to various elements of risk, which may involve, to a varying degree, elements of risk in excess of the amounts recognized for financial statement purposes. These risks include: the risk that changes in the value of a derivative may not correlate perfectly with the underlying asset, rate or index; counterparty credit risk related to over the counter derivative counterparties’ failure to perform under contract terms; liquidity risk related to the lack of a liquid market for these contracts allowing the fund to close out its position(s); and documentation risk relating to disagreement over contract terms. No such investments were held by the Series as of June 30, 2013.
| 7. | Federal Income Tax Information |
The amount and characterization of certain income and capital gains to be distributed are determined in accordance with federal income tax regulations, which may differ from accounting principles generally accepted in the United States of America. The Series may periodically make reclassifications among its capital accounts to reflect income and gains available for distribution (or available capital loss carryovers) under income tax regulations, without impacting the Series’ net asset value. Any such reclassifications are not reflected in the financial highlights.
The final determination of the tax character of current year distributions will be made at the conclusion of the fiscal year. The tax character of distributions paid for the year ended December 31, 2012 was as follows:
| | | | | | |
Ordinary income | | $ | 45,983 | | | |
Tax exempt income | | | 5,736,636 | | | |
Long-term capital gains | | | 741,484 | | | |
25
Diversified Tax Exempt Series
Notes to Financial Statements (continued)
(unaudited)
| 7. | Federal Income Tax Information (continued) |
At June 30, 2013, the identified cost for federal income tax purposes, the resulting gross unrealized appreciation and depreciation, and the net unrealized appreciation were as follows:
| | | | |
Cost for federal income tax purposes | | $ | 319,074,678 | |
Unrealized appreciation | | | 3,727,173 | |
Unrealized depreciation | | | (5,009,867 | ) |
| | | | |
Net unrealized appreciation | | $ | (1,282,694 | ) |
| | | | |
26
Diversified Tax Exempt Series
Literature Requests
(unaudited)
Proxy Voting Policies and Procedures
A description of the policies and procedures that the Fund uses to determine how to vote proxies relating to portfolio securities is available, without charge, upon request:
| | | | |
| By phone | | 1-800-466-3863 | | |
| On the Securities and Exchange | | | | |
| Commission’s (SEC) web site | | http://www.sec.gov | | |
Proxy Voting Record
Information regarding how the Fund voted proxies relating to portfolio securities during the most recent 12-month period ended June 30th is available, without charge, upon request:
| | | | |
| By phone | | 1-800-466-3863 | | |
| On the SEC’s web site | | http://www.sec.gov | | |
Quarterly Portfolio Holdings
The Series’ complete schedule of portfolio holdings for the 1st and 3rd quarters of each fiscal year are provided on Form N-Q, and are available, without charge, upon request:
| | | | |
| By phone | | 1-800-466-3863 | | |
| On the SEC’s web site | | http://www.sec.gov | | |
The Series’ Form N-Q may be reviewed and copied at the SEC’s Public Reference Room in Washington, D.C. Information on the operation of the Public Reference Room may be obtained by calling 1-800-SEC-0330.
Prospectus and Statement of Additional Information (SAI)
The prospectus and SAI provide additional information about each Series, including charges, expenses and risks. These documents are available, without charge, upon request:
| | | | |
| By phone | | 1-800-466-3863 | | |
| On the SEC’s web site | | http://www.sec.gov | | |
| On our web site | | http://www.manning-napier.com | | |
Additional information available at www.manning-napier.com
1. Fund Holdings - Month-End
2. Fund Holdings - Quarter-End
3. Shareholder Report - Annual
4. Shareholder Report - Semi-Annual
The Fund also offers electronic notification or “e-delivery” when certain documents are available on-line to be downloaded or reviewed. Direct shareholders can elect to receive electronic notification when shareholder reports, prospectus updates, and/or statements are available. If you do not currently have on-line access to your account, you can establish access by going to www.manning-napier.com, click on “Login” in the top corner of the page, and follow the prompts to self-enroll. Once enrolled, you can set your electronic notification preferences by clicking on the Account Options tab located within the green toolbar and then select E-Delivery Option. Should you have any questions on either how to establish on-line access or how to update your account settings, please contact Investor Services at 1-800-466-3863.
MNDTE-6/30-SAR
| | | | | | |
| | | | NEW YORK TAX EXEMPT SERIES | | |
www.manning-napier.com | | | | |
New York Tax Exempt Series
Shareholder Expense Example
(unaudited)
As a shareholder of the Series, you may incur two types of costs: (1) transaction costs and (2) ongoing costs, including management fees and other Series expenses. This example is intended to help you understand your ongoing costs (in dollars) of investing in the Series and to compare these costs with the ongoing costs of investing in other mutual funds.
The example is based on an investment of $1,000 invested at the beginning of the period and held for the entire period (January 1, 2013 to June 30, 2013).
Actual Expenses
The first line of the table below provides information about actual account values and actual expenses. You may use the information in this line, together with the amount you invested, to estimate the expenses that you paid over the period. Simply divide your account value by $1,000 (for example, an $8,600 account value divided by $1,000 = 8.6), then multiply the result by the number in the first line under the heading entitled “Expenses Paid During Period” to estimate the expenses you paid on your account during this period.
Hypothetical Example for Comparison Purposes
The second line of the table below provides information about hypothetical account values and hypothetical expenses based on the Series’ actual expense ratio and an assumed rate of return of 5% per year before expenses, which is not the Series’ actual return. The hypothetical account values and expenses may not be used to estimate the actual ending account balance or expenses you paid during the period. You may use this information to compare the ongoing costs of investing in the Series and other funds. To do so, compare this 5% hypothetical example with the 5% hypothetical examples that appear in the shareholder reports of the other funds.
Please note that the expenses shown in the table are meant to highlight your ongoing costs only and do not reflect any transaction costs. Therefore, the second line of the table is useful in comparing ongoing costs only, and will not help you determine the relative total costs of owning different funds. In addition, if these transaction costs were included, your costs would have been higher.
| | | | | | |
| | | BEGINNING
ACCOUNT VALUE
1/1/13 | | ENDING
ACCOUNT VALUE
6/30/13 | | EXPENSES PAID
DURING PERIOD*
1/1/13-6/30/13 |
Actual | | $1,000.00 | | $ 979.50 | | $2.94 |
Hypothetical (5% return before expenses) | | $1,000.00 | | $1,021.82 | | $3.01 |
*Expenses are equal to the Series’ annualized expense ratio (for the six-month period) of 0.60%, multiplied by the average account value over the period, multiplied by 181/365 to reflect the one-half year period. Expenses are based on the most recent fiscal half year.
1
New York Tax Exempt Series
Portfolio Composition as of June 30, 2013
(unaudited)
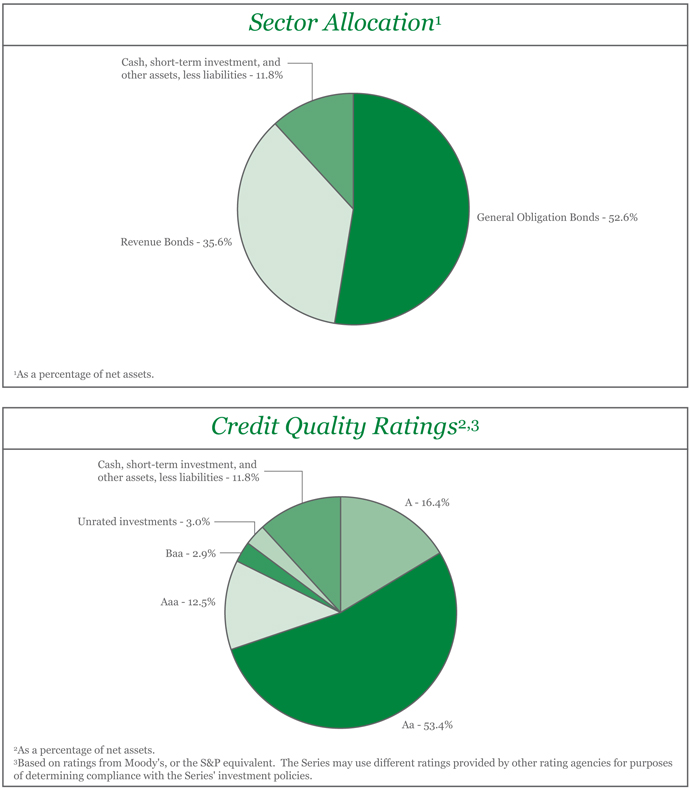
2
New York Tax Exempt Series
Investment Portfolio - June 30, 2013
(unaudited)
| | | | | | | | | | | | | | | | | | | | | | |
| | | COUPON
RATE | | | MATURITY
DATE | | | CREDIT
RATING1
(UNAUDITED) | | | PRINCIPAL
AMOUNT | | | VALUE
(NOTE 2) | | | |
| | | | | | |
NEW YORK MUNICIPAL BONDS - 88.2% | | | | | | | | | | | | | | | | | | | | | | |
| | | | | | |
Albany County, Public Impt., G.O. Bond | | | 4.000% | | | | 6/1/2026 | | | | Aa3 | | | $ | 500,000 | | | $ | 515,820 | | | |
Albany Municipal Water Finance Authority, Series A, Revenue Bond | | | 5.000% | | | | 12/1/2016 | | | | AA2 | | | | 505,000 | | | | 572,352 | | | |
Albany Municipal Water Finance Authority, Series A, Revenue Bond | | | 5.000% | | | | 12/1/2018 | | | | AA2 | | | | 500,000 | | | | 584,000 | | | |
Amherst Central School District, G.O. Bond | | | 2.000% | | | | 8/1/2014 | | | | Aa3 | | | | 500,000 | | | | 508,815 | | | |
Arlington Central School District, G.O. Bond | | | 4.000% | | | | 12/15/2021 | | | | Aa2 | | | | 300,000 | | | | 337,194 | | | |
Bay Shore Union Free School District, G.O. Bond | | | 4.000% | | | | 8/15/2014 | | | | Aa2 | | | | 510,000 | | | | 529,569 | | | |
Beacon, Public Impt., Series A, G.O. Bond | | | 4.000% | | | | 8/15/2014 | | | | Aa3 | | | | 400,000 | | | | 414,652 | | | |
Bedford Central School District, G.O. Bond | | | 2.000% | | | | 10/15/2021 | | | | Aa1 | | | | 500,000 | | | | 482,535 | | | |
Bedford, Public Impt., G.O. Bond | | | 2.000% | | | | 6/15/2014 | | | | AAA2 | | | | 350,000 | | | | 356,101 | | | |
Bedford, Public Impt., G.O. Bond | | | 2.000% | | | | 6/15/2015 | | | | AAA2 | | | | 275,000 | | | | 283,195 | | | |
Bethlehem, Public Impt., G.O. Bond | | | 4.500% | | | | 12/1/2033 | | | | AA2 | | | | 335,000 | | | | 350,909 | | | |
Bethlehem, Public Impt., G.O. Bond | | | 4.500% | | | | 12/1/2035 | | | | AA2 | | | | 425,000 | | | | 443,475 | | | |
Binghamton, Public Impt., G.O. Bond | | | 4.000% | | | | 9/15/2024 | | | | A2 | | | | 505,000 | | | | 517,645 | | | |
Briarcliff Manor, Public Impt., Series A, G.O. Bond | | | 2.000% | | | | 9/1/2014 | | | | Aa2 | | | | 260,000 | | | | 264,992 | | | |
Brookhaven, G.O. Bond, AMBAC | | | 5.000% | | | | 6/1/2014 | | | | Aa2 | | | | 200,000 | | | | 209,062 | | | |
Buffalo Fiscal Stability Authority, Sales Tax & State Aid, Series B, Revenue Bond, NATL | | | 5.000% | | | | 9/1/2016 | | | | Aa1 | | | | 525,000 | | | | 570,218 | | | |
Buffalo, Public Impt., Series A, G.O. Bond | | | 3.000% | | | | 4/1/2023 | | | | A1 | | | | 400,000 | | | | 388,264 | | | |
Cattaraugus County, Highway Impt., G.O. Bond | | | 2.000% | | | | 4/15/2019 | | | | A1 | | | | 405,000 | | | | 404,178 | | | |
Cayuga County, Public Impt., G.O. Bond, AGM | | | 3.250% | | | | 4/1/2026 | | | | A1 | | | | 670,000 | | | | 671,333 | | | |
Chautauqua County, Public Impt., G.O. Bond | | | 4.250% | | | | 1/15/2027 | | | | A2 | | | | 665,000 | | | | 688,581 | | | |
Chenango Valley Central School District, G.O. Bond, AGM | | | 2.125% | | | | 6/15/2021 | | | | A2 | | | | 500,000 | | | | 468,940 | | | |
Clarence Central School District, G.O. Bond | | | 4.000% | | | | 5/15/2021 | | | | Aa2 | | | | 250,000 | | | | 277,843 | | | |
Clarkstown Central School District, G.O. Bond | | | 4.000% | | | | 10/15/2021 | | | | Aa2 | | | | 500,000 | | | | 554,215 | | | |
Clarkstown, Public Impt., G.O. Bond | | | 2.000% | | | | 10/15/2014 | | | | AAA2 | | | | 675,000 | | | | 689,789 | | | |
Cleveland Hill Union Free School District, G.O. Bond, AGM | | | 3.750% | | | | 6/15/2025 | | | | A2 | | | | 475,000 | | | | 493,957 | | | |
Clifton Park Water Authority, Revenue Bond | | | 4.250% | | | | 10/1/2029 | | | | A2 | | | | 250,000 | | | | 258,455 | | | |
Connetquot Central School District of Islip, G.O. Bond | | | 4.000% | | | | 7/15/2014 | | | | Aa2 | | | | 390,000 | | | | 405,163 | | | |
Copiague Union Free School District, G.O. Bond | | | 2.000% | | | | 5/1/2015 | | | | Aa3 | | | | 500,000 | | | | 512,650 | | | |
Cortland County, Public Impt., G.O. Bond, AGM | | | 3.000% | | | | 8/15/2030 | | | | AA2 | | | | 215,000 | | | | 185,371 | | | |
Dutchess County, Public Impt., G.O. Bond | | | 5.000% | | | | 10/1/2014 | | | | Aa1 | | | | 235,000 | | | | 248,921 | | | |
Dutchess County, Public Impt., G.O. Bond | | | 5.000% | | | | 10/1/2015 | | | | Aa1 | | | | 250,000 | | | | 274,783 | | | |
Dutchess County, Public Impt., Prerefunded Balance, G.O. Bond, NATL | | | 4.000% | | | | 12/15/2016 | | | | Aa1 | | | | 315,000 | | | | 332,123 | | | |
Dutchess County, Public Impt., Unrefunded Balance, G.O. Bond, NATL | | | 4.000% | | | | 12/15/2016 | | | | Aa1 | | | | 360,000 | | | | 376,229 | | | |
East Irondequoit Central School District, G.O. Bond | | | 2.250% | | | | 6/15/2014 | | | | Aa2 | | | | 580,000 | | | | 589,315 | | | |
East Islip Union Free School District, Series A, G.O. Bond | | | 4.000% | | | | 6/15/2015 | | | | AA2 | | | | 345,000 | | | | 366,369 | | | |
Erie County Water Authority, Revenue Bond | | | 5.000% | | | | 12/1/2013 | | | | Aa2 | | | | 400,000 | | | | 407,960 | | | |
The accompanying notes are an integral part of the financial statements.
3
New York Tax Exempt Series
Investment Portfolio - June 30, 2013
(unaudited)
| | | | | | | | | | | | | | | | | | | | | | |
| | | COUPON
RATE | | | MATURITY
DATE | | | CREDIT
RATING1
(UNAUDITED) | | | PRINCIPAL
AMOUNT | | | VALUE
(NOTE 2) | | | |
|
NEW YORK MUNICIPAL BONDS (continued) |
| | | | | | |
Erie County Water Authority, Revenue Bond, NATL | | | 5.000% | | | | 12/1/2037 | | | | Aa2 | | | $ | 625,000 | | | $ | 646,769 | | | |
Erie County, Public Impt., Series A, G.O. Bond | | | 5.000% | | | | 4/1/2025 | | | | A2 | | | | 200,000 | | | | 221,500 | | | |
Erie County, Public Impt., Series A, G.O. Bond | | | 5.000% | | | | 4/1/2026 | | | | A2 | | | | 215,000 | | | | 235,569 | | | |
Essex County, Public Impt., G.O. Bond | | | 5.000% | | | | 5/1/2020 | | | | AA2 | | | | 500,000 | | | | 582,480 | | | |
Gananda Central School District, G.O. Bond | | | 3.000% | | | | 6/15/2019 | | | | AA2 | | | | 250,000 | | | | 260,320 | | | |
Gates Chili Central School District, G.O. Bond | | | 1.000% | | | | 6/15/2014 | | | | Aa3 | | | | 460,000 | | | | 462,093 | | | |
Greece Central School District, G.O. Bond, AGM | | | 5.000% | | | | 6/15/2015 | | | | Aa3 | | | | 500,000 | | | | 544,005 | | | |
Greece Central School District, G.O. Bond, AGM | | | 4.000% | | | | 6/15/2019 | | | | Aa3 | | | | 2,675,000 | | | | 2,900,529 | | | |
Greenburgh, Public Impt., G.O. Bond | | | 4.750% | | | | 5/15/2014 | | | | Aaa | | | | 250,000 | | | | 259,803 | | | |
Greene County, Public Impt., G.O. Bond | | | 1.500% | | | | 3/15/2014 | | | | Aa3 | | | | 505,000 | | | | 508,464 | | | |
Greene County, Public Impt., G.O. Bond | | | 3.000% | | | | 12/15/2014 | | | | Aa3 | | | | 595,000 | | | | 615,194 | | | |
Hauppauge Union Free School District, G.O. Bond | | | 3.000% | | | | 12/1/2014 | | | | Aa2 | | | | 585,000 | | | | 607,271 | | | |
Hempstead, Public Impt., G.O. Bond | | | 3.000% | | | | 8/15/2032 | | | | A2 | | | | 465,000 | | | | 381,588 | | | |
Hempstead, Public Impt., Series B, G.O. Bond | | | 2.500% | | | | 8/1/2013 | | | | Aaa | | | | 225,000 | | | | 225,491 | | | |
Hempstead, Public Impt., Series B, G.O. Bond | | | 2.500% | | | | 8/1/2014 | | | | Aaa | | | | 280,000 | | | | 287,361 | | | |
Horseheads Central School District, G.O. Bond | | | 2.000% | | | | 6/15/2015 | | | | Aa3 | | | | 540,000 | | | | 550,228 | | | |
Huntington, G.O. Bond, AMBAC | | | 5.500% | | | | 4/15/2014 | | | | Aaa | | | | 415,000 | | | | 432,642 | | | |
Huntington, Public Impt., G.O. Bond | | | 2.000% | | | | 6/15/2014 | | | | Aaa | | | | 570,000 | | | | 579,086 | | | |
Huntington, Public Impt., G.O. Bond | | | 3.000% | | | | 7/15/2015 | | | | Aaa | | | | 925,000 | | | | 969,049 | | | |
Iroquois Central School District, School Impt., G.O. Bond | | | 2.000% | | | | 6/15/2021 | | | | Aa2 | | | | 500,000 | | | | 484,060 | | | |
Ithaca City School District, G.O. Bond | | | 3.000% | | | | 7/1/2014 | | | | AA2 | | | | 675,000 | | | | 692,921 | | | |
Ithaca City School District, G.O. Bond, AGC | | | 3.000% | | | | 7/1/2014 | | | | A3 | | | | 330,000 | | | | 338,761 | | | |
Jamestown City School District, G.O. Bond | | | 3.000% | | | | 4/1/2019 | | | | A1 | | | | 200,000 | | | | 207,264 | | | |
Johnson City Central School District, Prerefunded Balance, G.O. Bond, FGRNA | | | 4.375% | | | | 6/15/2028 | | | | A2 | | | | 1,000,000 | | | | 1,039,590 | | | |
Katonah-Lewisboro Union Free School District, Series C, G.O. Bond, FGRNA | | | 5.000% | | | | 11/1/2014 | | | | Aa2 | | | | 1,000,000 | | | | 1,064,550 | | | |
Lockport City School District, G.O. Bond, AGM | | | 2.000% | | | | 8/1/2019 | | | | A1 | | | | 450,000 | | | | 449,253 | | | |
Long Beach City School District, G.O. Bond | | | 3.000% | | | | 5/1/2014 | | | | Aa2 | | | | 500,000 | | | | 511,365 | | | |
Long Island Power Authority, Electric Systems, Prerefunded Balance, Series C, Revenue Bond, CIFG | | | 5.000% | | | | 9/1/2015 | | | | Aaa | | | | 250,000 | | | | 252,070 | | | |
Long Island Power Authority, Electric Systems, Series A, Revenue Bond | | | 5.750% | | | | 4/1/2039 | | | | Baa1 | | | | 675,000 | | | | 754,130 | | | |
Long Island Power Authority, Electric Systems, Series F, Revenue Bond, NATL | | | 4.500% | | | | 5/1/2028 | | | | Baa1 | | | | 1,880,000 | | | | 1,894,984 | | | |
Mahopac Central School District, Series A, G.O. Bond | | | 4.000% | | | | 6/1/2014 | | | | Aa2 | | | | 945,000 | | | | 975,807 | | | |
Mamaroneck Union Free School District, G.O. Bond | | | 3.500% | | | | 6/15/2025 | | | | Aaa | | | | 1,000,000 | | | | 1,037,740 | | | |
Manhasset Union Free School District, G.O. Bond | | | 4.000% | | | | 9/15/2014 | | | | Aaa | | | | 655,000 | | | | 684,999 | | | |
Marlboro Central School District, G.O. Bond, AGC | | | 4.000% | | | | 12/15/2026 | | | | AA2 | | | | 500,000 | | | | 512,900 | | | |
Metropolitan Transportation Authority, Dedicated Tax Fund, Series B, Revenue Bond | | | 5.000% | | | | 11/15/2034 | | | | AA2 | | | | 1,000,000 | | | | 1,056,930 | | | |
The accompanying notes are an integral part of the financial statements.
4
New York Tax Exempt Series
Investment Portfolio - June 30, 2013
(unaudited)
| | | | | | | | | | | | | | | | | | | | | | |
| | | COUPON
RATE | | | MATURITY
DATE | | | CREDIT
RATING1
(UNAUDITED) | | | PRINCIPAL
AMOUNT | | | VALUE
(NOTE 2) | | | |
| |
NEW YORK MUNICIPAL BONDS (continued) | | | |
| | | | | | |
Metropolitan Transportation Authority, Series B, Revenue Bond, AGM | | | 4.500% | | | | 11/15/2032 | | | | A2 | | | $ | 500,000 | | | $ | 502,000 | | | |
Miller Place Union Free School District, G.O. Bond | | | 4.000% | | | | 2/15/2027 | | | | Aa2 | | | | 265,000 | | | | 270,952 | | | |
Minisink Valley Central School District, G.O. Bond | | | 2.500% | | | | 4/15/2014 | | | | AA2 | | | | 225,000 | | | | 228,751 | | | |
Minisink Valley Central School District, G.O. Bond | | | 2.500% | | | | 4/15/2015 | | | | AA2 | | | | 200,000 | | | | 205,530 | | | |
Monroe County Water Authority, Revenue Bond | | | 3.250% | | | | 8/1/2013 | | | | Aa2 | | | | 510,000 | | | | 511,372 | | | |
Monroe County Water Authority, Revenue Bond | | | 4.250% | | | | 8/1/2030 | | | | Aa2 | | | | 405,000 | | | | 416,227 | | | |
Monroe County Water Authority, Revenue Bond | | | 4.500% | | | | 8/1/2035 | | | | Aa2 | | | | 275,000 | | | | 281,531 | | | |
Monroe County, Public Impt., G.O. Bond, AGM | | | 3.000% | | | | 6/1/2022 | | | | A2 | | | | 500,000 | | | | 491,115 | | | |
Nassau County, Public Impt., Series C, G.O. Bond | | | 4.000% | | | | 10/1/2026 | | | | A2 | | | | 1,000,000 | | | | 1,020,820 | | | |
Nassau County, Public Impt., Series C, G.O. Bond, AGC | | | 5.000% | | | | 10/1/2028 | | | | A2 | | | | 1,000,000 | | | | 1,070,250 | | | |
New Rochelle City School District, G.O. Bond | | | 4.000% | | | | 12/15/2014 | | | | Aa2 | | | | 600,000 | | | | 632,136 | | | |
New York City Municipal Water Finance Authority, Series AA, Revenue Bond | | | 5.000% | | | | 6/15/2021 | | | | Aa2 | | | | 545,000 | | | | 622,052 | | | |
New York City Municipal Water Finance Authority, Series C, Revenue Bond | | | 5.000% | | | | 6/15/2014 | | | | Aa1 | | | | 250,000 | | | | 261,627 | | | |
New York City Municipal Water Finance Authority, Water & Sewer Systems, Series A, Revenue Bond | | | 4.250% | | | | 6/15/2033 | | | | Aa1 | | | | 1,250,000 | | | | 1,258,600 | | | |
New York City Municipal Water Finance Authority, Water & Sewer Systems, Series A, Revenue Bond | | | 4.500% | | | | 6/15/2037 | | | | Aa1 | | | | 1,000,000 | | | | 1,016,310 | | | |
New York City Municipal Water Finance Authority, Water & Sewer Systems, Series A, Revenue Bond | | | 5.750% | | | | 6/15/2040 | | | | Aa1 | | | | 1,000,000 | | | | 1,127,020 | | | |
New York City Municipal Water Finance Authority, Water & Sewer Systems, Series D, Revenue Bond, AMBAC | | | 4.500% | | | | 6/15/2036 | | | | Aa1 | | | | 500,000 | | | | 502,820 | | | |
New York City Municipal Water Finance Authority, Water & Sewer Systems, Series EE, Revenue Bond | | | 2.500% | | | | 6/15/2014 | | | | Aa2 | | | | 450,000 | | | | 459,882 | | | |
New York City Transitional Finance Authority, Future Tax Secured, Public Impt., Subseries F-1, Revenue Bond | | | 5.000% | | | | 2/1/2019 | | | | Aa1 | | | | 1,500,000 | | | | 1,747,755 | | | |
New York City Transitional Finance Authority, Prerefunded Balance, Future Tax Secured, Public Impt., Series C, Revenue Bond | | | 5.250% | | | | 2/1/2014 | | | | WR3 | | | | 730,000 | | | | 751,521 | | | |
New York City Transitional Finance Authority, Prerefunded Balance, Future Tax Secured, Public Impt., Series C, Revenue Bond | | | 5.250% | | | | 2/1/2017 | | | | WR3 | | | | 1,390,000 | | | | 1,430,727 | | | |
New York City Transitional Finance Authority, Prerefunded Balance, Future Tax Secured, Public Impt., Series C, Revenue Bond, XLCA | | | 5.000% | | | | 2/1/2019 | | | | Aaa | | | | 1,705,000 | | | | 1,752,433 | | | |
New York City Transitional Finance Authority, Prerefunded Balance, Future Tax Secured, Series B, Revenue Bond | | | 5.250% | | | | 8/1/2019 | | | | WR3 | | | | 2,705,000 | | | | 2,717,416 | | | |
New York City, Prerefunded Balance, Subseries J-1, G.O. Bond | | | 5.000% | | | | 8/1/2013 | | | | WR3 | | | | 25,000 | | | | 25,109 | | | |
The accompanying notes are an integral part of the financial statements.
5
New York Tax Exempt Series
Investment Portfolio - June 30, 2013
(unaudited)
| | | | | | | | | | | | | | | | | | | | | | |
| | | COUPON
RATE | | | MATURITY
DATE | | | CREDIT
RATING1
(UNAUDITED) | | | PRINCIPAL
AMOUNT | | | VALUE
(NOTE 2) | | | |
| |
NEW YORK MUNICIPAL BONDS (continued) | | | |
| | | | | | |
New York City, Public Impt., G.O. Bond, XLCA | | | 5.000% | | | | 9/1/2019 | | | | Aa2 | | | $ | 500,000 | | | $ | 541,975 | | | |
New York City, Public Impt., Prerefunded Balance, Series C, G.O. Bond | | | 5.500% | | | | 9/15/2019 | | | | AA2 | | | | 600,000 | | | | 606,714 | | | |
New York City, Public Impt., Prerefunded Balance, Series D, G.O. Bond | | | 5.250% | | | | 10/15/2017 | | | | Aa2 | | | | 1,950,000 | | | | 1,978,880 | | | |
New York City, Public Impt., Series A, G.O. Bond | | | 5.000% | | | | 8/1/2013 | | | | Aa2 | | | | 1,000,000 | | | | 1,004,370 | | | |
New York City, Public Impt., Series I, G.O. Bond, NATL | | | 5.000% | | | | 8/1/2013 | | | | Aa2 | | | | 500,000 | | | | 502,185 | | | |
New York City, Public Impt., Subseries A, G.O. Bond . | | | 5.000% | | | | 3/1/2015 | | | | Aa2 | | | | 1,000,000 | | | | 1,074,390 | | | |
New York City, Series A, G.O. Bond, AGM | | | 5.000% | | | | 8/1/2015 | | | | Aa2 | | | | 205,000 | | | | 223,967 | | | |
New York City, Series B, G.O. Bond | | | 4.000% | | | | 8/1/2013 | | | | Aa2 | | | | 865,000 | | | | 867,993 | | | |
New York City, Series D, G.O. Bond | | | 5.250% | | | | 8/1/2014 | | | | Aa2 | | | | 1,390,000 | | | | 1,465,394 | | | |
New York City, Unrefunded Balance, Subseries J-1, G.O. Bond | | | 5.000% | | | | 8/1/2013 | | | | Aa2 | | | | 175,000 | | | | 175,765 | | | |
New York Local Government Assistance Corp., Series A, Revenue Bond | | | 5.000% | | | | 4/1/2015 | | | | AAA2 | | | | 1,000,000 | | | | 1,079,600 | | | |
New York Power Authority, Series A, Revenue Bond | | | 4.000% | | | | 11/15/2018 | | | | Aa2 | | | | 220,000 | | | | 247,766 | | | |
New York Power Authority, Series A, Revenue Bond, FGIC | | | 5.000% | | | | 11/15/2016 | | | | Aa2 | | | | 900,000 | | | | 991,206 | | | |
New York Power Authority, Series C, Revenue Bond, NATL | | | 5.000% | | | | 11/15/2017 | | | | Aa2 | | | | 500,000 | | | | 582,645 | | | |
New York State Dormitory Authority, Columbia University, Revenue Bond | | | 5.000% | | | | 7/1/2038 | | | | Aaa | | | | 900,000 | | | | 961,515 | | | |
New York State Dormitory Authority, Cornell University, Series C, Revenue Bond | | | 5.000% | | | | 7/1/2037 | | | | Aa1 | | | | 1,000,000 | | | | 1,076,410 | | | |
New York State Dormitory Authority, New York University, Series A, Revenue Bond | | | 5.000% | | | | 7/1/2039 | | | | Aa3 | | | | 1,000,000 | | | | 1,060,310 | | | |
New York State Dormitory Authority, Series A, Revenue Bond, AGM | | | 4.000% | | | | 10/1/2025 | | | | A1 | | | | 1,500,000 | | | | 1,537,725 | | | |
New York State Dormitory Authority, Series A, Revenue Bond, AGM | | | 4.375% | | | | 10/1/2030 | | | | A1 | | | | 1,500,000 | | | | 1,521,825 | | | |
New York State Dormitory Authority, Series B, Revenue Bond | | | 5.000% | | | | 3/15/2019 | | | | AAA2 | | | | 1,000,000 | | | | 1,169,200 | | | |
New York State Dormitory Authority, Series B, Revenue Bond, AGM | | | 4.400% | | | | 10/1/2030 | | | | A2 | | | | 140,000 | | | | 142,237 | | | |
New York State Dormitory Authority, Series B, Revenue Bond, AGM | | | 4.750% | | | | 10/1/2040 | | | | A2 | | | | 1,360,000 | | | | 1,392,613 | | | |
New York State Dormitory Authority, University of Rochester, Series A, Revenue Bond | | | 5.125% | | | | 7/1/2039 | | | | Aa3 | | | | 1,000,000 | | | | 1,071,240 | | | |
New York State Environmental Facilities Corp., Clean Water & Drinking, Series A, Revenue Bond | | | 4.500% | | | | 6/15/2036 | | | | Aaa | | | | 1,000,000 | | | | 1,022,030 | | | |
New York State Environmental Facilities Corp., Clean Water & Drinking, Series B, Revenue Bond | | | 4.500% | | | | 6/15/2036 | | | | Aaa | | | | 1,500,000 | | | | 1,499,970 | | | |
New York State Environmental Facilities Corp., Pollution Control, Unrefunded Balance, Series B, Revenue Bond | | | 5.200% | | | | 5/15/2014 | | | | Aaa | | | | 90,000 | | | | 92,057 | | | |
The accompanying notes are an integral part of the financial statements.
6
New York Tax Exempt Series
Investment Portfolio - June 30, 2013
(unaudited)
| | | | | | | | | | | | | | | | | | | | | | |
| | | COUPON
RATE | | | MATURITY
DATE | | | CREDIT
RATING1
(UNAUDITED) | | | PRINCIPAL
AMOUNT | | | VALUE
(NOTE 2) | | | |
| |
NEW YORK MUNICIPAL BONDS (continued) | | | |
| | | | | | |
New York State Environmental Facilities Corp., Series A, Revenue Bond | | | 5.000% | | | | 6/15/2017 | | | | Aaa | | | $ | 1,000,000 | | | $ | 1,145,110 | | | |
New York State Municipal Bond Bank Agency, Subseries A1, Revenue Bond | | | 4.000% | | | | 12/15/2014 | | | | AA2 | | | | 250,000 | | | | 262,710 | | | |
New York State Municipal Bond Bank Agency, Subseries B1, Revenue Bond | | | 4.125% | | | | 12/15/2029 | | | | A2 | | | | 420,000 | | | | 423,793 | | | |
New York State Municipal Bond Bank Agency, Subseries B1, Revenue Bond | | | 4.500% | | | | 12/15/2034 | | | | A2 | | | | 215,000 | | | | 218,859 | | | |
New York State Power Authority, Series A, Revenue Bond, NATL | | | 4.500% | | | | 11/15/2047 | | | | Aa2 | | | | 2,000,000 | | | | 2,010,180 | | | |
New York State Thruway Authority, Highway Impt., Prerefunded Balance, Series A, Revenue Bond, AMBAC | | | 5.000% | | | | 3/15/2017 | | | | Aa2 | | | | 260,000 | | | | 274,937 | | | |
New York State Thruway Authority, Highway Impt., Series A, Revenue Bond | | | 5.000% | | | | 3/15/2015 | | | | AAA2 | | | | 500,000 | | | | 538,435 | | | |
New York State Thruway Authority, Highway Impt., Series I, Revenue Bond | | | 4.000% | | | | 1/1/2019 | | | | A1 | | | | 525,000 | | | | 576,056 | | | |
New York State Thruway Authority, Series A, Revenue Bond | | | 5.000% | | | | 3/15/2015 | | | | AAA2 | | | | 500,000 | | | | 538,435 | | | |
New York State Thruway Authority, Series A, Revenue Bond | | | 5.000% | | | | 3/15/2020 | | | | AAA2 | | | | 550,000 | | | | 646,355 | | | |
New York State Thruway Authority, Series B, Revenue Bond, AMBAC | | | 5.000% | | | | 4/1/2019 | | | | AA2 | | | | 2,500,000 | | | | 2,717,425 | | | |
New York State Urban Development Corp., Correctional Capital Facilities, Series A, Revenue Bond, AGM | | | 5.250% | | | | 1/1/2014 | | | | Aa3 | | | | 175,000 | | | | 179,441 | | | |
New York State, Series C, G.O. Bond | | | 5.000% | | | | 4/15/2014 | | | | Aa2 | | | | 645,000 | | | | 670,523 | | | |
New York State, Series C, G.O. Bond | | | 5.000% | | | | 9/1/2014 | | | | Aa2 | | | | 1,000,000 | | | | 1,057,760 | | | |
New York State, Series C, G.O. Bond | | | 4.000% | | | | 2/1/2027 | | | | Aa2 | | | | 600,000 | | | | 626,856 | | | |
Niagara County, Water Utility Impt., G.O. Bond | | | 2.000% | | | | 2/1/2020 | | | | Aa3 | | | | 500,000 | | | | 495,020 | | | |
Niagara-Wheatfield Central School District, G.O. Bond, FGRNA | | | 4.125% | | | | 2/15/2019 | | | | A2 | | | | 610,000 | | | | 660,044 | | | |
Niagara-Wheatfield Central School District, G.O. Bond, FGRNA | | | 4.125% | | | | 2/15/2020 | | | | A2 | | | | 850,000 | | | | 912,552 | | | |
North Colonie Central School District, G.O. Bond | | | 4.000% | | | | 7/15/2020 | | | | AA2 | | | | 400,000 | | | | 452,236 | | | |
North Hempstead, G.O. Bond | | | 3.000% | | | | 5/1/2015 | | | | Aa1 | | | | 375,000 | | | | 391,695 | | | |
Olean, Public Impt., G.O. Bond | | | 3.000% | | | | 8/1/2030 | | | | A1 | | | | 460,000 | | | | 399,280 | | | |
Oneida County, Public Impt., G.O. Bond, AGM | | | 3.000% | | | | 5/1/2020 | | | | A1 | | | | 400,000 | | | | 411,172 | | | |
Onondaga County, Public Impt., Series A, G.O. Bond | | | 3.000% | | | | 3/1/2015 | | | | Aa1 | | | | 1,000,000 | | | | 1,041,940 | | | |
Onondaga County, Public Impt., Series A, G.O. Bond | | | 4.500% | | | | 3/1/2028 | | | | Aa1 | | | | 365,000 | | | | 384,586 | | | |
Ontario County, Public Impt., G.O. Bond | | | 3.000% | | | | 4/15/2015 | | | | Aa1 | | | | 200,000 | | | | 207,856 | | | |
Orange County, Series A, G.O. Bond | | | 5.000% | | | | 7/15/2014 | | | | Aaa | | | | 550,000 | | | | 577,329 | | | |
Orange County, Series A, G.O. Bond | | | 5.000% | | | | 7/15/2015 | | | | Aaa | | | | 500,000 | | | | 545,390 | | | |
Orangetown, Public Impt., G.O. Bond | | | 3.000% | | | | 9/15/2026 | | | | Aa2 | | | | 580,000 | | | | 574,043 | | | |
The accompanying notes are an integral part of the financial statements.
7
New York Tax Exempt Series
Investment Portfolio - June 30, 2013
(unaudited)
| | | | | | | | | | | | | | | | | | | | | | |
| | | COUPON
RATE | | | MATURITY
DATE | | | CREDIT
RATING1
(UNAUDITED) | | | PRINCIPAL
AMOUNT | | | VALUE
(NOTE 2) | | | |
| |
NEW YORK MUNICIPAL BONDS (continued) | | | |
| | | | | | |
Otsego County, G.O. Bond | | | 4.000% | | | | 11/15/2027 | | | | Aa3 | | | $ | 790,000 | | | $ | 822,785 | | | |
Perinton, Public Impt., G.O. Bond | | | 4.250% | | | | 12/15/2031 | | | | AA2 | | | | 175,000 | | | | 182,224 | | | |
Pittsford Central School District, G.O. Bond | | | 4.000% | | | | 10/1/2021 | | | | Aa1 | | | | 350,000 | | | | 392,623 | | | |
Pittsford Central School District, G.O. Bond | | | 4.000% | | | | 10/1/2022 | | | | Aa1 | | | | 600,000 | | | | 667,788 | | | |
Pleasantville Union Free School District, G.O. Bond | | | 4.000% | | | | 5/1/2015 | | | | Aa2 | | | | 530,000 | | | | 562,584 | | | |
Pleasantville Union Free School District, G.O. Bond | | | 4.375% | | | | 5/1/2039 | | | | Aa2 | | | | 500,000 | | | | 500,615 | | | |
Port Authority of New York & New Jersey, Airport & Marina Impt., Series 175, Revenue Bond | | | 4.000% | | | | 12/1/2026 | | | | Aa3 | | | | 1,000,000 | | | | 1,037,520 | | | |
Port Authority of New York & New Jersey, Revenue Bond | | | 5.000% | | | | 12/1/2018 | | | | Aa3 | | | | 465,000 | | | | 545,882 | | | |
Port Authority of New York & New Jersey, Revenue Bond | | | 4.750% | | | | 7/15/2030 | | | | Aa3 | | | | 495,000 | | | | 519,869 | | | |
Port Authority of New York & New Jersey, Revenue Bond | | | 4.500% | | | | 10/15/2037 | | | | Aa3 | | | | 400,000 | | | | 405,892 | | | |
Port Washington Union Free School District, G.O. Bond | | | 3.000% | | | | 12/1/2014 | | | | Aa1 | | | | 500,000 | | | | 519,980 | | | |
Putnam County, Public Impt., G.O. Bond | | | 2.000% | | | | 11/15/2014 | | | | Aa2 | | | | 255,000 | | | | 260,577 | | | |
Queensbury Union Free School District, G.O. Bond | | | 4.000% | | | | 12/15/2014 | | | | Aa2 | | | | 300,000 | | | | 315,525 | | | |
Ramapo, Public Impt., Series B, G.O. Bond, NATL | | | 4.375% | | | | 5/1/2031 | | | | A1 | | | | 435,000 | | | | 435,496 | | | |
Ramapo, Public Impt., Series B, G.O. Bond, NATL | | | 4.375% | | | | 5/1/2032 | | | | A1 | | | | 510,000 | | | | 509,000 | | | |
Ramapo, Public Impt., Series B, G.O. Bond, NATL | | | 4.500% | | | | 5/1/2033 | | | | A1 | | | | 410,000 | | | | 410,303 | | | |
Rochester, Series A, G.O. Bond, AMBAC | | | 5.000% | | | | 8/15/2022 | | | | Aa3 | | | | 95,000 | | | | 110,366 | | | |
Sachem Central School District of Holbrook, G.O. Bond, FGRNA | | | 4.375% | | | | 10/15/2030 | | | | AA2 | | | | 1,000,000 | | | | 1,017,610 | | | |
Saratoga County Water Authority, Water Utility Impt., Revenue Bond | | | 5.000% | | | | 9/1/2038 | | | | AA2 | | | | 950,000 | | | | 986,756 | | | |
Saratoga County, Sewer Impt., Series A, G.O. Bond | | | 4.750% | | | | 7/15/2036 | | | | Aa1 | | | | 820,000 | | | | 850,881 | | | |
Saratoga County, Sewer Impt., Series B, G.O. Bond | | | 4.200% | | | | 7/15/2032 | | | | AA2 | | | | 425,000 | | | | 428,455 | | | |
Saratoga County, Sewer Impt., Series B, G.O. Bond | | | 4.250% | | | | 7/15/2035 | | | | AA2 | | | | 700,000 | | | | 703,346 | | | |
Saratoga Springs City School District, G.O. Bond | | | 4.000% | | | | 6/15/2015 | | | | AA2 | | | | 500,000 | | | | 534,450 | | | |
Scarsdale Union Free School District, G.O. Bond | | | 4.000% | | | | 6/1/2015 | | | | Aaa | | | | 270,000 | | | | 287,771 | | | |
Schenectady County, Series A, G.O. Bond | | | 3.000% | | | | 7/15/2013 | | | | Aa1 | | | | 485,000 | | | | 485,635 | | | |
Schenectady County, Series A, G.O. Bond | | | 2.000% | | | | 7/15/2014 | | | | Aa1 | | | | 475,000 | | | | 483,151 | | | |
Schroon Lake Central School District, G.O. Bond, AGM | | | 4.000% | | | | 6/15/2027 | | | | A2 | | | | 490,000 | | | | 510,869 | | | |
Shenendehowa Central School District, G.O. Bond | | | 2.500% | | | | 6/15/2014 | | | | AA2 | | | | 280,000 | | | | 285,034 | | | |
Shenendehowa Central School District, G.O. Bond | | | 4.000% | | | | 7/15/2020 | | | | AA2 | | | | 475,000 | | | | 532,052 | | | |
Skaneateles Central School District, G.O. Bond | | | 2.000% | | | | 6/15/2015 | | | | AA2 | | | | 660,000 | | | | 673,266 | | | |
Skaneateles Central School District, G.O. Bond | | | 4.000% | | | | 6/15/2015 | | | | AA2 | | | | 280,000 | | | | 297,060 | | | |
Smithtown Central School District, G.O. Bond | | | 3.000% | | | | 8/1/2013 | | | | Aa2 | | | | 255,000 | | | | 255,637 | | | |
South Country Central School District at Brookhaven, G.O. Bond, AGM | | | 4.000% | | | | 7/15/2027 | | | | AA2 | | | | 750,000 | | | | 756,473 | | | |
South Glens Falls Central School District, Unrefunded Balance, G.O. Bond, FGRNA | | | 5.375% | | | | 6/15/2018 | | | | A1 | | | | 95,000 | | | | 97,130 | | | |
The accompanying notes are an integral part of the financial statements.
8
New York Tax Exempt Series
Investment Portfolio - June 30, 2013
(unaudited)
| | | | | | | | | | | | | | | | | | | | | | |
| | | COUPON
RATE | | | MATURITY
DATE | | | CREDIT
RATING1
(UNAUDITED) | | | PRINCIPAL
AMOUNT | | | VALUE
(NOTE 2) | | | |
| | | | | |
NEW YORK MUNICIPAL BONDS (continued) | | | | | | | | | | | | | | | | | | | |
| | | | | | |
South Huntington Union Free School District, G.O. Bond | | | 2.250% | | | | 3/15/2015 | | | | Aa1 | | | $ | 250,000 | | | $ | 257,497 | | | |
South Orangetown Central School District, G.O. Bond | | | 3.000% | | | | 8/1/2015 | | | | Aa2 | | | | 230,000 | | | | 239,596 | | | |
Southampton Union Free School District, G.O. Bond | | | 2.500% | | | | 6/1/2015 | | | | Aaa | | | | 950,000 | | | | 985,454 | | | |
Southampton, Public Impt., G.O. Bond | | | 3.000% | | | | 4/15/2014 | | | | Aa1 | | | | 525,000 | | | | 536,340 | | | |
Southold, Public Impt., G.O. Bond | | | 2.000% | | | | 8/15/2013 | | | | Aa2 | | | | 580,000 | | | | 581,276 | | | |
Spencerport Fire District, Public Impt., G.O. Bond, AGC | | | 4.500% | | | | 11/15/2031 | | | | AA2 | | | | 290,000 | | | | 305,089 | | | |
Spencerport Fire District, Public Impt., G.O. Bond, AGC | | | 4.500% | | | | 11/15/2032 | | | | AA2 | | | | 250,000 | | | | 262,280 | | | |
St. Lawrence County, Public Impt., G.O. Bond, FGRNA | | | 4.500% | | | | 5/15/2031 | | | | A2 | | | | 1,185,000 | | | | 1,188,756 | | | |
St. Lawrence County, Public Impt., G.O. Bond, FGRNA | | | 4.500% | | | | 5/15/2032 | | | | A2 | | | | 1,000,000 | | | | 1,001,560 | | | |
Suffolk County Water Authority, Revenue Bond | | | 4.000% | | | | 6/1/2022 | | | | AA2 | | | | 200,000 | | | | 222,812 | | | |
Suffolk County Water Authority, Revenue Bond | | | 4.000% | | | | 6/1/2024 | | | | AA2 | | | | 450,000 | | | | 488,187 | | | |
Suffolk County Water Authority, Revenue Bond, NATL | | | 4.500% | | | | 6/1/2027 | | | | Baa1 | | | | 1,160,000 | | | | 1,184,209 | | | |
Suffolk County Water Authority, Series A, Revenue Bond | | | 5.000% | | | | 6/1/2018 | | | | AA2 | | | | 200,000 | | | | 231,712 | | | |
Suffolk County Water Authority, Series A, Revenue Bond | | | 4.500% | | | | 6/1/2030 | | | | AA2 | | | | 640,000 | | | | 664,582 | | | |
Suffolk County Water Authority, Series A, Revenue Bond, NATL | | | 4.500% | | | | 6/1/2032 | | | | Baa1 | | | | 1,000,000 | | | | 1,017,240 | | | |
Suffolk County, Public Impt., Series B, G.O. Bond | | | 3.000% | | | | 10/15/2014 | | | | A2 | | | | 2,000,000 | | | | 2,062,020 | | | |
Syracuse, Public Impt., Series A, G.O. Bond, FGRNA | | | 4.250% | | | | 12/1/2028 | | | | A1 | | | | 600,000 | | | | 601,662 | | | |
Syracuse, Public Impt., Series A, G.O. Bond, FGRNA | | | 4.250% | | | | 12/1/2029 | | | | A1 | | | | 600,000 | | | | 599,982 | | | |
Tarrytowns Union Free School District, G.O. Bond, AMBAC | | | 4.250% | | | | 1/15/2030 | | | | Aa2 | | | | 215,000 | | | | 217,584 | | | |
Tarrytowns Union Free School District, G.O. Bond, AMBAC | | | 4.375% | | | | 1/15/2032 | | | | Aa2 | | | | 1,090,000 | | | | 1,101,892 | | | |
Three Village Central School District Brookhaven & Smithtown, G.O. Bond | | | 3.500% | | | | 5/1/2015 | | | | Aa2 | | | | 1,000,000 | | | | 1,053,670 | | | |
Tompkins County, Public Impt., G.O. Bond | | | 4.250% | | | | 12/15/2032 | | | | Aa1 | | | | 300,000 | | | | 303,267 | | | |
Tompkins County, Series A, G.O. Bond, NATL | | | 5.250% | | | | 2/15/2015 | | | | Aa1 | | | | 315,000 | | | | 324,724 | | | |
Triborough Bridge & Tunnel Authority, General Purposes, Prerefunded Balance, Series A, Revenue Bond, NATL | | | 4.750% | | | | 1/1/2019 | | | | AA2 | | | | 300,000 | | | | 329,604 | | | |
Triborough Bridge & Tunnel Authority, General Purposes, Prerefunded Balance, Series B, Revenue Bond | | | 5.000% | | | | 1/1/2014 | | | | AA2 | | | | 900,000 | | | | 921,654 | | | |
Triborough Bridge & Tunnel Authority, Revenue Bond | | | 5.000% | | | | 11/15/2018 | | | | Aa3 | | | | 490,000 | | | | 571,805 | | | |
The accompanying notes are an integral part of the financial statements.
9
New York Tax Exempt Series
Investment Portfolio - June 30, 2013
(unaudited)
| | | | | | | | | | | | | | | | | | | | | | |
| | | COUPON
RATE | | | MATURITY
DATE | | | CREDIT
RATING1
(UNAUDITED) | | | PRINCIPAL
AMOUNT/
SHARES | | | VALUE (NOTE 2) | | | |
| | | | | |
NEW YORK MUNICIPAL BONDS (continued) | | | | | | | | | | | | | | | | | | | |
| | | | | | |
Triborough Bridge & Tunnel Authority, Series B, Revenue Bond | | | 5.000% | | | | 11/15/2022 | | | | Aa3 | | | $ | 1,000,000 | | | $ | 1,184,120 | | | |
Triborough Bridge & Tunnel Authority, Series C, Revenue Bond | | | 5.000% | | | | 11/15/2038 | | | | Aa3 | | | | 900,000 | | | | 938,277 | | | |
Union Endicott Central School District, G.O. Bond, FGRNA | | | 4.125% | | | | 6/15/2014 | | | | A2 | | | | 605,000 | | | | 626,018 | | | |
Union Endicott Central School District, G.O. Bond, FGRNA | | | 4.125% | | | | 6/15/2015 | | | | A2 | | | | 865,000 | | | | 919,694 | | | |
Victor Central School District, G.O. Bond | | | 4.000% | | | | 6/15/2014 | | | | Aa2 | | | | 290,000 | | | | 299,529 | | | |
Voorheesville Central School District, G.O. Bond | | | 5.000% | | | | 6/15/2021 | | | | AA2 | | | | 500,000 | | | | 595,905 | | | |
Warren County, Public Impt., G.O. Bond, AGM | | | 4.000% | | | | 7/15/2020 | | | | AA2 | | | | 500,000 | | | | 543,650 | | | |
Wayne County, Public Impt., G.O. Bond | | | 3.000% | | | | 6/1/2021 | | | | Aa2 | | | | 295,000 | | | | 306,750 | | | |
Webster Central School District, Series A, G.O. Bond | | | 2.000% | | | | 10/15/2014 | | | | AA2 | | | | 325,000 | | | | 331,068 | | | |
Webster Central School District, Series B, G.O. Bond | | | 2.000% | | | | 10/15/2014 | | | | AA2 | | | | 410,000 | | | | 417,655 | | | |
Westchester County, Public Impt., Prerefunded Balance, Series B, G.O. Bond | | | 3.700% | | | | 12/15/2015 | | | | Aaa | | | | 1,000,000 | | | | 1,016,080 | | | |
Westchester County, Public Impt., Series A, G.O. Bond | | | 3.000% | | | | 1/15/2015 | | | | Aaa | | | | 500,000 | | | | 519,750 | | | |
Westchester County, Series C, G.O. Bond | | | 5.000% | | | | 11/1/2013 | | | | Aaa | | | | 200,000 | | | | 203,276 | | | |
White Plains City School District, Series B, G.O. Bond | | | 4.650% | | | | 5/15/2031 | | | | Aa2 | | | | 685,000 | | | | 727,107 | | | |
White Plains, Public Impt., Series A, G.O. Bond | | | 2.750% | | | | 9/15/2023 | | | | Aa1 | | | | 330,000 | | | | 333,175 | | | |
William Floyd Union Free School District of the Mastics-Moriches-Shirley, G.O. Bond | | | 2.250% | | | | 12/15/2014 | | | | AA2 | | | | 400,000 | | | | 409,784 | | | |
Yorktown Central School District, G.O. Bond | | | 4.000% | | | | 3/1/2025 | | | | AA2 | | | | 370,000 | | | | 388,049 | | | |
| | | | | | | | | | | | | | | | | | | | | | |
| | | | | | | | | | | | | | | | | | | | | | |
TOTAL MUNICIPAL BONDS | | | | | | | | | | | | | | | | | | | | | | |
(Identified Cost $143,764,439) | | | | | | | | | | | | | | | | | | | 145,294,641 | | | |
| | | | | | | | | | | | | | | | | | | | | | |
| | | | | | | | | | | | | | | | | | | | | | |
SHORT-TERM INVESTMENT - 10.4% | | | | | | | | | | | | | | | | | | | | | | |
| | | | | | |
Dreyfus BASIC New York Municipal Money Market Fund | | | | | | | | | | | | | | | | | | | | | | |
(Identified Cost $17,131,322) | | | | | | | | | | | | | | | 17,131,322 | | | | 17,131,322 | | | |
| | | | | | | | | | | | | | | | | | | | | | |
TOTAL INVESTMENTS - 98.6% | | | | | | | | | | | | | | | | | | | | | | |
(Identified Cost $160,895,761) | | | | | | | | | | | | | | | | | | | 162,425,963 | | | |
OTHER ASSETS, LESS LIABILITIES - 1.4% | | | | | | | | | | | | | | | | | | | 2,266,652 | | | |
| | | | | | | | | | | | | | | | | | | | | | |
NET ASSETS - 100% | | | | | | | | | | | | | | | | | | $ | 164,692,615 | | | |
| | | | | | | | | | | | | | | | | | | | | | |
The accompanying notes are an integral part of the financial statements.
10
New York Tax Exempt Series
Investment Portfolio - June 30, 2013
(unaudited)
KEY:
G.O. Bond - General Obligation Bond
Impt. - Improvement
Scheduled principal and interest payments are guaranteed by:
AGC (Assured Guaranty Corp.)
AGM (Assurance Guaranty Municipal Corp.)
AMBAC (AMBAC Assurance Corp.)
CIFG (CIFG North America, Inc.)
FGRNA (FGIC reinsured by NATL)
NATL (National Public Finance Guarantee Corp.)
XLCA (XL Capital Assurance)
The insurance does not guarantee the market value of the municipal bonds.
1Credit ratings from Moody’s (unaudited).
2Credit ratings from S&P (unaudited).
3Credit rating has been withdrawn. As of June 30, 2013, there is no rating available (unaudited).
The Series’ portfolio holds, as a percentage of net assets, greater than 10% in bonds insured by the following company: NATL - 12.7%.
11
New York Tax Exempt Series
Statement of Assets and Liabilities
June 30, 2013 (unaudited)
| | | | |
ASSETS: | | | | |
| |
Investments (identified cost $160,895,761) (Note 2) | | $ | 162,425,963 | |
Receivable for securities sold | | | 2,048,650 | |
Interest receivable | | | 1,349,494 | |
Receivable for fund shares sold | | | 127,020 | |
Prepaid expenses | | | 426 | |
| | | | |
| |
TOTAL ASSETS | | | 165,951,553 | |
| | | | |
| |
LIABILITIES: | | | | |
| |
Accrued management fees (Note 3) | | | 68,704 | |
Accrued fund accounting and administration fees (Note 3) | | | 13,320 | |
Accrued transfer agent fees (Note 3) | | | 773 | |
Accrued Chief Compliance Officer service fees (Note 3) | | | 339 | |
Payable for securities purchased | | | 1,137,100 | |
Payable for fund shares repurchased | | | 8,497 | |
Other payables and accrued expenses | | | 30,205 | |
| | | | |
| |
TOTAL LIABILITIES | | | 1,258,938 | |
| | | | |
| |
TOTAL NET ASSETS | | $ | 164,692,615 | |
| | | | |
| |
NET ASSETS CONSIST OF: | | | | |
| |
Capital stock | | $ | 156,949 | |
Additional paid-in-capital | | | 162,256,266 | |
Undistributed net investment income | | | 364,201 | |
Accumulated net realized gain on investments | | | 384,997 | |
Net unrealized appreciation on investments | | | 1,530,202 | |
| | | | |
| |
TOTAL NET ASSETS | | $ | 164,692,615 | |
| | | | |
| |
NET ASSET VALUE, OFFERING PRICE AND REDEMPTION PRICE PER SHARE - Class A ($164,692,615/15,694,890 shares) | | $ | 10.49 | |
| | | | |
The accompanying notes are an integral part of the financial statements.
12
New York Tax Exempt Series
Statement of Operations
For the Six Months Ended June 30, 2013 (unaudited)
| | | | |
INVESTMENT INCOME: | | | | |
| |
Interest | | $ | 1,892,274 | |
Dividends | | | 192 | |
| | | | |
| |
Total Investment Income | | | 1,892,466 | |
| | | | |
| |
EXPENSES: | | | | |
| |
Management fees (Note 3) | | | 413,906 | |
Fund accounting and administration fees (Note 3) | | | 41,809 | |
Transfer agent fees (Note 3) | | | 2,184 | |
Directors’ fees (Note 3) | | | 1,890 | |
Chief Compliance Officer service fees (Note 3) | | | 1,118 | |
Custodian fees | | | 4,154 | |
Miscellaneous | | | 32,016 | |
| | | | |
| |
Total Expenses | | | 497,077 | |
| | | | |
| |
NET INVESTMENT INCOME | | | 1,395,389 | |
| | | | |
| |
REALIZED AND UNREALIZED GAIN (LOSS) ON INVESTMENTS: | | | | |
| |
Net realized gain (loss) on investments | | | 268,396 | |
Net change in unrealized appreciation (depreciation) on investments | | | (5,033,657 | ) |
| | | | |
| |
NET REALIZED AND UNREALIZED GAIN (LOSS) ON INVESTMENTS | | | (4,765,261 | ) |
| | | | |
| |
NET DECREASE IN NET ASSETS RESULTING FROM OPERATIONS | | $ | (3,369,872 | ) |
| | | | |
The accompanying notes are an integral part of the financial statements.
13
New York Tax Exempt Series
Statements of Changes in Net Assets
| | | | | | | | |
| | | FOR THE SIX
MONTHS ENDED
6/30/13
(UNAUDITED) | | | FOR THE
YEAR ENDED
12/31/12 | |
INCREASE (DECREASE) IN NET ASSETS: | | | | | | | | |
| | |
OPERATIONS: | | | | | | | | |
| | |
Net investment income | | $ | 1,395,389 | | | $ | 2,813,892 | |
Net realized gain (loss) on investments | | | 268,396 | | | | 120,091 | |
Net change in unrealized appreciation (depreciation) on investments | | | (5,033,657 | ) | | | 2,342,321 | |
| | | | | | | | |
| | |
Net increase (decrease) from operations | | | (3,369,872 | ) | | | 5,276,304 | |
| | | | | | | | |
| | |
DISTRIBUTIONS TO SHAREHOLDERS (Note 8): | | | | | | | | |
| | |
From net investment income | | | (1,091,186 | ) | | | (3,018,903 | ) |
From net realized gain on investments | | | — | | | | (1,500 | ) |
| | | | | | | | |
| | |
Total distributions to shareholders | | | (1,091,186 | ) | | | (3,020,403 | ) |
| | | | | | | | |
| | |
CAPITAL STOCK ISSUED AND REPURCHASED: | | | | | | | | |
| | |
Net increase from capital share transactions (Note 5) | | | 6,368,249 | | | | 2,437,158 | |
| | | | | | | | |
| | |
Net increase in net assets | | | 1,907,191 | | | | 4,693,059 | |
| | |
NET ASSETS: | | | | | | | | |
| | |
Beginning of period | | | 162,785,424 | | | | 158,092,365 | |
| | | | | | | | |
| | |
End of period (including undistributed net investment income of $364,201 and $59,998, respectively) | | $ | 164,692,615 | | | $ | 162,785,424 | |
| | | | | | | | |
The accompanying notes are an integral part of the financial statements.
14
New York Tax Exempt Series
Financial Highlights
| | | | | | | | | | | | | | | | | | | | | | | | |
| | | FOR THE SIX
MONTHS ENDED
6/30/13
(UNAUDITED) | | | FOR THE YEARS ENDED | |
| | | 12/31/12 | | | 12/31/11 | | | 12/31/10 | | | 12/31/09 | | | 12/31/08 | |
Per share data (for a share outstanding throughout each period): | | | | | | | | | | | | | | | | | | | | | | | | |
Net asset value - Beginning of period | | $ | 10.78 | | | $ | 10.63 | | | $ | 10.19 | | | $ | 10.55 | | | $ | 9.79 | | | $ | 10.41 | |
| | | | | | | | | | | | | | | | | | | | | | | | |
Income (loss) from investment operations: | | | | | | | | | | | | | | | | | | | | | | | | |
Net investment income | | | 0.09 | 1 | | | 0.19 | 1 | | | 0.28 | 1 | | | 0.36 | 1 | | | 0.38 | 1 | | | 0.38 | |
Net realized and unrealized gain (loss) on investments | | | (0.31 | ) | | | 0.16 | | | | 0.56 | | | | (0.32 | ) | | | 0.82 | | | | (0.63 | ) |
| | | | | | | | | | | | | | | | | | | | | | | | |
| | | | | | |
Total from investment operations | | | (0.22 | ) | | | 0.35 | | | | 0.84 | | | | 0.04 | | | | 1.20 | | | | (0.25 | ) |
| | | | | | | | | | | | | | | | | | | | | | | | |
| | | | | | |
Less distributions to shareholders: | | | | | | | | | | | | | | | | | | | | | | | | |
From net investment income | | | (0.07 | ) | | | (0.20 | ) | | | (0.27 | ) | | | (0.39 | ) | | | (0.41 | ) | | | (0.36 | ) |
From net realized gain on investments | | | — | | | | — | 2 | | | (0.13 | ) | | | (0.01 | ) | | | (0.03 | ) | | | (0.01 | ) |
| | | | | | | | | | | | | | | | | | | | | | | | |
| | | | | | |
Total distributions to shareholders | | | (0.07 | ) | | | (0.20 | ) | | | (0.40 | ) | | | (0.40 | ) | | | (0.44 | ) | | | (0.37 | ) |
| | | | | | | | | | | | | | | | | | | | | | | | |
| | | | | | |
Net asset value - End of period | | $ | 10.49 | | | $ | 10.78 | | | $ | 10.63 | | | $ | 10.19 | | | $ | 10.55 | | | $ | 9.79 | |
| | | | | | | | | | | | | | | | | | | | | | | | |
| | | | | | |
Net assets - End of period (000’s omitted) | | $ | 164,693 | | | $ | 162,785 | | | $ | 158,092 | | | $ | 136,225 | | | $ | 110,532 | | | $ | 97,202 | |
| | | | | | | | | | | | | | | | | | | | | | | | |
| | | | | | |
Total return3 | | | (2.05 | %) | | | 3.31 | % | | | 8.37 | % | | | 0.32 | % | | | 12.46 | % | | | (2.37 | %) |
Ratios (to average net assets)/ | | | | | | | | | | | | | | | | | | | | | | | | |
Supplemental Data: | | | | | | | | | | | | | | | | | | | | | | | | |
Expenses* | | | 0.60 | %4 | | | 0.60 | % | | | 0.61 | % | | | 0.61 | % | | | 0.64 | % | | | 0.64 | % |
Net investment income | | | 1.69 | %4 | | | 1.72 | % | | | 2.66 | % | | | 3.41 | % | | | 3.64 | % | | | 3.71 | % |
Portfolio turnover | | | 9 | % | | | 7 | % | | | 48 | % | | | 7 | % | | | 10 | % | | | 11 | % |
|
| * For certain periods presented, the investment advisor did not impose all or a portion of its management and/or other fees, and in some periods may have paid a portion of the Series’ expenses. If these expenses had been incurred by the Series, the expense ratio (to average net assets) would have increased by the following amounts: | |
| | | | | | |
| | | N/A | | | | N/A | | | | N/A | | | | 0.00 | %5 | | | 0.00 | %5 | | | N/A | |
1Calculated based on average shares outstanding during the periods.
2Less than $0.01 per share.
3Represents aggregate total return for the periods indicated, and assumes reinvestment of all distributions. Total return would have been lower had certain expenses not been waived or reimbursed during certain periods. Periods less than one year are not annualized.
4Annualized.
5Less than 0.01%.
The accompanying notes are an integral part of the financial statements.
15
New York Tax Exempt Series
Notes to Financial Statements
(unaudited)
New York Tax Exempt Series (the “Series”) is a no-load diversified series of Manning & Napier Fund, Inc. (the “Fund”). The Fund is organized in Maryland and is registered under the Investment Company Act of 1940, as amended, as an open-end management investment company.
The Series’ investment objective is to provide as high a level of current income exempt from federal income tax and New York State personal income tax as the Advisor believes is consistent with the preservation of capital.
The Fund’s advisor is Manning & Napier Advisors, LLC (the “Advisor”). Shares of the Series are offered to investors, clients and employees of the Advisor and its affiliates. The total authorized capital stock of the Fund consists of 15 billion shares of common stock each having a par value of $0.01. As of June 30, 2013, 10.3 billion shares have been designated in total among 42 series, of which 100 million have been designated as New York Tax Exempt Series Class A common stock.
| 2. | Significant Accounting Policies |
Security Valuation
Municipal securities will normally be valued on the basis of market valuations provided by an independent pricing service (the “Service”). The Service utilizes the latest price quotations and a matrix system (which considers such factors as security prices of similar securities, yields, maturities and ratings). The Service has been approved by the Fund’s Board of Directors (the “Board”).
Short-term investments that mature in sixty days or less are valued at amortized cost, which approximates fair value. Investments in open-end investment companies are valued at their net asset value per share on valuation date.
Volume and level of activity in established markets for an asset or liability are evaluated to determine whether recent transactions and quoted prices are determinative of fair value. Where there have been significant decreases in volume and level of activity, further analysis and adjustment may be necessary to estimate fair value. The Series measures fair value in these instances by the use of inputs and valuation techniques which may be based upon current market prices of securities that are comparable in coupon, rating, maturity and industry and/or expectation of future cash flows. As a result of trading in relatively thin markets and/or markets that experience significant volatility, the prices used by the Series to value these securities may differ from the value that would be realized if these securities were sold, and the differences could be material.
Securities for which representative valuations or prices are not available from the Series’ pricing service may be valued at fair value as determined in good faith by the Advisor under procedures approved by and under the general supervision and responsibility of the Board. Due to the inherent uncertainty of valuations of such securities, the fair value may differ significantly from the values that would have been used had a ready market for such securities existed. If trading or events occurring after the close of the principal market in which securities are traded are expected to materially affect the value of those securities, then they may be valued at their fair value, taking this trading or these events into account.
Various inputs are used in determining the value of the Series’ assets or liabilities carried at fair value. These inputs are summarized in three broad levels. Level 1 includes quoted prices in active markets for identical assets and liabilities. Level 2 includes other significant observable inputs (including quoted prices for similar securities, interest rates, prepayment speeds, credit risk, etc.). Level 3 includes significant unobservable inputs (including the Series’ own assumptions in determining the fair value of investments). A financial instrument’s level within the fair value hierarchy is based on the lowest level of any input both individually and in aggregate that is significant to the fair value measurement. The inputs or methodology used for valuing securities are not necessarily an indication of the risk associated with investing in those securities.
16
New York Tax Exempt Series
Notes to Financial Statements (continued)
(unaudited)
| 2. | Significant Accounting Policies (continued) |
Security Valuation (continued)
The following is a summary of the valuation levels used for major security types as of June 30, 2013 in valuing the Series’ assets or liabilities carried at fair value:
| | | | | | | | | | | | | | | | |
| DESCRIPTION | | TOTAL | | | LEVEL 1 | | | LEVEL 2 | | | LEVEL 3 | |
Assets: | | | | | | | | | | | | | | | | |
Debt securities: | | | | | | | | | | | | | | | | |
States and political subdivisions (municipals) | | $ | 145,294,641 | | | $ | — | | | $ | 145,294,641 | | | $ | — | |
Mutual fund | | | 17,131,322 | | | | 17,131,322 | | | | — | | | | — | |
| | | | | | | | | | | | | | | | |
Total assets | | $ | 162,425,963 | | | $ | 17,131,322 | | | $ | 145,294,641 | | | $ | — | |
| | | | | | | | | | | | | | | | |
There were no Level 3 securities held by the Series as of December 31, 2012 or June 30, 2013.
The Fund’s policy is to recognize transfers in and transfers out of the valuation levels as of the beginning of the reporting period. There were no transfers between Level 1 and Level 2 during the six months ended June 30, 2013.
Security Transactions, Investment Income and Expenses
Security transactions are accounted for on trade date. Dividend income is recorded on the ex-dividend date, except that if the ex-dividend date has passed, certain dividends from foreign securities are recorded as soon as the Series is informed of the ex-dividend date. Non-cash dividends, if any, are recorded at the fair value of the securities received. Interest income, including amortization of premium and accretion of discounts using the effective interest method, is earned from settlement date and accrued daily.
Expenses are recorded on an accrual basis. Most expenses of the Fund can be attributed to a specific series. Expenses which cannot be directly attributed are apportioned among the series in the Fund in such a manner as deemed equitable by the Fund’s Board, taking into consideration, among other things, the nature and type of expense.
The Series uses the identified cost method for determining realized gain or loss on investments for both financial statement and federal income tax reporting purposes.
Federal Taxes
The Series’ policy is to comply with the provisions of the Internal Revenue Code applicable to regulated investment companies. The Series is not subject to federal income tax or excise tax to the extent that the Series distributes to shareholders each year its taxable income, including any net realized gains on investments, in accordance with requirements of the Internal Revenue Code. Accordingly, no provision for federal income tax or excise tax has been made in the financial statements.
Management evaluates its tax positions to determine if the tax positions taken meet the minimum recognition threshold in connection with accounting for uncertainties in income tax positions taken or expected to be taken for the purposes of measuring and recognizing tax liabilities in the financial statements. Recognition of tax benefits of an uncertain tax position is required only when the position is “more likely than not” to be sustained assuming examination by taxing authorities. At June 30, 2013, the Series has recorded no liability for net unrecognized tax benefits relating to uncertain income tax positions taken or expected to be taken in future tax returns.
The Series files income tax returns in the U.S. federal jurisdiction and various states, as required. No income tax returns are currently under investigation. The statute of limitations on the Series’ tax returns remains open for the years ended December 31, 2009 through December 31, 2012. The Series is not aware of any tax positions for which it is reasonably possible that the total amounts of unrecognized tax benefits will significantly change in the next twelve months.
Distributions of Income and Gains
Distributions to shareholders of net investment income are made quarterly. Distributions of net realized gains are made annually. An additional distribution may be necessary to avoid taxation of the Series. Distributions are recorded on the ex-dividend date.
17
New York Tax Exempt Series
Notes to Financial Statements (continued)
(unaudited)
| 2. | Significant Accounting Policies (continued) |
Indemnifications
The Fund’s organizational documents provide former and current directors and officers with a limited indemnification against liabilities arising in connection with the performance of their duties to the Fund. In the normal course of business, the Fund may also enter into contracts that provide general indemnifications. The Fund’s maximum exposure under these arrangements is unknown as this would be dependent on future claims that may be made against the Fund. The risk of material loss from such claims is considered remote.
Other
The preparation of financial statements in conformity with accounting principles generally accepted in the United States of America requires management to make estimates and assumptions that affect the reported amounts of assets and liabilities and the disclosure of contingent assets and liabilities at the date of the financial statements and the reported amounts of income and expenses during the reporting period. Actual results could differ from those estimates.
| 3. | Transactions with Affiliates |
The Fund has an Investment Advisory Agreement (the “Agreement”) with the Advisor, for which the Series pays a fee, computed daily and payable monthly, at an annual rate of 0.50% of the Series’ average daily net assets.
Under the Agreement, personnel of the Advisor provide the Series with advice and assistance in the choice of investments and the execution of securities transactions, and otherwise maintain the Series’ organization. The Advisor also provides the Fund with necessary office space and fund administration and support services. The salaries of all officers of the Fund (except a percentage of the Fund’s Chief Compliance Officer’s salary, which is paid by the Fund), and of all Directors who are “affiliated persons” of the Fund, or of the Advisor, and all personnel of the Fund, or of the Advisor, performing services relating to research, statistical and investment activities, are paid by the Advisor. Each “non-affiliated” Director receives an annual stipend, which is allocated among all the active series of the Fund. In addition, these Directors also receive a fee per Board meeting attended plus a fee for each committee meeting attended.
The Advisor has contractually agreed, until at least April 30, 2014, to waive its management fee and, if necessary, pay other operating expenses of the Series in order to maintain total direct annual fund operating expenses for the Series at no more than 0.85% of average daily net assets each year. The Advisor did not waive any fees for the six months ended June 30, 2013. The Advisor is not eligible to recoup any expenses that have been waived or reimbursed in prior years.
Manning & Napier Investor Services, Inc., a registered broker-dealer affiliate of the Advisor, acts as distributor for the Fund’s shares. The services of Manning & Napier Investor Services, Inc. are provided at no additional cost to the Series.
The Advisor has agreements with BNY Mellon Investment Servicing (U.S.) Inc. (“BNY”) under which BNY serves as sub-accountant services agent and sub-transfer agent. The Fund pays the Advisor an annual fee related to fund accounting and administration of 0.0175% on the first $3 billion of average daily net assets (excluding Target Series and Strategic Income Series); 0.015% on the next $3 billion of average daily net assets (excluding Target Series and Strategic Income Series); and 0.01% of the average daily net assets in excess of $6 billion (excluding Target Series and Strategic Income Series); plus a base fee of $25,500 per series. Transfer Agent fees are charged to the Fund on a per account basis. Additionally, certain transaction and cusip-based fees and out-of-pocket expenses, including charges for reporting relating to the Fund’s compliance program, are charged. Effective October 1, 2012, the aforementioned agreements were modified to reduce the annual fee related to fund accounting and administration, as well as transfer agent fees, by 10%, excluding out-of-pocket expenses.
Expenses not directly attributable to a series are allocated based on each series’ relative net assets or number of accounts, depending on the expense.
18
New York Tax Exempt Series
Notes to Financial Statements (continued)
(unaudited)
| 4. | Purchases and Sales Securities |
For the six months ended June 30, 2013, purchases and sales of securities, other than U.S. Government securities and short-term securities, were $13,471,235 and $19,392,310 respectively. There were no purchases or sales of U.S. Government securities.
| 5. | Capital Stock Transactions |
Transactions in shares of New York Tax Exempt Series were:
| | | | | | | | | | | | | | | | |
| | | FOR THE SIX MONTHS ENDED 6/30/13 | | | FOR THE YEAR ENDED 12/31/12 | |
| | SHARES | | | AMOUNT | | | SHARES | | | AMOUNT | |
Sold | | | 1,364,424 | | | $ | 14,653,290 | | | | 2,071,760 | | | $ | 22,298,750 | |
Reinvested | | | 96,478 | | | | 1,026,026 | | | | 263,446 | | | | 2,829,327 | |
Repurchased | | | (873,644 | ) | | | (9,311,067 | ) | | | (2,101,837 | ) | | | (22,690,919 | ) |
| | | | | | | | | | | | | | | | |
Total | | | 587,258 | | | $ | 6,368,249 | | | | 233,369 | | | $ | 2,437,158 | |
| | | | | | | | | | | | | | | | |
Substantially all of the Series’ shares represent investments by fiduciary accounts over which the Advisor has sole investment discretion.
The Series may trade in instruments including written and purchased options, forward foreign currency exchange contracts and futures contracts and other derivatives in the normal course of investing activities to assist in managing exposure to various market risks. The Series may be subject to various elements of risk, which may involve, to a varying degree, elements of risk in excess of the amounts recognized for financial statement purposes. These risks include: the risk that changes in the value of a derivative may not correlate perfectly with the underlying asset, rate or index; counterparty credit risk related to over the counter derivative counterparties’ failure to perform under contract terms; liquidity risk related to the lack of a liquid market for these contracts allowing the fund to close out its position(s); and documentation risk relating to disagreement over contract terms. No such investments were held by the Series as of June 30, 2013.
| 7. | Concentration of Credit |
The Series primarily invests in debt obligations issued by the State of New York and its political subdivisions, agencies and public authorities to obtain funds for various public purposes. The Series is more susceptible to factors adversely affecting issues of New York municipal securities than is a municipal bond fund that is not concentrated in these issues to the same extent.
| 8. | Federal Income Tax Information |
The amount and characterization of certain income and capital gains to be distributed are determined in accordance with federal income tax regulations, which may differ from accounting principles generally accepted in the United States of America. The Series may periodically make reclassifications among its capital accounts to reflect income and gains available for distribution (or available capital loss carryovers) under income tax regulations, without impacting the Series’ net asset value. Any such reclassifications are not reflected in the financial highlights.
The final determination of the tax character of current year distributions will be made at the conclusion of the fiscal year. The tax character of distributions paid for the year ended December 31, 2012 was as follows:
| | | | |
Tax exempt income | | $ | 3,018,903 | |
Long-term capital gains | | | 1,500 | |
19
New York Tax Exempt Series
Notes to Financial Statements (continued)
(unaudited)
| 8. | Federal Income Tax Information (continued) |
At June 30, 2013, the identified cost for federal income tax purposes, the resulting gross unrealized appreciation and depreciation, and the net unrealized appreciation were as follows:
| | | | |
Cost for federal income tax purposes | | $ | 160,895,761 | |
Unrealized appreciation | | | 2,471,614 | |
Unrealized depreciation | | | (941,412 | ) |
| | | | |
Net unrealized appreciation | | $ | 1,530,202 | |
| | | | |
20
{This page intentionally left blank}
21
New York Tax Exempt Series
Literature Requests
(unaudited)
Proxy Voting Policies and Procedures
A description of the policies and procedures that the Fund uses to determine how to vote proxies relating to portfolio securities is available, without charge, upon request:
| | | | |
| By phone | | 1-800-466-3863 | | |
| On the Securities and Exchange | | | | |
| Commission’s (SEC) web site | | http://www.sec.gov | | |
Proxy Voting Record
Information regarding how the Fund voted proxies relating to portfolio securities during the most recent 12-month period ended June 30th is available, without charge, upon request:
| | | | |
| By phone | | 1-800-466-3863 | | |
| On the SEC’s web site | | http://www.sec.gov | | |
Quarterly Portfolio Holdings
The Series’ complete schedule of portfolio holdings for the 1st and 3rd quarters of each fiscal year are provided on Form N-Q, and are available, without charge, upon request:
| | | | |
| By phone | | 1-800-466-3863 | | |
| On the SEC’s web site | | http://www.sec.gov | | |
The Series’ Form N-Q may be reviewed and copied at the SEC’s Public Reference Room in Washington, D.C. Information on the operation of the Public Reference Room may be obtained by calling 1-800-SEC-0330.
Prospectus and Statement of Additional Information (SAI)
The prospectus and SAI provide additional information about each Series, including charges, expenses and risks. These documents are available, without charge, upon request:
| | | | |
| By phone | | 1-800-466-3863 | | |
| On the SEC’s web site | | http://www.sec.gov | | |
| On our web site | | http://www.manning-napier.com | | |
Additional information available at www.manning-napier.com
1. Fund Holdings - Month-End
2. Fund Holdings - Quarter-End
3. Shareholder Report - Annual
4. Shareholder Report - Semi-Annual
The Fund also offers electronic notification or “e-delivery” when certain documents are available on-line to be downloaded or reviewed. Direct shareholders can elect to receive electronic notification when shareholder reports, prospectus updates, and/or statements are available. If you do not currently have on-line access to your account, you can establish access by going to www.manning-napier.com, click on “Login” in the top corner of the page, and follow the prompts to self-enroll. Once enrolled, you can set your electronic notification preferences by clicking on the Account Options tab located within the green toolbar and then select E-Delivery Option. Should you have any questions on either how to establish on-line access or how to update your account settings, please contact Investor Services at 1-800-466-3863.
MNNYT-6/13-SAR
| | | | | | |
| | | | CORE BOND SERIES | | |
www.manning-napier.com | | | | |
Core Bond Series
Shareholder Expense Example
(unaudited)
As a shareholder of the Series, you may incur two types of costs: (1) transaction costs and (2) ongoing costs, including management fees and other Series expenses. This example is intended to help you understand your ongoing costs (in dollars) of investing in the Series and to compare these costs with the ongoing costs of investing in other mutual funds.
The example is based on an investment of $1,000 invested at the beginning of the period and held for the entire period (January 1, 2013 to June 30, 2013).
Actual Expenses
The first line of the table below provides information about actual account values and actual expenses. You may use the information in this line, together with the amount you invested, to estimate the expenses that you paid over the period. Simply divide your account value by $1,000 (for example, an $8,600 account value divided by $1,000 = 8.6), then multiply the result by the number in the first line under the heading entitled “Expenses Paid During Period” to estimate the expenses you paid on your account during this period.
Hypothetical Example for Comparison Purposes
The second line of the table below provides information about hypothetical account values and hypothetical expenses based on the Series’ actual expense ratio and an assumed rate of return of 5% per year before expenses, which is not the Series’ actual return. The hypothetical account values and expenses may not be used to estimate the actual ending account balance or expenses you paid during the period. You may use this information to compare the ongoing costs of investing in the Series and other funds. To do so, compare this 5% hypothetical example with the 5% hypothetical examples that appear in the shareholder reports of the other funds.
Please note that the expenses shown in the table are meant to highlight your ongoing costs only and do not reflect any transaction costs. Therefore, the second line of the table is useful in comparing ongoing costs only, and will not help you determine the relative total costs of owning different funds. In addition, if these transaction costs were included, your costs would have been higher.
| | | | | | |
| | | BEGINNING
ACCOUNT VALUE
1/1/13 | | ENDING
ACCOUNT VALUE
6/30/13 | | EXPENSES PAID
DURING PERIOD*
1/1/13-6/30/13 |
Actual | | $1,000.00 | | $ 974.60 | | $3.43 |
Hypothetical (5% return before expenses) | | $1,000.00 | | $1,021.32 | | $3.51 |
*Expenses are equal to the Series’ annualized expense ratio (for the six-month period) of 0.70%, multiplied by the average account value over the period, multiplied by 181/365 (to reflect the one-half year period). Expenses are based on the most recent fiscal half year.
1
Core Bond Series
Portfolio Composition as of June 30, 2013
(unaudited)
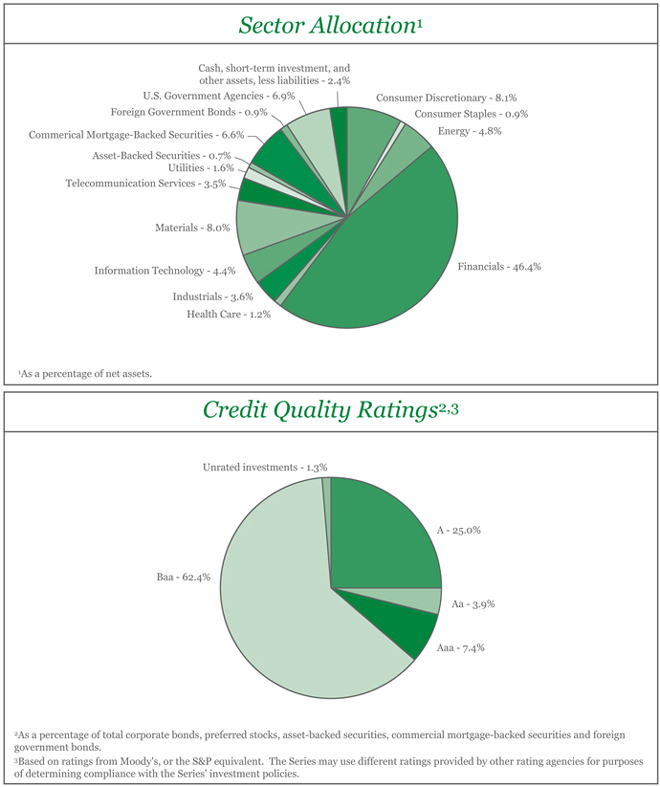
2
Core Bond Series
Investment Portfolio - June 30, 2013
(unaudited)
| | | | | | | | | | | | | | |
| | | CREDIT
RATING1
(UNAUDITED) | | | PRINCIPAL
AMOUNT | | | VALUE (NOTE 2) | | | |
| | | | |
CORPORATE BONDS - 80.1% | | | | | | | | | | | | | | |
| | | | |
Non-Convertible Corporate Bonds - 80.1% | | | | | | | | | | | | | | |
Consumer Discretionary - 8.1% | | | | | | | | | | | | | | |
Hotels, Restaurants & Leisure - 1.3% | | | | | | | | | | | | | | |
International Game Technology, 7.50%, 6/15/2019 | | | Baa2 | | | $ | 2,000,000 | | | $ | 2,315,442 | | | |
| | | | | | | | | | | | | | |
Household Durables - 2.5% | | | | | | | | | | | | | | |
Newell Rubbermaid, Inc., 4.70%, 8/15/2020 | | | Baa3 | | | | 1,345,000 | | | | 1,436,393 | | | |
NVR, Inc., 3.95%, 9/15/2022 | | | Baa2 | | | | 1,775,000 | | | | 1,725,717 | | | |
Tupperware Brands Corp., 4.75%, 6/1/2021 | | | Baa3 | | | | 1,100,000 | | | | 1,115,653 | | | |
| | | | | | | | | | | | | | |
| | | | |
| | | | | | | | | | | 4,277,763 | | | |
| | | | | | | | | | | | | | |
Media - 2.8% | | | | | | | | | | | | | | |
DIRECTV Holdings LLC - DIRECTV Financing Co., Inc., 5.20%, 3/15/2020 | | | Baa2 | | | | 1,280,000 | | | | 1,382,045 | | | |
Discovery Communications LLC, 5.05%, 6/1/2020 | | | Baa2 | | | | 1,275,000 | | | | 1,414,484 | | | |
Thomson Reuters Corp. (Canada), 0.875%, 5/23/2016 | | | Baa1 | | | | 1,000,000 | | | | 990,113 | | | |
Time Warner, Inc., 4.75%, 3/29/2021 | | | Baa2 | | | | 1,110,000 | | | | 1,194,079 | | | |
| | | | | | | | | | | | | | |
| | | | |
| | | | | | | | | | | 4,980,721 | | | |
| | | | | | | | | | | | | | |
Multiline Retail - 1.2% | | | | | | | | | | | | | | |
Dollar General Corp., 1.875%, 4/15/2018 | | | Baa3 | | | | 910,000 | | | | 877,992 | | | |
Macy’s Retail Holdings, Inc., 2.875%, 2/15/2023 | | | Baa3 | | | | 945,000 | | | | 871,634 | | | |
Target Corp., 3.875%, 7/15/2020 | | | A2 | | | | 335,000 | | | | 358,104 | | | |
| | | | | | | | | | | | | | |
| | | | |
| | | | | | | | | | | 2,107,730 | | | |
| | | | | | | | | | | | | | |
Textiles, Apparel & Luxury Goods - 0.3% | | | | | | | | | | | | | | |
VF Corp., 5.95%, 11/1/2017 | | | A3 | | | | 485,000 | | | | 562,660 | | | |
| | | | | | | | | | | | | | |
| | | | |
Total Consumer Discretionary | | | | | | | | | | | 14,244,316 | | | |
| | | | | | | | | | | | | | |
| | | | |
Consumer Staples - 0.9% | | | | | | | | | | | | | | |
Beverages - 0.5% | | | | | | | | | | | | | | |
PepsiCo, Inc., 7.90%, 11/1/2018 | | | A1 | | | | 775,000 | | | | 992,638 | | | |
| | | | | | | | | | | | | | |
Food Products - 0.4% | | | | | | | | | | | | | | |
Tyson Foods, Inc., 4.50%, 6/15/2022 | | | Baa3 | | | | 650,000 | | | | 664,186 | | | |
| | | | | | | | | | | | | | |
| | | | |
Total Consumer Staples | | | | | | | | | | | 1,656,824 | | | |
| | | | | | | | | | | | | | |
| | | | |
Energy - 4.8% | | | | | | | | | | | | | | |
Energy Equipment & Services - 2.5% | | | | | | | | | | | | | | |
Baker Hughes, Inc., 7.50%, 11/15/2018 | | | A2 | | | | 885,000 | | | | 1,114,392 | | | |
Schlumberger Oilfield plc2, 4.20%, 1/15/2021 | | | A1 | | | | 1,465,000 | | | | 1,564,569 | | | |
Weatherford International Ltd., 9.625%, 3/1/2019 | | | Baa2 | | | | 1,415,000 | | | | 1,788,873 | | | |
| | | | | | | | | | | | | | |
| | | | |
| | | | | | | | | | | 4,467,834 | | | |
| | | | | | | | | | | | | | |
Oil, Gas & Consumable Fuels - 2.3% | | | | | | | | | | | | | | |
Buckeye Partners LP, 4.15%, 7/1/2023 | | | Baa3 | | | | 930,000 | | | | 904,839 | | | |
EOG Resources, Inc., 2.625%, 3/15/2023 | | | A3 | | | | 775,000 | | | | 725,200 | | | |
Lukoil International Finance B.V. (Russia)2, 3.416%, 4/24/2018 | | | Baa2 | | | | 500,000 | | | | 486,250 | | | |
The accompanying notes are an integral part of the financial statements.
3
Core Bond Series
Investment Portfolio - June 30, 2013
(unaudited)
| | | | | | | | | | | | | | |
| | | CREDIT
RATING1
(UNAUDITED) | | | PRINCIPAL
AMOUNT | | | VALUE (NOTE 2) | | | |
| | | | |
CORPORATE BONDS (continued) | | | | | | | | | | | | | | |
| | | | |
Non-Convertible Corporate Bonds (continued) | | | | | | | | | | | | | | |
Energy (continued) | | | | | | | | | | | | | | |
Oil, Gas & Consumable Fuels (continued) | | | | | | | | | | | | | | |
Shell International Finance B.V. (Netherlands), 4.30%, 9/22/2019 | | | Aa1 | | | $ | 1,645,000 | | | $ | 1,825,457 | | | |
| | | | | | | | | | | | | | |
| | | | |
| | | | | | | | | | | 3,941,746 | | | |
| | | | | | | | | | | | | | |
| | | | |
Total Energy | | | | | | | | | | | 8,409,580 | | | |
| | | | | | | | | | | | | | |
Financials - 44.0% | | | | | | | | | | | | | | |
Capital Markets - 12.2% | | | | | | | | | | | | | | |
The Charles Schwab Corp., 4.45%, 7/22/2020 | | | A2 | | | | 1,320,000 | | | | 1,426,166 | | | |
The Goldman Sachs Group, Inc., 2.375%, 1/22/2018 | | | A3 | | | | 905,000 | | | | 888,558 | | | |
The Goldman Sachs Group, Inc., 6.15%, 4/1/2018 | | | A3 | | | | 1,555,000 | | | | 1,752,236 | | | |
The Goldman Sachs Group, Inc., 7.50%, 2/15/2019 | | | A3 | | | | 1,100,000 | | | | 1,306,331 | | | |
The Goldman Sachs Group, Inc., 5.375%, 3/15/2020 | | | A3 | | | | 935,000 | | | | 1,014,525 | | | |
The Goldman Sachs Group, Inc., 5.25%, 7/27/2021 | | | A3 | | | | 1,150,000 | | | | 1,230,384 | | | |
Jefferies Group LLC, 5.125%, 4/13/2018 | | | Baa3 | | | | 1,000,000 | | | | 1,045,002 | | | |
Jefferies Group LLC, 8.50%, 7/15/2019 | | | Baa3 | | | | 3,245,000 | | | | 3,910,225 | | | |
Merrill Lynch & Co., Inc., 6.875%, 4/25/2018 | | | Baa2 | | | | 1,200,000 | | | | 1,381,107 | | | |
Merrill Lynch & Co., Inc., 6.875%, 11/15/2018 | | | Baa2 | | | | 1,000,000 | | | | 1,164,696 | | | |
Morgan Stanley, 5.55%, 4/27/2017 | | | Baa1 | | | | 1,317,000 | | | | 1,424,708 | | | |
Morgan Stanley, 2.125%, 4/25/2018 | | | Baa1 | | | | 1,400,000 | | | | 1,339,843 | | | |
Morgan Stanley, 7.30%, 5/13/2019 | | | Baa1 | | | | 3,120,000 | | | | 3,624,236 | | | |
| | | | | | | | | | | | | | |
| | | | |
| | | | | | | | | | | 21,508,017 | | | |
| | | | | | | | | | | | | | |
Commercial Banks - 7.8% | | | | | | | | | | | | | | |
BBVA Bancomer S.A. (Mexico)2, 6.75%, 9/30/2022 | | | Baa2 | | | | 1,185,000 | | | | 1,279,800 | | | |
BBVA US Senior S.A.U. (Spain), 4.664%, 10/9/2015 | | | Baa3 | | | | 1,320,000 | | | | 1,359,762 | | | |
HSBC Bank plc (United Kingdom)2, 1.50%, 5/15/2018 | | | Aa3 | | | | 1,150,000 | | | | 1,108,240 | | | |
Intesa Sanpaolo S.p.A. (Italy), 3.125%, 1/15/2016 | | | Baa2 | | | | 930,000 | | | | 914,430 | | | |
Intesa Sanpaolo S.p.A. (Italy)2, 6.50%, 2/24/2021 | | | Baa2 | | | | 945,000 | | | | 951,778 | | | |
Lloyds TSB Bank plc (United Kingdom)2, 6.50%, 9/14/2020 | | | Baa3 | | | | 1,210,000 | | | | 1,290,002 | | | |
Manufacturers & Traders Trust Co., 6.625%, 12/4/2017 | | | A3 | | | | 1,480,000 | | | | 1,741,177 | | | |
National City Corp., 6.875%, 5/15/2019 | | | Baa1 | | | | 1,445,000 | | | | 1,728,405 | | | |
PNC Bank National Association, 5.25%, 1/15/2017 | | | A3 | | | | 880,000 | | | | 972,250 | | | |
Royal Bank of Canada (Canada), 1.20%, 9/19/2017 | | | Aaa | | | | 445,000 | | | | 434,169 | | | |
Santander Holdings USA, Inc., 4.625%, 4/19/2016 | | | Baa2 | | | | 750,000 | | | | 791,188 | | | |
Wells Fargo & Co., Series M, 3.45%, 2/13/2023 | | | A3 | | | | 910,000 | | | | 869,082 | | | |
Westpac Banking Corp. (Australia)2, 1.25%, 12/15/2017 | | | Aaa | | | | 430,000 | | | | 418,648 | | | |
| | | | | | | | | | | | | | |
| | | | |
| | | | | | | | | | | 13,858,931 | | | |
| | | | | | | | | | | | | | |
Consumer Finance - 2.3% | | | | | | | | | | | | | | |
Capital One Bank USA National Association, 3.375%, 2/15/2023 | | | Baa1 | | | | 1,365,000 | | | | 1,290,272 | | | |
Caterpillar Financial Services Corp., 7.05%, 10/1/2018 | | | A2 | | | | 1,095,000 | | | | 1,356,483 | | | |
John Deere Capital Corp., 5.75%, 9/10/2018 | | | A2 | | | | 1,245,000 | | | | 1,452,971 | | | |
| | | | | | | | | | | | | | |
| | | | |
| | | | | | | | | | | 4,099,726 | | | |
| | | | | | | | | | | | | | |
The accompanying notes are an integral part of the financial statements.
4
Core Bond Series
Investment Portfolio - June 30, 2013
(unaudited)
| | | | | | | | | | | | | | |
| | | CREDIT
RATING1
(UNAUDITED) | | | PRINCIPAL
AMOUNT | | | VALUE (NOTE 2) | | | |
| | | | |
CORPORATE BONDS (continued) | | | | | | | | | | | | | | |
| | | | |
Non-Convertible Corporate Bonds (continued) | | | | | | | | | | | | | | |
Financials (continued) | | | | | | | | | | | | | | |
Diversified Financial Services - 7.5% | | | | | | | | | | | | | | |
Bank of America Corp., 3.30%, 1/11/2023 | | | Baa2 | | | $ | 435,000 | | | $ | 411,139 | | | |
The Bear Stearns Companies LLC, 7.25%, 2/1/2018 | | | A2 | | | | 2,935,000 | | | | 3,494,825 | | | |
Citigroup, Inc., 8.50%, 5/22/2019 | | | Baa2 | | | | 3,051,000 | | | | 3,844,342 | | | |
CME Group, Inc., 3.00%, 9/15/2022 | | | Aa3 | | | | 1,720,000 | | | | 1,619,294 | | | |
General Electric Capital Corp., 5.625%, 5/1/2018 | | | A1 | | | | 1,440,000 | | | | 1,651,686 | | | |
General Electric Capital Corp., 5.50%, 1/8/2020 | | | A1 | | | | 320,000 | | | | 360,795 | | | |
ING Bank N.V. (Netherlands)2, 5.125%, 5/1/2015 | | | Baa2 | | | | 900,000 | | | | 940,887 | | | |
ING US, Inc. (Netherlands)2, 2.90%, 2/15/2018 | | | Baa3 | | | | 950,000 | | | | 954,780 | | | |
| | | | | | | | | | | | | | |
| | | | |
| | | | | | | | | | | 13,277,748 | | | |
| | | | | | | | | | | | | | |
Insurance - 5.7% | | | | | | | | | | | | | | |
American International Group, Inc., 4.875%, 6/1/2022 | | | Baa1 | | | | 2,450,000 | | | | 2,611,514 | | | |
Fidelity National Financial, Inc., 6.60%, 5/15/2017 | | | Baa3 | | | | 1,575,000 | | | | 1,745,691 | | | |
First American Financial Corp., 4.30%, 2/1/2023 | | | Baa3 | | | | 915,000 | | | | 880,289 | | | |
Genworth Holdings, Inc., 7.625%, 9/24/2021 | | | Baa3 | | | | 2,285,000 | | | | 2,655,353 | | | |
Hartford Financial Services Group, Inc., 5.125%, 4/15/2022 | | | Baa3 | | | | 1,980,000 | | | | 2,154,470 | | | |
| | | | | | | | | | | | | | |
| | | | |
| | | | | | | | | | | 10,047,317 | | | |
| | | | | | | | | | | | | | |
Real Estate Investment Trusts (REITS) - 8.5% | | | | | | | | | | | | | | |
American Campus Communities Operating Partnership LP, 3.75%, 4/15/2023 | | | Baa3 | | | | 470,000 | | | | 451,019 | | | |
American Tower Trust I2, 1.551%, 3/15/2018 | | | Aaa | | | | 465,000 | | | | 456,945 | | | |
BioMed Realty LP, 3.85%, 4/15/2016 | | | Baa3 | | | | 740,000 | | | | 775,957 | | | |
Boston Properties LP, 5.875%, 10/15/2019 | | | Baa2 | | | | 935,000 | | | | 1,078,438 | | | |
Boston Properties LP, 5.625%, 11/15/2020 | | | Baa2 | | | | 300,000 | | | | 340,480 | | | |
Camden Property Trust, 5.70%, 5/15/2017 | | | Baa1 | | | | 780,000 | | | | 867,385 | | | |
Corporate Office Properties LP2, 3.60%, 5/15/2023 | | | Baa3 | | | | 920,000 | | | | 849,140 | | | |
Digital Realty Trust LP, 5.875%, 2/1/2020 | | | Baa2 | | | | 1,305,000 | | | | 1,423,949 | | | |
Digital Realty Trust LP, 5.25%, 3/15/2021 | | | Baa2 | | | | 45,000 | | | | 46,940 | | | |
HCP, Inc., 6.70%, 1/30/2018 | | | Baa1 | | | | 1,315,000 | | | | 1,539,134 | | | |
Health Care REIT, Inc., 6.20%, 6/1/2016 | | | Baa2 | | | | 375,000 | | | | 421,081 | | | |
Health Care REIT, Inc., 4.95%, 1/15/2021 | | | Baa2 | | | | 990,000 | | | | 1,053,406 | | | |
Host Hotels & Resorts LP, Series D, 3.75%, 10/15/2023 | | | Baa3 | | | | 930,000 | | | | 852,947 | | | |
Mack-Cali Realty LP, 7.75%, 8/15/2019 | | | Baa2 | | | | 735,000 | | | | 900,509 | | | |
National Retail Properties, Inc., 3.30%, 4/15/2023 | | | Baa2 | | | | 945,000 | | | | 854,035 | | | |
Simon Property Group LP, 10.35%, 4/1/2019 | | | A3 | | | | 990,000 | | | | 1,371,083 | | | |
UDR, Inc., 4.625%, 1/10/2022 | | | Baa2 | | | | 1,600,000 | | | | 1,655,261 | | | |
| | | | | | | | | | | | | | |
| | | | |
| | | | | | | | | | | 14,937,709 | | | |
| | | | | | | | | | | | | | |
| | | | |
Total Financials | | | | | | | | | | | 77,729,448 | | | |
| | | | | | | | | | | | | | |
The accompanying notes are an integral part of the financial statements.
5
Core Bond Series
Investment Portfolio - June 30, 2013
(unaudited)
| | | | | | | | | | | | | | |
| | | CREDIT
RATING1
(UNAUDITED) | | | PRINCIPAL
AMOUNT | | | VALUE
(NOTE 2) | | | |
| | | | |
CORPORATE BONDS (continued) | | | | | | | | | | | | | | |
| | | | |
Non-Convertible Corporate Bonds (continued) | | | | | | | | | | | | | | |
Health Care - 1.2% | | | | | | | | | | | | | | |
Biotechnology - 0.2% | | | | | | | | | | | | | | |
Amgen, Inc., 3.45%, 10/1/2020 | | | Baa1 | | | $ | 370,000 | | | $ | 377,652 | | | |
| | | | | | | | | | | | | | |
Health Care Providers & Services - 1.0% | | | | | | | | | | | | | | |
Express Scripts Holding Co., 4.75%, 11/15/2021 | | | Baa3 | | | | 815,000 | | | | 871,929 | | | |
UnitedHealth Group, Inc., 2.75%, 2/15/2023 | | | A3 | | | | 1,000,000 | | | | 930,763 | | | |
| | | | | | | | | | | | | | |
| | | | |
| | | | | | | | | | | 1,802,692 | | | |
| | | | | | | | | | | | | | |
| | | | |
Total Health Care | | | | | | | | | | | 2,180,344 | | | |
| | | | | | | | | | | | | | |
| | | | |
Industrials - 3.6% | | | | | | | | | | | | | | |
Aerospace & Defense - 0.8% | | | | | | | | | | | | | | |
Textron, Inc., 7.25%, 10/1/2019 | | | Baa3 | | | | 1,245,000 | | | | 1,478,428 | | | |
| | | | | | | | | | | | | | |
Air Freight & Logistics - 0.6% | | | | | | | | | | | | | | |
FedEx Corp., 8.00%, 1/15/2019 | | | Baa1 | | | | 790,000 | | | | 998,626 | | | |
| | | | | | | | | | | | | | |
Industrial Conglomerates - 0.8% | | | | | | | | | | | | | | |
General Electric Co., 5.25%, 12/6/2017 | | | Aa3 | | | | 370,000 | | | | 417,784 | | | |
Tyco Electronics Group S.A. (Switzerland), 4.875%, 1/15/2021 | | | Baa2 | | | | 975,000 | | | | 1,039,261 | | | |
| | | | | | | | | | | | | | |
| | | | |
| | | | | | | | | | | 1,457,045 | | | |
| | | | | | | | | | | | | | |
Machinery - 0.4% | | | | | | | | | | | | | | |
Joy Global, Inc., 5.125%, 10/15/2021 | | | Baa2 | | | | 650,000 | | | | 690,336 | | | |
| | | | | | | | | | | | | | |
Road & Rail - 1.0% | | | | | | | | | | | | | | |
Union Pacific Corp., 5.65%, 5/1/2017 | | | Baa1 | | | | 705,000 | | | | 795,384 | | | |
Union Pacific Corp., 2.95%, 1/15/2023 | | | Baa1 | | | | 900,000 | | | | 866,665 | | | |
| | | | | | | | | | | | | | |
| | | | |
| | | | | | | | | | | 1,662,049 | | | |
| | | | | | | | | | | | | | |
| | | | |
Total Industrials | | | | | | | | | | | 6,286,484 | | | |
| | | | | | | | | | | | | | |
| | | | |
Information Technology - 4.4% | | | | | | | | | | | | | | |
Computers & Peripherals - 2.4% | | | | | | | | | | | | | | |
Apple, Inc., 2.40%, 5/3/2023 | | | Aa1 | | | | 465,000 | | | | 431,271 | | | |
EMC Corp., 2.65%, 6/1/2020 | | | A1 | | | | 2,040,000 | | | | 2,010,989 | | | |
Hewlett-Packard Co., 2.125%, 9/13/2015 | | | Baa1 | | | | 1,850,000 | | | | 1,872,359 | | | |
| | | | | | | | | | | | | | |
| | | | |
| | | | | | | | | | | 4,314,619 | | | |
| | | | | | | | | | | | | | |
Electronic Equipment, Instruments & Components - 0.4% | | | | | | | | | | | | | | |
Corning, Inc., 6.625%, 5/15/2019 | | | A3 | | | | 650,000 | | | | 781,180 | | | |
| | | | | | | | | | | | | | |
IT Services - 0.6% | | | | | | | | | | | | | | |
The Western Union Co., 5.253%, 4/1/2020 | | | Baa1 | | | | 945,000 | | | | 1,002,387 | | | |
| | | | | | | | | | | | | | |
Software - 1.0% | | | | | | | | | | | | | | |
Autodesk, Inc., 3.60%, 12/15/2022 | | | Baa2 | | | | 1,825,000 | | | | 1,741,899 | | | |
| | | | | | | | | | | | | | |
| | | | |
Total Information Technology | | | | | | | | | | | 7,840,085 | | | |
| | | | | | | | | | | | | | |
The accompanying notes are an integral part of the financial statements.
6
Core Bond Series
Investment Portfolio - June 30, 2013
(unaudited)
| | | | | | | | | | | | | | |
| | | CREDIT
RATING1
(UNAUDITED) | | | PRINCIPAL
AMOUNT | | | VALUE (NOTE 2) | | | |
| | | | |
CORPORATE BONDS (continued) | | | | | | | | | | | | | | |
| | | | |
Non-Convertible Corporate Bonds (continued) | | | | | | | | | | | | | | |
Materials - 8.0% | | | | | | | | | | | | | | |
Chemicals - 0.5% | | | | | | | | | | | | | | |
Eastman Chemical Co., 3.60%, 8/15/2022 | | | Baa2 | | | $ | 855,000 | | | $ | 824,099 | | | |
| | | | | | | | | | | | | | |
Metals & Mining - 6.2% | | | | | | | | | | | | | | |
Allegheny Technologies, Inc., 5.95%, 1/15/2021 | | | Baa3 | | | | 1,625,000 | | | | 1,726,303 | | | |
BHP Billiton Finance (USA) Ltd. (Australia), 6.50%, 4/1/2019 | | | A1 | | | | 2,445,000 | | | | 2,927,181 | | | |
Carpenter Technology Corp., 4.45%, 3/1/2023 | | | Baa3 | | | | 1,000,000 | | | | 974,775 | | | |
Cliffs Natural Resources, Inc., 5.90%, 3/15/2020 | | | Baa3 | | | | 850,000 | | | | 819,067 | | | |
Freeport-McMoRan Copper & Gold, Inc.2, 2.375%, 3/15/2018 | | | Baa3 | | | | 650,000 | | | | 618,199 | | | |
Freeport-McMoRan Copper & Gold, Inc., 3.55%, 3/1/2022 | | | Baa3 | | | | 840,000 | | | | 763,020 | | | |
Rio Tinto Finance USA Ltd. (United Kingdom), 3.75%, 9/20/2021 | | | A3 | | | | 1,250,000 | | | | 1,234,433 | | | |
Rio Tinto Finance USA plc (United Kingdom), 1.375%, 6/17/2016 | | | A3 | | | | 1,100,000 | | | | 1,093,377 | | | |
Teck Resources Ltd. (Canada), 3.00%, 3/1/2019 | | | Baa2 | | | | 845,000 | | | | 821,641 | | | |
| | | | | | | | | | | | | | |
| | | | |
| | | | | | | | | | | 10,977,996 | | | |
| | | | | | | | | | | | | | |
Paper & Forest Products - 1.3% | | | | | | | | | | | | | | |
International Paper Co., 7.50%, 8/15/2021 | | | Baa3 | | | | 1,885,000 | | | | 2,313,609 | | | |
| | | | | | | | | | | | | | |
| | | | |
Total Materials | | | | | | | | | | | 14,115,704 | | | |
| | | | | | | | | | | | | | |
| | | | |
Telecommunication Services - 3.5% | | | | | | | | | | | | | | |
Diversified Telecommunication Services - 1.3% | | | | | | | | | | | | | | |
Telefonica Emisiones S.A.U. (Spain), 3.192%, 4/27/2018 | | | Baa2 | | | | 1,875,000 | | | | 1,816,140 | | | |
Verizon Communications, Inc., 8.75%, 11/1/2018 | | | A3 | | | | 373,000 | | | | 486,146 | | | |
| | | | | | | | | | | | | | |
| | | | |
| | | | | | | | | | | 2,302,286 | | | |
| | | | | | | | | | | | | | |
Wireless Telecommunication Services - 2.2% | | | | | | | | | | | | | | |
America Movil SAB de C.V. (Mexico), 5.00%, 3/30/2020 | | | A2 | | | | 1,315,000 | | | | 1,411,376 | | | |
Crown Castle Towers LLC2, 6.113%, 1/15/2020 | | | A2 | | | | 745,000 | | | | 854,869 | | | |
Crown Castle Towers LLC2, 4.883%, 8/15/2020 | | | A2 | | | | 250,000 | | | | 268,833 | | | |
SBA Tower Trust2, 5.101%, 4/17/2017 | | | A2 | | | | 375,000 | | | | 410,136 | | | |
SBA Tower Trust2, 2.933%, 12/15/2017 | | | A2 | | | | 430,000 | | | | 433,941 | | | |
SBA Tower Trust2, 3.598%, 4/15/2018 | | | Baa3 | | | | 465,000 | | | | 460,110 | | | |
| | | | | | | | | | | | | | |
| | | | |
| | | | | | | | | | | 3,839,265 | | | |
| | | | | | | | | | | | | | |
| | | | |
Total Telecommunication Services | | | | | | | | | | | 6,141,551 | | | |
| | | | | | | | | | | | | | |
| | | | |
Utilities - 1.6% | | | | | | | | | | | | | | |
Electric Utilities - 0.5% | | | | | | | | | | | | | | |
System Energy Resources, Inc., 4.10%, 4/1/2023 | | | Baa1 | | | | 885,000 | | | | 879,457 | | | |
| | | | | | | | | | | | | | |
Gas Utilities - 0.5% | | | | | | | | | | | | | | |
National Fuel Gas Co., 3.75%, 3/1/2023 | | | Baa1 | | | | 1,000,000 | | | | 962,337 | | | |
| | | | | | | | | | | | | | |
Independent Power Producers & Energy Traders - 0.6% | | | | | | | | | | | | | | |
Exelon Generation Co. LLC, 6.20%, 10/1/2017 | | | Baa2 | | | | 350,000 | | | | 400,117 | | | |
The accompanying notes are an integral part of the financial statements.
7
Core Bond Series
Investment Portfolio - June 30, 2013
(unaudited)
| | | | | | | | | | | | | | |
| | | CREDIT
RATING1
(UNAUDITED) | | | PRINCIPAL
AMOUNT/
SHARES | | | VALUE (NOTE 2) | | | |
| | | | |
CORPORATE BONDS (continued) | | | | | | | | | | | | | | |
| | | | |
Non-Convertible Corporate Bonds (continued) | | | | | | | | | | | | | | |
Utilities (continued) | | | | | | | | | | | | | | |
Independent Power Producers & Energy Traders (continued) | | | | | | | | | | | | | | |
Exelon Generation Co. LLC, 5.20%, 10/1/2019 | | | Baa2 | | | $ | 550,000 | | | $ | 604,837 | | | |
| | | | | | | | | | | | | | |
| | | | |
| | | | | | | | | | | 1,004,954 | | | |
| | | | | | | | | | | | | | |
| | | | |
Total Utilities | | | | | | | | | | | 2,846,748 | | | |
| | | | | | | | | | | | | | |
TOTAL CORPORATE BONDS | | | | | | | | | | | | | | |
(Identified Cost $138,017,439) | | | | | | | | | | | 141,451,084 | | | |
| | | | | | | | | | | | | | |
| | | | |
PREFERRED STOCKS - 2.4% | | | | | | | | | | | | | | |
| | | | |
Financials - 2.4% | | | | | | | | | | | | | | |
Commercial Banks - 1.5% | | | | | | | | | | | | | | |
BB&T Corp., Series D (non-cumulative), 5.85% | | | Baa2 | | | | 34,120 | | | | 855,047 | | | |
PNC Financial Services Group, Inc., Series Q (non-cumulative), 5.375% | | | Baa3 | | | | 35,125 | | | | 851,781 | | | |
U.S. Bancorp., Series F (non-cumulative), 6.50%3 | | | Baa1 | | | | 32,800 | | | | 921,680 | | | |
| | | | | | | | | | | | | | |
| | | | |
| | | | | | | | | | | 2,628,508 | | | |
| | | | | | | | | | | | | | |
Real Estate Investment Trusts (REITS) - 0.9% | | | | | | | | | | | | | | |
Boston Properties, Inc., Series F, 5.25% | | | Baa3 | | | | 37,750 | | | | 908,643 | | | |
Public Storage, Series Q, 6.50% | | | A3 | | | | 29,910 | | | | 768,986 | | | |
| | | | | | | | | | | | | | |
| | | | |
| | | | | | | | | | | 1,677,629 | | | |
| | | | | | | | | | | | | | |
TOTAL PREFERRED STOCKS | | | | | | | | | | | | | | |
(Identified Cost $4,238,031) | | | | | | | | | | | 4,306,137 | | | |
| | | | | | | | | | | | | | |
| | | | |
ASSET-BACKED SECURITIES - 0.7% | | | | | | | | | | | | | | |
| | | | |
FDIC Trust, Series 2011-R1, Class A2, 2.672%, 7/25/2026 | | | WR4 | | | $ | 169,145 | | | | 174,308 | | | |
Hertz Vehicle Financing LLC, Series 2009-2A, Class A22, 5.29%, 3/25/2016 | | | Aaa | | | | 370,000 | | | | 392,778 | | | |
Hertz Vehicle Financing LLC, Series 2010-1A, Class A22, 3.74%, 2/25/2017 | | | Aaa | | | | 595,000 | | | | 624,925 | | | |
| | | | | | | | | | | | | | |
| | | | |
TOTAL ASSET-BACKED SECURITIES | | | | | | | | | | | | | | |
(Identified Cost $1,134,012) | | | | | | | | | | | 1,192,011 | | | |
| | | | | | | | | | | | | | |
| | | | |
COMMERCIAL MORTGAGE-BACKED SECURITIES - 6.6% | | | | | | | | | | | | | | |
| | | | |
Americold LLC Trust, Series 2010-ARTA, Class A12, 3.847%, 1/14/2029 | | | AAA5 | | | | 80,159 | | | | 83,551 | | | |
BAMLL Commercial Mortgage Securities Trust, Series 2012-PARK, Class A2, 2.959%, 12/10/2030 | | | AAA5 | | | | 215,000 | | | | 201,732 | | | |
Banc of America Commercial Mortgage Trust, Series 2006-2, Class A46, 5.73%, 5/10/2045 | | | AAA5 | | | | 200,000 | | | | 220,848 | | | |
Banc of America Commercial Mortgage Trust, Series 2006-4, Class A4, 5.634%, 7/10/2046 | | | Aaa | | | | 100,000 | | | | 109,732 | | | |
Bear Stearns Commercial Mortgage Securities Trust, Series 2005-PWR9, Class A4A, 4.871%, 9/11/2042 | | | Aaa | | | | 160,000 | | | | 170,533 | | | |
The accompanying notes are an integral part of the financial statements.
8
Core Bond Series
Investment Portfolio - June 30, 2013
(unaudited)
| | | | | | | | | | | | | | |
| | | CREDIT
RATING1
(UNAUDITED) | | | PRINCIPAL
AMOUNT | | | VALUE
(NOTE 2) | | | |
| | | | |
COMMERCIAL MORTGAGE-BACKED SECURITIES (continued) | | | | | | | | | | | | | | |
| | | | |
Bear Stearns Commercial Mortgage Securities Trust, Series 2006-PW12, Class A46, 5.715%, 9/11/2038 | | | Aaa | | | $ | 200,000 | | | $ | 220,774 | | | |
Bear Stearns Commercial Mortgage Securities Trust, Series 2006-PW13, Class A4, 5.54%, 9/11/2041 | | | AAA5 | | | | 300,000 | | | | 331,742 | | | |
CFCRE Commercial Mortgage Trust, Series 2011-C1, Class A22, 3.759%, 4/15/2044 | | | Aaa | | | | 60,000 | | | | 63,169 | | | |
Citigroup - Deutsche Bank Commercial Mortgage Trust, Series 2005-CD1, Class A46, 5.218%, 7/15/2044 | | | Aaa | | | | 280,000 | | | | 300,775 | | | |
Commercial Mortgage Pass-Through Certificates, Series 2010-C1, Class A12, 3.156%, 7/10/2046 | | | Aaa | | | | 239,808 | | | | 249,172 | | | |
Commercial Mortgage Pass-Through Certificates, Series 2012-CR4, Class A3, 2.853%, 10/15/2045 | | | Aaa | | | | 300,000 | | | | 277,227 | | | |
Commercial Mortgage Trust, Series 2006-GG7, Class A46, 5.86%, 7/10/2038 | | | Aaa | | | | 415,000 | | | | 460,008 | | | |
Credit Suisse Commercial Mortgage Trust, Series 2013-IVR3, Class A12,6, 2.50%, 5/25/2043 | | | AAA5 | | | | 434,158 | | | | 414,796 | | | |
Credit Suisse Mortgage Capital Certificates, Series 2013-TH1, Class A12,6, 2.13%, 2/25/2043 | | | AAA5 | | | | 435,861 | | | | 409,747 | | | |
Extended Stay America Trust, Series 2013-ESH7, Class A272, 2.958%, 12/5/2031 | | | Aaa | | | | 455,000 | | | | 441,605 | | | |
Fannie Mae Multifamily REMIC Trust, Series 2012-M13, Class A2, 2.377%, 5/25/2022 | | | WR4 | | | | 400,000 | | | | 379,057 | | | |
Fannie Mae Multifamily REMIC Trust, Series 2012-M13, Class ASQ2, 1.246%, 8/25/2017 | | | WR4 | | | | 380,000 | | | | 375,196 | | | |
Freddie Mac Multifamily Structured Pass-Through Certificates, Series K-P01, Class A2, 1.72%, 1/25/2019 | | | WR4 | | | | 420,000 | | | | 414,957 | | | |
FREMF Mortgage Trust, Series 2011-K701, Class B2,6, 4.286%, 7/25/2048 | | | A5 | | | | 160,000 | | | | 162,993 | | | |
JP Morgan Chase Commercial Mortgage Securities Corp., Series 2005-CB13, Class A46, 5.294%, 1/12/2043 | | | Aaa | | | | 650,000 | | | | 702,345 | | | |
JP Morgan Chase Commercial Mortgage Securities Corp., Series 2005-LDP5, Class A46, 5.20%, 12/15/2044 | | | Aaa | | | | 325,000 | | | | 350,721 | | | |
JP Morgan Chase Commercial Mortgage Securities Corp., Series 2006-LDP7, Class A46, 5.863%, 4/15/2045 | | | Aaa | | | | 435,000 | | | | 480,607 | | | |
JP Morgan Chase Commercial Mortgage Securities Corp., Series 2010-C2, Class A32, 4.07%, 11/15/2043 | | | AAA5 | | | | 200,000 | | | | 210,470 | | | |
JP Morgan Mortgage Trust, Series 2013-1, Class 1A22,6, 3.00%, 3/25/2043 | | | WR4 | | | | 400,474 | | | | 396,496 | | | |
JP Morgan Mortgage Trust, Series 2013-2, Class A22,6, 3.50%, 5/25/2043 | | | AAA5 | | | | 423,695 | | | | 413,926 | | | |
LSTAR Commercial Mortgage Trust, Series 2011-1, Class A2, 3.913%, 6/25/2043 | | | Aaa | | | | 32,179 | | | | 33,004 | | | |
Morgan Stanley Bank of America Merrill Lynch Trust, Series 2012-C5 Class A4, 3.176%, 8/15/2045 | | | Aaa | | | | 430,000 | | | | 412,448 | | | |
Motel 6 Trust, Series 2012-MTL6, Class A22, 1.948%, 10/5/2025 | | | AAA5 | | | | 300,000 | | | | 294,132 | | | |
The accompanying notes are an integral part of the financial statements.
9
Core Bond Series
Investment Portfolio - June 30, 2013
(unaudited)
| | | | | | | | | | | | | | |
| | | CREDIT
RATING1
(UNAUDITED) | | | PRINCIPAL
AMOUNT | | | VALUE (NOTE 2) | | | |
| | | | |
COMMERCIAL MORTGAGE-BACKED SECURITIES (continued) | | | | | | | | | | | | | | |
| | | | |
OBP Depositor LLC Trust, Series 2010-OBP, Class A2, 4.646%, 7/15/2045 | | | AAA5 | | | $ | 100,000 | | | $ | 108,436 | | | |
Sequoia Mortgage Trust, Series 2011-2, Class A16, 3.90%, 9/25/2041 | | | WR4 | | | | 389,466 | | | | 386,880 | | | |
Sequoia Mortgage Trust, Series 2013-2, Class A16, 1.874%, 2/25/2043 | | | AAA5 | | | | 403,063 | | | | 363,361 | | | |
Sequoia Mortgage Trust, Series 2013-7, Class A26, 3.00%, 6/25/2043 | | | AAA5 | | | | 279,421 | | | | 263,805 | | | |
Sequoia Mortgage Trust, Series 2013-8, Class A16, 3.00%, 6/25/2043 | | | Aaa | | | | 385,000 | | | | 363,073 | | | |
Vornado DP LLC Trust, Series 2010-VNO, Class A2FX2, 4.004%, 9/13/2028 | | | AAA5 | | | | 245,000 | | | | 255,337 | | | |
Wachovia Bank Commercial Mortgage Trust, Series 2005-C21, Class A46, 5.239%, 10/15/2044 | | | Aaa | | | | 130,332 | | | | 140,121 | | | |
Wachovia Bank Commercial Mortgage Trust, Series 2006-C26, Class A36, 6.011%, 6/15/2045 | | | Aaa | | | | 280,000 | | | | 311,645 | | | |
Wells Fargo Commercial Mortgage Trust, Series 2010-C1, Class A22, 4.393%, 11/15/2043 | | | Aaa | | | | 275,000 | | | | 290,250 | | | |
Wells Fargo Commercial Mortgage Trust, Series 2012-LC5, Class A3, 2.918%, 10/15/2045 | | | Aaa | | | | 545,000 | | | | 510,463 | | | |
| | | | | | | | | | | | | | |
| | | | |
TOTAL COMMERCIAL MORTGAGE-BACKED SECURITIES | | | | | | | | | | | | | | |
(Identified Cost $11,792,582) | | | | | | | | | | | 11,575,134 | | | |
| | | | | | | | | | | | | | |
| | | | |
FOREIGN GOVERNMENT BONDS - 0.9% | | | | | | | | | | | | | | |
| | | | |
Brazilian Government Bond (Brazil), 8.875%, 10/14/2019 | | | Baa2 | | | | 300,000 | | | | 394,500 | | | |
Chile Government Bond (Chile), 3.25%, 9/14/2021 | | | Aa3 | | | | 900,000 | | | | 900,000 | | | |
Russian Foreign Bond - Eurobond (Russia), 5.00%, 4/29/2020 | | | Baa1 | | | | 300,000 | | | | 321,000 | | | |
| | | | | | | | | | | | | | |
| | | | |
TOTAL FOREIGN GOVERNMENT BONDS | | | | | | | | | | | | | | |
(Identified Cost $1,610,825) | | | | | | | | | | | 1,615,500 | | | |
| | | | | | | | | | | | | | |
| | | | |
U.S. GOVERNMENT AGENCIES - 6.9% | | | | | | | | | | | | | | |
| | | | |
Mortgage-Backed Securities - 6.9% | | | | | | | | | | | | | | |
Fannie Mae, Pool #888468, 5.50%, 9/1/2021 | | | | | | | 766,313 | | | | 826,466 | | | |
Fannie Mae, Pool #995233, 5.50%, 10/1/2021 | | | | | | | 58,724 | | | | 63,350 | | | |
Fannie Mae, Pool #888017, 6.00%, 11/1/2021 | | | | | | | 70,121 | | | | 76,930 | | | |
Fannie Mae, Pool #995329, 5.50%, 12/1/2021 | | | | | | | 490,799 | | | | 529,479 | | | |
Fannie Mae, Pool #888136, 6.00%, 12/1/2021 | | | | | | | 90,833 | | | | 99,644 | | | |
Fannie Mae, Pool #888810, 5.50%, 11/1/2022 | | | | | | | 860,892 | | | | 928,953 | | | |
Fannie Mae, Pool #AD0462, 5.50%, 10/1/2024 | | | | | | | 52,609 | | | | 56,778 | | | |
Fannie Mae, Pool #AB4086, 3.00%, 12/1/2026 | | | | | | | 384,846 | | | | 396,283 | | | |
Fannie Mae, Pool #AJ7717, 3.00%, 12/1/2026 | | | | | | | 466,843 | | | | 480,736 | | | |
Fannie Mae, Pool #AK0726, 3.00%, 2/1/2027 | | | | | | | 234,620 | | | | 241,555 | | | |
Fannie Mae, Pool #AK4747, 3.50%, 3/1/2027 | | | | | | | 185,970 | | | | 193,950 | | | |
Fannie Mae, Pool #AB5970, 3.00%, 8/1/2027 | | | | | | | 536,534 | | | | 552,968 | | | |
Fannie Mae, Pool #AL3299, 3.00%, 2/1/2028 | | | | | | | 481,113 | | | | 495,577 | | | |
Fannie Mae, Pool #AL3586, 3.00%, 3/1/2028 | | | | | | | 323,213 | | | | 333,279 | | | |
Fannie Mae, Pool #AT9599, 3.00%, 6/1/2028 | | | | | | | 85,693 | | | | 88,332 | | | |
Fannie Mae, Pool #995876, 6.00%, 11/1/2038 | | | | | | | 794,561 | | | | 863,486 | | | |
The accompanying notes are an integral part of the financial statements.
10
Core Bond Series
Investment Portfolio - June 30, 2013
(unaudited)
| | | | | | | | | | |
| | | PRINCIPAL
AMOUNT | | | VALUE (NOTE 2) | | | |
| | | |
U.S. GOVERNMENT AGENCIES (continued) | | | | | | | | | | |
| | | |
Mortgage-Backed Securities (continued) | | | | | | | | | | |
Fannie Mae, Pool #AO8298, 3.50%, 8/1/2042 | | $ | 294,109 | | | $ | 299,148 | | | |
Fannie Mae, Pool #AB6228, 3.50%, 9/1/2042 | | | 294,850 | | | | 300,274 | | | |
Fannie Mae, Pool #AL3454, 3.00%, 4/1/2043 | | | 407,743 | | | | 398,949 | | | |
Fannie Mae, Pool #AT3045, 3.00%, 4/1/2043 | | | 93,543 | | | | 91,536 | | | |
Fannie Mae, Pool #AL3499, 3.50%, 5/1/2043 | | | 154,805 | | | | 157,464 | | | |
Fannie Mae, Pool #AB9782, 3.00%, 7/1/2043 | | | 214,639 | | | | 210,031 | | | |
Fannie Mae, Pool #MA1489, 3.00%, 7/1/2043 | | | 195,126 | | | | 190,911 | | | |
Freddie Mac, Pool #G11850, 5.50%, 7/1/2020 | | | 290,517 | | | | 314,928 | | | |
Freddie Mac, Pool #G12610, 6.00%, 3/1/2022 | | | 86,020 | | | | 94,101 | | | |
Freddie Mac, Pool #G12655, 6.00%, 5/1/2022 | | | 63,815 | | | | 69,811 | | | |
Freddie Mac, Pool #J19935, 2.50%, 8/1/2022 | | | 244,634 | | | | 249,633 | | | |
Freddie Mac, Pool #G12988, 6.00%, 1/1/2023 | | | 48,888 | | | | 53,696 | | | |
Freddie Mac, Pool #G13078, 6.00%, 3/1/2023 | | | 86,713 | | | | 95,520 | | | |
Freddie Mac, Pool #J16679, 3.00%, 9/1/2026 | | | 293,059 | | | | 302,070 | | | |
Freddie Mac, Pool #G05671, 5.50%, 8/1/2038 | | | 64,809 | | | | 69,782 | | | |
Freddie Mac, Pool #G05900, 6.00%, 3/1/2040 | | | 424,571 | | | | 460,522 | | | |
Freddie Mac, Pool #C03815, 3.50%, 3/1/2042 | | | 95,608 | | | | 97,047 | | | |
Freddie Mac, Pool #G07213, 3.50%, 11/1/2042 | | | 262,435 | | | | 266,617 | | | |
Freddie Mac, Pool #C09026, 2.50%, 2/1/2043 | | | 408,162 | | | | 377,710 | | | |
Freddie Mac, Pool #V80002, 2.50%, 4/1/2043 | | | 503,330 | | | | 465,778 | | | |
Freddie Mac, Pool #Q19115, 3.00%, 6/1/2043 | | | 209,018 | | | | 204,219 | | | |
Freddie Mac, Pool #Q19118, 3.50%, 6/1/2043 | | | 390,253 | | | | 396,504 | | | |
Freddie Mac, Pool #Q19121, 3.50%, 6/1/2043 | | | 390,253 | | | | 396,141 | | | |
Freddie Mac, Pool #V80160, 3.50%, 6/1/2043 | | | 234,151 | | | | 237,653 | | | |
Freddie Mac, Pool #C09044, 3.50%, 7/1/2043 | | | 156,100 | | | | 158,413 | | | |
| | | | | | | | | | |
| | | |
TOTAL U.S. GOVERNMENT AGENCIES | | | | | | | | | | |
(Identified Cost $12,258,012) | | | | | | | 12,186,224 | | | |
| | | | | | | | | | |
The accompanying notes are an integral part of the financial statements.
11
Core Bond Series
Investment Portfolio - June 30, 2013
(unaudited)
| | | | | | | | | | |
| | | SHARES | | | VALUE (NOTE 2) | | | |
| | | |
SHORT-TERM INVESTMENT - 1.8% | | | | | | | | | | |
| | | |
Dreyfus Cash Management, Inc. - Institutional Shares7, 0.05%, | | | | | | | | | | |
(Identified Cost $ 3,150,889) | | | 3,150,889 | | | $ | 3,150,889 | | | |
| | | | | | | | | | |
TOTAL INVESTMENTS - 99.4% | | | | | | | | | | |
(Identified Cost $ 172,201,790) | | | | | | | 175,476,979 | | | |
OTHER ASSETS, LESS LIABILITIES - 0.6% | | | | | | | 1,144,937 | | | |
| | | | | | | | | | |
NET ASSETS - 100% | | | | | | $ | 176,621,916 | | | |
| | | | | | | | | | |
1Credit ratings from Moody’s (unaudited).
2Restricted securities - Investment in securities that are restricted as to public resale under the Securities Act of 1933, as amended. These securities have been sold under rule 144A and have been determined to be liquid under guidelines established by the Board of Directors. These securities amount to $18,567,954, or 10.5%, of the Series’ net assets as of June 30, 2013 (see Note 2 to the financial statements).
3The rate shown is a fixed rate as of June 30, 2013; the rate becomes floating, based on LIBOR plus a spread, in 2022.
4Credit rating has been withdrawn. As of June 30, 2013, there is no rating available (unaudited).
5Credit ratings from S&P (unaudited).
6The coupon rate is floating and is the effective rate as of June 30, 2013.
7Rate shown is the current yield as of June 30, 2013.
The accompanying notes are an integral part of the financial statements.
12
Core Bond Series
Statement of Assets and Liabilities
June 30, 2013 (unaudited)
| | | | |
ASSETS: | | | | |
| |
Investments, at value (identified cost $172,201,790) (Note 2) | | $ | 175,476,979 | |
Receivable for securities sold | | | 2,059,616 | |
Interest receivable | | | 1,852,407 | |
Dividends receivable | | | 13,510 | |
Receivable for fund shares sold | | | 1,300 | |
Prepaid expenses | | | 509 | |
| | | | |
| |
TOTAL ASSETS | | | 179,404,321 | |
| | | | |
| |
LIABILITIES: | | | | |
| |
Accrued management fees (Note 3) | | | 89,421 | |
Accrued fund accounting and administration fees (Note 3) | | | 11,271 | |
Accrued transfer agent fees (Note 3) | | | 685 | |
Accrued Chief Compliance Officer service fees (Note 3) | | | 339 | |
Payable for securities purchased | | | 1,842,854 | |
Payable for fund shares repurchased | | | 803,331 | |
Other payables and accrued expenses | | | 34,504 | |
| | | | |
| |
TOTAL LIABILITIES | | | 2,782,405 | |
| | | | |
| |
TOTAL NET ASSETS | | $ | 176,621,916 | |
| | | | |
| |
NET ASSETS CONSIST OF: | | | | |
| |
Capital stock | | $ | 158,708 | |
Additional paid-in-capital | | | 168,391,396 | |
Undistributed net investment income | | | 590,020 | |
Accumulated net realized gain on investments | | | 4,206,603 | |
Net unrealized appreciation on investments | | | 3,275,189 | |
| | | | |
| |
TOTAL NET ASSETS | | $ | 176,621,916 | |
| | | | |
| |
NET ASSET VALUE, OFFERING PRICE AND REDEMPTION PRICE PER SHARE - Class A ($176,621,916/15,870,783 shares) | | $ | 11.13 | |
| | | | |
The accompanying notes are an integral part of the financial statements.
13
Core Bond Series
Statement of Operations
For the Six Months Ended June 30, 2013 (unaudited)
| | | | |
INVESTMENT INCOME: | | | | |
| |
Interest | | $ | 3,381,084 | |
Dividends | | | 111,473 | |
| | | | |
| |
Total Investment Income | | | 3,492,557 | |
| | | | |
| |
EXPENSES: | | | | |
| |
Management fees (Note 3) | | | 550,943 | |
Fund accounting and administration fees (Note 3) | | | 35,246 | |
Directors’ fees (Note 3) | | | 2,074 | |
Transfer agent fees (Note 3) | | | 1,800 | |
Chief Compliance Officer service fees (Note 3) | | | 1,117 | |
Custodian fees | | | 6,498 | |
Miscellaneous | | | 43,126 | |
| | | | |
| |
Total Expenses | | | 640,804 | |
| | | | |
| |
NET INVESTMENT INCOME | | | 2,851,753 | |
| | | | |
| |
REALIZED AND UNREALIZED GAIN (LOSS) ON INVESTMENTS: | | | | |
| |
Net realized gain (loss) on investments | | | 3,954,250 | |
Net change in unrealized appreciation (depreciation) on investments | | | (11,433,181 | ) |
| | | | |
| |
NET REALIZED AND UNREALIZED GAIN (LOSS) ON INVESTMENTS | | | (7,478,931 | ) |
| | | | |
| |
NET DECREASE IN NET ASSETS RESULTING FROM OPERATIONS | | $ | (4,627,178 | ) |
| | | | |
The accompanying notes are an integral part of the financial statements.
14
Core Bond Series
Statements of Changes in Net Assets
| | | | | | | | |
| | | FOR THE SIX
MONTHS ENDED
6/30/2013 | | | FOR THE
YEAR ENDED
12/31/12 | |
INCREASE (DECREASE) IN NET ASSETS: | | | | | | | | |
| | |
OPERATIONS: | | | | | | | | |
| | |
Net investment income | | $ | 2,851,753 | | | $ | 6,211,867 | |
Net realized gain (loss) on investments | | | 3,954,250 | | | | 2,750,729 | |
Net change in unrealized appreciation (depreciation) on investments | | | (11,433,181 | ) | | | 6,969,384 | |
| | | | | | | | |
| | |
Net increase (decrease) from operations | | | (4,627,178 | ) | | | 15,931,980 | |
| | | | | | | | |
| | |
DISTRIBUTIONS TO SHAREHOLDERS (Note 8): | | | | | | | | |
| | |
From net investment income | | | (2,249,368 | ) | | | (6,256,063 | ) |
From net realized gain on investments | | | — | | | | (2,295,666 | ) |
| | | | | | | | |
| | |
Total distributions to shareholders | | | (2,249,368 | ) | | | (8,551,729 | ) |
| | | | | | | | |
| | |
CAPITAL STOCK ISSUED AND REPURCHASED: | | | | | | | | |
| | |
Net increase (decrease) from capital share transactions (Note 5) | | | (6,117,363 | ) | | | 18,149,946 | |
| | | | | | | | |
| | |
Net increase (decrease) in net assets | | | (12,993,909 | ) | | | 25,530,197 | |
| | |
NET ASSETS: | | | | | | | | |
| | |
Beginning of period | | | 189,615,825 | | | | 164,085,628 | |
| | | | | | | | |
| | |
End of period (including undistributed net investment income of $590,020 and distributions in excess of net investment income of $12,365, respectively) | | $ | 176,621,916 | | | $ | 189,615,825 | |
| | | | | | | | |
The accompanying notes are an integral part of the financial statements.
15
Core Bond Series
Financial Highlights
| | | | | | | | | | | | | | | | | | | | | | | | |
| | | FOR THE SIX
MONTHS
ENDED
6/30/2013 | | | FOR THE YEARS ENDED | |
| | | (UNAUDITED) | | | 12/31/12 | | | 12/31/11 | | | 12/31/10 | | | 12/31/09 | | | 12/31/08 | |
Per share data (for a share outstanding throughout each period): | | | | | | | | | | | | | | | | | | | | | | | | |
Net asset value - Beginning of period | | $ | 11.56 | | | $ | 11.05 | | | $ | 10.94 | | | $ | 10.38 | | | $ | 9.69 | | | $ | 10.05 | |
| | | | | | | | | | | | | | | | | | | | | | | | |
Income (loss) from investment operations: | | | | | | | | | | | | | | | | | | | | | | | | |
Net investment income | | | 0.18 | 1 | | | 0.41 | 1 | | | 0.44 | 1 | | | 0.45 | 1 | | | 0.49 | 1 | | | 0.45 | |
Net realized and unrealized gain (loss) on investments | | | (0.47 | ) | | | 0.66 | | | | 0.18 | | | | 0.48 | | | | 0.62 | | | | (0.30 | ) |
| | | | | | | | | | | | | | | | | | | | | | | | |
| | | | | | |
Total from investment operations | | | (0.29 | ) | | | 1.07 | | | | 0.62 | | | | 0.93 | | | | 1.11 | | | | 0.15 | |
| | | | | | | | | | | | | | | | | | | | | | | | |
| | | | | | |
Less distributions to shareholders: | | | | | | | | | | | | | | | | | | | | | | | | |
From net investment income | | | (0.14 | ) | | | (0.41 | ) | | | (0.44 | ) | | | (0.37 | ) | | | (0.42 | ) | | | (0.46 | ) |
From net realized gain on investments | | | — | | | | (0.15 | ) | | | (0.07 | ) | | | — | | | | — | | | | (0.05 | ) |
| | | | | | | | | | | | | | | | | | | | | | | | |
| | | | | | |
Total distributions to shareholders | | | (0.14 | ) | | | (0.56 | ) | | | (0.51 | ) | | | (0.37 | ) | | | (0.42 | ) | | | (0.51 | ) |
| | | | | | | | | | | | | | | | | | | | | | | | |
| | | | | | |
Net asset value - End of period | | $ | 11.13 | | | $ | 11.56 | | | $ | 11.05 | | | $ | 10.94 | | | $ | 10.38 | | | $ | 9.69 | |
| | | | | | | | | | | | | | | | | | | | | | | | |
| | | | | | |
Net assets - End of period (000’s omitted) | | $ | 176,622 | | | $ | 189,616 | | | $ | 164,086 | | | $ | 114,058 | | | $ | 76,601 | | | $ | 53,071 | |
| | | | | | | | | | | | | | | | | | | | | | | | |
| | | | | | |
Total return2 | | | (2.54 | %) | | | 9.74 | % | | | 5.68 | % | | | 8.97 | % | | | 11.46 | % | | | 1.66 | % |
Ratios (to average net assets)/ | | | | | | | | | | | | | | | | | | | | | | | | |
Supplemental Data: | | | | | | | | | | | | | | | | | | | | | | | | |
Expenses* | | | 0.70 | %3 | | | 0.70 | % | | | 0.71 | % | | | 0.76 | % | | | 0.79 | % | | | 0.80 | % |
Net investment income | | | 3.11 | %3 | | | 3.55 | % | | | 3.91 | % | | | 4.10 | % | | | 4.84 | % | | | 4.73 | % |
Portfolio turnover | | | 32 | % | | | 31 | % | | | 18 | % | | | 23 | % | | | 67 | % | | | 53 | % |
|
| * The investment advisor did not impose all or a portion of its management and/or other fees, and in some periods may have paid a portion of the Series’ expenses. If these expenses had been incurred by the Series, the expense ratio (to average net assets) would have increased by the following amount: | |
| | | | | | |
| | | N/A | | | | N/A | | | | N/A | | | | 0.00 | %4 | | | 0.00 | %4 | | | 0.03 | % |
1Calculated based on average shares outstanding during the periods.
2Represents aggregate total return for the periods indicated, and assumes reinvestment of all distributions. Total return would have been lower had certain expenses not been waived or reimbursed during certain periods. Periods less than one year are not annualized.
3Annualized.
4Less than 0.01%.
The accompanying notes are an integral part of the financial statements.
16
Core Bond Series
Notes to Financial Statements
(unaudited)
Core Bond Series (the “Series”) is a no-load diversified series of Manning & Napier Fund, Inc. (the “Fund”). The Fund is organized in Maryland and is registered under the Investment Company Act of 1940, as amended, as an open-end management investment company.
The Series’ investment objective is to provide long-term total return by investing primarily in fixed income securities.
The Fund’s advisor is Manning & Napier Advisors, LLC (the “Advisor”). Shares of the Series are offered to investors, clients and employees of the Advisor and its affiliates. The total authorized capital stock of the Fund consists of 15 billion shares of common stock each having a par value of $0.01. As of June 30, 2013, 10.3 billion shares have been designated in total among 42 series, of which 125 million have been designated as Core Bond Series Class A common stock.
| 2. | Significant Accounting Policies |
Security Valuation
Portfolio securities, including domestic equities, foreign equities, warrants and options, listed on an exchange other than the NASDAQ Stock Market are valued at the latest quoted sales price of the exchange on which the security is primarily traded. Securities not traded on valuation date or securities not listed on an exchange are valued at the latest quoted bid price provided by the Fund’s pricing service. Securities listed on the NASDAQ Stock Market are valued in accordance with the NASDAQ Official Closing Price.
Debt securities, including government bonds, foreign bonds, asset-backed securities, structured notes, supranational obligations, sovereign bonds, corporate bonds and mortgage-backed securities will normally be valued on the basis of evaluated bid prices provided directly by an independent pricing service. The pricing services use multiple valuation techniques to determine fair value. In instances where sufficient market activity exists, the pricing services may utilize a market-based approach through which quotes from market makers are used to determine fair value. In instances where sufficient market activity may not exist or is limited, the pricing services also utilize proprietary valuation models which may consider market characteristics such as benchmark yield curves, option-adjusted spreads, credit spreads, estimated default rates, coupon rates, anticipated timing of principal repayments, underlying collateral, and other unique security features in order to estimate the relevant cash flows, which are then discounted to calculate the fair value. Certain investments in securities held by the Series may be valued on a basis of a price provided directly by a principal market maker. These prices may differ from the value that would have been used had a broader market for securities existed.
Municipal securities will normally be valued on the basis of market valuations provided by an independent pricing service that utilizes the latest price quotations and a matrix system (which considers such factors as security prices of similar securities, yields, maturities and ratings).
Short-term investments that mature in sixty days or less are valued at amortized cost, which approximates fair value. Investments in open-end investment companies are valued at their net asset value per share on valuation date.
Volume and level of activity in established markets for an asset or liability are evaluated to determine whether recent transactions and quoted prices are determinative of fair value. Where there have been significant decreases in volume and level of activity, further analysis and adjustment may be necessary to estimate fair value. The Series measures fair value in these instances by the use of inputs and valuation techniques which may be based upon current market prices of securities that are comparable in coupon, rating, maturity and industry and/or expectation of future cash flows. As a result of trading in relatively thin markets and/or markets that experience significant volatility, the prices used by the Series to value these securities may differ from the value that would be realized if these securities were sold, and the differences could be material.
Securities for which representative valuations or prices are not available from the Series’ pricing service may be valued at fair value as determined in good faith by the Advisor under procedures approved by and under the general supervision and responsibility of the Fund’s Board of Directors (the “Board”). Due to the inherent uncertainty of valuations of such securities, the fair value may differ significantly from the values that would have been used had a ready market for such securities existed. If
17
Core Bond Series
Notes to Financial Statements (continued)
(unaudited)
| 2. | Significant Accounting Policies (continued) |
Security Valuation (continued)
trading or events occurring after the close of the principal market in which securities are traded are expected to materially affect the value of those securities, then they may be valued at their fair value, taking this trading or these events into account.
Various inputs are used in determining the value of the Series’ assets or liabilities carried at fair value. These inputs are summarized in three broad levels. Level 1 includes quoted prices in active markets for identical assets and liabilities. Level 2 includes other significant observable inputs (including quoted prices for similar securities, interest rates, prepayment speeds, credit risk, etc.). Level 3 includes significant unobservable inputs (including the Series’ own assumptions in determining the fair value of investments). A financial instrument’s level within the fair value hierarchy is based on the lowest level of any input both individually and in aggregate that is significant to the fair value measurement. The inputs or methodology used for valuing securities are not necessarily an indication of the risk associated with investing in those securities.
The following is a summary of the valuation levels used for major security types as of June 30, 2013 in valuing the Series’ assets or liabilities carried at fair value:
| | | | | | | | | | | | | | | | |
| DESCRIPTION | | TOTAL | | | LEVEL 1 | | | LEVEL 2 | | | LEVEL 3 | |
Assets: | | | | | | | | | | | | | | | | |
Preferred securities: | | | | | | | | | | | | | | | | |
Financials | | $ | 4,306,137 | | | $ | 4,306,137 | | | $ | — | | | $ | — | |
Debt securities: | | | | | | | | | | | | | | | | |
U.S. Treasury and other U.S. Government agencies | | | 12,186,224 | | | | — | | | | 12,186,224 | | | | — | |
Corporate debt: | | | | | | | | | | | | | | | | |
Consumer Discretionary | | | 14,244,316 | | | | — | | | | 14,244,316 | | | | — | |
Consumer Staples | | | 1,656,824 | | | | — | | | | 1,656,824 | | | | — | |
Energy | | | 8,409,580 | | | | — | | | | 8,409,580 | | | | — | |
Financials | | | 77,729,448 | | | | — | | | | 77,729,448 | | | | — | |
Health Care | | | 2,180,344 | | | | — | | | | 2,180,344 | | | | — | |
Industrials | | | 6,286,484 | | | | — | | | | 6,286,484 | | | | — | |
Information Technology | | | 7,840,085 | | | | — | | | | 7,840,085 | | | | — | |
Materials | | | 14,115,704 | | | | — | | | | 14,115,704 | | | | — | |
Telecommunication Services | | | 6,141,551 | | | | — | | | | 6,141,551 | | | | — | |
Utilities | | | 2,846,748 | | | | — | | | | 2,846,748 | | | | — | |
Asset-backed securities | | | 1,192,011 | | | | — | | | | 1,192,011 | | | | — | |
Commercial mortgage-backed securities | | | 11,575,134 | | | | — | | | | 11,575,134 | | | | — | |
Foreign government bonds | | | 1,615,500 | | | | — | | | | 1,615,500 | | | | — | |
Mutual fund | | | 3,150,889 | | | | 3,150,889 | | | | — | | | | — | |
| | | | | | | | | | | | | | | | |
Total assets | | $ | 175,476,979 | | | $ | 7,457,026 | | | $ | 168,019,953 | | | $ | — | |
| | | | | | | | | | | | | | | | |
There were no Level 3 securities held by the Series as of December 31, 2012 or June 30, 2013.
The Fund’s policy is to recognize transfers in and transfers out of the valuation levels as of the beginning of the reporting period. There were no transfers between Level 1 and Level 2 during the six months ended June 30, 2013.
Security Transactions, Investment Income and Expenses
Security transactions are accounted for on trade date. Dividend income is recorded on the ex-dividend date, except that if the ex-dividend date has passed, certain dividends from foreign securities are recorded as soon as the Series is informed of the ex-dividend date. Non-cash dividends, if any, are recorded at the fair value of the securities received. Interest income, including amortization of premium and accretion of discounts using the effective interest method, is earned from settlement date and accrued daily.
18
Core Bond Series
Notes to Financial Statements (continued)
(unaudited)
| 2. | Significant Accounting Policies (continued) |
Security Transactions, Investment Income and Expenses (continued)
Expenses are recorded on an accrual basis. Most expenses of the Fund can be attributed to a specific series. Expenses which cannot be directly attributed are apportioned among the series in the Fund in such a manner as deemed equitable by the Fund’s Board, taking into consideration, among other things, the nature and type of expense.
The Series uses the identified cost method for determining realized gain or loss on investments for both financial statement and federal income tax reporting purposes.
Foreign Currency Translation
The books and records of the Series are maintained in U.S. dollars. Foreign currencies, investments and other assets and liabilities are translated into U.S. dollars at the current exchange rates. Purchases and sales of investment securities and income and expenses are translated on the respective dates of such transactions. The Series does not isolate realized and unrealized gains and losses attributable to changes in the exchange rates from gains and losses that arise from changes in the fair value of investments. Such fluctuations are included with net realized and unrealized gain or loss on investments. Net realized foreign currency gains and losses represent foreign currency gains and losses between trade date and settlement date on securities transactions, gains and losses on disposition of foreign currencies and the difference between the amount of income and foreign withholding taxes recorded on the books of the Series and the amounts actually received or paid.
Securities Purchased on a When-Issued Basis or Forward Commitment
The Series may purchase securities on a when-issued basis or forward commitment. These transactions involve a commitment by the Series to purchase securities for a predetermined price with payment and delivery taking place beyond the customary settlement period. When such purchases are outstanding, the Series will designate liquid assets in an amount sufficient to meet the purchase price. When purchasing a security on a delayed delivery basis, the Series assumes the rights and risks of ownership of the security, including the risk of price and yield fluctuations, and takes such fluctuations into account when determining its net asset value. The Series may sell the when-issued securities before they are delivered, which may result in a capital gain or loss. No such investments were held by the Series on June 30, 2013.
In connection with its ability to purchase or sell securities on a forward commitment basis, the Series may enter into forward roll transactions principally using To Be Announced (TBA) securities. Forward roll transactions require the sale of securities for delivery in the current month, and a simultaneous agreement to repurchase substantially similar (same type, coupon and maturity) securities on a specified future date. Risks of entering into forward roll transactions include the potential inability of the counterparty to meet the terms of the agreement; the potential of the Series to receive inferior securities at redelivery as compared to the securities sold to the counterparty; counterparty credit risk; and the potential pay down speed variance between the mortgage-backed pools. During the roll period, the Series forgoes principal and interest paid on the securities. The Series accounts for such dollar rolls as purchases and sales. Information regarding securities purchased on a when-issued basis is included in the Series’ Investment Portfolio. No such investments were held by the Series on June 30, 2013.
Restricted Securities
Restricted securities are purchased in private placement transactions, are not registered under the Securities Act of 1933, as amended, and may have contractual restrictions on resale. Information regarding restricted securities is included at the end of the Series’ Investment Portfolio.
Illiquid Securities
A security may be considered illiquid if so deemed in good faith by the Advisor under procedures approved by and under the general supervision and responsibility of the Fund’s Board. Securities that are illiquid are marked with the applicable footnote on the Investment Portfolio. No such investments were held by the Series on June 30, 2013.
Federal Taxes
The Series’ policy is to comply with the provisions of the Internal Revenue Code applicable to regulated investment companies. The Series is not subject to federal income tax or excise tax to the extent that the Series distributes to shareholders each year its taxable income, including any net realized gains on investments, in accordance with requirements of the Internal Revenue Code. Accordingly, no provision for federal income tax or excise tax has been made in the financial statements.
19
Core Bond Series
Notes to Financial Statements (continued)
(unaudited)
| 2. | Significant Accounting Policies (continued) |
Federal Taxes (continued)
Management evaluates its tax positions to determine if the tax positions taken meet the minimum recognition threshold in connection with accounting for uncertainties in income tax positions taken or expected to be taken for the purposes of measuring and recognizing tax liabilities in the financial statements. Recognition of tax benefits of an uncertain tax position is required only when the position is “more likely than not” to be sustained assuming examination by taxing authorities. At June 30, 2013, the Series has recorded no liability for net unrecognized tax benefits relating to uncertain income tax positions taken or expected to be taken in future tax returns.
The Series files income tax returns in the U.S. federal jurisdiction, various states and foreign jurisdictions, as required. No income tax returns are currently under investigation. The statute of limitations on the Series’ tax returns remains open for the years ended December 31, 2009 through December 31, 2012. The Series is not aware of any tax positions for which it is reasonably possible that the total amounts of unrecognized tax benefits will significantly change in the next twelve months.
Foreign Taxes
Based on the Series’ understanding of the tax rules and rates related to income, gains and currency purchase/repatriation transactions for foreign jurisdictions in which it invests, the Series will provide for foreign taxes, and where appropriate, deferred foreign tax.
Distributions of Income and Gains
Distributions to shareholders of net investment income are made quarterly. Distributions of net realized gains are made annually. An additional distribution may be necessary to avoid taxation of the Series. Distributions are recorded on the ex-dividend date.
Indemnifications
The Fund’s organizational documents provide former and current directors and officers with a limited indemnification against liabilities arising in connection with the performance of their duties to the Fund. In the normal course of business, the Fund may also enter into contracts that provide general indemnifications. The Fund’s maximum exposure under these arrangements is unknown as this would be dependent on future claims that may be made against the Fund. The risk of material loss from such claims is considered remote.
Other
The preparation of financial statements in conformity with accounting principles generally accepted in the United States of America requires management to make estimates and assumptions that affect the reported amounts of assets and liabilities and the disclosure of contingent assets and liabilities at the date of the financial statements and the reported amounts of income and expenses during the reporting period. Actual results could differ from those estimates.
| 3. | Transactions with Affiliates |
The Fund has an Investment Advisory Agreement (the “Agreement”) with the Advisor, for which the Series pays a fee, computed daily and payable monthly, at an annual rate of 0.60% of the Series’ average daily net assets.
Under the Agreement, personnel of the Advisor provide the Series with advice and assistance in the choice of investments and the execution of securities transactions, and otherwise maintain the Series’ organization. The Advisor also provides the Fund with necessary office space and fund administration and support services. The salaries of all officers of the Fund (except a percentage of the Fund’s Chief Compliance Officer’s salary, which is paid by the Fund), and of all Directors who are “affiliated persons” of the Fund, or of the Advisor, and all personnel of the Fund, or of the Advisor, performing services relating to research, statistical and investment activities, are paid by the Advisor. Each “non-affiliated” Director receives an annual stipend, which is allocated among all the active series of the Fund. In addition, these Directors also receive a fee per Board meeting attended plus a fee for each committee meeting attended.
The Advisor has contractually agreed, until at least April 30, 2014, to waive its fee and, if necessary, pay other operating expenses of the Series in order to maintain total direct annual fund operating expenses for the Series at no more than 0.80% of
20
Core Bond Series
Notes to Financial Statements (continued)
(unaudited)
| 3. | Transactions with Affiliates (continued) |
average daily net assets each year. The Advisor did not waive any fees for the six months ended June 30, 2013. The Advisor is not eligible to recoup any expenses that have been waived or reimbursed in prior years.
Manning & Napier Investor Services, Inc., a registered broker-dealer affiliate of the Advisor, acts as distributor for the Fund’s shares. The services of Manning & Napier Investor Services, Inc. are provided at no additional cost to the Series.
The Advisor has agreements with BNY Mellon Investment Servicing (U.S.) Inc. (“BNY”) under which BNY serves as sub-accountant services agent and sub-transfer agent. The Fund pays the Advisor an annual fee related to fund accounting and administration of 0.0175% on the first $3 billion of average daily net assets (excluding Target Series and Strategic Income Series); 0.015% on the next $3 billion of average daily net assets (excluding Target Series and Strategic Income Series); and 0.01% of the average daily net assets in excess of $6 billion (excluding Target Series and Strategic Income Series); plus a base fee of $25,500 per series. Transfer Agent fees are charged to the Fund on a per account basis. Additionally, certain transaction and cusip-based fees and out-of-pocket expenses, including charges for reporting relating to the Fund’s compliance program, are charged. Effective October 1, 2012, the aforementioned agreements were modified to reduce the annual fee related to fund accounting and administration, as well as transfer agent fees, by 10%, excluding out-of-pocket expenses.
Expenses not directly attributable to a series are allocated based on each series’ relative net assets or number of accounts, depending on the expense.
| 4. | Purchases and Sales of Securities |
For the six months ended June 30, 2013, purchases and sales of securities, other than U.S. Government securities and short-term securities, were $51,657,714 and $55,405,532 respectively. Purchases and sales of U.S. Government securities, other than short-term securities, were $7,742,550 and $1,598,642, respectively.
| 5. | Capital Stock Transactions |
Transactions in shares of Core Bond Series were:
| | | | | | | | | | | | | | | | |
| | | FOR THE SIX MONTHS ENDED 06/30/13 | | | FOR THE YEAR ENDED 12/31/12 | |
| | | SHARES | | | AMOUNT | | | SHARES | | | AMOUNT | |
Sold | | | 725,912 | | | $ | 8,398,811 | | | | 1,780,781 | | | $ | 20,734,234 | |
Reinvested | | | 190,251 | | | | 2,175,923 | | | | 734,730 | | | | 8,458,577 | |
Repurchased | | | (1,451,804 | ) | | | (16,692,097 | ) | | | (953,817 | ) | | | (11,042,865 | ) |
| | | | | | | | | | | | | | | | |
Total | | | (535,641 | ) | | $ | (6,117,363 | ) | | | 1,561,694 | | | $ | 18,149,946 | |
| | | | | | | | | | | | | | | | |
Substantially all of the Series’ shares represent investments by fiduciary accounts over which the Advisor has sole investment discretion.
The Series may trade in instruments including written and purchased options, forward foreign currency exchange contracts and futures contracts and other derivatives in the normal course of investing activities to assist in managing exposure to various market risks. The Series may be subject to various elements of risk, which may involve, to a varying degree, elements of risk in excess of the amounts recognized for financial statement purposes. These risks include: the risk that changes in the value of a derivative may not correlate perfectly with the underlying asset, rate or index; counterparty credit risk related to over the counter derivative counterparties’ failure to perform under contract terms; liquidity risk related to the lack of a liquid market for these contracts allowing the fund to close out its position(s); and documentation risk relating to disagreement over contract terms. No such investments were held by the Series as of June 30, 2013.
21
Core Bond Series
Notes to Financial Statements (continued)
(unaudited)
Investing in securities of foreign companies and foreign governments involves special risks and considerations not typically associated with investing in securities of domestic companies and the U.S. Government. These risks include revaluation of currencies and future adverse political and economic developments. Moreover, securities of foreign companies and foreign governments and their markets may be less liquid and their prices more volatile than those of comparable domestic companies and the U.S. Government.
| 8. | Federal Income Tax Information |
The amount and characterization of certain income and capital gains to be distributed are determined in accordance with federal income tax regulations, which may differ from accounting principles generally accepted in the United States of America. The Series may periodically make reclassifications among its capital accounts to reflect income and gains available for distribution (or available capital loss carryovers) under income tax regulations, without impacting the Series’ net asset value. Any such reclassifications are not reflected in the financial highlights.
The final determination of the tax character of current year distributions will be made at the conclusion of the fiscal year. The tax character of distributions paid for the year ended December 31, 2012, was as follows:
| | | | | | | | |
Ordinary income | | $ | 6,235,528 | | | | | |
Long-term capital gains | | | 2,316,201 | | | | | |
At June 30, 2013, the identified cost for federal income tax purposes, the resulting gross unrealized appreciation and depreciation, and the net unrealized appreciation were as follows:
| | | | |
Cost for federal income tax purposes | | $ | 172,201,790 | |
Unrealized appreciation | | | 6,085,419 | |
Unrealized depreciation | | | (2,810,230 | ) |
| | | | |
Net unrealized appreciation | | $ | 3,275,189 | |
| | | | |
22
Core Bond Series
Literature Requests
(unaudited)
Proxy Voting Policies and Procedures
A description of the policies and procedures that the Fund uses to determine how to vote proxies relating to portfolio securities is available, without charge, upon request:
| | | | |
| By phone | | 1-800-466-3863 | | |
| On the Securities and Exchange | | | | |
| Commission’s (SEC) web site | | http://www.sec.gov | | |
Proxy Voting Record
Information regarding how the Fund voted proxies relating to portfolio securities during the most recent 12-month period ended June 30th is available, without charge, upon request:
| | | | |
| By phone | | 1-800-466-3863 | | |
| On the SEC’s web site | | http://www.sec.gov | | |
Quarterly Portfolio Holdings
The Series’ complete schedule of portfolio holdings for the 1st and 3rd quarters of each fiscal year are provided on Form N-Q, and are available, without charge, upon request:
| | | | |
| By phone | | 1-800-466-3863 | | |
| On the SEC’s web site | | http://www.sec.gov | | |
The Series’ Form N-Q may be reviewed and copied at the SEC’s Public Reference Room in Washington, D.C. Information on the operation of the Public Reference Room may be obtained by calling 1-800-SEC-0330.
Prospectus and Statement of Additional Information (SAI)
The prospectus and SAI provide additional information about each Series, including charges, expenses and risks. These documents are available, without charge, upon request:
| | | | |
| By phone | | 1-800-466-3863 | | |
| On the SEC’s web site | | http://www.sec.gov | | |
| On our web site | | http://www.manning-napier.com | | |
Additional information available at www.manning-napier.com
1. Fund Holdings - Month-End
2. Fund Holdings - Quarter-End
3. Shareholder Report - Annual
4. Shareholder Report - Semi-Annual
The Fund also offers electronic notification or “e-delivery” when certain documents are available on-line to be downloaded or reviewed. Direct shareholders can elect to receive electronic notification when shareholder reports, prospectus updates, and/or statements are available. If you do not currently have on-line access to your account, you can establish access by going to www.manning-napier.com, click on “Login” in the top corner of the page, and follow the prompts to self-enroll. Once enrolled, you can set your electronic notification preferences by clicking on the Account Options tab located within the green toolbar and then select E-Delivery Option. Should you have any questions on either how to establish on-line access or how to update your account settings, please contact Investor Services at 1-800-466-3863.
MNCOB-6/13-SAR
| | | | | | |
| | | | CORE PLUS BOND SERIES | | |
www.manning-napier.com | | | | |
Core Plus Bond Series
Shareholder Expense Example
(unaudited)
As a shareholder of the Series, you may incur two types of costs: (1) transaction costs and (2) ongoing costs, including management fees and other Series expenses. This example is intended to help you understand your ongoing costs (in dollars) of investing in the Series and to compare these costs with the ongoing costs of investing in other mutual funds.
The example is based on an investment of $1,000 invested at the beginning of the period and held for the entire period (January 1, 2013 to June 30, 2013).
Actual Expenses
The first line of the table below provides information about actual account values and actual expenses. You may use the information in this line, together with the amount you invested, to estimate the expenses that you paid over the period. Simply divide your account value by $1,000 (for example, an $8,600 account value divided by $1,000 = 8.6), then multiply the result by the number in the first line under the heading entitled “Expenses Paid During Period” to estimate the expenses you paid on your account during this period.
Hypothetical Example for Comparison Purposes
The second line of the table below provides information about hypothetical account values and hypothetical expenses based on the Series’ actual expense ratio and an assumed rate of return of 5% per year before expenses, which is not the Series’ actual return. The hypothetical account values and expenses may not be used to estimate the actual ending account balance or expenses you paid during the period. You may use this information to compare the ongoing costs of investing in the Series and other funds. To do so, compare this 5% hypothetical example with the 5% hypothetical examples that appear in the shareholder reports of the other funds.
Please note that the expenses shown in the table are meant to highlight your ongoing costs only and do not reflect any transaction costs. Therefore, the second line of the table is useful in comparing ongoing costs only, and will not help you determine the relative total costs of owning different funds. In addition, if these transaction costs were included, your costs would have been higher.
| | | | | | |
| | | BEGINNING ACCOUNT VALUE 1/1/13 | | ENDING ACCOUNT VALUE 6/30/13 | | EXPENSES PAID
DURING PERIOD*
1/1/13-6/30/13 |
Actual | | $1,000.00 | | $ 981.90 | | $3.69 |
Hypothetical (5% return before expenses) | | $1,000.00 | | $1,021.08 | | $3.76 |
*Expenses are equal to the Series’ annualized expense ratio (for the six-month period) of 0.75%, multiplied by the average account value over the period, multiplied by 181/365 (to reflect the one-half year period). Expenses are based on the most recent fiscal half year.
1
Core Plus Bond Series
Portfolio Composition as of June 30, 2013
(unaudited)
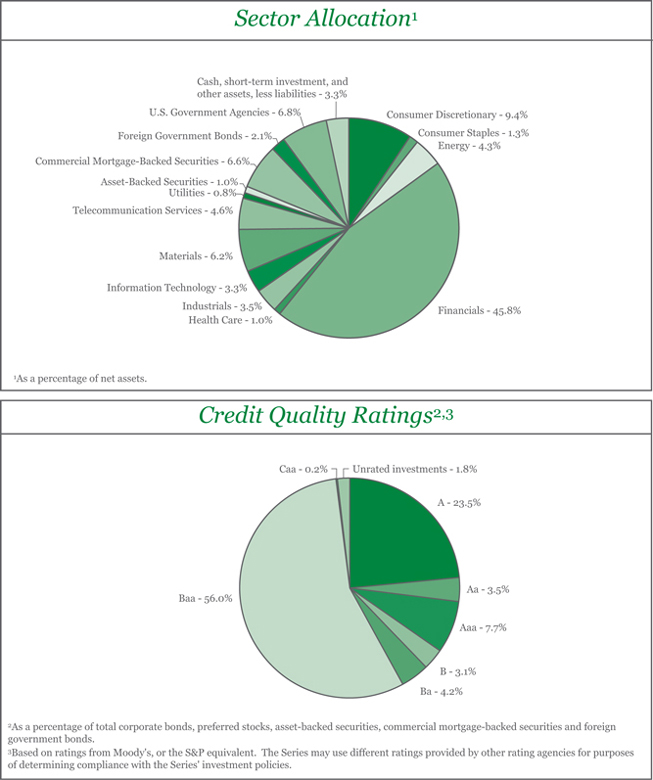
2
Core Plus Bond Series
Investment Portfolio - June 30, 2013
(unaudited)
| | | | | | | | | | | | | | |
| | | CREDIT
RATING1
(UNAUDITED) | | | PRINCIPAL
AMOUNT | | | VALUE (NOTE 2) | | | |
| | | | |
CORPORATE BONDS - 77.1% | | | | | | | | | | | | | | |
| | | | |
Convertible Corporate Bonds - 0.4% | | | | | | | | | | | | | | |
Financials - 0.4% | | | | | | | | | | | | | | |
Real Estate Investment Trusts (REITS) - 0.4% | | | | | | | | | | | | | | |
BioMed Realty LP2, 3.75%, 1/15/2030 | | | | | | | | | | | | | | |
(Identified Cost $2,760,937) | | | WR3 | | | $ | 2,375,000 | | | $ | 2,873,750 | | | |
| | | | | | | | | | | | | | |
Non-Convertible Corporate Bonds - 76.7% | | | | | | | | | | | | | | |
Consumer Discretionary - 9.4% | | | | | | | | | | | | | | |
Auto Components - 0.1% | | | | | | | | | | | | | | |
Gestamp Funding Luxembourg S.A. (Spain)2, 5.625%, 5/31/2020 | | | B1 | | | | 405,000 | | | | 384,750 | | | |
| | | | | | | | | | | | | | |
Hotels, Restaurants & Leisure - 1.2% | | | | | | | | | | | | | | |
International Game Technology, 7.50%, 6/15/2019 | | | Baa2 | | | | 6,755,000 | | | | 7,820,405 | | | |
| | | | | | | | | | | | | | |
Household Durables - 1.6% | | | | | | | | | | | | | | |
Brookfield Residential Properties, Inc. - Brookfield Residential US Corp. (Canada)2, 6.125%, 7/1/2022 | | | B2 | | | | 385,000 | | | | 377,781 | | | |
Lennar Corp., 6.95%, 6/1/2018 | | | Ba3 | | | | 385,000 | | | | 415,800 | | | |
NVR, Inc., 3.95%, 9/15/2022 | | | Baa2 | | | | 6,225,000 | | | | 6,052,163 | | | |
Tupperware Brands Corp., 4.75%, 6/1/2021 | | | Baa3 | | | | 3,125,000 | | | | 3,169,469 | | | |
Weekley Homes LLC - Weekley Finance Corp.2, 6.00%, 2/1/2023 | | | B2 | | | | 345,000 | | | | 338,963 | | | |
| | | | | | | | | | | | | | |
| | | | |
| | | | | | | | | | | 10,354,176 | | | |
| | | | | | | | | | | | | | |
Media - 3.8% | | | | | | | | | | | | | | |
CCO Holdings LLC - CCO Holdings Capital Corp.2, 5.25%, 3/15/2021 | | | B1 | | | | 575,000 | | | | 566,375 | | | |
DIRECTV Holdings LLC - DIRECTV Financing Co., Inc., 5.20%, 3/15/2020 | | | Baa2 | | | | 4,710,000 | | | | 5,085,495 | | | |
Discovery Communications LLC, 5.05%, 6/1/2020 | | | Baa2 | | | | 4,875,000 | | | | 5,408,320 | | | |
Nara Cable Funding Ltd. (Spain)2, 8.875%, 12/1/2018 | | | B1 | | | | 480,000 | | | | 499,200 | | | |
Sirius XM Radio, Inc.2, 8.75%, 4/1/2015 | | | B1 | | | | 350,000 | | | | 385,000 | | | |
Sirius XM Radio, Inc.2, 4.25%, 5/15/2020 | | | B1 | | | | 500,000 | | | | 470,000 | | | |
Starz LLC - Starz Finance Corp., 5.00%, 9/15/2019 | | | Ba2 | | | | 595,000 | | | | 590,537 | | | |
Time Warner, Inc., 3.15%, 7/15/2015 | | | Baa2 | | | | 3,000,000 | | | | 3,133,701 | | | |
Time Warner, Inc., 4.75%, 3/29/2021 | | | Baa2 | | | | 4,110,000 | | | | 4,421,320 | | | |
Unitymedia Hessen GmbH & Co. KG - Unitymedia NRW GmbH (Germany)2, 5.50%, 1/15/2023 | | | Ba3 | | | | 600,000 | | | | 567,000 | | | |
Virgin Media Secured Finance plc (United Kingdom), 5.25%, 1/15/2021 | | | Ba3 | | | | 360,000 | | | | 360,032 | | | |
The Walt Disney Co., 1.35%, 8/16/2016 | | | A2 | | | | 3,000,000 | | | | 3,027,144 | | | |
| | | | | | | | | | | | | | |
| | | | |
| | | | | | | | | | | 24,514,124 | | | |
| | | | | | | | | | | | | | |
Multiline Retail - 1.0% | | | | | | | | | | | | | | |
Dollar General Corp., 1.875%, 4/15/2018 | | | Baa3 | | | | 3,300,000 | | | | 3,183,929 | | | |
Macy’s Retail Holdings, Inc., 2.875%, 2/15/2023 | | | Baa3 | | | | 3,420,000 | | | | 3,154,485 | | | |
| | | | | | | | | | | | | | |
| | | | |
| | | | | | | | | | | 6,338,414 | | | |
| | | | | | | | | | | | | | |
Specialty Retail - 1.1% | | | | | | | | | | | | | | |
Advance Auto Parts, Inc., 4.50%, 1/15/2022 | | | Baa3 | | | | 1,650,000 | | | | 1,604,590 | | | |
Dufry Finance SCA (Switzerland)2, 5.50%, 10/15/2020 | | | Ba3 | | | | 365,000 | | | | 365,964 | | | |
The accompanying notes are an integral part of the financial statements.
3
Core Plus Bond Series
Investment Portfolio - June 30, 2013
(unaudited)
| | | | | | | | | | | | | | |
| | | CREDIT
RATING1
(UNAUDITED) | | | PRINCIPAL
AMOUNT | | | VALUE (NOTE 2) | | | |
| | | | |
CORPORATE BONDS (continued) | | | | | | | | | | | | | | |
| | | | |
Non-Convertible Corporate Bonds (continued) | | | | | | | | | | | | | | |
Consumer Discretionary (continued) | | | | | | | | | | | | | | |
Specialty Retail (continued) | | | | | | | | | | | | | | |
The Home Depot, Inc., 5.40%, 3/1/2016 | | | A3 | | | $ | 4,325,000 | | | $ | 4,819,287 | | | |
Rent-A-Center, Inc., 6.625%, 11/15/2020 | | | Ba3 | | | | 500,000 | | | | 523,750 | | | |
| | | | | | | | | | | | | | |
| | | | |
| | | | | | | | | | | 7,313,591 | | | |
| | | | | | | | | | | | | | |
Textiles, Apparel & Luxury Goods - 0.6% | | | | | | | | | | | | | | |
Jones Group, Inc. - Apparel Group Holdings - Apparel Group USA - Footwear Accessories Retail, 6.875%, 3/15/2019 | | | B1 | | | | 380,000 | | | | 381,900 | | | |
VF Corp., 5.95%, 11/1/2017 | | | A3 | | | | 2,815,000 | | | | 3,265,746 | | | |
| | | | | | | | | | | | | | |
| | | | |
| | | | | | | | | | | 3,647,646 | | | |
| | | | | | | | | | | | | | |
| | | | |
Total Consumer Discretionary | | | | | | | | | | | 60,373,106 | | | |
| | | | | | | | | | | | | | |
| | | | |
Consumer Staples - 1.3% | | | | | | | | | | | | | | |
Beverages - 0.5% | | | | | | | | | | | | | | |
The Coca-Cola Co., 1.50%, 11/15/2015 | | | Aa3 | | | | 3,000,000 | | | | 3,060,345 | | | |
| | | | | | | | | | | | | | |
Food Products - 0.7% | | | | | | | | | | | | | | |
C&S Group Enterprises LLC2, 8.375%, 5/1/2017 | | | B1 | | | | 604,000 | | | | 640,240 | | | |
FAGE Dairy Industry S.A. - FAGE USA Dairy Industry, Inc. (Greece)2, 9.875%, 2/1/2020 | | | B3 | | | | 375,000 | | | | 404,063 | | | |
Land O’ Lakes, Inc.2, 6.00%, 11/15/2022 | | | Ba2 | | | | 345,000 | | | | 355,350 | | | |
Shearer’s Foods LLC - Chip Finance Corp.2, 9.00%, 11/1/2019 | | | B3 | | | | 455,000 | | | | 481,163 | | | |
Tyson Foods, Inc., 4.50%, 6/15/2022 | | | Baa3 | | | | 2,350,000 | | | | 2,401,286 | | | |
| | | | | | | | | | | | | | |
| | | | |
| | | | | | | | | | | 4,282,102 | | | |
| | | | | | | | | | | | | | |
Household Products - 0.0%* | | | | | | | | | | | | | | |
The Procter & Gamble Co., 4.85%, 12/15/2015 | | | Aa3 | | | | 25,000 | | | | 27,489 | | | |
| | | | | | | | | | | | | | |
Tobacco - 0.1% | | | | | | | | | | | | | | |
Vector Group Ltd., 7.75%, 2/15/2021 | | | Ba3 | | | | 580,000 | | | | 598,850 | | | |
| | | | | | | | | | | | | | |
| | | | |
Total Consumer Staples | | | | | | | | | | | 7,968,786 | | | |
| | | | | | | | | | | | | | |
| | | | |
Energy - 4.3% | | | | | | | | | | | | | | |
Energy Equipment & Services - 2.5% | | | | | | | | | | | | | | |
Baker Hughes, Inc., 7.50%, 11/15/2018 | | | A2 | | | | 3,155,000 | | | | 3,972,776 | | | |
Calfrac Holdings LP (Canada)2, 7.50%, 12/1/2020 | | | B1 | | | | 745,000 | | | | 737,550 | | | |
Schlumberger Oilfield plc2, 4.20%, 1/15/2021 | | | A1 | | | | 2,630,000 | | | | 2,808,748 | | | |
Shelf Drilling Holdings Ltd. (United Arab Emirates)2, 8.625%, 11/1/2018 | | | B1 | | | | 375,000 | | | | 390,000 | | | |
Sidewinder Drilling, Inc.2, 9.75%, 11/15/2019 | | | B3 | | | | 375,000 | | | | 379,687 | | | |
Weatherford International Ltd., 9.625%, 3/1/2019 | | | Baa2 | | | | 6,175,000 | | | | 7,806,565 | | | |
| | | | | | | | | | | | | | |
| | | | |
| | | | | | | | | | | 16,095,326 | | | |
| | | | | | | | | | | | | | |
Oil, Gas & Consumable Fuels - 1.8% | | | | | | | | | | | | | | |
Buckeye Partners LP, 4.15%, 7/1/2023 | | | Baa3 | | | | 3,380,000 | | | | 3,288,554 | | | |
Chesapeake Oilfield Operating LLC - Chesapeake Oilfield Finance, Inc.2, 6.625%, 11/15/2019 | | | Ba3 | | | | 775,000 | | | | 767,250 | | | |
The accompanying notes are an integral part of the financial statements.
4
Core Plus Bond Series
Investment Portfolio - June 30, 2013
(unaudited)
| | | | | | | | | | | | | | |
| | | CREDIT
RATING1
(UNAUDITED) | | | PRINCIPAL AMOUNT | | | VALUE (NOTE 2) | | | |
| | | | |
CORPORATE BONDS (continued) | | | | | | | | | | | | | | |
| | | | |
Non-Convertible Corporate Bonds (continued) | | | | | | | | | | | | | | |
Energy (continued) | | | | | | | | | | | | | | |
Oil, Gas & Consumable Fuels (continued) | | | | | | | | | | | | | | |
EOG Resources, Inc., 2.625%, 3/15/2023 | | | A3 | | | $ | 2,765,000 | | | $ | 2,587,327 | | | |
EPL Oil & Gas, Inc., 8.25%, 2/15/2018 | | | Caa1 | | | | 560,000 | | | | 576,800 | | | |
Gulfport Energy Corp.2, 7.75%, 11/1/2020 | | | B3 | | | | 565,000 | | | | 572,063 | | | |
Lukoil International Finance B.V. (Russia)2, 3.416%, 4/24/2018 | | | Baa2 | | | | 1,950,000 | | | | 1,896,375 | | | |
Northern Tier Energy LLC - Northern Tier Finance Corp.2, 7.125%, 11/15/2020 | | | B1 | | | | 595,000 | | | | 600,950 | | | |
PBF Holding Co. LLC - PBF Finance Corp., 8.25%, 2/15/2020 | | | Ba3 | | | | 545,000 | | | | 570,887 | | | |
Sabine Pass Liquefaction LLC2, 5.625%, 2/1/2021 | | | Ba3 | | | | 700,000 | | | | 679,000 | | | |
| | | | | | | | | | | | | | |
| | | | |
| | | | | | | | | | | 11,539,206 | | | |
| | | | | | | | | | | | | | |
| | | | |
Total Energy | | | | | | | | | | | 27,634,532 | | | |
| | | | | | | | | | | | | | |
| | | | |
Financials - 42.3% | | | | | | | | | | | | | | |
Capital Markets - 8.7% | | | | | | | | | | | | | | |
Goldman Sachs Capital II4, 4.00%, 6/1/2043 | | | Ba2 | | | | 4,205,000 | | | | 3,342,975 | | | |
The Goldman Sachs Group, Inc., 2.375%, 1/22/2018 | | | A3 | | | | 3,290,000 | | | | 3,230,227 | | | |
The Goldman Sachs Group, Inc., 6.15%, 4/1/2018 | | | A3 | | | | 5,875,000 | | | | 6,620,185 | | | |
The Goldman Sachs Group, Inc., 5.375%, 3/15/2020 | | | A3 | | | | 4,510,000 | | | | 4,893,594 | | | |
The Goldman Sachs Group, Inc., 5.25%, 7/27/2021 | | | A3 | | | | 3,085,000 | | | | 3,300,638 | | | |
Jefferies Finance LLC - JFIN Co-Issuer Corp.2, 7.375%, 4/1/2020 | | | B1 | | | | 575,000 | | | | 557,750 | | | |
Jefferies Group LLC, 5.125%, 4/13/2018 | | | Baa3 | | | | 4,000,000 | | | | 4,180,008 | | | |
Jefferies Group LLC, 8.50%, 7/15/2019 | | | Baa3 | | | | 6,925,000 | | | | 8,344,625 | | | |
Merrill Lynch & Co., Inc., 6.875%, 4/25/2018 | | | Baa2 | | | | 2,295,000 | | | | 2,641,368 | | | |
Morgan Stanley, 2.125%, 4/25/2018 | | | Baa1 | | | | 5,070,000 | | | | 4,852,147 | | | |
Morgan Stanley, 7.30%, 5/13/2019 | | | Baa1 | | | | 4,310,000 | | | | 5,006,556 | | | |
Morgan Stanley, 5.50%, 1/26/2020 | | | Baa1 | | | | 4,485,000 | | | | 4,814,141 | | | |
Morgan Stanley, 5.75%, 1/25/2021 | | | Baa1 | | | | 3,940,000 | | | | 4,276,681 | | | |
| | | | | | | | | | | | | | |
| | | | |
| | | | | | | | | | | 56,060,895 | | | |
| | | | | | | | | | | | | | |
Commercial Banks - 7.5% | | | | | | | | | | | | | | |
BBVA Bancomer S.A. (Mexico)2, 6.75%, 9/30/2022 | | | Baa2 | | | | 4,300,000 | | | | 4,644,000 | | | |
BBVA US Senior S.A.U. (Spain), 4.664%, 10/9/2015 | | | Baa3 | | | | 3,190,000 | | | | 3,286,092 | | | |
HSBC Bank plc (United Kingdom)2, 1.50%, 5/15/2018 | | | Aa3 | | | | 4,190,000 | | | | 4,037,848 | | | |
Intesa Sanpaolo S.p.A. (Italy), 3.125%, 1/15/2016 | | | Baa2 | | | | 3,230,000 | | | | 3,175,923 | | | |
Intesa Sanpaolo S.p.A. (Italy)2, 6.50%, 2/24/2021 | | | Baa2 | | | | 3,280,000 | | | | 3,303,524 | | | |
Lloyds TSB Bank plc (United Kingdom)2, 6.50%, 9/14/2020 | | | Baa3 | | | | 2,930,000 | | | | 3,123,723 | | | |
Manufacturers & Traders Trust Co., 6.625%, 12/4/2017 | | | A3 | | | | 7,665,000 | | | | 9,017,650 | | | |
National City Corp., 6.875%, 5/15/2019 | | | Baa1 | | | | 1,920,000 | | | | 2,296,566 | | | |
PNC Bank National Association, 5.25%, 1/15/2017 | | | A3 | | | | 5,640,000 | | | | 6,231,241 | | | |
Royal Bank of Canada (Canada), 1.20%, 9/19/2017 | | | Aaa | | | | 1,550,000 | | | | 1,512,273 | | | |
Santander Holdings USA, Inc., 3.00%, 9/24/2015 | | | Baa2 | | | | 2,000,000 | | | | 2,050,664 | | | |
Santander Holdings USA, Inc., 4.625%, 4/19/2016 | | | Baa2 | | | | 750,000 | | | | 791,188 | | | |
Wells Fargo & Co., Series M, 3.45%, 2/13/2023 | | | A3 | | | | 3,175,000 | | | | 3,032,236 | | | |
The accompanying notes are an integral part of the financial statements.
5
Core Plus Bond Series
Investment Portfolio - June 30, 2013
(unaudited)
| | | | | | | | | | | | | | |
| | | CREDIT
RATING1
(UNAUDITED) | | | PRINCIPAL
AMOUNT | | | VALUE (NOTE 2) | | | |
| | | | |
CORPORATE BONDS (continued) | | | | | | | | | | | | | | |
| | | | |
Non-Convertible Corporate Bonds (continued) | | | | | | | | | | | | | | |
Financials (continued) | | | | | | | | | | | | | | |
Commercial Banks (continued) | | | | | | | | | | | | | | |
Westpac Banking Corp. (Australia)2, 1.25%, 12/15/2017 | | | Aaa | | | $ | 1,475,000 | | | $ | 1,436,060 | | | |
| | | | | | | | | | | | | | |
| | | | |
| | | | | | | | | | | 47,938,988 | | | |
| | | | | | | | | | | | | | |
Consumer Finance - 3.4% | | | | | | | | | | | | | | |
American Express Co., 2.65%, 12/2/2022 | | | A3 | | | | 4,525,000 | | | | 4,178,009 | | | |
American Express Co.4, 6.80%, 9/1/2066 | | | Baa2 | | | | 3,445,000 | | | | 3,677,537 | | | |
Capital One Bank USA National Association, 3.375%, 2/15/2023 | | | Baa1 | | | | 4,950,000 | | | | 4,679,007 | | | |
Caterpillar Financial Services Corp., 7.05%, 10/1/2018 | | | A2 | | | | 3,385,000 | | | | 4,193,328 | | | |
Credit Acceptance Corp., 9.125%, 2/1/2017 | | | B1 | | | | 330,000 | | | | 348,975 | | | |
John Deere Capital Corp., 5.75%, 9/10/2018 | | | A2 | | | | 3,795,000 | | | | 4,428,936 | | | |
| | | | | | | | | | | | | | |
| | | | |
| | | | | | | | | | | 21,505,792 | | | |
| | | | | | | | | | | | | | |
Diversified Financial Services - 8.0% | | | | | | | | | | | | | | |
Bank of America Corp., 5.75%, 8/15/2016 | | | Baa3 | | | | 3,715,000 | | | | 4,036,964 | | | |
Bank of America Corp., 3.30%, 1/11/2023 | | | Baa2 | | | | 1,520,000 | | | | 1,436,623 | | | |
The Bear Stearns Companies LLC, 7.25%, 2/1/2018 | | | A2 | | | | 2,195,000 | | | | 2,613,676 | | | |
Citigroup, Inc., 8.50%, 5/22/2019 | | | Baa2 | | | | 10,616,000 | | | | 13,376,447 | | | |
CME Group, Inc., 3.00%, 9/15/2022 | | | Aa3 | | | | 6,010,000 | | | | 5,658,115 | | | |
CNG Holdings, Inc.2, 9.375%, 5/15/2020 | | | B3 | | | | 705,000 | | | | 676,800 | | | |
Ford Motor Credit Co. LLC, 5.00%, 5/15/2018 | | | Baa3 | | | | 6,030,000 | | | | 6,430,537 | | | |
General Electric Capital Corp., 5.625%, 5/1/2018 | | | A1 | | | | 2,150,000 | | | | 2,466,059 | | | |
General Electric Capital Corp., 5.50%, 1/8/2020 | | | A1 | | | | 3,105,000 | | | | 3,500,844 | | | |
ING Bank N.V. (Netherlands)2, 5.125%, 5/1/2015 | | | Baa2 | | | | 3,100,000 | | | | 3,240,833 | | | |
ING US, Inc. (Netherlands)2, 2.90%, 2/15/2018 | | | Baa3 | | | | 2,050,000 | | | | 2,060,316 | | | |
ING US, Inc. (Netherlands)2, 5.50%, 7/15/2022 | | | Baa3 | | | | 1,100,000 | | | | 1,170,124 | | | |
JPMorgan Chase Bank National Association, 5.875%, 6/13/2016 | | | A1 | | | | 3,000,000 | | | | 3,344,967 | | | |
Ladder Capital Finance Holdings LLLP - Ladder Capital Finance Corp.2, 7.375%, 10/1/2017 | | | Ba3 | | | | 575,000 | | | | 586,500 | | | |
SPL Logistics Escrow LLC - SPL Logistics Finance Corp.2, 8.875%, 8/1/2020 | | | B2 | | | | 715,000 | | | | 743,600 | | | |
| | | | | | | | | | | | | | |
| | | | |
| | | | | | | | | | | 51,342,405 | | | |
| | | | | | | | | | | | | | |
Insurance - 5.7% | | | | | | | | | | | | | | |
American International Group, Inc., 4.875%, 6/1/2022 | | | Baa1 | | | | 8,525,000 | | | | 9,087,002 | | | |
Fidelity National Financial, Inc., 6.60%, 5/15/2017 | | | Baa3 | | | | 5,495,000 | | | | 6,090,521 | | | |
First American Financial Corp., 4.30%, 2/1/2023 | | | Baa3 | | | | 3,160,000 | | | | 3,040,125 | | | |
Genworth Holdings, Inc., 7.625%, 9/24/2021 | | | Baa3 | | | | 7,955,000 | | | | 9,244,346 | | | |
Genworth Holdings, Inc.4, 6.15%, 11/15/2066 | | | Ba1 | | | | 1,750,000 | | | | 1,518,125 | | | |
Hartford Financial Services Group, Inc., 5.125%, 4/15/2022 | | | Baa3 | | | | 6,915,000 | | | | 7,524,322 | | | |
| | | | | | | | | | | | | | |
| | | | |
| | | | | | | | | | | 36,504,441 | | | |
| | | | | | | | | | | | | | |
The accompanying notes are an integral part of the financial statements.
6
Core Plus Bond Series
Investment Portfolio - June 30, 2013
(unaudited)
| | | | | | | | | | | | | | |
| | | CREDIT
RATING1
(UNAUDITED) | | | PRINCIPAL
AMOUNT | | | VALUE (NOTE 2) | | | |
| | | | |
CORPORATE BONDS (continued) | | | | | | | | | | | | | | |
| | | | |
Non-Convertible Corporate Bonds (continued) | | | | | | | | | | | | | | |
Financials (continued) | | | | | | | | | | | | | | |
Real Estate Investment Trusts (REITS) - 9.0% | | | | | | | | | | | | | | |
American Campus Communities Operating Partnership LP, 3.75%, 4/15/2023 | | | Baa3 | | | $ | 1,620,000 | | | $ | 1,554,576 | | | |
American Tower Trust I2, 1.551%, 3/15/2018 | | | Aaa | | | | 1,625,000 | | | | 1,596,850 | | | |
BioMed Realty LP, 3.85%, 4/15/2016 | | | Baa3 | | | | 2,750,000 | | | | 2,883,625 | | | |
Boston Properties LP, 5.875%, 10/15/2019 | | | Baa2 | | | | 4,455,000 | | | | 5,138,442 | | | |
Camden Property Trust, 5.70%, 5/15/2017 | | | Baa1 | | | | 4,025,000 | | | | 4,475,929 | | | |
Corporate Office Properties LP2, 3.60%, 5/15/2023 | | | Baa3 | | | | 3,350,000 | | | | 3,091,976 | | | |
Corrections Corp. of America2, 4.125%, 4/1/2020 | | | Ba1 | | | | 580,000 | | | | 566,950 | | | |
Digital Realty Trust LP, 5.875%, 2/1/2020 | | | Baa2 | | | | 1,000,000 | | | | 1,091,149 | | | |
Digital Realty Trust LP, 5.25%, 3/15/2021 | | | Baa2 | | | | 4,180,000 | | | | 4,360,200 | | | |
HCP, Inc., 6.70%, 1/30/2018 | | | Baa1 | | | | 4,500,000 | | | | 5,266,998 | | | |
Health Care REIT, Inc., 4.95%, 1/15/2021 | | | Baa2 | | | | 3,450,000 | | | | 3,670,959 | | | |
Host Hotels & Resorts LP, Series D, 3.75%, 10/15/2023 | | | Baa3 | | | | 3,290,000 | | | | 3,017,414 | | | |
Mack-Cali Realty LP, 7.75%, 8/15/2019 | | | Baa2 | | | | 2,665,000 | | | | 3,265,113 | | | |
National Retail Properties, Inc., 3.30%, 4/15/2023 | | | Baa2 | | | | 3,340,000 | | | | 3,018,495 | | | |
Simon Property Group LP, 6.125%, 5/30/2018 | | | A3 | | | | 3,000,000 | | | | 3,524,679 | | | |
Simon Property Group LP, 10.35%, 4/1/2019 | | | A3 | | | | 3,670,000 | | | | 5,082,700 | | | |
UDR, Inc., 4.625%, 1/10/2022 | | | Baa2 | | | | 5,700,000 | | | | 5,896,867 | | | |
| | | | | | | | | | | | | | |
| | | | |
| | | | | | | | | | | 57,502,922 | | | |
| | | | | | | | | | | | | | |
| | | | |
Total Financials | | | | | | | | | | | 270,855,443 | | | |
| | | | | | | | | | | | | | |
| | | | |
Health Care - 1.0% | | | | | | | | | | | | | | |
Health Care Equipment & Supplies - 0.3% | | | | | | | | | | | | | | |
Alere, Inc.2, 6.50%, 6/15/2020 | | | Caa1 | | | | 795,000 | | | | 771,150 | | | |
Fresenius Medical Care US Finance, Inc. (Germany)2, 6.50%, 9/15/2018 | | | Ba2 | | | | 695,000 | | | | 755,813 | | | |
Fresenius US Finance II, Inc. (Germany)2, 9.00%, 7/15/2015 | | | Ba1 | | | | 445,000 | | | | 491,725 | | | |
| | | | | | | | | | | | | | |
| | | | |
| | | | | | | | | | | 2,018,688 | | | |
| | | | | | | | | | | | | | |
Health Care Providers & Services - 0.5% | | | | | | | | | | | | | | |
Express Scripts Holding Co., 4.75%, 11/15/2021 | | | Baa3 | | | | 2,885,000 | | | | 3,086,520 | | | |
Tenet Healthcare Corp.2, 4.50%, 4/1/2021 | | | Ba3 | | | | 405,000 | | | | 377,663 | | | |
| | | | | | | | | | | | | | |
| | | | |
| | | | | | | | | | | 3,464,183 | | | |
| | | | | | | | | | | | | | |
Pharmaceuticals - 0.2% | | | | | | | | | | | | | | |
Valeant Pharmaceuticals International2, 6.75%, 8/15/2021 | | | B1 | | | | 395,000 | | | | 395,494 | | | |
VPII Escrow Corp.2, 6.75%, 8/15/2018 | | | B1 | | | | 575,000 | | | | 589,375 | | | |
| | | | | | | | | | | | | | |
| | | | |
| | | | | | | | | | | 984,869 | | | |
| | | | | | | | | | | | | | |
| | | | |
Total Health Care | | | | | | | | | | | 6,467,740 | | | |
| | | | | | | | | | | | | | |
| | | | |
Industrials - 3.5% | | | | | | | | | | | | | | |
Aerospace & Defense - 1.0% | | | | | | | | | | | | | | |
Bombardier, Inc. (Canada)2, 4.25%, 1/15/2016 | | | Ba2 | | | | 365,000 | | | | 373,213 | | | |
The accompanying notes are an integral part of the financial statements.
7
Core Plus Bond Series
Investment Portfolio - June 30, 2013
(unaudited)
| | | | | | | | | | | | | | |
| | | CREDIT
RATING1
(UNAUDITED) | | | PRINCIPAL
AMOUNT | | | VALUE (NOTE 2) | | | |
| | | | |
CORPORATE BONDS (continued) | | | | | | | | | | | | | | |
| | | | |
Non-Convertible Corporate Bonds (continued) | | | | | | | | | | | | | | |
Industrials (continued) | | | | | | | | | | | | | | |
Aerospace & Defense (continued) | | | | | | | | | | | | | | |
Bombardier, Inc. (Canada)2, 6.125%, 1/15/2023 | | | Ba2 | | | $ | 580,000 | | | $ | 575,650 | | | |
DigitalGlobe, Inc.2, 5.25%, 2/1/2021 | | | B1 | | | | 365,000 | | | | 350,400 | | | |
Ducommun, Inc., 9.75%, 7/15/2018 | | | B3 | | | | 350,000 | | | | 382,375 | | | |
Textron, Inc., 7.25%, 10/1/2019 | | | Baa3 | | | | 3,790,000 | | | | 4,500,595 | | | |
| | | | | | | | | | | | | | |
| | | | |
| | | | | | | | | | | 6,182,233 | | | |
| | | | | | | | | | | | | | |
Air Freight & Logistics - 0.1% | | | | | | | | | | | | | | |
Aguila 3 S.A. (Luxembourg)2, 7.875%, 1/31/2018 | | | B2 | | | | 370,000 | | | | 381,100 | | | |
FedEx Corp., 8.00%, 1/15/2019 | | | Baa1 | | | | 435,000 | | | | 549,876 | | | |
| | | | | | | | | | | | | | |
| | | | |
| | | | | | | | | | | 930,976 | | | |
| | | | | | | | | | | | | | |
Airlines - 0.3% | | | | | | | | | | | | | | |
Aviation Capital Group Corp.2, 4.625%, 1/31/2018 | | | BB5 | | | | 360,000 | | | | 354,409 | | | |
Aviation Capital Group Corp.2, 6.75%, 4/6/2021 | | | BB5 | | | | 395,000 | | | | 415,997 | | | |
Delta Air Lines Pass-Through Trust, Series 2010-1, Class B, 6.375%, 1/2/2016 | | | Ba2 | | | | 165,000 | | | | 171,600 | | | |
Delta Air Lines Pass-Through Trust, Series 2010-2, Class B, 6.75%, 11/23/2015 | | | Ba3 | | | | 365,000 | | | | 376,862 | | | |
United Continental Holdings, Inc., 6.375%, 6/1/2018 | | | B2 | | | | 390,000 | | | | 383,175 | | | |
| | | | | | | | | | | | | | |
| | | | |
| | | | | | | | | | | 1,702,043 | | | |
| | | | | | | | | | | | | | |
Commercial Services & Supplies - 0.1% | | | | | | | | | | | | | | |
Clean Harbors, Inc., 5.25%, 8/1/2020 | | | Ba2 | | | | 365,000 | | | | 370,475 | | | |
Garda World Security Corp. (Canada)2, 9.75%, 3/15/2017 | | | B2 | | | | 380,000 | | | | 401,850 | | | |
| | | | | | | | | | | | | | |
| | | | |
| | | | | | | | | | | 772,325 | | | |
| | | | | | | | | | | | | | |
Industrial Conglomerates - 0.5% | | | | | | | | | | | | | | |
General Electric Co., 5.25%, 12/6/2017 | | | Aa3 | | | | 2,100,000 | | | | 2,371,209 | | | |
Tyco Electronics Group S.A. (Switzerland), 4.875%, 1/15/2021 | | | Baa2 | | | | 800,000 | | | | 852,727 | | | |
| | | | | | | | | | | | | | |
| | | | |
| | | | | | | | | | | 3,223,936 | | | |
| | | | | | | | | | | | | | |
Machinery - 0.5% | | | | | | | | | | | | | | |
Dynacast International LLC - Dynacast Finance, Inc., 9.25%, 7/15/2019 | | | B2 | | | | 535,000 | | | | 583,150 | | | |
Joy Global, Inc., 5.125%, 10/15/2021 | | | Baa2 | | | | 2,350,000 | | | | 2,495,832 | | | |
| | | | | | | | | | | | | | |
| | | | |
| | | | | | | | | | | 3,078,982 | | | |
| | | | | | | | | | | | | | |
Marine - 0.1% | | | | | | | | | | | | | | |
Navios Maritime Holdings, Inc. - Navios Maritime Finance US, Inc., 8.875%, 11/1/2017 | | | B1 | | | | 390,000 | | | | 403,650 | | | |
| | | | | | | | | | | | | | |
Professional Services - 0.0%* | | | | | | | | | | | | | | |
FTI Consulting, Inc.2, 6.00%, 11/15/2022 | | | Ba2 | | | | 360,000 | | | | 364,500 | | | |
| | | | | | | | | | | | | | |
Road & Rail - 0.8% | | | | | | | | | | | | | | |
Union Pacific Corp., 5.65%, 5/1/2017 | | | Baa1 | | | | 3,675,000 | | | | 4,146,150 | | | |
The accompanying notes are an integral part of the financial statements.
8
Core Plus Bond Series
Investment Portfolio - June 30, 2013
(unaudited)
| | | | | | | | | | | | | | |
| | | CREDIT
RATING1
(UNAUDITED) | | | PRINCIPAL
AMOUNT | | | VALUE (NOTE 2) | | | |
| | | | |
CORPORATE BONDS (continued) | | | | | | | | | | | | | | |
| | | | |
Non-Convertible Corporate Bonds (continued) | | | | | | | | | | | | | | |
Industrials (continued) | | | | | | | | | | | | | | |
Road & Rail (continued) | | | | | | | | | | | | | | |
Union Pacific Corp., 2.95%, 1/15/2023 | | | Baa1 | | | $ | 1,100,000 | | | $ | 1,059,257 | | | |
| | | | | | | | | | | | | | |
| | | | |
| | | | | | | | | | | 5,205,407 | | | |
| | | | | | | | | | | | | | |
Trading Companies & Distributors - 0.1% | | | | | | | | | | | | | | |
Rexel S.A. (France)2, 5.25%, 6/15/2020 | | | Ba3 | | | | 575,000 | | | | 573,563 | | | |
| | | | | | | | | | | | | | |
| | | | |
Total Industrials | | | | | | | | | | | 22,437,615 | | | |
| | | | | | | | | | | | | | |
| | | | |
Information Technology - 3.3% | | | | | | | | | | | | | | |
Communications Equipment - 0.1% | | | | | | | | | | | | | | |
Hughes Satellite Systems Corp., 6.50%, 6/15/2019 | | | Ba3 | | | | 325,000 | | | | 344,500 | | | |
ViaSat, Inc., 6.875%, 6/15/2020 | | | B2 | | | | 500,000 | | | | 527,500 | | | |
| | | | | | | | | | | | | | |
| | | | |
| | | | | | | | | | | 872,000 | | | |
| | | | | | | | | | | | | | |
Computers & Peripherals - 2.4% | | | | | | | | | | | | | | |
Apple, Inc., 2.40%, 5/3/2023 | | | Aa1 | | | | 1,690,000 | | | | 1,567,414 | | | |
EMC Corp., 2.65%, 6/1/2020 | | | A1 | | | | 7,435,000 | | | | 7,329,267 | | | |
Hewlett-Packard Co., 2.125%, 9/13/2015 | | | Baa1 | | | | 6,615,000 | | | | 6,694,949 | | | |
| | | | | | | | | | | | | | |
| | | | |
| | | | | | | | | | | 15,591,630 | | | |
| | | | | | | | | | | | | | |
Electronic Equipment, Instruments & Components - 0.1% | | | | | | | | | | | | | | |
CPI International, Inc., 8.00%, 2/15/2018 | | | B3 | | | | 390,000 | | | | 401,700 | | | |
| | | | | | | | | | | | | | |
Software - 0.7% | | | | | | | | | | | | | | |
Audatex North America, Inc.2, 6.00%, 6/15/2021 | | | Ba2 | | | | 550,000 | | | | 548,625 | | | |
Autodesk, Inc., 3.60%, 12/15/2022 | | | Baa2 | | | | 3,510,000 | | | | 3,350,172 | | | |
Interface Security Systems Holdings, Inc. - Interface Security Systems LLC2, 9.25%, 1/15/2018 | | | B3 | | | | 360,000 | | | | 367,200 | | | |
| | | | | | | | | | | | | | |
| | | | |
| | | | | | | | | | | 4,265,997 | | | |
| | | | | | | | | | | | | | |
| | | | |
Total Information Technology | | | | | | | | | | | 21,131,327 | | | |
| | | | | | | | | | | | | | |
| | | | |
Materials - 6.2% | | | | | | | | | | | | | | |
Chemicals - 0.8% | | | | | | | | | | | | | | |
Ashland, Inc.2, 3.875%, 4/15/2018 | | | Ba1 | | | | 580,000 | | | | 574,200 | | | |
Eastman Chemical Co., 3.60%, 8/15/2022 | | | Baa2 | | | | 3,000,000 | | | | 2,891,577 | | | |
Nufarm Australia Ltd. (Australia)2, 6.375%, 10/15/2019 | | | Ba3 | | | | 735,000 | | | | 733,163 | | | |
Rentech Nitrogen Partners LP - Rentech Nitrogen Finance Corp.2, 6.50%, 4/15/2021 | | | B1 | | | | 605,000 | | | | 598,950 | | | |
Trinseo Materials Operating SCA - Trinseo Materials Finance, Inc. (Luxembourg)2, 8.75%, 2/1/2019 | | | B1 | | | | 365,000 | | | | 348,575 | | | |
| | | | | | | | | | | | | | |
| | | | |
| | | | | | | | | | | 5,146,465 | | | |
| | | | | | | | | | | | | | |
Metals & Mining - 4.2% | | | | | | | | | | | | | | |
Allegheny Technologies, Inc., 5.95%, 1/15/2021 | | | Baa3 | | | | 5,185,000 | | | | 5,508,233 | | | |
BHP Billiton Finance (USA) Ltd. (Australia), 6.50%, 4/1/2019 | | | A1 | | | | 3,230,000 | | | | 3,866,992 | | | |
Cliffs Natural Resources, Inc., 5.90%, 3/15/2020 | | | Baa3 | | | | 500,000 | | | | 481,804 | | | |
The accompanying notes are an integral part of the financial statements.
9
Core Plus Bond Series
Investment Portfolio - June 30, 2013
(unaudited)
| | | | | | | | | | | | | | |
| | | CREDIT
RATING1
(UNAUDITED) | | | PRINCIPAL
AMOUNT | | | VALUE (NOTE 2) | | | |
| | | | |
CORPORATE BONDS (continued) | | | | | | | | | | | | | | |
| | | | |
Non-Convertible Corporate Bonds (continued) | | | | | | | | | | | | | | |
Materials (continued) | | | | | | | | | | | | | | |
Metals & Mining (continued) | | | | | | | | | | | | | | |
Cliffs Natural Resources, Inc., 4.80%, 10/1/2020 | | | Baa3 | | | $ | 1,000,000 | | | $ | 901,396 | | | |
Freeport-McMoRan Copper & Gold, Inc.2, 2.375%, 3/15/2018 | | | Baa3 | | | | 2,350,000 | | | | 2,235,029 | | | |
Freeport-McMoRan Copper & Gold, Inc., 3.55%, 3/1/2022 | | | Baa3 | | | | 2,925,000 | | | | 2,656,944 | | | |
Rio Tinto Finance USA Ltd. (Australia), 3.75%, 9/20/2021 | | | A3 | | | | 4,000,000 | | | | 3,950,184 | | | |
Rio Tinto Finance USA plc (United Kingdom), 1.375%, 6/17/2016 | | | A3 | | | | 3,900,000 | | | | 3,876,518 | | | |
Shale-Inland Holdings LLC - Shale-Inland Finance Corp.2, 8.75%, 11/15/2019 | | | B3 | | | | 375,000 | | | | 382,500 | | | |
Teck Resources Ltd. (Canada), 3.00%, 3/1/2019 | | | Baa2 | | | | 3,010,000 | | | | 2,926,792 | | | |
| | | | | | | | | | | | | | |
| | | | |
| | | | | | | | | | | 26,786,392 | | | |
| | | | | | | | | | | | | | |
Paper & Forest Products - 1.2% | | | | | | | | | | | | | | |
International Paper Co., 7.50%, 8/15/2021 | | | Baa3 | | | | 5,330,000 | | | | 6,541,930 | | | |
Smurfit Kappa Acquisitions (Ireland)2, 4.875%, 9/15/2018 | | | Ba2 | | | | 940,000 | | | | 911,800 | | | |
| | | | | | | | | | | | | | |
| | | | |
| | | | | | | | | | | 7,453,730 | | | |
| | | | | | | | | | | | | | |
| | | | |
Total Materials | | | | | | | | | | | 39,386,587 | | | |
| | | | | | | | | | | | | | |
| | | | |
Telecommunication Services - 4.6% | | | | | | | | | | | | | | |
Diversified Telecommunication Services - 2.1% | | | | | | | | | | | | | | |
Digicel Ltd. (Jamaica)2, 6.00%, 4/15/2021 | | | B1 | | | | 585,000 | | | | 552,825 | | | |
Inmarsat Finance plc (United Kingdom)2, 7.375%, 12/1/2017 | | | Ba2 | | | | 295,000 | | | | 306,800 | | | |
Telefonica Emisiones S.A.U. (Spain), 3.192%, 4/27/2018 | | | Baa2 | | | | 6,485,000 | | | | 6,281,423 | | | |
UPCB Finance VI Ltd. (Netherlands)2, 6.875%, 1/15/2022 | | | Ba3 | | | | 410,000 | | | | 424,350 | | | |
Verizon Communications, Inc., 2.00%, 11/1/2016 | | | A3 | | | | 3,000,000 | | | | 3,056,898 | | | |
Verizon Communications, Inc., 8.75%, 11/1/2018 | | | A3 | | | | 1,386,000 | | | | 1,806,429 | | | |
Windstream Corp., 7.50%, 6/1/2022 | | | B1 | | | | 665,000 | | | | 678,300 | | | |
| | | | | | | | | | | | | | |
| | | | |
| | | | | | | | | | | 13,107,025 | | | |
| | | | | | | | | | | | | | |
Wireless Telecommunication Services - 2.5% | | | | | | | | | | | | | | |
America Movil SAB de C.V. (Mexico), 5.00%, 3/30/2020 | | | A2 | | | | 4,980,000 | | | | 5,344,984 | | | |
Crown Castle Towers LLC2, 6.113%, 1/15/2020 | | | A2 | | | | 4,070,000 | | | | 4,670,223 | | | |
Crown Castle Towers LLC2, 4.883%, 8/15/2020 | | | A2 | | | | 610,000 | | | | 655,953 | | | |
SBA Tower Trust2, 5.101%, 4/17/2017 | | | A2 | | | | 2,095,000 | | | | 2,291,291 | | | |
SBA Tower Trust2, 2.933%, 12/15/2017 | | | A2 | | | | 1,515,000 | | | | 1,528,886 | | | |
SBA Tower Trust2, 3.598%, 4/15/2018 | | | Baa3 | | | | 1,640,000 | | | | 1,622,755 | | | |
| | | | | | | | | | | | | | |
| | | | |
| | | | | | | | | | | 16,114,092 | | | |
| | | | | | | | | | | | | | |
| | | | |
Total Telecommunication Services | | | | | | | | | | | 29,221,117 | | | |
| | | | | | | | | | | | | | |
| | | | |
Utilities - 0.8% | | | | | | | | | | | | | | |
Electric Utilities - 0.5% | | | | | | | | | | | | | | |
System Energy Resources, Inc., 4.10%, 4/1/2023 | | | Baa1 | | | | 3,110,000 | | | | 3,090,522 | | | |
| | | | | | | | | | | | | | |
Gas Utilities - 0.3% | | | | | | | | | | | | | | |
National Fuel Gas Co., 3.75%, 3/1/2023 | | | Baa1 | | | | 2,000,000 | | | | 1,924,674 | | | |
| | | | | | | | | | | | | | |
The accompanying notes are an integral part of the financial statements.
10
Core Plus Bond Series
Investment Portfolio - June 30, 2013
(unaudited)
| | | | | | | | | | | | | | |
| | | CREDIT
RATING1
(UNAUDITED) | | | PRINCIPAL
AMOUNT/
SHARES | | | VALUE (NOTE 2) | | | |
| | | | |
CORPORATE BONDS (continued) | | | | | | | | | | | | | | |
| | | | |
Non-Convertible Corporate Bonds (continued) | | | | | | | | | | | | | | |
Utilities (continued) | | | | | | | | | | | | | | |
Independent Power Producers & Energy Traders - 0.0%* | | | | | | | | | | | | | | |
NRG Energy, Inc., 7.875%, 5/15/2021 | | | B1 | | | $ | 350,000 | | | $ | 373,625 | | | |
| | | | | | | | | | | | | | |
| | | | |
Total Utilities | | | | | | | | | | | 5,388,821 | | | |
| | | | | | | | | | | | | | |
Total Non-Convertible Corporate Bonds | | | | | | | | | | | | | | |
(Identified Cost $473,066,976) | | | | | | | | | | | 490,865,074 | | | |
| | | | | | | | | | | | | | |
| | | | | | | | | | | | | | |
TOTAL CORPORATE BONDS | | | | | | | | | | | | | | |
(Identified Cost $475,827,913) | | | | | | | | | | | 493,738,824 | | | |
| | | | | | | | | | | | | | |
| | | | |
PREFERRED STOCKS - 3.1% | | | | | | | | | | | | | | |
| | | | |
Financials - 3.1% | | | | | | | | | | | | | | |
Commercial Banks - 1.4% | | | | | | | | | | | | | | |
BB&T Corp., Series D (non-cumulative), 5.85% | | | Baa2 | | | | 119,980 | | | | 3,006,699 | | | |
PNC Financial Services Group, Inc., Series Q (non-cumulative), 5.375% | | | Baa3 | | | | 123,550 | | | | 2,996,087 | | | |
U.S. Bancorp., Series F (non-cumulative), 6.50%6 | | | Baa1 | | | | 114,010 | | | | 3,203,681 | | | |
| | | | | | | | | | | | | | |
| | | | |
| | | | | | | | | | | 9,206,467 | | | |
| | | | | | | | | | | | | | |
Diversified Financial Services - 0.5% | | | | | | | | | | | | | | |
JPMorgan Chase & Co., Series P (non-cumulative), 5.45% | | | Ba1 | | | | 126,000 | | | | 3,002,580 | | | |
| | | | | | | | | | | | | | |
Real Estate Investment Trusts (REITS) - 1.2% | | | | | | | | | | | | | | |
Boston Properties, Inc., Series F, 5.25% | | | Baa3 | | | | 132,000 | | | | 3,177,240 | | | |
National Retail Properties, Inc., 5.70% | | | Baa3 | | | | 70,000 | | | | 1,677,900 | | | |
Public Storage, Series Q, 6.50% | | | A3 | | | | 109,100 | | | | 2,804,961 | | | |
| | | | | | | | | | | | | | |
| | | | |
| | | | | | | | | | | 7,660,101 | | | |
| | | | | | | | | | | | | | |
| | | | | | | | | | | | | | |
TOTAL PREFERRED STOCKS | | | | | | | | | | | | | | |
(Identified Cost $19,835,173) | | | | | | | | | | | 19,869,148 | | | |
| | | | | | | | | | | | | | |
| | | | |
ASSET-BACKED SECURITIES - 1.0% | | | | | | | | | | | | | | |
FDIC Trust, Series 2011-R1, Class A2, 2.672%, 7/25/2026 | | | WR3 | | | $ | 848,832 | | | | 874,745 | | | |
Hertz Vehicle Financing LLC, Series 2009-2A, Class A22, 5.29%, 3/25/2016 | | | Aaa | | | | 2,585,000 | | | | 2,744,138 | | | |
Hertz Vehicle Financing LLC, Series 2010-1A, Class A22, 3.74%, 2/25/2017 | | | Aaa | | | | 2,360,000 | | | | 2,478,696 | | | |
SLM Student Loan Trust, Series 2002-4, Class A44, 0.413%, 3/15/2017 | | | Aaa | | | | 86,173 | | | | 85,855 | | | |
| | | | | | | | | | | | | | |
| | | | | | | | | | | | | | |
TOTAL ASSET-BACKED SECURITIES | | | | | | | | | | | | | | |
(Identified Cost $5,878,478) | | | | | | | | | | | 6,183,434 | | | |
| | | | | | | | | | | | | | |
| | | | |
COMMERCIAL MORTGAGE-BACKED SECURITIES - 6.6% | | | | | | | | | | | | | | |
Americold LLC Trust, Series 2010-ARTA, Class A12, 3.847%, 1/14/2029 | | | AAA5 | | | | 348,692 | | | | 363,447 | | | |
BAMLL Commercial Mortgage Securities Trust, Series 2012-PARK, Class A2, 2.959%, 12/10/2030 | | | AAA5 | | | | 745,000 | | | | 699,025 | | | |
The accompanying notes are an integral part of the financial statements.
11
Core Plus Bond Series
Investment Portfolio - June 30, 2013
(unaudited)
| | | | | | | | | | | | | | |
| | | CREDIT
RATING1
(UNAUDITED) | | | PRINCIPAL
AMOUNT | | | VALUE
(NOTE 2) | | | |
| | | | |
COMMERCIAL MORTGAGE-BACKED SECURITIES (continued) | | | | | | | | | | | | | | |
| | | | |
Banc of America Commercial Mortgage Trust, Series 2006-2, Class A44, 5.73%, 5/10/2045 | | | AAA5 | | | $ | 700,000 | | | $ | 772,967 | | | |
Banc of America Commercial Mortgage Trust, Series 2006-4, Class A4, 5.634%, 7/10/2046 | | | Aaa | | | | 335,000 | | | | 367,603 | | | |
Bear Stearns Commercial Mortgage Securities Trust, Series 2005-PWR9, Class A4A, 4.871%, 9/11/2042 | | | Aaa | | | | 715,000 | | | | 762,068 | | | |
Bear Stearns Commercial Mortgage Securities Trust, Series 2006-PW12, Class A44, 5.715%, 9/11/2038 | | | Aaa | | | | 1,010,000 | | | | 1,114,907 | | | |
Bear Stearns Commercial Mortgage Securities Trust, Series 2006-PW13, Class A4, 5.54%, 9/11/2041 | | | AAA5 | | | | 650,000 | | | | 718,774 | | | |
CFCRE Commercial Mortgage Trust, Series 2011-C1, Class A22, 3.759%, 4/15/2044 | | | Aaa | | | | 240,000 | | | | 252,678 | | | |
Citigroup - Deutsche Bank Commercial Mortgage Trust, Series 2005-CD1, Class A44, 5.218%, 7/15/2044 | | | Aaa | | | | 500,000 | | | | 537,098 | | | |
Commercial Mortgage Pass-Through Certificates, Series 2010-C1, Class A12, 3.156%, 7/10/2046 | | | Aaa | | | | 1,180,941 | | | | 1,227,057 | | | |
Commercial Mortgage Pass-Through Certificates, Series 2012-CR4, Class A3, 2.853%, 10/15/2045 | | | Aaa | | | | 1,055,000 | | | | 974,915 | | | |
Commercial Mortgage Trust, Series 2006-GG7, Class A44, 5.86%, 7/10/2038 | | | Aaa | | | | 1,695,000 | | | | 1,878,828 | | | |
Credit Suisse Commercial Mortgage Trust, Series 2013-IVR3, Class A12,4, 2.50%, 5/25/2043 | | | AAA5 | | | | 1,586,924 | | | | 1,516,150 | | | |
Credit Suisse Mortgage Capital Certificates, Series 2013-TH1, Class A12,4, 2.13%, 2/25/2043 | | | AAA5 | | | | 1,518,329 | | | | 1,427,361 | | | |
Extended Stay America Trust, Series 2013-ESH7, Class A272, 2.958%, 12/5/2031 | | | Aaa | | | | 1,500,000 | | | | 1,455,841 | | | |
Fannie Mae Multifamily REMIC Trust, Series 2012-M13, Class A2, 2.377%, 5/25/2022 | | | WR3 | | | | 1,400,000 | | | | 1,326,699 | | | |
Fannie Mae Multifamily REMIC Trust, Series 2012-M13, Class ASQ2, 1.246%, 8/25/2017 | | | WR3 | | | | 1,325,000 | | | | 1,308,249 | | | |
Freddie Mac Multifamily Structured Pass-Through Certificates, Series K-P01, Class A2, 1.72%, 1/25/2019 | | | WR3 | | | | 1,480,000 | | | | 1,462,228 | | | |
FREMF Mortgage Trust, Series 2011-K701, Class B2,4, 4.286%, 7/25/2048 | | | A5 | | | | 950,000 | | | | 967,774 | | | |
FREMF Mortgage Trust, Series 2011-K702, Class B2,4, 4.77%, 4/25/2044 | | | A3 | | | | 230,000 | | | | 238,555 | | | |
JP Morgan Chase Commercial Mortgage Securities Corp., Series 2005-CB13, Class A44, 5.294%, 1/12/2043 | | | Aaa | | | | 850,000 | | | | 918,451 | | | |
JP Morgan Chase Commercial Mortgage Securities Corp., Series 2005-LDP5, Class A44, 5.20%, 12/15/2044 | | | Aaa | | | | 1,670,000 | | | | 1,802,165 | | | |
JP Morgan Chase Commercial Mortgage Securities Corp., Series 2006-LDP7, Class A44, 5.863%, 4/15/2045 | | | Aaa | | | | 1,075,000 | | | | 1,187,706 | | | |
JP Morgan Chase Commercial Mortgage Securities Corp., Series 2010-C2, Class A32, 4.07%, 11/15/2043 | | | AAA5 | | | | 750,000 | | | | 789,261 | | | |
JP Morgan Mortgage Trust, Series 2013-1, Class 1A22,4, 3.00%, 3/25/2043 | | | WR3 | | | | 1,395,058 | | | | 1,381,200 | | | |
The accompanying notes are an integral part of the financial statements.
12
Core Plus Bond Series
Investment Portfolio - June 30, 2013
(unaudited)
| | | | | | | | | | | | | | |
| | | CREDIT RATING 1 (UNAUDITED) | | | PRINCIPAL AMOUNT/ SHARES | | | VALUE (NOTE 2) | | | |
| | | |
COMMERCIAL MORTGAGE-BACKED SECURITIES (continued) | | | | | | | | | | | |
| | | | |
JP Morgan Mortgage Trust, Series 2013-2, Class A22,4, 3.50%, 5/25/2043 | | | AAA5 | | | $ | 1,559,434 | | | $ | 1,523,478 | | | |
Morgan Stanley Bank of America Merrill Lynch Trust, Series 2012-C5 Class A4, 3.176%, 8/15/2045 | | | Aaa | | | | 1,505,000 | | | | 1,443,569 | | | |
Morgan Stanley Capital I Trust, Series 2005-IQ10, Class A4A4, 5.23%, 9/15/2042 | | | Aaa | | | | 205,467 | | | | 218,912 | | | |
Morgan Stanley Capital I Trust, Series 2011-C1, Class A22, 3.884%, 9/15/2047 | | | AAA5 | | | | 200,000 | | | | 211,774 | | | |
Motel 6 Trust, Series 2012-MTL6, Class A22, 1.948%, 10/5/2025 | | | AAA5 | | | | 1,055,000 | | | | 1,034,365 | | | |
OBP Depositor LLC Trust, Series 2010-OBP, Class A2, 4.646%, 7/15/2045 | | | AAA5 | | | | 420,000 | | | | 455,432 | | | |
Sequoia Mortgage Trust, Series 2011-2, Class A14, 3.90%, 9/25/2041 | | | WR3 | | | | 1,240,098 | | | | 1,231,867 | | | |
Sequoia Mortgage Trust, Series 2013-2, Class A14, 1.874%, 2/25/2043 | | | AAA5 | | | | 1,384,642 | | | | 1,248,252 | | | |
Sequoia Mortgage Trust, Series 2013-7, Class A24, 3.00%, 6/25/2043 | | | AAA5 | | | | 1,027,868 | | | | 970,425 | | | |
Sequoia Mortgage Trust, Series 2013-8, Class A14, 3.00%, 6/25/2043 | | | Aaa | | | | 1,424,000 | | | | 1,342,897 | | | |
Vornado DP LLC Trust, Series 2010-VNO, Class A2FX2, 4.004%, 9/13/2028 | | | AAA5 | | | | 1,195,000 | | | | 1,245,417 | | | |
Wachovia Bank Commercial Mortgage Trust, Series 2005-C21, Class A44, 5.239%, 10/15/2044 | | | Aaa | | | | 1,060,032 | | | | 1,139,650 | | | |
Wachovia Bank Commercial Mortgage Trust, Series 2006-C26, Class A34, 6.011%, 6/15/2045 | | | Aaa | | | | 1,220,000 | | | | 1,357,883 | | | |
Wells Fargo Commercial Mortgage Trust, Series 2010-C1, Class A22, 4.393%, 11/15/2043 | | | Aaa | | | | 1,350,000 | | | | 1,424,863 | | | |
Wells Fargo Commercial Mortgage Trust, Series 2012-LC5, Class A3, 2.918%, 10/15/2045 | | | Aaa | | | | 1,915,000 | | | | 1,793,644 | | | |
| | | | | | | | | | | | | | |
| | | | | | | | | | | | | | |
TOTAL COMMERCIAL MORTGAGE-BACKED SECURITIES | | | | | | | | | | | | | | |
(Identified Cost $42,707,919) | | | | | | | | | | | 42,093,435 | | | |
| | | | | | | | | | | | | | |
| | | | |
FOREIGN GOVERNMENT BONDS - 2.1% | | | | | | | | | | | | | | |
| | | | |
Brazilian Government Bond (Brazil), 8.875%, 10/14/2019 | | | Baa2 | | | | 1,300,000 | | | | 1,709,500 | | | |
Chile Government Bond (Chile), 3.25%, 9/14/2021 | | | Aa3 | | | | 3,200,000 | | | | 3,200,000 | | | |
Malaysia Government Bond (Malaysia), 4.262%, 9/15/2016 | | | A3 | | | MYR | 8,905,000 | | | | 2,890,967 | | | |
Mexican Government Bond (Mexico), 8.00%, 12/17/2015 | | | Baa1 | | | MXN | 55,455,000 | | | | 4,628,066 | | | |
Russian Foreign Bond - Eurobond (Russia), 5.00%, 4/29/2020 | | | Baa1 | | | | 1,000,000 | | | | 1,070,000 | | | |
| | | | | | | | | | | | | | |
| | | | | | | | | | | | | | |
TOTAL FOREIGN GOVERNMENT BONDS | | | | | | | | | | | | | | |
(Identified Cost $13,643,600) | | | | | | | | | | | 13,498,533 | | | |
| | | | | | | | | | | | | | |
| | | | |
MUTUAL FUND - 0.0%* | | | | | | | | | | | | | | |
| | | | |
John Hancock Preferred Income Fund | | | | | | | | | | | | | | |
(Identified Cost $139,390) | | | | | | | 10,500 | | | | 218,505 | | | |
| | | | | | | | | | | | | | |
The accompanying notes are an integral part of the financial statements.
13
Core Plus Bond Series
Investment Portfolio - June 30, 2013
(unaudited)
| | | | | | | | | | |
| | | PRINCIPAL
AMOUNT | | | VALUE
(NOTE 2) | | | |
| | | |
U.S. GOVERNMENT AGENCIES - 6.8% | | | | | | | | | | |
| | | |
Mortgage-Backed Securities - 6.8% | | | | | | | | | | |
Fannie Mae, Pool #888468, 5.50%, 9/1/2021 | | $ | 1,858,645 | | | $ | 2,004,544 | | | |
Fannie Mae, Pool #995233, 5.50%, 10/1/2021 | | | 153,682 | | | | 165,788 | | | |
Fannie Mae, Pool #888017, 6.00%, 11/1/2021 | | | 170,426 | | | | 186,973 | | | |
Fannie Mae, Pool #995329, 5.50%, 12/1/2021 | | | 1,193,257 | | | | 1,287,298 | | | |
Fannie Mae, Pool #888136, 6.00%, 12/1/2021 | | | 219,986 | | | | 241,325 | | | |
Fannie Mae, Pool #888810, 5.50%, 11/1/2022 | | | 2,088,612 | | | | 2,253,737 | | | |
Fannie Mae, Pool #AD0462, 5.50%, 10/1/2024 | | | 127,778 | | | | 137,905 | | | |
Fannie Mae, Pool #AB4086, 3.00%, 12/1/2026 | | | 1,430,892 | | | | 1,473,416 | | | |
Fannie Mae, Pool #AJ7717, 3.00%, 12/1/2026 | | | 1,735,768 | | | | 1,787,423 | | | |
Fannie Mae, Pool #AK0726, 3.00%, 2/1/2027 | | | 703,860 | | | | 724,664 | | | |
Fannie Mae, Pool #AK4747, 3.50%, 3/1/2027 | | | 679,851 | | | | 709,026 | | | |
Fannie Mae, Pool #AB5970, 3.00%, 8/1/2027 | | | 1,994,885 | | | | 2,055,989 | | | |
Fannie Mae, Pool #AL3299, 3.00%, 2/1/2028 | | | 1,443,340 | | | | 1,486,732 | | | |
Fannie Mae, Pool #AL3586, 3.00%, 3/1/2028 | | | 979,434 | | | | 1,009,936 | | | |
Fannie Mae, Pool #MA1453, 3.00%, 5/1/2028 | | | 742,898 | | | | 765,784 | | | |
Fannie Mae, Pool #AT9599, 3.00%, 6/1/2028 | | | 318,617 | | | | 328,431 | | | |
Fannie Mae, Pool #918516, 5.50%, 6/1/2037 | | | 808,435 | | | | 876,796 | | | |
Fannie Mae, Pool #995876, 6.00%, 11/1/2038 | | | 2,798,341 | | | | 3,041,088 | | | |
Fannie Mae, Pool #AO8298, 3.50%, 8/1/2042 | | | 1,093,524 | | | | 1,112,261 | | | |
Fannie Mae, Pool #AB6228, 3.50%, 9/1/2042 | | | 1,096,278 | | | | 1,116,448 | | | |
Fannie Mae, Pool #AL3454, 3.00%, 4/1/2043 | | | 1,516,025 | | | | 1,483,329 | | | |
Fannie Mae, Pool #AT3045, 3.00%, 4/1/2043 | | | 347,805 | | | | 340,342 | | | |
Fannie Mae, Pool #AL3499, 3.50%, 5/1/2043 | | | 575,579 | | | | 585,466 | | | |
Fannie Mae, Pool #AB9782, 3.00%, 7/1/2043 | | | 798,047 | | | | 780,913 | | | |
Fannie Mae, Pool #MA1489, 3.00%, 7/1/2043 | | | 725,497 | | | | 709,827 | | | |
Freddie Mac, Pool #G11850, 5.50%, 7/1/2020 | | | 706,234 | | | | 765,575 | | | |
Freddie Mac, Pool #G12610, 6.00%, 3/1/2022 | | | 208,745 | | | | 228,356 | | | |
Freddie Mac, Pool #G12655, 6.00%, 5/1/2022 | | | 155,008 | | | | 169,570 | | | |
Freddie Mac, Pool #J19935, 2.50%, 8/1/2022 | | | 1,386,259 | | | | 1,414,587 | | | |
Freddie Mac, Pool #G12988, 6.00%, 1/1/2023 | | | 118,854 | | | | 130,542 | | | |
Freddie Mac, Pool #G13078, 6.00%, 3/1/2023 | | | 210,189 | | | | 231,536 | | | |
Freddie Mac, Pool #G13331, 5.50%, 10/1/2023 | | | 93,828 | | | | 101,585 | | | |
Freddie Mac, Pool #J16679, 3.00%, 9/1/2026 | | | 1,089,620 | | | | 1,123,126 | | | |
Freddie Mac, Pool #G04176, 5.50%, 5/1/2038 | | | 1,141,362 | | | | 1,226,167 | | | |
Freddie Mac, Pool #A78227, 5.50%, 6/1/2038 | | | 1,044,173 | | | | 1,121,757 | | | |
Freddie Mac, Pool #G05671, 5.50%, 8/1/2038 | | | 108,147 | | | | 116,445 | | | |
Freddie Mac, Pool #G05900, 6.00%, 3/1/2040 | | | 816,374 | | | | 885,500 | | | |
Freddie Mac, Pool #C03815, 3.50%, 3/1/2042 | | | 355,482 | | | | 360,832 | | | |
Freddie Mac, Pool #G07213, 3.50%, 11/1/2042 | | | 975,759 | | | | 991,309 | | | |
Freddie Mac, Pool #C09026, 2.50%, 2/1/2043 | | | 1,517,584 | | | | 1,404,360 | | | |
Freddie Mac, Pool #V80002, 2.50%, 4/1/2043 | | | 1,871,428 | | | | 1,731,804 | | | |
Freddie Mac, Pool #Q19115, 3.00%, 6/1/2043 | | | 777,148 | | | | 759,306 | | | |
Freddie Mac, Pool #Q19118, 3.50%, 6/1/2043 | | | 1,450,996 | | | | 1,474,236 | | | |
The accompanying notes are an integral part of the financial statements.
14
Core Plus Bond Series
Investment Portfolio - June 30, 2013
(unaudited)
| | | | | | | | | | |
| | | PRINCIPAL
AMOUNT/
SHARES | | | VALUE (NOTE 2) | | | |
| | | |
U.S. GOVERNMENT AGENCIES (continued) | | | | | | | | | | |
| | | |
Mortgage-Backed Securities (continued) | | | | | | | | | | |
Freddie Mac, Pool #Q19121, 3.50%, 6/1/2043 | | $ | 1,450,996 | | | $ | 1,472,887 | | | |
Freddie Mac, Pool #V80160, 3.50%, 6/1/2043 | | | 870,597 | | | | 883,618 | | | |
Freddie Mac, Pool #C09044, 3.50%, 7/1/2043 | | | 580,398 | | | | 588,998 | | | |
| | | | | | | | | | |
| | | | | | | | | | |
TOTAL U.S. GOVERNMENT AGENCIES
(Identified Cost $44,166,228) | | | | | | | 43,847,537 | | | |
| | | | | | | | | | |
| | | | | | | | | | |
SHORT-TERM INVESTMENT - 0.6% | | | | | | | | | | |
| | | |
Dreyfus Cash Management, Inc. - Institutional Shares7, 0.05%, | | | | | | | | | | |
(Identified Cost $3,608,880) | | | 3,608,880 | | | | 3,608,880 | | | |
| | | | | | | | | | |
TOTAL INVESTMENTS - 97.3% | | | | | | | | | | |
(Identified Cost $605,807,581) | | | | | | | 623,058,296 | | | |
OTHER ASSETS, LESS LIABILITIES - 2.7% | | | | | | | 17,235,796 | | | |
| | | | | | | | | | |
| | | |
NET ASSETS - 100% | | | | | | $ | 640,294,092 | | | |
| | | | | | | | | | |
*Less than 0.1%
MXN - Mexican Peso
MYR - Malaysian Ringgit
1Credit ratings from Moody’s (unaudited).
2Restricted securities - Investment in securities that are restricted as to public resale under the Securities Act of 1933, as amended. These securities have been sold under rule 144A and have been determined to be liquid under guidelines established by the Board of Directors. These securities amount to $96,614,360, or 15.1%, of the Series’ net assets as of June 30, 2013 (see Note 2 to the financial statements).
3Credit rating has been withdrawn. As of June 30, 2013, there is no rating available (unaudited).
4The coupon rate is floating and is the effective rate as of June 30, 2013.
5Credit ratings from S&P (unaudited).
6The rate shown is a fixed rate as of June 30, 2013; the rate becomes floating, based on LIBOR plus a spread, in 2022.
7Rate shown is the current yield as of June 30, 2013.
The accompanying notes are an integral part of the financial statements.
15
Core Plus Bond Series
Statement of Assets and Liabilities
June 30, 2013 (unaudited)
| | | | |
ASSETS: | | | | |
| |
Investments, at value (identified cost $605,807,581) (Note 2) | | $ | 623,058,296 | |
Interest receivable | | | 6,340,139 | |
Receivable for fund shares sold | | | 748,645 | |
Dividends receivable | | | 46,791 | |
Receivable for securities sold | | | 19,590,046 | |
Prepaid expenses | | | 2,036 | |
| | | | |
| |
TOTAL ASSETS | | | 649,785,953 | |
| | | | |
| |
LIABILITIES: | | | | |
| |
Accrued management fees (Note 3) | | | 377,569 | |
Accrued fund accounting and administration fees (Note 3) | | | 22,558 | |
Accrued transfer agent fees (Note 3) | | | 1,828 | |
Accrued Chief Compliance Officer service fees (Note 3) | | | 339 | |
Payable for securities purchased | | | 8,143,942 | |
Payable for fund shares repurchased | | | 881,015 | |
Other payables and accrued expenses | | | 64,610 | |
| | | | |
| |
TOTAL LIABILITIES | | | 9,491,861 | |
| | | | |
| |
TOTAL NET ASSETS | | $ | 640,294,092 | |
| | | | |
| |
NET ASSETS CONSIST OF: | | | | |
| |
Capital stock | | $ | 586,537 | |
Additional paid-in-capital | | | 605,872,658 | |
Undistributed net investment income | | | 2,151,623 | |
Accumulated net realized gain on investments, foreign currency and translation of other assets and liabilities | | | 14,433,102 | |
Net unrealized appreciation on investments, foreign currency and translation of other assets and liabilities | | | 17,250,172 | |
| | | | |
| |
TOTAL NET ASSETS | | $ | 640,294,092 | |
| | | | |
| |
NET ASSET VALUE, OFFERING PRICE AND REDEMPTION PRICE PER SHARE - Class A ($640,294,092/58,653,708 shares) | | $ | 10.92 | |
| | | | |
The accompanying notes are an integral part of the financial statements.
16
Core Plus Bond Series
Statement of Operations
For the Six Months Ended June 30, 2013 (unaudited)
| | | | |
INVESTMENT INCOME: | | | | |
| |
Interest | | $ | 12,957,575 | |
Dividends (net of foreign taxes withheld, $6,612) | | | 456,482 | |
| | | | |
| |
Total Investment Income | | | 13,414,057 | |
| | | | |
| |
EXPENSES: | | | | |
| |
Management fees (Note 3) | | | 2,280,483 | |
Fund accounting and administration fees (Note 3) | | | 66,517 | |
Transfer agent fees (Note 3) | | | 8,117 | |
Directors’ fees (Note 3) | | | 7,230 | |
Chief Compliance Officer service fees (Note 3) | | | 1,117 | |
Custodian fees | | | 17,929 | |
Miscellaneous | | | 64,522 | |
| | | | |
| |
Total Expenses | | | 2,445,915 | |
| | | | |
| |
NET INVESTMENT INCOME | | | 10,968,142 | |
| | | | |
| |
REALIZED AND UNREALIZED GAIN (LOSS) ON INVESTMENTS AND FOREIGN CURRENCY: | | | | |
| |
Net realized gain on-
Investments | | | 11,036,881 | |
Foreign currency transactions and translation of other assets and liabilities | | | 145,938 | |
| | | | |
| |
| | | 11,182,819 | |
| | | | |
| |
Net change in unrealized appreciation (depreciation) on-
Investments | | | (34,639,776 | ) |
Foreign currency and translation of other assets and liabilities | | | (3,963 | ) |
| | | | |
| |
| | | (34,643,739 | ) |
| | | | |
| |
NET REALIZED AND UNREALIZED GAIN (LOSS) ON INVESTMENTS AND FOREIGN CURRENCY | | | (23,460,920 | ) |
| | | | |
| |
NET DECREASE IN NET ASSETS RESULTING FROM OPERATIONS | | $ | (12,492,778 | ) |
| | | | |
The accompanying notes are an integral part of the financial statements.
17
Core Plus Bond Series
Statements of Changes in Net Assets
| | | | | | | | |
| | | FOR THE SIX
MONTHS ENDED
6/30/13
(UNAUDITED) | | | FOR THE YEAR ENDED
12/31/12 | |
INCREASE (DECREASE) IN NET ASSETS: | | | | | | | | |
| | |
OPERATIONS: | | | | | | | | |
| | |
Net investment income | | $ | 10,968,142 | | | $ | 24,482,037 | |
Net realized gain on investments and foreign currency | | | 11,182,819 | | | | 8,013,825 | |
Net change in unrealized appreciation (depreciation) on investments and foreign currency | | | (34,643,739 | ) | | | 30,148,362 | |
| | | | | | | | |
| | |
Net increase (decrease) from operations | | | (12,492,778 | ) | | | 62,644,224 | |
| | | | | | | | |
| | |
DISTRIBUTIONS TO SHAREHOLDERS (Note 8): | | | | | | | | |
| | |
From net investment income | | | (8,763,707 | ) | | | (24,561,572 | ) |
From net realized gain on investments | | | — | | | | (5,701,872 | ) |
| | | | | | | | |
| | |
Total distributions to shareholders | | | (8,763,707 | ) | | | (30,263,444 | ) |
| | | | | | | | |
| | |
CAPITAL STOCK ISSUED AND REPURCHASED: | | | | | | | | |
| | |
Net increase from capital share transactions (Note 5) | | | 30,469,019 | | | | 29,117,332 | |
| | | | | | | | |
| | |
Net increase in net assets | | | 9,212,534 | | | | 61,498,112 | |
| | |
NET ASSETS: | | | | | | | | |
| | |
Beginning of period | | | 631,081,558 | | | | 569,583,446 | |
| | | | | | | | |
| | |
End of period (including undistributed net investment income of $2,151,623 and distribution in excess of net investment income $52,812, respectively) | | $ | 640,294,092 | | | $ | 631,081,558 | |
| | | | | | | | |
The accompanying notes are an integral part of the financial statements.
18
Core Plus Bond Series
Financial Highlights
| | | | | | | | | | | | | | | | | | | | | | | | |
| | | FOR THE SIX
MONTHS ENDED
6/30/2013
(UNAUDITED) | | | FOR THE YEARS ENDED | |
| | | 12/31/12 | | | 12/31/11 | | | 12/31/10 | | | 12/31/09 | | | 12/31/08 | |
Per share data (for a share outstanding throughout each period): | | | | | | | | | | | | | | | | | | | | | | | | |
Net asset value - Beginning of period | | $ | 11.27 | | | $ | 10.67 | | | $ | 10.96 | | | $ | 10.49 | | | $ | 9.66 | | | $ | 10.02 | |
| | | | | | | | | | | | | | | | | | | | | | | | |
Income (loss) from investment operations: | | | | | | | | | | | | | | | | | | | | | | | | |
Net investment income | | | 0.19 | 1 | | | 0.45 | 1 | | | 0.51 | 1 | | | 0.55 | 1 | | | 0.57 | 1 | | | 0.42 | |
Net realized and unrealized gain (loss) on investments | | | (0.39 | ) | | | 0.70 | | | | 0.03 | | | | 0.51 | | | | 0.82 | | | | (0.32 | ) |
| | | | | | | | | | | | | | | | | | | | | | | | |
| | | | | | |
Total from investment operations | | | (0.20 | ) | | | 1.15 | | | | 0.54 | | | | 1.06 | | | | 1.39 | | | | 0.10 | |
| | | | | | | | | | | | | | | | | | | | | | | | |
| | | | | | |
Less distributions to shareholders: | | | | | | | | | | | | | | | | | | | | | | | | |
From net investment income | | | (0.15 | ) | | | (0.45 | ) | | | (0.51 | ) | | | (0.52 | ) | | | (0.56 | ) | | | (0.45 | ) |
From net realized gain on investments | | | — | | | | (0.10 | ) | | | (0.32 | ) | | | (0.07 | ) | | | — | | | | (0.01 | ) |
| | | | | | | | | | | | | | | | | | | | | | | | |
| | | | | | |
Total distributions to shareholders | | | (0.15 | ) | | | (0.55 | ) | | | (0.83 | ) | | | (0.59 | ) | | | (0.56 | ) | | | (0.46 | ) |
| | | | | | | | | | | | | | | | | | | | | | | | |
| | | | | | |
Net asset value - End of period | | $ | 10.92 | | | $ | 11.27 | | | $ | 10.67 | | | $ | 10.96 | | | $ | 10.49 | | | $ | 9.66 | |
| | | | | | | | | | | | | | | | | | | | | | | | |
| | | | | | |
Net assets - End of period (000’s omitted) | | $ | 640,294 | | | $ | 631,082 | | | $ | 569,583 | | | $ | 535,355 | | | $ | 395,308 | | | $ | 340,631 | |
| | | | | | | | | | | | | | | | | | | | | | | | |
| | | | | | |
Total return2 | | | (1.80 | %) | | | 10.94 | % | | | 4.91 | % | | | 10.18 | % | | | 14.35 | % | | | 1.24 | % |
Ratios (to average net assets)/Supplemental Data: | | | | | | | | | | | | | | | | | | | | | | | | |
Expenses* | | | 0.75 | %3 | | | 0.75 | % | | | 0.75 | % | | | 0.76 | % | | | 0.78 | % | | | 0.80 | % |
Net investment income | | | 3.37 | %3 | | | 4.01 | % | | | 4.56 | % | | | 4.92 | % | | | 5.60 | % | | | 4.84 | % |
Portfolio turnover | | | 28 | % | | | 41 | % | | | 35 | % | | | 31 | % | | | 72 | % | | | 63 | % |
|
| * The investment advisor did not impose all or a portion of its management and/or other fees, and in some periods may have paid a portion of the Series’ expenses. If these expenses had been incurred by the Series, the expense ratio (to average net assets) would have increased by the following amount: | |
| | | | | | |
| | | N/A | | | | N/A | | | | N/A | | | | 0.00 | %4 | | | 0.00 | %4 | | | N/A | |
1Calculated based on average shares outstanding during the periods.
2Represents aggregate total return for the periods indicated, and assumes reinvestment of all distributions. Total return would have been lower had certain expenses not been waived or reimbursed during certain periods. Periods less than one year are not annualized.
3Annualized.
4Less than 0.01%.
The accompanying notes are an integral part of the financial statements.
19
Core Plus Bond Series
Notes to Financial Statements
(unaudited)
Core Plus Bond Series (the “Series”) is a no-load diversified series of Manning & Napier Fund, Inc. (the “Fund”). The Fund is organized in Maryland and is registered under the Investment Company Act of 1940, as amended, as an open-end management investment company.
The Series’ investment objective is to provide long-term total return by investing primarily in fixed income securities.
The Fund’s advisor is Manning & Napier Advisors, LLC (the “Advisor”). Shares of the Series are offered to investors, clients and employees of the Advisor and its affiliates. The total authorized capital stock of the Fund consists of 15 billion shares of common stock each having a par value of $0.01. As of June 30, 2013, 10.3 billion shares have been designated in total among 42 series, of which 125 million have been designated as Core Plus Bond Series Class A common stock.
| 2. | Significant Accounting Policies |
Security Valuation
Portfolio securities, including domestic equities, foreign equities, warrants and options, listed on an exchange other than the NASDAQ Stock Market are valued at the latest quoted sales price of the exchange on which the security is primarily traded. Securities not traded on valuation date or securities not listed on an exchange are valued at the latest quoted bid price provided by the Fund’s pricing service. Securities listed on the NASDAQ Stock Market are valued in accordance with the NASDAQ Official Closing Price.
Debt securities, including government bonds, foreign bonds, asset-backed securities, structured notes, supranational obligations, sovereign bonds, corporate bonds and mortgage-backed securities will normally be valued on the basis of evaluated bid prices provided directly by an independent pricing service. The pricing services use multiple valuation techniques to determine fair value. In instances where sufficient market activity exists, the pricing services may utilize a market-based approach through which quotes from market makers are used to determine fair value. In instances where sufficient market activity may not exist or is limited, the pricing services also utilize proprietary valuation models which may consider market characteristics such as benchmark yield curves, option-adjusted spreads, credit spreads, estimated default rates, coupon rates, anticipated timing of principal repayments, underlying collateral, and other unique security features in order to estimate the relevant cash flows, which are then discounted to calculate the fair value. Certain investments in securities held by the Series may be valued on a basis of a price provided directly by a principal market maker. These prices may differ from the value that would have been used had a broader market for securities existed.
Municipal securities will normally be valued on the basis of market valuations provided by an independent pricing service that utilizes the latest price quotations and a matrix system (which considers such factors as security prices of similar securities, yields, maturities and ratings).
Short-term investments that mature in sixty days or less are valued at amortized cost, which approximates fair value. Investments in open-end investment companies are valued at their net asset value per share on valuation date.
Volume and level of activity in established markets for an asset or liability are evaluated to determine whether recent transactions and quoted prices are determinative of fair value. Where there have been significant decreases in volume and level of activity, further analysis and adjustment may be necessary to estimate fair value. The Series measures fair value in these instances by the use of inputs and valuation techniques which may be based upon current market prices of securities that are comparable in coupon, rating, maturity and industry and/or expectation of future cash flows. As a result of trading in relatively thin markets and/or markets that experience significant volatility, the prices used by the Series to value these securities may differ from the value that would be realized if these securities were sold, and the differences could be material.
Securities for which representative valuations or prices are not available from the Series’ pricing service may be valued at fair value as determined in good faith by the Advisor under procedures approved by and under the general supervision and responsibility of the Fund’s Board of Directors (the “Board”). Due to the inherent uncertainty of valuations of such securities, the fair value may differ significantly from the values that would have been used had a ready market for such securities existed. If
20
Core Plus Bond Series
Notes to Financial Statements (continued)
(unaudited)
| 2. | Significant Accounting Policies (continued) |
Security Valuation (continued)
trading or events occurring after the close of the principal market in which securities are traded are expected to materially affect the value of those securities, then they may be valued at their fair value, taking this trading or these events into account.
Various inputs are used in determining the value of the Series’ assets or liabilities carried at fair value. These inputs are summarized in three broad levels. Level 1 includes quoted prices in active markets for identical assets and liabilities. Level 2 includes other significant observable inputs (including quoted prices for similar securities, interest rates, prepayment speeds, credit risk, etc.). Level 3 includes significant unobservable inputs (including the Series’ own assumptions in determining the fair value of investments). A financial instrument’s level within the fair value hierarchy is based on the lowest level of any input both individually and in aggregate that is significant to the fair value measurement. The inputs or methodology used for valuing securities are not necessarily an indication of the risk associated with investing in those securities.
The following is a summary of the valuation levels used for major security types as of June 30, 2013 in valuing the Series’ assets or liabilities carried at fair value:
| | | | | | | | | | | | | | | | |
| DESCRIPTION | | TOTAL | | | LEVEL 1 | | | LEVEL 2 | | | LEVEL 3 | |
Assets: | | | | | | | | | | | | | | | | |
Preferred securities: | | | | | | | | | | | | | | | | |
Financials | | $ | 19,869,148 | | | $ | 19,869,148 | | | $ | — | | | $ | — | |
Debt securities: | | | | | | | | | | | | | | | | |
U.S. Treasury and other U.S. Government agencies | | | 43,847,537 | | | | — | | | | 43,847,537 | | | | — | |
Corporate debt: | | | | | | | | | | | | | | | | |
Consumer Discretionary | | | 60,373,106 | | | | — | | | | 60,373,106 | | | | — | |
Consumer Staples | | | 7,968,786 | | | | — | | | | 7,968,786 | | | | — | |
Energy | | | 27,634,532 | | | | — | | | | 27,634,532 | | | | — | |
Financials | | | 270,855,443 | | | | — | | | | 270,855,443 | | | | — | |
Health Care | | | 6,467,740 | | | | — | | | | 6,467,740 | | | | — | |
Industrials | | | 22,437,615 | | | | — | | | | 22,437,615 | | | | — | |
Information Technology | | | 21,131,327 | | | | — | | | | 21,131,327 | | | | — | |
Materials | | | 39,386,587 | | | | — | | | | 39,386,587 | | | | — | |
Telecommunication Services | | | 29,221,117 | | | | — | | | | 29,221,117 | | | | — | |
Utilities | | | 5,388,821 | | | | — | | | | 5,388,821 | | | | — | |
Convertible corporate debt: | | | | | | | | | | | | | | | | |
Financials | | | 2,873,750 | | | | — | | | | 2,873,750 | | | | — | |
Asset-backed securities | | | 6,183,434 | | | | — | | | | 6,183,434 | | | | — | |
Commercial mortgage-backed securities | | | 42,093,435 | | | | — | | | | 42,093,435 | | | | — | |
Foreign government bonds | | | 13,498,533 | | | | — | | | | 13,498,533 | | | | — | |
Mutual funds | | | 3,827,385 | | | | 3,827,385 | | | | — | | | | — | |
| | | | | | | | | | | | | | | | |
Total assets | | $ | 623,058,296 | | | $ | 23,696,533 | | | $ | 599,361,763 | | | $ | — | |
| | | | | | | | | | | | | | | | |
There were no Level 3 securities held by the Series as of December 31, 2012 or June 30, 2013.
The Fund’s policy is to recognize transfers in and transfers out of the valuation levels as of the beginning of the reporting period. There were no transfers between Level 1 and Level 2 during the six months ended June 30, 2013.
Security Transactions, Investment Income and Expenses
Security transactions are accounted for on trade date. Dividend income is recorded on the ex-dividend date, except that if the ex-dividend date has passed, certain dividends from foreign securities are recorded as soon as the Series is informed of the ex-dividend date. Non-cash dividends, if any, are recorded at the fair value of the securities received. Interest income, including amortization of premium and accretion of discounts using the effective interest method, is earned from settlement date and accrued daily.
21
Core Plus Bond Series
Notes to Financial Statements (continued)
(unaudited)
| 2. | Significant Accounting Policies (continued) |
Security Transactions, Investment Income and Expenses (continued)
Expenses are recorded on an accrual basis. Most expenses of the Fund can be attributed to a specific series. Expenses which cannot be directly attributed are apportioned among the series in the Fund in such a manner as deemed equitable by the Fund’s Board, taking into consideration, among other things, the nature and type of expense.
The Series uses the identified cost method for determining realized gain or loss on investments for both financial statement and federal income tax reporting purposes.
Foreign Currency Translation
The books and records of the Series are maintained in U.S. dollars. Foreign currencies, investments and other assets and liabilities are translated into U.S. dollars at the current exchange rates. Purchases and sales of investment securities and income and expenses are translated on the respective dates of such transactions. The Series does not isolate realized and unrealized gains and losses attributable to changes in the exchange rates from gains and losses that arise from changes in the fair value of investments. Such fluctuations are included with net realized and unrealized gain or loss on investments. Net realized foreign currency gains and losses represent foreign currency gains and losses between trade date and settlement date on securities transactions, gains and losses on disposition of foreign currencies and the difference between the amount of income and foreign withholding taxes recorded on the books of the Series and the amounts actually received or paid.
Forward Foreign Currency Exchange Contracts
The Series may purchase or sell forward foreign currency exchange contracts in order to hedge a portfolio position or specific transaction. Risks may arise if the counterparties to a contract are unable to meet the terms of the contract or if the value of the foreign currency moves unfavorably.
All forward foreign currency exchange contracts are adjusted daily by the exchange rate of the underlying currency and, for financial statement purposes, any gain or loss is recorded as unrealized gain or loss until a contract has been closed.
The Series may regularly trade forward foreign currency exchange contracts with off-balance sheet risk in the normal course of its investing activities to assist in managing exposure to changes in foreign currency exchange rates.
The notional or contractual amount of these instruments represents the investment the Series has in forward foreign currency exchange contracts and does not necessarily represent the amounts potentially at risk. The measurement of the risks associated with forward foreign currency exchange contracts is meaningful only when all related and offsetting transactions are considered. The Series did not hold any forward foreign currency exchange contracts during the six months ended June 30, 2013.
Securities Purchased on a When-Issued Basis or Forward Commitment
The Series may purchase securities on a when-issued basis or forward commitment. These transactions involve a commitment by the Series to purchase securities for a predetermined price with payment and delivery taking place beyond the customary settlement period. When such purchases are outstanding, the Series will designate liquid assets in an amount sufficient to meet the purchase price. When purchasing a security on a delayed delivery basis, the Series assumes the rights and risks of ownership of the security, including the risk of price and yield fluctuations, and takes such fluctuations into account when determining its net asset value. The Series may sell the when-issued securities before they are delivered, which may result in a capital gain or loss. No such investments were held by the Series on June 30, 2013.
In connection with its ability to purchase or sell securities on a forward commitment basis, the Series may enter into forward roll transactions principally using To Be Announced (TBA) securities. Forward roll transactions require the sale of securities for delivery in the current month, and a simultaneous agreement to repurchase substantially similar (same type, coupon and maturity) securities on a specified future date. Risks of entering into forward roll transactions include the potential inability of the counterparty to meet the terms of the agreement; the potential of the Series to receive inferior securities at redelivery as compared to the securities sold to the counterparty; counterparty credit risk; and the potential pay down speed variance between the mortgage-backed pools. During the roll period, the Series forgoes principal and interest paid on the securities. The
22
Core Plus Bond Series
Notes to Financial Statements (continued)
(unaudited)
| 2. | Significant Accounting Policies (continued) |
Securities Purchased on a When-Issued Basis or Forward Commitment (continued)
Series accounts for such dollar rolls as purchases and sales. Information regarding securities purchased on a when-issued basis is included in the Series’ Investment Portfolio. No such investments were held by the Series on June 30, 2013.
Restricted Securities
Restricted securities are purchased in private placement transactions, are not registered under the Securities Act of 1933, as amended, and may have contractual restrictions on resale. Information regarding restricted securities is included at the end of the Series’ Investment Portfolio.
Illiquid Securities
A security may be considered illiquid if so deemed in good faith by the Advisor under procedures approved by and under the general supervision and responsibility of the Fund’s Board. Securities that are illiquid are marked with the applicable footnote on the Investment Portfolio. No such investments were held by the Series on June 30, 2013.
Federal Taxes
The Series’ policy is to comply with the provisions of the Internal Revenue Code applicable to regulated investment companies. The Series is not subject to federal income tax or excise tax to the extent that the Series distributes to shareholders each year its taxable income, including any net realized gains on investments, in accordance with requirements of the Internal Revenue Code. Accordingly, no provision for federal income tax or excise tax has been made in the financial statements.
Management evaluates its tax positions to determine if the tax positions taken meet the minimum recognition threshold in connection with accounting for uncertainties in income tax positions taken or expected to be taken for the purposes of measuring and recognizing tax liabilities in the financial statements. Recognition of tax benefits of an uncertain tax position is required only when the position is “more likely than not” to be sustained assuming examination by taxing authorities. At June 30, 2013, the Series has recorded no liability for net unrecognized tax benefits relating to uncertain income tax positions taken or expected to be taken in future tax returns.
The Series files income tax returns in the U.S. federal jurisdiction, various states and foreign jurisdictions, as required. No income tax returns are currently under investigation. The statute of limitations on the Series’ tax returns remains open for the years ended December 31, 2009 through December 31, 2012. The Series is not aware of any tax positions for which it is reasonably possible that the total amounts of unrecognized tax benefits will significantly change in the next twelve months.
Foreign Taxes
Based on the Series’ understanding of the tax rules and rates related to income, gains and currency purchase/repatriation transactions for foreign jurisdictions in which it invests, the Series will provide for foreign taxes, and where appropriate, deferred foreign tax.
Distributions of Income and Gains
Distributions to shareholders of net investment income are made quarterly. Distributions of net realized gains are made annually. An additional distribution may be necessary to avoid taxation of the Series. Distributions are recorded on the ex-dividend date.
Indemnifications
The Fund’s organizational documents provide former and current directors and officers with a limited indemnification against liabilities arising in connection with the performance of their duties to the Fund. In the normal course of business, the Fund may also enter into contracts that provide general indemnifications. The Fund’s maximum exposure under these arrangements is unknown as this would be dependent on future claims that may be made against the Fund. The risk of material loss from such claims is considered remote.
Other
The preparation of financial statements in conformity with accounting principles generally accepted in the United States of America requires management to make estimates and assumptions that affect the reported amounts of assets and liabilities and
23
Core Plus Bond Series
Notes to Financial Statements (continued)
(unaudited)
| 2. | Significant Accounting Policies (continued) |
Other (continued)
the disclosure of contingent assets and liabilities at the date of the financial statements and the reported amounts of income and expenses during the reporting period. Actual results could differ from those estimates.
| 3. | Transactions with Affiliates |
The Fund has an Investment Advisory Agreement (the “Agreement”) with the Advisor, for which the Series pays a fee, computed daily and payable monthly, at an annual rate of 0.70% of the Series’ average daily net assets.
Under the Agreement, personnel of the Advisor provide the Series with advice and assistance in the choice of investments and the execution of securities transactions, and otherwise maintain the Series’ organization. The Advisor also provides the Fund with necessary office space and fund administration and support services. The salaries of all officers of the Fund (except a percentage of the Fund’s Chief Compliance Officer’s salary, which is paid by the Fund), and of all Directors who are “affiliated persons” of the Fund, or of the Advisor, and all personnel of the Fund, or of the Advisor, performing services relating to research, statistical and investment activities, are paid by the Advisor. Each “non-affiliated” Director receives an annual stipend, which is allocated among all the active series of the Fund. In addition, these Directors also receive a fee per Board meeting attended plus a fee for each committee meeting attended.
The Advisor has contractually agreed, until at least April 30, 2014, to waive its fee and, if necessary, pay other operating expenses of the Series in order to maintain total direct annual fund operating expenses for the Series at no more than 0.90% of average daily net assets each year. The Advisor did not waive any fees for the six months ended June 30, 2013. The Advisor is not eligible to recoup any expenses that have been waived or reimbursed in prior years.
Manning & Napier Investor Services, Inc., a registered broker-dealer affiliate of the Advisor, acts as distributor for the Fund’s shares. The services of Manning & Napier Investor Services, Inc. are provided at no additional cost to the Series.
The Advisor has agreements with BNY Mellon Investment Servicing (U.S.) Inc. (“BNY”) under which BNY serves as sub-accountant services agent and sub-transfer agent. The Fund pays the Advisor an annual fee related to fund accounting and administration of 0.0175% on the first $3 billion of average daily net assets (excluding Target Series and Strategic Income Series); 0.015% on the next $3 billion of average daily net assets (excluding Target Series and Strategic Income Series); and 0.01% of the average daily net assets in excess of $6 billion (excluding Target Series and Strategic Income Series); plus a base fee of $25,500 per series. Transfer Agent fees are charged to the Fund on a per account basis. Additionally, certain transaction and cusip-based fees and out-of-pocket expenses, including charges for reporting relating to the Fund’s compliance program, are charged. Effective October 1, 2012, the aforementioned agreements were modified to reduce the annual fee related to fund accounting and administration, as well as transfer agent fees, by 10%, excluding out-of-pocket expenses.
Expenses not directly attributable to a series are allocated based on each series’ relative net assets or number of accounts, depending on the expense.
| 4. | Purchases and Sales of Securities |
For the six months ended June 30, 2013, purchases and sales of securities, other than U.S. Government securities and short-term securities, were $188,798,711 and $168,002,584 respectively. Purchases and sales of U.S. Government securities, other than short-term securities, were $29,277,069 and $5,864,642, respectively.
24
Core Plus Bond Series
Notes to Financial Statements (continued)
(unaudited)
| 5. | Capital Stock Transactions |
Transactions in shares of Core Plus Bond Series were:
| | | | | | | | | | | | | | | | |
| | | FOR THE SIX MONTHS ENDED 06/30/13 | | | FOR THE YEAR ENDED 12/31/12 | |
| | SHARES | | | AMOUNT | | | SHARES | | | AMOUNT | |
Sold | | | 4,913,219 | | | $ | 55,651,806 | | | | 5,829,953 | | | $ | 65,592,237 | |
Reinvested | | | 760,749 | | | | 8,523,672 | | | | 2,664,854 | | | | 29,775,472 | |
Repurchased | | | (3,006,136 | ) | | | (33,706,459 | ) | | | (5,875,777 | ) | | | (66,250,377 | ) |
| | | | | | | | | | | | | | | | |
Total | | | 2,667,832 | | | $ | 30,469,019 | | | | 2,619,030 | | | $ | 29,117,332 | |
| | | | | | | | | | | | | | | | |
Substantially all of the Series’ shares represent investments by fiduciary accounts over which the Advisor has sole investment discretion.
The Series may trade in instruments including written and purchased options, forward foreign currency exchange contracts and futures contracts and other derivatives in the normal course of investing activities to assist in managing exposure to various market risks. The Series may be subject to various elements of risk, which may involve, to a varying degree, elements of risk in excess of the amounts recognized for financial statement purposes. These risks include: the risk that changes in the value of a derivative may not correlate perfectly with the underlying asset, rate or index; counterparty credit risk related to over the counter derivative counterparties’ failure to perform under contract terms; liquidity risk related to the lack of a liquid market for these contracts allowing the fund to close out its position(s); and documentation risk relating to disagreement over contract terms. No such investments were held by the Series as of June 30, 2013.
Investing in securities of foreign companies and foreign governments involves special risks and considerations not typically associated with investing in securities of domestic companies and the U.S. Government. These risks include revaluation of currencies and future adverse political and economic developments. Moreover, securities of foreign companies and foreign governments and their markets may be less liquid and their prices more volatile than those of comparable domestic companies and the U.S. Government.
| 8. | Federal Income Tax Information |
The amount and characterization of certain income and capital gains to be distributed are determined in accordance with federal income tax regulations, which may differ from accounting principles generally accepted in the United States of America. The Series may periodically make reclassifications among its capital accounts to reflect income and gains available for distribution (or available capital loss carryovers) under income tax regulations, without impacting the Series’ net asset value. Any such reclassifications are not reflected in the financial highlights.
The final determination of the tax character of current year distributions will be made at the conclusion of the fiscal year. The tax character of distributions paid for the year ended December 31, 2012 was as follows:
| | | | |
Ordinary income | | $ | 26,389,475 | |
Long-term capital gains | | | 3,873,969 | |
25
Core Plus Bond Series
Notes to Financial Statements (continued)
(unaudited)
| 8. | Federal Income Tax Information (continued) |
At June 30, 2013, the identified cost for federal income tax purposes, the resulting gross unrealized appreciation and depreciation, and the net unrealized appreciation were as follows:
| | | | |
Cost for federal income tax purposes | | $ | 605,816,505 | |
Unrealized appreciation | | | 26,893,603 | |
Unrealized depreciation | | | (9,651,812 | ) |
| | | | |
Net unrealized appreciation | | $ | 17,241,791 | |
| | | | |
Effective August 1, 2013, the shares of the Series have been redesignated as Class S Shares and the Series issued Class I Shares. Each class of shares is substantially the same except that Class S shares bear shareholder service fees.
26
Core Plus Bond Series
Literature Requests
(unaudited)
Proxy Voting Policies and Procedures
A description of the policies and procedures that the Fund uses to determine how to vote proxies relating to portfolio securities is available, without charge, upon request:
| | | | |
| By phone | | 1-800-466-3863 | | |
| On the Securities and Exchange | | | | |
| Commission’s (SEC) web site | | http://www.sec.gov | | |
Proxy Voting Record
Information regarding how the Fund voted proxies relating to portfolio securities during the most recent 12-month period ended June 30th is available, without charge, upon request:
| | | | |
| By phone | | 1-800-466-3863 | | |
| On the SEC’s web site | | http://www.sec.gov | | |
Quarterly Portfolio Holdings
The Series’ complete schedule of portfolio holdings for the 1st and 3rd quarters of each fiscal year are provided on Form N-Q, and are available, without charge, upon request:
| | | | |
| By phone | | 1-800-466-3863 | | |
| On the SEC’s web site | | http://www.sec.gov | | |
The Series’ Form N-Q may be reviewed and copied at the SEC’s Public Reference Room in Washington, D.C. Information on the operation of the Public Reference Room may be obtained by calling 1-800-SEC-0330.
Prospectus and Statement of Additional Information (SAI)
The prospectus and SAI provide additional information about each Series, including charges, expenses and risks. These documents are available, without charge, upon request:
| | | | |
| By phone | | 1-800-466-3863 | | |
| On the SEC’s web site | | http://www.sec.gov | | |
| On our web site | | http://www.manning-napier.com | | |
Additional information available at www.manning-napier.com
1. Fund Holdings - Month-End
2. Fund Holdings - Quarter-End
3. Shareholder Report - Annual
4. Shareholder Report - Semi-Annual
The Fund also offers electronic notification or “e-delivery” when certain documents are available on-line to be downloaded or reviewed. Direct shareholders can elect to receive electronic notification when shareholder reports, prospectus updates, and/or statements are available. If you do not currently have on-line access to your account, you can establish access by going to www.manning-napier.com, click on “Login” in the top corner of the page, and follow the prompts to self-enroll. Once enrolled, you can set your electronic notification preferences by clicking on the Account Options tab located within the green toolbar and then select E-Delivery Option. Should you have any questions on either how to establish on-line access or how to update your account settings, please contact Investor Services at 1-800-466-3863.
MNCPB-6/13-SAR
| | | | | | |
| | | | HIGH YIELD BOND SERIES | | |
www.manning-napier.com | | | | |
High Yield Bond Series
Shareholder Expense Example
(unaudited)
As a shareholder of the Series, you may incur two types of costs: (1) transaction costs and (2) ongoing costs, including management fees and other Series expenses. This example is intended to help you understand your ongoing costs (in dollars) of investing in the Series and to compare these costs with the ongoing costs of investing in other mutual funds.
The example is based on an investment of $1,000 invested in each class at the beginning of the period and held for the entire period (January 1, 2013 to June 30, 2013).
Actual Expenses
The Actual lines of the table below provide information about actual account values and actual expenses. You may use the information in this line, together with the amount you invested, to estimate the expenses that you paid over the period. Simply divide your account value by $1,000 (for example, an $8,600 account value divided by $1,000 = 8.6), then multiply the result by the number in the Actual line for the Class in which you have invested under the heading entitled “Expenses Paid During Period” to estimate the expenses you paid on your account during this period.
Hypothetical Example for Comparison Purposes
The Hypothetical lines of each Class in the table below provide information about hypothetical account values and hypothetical expenses based on the Class’ actual expense ratio and an assumed rate of return of 5% per year before expenses, which is not the Class’ actual return. The hypothetical account values and expenses may not be used to estimate the actual ending account balance or expenses you paid during the period. You may use this information to compare the ongoing costs of investing in the Series and other funds. To do so, compare this 5% hypothetical example with the 5% hypothetical examples that appear in the shareholder reports of the other funds.
Please note that the expenses shown in the table are meant to highlight your ongoing costs only and do not reflect any transaction costs. Therefore, the Hypothetical lines for each Class in the table are useful in comparing ongoing costs only, and will not help you determine the relative total costs of owning different funds. In addition, if these transaction costs were included, your costs would have been higher.
| | | | | | | | |
| | | BEGINNING
ACCOUNT VALUE
1/1/13 | | ENDING
ACCOUNT VALUE
6/30/13 | | EXPENSES PAID
DURING PERIOD*
1/1/13-6/30/13 | | ANNUALIZED
EXPENSE RATIO |
Class S | | | | | | | | |
Actual | | $1,000.00 | | $1,012.30 | | $5.64 | | 1.13% |
Hypothetical (5% return before expenses) | | $1,000.00 | | $1,019.19 | | $5.66 | | 1.13% |
Class I | | | | | | | | |
Actual | | $1,000.00 | | $1,013.70 | | $4.39 | | 0.88% |
Hypothetical (5% return before expenses) | | $1,000.00 | | $1,020.43 | | $4.41 | | 0.88% |
*Expenses are equal to the Class’ annualized expense ratio (for the six-month period), multiplied by the average account value over the period, multiplied by 181/365 (to reflect the one-half year period). Expenses are based on the most recent fiscal half year.
1
High Yield Bond Series
Portfolio Composition as of June 30, 2013
(unaudited)
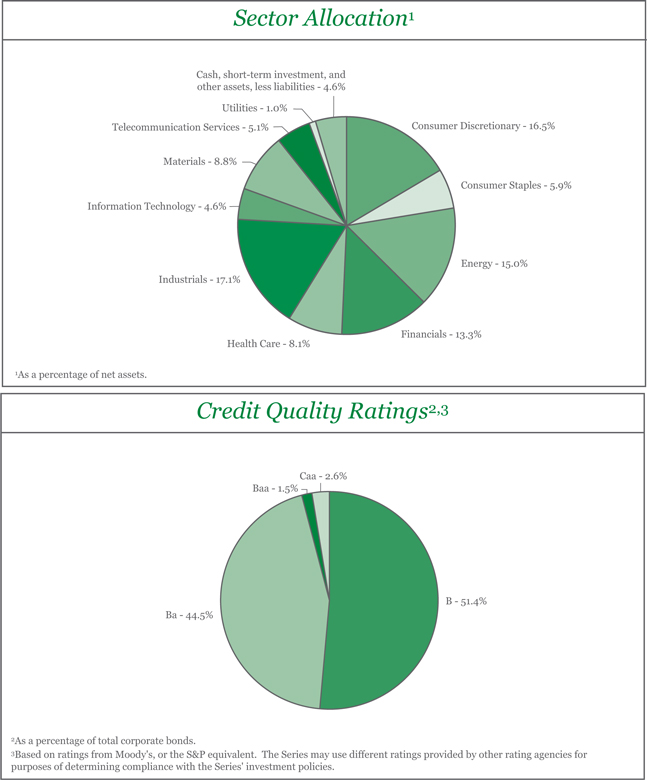
2
High Yield Bond Series
Investment Portfolio - June 30, 2013
(unaudited)
| | | | | | | | | | | | | | |
| | | CREDIT
RATING1
(UNAUDITED) | | | PRINCIPAL
AMOUNT | | | VALUE (NOTE 2) | | | |
| | | | |
CORPORATE BONDS - 95.4% | | | | | | | | | | | | | | |
| | | | |
Non-Convertible Corporate Bonds - 95.4% | | | | | | | | | | | | | | |
Consumer Discretionary - 16.5% | | | | | | | | | | | | | | |
Auto Components - 1.0% | | | | | | | | | | | | | | |
Gestamp Funding Luxembourg S.A. (Spain)2 , 5.625%, 5/31/2020 | | | B1 | | | $ | 2,085,000 | | | $ | 1,980,750 | | | |
| | | | | | | | | | | | | | |
Household Durables - 3.0% | | | | | | | | | | | | | | |
Brookfield Residential Properties, Inc. - Brookfield Residential US Corp. (Canada)2 , 6.125%, 7/1/2022 | | | B2 | | | | 2,035,000 | | | | 1,996,844 | | | |
Lennar Corp., 6.95%, 6/1/2018 | | | Ba3 | | | | 2,015,000 | | | | 2,176,200 | | | |
Weekley Homes LLC - Weekley Finance Corp.2 , 6.00%, 2/1/2023 | | | B2 | | | | 1,860,000 | | | | 1,827,450 | | | |
| | | | | | | | | | | | | | |
| | | | |
| | | | | | | | | | | 6,000,494 | | | |
| | | | | | | | | | | | | | |
Media - 8.3% | | | | | | | | | | | | | | |
CCO Holdings LLC - CCO Holdings Capital Corp.2 , 5.25%, 3/15/2021 | | | B1 | | | | 2,995,000 | | | | 2,950,075 | | | |
Nara Cable Funding Ltd. (Spain)2 , 8.875%, 12/1/2018 | | | B1 | | | | 2,165,000 | | | | 2,251,600 | | | |
Sirius XM Radio, Inc.2 , 8.75%, 4/1/2015 | | | B1 | | | | 1,685,000 | | | | 1,853,500 | | | |
Sirius XM Radio, Inc.2 , 4.25%, 5/15/2020 | | | B1 | | | | 2,000,000 | | | | 1,880,000 | | | |
Starz LLC - Starz Finance Corp., 5.00%, 9/15/2019 | | | Ba2 | | | | 3,115,000 | | | | 3,091,637 | | | |
Unitymedia Hessen GmbH & Co. KG - Unitymedia NRW GmbH (Germany)2 , 5.50%, 1/15/2023 | | | Ba3 | | | | 3,165,000 | | | | 2,990,925 | | | |
Virgin Media Secured Finance plc (United Kingdom), 5.25%, 1/15/2021 | | | Ba3 | | | | 1,870,000 | | | | 1,870,165 | | | |
| | | | | | | | | | | | | | |
| | | | |
| | | | | | | | | | | 16,887,902 | | | |
| | | | | | | | | | | | | | |
Specialty Retail - 2.3% | | | | | | | | | | | | | | |
Dufry Finance SCA (Switzerland)2 , 5.50%, 10/15/2020 | | | Ba3 | | | | 2,000,000 | | | | 2,005,284 | | | |
Rent-A-Center, Inc., 6.625%, 11/15/2020 | | | Ba3 | | | | 2,630,000 | | | | 2,754,925 | | | |
| | | | | | | | | | | | | | |
| | | | |
| | | | | | | | | | | 4,760,209 | | | |
| | | | | | | | | | | | | | |
Textiles, Apparel & Luxury Goods - 1.9% | | | | | | | | | | | | | | |
Jones Group, Inc. - Apparel Group Holdings - Apparel Group USA - Footwear Accessories Retail, 6.875%, 3/15/2019 | | | B1 | | | | 1,870,000 | | | | 1,879,350 | | | |
SIWF Merger Sub, Inc. - Springs Industries, Inc.2 , 6.25%, 6/1/2021 | | | B2 | | | | 1,975,000 | | | | 1,935,500 | | | |
| | | | | | | | | | | | | | |
| | | | |
| | | | | | | | | | | 3,814,850 | | | |
| | | | | | | | | | | | | | |
| | | | |
Total Consumer Discretionary | | | | | | | | | | | 33,444,205 | | | |
| | | | | | | | | | | | | | |
| | | | |
Consumer Staples - 5.9% | | | | | | | | | | | | | | |
Food Products - 4.4% | | | | | | | | | | | | | | |
C&S Group Enterprises LLC2 , 8.375%, 5/1/2017 | | | B1 | | | | 2,369,000 | | | | 2,511,140 | | | |
FAGE Dairy Industry S.A. - FAGE USA Dairy Industry, Inc. (Greece)2 , 9.875%, 2/1/2020 | | | B3 | | | | 1,875,000 | | | | 2,020,313 | | | |
Land O’ Lakes, Inc.2 , 6.00%, 11/15/2022 | | | Ba2 | | | | 1,785,000 | | | | 1,838,550 | | | |
Shearer’s Foods LLC - Chip Finance Corp.2 , 9.00%, 11/1/2019 | | | B3 | | | | 2,390,000 | | | | 2,527,425 | | | |
| | | | | | | | | | | | | | |
| | | | |
| | | | | | | | | | | 8,897,428 | | | |
| | | | | | | | | | | | | | |
Tobacco - 1.5% | | | | | | | | | | | | | | |
Vector Group Ltd., 7.75%, 2/15/2021 | | | Ba3 | | | | 3,000,000 | | | | 3,097,500 | | | |
| | | | | | | | | | | | | | |
| | | | |
Total Consumer Staples | | | | | | | | | | | 11,994,928 | | | |
| | | | | | | | | | | | | | |
The accompanying notes are an integral part of the financial statements.
3
High Yield Bond Series
Investment Portfolio - June 30, 2013
(unaudited)
| | | | | | | | | | | | | | |
| | | CREDIT
RATING1
(UNAUDITED) | | | PRINCIPAL
AMOUNT | | | VALUE
(NOTE 2) | | | |
| | | | |
CORPORATE BONDS (continued) | | | | | | | | | | | | | | |
| | | | |
Non-Convertible Corporate Bonds (continued) | | | | | | | | | | | | | | |
Energy - 15.0% | | | | | | | | | | | | | | |
Energy Equipment & Services - 3.7% | | | | | | | | | | | | | | |
Calfrac Holdings LP (Canada)2, 7.50%, 12/1/2020 | | | B1 | | | $ | 3,680,000 | | | $ | 3,643,200 | | | |
Shelf Drilling Holdings Ltd. (United Arab Emirates)2, 8.625%, 11/1/2018 | | | B1 | | | | 1,890,000 | | | | 1,965,600 | | | |
Sidewinder Drilling, Inc.2, 9.75%, 11/15/2019 | | | B3 | | | | 1,890,000 | | | | 1,913,625 | | | |
| | | | | | | | | | | | | | |
| | | | |
| | | | | | | | | | | 7,522,425 | | | |
| | | | | | | | | | | | | | |
Oil, Gas & Consumable Fuels - 11.3% | | | | | | | | | | | | | | |
Chesapeake Oilfield Operating LLC - Chesapeake Oilfield Finance, Inc.2, 6.625%, 11/15/2019 | | | Ba3 | | | | 3,930,000 | | | | 3,890,700 | | | |
EPL Oil & Gas, Inc., 8.25%, 2/15/2018 | | | Caa1 | | | | 2,955,000 | | | | 3,043,650 | | | |
Gulfport Energy Corp.2, 7.75%, 11/1/2020 | | | B3 | | | | 2,800,000 | | | | 2,835,000 | | | |
ION Geophysical Corp.2, 8.125%, 5/15/2018 | | | B3 | | | | 1,380,000 | | | | 1,331,700 | | | |
LBC Tank Terminals Holding Netherlands B.V. (Belgium)2, 6.875%, 5/15/2023 | | | B3 | | | | 1,970,000 | | | | 1,974,925 | | | |
Northern Tier Energy LLC - Northern Tier Finance Corp.2, 7.125%, 11/15/2020 | | | B1 | | | | 3,145,000 | | | | 3,176,450 | | | |
PBF Holding Co. LLC - PBF Finance Corp., 8.25%, 2/15/2020 | | | Ba3 | | | | 2,870,000 | | | | 3,006,325 | | | |
Sabine Pass Liquefaction LLC2, 5.625%, 2/1/2021 | | | Ba3 | | | | 3,675,000 | | | | 3,564,750 | | | |
| | | | | | | | | | | | | | |
| | | | |
| | | | | | | | | | | 22,823,500 | | | |
| | | | | | | | | | | | | | |
| | | | |
Total Energy | | | | | | | | | | | 30,345,925 | | | |
| | | | | | | | | | | | | | |
| | | | |
Financials - 13.3% | | | | | | | | | | | | | | |
Capital Markets - 2.9% | | | | | | | | | | | | | | |
Jefferies Finance LLC - JFIN Co-Issuer Corp.2, 7.375%, 4/1/2020 | | | B1 | | | | 2,970,000 | | | | 2,880,900 | | | |
Jefferies Group LLC, 8.50%, 7/15/2019 | | | Baa3 | | | | 2,500,000 | | | | 3,012,500 | | | |
| | | | | | | | | | | | | | |
| | | | |
| | | | | | | | | | | 5,893,400 | | | |
| | | | | | | | | | | | | | |
Commercial Banks - 1.0% | | | | | | | | | | | | | | |
Provident Funding Associates LP - PFG Finance Corp.2, 6.75%, 6/15/2021 | | | Ba3 | | | | 1,985,000 | | | | 1,980,037 | | | |
| | | | | | | | | | | | | | |
Consumer Finance - 0.9% | | | | | | | | | | | | | | |
Credit Acceptance Corp., 9.125%, 2/1/2017 | | | B1 | | | | 1,770,000 | | | | 1,871,775 | | | |
| | | | | | | | | | | | | | |
Diversified Financial Services - 6.1% | | | | | | | | | | | | | | |
CNG Holdings, Inc.2, 9.375%, 5/15/2020 | | | B3 | | | | 3,150,000 | | | | 3,024,000 | | | |
CNH Capital LLC, 6.25%, 11/1/2016 | | | Ba2 | | | | 1,730,000 | | | | 1,842,450 | | | |
Ladder Capital Finance Holdings LLLP - Ladder Capital Finance Corp.2, 7.375%, 10/1/2017 | | | Ba3 | | | | 3,125,000 | | | | 3,187,500 | | | |
Oxford Finance LLC - Oxford Finance Co-Issuer, Inc.2, 7.25%, 1/15/2018 | | | B1 | | | | 1,310,000 | | | | 1,362,400 | | | |
SPL Logistics Escrow LLC - SPL Logistics Finance Corp.2, 8.875%, 8/1/2020 | | | B2 | | | | 2,760,000 | | | | 2,870,400 | | | |
| | | | | | | | | | | | | | |
| | | | |
| | | | | | | | | | | 12,286,750 | | | |
| | | | | | | | | | | | | | |
The accompanying notes are an integral part of the financial statements.
4
High Yield Bond Series
Investment Portfolio - June 30, 2013
(unaudited)
| | | | | | | | | | | | | | |
| | | CREDIT
RATING1
(UNAUDITED) | | | PRINCIPAL
AMOUNT | | | VALUE (NOTE 2) | | | |
| | | | |
CORPORATE BONDS (continued) | | | | | | | | | | | | | | |
| | | | |
Non-Convertible Corporate Bonds (continued) | | | | | | | | | | | | | | |
Financials (continued) | | | | | | | | | | | | | | |
Insurance - 1.0% | | | | | | | | | | | | | | |
Fidelity & Guaranty Life Holdings, Inc.2, 6.375%, 4/1/2021 | | | B1 | | | $ | 2,100,000 | | | $ | 2,037,000 | | | |
| | | | | | | | | | | | | | |
Real Estate Investment Trusts (REITS) - 1.4% | | | | | | | | | | | | | | |
Corrections Corp. of America2, 4.125%, 4/1/2020 | | | Ba1 | | | | 2,975,000 | | | | 2,908,063 | | | |
| | | | | | | | | | | | | | |
| | | | |
Total Financials | | | | | | | | | | | 26,977,025 | | | |
| | | | | | | | | | | | | | |
| | | | |
Health Care - 8.1% | | | | | | | | | | | | | | |
Health Care Equipment & Supplies - 5.1% | | | | | | | | | | | | | | |
Alere, Inc.2, 7.25%, 7/1/2018 | | | B3 | | | | 1,880,000 | | | | 1,992,800 | | | |
Alere, Inc.2, 6.50%, 6/15/2020 | | | Caa1 | | | | 2,060,000 | | | | 1,998,200 | | | |
Fresenius Medical Care US Finance, Inc. (Germany), 6.875%, 7/15/2017 | | | Ba2 | | | | 2,370,000 | | | | 2,589,225 | | | |
Fresenius Medical Care US Finance, Inc. (Germany)2, 6.50%, 9/15/2018 | | | Ba2 | | | | 1,265,000 | | | | 1,375,687 | | | |
Fresenius US Finance II, Inc. (Germany)2, 9.00%, 7/15/2015 | | | Ba1 | | | | 2,170,000 | | | | 2,397,850 | | | |
| | | | | | | | | | | | | | |
| | | | |
| | | | | | | | | | | 10,353,762 | | | |
| | | | | | | | | | | | | | |
Health Care Providers & Services - 0.4% | | | | | | | | | | | | | | |
Tenet Healthcare Corp.2, 4.50%, 4/1/2021 | | | Ba3 | | | | 1,000,000 | | | | 932,500 | | | |
| | | | | | | | | | | | | | |
Pharmaceuticals - 2.6% | | | | | | | | | | | | | | |
Valeant Pharmaceuticals International2, 6.75%, 8/15/2021 | | | B1 | | | | 3,815,000 | | | | 3,819,769 | | | |
VPII Escrow Corp.2, 6.75%, 8/15/2018 | | | B1 | | | | 1,335,000 | | | | 1,368,375 | | | |
| | | | | | | | | | | | | | |
| | | | |
| | | | | | | | | | | 5,188,144 | | | |
| | | | | | | | | | | | | | |
| | | | |
Total Health Care | | | | | | | | | | | 16,474,406 | | | |
| | | | | | | | | | | | | | |
| | | | |
Industrials - 17.1% | | | | | | | | | | | | | | |
Aerospace & Defense - 5.4% | | | | | | | | | | | | | | |
Bombardier, Inc. (Canada)2, 4.25%, 1/15/2016 | | | Ba2 | | | | 1,875,000 | | | | 1,917,187 | | | |
Bombardier, Inc. (Canada)2, 6.125%, 1/15/2023 | | | Ba2 | | | | 3,185,000 | | | | 3,161,113 | | | |
DigitalGlobe, Inc.2, 5.25%, 2/1/2021 | | | B1 | | | | 1,860,000 | | | | 1,785,600 | | | |
Ducommun, Inc., 9.75%, 7/15/2018 | | | B3 | | | | 1,845,000 | | | | 2,015,663 | | | |
Erickson Air-Crane, Inc.2, 8.25%, 5/1/2020 | | | B1 | | | | 2,005,000 | | | | 1,949,863 | | | |
| | | | | | | | | | | | | | |
| | | | |
| | | | | | | | | | | 10,829,426 | | | |
| | | | | | | | | | | | | | |
Air Freight & Logistics - 1.0% | | | | | | | | | | | | | | |
Aguila 3 S.A. (Luxembourg)2, 7.875%, 1/31/2018 | | | B2 | | | | 1,885,000 | | | | 1,941,550 | | | |
| | | | | | | | | | | | | | |
Airlines - 4.5% | | | | | | | | | | | | | | |
Aviation Capital Group Corp.2, 4.625%, 1/31/2018 | | | BB3 | | | | 1,880,000 | | | | 1,850,804 | | | |
Aviation Capital Group Corp.2, 6.75%, 4/6/2021 | | | BB3 | | | | 2,590,000 | | | | 2,727,679 | | | |
Delta Air Lines Pass-Through Trust, Series 2010-1, Class B, 6.375%, 1/2/2016 | | | Ba2 | | | | 1,890,000 | | | | 1,965,600 | | | |
Delta Air Lines Pass-Through Trust, Series 2010-2, Class B, 6.75%, 11/23/2015 | | | Ba3 | | | | 850,000 | | | | 877,625 | | | |
The accompanying notes are an integral part of the financial statements.
5
High Yield Bond Series
Investment Portfolio - June 30, 2013
(unaudited)
| | | | | | | | | | | | | | |
| | | CREDIT
RATING1
(UNAUDITED) | | | PRINCIPAL
AMOUNT | | | VALUE
(NOTE 2) | | | |
| | | | |
CORPORATE BONDS (continued) | | | | | | | | | | | | | | |
| | | | |
Non-Convertible Corporate Bonds (continued) | | | | | | | | | | | | | | |
Industrials (continued) | | | | | | | | | | | | | | |
Airlines (continued) | | | | | | | | | | | | | | |
United Continental Holdings, Inc., 6.375%, 6/1/2018 | | | B2 | | | $ | 1,760,000 | | | $ | 1,729,200 | | | |
| | | | | | | | | | | | | | |
| | | | |
| | | | | | | | | | | 9,150,908 | | | |
| | | | | | | | | | | | | | |
Commercial Services & Supplies - 1.0% | | | | | | | | | | | | | | |
Clean Harbors, Inc., 5.25%, 8/1/2020 | | | Ba2 | | | | 1,695,000 | | | | 1,720,425 | | | |
Garda World Security Corp. (Canada)2, 9.75%, 3/15/2017 | | | B2 | | | | 225,000 | | | | 237,937 | | | |
| | | | | | | | | | | | | | |
| | | | |
| | | | | | | | | | | 1,958,362 | | | |
| | | | | | | | | | | | | | |
Machinery - 1.3% | | | | | | | | | | | | | | |
Dynacast International LLC - Dynacast Finance, Inc., 9.25%, 7/15/2019 | | | B2 | | | | 2,500,000 | | | | 2,725,000 | | | |
| | | | | | | | | | | | | | |
Marine - 1.0% | | | | | | | | | | | | | | |
Navios Maritime Holdings, Inc. - Navios Maritime Finance US, Inc., 8.875%, 11/1/2017 | | | B1 | | | | 2,015,000 | | | | 2,085,525 | | | |
| | | | | | | | | | | | | | |
Professional Services - 0.9% | | | | | | | | | | | | | | |
FTI Consulting, Inc.2, 6.00%, 11/15/2022 | | | Ba2 | | | | 1,880,000 | | | | 1,903,500 | | | |
| | | | | | | | | | | | | | |
Trading Companies & Distributors - 2.0% | | | | | | | | | | | | | | |
International Lease Finance Corp., 6.25%, 5/15/2019 | | | Ba3 | | | | 1,000,000 | | | | 1,027,500 | | | |
Rexel S.A. (France)2, 5.25%, 6/15/2020 | | | Ba3 | | | | 2,970,000 | | | | 2,962,575 | | | |
| | | | | | | | | | | | | | |
| | | | |
| | | | | | | | | | | 3,990,075 | | | |
| | | | | | | | | | | | | | |
| | | | |
Total Industrials | | | | | | | | | | | 34,584,346 | | | |
| | | | | | | | | | | | | | |
| | | | |
Information Technology - 4.6% | | | | | | | | | | | | | | |
Communications Equipment - 1.9% | | | | | | | | | | | | | | |
Hughes Satellite Systems Corp., 6.50%, 6/15/2019 | | | Ba3 | | | | 1,780,000 | | | | 1,886,800 | | | |
ViaSat, Inc., 6.875%, 6/15/2020 | | | B2 | | | | 1,845,000 | | | | 1,946,475 | | | |
| | | | | | | | | | | | | | |
| | | | |
| | | | | | | | | | | 3,833,275 | | | |
| | | | | | | | | | | | | | |
Electronic Equipment, Instruments & Components - 1.0% | | | | | | | | | | | | | | |
CPI International, Inc., 8.00%, 2/15/2018 | | | B3 | | | | 1,950,000 | | | | 2,008,500 | | | |
| | | | | | | | | | | | | | |
Software - 1.7% | | | | | | | | | | | | | | |
Audatex North America, Inc.2, 6.00%, 6/15/2021 | | | Ba2 | | | | 1,500,000 | | | | 1,496,250 | | | |
Interface Security Systems Holdings, Inc. - Interface Security Systems LLC2, 9.25%, 1/15/2018 | | | B3 | | | | 1,880,000 | | | | 1,917,600 | | | |
| | | | | | | | | | | | | | |
| | | | |
| | | | | | | | | | | 3,413,850 | | | |
| | | | | | | | | | | | | | |
| | | | |
Total Information Technology | | | | | | | | | | | 9,255,625 | | | |
| | | | | | | | | | | | | | |
| | | | |
Materials - 8.8% | | | | | | | | | | | | | | |
Chemicals - 5.2% | | | | | | | | | | | | | | |
Ashland, Inc.2, 3.875%, 4/15/2018 | | | Ba1 | | | | 2,025,000 | | | | 2,004,750 | | | |
Nufarm Australia Ltd. (Australia)2, 6.375%, 10/15/2019 | | | Ba3 | | | | 3,640,000 | | | | 3,630,900 | | | |
Rentech Nitrogen Partners LP - Rentech Nitrogen Finance Corp.2, 6.50%, 4/15/2021 | | | B1 | | | | 3,065,000 | | | | 3,034,350 | | | |
The accompanying notes are an integral part of the financial statements.
6
High Yield Bond Series
Investment Portfolio - June 30, 2013
(unaudited)
| | | | | | | | | | | | | | |
| | | CREDIT RATING 1 (UNAUDITED) | | | PRINCIPAL AMOUNT/ SHARES | | | VALUE (NOTE 2) | | | |
| | | | |
CORPORATE BONDS (continued) | | | | | | | | | | | | | | |
| | | | |
Non-Convertible Corporate Bonds (continued) | | | | | | | | | | | | | | |
Materials (continued) | | | | | | | | | | | | | | |
Chemicals (continued) | | | | | | | | | | | | | | |
Trinseo Materials Operating SCA - Trinseo Materials Finance, Inc. (Luxembourg)2, 8.75%, 2/1/2019 | | | B1 | | | $ | 1,860,000 | | | $ | 1,776,300 | | | |
| | | | | | | | | | | | | | |
| | | | |
| | | | | | | | | | | 10,446,300 | | | |
| | | | | | | | | | | | | | |
Metals & Mining - 0.9% | | | | | | | | | | | | | | |
Shale-Inland Holdings LLC - Shale-Inland Finance Corp.2, 8.75%, 11/15/2019 | | | B3 | | | | 1,890,000 | | | | 1,927,800 | | | |
| | | | | | | | | | | | | | |
Paper & Forest Products - 2.7% | | | | | | | | | | | | | | |
Smurfit Kappa Acquisitions (Ireland)2, 4.875%, 9/15/2018 | | | Ba2 | | | | 5,580,000 | | | | 5,412,600 | | | |
| | | | | | | | | | | | | | |
| | | | |
Total Materials | | | | | | | | | | | 17,786,700 | | | |
| | | | | | | | | | | | | | |
| | | | |
Telecommunication Services - 5.1% | | | | | | | | | | | | | | |
Diversified Telecommunication Services - 5.1% | | | | | | | | | | | | | | |
Digicel Ltd. (Jamaica)2, 6.00%, 4/15/2021 | | | B1 | | | | 3,095,000 | | | | 2,924,775 | | | |
Inmarsat Finance plc (United Kingdom)2, 7.375%, 12/1/2017 | | | Ba2 | | | | 1,685,000 | | | | 1,752,400 | | | |
UPCB Finance VI Ltd. (Netherlands)2, 6.875%, 1/15/2022 | | | Ba3 | | | | 2,000,000 | | | | 2,070,000 | | | |
Windstream Corp., 7.50%, 6/1/2022 | | | B1 | | | | 3,495,000 | | | | 3,564,900 | | | |
| | | | | | | | | | | | | | |
| | | | |
Total Telecommunication Services | | | | | | | | | | | 10,312,075 | | | |
| | | | | | | | | | | | | | |
| | | | |
Utilities - 1.0% | | | | | | | | | | | | | | |
Independent Power Producers & Energy Traders - 1.0% | | | | | | | | | | | | | | |
NRG Energy, Inc., 7.875%, 5/15/2021 | | | B1 | | | | 1,825,000 | | | | 1,948,187 | | | |
| | | | | | | | | | | | | | |
TOTAL CORPORATE BONDS | | | | | | | | | | | | | | |
(Identified Cost $193,108,346) | | | | | | | | | | | 193,123,422 | | | |
| | | | | | | | | | | | | | |
| | | | |
SHORT-TERM INVESTMENT - 1.9% | | | | | | | | | | | | | | |
Dreyfus Cash Management, Inc. - Institutional Shares4, 0.05%, | | | | | | | | | | | | | | |
(Identified Cost $3,833,468) | | | | | | | 3,833,468 | | | | 3,833,468 | | | |
| | | | | | | | | | | | | | |
| | | | |
TOTAL INVESTMENTS - 97.3% | | | | | | | | | | | | | | |
(Identified Cost $196,941,814) | | | | | | | | | | | 196,956,890 | | | |
OTHER ASSETS, LESS LIABILITIES - 2.7% | | | | | | | | | | | 5,505,137 | | | |
| | | | | | | | | | | | | | |
| | | | |
NET ASSETS - 100% | | | | | | | | | | $ | 202,462,027 | | | |
| | | | | | | | | | | | | | |
1Credit ratings from Moody’s (unaudited).
2Restricted securities - Investment in securities that are restricted as to public resale under the Securities Act of 1933, as amended. These securities have been sold under rule 144A and have been determined to be liquid under guidelines established by the Board of Directors. These securities amount to $137,386,320 or 67.9% of the Series’ net assets as of June 30, 2013 (see Note 2 to the financial statements).
3Credit ratings from S&P (unaudited).
4Rate shown is the current yield as of June 30, 2013.
The accompanying notes are an integral part of the financial statements.
7
High Yield Bond Series
Statement of Assets and Liabilities
June 30, 2013 (unaudited)
| | | | |
ASSETS: | | | | |
| |
Investments (identified cost $196,941,814) (Note 2) | | $ | 196,956,890 | |
Interest receivable | | | 3,411,663 | |
Receivable for securities sold | | | 8,860,051 | |
Receivable for fund shares sold | | | 250,731 | |
Dividends receivable | | | 211 | |
Prepaid expenses | | | 804 | |
| | | | |
| |
TOTAL ASSETS | | | 209,480,350 | |
| | | | |
| |
LIABILITIES: | | | | |
| |
Accrued management fees (Note 3) | | | 126,984 | |
Accrued shareholder services fees (Class S) (Note 3) | | | 38,302 | |
Accrued fund accounting and administration fees (Note 3) | | | 10,116 | |
Accrued transfer agent fees (Note 3) | | | 2,117 | |
Accrued Chief Compliance Officer service fees (Note 3) | | | 339 | |
Payable for securities purchased | | | 6,660,169 | |
Payable for fund shares repurchased | | | 174,950 | |
Other payables and accrued expenses | | | 5,346 | |
| | | | |
| |
TOTAL LIABILITIES | | | 7,018,323 | |
| | | | |
| |
TOTAL NET ASSETS | | $ | 202,462,027 | |
| | | | |
| |
NET ASSETS CONSIST OF: | | | | |
| |
Capital stock | | $ | 191,338 | |
Additional paid-in-capital | | | 195,644,715 | |
Undistributed net investment income | | | 1,238,059 | |
Accumulated net realized gain on investments | | | 5,372,839 | |
Net unrealized appreciation on investments | | | 15,076 | |
| | | | |
| |
TOTAL NET ASSETS | | $ | 202,462,027 | |
| | | | |
| |
NET ASSET VALUE, OFFERING PRICE AND REDEMPTION PRICE PER SHARE - Class S
($182,798,711/17,107,048 shares) | | $ | 10.69 | |
| | | | |
| |
NET ASSET VALUE, OFFERING PRICE AND REDEMPTION PRICE PER SHARE - Class I
($19,663,316/2,026,726 shares) | | $ | 9.70 | |
| | | | |
The accompanying notes are an integral part of the financial statements.
8
High Yield Bond Series
Statement of Operations
For the Six Months Ended June 30, 2013 (unaudited)
| | | | |
INVESTMENT INCOME: | | | | |
| |
Interest | | $ | 6,258,480 | |
Dividends | | | 1,708 | |
| | | | |
| |
Total Investment Income | | | 6,260,188 | |
| | | | |
| |
EXPENSES: | | | | |
| |
Management fees (Note 3) | | | 757,986 | |
Shareholder services fees (Class S) (Note 3) | | | 229,940 | |
Fund accounting and administration fees (Note 3) | | | 32,511 | |
Transfer agent fees (Note 3) | | | 6,620 | |
Directors’ fees (Note 3) | | | 2,184 | |
Chief Compliance Officer service fees (Note 3) | | | 1,117 | |
Custodian fees | | | 5,671 | |
Miscellaneous | | | 80,013 | |
| | | | |
| |
Total Expenses | | | 1,116,042 | |
| | | | |
| |
NET INVESTMENT INCOME | | | 5,144,146 | |
| | | | |
| |
REALIZED AND UNREALIZED GAIN (LOSS) ON INVESTMENTS: | | | | |
| |
Net realized gain (loss) on investments | | | 4,063,197 | |
Net change in unrealized appreciation (depreciation) on investments | | | (6,817,460 | ) |
| | | | |
| |
NET REALIZED AND UNREALIZED GAIN (LOSS) ON INVESTMENTS | | | (2,754,263 | ) |
| | | | |
| |
NET INCREASE IN NET ASSETS RESULTING FROM OPERATIONS | | $ | 2,389,883 | |
| | | | |
The accompanying notes are an integral part of the financial statements.
9
High Yield Bond Series
Statements of Changes in Net Assets
| | | | | | | | |
| | | FOR THE SIX
MONTHS ENDED 6/30/13 (UNAUDITED) | | | FOR THE YEAR ENDED
12/31/12 | |
INCREASE (DECREASE) IN NET ASSETS: | | | | | | | | |
| | |
OPERATIONS: | | | | | | | | |
| | |
Net investment income | | $ | 5,144,146 | | | $ | 10,787,749 | |
Net realized gain (loss) on investments | | | 4,063,197 | | | | 7,047,305 | |
Net change in unrealized appreciation (depreciation) on investments | | | (6,817,460 | ) | | | 7,175,708 | |
| | | | | | | | |
| | |
Net increase from operations | | | 2,389,883 | | | | 25,010,762 | |
| | | | | | | | |
| | |
DISTRIBUTIONS TO SHAREHOLDERS (Note 8): | | | | | | | | |
| | |
From net investment income (Class S) | | | (3,491,930 | ) | | | (10,361,600 | ) |
From net investment income (Class I) | | | (415,416 | ) | | | (467,597 | ) |
From net realized gain on investments (Class S) | | | — | | | | (5,914,586 | ) |
From net realized gain on investments (Class I) | | | — | | | | (472,249 | ) |
| | | | | | | | |
| | |
Total distributions to shareholders | | | (3,907,346 | ) | | | (17,216,032 | ) |
| | | | | | | | |
| | |
CAPITAL STOCK ISSUED AND REPURCHASED: | | | | | | | | |
| | |
Net increase from capital share transactions (Note 5) | | | 10,790,355 | | | | 10,044,454 | |
| | | | | | | | |
| | |
Net increase in net assets | | | 9,272,892 | | | | 17,839,184 | |
| | |
NET ASSETS: | | | | | | | | |
| | |
Beginning of period | | | 193,189,135 | | | | 175,349,951 | |
| | | | | | | | |
| | |
End of period (including undistributed net investment income of $1,238,059 and $1,259, respectively) | | $ | 202,462,027 | | | $ | 193,189,135 | |
| | | | | | | | |
The accompanying notes are an integral part of the financial statements.
10
High Yield Bond Series
Financial Highlights - Class S*
| | | | | | | | | | | | | | | | | | | | |
| | | FOR THE SIX
MONTHS ENDED
6/30/13 | | | FOR THE YEARS ENDED | | | FOR THE
PERIOD
9/14/091 TO | |
| | (UNAUDITED) | | | 12/31/12 | | | 12/31/11 | | | 12/31/10 | | | 12/31/09 | |
Per share data (for a share outstanding throughout each period): | | | | | | | | | | | | | | | | | | | | |
Net asset value - Beginning of period | | $ | 10.75 | | | $ | 10.30 | | | $ | 10.74 | | | $ | 10.37 | | | $ | 10.00 | |
| | | | | | | | | | | | | | | | | | | | |
Income from investment operations: | | | | | | | | | | | | | | | | | | | | |
Net investment income2 | | | 0.28 | | | | 0.63 | | | | 0.69 | | | | 0.75 | | | | 0.20 | |
Net realized and unrealized gain (loss) on investments | | | (0.13 | ) | | | 0.83 | | | | (0.17 | ) | | | 0.66 | | | | 0.28 | |
| | | | | | | | | | | | | | | | | | | | |
| | | | | |
Total from investment operations | | | 0.15 | | | | 1.46 | | | | 0.52 | | | | 1.41 | | | | 0.48 | |
| | | | | | | | | | | | | | | | | | | | |
| | | | | |
Less distributions to shareholders: | | | | | | | | | | | | | | | | | | | | |
From net investment income | | | (0.21 | ) | | | (0.64 | ) | | | (0.67 | ) | | | (0.75 | ) | | | (0.10 | ) |
From net realized gain on investments | | | — | | | | (0.37 | ) | | | (0.29 | ) | | | (0.29 | ) | | | (0.01 | ) |
| | | | | | | | | | | | | | | | | | | | |
| | | | | |
Total distributions to shareholders | | | (0.21 | ) | | | (1.01 | ) | | | (0.96 | ) | | | (1.04 | ) | | | (0.11 | ) |
| | | | | | | | | | | | | | | | | | | | |
| | | | | |
Net asset value - End of period | | $ | 10.69 | | | $ | 10.75 | | | $ | 10.30 | | | $ | 10.74 | | | $ | 10.37 | |
| | | | | | | | | | | | | | | | | | | | |
| | | | | |
Net assets - End of period (000’s omitted) | | $ | 182,799 | | | $ | 179,187 | | | $ | 175,350 | | | $ | 158,181 | | | $ | 127,678 | |
| | | | | | | | | | | | | | | | | | | | |
| | | | | |
Total return3 | | | 1.31 | % | | | 14.46 | % | | | 4.87 | % | | | 13.59 | % | | | 4.82 | % |
Ratios (to average net assets)/ Supplemental Data: | | | | | | | | | | | | | | | | | | | | |
Expenses** | | | 1.13 | %4 | | | 1.10 | % | | | 1.12 | % | | | 1.14 | % | | | 1.20 | %4 |
Net investment income | | | 5.07 | %4 | | | 5.83 | % | | | 6.26 | % | | | 6.79 | % | | | 6.51 | %4 |
Portfolio turnover | | | 54 | % | | | 91 | % | | | 63 | % | | | 54 | % | | | 22 | % |
|
* Effective August 1, 2012, the shares of the Series have been designated as Class S. ** For certain periods presented, the investment advisor did not impose all or a portion of its management and/or other fees, and in some periods may have paid a portion of the Series’ expenses. If these expenses had been incurred by the Series, the expense ratio (to average net assets) would have increased by the following amounts: | |
| | | | | |
| | | N/A | | | | N/A | | | | N/A | | | | 0.00 | %5 | | | 0.02 | %4 |
1Commencement of operations.
2Calculated based on average shares outstanding during the periods.
3Represents aggregate total return for the periods indicated, and assumes reinvestment of all distributions. Total return would have been lower had certain expenses not been waived during certain periods. Periods less than one year are not annualized.
4Annualized.
5Less than 0.01%.
The accompanying notes are an integral part of the financial statements.
11
High Yield Bond Series
Financial Highlights - Class I
| | | | | | | | |
| | | FOR THE SIX
MONTHS ENDED
6/30/2013
(UNAUDITED) | | | FOR THE PERIOD
8/1/121 TO
12/31/12 | |
Per share data (for a share outstanding throughout each period): | | | | | | | | |
Net asset value - Beginning of period | | $ | 9.78 | | | $ | 10.00 | |
| | | | | | | | |
Income (loss) from investment operations: | | | | | | | | |
Net investment income2 | | | 0.26 | | | | 0.25 | |
Net realized and unrealized gain (loss) on investments | | | (0.12 | ) | | | 0.30 | |
| | | | | | | | |
| | |
Total from investment operations | | | 0.14 | | | | 0.55 | |
| | | | | | | | |
| | |
Less distributions to shareholders: | | | | | | | | |
From net investment income | | | (0.22 | ) | | | (0.40 | ) |
From net realized gain on investments | | | — | | | | (0.37 | ) |
| | | | | | | | |
| | |
Total distributions to shareholders | | | (0.22 | ) | | | (0.77 | ) |
| | | | | | | | |
| | |
Net asset value - End of period | | $ | 9.70 | | | $ | 9.78 | |
| | | | | | | | |
| | |
Net assets - End of period (000’s omitted) | | $ | 19,663 | | | $ | 14,002 | |
| | | | | | | | |
| | |
Total return3 | | | 1.37 | % | | | 5.59 | % |
Ratios (to average net assets)/ Supplemental Data: | | | | | | | | |
Expenses4 | | | 0.88 | % | | | 0.87 | % |
Net investment income4 | | | 5.33 | % | | | 5.90 | % |
Portfolio turnover | | | 54 | % | | | 91 | % |
1Commencement of operations.
2Calculated based on average shares outstanding during the periods.
3Represents aggregate total return for the periods indicated, and assumes reinvestment of all distributions. Periods less than one year are not annualized.
4Annualized.
The accompanying notes are an integral part of the financial statements.
12
High Yield Bond Series
Notes to Financial Statements
(unaudited)
High Yield Bond Series (the “Series”) is a no-load non-diversified series of Manning & Napier Fund, Inc. (the “Fund”). The Fund is organized in Maryland and is registered under the Investment Company Act of 1940, as amended, as an open-end management investment company.
The Series’ investment objective is to provide a high level of long-term total return by investing principally in non-investment grade fixed income securities that are issued by government and corporate entities.
The Fund’s advisor is Manning & Napier Advisors, LLC (the “Advisor”). Shares of the Series are offered to investors, clients and employees of the Advisor and its affiliates. The series is authorized to issue two classes of shares (Class S & Class I). Each class of shares is substantially the same, except that Class S shares bear shareholder service fees. The total authorized capital stock of the Fund consists of 15 billion shares of common stock each having a par value of $0.01. As of June 30, 2013, 10.3 billion shares have been designated in total among 42 series, of which 125 million have been designated as High Yield Bond Series Class S common stock and 100 million shares have been designated as High Yield Bond Class I common stock.
| 2. | Significant Accounting Policies |
Security Valuation
Portfolio securities, including domestic equities, foreign equities, warrants and options, listed on an exchange other than the NASDAQ Stock Market are valued at the latest quoted sales price of the exchange on which the security is primarily traded. Securities not traded on valuation date or securities not listed on an exchange are valued at the latest quoted bid price provided by the Fund’s pricing service. Securities listed on the NASDAQ Stock Market are valued in accordance with the NASDAQ Official Closing Price.
Debt securities, including government bonds, foreign bonds, asset-backed securities, structured notes, supranational obligations, sovereign bonds, corporate bonds and mortgage-backed securities will normally be valued on the basis of evaluated bid prices provided directly by an independent pricing service. The pricing services use multiple valuation techniques to determine fair value. In instances where sufficient market activity exists, the pricing services may utilize a market-based approach through which quotes from market makers are used to determine fair value. In instances where sufficient market activity may not exist or is limited, the pricing services also utilize proprietary valuation models which may consider market characteristics such as benchmark yield curves, option-adjusted spreads, credit spreads, estimated default rates, coupon rates, anticipated timing of principal repayments, underlying collateral, and other unique security features in order to estimate the relevant cash flows, which are then discounted to calculate the fair value. Certain investments in securities held by the Series may be valued on a basis of a price provided directly by a principal market maker. These prices may differ from the value that would have been used had a broader market for securities existed.
Short-term investments that mature in sixty days or less are valued at amortized cost, which approximates fair value. Investments in open-end investment companies are valued at their net asset value per share on valuation date.
Volume and level of activity in established markets for an asset or liability are evaluated to determine whether recent transactions and quoted prices are determinative of fair value. Where there have been significant decreases in volume and level of activity, further analysis and adjustment may be necessary to estimate fair value. The Series measures fair value in these instances by the use of inputs and valuation techniques which may be based upon current market prices of securities that are comparable in coupon, rating, maturity and industry and/or expectation of future cash flows. As a result of trading in relatively thin markets and/or markets that experience significant volatility, the prices used by the Series to value these securities may differ from the value that would be realized if these securities were sold, and the differences could be material.
Securities for which representative valuations or prices are not available from the Series’ pricing service may be valued at fair value as determined in good faith by the Advisor under procedures approved by and under the general supervision and responsibility of the Fund’s Board of Directors (the “Board”). Due to the inherent uncertainty of valuations of such securities, the fair value may differ significantly from the values that would have been used had a ready market for such securities existed. If
13
High Yield Bond Series
Notes to Financial Statements (continued)
(unaudited)
| 2. | Significant Accounting Policies (continued) |
Security Valuation (continued)
trading or events occurring after the close of the principal market in which securities are traded are expected to materially affect the value of those securities, then they may be valued at their fair value, taking this trading or these events into account.
Various inputs are used in determining the value of the Series’ assets or liabilities carried at fair value. These inputs are summarized in three broad levels. Level 1 includes quoted prices in active markets for identical assets and liabilities. Level 2 includes other significant observable inputs (including quoted prices for similar securities, interest rates, prepayment speeds, credit risk, etc.). Level 3 includes significant unobservable inputs (including the Series’ own assumptions in determining the fair value of investments). A financial instrument’s level within the fair value hierarchy is based on the lowest level of any input both individually and in aggregate that is significant to the fair value measurement. The inputs or methodology used for valuing securities are not necessarily an indication of the risk associated with investing in those securities.
The following is a summary of the valuation levels used for major security types as of June 30, 2013 in valuing the Series’ assets or liabilities carried at fair value:
| | | | | | | | | | | | | | | | |
| DESCRIPTION | | TOTAL | | | LEVEL 1 | | | LEVEL 2 | | | LEVEL 3 | |
Assets: | | | | | | | | | | | | | | | | |
Debt securities: | | | | | | | | | | | | | | | | |
Corporate debt: | | | | | | | | | | | | | | | | |
Consumer Discretionary | | $ | 33,444,205 | | | $ | — | | | $ | 33,444,205 | | | $ | — | |
Consumer Staples | | | 11,994,928 | | | | — | | | | 11,994,928 | | | | — | |
Energy | | | 30,345,925 | | | | — | | | | 30,345,925 | | | | — | |
Financials | | | 26,977,025 | | | | — | | | | 26,977,025 | | | | — | |
Health Care | | | 16,474,406 | | | | — | | | | 16,474,406 | | | | — | |
Industrials | | | 34,584,346 | | | | — | | | | 34,584,346 | | | | — | |
Information Technology | | | 9,255,625 | | | | — | | | | 9,255,625 | | | | — | |
Materials | | | 17,786,700 | | | | — | | | | 17,786,700 | | | | — | |
Telecommunication Services | | | 10,312,075 | | | | — | | | | 10,312,075 | | | | — | |
Utilities | | | 1,948,187 | | | | — | | | | 1,948,187 | | | | — | |
Mutual fund | | | 3,833,468 | | | | 3,833,468 | | | | — | | | | — | |
| | | | | | | | | | | | | | | | |
Total assets | | $ | 196,956,890 | | | $ | 3,833,468 | | | $ | 193,123,422 | | | $ | — | |
| | | | | | | | | | | | | | | | |
There were no Level 3 securities held by the Series as of December 31, 2012 or June 30, 2013.
The Fund’s policy is to recognize transfers in and transfers out of the valuation levels as of the beginning of the reporting period. There were no transfers between Level 1 and Level 2 during the six months ended June 30, 2013.
Security Transactions, Investment Income and Expenses
Security transactions are accounted for on trade date. Dividend income is recorded on the ex-dividend date, except that if the ex-dividend date has passed, certain dividends from foreign securities are recorded as soon as the Series is informed of the ex-dividend date. Non-cash dividends, if any, are recorded at the fair value of the securities received. Interest income, including amortization of premium and accretion of discounts using the effective interest method, is earned from settlement date and accrued daily.
Expenses are recorded on an accrual basis. Most expenses of the Fund can be attributed to a specific series. Expenses which cannot be directly attributed are apportioned among the series in the Fund in such a manner as deemed equitable by the Fund’s Board, taking into consideration, among other things, the nature and type of expense.
The Series uses the identified cost method for determining realized gain or loss on investments for both financial statement and federal income tax reporting purposes.
14
High Yield Bond Series
Notes to Financial Statements (continued)
(unaudited)
| 2. | Significant Accounting Policies (continued) |
Foreign Currency Translation
The books and records of the Series are maintained in U.S. dollars. Foreign currencies, investments and other assets and liabilities are translated into U.S. dollars at the current exchange rates. Purchases and sales of investment securities and income and expenses are translated on the respective dates of such transactions. The Series does not isolate realized and unrealized gains and losses attributable to changes in the exchange rates from gains and losses that arise from changes in the fair value of investments. Such fluctuations are included with net realized and unrealized gain or loss on investments. Net realized foreign currency gains and losses represent foreign currency gains and losses between trade date and settlement date on securities transactions, gains and losses on disposition of foreign currencies and the difference between the amount of income and foreign withholding taxes recorded on the books of the Series and the amounts actually received or paid.
Restricted Securities
Restricted securities are purchased in private placement transactions, are not registered under the Securities Act of 1933, as amended, and may have contractual restrictions on resale. Information regarding restricted securities is included at the end of the Series’ Investment Portfolio.
Illiquid Securities
A security may be considered illiquid if so deemed in good faith by the Advisor under procedures approved by and under the general supervision and responsibility of the Fund’s Board. Securities that are illiquid are marked with the applicable footnote on the Investment Portfolio. No such investments were held by the Series on June 30, 2013.
Federal Taxes
The Series’ policy is to comply with the provisions of the Internal Revenue Code applicable to regulated investment companies. The Series is not subject to federal income tax or excise tax to the extent that the Series distributes to shareholders each year its taxable income, including any net realized gains on investments, in accordance with requirements of the Internal Revenue Code. Accordingly, no provision for federal income tax or excise tax has been made in the financial statements.
Management evaluates its tax positions to determine if the tax positions taken meet the minimum recognition threshold in connection with accounting for uncertainties in income tax positions taken or expected to be taken for the purposes of measuring and recognizing tax liabilities in the financial statements. Recognition of tax benefits of an uncertain tax position is required only when the position is “more likely than not” to be sustained assuming examination by taxing authorities. At June 30, 2013, the Series has recorded no liability for net unrecognized tax benefits relating to uncertain income tax positions taken or expected to be taken in future tax returns.
The Series files income tax returns in the U.S. federal jurisdiction, various states and foreign jurisdictions, as required. No income tax returns are currently under investigation. The statute of limitations on the Series’ tax returns remains open for the period ended December 31, 2009 and the years ended December 31, 2010 through December 31, 2012. The Series is not aware of any tax positions for which it is reasonably possible that the total amounts of unrecognized tax benefits will significantly change in the next twelve months.
Foreign Taxes
Based on the Series’ understanding of the tax rules and rates related to income, gains and currency purchase/repatriation transactions for foreign jurisdictions in which it invests, the Series will provide for foreign taxes, and where appropriate, deferred foreign tax.
Distributions of Income and Gains
Distributions to shareholders of net investment income are made quarterly. Distributions of net realized gains are made annually. An additional distribution may be necessary to avoid taxation of the Series. Distributions are recorded on the ex-dividend date.
Indemnifications
The Fund’s organizational documents provide former and current directors and officers with a limited indemnification against liabilities arising in connection with the performance of their duties to the Fund. In the normal course of business, the Fund may
15
High Yield Bond Series
Notes to Financial Statements (continued)
(unaudited)
| 2. | Significant Accounting Policies (continued) |
Indemnifications (continued)
also enter into contracts that provide general indemnifications. The Fund’s maximum exposure under these arrangements is unknown as this would be dependent on future claims that may be made against the Fund. The risk of material loss from such claims is considered remote.
Other
The preparation of financial statements in conformity with accounting principles generally accepted in the United States of America requires management to make estimates and assumptions that affect the reported amounts of assets and liabilities and the disclosure of contingent assets and liabilities at the date of the financial statements and the reported amounts of income and expenses during the reporting period. Actual results could differ from those estimates.
| 3. | Transactions with Affiliates |
The Fund has an Investment Advisory Agreement (the “Agreement”) with the Advisor, for which the Series pays a fee, computed daily and payable monthly, at an annual rate of 0.75% of the Series’ average daily net assets.
Under the Agreement, personnel of the Advisor provide the Series with advice and assistance in the choice of investments and the execution of securities transactions, and otherwise maintain the Series’ organization. The Advisor also provides the Fund with necessary office space and fund administration and support services. The salaries of all officers of the Fund (except a percentage of the Fund’s Chief Compliance Officer’s salary, which is paid by the Fund), and of all Directors who are “affiliated persons” of the Fund, or of the Advisor, and all personnel of the Fund, or of the Advisor, performing services relating to research, statistical and investment activities, are paid by the Advisor. Each “non-affiliated” Director receives an annual stipend, which is allocated among all the active series of the Fund. In addition, these Directors also receive a fee per Board meeting attended plus a fee for each committee meeting attended.
The Class S shares of the Series are subject to a shareholder service fee in accordance with a shareholder service plan adopted by the Board. The shareholder service fee is intended to compensate financial intermediaries, including affiliates of the Fund, in connection with the provision of direct client service, personal services, maintenance of shareholder accounts and reporting services. For these services, Class S of the Series pays a fee, computed daily and payable monthly, at an annual rate of 0.25% of the average daily net assets of Class S. The Fund has a Shareholder Services Agreement with the Advisor, for which the Advisor receives the shareholder services fee as stated above.
The Advisor has contractually agreed, until at least April 30, 2014, to waive its management fee and, if necessary, pay other operating expenses of the Series in order to maintain total direct annual fund operating expenses for the Series, exclusive of shareholder service fees, at no more than 0.95% of average daily net assets. The Advisor did not waive any fees for the six months ended June 30, 2013. The Advisor is not eligible to recoup any expenses that have been waived or reimbursed in prior years.
Manning & Napier Investor Services, Inc., a registered broker-dealer affiliate of the Advisor, acts as distributor for the Fund’s shares. The services of Manning & Napier Investor Services, Inc. are provided at no additional cost to the Series.
The Advisor has agreements with BNY Mellon Investment Servicing (U.S.) Inc. (“BNY”) under which BNY serves as sub-accountant services agent and sub-transfer agent. The Fund pays the Advisor an annual fee related to fund accounting and administration of 0.0175% on the first $3 billion of average daily net assets (excluding Target Series and Strategic Income Series); 0.015% on the next $3 billion of average daily net assets (excluding Target Series and Strategic Income Series); and 0.01% of the average daily net assets in excess of $6 billion (excluding Target Series and Strategic Income Series); plus a base fee of $25,500 per series. Transfer Agent fees are charged to the Fund on a per account basis. Additionally, certain transaction and cusip-based fees and out-of-pocket expenses, including charges for reporting relating to the Fund’s compliance program, are charged. Effective October 1, 2012, the aforementioned agreements were modified to reduce the annual fee related to fund accounting and administration, as well as transfer agent fees, by 10%, excluding out-of-pocket expenses.
16
High Yield Bond Series
Notes to Financial Statements (continued)
(unaudited)
| 3. | Transactions with Affiliates (continued) |
Expenses not directly attributable to a series are allocated based on each series’ relative net assets or number of accounts, depending on the expense.
| 4. | Purchases and Sales of Securities |
For the six months ended June 30, 2013, purchases and sales of securities, other than U.S. Government securities and short-term securities, were $116,771,694 and $105,761,869 respectively. There were no purchases or sales of U.S. Government securities.
| 5. | Capital Stock Transactions |
Transactions in shares of Class S and Class I shares of High Yield Bond Series were:
| | | | | | | | | | | | | | | | |
| | | FOR THE SIX MONTHS ENDED 6/30/13 | | | FOR THE YEAR ENDED 12/31/12 | |
| CLASS S | | SHARES | | | AMOUNT | | | SHARES | | | AMOUNT | |
Sold | | | 1,385,023 | | | $ | 15,208,363 | | | | 2,014,989 | | | $ | 21,922,842 | |
Reinvested | | | 306,821 | | | | 3,347,061 | | | | 1,474,830 | | | | 15,828,509 | |
Repurchased | | | (1,248,981 | ) | | | (13,687,033 | ) | | | (3,857,491 | ) | | | (42,040,705 | ) |
| | | | | | | | | | | | | | | | |
Total | | | 442,863 | | | $ | 4,868,391 | | | | (367,672 | ) | | $ | (4,289,354 | ) |
| | | | | | | | | | | | | | | | |
| | | | | | | | | | | | | | | | |
| | | FOR THE SIX MONTHS ENDED 6/30/13 | | | FOR THE PERIOD 8/1/12
(COMMENCEMENT OF
OPERATIONS) TO 12/31/12 | |
| CLASS I | | SHARES | | | AMOUNT | | | SHARES | | | AMOUNT | |
Sold | | | 556,340 | | | $ | 5,536,837 | | | | 1,360,330 | | | $ | 13,642,660 | |
Reinvested | | | 40,420 | | | | 400,419 | | | | 94,180 | | | | 923,980 | |
Repurchased | | | (1,521 | ) | | | (15,292 | ) | | | (23,023 | ) | | | (232,832 | ) |
| | | | | | | | | | | | | | | | |
Total | | | 595,239 | | | $ | 5,921,964 | | | | 1,431,487 | | | $ | 14,333,808 | |
| | | | | | | | | | | | | | | | |
Substantially all of the Series’ shares represent investments by fiduciary accounts over which the Advisor has sole investment discretion.
The Series may trade in instruments including written and purchased options, forward foreign currency exchange contracts and futures contracts and other derivatives in the normal course of investing activities to assist in managing exposure to various market risks. The Series may be subject to various elements of risk, which may involve, to a varying degree, elements of risk in excess of the amounts recognized for financial statement purposes. These risks include: the risk that changes in the value of a derivative may not correlate perfectly with the underlying asset, rate or index; counterparty credit risk related to over the counter derivative counterparties’ failure to perform under contract terms; liquidity risk related to the lack of a liquid market for these contracts allowing the fund to close out its position(s); and documentation risk relating to disagreement over contract terms. No such investments were held by the Series as of June 30, 2013.
17
High Yield Bond Series
Notes to Financial Statements (continued)
(unaudited)
Investing in securities of foreign companies and foreign governments involves special risks and considerations not typically associated with investing in securities of domestic companies and the U.S. Government. These risks include revaluation of currencies and future adverse political and economic developments. Moreover, securities of foreign companies and foreign governments and their markets may be less liquid and their prices more volatile than those of comparable domestic companies and the U.S. Government.
| 8. | Federal Income Tax Information |
The amount and characterization of certain income and capital gains to be distributed are determined in accordance with federal income tax regulations, which may differ from accounting principles generally accepted in the United States of America. The Series may periodically make reclassifications among its capital accounts to reflect income and gains available for distribution (or available capital loss carryovers) under income tax regulations, without impacting the Series’ net asset value. Any such reclassifications are not reflected in the financial highlights.
The final determination of the tax character of current year distributions will be made at the conclusion of the fiscal year. The tax character of distributions paid for the year ended December 31, 2012 was as follows:
| | | | | | |
Ordinary income | | $ | 14,255,662 | | | |
Long-term capital gains | | | 2,960,370 | | | |
At June 30, 2013, the identified cost for federal income tax purposes, the resulting gross unrealized appreciation and depreciation, and the net unrealized appreciation were as follows:
| | | | |
Cost for federal income tax purposes | | $ | 196,941,814 | |
Unrealized appreciation | | | 3,226,927 | |
Unrealized depreciation | | | (3,211,851 | ) |
| | | | |
Net unrealized appreciation | | $ | 15,076 | |
| | | | |
18
High Yield Bond Series
Literature Requests
(unaudited)
Proxy Voting Policies and Procedures
A description of the policies and procedures that the Fund uses to determine how to vote proxies relating to portfolio securities is available, without charge, upon request:
| | | | |
| By phone | | 1-800-466-3863 | | |
| On the Securities and Exchange | | | | |
| Commission’s (SEC) web site | | http://www.sec.gov | | |
Proxy Voting Record
Information regarding how the Fund voted proxies relating to portfolio securities during the most recent 12-month period ended June 30th is available, without charge, upon request:
| | | | |
| By phone | | 1-800-466-3863 | | |
| On the SEC’s web site | | http://www.sec.gov | | |
Quarterly Portfolio Holdings
The Series’ complete schedule of portfolio holdings for the 1st and 3rd quarters of each fiscal year are provided on Form N-Q, and are available, without charge, upon request:
| | | | |
| By phone | | 1-800-466-3863 | | |
| On the SEC’s web site | | http://www.sec.gov | | |
The Series’ Form N-Q may be reviewed and copied at the SEC’s Public Reference Room in Washington, D.C. Information on the operation of the Public Reference Room may be obtained by calling 1-800-SEC-0330.
Prospectus and Statement of Additional Information (SAI)
The prospectus and SAI provide additional information about each Series, including charges, expenses and risks. These documents are available, without charge, upon request:
| | | | |
| By phone | | 1-800-466-3863 | | |
| On the SEC’s web site | | http://www.sec.gov | | |
| On our web site | | http://www.manning-napier.com | | |
Additional information available at www.manning-napier.com
1. Fund Holdings - Month-End
2. Fund Holdings - Quarter-End
3. Shareholder Report - Annual
4. Shareholder Report - Semi-Annual
The Fund also offers electronic notification or “e-delivery” when certain documents are available on-line to be downloaded or reviewed. Direct shareholders can elect to receive electronic notification when shareholder reports, prospectus updates, and/or statements are available. If you do not currently have on-line access to your account, you can establish access by going to www.manning-napier.com, click on “Login” in the top corner of the page, and follow the prompts to self-enroll. Once enrolled, you can set your electronic notification preferences by clicking on the Account Options tab located within the green toolbar and then select E-Delivery Option. Should you have any questions on either how to establish on-line access or how to update your account settings, please contact Investor Services at 1-800-466-3863.
MNHYB-6/13-SAR
| | | | | | |
| | | | INFLATION FOCUS EQUITY SERIES | | |
www.manning-napier.com | | | | |
Inflation Focus Equity Series
Shareholder Expense Example
(unaudited)
As a shareholder of the Series, you may incur two types of costs: (1) transaction costs and (2) ongoing costs, including management fees and other Series expenses. This example is intended to help you understand your ongoing costs (in dollars) of investing in the Series and to compare these costs with the ongoing costs of investing in other mutual funds.
The example is based on an investment of $1,000 invested at the beginning of the period and held for the entire period (January 1, 2013 to June 30, 2013).
Actual Expenses
The first line of the table below provides information about actual account values and actual expenses. You may use the information in this line, together with the amount you invested, to estimate the expenses that you paid over the period. Simply divide your account value by $1,000 (for example, an $8,600 account value divided by $1,000 = 8.6), then multiply the result by the number in the first line under the heading entitled “Expenses Paid During Period” to estimate the expenses you paid on your account during this period.
Hypothetical Example for Comparison Purposes
The second line of the table below provides information about hypothetical account values and hypothetical expenses based on the Series’ actual expense ratio and an assumed rate of return of 5% per year before expenses, which is not the Series’ actual return. The hypothetical account values and expenses may not be used to estimate the actual ending account balance or expenses you paid during the period. You may use this information to compare the ongoing costs of investing in the Series and other funds. To do so, compare this 5% hypothetical example with the 5% hypothetical examples that appear in the shareholder reports of the other funds.
Please note that the expenses shown in the table are meant to highlight your ongoing costs only and do not reflect any transaction costs. Therefore, the second line of the table is useful in comparing ongoing costs only, and will not help you determine the relative total costs of owning different funds. In addition, if these transaction costs were included, your costs would have been higher.
| | | | | | |
| | | BEGINNING ACCOUNT VALUE 1/1/13 | | ENDING ACCOUNT VALUE
6/30/13 | | EXPENSES PAID DURING PERIOD*
1/1/13-6/30/13 |
Actual | | $1,000.00 | | $1,025.30 | | $6.03 |
Hypothetical (5% return before expenses) | | $1,000.00 | | $1,018.84 | | $6.01 |
*Expenses are equal to the Series’ annualized expense ratio (for the six-month period) of 1.20%, multiplied by the average account value over the period, multiplied by 181/365 (to reflect the one-half year period). Expenses are based on the most recent fiscal half year. The Series’ total return would have been lower had certain expenses not been waived during the period.
1
Inflation Focus Equity Series
Portfolio Composition as of June 30, 2013
(unaudited)
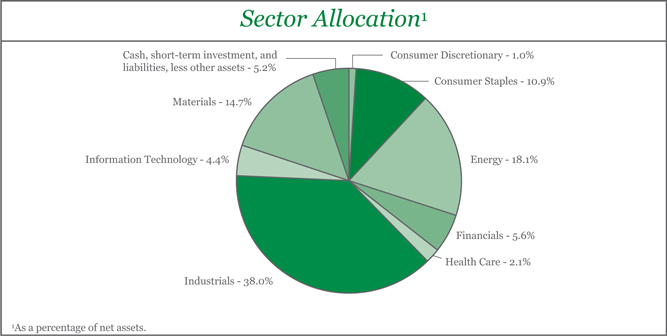
| | | | | | | | | | |
Top Ten Stock Holdings2 | |
Westport Innovations, Inc. - ADR (Canada) | | | 3.4% | | | Syngenta AG (Switzerland) | | | 3.0% | |
Cameron International Corp. | | | 3.3% | | | Pentair Ltd. - ADR | | | 3.0% | |
DuPont Fabros Technology, Inc. | | | 3.2% | | | Pall Corp. | | | 2.9% | |
Xylem, Inc. | | | 3.1% | | | Monsanto Co. | | | 2.8% | |
Ingredion, Inc. | | | 3.0% | | | Hess Corp. | | | 2.6% | |
2As a percentage of total investments. | | | | | | | | | | |
2
Inflation Focus Equity Series
Investment Portfolio - June 30, 2013
(unaudited)
| | | | | | | | | | |
| | | SHARES | | | VALUE (NOTE 2) | | | |
| | | |
COMMON STOCKS - 94.8% | | | | | | | | | | |
| | | |
Consumer Discretionary - 1.0% | | | | | | | | | | |
Auto Components - 1.0% | | | | | | | | | | |
BorgWarner, Inc.* | | | 11,830 | | | $ | 1,019,155 | | | |
| | | | | | | | | | |
Consumer Staples - 10.9% | | | | | | | | | | |
Food & Staples Retailing - 3.8% | | | | | | | | | | |
The Fresh Market, Inc.* | | | 19,520 | | | | 970,534 | | | |
United Natural Foods, Inc.* | | | 18,730 | | | | 1,011,233 | | | |
Whole Foods Market, Inc. | | | 33,790 | | | | 1,739,509 | | | |
| | | | | | | | | | |
| | | |
| | | | | | | 3,721,276 | | | |
| | | | | | | | | | |
Food Products - 7.1% | | | | | | | | | | |
Annie’s, Inc.* | | | 12,440 | | | | 531,686 | | | |
Glanbia plc (Ireland)*1 | | | 75,080 | | | | 1,011,478 | | | |
The Hain Celestial Group, Inc.* | | | 15,410 | | | | 1,001,188 | | | |
Ingredion, Inc. | | | 46,770 | | | | 3,069,047 | | | |
Mead Johnson Nutrition Co. | | | 18,840 | | | | 1,492,693 | | | |
| | | | | | | | | | |
| | | |
| | | | | | | 7,106,092 | | | |
| | | | | | | | | | |
| | | |
Total Consumer Staples | | | | | | | 10,827,368 | | | |
| | | | | | | | | | |
| | | |
Energy - 18.1% | | | | | | | | | | |
Energy Equipment & Services - 11.4% | | | | | | | | | | |
Baker Hughes, Inc. | | | 32,620 | | | | 1,504,761 | | | |
Bourbon S.A. (France)1 | | | 20,600 | | | | 535,043 | | | |
Cameron International Corp.* | | | 55,390 | | | | 3,387,652 | | | |
Core Laboratories N.V. - ADR | | | 6,390 | | | | 969,107 | | | |
Fugro N.V. (Netherlands)1 | | | 17,300 | | | | 940,014 | | | |
Gulfmark Offshore, Inc. - Class A | | | 24,100 | | | | 1,086,669 | | | |
Hornbeck Offshore Services, Inc.* | | | 800 | | | | 42,800 | | | |
National Oilwell Varco, Inc. | | | 14,230 | | | | 980,447 | | | |
Prosafe SE (Norway)1 | | | 112,900 | | | | 992,785 | | | |
Schlumberger Ltd. | | | 13,590 | | | | 973,859 | | | |
| | | | | | | | | | |
| | | |
| | | | | | | 11,413,137 | | | |
| | | | | | | | | | |
Oil, Gas & Consumable Fuels - 6.7% | | | | | | | | | | |
Chesapeake Energy Corp. | | | 24,450 | | | | 498,291 | | | |
Encana Corp. (Canada) | | | 88,410 | | | | 1,497,665 | | | |
EOG Resources, Inc. | | | 7,800 | | | | 1,027,104 | | | |
Hess Corp. | | | 39,880 | | | | 2,651,621 | | | |
Range Resources Corp. | | | 12,620 | | | | 975,778 | | | |
| | | | | | | | | | |
| | | |
| | | | | | | 6,650,459 | | | |
| | | | | | | | | | |
| | | |
Total Energy | | | | | | | 18,063,596 | | | |
| | | | | | | | | | |
| | | |
Financials - 5.6% | | | | | | | | | | |
Real Estate Investment Trusts (REITS) - 5.6% | | | | | | | | | | |
Digital Realty Trust, Inc. | | | 38,620 | | | | 2,355,820 | | | |
The accompanying notes are an integral part of the financial statements.
3
Inflation Focus Equity Series
Investment Portfolio - June 30, 2013
(unaudited)
| | | | | | | | | | |
| | | SHARES | | | VALUE (NOTE 2) | | | |
| | | |
COMMON STOCKS (continued) | | | | | | | | | | |
| | | |
Financials (continued) | | | | | | | | | | |
Real Estate Investment Trusts (REITS) (continued) | | | | | | | | | | |
DuPont Fabros Technology, Inc. | | | 132,420 | | | $ | 3,197,943 | | | |
| | | | | | | | | | |
| | | |
Total Financials | | | | | | | 5,553,763 | | | |
| | | | | | | | | | |
| | | |
Health Care - 2.1% | | | | | | | | | | |
Health Care Equipment & Supplies - 2.1% | | | | | | | | | | |
Neogen Corp.* | | | 36,620 | | | | 2,034,607 | | | |
| | | | | | | | | | |
Industrials - 38.0% | | | | | | | | | | |
Air Freight & Logistics - 1.0% | | | | | | | | | | |
C.H. Robinson Worldwide, Inc. | | | 17,650 | | | | 993,872 | | | |
| | | | | | | | | | |
Electrical Equipment - 3.4% | | | | | | | | | | |
Polypore International, Inc.* | | | 61,270 | | | | 2,469,181 | | | |
Schneider Electric S.A. (France)1 | | | 13,390 | | | | 972,466 | | | |
| | | | | | | | | | |
| | | |
| | | | | | | 3,441,647 | | | |
| | | | | | | | | | |
Machinery - 23.2% | | | | | | | | | | |
AGCO Corp. | | | 39,220 | | | | 1,968,452 | | | |
Deere & Co. | | | 10,390 | | | | 844,187 | | | |
FANUC Corp. (Japan)1 | | | 12,900 | | | | 1,866,977 | | | |
Joy Global, Inc. | | | 30,110 | | | | 1,461,238 | | | |
Kennametal, Inc. | | | 49,940 | | | | 1,939,170 | | | |
KUKA AG (Germany)1 | | | 35,240 | | | | 1,487,741 | | | |
Lindsay Corp. | | | 13,400 | | | | 1,004,732 | | | |
Pall Corp. | | | 44,470 | | | | 2,954,142 | | | |
Pentair Ltd. - ADR | | | 51,940 | | | | 2,996,419 | | | |
Westport Innovations, Inc. - ADR (Canada)* | | | 102,420 | | | | 3,434,143 | | | |
Xylem, Inc. | | | 116,090 | | | | 3,127,465 | | | |
| | | | | | | | | | |
| | | |
| | | | | | | 23,084,666 | | | |
| | | | | | | | | | |
Professional Services - 2.0% | | | | | | | | | | |
ALS Ltd. (Australia)1 | | | 230,020 | | | | 2,002,403 | | | |
| | | | | | | | | | |
Trading Companies & Distributors - 4.8% | | | | | | | | | | |
Brenntag AG (Germany)1 | | | 13,590 | | | | 2,065,569 | | | |
Fastenal Co. | | | 43,340 | | | | 1,987,139 | | | |
MSC Industrial Direct Co., Inc. - Class A | | | 9,410 | | | | 728,899 | | | |
| | | | | | | | | | |
| | | |
| | | | | | | 4,781,607 | | | |
| | | | | | | | | | |
Transportation Infrastructure - 3.6% | | | | | | | | | | |
Groupe Eurotunnel S.A. (France)1 | | | 220,610 | | | | 1,677,503 | | | |
Koninklijke Vopak N.V. (Netherlands)1 | | | 32,890 | | | | 1,941,270 | | | |
| | | | | | | | | | |
| | | |
| | | | | | | 3,618,773 | | | |
| | | | | | | | | | |
| | | |
Total Industrials | | | | | | | 37,922,968 | | | |
| | | | | | | | | | |
The accompanying notes are an integral part of the financial statements.
4
Inflation Focus Equity Series
Investment Portfolio - June 30, 2013
(unaudited)
| | | | | | | | | | |
| | | SHARES | | | VALUE (NOTE 2) | | | |
| | | |
COMMON STOCKS (continued) | | | | | | | | | | |
| | | |
Information Technology - 4.4% | | | | | | | | | | |
Computers & Peripherals - 1.1% | | | | | | | | | | |
Stratasys Ltd.* | | | 12,680 | | | $ | 1,061,823 | | | |
| | | | | | | | | | |
Electronic Equipment, Instruments & Components - 1.3% | | | | | | | | | | |
Maxwell Technologies, Inc.* | | | 182,780 | | | | 1,306,877 | | | |
| | | | | | | | | | |
Software - 2.0% | | | | | | | | | | |
Aspen Technology, Inc.* | | | 17,010 | | | | 489,718 | | | |
Aveva Group plc (United Kingdom)1 | | | 43,550 | | | | 1,492,980 | | | |
| | | | | | | | | | |
| | | |
| | | | | | | 1,982,698 | | | |
| | | | | | | | | | |
| | | |
Total Information Technology | | | | | | | 4,351,398 | | | |
| | | | | | | | | | |
| | | |
Materials - 14.7% | | | | | | | | | | |
Chemicals - 12.5% | | | | | | | | | | |
Johnson Matthey plc (United Kingdom)1 | | | 63,620 | | | | 2,541,949 | | | |
Monsanto Co. | | | 28,230 | | | | 2,789,124 | | | |
Nufarm Ltd. (Australia)1 | | | 475,100 | | | | 2,015,081 | | | |
Syngenta AG (Switzerland)1 | | | 7,840 | | | | 3,057,277 | | | |
Umicore S.A. (Belgium)1 | | | 51,120 | | | | 2,122,738 | | | |
| | | | | | | | | | |
| | | |
| | | | | | | 12,526,169 | | | |
| | | | | | | | | | |
Metals & Mining - 2.2% | | | | | | | | | | |
Alumina Ltd. (Australia)*1 | | | 1,072,590 | | | | 954,579 | | | |
Schnitzer Steel Industries, Inc. - Class A | | | 51,890 | | | | 1,213,188 | | | |
| | | | | | | | | | |
| | | |
| | | | | | | 2,167,767 | | | |
| | | | | | | | | | |
| | | |
Total Materials | | | | | | | 14,693,936 | | | |
| | | | | | | | | | |
TOTAL COMMON STOCKS | | | | | | | | | | |
(Identified Cost $87,511,586) | | | | | | | 94,466,791 | | | |
| | | | | | | | | | |
| | | |
SHORT-TERM INVESTMENT - 6.7% | | | | | | | | | | |
| | | |
Dreyfus Cash Management, Inc. - Institutional Shares2, 0.05% | | | | | | | | | | |
(Identified Cost $6,687,504) | | | 6,687,504 | | | | 6,687,504 | | | |
| | | | | | | | | | |
| | | |
TOTAL INVESTMENTS - 101.5% | | | | | | | | | | |
(Identified Cost $94,199,090) | | | | | | | 101,154,295 | | | |
LIABILITIES, LESS OTHER ASSETS - (1.5%) | | | | | | | (1,450,308 | ) | | |
| | | | | | | | | | |
| | | |
NET ASSETS - 100% | | | | | | $ | 99,703,987 | | | |
| | | | | | | | | | |
ADR - American Depository Receipt
*Non-income producing security.
1A factor from a third party vendor was applied to determine the security’s fair value following the close of local trading.
2Rate shown is the current yield as of June 30, 2013.
The accompanying notes are an integral part of the financial statements.
5
Inflation Focus Equity Series
Statement of Assets and Liabilities
June 30, 2013 (unaudited)
| | | | |
ASSETS: | | | | |
| |
Investments, at value (identified cost $94,199,090) (Note 2) | | $ | 101,154,295 | |
Cash | | | 136,981 | |
Receivable for fund shares sold | | | 154,908 | |
Dividends receivable | | | 119,962 | |
Foreign tax reclaims receivable | | | 42,946 | |
Prepaid expenses | | | 688 | |
| | | | |
| |
TOTAL ASSETS | | | 101,609,780 | |
| | | | |
| |
LIABILITIES: | | | | |
| |
Accrued management fees (Note 3) | | | 76,064 | |
Accrued fund accounting and administration fees (Note 3) | | | 5,900 | |
Accrued transfer agent fees (Note 3) | | | 2,064 | |
Accrued Directors’ fees (Note 3) | | | 641 | |
Accrued Chief Compliance Officer service fees (Note 3) | | | 339 | |
Payable for securities purchased | | | 1,593,220 | |
Payable for fund shares repurchased | | | 181,963 | |
Other payables and accrued expenses | | | 45,602 | |
| | | | |
| |
TOTAL LIABILITIES | | | 1,905,793 | |
| | | | |
| |
TOTAL NET ASSETS | | $ | 99,703,987 | |
| | | | |
| |
NET ASSETS CONSIST OF: | | | | |
| |
Capital stock | | $ | 87,980 | |
Additional paid-in-capital | | | 91,114,186 | |
Undistributed net investment income | | | 140,303 | |
Accumulated net realized gain on investments, foreign currency and translation of other assets and liabilities | | | 1,410,357 | |
Net unrealized appreciation on investments, foreign currency and translation of other assets and liabilities | | | 6,951,161 | |
| | | | |
| |
TOTAL NET ASSETS | | $ | 99,703,987 | |
| | | | |
| |
NET ASSET VALUE, OFFERING PRICE AND REDEMPTION PRICE PER SHARE - Class A ($99,703,987/8,797,977 shares) | | $ | 11.33 | |
| | | | |
The accompanying notes are an integral part of the financial statements.
6
Inflation Focus Equity Series
Statement of Operations
For the Six Months Ended June 30, 2013 (unaudited)
| | | | |
INVESTMENT INCOME: | | | | |
| |
Dividends (net of foreign taxes withheld, $36,392) | | $ | 674,954 | |
| | | | |
| |
EXPENSES: | | | | |
| |
Management fees (Note 3) | | | 445,542 | |
Fund accounting and administration fees (Note 3) | | | 18,713 | |
Transfer agent fees (Note 3) | | | 7,596 | |
Chief Compliance Officer service fees (Note 3) | | | 1,117 | |
Directors’ fees (Note 3) | | | 426 | |
Custodian fees | | | 7,631 | |
Miscellaneous | | | 57,166 | |
| | | | |
| |
Total Expenses | | | 538,191 | |
| | | | |
| |
Less reduction of expenses (Note 3) | | | (3,540 | ) |
| | | | |
| |
Net Expenses | | | 534,651 | |
| | | | |
| |
NET INVESTMENT INCOME | | | 140,303 | |
| | | | |
| |
REALIZED AND UNREALIZED GAIN (LOSS) ON INVESTMENTS AND FOREIGN CURRENCY: | | | | |
| |
Net realized gain (loss) on-
Investments | | | 1,518,490 | |
Foreign currency and translation of other assets and liabilities | | | (835 | ) |
| | | | |
| |
| | | 1,517,655 | |
| | | | |
Net change in unrealized appreciation (depreciation) on-
Investments | | | (50,565 | ) |
Foreign currency and translation of other assets and liabilities | | | (4,568 | ) |
| | | | |
| |
| | | (55,133 | ) |
| | | | |
| |
NET REALIZED AND UNREALIZED GAIN (LOSS) ON INVESTMENTS AND FOREIGN CURRENCY | | | 1,462,522 | |
| | | | |
| |
NET INCREASE IN NET ASSETS RESULTING FROM OPERATIONS | | $ | 1,602,825 | |
| | | | |
The accompanying notes are an integral part of the financial statements.
7
Inflation Focus Equity Series
Statements of Changes in Net Assets
| | | | | | | | |
| | | FOR THE SIX
MONTHS ENDED 6/30/13 (UNAUDITED) | | | FOR THE
YEAR ENDED 12/31/12 | |
INCREASE (DECREASE) IN NET ASSETS: | | | | | | | | |
| | |
OPERATIONS: | | | | | | | | |
| | |
Net investment income | | $ | 140,303 | | | $ | 355,792 | |
Net realized gain (loss) on investments and foreign currency | | | 1,517,655 | | | | 2,157,793 | |
Net change in unrealized appreciation (depreciation) on investments and foreign currency | | | (55,133 | ) | | | 7,368,181 | |
| | | | | | | | |
| | |
Net increase from operations | | | 1,602,825 | | | | 9,881,766 | |
| | | | | | | | |
| | |
DISTRIBUTIONS TO SHAREHOLDERS (Note 8): | | | | | | | | |
| | |
From net investment income | | | — | | | | (367,886 | ) |
From net realized gain on investments | | | — | | | | (1,816,566 | ) |
| | | | | | | | |
| | |
Total distributions to shareholders | | | — | | | | (2,184,452 | ) |
| | | | | | | | |
| | |
CAPITAL STOCK ISSUED AND REPURCHASED: | | | | | | | | |
| | |
Net increase from capital share transactions (Note 5) | | | 18,987,264 | | | | 2,149,322 | |
| | | | | | | | |
| | |
Net increase in net assets | | | 20,590,089 | | | | 9,846,636 | |
| | |
NET ASSETS: | | | | | | | | |
| | |
Beginning of period | | | 79,113,898 | | | | 69,267,262 | |
| | | | | | | | |
| | |
End of period (including undistributed net investment income of $ 140,303 and $0, respectively) | | $ | 99,703,987 | | | $ | 79,113,898 | |
| | | | | | | | |
The accompanying notes are an integral part of the financial statements.
8
Inflation Focus Equity Series
Financial Highlights
| | | | | | | | | | | | |
| | | FOR THE SIX MONTHS ENDED 6/30/13 (UNAUDITED) | | | FOR THE YEAR ENDED
12/31/12 | | | FOR THE PERIOD
8/23/111 TO 12/31/11 | |
Per share data (for a share outstanding throughout each period): | | | | | | | | | | | | |
Net asset value - Beginning of period | | $ | 11.05 | | | $ | 9.95 | | | $ | 10.00 | |
| | | | | | | | | | | | |
Income (loss) from investment operations: | | | | | | | | | | | | |
Net investment income2 | | | 0.02 | | | | 0.05 | | | | 0.00 | 3 |
Net realized and unrealized gain (loss) on investments | | | 0.26 | | | | 1.36 | | | | (0.05 | ) |
| | | | | | | | | | | | |
| | | |
Total from investment operations | | | 0.28 | | | | 1.41 | | | | (0.05 | ) |
| | | | | | | | | | | | |
| | | |
Less distributions to shareholders: | | | | | | | | | | | | |
From net investment income | | | — | | | | (0.05 | ) | | | — | |
From net realized gain on investments | | | — | | | | (0.26 | ) | | | — | |
| | | | | | | | | | | | |
| | | |
Total distributions to shareholders | | | — | | | | (0.31 | ) | | | — | |
| | | | | | | | | | | | |
| | | |
Net asset value - End of period | | $ | 11.33 | | | $ | 11.05 | | | $ | 9.95 | |
| | | | | | | | | | | | |
| | | |
Net assets - End of period (000’s omitted) | | $ | 99,704 | | | $ | 79,114 | | | $ | 69,267 | |
| | | | | | | | | | | | |
| | | |
Total return4 | | | 2.53 | % | | | 14.26 | % | | | (0.50 | %) |
Ratios (to average net assets)/ Supplemental Data: | | | | | | | | | | | | |
Expenses* | | | 1.20 | %5 | | | 1.20 | % | | | 1.20 | %5 |
Net investment income | | | 0.31 | %5 | | | 0.47 | % | | | 0.60 | %5 |
Portfolio turnover | | | 24 | % | | | 56 | % | | | 9 | % |
|
| * The investment advisor did not impose all or a portion of its management and/or other fees, and in some periods may have paid a portion of the Series’ expenses. If these expenses had been incurred by the Series, the expense ratio (to average net assets) would have increased by the following amount: | |
| | | |
| | | 0.01 | %5 | | | 0.03 | % | | | 0.16 | %5 |
1Commencement of operations.
2Calculated based on average shares outstanding during the periods.
3Less than $0.01.
4Represents aggregate total return for the periods indicated, and assumes reinvestment of all distributions. Total return would have been lower had certain expenses not been waived or reimbursed during certain periods. Periods less than one year are not annualized.
5Annualized.
The accompanying notes are an integral part of the financial statements.
9
Inflation Focus Equity Series
Notes to Financial Statements
(unaudited)
Inflation Focus Equity Series (the “Series”) is a no-load non-diversified series of Manning & Napier Fund, Inc. (the “Fund”). The Fund is organized in Maryland and is registered under the Investment Company Act of 1940, as amended, as an open-end management investment company.
The Series’ investment objective is to provide long-term growth and inflation protection primarily through investment in equity securities that are expected to benefit from an inflationary environment.
The Fund’s advisor is Manning & Napier Advisors, LLC (the “Advisor”). Shares of the Series are offered to investors, clients and employees of the Advisor and its affiliates. The total authorized capital stock of the Fund consists of 15 billion shares of common stock each having a par value of $0.01. As of June 30, 2013, 10.3 billion shares have been designated in total among 42 series, of which 100 million have been designated as Inflation Focus Equity Series Class A common stock.
| 2. | Significant Accounting Policies |
Security Valuation
Portfolio securities, including domestic equities, foreign equities, warrants and options, listed on an exchange other than the NASDAQ Stock Market are valued at the latest quoted sales price of the exchange on which the security is primarily traded. Securities not traded on valuation date or securities not listed on an exchange are valued at the latest quoted bid price provided by the Fund’s pricing service. Securities listed on the NASDAQ Stock Market are valued in accordance with the NASDAQ Official Closing Price.
Short-term investments that mature in sixty days or less are valued at amortized cost, which approximates fair value. Investments in open-end investment companies are valued at their net asset value per share on valuation date.
Volume and level of activity in established markets for an asset or liability are evaluated to determine whether recent transactions and quoted prices are determinative of fair value. Where there have been significant decreases in volume and level of activity, further analysis and adjustment may be necessary to estimate fair value. The Series measures fair value in these instances by the use of inputs and valuation techniques which may be based upon current market prices of securities that are comparable in coupon, rating, maturity and industry and/or expectation of future cash flows. As a result of trading in relatively thin markets and/or markets that experience significant volatility, the prices used by the Series to value these securities may differ from the value that would be realized if these securities were sold, and the differences could be material.
Securities for which representative valuations or prices are not available from the Series’ pricing service may be valued at fair value as determined in good faith by the Advisor under procedures approved by and under the general supervision and responsibility of the Fund’s Board of Directors (the “Board”). Due to the inherent uncertainty of valuations of such securities, the fair value may differ significantly from the values that would have been used had a ready market for such securities existed. If trading or events occurring after the close of the principal market in which securities are traded are expected to materially affect the value of those securities, then they may be valued at their fair value, taking this trading or these events into account. In accordance with the procedures approved by the Board, the values of certain securities trading outside the U.S. were adjusted following the close of local trading using a factor from a third party vendor. The third party vendor uses statistical analyses and quantitative models, which consider among other things subsequent movement and changes in the prices of indices, securities and exchange rates in other markets, to determine the factors which are used to adjust local market prices. The value of securities used for net asset value calculation under these procedures may differ from published prices for the same securities. It is the Fund’s policy to classify each foreign equity security where a factor from a third party vendor is provided as a Level 2 security.
Various inputs are used in determining the value of the Series’ assets or liabilities carried at fair value. These inputs are summarized in three broad levels. Level 1 includes quoted prices in active markets for identical assets and liabilities. Level 2 includes other significant observable inputs (including quoted prices for similar securities, interest rates, prepayment speeds, credit risk, etc.). Level 3 includes significant unobservable inputs (including the Series’ own assumptions in determining the fair value of investments). A financial instrument’s level within the fair value hierarchy is based on the lowest level of any input both
10
Inflation Focus Equity Series
Notes to Financial Statements (continued)
(unaudited)
| 2. | Significant Accounting Policies (continued) |
Security Valuation (continued)
individually and in aggregate that is significant to the fair value measurement. The inputs or methodology used for valuing securities are not necessarily an indication of the risk associated with investing in those securities.
The following is a summary of the valuation levels used for major security types as of June 30, 2013 in valuing the Series’ assets or liabilities carried at fair value:
| | | | | | | | | | | | | | | | |
| DESCRIPTION | | TOTAL | | | LEVEL 1 | | | LEVEL 2 | | | LEVEL 3 | |
Assets: | | | | | | | | | | | | | | | | |
Equity securities: | | | | | | | | | | | | | | | | |
Consumer Discretionary | | $ | 1,019,155 | | | $ | 1,019,155 | | | $ | — | | | $ | — | |
Consumer Staples | | | 10,827,368 | | | | 9,815,890 | | | | 1,011,478 | | | | — | |
Energy | | | 18,063,596 | | | | 15,595,754 | | | | 2,467,842 | | | | — | |
Financials | | | 5,553,763 | | | | 5,553,763 | | | | — | | | | — | |
Health Care | | | 2,034,607 | | | | 2,034,607 | | | | — | | | | — | |
Industrials | | | 37,922,968 | | | | 25,909,039 | | | | 12,013,929 | | | | — | |
Information Technology | | �� | 4,351,398 | | | | 2,858,418 | | | | 1,492,980 | | | | — | |
Materials | | | 14,693,936 | | | | 4,002,312 | | | | 10,691,624 | | | | — | |
Mutual fund | | | 6,687,504 | | | | 6,687,504 | | | | — | | | | — | |
| | | | | | | | | | | | | | | | |
Total assets | | $ | 101,154,295 | | | $ | 73,476,442 | | | $ | 27,677,853 | | | $ | — | |
| | | | | | | | | | | | | | | | |
Please see the Investment Portfolio for foreign securities where a factor from a third party vendor was applied to determine the security’s fair value following the close of local trading. Such securities are included in Level 2 in the table above.
There were no Level 3 securities held by the Series as of December 31, 2012 or June 30, 2013.
The Fund’s policy is to recognize transfers in and transfers out of the valuation levels as of the beginning of the reporting period. There were no transfers between Level 1 and Level 2 during the six months ended June 30, 2013.
Security Transactions, Investment Income and Expenses
Security transactions are accounted for on trade date. Dividend income is recorded on the ex-dividend date, except that if the ex-dividend date has passed, certain dividends from foreign securities are recorded as soon as the Series is informed of the ex-dividend date. Non-cash dividends, if any, are recorded at the fair value of the securities received. Interest income, including amortization of premium and accretion of discounts using the effective interest method, is earned from settlement date and accrued daily.
Expenses are recorded on an accrual basis. Most expenses of the Fund can be attributed to a specific series. Expenses which cannot be directly attributed are apportioned among the series in the Fund in such a manner as deemed equitable by the Fund’s Board, taking into consideration, among other things, the nature and type of expense.
The Fund records distributions received in excess of income from underlying investments as a reduction of cost of investments and/or realized gain. Such amounts are based on estimates if actual amounts are not available and actual amounts of income, realized gain and return of capital may differ from the estimated amounts. The Fund adjusts the estimated amounts of components of distributions (and consequently its net investment income) as necessary once the issuers provide information about the actual composition of the distributions.
The Series uses the identified cost method for determining realized gain or loss on investments for both financial statement and federal income tax reporting purposes.
Foreign Currency Translation
The books and records of the Series are maintained in U.S. dollars. Foreign currencies, investments and other assets and liabilities are translated into U.S. dollars at the current exchange rates. Purchases and sales of investment securities and
11
Inflation Focus Equity Series
Notes to Financial Statements (continued)
(unaudited)
| 2. | Significant Accounting Policies (continued) |
Foreign Currency Translation (continued)
income and expenses are translated on the respective dates of such transactions. The Series does not isolate realized and unrealized gains and losses attributable to changes in the exchange rates from gains and losses that arise from changes in the fair value of investments. Such fluctuations are included with net realized and unrealized gain or loss on investments. Net realized foreign currency gains and losses represent foreign currency gains and losses between trade date and settlement date on securities transactions, gains and losses on disposition of foreign currencies and the difference between the amount of income and foreign withholding taxes recorded on the books of the Series and the amounts actually received or paid.
Federal Taxes
The Series’ policy is to comply with the provisions of the Internal Revenue Code applicable to regulated investment companies. The Series is not subject to federal income tax or excise tax to the extent that the Series distributes to shareholders each year its taxable income, including any net realized gains on investments, in accordance with requirements of the Internal Revenue Code. Accordingly, no provision for federal income tax or excise tax has been made in the financial statements.
Management evaluates its tax positions to determine if the tax positions taken meet the minimum recognition threshold in connection with accounting for uncertainties in income tax positions taken or expected to be taken for the purposes of measuring and recognizing tax liabilities in the financial statements. Recognition of tax benefits of an uncertain tax position is required only when the position is “more likely than not” to be sustained assuming examination by taxing authorities. At June 30, 2013, the Series has recorded no liability for net unrecognized tax benefits relating to uncertain income tax positions taken or expected to be taken in future tax returns.
The Series files income tax returns in the U.S. federal jurisdiction, various states and foreign jurisdictions, as required. No income tax returns are currently under investigation. The statute of limitations on the Series’ tax returns remains open for the period ended December 31, 2011 and the year ended December 31, 2012. The Series is not aware of any tax positions for which it is reasonably possible that the total amounts of unrecognized tax benefits will significantly change in the next twelve months.
Foreign Taxes
Based on the Series’ understanding of the tax rules and rates related to income, gains and currency purchase/repatriation transactions for foreign jurisdictions in which it invests, the Series will provide for foreign taxes, and where appropriate, deferred foreign tax.
Distributions of Income and Gains
Distributions to shareholders of net investment income and net realized gains are made annually. An additional distribution may be necessary to avoid taxation of the Series. Distributions are recorded on the ex-dividend date.
Indemnifications
The Fund’s organizational documents provide former and current directors and officers with a limited indemnification against liabilities arising in connection with the performance of their duties to the Fund. In the normal course of business, the Fund may also enter into contracts that provide general indemnifications. The Fund’s maximum exposure under these arrangements is unknown as this would be dependent on future claims that may be made against the Fund. The risk of material loss from such claims is considered remote.
Other
The preparation of financial statements in conformity with accounting principles generally accepted in the United States of America requires management to make estimates and assumptions that affect the reported amounts of assets and liabilities and the disclosure of contingent assets and liabilities at the date of the financial statements and the reported amounts of income and expenses during the reporting period. Actual results could differ from those estimates.
12
Inflation Focus Equity Series
Notes to Financial Statements (continued)
(unaudited)
| 3. | Transactions with Affiliates |
The Fund has an Investment Advisory Agreement (the “Agreement”) with the Advisor, for which the Series pays a fee, computed daily and payable monthly, at an annual rate of 1.00% of the Series’ average daily net assets.
Under the Agreement, personnel of the Advisor provide the Series with advice and assistance in the choice of investments and the execution of securities transactions, and otherwise maintain the Series’ organization. The Advisor also provides the Fund with necessary office space and fund administration and support services. The salaries of all officers of the Fund (except a percentage of the Fund’s Chief Compliance Officer’s salary, which is paid by the Fund), and of all Directors who are “affiliated persons” of the Fund, or of the Advisor, and all personnel of the Fund, or of the Advisor, performing services relating to research, statistical and investment activities, are paid by the Advisor. Each “non-affiliated” Director receives an annual stipend, which is allocated among all the active series of the Fund. In addition, these Directors also receive a fee per Board meeting attended plus a fee for each committee meeting attended.
The Advisor has contractually agreed, until at least April 30, 2014, to waive its fee and, if necessary, pay other operating expenses of the Series in order to maintain total direct annual fund operating expenses for the Series at no more than 1.20% of average daily net assets each year. Accordingly, the Advisor waived fees of $3,540 for the six months ended June 30, 2013, which is included as a reduction of expenses on the Statement of Operations. The Advisor is not eligible to recoup any expenses that have been waived or reimbursed.
Manning & Napier Investor Services, Inc., a registered broker-dealer affiliate of the Advisor, acts as distributor for the Fund’s shares. The services of Manning & Napier Investor Services, Inc. are provided at no additional cost to the Series.
The Advisor has agreements with BNY Mellon Investment Servicing (U.S.) Inc. (“BNY”) under which BNY serves as sub-accountant services agent and sub-transfer agent. The Fund pays the Advisor an annual fee related to fund accounting and administration of 0.0175% on the first $3 billion of average daily net assets (excluding Target Series and Strategic Income Series); 0.015% on the next $3 billion of average daily net assets (excluding Target Series and Strategic Income Series); and 0.01% of the average daily net assets in excess of $6 billion (excluding Target Series and Strategic Income Series); plus a base fee of $25,500 per series. Transfer Agent fees are charged to the Fund on a per account basis. Additionally, certain transaction and cusip-based fees and out-of-pocket expenses, including charges for reporting relating to the Fund’s compliance program, are charged. Effective October 1, 2012, the aforementioned agreements were modified to reduce the annual fee related to fund accounting and administration, as well as transfer agent fees, by 10%, excluding out-of-pocket expenses.
Expenses not directly attributable to a series are allocated based on each series’ relative net assets or number of accounts, depending on the expense.
| 4. | Purchases and Sales of Securities |
For the six months ended June 30, 2013, purchases and sales of securities, other than U.S. Government securities and short-term securities, were $39,039,759 and $20,549,306 respectively. There were no purchases or sales of U.S. Government securities.
| 5. | Capital Stock Transactions |
Transactions in Class A shares of Inflation Focus Equity Series were:
| | | | | | | | | | | | | | | | |
| | | FOR THE SIX MONTHS ENDED 6/30/13 | | | FOR THE YEAR ENDED 12/31/12 | |
| | | SHARES | | | AMOUNT | | | SHARES | | | AMOUNT | |
Sold | | | 1,899,198 | | | $ | 21,914,745 | | | | 684,939 | | | $ | 7,455,324 | |
Reinvested | | | — | | | | — | | | | 197,345 | | | | 2,153,038 | |
Repurchased | | | (257,836 | ) | | | (2,927,481 | ) | | | (687,077 | ) | | | (7,459,040 | ) |
| | | | | | | | | | | | | | | | |
Total | | | 1,641,362 | | | $ | 18,987,264 | | | | 195,207 | | | $ | 2,149,322 | |
| | | | | | | | | | | | | | | | |
13
Inflation Focus Equity Series
Notes to Financial Statements (continued)
(unaudited)
| 5. | Capital Stock Transactions (continued) |
Approximately 85% of the Series’ shares represent investments by fiduciary accounts over which the Advisor has sole investment discretion.
The Series may trade in instruments including written and purchased options, forward foreign currency exchange contracts and futures contracts and other derivatives in the normal course of investing activities to assist in managing exposure to various market risks. The Series may be subject to various elements of risk, which may involve, to a varying degree, elements of risk in excess of the amounts recognized for financial statement purposes. These risks include: the risk that changes in the value of a derivative may not correlate perfectly with the underlying asset, rate or index; counterparty credit risk related to over the counter derivative counterparties’ failure to perform under contract terms; liquidity risk related to the lack of a liquid market for these contracts allowing the fund to close out its position(s); and documentation risk relating to disagreement over contract terms. No such investments were held by the Series as of June 30, 2013.
Investing in securities of foreign companies and foreign governments involves special risks and considerations not typically associated with investing in securities of domestic companies and the U.S. Government. These risks include revaluation of currencies and future adverse political and economic developments. Moreover, securities of foreign companies and foreign governments and their markets may be less liquid and their prices more volatile than those of comparable domestic companies and the U.S. Government.
| 8. | Federal Income Tax Information |
The amount and characterization of certain income and capital gains to be distributed are determined in accordance with federal income tax regulations, which may differ from accounting principles generally accepted in the United States of America. The Series may periodically make reclassifications among its capital accounts to reflect income and gains available for distribution (or available capital loss carryovers) under income tax regulations, without impacting the Series’ net asset value. Any such reclassifications are not reflected in the financial highlights.
The final determination of the tax character of current year distributions will be made at the conclusion of the fiscal year. The tax character of distributions paid for the year ended December 31, 2012 was as follows:
| | | | |
Ordinary income | | $ | 2,088,150 | |
Long-term capital gains | | | 96,302 | |
At June 30, 2013, the identified cost of investments for federal income tax purposes, the resulting gross unrealized appreciation and depreciation, and the net unrealized appreciation were as follows:
| | | | |
Cost for federal income tax purposes | | $ | 94,638,441 | |
Unrealized appreciation | | | 10,039,719 | |
Unrealized depreciation | | | (3,523,865 | ) |
| | | | |
Net unrealized appreciation | | $ | 6,515,854 | |
| | | | |
14
Inflation Focus Equity Series
Literature Requests
(unaudited)
Proxy Voting Policies and Procedures
A description of the policies and procedures that the Fund uses to determine how to vote proxies relating to portfolio securities is available, without charge, upon request:
| | | | |
| By phone | | 1-800-466-3863 | | |
| On the Securities and Exchange | | | | |
| Commission’s (SEC) web site | | http://www.sec.gov | | |
Proxy Voting Record
Information regarding how the Fund voted proxies relating to portfolio securities during the most recent 12-month period ended June 30th is available, without charge, upon request:
| | | | |
| By phone | | 1-800-466-3863 | | |
| On the SEC’s web site | | http://www.sec.gov | | |
Quarterly Portfolio Holdings
The Series’ complete schedule of portfolio holdings for the 1st and 3rd quarters of each fiscal year are provided on Form N-Q, and are available, without charge, upon request:
| | | | |
| By phone | | 1-800-466-3863 | | |
| On the SEC’s web site | | http://www.sec.gov | | |
The Series’ Form N-Q may be reviewed and copied at the SEC’s Public Reference Room in Washington, D.C. Information on the operation of the Public Reference Room may be obtained by calling 1-800-SEC-0330.
Prospectus and Statement of Additional Information (SAI)
The prospectus and SAI provide additional information about each Series, including charges, expenses and risks. These documents are available, without charge, upon request:
| | | | |
| By phone | | 1-800-466-3863 | | |
| On the SEC’s web site | | http://www.sec.gov | | |
| On our web site | | http://www.manning-napier.com | | |
Additional information available at www.manning-napier.com
1. Fund Holdings - Month-End
2. Fund Holdings - Quarter-End
3. Shareholder Report - Annual
4. Shareholder Report - Semi-Annual
The Fund also offers electronic notification or “e-delivery” when certain documents are available on-line to be downloaded or reviewed. Direct shareholders can elect to receive electronic notification when shareholder reports, prospectus updates, and/or statements are available. If you do not currently have on-line access to your account, you can establish access by going to www.manning-napier.com, click on “Login” in the top corner of the page, and follow the prompts to self-enroll. Once enrolled, you can set your electronic notification preferences by clicking on the Account Options tab located within the green toolbar and then select E-Delivery Option. Should you have any questions on either how to establish on-line access or how to update your account settings, please contact Investor Services at 1-800-466-3863.
MNIFE-6/30-SAR
| | | | | | |
| | | | EMERGING MARKETS SERIES | | |
www.manning-napier.com | | | | |
Emerging Markets Series
Shareholder Expense Example
(unaudited)
As a shareholder of the Series, you may incur two types of costs: (1) transaction costs and (2) ongoing costs, including management fees and other Series expenses. This example is intended to help you understand your ongoing costs (in dollars) of investing in the Series and to compare these costs with the ongoing costs of investing in other mutual funds.
The example is based on an investment of $1,000 invested at the beginning of the period and held for the entire period (January 1, 2013 to June 30, 2013).
Actual Expenses
The first line of the table below provides information about actual account values and actual expenses. You may use the information in this line, together with the amount you invested, to estimate the expenses that you paid over the period. Simply divide your account value by $1,000 (for example, an $8,600 account value divided by $1,000 = 8.6), then multiply the result by the number in the first line under the heading entitled “Expenses Paid During Period” to estimate the expenses you paid on your account during this period.
Hypothetical Example for Comparison Purposes
The second line of the table below provides information about hypothetical account values and hypothetical expenses based on the Series’ actual expense ratio and an assumed rate of return of 5% per year before expenses, which is not the Series’ actual return. The hypothetical account values and expenses may not be used to estimate the actual ending account balance or expenses you paid during the period. You may use this information to compare the ongoing costs of investing in the Series and other funds. To do so, compare this 5% hypothetical example with the 5% hypothetical examples that appear in the shareholder reports of the other funds.
Please note that the expenses shown in the table are meant to highlight your ongoing costs only and do not reflect any transaction costs. Therefore, the second line of the table is useful in comparing ongoing costs only, and will not help you determine the relative total costs of owning different funds. In addition, if these transaction costs were included, your costs would have been higher.
| | | | | | |
| | | BEGINNING
ACCOUNT VALUE
1/1/13 | | ENDING
ACCOUNT VALUE
6/30/13 | | EXPENSES PAID
DURING PERIOD
1/1/13-6/30/13 |
Actual | | $1,000.00 | | $ 961.30 | | $5.84 |
Hypothetical (5% return before expenses) | | $1,000.00 | | $1,018.84 | | $6.01 |
Expenses are equal to the Series’ annualized expense ratio (for the six-month period) of 1.20%, multiplied by the average account value over the period, multiplied by 181/365 (to reflect the one-half year period). Expenses are based on the most recent fiscal half year. The Series’ total return would have been lower had certain expenses not been waived during the period.
1
Emerging Markets Series
Portfolio Composition as of June 30, 2013
(unaudited)
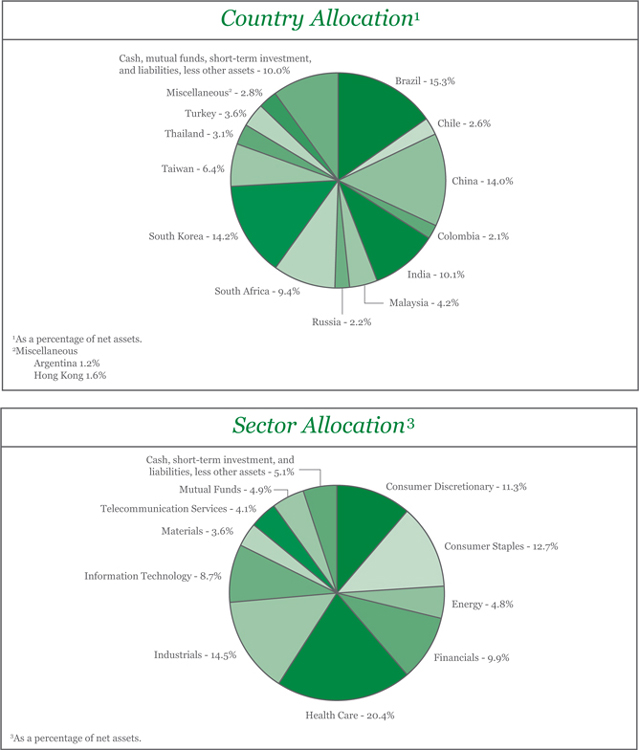
2
Emerging Markets Series
Investment Portfolio - June 30, 2013
(unaudited)
| | | | | | | | | | |
| | | SHARES | | | VALUE (NOTE 2) | | | |
| | | |
COMMON STOCKS - 90.0% | | | | | | | | | | |
| | | |
Consumer Discretionary - 11.3% | | | | | | | | | | |
Auto Components - 1.4% | | | | | | | | | | |
Mando Corp. (South Korea)1 | | | 14,900 | | | $ | 1,330,726 | | | |
| | | | | | | | | | |
Automobiles - 2.3% | | | | | | | | | | |
Hyundai Motor Co. (South Korea)1 | | | 10,570 | | | | 2,073,100 | | | |
| | | | | | | | | | |
Diversified Consumer Services - 3.0% | | | | | | | | | | |
Anhanguera Educacional Participacoes S.A. (Brazil) | | | 470,190 | | | | 2,752,003 | | | |
| | | | | | | | | | |
Hotels, Restaurants & Leisure - 1.2% | | | | | | | | | | |
Arcos Dorados Holdings, Inc. (Argentina) | | | 91,000 | | | | 1,062,880 | | | |
| | | | | | | | | | |
Household Durables - 1.1% | | | | | | | | | | |
LG Electronics, Inc. (South Korea)1 | | | 15,900 | | | | 1,010,584 | | | |
| | | | | | | | | | |
Specialty Retail - 2.3% | | | | | | | | | | |
Belle International Holdings Ltd. (Hong Kong)1 | | | 1,036,000 | | | | 1,416,294 | | | |
China ZhengTong Auto Services Holdings Ltd. (China)*1 | | | 1,470,000 | | | | 685,025 | | | |
| | | | | | | | | | |
| | | |
| | | | | | | 2,101,319 | | | |
| | | | | | | | | | |
| | | |
Total Consumer Discretionary | | | | | | | 10,330,612 | | | |
| | | | | | | | | | |
| | | |
Consumer Staples - 12.7% | | | | | | | | | | |
Beverages - 4.1% | | | | | | | | | | |
Cia Cervecerias Unidas S.A. - ADR (Chile) | | | 83,000 | | | | 2,374,630 | | | |
Cia de Bebidas das Americas (AmBev) - ADR (Brazil) | | | 34,900 | | | | 1,303,515 | | | |
| | | | | | | | | | |
| | | |
| | | | | | | 3,678,145 | | | |
| | | | | | | | | | |
Food & Staples Retailing - 3.3% | | | | | | | | | | |
President Chain Store Corp. (Taiwan)1 | | | 239,000 | | | | 1,562,300 | | | |
Raia Drogasil S.A. (Brazil) | | | 150,000 | | | | 1,453,380 | | | |
| | | | | | | | | | |
| | | |
| | | | | | | 3,015,680 | | | |
| | | | | | | | | | |
Food Products - 3.4% | | | | | | | | | | |
Charoen Pokphand Foods PCL (Thailand)1 | | | 1,640,000 | | | | 1,357,903 | | | |
M Dias Branco S.A. (Brazil) | | | 46,000 | | | | 1,739,933 | | | |
| | | | | | | | | | |
| | | |
| | | | | | | 3,097,836 | | | |
| | | | | | | | | | |
Personal Products - 1.9% | | | | | | | | | | |
Natura Cosmeticos S.A. (Brazil) | | | 79,000 | | | | 1,727,743 | | | |
| | | | | | | | | | |
| | | |
Total Consumer Staples | | | | | | | 11,519,404 | | | |
| | | | | | | | | | |
| | | |
Energy - 4.8% | | | | | | | | | | |
Energy Equipment & Services - 1.2% | | | | | | | | | | |
Anton Oilfield Services Group (China)1 | | | 682,000 | | | | 488,944 | | | |
SPT Energy Group, Inc. (China)1 | | | 980,000 | | | | 591,858 | | | |
| | | | | | | | | | |
| | | |
| | | | | | | 1,080,802 | | | |
| | | | | | | | | | |
Oil, Gas & Consumable Fuels - 3.6% | | | | | | | | | | |
Pacific Rubiales Energy Corp. (Colombia) | | | 110,000 | | | | 1,931,825 | | | |
The accompanying notes are an integral part of the financial statements.
3
Emerging Markets Series
Investment Portfolio - June 30, 2013
(unaudited)
| | | | | | | | | | |
| | | SHARES | | | VALUE (NOTE 2) | | | |
| | | |
COMMON STOCKS (continued) | | | | | | | | | | |
| | | |
Energy (continued) | | | | | | | | | | |
Oil, Gas & Consumable Fuels (continued) | | | | | | | | | | |
Petroleo Brasileiro S.A. - ADR (Brazil) | | | 93,700 | | | $ | 1,373,642 | | | |
| | | | | | | | | | |
| | | |
Total Energy | | | | | | | 4,386,269 | | | |
| | | | | | | | | | |
| | | |
Financials - 9.9% | | | | | | | | | | |
Capital Markets - 0.4% | | | | | | | | | | |
OSK Holdings Berhad (Malaysia)1 | | | 712,375 | | | | 371,053 | | | |
| | | | | | | | | | |
Commercial Banks - 3.8% | | | | | | | | | | |
Hong Leong Financial Group Berhad (Malaysia)1 | | | 338,000 | | | | 1,541,757 | | | |
ICICI Bank Ltd. - ADR (India) | | | 50,000 | | | | 1,912,500 | | | |
| | | | | | | | �� | | |
| | | |
| | | | | | | 3,454,257 | | | |
| | | | | | | | | | |
Diversified Financial Services - 2.1% | | | | | | | | | | |
JSE Ltd. (South Africa)1 | | | 271,000 | | | | 1,946,475 | | | |
| | | | | | | | | | |
Insurance - 1.5% | | | | | | | | | | |
Brasil Insurance Participacoes e Administracao S.A. (Brazil) | | | 143,000 | | | | 1,405,423 | | | |
| | | | | | | | | | |
Real Estate Management & Development - 2.1% | | | | | | | | | | |
BR Malls Participacoes S.A. (Brazil) | | | 71,000 | | | | 634,795 | | | |
General Shopping Brasil S.A. (Brazil)* | | | 318,000 | | | | 1,227,051 | | | |
| | | | | | | | | | |
| | | |
| | | | | | | 1,861,846 | | | |
| | | | | | | | | | |
| | | |
Total Financials | | | | | | | 9,039,054 | | | |
| | | | | | | | | | |
| | | |
Health Care - 20.4% | | | | | | | | | | |
Biotechnology - 2.7% | | | | | | | | | | |
Green Cross Corp. (South Korea)1 | | | 23,100 | | | | 2,472,794 | | | |
| | | | | | | | | | |
Health Care Equipment & Supplies - 5.9% | | | | | | | | | | |
Mindray Medical International Ltd. - ADR (China) | | | 76,700 | | | | 2,872,415 | | | |
Shandong Weigao Group Medical Polymer Co. Ltd. - Class H (China)1 | | | 2,326,000 | | | | 2,534,144 | | | |
| | | | | | | | | | |
| | | |
| | | | | | | 5,406,559 | | | |
| | | | | | | | | | |
Health Care Providers & Services - 3.8% | | | | | | | | | | |
Life Healthcare Group Holdings Ltd. (South Africa)1 | | | 809,000 | | | | 3,068,413 | | | |
Qualicorp S.A. (Brazil)* | | | 46,000 | | | | 350,254 | | | |
| | | | | | | | | | |
| | | |
| | | | | | | 3,418,667 | | | |
| | | | | | | | | | |
Pharmaceuticals - 8.0% | | | | | | | | | | |
Glenmark Pharmaceuticals Ltd. (India)1 | | | 410,383 | | | | 3,773,028 | | | |
Lupin Ltd. (India)1 | | | 134,490 | | | | 1,764,268 | | | |
Strides Arcolab Ltd. (India)1 | | | 118,000 | | | | 1,723,667 | | | |
| | | | | | | | | | |
| | | |
| | | | | | | 7,260,963 | | | |
| | | | | | | | | | |
| | | |
Total Health Care | | | | | | | 18,558,983 | | | |
| | | | | | | | | | |
| | | |
Industrials - 14.5% | | | | | | | | | | |
Electrical Equipment - 2.3% | | | | | | | | | | |
Teco Electric and Machinery Co. Ltd. (Taiwan)1 | | | 2,052,000 | | | | 2,042,607 | | | |
| | | | | | | | | | |
The accompanying notes are an integral part of the financial statements.
4
Emerging Markets Series
Investment Portfolio - June 30, 2013
(unaudited)
| | | | | | | | | | |
| | | SHARES | | | VALUE (NOTE 2) | | | |
| | | |
COMMON STOCKS (continued) | | | | | | | | | | |
| | | |
Industrials (continued) | | | | | | | | | | |
Machinery - 6.0% | | | | | | | | | | |
Hiwin Technologies Corp. (Taiwan)1 | | | 372,450 | | | $ | 2,206,651 | | | |
Turk Traktor ve Ziraat Makineleri AS (Turkey)1 | | | 92,156 | | | | 3,246,995 | | | |
| | | | | | | | | | |
| | | |
| | | | | | | 5,453,646 | | | |
| | | | | | | | | | |
Marine - 4.1% | | | | | | | | | | |
Precious Shipping PCL (Thailand)1 | | | 2,577,400 | | | | 1,468,907 | | | |
Sinotrans Shipping Ltd. (China)1 | | | 9,500,000 | | | | 2,268,609 | | | |
| | | | | | | | | | |
| | | |
| | | | | | | 3,737,516 | | | |
| | | | | | | | | | |
Transportation Infrastructure - 2.1% | | | | | | | | | | |
Malaysia Airports Holdings Berhad (Malaysia)1 | | | 967,000 | | | | 1,931,245 | | | |
| | | | | | | | | | |
| | | |
Total Industrials | | | | | | | 13,165,014 | | | |
| | | | | | | | | | |
| | | |
Information Technology - 8.7% | | | | | | | | | | |
Internet Software & Services - 7.0% | | | | | | | | | | |
Mail.ru Group Ltd. - GDR (Russia)1 | | | 25,400 | | | | 727,964 | | | |
NHN Corp. (South Korea)1 | | | 9,800 | | | | 2,488,078 | | | |
Tencent Holdings Ltd. (China)1 | | | 20,000 | | | | 780,945 | | | |
Yandex N.V. - Class A - ADR (Russia)* | | | 45,700 | | | | 1,262,691 | | | |
Youku Tudou, Inc. - ADR (China)* | | | 56,800 | | | | 1,089,992 | | | |
| | | | | | | | | | |
| | | |
| | | | | | | 6,349,670 | | | |
| | | | | | | | | | |
Semiconductors & Semiconductor Equipment - 1.7% | | | | | | | | | | |
Samsung Electronics Co. Ltd. (South Korea)1 | | | 1,360 | | | | 1,589,601 | | | |
| | | | | | | | | | |
| | | |
Total Information Technology | | | | | | | 7,939,271 | | | |
| | | | | | | | | | |
| | | |
Materials - 3.6% | | | | | | | | | | |
Chemicals - 1.6% | | | | | | | | | | |
Yingde Gases Group Co., Ltd. (China)1 | | | 1,604,000 | | | | 1,473,270 | | | |
| | | | | | | | | | |
Metals & Mining - 2.0% | | | | | | | | | | |
Impala Platinum Holdings Ltd. (South Africa)1 | | | 188,000 | | | | 1,770,614 | | | |
| | | | | | | | | | |
| | | |
Total Materials | | | | | | | 3,243,884 | | | |
| | | | | | | | | | |
| | | |
Telecommunication Services - 4.1% | | | | | | | | | | |
Wireless Telecommunication Services - 4.1% | | | | | | | | | | |
MTN Group Ltd. (South Africa)1 | | | 94,700 | | | | 1,761,364 | | | |
SK Telecom Co. Ltd. (South Korea)1 | | | 10,900 | | | | 2,004,570 | | | |
| | | | | | | | | | |
| | | |
Total Telecommunication Services | | | | | | | 3,765,934 | | | |
| | | | | | | | | | |
| | | | | | | | | | |
TOTAL COMMON STOCKS | | | | | | | | | | |
(Identified Cost $77,161,218) | | | | | | | 81,948,425 | | | |
| | | | | | | | | | |
| | | |
MUTUAL FUNDS - 4.9% | | | | | | | | | | |
| | | |
iShares India 50 ETF | | | 104,000 | | | | 2,320,240 | | | |
The accompanying notes are an integral part of the financial statements.
5
Emerging Markets Series
Investment Portfolio - June 30, 2013
(unaudited)
| | | | | | | | | | |
| | | SHARES | | | VALUE (NOTE 2) | | | |
| | | |
MUTUAL FUNDS (continued) | | | | | | | | | | |
| | | |
PowerShares India Portfolio | | | 128,000 | | | $ | 2,120,960 | | | |
| | | | | | | | | | |
| | | | | | | | | | |
TOTAL MUTUAL FUNDS | | | | | | | | | | |
(Identified Cost $4,613,804) | | | | | | | 4,441,200 | | | |
| | | | | | | | | | |
| | | | | | | | | | |
SHORT-TERM INVESTMENT - 5.5% | | | | | | | | | | |
| | | |
Dreyfus Cash Management, Inc. - Institutional Shares2 , 0.05%, | | | | | | | | | | |
(Identified Cost $5,014,736) | | | 5,014,736 | | | | 5,014,736 | | | |
| | | | | | | | | | |
TOTAL INVESTMENTS - 100.4% | | | | | | | | | | |
(Identified Cost $86,789,758) | | | | | | | 91,404,361 | | | |
LIABILITIES, LESS OTHER ASSETS - (0.4%) | | | | | | | (384,127 | ) | | |
| | | | | | | | | | |
| | | |
NET ASSETS - 100% | | | | | | $ | 91,020,234 | | | |
| | | | | | | | | | |
ADR - American Depository Receipt
ETF - Exchange-Traded Fund
*Non-income producing security.
1A factor from a third party vendor was applied to determine the security’s fair value following the close of local trading.
2Rate shown is the current yield as of June 30, 2013.
The Series’ portfolio holds, as a percentage of net assets, greater than 10% in the following countries:
Brazil - 15.3%; South Korea - 14.2%; China - 14.0%; India - 10.1%.
The accompanying notes are an integral part of the financial statements.
6
Emerging Markets Series
Statement of Assets & Liabilities
June 30, 2013 (unaudited)
| | | | |
ASSETS: | | | | |
| |
Investments, at value (identified cost $86,789,758) (Note 2) | | $ | 91,404,361 | |
Dividends receivable | | | 101,619 | |
Receivable for fund shares sold | | | 82,849 | |
Foreign currency (identified cost $79,772) | | | 78,960 | |
Prepaid expenses | | | 661 | |
| | | | |
| |
TOTAL ASSETS | | | 91,668,450 | |
| | | | |
| |
LIABILITIES: | | | | |
| |
Accrued foreign capital gains tax (Note 2) | | | 133,037 | |
Foreign capital gains tax payable (Note 2) | | | 812 | |
Accrued management fees (Note 3) | | | 62,621 | |
Accrued fund accounting and administration fees (Note 3) | | | 5,513 | |
Accrued transfer agent fees (Note 3) | | | 2,522 | |
Accrued Chief Compliance Officer service fees (Note 3) | | | 340 | |
Accrued Directors’ fees (Note 3) | | | 252 | |
Payable for fund shares repurchased | | | 177,254 | |
Payable for securities purchased | | | 174,257 | |
Accrued custodian fees | | | 61,999 | |
Other payables and accrued expenses | | | 29,609 | |
| | | | |
| |
TOTAL LIABILITIES | | | 648,216 | |
| | | | |
| |
TOTAL NET ASSETS | | $ | 91,020,234 | |
| | | | |
| |
NET ASSETS CONSIST OF: | | | | |
| |
Capital stock | | $ | 81,318 | |
Additional paid-in-capital | | | 81,400,852 | |
Undistributed net investment income | | | 512,502 | |
Accumulated net realized gain on investments, foreign currency and translation of other assets and liabilities | | | 4,544,775 | |
Net unrealized appreciation on investments (net of foreign capital gains tax of $133,037), foreign currency and translation of other assets and liabilities | | | 4,480,787 | |
| | | | |
| |
TOTAL NET ASSETS | | $ | 91,020,234 | |
| | | | |
| |
NET ASSET VALUE, OFFERING PRICE AND REDEMPTION PRICE PER SHARE - Class A ($91,020,234/8,131,757 shares) | | $ | 11.19 | |
| | | | |
The accompanying notes are an integral part of the financial statements.
7
Emerging Markets Series
Statement of Operations
For the Six Months Ended June 30, 2013 (unaudited)
| | | | |
INVESTMENT INCOME: | | | | |
| |
Dividends (net of foreign taxes withheld, $134,545) | | $ | 1,086,404 | |
| | | | |
| |
EXPENSES: | | | | |
| |
Management fees (Note 3) | | | 478,251 | |
Fund accounting and administration fees (Note 3) | | | 19,716 | |
Transfer agent fees (Note 3) | | | 7,258 | |
Directors’ fees (Note 3) | | | 787 | |
Chief Compliance Officer service fees (Note 3) | | | 1,117 | |
Custodian fees | | | 65,920 | |
Miscellaneous | | | 58,543 | |
| | | | |
| |
Total Expenses | | | 631,592 | |
Less reduction of expenses (Note 3) | | | (57,690 | ) |
| | | | |
| |
Net Expenses | | | 573,902 | |
| | | | |
| |
NET INVESTMENT INCOME | | | 512,502 | |
| | | | |
| |
REALIZED AND UNREALIZED GAIN (LOSS) ON INVESTMENTS AND FOREIGN CURRENCY: | | | | |
| |
Net realized gain (loss) on- | | | | |
Investments (net of India tax of $212,317) | | | 4,032,008 | |
Foreign currency and translation of other assets and liabilities | | | (89,070 | ) |
| | | | |
| |
| | | 3,942,938 | |
| | | | |
| |
Net change in unrealized appreciation (depreciation) on- | | | | |
Investments (net of decrease in accrued foreign capital gains tax of $491,001) | | | (8,030,755 | ) |
Foreign currency and translation of other assets and liabilities | | | (2,474 | ) |
| | | | |
| |
| | | (8,033,229 | ) |
| | | | |
| |
NET REALIZED AND UNREALIZED GAIN (LOSS) ON INVESTMENTS AND FOREIGN CURRENCY | | | (4,090,291 | ) |
| | | | |
| |
NET DECREASE IN NET ASSETS RESULTING FROM OPERATIONS | | $ | (3,577,789 | ) |
| | | | |
The accompanying notes are an integral part of the financial statements.
8
Emerging Markets Series
Statements of Changes in Net Assets
| | | | | | | | |
| | | FOR THE SIX
MONTH ENDED
6/30/2013
(UNAUDITED) | | | FOR THE YEAR ENDED 12/31/12 | |
INCREASE (DECREASE) IN NET ASSETS: | | | | | | | | |
| | |
OPERATIONS: | | | | | | | | |
| | |
Net investment income | | $ | 512,502 | | | $ | 343,149 | |
Net realized gain (loss) on investments and foreign currency | | | 3,942,938 | | | | 3,936,183 | |
Net change in unrealized appreciation (depreciation) on investments and foreign currency | | | (8,033,229 | ) | | | 13,482,230 | |
| | | | | | | | |
| | |
Net increase (decrease) from operations | | | (3,577,789 | ) | | | 17,761,562 | |
| | | | | | | | |
| | |
DISTRIBUTIONS TO SHAREHOLDERS (Note 8): | | | | | | | | |
| | |
From net investment income | | | — | | | | (208,190 | ) |
From net realized gain on investments | | | — | | | | (3,291,467 | ) |
| | | | | | | | |
| | |
Total distributions to shareholders | | | — | | | | (3,499,657 | ) |
| | | | | | | | |
| | |
CAPITAL STOCK ISSUED AND REPURCHASED: | | | | | | | | |
| | |
Net increase (decrease) from capital share transactions (Note 5) | | | (655,209 | ) | | | 2,876,916 | |
| | | | | | | | |
| | |
Net increase (decrease) in net assets | | | (4,232,998 | ) | | | 17,138,821 | |
| | |
NET ASSETS: | | | | | | | | |
| | |
Beginning of period | | | 95,253,232 | | | | 78,114,411 | |
| | | | | | | | |
| | |
End of period (including undistributed net investment income of $ 512,502 and $ 0, respectively) | | $ | 91,020,234 | | | $ | 95,253,232 | |
| | | | | | | | |
The accompanying notes are an integral part of the financial statements.
9
Emerging Markets Series
Financial Highlights
| | | | | | | | | | | | |
| | | FOR THE SIX
MONTHS ENDED
6/30/13
(UNAUDITED) | | | FOR THE YEAR
ENDED 12/31/12 | | | FOR THE PERIOD
11/16/111 TO
12/31/11 | |
Per share data (for a share outstanding throughout each period): | | | | | | | | | | | | |
Net asset value - Beginning of period | | $ | 11.64 | | | $ | 9.85 | | | $ | 10.00 | |
| | | | | | | | | | | | |
Income (loss) from investment operations: | | | | | | | | | | | | |
Net investment income2 | | | 0.06 | | | | 0.04 | | | | 0.01 | |
Net realized and unrealized gain (loss) on investments | | | (0.51 | ) | | | 2.20 | | | | (0.15 | ) |
| | | | | | | | | | | | |
| | | |
Total from investment operations | | | (0.45 | ) | | | 2.24 | | | | (0.14 | ) |
| | | | | | | | | | | | |
| | | |
Less distributions to shareholders: | | | | | | | | | | | | |
From net investment income | | | — | | | | (0.03 | ) | | | (0.01 | ) |
From net realized gain on investments | | | — | | | | (0.42 | ) | | | — | |
| | | | | | | | | | | | |
| | | |
Total distributions to shareholders | | | — | | | | (0.45 | ) | | | (0.01 | ) |
| | | | | | | | | | | | |
| | | |
Net asset value - End of period | | $ | 11.19 | | | $ | 11.64 | | | $ | 9.85 | |
| | | | | | | | | | | | |
| | | |
Net assets - End of period (000’s omitted) | | $ | 91,020 | | | $ | 95,253 | | | $ | 78,114 | |
| | | | | | | | | | | | |
| | | |
Total return3 | | | (3.87 | %) | | | 22.77 | % | | | (1.37 | %) |
Ratios (to average net assets)/ Supplemental Data: | | | | | | | | | | | | |
Expenses* | | | 1.20 | %4 | | | 1.20 | % | | | 1.20 | %4 |
Net investment income | | | 1.07 | %4 | | | 0.39 | % | | | 0.86 | %4 |
Portfolio turnover | | | 16 | % | | | 40 | % | | | 0 | % |
|
| * The investment advisor did not impose all or a portion of its management and/or other fees, and in some periods may have paid a portion of the Series’ expenses. If these expenses had been incurred by the Series, the expense ratio (to average net assets) would have increased by the following amount: | |
| | | |
| | | 0.12 | %4 | | | 0.07 | % | | | 0.95 | %4 |
1Commencement of operations.
2Calculated based on average shares outstanding during the periods.
3Represents aggregate total return for the periods indicated, and assumes reinvestment of all distributions. Total return would have been lower had certain expenses not been waived or reimbursed during certain periods. Periods less than one year are not annualized.
4Annualized.
The accompanying notes are an integral part of the financial statements.
10
Emerging Markets Series
Notes to Financial Statements
(unaudited)
Emerging Markets Series (the “Series”) is a no-load non-diversified series of Manning & Napier Fund, Inc. (the “Fund”). The Fund is organized in Maryland and is registered under the Investment Company Act of 1940, as amended, as an open-end management investment company.
The Series’ investment objective is to provide long-term growth.
The Fund’s advisor is Manning and Napier Advisors, LLC (“The Advisor”). Shares of the Series are offered to investors, clients and employees of the Advisor and its affiliates. The total authorized capital stock of the Fund consists of 15 billion shares of common stock each having a par value of $0.01. As of June 30, 2013, 10.3 billion shares have been designated in total among 42 series, of which 100 million have been designated as Emerging Markets Series Class A common stock.
| 2. | Significant Accounting Policies |
Security Valuation
Portfolio securities, including domestic equities, foreign equities, warrants and options, listed on an exchange other than the NASDAQ Stock Market are valued at the latest quoted sales price of the exchange on which the security is primarily traded. Securities not traded on valuation date or securities not listed on an exchange are valued at the latest quoted bid price provided by the Fund’s pricing service. Securities listed on the NASDAQ Stock Market are valued in accordance with the NASDAQ Official Closing Price.
Short-term investments that mature in sixty days or less are valued at amortized cost, which approximates fair value. Investments in open-end investment companies are valued at their net asset value per share on valuation date.
Volume and level of activity in established markets for an asset or liability are evaluated to determine whether recent transactions and quoted prices are determinative of fair value. Where there have been significant decreases in volume and level of activity, further analysis and adjustment may be necessary to estimate fair value. The Series measures fair value in these instances by the use of inputs and valuation techniques which may be based upon current market prices of securities that are comparable in coupon, rating, maturity and industry and/or expectation of future cash flows. As a result of trading in relatively thin markets and/or markets that experience significant volatility, the prices used by the Series to value these securities may differ from the value that would be realized if these securities were sold, and the differences could be material.
Securities for which representative valuations or prices are not available from the Series’ pricing service may be valued at fair value as determined in good faith by the Advisor under procedures approved by and under the general supervision and responsibility of the Fund’s Board of Directors (the “Board”). Due to the inherent uncertainty of valuations of such securities, the fair value may differ significantly from the values that would have been used had a ready market for such securities existed. If trading or events occurring after the close of the principal market in which securities are traded are expected to materially affect the value of those securities, then they may be valued at their fair value, taking this trading or these events into account. In accordance with the procedures approved by the Board, the values of certain securities trading outside the U.S. were adjusted following the close of local trading using a factor from a third party vendor. The third party vendor uses statistical analyses and quantitative models, which consider among other things subsequent movement and changes in the prices of indices, securities and exchange rates in other markets, to determine the factors which are used to adjust local market prices. The value of securities used for net asset value calculation under these procedures may differ from published prices for the same securities. It is the Fund’s policy to classify each foreign equity security where a factor from a third party vendor is provided as a Level 2 security.
Various inputs are used in determining the value of the Series’ assets or liabilities carried at fair value. These inputs are summarized in three broad levels. Level 1 includes quoted prices in active markets for identical assets and liabilities. Level 2 includes other significant observable inputs (including quoted prices for similar securities, interest rates, prepayment speeds, credit risk, etc.). Level 3 includes significant unobservable inputs (including the Series’ own assumptions in determining the fair value of investments). A financial instrument’s level within the fair value hierarchy is based on the lowest level of any input both
11
Emerging Markets Series
Notes to Financial Statements (continued)
(unaudited)
| 2. | Significant Accounting Policies (continued) |
Security Valuation (continued)
individually and in aggregate that is significant to the fair value measurement. The inputs or methodology used for valuing securities are not necessarily an indication of the risk associated with investing in those securities.
The following is a summary of the valuation levels used for major security types as of June 30, 2013 in valuing the Series’ assets or liabilities carried at fair value:
| | | | | | | | | | | | | | | | |
| DESCRIPTION | | TOTAL | | | LEVEL 1 | | | LEVEL 2 | | | LEVEL 3 | |
Assets: | | | | | | | | | | | | | | | | |
Equity securities: | | | | | | | | | | | | | | | | |
Consumer Discretionary | | $ | 10,330,612 | | | $ | 3,814,883 | | | $ | 6,515,729 | | | $ | — | |
Consumer Staples | | | 11,519,404 | | | | 8,599,201 | | | | 2,920,203 | | | | — | |
Energy | | | 4,386,269 | | | | 3,305,467 | | | | 1,080,802 | | | | — | |
Financials | | | 9,039,054 | | | | 5,179,769 | | | | 3,859,285 | | | | — | |
Health Care | | | 18,558,983 | | | | 3,222,669 | | | | 15,336,314 | | | | — | |
Industrials | | | 13,165,014 | | | | — | | | | 13,165,014 | | | | — | |
Information Technology | | | 7,939,271 | | | | 2,352,683 | | | | 5,586,588 | | | | — | |
Materials | | | 3,243,884 | | | | — | | | | 3,243,884 | | | | — | |
Telecommunication Services | | | 3,765,934 | | | | — | | | | 3,765,934 | | | | — | |
Mutual funds | | | 9,455,936 | | | | 9,455,936 | | | | — | | | | — | |
| | | | | | | | | | | | | | | | |
Total assets | | $ | 91,404,361 | | | $ | 35,930,608 | | | $ | 55,473,753 | | | $ | — | |
| | | | | | | | | | | | | | | | |
Please see the Investment Portfolio for foreign securities where a factor from a third party vendor was applied to determine the securities’ fair value following the close of local trading. Such securities are included in Level 2 in the table above.
There were no Level 3 securities held by the Series as of December 31, 2012 or June 30, 2013.
The Fund’s policy is to recognize transfers in and transfers out of the valuation levels as of the beginning of the reporting period. There were no transfers between Level 1 and Level 2 during the six months ended June 30, 2013.
Security Transactions, Investment Income and Expenses
Security transactions are accounted for on trade date. Dividend income is recorded on the ex-dividend date, except that if the ex-dividend date has passed, certain dividends from foreign securities are recorded as soon as the Series is informed of the ex-dividend date. Non-cash dividends, if any, are recorded at the fair value of the securities received. Interest income, including amortization of premium and accretion of discounts using the effective interest method, is earned from settlement date and accrued daily.
Expenses are recorded on an accrual basis. Most expenses of the Fund can be attributed to a specific series. Expenses which cannot be directly attributed are apportioned among the series in the Fund in such a manner as deemed equitable by the Fund’s Board, taking into consideration, among other things, the nature and type of expense.
The Series uses the identified cost method for determining realized gain or loss on investments for both financial statement and federal income tax reporting purposes.
Foreign Currency Translation
The books and records of the Series are maintained in U.S. dollars. Foreign currencies, investments and other assets and liabilities are translated into U.S. dollars at the current exchange rates. Purchases and sales of investment securities and income and expenses are translated on the respective dates of such transactions. The Series does not isolate realized and unrealized gains and losses attributable to changes in the exchange rates from gains and losses that arise from changes in the fair value of investments. Such fluctuations are included with net realized and unrealized gain or loss on investments. Net realized foreign currency gains and losses represent foreign currency gains and losses between trade date and settlement date
12
Emerging Markets Series
Notes to Financial Statements (continued)
(unaudited)
| 2. | Significant Accounting Policies (continued) |
Foreign Currency Translation (continued)
on securities transactions, gains and losses on disposition of foreign currencies and the difference between the amount of income and foreign withholding taxes recorded on the books of the Series and the amounts actually received or paid.
Forward Foreign Currency Exchange Contracts
The Series may purchase or sell forward foreign currency exchange contracts in order to hedge a portfolio position or specific transaction. Risks may arise if the counterparties to a contract are unable to meet the terms of the contract or if the value of the foreign currency moves unfavorably.
All forward foreign currency exchange contracts are adjusted daily by the exchange rate of the underlying currency and, for financial statement purposes, any gain or loss is recorded as unrealized gain or loss until a contract has been closed. Realized and unrealized gain or loss arising from a transaction is included in net realized and unrealized gain (loss) on investments.
The Series may regularly trade forward foreign currency exchange contracts with off-balance sheet risk in the normal course of its investing activities to assist in managing exposure to changes in foreign currency exchange rates.
The notional or contractual amount of these instruments represents the investment the Series has in forward foreign currency exchange contracts and does not necessarily represent the amounts potentially at risk. The measurement of the risks associated with forward foreign currency exchange contracts is meaningful only when all related and offsetting transactions are considered. As of June 30, 2013, no investments in forward foreign currency exchange contracts were held by the Series.
Federal Taxes
The Series’ policy is to comply with the provisions of the Internal Revenue Code applicable to regulated investment companies. The Series is not subject to federal income tax or excise tax to the extent that the Series distributes to shareholders each year its taxable income, including any net realized gains on investments, in accordance with requirements of the Internal Revenue Code. Accordingly, no provision for federal income tax or excise tax has been made in the financial statements.
Management evaluates its tax positions to determine if the tax positions taken meet the minimum recognition threshold in connection with accounting for uncertainties in income tax positions taken or expected to be taken for the purposes of measuring and recognizing tax liabilities in the financial statements. Recognition of tax benefits of an uncertain tax position is required only when the position is “more likely than not” to be sustained assuming examination by taxing authorities. At June 30, 2013, the Series has recorded no liability for net unrecognized tax benefits relating to uncertain income tax positions taken or expected to be taken in future tax returns.
The Series files income tax returns in the U.S. federal jurisdiction, various states and foreign jurisdictions, as required. No income tax returns are currently under investigation. The statute of limitations on the Series’ tax returns remains open for the period ended December 31, 2011 and the year ended December 31, 2012. The Series is not aware of any tax positions for which it is reasonably possible that the total amounts of unrecognized tax benefits will significantly change in the next twelve months.
Foreign Taxes
Based on the Series’ understanding of the tax rules and rates related to income, gains and currency purchase/repatriation transactions for foreign jurisdictions in which it invests, the Series will provide for foreign taxes, and where appropriate, deferred foreign tax. The Series is subject to a tax imposed on short term capital gains on securities of issuers domiciled in India. The Series records an estimated deferred tax liability for securities that have been held for less than a year at the end of the reporting period, assuming those positions were disposed of at the end of the period. This amount is reported in Accrued foreign capital gains tax in the accompanying Statement of Assets and Liabilities. Realized losses on the sale of securities of issuers domiciled in India can be carried forward for eight years to offset potential future short term realized capital gains.
13
Emerging Markets Series
Notes to Financial Statements (continued)
(unaudited)
| 2. | Significant Accounting Policies (continued) |
Distributions of Income and Gains
Distributions to shareholders of net investment income and net realized gains are made annually. An additional distribution may be necessary to avoid taxation of the Series. Distributions are recorded on the ex-dividend date.
Indemnifications
The Fund’s organizational documents provide former and current directors and officers with a limited indemnification against liabilities arising in connection with the performance of their duties to the Fund. In the normal course of business, the Fund may also enter into contracts that provide general indemnifications. The Fund’s maximum exposure under these arrangements is unknown as this would be dependent on future claims that may be made against the Fund. The risk of material loss from such claims is considered remote.
Other
The preparation of financial statements in conformity with accounting principles generally accepted in the United States of America requires management to make estimates and assumptions that affect the reported amounts of assets and liabilities and the disclosure of contingent assets and liabilities at the date of the financial statements and the reported amounts of income and expenses during the reporting period. Actual results could differ from those estimates.
| 3. | Transactions with Affiliates |
The Fund has an Investment Advisory Agreement (the “Agreement”) with the Advisor for which the Series pays a fee, computed daily and payable monthly, at an annual rate of 1.00% of the Series’ average daily net assets.
Under the Agreement, personnel of the Advisor provide the Series with advice and assistance in the choice of investments and the execution of securities transactions, and otherwise maintain the Series’ organization. The Advisor also provides the Fund with necessary office space and fund administration and support services. The salaries of all officers of the Fund (except a percentage of the Fund’s Chief Compliance Officer’s salary, which is paid by the Fund), and of all Directors who are “affiliated persons” of the Fund, or of the Advisor, and all personnel of the Fund, or of the Advisor, performing services relating to research, statistical and investment activities, are paid by the Advisor. Each “non-affiliated” Director receives an annual stipend, which is allocated among all the active series of the Fund. In addition, these Directors also receive a fee per Board meeting attended plus a fee for each committee meeting attended.
The Advisor has contractually agreed, until at least April 30, 2014, to waive its fee and, if necessary, pay other operating expenses of the Series in order to maintain total direct annual fund operating expenses for the Series at no more than 1.20% of average daily net assets each year. Accordingly, the Advisor voluntarily waived fees of $57,690 for the six months ended June 30, 2013, which is included as a reduction of expenses on the statement of operations. The Advisor is not eligible to recoup any expenses that have been waived or reimbursed.
Manning & Napier Investor Services, Inc., a registered broker-dealer affiliate of the Advisor, acts as distributor for the Fund’s shares. The services of Manning & Napier Investor Services, Inc. are provided at no additional cost to the Series.
The Advisor has agreements with BNY Mellon Investment Servicing (U.S.) Inc. (“BNY”) under which BNY serves as sub-accountant services agent and sub-transfer agent. The Fund pays the Advisor an annual fee related to fund accounting and administration of 0.0175% on the first $3 billion of average daily net assets (excluding Target Series and Strategic Income Series); 0.015% on the next $3 billion of average daily net assets (excluding Target Series and Strategic Income Series); and 0.01% of the average daily net assets in excess of $6 billion (excluding Target Series and Strategic Income Series); plus a base fee of $25,500 per series. Transfer Agent fees are charged to the Fund on a per account basis. Additionally, certain transaction and cusip-based fees and out-of-pocket expenses, including charges for reporting relating to the Fund’s compliance program, are charged. Effective October 1, 2012, the aforementioned agreements were modified to reduce the annual fee related to fund accounting and administration, as well as transfer agent fees, by 10%, excluding out-of-pocket expenses.
14
Emerging Markets Series
Notes to Financial Statements (continued)
(unaudited)
| 3. | Transactions with Affiliates (continued) |
Expenses not directly attributable to a series are allocated based on each series’ relative net assets or number of accounts, depending on the expense.
| 4. | Purchases and Sales of Securities |
For the six months ended June 30, 2013, purchases and sales of securities, other than U.S. Government securities and short-term securities, were $14,987,997 and $15,466,853, respectively. There were no purchases or sales of U.S. Government securities.
| 5. | Capital Stock Transactions |
Transactions in shares of Emerging Markets Series were:
| | | | | | | | | | | | | | | | |
| | | FOR THE SIX MONTHS ENDED 6/30/13 | | | FOR THE YEAR ENDED 12/31/12 | |
| | | SHARES | | | AMOUNT | | | SHARES | | | AMOUNT | |
Sold | | | 438,517 | | | $ | 5,138,291 | | | | 786,473 | | | $ | 8,680,541 | |
Reinvested | | | — | | | | — | | | | 304,792 | | | | 3,462,433 | |
Repurchased | | | (491,100 | ) | | | (5,793,500 | ) | | | (835,935 | ) | | | (9,266,058 | ) |
| | | | | | | | | | | | | | | | |
Total | | | (52,583 | ) | | $ | (655,209 | ) | | | 255,330 | | | | 2,876,916 | |
| | | | | | | | | | | | | | | | |
Substantially all of the Series’ shares represent investments by fiduciary accounts over which the Advisor has sole investment discretion.
The Series may trade in instruments including written and purchased options, forward foreign currency exchange contracts and futures contracts and other derivatives in the normal course of investing activities to assist in managing exposure to various market risks. The Series may be subject to various elements of risk, which may involve, to a varying degree, elements of risk in excess of the amounts recognized for financial statement purposes. These risks include: the risk that changes in the value of a derivative may not correlate perfectly with the underlying asset, rate or index; counterparty credit risk related to over the counter derivative counterparties’ failure to perform under contract terms; liquidity risk related to the lack of a liquid market for these contracts allowing the fund to close out its position(s); and documentation risk relating to disagreement over contract terms. No such investments were held by the Series as of June 30, 2013.
Investing in securities of foreign companies and foreign governments involves special risks and considerations not typically associated with investing in securities of domestic companies and the U.S. Government. These risks include revaluation of currencies and future adverse political and economic developments. Moreover, securities of foreign companies and foreign governments and their markets may be less liquid and their prices more volatile than those of comparable domestic companies and the U.S. Government.
| 8. | Federal Income Tax Information |
The amount and characterization of certain income and capital gains to be distributed are determined in accordance with federal income tax regulations, which may differ from accounting principles generally accepted in the United States of America. The Series may periodically make reclassifications among its capital accounts to reflect income and gains available for distribution (or available capital loss carryovers) under income tax regulations, without impacting the Series’ net asset value. Any such reclassifications are not reflected in the financial highlights.
15
Emerging Markets Series
Notes to Financial Statements (continued)
(unaudited)
| 8. | Federal Income Tax Information (continued) |
The final determination of the tax character of current year distributions will be made at the conclusion of the fiscal year. The tax character of distributions paid for the year ended December 31, 2012 was as follows:
| | | | |
Ordinary income | | $ | 3,478,088 | |
Long-term capital gains | | | 21,569 | |
At June 30, 2013, the identified cost for federal income tax purposes, the resulting gross unrealized appreciation and depreciation, and the net unrealized appreciation were as follows:
| | | | |
Cost for federal income tax purposes | | $ | 86,789,758 | |
Unrealized appreciation | | | 11,871,652 | |
Unrealized depreciation | | | (7,257,049 | ) |
| | | | |
Net unrealized appreciation | | $ | 4,614,603 | |
| | | | |
16
{This page intentionally left blank}
17
Emerging Markets Series
Literature Requests
(unaudited)
Proxy Voting Policies and Procedures
A description of the policies and procedures that the Fund uses to determine how to vote proxies relating to portfolio securities is available, without charge, upon request:
| | | | |
| By phone | | 1-800-466-3863 | | |
| On the Securities and Exchange Commission’s (SEC) web site | | http://www.sec.gov | | |
Proxy Voting Record
Information regarding how the Fund voted proxies relating to portfolio securities during the most recent 12-month period ended June 30th is available, without charge, upon request:
| | | | |
| By phone | | 1-800-466-3863 | | |
| On the SEC’s web site | | http://www.sec.gov | | |
Quarterly Portfolio Holdings
The Series’ complete schedule of portfolio holdings for the 1st and 3rd quarters of each fiscal year are provided on Form N-Q, and are available, without charge, upon request:
| | | | |
| By phone | | 1-800-466-3863 | | |
| On the SEC’s web site | | http://www.sec.gov | | |
The Series’ Form N-Q may be reviewed and copied at the SEC’s Public Reference Room in Washington, D.C. Information on the operation of the Public Reference Room may be obtained by calling 1-800-SEC-0330.
Prospectus and Statement of Additional Information (SAI)
The prospectus and SAI provide additional information about each Series, including charges, expenses and risks. These documents are available, without charge, upon request:
| | | | |
| By phone | | 1-800-466-3863 | | |
| On the SEC’s web site | | http://www.sec.gov | | |
| On our web site | | http://www.manning-napier.com | | |
Additional information available at www.manning-napier.com
1. Fund Holdings - Month-End
2. Fund Holdings - Quarter-End
3. Shareholder Report - Annual
4. Shareholder Report - Semi-Annual
The Fund also offers electronic notification or “e-delivery” when certain documents are available on-line to be downloaded or reviewed. Direct shareholders can elect to receive electronic notification when shareholder reports, prospectus updates, and/or statements are available. If you do not currently have on-line access to your account, you can establish access by going to www.manning-napier.com, click on “Login” in the top corner of the page, and follow the prompts to self-enroll. Once enrolled, you can set your electronic notification preferences by clicking on the Account Options tab located within the green toolbar and then select E-Delivery Option. Should you have any questions on either how to establish on-line access or how to update your account settings, please contact Investor Services at 1-800-466-3863.
MNEMS-6/13-SAR
| | | | | | |
| | | | GLOBAL FIXED INCOME SERIES | | |
www.manning-napier.com | | | | |
Global Fixed Income Series
Shareholder Expense Example
(unaudited)
As a shareholder of the Series, you may incur two types of costs: (1) transaction costs and (2) ongoing costs, including management fees and other Series expenses. This example is intended to help you understand your ongoing costs (in dollars) of investing in the Series and to compare these costs with the ongoing costs of investing in other mutual funds.
The example is based on an investment of $1,000 invested in each class at the beginning of the period and held for the entire period (January 1, 2013 to June 30, 2013, except for Class S Actual, which is from April 1, 2013* to June 30, 2013).
Actual Expenses
The Actual lines of the table below provides information about actual account values and actual expenses. You may use the information in this line, together with the amount you invested, to estimate the expenses that you paid over the period. Simply divide your account value by $1,000 (for example, an $8,600 account value divided by $1,000 = 8.6), then multiply the result by the number in the Actual line for the class in which you have invested under the heading entitled “Expenses Paid During Period” to estimate the expenses you paid on your account during this period.
Hypothetical Example for Comparison Purposes
The Hypothetical lines of the table below provides information about hypothetical account values and hypothetical expenses based on the Class’ actual expense ratio and an assumed rate of return of 5% per year before expenses, which is not the Class’ actual return. The hypothetical account values and expenses may not be used to estimate the actual ending account balance or expenses you paid during the period. You may use this information to compare the ongoing costs of investing in the Class of the Series and other funds. To do so, compare this 5% hypothetical example with the 5% hypothetical examples that appear in the shareholder reports of the other funds.
Please note that the expenses shown in the table are meant to highlight your ongoing costs only and do not reflect any transaction costs. Therefore, the Hypothetical line for each class in of the table is useful in comparing ongoing costs only, and will not help you determine the relative total costs of owning different funds. In addition, if these transaction costs were included, your costs would have been higher.
| | | | | | | | |
| | | BEGINNING ACCOUNT VALUE 1/1/13* | | ENDING ACCOUNT VALUE 6/30/13 | | EXPENSES PAID DURING PERIOD** 1/1/13-6/30/13 | | ANNUALIZED EXPENSE RATIO |
Class S | | | | | | | | |
Actual | | $1,000.00 | | $ 959.20 | | $2.05 | | 0.85% |
Hypothetical (5% return before expenses) | | $1,000.00 | | $1,010.23 | | $4.24 | | 0.85% |
Class I | | | | | | | | |
Actual | | $1,000.00 | | $ 977.54 | | $3.43 | | 0.70% |
Hypothetical (5% return before expenses) | | $1,000.00 | | $1,021.32 | | $3.51 | | 0.70% |
*Class S inception date was April 1, 2013.
**Expenses are equal to the Class’ annualized expense ratio (for the six-month period), multiplied by the average account value over the period, multiplied by 181/365 to reflect the one-half year period (except for the Series’ Class S Actual return information, which reflects the 90 day period ended June 30, 2013 due to its inception date of April 1, 2013). The Series’ total return would have been lower had certain expenses not been waived during the period
1
Global Fixed Income Series
Portfolio Composition as of June 30, 2013
(unaudited)
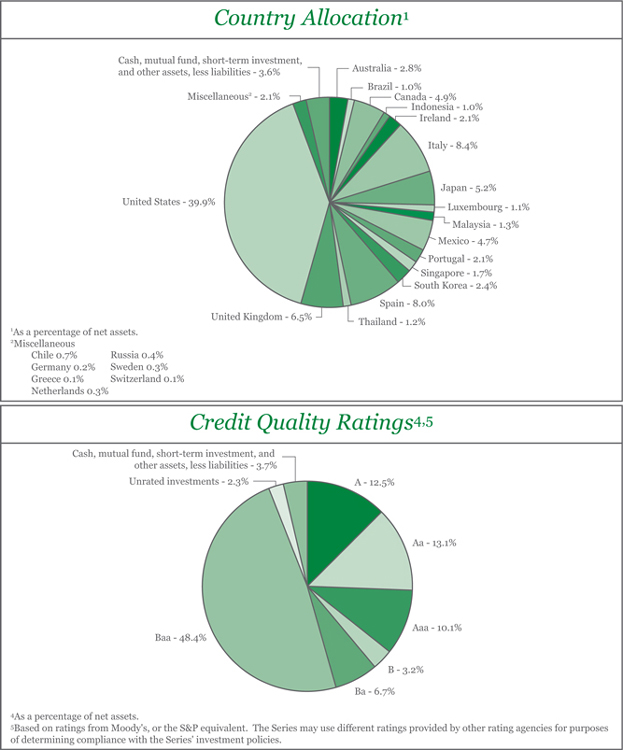
2
Global Fixed Income Series
Investment Portfolio - June 30, 2013
(unaudited)
| | | | | | | | | | | | | | |
| | | CREDIT RATING 1 (UNAUDITED) | | | PRINCIPAL AMOUNT2 | | | VALUE (NOTE 2) | | | |
| | | | |
CORPORATE BONDS - 54.4% | | | | | | | | | | | | | | |
| | | | |
Non-Convertible Corporate Bonds - 54.4% | | | | | | | | | | | | | | |
Consumer Discretionary - 7.5% | | | | | | | | | | | | | | |
Auto Components - 0.2% | | | | | | | | | | | | | | |
Gestamp Funding Luxembourg S.A. (Spain)3, 5.625%, 5/31/2020 | | | B1 | | | | 500,000 | | | $ | 475,000 | | | |
| | | | | | | | | | | | | | |
Hotels, Restaurants & Leisure - 0.6% | | | | | | | | | | | | | | |
International Game Technology, 7.50%, 6/15/2019 | | | Baa2 | | | | 1,000,000 | | | | 1,157,721 | | | |
| | | | | | | | | | | | | | |
Household Durables - 1.6% | | | | | | | | | | | | | | |
Brookfield Residential Properties, Inc. - Brookfield Residential US Corp. (Canada)3, 6.125%, 7/1/2022 | | | B2 | | | | 500,000 | | | | 490,625 | | | |
Newell Rubbermaid, Inc., 4.70%, 8/15/2020 | | | Baa3 | | | | 520,000 | | | | 555,334 | | | |
NVR, Inc., 3.95%, 9/15/2022 | | | Baa2 | | | | 1,280,000 | | | | 1,244,461 | | | |
Tupperware Brands Corp., 4.75%, 6/1/2021 | | | Baa3 | | | | 1,190,000 | | | | 1,206,934 | | | |
| | | | | | | | | | | | | | |
| | | | |
| | | | | | | | | | | 3,497,354 | | | |
| | | | | | | | | | | | | | |
Media - 3.1% | | | | | | | | | | | | | | |
CCO Holdings LLC - CCO Holdings Capital Corp.3, 5.25%, 3/15/2021 | | | B1 | | | | 500,000 | | | | 492,500 | | | |
DIRECTV Holdings LLC - DIRECTV Financing Co., Inc., 5.20%, 3/15/2020 | | | Baa2 | | | | 835,000 | | | | 901,569 | | | |
Discovery Communications LLC, 5.05%, 6/1/2020 | | | Baa2 | | | | 320,000 | | | | 355,008 | | | |
Discovery Communications LLC, 3.25%, 4/1/2023 | | | Baa2 | | | | 700,000 | | | | 656,417 | | | |
Nara Cable Funding Ltd. (Spain)3, 8.875%, 12/1/2018 | | | B1 | | | | 500,000 | | | | 520,000 | | | |
NBCUniversal Media LLC, 5.15%, 4/30/2020 | | | A3 | | | | 695,000 | | | | 791,251 | | | |
Sirius XM Radio, Inc.3, 4.25%, 5/15/2020 | | | B1 | | | | 500,000 | | | | 470,000 | | | |
Time Warner, Inc., 3.15%, 7/15/2015 | | | Baa2 | | | | 565,000 | | | | 590,180 | | | |
Time Warner, Inc., 4.75%, 3/29/2021 | | | Baa2 | | | | 770,000 | | | | 828,325 | | | |
Unitymedia Hessen GmbH & Co. KG - Unitymedia NRW GmbH (Germany)3, 5.50%, 1/15/2023 | | | Ba3 | | | | 500,000 | | | | 472,500 | | | |
The Walt Disney Co., 1.35%, 8/16/2016 | | | A2 | | | | 600,000 | | | | 605,429 | | | |
The Walt Disney Co., 5.625%, 9/15/2016 | | | A2 | | | | 10,000 | | | | 11,387 | | | |
| | | | | | | | | | | | | | |
| | | | |
| | | | | | | | | | | 6,694,566 | | | |
| | | | | | | | | | | | | | |
Multiline Retail - 0.3% | | | | | | | | | | | | | | |
Dollar General Corp., 1.875%, 4/15/2018 | | | Baa3 | | | | 350,000 | | | | 337,690 | | | |
Macy’s Retail Holdings, Inc., 2.875%, 2/15/2023 | | | Baa3 | | | | 350,000 | | | | 322,827 | | | |
Target Corp., 3.875%, 7/15/2020 | | | A2 | | | | 15,000 | | | | 16,034 | | | |
| | | | | | | | | | | | | | |
| | | | |
| | | | | | | | | | | 676,551 | | | |
| | | | | | | | | | | | | | |
Specialty Retail - 1.4% | | | | | | | | | | | | | | |
Advance Auto Parts, Inc., 4.50%, 1/15/2022 | | | Baa3 | | | | 355,000 | | | | 345,230 | | | |
The Home Depot, Inc., 5.40%, 3/1/2016 | | | A3 | | | | 1,265,000 | | | | 1,409,572 | | | |
Lowe’s Companies, Inc., 1.625%, 4/15/2017 | | | A3 | | | | 700,000 | | | | 699,798 | | | |
Rent-A-Center, Inc., 6.625%, 11/15/2020 | | | Ba3 | | | | 500,000 | | | | 523,750 | | | |
| | | | | | | | | | | | | | |
| | | | |
| | | | | | | | | | | 2,978,350 | | | |
| | | | | | | | | | | | | | |
The accompanying notes are an integral part of the financial statements.
3
Global Fixed Income Series
Investment Portfolio - June 30, 2013
(unaudited)
| | | | | | | | | | | | | | |
| | | CREDIT RATING 1 (UNAUDITED) | | | PRINCIPAL AMOUNT2 | | | VALUE (NOTE 2) | | | |
| | | | |
CORPORATE BONDS (continued) | | | | | | | | | | | | | | |
| | | | |
Non-Convertible Corporate Bonds (continued) | | | | | | | | | | | | | | |
Consumer Discretionary (continued) | | | | | | | | | | | | | | |
Textiles, Apparel & Luxury Goods - 0.3% | | | | | | | | | | | | | | |
VF Corp., 5.95%, 11/1/2017 | | | A3 | | | | 625,000 | | | $ | 725,077 | | | |
| | | | | | | | | | | | | | |
| | | | |
Total Consumer Discretionary | | | | | | | | | | | 16,204,619 | | | |
| | | | | | | | | | | | | | |
| | | | |
Consumer Staples - 1.0% | | | | | | | | | | | | | | |
Beverages - 0.3% | | | | | | | | | | | | | | |
The Coca-Cola Co., 1.50%, 11/15/2015 | | | Aa3 | | | | 535,000 | | | | 545,762 | | | |
| | | | | | | | | | | | | | |
Food Products - 0.7% | | | | | | | | | | | | | | |
C&S Group Enterprises LLC3, 8.375%, 5/1/2017 | | | B1 | | | | 500,000 | | | | 530,000 | | | |
FAGE Dairy Industry S.A. - FAGE USA Dairy Industry, Inc. (Greece)3, 9.875%, 2/1/2020 | | | B3 | | | | 250,000 | | | | 269,375 | | | |
Shearer’s Foods LLC - Chip Finance Corp.3, 9.00%, 11/1/2019 | | | B3 | | | | 250,000 | | | | 264,375 | | | |
Tyson Foods, Inc., 4.50%, 6/15/2022 | | | Baa3 | | | | 440,000 | | | | 449,603 | | | |
| | | | | | | | | | | | | | |
| | | | |
| | | | | | | | | | | 1,513,353 | | | |
| | | | | | | | | | | | | | |
| | | | |
Total Consumer Staples | | | | | | | | | | | 2,059,115 | | | |
| | | | | | | | | | | | | | |
| | | | |
Energy - 2.8% | | | | | | | | | | | | | | |
Energy Equipment & Services - 1.4% | | | | | | | | | | | | | | |
Baker Hughes, Inc., 7.50%, 11/15/2018 | | | A2 | | | | 575,000 | | | | 724,040 | | | |
Schlumberger Oilfield plc3, 4.20%, 1/15/2021 | | | A1 | | | | 560,000 | | | | 598,060 | | | |
Weatherford International Ltd., 9.625%, 3/1/2019 | | | Baa2 | | | | 1,355,000 | | | | 1,713,019 | | | |
| | | | | | | | | | | | | | |
| | | | |
| | | | | | | | | | | 3,035,119 | | | |
| | | | | | | | | | | | | | |
Oil, Gas & Consumable Fuels - 1.4% | | | | | | | | | | | | | | |
Buckeye Partners LP, 4.15%, 7/1/2023 | | | Baa3 | | | | 330,000 | | | | 321,072 | | | |
Chesapeake Oilfield Operating LLC - Chesapeake Oilfield Finance, Inc.3, 6.625%, 11/15/2019 | | | Ba3 | | | | 500,000 | | | | 495,000 | | | |
EOG Resources, Inc., 2.625%, 3/15/2023 | | | A3 | | | | 490,000 | | | | 458,514 | | | |
Lukoil International Finance B.V. (Russia)3, 3.416%, 4/24/2018 | | | Baa2 | | | | 250,000 | | | | 243,125 | | | |
Petrobras International Finance Co. (Brazil), 5.375%, 1/27/2021 | | | A3 | | | | 1,515,000 | | | | 1,522,111 | | | |
| | | | | | | | | | | | | | |
| | | | |
| | | | | | | | | | | 3,039,822 | | | |
| | | | | | | | | | | | | | |
| | | | |
Total Energy | | | | | | | | | | | 6,074,941 | | | |
| | | | | | | | | | | | | | |
| | | | |
Financials - 30.5% | | | | | | | | | | | | | | |
Capital Markets - 4.8% | | | | | | | | | | | | | | |
BNP Paribas Home Loan Covered Bonds S.A. (France), 3.75%, 4/20/2020 | | | AAA4 | | | EUR | 50,000 | | | | 73,324 | | | |
The Goldman Sachs Group, Inc., 2.375%, 1/22/2018 | | | A3 | | | | 330,000 | | | | 324,005 | | | |
The Goldman Sachs Group, Inc., 6.15%, 4/1/2018 | | | A3 | | | | 1,790,000 | | | | 2,017,044 | | | |
The Goldman Sachs Group, Inc., 5.375%, 3/15/2020 | | | A3 | | | | 615,000 | | | | 667,308 | | | |
The Goldman Sachs Group, Inc., 5.25%, 7/27/2021 | | | A3 | | | | 550,000 | | | | 588,444 | | | |
Jefferies Finance LLC - JFIN Co-Issuer Corp.3, 7.375%, 4/1/2020 | | | B1 | | | | 500,000 | | | | 485,000 | | | |
Jefferies Group LLC, 5.125%, 4/13/2018 | | | Baa3 | | | | 15,000 | | | | 15,675 | | | |
Jefferies Group LLC, 8.50%, 7/15/2019 | | | Baa3 | | | | 2,265,000 | | | | 2,729,325 | | | |
The accompanying notes are an integral part of the financial statements.
4
Global Fixed Income Series
Investment Portfolio - June 30, 2013
(unaudited)
| | | | | | | | | | | | | | |
| | | CREDIT RATING 1 (UNAUDITED) | | | PRINCIPAL AMOUNT2 | | | VALUE (NOTE 2) | | | |
| | | | |
CORPORATE BONDS (continued) | | | | | | | | | | | | | | |
| | | | |
Non-Convertible Corporate Bonds (continued) | | | | | | | | | | | | | | |
Financials (continued) | | | | | | | | | | | | | | |
Capital Markets (continued) | | | | | | | | | | | | | | |
Merrill Lynch & Co., Inc., 6.875%, 4/25/2018 | | | Baa2 | | | | 480,000 | | | $ | 552,443 | | | |
Morgan Stanley, 2.125%, 4/25/2018 | | | Baa1 | | | | 740,000 | | | | 708,203 | | | |
Morgan Stanley, 5.75%, 1/25/2021 | | | Baa1 | | | | 2,015,000 | | | | 2,187,186 | | | |
| | | | | | | | | | | | | | |
| | | | |
| | | | | | | | | | | 10,347,957 | | | |
| | | | | | | | | | | | | | |
Commercial Banks - 10.7% | | | | | | | | | | | | | | |
Banco Santander S.A. (Spain), 4.00%, 4/7/2020 | | | A3 | | | | EUR 100,000 | | | | 136,094 | | | |
Banco Santander S.A. (Spain), 3.875%, 2/6/2026 | | | A3 | | | | EUR 700,000 | | | | 900,005 | | | |
Barclays Bank plc (United Kingdom), 4.25%, 1/12/2022 | | | Aaa | | | | GBP 2,755,000 | | | | 4,536,574 | | | |
BBVA Bancomer S.A. (Mexico)3, 6.75%, 9/30/2022 | | | Baa2 | | | | 845,000 | | | | 912,600 | | | |
BBVA US Senior S.A.U. (Spain), 4.664%, 10/9/2015 | | | Baa3 | | | | 610,000 | | | | 628,375 | | | |
Commonwealth Bank of Australia (Australia), 5.75%, 1/25/2017 | | | Aaa | | | | AUD 2,240,000 | | | | 2,179,910 | | | |
HSBC Bank plc (United Kingdom)3, 1.50%, 5/15/2018 | | | Aa3 | | | | 500,000 | | | | 481,843 | | | |
Intesa Sanpaolo S.p.A. (Italy), 3.125%, 1/15/2016 | | | Baa2 | | | | 875,000 | | | | 860,351 | | | |
Intesa Sanpaolo S.p.A. (Italy)3, 6.50%, 2/24/2021 | | | Baa2 | | | | 565,000 | | | | 569,052 | | | |
KeyBank National Association, 5.70%, 11/1/2017 | | | Baa1 | | | | 260,000 | | | | 290,940 | | | |
Lloyds TSB Bank plc (United Kingdom)3, 6.50%, 9/14/2020 | | | Baa3 | | | | 580,000 | | | | 618,348 | | | |
Manufacturers & Traders Trust Co., 6.625%, 12/4/2017 | | | A3 | | | | 780,000 | | | | 917,648 | | | |
National City Corp., 6.875%, 5/15/2019 | | | Baa1 | | | | 1,350,000 | | | | 1,614,773 | | | |
Royal Bank of Canada (Canada), 3.27%, 11/10/2014 | | | Aaa | | | | CAD 1,295,000 | | | | 1,259,193 | | | |
Royal Bank of Canada (Canada), 3.18%, 3/16/2015 | | | Aaa | | | | CAD 2,140,000 | | | | 2,085,874 | | | |
Royal Bank of Canada (Canada), 3.77%, 3/30/2018 | | | Aaa | | | | CAD 1,995,000 | | | | 1,997,807 | | | |
Santander Holdings USA, Inc., 4.625%, 4/19/2016 | | | Baa2 | | | | 470,000 | | | | 495,811 | | | |
Wells Fargo & Co., Series M, 3.45%, 2/13/2023 | | | A3 | | | | 575,000 | | | | 549,145 | | | |
Westpac Banking Corp. (Australia), 5.75%, 2/6/2017 | | | Aaa | | | | AUD 2,100,000 | | | | 2,044,080 | | | |
| | | | | | | | | | | | | | |
| | | | |
| | | | | | | | | | | 23,078,423 | | | |
| | | | | | | | | | | | | | |
Consumer Finance - 1.9% | | | | | | | | | | | | | | |
American Express Co., 2.65%, 12/2/2022 | | | A3 | | | | 902,000 | | | | 832,832 | | | |
American Express Co.5, 6.80%, 9/1/2066 | | | Baa2 | | | | 620,000 | | | | 661,850 | | | |
Capital One Bank USA National Association, 3.375%, 2/15/2023 | | | Baa1 | | | | 1,005,000 | | | | 949,980 | | | |
Caterpillar Financial Services Corp., 7.05%, 10/1/2018 | | | A2 | | | | 675,000 | | | | 836,188 | | | |
John Deere Capital Corp., 5.75%, 9/10/2018 | | | A2 | | | | 720,000 | | | | 840,272 | | | |
| | | | | | | | | | | | | | |
| | | | |
| | | | | | | | | | | 4,121,122 | | | |
| | | | | | | | | | | | | | |
Diversified Financial Services - 5.4% | | | | | | | | | | | | | | |
Bank of America Corp., 5.75%, 8/15/2016 | | | Baa3 | | | | 680,000 | | | | 738,933 | | | |
Bank of America Corp., 3.30%, 1/11/2023 | | | Baa2 | | | | 285,000 | | | | 269,367 | | | |
The Bear Stearns Companies LLC, 7.25%, 2/1/2018 | | | A2 | | | | 380,000 | | | | 452,482 | | | |
Citigroup, Inc., 8.50%, 5/22/2019 | | | Baa2 | | | | 2,710,000 | | | | 3,414,673 | | | |
CME Group, Inc., 3.00%, 9/15/2022 | | | Aa3 | | | | 1,320,000 | | | | 1,242,714 | | | |
CNG Holdings, Inc.3, 9.375%, 5/15/2020 | | | B3 | | | | 500,000 | | | | 480,000 | | | |
Ford Motor Credit Co. LLC, 5.00%, 5/15/2018 | | | Baa3 | | | | 1,315,000 | | | | 1,402,348 | | | |
The accompanying notes are an integral part of the financial statements.
5
Global Fixed Income Series
Investment Portfolio - June 30, 2013
(unaudited)
| | | | | | | | | | | | | | |
| | | CREDIT RATING 1 (UNAUDITED) | | | PRINCIPAL AMOUNT2 | | | VALUE (NOTE 2) | | | |
| | | | |
CORPORATE BONDS (continued) | | | | | | | | | | | | | | |
| | | | |
Non-Convertible Corporate Bonds (continued) | | | | | | | | | | | | | | |
Financials (continued) | | | | | | | | | | | | | | |
Diversified Financial Services (continued) | | | | | | | | | | | | | | |
General Electric Capital Corp., 5.625%, 5/1/2018 | | | A1 | | | | 725,000 | | | $ | 831,578 | | | |
General Electric Capital Corp., 5.50%, 1/8/2020 | | | A1 | | | | 585,000 | | | | 659,579 | | | |
ING US, Inc. (Netherlands)3, 2.90%, 2/15/2018 | | | Baa3 | | | | 370,000 | | | | 371,862 | | | |
ING US, Inc. (Netherlands)3, 5.50%, 7/15/2022 | | | Baa3 | | | | 270,000 | | | | 287,212 | | | |
JPMorgan Chase & Co., 6.30%, 4/23/2019 | | | A2 | | | | 820,000 | | | | 952,592 | | | |
Ladder Capital Finance Holdings LLLP - Ladder Capital Finance Corp.3, 7.375%, 10/1/2017 | | | Ba3 | | | | 500,000 | | | | 510,000 | | | |
| | | | | | | | | | | | | | |
| | | | |
| | | | | | | | | | | 11,613,340 | | | |
| | | | | | | | | | | | | | |
Insurance - 2.9% | | | | | | | | | | | | | | |
American International Group, Inc., 4.875%, 6/1/2022 | | | Baa1 | | | | 1,875,000 | | | | 1,998,607 | | | |
Fidelity National Financial, Inc., 6.60%, 5/15/2017 | | | Baa3 | | | | 10,000 | | | | 11,084 | | | |
First American Financial Corp., 4.30%, 2/1/2023 | | | Baa3 | | | | 565,000 | | | | 543,567 | | | |
Genworth Holdings, Inc., 7.625%, 9/24/2021 | | | Baa3 | | | | 1,755,000 | | | | 2,039,450 | | | |
Genworth Holdings, Inc.5, 6.15%, 11/15/2066 | | | Ba1 | | | | 200,000 | | | | 173,500 | | | |
Hartford Financial Services Group, Inc., 5.125%, 4/15/2022 | | | Baa3 | | | | 1,320,000 | | | | 1,436,313 | | | |
| | | | | | | | | | | | | | |
| | | | |
| | | | | | | | | | | 6,202,521 | | | |
| | | | | | | | | | | | | | |
Real Estate Investment Trusts (REITS) - 4.8% | | | | | | | | | | | | | | |
American Campus Communities Operating Partnership LP, 3.75%, 4/15/2023 | | | Baa3 | | | | 280,000 | | | | 268,692 | | | |
BioMed Realty LP, 3.85%, 4/15/2016 | | | Baa3 | | | | 560,000 | | | | 587,211 | | | |
Boston Properties LP, 5.875%, 10/15/2019 | | | Baa2 | | | | 780,000 | | | | 899,660 | | | |
Camden Property Trust, 5.70%, 5/15/2017 | | | Baa1 | | | | 715,000 | | | | 795,103 | | | |
Corporate Office Properties LP3, 3.60%, 5/15/2023 | | | Baa3 | | | | 400,000 | | | | 369,191 | | | |
Digital Realty Trust LP, 5.875%, 2/1/2020 | | | Baa2 | | | | 1,110,000 | | | | 1,211,175 | | | |
HCP, Inc., 6.70%, 1/30/2018 | | | Baa1 | | | | 865,000 | | | | 1,012,434 | | | |
Health Care REIT, Inc., 4.95%, 1/15/2021 | | | Baa2 | | | | 635,000 | | | | 675,669 | | | |
Host Hotels & Resorts LP, Series D, 3.75%, 10/15/2023 | | | Baa3 | | | | 580,000 | | | | 531,945 | | | |
Mack-Cali Realty LP, 7.75%, 8/15/2019 | | | Baa2 | | | | 540,000 | | | | 661,599 | | | |
National Retail Properties, Inc., 3.30%, 4/15/2023 | | | Baa2 | | | | 630,000 | | | | 569,357 | | | |
Simon Property Group LP, 6.125%, 5/30/2018 | | | A3 | | | | 285,000 | | | | 334,844 | | | |
Simon Property Group LP, 10.35%, 4/1/2019 | | | A3 | | | | 1,125,000 | | | | 1,558,049 | | | |
UDR, Inc., 4.625%, 1/10/2022 | | | Baa2 | | | | 920,000 | | | | 951,775 | | | |
| | | | | | | | | | | | | | |
| | | | |
| | | | | | | | | | | 10,426,704 | | | |
| | | | | | | | | | | | | | |
| | | | |
Total Financials | | | | | | | | | | | 65,790,067 | | | |
| | | | | | | | | | | | | | |
| | | | |
Health Care - 1.5% | | | | | | | | | | | | | | |
Health Care Equipment & Supplies - 1.1% | | | | | | | | | | | | | | |
FMC Finance VIII S.A. (Germany)3, 6.50%, 9/15/2018 | | | Ba2 | | | EUR | 1,540,000 | | | | 2,310,461 | | | |
| | | | | | | | | | | | | | |
Health Care Providers & Services - 0.2% | | | | | | | | | | | | | | |
Express Scripts Holding Co., 4.75%, 11/15/2021 | | | Baa3 | | | | 500,000 | | | | 534,925 | | | |
| | | | | | | | | | | | | | |
The accompanying notes are an integral part of the financial statements.
6
Global Fixed Income Series
Investment Portfolio - June 30, 2013
(unaudited)
| | | | | | | | | | | | | | |
| | | CREDIT RATING 1 (UNAUDITED) | | | PRINCIPAL AMOUNT2 | | | VALUE (NOTE 2) | | | |
| | | | |
CORPORATE BONDS (continued) | | | | | | | | | | | | | | |
| | | | |
Non-Convertible Corporate Bonds (continued) | | | | | | | | | | | | | | |
Health Care (continued) | | | | | | | | | | | | | | |
Pharmaceuticals - 0.2% | | | | | | | | | | | | | | |
Valeant Pharmaceuticals International3, 6.75%, 8/15/2021 | | | B1 | | | | 500,000 | | | $ | 500,625 | | | |
| | | | | | | | | | | | | | |
| | | | |
Total Health Care | | | | | | | | | | | 3,346,011 | | | |
| | | | | | | | | | | | | | |
| | | | |
Industrials - 3.3% | | | | | | | | | | | | | | |
Aerospace & Defense - 0.9% | | | | | | | | | | | | | | |
The Boeing Co., 6.00%, 3/15/2019 | | | A2 | | | | 685,000 | | | | 815,506 | | | |
Bombardier, Inc. (Canada)3, 6.125%, 1/15/2023 | | | Ba2 | | | | 500,000 | | | | 496,250 | | | |
DigitalGlobe, Inc.3, 5.25%, 2/1/2021 | | | B1 | | | | 500,000 | | | | 480,000 | | | |
Textron, Inc., 7.25%, 10/1/2019 | | | Baa3 | | | | 35,000 | | | | 41,562 | | | |
| | | | | | | | | | | | | | |
| | | | |
| | | | | | | | | | | 1,833,318 | | | |
| | | | | | | | | | | | | | |
Air Freight & Logistics - 0.0%* | | | | | | | | | | | | | | |
FedEx Corp., 8.00%, 1/15/2019 | | | Baa1 | | | | 10,000 | | | | 12,641 | | | |
| | | | | | | | | | | | | | |
Airlines - 0.6% | | | | | | | | | | | | | | |
Aviation Capital Group Corp.3, 4.625%, 1/31/2018 | | | BB4 | | | | 500,000 | | | | 492,235 | | | |
Southwest Airlines Co., 5.25%, 10/1/2014 | | | Baa3 | | | | 815,000 | | | | 853,120 | | | |
| | | | | | | | | | | | | | |
| | | | |
| | | | | | | | | | | 1,345,355 | | | |
| | | | | | | | | | | | | | |
Commercial Services & Supplies - 0.8% | | | | | | | | | | | | | | |
Garda World Security Corp. (Canada), 9.75%, 3/15/2017 | | | B2 | | | | CAD 1,050,000 | | | | 1,038,319 | | | |
Waste Management, Inc., 7.375%, 3/11/2019 | | | Baa3 | | | | 560,000 | | | | 675,423 | | | |
| | | | | | | | | | | | | | |
| | | | |
| | | | | | | | | | | 1,713,742 | | | |
| | | | | | | | | | | | | | |
Industrial Conglomerates - 0.2% | | | | | | | | | | | | | | |
General Electric Co., 5.25%, 12/6/2017 | | | Aa3 | | | | 100,000 | | | | 112,915 | | | |
Tyco Electronics Group S.A. (Switzerland), 4.875%, 1/15/2021 | | | Baa2 | | | | 185,000 | | | | 197,193 | | | |
| | | | | | | | | | | | | | |
| | | | |
| | | | | | | | | | | 310,108 | | | |
| | | | | | | | | | | | | | |
Machinery - 0.2% | | | | | | | | | | | | | | |
Joy Global, Inc., 5.125%, 10/15/2021 | | | Baa2 | | | | 415,000 | | | | 440,753 | | | |
| | | | | | | | | | | | | | |
Professional Services - 0.2% | | | | | | | | | | | | | | |
FTI Consulting, Inc.3, 6.00%, 11/15/2022 | | | Ba2 | | | | 500,000 | | | | 506,250 | | | |
| | | | | | | | | | | | | | |
Road & Rail - 0.4% | | | | | | | | | | | | | | |
Union Pacific Corp., 2.95%, 1/15/2023 | | | Baa1 | | | | 965,000 | | | | 929,257 | | | |
| | | | | | | | | | | | | | |
| | | | |
Total Industrials | | | | | | | | | | | 7,091,424 | | | |
| | | | | | | | | | | | | | |
| | | | |
Information Technology - 2.6% | | | | | | | | | | | | | | |
Communications Equipment - 0.2% | | | | | | | | | | | | | | |
Hughes Satellite Systems Corp., 6.50%, 6/15/2019 | | | Ba3 | | | | 500,000 | | | | 530,000 | | | |
| | | | | | | | | | | | | | |
Computers & Peripherals - 1.4% | | | | | | | | | | | | | | |
Apple, Inc., 2.40%, 5/3/2023 | | | Aa1 | | | | 100,000 | | | | 92,746 | | | |
EMC Corp., 2.65%, 6/1/2020 | | | A1 | | | | 1,595,000 | | | | 1,572,318 | | | |
The accompanying notes are an integral part of the financial statements.
7
Global Fixed Income Series
Investment Portfolio - June 30, 2013
(unaudited)
| | | | | | | | | | | | | | |
| | | CREDIT RATING 1 (UNAUDITED) | | | PRINCIPAL AMOUNT2 | | | VALUE (NOTE 2) | | | |
| | | | |
CORPORATE BONDS (continued) | | | | | | | | | | | | | | |
| | | | |
Non-Convertible Corporate Bonds (continued) | | | | | | | | | | | | | | |
Information Technology (continued) | | | | | | | | | | | | | | |
Computers & Peripherals (continued) | | | | | | | | | | | | | | |
Hewlett-Packard Co., 2.125%, 9/13/2015 | | | Baa1 | | | | 1,245,000 | | | $ | 1,260,047 | | | |
| | | | | | | | | | | | | | |
| | | | |
| | | | | | | | | | | 2,925,111 | | | |
| | | | | | | | | | | | | | |
Electronic Equipment, Instruments & Components - 0.3% | | | | | | | | | | | | | | |
Corning, Inc., 6.625%, 5/15/2019 | | | A3 | | | | 15,000 | | | | 18,027 | | | |
Corning, Inc., 4.25%, 8/15/2020 | | | A3 | | | | 505,000 | | | | 538,553 | | | |
| | | | | | | | | | | | | | |
| | | | |
| | | | | | | | | | | 556,580 | | | |
| | | | | | | | | | | | | | |
IT Services - 0.2% | | | | | | | | | | | | | | |
International Business Machines Corp., 8.375%, 11/1/2019 | | | Aa3 | | | | 10,000 | | | | 13,395 | | | |
The Western Union Co., 5.253%, 4/1/2020 | | | Baa1 | | | | 500,000 | | | | 530,363 | | | |
| | | | | | | | | | | | | | |
| | | | |
| | | | | | | | | | | 543,758 | | | |
| | | | | | | | | | | | | | |
Office Electronics - 0.0%* | | | | | | | | | | | | | | |
Xerox Corp.5, 1.672%, 9/13/2013 | | | Baa2 | | | | 15,000 | | | | 15,024 | | | |
| | | | | | | | | | | | | | |
Software - 0.5% | | | | | | | | | | | | | | |
Autodesk, Inc., 3.60%, 12/15/2022 | | | Baa2 | | | | 1,135,000 | | | | 1,083,318 | | | |
| | | | | | | | | | | | | | |
| | | | |
Total Information Technology | | | | | | | | | | | 5,653,791 | | | |
| | | | | | | | | | | | | | |
| | | | |
Materials - 3.5% | | | | | | | | | | | | | | |
Chemicals - 0.7% | | | | | | | | | | | | | | |
Ashland, Inc.3, 3.875%, 4/15/2018 | | | Ba1 | | | | 500,000 | | | | 495,000 | | | |
Eastman Chemical Co., 3.60%, 8/15/2022 | | | Baa2 | | | | 550,000 | | | | 530,122 | | | |
Nufarm Australia Ltd. (Australia)3, 6.375%, 10/15/2019 | | | Ba3 | | | | 500,000 | | | | 498,750 | | | |
| | | | | | | | | | | | | | |
| | | | |
| | | | | | | | | | | 1,523,872 | | | |
| | | | | | | | | | | | | | |
Metals & Mining - 2.1% | | | | | | | | | | | | | | |
Allegheny Technologies, Inc., 5.95%, 1/15/2021 | | | Baa3 | | | | 1,140,000 | | | | 1,211,068 | | | |
BHP Billiton Finance (USA) Ltd. (Australia), 6.50%, 4/1/2019 | | | A1 | | | | 580,000 | | | | 694,382 | | | |
Cliffs Natural Resources, Inc., 5.90%, 3/15/2020 | | | Baa3 | | | | 265,000 | | | | 255,356 | | | |
Freeport-McMoRan Copper & Gold, Inc.3, 2.375%, 3/15/2018 | | | Baa3 | | | | 470,000 | | | | 447,006 | | | |
Freeport-McMoRan Copper & Gold, Inc., 3.55%, 3/1/2022 | | | Baa3 | | | | 580,000 | | | | 526,847 | | | |
Rio Tinto Finance USA Ltd. (Australia), 3.75%, 9/20/2021 | | | A3 | | | | 725,000 | | | | 715,971 | | | |
Teck Resources Ltd. (Canada), 3.00%, 3/1/2019 | | | Baa2 | | | | 645,000 | | | | 627,170 | | | |
| | | | | | | | | | | | | | |
| | | | |
| | | | | | | | | | | 4,477,800 | | | |
| | | | | | | | | | | | | | |
Paper & Forest Products - 0.7% | | | | | | | | | | | | | | |
International Paper Co., 7.50%, 8/15/2021 | | | Baa3 | | | | 1,175,000 | | | | 1,442,170 | | | |
| | | | | | | | | | | | | | |
| | | | |
Total Materials | | | | | | | | | | | 7,443,842 | | | |
| | | | | | | | | | | | | | |
| | | | |
Telecommunication Services - 1.5% | | | | | | | | | | | | | | |
Diversified Telecommunication Services - 0.9% | | | | | | | | | | | | | | |
Telefonica Emisiones S.A.U. (Spain), 3.192%, 4/27/2018 | | | Baa2 | | | | 500,000 | | | | 484,304 | | | |
Verizon Communications, Inc., 2.00%, 11/1/2016 | | | A3 | | | | 15,000 | | | | 15,285 | | | |
The accompanying notes are an integral part of the financial statements.
8
Global Fixed Income Series
Investment Portfolio - June 30, 2013
(unaudited)
| | | | | | | | | | | | | | |
| | | CREDIT
RATING1
(UNAUDITED) | | | PRINCIPAL AMOUNT2/ SHARES | | | VALUE (NOTE 2) | | | |
| | | | |
CORPORATE BONDS (continued) | | | | | | | | | | | | | | |
| | | | |
Non-Convertible Corporate Bonds (continued) | | | | | | | | | | | | | | |
Telecommunication Services (continued) | | | | | | | | | | | | | | |
Diversified Telecommunication Services (continued) | | | | | | | | | | | | | | |
Verizon Communications, Inc., 8.75%, 11/1/2018 | | | A3 | | | | 706,000 | | | $ | 920,158 | | | |
Windstream Corp., 7.50%, 6/1/2022 | | | B1 | | | | 500,000 | | | | 510,000 | | | |
| | | | | | | | | | | | | | |
| | | | |
| | | | | | | | | | | 1,929,747 | | | |
| | | | | | | | | | | | | | |
Wireless Telecommunication Services - 0.6% | | | | | | | | | | | | | | |
America Movil SAB de C.V. (Mexico), 5.00%, 3/30/2020 | | | A2 | | | | 740,000 | | | | 794,235 | | | |
SBA Tower Trust3, 3.598%, 4/15/2018 | | | Baa3 | | | | 500,000 | | | | 494,743 | | | |
| | | | | | | | | | | | | | |
| | | | |
| | | | | | | | | | | 1,288,978 | | | |
| | | | | | | | | | | | | | |
| | | | |
Total Telecommunication Services | | | | | | | | | | | 3,218,725 | | | |
| | | | | | | | | | | | | | |
| | | | |
Utilities - 0.2% | | | | | | | | | | | | | | |
Gas Utilities - 0.2% | | | | | | | | | | | | | | |
National Fuel Gas Co., 3.75%, 3/1/2023 | | | Baa1 | | | | 400,000 | | | | 384,935 | | | |
| | | | | | | | | | | | | | |
| | | | | | | | | | | | | | |
TOTAL CORPORATE BONDS
(Identified Cost $122,968,809) | | | | | | | | | | | 117,267,470 | | | |
| | | | | | | | | | | | | | |
| | | | |
PREFERRED STOCKS - 0.1% | | | | | | | | | | | | | | |
| | | | |
Financials - 0.1% | | | | | | | | | | | | | | |
Real Estate Investment Trusts (REITS) - 0.1% | | | | | | | | | | | | | | |
National Retail Properties, Inc., 5.70% (Identified Cost $250,000) | | | Baa3 | | | | 10,000 | | | | 239,700 | | | |
| | | | | | | | | | | | | | |
| | | | |
FOREIGN GOVERNMENT BONDS - 41.8% | | | | | | | | | | | | | | |
| | | | |
Australia Government Bond (Australia), 4.50%, 4/15/2020 | | | Aaa | | | AUD | 600,000 | | | | 584,290 | | | |
Brazilian Government Bond (Brazil), 8.875%, 10/14/2019 | | | Baa2 | | | | 400,000 | | | | 526,000 | | | |
Canada Housing Trust No. 1 (Canada)3, 4.10%, 12/15/2018 | | | Aaa | | | CAD | 2,485,000 | | | | 2,585,728 | | | |
Chile Government Bond (Chile), 3.25%, 9/14/2021 | | | Aa3 | | | | 1,500,000 | | | | 1,500,000 | | | |
Indonesia Treasury Bond (Indonesia), 8.25%, 7/15/2021 | | | Baa3 | | | IDR | 5,000,000,000 | | | | 538,271 | | | |
Indonesia Treasury Bond (Indonesia), 7.00%, 5/15/2022 | | | Baa3 | | | IDR | 16,615,000,000 | | | | 1,654,820 | | | |
Ireland Government Bond (Ireland), 5.00%, 10/18/2020 | | | Ba1 | | | EUR | 1,340,000 | | | | 1,868,911 | | | |
Ireland Government Bond (Ireland), 3.90%, 3/20/2023 | | | Ba1 | | | EUR | 400,000 | | | | 512,139 | | | |
Ireland Government Bond (Ireland), 5.40%, 3/13/2025 | | | Ba1 | | | EUR | 1,500,000 | | | | 2,116,705 | | | |
Italy Buoni Poliennali Del Tesoro (Italy), 5.50%, 9/1/2022 | | | Baa2 | | | EUR | 2,835,000 | | | | 3,968,395 | | | |
Italy Buoni Poliennali Del Tesoro (Italy), 5.50%, 11/1/2022 | | | Baa2 | | | EUR | 3,910,000 | | | | 5,460,594 | | | |
Italy Buoni Poliennali Del Tesoro (Italy), 4.50%, 5/1/2023 | | | Baa2 | | | EUR | 3,300,000 | | | | 4,295,421 | | | |
Italy Buoni Poliennali Del Tesoro (Italy)3, 5.00%, 3/1/2025 | | | Baa2 | | | EUR | 2,215,000 | | | | 2,976,639 | | | |
Japan Government Five Year Bond (Japan), 0.30%, 12/20/2016 | | | Aa3 | | | JPY | 530,700,000 | | | | 5,370,847 | | | |
Japan Government Ten Year Bond (Japan), 1.00%, 12/20/2021 | | | Aa3 | | | JPY | 258,850,000 | | | | 2,661,181 | | | |
Japan Government Two Year Bond (Japan), 0.10%, 3/15/2014 | | | Aa3 | | | JPY | 318,250,000 | | | | 3,209,062 | | | |
Korea Treasury Bond (South Korea), 4.50%, 3/10/2015 | | | Aa3 | | | KRW | 5,790,000,000 | | | | 5,209,408 | | | |
Malaysia Government Bond (Malaysia), 3.434%, 8/15/2014 | | | WR6 | | | MYR | 6,820,000 | | | | 2,166,215 | | | |
The accompanying notes are an integral part of the financial statements.
9
Global Fixed Income Series
Investment Portfolio - June 30, 2013
(unaudited)
| | | | | | | | | | | | | | |
| | | CREDIT
RATING1
(UNAUDITED) | | | PRINCIPAL AMOUNT2/ SHARES | | | VALUE (NOTE 2) | | | |
| | | | |
FOREIGN GOVERNMENT BONDS (continued) | | | | | | | | | | | | | | |
| | | | |
Malaysia Government Bond (Malaysia), 3.172%, 7/15/2016 | | | WR6 | | | MYR | 2,000,000 | | | $ | 631,173 | | | |
Mexican Government Bond (Mexico), 6.00%, 6/18/2015 | | | Baa1 | | | MXN | 625,000 | | | | 49,689 | | | |
Mexican Government Bond (Mexico), 8.00%, 12/17/2015 | | | Baa1 | | | MXN | 21,454,000 | | | | 1,790,470 | | | |
Mexican Government Bond (Mexico), 6.25%, 6/16/2016 | | | Baa1 | | | MXN | 15,000,000 | | | | 1,213,790 | | | |
Mexican Government Bond (Mexico), 7.25%, 12/15/2016 | | | Baa1 | | | MXN | 26,070,000 | | | | 2,168,479 | | | |
Mexican Government Bond (Mexico), 7.75%, 12/14/2017 | | | Baa1 | | | MXN | 17,000,000 | | | | 1,446,683 | | | |
Mexican Government Bond (Mexico), 6.50%, 6/10/2021 | | | Baa1 | | | MXN | 21,000,000 | | | | 1,708,855 | | | |
Portugal Obrigacoes do Tesouro OT (Portugal), 4.80%, 6/15/2020 | | | Ba3 | | | EUR | 805,000 | | | | 967,140 | | | |
Portugal Obrigacoes do Tesouro OT (Portugal), 4.95%, 10/25/2023 | | | Ba3 | | | EUR | 1,210,000 | | | | 1,404,731 | | | |
Portugal Obrigacoes do Tesouro OT (Portugal)3, 5.65%, 2/15/2024 | | | WR6 | | | EUR | 1,755,000 | | | | 2,124,705 | | | |
Russian Foreign Bond - Eurobond (Russia), 5.00%, 4/29/2020 | | | Baa1 | | | | 500,000 | | | | 535,000 | | | |
Singapore Government Bond (Singapore), 2.50%, 6/1/2019 | | | Aaa | | | SGD | 4,515,000 | | | | 3,719,491 | | | |
Spain Government Bond (Spain), 4.50%, 1/31/2018 | | | Baa3 | | | EUR | 1,415,000 | | | | 1,910,248 | | | |
Spain Government Bond (Spain), 4.00%, 4/30/2020 | | | Baa3 | | | EUR | 2,240,000 | | | | 2,878,359 | | | |
Spain Government Bond (Spain)3, 5.40%, 1/31/2023 | | | Baa3 | | | EUR | 3,755,000 | | | | 5,132,540 | | | |
Spain Government Bond (Spain), 4.80%, 1/31/2024 | | | Baa3 | | | EUR | 3,200,000 | | | | 4,150,778 | | | |
Sweden Government Bond (Sweden), 4.25%, 3/12/2019 | | | Aaa | | | SEK | 4,000,000 | | | | 677,421 | | | |
Thailand Government Bond (Thailand), 3.25%, 6/16/2017 | | | Baa1 | | | THB | 20,000,000 | | | | 645,696 | | | |
Thailand Government Bond (Thailand), 2.80%, 10/10/2017 | | | Baa1 | | | THB | 60,795,000 | | | | 1,923,576 | | | |
United Kingdom Gilt (United Kingdom), 1.00%, 9/7/2017 | | | Aa1 | | | GBP | 2,035,000 | | | | 3,073,764 | | | |
United Kingdom Gilt (United Kingdom), 5.00%, 3/7/2018 | | | Aa1 | | | GBP | 2,610,000 | | | | 4,642,687 | | | |
| | | | | | | | | | | | | | |
| | | | |
TOTAL FOREIGN GOVERNMENT BONDS
(Identified Cost $93,067,325) | | | | | | | | | | | 89,999,901 | | | |
| | | | | | | | | | | | | | |
| | | | |
MUTUAL FUND - 0.1% | | | | | | | | | | | | | | |
| | | | |
iShares iBoxx $ High Yield Corporate Bond Fund (Identified Cost $299,594) | | | | | | | 3,250 | | | | 295,295 | | | |
| | | | | | | | | | | | | | |
| | | | |
SHORT-TERM INVESTMENT - 1.4% | | | | | | | | | | | | | | |
| | | | |
Dreyfus Cash Management, Inc. - Institutional Shares7, 0.05%, (Identified Cost $2,955,431) | | | | | | | 2,955,431 | | | | 2,955,431 | | | |
| | | | | | | | | | | | | | |
TOTAL INVESTMENTS - 97.8%
(Identified Cost $219,541,159) | | | | | | | | | | | 210,757,797 | | | |
OTHER ASSETS, LESS LIABILITIES - 2.2% | | | | | | | | | | | 4,680,352 | | | |
| | | | | | | | | | | | | | |
| | | | |
NET ASSETS - 100% | | | | | | | | | | $ | 215,438,149 | | | |
| | | | | | | | | | | | | | |
*Less than 0.1%
AUD - Australian Dollar
CAD - Canadian Dollar
EUR - Euro
GBP - British Pound
IDR - Indonesian Rupiah
JPY - Japanese Yen
KRW - South Korean Won
The accompanying notes are an integral part of the financial statements.
10
Global Fixed Income Series
Investment Portfolio - June 30, 2013
(unaudited)
MXN - Mexican Peso
MYR - Malaysian Ringgit
SEK - Swedish Krona
SGD - Singapore Dollar
THB - Thai Baht
1Credit ratings from Moody’s (unaudited).
2Amount is stated in USD unless otherwise noted.
3Restricted securities - Investment in securities that are restricted as to public resale under the Securities Act of 1933, as amended. These securities have been sold under rule 144A and have been determined to be liquid under guidelines established by the Board of Directors. These securities amount to $29,946,600 or 13.9% of the Series’ net assets as of June 30, 2013 (see Note 2 to the financial statements).
4Credit ratings from S&P (unaudited).
5The coupon rate is floating and is the effective rate as of June 30, 2013.
6Credit rating has been withdrawn. As of June 30, 2013, there is no rating available (unaudited).
7Rate shown is the current yield as of June 30, 2013.
The Series’ portfolio holds, as a percentage of net assets, greater than 10% in the following countries: United States 39.9%.
11
Global Fixed Income Series
Statement of Assets and Liabilities
June 30, 2013 (unaudited)
| | | | |
ASSETS: | | | | |
| |
Investments, at value (identified cost $219,541,159) (Note 2) | | $ | 210,757,797 | |
Cash | | | 1,402,293 | |
Receivable for securities sold | | | 5,531,520 | |
Interest receivable | | | 2,518,041 | |
Foreign tax reclaims receivable | | | 34,890 | |
Receivable for fund shares sold | | | 95,261 | |
Dividends receivable | | | 272 | |
Prepaid expenses | | | 18 | |
| | | | |
| |
TOTAL ASSETS | | | 220,340,092 | |
| | | | |
| |
LIABILITIES: | | | | |
| |
Foreign currency (identified cost $1,672,051) | | | 1,682,594 | |
Accrued management fees (Note 3) | | | 112,128 | |
Accrued shareholder services fees (Class S) (Note 3) | | | 23,241 | |
Accrued fund accounting and administration fees (Note 3) | | | 5,199 | |
Accrued Chief Compliance Officer service fees (Note 3) | | | 330 | |
Accrued Directors’ fees (Note 3) | | | 258 | |
Payable for securities purchased | | | 2,842,234 | |
Payable for fund shares repurchased | | | 177,609 | |
Accrued foreign capital gains tax (Note 2) | | | 28,691 | |
Other payables and accrued expenses | | | 29,659 | |
| | | | |
| |
TOTAL LIABILITIES | | | 4,901,943 | |
| | | | |
| |
TOTAL NET ASSETS | | $ | 215,438,149 | |
| | | | |
| |
NET ASSETS CONSIST OF: | | | | |
| |
Capital stock | | $ | 225,040 | |
Additional paid-in-capital | | | 224,627,833 | |
Undistributed net investment income | | | 394,454 | |
Accumulated net realized loss on investments, foreign currency and translation of other assets and liabilities | | | (939,059 | ) |
Net unrealized depreciation on investments, foreign currency and translation of other assets and liabilities | | | (8,870,119 | ) |
| | | | |
| |
TOTAL NET ASSETS | | $ | 215,438,149 | |
| | | | |
| |
NET ASSET VALUE, OFFERING PRICE AND REDEMPTION PRICE PER SHARE - Class S
($185,086,508/19,336,504 shares) | | $ | 9.57 | |
| | | | |
| |
NET ASSET VALUE, OFFERING PRICE AND REDEMPTION PRICE PER SHARE - Class I
($30,351,641/3,167,486 shares) | | $ | 9.58 | |
| | | | |
The accompanying notes are an integral part of the financial statements.
12
Global Fixed Income Series
Statement of Operations
For the Six Months Ended June 30, 2013 (unaudited)
| | | | |
INVESTMENT INCOME: | | | | |
| |
Interest | | $ | 1,354,452 | |
Dividends (net of foreign taxes withheld, $31,132) | | | 12,973 | |
| | | | |
| |
Total Investment Income | | | 1,367,425 | |
| | | | |
| |
EXPENSES: | | | | |
| |
Management fees (Note 3) | | | 324,342 | |
Shareholder services fees (Class S) (Note 3) | | | 69,032 | |
Fund accounting and administration fees (Note 3) | | | 25,324 | |
Directors’ fees (Note 3) | | | 1,536 | |
Chief Compliance Officer service fees (Note 3) | | | 1,123 | |
Transfer agent fees (Note 3) | | | 965 | |
Custodian fees | | | 1,319 | |
Miscellaneous | | | 35,454 | |
| | | | |
| |
Total Expenses | | | 459,095 | |
Less reduction of expenses (Note 3) | | | (13,544 | ) |
| | | | |
| |
Net Expenses | | | 445,551 | |
| | | | |
| |
NET INVESTMENT INCOME | | | 921,874 | |
| | | | |
| |
REALIZED AND UNREALIZED GAIN (LOSS) ON INVESTMENTS AND FOREIGN CURRENCY: | | | | |
| |
Net realized gain (loss) on- | | | | |
Investments | | | (346,373 | ) |
Foreign currency transactions and translation of other assets and liabilities | | | (598,050 | ) |
| | | | |
| |
| | | (944,423 | ) |
| | | | |
Net change in unrealized appreciation (depreciation) on- | | | | |
Investments (net of decrease in accrued foreign capital gains tax of $214) | | | (8,811,105 | ) |
Foreign currency transactions and translation of other assets and liabilities | | | (100,522 | ) |
| | | | |
| |
| | | (8,911,627 | ) |
| | | | |
| |
NET REALIZED AND UNREALIZED GAIN (LOSS) ON INVESTMENTS AND FOREIGN CURRENCY | | | (9,856,050 | ) |
| | | | |
| |
NET DECREASE IN NET ASSETS RESULTING FROM OPERATIONS | | $ | (8,934,176 | ) |
| | | | |
The accompanying notes are an integral part of the financial statements.
13
Global Fixed Income Series
Statements of Changes in Net Assets
| | | | | | | | |
| | | FOR THE SIX MONTHS ENDED 6/30/13 (UNAUDITED) | | | FOR THE PERIOD 10/1/121 TO
12/31/12 | |
INCREASE (DECREASE) IN NET ASSETS: | | | | | | | | |
| | |
OPERATIONS: | | | | | | | | |
| | |
Net investment income | | $ | 921,874 | | | $ | 20,078 | |
Net realized loss on investments and foreign currency | | | (944,423 | ) | | | (12,778 | ) |
Net change in unrealized appreciation (depreciation) on investments and foreign currency | | | (8,911,627 | ) | | | 41,508 | |
| | | | | | | | |
| | |
Net increase (decrease) from operations | | | (8,934,176 | ) | | | 48,808 | |
| | | | | | | | |
| | |
DISTRIBUTIONS TO SHAREHOLDERS (Note 8): | | | | | | | | |
| | |
From net investment income (Class S) | | | (432,395 | ) | | | — | |
From net investment income (Class I) | | | (94,482 | ) | | | (2,074 | ) |
From net realized gain on investments (Class I) | | | — | | | | (405 | ) |
| | | | | | | | |
| | |
Total distributions to shareholders | | | (526,877 | ) | | | (2,479 | ) |
| | | | | | | | |
| | |
CAPITAL STOCK ISSUED AND REPURCHASED: | | | | | | | | |
| | |
Net increase from capital share transactions (Note 5) | | | 219,792,919 | | | | 5,059,954 | |
| | | | | | | | |
| | |
Net increase in net assets | | | 210,331,866 | | | | 5,106,283 | |
| | |
NET ASSETS: | | | | | | | | |
| | |
Beginning of period | | | 5,106,283 | | | | — | |
| | | | | | | | |
| | |
End of period (including undistributed net investment income of $394,454 and distributions in excess of net investment income of $543, respectively) | | $ | 215,438,149 | | | $ | 5,106,283 | |
| | | | | | | | |
1Commencement of operations.
The accompanying notes are an integral part of the financial statements.
14
Global Fixed Income Series
Financial Highlights - Class S
| | | | | | | | |
| | | | | | | FOR THE PERIOD
4/1/131 TO 6/30/13
(UNAUDITED) | |
Per share data (for a share outstanding throughout the period): | | | | |
Net asset value - Beginning of period | | $ | 10.00 | |
| | | | | | | | |
Income (loss) from investment operations: | | | | |
Net investment income2 | | | 0.04 | |
Net realized and unrealized gain (loss) on investments | | | (0.45 | ) |
| | | | | | | | |
| |
Total from investment operations | | | (0.41 | ) |
| | | | | | | | |
| |
Less distributions to shareholders: | | | | |
From net investment income | | | (0.02 | ) |
| | | | | | | | |
| |
Net asset value - End of period | | $ | 9.57 | |
| | | | | | | | |
| |
Net assets - End of period (000’s omitted) | | $ | 185,087 | |
| | | | | | | | |
| |
Total return3 | | | (4.08 | %) |
Ratios (to average net assets)/ Supplemental Data: | | | | |
Expenses* | | | 0.85 | %4 |
Net investment income | | | 1.67 | %4 |
Portfolio turnover | | | 37 | % |
1Commencement of operations.
2Calculated based on average shares outstanding during the period.
3Represents aggregate total return for the period indicated, and assumes reinvestment of all distributions. Total return would have been lower had certain expenses not been reimbursed during the period. Periods less than one year are not annualized.
4Annualized.
The accompanying notes are an integral part of the financial statements.
15
Global Fixed Income Series
Financial Highlights - Class I
| | | | | | | | | | | | |
| | | | | | | FOR THE SIX MONTHS ENDED 6/30/13
(UNAUDITED) | | | FOR THE PERIOD 10/1/121 TO 12/31/12 | |
Per share data (for a share outstanding throughout each period): | | | | | | | | |
Net asset value - Beginning of period | | $ | 10.09 | | | $ | 10.00 | |
| | | | | | | | | | | | |
Income (loss) from investment operations: | | | | | | | | |
Net investment income2 | | | 0.09 | | | | 0.04 | |
Net realized and unrealized gain (loss) on investments | | | (0.54 | ) | | | 0.05 | |
| | | | | | | | | | | | |
| | |
Total from investment operations | | | (0.45 | ) | | | 0.09 | |
| | | | | | | | | | | | |
| | |
Less distributions to shareholders: | | | | | | | | |
From net investment income | | | (0.06 | ) | | | — | 3 |
From net realized gain on investments | | | — | | | | — | 3 |
| | | | | | | | | | | | |
| | |
Total distributions to shareholders | | | (0.06 | ) | | | — | 3 |
| | | | | | | | | | | | |
| | |
Net asset value - End of period | | $ | 9.58 | | | $ | 10.09 | |
| | | | | | | | | | | | |
| | |
Net assets - End of period (000’s omitted) | | $ | 30,352 | | | $ | 5,106 | |
| | | | | | | | | | | | |
| | |
Total return4 | | | (4.53 | %) | | | 0.95 | % |
Ratios (to average net assets)/ Supplemental Data: | | | | | | | | |
Expenses*5 | | | 0.70 | % | | | 0.70 | % |
Net investment income5 | | | 1.89 | % | | | 1.60 | % |
Portfolio turnover | | | 37 | % | | | 4 | % |
|
| * The investment advisor did not impose all of its management and/or other fees during the periods, and may have paid a portion of the Series’ expenses. If these expenses had been incurred by the Class, the expense ratio (to average net assets) would have been increased by the following amount: | |
| | |
| | | 0.30 | %5 | | | 4.08 | %5 |
1Commencement of operations.
2Calculated based on average shares outstanding during the periods.
3Less than $0.01.
4Represents aggregate total return for the periods indicated, and assumes reinvestment of all distributions. Total return would have been lower had certain expenses not been waived during certain periods. Periods less than one year are not annualized.
5Annualized.
The accompanying notes are an integral part of the financial statements.
16
Global Fixed Income Series
Notes to Financial Statements
(unaudited)
Global Fixed Income Series (the “Series”) is a no-load non-diversified series of Manning & Napier Fund, Inc. (the “Fund”). The Fund is organized in Maryland and is registered under the Investment Company Act of 1940, as amended, as an open-end management investment company.
The Series’ investment objective is to provide long-term total return by investing principally in fixed income securities of issuers located anywhere in the world.
The Fund’s advisor is Manning & Napier Advisors, LLC (the “Advisor”). Shares of the Series are offered to investors, clients and employees of the Advisor and its affiliates. The Series is authorized to issue two classes of share (Class S and Class I). Class S shares of the Series commenced on April 1, 2013. Each class is substantially the same, except Class S shares bear shareholder services fees. The total authorized capital stock of the Fund consists of 15 billion shares of common stock each having a par value of $0.01. As of June 30, 2013, 10.3 billion shares have been designated in total among 42 series, of which 100 million have been designated as Global Fixed Income Series Class S common stock, and 100 million designated as Global Fixed Income Series Class I common stock.
| 2. | Significant Accounting Policies |
Security Valuation
Portfolio securities, including domestic equities, foreign equities, warrants and options, listed on an exchange other than the NASDAQ Stock Market are valued at the latest quoted sales price of the exchange on which the security is primarily traded. Securities not traded on valuation date or securities not listed on an exchange are valued at the latest quoted bid price provided by the Fund’s pricing service. Securities listed on the NASDAQ Stock Market are valued in accordance with the NASDAQ Official Closing Price.
Debt securities, including government bonds, foreign bonds, asset-backed securities, structured notes, supranational obligations, sovereign bonds, corporate bonds and mortgage-backed securities will normally be valued on the basis of evaluated bid prices provided directly by an independent pricing service. The pricing services use multiple valuation techniques to determine fair value. In instances where sufficient market activity exists, the pricing services may utilize a market-based approach through which quotes from market makers are used to determine fair value. In instances where sufficient market activity may not exist or is limited, the pricing services also utilize proprietary valuation models which may consider market characteristics such as benchmark yield curves, option-adjusted spreads, credit spreads, estimated default rates, coupon rates, anticipated timing of principal repayments, underlying collateral, and other unique security features in order to estimate the relevant cash flows, which are then discounted to calculate the fair value. Certain investments in securities held by the Series may be valued on a basis of a price provided directly by a principal market maker. These prices may differ from the value that would have been used had a broader market for securities existed.
Municipal securities will normally be valued on the basis of market valuations provided by an independent pricing service that utilizes the latest price quotations and a matrix system (which considers such factors as security prices of similar securities, yields, maturities and ratings).
Short-term investments that mature in sixty days or less are valued at amortized cost, which approximates fair value. Investments in open-end investment companies are valued at their net asset value per share on valuation date.
Volume and level of activity in established markets for an asset or liability are evaluated to determine whether recent transactions and quoted prices are determinative of fair value. Where there have been significant decreases in volume and level of activity, further analysis and adjustment may be necessary to estimate fair value. The Series measures fair value in these instances by the use of inputs and valuation techniques which may be based upon current market prices of securities that are comparable in coupon, rating, maturity and industry and/or expectation of future cash flows. As a result of trading in relatively thin markets and/or markets that experience significant volatility, the prices used by the Series to value these securities may differ from the value that would be realized if these securities were sold, and the differences could be material.
17
Global Fixed Income Series
Notes to Financial Statements (continued)
(unaudited)
| 2. | Significant Accounting Policies (continued) |
Security Valuation (continued)
Securities for which representative valuations or prices are not available from the Series’ pricing service may be valued at fair value as determined in good faith by the Advisor under procedures approved by and under the general supervision and responsibility of the Fund’s Board of Directors (the “Board”). Due to the inherent uncertainty of valuations of such securities, the fair value may differ significantly from the values that would have been used had a ready market for such securities existed. If trading or events occurring after the close of the principal market in which securities are traded are expected to materially affect the value of those securities, then they may be valued at their fair value, taking this trading or these events into account.
Various inputs are used in determining the value of the Series’ assets or liabilities carried at fair value. These inputs are summarized in three broad levels. Level 1 includes quoted prices in active markets for identical assets and liabilities. Level 2 includes other significant observable inputs (including quoted prices for similar securities, interest rates, prepayment speeds, credit risk, etc.). Level 3 includes significant unobservable inputs (including the Series’ own assumptions in determining the fair value of investments). A financial instrument’s level within the fair value hierarchy is based on the lowest level of any input both individually and in aggregate that is significant to the fair value measurement. The inputs or methodology used for valuing securities are not necessarily an indication of the risk associated with investing in those securities.
The following is a summary of the valuation levels used for major security types as of June 30, 2013 in valuing the Series’ assets or liabilities carried at fair value:
| | | | | | | | | | | | | | | | |
| DESCRIPTION | | TOTAL | | | LEVEL 1 | | | LEVEL 2 | | | LEVEL 3 | |
Assets: | | | | | | | | | | | | | | | | |
Preferred securities: | | | | | | | | | | | | | | | | |
Financials | | $ | 239,700 | | | $ | 239,700 | | | $ | — | | | $ | — | |
Debt securities: | | | | | | | | | | | | | | | | |
Corporate debt: | | | | | | | | | | | | | | | | |
Consumer Discretionary | | | 16,204,619 | | | | — | | | | 16,204,619 | | | | — | |
Consumer Staples | | | 2,059,115 | | | | — | | | | 2,059,115 | | | | — | |
Energy | | | 6,074,941 | | | | — | | | | 6,074,941 | | | | — | |
Financials | | | 65,790,067 | | | | — | | | | 65,790,067 | | | | — | |
Health Care | | | 3,346,011 | | | | — | | | | 3,346,011 | | | | — | |
Industrials | | | 7,091,424 | | | | — | | | | 7,091,424 | | | | — | |
Information Technology | | | 5,653,791 | | | | — | | | | 5,653,791 | | | | — | |
Materials | | | 7,443,842 | | | | — | | | | 7,443,842 | | | | — | |
Telecommunication Services | | | 3,218,725 | | | | — | | | | 3,218,725 | | | | — | |
Utilities | | | 384,935 | | | | — | | | | 384,935 | | | | — | |
Foreign government bonds | | | 89,999,901 | | | | — | | | | 89,999,901 | | | | — | |
Mutual funds | | | 3,250,726 | | | | 3,250,726 | | | | — | | | | — | |
| | | | | | | | | | | | | | | | |
Total assets | | $ | 210,757,797 | | | $ | 3,490,426 | | | $ | 207,267,371 | | | $ | — | |
| | | | | | | | | | | | | | | | |
There were no Level 3 securities held by the Series as of December 31, 2012 or June 30, 2013.
The Fund’s policy is to recognize transfers in and transfers out of the valuation levels as of the beginning of the reporting period. There were no transfers between Level 1 and Level 2 during the six months ended June 30, 2013.
Security Transactions, Investment Income and Expenses
Security transactions are accounted for on trade date. Dividend income is recorded on the ex-dividend date, except that if the ex-dividend date has passed, certain dividends from foreign securities are recorded as soon as the Series is informed of the ex-dividend date. Non-cash dividends, if any, are recorded at the fair value of the securities received. Interest income, including amortization of premium and accretion of discounts using the effective interest method, is earned from settlement date and accrued daily.
18
Global Fixed Income Series
Notes to Financial Statements (continued)
(unaudited)
| 2. | Significant Accounting Policies (continued) |
Security Transactions, Investment Income and Expenses (continued)
Expenses are recorded on an accrual basis. Most expenses of the Fund can be attributed to a specific series. Expenses which cannot be directly attributed are apportioned among the series in the Fund in such a manner as deemed equitable by the Fund’s Board, taking into consideration, among other things, the nature and type of expense.
The Series uses the identified cost method for determining realized gain or loss on investments for both financial statement and federal income tax reporting purposes.
Foreign Currency Translation
The books and records of the Series are maintained in U.S. dollars. Foreign currencies, investments and other assets and liabilities are translated into U.S. dollars at the current exchange rates. Purchases and sales of investment securities and income and expenses are translated on the respective dates of such transactions. The Series does not isolate realized and unrealized gains and losses attributable to changes in the exchange rates from gains and losses that arise from changes in the fair value of investments. Such fluctuations are included with net realized and unrealized gain or loss on investments. Net realized foreign currency gains and losses represent foreign currency gains and losses between trade date and settlement date on securities transactions, gains and losses on disposition of foreign currencies and the difference between the amount of income and foreign withholding taxes recorded on the books of the Series and the amounts actually received or paid.
Forward Foreign Currency Exchange Contracts
The Series may purchase or sell forward foreign currency exchange contracts in order to hedge a portfolio position or specific transaction. Risks may arise if the counterparties to a contract are unable to meet the terms of the contract or if the value of the foreign currency moves unfavorably.
All forward foreign currency exchange contracts are adjusted daily by the exchange rate of the underlying currency and, for financial statement purposes, any gain or loss is recorded as unrealized gain or loss until a contract has been closed.
The Series may regularly trade forward foreign currency exchange contracts with off-balance sheet risk in the normal course of its investing activities to assist in managing exposure to changes in foreign currency exchange rates.
The notional or contractual amount of these instruments represents the investment the Series has in forward foreign currency exchange contracts and does not necessarily represent the amounts potentially at risk. The measurement of the risks associated with forward foreign currency exchange contracts is meaningful only when all related and offsetting transactions are considered. During the period of March 28, 2013 through May 6, 2013 the period for which foreign currency contracts were held, the average volume of derivative activity (measured in terms of the notional amount) was approximately $4,568,293.
The following table presents the effect of derivative instruments on the Statement of Operations as of June 30, 2013:
| | | | | | |
| STATEMENT OF OPERATIONS | |
Derivative | | | | | | |
Foreign forward currency exchange contracts | | Net realized gain (loss) on foreign currency transactions and translation of other assets and liabilities | | $ | (17,040 | ) |
Derivative | | | | | | |
Foreign forward currency exchange contracts | | Net change in unrealized appreciation (depreciation) on foreign currency transactions and translation of other assets and liabilities | | $ | (13,220 | ) |
As of June 30, 2013, no investments in forward foreign currency exchange contracts were held by the Series.
Securities Purchased on a When-Issued Basis or Forward Commitment
The Series may purchase securities on a when-issued basis or forward commitment. These transactions involve a commitment by the Series to purchase securities for a predetermined price with payment and delivery taking place beyond the customary settlement period. When such purchases are outstanding, the Series will designate liquid assets in an amount sufficient to meet
19
Global Fixed Income Series
Notes to Financial Statements (continued)
(unaudited)
| 2. | Significant Accounting Policies (continued) |
Securities Purchased on a When-Issued Basis or Forward Commitment (continued)
the purchase price. When purchasing a security on a delayed delivery basis, the Series assumes the rights and risks of ownership of the security, including the risk of price and yield fluctuations, and takes such fluctuations into account when determining its net asset value. The Series may sell the when-issued securities before they are delivered, which may result in a capital gain or loss.
In connection with its ability to purchase or sell securities on a forward commitment basis, the Series may enter into forward roll transactions principally using To Be Announced (TBA) securities. Forward roll transactions require the sale of securities for delivery in the current month, and a simultaneous agreement to repurchase substantially similar (same type, coupon and maturity) securities on a specified future date. Risks of entering into forward roll transactions include the potential inability of the counterparty to meet the terms of the agreement; the potential of the Series to receive inferior securities at redelivery as compared to the securities sold to the counterparty; counterparty credit risk; and the potential pay down speed variance between the mortgage-backed pools. During the roll period, the Series forgoes principal and interest paid on the securities. The Series accounts for such dollar rolls as purchases and sales. Information regarding securities purchased on a when-issued basis is included in the Series’ Investment Portfolio. No such investments were held by the Series on June 30, 2013.
Restricted Securities
Restricted securities are purchased in private placement transactions, are not registered under the Securities Act of 1933, as amended, and may have contractual restrictions on resale. Information regarding restricted securities is included at the end of the Series’ Investment Portfolio.
Illiquid Securities
A security may be considered illiquid if so deemed in good faith by the Advisor under procedures approved by and under the general supervision and responsibility of the Fund’s Board. Securities that are illiquid are marked with the applicable footnote on the Investment Portfolio. No such investments were held by the Series on June 30, 2013.
Federal Taxes
The Series’ policy is to comply with the provisions of the Internal Revenue Code applicable to regulated investment companies. The Series is not subject to federal income tax or excise tax to the extent that the Series distributes to shareholders each year its taxable income, including any net realized gains on investments, in accordance with requirements of the Internal Revenue Code. Accordingly, no provision for federal income tax or excise tax has been made in the financial statements.
Management evaluates its tax positions to determine if the tax positions taken meet the minimum recognition threshold in connection with accounting for uncertainties in income tax positions taken or expected to be taken for the purposes of measuring and recognizing tax liabilities in the financial statements. Recognition of tax benefits of an uncertain tax position is required only when the position is “more likely than not” to be sustained assuming examination by taxing authorities. At June 30, 2013, the Series has recorded no liability for net unrecognized tax benefits relating to uncertain income tax positions taken or expected to be taken in future tax returns.
The Series files income tax returns in the U.S. federal jurisdiction, various states and foreign jurisdictions, as required. No income tax returns are currently under investigation. The statute of limitations on the Series’ tax returns remains open for the period ended December 31, 2012. The Series is not aware of any tax positions for which it is reasonably possible that the total amounts of unrecognized tax benefits will significantly change in the next twelve months.
Foreign Taxes
Based on the Series’ understanding of the tax rules and rates related to income, gains and currency purchase/repatriation transactions for foreign jurisdictions in which it invests, the Series will provide for foreign taxes, and where appropriate, deferred foreign tax.
Distributions of Income and Gains
Distributions to shareholders of net investment income are made quarterly. Distributions of net realized gains are made annually. An additional distribution may be necessary to avoid taxation of the Series. Distributions are recorded on the ex-dividend date.
20
Global Fixed Income Series
Notes to Financial Statements (continued)
(unaudited)
| 2. | Significant Accounting Policies (continued) |
Indemnifications
The Fund’s organizational documents provide former and current directors and officers with a limited indemnification against liabilities arising in connection with the performance of their duties to the Fund. In the normal course of business, the Fund may also enter into contracts that provide general indemnifications. The Fund’s maximum exposure under these arrangements is unknown as this would be dependent on future claims that may be made against the Fund. The risk of material loss from such claims is considered remote.
Other
The preparation of financial statements in conformity with accounting principles generally accepted in the United States of America requires management to make estimates and assumptions that affect the reported amounts of assets and liabilities and the disclosure of contingent assets and liabilities at the date of the financial statements and the reported amounts of income and expenses during the reporting period. Actual results could differ from those estimates.
| 3. | Transactions with Affiliates |
The Fund has an Investment Advisory Agreement (the “Agreement”) with the Advisor, for which the Series pays a fee, computed daily and payable monthly, at an annual rate of 0.60% of the Series’ average daily net assets.
Under the Agreement, personnel of the Advisor provide the Series with advice and assistance in the choice of investments and the execution of securities transactions, and otherwise maintain the Series’ organization. The Advisor also provides the Fund with necessary office space and fund administration and support services. The salaries of all officers of the Fund (except a percentage of the Fund’s Chief Compliance Officer’s salary, which is paid by the Fund), and of all Directors who are “affiliated persons” of the Fund, or of the Advisor, and all personnel of the Fund, or of the Advisor, performing services relating to research, statistical and investment activities, are paid by the Advisor. Each “non-affiliated” Director receives an annual stipend, which is allocated among all the active series of the Fund. In addition, these Directors also receive a fee per Board meeting attended plus a fee for each committee meeting attended.
The Class S shares of the Series are subject to a shareholder services fee in accordance with a shareholder services plan adopted by the Board. The shareholder service fee is intended to compensate financial intermediaries, including affiliates of the Fund, in connection with the provision of direct client service, personal services, maintenance of shareholder accounts and reporting services. For these services, Class S of the Series pay a fee, computed daily and payable monthly, at an annual rate of 0.15% of the average daily net assets of Class S. The Fund has a Shareholder Services Agreement with the Advisor, for which the Advisor receives the shareholder services fee as stated above.
The Advisor has contractually agreed, until at least April 30, 2014, to waive its fee and, if necessary, pay other operating expenses of the Series in order to maintain total direct annual fund operating expenses for the Series, exclusive of each share class’ shareholder service fee, at no more than 0.70% of average daily net assets each year. For the six months ended June 30, 2013, the Advisor voluntarily waived fees of $13,544, which is included as a reduction of expenses on the Statement of Operations. The Advisor is not eligible to recoup any expenses that have been waived or reimbursed in prior years.
Manning & Napier Investor Services, Inc., a registered broker-dealer affiliate of the Advisor, acts as distributor for the Fund’s shares. The services of Manning & Napier Investor Services, Inc. are provided at no additional cost to the Series.
The Advisor has agreements with BNY Mellon Investment Servicing (U.S.) Inc. (“BNY”) under which BNY serves as sub-accountant services agent and sub-transfer agent. The Fund pays the Advisor an annual fee related to fund accounting and administration of 0.0175% on the first $3 billion of average daily net assets (excluding Target Series and Strategic Income Series); 0.015% on the next $3 billion of average daily net assets (excluding Target Series and Strategic Income Series); and 0.01% of the average daily net assets in excess of $6 billion (excluding Target Series and Strategic Income Series); plus a base fee of $25,500 per series. Transfer Agent fees are charged to the Fund on a per account basis. Additionally, certain transaction and cusip-based fees and out-of-pocket expenses, including charges for reporting relating to the Fund’s compliance program,
21
Global Fixed Income Series
Notes to Financial Statements (continued)
(unaudited)
| 3. | Transactions with Affiliates (continued) |
are charged. Effective October 1, 2012, the aforementioned agreements were modified to reduce the annual fee related to fund accounting and administration, as well as transfer agent fees, by 10%, excluding out-of-pocket expenses.
Expenses not directly attributable to a series are allocated based on each series’ relative net assets or number of accounts, depending on the expense.
| 4. | Purchases and Sales of Securities |
For the six months ended June 30, 2013, purchases and sales of securities, other than U.S. Government securities and short-term securities, were $246,700,506 and $33,998,581 respectively. There were no purchases and sales of U.S. Government securities.
| 5. | Capital Stock Transactions |
Transactions in Class S and I shares of Global Fixed Income Series were:
| | | | | | | | | | | | | | | | |
| CLASS S | | FOR THE PERIOD 4/1/13
(COMMENCEMENT OF
OPERATIONS) TO 6/30/13 | | | | |
| | SHARES | | | AMOUNT | | |
Sold | | | 19,570,489 | | | $ | 195,491,855 | | | | | | | | | |
Reinvested | | | 42,070 | | | | 415,234 | | | | | | | | | |
Repurchased | | | (276,055 | ) | | | (2,734,009 | ) | | | | | | | | |
| | | | | | | | | | | | | | | | |
Total | | | 19,336,504 | | | $ | 193,173,080 | | | | | | | | | |
| | | | | | | | | | | | | | | | |
| | | | | | | | | | | | | | | | |
| CLASS I | | FOR THE SIX MONTHS ENDED 6/30/13 | | | FOR THE PERIOD 10/1/12
(COMMENCEMENT OF
OPERATIONS) TO 12/31/12 | |
| | SHARES | | | AMOUNT | | | SHARES | | | AMOUNT | |
Sold | | | 2,651,935 | | | $ | 26,525,357 | | | | 505,762 | | | $ | 5,057,476 | |
Reinvested | | | 9,543 | | | | 94,482 | | | | 246 | | | | 2,478 | |
| | | | | | | | | | | | | | | | |
Total | | | 2,661,478 | | | $ | 26,619,839 | | | | 506,008 | | | $ | 5,059,954 | |
| | | | | | | | | | | | | | | | |
Substantially all of the Series’ shares represent investments by fiduciary accounts over which the Advisor has sole investment discretion.
The Series may trade in instruments including written and purchased options, forward foreign currency exchange contracts and futures contracts and other derivatives in the normal course of investing activities to assist in managing exposure to various market risks. The Series may be subject to various elements of risk, which may involve, to a varying degree, elements of risk in excess of the amounts recognized for financial statement purposes. These risks include: the risk that changes in the value of a derivative may not correlate perfectly with the underlying asset, rate or index; counterparty credit risk related to over the counter derivative counterparties’ failure to perform under contract terms; liquidity risk related to the lack of a liquid market for these contracts allowing the fund to close out its position(s); and documentation risk relating to disagreement over contract terms. No such investments were held by the Series as of June 30, 2013.
Investing in securities of foreign companies and foreign governments involves special risks and considerations not typically associated with investing in securities of domestic companies and the U.S. Government. These risks include revaluation of currencies and future adverse political and economic developments. Moreover, securities of foreign companies and foreign
22
Global Fixed Income Series
Notes to Financial Statements (continued)
(unaudited)
| 7. | Foreign Securities (continued) |
governments and their markets may be less liquid and their prices more volatile than those of comparable domestic companies and the U.S. Government.
| 8. | Federal Income Tax Information |
The amount and characterization of certain income and capital gains to be distributed are determined in accordance with federal income tax regulations, which may differ from accounting principles generally accepted in the United States of America. The Series may periodically make reclassifications among its capital accounts to reflect income and gains available for distribution (or available capital loss carryovers) under income tax regulations without impacting the Series’ net asset value. Any such reclassifications are not reflected in the financial highlights.
The final determination of the tax character of current year distributions will be made at the conclusion of the fiscal year. The tax character of distributions paid for the period ended December 31, 2012 was as follows:
Ordinary income $2,479
At June 30, 2013, the identified cost of investments for federal income tax purposes, the resulting gross unrealized appreciation and depreciation, and the net unrealized depreciation were as follows:
| | | | |
Cost for federal income tax purposes | | $ | 219,541,159 | |
Unrealized appreciation | | | 1,242,735 | |
Unrealized depreciation | | | (10,026,097 | ) |
| | | | |
Net unrealized depreciation | | $ | (8,783,362 | ) |
| | | | |
23
{This page intentionally left blank}
24
{This page intentionally left blank}
25
Global Fixed Income Series
Literature Requests
(unaudited)
Proxy Voting Policies and Procedures
A description of the policies and procedures that the Fund uses to determine how to vote proxies relating to portfolio securities is available, without charge, upon request:
| | | | |
| By phone | | 1-800-466-3863 | | |
| On the Securities and Exchange | | | | |
| Commission’s (SEC) web site | | http://www.sec.gov | | |
Proxy Voting Record
Information regarding how the Fund voted proxies relating to portfolio securities during the most recent 12-month period ended June 30th is available, without charge, upon request:
| | | | |
| By phone | | 1-800-466-3863 | | |
| On the SEC’s web site | | http://www.sec.gov | | |
Quarterly Portfolio Holdings
The Series’ complete schedule of portfolio holdings for the 1st and 3rd quarters of each fiscal year are provided on Form N-Q, and are available, without charge, upon request:
| | | | |
| By phone | | 1-800-466-3863 | | |
| On the SEC’s web site | | http://www.sec.gov | | |
The Series’ Form N-Q may be reviewed and copied at the SEC’s Public Reference Room in Washington, D.C. Information on the operation of the Public Reference Room may be obtained by calling 1-800-SEC-0330.
Prospectus and Statement of Additional Information (SAI)
The prospectus and SAI provide additional information about each Series, including charges, expenses and risks. These documents are available, without charge, upon request:
| | | | |
| By phone | | 1-800-466-3863 | | |
| On the SEC’s web site | | http://www.sec.gov | | |
| On our web site | | http://www.manning-napier.com | | |
Additional information available at www.manning-napier.com
1. Fund Holdings - Month-End
2. Fund Holdings - Quarter-End
3. Shareholder Report - Annual
4. Shareholder Report - Semi-Annual
The Fund also offers electronic notification or “e-delivery” when certain documents are available on-line to be downloaded or reviewed. Direct shareholders can elect to receive electronic notification when shareholder reports, prospectus updates, and/or statements are available. If you do not currently have on-line access to your account, you can establish access by going to www.manning-napier.com, click on “Login” in the top corner of the page, and follow the prompts to self-enroll. Once enrolled, you can set your electronic notification preferences by clicking on the Account Options tab located within the green toolbar and then select E-Delivery Option. Should you have any questions on either how to establish on-line access or how to update your account settings, please contact Investor Services at 1-800-466-3863.
MNGFI-6/13-SAR
| | | | | | |
| | | | STRATEGIC INCOME CONSERVATIVE SERIES | | |
| | | | STRATEGIC INCOME MODERATE SERIES | | |
www.manning-napier.com | | | | |
Shareholder Expense Example
(unaudited)
As a shareholder of the Series, you may incur two types of costs: (1) transaction costs and (2) ongoing costs, including management fees and other Series expenses. This example is intended to help you understand your ongoing costs (in dollars) of investing in the Series and to compare these costs with the ongoing costs of investing in other mutual funds.
The example is based on an investment of $1,000 invested at the beginning of the period and held for the entire period (January 1, 2013 to June 30, 2013).
Actual Expenses
The Actual lines of the tables below provide information about actual account values and actual expenses. You may use the information in these lines, together with the amount you invested, to estimate the expenses that you paid over the period. Simply divide your account value by $1,000 (for example, an $8,600 account value divided by $1,000 = 8.6), then multiply the result by the number in the Actual line for the Series and Class in which you have invested under the heading entitled “Expenses Paid During Period” to estimate the expenses you paid on your account during this period.
Hypothetical Example for Comparison Purposes
The Hypothetical lines of the tables below provide information about hypothetical account values and hypothetical expenses based on the Class’ actual expense ratio and an assumed rate of return of 5% per year before expenses, which is not the Class’ actual return. The hypothetical account values and expenses may not be used to estimate the actual ending account balance or expenses you paid during the period. You may use this information to compare the ongoing costs of investing in the Series and other funds. To do so, compare this 5% hypothetical example for the Series and Class in which you have invested with the 5% hypothetical examples that appear in the shareholder reports of the other funds.
Please note that the expenses shown in the tables are meant to highlight your ongoing costs only and do not reflect any transaction costs. Therefore, the Hypothetical lines of the tables are useful in comparing ongoing costs only, and will not help you determine the relative total costs of owning different funds. In addition, if these transaction costs were included, your costs would have been higher.
| | | | | | | | |
| | | BEGINNING ACCOUNT VALUE 1/1/13 | | ENDING ACCOUNT VALUE 6/30/13 | | EXPENSES PAID DURING PERIOD 1/1/13-6/30/13 | | ANNUALIZED EXPENSE RATIO1,2 |
Strategic Income Conservative Series | | | | | | | | |
Actual (Class S) | | $1,000.00 | | $1,010.90 | | $1.50 | | 0.30% |
Hypothetical (5% return before expenses) | | $1,000.00 | | $1,023.31 | | $1.51 | | 0.30% |
Actual (Class I) | | $1,000.00 | | $1,011.90 | | $0.25 | | 0.05% |
Hypothetical (5% return before expenses) | | $1,000.00 | | $1,024.55 | | $0.25 | | 0.05% |
| | | | | | | | |
| | | BEGINNING ACCOUNT VALUE 1/1/13 | | ENDING ACCOUNT VALUE 6/30/13 | | EXPENSES PAID DURING PERIOD 1/1/13-6/30/13 | | ANNUALIZED EXPENSE RATIO1,2 |
Strategic Income Moderate Series | | | | | | | | |
Actual (Class S) | | $1,000.00 | | $1,050.60 | | $1.53 | | 0.30% |
Hypothetical (5% return before expenses) | | $1,000.00 | | $1,023.31 | | $1.51 | | 0.30% |
Actual (Class I) | | $1,000.00 | | $1,052.60 | | $0.25 | | 0.05% |
Hypothetical (5% return before expenses) | | $1,000.00 | | $1,024.55 | | $0.25 | | 0.05% |
1Expense ratios of the Class do not include fees and expenses indirectly incurred by the underlying funds. If these expenses were included, the expense ratios would have been higher.
2Expenses are equal to the Class’ annualized expense ratio (for the six month period), multiplied by the average account value over the period, multiplied by 181/365 to reflect the one-half year period. Expenses are based on the most recent fiscal half year. The Class’ total returns would have been lower had certain expenses not been reimbursed during the period.
1
Portfolio Composition as of June 30, 2013 - Asset Allocation1
(unaudited)
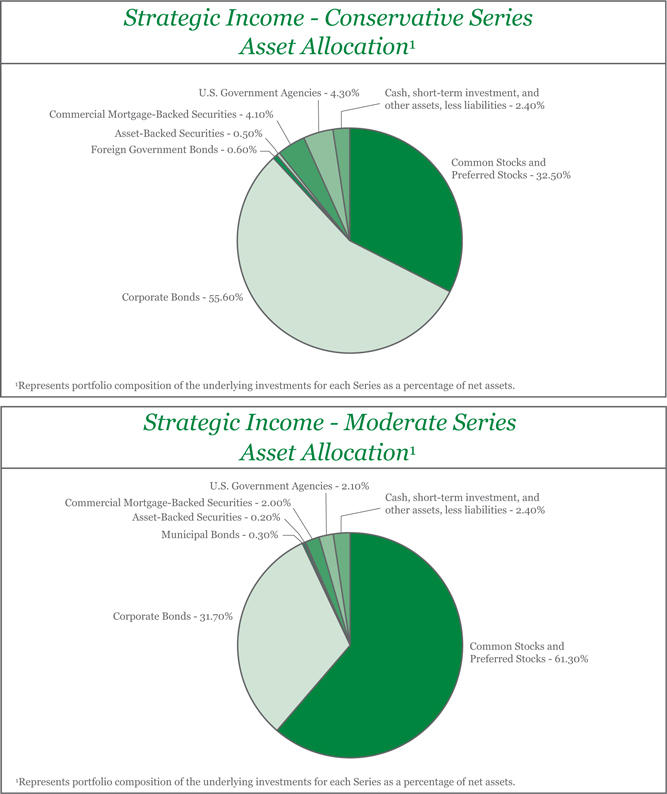
2
Statements of Assets and Liabilities
June 30, 2013 (unaudited)
| | | | | | | | |
| | | STRATEGIC INCOME
CONSERVATIVE SERIES | | | STRATEGIC INCOME
MODERATE SERIES | |
ASSETS: | | | | | | | | |
| | |
Manning & Napier Core Bond Series
- Class I (327,247 shares and 146,100 shares, respectively) | | $ | 3,642,254 | | | $ | 1,626,092 | |
Manning & Napier Dividend Focus Series
- Class I (87,795 shares and 176,199 shares, respectively) | | | 1,258,977 | | | | 2,526,701 | |
Manning & Napier High Yield Bond Series
- Class I (35,652 shares and 42,364 shares, respectively) | | | 345,827 | | | | 410,931 | |
Manning & Napier Real Estate Series
- Class I (59,621 shares and 79,285 shares, respectively) | | | 590,841 | | | | 785,717 | |
| | | | | | | | |
Total investments in securities: | | | | | | | | |
At value* | | | 5,837,899 | | | | 5,349,441 | |
Receivable from Advisor (Note 3) | | | 59,092 | | | | 59,665 | |
Receivable for securities sold | | | 573 | | | | 4,401 | |
Receivable for fund shares sold | | | — | | | | 75 | |
Prepaid expenses | | | 7 | | | | 7 | |
| | | | | | | | |
| | |
TOTAL ASSETS | | | 5,897,571 | | | | 5,413,589 | |
| | | | | | | | |
| | |
LIABILITIES: | | | | | | | | |
| | |
Accrued fund accounting and administration fees (Note 3) | | | 20,057 | | | | 20,051 | |
Accrued transfer agent fees (Note 3) | | | 1,428 | | | | 1,426 | |
Accrued shareholder services fees (Note 3) | | | 882 | | | | 1,082 | |
Accrued Directors’ fees (Note 3) | | | 623 | | | | 627 | |
Accrued Chief Compliance Officer service fees (Note 3) | | | 511 | | | | 511 | |
Audit fees payable | | | 16,043 | | | | 16,044 | |
Registration and filing fees payable | | | 7,387 | | | | 7,393 | |
Printing fees payable | | | 5,139 | | | | 5,139 | |
Payable for fund shares repurchased | | | — | | | | 3,898 | |
Other payables and accrued expenses | | | 4,229 | | | | 4,542 | |
| | | | | | | | |
| | |
TOTAL LIABILITIES | | | 56,299 | | | | 60,713 | |
| | | | | | | | |
| | |
TOTAL NET ASSETS | | $ | 5,841,272 | | | $ | 5,352,876 | |
| | | | | | | | |
| | |
NET ASSETS CONSIST OF: | | | | | | | | |
| | |
Capital stock | | | 5,792 | | | | 5,102 | |
Additional paid-in-capital | | | 5,913,257 | | | | 5,304,541 | |
Undistributed net investment income | | | 7,391 | | | | 6,180 | |
Accumulated net realized gain on underlying series | | | 27,536 | | | | 24,967 | |
Net unrealized appreciation (depreciation) on underlying series | | | (112,704 | ) | | | 12,086 | |
| | | | | | | | |
| | |
TOTAL NET ASSETS | | $ | 5,841,272 | | | $ | 5,352,876 | |
| | | | | | | | |
| | |
Class S | | | | | | | | |
Net Assets | | $ | 4,395,929 | | | $ | 5,295,812 | |
Shares Outstanding | | | 435,825 | | | | 504,758 | |
Net Asset Value, Offering Price, and Redemption Price per share | | $ | 10.09 | | | $ | 10.49 | |
Class I | | | | | | | | |
Net Assets | | $ | 1,445,343 | | | $ | 57,064 | |
Shares Outstanding | | | 143,384 | | | | 5,437 | |
Net Asset Value, Offering Price, and Redemption Price per share | | $ | 10.08 | | | $ | 10.50 | |
| | |
*At identified cost | | $ | 5,950,603 | | | $ | 5,337,355 | |
| | | | | | | | |
The accompanying notes are an integral part of the financial statements.
3
Statements of Operations
For the Six Months Ended June 30, 2013 (unaudited)
| | | | | | | | |
| | | STRATEGIC INCOME
CONSERVATIVE SERIES | | | STRATEGIC INCOME
MODERATE SERIES | |
INVESTMENT INCOME: | | | | | | | | |
| | |
Income distributions from underlying series | | $ | 61,395 | | | $ | 52,268 | |
| | | | | | | | |
| | |
EXPENSES: | | | | | | | | |
| | |
Fund accounting and administration fees (Note 3) | | | 19,856 | | | | 19,851 | |
Shareholder services fees (Class S)(Note 3) | | | 4,383 | | | | 4,897 | |
Transfer agent fees (Note 3) | | | 1,363 | | | | 1,358 | |
Chief Compliance Officer service fees (Note 3) | | | 907 | | | | 907 | |
Directors’ fees (Note 3) | | | 666 | | | | 665 | |
Audit fees | | | 16,075 | | | | 16,075 | |
Registration and filing fees | | | 9,416 | | | | 9,418 | |
Custodian fees | | | 785 | | | | 1,024 | |
Miscellaneous | | | 3,236 | | | | 3,239 | |
| | | | | | | | |
| | |
Total Expenses | | | 56,687 | | | | 57,434 | |
Less reduction of expenses (Note 3) | | | (51,198 | ) | | | (51,544 | ) |
| | | | | | | | |
| | |
Net Expenses | | | 5,489 | | | | 5,890 | |
| | | | | | | | |
| | |
NET INVESTMENT INCOME | | | 55,906 | | | | 46,378 | |
| | | | | | | | |
| | |
REALIZED AND UNREALIZED GAIN (LOSS) ON UNDERLYING SERIES: | | | | | | | | |
| | |
Net realized gain (loss) on underlying series | | | 3,261 | | | | 2,519 | |
Net change in unrealized appreciation (depreciation) on underlying series | | | (71,125 | ) | | | 53,836 | |
| | | | | | | | |
| | |
NET REALIZED AND UNREALIZED GAIN (LOSS) ON UNDERLYING SERIES | | | (67,864 | ) | | | 56,355 | |
| | | | | | | | |
| | |
NET INCREASE (DECREASE) IN NET ASSETS RESULTING FROM OPERATIONS | | $ | (11,958 | ) | | $ | 102,733 | |
| | | | | | | | |
The accompanying notes are an integral part of the financial statements.
4
Statements of Changes in Net Assets
| | | | | | | | | | | | | | | | |
| | | STRATEGIC INCOME CONSERVATIVE SERIES | | | STRATEGIC INCOME MODERATE SERIES | |
| | | FOR THE SIX
MONTHS ENDED 6/30/13
(UNAUDITED) | | | FOR THE PERIOD
8/1/121 TO 12/31/12 | | | FOR THE SIX
MONTHS ENDED 6/30/13
(UNAUDITED) | | | FOR THE PERIOD
8/1/121 TO 12/31/12 | |
INCREASE (DECREASE) IN NET ASSETS: | | | | | | | | | | | | | | | | |
| | | | |
OPERATIONS: | | | | | | | | | | | | | | | | |
| | | | |
Net investment income | | $ | 55,906 | | | $ | 30,964 | | | $ | 46,378 | | | $ | 32,446 | |
Net realized gain (loss) on underlying series | | | 3,261 | | | | (57 | ) | | | 2,519 | | | | 60 | |
Distributions of realized gains from underlying series | | | — | | | | 30,420 | | | | — | | | | 32,732 | |
Net change in unrealized appreciation (depreciation) on underlying series | | | (71,125 | ) | | | (41,579 | ) | | | 53,836 | | | | (41,750 | ) |
| | | | | | | | | | | | | | | | |
| | | | |
Net increase (decrease) from operations | | | (11,958 | ) | | | 19,748 | | | | 102,733 | | | | 23,488 | |
| | | | | | | | | | | | | | | | |
| | | | |
DISTRIBUTIONS TO SHAREHOLDERS (Note 8): | | | | | | | | | | | | | | | | |
| | | | |
From net investment income (Class S) | | | (35,184 | ) | | | (35,255 | ) | | | (39,668 | ) | | | (40,601 | ) |
From net investment income (Class I) | | | (13,331 | ) | | | (1,223 | ) | | | (530 | ) | | | (1,301 | ) |
From net realized gain on investments (Class S) | | | — | | | | (559 | ) | | | — | | | | (865 | ) |
From net realized gain on investments (Class I) | | | — | | | | (15 | ) | | | — | | | | (23 | ) |
| | | | | | | | | | | | | | | | |
| | | | |
Total distributions to shareholders | | | (48,515 | ) | | | (37,052 | ) | | | (40,198 | ) | | | (42,790 | ) |
| | | | | | | | | | | | | | | | |
| | | | |
CAPITAL STOCK ISSUED AND REPURCHASED: | | | | | | | | | | | | | | | | |
| | | | |
Net increase from capital share transactions (Note 6) | | | 3,735,117 | | | | 2,183,932 | | | | 3,218,505 | | | | 2,091,138 | |
| | | | | | | | | | | | | | | | |
| | | | |
Net increase in net assets | | | 3,674,644 | | | | 2,166,628 | | | | 3,281,040 | | | | 2,071,836 | |
| | | | |
NET ASSETS: | | | | | | | | | | | | | | | | |
| | | | |
Beginning of period | | | 2,166,628 | | | | — | | | | 2,071,836 | | | | — | |
| | | | | | | | | | | | | | | | |
| | | | |
End of period (including undistributed net investment income of $7,391, $0, $6,180 and $0, respectively) | | $ | 5,841,272 | | | $ | 2,166,628 | | | $ | 5,352,876 | | | $ | 2,071,836 | |
| | | | | | | | | | | | | | | | |
1Commencement of operations.
The accompanying notes are an integral part of the financial statements.
5
Financial Highlights
| | | | | | | | |
| STRATEGIC INCOME CONSERVATIVE SERIES CLASS S | | FOR THE SIX
MONTHS ENDED
6/30/13
(UNAUDITED) | | | FOR THE PERIOD
8/1/121 TO 12/31/12 | |
Per share data (for a share outstanding throughout each period): | | | | | | | | |
Net asset value - Beginning of period | | $ | 10.07 | | | $ | 10.00 | |
| | | | | | | | |
Income (loss) from investment operations: | | | | | | | | |
Net investment income2 | | | 0.12 | | | | 0.30 | |
Net realized and unrealized gain (loss) on underlying series | | | (0.01 | ) | | | 0.01 | |
| | | | | | | | |
| | |
Total from investment operations | | | 0.11 | | | | 0.31 | |
| | | | | | | | |
| | |
Less distributions to shareholders: | | | | | | | | |
From net investment income | | | (0.09 | ) | | | (0.24 | ) |
From net realized gain on investments | | | — | | | | (0.00 | )3 |
| | | | | | | | |
| | |
Total distributions to shareholders | | | (0.09 | ) | | | (0.24 | ) |
| | | | | | | | |
| | |
Net asset value - End of period | | $ | 10.09 | | | $ | 10.07 | |
| | | | | | | | |
| | |
Net assets - End of period (000’s omitted) | | $ | 4,396 | | | $ | 2,115 | |
| | | | | | | | |
| | |
Total return4 | | | 1.09 | % | | | 3.12 | % |
Ratios (to average net assets)/Supplemental Data: | | | | | | | | |
Expenses*5 | | | 0.30 | %6 | | | 0.30 | %7 |
Net investment income8 | | | 1.15 | % | | | 2.95 | % |
Series portfolio turnover9 | | | 4 | % | | | 5 | % |
|
| * The investment advisor paid a portion of the Series’ expenses. If these expenses had been incurred by the Series, the expense ratios (to average net assets) would have been increased by the following amount5 : | |
| | |
| | | 2.38 | %6 | | | 10.89 | %7,10 |
| | | | | | | | |
| STRATEGIC INCOME CONSERVATIVE SERIES CLASS I | | FOR THE SIX
MONTHS ENDED
6/30/13
(UNAUDITED) | | | FOR THE PERIOD
8/1/121 TO 12/31/12 | |
Per share data (for a share outstanding throughout the period): | | | | | | | | |
Net asset value - Beginning of period | | $ | 10.06 | | | $ | 10.00 | |
| | | | | | | | |
Income (loss) from investment operations: | | | | | | | | |
Net investment income2 | | | 0.17 | | | | 0.22 | |
Net realized and unrealized gain (loss) on underlying series | | | (0.05 | ) | | | 0.08 | |
| | | | | | | | |
| | |
Total from investment operations | | | 0.12 | | | | 0.30 | |
| | | | | | | | |
| | |
Less distributions to shareholders: | | | | | | | | |
From net investment income | | | (0.10 | ) | | | (0.24 | ) |
From net realized gain on investments | | | — | | | | (0.00 | )3 |
| | | | | | | | |
| | |
Total distributions to shareholders | | | (0.10 | ) | | | (0.24 | ) |
| | | | | | | | |
| | |
Net asset value - End of period | | $ | 10.08 | | | $ | 10.06 | |
| | | | | | | | |
| | |
Net assets - End of period (000’s omitted) | | $ | 1,445 | | | $ | 52 | |
| | | | | | | | |
| | |
Total return4 | | | 1.19 | % | | | 3.08 | % |
Ratios (to average net assets)/Supplemental Data: | | | | | | | | |
Expenses*5 | | | 0.05 | %6 | | | 0.05 | %7 |
Net investment income8 | | | 1.66 | % | | | 2.15 | % |
Series portfolio turnover9 | | | 4 | % | | | 5 | % |
|
| * The investment advisor paid a portion of the Series’ expenses. If these expenses had been incurred by the Series, the expense ratios (to average net assets) would have been increased by the following amount5 : | |
| | |
| | | 2.06 | %6 | | | 27.14 | %7,10 |
1Commencement of operations.
2Calculated based on average shares outstanding during the period.
3Less than ($0.01) per share.
4Represents aggregate total return for the periods indicated. Total return would have been lower had certain expenses not been reimbursed during the periods. Periods less than one year are not annualized.
5Annualized.
6Expense ratios do not include expenses of the Underlying Series in which the Series invests. The average expense ratio of the Underlying Series was 0.70%.
7Expense ratios do not include expenses of the Underlying Series in which the Series invests. The average expense ratio of the Underlying Series was 0.71%.
8Net investment income is affected by the timing of distributions from underlying fund investments.
9Reflects activity of the Series and does not include the activity of the Underlying Series.
10The increase to the expense ratios (to average net assets) is largely due to the small net assets in each class.
The accompanying notes are an integral part of the financial statements.
6
Financial Highlights
| | | | | | | | |
| STRATEGIC INCOME MODERATE SERIES CLASS S | | FOR THE SIX
MONTHS ENDED
6/30/13
(UNAUDITED) | | | FOR THE PERIOD
8/1/121 TO 12/31/12 | |
Per share data (for a share outstanding throughout each period): | | | | | | | | |
Net asset value - Beginning of period | | $ | 10.07 | | | $ | 10.00 | |
| | | | | | | | |
Income (loss) from investment operations: | | | | | | | | |
Net investment income2 | | | 0.12 | | | | 0.30 | |
Net realized and unrealized gain (loss) on underlying series | | | 0.39 | | | | 0.02 | |
| | | | | | | | |
| | |
Total from investment operations | | | 0.51 | | | | 0.32 | |
| | | | | | | | |
| | |
Less distributions to shareholders: | | | | | | | | |
From net investment income | | | (0.09 | ) | | | (0.25 | ) |
From net realized gain on investments | | | — | | | | (0.00 | )3 |
| | | | | | | | |
| | |
Total distributions to shareholders | | | (0.09 | ) | | | (0.25 | ) |
| | | | | | | | |
| | |
Net asset value - End of period | | $ | 10.49 | | | $ | 10.07 | |
| | | | | | | | |
| | |
Net assets - End of period (000’s omitted) | | $ | 5,296 | | | $ | 2,019 | |
| | | | | | | | |
| | |
Total return4 | | | 5.06 | % | | | 3.23 | % |
Ratios (to average net assets)/Supplemental Data: | | | | | | | | |
Expenses*5 | | | 0.30 | %6 | | | 0.30 | %7 |
Net investment income8 | | | 1.16 | % | | | 2.92 | % |
Series portfolio turnover9 | | | 2 | % | | | 7 | % |
|
| * The investment advisor paid a portion of the Series’ expenses. If these expenses had been incurred by the Series, the expense ratios (to average net assets) would have been increased by the following amount5 : | |
| | |
| | | 2.59 | %6 | | | 10.28 | %7,10 |
| | | | | | | | |
| STRATEGIC INCOME MODERATE SERIES CLASS I | | FOR THE SIX
MONTHS ENDED
6/30/13
(UNAUDITED) | | | FOR THE PERIOD
8/1/121 TO 12/31/12 | |
Per share data (for a share outstanding throughout each period): | | | | | | | | |
Net asset value - Beginning of period | | $ | 10.07 | | | $ | 10.00 | |
| | | | | | | | |
Income (loss) from investment operations: | | | | | | | | |
Net investment income2 | | | 0.11 | | | | 0.22 | |
Net realized and unrealized gain (loss) on underlying series | | | 0.42 | | | | 0.10 | |
| | | | | | | | |
| | |
Total from investment operations | | | 0.53 | | | | 0.32 | |
| | | | | | | | |
| | |
Less distributions to shareholders: | | | | | | | | |
From net investment income | | | (0.10 | ) | | | (0.25 | ) |
From net realized gain on investments | | | — | | | | (0.00 | )3 |
| | | | | | | | |
| | |
Total distributions to shareholders | | | (0.10 | ) | | | (0.25 | ) |
| | | | | | | | |
| | |
Net asset value - End of period | | $ | 10.50 | | | $ | 10.07 | |
| | | | | | | | |
| | |
Net assets - End of period (000’s omitted) | | $ | 57 | | | $ | 53 | |
| | | | | | | | |
| | |
Total return4 | | | 5.26 | % | | | 3.29 | % |
Ratios (to average net assets)/Supplemental Data: | | | | | | | | |
Expenses*5 | | | 0.05 | %6 | | | 0.05 | %7 |
Net investment income8 | | | 1.08 | % | | | 2.16 | % |
Series portfolio turnover9 | | | 2 | % | | | 7 | % |
|
| * The investment advisor paid a portion of the Series’ expenses. If these expenses had been incurred by the Series, the expense ratios (to average net assets) would have been increased by the following amount5 : | |
| | |
| | | 2.73 | %6 | | | 27.25 | %7,10 |
1Commencement of operations.
2Calculated based on average shares outstanding during the period.
3Less than ($0.01) per share.
4Represents aggregate total return for the periods indicated. Total return would have been lower had certain expenses not been reimbursed during the periods. Periods less than one year are not annualized.
5Annualized.
6Expense ratios do not include expenses of the Underlying Series in which the Series invests. The average expense ratio of the Underlying Series was 0.68%.
7Expense ratios do not include expenses of the Underlying Series in which the Series invests. The average expense ratio of the Underlying Series was 0.70%.
8Net investment income is affected by the timing of distributions from underlying fund investments.
9Reflects activity of the Series and does not include the activity of the Underlying Series.
10The increase to the expense ratios (to average net assets) is largely due to the small net assets in each class.
The accompanying notes are an integral part of the financial statements.
7
Notes to Financial Statements
(unaudited)
Strategic Income Conservative Series and Strategic Income Moderate Series (each the “Series”) are no-load diversified series of Manning & Napier Fund, Inc. (the “Fund”). The Fund is organized in Maryland and is registered under the Investment Company Act of 1940 (the “1940 Act”), as amended, as an open-end management investment company.
The goals of each Series are as follows: Strategic Income Conservative Series - primary goal is to manage against capital risk and generate income; secondary goal is to provide long term capital growth. Strategic Income Moderate Series - equal emphasis on managing against capital risk while generating income and pursuing long term capital growth.
Each Series seeks to achieve its investment objectives by investing in a combination of other Manning & Napier mutual funds (the “Underlying Series”). As of June 30, 2013, the Underlying Series include the Core Bond Series, the Dividend Focus Series, the High Yield Bond Series, and the Real Estate Series of the Fund. The financial statements of the Underlying Series should be read in conjunction with the Series’ financial statements.
Each Series is authorized to issue two classes of shares (Class S and I). Each class of shares is substantially the same, except that Class S shares bear a shareholder service fee.
The Fund’s advisor is Manning & Napier Advisors, LLC (the “Advisor”). Shares of each Series are offered to investors and employees of the Advisor and its affiliates. The total authorized capital stock of the Fund consists of 15 billion shares of common stock each having a par value of $0.01. As of June 30, 2013, 10.3 billion shares have been designated in total among 42 series, of which 100 million have been designated in each of the Series for Class S common stock and 100 million have been designated in each of the Series for Class I common stock.
| 2. | Significant Accounting Policies |
Security Valuation
Investments in the Underlying Series are valued at their net asset value per share on valuation date. In the absence of the availability of a net asset value per share on the Underlying Series, security valuations may be determined in good faith by the Advisor under procedures approved by and under the general supervision and responsibility of the Fund’s Board of Directors (the “Board”).
Volume and level of activity in established markets for an asset or liability are evaluated to determine whether recent transactions and quoted prices are determinative of fair value. Where there have been significant decreases in volume and level of activity, further analysis and adjustment may be necessary to estimate fair value. The Series measure fair value in these instances by the use of inputs and valuation techniques which may be based upon current market prices of securities that are comparable in coupon, rating, maturity and industry and/or expectation of future cash flows. As a result of trading in relatively thin markets and/or markets that experience significant volatility, the prices used by the Series to value these securities may differ from the value that would be realized if these securities were sold, and the differences could be material.
Securities for which representative valuations or prices are not available from the Series’ pricing service may be valued at fair value as determined in good faith by the Advisor under procedures approved by and under the general supervision and responsibility of the Board. Due to the inherent uncertainty of valuations of such securities, the fair value may differ significantly from the values that would have been used had a ready market for such securities existed. If trading or events occurring after the close of the principal market in which securities are traded are expected to materially affect the value of those securities, then they may be valued at their fair value, taking this trading or these events into account.
Various inputs are used in determining the value of the Series’ assets or liabilities carried at fair value. These inputs are summarized in three broad levels. Level 1 includes quoted prices in active markets for identical assets and liabilities. Level 2 includes other significant observable inputs (including quoted prices for similar securities, interest rates, prepayment speeds, credit risk, etc.). Level 3 includes significant unobservable inputs (including the Series’ own assumptions in determining the fair value of investments). A financial instrument’s level within the fair value hierarchy is based on the lowest level on any input both individually and in aggregate that is significant to the fair value measurement. The inputs or methodology used for valuing securities are not necessarily an indication of the risk associated with investing in those securities.
8
Notes to Financial Statements (continued)
(unaudited)
| 2. | Significant Accounting Policies (continued) |
Security Valuation (continued)
The following is a summary of the valuation levels used for major security types as of June 30, 2013 in valuing the Series’ assets or liabilities carried at fair value:
| | | | | | | | | | | | | | | | |
| | | STRATEGIC INCOME CONSERVATIVE SERIES | |
| DESCRIPTION | | TOTAL | | | LEVEL 1 | | | LEVEL 2 | | | LEVEL 3 | |
Assets: | | | | | | | | | | | | | | | | |
Mutual funds | | $ | 5,837,899 | | | $ | 5,837,899 | | | $ | — | | | $ | — | |
| | | | | | | | | | | | | | | | |
Total assets: | | $ | 5,837,899 | | | $ | 5,837,899 | | | $ | — | | | $ | — | |
| | | | | | | | | | | | | | | | |
| | | | | | | | | | | | | | | | |
| | | STRATEGIC INCOME MODERATE SERIES | |
| DESCRIPTION | | TOTAL | | | LEVEL 1 | | | LEVEL 2 | | | LEVEL 3 | |
Assets: | | | | | | | | | | | | | | | | |
Mutual funds | | $ | 5,349,441 | | | $ | 5,349,441 | | | $ | — | | | $ | — | |
| | | | | | | | | | | | | | | | |
Total assets: | | $ | 5,349,441 | | | $ | 5,349,441 | | | $ | — | | | $ | — | |
| | | | | | | | | | | | | | | | |
There were no Level 2 or Level 3 securities held by any of the Series as of December 31, 2012 or June 30, 2013.
The Fund’s policy is to recognize transfers in and transfers out of the valuation levels as of the beginning of the reporting period. There were no transfers between Level 1 and Level 2 during the six months ended June 30, 2013.
Security Transactions, Investment Income and Expenses
Security transactions are accounted for on trade date. Dividend income is recorded on the ex-dividend date. Non-cash dividends, if any, are recorded at the fair value of the securities received. Income and capital gains distributions from the Underlying Series, if any, are recorded on the ex-dividend date.
Expenses are recorded on an accrual basis. Most expenses of the Fund can be attributed to a specific series. Expenses which cannot be directly attributed are apportioned among the series in the Fund in such a manner as deemed equitable by the Fund’s Board, taking into consideration, among other things, the nature and type of expense. Expenses included in the accompanying statements of operations do not include any expense of the Underlying Series.
Income, expenses (other than class specific expenses), and realized and unrealized gains and losses are prorated among the classes based on the relative net assets of each class. Class specific expenses are directly charged to that Class.
The Series use the identified cost method for determining realized gain or loss on investments for both financial statement and federal income tax reporting purposes.
Federal Taxes
Each Series’ policy is to comply with the provisions of the Internal Revenue Code applicable to regulated investment companies. The Series are not subject to federal income tax or excise tax to the extent that each Series distributes to shareholders each year its taxable income, including any net realized gains on investments, in accordance with requirements of the Internal Revenue Code. Accordingly, no provision for federal income tax or excise tax has been made in the financial statements.
Management evaluates its tax positions to determine if the tax positions taken meet the minimum recognition threshold in connection with accounting for uncertainties in income tax positions taken or expected to be taken for the purposes of measuring and recognizing tax liabilities in the financial statements. Recognition of tax benefits of an uncertain tax position is required only when the position is “more likely than not” to be sustained assuming examination by taxing authorities. At June 30, 2013, the Series have recorded no liability for net unrecognized tax benefits relating to uncertain income tax positions taken or expected to be taken in future tax returns.
9
Notes to Financial Statements (continued)
(unaudited)
| 2. | Significant Accounting Policies (continued) |
Federal Taxes (continued)
The Series file income tax returns in the U.S. federal jurisdiction, various states and foreign jurisdictions, as required. No income tax returns are currently under investigation. As the commencement of operations of the Series was August 1, 2012, the statute of limitations remains open for the period ended December 31, 2012. The Series are not aware of any tax positions for which it is reasonably possible that the total amounts of unrecognized tax benefits will significantly change in the next twelve months.
Foreign Taxes
Based on the Series’ understanding of the tax rules and rates related to income, gains and currency purchase/ repatriation transactions for foreign jurisdictions in which they invest, the Series will provide for foreign taxes, and where appropriate, deferred foreign tax.
Distributions of Income and Gains
Distributions to shareholders of net investment income are made quarterly. Distributions of net realized gains are made annually. An additional distribution may be necessary to avoid taxation of a Series. Distributions are recorded on the ex-dividend date.
Indemnifications
The Fund’s organizational documents provide former and current directors and officers with a limited indemnification against liabilities arising in connection with the performance of their duties to the Fund. In the normal course of business, the Fund may also enter into contracts that provide general indemnifications. The Fund’s maximum exposure under these arrangements is unknown as this would be dependent on future claims that may be made against the Fund. The risk of material loss from such claims is considered remote.
Other
The preparation of financial statements in conformity with accounting principles generally accepted in the United States of America requires management to make estimates and assumptions that affect the reported amounts of assets and liabilities and the disclosure of contingent assets and liabilities at the date of the financial statements and the reported amounts of income and expenses during the reporting period. Actual results could differ from those estimates.
| 3. | Transactions with Affiliates |
The Fund has an Investment Advisory Agreement (the “Agreement”) with the Advisor, for which the Advisor does not receive an advisory fee for the services it performs for the Series. However, the Advisor is entitled to receive an advisory fee from each of the Underlying Series in which the Series invest.
Under the Agreement, personnel of the Advisor provide the Series with advice and assistance in the choice of investments and the execution of securities transactions, and otherwise maintain the Series’ organization. The Advisor also provides the Fund with necessary office space and fund administration and support services. The salaries of all officers of the Fund (except a percentage of the Fund’s Chief Compliance Officer’s salary, which is paid by the Fund), and of all Directors who are “affiliated persons” of the Fund, or of the Advisor, and all personnel of the Fund, or of the Advisor, performing services relating to research, statistical and investment activities, are paid by the Advisor. Each “non-affiliated” Director receives an annual stipend, which is allocated among all the active series of the Fund. In addition, these Directors also receive a fee per Board meeting attended plus a fee for each committee meeting attended.
The Class S shares of the Series are subject to a shareholder service fee in accordance with a shareholder service plan adopted by the Board. The shareholder service fee is intended to compensate financial intermediaries, including affiliates of the Fund, in connection with the provision of direct client services, personal services, maintenance of shareholder accounts and reporting services. For these services, Class S of the Series pays a fee, computed daily and payable monthly, at an annual rate of 0.25% of the average daily net assets of Class S. The Fund has a Shareholder Services Agreement with the Advisor, for which the Advisor receives the shareholder services fee as stated above.
Manning & Napier Investor Services, Inc., a registered broker-dealer affiliate of the Advisor, acts as distributor for the Fund’s shares. The services of Manning & Napier Investor Services, Inc. are provided at no additional cost to the Series.
10
Notes to Financial Statements (continued)
(unaudited)
| 3. | Transactions with Affiliates (continued) |
The Advisor has contractually agreed, until at least April 30, 2014, to limit each class’ total direct annual fund operating expenses for the Series at no more than 0.05% for each class, exclusive of shareholder service fees, of average daily net assets each year. The Advisor’s agreement to limit each class’ operating expenses is limited to direct operating expenses and, therefore, does not apply to the indirect expenses incurred by the Series through their investments in the Underlying Series. For the six months ended June 30, 2013, the Advisor reimbursed expenses of $51,198 for Strategic Income Conservative Series and $51,544 for Strategic Income Moderate Series, which is included as a reduction of expenses on the Statements of Operations. The Advisor is not eligible to recoup any expenses that have been waved or reimbursed in prior years.
The Advisor has agreements with BNY Mellon Investment Servicing (U.S.) Inc. (“BNY”) under which BNY serves as sub-accountant services agent and sub-transfer agent. The fee rates for these Series are as follows: An annual fee related to fund accounting and administration of 0.0025% of the average daily net assets with an annual base fee of $40,500 per series. Transfer Agent fees are charged to the Fund on a per account basis. Additionally, certain cusip-based and out-of-pocket expenses are charged. Effective October 1, 2012, the aforementioned agreements were modified to reduce the annual fee related to fund accounting and administration, as well as transfer agent fees, by 10%, excluding out-of-pocket expenses.
Expenses not directly attributable to a series are allocated based on each series’ relative net assets or number of accounts, depending on the expense.
| 4. | Purchases and Sales of Securities |
For the six months ended June 30, 2013, purchases and sales of Underlying Series were as follows:
| | | | | | | | | | |
| SERIES | | PURCHASES | | | SALES | | | |
Strategic Income Conservative Series | | $ | 3,916,921 | | | $ | 174,022 | | | |
Strategic Income Moderate Series | | $ | 3,285,666 | | | $ | 60,633 | | | |
| 5. | Investments in Affiliated Issuers |
A summary of the Series’ transactions in the shares of affiliated issuers during the six months ended June 30, 2013 is set forth below:
| | | | | | | | | | | | | | | | | | | | | | | | | | | | |
STRATEGIC INCOME
CONSERVATIVE SERIES | | VALUE AT
12/31/12 | | | PURCHASE
COST | | | SALES
PROCEEDS | | | VALUE AT
6/30/13 | | | SHARES HELD
AT 6/30/13 | | | DIVIDEND
INCOME
1/1/13
THROUGH
6/30/13 | | | NET REALIZED
GAIN/(LOSS)
1/1/13
THROUGH
6/30/13 | |
Manning & Napier | | | | | | | | | | | | | | | | | | | | | | | | | | | | |
Core Bond | | | | | | | | | | | | | | | | | | | | | | | | | | | | |
Series | | | | | | | | | | | | | | | | | | | | | | | | | | | | |
- Class I | | $ | 1,383,430 | | | $ | 2,506,830 | | | $ | 111,374 | | | $ | 3,642,254 | | | | 327,247 | | | $ | 40,953 | | | $ | (267 | ) |
Manning & Napier | | | | | | | | | | | | | | | | | | | | | | | | | | | | |
Dividend Focus | | | | | | | | | | | | | | | | | | | | | | | | | | | | |
Series | | | | | | | | | | | | | | | | | | | | | | | | | | | | |
- Class I | | | 439,596 | | | | 783,384 | | | | 34,805 | | | | 1,258,977 | | | | 87,795 | | | | 13,493 | | | | 3,008 | |
Manning & Napier | | | | | | | | | | | | | | | | | | | | | | | | | | | | |
High Yield Bond | | | | | | | | | | | | | | | | | | | | | | | | | | | | |
Series | | | | | | | | | | | | | | | | | | | | | | | | | | | | |
- Class I | | | 128,059 | | | | 235,015 | | | | 10,441 | | | | 345,827 | | | | 35,652 | | | | 6,949 | | | | (11 | ) |
Manning & Napier | | | | | | | | | | | | | | | | | | | | | | | | | | | | |
Real Estate | | | | | | | | | | | | | | | | | | | | | | | | | | | | |
Series | | | | | | | | | | | | | | | | | | | | | | | | | | | | |
- Class I | | | 211,779 | | | | 391,692 | | | | 17,402 | | | | 590,841 | | | | 59,621 | | | | — | | | | 531 | |
| | | | | | | | | | | | | | | | | | | | | | | | | | | | |
| | $ | 2,162,864 | | | $ | 3,916,921 | | | $ | 174,022 | | | $ | 5,837,899 | | | | | | | $ | 61,395 | | | $ | 3,261 | |
| | | | | | | | | | | | | | | | | | | | | | | | | | | | |
11
Notes to Financial Statements (continued)
(unaudited)
| 5. | Investments in Affiliated Issuers (continued) |
| | | | | | | | | | | | | | | | | | | | | | | | | | | | |
STRATEGIC INCOME MODERATE SERIES | | VALUE AT
12/31/12 | | | PURCHASE
COST | | | SALES
PROCEEDS | | | VALUE AT
6/30/13 | | | SHARES HELD
AT 6/30/13 | | | DIVIDEND
INCOME
1/1/13
THROUGH
6/30/13 | | | NET REALIZED
GAIN/(LOSS)
1/1/13
THROUGH
6/30/13 | |
Manning & Napier | | | | | | | | | | | | | | | | | | | | | | | | | | | | |
Core Bond | | | | | | | | | | | | | | | | | | | | | | | | | | | | |
Series | | | | | | | | | | | | | | | | | | | | | | | | | | | | |
- Class I | | $ | 658,392 | | | $ | 1,051,413 | | | $ | 19,402 | | | $ | 1,626,092 | | | | 146,100 | | | $ | 17,803 | | | $ | (167 | ) |
Manning & Napier | | | | | | | | | | | | | | | | | | | | | | | | | | | | |
Dividend Focus | | | | | | | | | | | | | | | | | | | | | | | | | | | | |
Series | | | | | | | | | | | | | | | | | | | | | | | | | | | | |
- Class I | | | 944,919 | | | | 1,478,550 | | | | 27,285 | | | | 2,526,701 | | | | 176,199 | | | | 26,417 | | | | 2,561 | |
Manning & Napier | | | | | | | | | | | | | | | | | | | | | | | | | | | | |
High Yield Bond | | | | | | | | | | | | | | | | | | | | | | | | | | | | |
Series | | | | | | | | | | | | | | | | | | | | | | | | | | | | |
- Class I | | | 162,360 | | | | 262,853 | | | | 4,851 | | | | 410,931 | | | | 42,364 | | | | 8,048 | | | | (53 | ) |
Manning & Napier | | | | | | | | | | | | | | | | | | | | | | | | | | | | |
Real Estate | | | | | | | | | | | | | | | | | | | | | | | | | | | | |
Series | | | | | | | | | | | | | | | | | | | | | | | | | | | | |
- Class I | | | 302,382 | | | | 492,850 | | | | 9,095 | | | | 785,717 | | | | 79,285 | | | | — | | | | 178 | |
| | | | | | | | | | | | | | | | | | | | | | | | | | | | |
| | $ | 2,068,053 | | | $ | 3,285,666 | | | $ | 60,633 | | | $ | 5,349,441 | | | | | | | $ | 52,268 | | | $ | 2,519 | |
| | | | | | | | | | | | | | | | | | | | | | | | | | | | |
| 6. | Capital Stock Transactions |
Transactions in Class S and Class I shares were:
| | | | | | | | | | | | | | | | | | | | | | | | | | | | | | | | |
STRATEGIC INCOME
CONSERVATIVE SERIES: | | FOR THE SIX MONTHS ENDED 6/30/13 | | | FOR THE PERIOD 8/1/12
(COMMENCEMENT OF
OPERATIONS) TO
12/31/12 | | | FOR THE SIX MONTHS ENDED 6/30/13 | | | FOR THE PERIOD
8/1/12
(COMMENCEMENT
OF OPERATIONS)
TO 12/31/12 | |
| | | CLASS S
SHARES | | | AMOUNTS | | | CLASS S
SHARES | | | AMOUNTS | | | CLASS I
SHARES | | | AMOUNTS | | | CLASS I
SHARES | | | AMOUNTS | |
Sold | | | 238,778 | | | $ | 2,454,829 | | | | 206,735 | | | $ | 2,099,291 | | | | 136,945 | | | $ | 1,403,541 | | | | 5,000 | | | $ | 50,000 | |
Reinvested | | | 3,288 | | | | 33,311 | | | | 3,329 | | | | 33,402 | | | | 1,317 | | | | 13,331 | | | | 123 | | | | 1,239 | |
Repurchased | | | (16,305 | ) | | | (169,885 | ) | | | — | | | | — | | | | (1 | ) | | | (10 | ) | | | — | | | | — | |
| | | | | | | | | | | | | | | | | | | | | | | | | | | | | | | | |
Total | | | 225,761 | | | $ | 2,318,255 | | | | 210,064 | | | $ | 2,132,693 | | | | 138,261 | | | $ | 1,416,862 | | | | 5,123 | | | $ | 51,239 | |
| | | | | | | | | | | | | | | | | | | | | | | | | | | | | | | | |
| | | | | | | | | | | | | | | | | | | | | | | | | | | | | | | | |
STRATEGIC INCOME
MODERATE SERIES: | | FOR THE SIX MONTHS
ENDED 6/30/13 | | | FOR THE PERIOD 8/1/12
(COMMENCEMENT OF
OPERATIONS) TO
12/31/12 | | | FOR THE SIX MONTHS
ENDED 6/30/13 | | | FOR THE PERIOD
8/1/12
(COMMENCEMENT
OF OPERATIONS)
TO 12/31/12 | |
| | | CLASS S
SHARES | | | AMOUNTS | | | CLASS S
SHARES | | | AMOUNTS | | | CLASS I
SHARES | | | AMOUNTS | | | CLASS I
SHARES | | | AMOUNTS | |
Sold | | | 309,635 | | | $ | 3,274,535 | | | | 196,369 | | | $ | 1,996,999 | | | | 123 | | | $ | 1,300 | | | | 5,133 | | | $ | 51,350 | |
Reinvested | | | 3,608 | | | | 37,736 | | | | 4,118 | | | | 41,466 | | | | 50 | | | | 531 | | | | 131 | | | | 1,323 | |
Repurchased | | | (8,972 | ) | | | (95,597 | ) | | | — | | | | — | | | | — | | | | — | | | | — | | | | — | |
| | | | | | | | | | | | | | | | | | | | | | | | | | | | | | | | |
Total | | | 304,271 | | | $ | 3,216,674 | | | | 200,487 | | | $ | 2,038,465 | | | | 173 | | | $ | 1,831 | | | | 5,264 | | | $ | 52,673 | |
| | | | | | | | | | | | | | | | | | | | | | | | | | | | | | | | |
12
Notes to Financial Statements (continued)
(unaudited)
| 6. | Capital Stock Transactions (continued) |
At June 30, 2013, two accounts owned the following in Strategic Income Conservative Series and two accounts, each owning greater than 10% of the net assets, owned the following in Strategic Income Moderate Series:
| | | | | | | | | | | | |
| SERIES | | SHARES
OWNED | | | PERCENTAGE
OF SERIES
SHARES
OUTSTANDING | | | VALUE | |
Strategic Income Conservative Series | | | 188,225 | | | | 32.5 | % | | $ | 1,898,043 | |
Strategic Income Moderate Series | | | 119,910 | | | | 23.5 | % | | $ | 1,257,861 | |
Investment activities of these shareholders may have a material effect on the Series.
The Underlying Series may trade in instruments including written and purchased options, forward foreign currency exchange contracts and futures contracts and other derivatives in the normal course of investing activities to assist in managing exposure to various market risks. The Underlying Series may be subject to various elements of risk which may involve, to a varying degree, elements of risk in excess of the amounts recognized for financial statement purposes. These risks include: the risk that changes in the value of a derivative may not correlate perfectly with the underlying asset, rate or index; counterparty credit risk related to over the counter derivative counterparties’ failure to perform under contract terms; liquidity risk related to the lack of a liquid market for these contracts allowing the Underlying Series to close out their position(s); and documentation risk relating to disagreement over contract terms. No such investments were held by the Underlying Series as of June 30, 2013.
| 8. | Federal Income Tax Information |
The amount and characterization of certain income and capital gains to be distributed are determined in accordance with federal income tax regulations, which may differ from accounting principles generally accepted in the United States of America. The Series may periodically make reclassifications among its capital accounts to reflect income and gains available for distribution (or available capital loss carryovers) under income tax regulations, without impacting the Series’ net asset value. Any such reclassifications are not reflected in the financial highlights.
The final determination of the tax character of current year distributions will be made at the conclusion of the fiscal year. The tax character of distributions paid for the year ended December 31, 2012 was as follows:
| | | | | | | | | | |
| | | STRATEGIC INCOME
CONSERVATIVE SERIES | | | STRATEGIC INCOME
MODERATE SERIES | | | |
Ordinary income | | $ | 36,660 | | | $ | 42,145 | | | |
Long-term capital gain | | | 392 | | | | 645 | | | |
At June 30, 2013, the identified cost for federal income tax purposes, the resulting gross unrealized appreciation and depreciation, and the net unrealized appreciation (depreciation) were as follows:
| | | | | | | | |
| | | STRATEGIC
INCOME
CONSERVATIVE
SERIES | | | STRATEGIC
INCOME
MODERATE
SERIES | |
Cost for federal income tax purposes | | $ | 5,951,568 | | | $ | 5,337,806 | |
Unrealized appreciation | | | 62,700 | | | | 118,337 | |
Unrealized depreciation | | | (176,369 | ) | | | (106,702 | ) |
| | | | | | | | |
Net unrealized appreciation (depreciation) | | $ | (113,669 | ) | | $ | 11,635 | |
| | | | | | | | |
13
Literature Requests
(unaudited)
Proxy Voting Policies and Procedures
A description of the policies and procedures that the Fund uses to determine how to vote proxies relating to portfolio securities is available, without charge, upon request:
| | | | |
| By phone | | 1-800-466-3863 | | |
| On the Securities and Exchange Commission’s (SEC) web site | | http://www.sec.gov | | |
Proxy Voting Record
Information regarding how the Fund voted proxies relating to portfolio securities during the most recent 12-month period ended June 30th is available, without charge, upon request:
| | | | |
| By phone | | 1-800-466-3863 | | |
| On the SEC’s web site | | http://www.sec.gov | | |
Quarterly Portfolio Holdings
The Series’ complete schedule of portfolio holdings for the 1st and 3rd quarters of each fiscal year are provided on Form N-Q, and are available, without charge, upon request:
| | | | |
| By phone | | 1-800-466-3863 | | |
| On the SEC’s web site | | http://www.sec.gov | | |
The Series’ Form N-Q may be reviewed and copied at the SEC’s Public Reference Room in Washington, D.C. Information on the operation of the Public Reference Room may be obtained by calling 1-800-SEC-0330.
Prospectus and Statement of Additional Information (SAI)
The prospectus and SAI provide additional information about each Series, including charges, expenses and risks. These documents are available, without charge, upon request:
| | | | |
| By phone | | 1-800-466-3863 | | |
| On the SEC’s web site | | http://www.sec.gov | | |
| On the Advisor’s web site | | http://www.manning-napier.com | | |
Additional information available at www.manning-napier.com
1. Fund Holdings - Month-End
2. Fund Holdings - Quarter-End
3. Shareholder Report - Annual
4. Shareholder Report - Semi-Annual
The Fund also offers electronic notification or “e-delivery” when certain documents are available on-line to be downloaded or reviewed. Direct shareholders can elect to receive electronic notification when shareholder reports, prospectus updates, and/or statements are available. If you do not currently have on-line access to your account, you can establish access by going to www.manning-napier.com, click on “Login” in the top corner of the page, and follow the prompts to self-enroll. Once enrolled, you can set your electronic notification preferences by clicking on the Account Options tab located within the green toolbar and then select E-Delivery Option. Should you have any questions on either how to establish on-line access or how to update your account settings, please contact Investor Services at 1-800-466-3863.
MNSTI-6/13-SAR
Not applicable for Semi-Annual Reports.
ITEM 3: | AUDIT COMMITTEE FINANCIAL EXPERT |
Not applicable for Semi-Annual Reports.
ITEM 4: | PRINCIPAL ACCOUNTANT FEES AND SERVICES |
Not applicable for Semi-Annual Reports.
ITEM 5: | AUDIT COMMITTEE OF LISTED REGISTRANTS |
Not applicable.
(a) | See Investment Portfolios under Item 1 on this Form N-CSR. |
ITEM 7: | DISCLOSURE OF PROXY VOTING POLICIES AND PROCEDURES FOR CLOSED- END MANAGEMENT INVESTMENT COMPANIES |
Not applicable.
ITEM 8: | PORTFOLIO MANAGERS OF CLOSED-END MANAGEMENT INVESTMENT COMPANIES |
Not applicable.
ITEM 9: | PURCHASES OF EQUITY SECURITIES BY CLOSED-END MANAGEMENT INVESTMENT COMPANY AND AFFILIATED PURCHASERS |
Not applicable.
ITEM 10: | SUBMISSION OF MATTERS TO A VOTE OF SECURITY HOLDERS |
There have been no material changes to the procedure by which shareholders may recommend nominees to the registrant’s board of directors.
ITEM 11: | CONTROLS AND PROCEDURES |
(a) Based on their evaluation of the Funds’ disclosure controls and procedures, as of a date within 90 days of the filing date, the Funds’ Principal Executive Officer and Principal Financial Officer have concluded that the Funds’ disclosure controls and procedures are: (i) reasonably designed to ensure that information required to be disclosed in this report is appropriately communicated to the Funds’ officers to allow timely decisions regarding disclosures required in this report; (ii) reasonably designed to ensure that information required to be disclosed in this report is recorded, processed, summarized and reported in a timely manner; and (iii) are effective in achieving the goals described in (i) and (ii) above.
(b) During the second fiscal quarter of the period covered by this report, there have been no changes in the Funds’ internal control over financial reporting that the above officers believe to have materially affected, or to be reasonably likely to materially affect, the Funds’ internal control over financial reporting.
(a)(1) | Not applicable for Semi-Annual Reports. |
(a)(2) | Separate certifications for the Registrant’s principal executive officer and principal financial officer, as required by Section 302 of the Sarbanes-Oxley Act of 2002 and Rule 30a-2(a) under the Investment Company Act of 1940, are attached as EX-99.CERT. |
(b) | A certification of the Registrant’s principal executive officer and principal financial officer, as required by 18 U.S.C Section 1350, as adopted pursuant to Section 906 of the Sarbanes-Oxley Act of 2002, and Rule 30a-2(b) under the Investment Company Act of 1940, is attached as EX- 99.906CERT. The certification furnished pursuant to this paragraph is not deemed to be “filed” for purposes of Section 18 of the Securities Exchange Act of 1934, or otherwise subject to the liability of that section. Such certification is not deemed to be incorporated by reference into any filing under the Securities Act of 1933 or the Securities Exchange Act of 1934, except to the extent that the Registrant specifically incorporates them by reference. |
SIGNATURES
Pursuant to the requirements of the Securities Exchange Act of 1934 and the Investment Company Act of 1940, the registrant has duly caused this report to be signed on its behalf by the undersigned, thereunto duly authorized.
Manning & Napier Fund, Inc.
/s/ B. Reuben Auspitz
B. Reuben Auspitz
President & Principal Executive Officer of Manning & Napier Fund, Inc.
Date: August 29, 2013
Pursuant to the requirements of the Securities Exchange Act of 1934 and the Investment Company Act of 1940, this report has been signed below by the following persons on behalf of the registrant and in the capacities and on the dates indicated.
/s/ B. Reuben Auspitz
B. Reuben Auspitz
President & Principal Executive Officer of Manning & Napier Fund, Inc.
Date: August 29, 2013
/s/ Christine Glavin
Christine Glavin
Chief Financial Officer & Principal Financial Officer of Manning & Napier Fund, Inc.
Date: August 29, 2013