UNITED STATES
SECURITIES AND EXCHANGE COMMISSION
Washington, D.C. 20549
FORM N-CSR
CERTIFIED SHAREHOLDER REPORT OF REGISTERED MANAGEMENT INVESTMENT COMPANIES
Investment Company Act file number 811-04087
--------------------------------------------------
Manning & Napier Fund, Inc.
------------------------------------------------------------------------------------
(Exact name of registrant as specified in charter)
290 Woodcliff Drive, Fairport, NY 14450
------------------------------------------------------------------------------------
(Address of principal executive offices)(Zip Code)
B. Reuben Auspitz 290 Woodcliff Drive, Fairport, NY 14450
------------------------------------------------------------------------------------
(Name and address of agent for service)
Registrant’s telephone number, including area code: 585-325-6880
----------------------------------
Date of fiscal year end: October 31
------------------------------------------------------------
Date of reporting period: November 1, 2011 through April 30, 2012
Form N-CSR is to be used by management investment companies to file reports with the Commission not later than 10 days after the transmission to stockholders of any report that is required to be transmitted to stockholders under Rule 30e-1 under the Investment Company Act of 1940 (17 CFR 270.30e-1). The Commission may use the information provided on Form N-CSR in its regulatory, disclosure review, inspection, and policymaking roles.
A registrant is required to disclose the information specified by Form N-CSR, and the Commission will make this information public. A registrant is not required to respond to the collection of information contained in Form N-CSR unless the Form displays a currently valid Office of Management and Budget (“OMB”) control number. Please direct comments concerning the accuracy of the information collection burden estimate and any suggestions for reducing the burden to Secretary, Securities and Exchange Commission, 100 F Street, NE, Washington, DC 20549. The OMB has reviewed this collection of information under the clearance requirements of 44 U.S.C. § 3507.
ITEM 1: | REPORTS TO STOCKHOLDERS. |

| | | | | | |
| | | | EQUITY SERIES | | |
www.manning-napier.com | | | |  |
Equity Series
Shareholder Expense Example
(unaudited)
As a shareholder of the Series, you may incur two types of costs: (1) transaction costs, including potential wire charges on redemptions and (2) ongoing costs, including management fees and other Series expenses. This example is intended to help you understand your ongoing costs (in dollars) of investing in the Series and to compare these costs with the ongoing costs of investing in other mutual funds.
The example is based on an investment of $1,000 invested at the beginning of the period and held for the entire period (November 1, 2011 to April 30, 2012).
Actual Expenses
The first line of the table below provides information about actual account values and actual expenses. You may use the information in this line, together with the amount you invested, to estimate the expenses that you paid over the period. Simply divide your account value by $1,000 (for example, an $8,600 account value divided by $1,000 = 8.6), then multiply the result by the number in the first line under the heading entitled “Expenses Paid During Period” to estimate the expenses you paid on your account during this period.
Hypothetical Example for Comparison Purposes
The second line of the table below provides information about hypothetical account values and hypothetical expenses based on the Series’ actual expense ratio and an assumed rate of return of 5% per year before expenses, which is not the Series’ actual return. The hypothetical account values and expenses may not be used to estimate the actual ending account balance or expenses you paid during the period. You may use this information to compare the ongoing costs of investing in the Series and other funds. To do so, compare this 5% hypothetical example with the 5% hypothetical examples that appear in the shareholder reports of the other funds.
Please note that the expenses shown in the table are meant to highlight your ongoing costs only and do not reflect any transaction costs. Therefore, the second line of the table is useful in comparing ongoing costs only, and will not help you determine the relative total costs of owning different funds. In addition, if these transaction costs were included, your costs would have been higher.
| | | | | | |
| | | BEGINNING ACCOUNT VALUE 11/1/11 | | ENDING ACCOUNT VALUE 4/30/12 | | EXPENSES PAID DURING PERIOD* 11/1/11-4/30/12 |
Actual | | $1,000.00 | | $1,073.70 | | $5.41 |
Hypothetical (5% return before expenses) | | $1,000.00 | | $1,019.64 | | $5.27 |
*Expenses are equal to the Series’ annualized expense ratio (for the six-month period) of 1.05%, multiplied by the average account value over the period, multiplied by 182/366 (to reflect the one-half year period). Expenses are based on the most recent fiscal half year. The Series’ total return would have been lower had certain expenses not been waived during the period.
1
Equity Series
Portfolio Composition as of April 30, 2012
(unaudited)
2
Equity Series
Investment Portfolio - April 30, 2012
(unaudited)
| | | | | | | | | | |
| | | SHARES | | | VALUE (NOTE 2) | | | |
| | | |
COMMON STOCKS - 98.5% | | | | | | | | | | |
| | | |
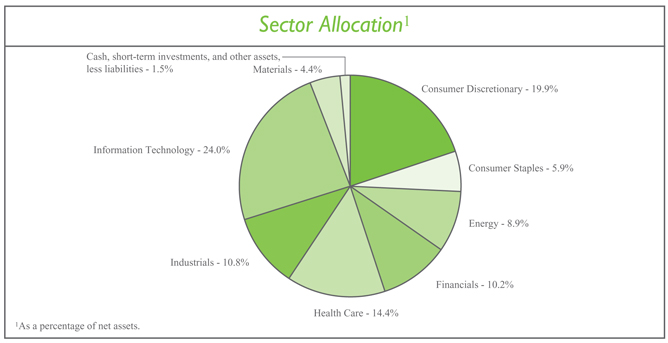
Consumer Discretionary - 19.9% | | | | | | | | | | |
Hotels, Restaurants & Leisure - 2.4% | | | | | | | | | | |
Carnival Corp. | | | 1,462,900 | | | $ | 47,529,621 | | | |
| | | | | | | | | | |
Household Durables - 1.2% | | | | | | | | | | |
DR Horton, Inc. | | | 360,930 | | | | 5,901,205 | | | |
Lennar Corp. - Class A | | | 232,170 | | | | 6,440,396 | | | |
NVR, Inc.* | | | 6,340 | | | | 4,970,179 | | | |
Toll Brothers, Inc.* | | | 218,490 | | | | 5,549,646 | | | |
| | | | | �� | | | | | |
| | | | | | | 22,861,426 | | | |
| | | | | | | | | | |
Internet & Catalog Retail - 3.0% | | | | | | | | | | |
Amazon.com, Inc.* | | | 232,080 | | | | 53,819,352 | | | |
HomeAway, Inc.* | | | 165,998 | | | | 4,324,248 | | | |
| | | | | | | | | | |
| | | | | | | 58,143,600 | | | |
| | | | | | | | | | |
| | | |
Media - 12.2% | | | | | | | | | | |
AMC Networks, Inc. - Class A* | | | 706,430 | | | | 30,023,275 | | | |
DIRECTV - Class A* | | | 901,530 | | | | 44,418,383 | | | |
Discovery Communications, Inc. - Class A* | | | 617,630 | | | | 33,611,424 | | | |
News Corp. - Class A | | | 1,530,180 | | | | 29,991,528 | | | |
Time Warner, Inc. | | | 1,265,700 | | | | 47,413,122 | | | |
The Walt Disney Co. | | | 781,590 | | | | 33,694,345 | | | |
The Washington Post Co. - Class B | | | 50,670 | | | | 19,161,874 | | | |
| | | | | | | | | | |
| | | | | | | 238,313,951 | | | |
| | | | | | | | | | |
Specialty Retail - 1.1% | | | | | | | | | | |
Dick’s Sporting Goods, Inc. | | | 423,690 | | | | 21,438,714 | | | |
| | | | | | | | | | |
Total Consumer Discretionary | | | | | | | 388,287,312 | | | |
| | | | | | | | | | |
Consumer Staples - 5.9% | | | | | | | | | | |
Beverages - 1.7% | | | | | | | | | | |
The Coca-Cola Co. | | | 440,820 | | | | 33,643,382 | | | |
| | | | | | | | | | |
Food & Staples Retailing - 1.6% | | | | | | | | | | |
The Kroger Co. | | | 1,309,500 | | | | 30,472,065 | | | |
| | | | | | | | | | |
Food Products - 2.6% | | | | | | | | | | |
H.J. Heinz Co. | | | 356,410 | | | | 19,000,217 | | | |
Kraft Foods, Inc. - Class A | | | 814,600 | | | | 32,478,102 | | | |
| | | | | | | | | | |
| | | | | | | 51,478,319 | | | |
| | | | | | | | | | |
Total Consumer Staples | | | | | | | 115,593,766 | | | |
| | | | | | | | | | |
Energy - 8.9% | | | | | | | | | | |
Energy Equipment & Services - 5.6% | | | | | | | | | | |
Baker Hughes, Inc. | | | 1,440,130 | | | | 63,524,134 | | | |
Cameron International Corp.* | | | 380,000 | | | | 19,475,000 | | | |
The accompanying notes are an integral part of the financial statements.
3
Equity Series
Investment Portfolio - April 30, 2012
(unaudited)
| | | | | | | | | | |
| | | SHARES | | | VALUE (NOTE 2) | | | |
| | | |
COMMON STOCKS (continued) | | | | | | | | | | |
| | | |
Energy (continued) | | | | | | | | | | |
Energy Equipment & Services (continued) | | | | | | | | | | |
Weatherford International Ltd. - ADR (Switzerland)* | | | 1,771,170 | | | $ | 25,274,596 | | | |
| | | | | | | | | | |
| | | | | | | 108,273,730 | | | |
| | | | | | | | | | |
Oil, Gas & Consumable Fuels - 3.3% | | | | | | | | | | |
Apache Corp. | | | 95,450 | | | | 9,157,473 | | | |
EOG Resources, Inc. | | | 92,450 | | | | 10,151,935 | | | |
Hess Corp. | | | 868,440 | | | | 45,280,462 | | | |
| | | | | | | | | | |
| | | | | | | 64,589,870 | | | |
| | | | | | | | | | |
Total Energy | | | | | | | 172,863,600 | | | |
| | | | | | | | | | |
Financials - 10.2% | | | | | | | | | | |
Capital Markets - 1.5% | | | | | | | | | | |
The Charles Schwab Corp. | | | 2,052,320 | | | | 29,348,176 | | | |
| | | | | | | | | | |
Consumer Finance - 2.7% | | | | | | | | | | |
American Express Co. | | | 350,620 | | | | 21,110,830 | | | |
Discover Financial Services | | | 915,810 | | | | 31,045,959 | | | |
| | | | | | | | | | |
| | | | | | | 52,156,789 | | | |
| | | | | | | | | | |
Diversified Financial Services - 4.3% | | | | | | | | | | |
CME Group, Inc. | | | 151,250 | | | | 40,205,275 | | | |
Moody’s Corp. | | | 1,045,190 | | | | 42,800,531 | | | |
| | | | | | | | | | |
| | | | | | | 83,005,806 | | | |
| | | | | | | | | | |
Real Estate Investment Trusts (REITS) - 1.7% | | | | | | | | | | |
Alexandria Real Estate Equities, Inc. | | | 87,980 | | | | 6,591,462 | | | |
BioMed Realty Trust, Inc. | | | 324,280 | | | | 6,427,230 | | | |
Corporate Office Properties Trust | | | 265,350 | | | | 6,248,993 | | | |
Digital Realty Trust, Inc. | | | 90,730 | | | | 6,812,916 | | | |
DuPont Fabros Technology, Inc. | | | 282,850 | | | | 7,679,377 | | | |
| | | | | | | | | | |
| | | | | | | 33,759,978 | | | |
| | | | | | | | | | |
Total Financials | | | | | | | 198,270,749 | | | |
| | | | | | | | | | |
Health Care - 14.4% | | | | | | | | | | |
Biotechnology - 1.1% | | | | | | | | | | |
Myriad Genetics, Inc.* | | | 845,040 | | | | 21,979,490 | | | |
| | | | | | | | | | |
Health Care Equipment & Supplies - 7.5% | | | | | | | | | | |
Alere, Inc.* | | | 2,265,210 | | | | 54,115,867 | | | |
Becton, Dickinson and Co. | | | 656,130 | | | | 51,473,399 | | | |
Boston Scientific Corp.* | | | 3,251,270 | | | | 20,352,950 | | | |
Volcano Corp.* | | | 773,520 | | | | 21,001,068 | | | |
| | | | | | | | | | |
| | | | | | | 146,943,284 | | | |
| | | | | | | | | | |
Health Care Technology - 5.0% | | | | | | | | | | |
Allscripts Healthcare Solutions, Inc.* | | | 1,795,520 | | | | 19,894,362 | | | |
The accompanying notes are an integral part of the financial statements.
4
Equity Series
Investment Portfolio - April 30, 2012
(unaudited)
| | | | | | | | | | |
| | | SHARES | | | VALUE (NOTE 2) | | | |
| | | |
COMMON STOCKS (continued) | | | | | | | | | | |
| | | |
Health Care (continued) | | | | | | | | | | |
Health Care Technology (continued) | | | | | | | | | | |
Cerner Corp.* | | | 837,110 | | | $ | 67,881,250 | | | |
Quality Systems, Inc. | | | 250,480 | | | | 9,367,952 | | | |
| | | | | | | | | | |
| | | | | | | 97,143,564 | | | |
| | | | | | | | | | |
Life Sciences Tools & Services - 0.8% | | | | | | | | | | |
Waters Corp.* | | | 186,180 | | | | 15,659,600 | | | |
| | | | | | | | | | |
Total Health Care | | | | | | | 281,725,938 | | | |
| | | | | | | | | | |
Industrials - 10.8% | | | | | | | | | | |
Air Freight & Logistics - 2.1% | | | | | | | | | | |
FedEx Corp. | | | 233,070 | | | | 20,566,097 | | | |
United Parcel Service, Inc. - Class B | | | 257,600 | | | | 20,128,864 | | | |
| | | | | | | | | | |
| | | | | | | 40,694,961 | | | |
| | | | | | | | | | |
Airlines - 3.7% | | | | | | | | | | |
Southwest Airlines Co. | | | 4,430,210 | | | | 36,682,139 | | | |
United Continental Holdings, Inc.* | | | 843,150 | | | | 18,481,848 | | | |
US Airways Group, Inc.* | | | 1,687,900 | | | | 17,317,854 | | | |
| | | | | | | | | | |
| | | | | | | 72,481,841 | | | |
| | | | | | | | | | |
Construction & Engineering - 1.3% | | | | | | | | | | |
Quanta Services, Inc.* | | | 1,170,400 | | | | 25,889,248 | | | |
| | | | | | | | | | |
Electrical Equipment - 0.8% | | | | | | | | | | |
Cooper Industries plc (Ireland) | | | 246,430 | | | | 15,419,125 | | | |
| | | | | | | | | | |
Machinery - 1.8% | | | | | | | | | | |
Flowserve Corp. | | | 218,460 | | | | 25,107,608 | | | |
Pall Corp. | | | 167,940 | | | | 10,010,903 | | | |
| | | | | | | | | | |
| | | | | | | 35,118,511 | | | |
| | | | | | | | | | |
Road & Rail - 1.1% | | | | | | | | | | |
Norfolk Southern Corp. | | | 288,180 | | | | 21,016,967 | | | |
| | | | | | | | | | |
Total Industrials | | | | | | | 210,620,653 | | | |
| | | | | | | | | | |
Information Technology - 24.0% | | | | | | | | | | |
Communications Equipment - 6.4% | | | | | | | | | | |
Cisco Systems, Inc. | | | 1,604,880 | | | | 32,338,332 | | | |
Juniper Networks, Inc.* | | | 1,762,990 | | | | 37,780,876 | | | |
Qualcomm, Inc. | | | 268,550 | | | | 17,144,232 | | | |
Riverbed Technology, Inc.* | | | 1,866,570 | | | | 36,827,426 | | | |
| | | | | | | | | | |
| | | | | | | 124,090,866 | | | |
| | | | | | | | | | |
Computers & Peripherals - 3.5% | | | | | | | | | | |
EMC Corp.* | | | 2,399,990 | | | | 67,703,718 | | | |
| | | | | | | | | | |
Electronic Equipment, Instruments & Components - 2.5% | | | | | | | | | | |
Amphenol Corp. - Class A | | | 180,160 | | | | 10,474,502 | | | |
The accompanying notes are an integral part of the financial statements.
5
Equity Series
Investment Portfolio - April 30, 2012
(unaudited)
| | | | | | | | | | |
| | | SHARES | | | VALUE (NOTE 2) | | | |
| | | |
COMMON STOCKS (continued) | | | | | | | | | | |
| | | |
Information Technology (continued) | | | | | | | | | | |
Electronic Equipment, Instruments & Components (continued) | | | | | | | | | | |
Corning, Inc. | | | 2,669,880 | | | $ | 38,312,778 | | | |
| | | | | | | | | | |
| | | | | | | 48,787,280 | | | |
| | | | | | | | | | |
Internet Software & Services - 4.5% | | | | | | | | | | |
Google, Inc. - Class A* | | | 146,140 | | | | 88,448,312 | | | |
| | | | | | | | | | |
IT Services - 3.5% | | | | | | | | | | |
MasterCard, Inc. - Class A | | | 77,290 | | | | 34,955,948 | | | |
Visa, Inc. - Class A | | | 272,500 | | | | 33,512,050 | | | |
| | | | | | | | | | |
| | | | | | | 68,467,998 | | | |
| | | | | | | | | | |
Software - 3.6% | | | | | | | | | | |
Autodesk, Inc.* | | | 799,170 | | | | 31,463,323 | | | |
Electronic Arts, Inc.* | | | 2,561,400 | | | | 39,394,332 | | | |
| | | | | | | | | | |
| | | | | | | 70,857,655 | | | |
| | | | | | | | | | |
Total Information Technology | | | | | | | 468,355,829 | | | |
| | | | | | | | | | |
Materials - 4.4% | | | | | | | | | | |
Chemicals - 3.2% | | | | | | | | | | |
Monsanto Co. | | | 820,490 | | | | 62,504,928 | | | |
| | | | | | | | | | |
Metals & Mining - 1.2% | | | | | | | | | | |
Alcoa, Inc. | | | 2,435,470 | | | | 23,697,123 | | | |
| | | | | | | | | | |
Total Materials | | | | | | | 86,202,051 | | | |
| | | | | | | | | | |
TOTAL COMMON STOCKS
(Identified Cost $1,773,825,923) | | | | | | | 1,921,919,898 | | | |
| | | | | | | | | | |
| | | |
SHORT-TERM INVESTMENTS - 0.6% | | | | | | | | | | |
| | | |
Dreyfus Cash Management, Inc. - Institutional Shares1 , 0.06% (Identified Cost $11,745,046) | | | 11,745,046 | | | | 11,745,046 | | | |
| | | | | | | | | | |
TOTAL INVESTMENTS - 99.1%
(Identified Cost $1,785,570,969) | | | | | | | 1,933,664,944 | | | |
OTHER ASSETS, LESS LIABILITIES - 0.9% | | | | | | | 17,487,779 | | | |
| | | | | | | | | | |
NET ASSETS - 100% | | | | | | $ | 1,951,152,723 | | | |
| | | | | | | | | | |
ADR - American Depository Receipt
*Non-income producing security
1 Rate shown is the current yield as of April 30, 2012.
The accompanying notes are an integral part of the financial statements.
6
Equity Series
Statement of Assets and Liabilities
April 30, 2012 (unaudited)
| | | | |
ASSETS: | | | | |
| |
Investments, at value (identified cost $1,785,570,969) (Note 2) | | $ | 1,933,664,944 | |
Receivable for securities sold | | | 35,419,917 | |
Receivable for fund shares sold | | | 2,317,261 | |
Dividends receivable | | | 232,472 | |
| | | | |
| |
TOTAL ASSETS | | | 1,971,634,594 | |
| | | | |
| |
LIABILITIES: | | | | |
| |
Accrued management fees (Note 3) | | | 1,572,858 | |
Accrued transfer agent fees (Note 3) | | | 79,245 | |
Accrued fund accounting and administration fees (Note 3) | | | 66,762 | |
Accrued directors’ fees (Note 3) | | | 6,908 | |
Accrued Chief Compliance Officer service fees (Note 3) | | | 415 | |
Payable for securities purchased | | | 11,003,513 | |
Payable for fund shares repurchased | | | 7,709,865 | |
Other payables and accrued expenses | | | 42,305 | |
| | | | |
| |
TOTAL LIABILITIES | | | 20,481,871 | |
| | | | |
| |
TOTAL NET ASSETS | | $ | 1,951,152,723 | |
| | | | |
| |
NET ASSETS CONSIST OF: | | | | |
| |
Capital stock | | $ | 1,025,311 | |
Additional paid-in-capital | | | 1,731,519,806 | |
Distributions in excess of net investment income | | | (1,148,655 | ) |
Accumulated net realized gain on investments | | | 71,662,286 | |
Net unrealized appreciation on investments | | | 148,093,975 | |
| | | | |
| |
TOTAL NET ASSETS | | $ | 1,951,152,723 | |
| | | | |
| |
NET ASSET VALUE, OFFERING PRICE AND REDEMPTION PRICE PER SHARE - Class A ($1,951,152,723/102,531,085 shares) | | $ | 19.03 | |
| | | | |
The accompanying notes are an integral part of the financial statements.
7
Equity Series
Statement of Operations
For the Six Months Ended April 30, 2012 (unaudited)
| | | | |
INVESTMENT INCOME: | | | | |
| |
Dividends | | $ | 11,777,962 | |
| | | | |
| |
EXPENSES: | | | | |
| |
Management fees (Note 3) | | | 9,826,833 | |
Transfer agent fees (Note 3) | | | 355,223 | |
Fund accounting and administration fees (Note 3) | | | 134,010 | |
Directors’ fees (Note 3) | | | 25,631 | |
Chief Compliance Officer service fees (Note 3) | | | 1,246 | |
Custodian fees | | | 54,883 | |
Miscellaneous | | | 124,952 | |
| | | | |
| |
Total Expenses | | | 10,522,778 | |
Less reduction of expenses (Note 3) | | | (203,853 | ) |
| | | | |
| |
Net Expenses | | | 10,318,925 | |
| | | | |
| |
NET INVESTMENT INCOME | | | 1,459,037 | |
| | | | |
| |
REALIZED AND UNREALIZED GAIN (LOSS) ON INVESTMENTS: | | | | |
| |
Net realized gain (loss) on investments | | | 84,097,839 | |
Net change in unrealized appreciation (depreciation) on investments | | | 54,655,104 | |
| | | | |
| |
NET REALIZED AND UNREALIZED GAIN (LOSS) ON INVESTMENTS | | | 138,752,943 | |
| | | | |
| |
NET INCREASE IN NET ASSETS RESULTING FROM OPERATIONS | | $ | 140,211,980 | |
| | | | |
The accompanying notes are an integral part of the financial statements.
8
Equity Series
Statements of Changes in Net Assets
| | | | | | | | |
| | | FOR THE SIX
MONTHS ENDED
4/30/12
(UNAUDITED) | | | FOR THE YEAR ENDED
10/31/11 | |
INCREASE (DECREASE) IN NET ASSETS: | | | | | | | | |
| | |
OPERATIONS: | | | | | | | | |
| | |
Net investment income | | $ | 1,459,037 | | | $ | 4,545,974 | |
Net realized gain (loss) on investments | | | 84,097,839 | | | | 87,039,146 | |
Net change in unrealized appreciation (depreciation) on investments | | | 54,655,104 | | | | (77,567,801 | ) |
| | | | | | | | |
| | |
Net increase (decrease) from operations | | | 140,211,980 | | | | 14,017,319 | |
| | | | | | | | |
| | |
DISTRIBUTIONS TO SHAREHOLDERS (Note 8): | | | | | | | | |
| | |
From net investment income | | | (4,425,681 | ) | | | (4,615,453 | ) |
From net realized gain on investments | | | (70,677,622 | ) | | | — | |
| | | | | | | | |
| | |
Total distributions to shareholders | | | (75,103,303 | ) | | | (4,615,453 | ) |
| | | | | | | | |
| | |
CAPITAL STOCK ISSUED AND REPURCHASED: | | | | | | | | |
| | |
Net increase (decrease) from capital share transactions (Note 5) | | | (38,994,439 | ) | | | 336,313,975 | |
| | | | | | | | |
| | |
Net increase in net assets | | | 26,114,238 | | | | 345,715,841 | |
| | |
NET ASSETS: | | | | | | | | |
| | |
Beginning of period | | | 1,925,038,485 | | | | 1,579,322,644 | |
| | | | | | | | |
| | |
End of period (including distributions in excess of net investment income of $1,148,655 and undistributed net investment income of $1,817,989, respectively) | | $ | 1,951,152,723 | | | $ | 1,925,038,485 | |
| | | | | | | | |
The accompanying notes are an integral part of the financial statements.
9
Equity Series
Financial Highlights
| | | | | | | | | | | | | | | | | | | | | | | | |
| | | FOR THE SIX MONTHS ENDED | | | FOR THE YEARS ENDED | |
| | | 4/30/12
(UNAUDITED) | | | 10/31/11 | | | 10/31/10 | | | 10/31/09 | | | 10/31/08 | | | 10/31/07 | |
Per share data (for a share outstanding throughout each period): | | | | | | | | | | | | | | | | | | | | | | | | |
Net asset value - Beginning of period | | $ | 18.45 | | | $ | 17.91 | | | $ | 15.55 | | | $ | 13.34 | | | $ | 21.43 | | | $ | 19.19 | |
| | | | | | | | | | | | | | | | | | | | | | | | |
Income (loss) from investment operations: | | | | | | | | | | | | | | | | | | | | | | | | |
Net investment income | | | 0.01 | 1 | | | 0.04 | 1 | | | 0.03 | 1 | | | 0.04 | 1 | | | 0.07 | | | | 0.06 | |
Net realized and unrealized gain (loss) on investments | | | 1.26 | | | | 0.55 | | | | 2.35 | | | | 2.24 | | | | (7.35 | ) | | | 2.65 | |
| | | | | | | | | | | | | | | | | | | | | | | | |
| | | | | | |
Total from investment operations | | | 1.27 | | | | 0.59 | | | | 2.38 | | | | 2.28 | | | | (7.28 | ) | | | 2.71 | |
| | | | | | | | | | | | | | | | | | | | | | | | |
| | | | | | |
Less distributions to shareholders: | | | | | | | | | | | | | | | | | | | | | | | | |
From net investment income | | | (0.04 | ) | | | (0.05 | ) | | | (0.02 | ) | | | (0.07 | ) | | | (0.07 | ) | | | (0.05 | ) |
From net realized gain on investments | | | (0.65 | ) | | | — | | | | — | | | | — | | | | (0.74 | ) | | | (0.42 | ) |
| | | | | | | | | | | | | | | | | | | | | | | | |
| | | | | | |
Total distributions to shareholders | | | (0.69 | ) | | | (0.05 | ) | | | (0.02 | ) | | | (0.07 | ) | | | (0.81 | ) | | | (0.47 | ) |
| | | | | | | | | | | | | | | | | | | | | | | | |
| | | | | | |
Net asset value - End of period | | $ | 19.03 | | | $ | 18.45 | | | $ | 17.91 | | | $ | 15.55 | | | $ | 13.34 | | | $ | 21.43 | |
| | | | | | | | | | | | | | | | | | | | | | | | |
| | | | | | |
Net assets - End of period (000’s omitted) | | $ | 1,951,153 | | | $ | 1,925,038 | | | $ | 1,579,323 | | | $ | 1,003,043 | | | $ | 501,583 | | | $ | 191,026 | |
| | | | | | | | | | | | | | | | | | | | | | | | |
| | | | | | |
Total return2 | | | 7.37 | % | | | 3.30 | % | | | 15.29 | % | | | 17.23 | % | | | (35.09 | %) | | | 14.37 | % |
Ratios (to average net assets)/ Supplemental Data: | | | | | | | | | | | | | | | | | | | | | | | | |
Expenses* | | | 1.05 | %3 | | | 1.05 | % | | | 1.05 | % | | | 1.05 | % | | | 1.05 | % | | | 1.05 | % |
Net investment income | | | 0.15 | %3 | | | 0.24 | % | | | 0.17 | % | | | 0.26 | % | | | 0.56 | % | | | 0.45 | % |
Portfolio turnover | | | 31 | % | | | 54 | % | | | 56 | % | | | 50 | % | | | 63 | % | | | 44 | % |
|
| *For certain periods presented, the investment advisor did not impose all or a portion of its management fees and/or other fees. If these expenses had been incurred by the Series, the expense ratio (to average net assets) would have increased by the following amount: | |
| | | | | | |
| | | 0.02 | %3 | | | 0.02 | % | | | 0.02 | % | | | 0.06 | % | | | 0.06 | % | | | 0.11 | % |
1Calculated based on average shares outstanding during the periods.
2Represents aggregate total return for the periods indicated, and assumes reinvestment of all distributions. Total return would have been lower had certain expenses not been waived or reimbursed during the periods. Periods less than one year are not annualized.
3Annualized.
The accompanying notes are an integral part of the financial statements.
10
Equity Series
Notes to Financial Statements
(unaudited)
Equity Series (the “Series”) is a no-load diversified series of Manning & Napier Fund, Inc. (the “Fund”). The Fund is organized in Maryland and is registered under the Investment Company Act of 1940, as amended, as an open-end management investment company.
The Series’ investment objective is to provide long-term growth of capital, primarily through investments in U.S. common stocks.
The Fund’s Advisor is Manning & Napier Advisors, LLC (the “Advisor”). Shares of the Series are offered to investors, clients and employees of the Advisor and its affiliates. The total authorized capital stock of the Fund consists of 15 billion shares of common stock each having a par value of $0.01. As of April 30, 2012, 9.8 billion shares have been designated in total among 41 series, of which 200 million have been designated as Equity Series Class A common stock.
| 2. | Significant Accounting Policies |
Security Valuation
Portfolio securities, including domestic equities, listed on an exchange other than the NASDAQ National Market System are valued at the latest quoted sales price of the exchange on which the security is primarily traded. Securities not traded on valuation date or securities not listed on an exchange are valued at the latest quoted bid price provided by the Fund’s pricing service. Securities listed on the NASDAQ National Market System are valued in accordance with the NASDAQ Official Closing Price.
Short-term investments that mature in sixty days or less are valued at amortized cost, which approximates fair value. Investments in open-end investment companies are valued at their net asset value per share on valuation date.
Volume and level of activity in established markets for an asset or liability are evaluated to determine whether recent transactions and quoted prices are determinative of fair value. Where there have been significant decreases in volume and level of activity, further analysis and adjustment may be necessary to estimate fair value. The Series measures fair value in these instances by the use of inputs and valuation techniques which may be based upon current market prices of securities that are comparable in coupon, rating, maturity and industry and/or expectation of future cash flows. As a result of trading in relatively thin markets and/or markets that experience significant volatility, the prices used by the Series to value these securities may differ from the value that would be realized if these securities were sold, and the differences could be material.
Securities for which representative valuations or prices are not available from the Series’ pricing service may be valued at fair value as determined in good faith by the Advisor under procedures approved by and under the general supervision and responsibility of the Fund’s Board of Directors (the “Board”). Due to the inherent uncertainty of valuations of such securities, the fair value may differ significantly from the values that would have been used had a ready market for such securities existed. If trading or events occurring after the close of the principal market in which securities are traded are expected to materially affect the value of those securities, then they may be valued at their fair value, taking this trading or these events into account.
Various inputs are used in determining the value of the Series’ assets or liabilities carried at fair value. These inputs are summarized in three broad levels. Level 1 includes quoted prices in active markets for identical assets and liabilities. Level 2 includes other significant observable inputs (including quoted prices for similar securities, interest rates, prepayment speeds, credit risk, etc.). Level 3 includes significant unobservable inputs (including the Series’ own assumptions in determining the fair value of investments). A financial instrument’s level within the fair value hierarchy is based on the lowest level of any input both individually and in aggregate that is significant to the fair value measurement. The inputs or methodology used for valuing securities are not necessarily an indication of the risk associated with investing in those securities.
11
Equity Series
Notes to Financial Statements (continued)
(unaudited)
| 2. | Significant Accounting Policies (continued) |
Security Valuation (continued)
The following is a summary of the valuation levels used for major security types as of April 30, 2012 in valuing the Series’ assets or liabilities carried at fair value:
| | | | | | | | | | | | | | | | |
| DESCRIPTION | | TOTAL | | | LEVEL 1 | | | LEVEL 2 | | | LEVEL 3 | |
Assets: | | | | | | | | | | | | | | | | |
Equity Securities*: | | | | | | | | | | | | | | | | |
Consumer Discretionary | | $ | 388,287,312 | | | $ | 388,287,312 | | | $ | — | | | $ | — | |
Consumer Staples | | | 115,593,766 | | | | 115,593,766 | | | | — | | | | — | |
Energy | | | 172,863,600 | | | | 172,863,600 | | | | — | | | | — | |
Financials | | | 198,270,749 | | | | 198,270,749 | | | | — | | | | — | |
Health Care | | | 281,725,938 | | | | 281,725,938 | | | | — | | | | — | |
Industrials | | | 210,620,653 | | | | 210,620,653 | | | | — | | | | — | |
Information Technology | | | 468,355,829 | | | | 468,355,829 | | | | — | | | | — | |
Materials | | | 86,202,051 | | | | 86,202,051 | | | | — | | | | — | |
Mutual Funds | | | 11,745,046 | | | | 11,745,046 | | | | — | | | | — | |
| | | | | | | | | | | | | | | | |
Total assets | | $ | 1,933,664,944 | | | $ | 1,933,664,944 | | | $ | — | | | $ | — | |
| | | | | | | | | | | | | | | | |
*Includes common stock, warrants and rights.
There were no Level 2 or Level 3 securities held by the Series as of October 31, 2011 or April 30, 2012.
The Fund’s policy is to recognize transfers in and transfers out of the valuation levels as of the beginning of the reporting period. There were no transfers between Level 1 and Level 2 during the six months ended April 30, 2012.
Recent Accounting Standard
In May 2011, the Financial Accounting Standards Board (“FASB”) issued Accounting Standards Update No. 2011-04, “Fair Value Measurements (Topic 820) - Amendments to Achieve Common Fair Value Measurement and Disclosure Requirements in U.S. GAAP and IFRSs” (“ASU 2011-04”). ASU 2011-04 clarifies the application of existing fair value measurement requirements, changes certain principles related to measuring fair value, and requires additional disclosures about fair value measurements.
Required disclosures are expanded under the new guidance, especially for fair value measurements that are categorized within Level 3 of the fair value hierarchy, for which quantitative information about the unobservable inputs used, and a narrative description of the valuation processes in place and sensitivity of recurring Level 3 measurements to changes in unobservable inputs will be required.
ASU 2011-04 is effective for interim and annual periods beginning after December 15, 2011 and is to be applied prospectively. Management is currently assessing the impact of this guidance, but does not expect it to have a material impact on the Series’ financial statements.
Security Transactions, Investment Income and Expenses
Security transactions are accounted for on trade date. Dividend income is recorded on the ex-dividend date, except that if the ex-dividend date has passed, certain dividends from foreign securities are recorded as soon as the Series is informed of the ex-dividend date. Non-cash dividends, if any, are recorded at the fair value of the securities received. Interest income, including amortization of premium and accretion of discounts using the effective interest method, is earned from settlement date and accrued daily.
Expenses are recorded on an accrual basis. Most expenses of the Fund can be attributed to a specific series. Expenses which cannot be directly attributed are apportioned among the series in the Fund in such a manner as deemed equitable by the Fund’s Board, taking into consideration, among other things, the nature and type of expense.
12
Equity Series
Notes to Financial Statements (continued)
(unaudited)
| 2. | Significant Accounting Policies (continued) |
Security Transactions, Investment Income and Expenses (continued)
The Series uses the identified cost method for determining realized gain or loss on investments for both financial statement and federal income tax reporting purposes.
Federal Taxes
The Series’ policy is to comply with the provisions of the Internal Revenue Code applicable to regulated investment companies. The Series is not subject to federal income tax or excise tax to the extent that the Series distributes to shareholders each year its taxable income, including any net realized gains on investments, in accordance with requirements of the Internal Revenue Code. Accordingly, no provision for federal income tax or excise tax has been made in the financial statements.
Management evaluates its tax positions to determine if the tax positions taken meet the minimum recognition threshold in connection with accounting for uncertainties in income tax positions taken or expected to be taken for the purposes of measuring and recognizing tax liabilities in the financial statements. Recognition of tax benefits of an uncertain tax position is required only when the position is “more likely than not” to be sustained assuming examination by taxing authorities. At April 30, 2012, the Series has recorded no liability for net unrecognized tax benefits relating to uncertain income tax positions taken or expected to be taken in future tax returns.
The Series files income tax returns in the U.S. federal jurisdiction, various states and foreign jurisdictions, as required. No income tax returns are currently under investigation. The statute of limitations on the Series’ tax returns remains open for the years ended October 31, 2008 through October 31, 2011. The Series is not aware of any tax positions for which it is reasonably possible that the total amounts of unrecognized tax benefits will significantly change in the next twelve months.
Foreign Taxes
Based on the Series’ understanding of the tax rules and rates related to income, gains and currency purchase/repatriation transactions for foreign jurisdictions in which it invests, the Series will provide for foreign taxes, and where appropriate, deferred foreign tax.
Distributions of Income and Gains
Distributions to shareholders of net investment income and net realized gains are made annually. An additional distribution may be necessary to avoid taxation of the Series. Distributions are recorded on the ex-dividend date.
Indemnifications
The Fund’s organizational documents provide former and current directors and officers with a limited indemnification against liabilities arising in connection with the performance of their duties to the Fund. In the normal course of business, the Fund may also enter into contracts that provide general indemnifications. The Fund’s maximum exposure under these arrangements is unknown as this would be dependent on future claims that may be made against the Fund. The risk of material loss from such claims is considered remote.
Other
The preparation of financial statements in conformity with accounting principles generally accepted in the United States of America requires management to make estimates and assumptions that affect the reported amounts of assets and liabilities and the disclosure of contingent assets and liabilities at the date of the financial statements and the reported amounts of income and expenses during the reporting period. Actual results could differ from those estimates.
| 3. | Transactions with Affiliates |
The Fund has an Investment Advisory Agreement (the “Agreement”) with the Advisor, for which the Series pays a fee, computed daily and payable monthly, at an annual rate of 1.00% of the Series’ average daily net assets.
Under the Agreement, personnel of the Advisor provide the Series with advice and assistance in the choice of investments and the execution of securities transactions, and otherwise maintain the Series’ organization. The Advisor also provides the Fund with necessary office space and fund administration and support services. The salaries of all officers of the Fund (except a
13
Equity Series
Notes to Financial Statements (continued)
(unaudited)
| 3. | Transactions with Affiliates (continued) |
percentage of the Fund’s Chief Compliance Officer’s salary, which is paid by the Fund), and of all Directors who are “affiliated persons” of the Fund, or of the Advisor, and all personnel of the Fund, or of the Advisor, performing services relating to research, statistical and investment activities, are paid by the Advisor. Each “non-affiliated” Director receives an annual stipend, which is allocated among all the active series of the Fund. In addition, these Directors also receive a fee per Board meeting attended plus a fee for each committee meeting attended.
The Advisor has contractually agreed, until at least February 28, 2013, to waive its fee and, if necessary, pay other operating expenses of the Series in order to maintain total direct annual fund operating expenses for the Series at no more than 1.05% of average daily net assets each year. Accordingly, the Advisor waived fees of $203,853 for the six months ended April 30, 2012, which is included as a reduction of expenses on the Statement of Operations. The Advisor is not eligible to recoup any expenses that have been waived or reimbursed in prior years.
Manning & Napier Investor Services, Inc., a registered broker-dealer affiliate of the Advisor, acts as distributor for the Fund’s shares. The services of Manning & Napier Investor Services, Inc. are provided at no additional cost to the Series.
The Advisor has agreements with BNY Mellon Investment Servicing (U.S.) Inc. (“BNY”) under which BNY serves as sub-accountant services agent and sub-transfer agent. The Fund pays the Advisor an annual fee related to fund accounting and administration of 0.0175% on the first $3 billion of average daily net assets (excluding Target Series); 0.015% on the next $3 billion of average daily net assets (excluding Target Series); and 0.01% of the average daily net assets in excess of $6 billion (excluding Target Series); plus a base fee of $25,500 per series. Transfer Agent fees are charged to the Fund on a per account basis. Additionally, certain transaction and cusip-based fees and out-of-pocket expenses, including charges for reporting relating to the Fund’s compliance program, are charged.
Expenses not directly attributable to a series are allocated based on each series’ relative net assets or number of accounts, depending on the expense.
| 4. | Purchases and Sales of Securities |
For the six months ended April 30, 2012, purchases and sales of securities, other than U.S. Government securities and short-term securities, were $588,422,694 and $622,821,555, respectively. There were no purchases or sales of U.S. Government securities.
| 5. | Capital Stock Transactions |
Transactions in shares of Equity Series were:
| | | | | | | | | | | | | | | | |
| | | FOR THE SIX MONTHS ENDED 4/30/12 | | | FOR THE YEAR ENDED 10/31/11 | |
| | | SHARES | | | AMOUNT | | | SHARES | | | AMOUNT | |
Sold | | | 17,103,528 | | | $ | 315,767,472 | | | | 47,769,996 | | | $ | 922,192,040 | |
Reinvested | | | 2,205,706 | | | | 37,144,091 | | | | 106,294 | | | | 2,006,821 | |
Repurchased | | | (21,111,175 | ) | | | (391,906,002 | ) | | | (31,743,999 | ) | | | (587,884,886 | ) |
| | | | | | | | | | | | | | | | |
Total | | | (1,801,941 | ) | | $ | (38,994,439 | ) | | | 16,132,291 | | | $ | 336,313,975 | |
| | | | | | | | | | | | | | | | |
At April 30, 2012, the retirement plan of the Advisor and its affiliates owned 221,025 shares of the Series (0.2% of shares outstanding) valued at $4,206,101.
The Series may trade in instruments including written and purchased options, forward foreign currency exchange contracts and futures contracts and other derivatives in the normal course of investing activities to assist in managing exposure to various
14
Equity Series
Notes to Financial Statements (continued)
(unaudited)
| 6. | Financial Instruments (continued) |
market risks. The Series may be subject to various elements of risk, which may involve, to a varying degree, elements of risk in excess of the amounts recognized for financial statement purposes. These risks include: the risk that changes in the value of a derivative may not correlate perfectly with the underlying asset, rate or index, counterparty credit risk related to over the counter derivative counterparties’ failure to perform under contract terms, liquidity risk related to the lack of a liquid market for these contracts allowing the fund to close out its position(s) and documentation risk relating to disagreement over contract terms. No such investments were held by the Series as of April 30, 2012.
Investing in securities of foreign companies and foreign governments involves special risks and considerations not typically associated with investing in securities of domestic companies and the U.S. Government. These risks include revaluation of currencies and future adverse political and economic developments. Moreover, securities of foreign companies and foreign governments and their markets may be less liquid and their prices more volatile than those of comparable domestic companies and the U.S. Government.
| 8. | Federal Income Tax Information |
The amount and characterization of certain income and capital gains to be distributed are determined in accordance with federal income tax regulations, which may differ from accounting principles generally accepted in the United States of America. The Series may periodically make reclassifications among its capital accounts to reflect income and gains available for distribution (or available capital loss carryovers) under income tax regulations, without impacting the Series’ net asset value. Any such reclassifications are not reflected in the financial highlights.
The final determination of the tax character of current year distributions will be made at the conclusion of the fiscal year. The tax character of distributions paid for the year ended October 31, 2011, were as follows:
Ordinary income $ 4,615,453
The Regulated Investment Company Modernization Act of 2010 (the “Act”) was enacted on December 22, 2010. The Act made changes to several tax rules including the unlimited carryover of future capital losses, which will retain their character as short-term and/or long-term losses. Prior to the Act, net capital losses incurred by the Series were carried forward for eight years and treated as short-term losses. The Act requires that post-enactment net capital losses be used before pre-enactment net capital losses.
At April 30, 2012, the identified cost of investments for federal income tax purposes, the resulting gross unrealized appreciation and depreciation, and the net unrealized appreciation were as follows:
| | | | |
Cost for federal income tax purposes | | $ | 1,792,180,924 | |
Unrealized appreciation | | | 242,593,049 | |
Unrealized depreciation | | | (101,109,029 | ) |
| | | | |
Net unrealized appreciation | | $ | 141,484,020 | |
| | | | |
15
Equity Series
Renewal of Investment Advisory Agreement
(unaudited)
At the Manning & Napier Fund, Inc. (the “Fund”) Board of Directors’ (the “Board”) meeting, held on November 18, 2011, the Investment Advisory Agreement (the “Agreement”) between the Fund and Manning & Napier Advisors, LLC (the “Advisor”) was reviewed by the Board for renewal. In connection with the decision whether to renew the Agreement, a variety of material was prepared for and reviewed by the Board.
Representatives of the Advisor attended the meeting and presented additional oral and written information to the Board to assist the Board in its considerations. The discussion immediately below outlines the materials and information presented to the Board in connection with the Board’s 2011 Annual Review of the Agreement and the conclusions made by the Directors when determining to continue the Agreement.
| | • | | The Board considered the services provided by the Advisor under the Agreement including, among others: deciding what securities to purchase and sell for each Series; arranging for the purchase and sale of such securities by placing orders with broker-dealers; administering the affairs of the Fund (including the books and records of the Fund not maintained by third party service providers such as the custodian or sub-transfer agent); arranging for the insurance coverage for the Fund; and supervising the preparation of tax returns, SEC filings (including registration statements) and reports to shareholders for the Fund. The Board also considered the nature and quality of such services provided under the Agreement in light of the Advisor’s services provided to the Fund for 25 years. The Board discussed the quality of these services with representatives from the Advisor and concluded that the Advisor was performing its services to the Fund required under the Agreement in a reasonable manner. |
| | • | | The Board considered the investment performance of the various Series of the Fund. The investment performance for each Series was reviewed on a cumulative basis since inception and on a one year basis. In addition, annualized performance for the following time periods was considered: inception, three year, five year, ten year, and current market cycle. A market cycle includes periods of both rising and falling markets. Returns for established benchmark indices for each Series were provided for each time period. The Board noted that the various Series were competitive against their respective benchmarks and/or peer groups over various time periods, but in particular over the full market cycle period relevant for the Series. In addition, the Board considered at the meeting (and considers on a quarterly basis) a peer group performance analysis consisting of Morningstar universes of mutual funds with similar investment objectives. The Board discussed the performance with representatives from the Advisor and concluded that the investment performance of each of the Fund’s Series was reasonable based on the Fund’s actual performance and comparative performance, especially performance over the current market cycle. |
| | • | | The Board considered the costs of the Advisor’s services and the profits of the Advisor as they relate to the Advisor’s services to the Fund under the Agreement. In reviewing the Advisor’s costs and profits, the Board discussed the Advisor’s revenues generated from the Fund (on both an actual and adjusted basis) and its expenses associated with providing the services under the Agreement. In addition, the Board reviewed the Advisor’s expenses associated with Fund activities outside of the Agreement (such as expense reimbursements pursuant to expense caps and payments made by the Advisor to third party platforms on which shares of the Fund are available for purchase). It was noted by representatives of the Advisor that 10 of the 29 active Series of the Fund are currently experiencing expenses above the capped expense ratios. After discussing the above costs and profits, the Board concluded that the Advisor’s profitability relating to its services provided under the Agreement was reasonable. |
| | • | | The Board considered the fees and expenses of the various Series of the Fund. The Advisor presented the advisory fees and total expenses for each Series, including the advisory fee adjusted for any expense waivers or reimbursements (either contractual or voluntary) paid by the Advisor. The advisory fees and expense ratios of each Series were compared to an average (on both a mean and median basis) of similar funds as disclosed on the Morningstar database. Representatives of the Advisor discussed with the Board the levels of its advisory fee for each Series of the Fund and as compared to the median and mean advisory fees for similar funds as listed on Morningstar. Expense ratios for every Series, except the Pro-Blend Class R and Class C, and Target Class R and Class C (and a few Class K), are currently below the median and mean for similar funds as listed on Morningstar. Based on their review of the information provided, the Board concluded that the fees and expenses of each Series of the Fund were reasonable on a comparative basis. |
16
Equity Series
Renewal of Investment Advisory Agreement
(unaudited)
| | • | | The Board also considered the other benefits the Advisor derives from its relationship with the Fund. Such other benefits include certain research products provided by soft dollars. Given the level of soft dollar transactions involving the Fund, the Board concluded that these additional benefits to the Advisor were reasonable. |
| | • | | In addition to the factors described above, the Board considered the Advisor’s personnel, investment strategies, policies and procedures relating to compliance with personal securities transactions, and reputation, expertise and resources in domestic and foreign financial markets. The Board concluded that these factors support the conclusion that the Advisor performs its services in a reasonable manner. |
| | • | | The Board did not consider economies of scale at this time because of the multiple uses of the Fund (for the Advisor’s discretionary investment account clients in addition to direct investors), the current profitability of the Advisor’s services to the Fund under the Agreement, and the overall size of the Fund complex. |
Based on the Board’s deliberations and their evaluation of the information described above, the Board, including a majority of Directors that are not “interested persons” as defined in the Investment Company Act of 1940, concluded that the compensation under the Agreement was fair and reasonable in light of the services and expenses and such other matters as the Directors considered to be relevant in the exercise of their reasonable judgment. Accordingly, the Board approved the renewal of the Agreement. In the course of their deliberations, the Directors did not identify any particular information that was all important or controlling.
17
Equity Series
Literature Requests
(unaudited)
Proxy Voting Policies and Procedures
A description of the policies and procedures that the Fund uses to determine how to vote proxies relating to portfolio securities is available, without charge, upon request:
| | | | |
| By phone | | 1-800-466-3863 | | |
| On the Securities and Exchange | | | | |
| Commission’s (SEC) web site | | http://www.sec.gov | | |
Proxy Voting Record
Information regarding how the Fund voted proxies relating to portfolio securities during the most recent 12-month period ended June 30th is available, without charge, upon request:
| | | | |
| By phone | | 1-800-466-3863 | | |
| On the SEC’s web site | | http://www.sec.gov | | |
Quarterly Portfolio Holdings
The Series’ complete schedule of portfolio holdings for the 1st and 3rd quarters of each fiscal year are provided on Form N-Q, and are available, without charge, upon request:
| | | | |
| By phone | | 1-800-466-3863 | | |
| On the SEC’s web site | | http://www.sec.gov | | |
The Series’ Form N-Q may be reviewed and copied at the SEC’s Public Reference Room in Washington, D.C. Information on the operation of the Public Reference Room may be obtained by calling 1-800-SEC-0330.
Prospectus and Statement of Additional Information (SAI)
The prospectus and SAI provide additional information about each Series, including charges, expenses and risks. These documents are available, without charge, upon request:
| | | | |
| By phone | | 1-800-466-3863 | | |
| On the SEC’s web site | | http://www.sec.gov | | |
| On our web site | | http://www.manning-napier.com | | |
Additional information available at www.manning-napier.com
1. Fund Holdings - Month-End
2. Fund Holdings - Quarter-End
3. Shareholder Report - Annual
4. Shareholder Report - Semi-Annual
The Fund also offers electronic notification or “e-delivery” when certain documents are available on-line to be downloaded or reviewed. Direct shareholders can elect to receive electronic notification when shareholder reports, prospectus updates, and/or statements are available. If you do not currently have on-line access to your account, you can establish access by going to www.manning-napier.com, click on “Login” in the top corner of the page, and follow the prompts to self-enroll. Once enrolled, you can set your electronic notification preferences by clicking on the Account Options tab located within the green toolbar and then select E-Delivery Option. Should you have any questions on either how to establish on-line access or how to update your account settings, please contact Investor Services at 1-800-466-3863.
MNEQY-04/12-SAR


| | | | | | |
| | | | TAX MANAGED SERIES | | |
www.manning-napier.com | | | |  |
Tax Managed Series
Shareholder Expense Example
(unaudited)
As a shareholder of the Series, you may incur two types of costs: (1) transaction costs, including potential wire charges on redemptions and (2) ongoing costs, including management fees and other Series expenses. This example is intended to help you understand your ongoing costs (in dollars) of investing in the Series and to compare these costs with the ongoing costs of investing in other mutual funds.
The example is based on an investment of $1,000 invested at the beginning of the period and held for the entire period (November 1, 2011 to April 30, 2012).
Actual Expenses
The first line of the table below provides information about actual account values and actual expenses. You may use the information in this line, together with the amount you invested, to estimate the expenses that you paid over the period. Simply divide your account value by $1,000 (for example, an $8,600 account value divided by $1,000 = 8.6), then multiply the result by the number in the first line under the heading entitled “Expenses Paid During Period” to estimate the expenses you paid on your account during this period.
Hypothetical Example for Comparison Purposes
The second line of the table below provides information about hypothetical account values and hypothetical expenses based on the Series’ actual expense ratio and an assumed rate of return of 5% per year before expenses, which is not the Series’ actual return. The hypothetical account values and expenses may not be used to estimate the actual ending account balance or expenses you paid during the period. You may use this information to compare the ongoing costs of investing in the Series and other funds. To do so, compare this 5% hypothetical example with the 5% hypothetical examples that appear in the shareholder reports of the other funds.
Please note that the expenses shown in the table are meant to highlight your ongoing costs only and do not reflect any transaction costs. Therefore, the second line of the table is useful in comparing ongoing costs only, and will not help you determine the relative total costs of owning different funds. In addition, if these transaction costs were included, your costs would have been higher.
| | | | | | |
| | | BEGINNING
ACCOUNT VALUE
11/1/11 | | ENDING
ACCOUNT VALUE
4/30/12 | | EXPENSES PAID
DURING PERIOD*
11/1/11-4/30/12 |
Actual | | $1,000.00 | | $1,077.00 | | $6.20 |
Hypothetical (5% return before expenses) | | $1,000.00 | | $1,018.90 | | $6.02 |
*Expenses are equal to the Series’ annualized expense ratio (for the six-month period) of 1.20%, multiplied by the average account value over the period, multiplied by 182/366 (to reflect the one-half year period). Expenses are based on the most recent fiscal half year. The Series’ total return would have been lower had certain expenses not been waived during the period.
1
Tax Managed Series
Portfolio Composition as of April 30, 2012
(unaudited)
2
Tax Managed Series
Investment Portfolio - April 30, 2012
(unaudited)
| | | | | | | | | | |
| | | SHARES | | | VALUE (NOTE 2) | | | |
| | | |
COMMON STOCKS - 98.1% | | | | | | | | | | |
| | | |
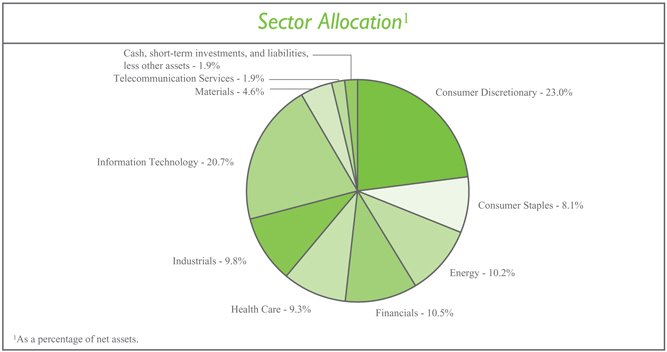
Consumer Discretionary - 23.0% | | | | | | | | | | |
Automobiles - 0.9% | | | | | | | | | | |
Toyota Motor Corp. - ADR (Japan) | | | 4,920 | | | $ | 402,358 | | | |
| | | | | | | | | | |
Hotels, Restaurants & Leisure - 2.8% | | | | | | | | | | |
Accor S.A. (France)1 | | | 4,240 | | | | 146,622 | | | |
Carnival Corp. | | | 35,150 | | | | 1,142,023 | | | |
| | | | | | | | | | |
| | | | | | | 1,288,645 | | | |
| | | | | | | | | | |
Internet & Catalog Retail - 2.2% | | | | | | | | | | |
Amazon.com, Inc.* | | | 4,400 | | | | 1,020,360 | | | |
| | | | | | | | | | |
Media - 16.1% | | | | | | | | | | |
AMC Networks, Inc. - Class A* | | | 16,850 | | | | 716,125 | | | |
DIRECTV - Class A* | | | 19,250 | | | | 948,447 | | | |
Discovery Communications, Inc. - Class A* | | | 10,790 | | | | 587,192 | | | |
Imax Corp. (Canada)* | | | 12,250 | | | | 293,633 | | | |
News Corp. - Class A | | | 43,210 | | | | 846,916 | | | |
Time Warner, Inc. | | | 27,860 | | | | 1,043,636 | | | |
Virgin Media, Inc. - ADR (United Kingdom) | | | 32,270 | | | | 792,551 | | | |
The Walt Disney Co. | | | 40,430 | | | | 1,742,937 | | | |
The Washington Post Co. - Class B | | | 1,290 | | | | 487,839 | | | |
| | | | | | | | | | |
| | | | | | | 7,459,276 | | | |
| | | | | | | | | | |
Specialty Retail - 1.0% | | | | | | | | | | |
Dick’s Sporting Goods, Inc. | | | 9,010 | | | | 455,906 | | | |
| | | | | | | | | | |
Total Consumer Discretionary | | | | | | | 10,626,545 | | | |
| | | | | | | | | | |
Consumer Staples - 8.1% | | | | | | | | | | |
Beverages - 2.6% | | | | | | | | | | |
Anheuser-Busch InBev N.V. (Belgium)1 | | | 8,940 | | | | 644,353 | | | |
The Coca-Cola Co. | | | 7,280 | | | | 555,610 | | | |
| | | | | | | | | | |
| | | | | | | 1,199,963 | | | |
| | | | | | | | | | |
Food & Staples Retailing - 1.5% | | | | | | | | | | |
Koninklijke Ahold N.V. (Netherlands)1 | | | 12,600 | | | | 159,924 | | | |
The Kroger Co. | | | 24,220 | | | | 563,599 | | | |
| | | | | | | | | | |
| | | | | | | 723,523 | | | |
| | | | | | | | | | |
Food Products - 4.0% | | | | | | | | | | |
Danone (France)1 | | | 11,410 | | | | 803,251 | | | |
Nestle S.A. (Switzerland)1 | | | 4,770 | | | | 292,350 | | | |
Unilever plc - ADR (United Kingdom) | | | 21,980 | | | | 754,354 | | | |
| | | | | | | | | | |
| | | | | | | 1,849,955 | | | |
| | | | | | | | | | |
Total Consumer Staples | | | | | | | 3,773,441 | | | |
| | | | | | | | | | |
The accompanying notes are an integral part of the financial statements.
3
Tax Managed Series
Investment Portfolio - April 30, 2012
(unaudited)
| | | | | | | | | | |
| | | SHARES | | | VALUE
(NOTE 2) | | | |
| | | |
COMMON STOCKS (continued) | | | | | | | | | | |
| | | |
Energy - 10.2% | | | | | | | | | | |
Energy Equipment & Services - 5.6% | | | | | | | | | | |
Baker Hughes, Inc. | | | 17,500 | | | $ | 771,925 | | | |
Cameron International Corp.* | | | 7,730 | | | | 396,163 | | | |
Schlumberger Ltd. | | | 11,030 | | | | 817,764 | | | |
Weatherford International Ltd. - ADR (Switzerland)* | | | 41,680 | | | | 594,774 | | | |
| | | | | | | | | | |
| | | | | | | 2,580,626 | | | |
| | | | | | | | | | |
Oil, Gas & Consumable Fuels - 4.6% | | | | | | | | | | |
Apache Corp. | | | 2,230 | | | | 213,946 | | | |
Chesapeake Energy Corp. | | | 11,940 | | | | 220,173 | | | |
Encana Corp. (Canada) | | | 13,540 | | | | 283,528 | | | |
EOG Resources, Inc. | | | 1,970 | | | | 216,326 | | | |
Hess Corp. | | | 17,010 | | | | 886,901 | | | |
Range Resources Corp. | | | 4,880 | | | | 325,301 | | | |
| | | | | | | | | | |
| | | | | | | 2,146,175 | | | |
| | | | | | | | | | |
Total Energy | | | | | | | 4,726,801 | | | |
| | | | | | | | | | |
Financials - 10.5% | | | | | | | | | | |
Capital Markets - 2.2% | | | | | | | | | | |
The Charles Schwab Corp. | | | 24,410 | | | | 349,063 | | | |
State Street Corp. | | | 14,700 | | | | 679,434 | | | |
| | | | | | | | | | |
| | | | | | | 1,028,497 | | | |
| | | | | | | | | | |
Commercial Banks - 0.8% | | | | | | | | | | |
Banco Santander S.A. (Spain)1 | | | 59,400 | | | | 372,949 | | | |
| | | | | | | | | | |
Consumer Finance - 3.2% | | | | | | | | | | |
American Express Co. | | | 7,950 | | | | 478,669 | | | |
Discover Financial Services | | | 29,690 | | | | 1,006,491 | | | |
| | | | | | | | | | |
| | | | | | | 1,485,160 | | | |
| | | | | | | | | | |
Diversified Financial Services - 4.2% | | | | | | | | | | |
CME Group, Inc. | | | 1,750 | | | | 465,185 | | | |
Deutsche Boerse AG (Germany)1 | | | 10,860 | | | | 681,886 | | | |
Moody’s Corp. | | | 18,930 | | | | 775,183 | | | |
| | | | | | | | | | |
| | | | | | | 1,922,254 | | | |
| | | | | | | | | | |
Real Estate Investment Trusts (REITS) - 0.1% | | | | | | | | | | |
DuPont Fabros Technology, Inc. | | | 1,490 | | | | 40,453 | | | |
| | | | | | | | | | |
Total Financials | | | | | | | 4,849,313 | | | |
| | | | | | | | | | |
Health Care - 9.3% | | | | | | | | | | |
Biotechnology - 1.0% | | | | | | | | | | |
BioMarin Pharmaceutical, Inc.* | | | 13,200 | | | | 458,040 | | | |
| | | | | | | | | | |
Health Care Equipment & Supplies - 3.5% | | | | | | | | | | |
Alere, Inc.* | | | 1,050 | | | | 25,085 | | | |
The accompanying notes are an integral part of the financial statements.
4
Tax Managed Series
Investment Portfolio - April 30, 2012
(unaudited)
| | | | | | | | | | |
| | | SHARES | | | VALUE (NOTE 2) | | | |
| | | |
COMMON STOCKS (continued) | | | | | | | | | | |
| | | |
Health Care (continued) | | | | | | | | | | |
Health Care Equipment & Supplies (continued) | | | | | | | | | | |
Becton, Dickinson and Co. | | | 9,120 | | | $ | 715,464 | | | |
Boston Scientific Corp.* | | | 71,080 | | | | 444,961 | | | |
Volcano Corp.* | | | 16,840 | | | | 457,206 | | | |
| | | | | | | | | | |
| | | | | | | 1,642,716 | | | |
| | | | | | | | | | |
Health Care Technology - 3.5% | | | | | | | | | | |
Allscripts Healthcare Solutions, Inc.* | | | 22,820 | | | | 252,845 | | | |
Cerner Corp.* | | | 16,600 | | | | 1,346,094 | | | |
| | | | | | | | | | |
| | | | | | | 1,598,939 | | | |
| | | | | | | | | | |
Life Sciences Tools & Services - 1.3% | | | | | | | | | | |
QIAGEN N.V. - ADR (Netherlands)* | | | 15,000 | | | | 250,950 | | | |
Waters Corp.* | | | 4,280 | | | | 359,991 | | | |
| | | | | | | | | | |
| | | | | | | 610,941 | | | |
| | | | | | | | | | |
Total Health Care | | | | | | | 4,310,636 | | | |
| | | | | | | | | | |
Industrials - 9.8% | | | | | | | | | | |
Air Freight & Logistics - 1.9% | | | | | | | | | | |
FedEx Corp. | | | 5,240 | | | | 462,378 | | | |
United Parcel Service, Inc. - Class B | | | 5,480 | | | | 428,207 | | | |
| | | | | | | | | | |
| | | | | | | 890,585 | | | |
| | | | | | | | | | |
Airlines - 2.4% | | | | | | | | | | |
Ryanair Holdings plc - ADR (Ireland)* | | | 16,750 | | | | 563,973 | | | |
Southwest Airlines Co. | | | 64,530 | | | | 534,308 | | | |
| | | | | | | | | | |
| | | | | | | 1,098,281 | | | |
| | | | | | | | | | |
Construction & Engineering - 1.4% | | | | | | | | | | |
Quanta Services, Inc.* | | | 30,330 | | | | 670,900 | | | |
| | | | | | | | | | |
Machinery - 2.5% | | | | | | | | | | |
Flowserve Corp. | | | 5,900 | | | | 678,087 | | | |
Pall Corp. | | | 3,730 | | | | 222,345 | | | |
Westport Innovations, Inc. - ADR (Canada)* | | | 7,500 | | | | 234,870 | | | |
| | | | | | | | | | |
| | | | | | | 1,135,302 | | | |
| | | | | | | | | | |
Road & Rail - 1.6% | | | | | | | | | | |
Norfolk Southern Corp. | | | 10,290 | | | | 750,450 | | | |
| | | | | | | | | | |
Total Industrials | | | | | | | 4,545,518 | | | |
| | | | | | | | | | |
Information Technology - 20.7% | | | | | | | | | | |
Communications Equipment - 6.5% | | | | | | | | | | |
Cisco Systems, Inc. | | | 34,110 | | | | 687,317 | | | |
Juniper Networks, Inc.* | | | 29,420 | | | | 630,470 | | | |
Qualcomm, Inc. | | | 20,440 | | | | 1,304,890 | | | |
The accompanying notes are an integral part of the financial statements.
5
Tax Managed Series
Investment Portfolio - April 30, 2012
(unaudited)
| | | | | | | | | | |
| | | SHARES | | | VALUE (NOTE 2) | | | |
| | | |
COMMON STOCKS (continued) | | | | | | | | | | |
| | | |
Information Technology (continued) | | | | | | | | | | |
Communications Equipment (continued) | | | | | | | | | | |
Riverbed Technology, Inc.* | | | 20,560 | | | $ | 405,649 | | | |
| | | | | | | | | | |
| | | | | | | 3,028,326 | | | |
| | | | | | | | | | |
Computers & Peripherals - 3.3% | | | | | | | | | | |
EMC Corp.* | | | 54,010 | | | | 1,523,622 | | | |
| | | | | | | | | | |
Electronic Equipment, Instruments & Components - 1.9% | | | | | | | | | | |
Corning, Inc. | | | 61,860 | | | | 887,691 | | | |
| | | | | | | | | | |
Internet Software & Services - 4.0% | | | | | | | | | | |
Google, Inc. - Class A* | | | 3,090 | | | | 1,870,161 | | | |
| | | | | | | | | | |
IT Services - 3.8% | | | | | | | | | | |
Amadeus IT Holding S.A. - Class A (Spain)1 | | | 15,170 | | | | 310,558 | | | |
Amdocs Ltd. - ADR (Guernsey)* | | | 10,730 | | | | 343,360 | | | |
MasterCard, Inc. - Class A | | | 1,200 | | | | 542,724 | | | |
Visa, Inc. - Class A | | | 4,410 | | | | 542,342 | | | |
| | | | | | | | | | |
| | | | | | | 1,738,984 | | | |
| | | | | | | | | | |
Software - 1.2% | | | | | | | | | | |
Autodesk, Inc.* | | | 14,060 | | | | 553,542 | | | |
| | | | | | | | | | |
Total Information Technology | | | | | | | 9,602,326 | | | |
| | | | | | | | | | |
Materials - 4.6% | | | | | | | | | | |
Chemicals - 3.7% | | | | | | | | | | |
Monsanto Co. | | | 17,520 | | | | 1,334,674 | | | |
Syngenta AG (Switzerland)1 | | | 1,020 | | | | 357,690 | | | |
| | | | | | | | | | |
| | | | | | | 1,692,364 | | | |
| | | | | | | | | | |
Metals & Mining - 0.9% | | | | | | | | | | |
Alcoa, Inc. | | | 43,460 | | | | 422,866 | | | |
| | | | | | | | | | |
Total Materials | | | | | | | 2,115,230 | | | |
| | | | | | | | | | |
Telecommunication Services - 1.9% | | | | | | | | | | |
Diversified Telecommunication Services - 1.9% | | | | | | | | | | |
Telenor ASA (Norway)1 | | | 48,430 | | | | 890,212 | | | |
| | | | | | | | | | |
TOTAL COMMON STOCKS
(Identified Cost $36,927,291) | | | | | | | 45,440,022 | | | |
| | | | | | | | | | |
The accompanying notes are an integral part of the financial statements.
6
Tax Managed Series
Investment Portfolio - April 30, 2012
(unaudited)
| | | | | | | | | | |
| | | SHARES | | | VALUE (NOTE 2) | | | |
| | | |
SHORT-TERM INVESTMENTS - 2.4% | | | | | | | | | | |
| | | |
Dreyfus Cash Management, Inc. - Institutional Shares2, 0.06% (Identified Cost $1,105,596) | | | 1,105,596 | | | $ | 1,105,596 | | | |
| | | | | | | | | | |
TOTAL INVESTMENTS - 100.5%
(Identified Cost $38,032,887) | | | | | | | 46,545,618 | | | |
LIABILITIES, LESS OTHER ASSETS - (0.5%) | | | | | | | (245,291 | ) | | |
| | | | | | | | | | |
NET ASSETS - 100% | | | | | | $ | 46,300,327 | | | |
| | | | | | | | | | |
ADR - American Depository Receipt
*Non-income producing security
1 A factor from a third party vendor was applied to determine the security’s fair value following the close of local trading.
2 Rate shown is the current yield as of April 30, 2012.
The accompanying notes are an integral part of the financial statements.
7
Tax Managed Series
Statement of Assets and Liabilities
April 30, 2012 (unaudited)
| | | | |
ASSETS: | | | | |
| |
Investments, at value (identified cost $38,032,887) (Note 2) | | $ | 46,545,618 | |
Foreign currency (identified cost $6,657) | | | 6,661 | |
Receivable for securities sold | | | 1,701,765 | |
Dividends receivable | | | 34,439 | |
Foreign tax reclaims receivable | | | 31,323 | |
Receivable for fund shares sold | | | 27,781 | |
| | | | |
| |
TOTAL ASSETS | | | 48,347,587 | |
| | | | |
| |
LIABILITIES: | | | | |
| |
Accrued management fees (Note 3) | | | 34,911 | |
Accrued fund accounting and administration fees (Note 3) | | | 8,894 | |
Accrued transfer agent fees (Note 3) | | | 2,345 | |
Accrued Chief Compliance Officer service fees (Note 3) | | | 415 | |
Accrued directors’ fees (Note 3) | | | 325 | |
Payable for securities purchased | | | 1,969,978 | |
Payable for fund shares repurchased | | | 8,831 | |
Other payables and accrued expenses | | | 21,561 | |
| | | | |
| |
TOTAL LIABILITIES | | | 2,047,260 | |
| | | | |
| |
TOTAL NET ASSETS | | $ | 46,300,327 | |
| | | | |
| |
NET ASSETS CONSIST OF: | | | | |
| |
Capital stock | | $ | 17,268 | |
Additional paid-in-capital | | | 39,934,126 | |
Distributions in excess of net investment income | | | (5,133 | ) |
Accumulated net realized loss on investments, foreign currency and translation of other assets and liabilities | | | (2,160,522 | ) |
Net unrealized appreciation on investments, foreign currency and translation of other assets and liabilities | | | 8,514,588 | |
| | | | |
| |
TOTAL NET ASSETS | | $ | 46,300,327 | |
| | | | |
| |
NET ASSET VALUE, OFFERING PRICE AND REDEMPTION PRICE PER SHARE - Class A
($46,300,327/1,726,779 shares) | | $ | 26.81 | |
| | | | |
The accompanying notes are an integral part of the financial statements.
8
Tax Managed Series
Statement of Operations
For the Six Months Ended April 30, 2012 (unaudited)
| | | | |
INVESTMENT INCOME: | | | | |
| |
Dividends (net of foreign taxes withheld, $10,797) | | $ | 297,438 | |
| | | | |
| |
EXPENSES: | | | | |
| |
Management fees (Note 3) | | | 232,806 | |
Fund accounting and administration fees (Note 3) | | | 18,055 | |
Transfer agent fees (Note 3) | | | 5,113 | |
Chief Compliance Officer service fees (Note 3) | | | 1,246 | |
Directors’ fees (Note 3) | | | 737 | |
Custodian fees | | | 3,192 | |
Miscellaneous | | | 37,158 | |
| | | | |
| |
Total Expenses | | | 298,307 | |
Less reduction of expenses (Note 3) | | | (18,940 | ) |
| | | | |
| |
Net Expenses | | | 279,367 | |
| | | | |
| |
NET INVESTMENT INCOME | | | 18,071 | |
| | | | |
| |
REALIZED AND UNREALIZED GAIN (LOSS) ON INVESTMENTS AND FOREIGN CURRENCY: | | | | |
| |
Net realized gain (loss) on- | | | | |
Investments | | | 1,936,642 | |
Foreign currency and translation of other assets and liabilities | | | 291 | |
| | | | |
| | | 1,936,933 | |
| | | | |
| |
Net change in unrealized appreciation (depreciation) on- | | | | |
Investments | | | 1,573,162 | |
Foreign currency and translation of other assets and liabilities | | | (1,208 | ) |
| | | | |
| | | 1,571,954 | |
| | | | |
| |
NET REALIZED AND UNREALIZED GAIN (LOSS) ON INVESTMENTS AND FOREIGN CURRENCY | | | 3,508,887 | |
| | | | |
| |
NET INCREASE IN NET ASSETS RESULTING FROM OPERATIONS | | $ | 3,526,958 | |
| | | | |
The accompanying notes are an integral part of the financial statements.
9
Tax Managed Series
Statements of Changes in Net Assets
| | | | | | | | |
| | | FOR THE SIX
MONTHS ENDED
4/30/12
(UNAUDITED) | | | FOR THE
YEAR ENDED
10/31/11 | |
INCREASE (DECREASE) IN NET ASSETS: | | | | | | | | |
| | |
OPERATIONS: | | | | | | | | |
| | |
Net investment income | | $ | 18,071 | | | $ | 150,021 | |
Net realized gain (loss) on investments and foreign currency | | | 1,936,933 | | | | (1,083,014 | ) |
Net change in unrealized appreciation (depreciation) on investments and foreign currency | | | 1,571,954 | | | | 69,312 | |
| | | | | | | | |
| | |
Net increase (decrease) from operations | | | 3,526,958 | | | | (863,681 | ) |
| | | | | | | | |
| | |
DISTRIBUTIONS TO SHAREHOLDERS (Note 8): | | | | | | | | |
| | |
From net investment income | | | (136,434 | ) | | | (135,784 | ) |
| | | | | | | | |
| | |
CAPITAL STOCK ISSUED AND REPURCHASED: | | | | | | | | |
| | |
Net increase (decrease) from capital share transactions (Note 5) | | | (4,753,560 | ) | | | 3,387,055 | |
| | | | | | | | |
| | |
Net increase (decrease) in net assets | | | (1,363,036 | ) | | | 2,387,590 | |
| | |
NET ASSETS: | | | | | | | | |
| | |
Beginning of period | | | 47,663,363 | | | | 45,275,773 | |
| | | | | | | | |
| | |
End of period (including distributions in excess of net investment income of $5,133 and undistributed net investment income of $113,230, respectively) | | $ | 46,300,327 | | | $ | 47,663,363 | |
| | | | | | | | |
The accompanying notes are an integral part of the financial statements.
10
Tax Managed Series
Financial Highlights
| | | | | | | | | | | | | | | | | | | | | | | | |
| | | FOR THE SIX
MONTHS ENDED | | | FOR THE YEARS ENDED | |
| | | 4/30/12 (UNAUDITED) | | | 10/31/11 | | | 10/31/10 | | | 10/31/09 | | | 10/31/08 | | | 10/31/07 | |
Per share data (for a share outstanding throughout each period): | | | | | | | | | | | | | | | | | | | | | | | | |
Net asset value - Beginning of period | | $ | 24.96 | | | $ | 25.01 | | | $ | 21.32 | | | $ | 18.26 | | | $ | 28.44 | | | $ | 27.01 | |
| | | | | | | | | | | | | | | | | | | | | | | | |
Income (loss) from investment operations: Net investment income | | | 0.01 | 1 | | | 0.08 | 1 | | | 0.06 | 1 | | | 0.06 | 1 | | | 0.12 | | | | 0.08 | |
Net realized and unrealized gain (loss) on investments | | | 1.91 | | | | (0.06 | ) | | | 3.67 | | | | 3.11 | | | | (9.42 | ) | | | 3.44 | |
| | | | | | | | | | | | | | | | | | | | | | | | |
| | | | | | |
Total from investment operations | | | 1.92 | | | | 0.02 | | | | 3.73 | | | | 3.17 | | | | (9.30 | ) | | | 3.52 | |
| | | | | | | | | | | | | | | | | | | | | | | | |
| | | | | | |
Less distributions to shareholders: | | | | | | | | | | | | | | | | | | | | | | | | |
From net investment income | | | (0.07 | ) | | | (0.07 | ) | | | (0.04 | ) | | | (0.11 | ) | | | (0.09 | ) | | | (0.14 | ) |
From net realized gain on investments | | | — | | | | — | | | | — | | | | — | | | | (0.79 | ) | | | (1.95 | ) |
| | | | | | | | | | | | | | | | | | | | | | | | |
| | | | | | |
Total distributions to shareholders | | | (0.07 | ) | | | (0.07 | ) | | | (0.04 | ) | | | (0.11 | ) | | | (0.88 | ) | | | (2.09 | ) |
| | | | | | | | | | | | | | | | | | | | | | | | |
| | | | | | |
Net asset value - End of period | | $ | 26.81 | | | $ | 24.96 | | | $ | 25.01 | | | $ | 21.32 | | | $ | 18.26 | | | $ | 28.44 | |
| | | | | | | | | | | | | | | | | | | | | | | | |
| | | | | | |
Net assets - End of period (000’s omitted) | | $ | 46,300 | | | $ | 47,663 | | | $ | 45,276 | | | $ | 29,259 | | | $ | 15,530 | | | $ | 25,695 | |
| | | | | | | | | | | | | | | | | | | | | | | | |
| | | | | | |
Total return2 | | | 7.70 | % | | | 0.08 | % | | | 17.50 | % | | | 17.57 | % | | | (33.62 | %) | | | 13.65 | % |
Ratios (to average net assets)/ Supplemental Data: | | | | | | | | | | | | | | | | | | | | | | | | |
Expenses* | | | 1.20 | %3 | | | 1.20 | % | | | 1.20 | % | | | 1.20 | % | | | 1.20 | % | | | 1.20 | % |
Net investment income | | | 0.08 | %3 | | | 0.29 | % | | | 0.28 | % | | | 0.31 | % | | | 0.44 | % | | | 0.38 | % |
Portfolio turnover | | | 21 | % | | | 57 | % | | | 56 | % | | | 48 | % | | | 96 | % | | | 65 | % |
|
| *For certain periods presented, the investment advisor did not impose all or a portion of its management fees and/or other fees. If these expenses had been incurred by the Series, the expense ratio (to average net assets) would have increased by the following amount: | |
| | | | | | |
| | | 0.08 | %3 | | | 0.04 | % | | | 0.14 | % | | | 0.24 | % | | | 0.20 | % | | | 0.25 | % |
1Calculated based on average shares outstanding during the periods.
2Represents aggregate total return for the periods indicated, and assumes reinvestment of all distributions. Total return would have been lower had certain expenses not been waived or reimbursed during the periods. Periods less than one year are not annualized.
3Annualized.
The accompanying notes are an integral part of the financial statements.
11
Tax Managed Series
Notes to Financial Statements
(unaudited)
Tax Managed Series (the “Series”) is a no-load diversified series of Manning & Napier Fund, Inc. (the “Fund”). The Fund is organized in Maryland and is registered under the Investment Company Act of 1940, as amended, as an open-end management investment company.
The Series’ investment objective is to maximize long-term growth while attempting to minimize the impact of taxes on the total return earned by shareholders.
The Series is authorized to issue five classes of shares (Class A, B, D, E and Z). Currently, only Class A shares have been issued. Each class of shares is substantially the same, except that class specific distribution and shareholder servicing expenses are borne by the specific class of shares to which they relate.
The Fund’s Advisor is Manning & Napier Advisors, LLC (the “Advisor”). Shares of the Series are offered to investors, clients and employees of the Advisor and its affiliates. The total authorized capital stock of the Fund consists of 15 billion shares of common stock each having a par value of $0.01. As of April 30, 2012, 9.8 billion shares have been designated in total among 41 series, of which 87.5 million have been designated as Tax Managed Series Class A common stock.
| 2. | Significant Accounting Policies |
Security Valuation
Portfolio securities, including domestic equities, foreign equities, warrants and options, listed on an exchange other than the NASDAQ National Market System are valued at the latest quoted sales price of the exchange on which the security is primarily traded. Securities not traded on valuation date or securities not listed on an exchange are valued at the latest quoted bid price provided by the Fund’s pricing service. Securities listed on the NASDAQ National Market System are valued in accordance with the NASDAQ Official Closing Price.
Short-term investments that mature in sixty days or less are valued at amortized cost, which approximates fair value. Investments in open-end investment companies are valued at their net asset value per share on valuation date.
Volume and level of activity in established markets for an asset or liability are evaluated to determine whether recent transactions and quoted prices are determinative of fair value. Where there have been significant decreases in volume and level of activity, further analysis and adjustment may be necessary to estimate fair value. The Series measures fair value in these instances by the use of inputs and valuation techniques which may be based upon current market prices of securities that are comparable in coupon, rating, maturity and industry and/or expectation of future cash flows. As a result of trading in relatively thin markets and/or markets that experience significant volatility, the prices used by the Series to value these securities may differ from the value that would be realized if these securities were sold, and the differences could be material.
Securities for which representative valuations or prices are not available from the Series’ pricing service may be valued at fair value as determined in good faith by the Advisor under procedures approved by and under the general supervision and responsibility of the Fund’s Board of Directors (the “Board”). Due to the inherent uncertainty of valuations of such securities, the fair value may differ significantly from the values that would have been used had a ready market for such securities existed. If trading or events occurring after the close of the principal market in which securities are traded are expected to materially affect the value of those securities, then they may be valued at their fair value, taking this trading or these events into account. In accordance with the procedures approved by the Board, the values of certain securities trading outside the U.S. were adjusted following the close of local trading using a factor from a third party vendor. The third party vendor uses statistical analyses and quantitative models, which consider among other things subsequent movement and changes in the prices of indices, securities and exchange rates in other markets, to determine the factors which are used to adjust local market prices. The value of securities used for net asset value calculation under these procedures may differ from published prices for the same securities. It is the Fund’s policy to classify each foreign equity security where a factor from a third party vendor is provided as a Level 2 security.
12
Tax Managed Series
Notes to Financial Statements (continued)
(unaudited)
| 2. | Significant Accounting Policies (continued) |
Security Valuation (continued)
Various inputs are used in determining the value of the Series’ assets or liabilities carried at fair value. These inputs are summarized in three broad levels. Level 1 includes quoted prices in active markets for identical assets and liabilities. Level 2 includes other significant observable inputs (including quoted prices for similar securities, interest rates, prepayment speeds, credit risk, etc.). Level 3 includes significant unobservable inputs (including the Series’ own assumptions in determining the fair value of investments). A financial instrument’s level within the fair value hierarchy is based on the lowest level of any input both individually and in aggregate that is significant to the fair value measurement. The inputs or methodology used for valuing securities are not necessarily an indication of the risk associated with investing in those securities.
The following is a summary of the valuation levels used for major security types as of April 30, 2012 in valuing the Series’ assets or liabilities carried at fair value:
| | | | | | | | | | | | | | | | |
| DESCRIPTION | | TOTAL | | | LEVEL 1 | | | LEVEL 2 | | | LEVEL 3 | |
Assets: | | | | | | | | | | | | | | | | |
Equity Securities*: | | | | | | | | | | | | | | | | |
Consumer Discretionary | | $ | 10,626,545 | | | $ | 10,479,923 | | | $ | 146,622 | | | $ | — | |
Consumer Staples | | | 3,773,441 | | | | 1,873,563 | | | | 1,899,878 | | | | — | |
Energy | | | 4,726,801 | | | | 4,726,801 | | | | — | | | | — | |
Financials | | | 4,849,313 | | | | 3,794,478 | | | | 1,054,835 | | | | — | |
Health Care | | | 4,310,636 | | | | 4,310,636 | | | | — | | | | — | |
Industrials | | | 4,545,518 | | | | 4,545,518 | | | | — | | | | — | |
Information Technology | | | 9,602,326 | | | | 9,291,768 | | | | 310,558 | | | | — | |
Materials | | | 2,115,230 | | | | 1,757,540 | | | | 357,690 | | | | — | |
Telecommunication Services | | | 890,212 | | | | — | | | | 890,212 | | | | — | |
Mutual Funds | | | 1,105,596 | | | | 1,105,596 | | | | — | | | | — | |
| | | | | | | | | | | | | | | | |
Total assets | | $ | 46,545,618 | | | $ | 41,885,823 | | | $ | 4,659,795 | | | $ | — | |
| | | | | | | | | | | | | | | | |
*Includes common stock, warrants and rights. Please see the Investment Portfolio for foreign securities where a factor from a third party vendor was applied to determine the security’s fair value following the close of local trading. Such securities are included in Level 2 in the table above.
There were no Level 3 securities held by the Series as of October 31, 2011 or April 30, 2012.
The Fund’s policy is to recognize transfers in and transfers out of the valuation levels as of the beginning of the reporting period. There were no transfers between Level 1 and Level 2 during the six months ended April 30, 2012.
Recent Accounting Standard
In May 2011, the Financial Accounting Standards Board (“FASB”) issued Accounting Standards Update No. 2011-04, “Fair Value Measurements (Topic 820) - Amendments to Achieve Common Fair Value Measurement and Disclosure Requirements in U.S. GAAP and IFRSs” (“ASU 2011-04”). ASU 2011-04 clarifies the application of existing fair value measurement requirements, changes certain principles related to measuring fair value, and requires additional disclosures about fair value measurements.
Required disclosures are expanded under the new guidance, especially for fair value measurements that are categorized within Level 3 of the fair value hierarchy, for which quantitative information about the unobservable inputs used, and a narrative description of the valuation processes in place and sensitivity of recurring Level 3 measurements to changes in unobservable inputs will be required.
ASU 2011-04 is effective for interim and annual periods beginning after December 15, 2011 and is to be applied prospectively. Management is currently assessing the impact of this guidance, but does not expect it to have a material impact on the Series’ financial statements.
13
Tax Managed Series
Notes to Financial Statements (continued)
(unaudited)
| 2. | Significant Accounting Policies (continued) |
Security Transactions, Investment Income and Expenses
Security transactions are accounted for on trade date. Dividend income is recorded on the ex-dividend date, except that if the ex-dividend date has passed, certain dividends from foreign securities are recorded as soon as the Series is informed of the ex-dividend date. Non-cash dividends, if any, are recorded at the fair value of the securities received. Interest income, including amortization of premium and accretion of discounts using the effective interest method, is earned from settlement date and accrued daily.
Expenses are recorded on an accrual basis. Most expenses of the Fund can be attributed to a specific series. Expenses which cannot be directly attributed are apportioned among the series in the Fund in such a manner as deemed equitable by the Fund’s Board, taking into consideration, among other things, the nature and type of expense.
The Series uses the identified cost method for determining realized gain or loss on investments for both financial statement and federal income tax reporting purposes.
Foreign Currency Translation
The books and records of the Series are maintained in U.S. dollars. Foreign currencies, investments and other assets and liabilities are translated into U.S. dollars at the current exchange rates. Purchases and sales of investment securities and income and expenses are translated on the respective dates of such transactions. The Series does not isolate realized and unrealized gains and losses attributable to changes in the exchange rates from gains and losses that arise from changes in the fair value of investments. Such fluctuations are included with net realized and unrealized gain or loss on investments. Net realized foreign currency gains and losses represent foreign currency gains and losses between trade date and settlement date on securities transactions, gains and losses on disposition of foreign currencies and the difference between the amount of income and foreign withholding taxes recorded on the books of the Series and the amounts actually received or paid.
Federal Taxes
The Series’ policy is to comply with the provisions of the Internal Revenue Code applicable to regulated investment companies. The Series is not subject to federal income tax or excise tax to the extent that the Series distributes to shareholders each year its taxable income, including any net realized gains on investments, in accordance with requirements of the Internal Revenue Code. Accordingly, no provision for federal income tax or excise tax has been made in the financial statements.
Management evaluates its tax positions to determine if the tax positions taken meet the minimum recognition threshold in connection with accounting for uncertainties in income tax positions taken or expected to be taken for the purposes of measuring and recognizing tax liabilities in the financial statements. Recognition of tax benefits of an uncertain tax position is required only when the position is “more likely than not” to be sustained assuming examination by taxing authorities. At April 30, 2012, the Series has recorded no liability for net unrecognized tax benefits relating to uncertain income tax positions taken or expected to be taken in future tax returns.
The Series files income tax returns in the U.S. federal jurisdiction, various states and foreign jurisdictions, as required. No income tax returns are currently under investigation. The statute of limitations on the Series’ tax returns remains open for the years ended October 31, 2008 through October 31, 2011. The Series is not aware of any tax positions for which it is reasonably possible that the total amounts of unrecognized tax benefits will significantly change in the next twelve months.
Foreign Taxes
Based on the Series’ understanding of the tax rules and rates related to income, gains and currency purchase/repatriation transactions for foreign jurisdictions in which it invests, the Series will provide for foreign taxes, and where appropriate, deferred foreign tax.
Distributions of Income and Gains
Distributions to shareholders of net investment income and net realized gains are made annually. An additional distribution may be necessary to avoid taxation of the Series. Distributions are recorded on the ex-dividend date.
14
Tax Managed Series
Notes to Financial Statements (continued)
(unaudited)
| 2. | Significant Accounting Policies (continued) |
Indemnifications
The Fund’s organizational documents provide former and current directors and officers with a limited indemnification against liabilities arising in connection with the performance of their duties to the Fund. In the normal course of business, the Fund may also enter into contracts that provide general indemnifications. The Fund’s maximum exposure under these arrangements is unknown as this would be dependent on future claims that may be made against the Fund. The risk of material loss from such claims is considered remote.
Other
The preparation of financial statements in conformity with accounting principles generally accepted in the United States of America requires management to make estimates and assumptions that affect the reported amounts of assets and liabilities and the disclosure of contingent assets and liabilities at the date of the financial statements and the reported amounts of income and expenses during the reporting period. Actual results could differ from those estimates.
| 3. | Transactions with Affiliates |
The Fund has an Investment Advisory Agreement (the “Agreement”) with the Advisor, for which the Series pays a fee, computed daily and payable monthly, at an annual rate of 1.00% of the Series’ average daily net assets.
Under the Agreement, personnel of the Advisor provide the Series with advice and assistance in the choice of investments and the execution of securities transactions, and otherwise maintain the Series’ organization. The Advisor also provides the Fund with necessary office space and fund administration and support services. The salaries of all officers of the Fund (except a percentage of the Fund’s Chief Compliance Officer’s salary, which is paid by the Fund), and of all Directors who are “affiliated persons” of the Fund, or of the Advisor, and all personnel of the Fund, or of the Advisor, performing services relating to research, statistical and investment activities, are paid by the Advisor. Each “non-affiliated” Director receives an annual stipend, which is allocated among all the active series of the Fund. In addition, these Directors also receive a fee per Board meeting attended plus a fee for each committee meeting attended.
The Advisor has contractually agreed, until at least February 28, 2013, to waive its fee and, if necessary, pay other operating expenses of the Series in order to maintain total direct annual fund operating expenses for the Class A Series at no more than 1.20% of average daily net assets each year. Accordingly, the Advisor waived fees of $18,940 for the six months ended April 30, 2012, which is included as a reduction of expenses on the Statement of Operations. The Advisor is not eligible to recoup any expenses that have been waived or reimbursed in prior years.
Manning & Napier Investor Services, Inc., a registered broker-dealer affiliate of the Advisor, acts as distributor for the Fund’s shares. The services of Manning & Napier Investor Services, Inc. are provided at no additional cost to the Series.
The Advisor has agreements with BNY Mellon Investment Servicing (U.S.) Inc. (“BNY”) under which BNY serves as sub-accountant services agent and sub-transfer agent. The Fund pays the Advisor an annual fee related to fund accounting and administration of 0.0175% on the first $3 billion of average daily net assets (excluding Target Series); 0.015% on the next $3 billion of average daily net assets (excluding Target Series); and 0.01% of the average daily net assets in excess of $6 billion (excluding Target Series); plus a base fee of $25,500 per series. Transfer Agent fees are charged to the Fund on a per account basis. Additionally, certain transaction and cusip-based fees and out-of-pocket expenses, including charges for reporting relating to the Fund’s compliance program, are charged.
Expenses not directly attributable to a series are allocated based on each series’ relative net assets or number of accounts, depending on the expense.
15
Tax Managed Series
Notes to Financial Statements (continued)
(unaudited)
| 4. | Purchases and Sales of Securities |
For the six months ended April 30, 2012, purchases and sales of securities, other than U.S. Government securities and short-term securities, were $9,460,983 and $13,113,932, respectively. There were no purchases or sales of U.S. Government securities.
| 5. | Capital Stock Transactions |
Transactions in Class A shares of Tax Managed Series were:
| | | | | | | | | | | | | | | | |
| | | FOR THE SIX MONTHS ENDED 4/30/12 | | | FOR THE YEAR ENDED 10/31/11 | |
| | | SHARES | | | AMOUNT | | | SHARES | | | AMOUNT | |
Sold | | | 136,790 | | | $ | 3,459,911 | | | | 570,847 | | | $ | 15,268,622 | |
Reinvested | | | 2,158 | | | | 51,213 | | | | 1,543 | | | | 40,496 | |
Repurchased | | | (322,017 | ) | | | (8,264,684 | ) | | | (473,149 | ) | | | (11,922,063 | ) |
| | | | | | | | | | | | | | | | |
Total | | | (183,069 | ) | | $ | (4,753,560 | ) | | | 99,241 | | | $ | 3,387,055 | |
| | | | | | | | | | | | | | | | |
At April 30, 2012, one omnibus account owned 1,010,926 shares of the Series (58.5% of shares outstanding) valued at $27,092,821. Investment activities of this shareholder may have a material effect on the Series.
The Series may trade in instruments including written and purchased options, forward foreign currency exchange contracts and futures contracts and other derivatives in the normal course of investing activities to assist in managing exposure to various market risks. The Series may be subject to various elements of risk, which may involve, to a varying degree, elements of risk in excess of the amounts recognized for financial statement purposes. These risks include: the risk that changes in the value of a derivative may not correlate perfectly with the underlying asset, rate or index, counterparty credit risk related to over the counter derivative counterparties’ failure to perform under contract terms, liquidity risk related to the lack of a liquid market for these contracts allowing the fund to close out its position(s) and documentation risk relating to disagreement over contract terms. No such investments were held by the Series as of April 30, 2012.
Investing in securities of foreign companies and foreign governments involves special risks and considerations not typically associated with investing in securities of domestic companies and the U.S. Government. These risks include revaluation of currencies and future adverse political and economic developments. Moreover, securities of foreign companies and foreign governments and their markets may be less liquid and their prices more volatile than those of comparable domestic companies and the U.S. Government.
| 8. | Federal Income Tax Information |
The amount and characterization of certain income and capital gains to be distributed are determined in accordance with federal income tax regulations, which may differ from accounting principles generally accepted in the United States of America. The Series may periodically make reclassifications among its capital accounts to reflect income and gains available for distribution (or available capital loss carryovers) under income tax regulations, without impacting the Series’ net asset value. Any such reclassifications are not reflected in the financial highlights.
The final determination of the tax character of current year distributions will be made at the conclusion of the fiscal year. The tax character of distributions paid for the year ended October 31, 2011 were as follows:
| | | | | | |
Ordinary income | | $ | 135,784 | | | |
16
Tax Managed Series
Notes to Financial Statements (continued)
(unaudited)
| 8. | Federal Income Tax Information (continued) |
At October 31, 2011, the Series had a capital loss carryover of $3,996,162, available to the extent allowed by tax law to offset future net capital gain, if any, that will expire as follows:
| | | | |
| LOSS CARRYOVER | | EXPIRATION DATE | | |
| $1,141,000 | | October 31, 2016 | | |
| $1,769,992 | | October 31, 2017 | | |
| $1,085,170 | | October 31, 2019 | | |
The Regulated Investment Company Modernization Act of 2010 (the “Act”) was enacted on December 22, 2010. The Act made changes to several tax rules including the unlimited carryover of future capital losses, which will retain their character as short-term and/or long-term losses. Prior to the Act, net capital losses incurred by the Series were carried forward for eight years and treated as short-term losses. The Act requires that post-enactment net capital losses be used before pre-enactment net capital losses.
At April 30, 2012, the identified cost of investments for federal income tax purposes, the resulting gross unrealized appreciation and depreciation, and the net unrealized appreciation were as follows:
| | | | |
Cost for federal income tax purposes | | $ | 38,134,180 | |
Unrealized appreciation | | | 9,318,882 | |
Unrealized depreciation | | | (907,444 | ) |
| | | | |
Net unrealized appreciation | | $ | 8,411,438 | |
| | | | |
17
Tax Managed Series
Renewal of Investment Advisory Agreement
(unaudited)
At the Manning & Napier Fund, Inc. (the “Fund”) Board of Directors’ (the “Board”) meeting, held on November 18, 2011, the Investment Advisory Agreement (the “Agreement”) between the Fund and Manning & Napier Advisors, LLC (the “Advisor”) was reviewed by the Board for renewal. In connection with the decision whether to renew the Agreement, a variety of material was prepared for and reviewed by the Board.
Representatives of the Advisor attended the meeting and presented additional oral and written information to the Board to assist the Board in its considerations. The discussion immediately below outlines the materials and information presented to the Board in connection with the Board’s 2011 Annual Review of the Agreement and the conclusions made by the Directors when determining to continue the Agreement.
| | • | | The Board considered the services provided by the Advisor under the Agreement including, among others: deciding what securities to purchase and sell for each Series; arranging for the purchase and sale of such securities by placing orders with broker-dealers; administering the affairs of the Fund (including the books and records of the Fund not maintained by third party service providers such as the custodian or sub-transfer agent); arranging for the insurance coverage for the Fund; and supervising the preparation of tax returns, SEC filings (including registration statements) and reports to shareholders for the Fund. The Board also considered the nature and quality of such services provided under the Agreement in light of the Advisor’s services provided to the Fund for 25 years. The Board discussed the quality of these services with representatives from the Advisor and concluded that the Advisor was performing its services to the Fund required under the Agreement in a reasonable manner. |
| | • | | The Board considered the investment performance of the various Series of the Fund. The investment performance for each Series was reviewed on a cumulative basis since inception and on a one year basis. In addition, annualized performance for the following time periods was considered: inception, three year, five year, ten year, and current market cycle. A market cycle includes periods of both rising and falling markets. Returns for established benchmark indices for each Series were provided for each time period. The Board noted that the various Series were competitive against their respective benchmarks and/or peer groups over various time periods, but in particular over the full market cycle period relevant for the Series. In addition, the Board considered at the meeting (and considers on a quarterly basis) a peer group performance analysis consisting of Morningstar universes of mutual funds with similar investment objectives. The Board discussed the performance with representatives from the Advisor and concluded that the investment performance of each of the Fund’s Series was reasonable based on the Fund’s actual performance and comparative performance, especially performance over the current market cycle. |
| | • | | The Board considered the costs of the Advisor’s services and the profits of the Advisor as they relate to the Advisor’s services to the Fund under the Agreement. In reviewing the Advisor’s costs and profits, the Board discussed the Advisor’s revenues generated from the Fund (on both an actual and adjusted basis) and its expenses associated with providing the services under the Agreement. In addition, the Board reviewed the Advisor’s expenses associated with Fund activities outside of the Agreement (such as expense reimbursements pursuant to expense caps and payments made by the Advisor to third party platforms on which shares of the Fund are available for purchase). It was noted by representatives of the Advisor that 10 of the 29 active Series of the Fund are currently experiencing expenses above the capped expense ratios. After discussing the above costs and profits, the Board concluded that the Advisor’s profitability relating to its services provided under the Agreement was reasonable. |
| | • | | The Board considered the fees and expenses of the various Series of the Fund. The Advisor presented the advisory fees and total expenses for each Series, including the advisory fee adjusted for any expense waivers or reimbursements (either contractual or voluntary) paid by the Advisor. The advisory fees and expense ratios of each Series were compared to an average (on both a mean and median basis) of similar funds as disclosed on the Morningstar database. Representatives of the Advisor discussed with the Board the levels of its advisory fee for each Series of the Fund and as compared to the median and mean advisory fees for similar funds as listed on Morningstar. Expense ratios for every Series, except the Pro-Blend Class R and Class C, and Target Class R and Class C (and a few Class K), are currently below the median and mean for similar funds as listed on Morningstar. Based on their review of the information provided, the Board concluded that the fees and expenses of each Series of the Fund were reasonable on a comparative basis. |
18
Tax Managed Series
Renewal of Investment Advisory Agreement
(unaudited)
| | • | | The Board also considered the other benefits the Advisor derives from its relationship with the Fund. Such other benefits include certain research products provided by soft dollars. Given the level of soft dollar transactions involving the Fund, the Board concluded that these additional benefits to the Advisor were reasonable. |
| | • | | In addition to the factors described above, the Board considered the Advisor’s personnel, investment strategies, policies and procedures relating to compliance with personal securities transactions, and reputation, expertise and resources in domestic and foreign financial markets. The Board concluded that these factors support the conclusion that the Advisor performs its services in a reasonable manner. |
| | • | | The Board did not consider economies of scale at this time because of the multiple uses of the Fund (for the Advisor’s discretionary investment account clients in addition to direct investors), the current profitability of the Advisor’s services to the Fund under the Agreement, and the overall size of the Fund complex. |
Based on the Board’s deliberations and their evaluation of the information described above, the Board, including a majority of Directors that are not “interested persons” as defined in the Investment Company Act of 1940, concluded that the compensation under the Agreement was fair and reasonable in light of the services and expenses and such other matters as the Directors considered to be relevant in the exercise of their reasonable judgment. Accordingly, the Board approved the renewal of the Agreement. In the course of their deliberations, the Directors did not identify any particular information that was all important or controlling.
19
{This page intentionally left blank}
20
Tax Managed Series
Literature Requests
(unaudited)
Proxy Voting Policies and Procedures
A description of the policies and procedures that the Fund uses to determine how to vote proxies relating to portfolio securities is available, without charge, upon request:
| | | | |
| By phone | | 1-800-466-3863 | | |
| On the Securities and Exchange | | | | |
| Commission’s (SEC) web site | | http://www.sec.gov | | |
Proxy Voting Record
Information regarding how the Fund voted proxies relating to portfolio securities during the most recent 12-month period ended June 30th is available, without charge, upon request:
| | | | |
| By phone | | 1-800-466-3863 | | |
| On the SEC’s web site | | http://www.sec.gov | | |
Quarterly Portfolio Holdings
The Series’ complete schedule of portfolio holdings for the 1st and 3rd quarters of each fiscal year are provided on Form N-Q, and are available, without charge, upon request:
| | | | |
| By phone | | 1-800-466-3863 | | |
| On the SEC’s web site | | http://www.sec.gov | | |
The Series’ Form N-Q may be reviewed and copied at the SEC’s Public Reference Room in Washington, D.C. Information on the operation of the Public Reference Room may be obtained by calling 1-800-SEC-0330.
Prospectus and Statement of Additional Information (SAI)
The prospectus and SAI provide additional information about each Series, including charges, expenses and risks. These documents are available, without charge, upon request:
| | | | |
| By phone | | 1-800-466-3863 | | |
| On the SEC’s web site | | http://www.sec.gov | | |
| On our web site | | http://www.manning-napier.com | | |
Additional information available at www.manning-napier.com
1. Fund Holdings - Month-End
2. Fund Holdings - Quarter-End
3. Shareholder Report - Annual
4. Shareholder Report - Semi-Annual
The Fund also offers electronic notification or “e-delivery” when certain documents are available on-line to be downloaded or reviewed. Direct shareholders can elect to receive electronic notification when shareholder reports, prospectus updates, and/or statements are available. If you do not currently have on-line access to your account, you can establish access by going to www.manning-napier.com, click on “Login” in the top corner of the page, and follow the prompts to self-enroll. Once enrolled, you can set your electronic notification preferences by clicking on the Account Options tab located within the green toolbar and then select E-Delivery Option. Should you have any questions on either how to establish on-line access or how to update your account settings, please contact Investor Services at 1-800-466-3863.
MNTAX-04/12-SAR


| | | | | | |
| | | | TARGET INCOME SERIES | | |
| | | | TARGET 2010 SERIES | | |
| | | | TARGET 2020 SERIES | | |
| | | | TARGET 2030 SERIES | | |
| | | | TARGET 2040 SERIES | | |
| | | | TARGET 2050 SERIES | | |
www.manning-napier.com | | | |  |
Shareholder Expense Example
(unaudited)
As a shareholder of the Series, you may incur two types of costs: (1) transaction costs, including potential wire charges on redemptions and (2) ongoing costs, including management fees and other Series expenses. This example is intended to help you understand your ongoing costs (in dollars) of investing in the Series and to compare these costs with the ongoing costs of investing in other mutual funds.
The example is based on an investment of $1,000 invested at the beginning of the period and held for the six month period (November 1, 2011 to April 30, 2012).
Actual Expenses
The Actual lines of the following tables provide information about actual account values and actual expenses. You may use the information in these lines, together with the amount you invested, to estimate the expenses that you paid over the period. Simply divide your account value by $1,000 (for example, an $8,600 account value divided by $1,000 = 8.6), then multiply the result by the number in the Actual line for the Series and Class in which you have invested under the heading entitled “Expenses Paid During Period” to estimate the expenses you paid on your account during this period.
Hypothetical Example for Comparison Purposes
The Hypothetical lines of the following tables provide information about hypothetical account values and hypothetical expenses based on the Class’ actual expense ratio and an assumed rate of return of 5% per year before expenses, which is not the Class’ actual return. The hypothetical account values and expenses may not be used to estimate the actual ending account balance or expenses you paid during the period. You may use this information to compare the ongoing costs of investing in the Series and other funds. To do so, compare this 5% hypothetical example for the Series and Class in which you have invested with the 5% hypothetical examples that appear in the shareholder reports of the other funds.
Please note that the expenses shown in the tables are meant to highlight your ongoing costs only and do not reflect any transaction costs. Therefore, the Hypothetical lines of the tables are useful in comparing ongoing costs only, and will not help you determine the relative total costs of owning different funds. In addition, if these transaction costs were included, your costs would have been higher.
| | | | | | | | |
| | | BEGINNING
ACCOUNT VALUE
11/1/11 | | ENDING
ACCOUNT VALUE
4/30/12 | | EXPENSES PAID
DURING PERIOD
11/1/11-4/30/121 | | ANNUALIZED
EXPENSE
RATIO2 |
Target Income | | | | | | | | |
Actual (Class K) | | $1,000.00 | | $1,040.10 | | $1.52 | | 0.30% |
Hypothetical3 | | $1,000.00 | | $1,023.37 | | $1.51 | | 0.30% |
Actual (Class R) | | $1,000.00 | | $1,038.60 | | $2.79 | | 0.55% |
Hypothetical3 | | $1,000.00 | | $1,022.13 | | $2.77 | | 0.55% |
Actual (Class C) | | $1,000.00 | | $1,036.50 | | $5.32 | | 1.05% |
Hypothetical3 | | $1,000.00 | | $1,019.64 | | $5.27 | | 1.05% |
Actual (Class I) | | $1,000.00 | | $1,042.50 | | $0.25 | | 0.05% |
Hypothetical3 | | $1,000.00 | | $1,024.61 | | $0.25 | | 0.05% |
1
Shareholder Expense Example
(unaudited)
| | | | | | | | |
| | | BEGINNING
ACCOUNT VALUE
11/1/11 | | ENDING
ACCOUNT VALUE
4/30/12 | | EXPENSES PAID
DURING PERIOD
11/1/11-4/30/121 | | ANNUALIZED
EXPENSE
RATIO2 |
Target 2010 | | | | | | | | |
Actual (Class K) | | $1,000.00 | | $1,048.90 | | $1.53 | | 0.30% |
Hypothetical3 | | $1,000.00 | | $1,023.37 | | $1.51 | | 0.30% |
Actual (Class R) | | $1,000.00 | | $1,047.90 | | $2.80 | | 0.55% |
Hypothetical3 | | $1,000.00 | | $1,022.13 | | $2.77 | | 0.55% |
Actual (Class C) | | $1,000.00 | | $1,044.70 | | $5.34 | | 1.05% |
Hypothetical3 | | $1,000.00 | | $1,019.64 | | $5.27 | | 1.05% |
Actual (Class I) | | $1,000.00 | | $1,050.40 | | $0.25 | | 0.05% |
Hypothetical3 | | $1,000.00 | | $1,024.61 | | $0.25 | | 0.05% |
| | | BEGINNING ACCOUNT VALUE 11/1/11 | | ENDING ACCOUNT VALUE 4/30/12 | | EXPENSES PAID DURING PERIOD 11/1/11-4/30/121 | | ANNUALIZED
EXPENSE
RATIO2 |
Target 2020 | | | | | | | | |
Actual (Class K) | | $1,000.00 | | $1,057.60 | | $1.53 | | 0.30% |
Hypothetical3 | | $1,000.00 | | $1,023.37 | | $1.51 | | 0.30% |
Actual (Class R) | | $1,000.00 | | $1,055.90 | | $2.81 | | 0.55% |
Hypothetical3 | | $1,000.00 | | $1,022.13 | | $2.77 | | 0.55% |
Actual (Class C) | | $1,000.00 | | $1,052.60 | | $5.36 | | 1.05% |
Hypothetical3 | | $1,000.00 | | $1,019.64 | | $5.27 | | 1.05% |
Actual (Class I) | | $1,000.00 | | $1,058.20 | | $0.26 | | 0.05% |
Hypothetical3 | | $1,000.00 | | $1,024.61 | | $0.25 | | 0.05% |
| | | BEGINNING ACCOUNT VALUE 11/1/11 | | ENDING ACCOUNT VALUE 4/30/12 | | EXPENSES PAID DURING PERIOD 11/1/11-4/30/121 | | ANNUALIZED
EXPENSE
RATIO2 |
Target 2030 | | | | | | | | |
Actual (Class K) | | $1,000.00 | | $1,058.10 | | $1.54 | | 0.30% |
Hypothetical3 | | $1,000.00 | | $1,023.37 | | $1.51 | | 0.30% |
Actual (Class R) | | $1,000.00 | | $1,056.20 | | $2.81 | | 0.55% |
Hypothetical3 | | $1,000.00 | | $1,022.13 | | $2.77 | | 0.55% |
Actual (Class C) | | $1,000.00 | | $1,053.90 | | $5.36 | | 1.05% |
Hypothetical3 | | $1,000.00 | | $1,019.64 | | $5.27 | | 1.05% |
Actual (Class I) | | $1,000.00 | | $1,059.60 | | $0.26 | | 0.05% |
Hypothetical3 | | $1,000.00 | | $1,024.61 | | $0.25 | | 0.05% |
2
Shareholder Expense Example
(unaudited)
| | | | | | | | |
| | | BEGINNING
ACCOUNT VALUE
11/1/11 | | ENDING
ACCOUNT VALUE
4/30/12 | | EXPENSES PAID
DURING PERIOD
11/1/11-4/30/121 | | ANNUALIZED
EXPENSE
RATIO2 |
Target 2040 | | | | | | | | |
Actual (Class K) | | $1,000.00 | | $1,071.60 | | $1.55 | | 0.30% |
Hypothetical3 | | $1,000.00 | | $1,023.37 | | $1.51 | | 0.30% |
Actual (Class R) | | $1,000.00 | | $1,069.70 | | $2.83 | | 0.55% |
Hypothetical3 | | $1,000.00 | | $1,022.13 | | $2.77 | | 0.55% |
Actual (Class C) | | $1,000.00 | | $1,066.90 | | $5.40 | | 1.05% |
Hypothetical3 | | $1,000.00 | | $1,019.64 | | $5.27 | | 1.05% |
Actual (Class I) | | $1,000.00 | | $1,071.90 | | $0.26 | | 0.05% |
Hypothetical3 | | $1,000.00 | | $1,024.61 | | $0.25 | | 0.05% |
| | | BEGINNING ACCOUNT VALUE 11/1/11 | | ENDING ACCOUNT VALUE 4/30/12 | | EXPENSES PAID DURING PERIOD 11/1/11-4/30/121 | | ANNUALIZED
EXPENSE
RATIO2 |
Target 2050 | | | | | | | | |
Actual (Class K) | | $1,000.00 | | $1,070.90 | | $1.54 | | 0.30% |
Hypothetical3 | | $1,000.00 | | $1,023.37 | | $1.51 | | 0.30% |
Actual (Class R) | | $1,000.00 | | $1,069.60 | | $2.83 | | 0.55% |
Hypothetical3 | | $1,000.00 | | $1,022.13 | | $2.77 | | 0.55% |
Actual (Class C) | | $1,000.00 | | $1,066.50 | | $5.39 | | 1.05% |
Hypothetical3 | | $1,000.00 | | $1,019.64 | | $5.27 | | 1.05% |
Actual (Class I) | | $1,000.00 | | $1,072.00 | | $0.26 | | 0.05% |
Hypothetical3 | | $1,000.00 | | $1,024.61 | | $0.25 | | 0.05% |
1Expenses are equal to the Class’ annualized expense ratio (for the six-month period), multiplied by the average account value over the period, multiplied by 182/366 (to reflect the one-half year period). Expenses are based on the most recent fiscal half year. The Class’ total returns would have been lower had certain expenses not been reimbursed during the period.
2Expense ratios of the Class do not include fees and expenses indirectly incurred by the underlying funds. If these expenses were included, the expense ratios would have been higher.
3Assumes 5% annual return before expenses.
3
Portfolio Composition as of April 30, 2012 - Asset Allocation1
(unaudited)
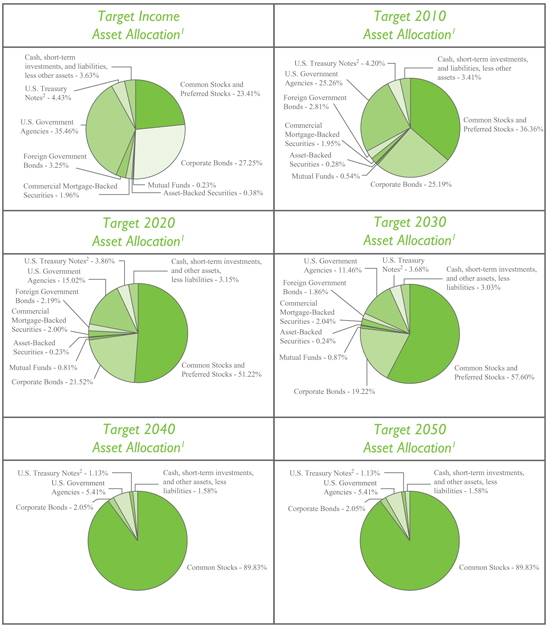
1 As a percentage of net assets of the underlying investment(s) for each Series.
2 A U.S. Treasury Note is an intermediate-term obligation of the U.S. Treasury issued with a maturity period between one and ten years.
4
Statement of Assets and Liabilities
April 30, 2012 (unaudited)
| | | | | | | | | | | | | | | | | | | | | | | | |
| | | TARGET
INCOME | | | TARGET
2010 | | | TARGET 2020 | | | TARGET 2030 | | | TARGET 2040 | | | TARGET 2050 | |
ASSETS: | | | | | | | | | | | | | | | | | | | | | | | | |
Manning & Napier Pro-Blend® Maximum Term | | | | | | | | | | | | | | | | | | | | | | | | |
Series - Class I (7,021,587 shares and 2,721,635 shares, respectively) | | $ | — | | | $ | — | | | $ | — | | | $ | — | | | $ | 75,692,710 | | | $ | 29,339,220 | |
Manning & Napier Pro-Blend® Extended Term | | | | | | | | | | | | | | | | | | | | | | | | |
Series - Class I (5,698,980 shares and 10,744,667 shares, respectively) | | | — | | | | — | | | | 58,927,451 | | | | 111,099,857 | | | | — | | | | — | |
Manning & Napier Pro-Blend® Moderate Term | | | | | | | | | | | | | | | | | | | | | | | | |
Series - Class I (2,468,265 shares and 5,538,327 shares, respectively) | | | — | | | | 25,966,143 | | | | 58,263,196 | | | | — | | | | — | | | | — | |
Manning & Napier Pro-Blend® Conservative Term | | | | | | | | | | | | | | | | | | | | | | | | |
Series - Class I (5,128,219 shares and 1,562,472 shares, respectively) | | | 55,384,766 | | | | 16,874,695 | | | | — | | | | — | | | | — | | | | — | |
| | | | | | | | | | | | | | | | | | | | | | | | |
Total investments in securities: | | | | | | | | | | | | | | | | | | | | | | | | |
At value* | | | 55,384,766 | | | | 42,840,838 | | | | 117,190,647 | | | | 111,099,857 | | | | 75,692,710 | | | | 29,339,220 | |
Receivable from Advisor
(Note 3) | | | 8,611 | | | | 9,143 | | | | 7,071 | | | | 7,173 | | | | 8,094 | | | | 9,663 | |
Receivable for securities sold | | | 520 | | | | 54,122 | | | | 507 | | | | 507 | | | | 507 | | | | 507 | |
Receivable for fund shares sold | | | 389,274 | | | | 15,421 | | | | 427,159 | | | | 390,573 | | | | 168,574 | | | | 40,191 | |
Prepaid registration and filing fees | | | 22,665 | | | | 23,665 | | | | 26,318 | | | | 24,814 | | | | 24,012 | | | | 23,929 | |
| | | | | | | | | | | | | | | | | | | | | | | | |
| | | | | | |
TOTAL ASSETS | | | 55,805,836 | | | | 42,943,189 | | | | 117,651,702 | | | | 111,522,924 | | | | 75,893,897 | | | | 29,413,510 | |
| | | | | | | | | | | | | | | | | | | | | | | | |
| | | | | | |
LIABILITIES: | | | | | | | | | | | | | | | | | | | | | | | | |
Accrued fund accounting and administration fees
(Note 3) | | | 11,186 | | | | 11,080 | | | | 11,601 | | | | 11,558 | | | | 11,317 | | | | 10,996 | |
Accrued distribution and service (Rule 12b-1) fees
(Note 3) | | | 11,417 | | | | 8,349 | | | | 22,788 | | | | 19,773 | | | | 14,978 | | | | 6,462 | |
Accrued transfer agent fees
(Note 3) | | | 2,545 | | | | 2,129 | | | | 2,525 | | | | 2,274 | | | | 2,477 | | | | 2,442 | |
Accrued Chief Compliance Officer service fees
(Note 3) | | | 416 | | | | 416 | | | | 416 | | | | 416 | | | | 416 | | | | 416 | |
Accrued Directors’ fees
(Note 3) | | | 326 | | | | 173 | | | | 459 | | | | 360 | | | | 265 | | | | 108 | |
Payable for securities purchased | | | 302,988 | | | | — | | | | 382,853 | | | | 327,346 | | | | 137,551 | | | | 38,501 | |
Payable for fund shares repurchased | | | 86,286 | | | | 69,035 | | | | 44,305 | | | | 60,151 | | | | 30,792 | | | | 1,196 | |
Audit fees payable | | | 11,432 | | | | 11,287 | | | | 11,271 | | | | 11,287 | | | | 11,342 | | | | 11,389 | |
Other payables and accrued expenses | | | 2,896 | | | | 3,235 | | | | 4,670 | | | | 4,828 | | | | 3,580 | | | | 2,857 | |
| | | | | | | | | | | | | | | | | | | | | | | | |
TOTAL LIABILITIES | | | 429,492 | | | | 105,704 | | | | 480,888 | | | | 437,993 | | | | 212,718 | | | | 74,367 | |
| | | | | | | | | | | | | | | | | | | | | | | | |
| | | | | | |
TOTAL NET ASSETS | | $ | 55,376,344 | | | $ | 42,837,485 | | | $ | 117,170,814 | | | $ | 111,084,931 | | | $ | 75,681,179 | | | $ | 29,339,143 | |
| | | | | | | | | | | | | | | | | | | | | | | | |
| | | | | | |
NET ASSETS CONSIST OF: | | | | | | | | | | | | | | | | | | | | | | | | |
Capital stock | | | 52,165 | | | | 43,638 | | | | 120,636 | | | | 114,643 | | | | 74,685 | | | | 27,624 | |
Additional paid-in-capital | | | 48,561,059 | | | | 40,424,417 | | | | 110,264,770 | | | | 104,041,914 | | | | 69,386,458 | | | | 26,956,869 | |
Undistributed net investment income (loss) | | | (73,203 | ) | | | (170,621 | ) | | | (191,450 | ) | | | 18,178 | | | | (41,051 | ) | | | (24,301 | ) |
Accumulated net realized gain on underlying series | | | 1,606,651 | | | | 1,491,400 | | | | 4,598,961 | | | | 3,610,307 | | | | 184,160 | | | | 31,962 | |
Net unrealized appreciation on underlying series | | | 5,229,672 | | | | 1,048,651 | | | | 2,377,897 | | | | 3,299,889 | | | | 6,076,927 | | | | 2,346,989 | |
| | | | | | | | | | | | | | | | | | | | | | | | |
| | | | | | |
TOTAL NET ASSETS | | $ | 55,376,344 | | | $ | 42,837,485 | | | $ | 117,170,814 | | | $ | 111,084,931 | | | $ | 75,681,179 | | | $ | 29,339,143 | |
| | | | | | | | | | | | | | | | | | | | | | | | |
The accompanying notes are an integral part of the financial statements.
5
Statement of Assets and Liabilities
April 30, 2012 (unaudited)
| | | | | | | | | | | | | | | | | | | | | | | | |
| | | TARGET
INCOME | | | TARGET 2010 | | | TARGET 2020 | | | TARGET 2030 | | | TARGET 2040 | | | TARGET 2050 | |
Class K | | | | | | | | | | | | | | | | | | | | | | | | |
Net Assets | | $ | 44,517,202 | | | $ | 23,468,255 | | | $ | 54,411,244 | | | $ | 60,323,143 | | | $ | 41,140,293 | | | $ | 21,630,282 | |
Shares Outstanding | | | 4,190,713 | | | | 2,389,753 | | | | 5,594,135 | | | | 6,231,963 | | | | 4,059,203 | | | | 2,035,449 | |
Net Asset Value, Offering Price, and Redemption Price per share | | $ | 10.62 | | | $ | 9.82 | | | $ | 9.73 | | | $ | 9.68 | | | $ | 10.14 | | | $ | 10.63 | |
| | | | | | |
Class R | | | | | | | | | | | | | | | | | | | | | | | | |
Net Assets | | $ | 3,706,575 | | | $ | 5,684,980 | | | $ | 20,773,852 | | | $ | 13,160,867 | | | $ | 14,624,407 | | | $ | 3,238,732 | |
Shares Outstanding | | | 352,247 | | | | 583,750 | | | | 2,159,825 | | | | 1,369,059 | | | | 1,452,836 | | | | 306,536 | |
Net Asset Value, Offering Price, and Redemption Price per share | | $ | 10.52 | | | $ | 9.74 | | | $ | 9.62 | | | $ | 9.61 | | | $ | 10.07 | | | $ | 10.57 | |
| | | | | | |
Class C | | | | | | | | | | | | | | | | | | | | | | | | |
Net Assets | | $ | 1,090,092 | | | $ | 1,557,723 | | | $ | 4,303,284 | | | $ | 2,895,400 | | | $ | 950,366 | | | $ | 1,049,877 | |
Shares Outstanding | | | 104,546 | | | | 160,438 | | | | 448,606 | | | | 302,785 | | | | 95,354 | | | | 100,534 | |
Net Asset Value, Offering Price, and Redemption Price per share | | $ | 10.43 | | | $ | 9.71 | | | $ | 9.59 | | | $ | 9.56 | | | $ | 9.97 | | | $ | 10.44 | |
| | | | | | |
Class I | | | | | | | | | | | | | | | | | | | | | | | | |
Net Assets | | $ | 6,062,475 | | | $ | 12,126,527 | | | $ | 37,682,434 | | | $ | 34,705,521 | | | $ | 18,966,113 | | | $ | 3,420,252 | |
Shares Outstanding | | | 568,953 | | | | 1,229,895 | | | | 3,861,054 | | | | 3,560,454 | | | | 1,861,096 | | | | 319,905 | |
Net Asset Value, Offering Price, and Redemption Price per share | | $ | 10.66 | | | $ | 9.86 | | | $ | 9.76 | | | $ | 9.75 | | | $ | 10.19 | | | $ | 10.69 | |
| | | | | | |
*At identified cost | | $ | 50,155,094 | | | $ | 41,792,187 | | | $ | 114,812,750 | | | $ | 107,799,968 | | | $ | 69,615,783 | | | $ | 26,992,231 | |
| | | | | | | | | | | | | | | | | | | | | | | | |
The accompanying notes are an integral part of the financial statements.
6
Statement of Operations
For the Six Months Ended April 30, 2012 (unaudited)
| | | | | | | | | | | | | | | | | | | | | | | | |
| | | TARGET
INCOME | | | TARGET
2010 | | | TARGET
2020 | | | TARGET
2030 | | | TARGET
2040 | | | TARGET
2050 | |
INVESTMENT INCOME: | | | | | | | | | | | | | | | | | | | | | | | | |
Income distributions from underlying series | | $ | 783,195 | | | $ | 586,736 | | | $ | 1,477,879 | | | $ | 1,232,285 | | | $ | 419,707 | | | $ | 157,899 | |
| | | | | | | | | | | | | | | | | | | | | | | | |
| | | | | | |
EXPENSES: | | | | | | | | | | | | | | | | | | | | | | | | |
Distribution and services (Rule 12b-1) fees
(Class K) (Note 3) | | | 54,146 | | | | 28,353 | | | | 64,136 | | | | 71,228 | | | | 47,547 | | | | 24,289 | |
Distribution and services (Rule 12b-1) fees
(Class C) (Note 3) | | | 6,217 | | | | 8,628 | | | | 20,381 | | | | 13,157 | | | | 4,491 | | | | 4,861 | |
Distribution and services (Rule 12b-1) fees
(Class R) (Note 3) | | | 5,734 | | | | 13,112 | | | | 45,754 | | | | 27,581 | | | | 32,606 | | | | 6,908 | |
Fund accounting and administration fees
(Note 3) | | | 22,822 | | | | 22,682 | | | | 23,519 | | | | 23,440 | | | | 23,023 | | | | 22,493 | |
Transfer agent fees (Note 3) | | | 4,833 | | | | 4,398 | | | | 5,476 | | | | 5,231 | | | | 5,094 | | | | 4,965 | |
Chief Compliance Officer service
fees (Note 3) | | | 1,246 | | | | 1,246 | | | | 1,246 | | | | 1,246 | | | | 1,246 | | | | 1,246 | |
Directors’ fees (Note 3) | | | 738 | | | | 543 | | | | 1,356 | | | | 1,259 | | | | 864 | | | | 322 | |
Registration and filing fees | | | 22,410 | | | | 22,424 | | | | 22,490 | | | | 22,467 | | | | 22,440 | | | | 22,426 | |
Audit fees | | | 7,937 | | | | 7,938 | | | | 7,941 | | | | 7,941 | | | | 7,941 | | | | 7,937 | |
Custodian fees | | | 1,237 | | | | 1,993 | | | | 2,235 | | | | 2,222 | | | | 1,239 | | | | 1,237 | |
Miscellaneous | | | 5,519 | | | | 5,491 | | | | 7,630 | | | | 7,378 | | | | 6,362 | | | | 5,241 | |
| | | | | | | | | | | | | | | | | | | | | | | | |
Total Expenses | | | 132,839 | | | | 116,808 | | | | 202,164 | | | | 183,150 | | | | 152,853 | | | | 101,925 | |
Less reduction of expenses
(Note 3) | | | (52,915 | ) | | | (55,708 | ) | | | (44,130 | ) | | | (44,999 | ) | | | (50,357 | ) | | | (58,720 | ) |
| | | | | | | | | | | | | | | | | | | | | | | | |
Net Expenses | | | 79,924 | | | | 61,100 | | | | 158,034 | | | | 138,151 | | | | 102,496 | | | | 43,205 | |
| | | | | | | | | | | | | | | | | | | | | | | | |
NET INVESTMENT INCOME | | | 703,271 | | | | 525,636 | | | | 1,319,845 | | | | 1,094,134 | | | | 317,211 | | | | 114,694 | |
| | | | | | | | | | | | | | | | | | | | | | | | |
| | | | | |
REALIZED AND UNREALIZED | | | | | | | | | | | | | | | | | | | | | |
GAIN (LOSS) ON UNDERLYING SERIES: | | | | | | | | | | | | | | | | | | | | | | | | |
Net realized gain (loss) on underlying series | | | 626,955 | | | | 164,561 | | | | 346,582 | | | | 166,453 | | | | 185,661 | | | | 34,374 | |
Distributions of realized gains from underlying series | | | 982,013 | | | | 1,327,217 | | | | 4,255,728 | | | | 3,448,916 | | | | — | | | | — | |
Net change in unrealized appreciation (depreciation) on underlying series | | | (196,264 | ) | | | (43,131 | ) | | | 244,116 | | | | 1,223,367 | | | | 4,320,616 | | | | 1,688,931 | |
| | | | | | | | | | | | | | | | | | | | | | | | |
NET REALIZED AND UNREALIZED GAIN (LOSS) ON UNDERLYING SERIES | | | 1,412,704 | | | | 1,448,647 | | | | 4,846,426 | | | | 4,838,736 | | | | 4,506,277 | | | | 1,723,305 | |
| | | | | | | | | | | | | | | | | | | | | | | | |
NET INCREASE IN NET ASSETS RESULTING FROM OPERATIONS | | $ | 2,115,975 | | | $ | 1,974,283 | | | $ | 6,166,271 | | | $ | 5,932,870 | | | $ | 4,823,488 | | | $ | 1,837,999 | |
| | | | | | | | | | | | | | | | | | | | | | | | |
The accompanying notes are an integral part of the financial statements.
7
Statements of Changes in Net Assets
| | | | | | | | | | | | | | | | | | | | | | | | |
| | | TARGET INCOME
FOR THE SIX | | | | | | TARGET 2010
FOR THE SIX | | | | | | TARGET 2020
FOR THE SIX | | | | |
| | | MONTHS ENDED
4/30/12
(UNAUDITED) | | | FOR THE
YEAR ENDED
10/31/11 | | | MONTHS ENDED
4/30/12
(UNAUDITED) | | | FOR THE
YEAR ENDED
10/31/11 | | | MONTHS ENDED
4/30/12
(UNAUDITED) | | | FOR THE YEAR ENDED
10/31/11 | |
INCREASE (DECREASE) IN NET ASSETS: | | | | | | | | | | | | | | | | | | | | | | | | |
| | | | | | |
OPERATIONS: | | | | | | | | | | | | | | | | | | | | | | | | |
| | | | | | |
Net investment income | | $ | 703,271 | | | $ | 1,006,787 | | | $ | 525,636 | | | $ | 611,903 | | | $ | 1,319,845 | | | $ | 1,649,009 | |
Net realized gain (loss) on underlying series | | | 626,955 | | | | 1,050,632 | | | | 164,561 | | | | 3,090,004 | | | | 346,582 | | | | 7,146,008 | |
Distributions of realized gains from underlying series | | | 982,013 | | | | 1,489,802 | | | | 1,327,217 | | | | 614,501 | | | | 4,255,728 | | | | 302,122 | |
Net change in unrealized appreciation (depreciation) on underlying series | | | (196,264 | ) | | | (2,211,399 | ) | | | (43,131 | ) | | | (3,243,066 | ) | | | 244,116 | | | | (6,642,777 | ) |
| | | | | | | | | | | | | | | | | | | | | | | | |
| | | | | | |
Net increase from operations | | | 2,115,975 | | | | 1,335,822 | | | | 1,974,283 | | | | 1,073,342 | | | | 6,166,271 | | | | 2,454,362 | |
| | | | | | | | | | | | | | | | | | | | | | | | |
| | | | | | |
DISTRIBUTIONS TO SHAREHOLDERS (Note 8): | | | | | | | | | | | | | | | | | | | | | | | | |
| | | | | | |
From net investment income
(Class K) | | | (737,666 | ) | | | (1,420,895 | ) | | | (418,995 | ) | | | (479,554 | ) | | | (787,891 | ) | | | (1,234,032 | ) |
From net investment income
(Class R) | | | (11,052 | ) | | | (9,440 | ) | | | (88,480 | ) | | | (58,775 | ) | | | (250,321 | ) | | | (218,696 | ) |
From net investment income
(Class C) | | | (19,533 | ) | | | (29,218 | ) | | | (25,712 | ) | | | (24,168 | ) | | | (50,831 | ) | | | (52,453 | ) |
From net investment income
(Class I) | | | (97,402 | ) | | | (12,717 | ) | | | (225,399 | ) | | | (29,812 | ) | | | (594,098 | ) | | | (86,948 | ) |
From net realized gain on investments
(Class K) | | | (1,776,212 | ) | | | (492,224 | ) | | | (2,048,959 | ) | | | (529,696 | ) | | | (3,524,215 | ) | | | (2,143,359 | ) |
From net realized gain on investments (Class R) | | | (27,719 | ) | | | (3,558 | ) | | | (462,011 | ) | | | (72,781 | ) | | | (1,200,023 | ) | | | (426,909 | ) |
From net realized gain on investments (Class C) | | | (60,498 | ) | | | (12,892 | ) | | | (171,418 | ) | | | (43,987 | ) | | | (303,902 | ) | | | (140,280 | ) |
From net realized gain on investments (Class I) | | | (216,121 | ) | | | (3,136 | ) | | | (1,019,074 | ) | | | (27,354 | ) | | | (2,414,187 | ) | | | (128,094 | ) |
| | | | | | | | | | | | | | | | | | | | | | | | |
| | | | | | |
Total distributions to shareholders | | | (2,946,203 | ) | | | (1,984,080 | ) | | | (4,460,048 | ) | | | (1,266,127 | ) | | | (9,125,468 | ) | | | (4,430,771 | ) |
| | | | | | | | | | | | | | | | | | | | | | | | |
| | | | | | |
CAPITAL STOCK ISSUED AND REPURCHASED: | | | | | | | | | | | | | | | | | | | | | | | | |
| | | | | | |
Net increase from capital share transactions
(Note 6) | | | 5,479,236 | | | | 2,650,464 | | | | 4,798,633 | | | | 5,446,293 | | | | 18,317,774 | | | | 19,669,116 | |
| | | | | | | | | | | | | | | | | | | | | | | | |
| | | | | | |
Net increase in net assets | | | 4,649,008 | | | | 2,002,206 | | | | 2,312,868 | | | | 5,253,508 | | | | 15,358,577 | | | | 17,692,707 | |
| | | | | | |
NET ASSETS: | | | | | | | | | | | | | | | | | | | | | | | | |
| | | | | | |
Beginning of period | | | 50,727,336 | | | | 48,725,130 | | | | 40,524,617 | | | | 35,271,109 | | | | 101,812,237 | | | | 84,119,530 | |
| | | | | | | | | | | | | | | | | | | | | | | | |
| | | | | | |
End of period1 | | $ | 55,376,344 | | | $ | 50,727,336 | | | $ | 42,837,485 | | | $ | 40,524,617 | | | $ | 117,170,814 | | | $ | 101,812,237 | |
| | | | | | | | | | | | | | | | | | | | | | | | |
| | | | | | |
1 Including undistributed net investment income of: | | | (73,203 | ) | | | 89,179 | | | | (170,621 | ) | | | 62,329 | | | | (191,450 | ) | | | 171,846 | |
The accompanying notes are an integral part of the financial statements.
8
Statements of Changes in Net Assets
| | | | | | | | | | | | | | | | | | | | | | | | |
| | | TARGET 2030
FOR THE SIX | | | | | | TARGET 2040
FOR THE SIX | | | | | | TARGET 2050
FOR THE SIX | | | | |
| | | MONTHS ENDED
4/30/12
(UNAUDITED) | | | FOR THE
YEAR ENDED
10/31/11 | | | MONTHS ENDED
4/30/12
(UNAUDITED) | | | FOR THE
YEAR ENDED
10/31/11 | | | MONTHS ENDED
4/30/12
(UNAUDITED) | | | FOR THE
YEAR ENDED
10/31/11 | |
INCREASE (DECREASE) IN NET ASSETS: | | | | | | | | | | | | | | | | | | | | | | | | |
| | | | | | |
OPERATIONS: | | | | | | | | | | | | | | | | | | | | | | | | |
| | | | | | |
Net investment income | | $ | 1,094,134 | | | $ | 1,285,878 | | | $ | 317,211 | | | $ | 472,744 | | | $ | 114,694 | | | $ | 162,934 | |
Net realized gain (loss) on underlying series | | | 166,453 | | | | 6,856,640 | | | | 185,661 | | | | 3,464,524 | | | | 34,374 | | | | 457,861 | |
Distributions of realized gains from underlying series | | | 3,448,916 | | | | — | | | | — | | | | — | | | | — | | | | — | |
Net change in unrealized appreciation (depreciation) on underlying series | | | 1,223,367 | | | | (5,730,579 | ) | | | 4,320,616 | | | | (3,996,816 | ) | | | 1,688,931 | | | | (661,564 | ) |
| | | | | | | | | | | | | | | | | | | | | | | | |
| | | | | | |
Net increase from operations | | | 5,932,870 | | | | 2,411,939 | | | | 4,823,488 | | | | (59,548 | ) | | | 1,837,999 | | | | (40,769 | ) |
| | | | | | | | | | | | | | | | | | | | | | | | |
| | | | | | |
DISTRIBUTIONS TO SHAREHOLDERS (Note 8): | | | | | | | | | | | | | | | | | | | | | | | | |
| | | | | | |
From net investment income (Class K) | | | (676,133 | ) | | | (1,038,708 | ) | | | (231,537 | ) | | | (364,102 | ) | | | (122,417 | ) | | | (130,602 | ) |
From net investment income (Class R) | | | (110,325 | ) | | | (95,429 | ) | | | (64,451 | ) | | | (55,126 | ) | | | (13,145 | ) | | | (13,664 | ) |
From net investment income (Class C) | | | (21,358 | ) | | | (20,789 | ) | | | (2,080 | ) | | | (2,590 | ) | | | (2,607 | ) | | | (3,344 | ) |
From net investment income (Class I) | | | (424,498 | ) | | | (58,516 | ) | | | (121,802 | ) | | | (14,836 | ) | | | (19,812 | ) | | | (1,727 | ) |
From net realized gain on investments
(Class K) | | | (3,843,451 | ) | | | (1,998,432 | ) | | | (1,939,029 | ) | | | (405,746 | ) | | | (344,780 | ) | | | (29,662 | ) |
From net realized gain on investments
(Class R) | | | (685,589 | ) | | | (212,808 | ) | | | (649,307 | ) | | | (81,999 | ) | | | (47,839 | ) | | | (4,292 | ) |
From net realized gain on investments
(Class C) | | | (181,828 | ) | | | (68,377 | ) | | | (48,306 | ) | | | (8,299 | ) | | | (18,248 | ) | | | (1,754 | ) |
From net realized gain on investments
(Class I) | | | (2,137,168 | ) | | | (89,785 | ) | | | (821,635 | ) | | | (10,968 | ) | | | (46,342 | ) | | | (255 | ) |
| | | | | | | | | | | | | | | | | | | | | | | | |
| | | | | | |
Total distributions to shareholders | | | (8,080,350 | ) | | | (3,582,844 | ) | | | (3,878,147 | ) | | | (943,666 | ) | | | (615,190 | ) | | | (185,300 | ) |
| | | | | | | | | | | | | | | | | | | | | | | | |
| | | | | | |
CAPITAL STOCK ISSUED AND REPURCHASED: | | | | | | | | | | | | | | | | | | | | | | | | |
| | | | | | |
Net increase from capital share transactions (Note 6) | | | 17,788,866 | | | | 18,055,075 | | | | 11,197,168 | | | | 12,014,839 | | | | 4,067,547 | | | | 5,906,849 | |
| | | | | | | | | | | | | | | | | | | | | | | | |
| | | | | | |
Net increase in net assets | | | 15,641,386 | | | | 16,884,170 | | | | 12,142,509 | | | | 11,011,625 | | | | 5,290,356 | | | | 5,680,780 | |
| | | | | | |
NET ASSETS: | | | | | | | | | | | | | | | | | | | | | | | | |
| | | | | | |
Beginning of period | | | 95,443,545 | | | | 78,559,375 | | | | 63,538,670 | | | | 52,527,045 | | | | 24,048,787 | | | | 18,368,007 | |
| | | | | | | | | | | | | | | | | | | | | | | | |
| | | | | | |
End of period1 | | $ | 111,084,931 | | | $ | 95,443,545 | | | $ | 75,681,179 | | | $ | 63,538,670 | | | $ | 29,339,143 | | | $ | 24,048,787 | |
| | | | | | | | | | | | | | | | | | | | | | | | |
| | | | | | |
1 Including undistributed net investment income of: | | | 18,178 | | | | 156,358 | | | | (41,051 | ) | | | 61,608 | | | | (24,301 | ) | | | 18,986 | |
The accompanying notes are an integral part of the financial statements.
9
Financial Highlights
| | | | | | | | | | | | | | | | | | | | |
| TARGET INCOME SERIES CLASS K | | FOR THE SIX
MONTHS ENDED
| | | FOR THE YEARS ENDED | | | FOR THE PERIOD | |
| | | 4/30/12
(UNAUDITED) | | | 10/31/11 | | | 10/31/10 | | | 10/31/09 | | | 3/28/081 TO 10/31/08 | |
Per share data (for a share outstanding throughout each period): | | | | | | | | | | | | | | | | | | | | |
Net asset value - Beginning of period | | $ | 10.86 | | | $ | 11.02 | | | $ | 10.13 | | | $ | 9.30 | | | $ | 10.00 | |
| | | | | | | | | | | | | | | | | | | | |
Income (loss) from investment operations: | | | | | | | | | | | | | | | | | | | | |
Net investment income (loss)2 | | | 0.15 | | | | 0.23 | | | | 0.19 | | | | 0.03 | | | | (0.01 | ) |
Net realized and unrealized gain (loss) on underlying series | | | 0.25 | | | | 0.06 | | | | 0.92 | | | | 1.04 | | | | (0.69 | ) |
| | | | | | | | | | | | | | | | | | | | |
| | | | | |
Total from investment operations | | | 0.40 | | | | 0.29 | | | | 1.11 | | | | 1.07 | | | | (0.70 | ) |
| | | | | | | | | | | | | | | | | | | | |
| | | | | |
Less distributions to shareholders: | | | | | | | | | | | | | | | | | | | | |
From net investment income | | | (0.19 | ) | | | (0.33 | ) | | | (0.19 | ) | | | (0.24 | ) | | | — | |
From net realized gain on investments | | | (0.45 | ) | | | (0.12 | ) | | | (0.03 | ) | | | — | | | | — | |
| | | | | | | | | | | | | | | | | | | | |
| | | | | |
Total distributions to shareholders | | | (0.64 | ) | | | (0.45 | ) | | | (0.22 | ) | | | (0.24 | ) | | | — | |
| | | | | | | | | | | | | | | | | | | | |
Net asset value - End of period | | $ | 10.62 | | | $ | 10.86 | | | $ | 11.02 | | | $ | 10.13 | | | $ | 9.30 | |
| | | | | | | | | | | | | | | | | | | | |
Net assets - End of period (000’s omitted) | | $ | 44,517 | | | $ | 44,682 | | | $ | 46,886 | | | $ | 42,116 | | | $ | 70,620 | 3 |
| | | | | | | | | | | | | | | | | | | | |
| | | | | |
Total return4 | | | 4.01 | % | | | 2.77 | % | | | 11.22 | % | | | 11.80 | % | | | (7.00 | %) |
Ratios (to average net assets)/Supplemental Data: | | | | | | | | | | | | | | | | | | | | |
Expenses* | | | 0.30 | %5,6 | | | 0.30 | %7 | | | 0.28 | %8,9 | | | 0.30 | %9 | | | 0.30 | %5,9 |
Net investment income (loss) | | | 2.79 | %5 | | | 2.11 | % | | | 1.83 | % | | | 0.31 | % | | | (0.27 | %)5 |
Series portfolio turnover10 | | | 8 | % | | | 14 | % | | | 9 | % | | | 13 | % | | | 0 | % |
|
| *The investment advisor paid a portion of the Series’ expenses. If these expenses had been incurred by the Series, the expense ratios (to average net assets) would have been increased by the following amounts: | |
| | | | | |
| | | 0.21 | %5,6 | | | 0.22 | %7 | | | 0.25 | %9 | | | 0.41 | %9 | | | 1,571 | %5,9,11 |
| TARGET INCOME SERIES CLASS R | | FOR THE SIX
MONTHS ENDED
| | | FOR THE YEARS ENDED | | | FOR THE PERIOD | |
| | | 4/30/12
(UNAUDITED) | | | 10/31/11 | | | 10/31/10 | | | 10/31/09 | | | 3/28/081 TO 10/31/08
| |
Per share data (for a share outstanding throughout each period): | | | | | | | | | | | | | | | | | | | | |
Net asset value - Beginning of period | | $ | 10.77 | | | $ | 10.93 | | | $ | 10.08 | | | $ | 9.29 | | | $ | 10.00 | |
| | | | | | | | | | | | | | | | | | | | |
Income (loss) from investment operations: | | | | | | | | | | | | | | | | | | | | |
Net investment income (loss)2 | | | 0.02 | | | | 0.16 | | | | 0.09 | | | | (0.05 | ) | | | 0.02 | |
Net realized and unrealized gain (loss) on underlying series | | | 0.36 | | | | 0.10 | | | | 0.99 | | | | 1.09 | | | | (0.73 | ) |
| | | | | | | | | | | | | | | | | | | | |
| | | | | |
Total from investment operations | | | 0.38 | | | | 0.26 | | | | 1.08 | | | | 1.04 | | | | (0.71 | ) |
| | | | | | | | | | | | | | | | | | | | |
| | | | | |
Less distributions to shareholders: | | | | | | | | | | | | | | | | | | | | |
From net investment income | | | (0.18 | ) | | | (0.30 | ) | | | (0.20 | ) | | | (0.25 | ) | | | — | |
From net realized gain on investments | | | (0.45 | ) | | | (0.12 | ) | | | (0.03 | ) | | | — | | | | — | |
| | | | | | | | | | | | | | | | | | | | |
Total distributions to shareholders | | | (0.63 | ) | | | (0.42 | ) | | | (0.23 | ) | | | (0.25 | ) | | | — | |
| | | | | | | | | | | | | | | | | | | | |
Net asset value - End of period | | $ | 10.52 | | | $ | 10.77 | | | $ | 10.93 | | | $ | 10.08 | | | $ | 9.29 | |
| | | | | | | | | | | | | | | | | | | | |
Net assets - End of period (000’s omitted) | | $ | 3,707 | | | $ | 553 | | | $ | 347 | | | $ | 54 | | | $ | 93 | 3 |
| | | | | | | | | | | | | | | | | | | | |
| | | | | |
Total return4 | | | 3.86 | % | | | 2.50 | % | | | 10.97 | % | | | 11.44 | % | | | (7.10 | %) |
Ratios (to average net assets)/Supplemental Data: | | | | | | | | | | | | | | | | | | | | |
Expenses* | | | 0.55 | %5,6 | | | 0.55 | %7 | | | 0.54 | %8,9 | | | 0.55 | %9 | | | 0.55 | %5,9 |
Net investment income (loss) | | | 0.35 | %5 | | | 1.47 | % | | | 0.81 | % | | | (0.51 | %) | | | 0.34 | %5 |
Series portfolio turnover10 | | | 8 | % | | | 14 | % | | | 9 | % | | | 13 | % | | | 0 | % |
|
| *The investment advisor paid a portion of the Series’ expenses. If these expenses had been incurred by the Series, the expense ratios (to average net assets) would have been increased by the following amounts: | |
| | | 0.21 | %5,6 | | | 0.22 | %7 | | | 0.37 | %9 | | | 169.34 | %9 | | | 43,127 | %5,9,11 |
1Commencement of operations.
2Calculated based on average shares outstanding during the period.
3Represents the whole number without rounding to the 000’s.
4Represents aggregate total return for the period indicated, and assumes reinvestment of all distributions. Total return would have been lower had certain expenses not been reimbursed during the period. Periods less than one year are not annualized.
5Annualized.
6Expense ratios do not include expenses of the underlying series in which the Series invests. The expense ratio of the underlying series was 0.67%.
7Expense ratios do not include expenses of the underlying series in which the Series invests. The expense ratio of the underlying series was 0.69%.
8During the year ended October 31, 2010, due to the timing of the renewal of the Series’ distribution plan under Rule 12b-1, the Series incurred approximately 11 months of distribution expense. The expense ratio would have been higher and the net investment income ratio and total return would have been lower had the Series incurred a full year of distribution expense.
9Expense ratios do not include expenses of the underlying series in which the Series invests. The expense ratio of the underlying series was 0.70%.
10Reflects activity of the Series and does not include the activity of the underlying series.
11The increase to the expense ratios (to average net assets) is largely due to the small net assets in each class.
The accompanying notes are an integral part of the financial statements.
10
Financial Highlights
| | | | | | | | | | | | | | | | | | | | |
| TARGET INCOME SERIES CLASS C | | FOR THE SIX
MONTHS ENDED
| | | FOR THE YEARS ENDED | | | FOR THE PERIOD | |
| | | 4/30/12
(UNAUDITED) | | | 10/31/2011 | | | 10/31/2010 | | | 10/31/2009 | | | 3/28/081 TO 10/31/08 | |
Per share data (for a share outstanding throughout each period): | | | | | | | | | | | | | | | | | | | | |
Net asset value - Beginning of period | | $ | 10.67 | | | $ | 10.84 | | | $ | 10.00 | | | $ | 9.26 | | | $ | 10.00 | |
| | | | | | | | | | | | | | | | | | | | |
Income (loss) from investment operations: | | | | | | | | | | | | | | | | | | | | |
Net investment income (loss)2 | | | 0.13 | | | | 0.13 | | | | 0.07 | | | | (0.03 | ) | | | (0.01 | ) |
Net realized and unrealized gain (loss) on underlying series | | | 0.23 | | | | 0.08 | | | | 0.95 | | | | 1.02 | | | | (0.73 | ) |
| | | | | | | | | | | | | | | | | | | | |
| | | | | |
Total from investment operations | | | 0.36 | | | | 0.21 | | | | 1.02 | | | | 0.99 | | | | (0.74 | ) |
| | | | | | | | | | | | | | | | | | | | |
Less distributions to shareholders: | | | | | | | | | | | | | | | | | | | | |
From net investment income | | | (0.15 | ) | | | (0.26 | ) | | | (0.15 | ) | | | (0.25 | ) | | | — | |
From net realized gain on investments | | | (0.45 | ) | | | (0.12 | ) | | | (0.03 | ) | | | — | | | | — | |
| | | | | | | | | | | | | | | | | | | | |
| | | | | |
Total distributions to shareholders | | | (0.60 | ) | | | (0.38 | ) | | | (0.18 | ) | | | (0.25 | ) | | | — | |
| | | | | | | | | | | | | | | | | | | | |
| | | | | |
Net asset value - End of period | | $ | 10.43 | | | $ | 10.67 | | | $ | 10.84 | | | $ | 10.00 | | | $ | 9.26 | |
| | | | | | | | | | | | | | | | | | | | |
| | | | | |
Net assets - End of period (000’s omitted) | | $ | 1,090 | | | $ | 1,424 | | | $ | 1,195 | | | $ | 330 | | | $ | 93 | 3 |
| | | | | | | | | | | | | | | | | | | | |
| | | | | |
Total return4 | | | 3.65 | % | | | 2.04 | % | | | 10.38 | % | | | 10.91 | % | | | (7.40 | %) |
Ratios (to average net assets)/Supplemental Data: | | | | | | | | | | | | | | | | | | | | |
Expenses* | | | 1.05 | %5,6 | | | 1.05 | %7 | | | 0.99 | %8,9 | | | 1.05 | %9 | | | 1.05 | %5,9 |
Net investment income (loss) | | | 2.54 | %5 | | | 1.23 | % | | | 0.66 | % | | | (0.30 | %) | | | (0.15 | %)5 |
Series portfolio turnover10 | | | 8 | % | | | 14 | % | | | 9 | % | | | 13 | % | | | 0 | % |
|
| *The investment advisor paid a portion of the Series’ expenses. If these expenses had been incurred by the Series, the expense ratios (to average net assets) would have been increased by the following amounts: | |
| | | | | |
| | | 0.21 | %5,6 | | | 0.22 | %7 | | | 0.29 | %9 | | | 10.70 | %9 | | | 43,147 | %5,9,11 |
| | | | | | | | | | | | | | | | | | | | |
| TARGET INCOME SERIES CLASS I | | FOR THE SIX
MONTHS ENDED
| | | FOR THE YEARS ENDED | | | FOR THE PERIOD | |
| | | 4/30/12
(UNAUDITED) | | | 10/31/2011 | | | 10/31/2010 | | | 10/31/2009 | | | 3/28/081 TO 10/31/08 | |
Per share data (for a share outstanding throughout each period): | | | | | | | | | | | | | | | | | | | | |
Net asset value - Beginning of period | | $ | 10.89 | | | $ | 11.05 | | | $ | 10.17 | | | $ | 9.32 | | | $ | 10.00 | |
| | | | | | | | | | | | | | | | | | | | |
Income (loss) from investment operations: | | | | | | | | | | | | | | | | | | | | |
Net investment income2 | | | 0.15 | | | | 0.07 | | | | 0.19 | | | | 0.06 | | | | 0.05 | |
Net realized and unrealized gain (loss) on underlying series | | | 0.27 | | | | 0.25 | | | | 0.94 | | | | 1.04 | | | | (0.73 | ) |
| | | | | | | | | | | | | | | | | | | | |
| | | | | |
Total from investment operations | | | 0.42 | | | | 0.32 | | | | 1.13 | | | | 1.10 | | | | (0.68 | ) |
| | | | | | | | | | | | | | | | | | | | |
Less distributions to shareholders: | | | | | | | | | | | | | | | | | | | | |
From net investment income | | | (0.20 | ) | | | (0.36 | ) | | | (0.22 | ) | | | (0.25 | ) | | | — | |
From net realized gain on investments | | | (0.45 | ) | | | (0.12 | ) | | | (0.03 | ) | | | — | | | | — | |
| | | | | | | | | | | | | | | | | | | | |
Total distributions to shareholders | | | (0.65 | ) | | | (0.48 | ) | | | (0.25 | ) | | | (0.25 | ) | | | — | |
| | | | | | | | | | | | | | | | | | | | |
Net asset value - End of period | | $ | 10.66 | | | $ | 10.89 | | | $ | 11.05 | | | $ | 10.17 | | | $ | 9.32 | |
| | | | | | | | | | | | | | | | | | | | |
Net assets - End of period (000’s omitted) | | $ | 6,062 | | | $ | 4,068 | | | $ | 298 | | | $ | 58 | | | $ | 93 | 3 |
| | | | | | | | | | | | | | | | | | | | |
| | | | | |
Total return4 | | | 4.25 | % | | | 3.00 | % | | | 11.44 | % | | | 12.06 | % | | | (6.80 | %) |
Ratios (to average net assets)/Supplemental Data: | | | | | | | | | | | | | | | | | | | | |
Expenses* | | | 0.05 | %5,6 | | | 0.05 | %7 | | | 0.05 | %9 | | | 0.05 | %9 | | | 0.05 | %5,9 |
Net investment income | | | 2.94 | %5 | | | 0.68 | % | | | 1.85 | % | | | 0.66 | % | | | 0.85 | %5 |
Series portfolio turnover10 | | | 8 | % | | | 14 | % | | | 9 | % | | | 13 | % | | | 0 | % |
|
*The investment advisor paid a portion of the Series’ expenses. If these expenses had been incurred by the Series, the expense ratios (to average net assets) would have been increased by the following amounts: | |
| | | 0.21 | %5,6 | | | 0.23 | %7 | | | 0.33 | %9 | | | 54.69 | %9 | | | 43,107 | %5,9,11 |
1Commencement of operations.
2Calculated based on average shares outstanding during the period.
3Represents the whole number without rounding to the 000’s.
4Represents aggregate total return for the period indicated, and assumes reinvestment of all distributions. Total return would have been lower had certain expenses not been reimbursed during the period. Periods less than one year are not annualized.
5Annualized.
6Expense ratios do not include expenses of the underlying series in which the Series invests. The expense ratio of the underlying series was 0.67%.
7Expense ratios do not include expenses of the underlying series in which the Series invests. The expense ratio of the underlying series was 0.69%.
8During the year ended October 31, 2010, due to the timing of the renewal of the Series’ distribution plan under Rule 12b-1, the Series incurred approximately 11 months of distribution expense. The expense ratio would have been higher and the net investment income ratio and total return would have been lower had the Series incurred a full year of distribution expense.
9Expense ratios do not include expenses of the underlying series in which the Series invests. The expense ratio of the underlying series was 0.70%.
10Reflects activity of the Series and does not include the activity of the underlying series.
11The increase to the expense ratios (to average net assets) is largely due to the small net assets in each class.
The accompanying notes are an integral part of the financial statements.
11
Financial Highlights
| | | | | | | | | | | | | | | | | | | | |
TARGET 2010 SERIES CLASS K | | FOR THE SIX
MONTHS ENDED
| | | FOR THE YEARS ENDED | | | FOR THE PERIOD | |
| | | 4/30/12
(UNAUDITED) | | | 10/31/2011 | | | 10/31/2010 | | | 10/31/2009 | | | 3/28/081 TO 10/31/08 | |
Per share data (for a share outstanding throughout each period): | | | | | | | | | | | | | | | | | | | | |
Net asset value - Beginning of period | | $ | 10.56 | | | $ | 10.64 | | | $ | 9.58 | | | $ | 8.61 | | | $ | 10.00 | |
| | | | | | | | | | | | | | | | | | | | |
Income (loss) from investment operations: | | | | | | | | | | | | | | | | | | | | |
Net investment income (loss)2 | | | 0.12 | | | | 0.20 | | | | 0.12 | | | | 0.02 | | | | (0.01 | ) |
Net realized and unrealized gain (loss) on underlying series | | | 0.31 | | | | 0.10 | | | | 1.10 | | | | 1.15 | | | | (1.38 | ) |
| | | | | | | | | | | | | | | | | | | | |
| | | | | |
Total from investment operations | | | 0.43 | | | | 0.30 | | | | 1.22 | | | | 1.17 | | | | (1.39 | ) |
| | | | | | | | | | | | | | | | | | | | |
Less distributions to shareholders: | | | | | | | | | | | | | | | | | | | | |
From net investment income | | | (0.20 | ) | | | (0.18 | ) | | | (0.14 | ) | | | (0.20 | ) | | | — | |
From net realized gain on investments | | | (0.97 | ) | | | (0.20 | ) | | | (0.02 | ) | | | — | | | | — | |
| | | | | | | | | | | | | | | | | | | | |
| | | | | |
Total distributions to shareholders | | | (1.17 | ) | | | (0.38 | ) | | | (0.16 | ) | | | (0.20 | ) | | | — | |
| | | | | | | | | | | | | | | | | | | | |
| | | | | |
Net asset value - End of period | | $ | 9.82 | | | $ | 10.56 | | | $ | 10.64 | | | $ | 9.58 | | | $ | 8.61 | |
| | | | | | | | | | | | | | | | | | | | |
| | | | | |
Net assets - End of period (000’s omitted) | | $ | 23,468 | | | $ | 23,653 | | | $ | 27,904 | | | $ | 15,782 | | | $ | 101,213 | 3 |
| | | | | | | | | | | | | | | | | | | | |
Total return4 | | | 4.89 | % | | | 2.97 | % | | | 12.85 | % | | | 13.97 | % | | | (13.90 | %) |
Ratios (to average net assets)/ Supplemental Data: | | | | | | | | | | | | | | | | | | | | |
Expenses* | | | 0.30 | %5,6 | | | 0.30 | %7 | | | 0.29 | %8,9 | | | 0.30 | %10 | | | 0.30 | %5,10 |
Net investment income (loss) | | | 2.56 | %5 | | | 1.84 | % | | | 1.20 | % | | | 0.19 | % | | | (0.28 | %)5 |
Series portfolio turnover11 | | | 24 | % | | | 48 | % | | | 11 | % | | | 9 | % | | | 0 | % |
|
*The investment advisor paid a portion of the Series’ expenses. If these expenses had been incurred by the Series, the expense ratios (to average net assets) would have been increased by the following amounts: | |
| | | 0.28 | %5,6 | | | 0.30 | %7 | | | 0.42 | %9 | | | 1.31 | %10 | | | 1,071 | %5,10,12 |
| TARGET 2010 SERIES CLASS R | | FOR THE SIX
MONTHS ENDED
| | | FOR THE YEARS ENDED | | | FOR THE PERIOD | |
| | | 4/30/12
(UNAUDITED) | | | 10/31/2011 | | | 10/31/2010 | | | 10/31/2009 | | | 3/28/081 TO 10/31/08 | |
Per share data (for a share outstanding throughout each period): | | | | | | | | | | | | | | | | | | | | |
Net asset value - Beginning of period | | $ | 10.48 | | | $ | 10.57 | | | $ | 9.54 | | | $ | 8.61 | | | $ | 10.00 | |
| | | | | | | | | | | | | | | | | | | | |
Income (loss) from investment operations: | | | | | | | | | | | | | | | | | | | | |
Net investment income (loss)2 | | | 0.11 | | | | 0.14 | | | | 0.12 | | | | (0.05 | ) | | | 0.02 | |
Net realized and unrealized gain (loss) on underlying series | | | 0.31 | | | | 0.13 | | | | 1.07 | | | | 1.18 | | | | (1.41 | ) |
| | | | | | | | | | | | | | | | | | | | |
| | | | | |
Total from investment operations | | | 0.42 | | | | 0.27 | | | | 1.19 | | | | 1.13 | | | | (1.39 | ) |
| | | | | | | | | | | | | | | | | | | | |
| | | | | |
Less distributions to shareholders: | | | | | | | | | | | | | | | | | | | | |
From net investment income | | | (0.19 | ) | | | (0.16 | ) | | | (0.14 | ) | | | (0.20 | ) | | | — | |
From net realized gain on investments | | | (0.97 | ) | | | (0.20 | ) | | | (0.02 | ) | | | — | | | | — | |
| | | | | | | | | | | | | | | | | | | | |
Total distributions to shareholders | | | (1.16 | ) | | | (0.36 | ) | | | (0.16 | ) | | | (0.20 | ) | | | — | |
| | | | | | | | | | | | | | | | | | | | |
| | | | | |
Net asset value - End of period | | $ | 9.74 | | | $ | 10.48 | | | $ | 10.57 | | | $ | 9.54 | | | $ | 8.61 | |
| | | | | | | | | | | | | | | | | | | | |
| | | | | |
Net assets - End of period (000’s omitted) | | $ | 5,685 | | | $ | 4,885 | | | $ | 3,655 | | | $ | 284 | | | $ | 86 | 3 |
| | | | | | | | | | | | | | | | | | | | |
| | | | | |
Total return4 | | | 4.79 | % | | | 2.67 | % | | | 12.64 | % | | | 13.54 | % | | | (13.90 | %) |
Ratios (to average net assets)/ Supplemental Data: | | | | | | | | | | | | | | | | | | | | |
Expenses* | | | 0.55 | %5,6 | | | 0.55 | %7 | | | 0.52 | %8,9 | | | 0.55 | %10 | | | 0.55 | %5,10 |
Net investment income (loss) | | | 2.22 | %5 | | | 1.32 | % | | | 1.16 | % | | | (0.55 | %) | | | 0.36 | %5 |
Series portfolio turnover11 | | | 24 | % | | | 48 | % | | | 11 | % | | | 9 | % | | | 0 | % |
|
*The investment advisor paid a portion of the Series’ expenses. If these expenses had been incurred by the Series, the expense ratios (to average net assets) would have been increased by the following amounts: | |
| | | 0.28 | %5,6 | | | 0.31 | %7 | | | 0.41 | %9 | | | 25.36 | %10 | | | 42,882 | %5,10,12 |
1Commencement of operations.
2Calculated based on average shares outstanding during the period.
3Represents the whole number without rounding to the 000’s.
4Represents aggregate total return for the period indicated, and assumes reinvestment of all distributions. Total return would have been lower had certain expenses not been reimbursed during the period. Periods less than one year are not annualized.
5Annualized.
6Expense ratios do not include expenses of the underlying series in which the Series invests. The expense ratios of the underlying series were 0.67% for Manning & Napier Pro-Blend® Conservative Term Series - Class I and 0.82% for Manning & Napier Pro-Blend® Moderate Term Series - Class I.
7Expense ratios do not include expenses of the underlying series in which the Series invests. The expense ratios of the underlying series were 0.69% for Manning & Napier Pro-Blend® Conservative Term Series - Class I and 0.82% for Manning & Napier Pro-Blend® Moderate Term Series - Class I.
8During the year ended October 31, 2010, due to the timing of the renewal of the Series’ distribution plan under Rule 12b-1, the Series incurred approximately 11 months of distribution expense. The expense ratio would have been higher and the net investment income ratio and total return would have been lower had the Series incurred a full year of distribution expense.
9Expense ratios do not include expenses of the underlying series in which the Series invests. The expense ratio of the underlying series was 0.84%.
10Expense ratios do not include expenses of the underlying series in which the Series invests. The expense ratio of the underlying series was 0.85%.
11Reflects activity of the Series and does not include the activity of the underlying series.
12The increase to the expense ratios (to average net assets) is largely due to the small net assets in each class.
The accompanying notes are an integral part of the financial statements.
12
Financial Highlights
| | | | | | | | | | | | | | | | | | | | |
| TARGET 2010 SERIES CLASS C | | FOR THE SIX
MONTHS ENDED
| | | FOR THE YEARS ENDED | | | FOR THE PERIOD | |
| | | 4/30/12
(UNAUDITED) | | | 10/31/2011 | | | 10/31/2010 | | | 10/31/2009 | | | 3/28/081 TO 10/31/08 | |
Per share data (for a share outstanding throughout each period): | | | | | | | | | | | | | | | | | | | | |
Net asset value - Beginning of period | | $ | 10.44 | | | $ | 10.53 | | | $ | 9.49 | | | $ | 8.58 | | | $ | 10.00 | |
| | | | | | | | | | | | | | | | | | | | |
Income (loss) from investment operations: | | | | | | | | | | | | | | | | | | | | |
Net investment income (loss)2 | | | 0.10 | | | | 0.10 | | | | 0.06 | | | | (0.01 | ) | | | (0.05 | ) |
Net realized and unrealized gain (loss) on underlying series | | | 0.29 | | | | 0.12 | | | | 1.08 | | | | 1.10 | | | | (1.37 | ) |
| | | | | | | | | | | | | | | | | | | | |
| | | | | |
Total from investment operations | | | 0.39 | | | | 0.22 | | | | 1.14 | | | | 1.09 | | | | (1.42 | ) |
| | | | | | | | | | | | | | | | | | | | |
| | | | | |
Less distributions to shareholders: | | | | | | | | | | | | | | | | | | | | |
From net investment income | | | (0.15 | ) | | | (0.11 | ) | | | (0.08 | ) | | | (0.18 | ) | | | — | |
From net realized gain on investments | | | (0.97 | ) | | | (0.20 | ) | | | (0.02 | ) | | | — | | | | — | |
| | | | | | | | | | | | | | | | | | | | |
| | | | | |
Total distributions to shareholders | | | (1.12 | ) | | | (0.31 | ) | | | (0.10 | ) | | | (0.18 | ) | | | — | |
| | | | | | | | | | | | | | | | | | | | |
| | | | | |
Net asset value - End of period | | $ | 9.71 | | | $ | 10.44 | | | $ | 10.53 | | | $ | 9.49 | | | $ | 8.58 | |
| | | | | | | | | | | | | | | | | | | | |
| | | | | |
Net assets - End of period (000’s omitted) | | $ | 1,558 | | | $ | 2,021 | | | $ | 2,247 | | | $ | 1,471 | | | $ | 98,226 | 3 |
| | | | | | | | | | | | | | | | | | | | |
| | | | | |
Total return4 | | | 4.47 | % | | | 2.21 | % | | | 12.12 | % | | | 13.13 | % | | | (14.20 | %) |
Ratios (to average net assets)/Supplemental Data: | | | | | | | | | | | | | | | | | | | | |
Expenses* | | | 1.05 | %5,6 | | | 1.05 | %7 | | | 0.98 | %8,9 | | | 1.05 | %10 | | | 1.05 | %5,10 |
Net investment income (loss) | | | 2.06 | %5 | | | 0.97 | % | | | 0.58 | % | | | (0.12 | %) | | | (1.03 | %)5 |
Series portfolio turnover11 | | | 24 | % | | | 48 | % | | | 11 | % | | | 9 | % | | | 0 | % |
|
*The investment advisor paid a portion of the Series’ expenses. If these expenses had been incurred by the Series, the expense ratios (to average net assets) would have been increased by the following amounts: | |
| | | 0.28 | %5,6 | | | 0.30 | %7 | | | 0.44 | %9 | | | 5.01 | %10 | | | 919 | %5,10,12 |
| TARGET 2010 SERIES CLASS I | | FOR THE SIX
MONTHS ENDED
| | | FOR THE YEARS ENDED | | | FOR THE PERIOD | |
| | | 4/30/12
(UNAUDITED) | | | 10/31/2011 | | | 10/31/2010 | | | 10/31/2009 | | | 3/28/081 TO 10/31/08 | |
Per share data (for a share outstanding throughout each period): | | | | | | | | | | | | | | | | | | | | |
Net asset value - Beginning of period | | $ | 10.60 | | | $ | 10.68 | | | $ | 9.62 | | | $ | 8.63 | | | $ | 10.00 | |
| | | | | | | | | | | | | | | | | | | | |
Income (loss) from investment operations: | | | | | | | | | | | | | | | | | | | | |
Net investment income2 | | | 0.14 | | | | 0.08 | | | | 0.14 | | | | 0.07 | | | | 0.05 | |
Net realized and unrealized gain (loss) on underlying series | | | 0.30 | | | | 0.25 | | | | 1.10 | | | | 1.12 | | | | (1.42 | ) |
| | | | | | | | | | | | | | | | | | | | |
| | | | | |
Total from investment operations | | | 0.44 | | | | 0.33 | | | | 1.24 | | | | 1.19 | | | | (1.37 | ) |
| | | | | | | | | | | | | | | | | | | | |
| | | | | |
Less distributions to shareholders: | | | | | | | | | | | | | | | | | | | | |
From net investment income | | | (0.21 | ) | | | (0.21 | ) | | | (0.16 | ) | | | (0.20 | ) | | | — | |
From net realized gain on investments | | | (0.97 | ) | | | (0.20 | ) | | | (0.02 | ) | | | — | | | | — | |
| | | | | | | | | | | | | | | | | | | | |
| | | | | |
Total distributions to shareholders | | | (1.18 | ) | | | (0.41 | ) | | | (0.18 | ) | | | (0.20 | ) | | | — | |
| | | | | | | | | | | | | | | | | | | | |
| | | | | |
Net asset value - End of period | | $ | 9.86 | | | $ | 10.60 | | | $ | 10.68 | | | $ | 9.62 | | | $ | 8.63 | |
| | | | | | | | | | | | | | | | | | | | |
| | | | | |
Net assets - End of period (000’s omitted) | | $ | 12,127 | | | $ | 9,966 | | | $ | 1,465 | | | $ | 469 | | | $ | 159 | 3 |
| | | | | | | | | | | | | | | | | | | | |
| | | | | |
Total return4 | | | 5.04 | % | | | 3.20 | % | | | 13.10 | % | | | 14.23 | % | | | (13.70 | %) |
Ratios (to average net assets)/ Supplemental Data: | | | | | | | | | | | | | | | | | | | | |
Expenses* | | | 0.05 | %5,6 | | | 0.05 | %7 | | | 0.05 | %9 | | | 0.05 | %10 | | | 0.05 | %5,10 |
Net investment income | | | 2.80 | %5 | | | 0.81 | % | | | 1.44 | % | | | 0.83 | % | | | 0.86 | %5 |
Series portfolio turnover11 | | | 24 | % | | | 48 | % | | | 11 | % | | | 9 | % | | | 0 | % |
|
*The investment advisor paid a portion of the Series’ expenses. If these expenses had been incurred by the Series, the expense ratios (to average net assets) would have been increased by the following amounts: | |
| | | 0.28 | %5,6 | | | 0.32 | %7 | | | 0.43 | %9 | | | 8.26 | %10 | | | 42,439 | %5,10,12 |
1Commencement of operations.
2Calculated based on average shares outstanding during the period.
3Represents the whole number without rounding to the 000’s.
4Represents aggregate total return for the period indicated, and assumes reinvestment of all distributions. Total return would have been lower had certain expenses not been reimbursed during the period. Periods less than one year are not annualized.
5Annualized.
6Expense ratios do not include expenses of the underlying series in which the Series invests. The expense ratios of the underlying series were 0.67% for Manning & Napier Pro-Blend® Conservative Term Series - Class I and 0.82% for Manning & Napier Pro-Blend® Moderate Term Series - Class I.
7Expense ratios do not include expenses of the underlying series in which the Series invests. The expense ratios of the underlying series were 0.69% for Manning & Napier Pro-Blend® Conservative Term Series - Class I and 0.82% for Manning & Napier Pro-Blend® Moderate Term Series - Class I.
8During the year ended October 31, 2010, due to the timing of the renewal of the Series’ distribution plan under Rule 12b-1, the Series incurred approximately 11 months of distribution expense. The expense ratio would have been higher and the net investment income ratio and total return would have been lower had the Series incurred a full year of distribution expense.
9Expense ratios do not include expenses of the underlying series in which the Series invests. The expense ratio of the underlying series was 0.84%.
10Expense ratios do not include expenses of the underlying series in which the Series invests. The expense ratio of the underlying series was 0.85%.
11Reflects activity of the Series and does not include the activity of the underlying series.
12The increase to the expense ratios (to average net assets) is largely due to the small net assets in each class.
The accompanying notes are an integral part of the financial statements.
13
Financial Highlights
| | | | | | | | | | | | | | | | | | | | |
| TARGET 2020 SERIES CLASS K | | FOR THE SIX
MONTHS ENDED
| | | FOR THE YEARS ENDED | | | FOR THE PERIOD | |
| | | 4/30/12
(UNAUDITED) | | | 10/31/2011 | | | 10/31/2010 | | | 10/31/2009 | | | 3/28/081 TO 10/31/08 | |
Per share data (for a share outstanding throughout each period): | | | | | | | | | | | | | | | | | | | | |
Net asset value - Beginning of period | | $ | 10.12 | | | $ | 10.33 | | | $ | 9.16 | | | $ | 8.14 | | | $ | 10.00 | |
| | | | | | | | | | | | | | | | | | | | |
Income (loss) from investment operations: | | | | | | | | | | | | | | | | | | | | |
Net investment income2 | | | 0.12 | | | | 0.20 | | | | 0.13 | | | | 0.02 | | | | 0.04 | |
Net realized and unrealized gain (loss) on underlying series | | | 0.38 | | | | 0.12 | | | | 1.23 | | | | 1.21 | | | | (1.90 | ) |
| | | | | | | | | | | | | | | | | | | | |
| | | | | |
Total from investment operations | | | 0.50 | | | | 0.32 | | | | 1.36 | | | | 1.23 | | | | (1.86 | ) |
| | | | | | | | | | | | | | | | | | | | |
| | | | | |
Less distributions to shareholders: | | | | | | | | | | | | | | | | | | | | |
From net investment income | | | (0.16 | ) | | | (0.19 | ) | | | (0.17 | ) | | | (0.21 | ) | | | — | |
From net realized gain on investments | | | (0.73 | ) | | | (0.34 | ) | | | (0.02 | ) | | | — | | | | — | |
| | | | | | | | | | | | | | | | | | | | |
| | | | | |
Total distributions to shareholders | | | (0.89 | ) | | | (0.53 | ) | | | (0.19 | ) | | | (0.21 | ) | | | — | |
| | | | | | | | | | | | | | | | | | | | |
| | | | | |
Net asset value - End of period | | $ | 9.73 | | | $ | 10.12 | | | $ | 10.33 | | | $ | 9.16 | | | $ | 8.14 | |
| | | | | | | | | | | | | | | | | | | | |
| | | | | |
Net assets - End of period (000’s omitted) | | $ | 54,411 | | | $ | 56,290 | | | $ | 64,613 | | | $ | 30,089 | | | $ | 157 | 3 |
| | | | | | | | | | | | | | | | | | | | |
| | | | | |
Total return4 | | | 5.76 | % | | | 3.14 | % | | | 14.89 | % | | | 15.72 | % | | | (18.60 | %) |
Ratios (to average net assets)/Supplemental Data: | | | | | | | | | | | | | | | | | | | | |
Expenses* | | | 0.30 | %5,6 | | | 0.30 | %5 | | | 0.29 | %7,8 | | | 0.30 | %9 | | | 0.30 | %6,9 |
Net investment income | | | 2.43 | %6 | | | 1.97 | % | | | 1.38 | % | | | 0.28 | % | | | 0.74 | %6 |
Series portfolio turnover10 | | | 11 | % | | | 49 | % | | | 20 | % | | | 9 | % | | | 31 | % |
|
*The investment advisor paid a portion of the Series’ expenses. If these expenses had been incurred by the Series, the expense ratios (to average net assets) would have been increased by the following amounts: | |
| | | 0.08 | %5,6 | | | 0.10 | %5 | | | 0.17 | %8 | | | 0.72 | %9 | | | 34,421 | %6,9,11 |
| TARGET 2020 SERIES CLASS R | | FOR THE SIX
MONTHS ENDED
| | | FOR THE YEARS ENDED | | | FOR THE PERIOD | |
| | | 4/30/12
(UNAUDITED) | | | 10/31/2011 | | | 10/31/2010 | | | 10/31/2009 | | | 3/28/081 TO 10/31/08 | |
Per share data (for a share outstanding throughout each period): | | | | | | | | | | | | | | | | | | | | |
Net asset value - Beginning of period | | $ | 10.02 | | | $ | 10.24 | | | $ | 9.10 | | | $ | 8.13 | | | $ | 10.00 | |
| | | | | | | | | | | | | | | | | | | | |
Income (loss) from investment operations: | | | | | | | | | | | | | | | | | | | | |
Net investment income (loss)2 | | | 0.10 | | | | 0.15 | | | | 0.12 | | | | (0.05 | ) | | | 0.04 | |
Net realized and unrealized gain (loss) on underlying series | | | 0.38 | | | | 0.14 | | | | 1.21 | | | | 1.23 | | | | (1.91 | ) |
| | | | | | | | | | | | | | | | | | | | |
| | | | | |
Total from investment operations | | | 0.48 | | | | 0.29 | | | | 1.33 | | | | 1.18 | | | | (1.87 | ) |
| | | | | | | | | | | | | | | | | | | | |
| | | | | |
Less distributions to shareholders: | | | | | | | | | | | | | | | | | | | | |
From net investment income | | | (0.15 | ) | | | (0.17 | ) | | | (0.17 | ) | | | (0.21 | ) | | | — | |
From net realized gain on investments | | | (0.73 | ) | | | (0.34 | ) | | | (0.02 | ) | | | — | | | | — | |
| | | | | | | | | | | | | | | | | | | | |
| | | | | |
Total distributions to shareholders | | | (0.88 | ) | | | (0.51 | ) | | | (0.19 | ) | | | (0.21 | ) | | | — | |
| | | | | | | | | | | | | | | | | | | | |
| | | | | |
Net asset value - End of period | | $ | 9.62 | | | $ | 10.02 | | | $ | 10.24 | | | $ | 9.10 | | | $ | 8.13 | |
| | | | | | | | | | | | | | | | | | | | |
| | | | | |
Net assets - End of period (000’s omitted) | | $ | 20,774 | | | $ | 16,105 | | | $ | 12,229 | | | $ | 562 | | | $ | 81 | 3 |
| | | | | | | | | | | | | | | | | | | | |
| | | | | |
Total return4 | | | 5.59 | % | | | 2.85 | % | | | 14.72 | % | | | 15.13 | % | | | (18.70 | %) |
Ratios (to average net assets)/Supplemental Data: | | | | | | | | | | | | | | | | | | | | |
Expenses* | | | 0.55 | %5,6 | | | 0.55 | %5 | | | 0.52 | %7,8 | | | 0.55 | %9 | | | 0.55 | %6,9 |
Net investment income (loss) | | | 2.03 | %6 | | | 1.48 | % | | | 1.25 | % | | | (0.54 | %) | | | 0.62 | %6 |
Series portfolio turnover10 | | | 11 | % | | | 49 | % | | | 20 | % | | | 9 | % | | | 31 | % |
|
*The investment advisor paid a portion of the Series’ expenses. If these expenses had been incurred by the Series, the expense ratios (to average net assets) would have been increased by the following amounts: | |
| | | 0.08 | %5,6 | | | 0.10 | %5 | | | 0.18 | %8 | | | 14.54 | %9 | | | 38,136 | %6,9,11 |
1Commencement of operations.
2Calculated based on average shares outstanding during the period.
3Represents the whole number without rounding to the 000’s.
4Represents aggregate total return for the period indicated, and assumes reinvestment of all distributions. Total return would have been lower had certain expenses not been reimbursed during the period. Periods less than one year are not annualized.
5Expense ratios do not include expenses of the underlying series in which the Series invests. The expense ratios of the underlying series were 0.82% for Manning & Napier Pro-Blend® Moderate Term Series - Class I and 0.83% for Manning & Napier Pro-Blend® Extended Term Series - Class I.
6Annualized.
7During the year ended October 31, 2010, due to the timing of the renewal of the Series’ distribution plan under Rule 12b-1, the Series incurred approximately 11 months of distribution expense. The expense ratio would have been higher and the net investment income ratio and total return would have been lower had the Series incurred a full year of distribution expense.
8Expense ratios do not include expenses of the underlying series in which the Series invests. The expense ratios of the underlying series were 0.84% for Manning & Napier Pro-Blend® Moderate Term Series - Class I and 0.83% for Manning & Napier Pro-Blend® Extended Term Series - Class I.
9Expense ratios do not include expenses of the underlying series in which the Series invests. The expense ratio of the underlying series was 0.85%.
10Reflects activity of the Series and does not include the activity of the underlying series.
11The increase to the expense ratios (to average net assets) is largely due to the small net assets in each class.
The accompanying notes are an integral part of the financial statements.
14
Financial Highlights
| | | | | | | | | | | | | | | | | | | | |
| TARGET 2020 SERIES CLASS C | | FOR THE SIX
MONTHS ENDED
| | | FOR THE YEARS ENDED | | | FOR THE PERIOD | |
| | | 4/30/12
(UNAUDITED) | | | 10/31/2011 | | | 10/31/2010 | | | 10/31/2009 | | | 3/28/081 TO 10/31/08 | |
Per share data (for a share outstanding throughout each period): | | | | | | | | | | | | | | | | | | | | |
Net asset value - Beginning of period | | $ | 9.99 | | | $ | 10.21 | | | $ | 9.06 | | | $ | 8.10 | | | $ | 10.00 | |
| | | | | | | | | | | | | | | | | | | | |
Income (loss) from investment operations: | | | | | | | | | | | | | | | | | | | | |
Net investment income (loss)2 | | | 0.09 | | | | 0.11 | | | | 0.10 | | | | 0.02 | | | | (0.05 | ) |
Net realized and unrealized gain (loss) on underlying series | | | 0.36 | | | | 0.14 | | | | 1.18 | | | | 1.13 | | | | (1.85 | ) |
| | | | | | | | | | | | | | | | | | | | |
| | | | | |
Total from investment operations | | | 0.45 | | | | 0.25 | | | | 1.28 | | | | 1.15 | | | | (1.90 | ) |
| | | | | | | | | | | | | | | | | | | | |
| | | | | |
Less distributions to shareholders: | | | | | | | | | | | | | | | | | | | | |
From net investment income | | | (0.12 | ) | | | (0.13 | ) | | | (0.11 | ) | | | (0.19 | ) | | | — | |
From net realized gain on investments | | | (0.73 | ) | | | (0.34 | ) | | | (0.02 | ) | | | — | | | | — | |
| | | | | | | | | | | | | | | | | | | | |
| | | | | |
Total distributions to shareholders | | | (0.85 | ) | | | (0.47 | ) | | | (0.13 | ) | | | (0.19 | ) | | | — | |
| | | | | | | | | | | | | | | | | | | | |
| | | | | |
Net asset value - End of period | | $ | 9.59 | | | $ | 9.99 | | | $ | 10.21 | | | $ | 9.06 | | | $ | 8.10 | |
| | | | | | | | | | | | | | | | | | | | |
| | | | | |
Net assets - End of period (000’s omitted) | | $ | 4,303 | | | $ | 4,155 | | | $ | 3,803 | | | $ | 2,123 | | | $ | 228,171 | 3 |
| | | | | | | | | | | | | | | | | | | | |
| | | | | |
Total return4 | | | 5.26 | % | | | 2.42 | % | | | 14.24 | % | | | 14.74 | % | | | (19.00 | %) |
Ratios (to average net assets)/ | | | | | | | | | | | | | | | | | | | | |
Supplemental Data: | | | | | | | | | | | | | | | | | | | | |
Expenses* | | | 1.05 | %5,6 | | | 1.05 | %5 | | | 0.98 | %7,8 | | | 1.05 | %9 | | | 1.05 | %6,9 |
Net investment income (loss) | | | 1.87 | %6 | | | 1.08 | % | | | 1.03 | % | | | 0.25 | % | | | (1.05 | %)6 |
Series portfolio turnover10 | | | 11 | % | | | 49 | % | | | 20 | % | | | 9 | % | | | 31 | % |
|
*The investment advisor paid a portion of the Series’ expenses. If these expenses had been incurred by the Series, the expense ratios (to average net assets) would have been increased by the following amounts: | |
| | | | | |
| | | 0.08 | %5,6 | | | 0.10 | %5 | | | 0.18 | %8 | | | 3.08 | %9 | | | 158 | %6,9,11 |
| TARGET 2020 SERIES CLASS I | | FOR THE SIX
MONTHS ENDED
| | | FOR THE YEARS ENDED | | | FOR THE PERIOD | |
| | | 4/30/12
(UNAUDITED) | | | 10/31/2011 | | | 10/31/2010 | | | 10/31/2009 | | | 3/28/081 TO 10/31/08 | |
Per share data (for a share outstanding throughout each period): | | | | | | | | | | | | | | | | | | | | |
Net asset value - Beginning of period | | $ | 10.16 | | | $ | 10.37 | | | $ | 9.19 | | | $ | 8.15 | | | $ | 10.00 | |
| | | | | | | | | | | | | | | | | | | | |
Income (loss) from investment operations: | | | | | | | | | | | | | | | | | | | | |
Net investment income2 | | | 0.13 | | | | 0.09 | | | | 0.18 | | | | 0.10 | | | | — | 12 |
Net realized and unrealized gain (loss) on underlying series | | | 0.38 | | | | 0.25 | | | | 1.21 | | | | 1.15 | | | | (1.85 | ) |
| | | | | | | | | | | | | | | | | | | | |
| | | | | |
Total from investment operations | | | 0.51 | | | | 0.34 | | | | 1.39 | | | | 1.25 | | | | (1.85 | ) |
| | | | | | | | | | | | | | | | | | | | |
| | | | | |
Less distributions to shareholders: | | | | | | | | | | | | | | | | | | | | |
From net investment income | | | (0.18 | ) | | | (0.21 | ) | | | (0.19 | ) | | | (0.21 | ) | | | — | |
From net realized gain on investments | | | (0.73 | ) | | | (0.34 | ) | | | (0.02 | ) | | | — | | | | — | |
| | | | | | | | | | | | | | | | | | | | |
| | | | | |
Total distributions to shareholders | | | (0.91 | ) | | | (0.55 | ) | | | (0.21 | ) | | | (0.21 | ) | | | — | |
| | | | | | | | | | | | | | | | | | | | |
| | | | | |
Net asset value - End of period | | $ | 9.76 | | | $ | 10.16 | | | $ | 10.37 | | | $ | 9.19 | | | $ | 8.15 | |
| | | | | | | | | | | | | | | | | | | | |
| | | | | |
Net assets - End of period (000’s omitted) | | $ | 37,682 | | | $ | 25,262 | | | $ | 3,474 | | | $ | 1,927 | | | $ | 51,467 | 3 |
| | | | | | | | | | | | | | | | | | | | |
| | | | | |
Total return4 | | | 5.82 | % | | | 3.37 | % | | | 15.24 | % | | | 15.98 | % | | | (18.50 | %) |
Ratios (to average net assets)/ Supplemental Data: | | | | | | | | | | | | | | | | | | | | |
Expenses* | | | 0.05 | %5,6 | | | 0.05 | %5 | | | 0.05 | %8 | | | 0.05 | %9 | | | 0.05 | %6,9 |
Net investment income (loss) | | | 2.75 | %6 | | | 0.85 | % | | | 1.89 | % | | | 1.22 | % | | | (0.02 | %)6 |
Series portfolio turnover10 | | | 11 | % | | | 49 | % | | | 20 | % | | | 9 | % | | | 31 | % |
|
* The investment advisor paid a portion of the Series’ expenses. If these expenses had been incurred by the Series, the expense ratios (to average net assets) would have been increased by the following amounts: | |
| | | | | |
| | | 0.08 | %5,6 | | | 0.11 | %5 | | | 0.19 | %8 | | | 2.90 | %9 | | | 871 | %6,9,11 |
1Commencement of operations.
2Calculated based on average shares outstanding during the period.
3Represents the whole number without rounding to the 000’s.
4Represents aggregate total return for the period indicated, and assumes reinvestment of all distributions. Total return would have been lower had certain expenses not been reimbursed during the period. Periods less than one year are not annualized.
5Expense ratios do not include expenses of the underlying series in which the Series invests. The expense ratios of the underlying series were 0.82% for Manning & Napier Pro-Blend® Moderate Term Series - Class I and 0.83% for Manning & Napier Pro-Blend® Extended Term Series - Class I.
6Annualized.
7During the year ended October 31, 2010, due to the timing of the renewal of the Series’ distribution plan under Rule 12b-1, the Series incurred approximately 11 months of distribution expense. The expense ratio would have been higher and the net investment income ratio and total return would have been lower had the Series incurred a full year of distribution expense.
8Expense ratios do not include expenses of the underlying series in which the Series invests. The expense ratios of the underlying series were 0.84% for Manning & Napier Pro-Blend® Moderate Term Series - Class I and 0.83% for Manning & Napier Pro-Blend® Extended Term Series - Class I.
9Expense ratios do not include expenses of the underlying series in which the Series invests. The expense ratio of the underlying series was 0.85%.
10Reflects activity of the Series and does not include the activity of the underlying series.
11The increase to the expense ratios (to average net assets) is largely due to the small net assets in each class.
12Less than $0.01.
The accompanying notes are an integral part of the financial statements.
15
Financial Highlights
| | | | | | | | | | | | | | | | | | | | |
| TARGET 2030 SERIES CLASS K | | FOR THE SIX
MONTHS ENDED
| | | FOR THE YEARS ENDED | | | FOR THE PERIOD | |
| | | 4/30/12 (UNAUDITED) | | | 10/31/2011 | | | 10/31/2010 | | | 10/31/2009 | | | 3/28/081 TO 10/31/08 | |
Per share data (for a share outstanding throughout each period): | | | | | | | | | | | | | | | | | | | | |
Net asset value - Beginning of period | | $ | 10.02 | | | $ | 10.15 | | | $ | 8.85 | | | $ | 7.81 | | | $ | 10.00 | |
| | | | | | | | | | | | | | | | | | | | |
Income (loss) from investment operations: | | | | | | | | | | | | | | | | | | | | |
Net investment income2 | | | 0.10 | | | | 0.16 | | | | 0.08 | | | | 0.01 | | | | 0.03 | |
Net realized and unrealized gain (loss) on underlying series | | | 0.40 | | | | 0.16 | | | | 1.36 | | | | 1.20 | | | | (2.22 | ) |
| | | | | | | | | | | | | | | | | | | | |
| | | | | |
Total from investment operations | | | 0.50 | | | | 0.32 | | | | 1.44 | | | | 1.21 | | | | (2.19 | ) |
| | | | | | | | | | | | | | | | | | | | |
| | | | | |
Less distributions to shareholders: | | | | | | | | | | | | | | | | | | | | |
From net investment income | | | (0.13 | ) | | | (0.15 | ) | | | (0.11 | ) | | | (0.17 | ) | | | — | |
From net realized gain on investments | | | (0.71 | ) | | | (0.30 | ) | | | (0.03 | ) | | | — | | | | — | |
| | | | | | | | | | | | | | | | | | | | |
| | | | | |
Total distributions to shareholders | | | (0.84 | ) | | | (0.45 | ) | | | (0.14 | ) | | | (0.17 | ) | | | — | |
| | | | | | | | | | | | | | | | | | | | |
| | | | | |
Net asset value - End of period | | $ | 9.68 | | | $ | 10.02 | | | $ | 10.15 | | | $ | 8.85 | | | $ | 7.81 | |
| | | | | | | | | | | | | | | | | | | | |
| | | | | |
Net assets - End of period (000’s omitted) | | $ | 60,323 | | | $ | 63,436 | | | $ | 66,235 | | | $ | 23,597 | | | $ | 118 | 3 |
| | | | | | | | | | | | | | | | | | | | |
| | | | | |
Total return4 | | | 5.81 | % | | | 3.15 | % | | | 16.34 | % | | | 16.05 | % | | | (21.90 | %) |
Ratios (to average net assets)/Supplemental Data: | | | | | | | | | | | | | | | | | | | | |
Expenses* | | | 0.30 | %5,6 | | | 0.30 | %7 | | | 0.29 | %8,9 | | | 0.30 | %10 | | | 0.30 | %5,10 |
Net investment income | | | 2.12 | %5 | | | 1.58 | % | | | 0.87 | % | | | 0.14 | % | | | 0.54 | %5 |
Series portfolio turnover11 | | | 22 | % | | | 40 | % | | | 15 | % | | | 9 | % | | | — | %12 |
|
| *The investment advisor paid a portion of the Series’ expenses. If these expenses had been incurred by the Series, the expense ratios (to average net assets) would have been increased by the following amounts: | |
| | | | | |
| | | 0.09 | %5,6 | | | 0.11 | %7 | | | 0.20 | %9 | | | 0.97 | %10 | | | 37,175 | %5,10,13 |
| TARGET 2030 SERIES CLASS R | | FOR THE SIX
MONTHS ENDED
| | | FOR THE YEARS ENDED | | | FOR THE PERIOD | |
| | | 4/30/12 (UNAUDITED) | | | 10/31/2011 | | | 10/31/2010 | | | 10/31/2009 | | | 3/28/081 TO 10/31/08 | |
Per share data (for a share outstanding throughout each period): | | | | | | | | | | | | | | | | | | | | |
Net asset value - Beginning of period | | $ | 9.96 | | | $ | 10.09 | | | $ | 8.83 | | | $ | 7.79 | | | $ | 10.00 | |
| | | | | | | | | | | | | | | | | | | | |
Income (loss) from investment operations: | | | | | | | | | | | | | | | | | | | | |
Net investment income (loss)2 | | | 0.08 | | | | 0.11 | | | | 0.06 | | | | (0.05 | ) | | | 0.02 | |
Net realized and unrealized gain (loss) on underlying series | | | 0.39 | | | | 0.19 | | | | 1.35 | | | | 1.26 | | | | (2.23 | ) |
| | | | | | | | | | | | | | | | | | | | |
| | | | | |
Total from investment operations | | | 0.47 | | | | 0.30 | | | | 1.41 | | | | 1.21 | | | | (2.21 | ) |
| | | | | | | | | | | | | | | | | | | | |
| | | | | |
Less distributions to shareholders: | | | | | | | | | | | | | | | | | | | | |
From net investment income | | | (0.11 | ) | | | (0.13 | ) | | | (0.12 | ) | | | (0.17 | ) | | | — | |
From net realized gain on investments | | | (0.71 | ) | | | (0.30 | ) | | | (0.03 | ) | | | — | | | | — | |
| | | | | | | | | | | | | | | | | | | | |
| | | | | |
Total distributions to shareholders | | | (0.82 | ) | | | (0.43 | ) | | | (0.15 | ) | | | (0.17 | ) | | | — | |
| | | | | | | | | | | | | | | | | | | | |
| | | | | |
Net asset value - End of period | | $ | 9.61 | | | $ | 9.96 | | | $ | 10.09 | | | $ | 8.83 | | | $ | 7.79 | |
| | | | | | | | | | | | | | | | | | | | |
| | | | | |
Net assets - End of period (000’s omitted) | | $ | 13,161 | | | $ | 9,243 | | | $ | 7,162 | | | $ | 328 | | | $ | 78 | 3 |
| | | | | | | | | | | | | | | | | | | | |
| | | | | |
Total return4 | | | 5.62 | % | | | 2.94 | % | | | 16.01 | % | | | 16.09 | % | | | (22.10 | %) |
Ratios (to average net assets)/ | | | | | | | | | | | | | | | | | | | | |
Supplemental Data: | | | | | | | | | | | | | | | | | | | | |
Expenses* | | | 0.55 | %5,6 | | | 0.55 | %7 | | | 0.54 | %8,9 | | | 0.55 | %10 | | | 0.55 | %5,10 |
Net investment income (loss) | | | 1.67 | %5 | | | 1.11 | % | | | 0.68 | % | | | (0.53 | %) | | | 0.31 | %5 |
Series portfolio turnover11 | | | 22 | % | | | 40 | % | | | 15 | % | | | 9 | % | | | — | %12 |
|
| *The investment advisor paid a portion of the Series’ expenses. If these expenses had been incurred by the Series, the expense ratios (to average net assets) would have been increased by the following amounts: | |
| | | | | |
| | | 0.09 | %5,6 | | | 0.11 | %7 | | | 0.18 | %9 | | | 28.67 | %10 | | | 38,768 | %5,10,13 |
1Commencement of operations.
2Calculated based on average shares outstanding during the period.
3Represents the whole number without rounding to the 000’s.
4Represents aggregate total return for the period indicated, and assumes reinvestment of all distributions. Total return would have been lower had certain expenses not been reimbursed during the period. Periods less than one year are not annualized.
5Annualized.
6Expense ratios do not include expenses of the underlying series in which the Series invests. The expense ratio of the underlying series was 0.83%.
7Expense ratios do not include expenses of the underlying series in which the Series invests. The expense ratios of the underlying series were 0.83% for Manning & Napier Pro-Blend® Extended Term Series - Class I and 0.84% for Manning & Napier Pro-Blend® Maximum Term Series - Class I.
8During the year ended October 31, 2010, due to the timing of the renewal of the Series’ distribution plan under Rule 12b-1, the Series incurred approximately 11 months of distribution expense. The expense ratio would have been higher and the net investment income ratio and total return would have been lower had the Series incurred a full year of distribution expense.
9Expense ratios do not include expenses of the underlying series in which the Series invests. The expense ratios of the underlying series were 0.83% for Manning & Napier Pro-Blend® Extended Term Series - Class I and 0.85% for Manning & Napier Pro-Blend® Maximum Term Series - Class I.
10Expense ratios do not include expenses of the underlying series in which the Series invests. The expense ratio of the underlying series was 0.85%.
11Reflects activity of the Series and does not include the activity of the underlying series.
12Less than 1%.
13The increase to the expense ratios (to average net assets) is largely due to the small net assets in each class.
The accompanying notes are an integral part of the financial statements.
16
Financial Highlights
| | | | | | | | | | | | | | | | | | | | |
| TARGET 2030 SERIES CLASS C | | FOR THE SIX
MONTHS ENDED
| | | FOR THE YEARS ENDED | | | FOR THE PERIOD | |
| | | 4/30/12
(UNAUDITED) | | | 10/31/2011 | | | 10/31/2010 | | | 10/31/2009 | | | 3/28/081 TO 10/31/08 | |
Per share data (for a share outstanding throughout each period): | | | | | | | | | | | | | | | | | | | | |
Net asset value - Beginning of period | | $ | 9.90 | | | $ | 10.05 | | | $ | 8.78 | | | $ | 7.77 | | | $ | 10.00 | |
| | | | | | | | | | | | | | | | | | | | |
Income (loss) from investment operations: | | | | | | | | | | | | | | | | | | | | |
Net investment income (loss)2 | | | 0.07 | | | | 0.07 | | | | 0.03 | | | | (0.02 | ) | | | (0.01 | ) |
Net realized and unrealized gain (loss) on underlying series | | | 0.38 | | | | 0.17 | | | | 1.33 | | | | 1.19 | | | | (2.22 | ) |
| | | | | | | | | | | | | | | | | | | | |
| | | | | |
Total from investment operations | | | 0.45 | | | | 0.24 | | | | 1.36 | | | | 1.17 | | | | (2.23 | ) |
| | | | | | | | | | | | | | | | | | | | |
| | | | | |
Less distributions to shareholders: | | | | | | | | | | | | | | | | | | | | |
From net investment income | | | (0.08 | ) | | | (0.09 | ) | | | (0.06 | ) | | | (0.16 | ) | | | — | |
From net realized gain on investments | | | (0.71 | ) | | | (0.30 | ) | | | (0.03 | ) | | | — | | | | — | |
| | | | | | | | | | | | | | | | | | | | |
| | | | | |
Total distributions to shareholders | | | (0.79 | ) | | | (0.39 | ) | | | (0.09 | ) | | | (0.16 | ) | | | — | |
| | | | | | | | | | | | | | | | | | | | |
| | | | | |
Net asset value - End of period | | $ | 9.56 | | | $ | 9.90 | | | $ | 10.05 | | | $ | 8.78 | | | $ | 7.77 | |
| | | | | | | | | | | | | | | | | | | | |
| | | | | |
Net assets - End of period (000’s omitted) | | $ | 2,895 | | | $ | 2,516 | | | $ | 2,231 | | | $ | 1,034 | | | $ | 78 | 3 |
| | | | | | | | | | | | | | | | | | | | |
| | | | | |
Total return4 | | | 5.39 | % | | | 2.35 | % | | | 15.50 | % | | | 15.57 | % | | | (22.30 | %) |
Ratios (to average net assets)/ | | | | | | | | | | | | | | | | | | | | |
Supplemental Data: | | | | | | | | | | | | | | | | | | | | |
Expenses* | | | 1.05 | %5,6 | | | 1.05 | %7 | | | 1.00 | %8,9 | | | 1.05 | %10 | | | 1.05 | %5,10 |
Net investment income (loss) | | | 1.40 | %5 | | | 0.72 | % | | | 0.31 | % | | | (0.22 | %) | | | (0.17 | %)5 |
Series portfolio turnover11 | | | 22 | % | | | 40 | % | | | 15 | % | | | 9 | % | | | — | %12 |
|
*The investment advisor paid a portion of the Series’ expenses. If these expenses had been incurred by the Series, the expense ratios (to average net assets) would have been increased by the following amounts: | |
| | | | | |
| | | 0.09 | %5,6 | | | 0.11 | %7 | | | 0.22 | %9 | | | 5.84 | %10 | | | 38,789 | %5,10,13 |
| | | | | | | | | | | | | | | | | | | | |
| TARGET 2030 SERIES CLASS I | | FOR THE SIX
MONTHS ENDED
| | | FOR THE YEARS ENDED | | | FOR THE PERIOD | |
| | | 4/30/12
(UNAUDITED) | | | 10/31/2011 | | | 10/31/2010 | | | 10/31/2009 | | | 3/28/081 TO 10/31/08 | |
Per share data (for a share outstanding throughout each period): | | | | | | | | | | | | | | | | | | | | |
Net asset value - Beginning of period | | $ | 10.09 | | | $ | 10.21 | | | $ | 8.90 | | | $ | 7.82 | | | $ | 10.00 | |
| | | | | | | | | | | | | | | | | | | | |
Income (loss) from investment operations: | | | | | | | | | | | | | | | | | | | | |
Net investment income2 | | | 0.12 | | | | 0.07 | | | | 0.13 | | | | 0.11 | | | | 0.01 | |
Net realized and unrealized gain (loss) on underlying series | | | 0.39 | | | | 0.28 | | | | 1.35 | | | | 1.14 | | | | (2.19 | ) |
| | | | | | | | | | | | | | | | | | | | |
| | | | | |
Total from investment operations | | | 0.51 | | | | 0.35 | | | | 1.48 | | | | 1.25 | | | | (2.18 | ) |
| | | | | | | | | | | | | | | | | | | | |
| | | | | |
Less distributions to shareholders: | | | | | | | | | | | | | | | | | | | | |
From net investment income | | | (0.14 | ) | | | (0.17 | ) | | | (0.14 | ) | | | (0.17 | ) | | | — | |
From net realized gain on investments | | | (0.71 | ) | | | (0.30 | ) | | | (0.03 | ) | | | — | | | | — | |
| | | | | | | | | | | | | | | | | | | | |
| | | | | |
Total distributions to shareholders | | | (0.85 | ) | | | (0.47 | ) | | | (0.17 | ) | | | (0.17 | ) | | | — | |
| | | | | | | | | | | | | | | | | | | | |
| | | | | |
Net asset value - End of period | | $ | 9.75 | | | $ | 10.09 | | | $ | 10.21 | | | $ | 8.90 | | | $ | 7.82 | |
| | | | | | | | | | | | | | | | | | | | |
| | | | | |
Net assets - End of period (000’s omitted) | | $ | 34,706 | | | $ | 20,249 | | | $ | 2,932 | | | $ | 1,316 | | | $ | 12,591 | 3 |
| | | | | | | | | | | | | | | | | | | | |
| | | | | |
Total return4 | | | 5.96 | % | | | 3.47 | % | | | 16.76 | % | | | 16.56 | % | | | (21.80 | %) |
Ratios (to average net assets)/ | | | | | | | | | | | | | | | | | | | | |
Supplemental Data: | | | | | | | | | | | | | | | | | | | | |
Expenses* | | | 0.05 | %5,6 | | | 0.05 | %7 | | | 0.05 | %9 | | | 0.05 | %10 | | | 0.05 | %5,10 |
Net investment income | | | 2.44 | %5 | | | 0.74 | % | | | 1.34 | % | | | 1.37 | % | | | 0.16 | %5 |
Series portfolio turnover11 | | | 22 | % | | | 40 | % | | | 15 | % | | | 9 | % | | | — | %12 |
|
*The investment advisor paid a portion of the Series’ expenses. If these expenses had been incurred by the Series, the expense ratios (to average net assets) would have been increased by the following amounts: | |
| | | | | |
| | | 0.09 | %5,6 | | | 0.12 | %7 | | | 0.22 | %9 | | | 6.18 | %10 | | | 14,979 | %5,10,13 |
1Commencement of operations.
2Calculated based on average shares outstanding during the period.
3Represents the whole number without rounding to the 000’s.
4Represents aggregate total return for the period indicated, and assumes reinvestment of all distributions. Total return would have been lower had certain expenses not been reimbursed during the period. Periods less than one year are not annualized.
5Annualized.
6Expense ratios do not include expenses of the underlying series in which the Series invests. The expense ratio of the underlying series was 0.83%.
7Expense ratios do not include expenses of the underlying series in which the Series invests. The expense ratios of the underlying series were 0.83% for Manning & Napier Pro-Blend® Extended Term Series - Class I and 0.84% for Manning & Napier Pro-Blend® Maximum Term Series - Class I.
8During the year ended October 31, 2010, due to the timing of the renewal of the Series’ distribution plan under Rule 12b-1, the Series incurred approximately 11 months of distribution expense. The expense ratio would have been higher and the net investment income ratio and total return would have been lower had the Series incurred a full year of distribution expense.
9Expense ratios do not include expenses of the underlying series in which the Series invests. The expense ratios of the underlying series were 0.83% for Manning & Napier Pro-Blend® Extended Term Series - Class I and 0.85% for Manning & Napier Pro-Blend® Maximum Term Series - Class I.
10Expense ratios do not include expenses of the underlying series in which the Series invests. The expense ratio of the underlying series was 0.85%.
11Reflects activity of the Series and does not include the activity of the underlying series.
12Less than 1%.
13The increase to the expense ratios (to average net assets) is largely due to the small net assets in each class.
The accompanying notes are an integral part of the financial statements.
17
Financial Highlights
| | | | | | | | | | | | | | | | | | | | |
| TARGET 2040 SERIES CLASS K | | FOR THE SIX
MONTHS ENDED
| | | FOR THE YEARS ENDED | | | FOR THE PERIOD | |
| | | 4/30/12
(UNAUDITED) | | | 10/31/2011 | | | 10/31/2010 | | | 10/31/2009 | | | 3/28/081 TO 10/31/08 | |
Per share data (for a share outstanding throughout each period): | | | | | | | | | | | | | | | | | | | | |
Net asset value - Beginning of period | | $ | 10.10 | | | $ | 10.20 | | | $ | 8.79 | | | $ | 7.58 | | | $ | 10.00 | |
| | | | | | | | | | | | | | | | | | | | |
Income (loss) from investment operations: | | | | | | | | | | | | | | | | | | | | |
Net investment income2 | | | 0.05 | | | | 0.09 | | | | 0.04 | | | | — | 3 | | | 0.02 | |
Net realized and unrealized gain (loss) on underlying series | | | 0.59 | | | | (0.02 | ) | | | 1.46 | | | | 1.36 | | | | (2.44 | ) |
| | | | | | | | | | | | | | | | | | | | |
| | | | | |
Total from investment operations | | | 0.64 | | | | 0.07 | | | | 1.50 | | | | 1.36 | | | | (2.42 | ) |
| | | | | | | | | | | | | | | | | | | | |
| | | | | |
Less distributions to shareholders: | | | | | | | | | | | | | | | | | | | | |
From net investment income | | | (0.06 | ) | | | (0.08 | ) | | | (0.06 | ) | | | (0.15 | ) | | | — | |
From net realized gain on investments | | | (0.54 | ) | | | (0.09 | ) | | | (0.03 | ) | | | — | | | | — | |
| | | | | | | | | | | | | | | | | | | | |
| | | | | |
Total distributions to shareholders | | | (0.60 | ) | | | (0.17 | ) | | | (0.09 | ) | | | (0.15 | ) | | | — | |
| | | | | | | | | | | | | | | | | | | | |
| | | | | |
Net asset value - End of period | | $ | 10.14 | | | $ | 10.10 | | | $ | 10.20 | | | $ | 8.79 | | | $ | 7.58 | |
| | | | | | | | | | | | | | | | | | | | |
| | | | | |
Net assets - End of period (000’s omitted) | | $ | 41,140 | | | $ | 39,853 | | | $ | 42,417 | | | $ | 12,880 | | | $ | 76 | 4 |
| | | | | | | | | | | | | | | | | | | | |
| | | | | |
Total return5 | | | 7.16 | % | | | 0.70 | % | | | 17.10 | % | | | 18.60 | % | | | (24.20 | %) |
Ratios (to average net assets)/ | | | | | | | | | | | | | | | | | | | | |
Supplemental Data: | | | | | | | | | | | | | | | | | | | | |
Expenses* | | | 0.30 | %6,7 | | | 0.30 | %8 | | | 0.29 | %7,9 | | | 0.30 | %7 | | | 0.30 | %6,7 |
Net investment income | | | 0.94 | %6 | | | 0.88 | % | | | 0.43 | % | | | 0.05 | % | | | 0.40 | %6 |
Series portfolio turnover10 | | | 1 | % | | | 19 | % | | | 4 | % | | | 7 | % | | | — | %11 |
|
| *The investment advisor paid a portion of the Series’ expenses. If these expenses had been incurred by the Series, the expense ratios (to average net assets) would have been increased by the following amounts: | |
| | | | | |
| | | 0.15 | %6,7 | | | 0.17 | %8 | | | 0.32 | %7 | | | 2.10 | %7 | | | 28,865 | %6,7,12 |
| | | | | | | | | | | | | | | | | | | | |
| TARGET 2040 SERIES CLASS R | | FOR THE SIX
MONTHS ENDED
| | | FOR THE YEARS ENDED | | | FOR THE PERIOD | |
| | | 4/30/12
(UNAUDITED) | | | 10/31/2011 | | | 10/31/2010 | | | 10/31/2009 | | | 3/28/081 TO 10/31/08 | |
Per share data (for a share outstanding throughout each period): | | | | | | | | | | | | | | | | | | | | |
Net asset value - Beginning of period | | $ | 10.04 | | | $ | 10.14 | | | $ | 8.76 | | | $ | 7.58 | | | $ | 10.00 | |
| | | | | | | | | | | | | | | | | | | | |
Income (loss) from investment operations: | | | | | | | | | | | | | | | | | | | | |
Net investment income (loss)2 | | | 0.03 | | | | 0.05 | | | | 0.04 | | | | (0.02 | ) | | | 0.01 | |
Net realized and unrealized gain (loss) on underlying series | | | 0.59 | | | | — | 3 | | | 1.43 | | | | 1.35 | | | | (2.43 | ) |
| | | | | | | | | | | | | | | | | | | | |
| | | | | |
Total from investment operations | | | 0.62 | | | | 0.05 | | | | 1.47 | | | | 1.33 | | | | (2.42 | ) |
| | | | | | | | | | | | | | | | | | | | |
| | | | | |
Less distributions to shareholders: | | | | | | | | | | | | | | | | | | | | |
From net investment income | | | (0.05 | ) | | | (0.06 | ) | | | (0.06 | ) | | | (0.15 | ) | | | — | |
From net realized gain on investments | | | (0.54 | ) | | | (0.09 | ) | | | (0.03 | ) | | | — | | | | — | |
| | �� | | | | | | | | | | | | | | | | | | |
| | | | | |
Total distributions to shareholders | | | (0.59 | ) | | | (0.15 | ) | | | (0.09 | ) | | | (0.15 | ) | | | — | |
| | | | | | | | | | | | | | | | | | | | |
| | | | | |
Net asset value - End of period | | $ | 10.07 | | | $ | 10.04 | | | $ | 10.14 | | | $ | 8.76 | | | $ | 7.58 | |
| | | | | | | | | | | | | | | | | | | | |
| | | | | |
Net assets - End of period (000’s omitted) | | $ | 14,624 | | | $ | 11,475 | | | $ | 8,168 | | | $ | 504 | | | $ | 76 | 4 |
| | | | | | | | | | | | | | | | | | | | |
| | | | | |
Total return5 | | | 6.97 | % | | | 0.50 | % | | | 16.85 | % | | | 18.21 | % | | | (24.20 | %) |
Ratios (to average net assets)/ | | | | | | | | | | | | | | | | | | | | |
Supplemental Data: | | | | | | | | | | | | | | | | | | | | |
Expenses* | | | 0.55 | %6,7 | | | 0.55 | %8 | | | 0.52 | %7,9 | | | 0.55 | %7 | | | 0.55 | %6,7 |
Net investment income (loss) | | | 0.65 | %6 | | | 0.52 | % | | | 0.40 | % | | | (0.21 | %) | | | 0.14 | %6 |
Series portfolio turnover10 | | | 1 | % | | | 19 | % | | | 4 | % | | | 7 | % | | | — | %11 |
|
| *The investment advisor paid a portion of the Series’ expenses. If these expenses had been incurred by the Series, the expense ratios (to average net assets) would have been increased by the following amounts: | |
| | | | | |
| | | 0.15 | %6,7 | | | 0.17 | %8 | | | 0.31 | %7 | | | 16.27 | %7 | | | 28,865 | %6,7,12 |
1Commencement of operations.
2Calculated based on average shares outstanding during the period.
3Less than $0.01.
4Represents the whole number without rounding to the 000’s.
5Represents aggregate total return for the period indicated, and assumes reinvestment of all distributions. Total return would have been lower had certain expenses not been reimbursed during the period. Periods less than one year are not annualized.
6Annualized.
7Expense ratios do not include expenses of the underlying series in which the Series invests. The expense ratio of the underlying series was 0.85%.
8Expense ratios do not include expenses of the underlying series in which the Series invests. The expense ratio of the underlying series was 0.84%.
9During the year ended October 31, 2010, due to the timing of the renewal of the Series’ distribution plan under Rule 12b-1, the Series incurred approximately 11 months of distribution expense. The expense ratio would have been higher and the net investment income ratio and total return would have been lower had the Series incurred a full year of distribution expense.
10Reflects activity of the Series and does not include the activity of the underlying series.
11Less than 1%.
12The increase to the expense ratios (to average net assets) is largely due to the small net assets in each class.
The accompanying notes are an integral part of the financial statements.
18
Financial Highlights
| | | | | | | | | | | | | | | | | | | | |
TARGET 2040 SERIES CLASS C | | FOR THE SIX
MONTHS ENDED
| | | FOR THE YEARS ENDED | | | FOR THE PERIOD | |
| | | 4/30/12
(UNAUDITED) | | | 10/31/2011 | | | 10/31/2010 | | | 10/31/2009 | | | 3/28/081 TO 10/31/08 | |
Per share data (for a share outstanding throughout each period): | | | | | | | | | | | | | | | | | | | | |
Net asset value - Beginning of period | | $ | 9.94 | | | $ | 10.06 | | | $ | 8.70 | | | $ | 7.55 | | | $ | 10.00 | |
| | | | | | | | | | | | | | | | | | | | |
Income (loss) from investment operations: | | | | | | | | | | | | | | | | | | | | |
Net investment income (loss)2 | | | 0.01 | | | | 0.01 | | | | (0.01 | ) | | | (0.06 | ) | | | (0.02 | ) |
Net realized and unrealized gain (loss) on underlying series | | | 0.58 | | | | (0.01 | ) | | | 1.43 | | | | 1.36 | | | | (2.43 | ) |
| | | | | | | | | | | | | | | | | | | | |
| | | | | |
Total from investment operations | | | 0.59 | | | | — | | | | 1.42 | | | | 1.30 | | | | (2.45 | ) |
| | | | | | | | | | | | | | | | | | | | |
| | | | | |
Less distributions to shareholders: | | | | | | | | | | | | | | | | | | | | |
From net investment income | | | (0.02 | ) | | | (0.03 | ) | | | (0.03 | ) | | | (0.15 | ) | | | — | |
From net realized gain on investments | | | (0.54 | ) | | | (0.09 | ) | | | (0.03 | ) | | | — | | | | — | |
| | | | | | | | | | | | | | | | | | | | |
| | | | | |
Total distributions to shareholders | | | (0.56 | ) | | | (0.12 | ) | | | (0.06 | ) | | | (0.15 | ) | | | — | |
| | | | | | | | | | | | | | | | | | | | |
| | | | | |
Net asset value - End of period | | $ | 9.97 | | | $ | 9.94 | | | $ | 10.06 | | | $ | 8.70 | | | $ | 7.55 | |
| | | | | | | | | | | | | | | | | | | | |
| | | | | |
Net assets - End of period (000’s omitted) | | $ | 950 | | | $ | 913 | | | $ | 875 | | | $ | 440 | | | $ | 75 | 3 |
| | | | | | | | | | | | | | | | | | | | |
| | | | | |
Total return4 | | | 6.69 | % | | | (0.01 | %) | | | 16.32 | % | | | 17.88 | % | | | (24.50 | %) |
Ratios (to average net assets)/ | | | | | | | | | | | | | | | | | | | | |
Supplemental Data: | | | | | | | | | | | | | | | | | | | | |
Expenses* | | | 1.05 | %5,6 | | | 1.05 | %7 | | | 0.99 | %6,8 | | | 1.05 | %6 | | | 1.05 | %5,6 |
Net investment income (loss) | | | 0.23 | %5 | | | 0.09 | % | | | (0.12 | %) | | | (0.65 | %) | | | (0.36 | %)5 |
Series portfolio turnover9 | | | 1 | % | | | 19 | % | | | 4 | % | | | 7 | % | | | — | %10 |
|
| *The investment advisor paid a portion of the Series’ expenses. If these expenses had been incurred by the Series, the expense ratios (to average net assets) would have been increased by the following amounts: | |
| | | | | |
| | | 0.15 | %5,6 | | | 0.17 | %7 | | | 0.37 | %6 | | | 15.19 | %6 | | | 28,898 | %5,6,11 |
| | | | | | | | | | | | | | | | | | | | |
TARGET 2040 SERIES CLASS I | | FOR THE SIX
MONTHS ENDED
| | | FOR THE YEARS ENDED | | | FOR THE PERIOD | |
| | | 4/30/12
(UNAUDITED) | | | 10/31/2011 | | | 10/31/2010 | | | 10/31/2009 | | | 3/28/081 TO 10/31/08 | |
Per share data (for a share outstanding throughout each period): | | | | | | | | | | | | | | | | | | | | |
Net asset value - Beginning of period | | $ | 10.16 | | | $ | 10.26 | | | $ | 8.83 | | | $ | 7.60 | | | $ | 10.00 | |
| | | | | | | | | | | | | | | | | | | | |
Income (loss) from investment operations: | | | | | | | | | | | | | | | | | | | | |
Net investment income2 | | | 0.06 | | | | 0.04 | | | | 0.08 | | | | 0.07 | | | | — | 12 |
Net realized and unrealized gain (loss) on underlying series | | | 0.59 | | | | 0.06 | | | | 1.46 | | | | 1.32 | | | | (2.40 | ) |
| | | | | | | | | | | | | | | | | | | | |
| | | | | |
Total from investment operations | | | 0.65 | | | | 0.10 | | | | 1.54 | | | | 1.39 | | | | (2.40 | ) |
| | | | | | | | | | | | | | | | | | | | |
| | | | | |
Less distributions to shareholders: | | | | | | | | | | | | | | | | | | | | |
From net investment income | | | (0.08 | ) | | | (0.11 | ) | | | (0.08 | ) | | | (0.16 | ) | | | — | |
From net realized gain on investments | | | (0.54 | ) | | | (0.09 | ) | | | (0.03 | ) | | | — | | | | — | |
| | | | | | | | | | | | | | | | | | | | |
| | | | | |
Total distributions to shareholders | | | (0.62 | ) | | | (0.20 | ) | | | (0.11 | ) | | | (0.16 | ) | | | — | |
| | | | | | | | | | | | | | | | | | | | |
| | | | | |
Net asset value - End of period | | $ | 10.19 | | | $ | 10.16 | | | $ | 10.26 | | | $ | 8.83 | | | $ | 7.60 | |
| | | | | | | | | | | | | | | | | | | | |
| | | | | |
Net assets - End of period (000’s omitted) | | $ | 18,966 | | | $ | 11,298 | | | $ | 1,066 | | | $ | 428 | | | $ | 28,539 | 3 |
| | | | | | | | | | | | | | | | | | | | |
| | | | | |
Total return4 | | | 7.19 | % | | | 0.93 | % | | | 17.52 | % | | | 18.86 | % | | | (24.00 | %) |
Ratios (to average net assets)/ | | | | | | | | | | | | | | | | | | | | |
Supplemental Data: | | | | | | | | | | | | | | | | | | | | |
Expenses* | | | 0.05 | %5,6 | | | 0.05 | %7 | | | 0.05 | %6 | | | 0.05 | %6 | | | 0.05 | %5,6 |
Net investment income (loss) | | | 1.17 | %5 | | | 0.35 | % | | | 0.84 | % | | | 0.93 | % | | | (0.04 | %)5 |
Series portfolio turnover9 | | | 1 | % | | | 19 | % | | | 4 | % | | | 7 | % | | | — | %10 |
|
| *The investment advisor paid a portion of the Series’ expenses. If these expenses had been incurred by the Series, the expense ratios (to average net assets) would have been increased by the following amounts: | |
| | | | | |
| | | 0.15 | %5,6 | | | 0.18 | %7 | | | 0.36 | %6 | | | 18.65 | %6 | | | 767 | %5,6,11 |
1Commencement of operations.
2Calculated based on average shares outstanding during the period.
3Represents the whole number without rounding to the 000’s.
4Represents aggregate total return for the period indicated, and assumes reinvestment of all distributions. Total return would have been lower had certain expenses not been reimbursed during the period. Periods less than one year are not annualized.
5Annualized.
6Expense ratios do not include expenses of the underlying series in which the Series invests. The expense ratio of the underlying series was 0.85%.
7Expense ratios do not include expenses of the underlying series in which the Series invests. The expense ratio of the underlying series was 0.84%.
8During the year ended October 31, 2010, due to the timing of the renewal of the Series’ distribution plan under Rule 12b-1, the Series incurred approximately 11 months of distribution expense. The expense ratio would have been higher and the net investment income ratio and total return would have been lower had the Series incurred a full year of distribution expense.
9Reflects activity of the Series and does not include the activity of the underlying series.
10Less than 1%.
11The increase to the expense ratios (to average net assets) is largely due to the small net assets in each class.
12Less than $0.01.
The accompanying notes are an integral part of the financial statements.
19
Financial Highlights
| | | | | | | | | | | | | | | | | | | | |
| TARGET 2050 SERIES CLASS K | | FOR THE SIX
MONTHS ENDED | | | FOR THE YEARS ENDED | | | FOR THE PERIOD | |
| | | 4/30/12
(UNAUDITED) | | | 10/31/2011 | | | 10/31/2010 | | | 10/31/2009 | | | 3/28/081 TO 10/31/08 | |
Per share data (for a share outstanding throughout each period): | | | | | | | | | | | | | | | | | | | | |
Net asset value - Beginning of period | | $ | 10.20 | | | $ | 10.22 | | | $ | 8.85 | | | $ | 7.58 | | | $ | 10.00 | |
| | | | | | | | | | | | | | | | | | | | |
Income (loss) from investment operations: | | | | | | | | | | | | | | | | | | | | |
Net investment income (loss)2 | | | 0.05 | | | | 0.09 | | | | 0.03 | | | | (0.02 | ) | | | 0.02 | |
Net realized and unrealized gain (loss) on underlying series | | | 0.64 | | | | (0.01 | ) | | | 1.48 | | | | 1.52 | | | | (2.44 | ) |
| | | | | | | | | | | | | | | | | | | | |
Total from investment operations | | | 0.69 | | | | 0.08 | | | | 1.51 | | | | 1.50 | | | | (2.42 | ) |
| | | | | | | | | | | | | | | | | | | | |
Less distributions to shareholders: | | | | | | | | | | | | | | | | | | | | |
From net investment income | | | (0.07 | ) | | | (0.08 | ) | | | (0.06 | ) | | | (0.23 | ) | | | — | |
From net realized gain on investments | | | (0.19 | ) | | | (0.02 | ) | | | (0.08 | ) | | | — | | | | — | |
| | | | | | | | | | | | | | | | | | | | |
Total distributions to shareholders | | | (0.26 | ) | | | (0.10 | ) | | | (0.14 | ) | | | (0.23 | ) | | | — | |
| | | | | | | | | | | | | | | | | | | | |
Net asset value - End of period | | $ | 10.63 | | | $ | 10.20 | | | $ | 10.22 | | | $ | 8.85 | | | $ | 7.58 | |
| | | | | | | | | | | | | | | | | | | | |
Net assets - End of period (000’s omitted) | | $ | 21,630 | | | $ | 18,293 | | | $ | 15,242 | | | $ | 1,047 | | | $ | 76 | 3 |
| | | | | | | | | | | | | | | | | | | | |
Total return4 | | | 7.09 | % | | | 0.76 | % | | | 17.16 | % | | | 20.71 | % | | | (24.20 | %) |
| Ratios (to average net assets)/Supplemental Data: | | | | | | | | | | | | | | | | | | | | |
Expenses* | | | 0.30 | %5,6 | | | 0.30 | %7 | | | 0.30 | %6,8 | | | 0.30 | %6 | | | 0.30 | %5,6 |
Net investment income (loss) | | | 0.92 | %5 | | | 0.82 | % | | | 0.28 | % | | | (0.24 | %) | | | 0.40 | %5 |
Series portfolio turnover9 | | | 2 | % | | | 10 | % | | | 3 | % | | | 46 | % | | | 1 | % |
|
| *The investment advisor paid a portion of the Series’ expenses. If these expenses had been incurred by the Series, the expense ratios (to average net assets) would have been increased by the following amounts: | |
| | | | | |
| | | 0.46 | %5,6 | | | 0.54 | %7 | | | 1.07 | %6 | | | 25.10 | %6 | | | 35,232 | %5,6,10 |
| TARGET 2050 SERIES CLASS R | | FOR THE SIX
MONTHS ENDED | | | FOR THE YEARS ENDED | | | FOR THE PERIOD | |
| | | 4/30/12
(UNAUDITED) | | | 10/31/2011 | | | 10/31/2010 | | | 10/31/2009 | | | 3/28/081 TO 10/31/08 | |
Per share data (for a share outstanding throughout each period): | | | | | | | | | | | | | | | | | | | | |
Net asset value - Beginning of period | | $ | 10.14 | | | $ | 10.16 | | | $ | 8.82 | | | $ | 7.58 | | | $ | 10.00 | |
| | | | | | | | | | | | | | | | | | | | |
Income (loss) from investment operations: | | | | | | | | | | | | | | | | | | | | |
Net investment income (loss)2 | | | 0.03 | | | | 0.06 | | | | 0.03 | | | | (0.05 | ) | | | 0.01 | |
Net realized and unrealized gain (loss) on underlying series | | | 0.64 | | | | — | 11 | | | 1.44 | | | | 1.52 | | | | (2.43 | ) |
| | | | | | | | | | | | | | | | | | | | |
Total from investment operations | | | 0.67 | | | | 0.06 | | | | 1.47 | | | | 1.47 | | | | (2.42 | ) |
| | | | | | | | | | | | | | | | | | | | |
Less distributions to shareholders: | | | | | | | | | | | | | | | | | | | | |
From net investment income | | | (0.05 | ) | | | (0.06 | ) | | | (0.05 | ) | | | (0.23 | ) | | | — | |
From net realized gain on investments | | | (0.19 | ) | | | (0.02 | ) | | | (0.08 | ) | | | — | | | | — | |
| | | | | | | | | | | | | | | | | | | | |
Total distributions to shareholders | | | (0.24 | ) | | | (0.08 | ) | | | (0.13 | ) | | | (0.23 | ) | | | — | |
| | | | | | | | | | | | | | | | | | | | |
Net asset value - End of period | | $ | 10.57 | | | $ | 10.14 | | | $ | 10.16 | | | $ | 8.82 | | | $ | 7.58 | |
| | | | | | | | | | | | | | | | | | | | |
Net assets - End of period (000’s omitted) | | $ | 3,239 | | | $ | 2,686 | | | $ | 2,154 | | | $ | 601 | | | $ | 76 | 3 |
| | | | | | | | | | | | | | | | | | | | |
Total return4 | | | 6.96 | % | | | 0.56 | % | | | 16.85 | % | | | 20.31 | % | | | (24.20 | %) |
| Ratios (to average net assets)/Supplemental Data: | | | | | | | | | | | | | | | | | | | | |
Expenses* | | | 0.55 | %5,6 | | | 0.55 | %7 | | | 0.53 | %6,8 | | | 0.55 | %6 | | | 0.55 | %5,6 |
Net investment income (loss) | | | 0.63 | %5 | | | 0.55 | % | | | 0.27 | % | | | (0.50 | %) | | | 0.14 | %5 |
Series portfolio turnover9 | | | 2 | % | | | 10 | % | | | 3 | % | | | 46 | % | | | 1 | % |
|
| *The investment advisor paid a portion of the Series’ expenses. If these expenses had been incurred by the Series, the expense ratios (to average net assets) would have been increased by the following amounts: | |
| | | | | |
| | | 0.46 | %5,6 | | | 0.54 | %7 | | | 1.44 | %6 | | | 242.05 | %6 | | | 35,243 | %5,6,10 |
1Commencement of operations.
2Calculated based on average shares outstanding during the period.
3Represents the whole number without rounding to the 000’s.
4Represents aggregate total return for the period indicated, and assumes reinvestment of all distributions. Total return would have been lower had certain expenses not been reimbursed during the period. Periods less than one year are not annualized.
5Annualized.
6Expense ratios do not include expenses of the underlying series in which the Series invests. The expense ratio of the underlying series was 0.85%.
7Expense ratios do not include expenses of the underlying series in which the Series invests. The expense ratio of the underlying series was 0.84%.
8During the year ended October 31, 2010, due to the timing of the renewal of the Series’ distribution plan under Rule 12b-1, the Series incurred approximately 11 months of distribution expense. The expense ratio would have been higher and the net investment income ratio and total return would have been lower had the Series incurred a full year of distribution expense.
9Reflects activity of the Series and does not include the activity of the underlying series.
10The increase to the expense ratios (to average net assets) is largely due to the small net assets in each class.
11Less than $0.01.
The accompanying notes are an integral part of the financial statements.
20
Financial Highlights
| | | | | | | | | | | | | | | | | | | | |
| TARGET 2050 SERIES CLASS C | | FOR THE SIX
MONTHS ENDED | | | FOR THE YEARS ENDED | | | FOR THE PERIOD | |
| | | 4/30/12
(UNAUDITED) | | | 10/31/2011 | | | 10/31/2010 | | | 10/31/2009 | | | 3/28/081 TO 10/31/08 | |
Per share data (for a share outstanding throughout each period): | | | | | | | | | | | | | | | | | | | | |
Net asset value - Beginning of period | | $ | 10.02 | | | $ | 10.08 | | | $ | 8.75 | | | $ | 7.55 | | | $ | 10.00 | |
| | | | | | | | | | | | | | | | | | | | |
Income (loss) from investment operations: | | | | | | | | | | | | | | | | | | | | |
Net investment income (loss)2 | | | 0.01 | | | | 0.01 | | | | (0.04 | ) | | | (0.06 | ) | | | (0.02 | ) |
Net realized and unrealized gain (loss) on underlying series | | | 0.63 | | | | (0.01 | ) | | | 1.46 | | | | 1.49 | | | | (2.43 | ) |
| | | | | | | | | | | | | | | | | | | | |
| | | | | |
Total from investment operations | | | 0.64 | | | | — | | | | 1.42 | | | | 1.43 | | | | (2.45 | ) |
| | | | | | | | | | | | | | | | | | | | |
| | | | | |
Less distributions to shareholders: | | | | | | | | | | | | | | | | | | | | |
From net investment income | | | (0.03 | ) | | | (0.04 | ) | | | (0.01 | ) | | | (0.23 | ) | | | — | |
From net realized gain on investments | | | (0.19 | ) | | | (0.02 | ) | | | (0.08 | ) | | | — | | | | — | |
| | | | | | | | | | | | | | | | | | | | |
| | | | | |
Total distributions to shareholders | | | (0.22 | ) | | | (0.06 | ) | | | (0.09 | ) | | | (0.23 | ) | | | — | |
| | | | | | | | | | | | | | | | | | | | |
| | | | | |
Net asset value - End of period | | $ | 10.44 | | | $ | 10.02 | | | $ | 10.08 | | | $ | 8.75 | | | $ | 7.55 | |
| | | | | | | | | | | | | | | | | | | | |
| | | | | |
Net assets - End of period (000’s omitted) | | $ | 1,050 | | | $ | 948 | | | $ | 843 | | | $ | 99 | | | $ | 75 | 3 |
| | | | | | | | | | | | | | | | | | | | |
| | | | | |
Total return4 | | | 6.65 | % | | | (0.06 | %) | | | 16.34 | % | | | 19.84 | % | | | (24.50 | %) |
Ratios (to average net assets)/Supplemental Data: | | | | | | | | | | | | | | | | | | | | |
Expenses* | | | 1.05 | %5,6 | | | 1.05 | %7 | | | 1.02 | %6,8 | | | 1.05 | %6 | | | 1.05 | %5,6 |
Net investment income (loss) | | | 0.22 | %5 | | | 0.09 | % | | | (0.44 | %) | | | (0.71 | %) | | | (0.36 | %)5 |
Series portfolio turnover9 | | | 2 | % | | | 10 | % | | | 3 | % | | | 46 | % | | | 1 | % |
|
| *The investment advisor paid a portion of the Series’ expenses. If these expenses had been incurred by the Series, the expense ratios (to average net assets) would have been increased by the following amounts: | |
| | | | | |
| | | 0.46 | %5,6 | | | 0.55 | %7 | | | 1.23 | %6 | | | 73.45 | %6 | | | 35,267 | %5,6,10 |
| | | | | | | | | | | | | | | | | | | | |
TARGET 2050 SERIES CLASS I | | FOR THE SIX
MONTHS ENDED | | | FOR THE YEARS ENDED | | | FOR THE PERIOD | |
| | | 4/30/12
(UNAUDITED) | | | 10/31/2011 | | | 10/31/2010 | | | 10/31/2009 | | | 3/28/081 TO 10/31/08 | |
Per share data (for a share outstanding throughout each period): | | | | | | | | | | | | | | | | | | | | |
Net asset value - Beginning of period | | $ | 10.26 | | | $ | 10.28 | | | $ | 8.90 | | | $ | 7.60 | | | $ | 10.00 | |
| | | | | | | | | | | | | | | | | | | | |
Income (loss) from investment operations: | | | | | | | | | | | | | | | | | | | | |
Net investment income2 | | | 0.06 | | | | 0.03 | | | | 0.07 | | | | 0.16 | | | | — | 11 |
Net realized and unrealized gain (loss) on underlying series | | | 0.64 | | | | 0.08 | | | | 1.47 | | | | 1.37 | | | | (2.40 | ) |
| | | | | | | | | | | | | | | | | | | | |
| | | | | |
Total from investment operations | | | 0.70 | | | | 0.11 | | | | 1.54 | | | | 1.53 | | | | (2.40 | ) |
| | | | | | | | | | | | | | | | | | | | |
| | | | | |
Less distributions to shareholders: | | | | | | | | | | | | | | | | | | | | |
From net investment income | | | (0.08 | ) | | | (0.11 | ) | | | (0.08 | ) | | | (0.23 | ) | | | — | |
From net realized gain on investments | | | (0.19 | ) | | | (0.02 | ) | | | (0.08 | ) | | | — | | | | — | |
| | | | | | | | | | | | | | | | | | | | |
| | | | | |
Total distributions to shareholders | | | (0.27 | ) | | | (0.13 | ) | | | (0.16 | ) | | | (0.23 | ) | | | — | |
| | | | | | | | | | | | | | | | | | | | |
| | | | | |
Net asset value - End of period | | $ | 10.69 | | | $ | 10.26 | | | $ | 10.28 | | | $ | 8.90 | | | $ | 7.60 | |
| | | | | | | | | | | | | | | | | | | | |
| | | | | |
Net assets - End of period (000’s omitted) | | $ | 3,420 | | | $ | 2,121 | | | $ | 129 | | | $ | 79 | | | $ | 17,863 | 3 |
| | | | | | | | | | | | | | | | | | | | |
| | | | | |
Total return4 | | | 7.20 | % | | | 0.98 | % | | | 17.40 | % | | | 21.07 | % | | | (24.00 | %) |
Ratios (to average net assets)/Supplemental Data: | | | | | | | | | | | | | | | | | | | | |
Expenses* | | | 0.05 | %5,6 | | | 0.05 | %7 | | | 0.05 | %6 | | | 0.05 | %6 | | | 0.05 | %5,6 |
Net investment income (loss) | | | 1.08 | %5 | | | 0.25 | % | | | 0.76 | % | | | 2.07 | % | | | (0.03 | %)5 |
Series portfolio turnover9 | | | 2 | % | | | 10 | % | | | 3 | % | | | 46 | % | | | 1 | % |
|
| *The investment advisor paid a portion of the Series’ expenses. If these expenses had been incurred by the Series, the expense ratios (to average net assets) would have been increased by the following amounts: | |
| | | | | |
| | | 0.46 | %5,6 | | | 0.57 | %7 | | | 1.90 | %6 | | | 141.53 | %6 | | | 1,903 | %5,6,10 |
1Commencement of operations.
2Calculated based on average shares outstanding during the period.
3Represents the whole number without rounding to the 000’s.
4Represents aggregate total return for the period indicated, and assumes reinvestment of all distributions. Total return would have been lower had certain expenses not been reimbursed during the period. Periods less than one year are not annualized.
5Annualized.
6Expense ratios do not include expenses of the underlying series in which the Series invests. The expense ratio of the underlying series was 0.85%.
7Expense ratios do not include expenses of the underlying series in which the Series invests. The expense ratio of the underlying series was 0.84%.
8During the year ended October 31, 2010, due to the timing of the renewal of the Series’ distribution plan under Rule 12b-1, the Series incurred approximately 11 months of distribution expense. The expense ratio would have been higher and the net investment income ratio and total return would have been lower had the Series incurred a full year of distribution expense.
9Reflects activity of the Series and does not include the activity of the underlying series.
10The increase to the expense ratios (to average net assets) is largely due to the small net assets in each class.
11Less than $0.01.
The accompanying notes are an integral part of the financial statements.
21
Notes to Financial Statements
(unaudited)
Target Income Series, Target 2010 Series, Target 2020 Series, Target 2030 Series, Target 2040 Series and Target 2050 Series (each the “Series”) are no-load diversified series of Manning & Napier Fund, Inc. (the “Fund”). The Fund is organized in Maryland and is registered under the Investment Company Act of 1940 (the “1940 Act”), as amended, as an open-end management investment company.
Each Series seeks to achieve its investment objectives by investing in a combination of other Manning & Napier mutual funds (the “underlying series”) in order to meet its target asset allocations and investment style. The Series are designed to provide a single investment portfolio that adjusts over time to meet the changing risk and return objectives of investors over their expected investment horizon. As the target retirement date approaches, the Series’ portfolio becomes more conservative with a larger fixed-income investment component. The financial statements of the underlying series should be read in conjunction with the Series’ financial statements.
Each Series is authorized to issue four classes of shares (Class K, R, C and I). Each class of shares is substantially the same, except that class-specific distribution and shareholder servicing expenses are borne by the specific class of shares to which they relate.
The Fund’s Advisor is Manning & Napier Advisors, LLC (the “Advisor”). Shares of each Series are offered to investors and employees of the Advisor and its affiliates. The total authorized capital stock of the Fund consists of 15.0 billion shares of common stock each having a par value of $0.01. As of April 30, 2012, 9.8 billion shares have been designated in total among 41 series, of which 10 million have been designated in each of the Series for Class C common stock, 40 million have been designated in each of the Series for Class K and R common stock and 100 million have been designated in each of the Series for Class I common stock.
| 2. | Significant Accounting Policies |
Security Valuation
Investments in the underlying series are valued at their net asset value per share on valuation date. In the absence of the availability of a net asset value per share on the underlying series, security valuations may be determined in good faith by the Advisor under procedures approved by and under the general supervision and responsibility of the Fund’s Board of Directors (the “Board”).
Volume and level of activity in established markets for an asset or liability are evaluated to determine whether recent transactions and quoted prices are determinative of fair value. Where there have been significant decreases in volume and level of activity, further analysis and adjustment may be necessary to estimate fair value. The Series measure fair value in these instances by the use of inputs and valuation techniques which may be based upon current market prices of securities that are comparable in coupon, rating, maturity and industry and/or expectation of future cash flows. As a result of trading in relatively thin markets and/or markets that experience significant volatility, the prices used by the Series to value these securities may differ from the value that would be realized if these securities were sold, and the differences could be material.
Securities for which representative valuations or prices are not available from the Series’ pricing service may be valued at fair value as determined in good faith by the Advisor under procedures approved by and under the general supervision and responsibility of the Board. Due to the inherent uncertainty of valuations of such securities, the fair value may differ significantly from the values that would have been used had a ready market for such securities existed. If trading or events occurring after the close of the principal market in which securities are traded are expected to materially affect the value of those securities, then they may be valued at their fair value, taking this trading or these events into account.
Various inputs are used in determining the value of the Series’ assets or liabilities carried at fair value. These inputs are summarized in three broad levels. Level 1 includes quoted prices in active markets for identical assets and liabilities. Level 2 includes other significant observable inputs (including quoted prices for similar securities, interest rates, prepayment speeds, credit risk, etc.). Level 3 includes significant unobservable inputs (including the Series’ own assumptions in determining the fair value of investments). A financial instrument’s level within the fair value hierarchy is based on the lowest level on any input both
22
Notes to Financial Statements (continued)
(unaudited)
| 2. | Significant Accounting Policies (continued) |
Security Valuation (continued)
individually and in aggregate that is significant to the fair value measurement. The inputs or methodology used for valuing securities are not necessarily an indication of the risk associated with investing in those securities.
The following is a summary of the valuation levels used for major security types as of April 30, 2012 in valuing the Series’ assets or liabilities carried at fair value:
| | | | | | | | | | | | | | | | |
| | | TARGET INCOME SERIES | | | | |
| DESCRIPTION | | TOTAL | | | LEVEL 1 | | | LEVEL 2 | | | LEVEL 3 | |
Assets: | | | | | | | | | | | | | | | | |
Mutual funds | | $ | 55,384,766 | | | $ | 55,384,766 | | | $ | — | | | $ | — | |
| | | | | | | | | | | | | | | | |
Total assets: | | $ | 55,384,766 | | | $ | 55,384,766 | | | $ | — | | | $ | — | |
| | | | | | | | | | | | | | | | |
| | | | | | | | | | | | | | | | |
| | | TARGET 2010 SERIES | | | | |
| DESCRIPTION | | TOTAL | | | LEVEL 1 | | | LEVEL 2 | | | LEVEL 3 | |
Assets: | | | | | | | | | | | | | | | | |
Mutual funds | | $ | 42,840,838 | | | $ | 42,840,838 | | | $ | — | | | $ | — | |
| | | | | | | | | | | | | | | | |
Total assets: | | $ | 42,840,838 | | | $ | 42,840,838 | | | $ | — | | | $ | — | |
| | | | | | | | | | | | | | | | |
| | | | | | | | | | | | | | | | |
| | | TARGET 2020 SERIES | | | | |
| DESCRIPTION | | TOTAL | | | LEVEL 1 | | | LEVEL 2 | | | LEVEL 3 | |
Assets: | | | | | | | | | | | | | | | | |
Mutual funds | | $ | 117,190,647 | | | $ | 117,190,647 | | | $ | — | | | $ | — | |
| | | | | | | | | | | | | | | | |
Total assets: | | $ | 117,190,647 | | | $ | 117,190,647 | | | $ | — | | | $ | — | |
| | | | | | | | | | | | | | | | |
| | | | | | | | | | | | | | | | |
| | | TARGET 2030 SERIES | | | | |
| DESCRIPTION | | TOTAL | | | LEVEL 1 | | | LEVEL 2 | | | LEVEL 3 | |
Assets: | | | | | | | | | | | | | | | | |
Mutual funds | | $ | 111,099,857 | | | $ | 111,099,857 | | | $ | — | | | $ | — | |
| | | | | | | | | | | | | | | | |
Total assets: | | $ | 111,099,857 | | | $ | 111,099,857 | | | $ | — | | | $ | — | |
| | | | | | | | | | | | | | | | |
| | | | | | | | | | | | | | | | |
| | | TARGET 2040 SERIES | | | | |
| DESCRIPTION | | TOTAL | | | LEVEL 1 | | | LEVEL 2 | | | LEVEL 3 | |
Assets: | | | | | | | | | | | | | | | | |
Mutual funds | | $ | 75,692,710 | | | $ | 75,692,710 | | | $ | — | | | $ | — | |
| | | | | | | | | | | | | | | | |
Total assets: | | $ | 75,692,710 | | | $ | 75,692,710 | | | $ | — | | | $ | — | |
| | | | | | | | | | | | | | | | |
| | | | | | | | | | | | | | | | |
| | | TARGET 2050 SERIES | | | | |
| DESCRIPTION | | TOTAL | | | LEVEL 1 | | | LEVEL 2 | | | LEVEL 3 | |
Assets: | | | | | | | | | | | | | | | | |
Mutual funds | | $ | 29,339,220 | | | $ | 29,339,220 | | | $ | — | | | $ | — | |
| | | | | | | | | | | | | | | | |
Total assets: | | $ | 29,339,220 | | | $ | 29,339,220 | | | $ | — | | | $ | — | |
| | | | | | | | | | | | | | | | |
There were no Level 2 or Level 3 securities held by any of the Series as of October 31, 2011 or April 30, 2012.
The Fund’s policy is to recognize transfers in and transfers out of the valuation levels as of the beginning of the reporting period. There were no transfers between Level 1 and Level 2 during the six months ended April 30, 2012.
Recent Accounting Standard
In May 2011, the Financial Accounting Standards Board (“FASB”) issued Accounting Standards Update No. 2011-04, “Fair Value Measurements (Topic 820) - Amendments to Achieve Common Fair Value Measurement and Disclosure Requirements in U.S.
23
Notes to Financial Statements (continued)
(unaudited)
| 2. | Significant Accounting Policies (continued) |
Recent Accounting Standard (continued)
GAAP and IFRSs” (“ASU 2011-04”). ASU 2011-04 clarifies the application of existing fair value measurement requirements, changes certain principles related to measuring fair value, and requires additional disclosures about fair value measurements.
Required disclosures are expanded under the new guidance, especially for fair value measurements that are categorized within Level 3 of the fair value hierarchy, for which quantitative information about the unobservable inputs used, and a narrative description of the valuation processes in place and sensitivity of recurring Level 3 measurements to changes in unobservable inputs will be required.
ASU 2011-04 is effective for annual periods beginning after December 15, 2011 and is to be applied prospectively. Management is currently assessing the impact of this guidance, but does not expect it to have a material impact on the Series’ financial statements.
Security Transactions, Investment Income and Expenses
Security transactions are accounted for on trade date. Dividend income is recorded on the ex-dividend date. Non-cash dividends, if any, are recorded at the fair value of the securities received. Income and capital gains distributions from the Underlying Series, if any, are recorded on the ex-dividend date.
Expenses are recorded on an accrual basis. Most expenses of the Fund can be attributed to a specific series. Expenses which cannot be directly attributed are apportioned among the series in the Fund in such a manner as deemed equitable by the Fund’s Board, taking into consideration, among other things, the nature and type of expense. Expenses included in the accompanying statements of operations do not include any expense of the underlying series.
Income, expenses (other than class specific expenses), and realized and unrealized gains and losses are prorated among the classes based on the relative net assets of each class. Class specific expenses are directly charged to that Class.
The Series use the identified cost method for determining realized gain or loss on investments for both financial statement and federal income tax reporting purposes.
Federal Taxes
Each Series’ policy is to comply with the provisions of the Internal Revenue Code applicable to regulated investment companies. The Series are not subject to federal income tax or excise tax to the extent that each Series distributes to shareholders each year its taxable income, including any net realized gains on investments, in accordance with requirements of the Internal Revenue Code. Accordingly, no provision for federal income tax or excise tax has been made in the financial statements.
Management evaluates its tax positions to determine if the tax positions taken meet the minimum recognition threshold in connection with accounting for uncertainties in income tax positions taken or expected to be taken for the purposes of measuring and recognizing tax liabilities in the financial statements. Recognition of tax benefits of an uncertain tax position is required only when the position is “more likely than not” to be sustained assuming examination by taxing authorities. At April 30, 2012, the Series have recorded no liability for net unrecognized tax benefits relating to uncertain income tax positions taken or expected to be taken in future tax returns.
The Series file income tax returns in the U.S. federal jurisdiction, various states and foreign jurisdictions, as required. No income tax returns are currently under investigation. The statute of limitations on the Series’ tax returns remains open for the years ended October 31, 2008 through October 31, 2011. The Series is not aware of any tax positions for which it is reasonably possible that the total amounts of unrecognized tax benefits will significantly change in the next twelve months.
Foreign Taxes
Based on the Series’ understanding of the tax rules and rates related to income, gains and currency purchase/ repatriation transactions for foreign jurisdictions in which they invest, the Series will provide for foreign taxes, and where appropriate, deferred foreign tax.
24
Notes to Financial Statements (continued)
(unaudited)
| 2. | Significant Accounting Policies (continued) |
Distributions of Income and Gains
Distributions to shareholders of net investment income are made semi-annually. Distributions of net realized gains are made annually. An additional distribution may be necessary to avoid taxation of a Series. Distributions are recorded on the ex-dividend date.
Indemnifications
The Fund’s organizational documents provide former and current directors and officers with a limited indemnification against liabilities arising in connection with the performance of their duties to the Fund. In the normal course of business, the Fund may also enter into contracts that provide general indemnifications. The Fund’s maximum exposure under these arrangements is unknown as this would be dependent on future claims that may be made against the Fund. The risk of material loss from such claims is considered remote.
Other
The preparation of financial statements in conformity with accounting principles generally accepted in the United States of America requires management to make estimates and assumptions that affect the reported amounts of assets and liabilities and the disclosure of contingent assets and liabilities at the date of the financial statements and the reported amounts of income and expenses during the reporting period. Actual results could differ from those estimates.
| 3. | Transactions with Affiliates |
The Fund has an Investment Advisory Agreement (the “Agreement”) with the Advisor, for which the Advisor does not receive an advisory fee for the services it performs for the Series. However, the Advisor is entitled to receive an advisory fee from each of the underlying series in which the Series invest.
Under the Agreement, personnel of the Advisor provide the Series with advice and assistance in the choice of investments and the execution of securities transactions, and otherwise maintain the Series’ organization. The Advisor also provides the Fund with necessary office space and fund administration and support services. The salaries of all officers of the Fund (except a percentage of the Fund’s Chief Compliance Officer’s salary, which is paid by the Fund), and of all Directors who are “affiliated persons” of the Fund, or of the Advisor, and all personnel of the Fund, or of the Advisor, performing services relating to research, statistical and investment activities, are paid by the Advisor. Each “non-affiliated” Director receives an annual stipend, which is allocated among all the active series of the Fund. In addition, these Directors also receive a fee per Board meeting attended plus a fee for each committee meeting attended.
The Advisor has contractually agreed, until at least February 28, 2020, to limit each class’ total direct annual fund operating expenses for the Series at no more than 0.05% for each class, exclusive of distribution and service fees, of average daily net assets each year. The Advisor’s agreement to limit each class’ operating expenses is limited to direct operating expenses and, therefore, does not apply to the indirect expenses incurred by the Series through their investments in the underlying series. For the six months ended April 30, 2012, the Advisor reimbursed expenses of $52,915 for Target Income Series, $55,708 for Target 2010 Series, $44,130 for Target 2020 Series, $44,999 for Target 2030 Series, $50,357 for Target 2040 Series and $58,720 for Target 2050 Series, which is included as a reduction of expenses on the Statements of Operations. The Advisor is not eligible to recoup any expenses that have been reimbursed in prior years.
Manning & Napier Investor Services, Inc., a registered broker-dealer affiliate of the Advisor, acts as distributor for the Fund’s shares. Each Series compensates the distributor for distributing and servicing the Series’ Class K, Class R and Class C shares pursuant to a distribution plan adopted under Rule 12b-1 of the 1940 Act, regardless of expenses actually incurred. Under the agreement, each Series pays distribution and services fees to the distributor at an annual rate of 0.25% of average daily net assets attributable to Class K shares, 0.50% of average daily net assets attributable to Class R shares, and 1.00% of average daily net assets attributable to Class C shares. There are no distribution and services fees on the Class I shares of each Series. The fees are accrued daily and paid monthly.
25
Notes to Financial Statements (continued)
(unaudited)
| 3. | Transactions with Affiliates (continued) |
The Advisor has agreements with BNY Mellon Investment Servicing (U.S.) Inc. (“BNY”) under which BNY serves as sub-accountant services agent and sub-transfer agent. The fee rates for these Series are as follows: An annual fee related to fund accounting and administration of 0.0025% of the average daily net assets with an annual base fee of $40,500 per series. Transfer Agent fees are charged to the Fund on a per account basis. Additionally, certain cusip-based and out-of-pocket expenses are charged.
Expenses not directly attributable to a series are allocated based on each series’ relative net assets or number of accounts, depending on the expense.
| 4. | Purchases and Sales of Securities |
For the six months ended April 30, 2012, purchases and sales of underlying series were as follows:
| | | | | | | | |
| SERIES | | PURCHASES | | | SALES | |
Target Income Series | | $ | 8,640,942 | | | $ | 4,447,062 | |
Target 2010 Series | | $ | 12,001,867 | | | $ | 9,837,668 | |
Target 2020 Series | | $ | 26,992,707 | | | $ | 12,253,457 | |
Target 2030 Series | | $ | 36,690,954 | | | $ | 22,465,488 | |
Target 2040 Series | | $ | 8,630,024 | | | $ | 1,018,838 | |
Target 2050 Series | | $ | 4,106,825 | | | $ | 560,760 | |
| 5. | Investments in Affiliated Issuers |
A summary of the Series’ transactions in the shares of affiliated issuers during the six months ended April 30, 2012 is set forth below:
| | | | | | | | | | | | | | | | | | | | | | | | | | | | |
TARGET INCOME SERIES | | VALUE AT
10/31/11 | | | PURCHASE
COST | | | SALES PROCEEDS | | | VALUE AT 4/30/12 | | | SHARES HELD
AT 4/30/12 | | | DIVIDEND
INCOME
10/31/11
THROUGH
4/30/12 | | | DISTRIBUTIONS AND NET REALIZED GAIN 10/31/11 THROUGH 4/30/12 | |
Manning & Napier Pro-Blend® Conservative Term Series - Class I | | $ | 50,760,195 | | | $ | 8,640,942 | | | $ | 4,447,062 | | | $ | 55,384,766 | | | | 5,128,219 | | | $ | 783,195 | | | $ | 1,608,968 | |
| | | | | | | | | | | | | | | | | | | | | | | | | | | | |
| | $ | 50,760,195 | | | $ | 8,640,942 | | | $ | 4,447,062 | | | $ | 55,384,766 | | | | | | | $ | 783,195 | | | $ | 1,608,968 | |
| | | | | | | | | | | | | | | | | | | | | | | | | | | | |
| | | | | | | | | | | | | | | | | | | | | | | | | | | | |
| TARGET 2010 SERIES | | VALUE AT
10/31/11 | | | PURCHASE
COST | | | SALES
PROCEEDS | | | VALUE AT 4/30/12 | | | SHARES HELD
AT 4/30/12 | | | DIVIDEND
INCOME
10/31/11
THROUGH
4/30/12 | | | DISTRIBUTIONS
AND NET REALIZED
GAIN 10/31/11
THROUGH
4/30/12 | |
Manning & Napier Pro-Blend® Moderate Term Series - Class I | | $ | 32,326,819 | | | $ | 3,071,906 | | | $ | 9,177,892 | | | $ | 25,966,143 | | | | 2,468,265 | | | $ | 458,631 | | | $ | 1,323,815 | |
Manning & Napier Pro-Blend® Conservative Term Series - Class I | | | 8,228,390 | | | | 8,929,961 | | | | 659,776 | | | | 16,874,695 | | | | 1,562,472 | | | | 128,105 | | | | 167,963 | |
| | | | | | | | | | | | | | | | | | | | | | | | | | | | |
| | $ | 40,555,209 | | | $ | 12,001,867 | | | $ | 9,837,668 | | | $ | 42,840,838 | | | | | | | $ | 586,736 | | | $ | 1,491,778 | |
| | | | | | | | | | | | | | | | | | | | | | | | | | | | |
26
Notes to Financial Statements (continued)
(unaudited)
| 5. | Investments in Affiliated Issuers (continued) |
| | | | | | | | | | | | | | | | | | | | | | | | | | | | |
| TARGET 2020 SERIES | | VALUE AT
10/31/11 | | | PURCHASE
COST | | | SALES PROCEEDS | | | VALUE AT
4/30/12 | | | SHARES HELD
AT 4/30/12 | | | DIVIDEND
INCOME
10/31/11
THROUGH
4/30/12 | | | DISTRIBUTIONS
AND NET REALIZED
GAIN 10/31/11
THROUGH
4/30/12 | |
Manning & Napier Pro-Blend® Extended Term Series - Class I | | $ | 60,936,279 | | | $ | 9,506,736 | | | $ | 11,136,840 | | | $ | 58,927,451 | | | | 5,698,980 | | | $ | 884,447 | | | $ | 3,044,052 | |
Manning & Napier Pro-Blend® Moderate Term Series - Class I | | | 40,924,421 | | | | 17,485,971 | | | | 1,116,617 | | | | 58,263,196 | | | | 5,538,327 | | | | 593,432 | | | | 1,558,258 | |
| | | | | | | | | | | | | | | | | | | | | | | | | | | | |
| | $ | 101,860,700 | | | $ | 26,992,707 | | | $ | 12,253,457 | | | $ | 117,190,647 | | | | | | | $ | 1,477,879 | | | $ | 4,602,310 | |
| | | | | | | | | | | | | | | | | | | | | | | | | | | | |
| | | | | | | |
| | | | | | | | | | | | | | | | | | | | | | | | | | | | |
| TARGET 2030 SERIES | | VALUE AT
10/31/11 | | | PURCHASE
COST | | | SALES PROCEEDS | | | VALUE AT
4/30/12 | | | SHARES HELD
AT 4/30/12 | | | DIVIDEND
INCOME
10/31/11
THROUGH
4/30/12 | | | DISTRIBUTIONS AND NET REALIZED
GAIN (LOSS)
10/31/11
THROUGH
4/30/12 | |
Manning & Napier Pro-Blend® Maximum Term Series - Class I | | $ | 18,521,072 | | | $ | 1,508,720 | | | $ | 19,732,180 | | | $ | — | | | | — | | | $ | 121,541 | | | $ | (1,298 | ) |
Manning & Napier Pro-Blend® Extended Term Series - Class I | | | 76,963,499 | | | | 35,182,234 | | | | 2,733,308 | | | | 111,099,857 | | | | 10,744,667 | | | | 1,110,744 | | | | 3,616,667 | |
| | | | | | | | | | | | | | | | | | | | | | | | | | | | |
| | $ | 95,484,571 | | | $ | 36,690,954 | | | $ | 22,465,488 | | | $ | 111,099,857 | | | | | | | $ | 1,232,285 | | | $ | 3,615,369 | |
| | | | | | | | | | | | | | | | | | | | | | | | | | | | |
| | | | | | | |
| | | | | | | | | | | | | | | | | | | | | | | | | | | | |
| TARGET 2040 SERIES | | VALUE AT
10/31/11 | | | PURCHASE
COST | | | SALES
PROCEEDS | | | VALUE AT
4/30/12 | | | SHARES HELD
AT 4/30/12 | | | DIVIDEND
INCOME
10/31/11
THROUGH
4/30/12 | | | DISTRIBUTIONS AND NET REALIZED
GAIN 10/31/11 THROUGH
4/30/12 | |
Manning & Napier Pro-Blend® Maximum Term Series - Class I | | $ | 63,575,247 | | | $ | 8,630,024 | | | $ | 1,018,838 | | | $ | 75,692,710 | | | | 7,021,587 | | | $ | 419,707 | | | $ | 185,661 | |
| | | | | | | | | | | | | | | | | | | | | | | | | | | | |
| | $ | 63,575,247 | | | $ | 8,630,024 | | | $ | 1,018,838 | | | $ | 75,692,710 | | | | | | | $ | 419,707 | | | $ | 185,661 | |
| | | | | | | | | | | | | | | | | | | | | | | | | | | | |
| | | | | | | |
| | | | | | | | | | | | | | | | | | | | | | | | | | | | |
TARGET 2050 SERIES | | VALUE AT
10/31/11 | | | PURCHASE
COST | | | SALES
PROCEEDS | | | VALUE AT
4/30/12 | | | SHARES HELD
AT 4/30/12 | | | DIVIDEND
INCOME
10/31/11
THROUGH
4/30/12 | | | DISTRIBUTIONS
AND NET REALIZED
GAIN 10/31/11
THROUGH
4/30/12 | |
Manning & Napier Pro-Blend® Maximum Term Series - Class I | | $ | 24,069,850 | | | $ | 4,106,825 | | | $ | 560,760 | | | $ | 29,339,220 | | | | 2,721,635 | �� | | $ | 157,899 | | | $ | 34,374 | |
| | | | | | | | | | | | | | | | | | | | | | | | | | | | |
| | $ | 24,069,850 | | | $ | 4,106,825 | | | $ | 560,760 | | | $ | 29,339,220 | | | | | | | $ | 157,899 | | | $ | 34,374 | |
| | | | | | | | | | | | | | | | | | | | | | | | | | | | |
27
Notes to Financial Statements (continued)
(unaudited)
| 6. | Capital Stock Transactions |
Transactions in Class K, Class R, Class C and Class I shares:
| | | | | | | | | | | | | | | | | | | | | | | | | | | | | | | | |
| TARGET INCOME SERIES: | | FOR THE SIX MONTHS ENDED 4/30/12 | | | FOR THE YEAR ENDED 10/31/11 | | | FOR THE SIX MONTHS ENDED 4/30/12 | | | FOR THE YEAR ENDED 10/31/11 | |
| | CLASS K | | | CLASS K | | | CLASS R | | | CLASS R | |
| | | SHARES | | | | AMOUNTS | | | | SHARES | | | | AMOUNTS | | | | SHARES | | | | AMOUNTS | | | | SHARES | | | | AMOUNTS | |
Sold | | | 203,677 | | | $ | 2,127,553 | | | | 362,556 | | | $ | 3,910,102 | | | | 309,573 | | | $ | 3,173,471 | | | | 44,775 | | | $ | 479,118 | |
Reinvested | | | 249,626 | | | | 2,513,730 | | | | 182,292 | | | | 1,912,025 | | | | 3,638 | | | | 36,345 | | | | 1,095 | | | | 11,394 | |
Repurchased | | | (377,166 | ) | | | (4,023,535 | ) | | | (684,328 | ) | | | (7,414,278 | ) | | | (12,266 | ) | | | (127,885 | ) | | | (26,311 | ) | | | (283,256 | ) |
| | | | | | | | | | | | | | | | | | | | | | | | | | | | | | | | |
Total | | | 76,137 | | | $ | 617,748 | | | | (139,480 | ) | | $ | (1,592,151 | ) | | | 300,945 | | | $ | 3,081,931 | | | | 19,559 | | | $ | 207,256 | |
| | | | | | | | | | | | | | | | | | | | | | | | | | | | | | | | |
| | | | | | | | |
| | | | | | | | | | | | | | | | | | | | | | | | | | | | | | | | |
| TARGET INCOME SERIES: | | FOR THE SIX MONTHS ENDED 4/30/12 | | | FOR THE YEAR ENDED 10/31/11 | | | FOR THE SIX MONTHS ENDED 4/30/12 | | | FOR THE YEAR ENDED 10/31/11 | |
| | CLASS C | | | CLASS C | | | CLASS I | | | CLASS I | |
| | | SHARES | | | | AMOUNTS | | | | SHARES | | | | AMOUNTS | | | | SHARES | | | | AMOUNTS | | | | SHARES | | | | AMOUNTS | |
Sold | | | 855 | | | $ | 8,800 | | | | 25,545 | | | $ | 271,238 | | | | 257,127 | | | $ | 2,755,817 | | | | 393,080 | | | $ | 4,289,430 | |
Reinvested | | | 6,914 | | | | 68,591 | | | | 3,384 | | | | 34,894 | | | | 29,671 | | | | 299,677 | | | | 1,499 | | | | 15,852 | |
Repurchased | | | (36,783 | ) | | | (374,210 | ) | | | (5,620 | ) | | | (59,932 | ) | | | (91,257 | ) | | | (979,118 | ) | | | (48,088 | ) | | | (516,123 | ) |
| | | | | | | | | | | | | | | | | | | | | | | | | | | | | | | | |
Total | | | (29,014 | ) | | $ | (296,819 | ) | | | 23,309 | | | $ | 246,200 | | | | 195,541 | | | $ | 2,076,376 | | | | 346,491 | | | $ | 3,789,159 | |
| | | | | | | | | | | | | | | | | | | | | | | | | | | | | | | | |
| | | | | | | | |
| | | | | | | | | | | | | | | | | | | | | | | | | | | | | | | | |
| TARGET 2010 SERIES: | | FOR THE SIX MONTHS ENDED 4/30/12 | | | FOR THE YEAR ENDED 10/31/11 | | | FOR THE SIX MONTHS ENDED 4/30/12 | | | FOR THE YEAR ENDED 10/31/11 | |
| | CLASS K | | | CLASS K | | | CLASS R | | | CLASS R | |
| | | SHARES | | | | AMOUNTS | | | | SHARES | | | | AMOUNTS | | | | SHARES | | | | AMOUNTS | | | | SHARES | | | | AMOUNTS | |
Sold | | | 121,119 | | | $ | 1,181,922 | | | | 310,020 | | | $ | 3,277,958 | | | | 98,121 | | | $ | 957,118 | | | | 282,494 | | | $ | 2,963,932 | |
Reinvested | | | 269,914 | | | | 2,467,020 | | | | 97,770 | | | | 1,009,250 | | | | 60,694 | | | | 550,492 | | | | 12,839 | | | | 131,556 | |
Repurchased | | | (240,866 | ) | | | (2,452,224 | ) | | | (790,894 | ) | | | (8,561,266 | ) | | | (41,053 | ) | | | (405,746 | ) | | | (175,273 | ) | | | (1,841,204 | ) |
| | | | | | | | | | | | | | | | | | | | | | | | | | | | | | | | |
Total | | | 150,167 | | | $ | 1,196,718 | | | | (383,104 | ) | | $ | (4,274,058 | ) | | | 117,762 | | | $ | 1,101,864 | | | | 120,060 | | | $ | 1,254,284 | |
| | | | | | | | | | | | | | | | | | | | | | | | | | | | | | | | |
| | | | | | | | |
| | | | | | | | | | | | | | | | | | | | | | | | | | | | | | | | |
| TARGET 2010 SERIES: | | FOR THE SIX MONTHS ENDED 4/30/12 | | | FOR THE YEAR ENDED 10/31/11 | | | FOR THE SIX MONTHS ENDED 4/30/12 | | | FOR THE YEAR ENDED 10/31/11 | |
| | CLASS C | | | CLASS C | | | CLASS I | | | CLASS I | |
| | | SHARES | | | | AMOUNTS | | | | SHARES | | | | AMOUNTS | | | | SHARES | | | | AMOUNTS | | | | SHARES | | | | AMOUNTS | |
Sold | | | 3,361 | | | $ | 32,141 | | | | 49,120 | | | $ | 518,688 | | | | 259,545 | | | $ | 2,635,857 | | | | 957,674 | | | $ | 10,313,222 | |
Reinvested | | | 20,323 | | | | 184,127 | | | | 6,272 | | | | 63,974 | | | | 135,207 | | | | 1,239,852 | | | | 5,512 | | | | 57,166 | |
Repurchased | | | (56,883 | ) | | | (554,503 | ) | | | (75,224 | ) | | | (789,515 | ) | | | (104,705 | ) | | | (1,037,423 | ) | | | (160,530 | ) | | | (1,697,468 | ) |
| | | | | | | | | | | | | | | | | | | | | | | | | | | | | | | | |
Total | | | (33,199 | ) | | $ | (338,235 | ) | | | (19,832 | ) | | $ | (206,853 | ) | | | 290,047 | | | $ | 2,838,286 | | | | 802,656 | | | $ | 8,672,920 | |
| | | | | | | | | | | | | | | | | | | | | | | | | | | | | | | | |
| | | | | | | | |
| | | | | | | | | | | | | | | | | | | | | | | | | | | | | | | | |
| TARGET 2020 SERIES: | | FOR THE SIX MONTHS ENDED 4/30/12 | | | FOR THE YEAR ENDED 10/31/11 | | | FOR THE SIX MONTHS ENDED 4/30/12 | | | FOR THE YEAR ENDED 10/31/11 | |
| | CLASS K | | | CLASS K | | | CLASS R | | | CLASS R | |
| | | SHARES | | | | AMOUNTS | | | | SHARES | | | | AMOUNTS | | | | SHARES | | | | AMOUNTS | | | | SHARES | | | | AMOUNTS | |
Sold | | | 588,285 | | | $ | 5,617,347 | | | | 1,675,922 | | | $ | 17,119,288 | | | | 542,541 | | | $ | 5,106,643 | | | | 595,012 | | | $ | 6,051,043 | |
Reinvested | | | 483,844 | | | | 4,311,050 | | | | 338,950 | | | | 3,377,391 | | | | 164,435 | | | | 1,450,323 | | | | 65,420 | | | | 645,605 | |
Repurchased | | | (1,039,275 | ) | | | (10,392,263 | ) | | | (2,707,061 | ) | | | (28,217,949 | ) | | | (154,337 | ) | | | (1,468,254 | ) | | | (247,831 | ) | | | (2,501,394 | ) |
| | | | | | | | | | | | | | | | | | | | | | | | | | | | | | | | |
Total | | | 32,854 | | | $ | (463,866 | ) | | | (692,189 | ) | | $ | (7,721,270 | ) | | | 552,639 | | | $ | 5,088,712 | | | | 412,601 | | | $ | 4,195,254 | |
| | | | | | | | | | | | | | | | | | | | | | | | | | | | | | | | |
28
Notes to Financial Statements (continued)
(unaudited)
| 6. | Capital Stock Transactions (continued) |
| | | | | | | | | | | | | | | | | | | | | | | | | | | | | | | | |
| TARGET 2020 SERIES: | | FOR THE SIX MONTHS ENDED 4/30/12 | | | FOR THE YEAR ENDED 10/31/11 | | | FOR THE SIX MONTHS ENDED 4/30/12 | | | FOR THE YEAR ENDED 10/31/11 | |
| | CLASS C | | | CLASS C | | | CLASS I | | | CLASS I | |
| | | SHARES | | | | AMOUNTS | | | | SHARES | | | | AMOUNTS | | | | SHARES | | | | AMOUNTS | | | | SHARES | | | | AMOUNTS | |
Sold | | | 39,731 | | | $ | 377,220 | | | | 145,377 | | | $ | 1,473,638 | | | | 1,199,777 | | | $ | 11,964,209 | | | | 2,300,696 | | | $ | 24,268,461 | |
Reinvested | | | 40,152 | | | | 353,734 | | | | 19,531 | | | | 192,191 | | | | 331,450 | | | | 2,959,845 | | | | 21,490 | | | | 215,042 | |
Repurchased | | | (47,372 | ) | | | (440,262 | ) | | | (121,172 | ) | | | (1,213,890 | ) | | | (156,673 | ) | | | (1,521,818 | ) | | | (170,809 | ) | | | (1,740,310 | ) |
| | | | | | | | | | | | | | | | | | | | | | | | | | | | | | | | |
Total | | | 32,511 | | | $ | 290,692 | | | | 43,736 | | | $ | 451,939 | | | | 1,374,554 | | | $ | 13,402,236 | | | | 2,151,377 | | | $ | 22,743,193 | |
| | | | | | | | | | | | | | | | | | | | | | | | | | | | | | | | |
| | | | | | | | |
| | | | | | | | | | | | | | | | | | | | | | | | | | | | | | | | |
| TARGET 2030 SERIES: | | FOR THE SIX MONTHS ENDED 4/30/12 | | | FOR THE YEAR ENDED 10/31/11 | | | FOR THE SIX MONTHS ENDED 4/30/12 | | | FOR THE YEAR ENDED 10/31/11 | |
| | CLASS K | | | CLASS K | | | CLASS R | | | CLASS R | |
| | | SHARES | | | | AMOUNTS | | | | SHARES | | | | AMOUNTS | | | | SHARES | | | | AMOUNTS | | | | SHARES | | | | AMOUNTS | |
Sold | | | 589,881 | | | $ | 5,548,421 | | | | 1,386,806 | | | $ | 14,122,320 | | | | 418,649 | | | $ | 3,922,396 | | | | 364,895 | | | $ | 3,702,652 | |
Reinvested | | | 512,881 | | | | 4,518,479 | | | | 304,172 | | | | 3,037,140 | | | | 90,890 | | | | 795,284 | | | | 31,015 | | | | 307,921 | |
Repurchased | | | (1,198,969 | ) | | | (11,928,419 | ) | | | (1,889,426 | ) | | | (19,955,578 | ) | | | (68,404 | ) | | | (650,027 | ) | | | (177,715 | ) | | | (1,812,551 | ) |
| | | | | | | | | | | | | | | | | | | | | | | | | | | | | | | | |
Total | | | (96,207 | ) | | $ | (1,861,519 | ) | | | (198,448 | ) | | $ | (2,796,118 | ) | | | 441,135 | | | $ | 4,067,653 | | | | 218,195 | | | $ | 2,198,022 | |
| | | | | | | | | | | | | | | | | | | | | | | | | | | | | | | | |
| | | | | | | | |
| | | | | | | | | | | | | | | | | | | | | | | | | | | | | | | | |
| TARGET 2030 SERIES: | | FOR THE SIX MONTHS ENDED 4/30/12 | | | FOR THE YEAR ENDED 10/31/11 | | | FOR THE SIX MONTHS ENDED 4/30/12 | | | FOR THE YEAR ENDED 10/31/11 | |
| | CLASS C | | | CLASS C | | | CLASS I | | | CLASS I | |
| | | SHARES | | | | AMOUNTS | | | | SHARES | | | | AMOUNTS | | | | SHARES | | | | AMOUNTS | | | | SHARES | | | | AMOUNTS | |
Sold | | | 26,975 | | | $ | 256,062 | | | | 52,873 | | | $ | 542,800 | | | | 1,452,313 | | | $ | 14,367,620 | | | | 1,840,303 | | | $ | 19,567,214 | |
Reinvested | | | 23,301 | | | | 203,186 | | | | 9,025 | | | | 89,165 | | | | 287,907 | | | | 2,550,862 | | | | 14,752 | | | | 148,301 | |
Repurchased | | | (1,488 | ) | | | (14,260 | ) | | | (29,974 | ) | | | (296,887 | ) | | | (185,745 | ) | | | (1,780,738 | ) | | | (136,151 | ) | | | (1,397,422 | ) |
| | | | | | | | | | | | | | | | | | | | | | | | | | | | | | | | |
Total | | | 48,788 | | | $ | 444,988 | | | | 31,924 | | | $ | 335,078 | | | | 1,554,475 | | | $ | 15,137,744 | | | | 1,718,904 | | | $ | 18,318,093 | |
| | | | | | | | | | | | | | | | | | | | | | | | | | | | | | | | |
| | | | | | | | |
| | | | | | | | | | | | | | | | | | | | | | | | | | | | | | | | |
| TARGET 2040 SERIES: | | FOR THE SIX MONTHS ENDED 4/30/12 | | | FOR THE YEAR ENDED 10/31/11 | | | FOR THE SIX MONTHS ENDED 4/30/12 | | | FOR THE YEAR ENDED 10/31/11 | |
| | CLASS K | | | CLASS K | | | CLASS R | | | CLASS R | |
| | | SHARES | | | | AMOUNTS | | | | SHARES | | | | AMOUNTS | | | | SHARES | | | | AMOUNTS | | | | SHARES | | | | AMOUNTS | |
Sold | | | 368,981 | | | $ | 3,618,146 | | | | 856,765 | | | $ | 8,988,768 | | | | 350,357 | | | $ | 3,424,543 | | | | 509,743 | | | $ | 5,324,802 | |
Reinvested | | | 241,379 | | | | 2,169,997 | | | | 73,655 | | | | 769,848 | | | | 79,798 | | | | 713,396 | | | | 13,209 | | | | 137,125 | |
Repurchased | | | (496,507 | ) | | | (4,993,642 | ) | | | (1,142,322 | ) | | | (12,527,615 | ) | | | (120,670 | ) | | | (1,182,237 | ) | | | (184,893 | ) | | | (1,905,669 | ) |
| | | | | | | | | | | | | | | | | | | | | | | | | | | | | | | | |
Total | | | 113,853 | | | $ | 794,501 | | | | (211,902 | ) | | $ | (2,768,999 | ) | | | 309,485 | | | $ | 2,955,702 | | | | 338,059 | | | $ | 3,556,258 | |
| | | | | | | | | | | | | | | | | | | | | | | | | | | | | | | | |
| | | | | | | | |
| | | | | | | | | | | | | | | | | | | | | | | | | | | | | | | | |
| TARGET 2040 SERIES: | | FOR THE SIX MONTHS ENDED 4/30/12 | | | FOR THE YEAR ENDED 10/31/11 | | | FOR THE SIX MONTHS ENDED 4/30/12 | | | FOR THE YEAR ENDED 10/31/11 | |
| | CLASS C | | | CLASS C | | | CLASS I | | | CLASS I | |
| | | SHARES | | | | AMOUNTS | | | | SHARES | | | | AMOUNTS | | | | SHARES | | | | AMOUNTS | | | | SHARES | | | | AMOUNTS | |
Sold | | | 3,561 | | | $ | 34,759 | | | | 16,846 | | | $ | 177,697 | | | | 771,433 | | | $ | 7,744,036 | | | | 1,065,270 | | | $ | 11,761,116 | |
Reinvested | | | 5,069 | | | | 44,909 | | | | 972 | | | | 10,017 | | | | 104,428 | | | | 942,986 | | | | 2,453 | | | | 25,804 | |
Repurchased | | | (5,115 | ) | | | (49,170 | ) | | | (12,994 | ) | | | (140,032 | ) | | | (127,088 | ) | | | (1,270,555 | ) | | | (59,387 | ) | | | (607,022 | ) |
| | | | | | | | | | | | | | | | | | | | | | | | | | | | | | | | |
Total | | | 3,515 | | | $ | 30,498 | | | | 4,824 | | | $ | 47,682 | | | | 748,773 | | | $ | 7,416,467 | | | | 1,008,336 | | | $ | 11,179,898 | |
| | | | | | | | | | | | | | | | | | | | | | | | | | | | | | | | |
29
Notes to Financial Statements (continued)
(unaudited)
| 6. | Capital Stock Transactions (continued) |
| | | | | | | | | | | | | | | | | | | | | | | | | | | | | | | | |
TARGET 2050 SERIES: | | FOR THE SIX MONTHS ENDED 4/30/12 | | | FOR THE YEAR ENDED 10/31/11 | | | FOR THE SIX MONTHS ENDED 4/30/12 | | | FOR THE YEAR ENDED 10/31/11 | |
| | CLASS K | | | CLASS K | | | CLASS R | | | CLASS R | |
| | | SHARES | | | | AMOUNTS | | | | SHARES | | | | AMOUNTS | | | | SHARES | | | | AMOUNTS | | | | SHARES | | | | AMOUNTS | |
Sold | | | 259,052 | | | $ | 2,645,760 | | | | 500,328 | | | $ | 5,260,037 | | | | 80,677 | | | $ | 821,204 | | | | 97,759 | | | $ | 1,032,883 | |
Reinvested | | | 49,591 | | | | 467,150 | | | | 15,172 | | | | 160,264 | | | | 6,487 | | | | 60,850 | | | | 1,712 | | | | 17,956 | |
Repurchased | | | (67,123 | ) | | | (683,516 | ) | | | (212,628 | ) | | | (2,326,688 | ) | | | (45,687 | ) | | | (457,795 | ) | | | (46,362 | ) | | | (491,564 | ) |
| | | | | | | | | | | | | | | | | | | | | | | | | | | | | | | | |
Total | | | 241,520 | | | $ | 2,429,394 | | | | 302,872 | | | $ | 3,093,613 | | | | 41,477 | | | $ | 424,259 | | | | 53,109 | | | $ | 559,275 | |
| | | | | | | | | | | | | | | | | | | | | | | | | | | | | | | | |
| | | | | | | | |
| | | | | | | | | | | | | | | | | | | | | | | | | | | | | | | | |
TARGET 2050 SERIES: | | FOR THE SIX MONTHS ENDED 4/30/12 | | | FOR THE YEAR ENDED 10/31/11 | | | FOR THE SIX MONTHS ENDED 4/30/12 | | | FOR THE YEAR ENDED 10/31/11 | |
| | CLASS C | | | CLASS C | | | CLASS I | | | CLASS I | |
| | | SHARES | | | | AMOUNTS | | | | SHARES | | | | AMOUNTS | | | | SHARES | | | | AMOUNTS | | | | SHARES | | | | AMOUNTS | |
Sold | | | 6,236 | | | $ | 64,077 | | | | 20,449 | | | $ | 208,493 | | | | 120,959 | | | $ | 1,242,352 | | | | 204,951 | | | $ | 2,262,297 | |
Reinvested | | | 2,119 | | | | 19,686 | | | | 470 | | | | 4,883 | | | | 6,965 | | | | 65,957 | | | | 186 | | | | 1,982 | |
Repurchased | | | (2,443 | ) | | | (25,267 | ) | | | (9,960 | ) | | | (108,643 | ) | | | (14,800 | ) | | | (152,911 | ) | | | (10,896 | ) | | | (115,051 | ) |
| | | | | | | | | | | | | | | | | | | | | | | | | | | | | | | | |
Total | | | 5,912 | | | $ | 58,496 | | | | 10,959 | | | $ | 104,733 | | | | 113,124 | | | $ | 1,155,398 | | | | 194,241 | | | $ | 2,149,228 | |
| | | | | | | | | | | | | | | | | | | | | | | | | | | | | | | | |
At April 30, 2012, one omnibus account owned the following in Target Income Series and Target 2050 Series and three omnibus accounts owned the following in Target 2010 Series, Target 2020 Series, Target 2030 Series and Target 2040 Series:
| | | | | | | | | | |
SERIES | |
| SHARES
OWNED |
| | PERCENTAGE
OF SERIES SHARES OUTSTANDING | | | VALUE | |
Target Income Series | | | 3,745,936 | | | 71.8% | | | $39,781,845 | |
Target 2010 Series | | | 2,618,906 | | | 60.0% | | | 25,738,838 | |
Target 2020 Series | | | 6,099,304 | | | 50.6% | | | 59,400,551 | |
Target 2030 Series | | | 6,571,019 | | | 57.3% | | | 63,716,072 | |
Target 2040 Series | | | 4,247,403 | | | 56.9% | | | 43,114,186 | |
Target 2050 Series | | | 1,755,879 | | | 63.6% | | | 18,664,991 | |
Investment activities of these shareholders may have a material effect on the Series.
The underlying Series may trade in instruments including written and purchased options, forward foreign currency exchange contracts and futures contracts and other derivatives in the normal course of investing activities to assist in managing exposure to various market risks. The underlying Series may be subject to various elements of risk which may involve, to a varying degree, elements of risk in excess of the amounts recognized for financial statement purposes. These risks include: the risk that changes in the value of a derivative may not correlate perfectly with the underlying asset, rate or index, counterparty credit risk related to over the counter derivative counterparties’ failure to perform under contract terms, liquidity risk related to the lack of a liquid market for these contracts allowing the fund to close out its position(s) and documentation risk relating to disagreement over contract terms. No such investments were held by the Series as of April 30, 2012.
| 8. | Federal Income Tax Information |
The amount and characterization of certain income and capital gains to be distributed are determined in accordance with federal income tax regulations, which may differ from accounting principles generally accepted in the United States of America. Each Series may periodically make reclassifications among its capital accounts to reflect income and gains available for distribution
30
Notes to Financial Statements (continued)
(unaudited)
| 8. | Federal Income Tax Information (continued) |
(or available capital loss carryovers) under income tax regulations, without impacting the Series’ net asset value. Any such reclassifications are not reflected in the financial highlights.
The final determination of the tax character of current year distributions will be made at the conclusion of the fiscal year. The tax character of distributions for the year ended October 31, 2011 were as follows:
| | | | | | | | | | | | | | | | | | | | | | | | |
| | | | TARGET | | | | TARGET | | | | TARGET | | | | TARGET | | | | TARGET | | | | TARGET | |
| | | | INCOME | | | | 2010 | | | | 2020 | | | | 2030 | | | | 2040 | | | | 2050 | |
| | | | SERIES | | | | SERIES | | | | SERIES | | | | SERIES | | | | SERIES | | | | SERIES | |
Ordinary income | | $ | 1,599,338 | | | $ | 601,589 | | | $ | 1,631,943 | | | $ | 3,092,457 | | | $ | 518,465 | | | $ | 179,306 | |
Long-term capital gain | | $ | 384,742 | | | $ | 664,538 | | | $ | 2,798,828 | | | $ | 490,387 | | | $ | 425,201 | | | $ | 5,994 | |
At April 30, 2012, the tax basis of components of distributable earnings and the net unrealized appreciation based on the identified cost for federal income tax purposes were as follows:
| | | | | | | | | | | | | | | | | | | | | | | | |
| | | | TARGET | | | | TARGET | | | | TARGET | | | | TARGET | | | | TARGET | | | | TARGET | |
| | | | INCOME | | | | 2010 | | | | 2020 | | | | 2030 | | | | 2040 | | | | 2050 | |
| | | | SERIES | | | | SERIES | | | | SERIES | | | | SERIES | | | | SERIES | | | | SERIES | |
Cost for federal income tax purposes | | $ | 50,157,233 | | | $ | 41,793,611 | | | $ | 114,815,332 | | | $ | 107,800,029 | | | $ | 69,615,783 | | | $ | 26,992,536 | |
Unrealized appreciation | | $ | 5,229,672 | | | $ | 1,048,651 | | | $ | 2,377,897 | | | $ | 3,299,889 | | | $ | 6,076,927 | | | $ | 2,346,989 | |
Unrealized depreciation | | | (2,139 | ) | | | (1,424 | ) | | | (2,582 | ) | | | (61 | ) | | | — | | | | (305 | ) |
| | | | | | | | | | | | | | | | | | | | | | | | |
Net unrealized appreciation | | $ | 5,227,533 | | | $ | 1,047,227 | | | $ | 2,375,315 | | | $ | 3,299,828 | | | $ | 6,076,927 | | | $ | 2,346,684 | |
| | | | | | | | | | | | | | | | | | | | | | | | |
At October 31, 2011, Target 2040 Series and Target 2050 Series had capital loss carryovers of $1,390 and $2,359, respectively, which are subject to limitations under Section 382-384 of the Internal Revenue Code, and are available to the extent allowed by tax law to offset future net capital gains, if any, which will expire on October 31, 2017 for both the Target 2040 Series and Target 2050 Series.
The Regulated Investment Company Modernization Act of 2010 (the “Act”) was enacted on December 22, 2010. The Act made changes to several tax rules including the unlimited carryover of future capital losses, which will retain their character as short-term and/or long-term losses. Prior to the Act, net capital losses incurred by the Series were carried forward for eight years and treated as short-term losses. The Act requires that post-enactment net capital losses be used before pre-enactment net capital losses.
31
Renewal of Investment Advisory Agreement
(unaudited)
At the Manning & Napier Fund, Inc. (the “Fund”) Board of Directors’ (the “Board”) meeting, held on November 18, 2011, the Investment Advisory Agreement (the “Agreement”) between the Fund and Manning & Napier Advisors, LLC (the “Advisor”) was reviewed by the Board for renewal. In connection with the decision whether to renew the Agreement, a variety of material was prepared for and reviewed by the Board.
Representatives of the Advisor attended the meeting and presented additional oral and written information to the Board to assist the Board in its considerations. The discussion immediately below outlines the materials and information presented to the Board in connection with the Board’s 2011 Annual Review of the Agreement and the conclusions made by the Directors when determining to continue the Agreement.
| | • | | The Board considered the services provided by the Advisor under the Agreement including, among others: deciding what securities to purchase and sell for each Series; arranging for the purchase and sale of such securities by placing orders with broker-dealers; administering the affairs of the Fund (including the books and records of the Fund not maintained by third party service providers such as the custodian or sub-transfer agent); arranging for the insurance coverage for the Fund; and supervising the preparation of tax returns, SEC filings (including registration statements) and reports to shareholders for the Fund. The Board also considered the nature and quality of such services provided under the Agreement in light of the Advisor’s services provided to the Fund for 25 years. The Board discussed the quality of these services with representatives from the Advisor and concluded that the Advisor was performing its services to the Fund required under the Agreement in a reasonable manner. |
| | • | | The Board considered the investment performance of the various Series of the Fund. The investment performance for each Series was reviewed on a cumulative basis since inception and on a one year basis. In addition, annualized performance for the following time periods was considered: inception, three year, five year, ten year, and current market cycle. A market cycle includes periods of both rising and falling markets. Returns for established benchmark indices for each Series were provided for each time period. The Board noted that the various Series were competitive against their respective benchmarks and/or peer groups over various time periods, but in particular over the full market cycle period relevant for the Series. In addition, the Board considered at the meeting (and considers on a quarterly basis) a peer group performance analysis consisting of Morningstar universes of mutual funds with similar investment objectives. The Board discussed the performance with representatives from the Advisor and concluded that the investment performance of each of the Fund’s Series was reasonable based on the Fund’s actual performance and comparative performance, especially performance over the current market cycle. |
| | • | | The Board considered the costs of the Advisor’s services and the profits of the Advisor as they relate to the Advisor’s services to the Fund under the Agreement. In reviewing the Advisor’s costs and profits, the Board discussed the Advisor’s revenues generated from the Fund (on both an actual and adjusted basis) and its expenses associated with providing the services under the Agreement. In addition, the Board reviewed the Advisor’s expenses associated with Fund activities outside of the Agreement (such as expense reimbursements pursuant to expense caps and payments made by the Advisor to third party platforms on which shares of the Fund are available for purchase). It was noted by representatives of the Advisor that 10 of the 29 active Series of the Fund are currently experiencing expenses above the capped expense ratios. After discussing the above costs and profits, the Board concluded that the Advisor’s profitability relating to its services provided under the Agreement was reasonable. |
| | • | | The Board considered the fees and expenses of the various Series of the Fund. The Advisor presented the advisory fees and total expenses for each Series, including the advisory fee adjusted for any expense waivers or reimbursements (either contractual or voluntary) paid by the Advisor. The advisory fees and expense ratios of each Series were compared to an average (on both a mean and median basis) of similar funds as disclosed on the Morningstar database. Representatives of the Advisor discussed with the Board the levels of its advisory fee for each Series of the Fund and as compared to the median and mean advisory fees for similar funds as listed on Morningstar. Expense ratios for every Series, except the Pro-Blend Class R and Class C, and Target Class R and Class C (and a few Class K), are currently below the median and mean for similar funds as listed on Morningstar. Based on their review of the information provided, the Board concluded that the fees and expenses of each Series of the Fund were reasonable on a comparative basis. |
32
Renewal of Investment Advisory Agreement
(unaudited)
| | • | | The Board also considered the other benefits the Advisor derives from its relationship with the Fund. Such other benefits include certain research products provided by soft dollars. Given the level of soft dollar transactions involving the Fund, the Board concluded that these additional benefits to the Advisor were reasonable. |
| | • | | In addition to the factors described above, the Board considered the Advisor’s personnel, investment strategies, policies and procedures relating to compliance with personal securities transactions, and reputation, expertise and resources in domestic and foreign financial markets. The Board concluded that these factors support the conclusion that the Advisor performs its services in a reasonable manner. |
| | • | | The Board did not consider economies of scale at this time because of the multiple uses of the Fund (for the Advisor’s discretionary investment account clients in addition to direct investors), the current profitability of the Advisor’s services to the Fund under the Agreement, and the overall size of the Fund complex. |
Based on the Board’s deliberations and their evaluation of the information described above, the Board, including a majority of Directors that are not “interested persons” as defined in the Investment Company Act of 1940, concluded that the compensation under the Agreement was fair and reasonable in light of the services and expenses and such other matters as the Directors considered to be relevant in the exercise of their reasonable judgment. Accordingly, the Board approved the renewal of the Agreement. In the course of their deliberations, the Directors did not identify any particular information that was all important or controlling.
33
Literature Requests
(unaudited)
Proxy Voting Policies and Procedures
A description of the policies and procedures that the Fund uses to determine how to vote proxies relating to portfolio securities is available, without charge, upon request:
| | | | |
| By phone | | 1-800-466-3863 | | |
| On the Securities and Exchange | | | | |
| Commission’s (SEC) web site | | http://www.sec.gov | | |
Proxy Voting Record
Information regarding how the Fund voted proxies relating to portfolio securities during the most recent 12-month period ended June 30th is available, without charge, upon request:
| | | | |
| By phone | | 1-800-466-3863 | | |
| On the SEC’s web site | | http://www.sec.gov | | |
Quarterly Portfolio Holdings
The Series’ complete schedule of portfolio holdings for the 1st and 3rd quarters of each fiscal year are provided on Form N-Q, and are available, without charge, upon request:
| | | | |
| By phone | | 1-800-466-3863 | | |
| On the SEC’s web site | | http://www.sec.gov | | |
The Series’ Form N-Q may be reviewed and copied at the SEC’s Public Reference Room in Washington, D.C. Information on the operation of the Public Reference Room may be obtained by calling 1-800-SEC-0330.
Prospectus and Statement of Additional Information (SAI)
The prospectus and SAI provide additional information about each Series, including charges, expenses and risks. These documents are available, without charge, upon request:
| | | | |
| By phone | | 1-800-466-3863 | | |
| On the SEC’s web site | | http://www.sec.gov | | |
| On the Advisor’s web site | | http://www.manning-napier.com | | |
Additional information available at www.manning-napier.com
1. Fund Holdings - Month-End
2. Fund Holdings - Quarter-End
3. Shareholder Report - Annual
4. Shareholder Report - Semi-Annual
The Fund also offers electronic notification or “e-delivery” when certain documents are available on-line to be downloaded or reviewed. Direct shareholders can elect to receive electronic notification when shareholder reports, prospectus updates, and/or statements are available. If you do not currently have on-line access to your account, you can establish access by going to www.manning-napier.com, click on “Login” in the top corner of the page, and follow the prompts to self-enroll. Once enrolled, you can set your electronic notification preferences by clicking on the Account Options tab located within the green toolbar and then select E-Delivery Option. Should you have any questions on either how to establish on-line access or how to update your account settings, please contact Investor Services at 1-800-466-3863.
MNTGT-04/12-SAR


| | | | | | |
| | | | DIVIDEND FOCUS SERIES | | |
www.manning-napier.com | | | |  |
Dividend Focus Series
Shareholder Expense Example
(unaudited)
As a shareholder of the Series, you may incur two types of costs: (1) transaction costs, including potential wire charges on redemptions and (2) ongoing costs, including management fees and other Series expenses. This example is intended to help you understand your ongoing costs (in dollars) of investing in the Series and to compare these costs with the ongoing costs of investing in other mutual funds.
The example is based on an investment of $1,000 invested at the beginning of the period and held for the entire period (November 1, 2011 to April 30, 2012, except for Class S Actual, which is from March 1, 2012* to April 30, 2012).
Actual Expenses
The first line of the table below provides information about actual account values and actual expenses. You may use the information in this line, together with the amount you invested, to estimate the expenses that you paid over the period. Simply divide your account value by $1,000 (for example, an $8,600 account value divided by $1,000 = 8.6), then multiply the result by the number in the first line under the heading entitled “Expenses Paid During Period” to estimate the expenses you paid on your account during this period.
Hypothetical Example for Comparison Purposes
The second line of the table below provides information about hypothetical account values and hypothetical expenses based on the Series’ actual expense ratio and an assumed rate of return of 5% per year before expenses, which is not the Series’ actual return. The hypothetical account values and expenses may not be used to estimate the actual ending account balance or expenses you paid during the period. You may use this information to compare the ongoing costs of investing in the Series and other funds. To do so, compare this 5% hypothetical example with the 5% hypothetical examples that appear in the shareholder reports of the other funds.
Please note that the expenses shown in the table are meant to highlight your ongoing costs only and do not reflect any transaction costs. Therefore, the second line of the table is useful in comparing ongoing costs only, and will not help you determine the relative total costs of owning different funds. In addition, if these transaction costs were included, your costs would have been higher.
| | | | | | | | |
| | | BEGINNING ACCOUNT VALUE
11/1/11* | | ENDING
ACCOUNT VALUE
4/30/12 | | EXPENSES PAID
DURING PERIOD**
11/1/11-4/30/12 | | ANNUALIZED
EXPENSE RATIO |
Class S | | | | | | | | |
Actual | | $1,000.00 | | $1,011.00 | | $1.42 | | 0.85% |
Hypothetical (5% return before expenses) | | $1,000.00 | | $1,020.64 | | $4.27 | | 0.85% |
Class I | | | | | | | | |
Actual | | $1,000.00 | | $1,089.50 | | $2.96 | | 0.57% |
Hypothetical (5% return before expenses) | | $1,000.00 | | $1,022.03 | | $2.87 | | 0.57% |
*Class S inception date was March 1, 2012.
**Expenses are equal to the Class’ annualized expense ratio (for the six-month period), multiplied by the average account value over the period, multiplied by 182/366 to reflect the one-half year period (except for the Series’ Class S Actual return information, which reflects the 61 day period ended April 30, 2012 due to its inception date of March 1, 2012).
1
Dividend Focus Series
Portfolio Composition as of April 30, 2012
(unaudited)
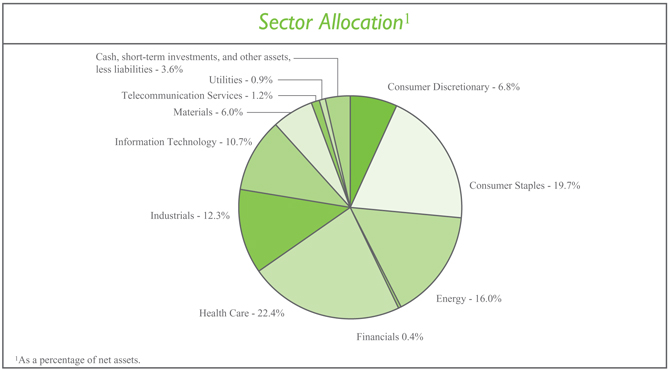
2
Dividend Focus Series
Investment Portfolio - April 30, 2012
(unaudited)
| | | | | | | | | | |
| | | SHARES | | | VALUE
(NOTE 2) | | | |
| | | |
COMMON STOCKS - 96.4% | | | | | | | | | | |
| | | |
Consumer Discretionary - 6.8% | | | | | | | | | | |
Auto Components - 0.1% | | | | | | | | | | |
Magna International, Inc. (Canada) | | | 4,273 | | | $ | 187,286 | | | |
| | | | | | | | | | |
Distributors - 0.2% | | | | | | | | | | |
Genuine Parts Co. | | | 3,948 | | | | 255,751 | | | |
| | | | | | | | | | |
Hotels, Restaurants & Leisure - 2.0% | | | | | | | | | | |
McDonald’s Corp. | | | 25,989 | | | | 2,532,628 | | | |
| | | | | | | | | | |
Leisure Equipment & Products - 0.2% | | | | | | | | | | |
Mattel, Inc. | | | 8,460 | | | | 284,256 | | | |
| | | | | | | | | | |
Media - 1.6% | | | | | | | | | | |
The McGraw-Hill Companies, Inc. | | | 7,134 | | | | 350,779 | | | |
Omnicom Group, Inc. | | | 6,330 | | | | 324,792 | | | |
Pearson plc - ADR (United Kingdom) | | | 19,310 | | | | 365,731 | | | |
Thomson Reuters Corp. | | | 21,692 | | | | 646,855 | | | |
Viacom, Inc. - Class B | | | 6,357 | | | | 294,901 | | | |
| | | | | | | | | | |
| | | | | | | 1,983,058 | | | |
| | | | | | | | | | |
Multiline Retail - 0.7% | | | | | | | | | | |
Kohl’s Corp. | | | 4,460 | | | | 223,580 | | | |
Target Corp. | | | 11,919 | | | | 690,587 | | | |
| | | | | | | | | | |
| | | | | | | 914,167 | | | |
| | | | | | | | | | |
Specialty Retail - 2.0% | | | | | | | | | | |
The Home Depot, Inc. | | | 38,762 | | | | 2,007,484 | | | |
Limited Brands, Inc. | | | 7,244 | | | | 360,027 | | | |
Staples, Inc. | | | 13,210 | | | | 203,434 | | | |
| | | | | | | | | | |
| | | | | | | 2,570,945 | | | |
| | | | | | | | | | |
Total Consumer Discretionary | | | | | | | 8,728,091 | | | |
| | | | | | | | | | |
Consumer Staples - 19.7% | | | | | | | | | | |
Beverages - 5.6% | | | | | | | | | | |
The Coca-Cola Co. | | | 58,354 | | | | 4,453,577 | | | |
PepsiCo, Inc. | | | 40,247 | | | | 2,656,302 | | | |
| | | | | | | | | | |
| | | | | | | 7,109,879 | | | |
| | | | | | | | | | |
Food & Staples Retailing - 3.8% | | | | | | | | | | |
SYSCO Corp. | | | 15,272 | | | | 441,361 | | | |
Walgreen Co. | | | 10,269 | | | | 360,031 | | | |
Wal-Mart Stores, Inc. | | | 69,230 | | | | 4,078,339 | | | |
| | | | | | | | | | |
| | | | | | | 4,879,731 | | | |
| | | | | | | | | | |
Food Products - 2.6% | | | | | | | | | | |
Archer-Daniels-Midland Co. | | | 13,156 | | | | 405,600 | | | |
Campbell Soup Co. | | | 8,188 | | | | 277,000 | | | |
ConAgra Foods, Inc. | | | 7,560 | | | | 195,199 | | | |
The accompanying notes are an integral part of the financial statements.
3
Dividend Focus Series
Investment Portfolio - April 30, 2012
(unaudited)
| | | | | | | | | | |
| | | SHARES | | | VALUE
(NOTE 2) | | | |
| | | |
COMMON STOCKS (continued) | | | | | | | | | | |
| | | |
Consumer Staples (continued) | | | | | | | | | | |
Food Products (continued) | | | | | | | | | | |
General Mills, Inc. | | | 16,666 | | | $ | 648,141 | | | |
H.J. Heinz Co. | | | 8,220 | | | | 438,208 | | | |
The Hershey Co. | | | 5,769 | | | | 386,581 | | | |
The J.M. Smucker Co. | | | 2,925 | | | | 232,918 | | | |
Kellogg Co. | | | 9,178 | | | | 464,131 | | | |
Sara Lee Corp. | | | 15,108 | | | | 332,980 | | | |
| | | | | | | | | | |
| | | | | | | 3,380,758 | | | |
| | | | | | | | | | |
Household Products - 4.1% | | | | | | | | | | |
Colgate-Palmolive Co. | | | 9,682 | | | | 957,937 | | | |
Kimberly-Clark Corp. | | | 10,092 | | | | 791,919 | | | |
The Procter & Gamble Co. | | | 55,714 | | | | 3,545,639 | | | |
| | | | | | | | | | |
| | | | | | | 5,295,495 | | | |
| | | | | | | | | | |
Personal Products - 0.2% | | | | | | | | | | |
Avon Products, Inc. | | | 8,535 | | | | 184,356 | | | |
| | | | | | | | | | |
Tobacco - 3.4% | | | | | | | | | | |
Lorillard, Inc. | | | 3,208 | | | | 434,010 | | | |
Philip Morris International, Inc. | | | 43,995 | | | | 3,937,992 | | | |
| | | | | | | | | | |
| | | | | | | 4,372,002 | | | |
| | | | | | | | | | |
Total Consumer Staples | | | | | | | 25,222,221 | | | |
| | | | | | | | | | |
Energy - 16.0% | | | | | | | | | | |
Oil, Gas & Consumable Fuels - 16.0% | | | | | | | | | | |
BP plc - ADR (United Kingdom) | | | 55,336 | | | | 2,402,136 | | | |
Chevron Corp. | | | 43,680 | | | | 4,654,541 | | | |
ConocoPhillips | | | 32,839 | | | | 2,352,258 | | | |
Exxon Mobil Corp. | | | 55,794 | | | | 4,817,254 | | | |
Marathon Oil Corp. | | | 8,599 | | | | 252,295 | | | |
Occidental Petroleum Corp. | | | 9,649 | | | | 880,182 | | | |
Royal Dutch Shell plc - Class A - ADR (Netherlands) | | | 37,783 | | | | 2,702,996 | | | |
Sasol Ltd. - ADR (South Africa) | | | 14,842 | | | | 703,956 | | | |
Statoil ASA - ADR (Norway) | | | 65,308 | | | | 1,757,438 | | | |
| | | | | | | | | | |
Total Energy | | | | | | | 20,523,056 | | | |
| | | | | | | | | | |
Financials - 0.4% | | | | | | | | | | |
Insurance - 0.4% | | | | | | | | | | |
Marsh & McLennan Companies, Inc. | | | 14,309 | | | | 478,636 | | | |
| | | | | | | | | | |
Health Care - 22.4% | | | | | | | | | | |
Biotechnology - 0.5% | | | | | | | | | | |
Amgen, Inc. | | | 9,195 | | | | 653,856 | | | |
| | | | | | | | | | |
Health Care Equipment & Supplies - 1.4% | | | | | | | | | | |
Baxter International, Inc. | | | 12,599 | | | | 698,111 | | | |
The accompanying notes are an integral part of the financial statements.
4
Dividend Focus Series
Investment Portfolio - April 30, 2012
(unaudited)
| | | | | | | | | | |
| | | SHARES | | | VALUE (NOTE 2) | | | |
| | | |
COMMON STOCKS (continued) | | | | | | | | | | |
| | | |
Health Care (continued) | | | | | | | | | | |
Health Care Equipment & Supplies (continued) | | | | | | | | | | |
Becton, Dickinson and Co. | | | 4,501 | | | $ | 353,103 | | | |
Medtronic, Inc. | | | 18,331 | | | | 700,244 | | | |
| | | | | | | | | | |
| | | | | | | 1,751,458 | | | |
| | | | | | | | | | |
Health Care Providers & Services - 0.2% | | | | | | | | | | |
Cardinal Health, Inc. | | | 6,283 | | | | 265,582 | | | |
| | | | | | | | | | |
Pharmaceuticals - 20.3% | | | | | | | | | | |
Abbott Laboratories | | | 38,951 | | | | 2,417,299 | | | |
AstraZeneca plc - ADR (United Kingdom) | | | 32,795 | | | | 1,439,702 | | | |
Bristol-Myers Squibb Co. | | | 43,439 | | | | 1,449,559 | | | |
Eli Lilly & Co. | | | 29,659 | | | | 1,227,586 | | | |
GlaxoSmithKline plc - ADR (United Kingdom) | | | 64,422 | | | | 2,978,229 | | | |
Johnson & Johnson | | | 70,982 | | | | 4,620,218 | | | |
Merck & Co., Inc. | | | 74,280 | | | | 2,914,747 | | | |
Novartis AG - ADR (Switzerland) | | | 48,101 | | | | 2,653,732 | | | |
Pfizer, Inc. | | | 195,862 | | | | 4,491,116 | | | |
Sanofi - ADR (France) | | | 48,485 | | | | 1,851,157 | | | |
| | | | | | | | | | |
| | | | | | | 26,043,345 | | | |
| | | | | | | | | | |
Total Health Care | | | | | | | 28,714,241 | | | |
| | | | | | | | | | |
Industrials - 12.3% | | | | | | | | | | |
Aerospace & Defense - 3.9% | | | | | | | | | | |
The Boeing Co. | | | 12,915 | | | | 991,872 | | | |
General Dynamics Corp. | | | 7,669 | | | | 517,658 | | | |
Honeywell International, Inc. | | | 17,852 | | | | 1,082,902 | | | |
Northrop Grumman Corp. | | | 6,570 | | | | 415,750 | | | |
Raytheon Co. | | | 7,402 | | | | 400,744 | | | |
United Technologies Corp. | | | 19,146 | | | | 1,563,079 | | | |
| | | | | | | | | | |
| | | | | | | 4,972,005 | | | |
| | | | | | | | | | |
Air Freight & Logistics - 1.0% | | | | | | | | | | |
United Parcel Service, Inc. - Class B | | | 16,840 | | | | 1,315,878 | | | |
| | | | | | | | | | |
Commercial Services & Supplies - 0.3% | | | | | | | | | | |
Waste Management, Inc. | | | 11,736 | | | | 401,371 | | | |
| | | | | | | | | | |
Electrical Equipment - 1.7% | | | | | | | | | | |
ABB Ltd. (Asea Brown Boveri) - ADR (Switzerland) | | | 47,711 | | | | 900,307 | | | |
Cooper Industries plc (Ireland) | | | 4,224 | | | | 264,296 | | | |
Emerson Electric Co. | | | 19,131 | | | | 1,005,143 | | | |
| | | | | | | | | | |
| | | | | | | 2,169,746 | | | |
| | | | | | | | | | |
Industrial Conglomerates - 2.9% | | | | | | | | | | |
3M Co. | | | 18,198 | | | | 1,626,173 | | | |
The accompanying notes are an integral part of the financial statements.
5
Dividend Focus Series
Investment Portfolio - April 30, 2012
(unaudited)
| | | | | | | | | | |
| | | SHARES | | | VALUE (NOTE 2) | | | |
| | | |
COMMON STOCKS (continued) | | | | | | | | | | |
| | | |
Industrials (continued) | | | | | | | | | | |
Industrial Conglomerates (continued) | | | | | | | | | | |
Koninklijke Philips Electronics N.V. - NY Shares (Netherlands) | | | 27,668 | | | $ | 553,083 | | | |
Siemens AG - ADR (Germany) | | | 16,755 | | | | 1,556,037 | | | |
| | | | | | | | | | |
| | | | | | | 3,735,293 | | | |
| | | | | | | | | | |
Machinery - 1.5% | | | | | | | | | | |
Deere & Co. | | | 4,586 | | | | 377,703 | | | |
Dover Corp. | | | 4,886 | | | | 306,157 | | | |
Eaton Corp. | | | 5,978 | | | | 288,020 | | | |
Illinois Tool Works, Inc. | | | 12,435 | | | | 713,520 | | | |
Stanley Black & Decker, Inc. | | | 2,889 | | | | 211,359 | | | |
| | | | | | | | | | |
| | | | | | | 1,896,759 | | | |
| | | | | | | | | | |
Road & Rail - 1.0% | | | | | | | | | | |
CSX Corp. | | | 11,758 | | | | 262,321 | | | |
Norfolk Southern Corp. | | | 6,075 | | | | 443,050 | | | |
Union Pacific Corp. | | | 5,519 | | | | 620,556 | | | |
| | | | | | | | | | |
| | | | | | | 1,325,927 | | | |
| | | | | | | | | | |
Total Industrials | | | | | | | 15,816,979 | | | |
| | | | | | | | | | |
Information Technology - 10.7% | | | | | | | | | | |
Communications Equipment - 0.8% | | | | | | | | | | |
Nokia Corp. - ADR (Finland) | | | 85,675 | | | | 312,714 | | | |
Telefonaktiebolaget LM Ericsson - ADR (Sweden) | | | 73,378 | | | | 733,413 | | | |
| | | | | | | | | | |
| | | | | | | 1,046,127 | | | |
| | | | | | | | | | |
Computers & Peripherals - 0.5% | | | | | | | | | | |
Hewlett-Packard Co. | | | 23,662 | | | | 585,871 | | | |
| | | | | | | | | | |
Electronic Equipment, Instruments & Components - 0.4% | | | | | | | | | | |
Corning, Inc. | | | 18,476 | | | | 265,131 | | | |
TE Connectivity Ltd. - ADR (Switzerland) | | | 7,793 | | | | 284,133 | | | |
| | | | | | | | | | |
| | | | | | | 549,264 | | | |
| | | | | | | | | | |
IT Services - 1.0% | | | | | | | | | | |
Accenture plc - Class A (Ireland) | | | 8,104 | | | | 526,355 | | | |
Automatic Data Processing, Inc. | | | 12,374 | | | | 688,242 | | | |
| | | | | | | | | | |
| | | | | | | 1,214,597 | | | |
| | | | | | | | | | |
Office Electronics - 0.8% | | | | | | | | | | |
Canon, Inc. - ADR (Japan) | | | 23,630 | | | | 1,071,857 | | | |
| | | | | | | | | | |
Semiconductors & Semiconductor Equipment - 3.7% | | | | | | | | | | |
Analog Devices, Inc. | | | 5,469 | | | | 213,182 | | | |
Applied Materials, Inc. | | | 23,854 | | | | 286,010 | | | |
Intel Corp. | | | 128,269 | | | | 3,642,840 | | | |
The accompanying notes are an integral part of the financial statements.
6
Dividend Focus Series
Investment Portfolio - April 30, 2012
(unaudited)
| | | | | | | | | | |
| | | SHARES | | | VALUE (NOTE 2) | | | |
| | | |
COMMON STOCKS (continued) | | | | | | | | | | |
| | | |
Information Technology (continued) | | | | | | | | | | |
Semiconductors & Semiconductor Equipment (continued) | | | | | | | | | | |
Linear Technology Corp. | | | 6,183 | | | $ | 202,246 | | | |
Texas Instruments, Inc. | | | 13,995 | | | | 447,000 | | | |
| | | | | | | | | | |
| | | | | | | 4,791,278 | | | |
| | | | | | | | | | |
Software - 3.5% | | | | | | | | | | |
Microsoft Corp. | | | 138,818 | | | | 4,444,952 | | | |
| | | | | | | | | | |
Total Information Technology | | | | | | | 13,703,946 | | | |
| | | | | | | | | | |
Materials - 6.0% | | | | | | | | | | |
Chemicals - 2.0% | | | | | | | | | | |
Air Products & Chemicals, Inc. | | | 3,849 | | | | 329,051 | | | |
The Dow Chemical Co. | | | 14,201 | | | | 481,130 | | | |
E.I. du Pont de Nemours & Co. | | | 23,968 | | | | 1,281,329 | | | |
PPG Industries, Inc. | | | 3,897 | | | | 410,120 | | | |
| | | | | | | | | | |
| | | | | | | 2,501,630 | | | |
| | | | | | | | | | |
Metals & Mining - 3.8% | | | | | | | | | | |
ArcelorMittal - NY Shares (Luxembourg) | | | 19,746 | | | | 342,198 | | | |
BHP Billiton plc - ADR (United Kingdom) | | | 51,877 | | | | 3,338,804 | | | |
Freeport-McMoRan Copper & Gold, Inc. | | | 10,901 | | | | 417,508 | | | |
Southern Copper Corp. | | | 15,873 | | | | 521,904 | | | |
Teck Resources Ltd. - Class B (Canada) | | | 6,651 | | | | 248,282 | | | |
| | | | | | | | | | |
| | | | | | | 4,868,696 | | | |
| | | | | | | | | | |
Paper & Forest Products - 0.2% | | | | | | | | | | |
International Paper Co. | | | 7,526 | | | | 250,691 | | | |
| | | | | | | | | | |
Total Materials | | | | | | | 7,621,017 | | | |
| | | | | | | | | | |
Telecommunication Services - 1.2% | | | | | | | | | | |
Wireless Telecommunication Services - 1.2% | | | | | | | | | | |
Mobile Telesystems - ADR (Russia) | | | 12,170 | | | | 238,045 | | | |
NTT DoCoMo, Inc. - ADR (Japan) | | | 47,860 | | | | 819,363 | | | |
Rogers Communications, Inc. - Class B (Canada) | | | 11,646 | | | | 434,745 | | | |
| | | | | | | | | | |
Total Telecommunication Services | | | | | | | 1,492,153 | | | |
| | | | | | | | | | |
Utilities - 0.9% | | | | | | | | | | |
Electric Utilities - 0.4% | | | | | | | | | | |
Companhia Energetica de Minas Gerais (CEMIG) - ADR (Brazil) | | | 11,465 | | | | 282,842 | | | |
Enersis S.A. - ADR (Chile) | | | 13,850 | | | | 280,740 | | | |
| | | | | | | | | | |
| | | | | | | 563,582 | | | |
| | | | | | | | | | |
Multi-Utilities - 0.3% | | | | | | | | | | |
Public Service Enterprise Group, Inc. | | | 13,456 | | | | 419,154 | | | |
| | | | | | | | | | |
The accompanying notes are an integral part of the financial statements.
7
Dividend Focus Series
Investment Portfolio - April 30, 2012
(unaudited)
| | | | | | | | | | |
| | | SHARES | | | VALUE
(NOTE 2) | | | |
| | | |
COMMON STOCKS (continued) | | | | | | | | | | |
| | | |
Utilities (continued) | | | | | | | | | | |
Water Utilities - 0.2% | | | | | | | | | | |
Companhia de Saneamento Basico do Estado de Sao Paulo (SABESP) - ADR (Brazil) | | | 2,867 | | | $ | 226,952 | | | |
| | | | | | | | | | |
Total Utilities | | | | | | | 1,209,688 | | | |
| | | | | | | | | | |
TOTAL COMMON STOCKS
(Identified Cost $116,961,892) | | | | | | | 123,510,028 | | | |
| | | | | | | | | | |
| | | |
SHORT-TERM INVESTMENTS - 3.5% | | | | | | | | | | |
| | | |
Dreyfus Cash Management, Inc. - Institutional Shares1, 0.06% (Identified Cost $4,501,874) | | | 4,501,874 | | | | 4,501,874 | | | |
| | | | | | | | | | |
TOTAL INVESTMENTS - 99.9%
(Identified Cost $121,463,766) | | | | | | | 128,011,902 | | | |
OTHER ASSETS, LESS LIABILITIES - 0.1% | | | | | | | 122,715 | | | |
| | | | | | | | | | |
NET ASSETS - 100% | | | | | | $ | 128,134,617 | | | |
| | | | | | | | | | |
ADR - American Depository Receipt
1 Rate shown is the current yield as of April 30, 2012.
The accompanying notes are an integral part of the financial statements.
8
Dividend Focus Series
Statement of Assets and Liabilities
April 30, 2012 (unaudited)
| | | | |
Investments, at value (identified cost $121,463,766) (Note 2) | | $ | 128,011,902 | |
Receivable from investment advisor (Note 3) | | | 640 | |
Receivable from transfer agent (Note 3) | | | 179 | |
Dividends receivable | | | 129,775 | |
Receivable for fund shares sold | | | 97,240 | |
Foreign tax reclaims receivable | | | 4,848 | |
| | | | |
| |
TOTAL ASSETS | | | 128,244,584 | |
| | | | |
| |
LIABILITIES: | | | | |
| |
Accrued management fees (Note 3) | | | 46,397 | |
Accrued fund accounting and administration fees (Note 3) | | | 12,321 | |
Accrued Chief Compliance Officer service fees (Note 3) | | | 418 | |
Accrued shareholder services fees (Class S) (Note 3) | | | 40 | |
Payable for fund shares repurchased | | | 33,314 | |
Audit fees payable | | | 17,252 | |
Other payables and accrued expenses | | | 225 | |
| | | | |
| |
TOTAL LIABILITIES | | | 109,967 | |
| | | | |
| |
TOTAL NET ASSETS | | $ | 128,134,617 | |
| | | | |
| |
NET ASSETS CONSIST OF: | | | | |
| |
Capital stock | | $ | 99,721 | |
Additional paid-in-capital | | | 120,371,319 | |
Undistributed net investment income | | | 321,548 | |
Accumulated net realized gain on investments | | | 793,893 | |
Net unrealized appreciation on investments | | | 6,548,136 | |
| | | | |
| |
TOTAL NET ASSETS | | $ | 128,134,617 | |
| | | | |
| |
NET ASSET VALUE, OFFERING PRICE AND REDEMPTION PRICE PER SHARE - Class S
($307,830/30,628 shares) | | $ | 10.05 | |
| | | | |
| |
NET ASSET VALUE, OFFERING PRICE AND REDEMPTION PRICE PER SHARE - Class I
($127,826,787/9,941,445 shares) | | $ | 12.86 | |
| | | | |
The accompanying notes are an integral part of the financial statements.
9
Dividend Focus Series
Statement of Operations
For the Six Months Ended April 30, 2012 (unaudited)
| | | | |
INVESTMENT INCOME: | | | | |
| |
Dividends (net of foreign taxes withheld, $48,068) | | $ | 1,674,473 | |
| | | | |
| |
EXPENSES: | | | | |
| |
Management fees (Note 3) | | | 239,990 | |
Fund accounting and administration fees (Note 3) | | | 23,876 | |
Transfer agent fees (Note 3) | | | 2,015 | |
Chief Compliance Officer service fees (Note 3) | | | 1,246 | |
Directors’ fees (Note 3) | | | 286 | |
Shareholder services fees (Class S)(Note 3) | | | 41 | |
Custodian fees | | | 7,637 | |
Miscellaneous | | | 30,620 | |
| | | | |
| |
Total Expenses | | | 305,711 | |
| | | | |
| |
NET INVESTMENT INCOME | | | 1,368,762 | |
| | | | |
| |
REALIZED AND UNREALIZED GAIN (LOSS) ON INVESTMENTS: | | | | |
| |
Net realized gain (loss) on investments | | | 845,035 | |
Net change in unrealized appreciation (depreciation) on investments | | | 7,375,831 | |
| | | | |
| |
NET REALIZED AND UNREALIZED GAIN (LOSS) ON INVESTMENTS | | | 8,220,866 | |
| | | | |
| |
NET INCREASE IN NET ASSETS RESULTING FROM OPERATIONS | | $ | 9,589,628 | |
| | | | |
The accompanying notes are an integral part of the financial statements.
10
Dividend Focus Series
Statements of Changes in Net Assets
| | | | | | | | |
| | | FOR THE SIX
MONTHS ENDED
4/30/12
(UNAUDITED) | | | FOR THE
YEAR ENDED
10/31/11 | |
INCREASE (DECREASE) IN NET ASSETS: | | | | | | | | |
| | |
OPERATIONS: | | | | | | | | |
| | |
Net investment income | | $ | 1,368,762 | | | $ | 523,429 | |
Net realized gain (loss) on investments | | | 845,035 | | | | 151,167 | |
Net change in unrealized appreciation (depreciation) on investments | | | 7,375,831 | | | | (1,016,872 | ) |
| | | | | | | | |
| | |
Net increase (decrease) from operations | | | 9,589,628 | | | | (342,276 | ) |
| | | | | | | | |
| | |
DISTRIBUTIONS TO SHAREHOLDERS (Note 8): | | | | | | | | |
| | |
From net investment income (Class S) | | | (55 | ) | | | — | |
From net investment income (Class I) | | | (1,199,626 | ) | | | (387,291 | ) |
From net realized gain on investments (Class I) | | | (185,043 | ) | | | (280,255 | ) |
| | | | | | | | |
| | |
Total distributions to shareholders | | | (1,384,724 | ) | | | (667,546 | ) |
| | | | | | | | |
| | |
CAPITAL STOCK ISSUED AND REPURCHASED: | | | | | | | | |
| | |
Net increase from capital share transactions (Note 5) | | | 40,901,469 | | | | 77,394,902 | |
| | | | | | | | |
| | |
Net increase in net assets | | | 49,106,373 | | | | 76,385,080 | |
| | |
NET ASSETS: | | | | | | | | |
| | |
Beginning of period | | | 79,028,244 | | | | 2,643,164 | |
| | | | | | | | |
| | |
End of period (including undistributed net investment income of $321,548 and $152,467, respectively) | | $ | 128,134,617 | | | $ | 79,028,244 | |
| | | | | | | | |
The accompanying notes are an integral part of the financial statements.
11
Dividend Focus Series
Financial Highlights - Class S
| | | | | | |
| | | | | FOR THE PERIOD
3/1/20121 TO 4/30/12
(UNAUDITED) | |
Per share data (for a share outstanding throughout the period): | | | | | | |
Net asset value - Beginning of period | | | | $ | 10.00 | |
| | | | | | |
Income (loss) from investment operations: | | | | | | |
Net investment income2 | | | | | — | 3 |
Net realized and unrealized gain (loss) on investments | | | | | 0.11 | |
| | | | | | |
| | |
Total from investment operations | | | | | 0.11 | |
| | | | | | |
| | |
Less distributions to shareholders: | | | | | | |
From net investment income | | | | | (0.06 | ) |
| | | | | | |
| | |
Net asset value - End of period | | | | $ | 10.05 | |
| | | | | | |
| | |
Net assets - End of period(000’s omitted) | | | | $ | 308 | |
| | | | | | |
| | |
Total return4 | | | | | 1.10 | % |
Ratios (to average net assets)/Supplemental Data: | | | | | | |
Expenses | | | | | 0.85 | %5 |
Net investment income | | | | | 0.29 | %5 |
Portfolio turnover | | | | | 17 | % |
1 Commencement of operations.
2 Calculated based on average shares outstanding during the period.
3 Less than $0.01 per share.
4 Represents aggregate total return for the period indicated, and assumes reinvestment of all distributions. Periods less than one year are not annualized.
5 Annualized.
The accompanying notes are an integral part of the financial statements.
12
Dividend Focus Series
Financial Highlights - Class I*
| | | | | | | | | | | | | | | | |
| | | FOR THE SIX
MONTHS ENDED
4/30/12
(UNAUDITED) | | | FOR THE
YEAR ENDED
10/31/11 | | | FOR THE
YEAR ENDED
10/31/10 | | | FOR THE PERIOD
11/7/081 TO
10/31/09 | |
Per share data (for a share outstanding throughout each period): | | | | | | | | | | | | | | | | |
Net asset value - Beginning of period | | $ | 11.96 | | | $ | 12.41 | | | $ | 11.38 | | | $ | 10.00 | |
| | | | | | | | | | | | | | | | |
Income (loss) from investment operations: | | | | | | | | | | | | | | | | |
Net investment income2 | | | 0.16 | | | | 0.27 | | | | 0.36 | | | | 0.34 | |
Net realized and unrealized gain (loss) on investments | | | 0.90 | | | | 0.88 | | | | 1.02 | | | | 1.22 | |
| | | | | | | | | | | | | | | | |
| | | | |
Total from investment operations | | | 1.06 | | | | 1.15 | | | | 1.38 | | | | 1.56 | |
| | | | | | | | | | | | | | | | |
| | | | |
Less distributions to shareholders: | | | | | | | | | | | | | | | | |
From net investment income | | | (0.14 | ) | | | (0.30 | ) | | | (0.35 | ) | | | (0.18 | ) |
From net realized gain on investments | | | (0.02 | ) | | | (1.30 | ) | | | — | 3 | | | — | |
| | | | | | | | | | | | | | | | |
| | | | |
Total distributions to shareholders | | | (0.16 | ) | | | (1.60 | ) | | | (0.35 | ) | | | (0.18 | ) |
| | | | | | | | | | | | | | | | |
| | | | |
Net asset value - End of period | | $ | 12.86 | | | $ | 11.96 | | | $ | 12.41 | | | $ | 11.38 | |
| | | | | | | | | | | | | | | | |
| | | | |
Net assets - End of period(000’s omitted) | | $ | 127,827 | | | $ | 79,028 | | | $ | 2,643 | | | $ | 2,044 | |
| | | | | | | | | | | | | | | | |
| | | | |
Total return4 | | | 8.95 | % | | | 10.17 | % | | | 12.32 | % | | | 15.81 | % |
Ratios (to average net assets)/Supplemental Data: | | | | | | | | | | | | | | | | |
Expenses** | | | 0.57 | %5 | | | 0.60 | % | | | 0.60 | % | | | 0.60 | %5 |
Net investment income | | | 2.57 | %5 | | | 2.41 | % | | | 2.99 | % | | | 3.33 | %5 |
Portfolio turnover | | | 17 | % | | | 8 | % | | | 73 | % | | | 28 | % |
|
* Effective March 1, 2012, the shares of the Series have been designated as Class I. ** For certain periods presented, the investment advisor did not impose all or a portion of its management fees and/or other fees. If these expenses had been incurred by the Class, the expense ratio (to average net assets) would have increased by the following amount: | |
| | | | |
| | | N/A | | | | 0.45 | % | | | 5.01 | % | | | 6.21 | %5 |
1Commencement of operations.
2Calculated based on average shares outstanding during the periods.
3Less than $0.01 per share.
4Represents aggregate total return for the periods indicated, and assumes reinvestment of all distributions. Total return would have been lower had certain expenses not been waived during certain periods. Periods less than one year are not annualized.
5Annualized.
The accompanying notes are an integral part of the financial statements.
13
Dividend Focus Series
Notes to Financial Statements
(unaudited)
Dividend Focus Series (the “Series”) is a no-load non-diversified series of Manning & Napier Fund, Inc. (the “Fund”). The Fund is organized in Maryland and is registered under the Investment Company Act of 1940, as amended, as an open-end management investment company.
The Series’ investment objective is to provide competitive returns consistent with the broad equity market while providing a level of capital protection during market downturns through a passive quantitative investment approach.
The Fund’s Advisor is Manning & Napier Advisors, LLC (the “Advisor”). Shares of the Series are offered to investors, clients and employees of the Advisor and its affiliates. Effective March 1, 2012, Class A shares of the Series have been redesignated as Class I Shares and the Series issued Class S Shares. The total authorized capital stock of the Fund consists of 15 billion shares of common stock each having a par value of $0.01. As of April 30, 2012, 9.8 billion shares have been designated in total among 41 series, of which 100 million have been designated as Dividend Focus Series Class I common stock and 100 million have been designated as Dividend Focus Series Class S common stock.
| 2. | Significant Accounting Policies |
Security Valuation
Portfolio securities, including domestic equities, foreign equities, warrants and options, listed on an exchange other than the NASDAQ National Market System are valued at the latest quoted sales price of the exchange on which the security is primarily traded. Securities not traded on valuation date or securities not listed on an exchange are valued at the latest quoted bid price provided by the Fund’s pricing service. Securities listed on the NASDAQ National Market System are valued in accordance with the NASDAQ Official Closing Price.
Short-term investments that mature in sixty days or less are valued at amortized cost, which approximates fair value. Investments in open-end investment companies are valued at their net asset value per share on valuation date.
Volume and level of activity in established markets for an asset or liability are evaluated to determine whether recent transactions and quoted prices are determinative of fair value. Where there have been significant decreases in volume and level of activity, further analysis and adjustment may be necessary to estimate fair value. The Series measures fair value in these instances by the use of inputs and valuation techniques which may be based upon current market prices of securities that are comparable in coupon, rating, maturity and industry and/or expectation of future cash flows. As a result of trading in relatively thin markets and/or markets that experience significant volatility, the prices used by the Series to value these securities may differ from the value that would be realized if these securities were sold, and the differences could be material.
Securities for which representative valuations or prices are not available from the Series’ pricing service may be valued at fair value as determined in good faith by the Advisor under procedures approved by and under the general supervision and responsibility of the Fund’s Board of Directors (the “Board”). Due to the inherent uncertainty of valuations of such securities, the fair value may differ significantly from the values that would have been used had a ready market for such securities existed. If trading or events occurring after the close of the principal market in which securities are traded are expected to materially affect the value of those securities, then they may be valued at their fair value, taking this trading or these events into account.
Various inputs are used in determining the value of the Series’ assets or liabilities carried at fair value. These inputs are summarized in three broad levels. Level 1 includes quoted prices in active markets for identical assets and liabilities. Level 2 includes other significant observable inputs (including quoted prices for similar securities, interest rates, prepayment speeds, credit risk, etc.). Level 3 includes significant unobservable inputs (including the Series’ own assumptions in determining the fair value of investments). A financial instrument’s level within the fair value hierarchy is based on the lowest level of any input both individually and in aggregate that is significant to the fair value measurement. The inputs or methodology used for valuing securities are not necessarily an indication of the risk associated with investing in those securities.
The following is a summary of the valuation levels used for major security types as of April 30, 2012 in valuing the Series’ assets or liabilities carried at fair value:
14
Dividend Focus Series
Notes to Financial Statements (continued)
(unaudited)
| 2. | Significant Accounting Policies (continued) |
Security Valuation (continued)
| | | | | | | | | | | | | | | | |
| DESCRIPTION | | TOTAL | | | LEVEL 1 | | | LEVEL 2 | | | LEVEL 3 | |
Assets: | | | | | | | | | | | | | | | | |
Equity Securities*: | | | | | | | | | | | | | | | | |
Consumer Discretionary | | $ | 8,728,091 | | | $ | 8,728,091 | | | $ | — | | | $ | — | |
Consumer Staples | | | 25,222,221 | | | | 25,222,221 | | | | — | | | | — | |
Energy | | | 20,523,056 | | | | 20,523,056 | | | | — | | | | — | |
Financials | | | 478,636 | | | | 478,636 | | | | — | | | | — | |
Health Care | | | 28,714,241 | | | | 28,714,241 | | | | — | | | | — | |
Industrials | | | 15,816,979 | | | | 15,816,979 | | | | — | | | | — | |
Information Technology | | | 13,703,946 | | | | 13,703,946 | | | | — | | | | — | |
Materials | | | 7,621,017 | | | | 7,621,017 | | | | — | | | | — | |
Telecommunication Services | | | 1,492,153 | | | | 1,492,153 | | | �� | — | | | | — | |
Utilities | | | 1,209,688 | | | | 1,209,688 | | | | — | | | | — | |
Mutual Funds | | | 4,501,874 | | | | 4,501,874 | | | | — | | | | — | |
| | | | | | | | | | | | | | | | |
Total assets | | $ | 128,011,902 | | | $ | 128,011,902 | | | $ | — | | | $ | — | |
| | | | | | | | | | | | | | | | |
* Includes common stock, warrants and rights.
There were no Level 2 or Level 3 securities held by the Series as of October 31, 2011 or April 30, 2012.
The Fund’s policy is to recognize transfers in and transfers out of the valuation levels as of the beginning of the reporting period. There were no transfers between Level 1 and Level 2 during the six months ended April 30, 2012.
Recent Accounting Standard
In May 2011, the Financial Accounting Standards Board (“FASB”) issued Accounting Standards Update No. 2011-04, “Fair Value Measurements (Topic 820) - Amendments to Achieve Common Fair Value Measurement and Disclosure Requirements in U.S. GAAP and IFRSs” (“ASU 2011-04”). ASU 2011-04 clarifies the application of existing fair value measurement requirements, changes certain principles related to measuring fair value, and requires additional disclosures about fair value measurements.
Required disclosures are expanded under the new guidance, especially for fair value measurements that are categorized within Level 3 of the fair value hierarchy, for which quantitative information about the unobservable inputs used, and a narrative description of the valuation processes in place and sensitivity of recurring Level 3 measurements to changes in unobservable inputs will be required.
ASU 2011-04 is effective for interim and annual periods beginning after December 15, 2011 and is to be applied prospectively. Management is currently assessing the impact of this guidance, but does not expect it to have a material impact on the Series’ financial statements.
Security Transactions, Investment Income and Expenses
Security transactions are accounted for on trade date. Dividend income is recorded on the ex-dividend date, except that if the ex-dividend date has passed, certain dividends from foreign securities are recorded as soon as the Series is informed of the ex-dividend date. Non-cash dividends, if any, are recorded at the fair value of the securities received. Interest income, including amortization of premium and accretion of discounts using the effective interest method, is earned from settlement date and accrued daily.
Expenses are recorded on an accrual basis. Most expenses of the Fund can be attributed to a specific series. Expenses which cannot be directly attributed are apportioned among the series in the Fund in such a manner as deemed equitable by the Fund’s Board, taking into consideration, among other things, the nature and type of expense.
15
Dividend Focus Series
Notes to Financial Statements (continued)
(unaudited)
| 2. | Significant Accounting Policies (continued) |
Security Transactions, Investment Income and Expenses (continued)
The Series uses the identified cost method for determining realized gain or loss on investments for both financial statement and federal income tax reporting purposes.
Foreign Currency Translation
The books and records of the Series are maintained in U.S. dollars. Foreign currencies, investments and other assets and liabilities are translated into U.S. dollars at the current exchange rates. Purchases and sales of investment securities and income and expenses are translated on the respective dates of such transactions. The Series does not isolate realized and unrealized gains and losses attributable to changes in the exchange rates from gains and losses that arise from changes in the fair value of investments. Such fluctuations are included with net realized and unrealized gain or loss on investments. Net realized foreign currency gains and losses represent foreign currency gains and losses between trade date and settlement date on securities transactions, gains and losses on disposition of foreign currencies and the difference between the amount of income and foreign withholding taxes recorded on the books of the Series and the amounts actually received or paid.
Federal Taxes
The Series’ policy is to comply with the provisions of the Internal Revenue Code applicable to regulated investment companies. The Series is not subject to federal income or excise tax to the extent that the Series distributes to shareholders each year its taxable income, including any net realized gains on investments, in accordance with requirements of the Internal Revenue Code. Accordingly, no provision for federal income tax or excise tax has been made in the financial statements.
Management evaluates its tax positions to determine if the tax positions taken meet the minimum recognition threshold in connection with accounting for uncertainties in income tax positions taken or expected to be taken for the purposes of measuring and recognizing tax liabilities in the financial statements. Recognition of tax benefits of an uncertain tax position is required only when the position is “more likely than not” to be sustained assuming examination by taxing authorities. At April 30, 2012, the Series has recorded no liability for net unrecognized tax benefits relating to uncertain income tax positions taken or expected to be taken in future tax returns.
The Series files income tax returns in the U.S. federal jurisdiction, various states and foreign jurisdictions, as required. No income tax returns are currently under investigation. The statute of limitations on the Series’ tax returns remains open for the period ended October 31, 2009 and the years ended October 31, 2010 through October 31, 2011. The Series is not aware of any tax positions for which it is reasonably possible that the total amounts of unrecognized tax benefits will significantly change in the next twelve months.
Foreign Taxes
Based on the Series’ understanding of the tax rules and rates related to income, gains and currency purchase/repatriation transactions for foreign jurisdictions in which it invests, the Series will provide for foreign taxes, and where appropriate, deferred foreign tax.
Distributions of Income and Gains
Distributions to shareholders of net investment income are made quarterly. Distributions of net realized gains are made annually. An additional distribution may be necessary to avoid taxation of the Series. Distributions are recorded on the ex-dividend date.
Indemnifications
The Fund’s organizational documents provide former and current directors and officers with a limited indemnification against liabilities arising in connection with the performance of their duties to the Fund. In the normal course of business, the Fund may also enter into contracts that provide general indemnifications. The Fund’s maximum exposure under these arrangements is unknown as this would be dependent on future claims that may be made against the Fund. The risk of material loss from such claims is considered remote.
Other
The preparation of financial statements in conformity with accounting principles generally accepted in the United States of America requires management to make estimates and assumptions that affect the reported amounts of assets and liabilities and
16
Dividend Focus Series
Notes to Financial Statements (continued)
(unaudited)
| 2. | Significant Accounting Policies (continued) |
Other (continued)
the disclosure of contingent assets and liabilities at the date of the financial statements and the reported amounts of income and expenses during the reporting period. Actual results could differ from those estimates.
| 3. | Transactions with Affiliates |
The Fund has an Investment Advisory Agreement (the “Agreement”) with the Advisor, for which the Series pays a fee, computed daily and payable monthly, at an annual rate of 0.45% of the Series’ average daily net assets.
Under the Agreement, personnel of the Advisor provide the Series with advice and assistance in the choice of investments and the execution of securities transactions, and otherwise maintain the Series’ organization. The Advisor also provides the Fund with necessary office space and fund administration and support services. The salaries of all officers of the Fund (except a percentage of the Fund’s Chief Compliance Officer’s salary, which is paid by the Fund), and of all Directors who are “affiliated persons” of the Fund, or of the Advisor, and all personnel of the Fund, or of the Advisor, performing services relating to research, statistical and investment activities, are paid by the Advisor. Each “non-affiliated” Director receives an annual stipend, which is allocated among all the active series of the Fund. In addition, these Directors also receive a fee per Board meeting attended plus a fee for each committee meeting attended.
Effective March 1, 2012, Class A shares of the Series have been redesignated as Class I shares and the Series issued Class S shares. The Class S shares of the Series are subject to a shareholder services fee in accordance with a shareholder services plan adopted by the Fund’s Board. The shareholder services fee is intended to compensate financial intermediaries, including affiliates of the Fund, in connection with the provision of direct client service, personal services, maintenance of shareholder accounts and reporting services. For these services, Class S of the Series pays a fee, computed daily and payable monthly, at an annual rate of 0.25% of the average daily net assets of Class S. The Fund has a Shareholder Services Agreement with the Advisor, for which the Advisor receives the shareholder services fee as stated above.
In conjunction with the Agreement, the Advisor has contractually agreed, until at least February 28, 2013, to waive its fee and, if necessary, pay other operating expenses of the Series in order to maintain total direct annual fund operating expenses for the Series at no more than 0.60% of average daily net assets each year. For the six months ended April 30, 2012, the Advisor did not waive fees or reimburse expenses for the Series. The Advisor is not eligible to recoup any expenses that have been waived or reimbursed in prior years.
Manning & Napier Investor Services, Inc., a registered broker-dealer affiliate of the Advisor, acts as distributor for the Fund’s shares. The services of Manning & Napier Investor Services, Inc. are provided at no additional cost to the Series.
The Advisor has agreements with BNY Mellon Investment Servicing (U.S.) Inc. (“BNY”) under which BNY serves as sub-accountant services agent and sub-transfer agent. The Fund pays the Advisor an annual fee related to fund accounting and administration of 0.0175% on the first $3 billion of average daily net assets (excluding Target Series); 0.015% on the next $3 billion of average daily net assets (excluding Target Series); and 0.01% of the average daily net assets in excess of $6 billion (excluding Target Series); plus a base fee of $25,500 per series. Transfer Agent fees are charged to the Fund on a per account basis. Additionally, certain transaction and cusip-based fees and out-of-pocket expenses, including charges for reporting relating to the Fund’s compliance program, are charged.
Expenses not directly attributable to a series are allocated based on each series’ relative net assets or number of accounts, depending on the expense.
| 4. | Purchases and Sales of Securities |
For the six months ended April 30, 2012, purchases and sales of securities, other than U.S. Government securities and short-term securities, were $54,790,224 and $16,969,379, respectively. There were no purchases or sales of U.S. Government securities.
17
Dividend Focus Series
Notes to Financial Statements (continued)
(unaudited)
| 5. | Capital Stock Transactions |
Transactions in Class S and I shares of Dividend Focus Series were:
| | | | | | | | | | | | | | | | |
| CLASS S | | FOR THE PERIOD 3/1/12
(COMMENCEMENT OF
OPERATIONS) TO 4/30/12 | | | | | | | |
| | | SHARES | | | AMOUNT | | | | | | | |
Sold | | | 30,623 | | | $ | 304,975 | | | | | | | | | |
Reinvested | | | 5 | | | | 55 | | | | | | | | | |
| | | | | | | | | | | | | | | | |
Total | | | 30,628 | | | $ | 305,030 | | | | | | | | | |
| | | | | | | | | | | | | | | | |
| | | | | | | | | | | | | | | | |
| CLASS I | | FOR THE SIX MONTHS ENDED 4/30/12 | | | FOR THE YEAR ENDED 10/31/11 | |
| | | SHARES | | | AMOUNT | | | SHARES | | | AMOUNT | |
Sold | | | 4,311,727 | | | $ | 52,661,028 | | | | 6,736,803 | | | $ | 81,351,801 | |
Reinvested | | | 64,259 | | | | 785,705 | | | | 44,413 | | | | 505,619 | |
Repurchased | | | (1,041,782 | ) | | | (12,850,294 | ) | | | (386,985 | ) | | | (4,462,518 | ) |
| | | | | | | | | | | | | | | | |
Total | | | 3,334,204 | | | $ | 40,596,439 | | | | 6,394,231 | | | $ | 77,394,902 | |
| | | | | | | | | | | | | | | | |
At April 30, 2012, one omnibus account owned 3,897,774 shares of the Series (39.1% of shares outstanding) valued at $50,125,378. In addition, the Advisor owned 60,704 shares (0.6% of shares outstanding) valued at $780,647 and the retirement plan of the Advisor and its affiliates owned 133,673 shares of the Series (1.3% of shares outstanding) valued at $1,719,041. Investment activities of these shareholders may have a material effect on the Series.
The Series may trade in instruments including written and purchased options, forward foreign currency exchange contracts and futures contracts and other derivatives in the normal course of investing activities to assist in managing exposure to various market risks. The Series may be subject to various elements of risk and may involve, to a varying degree, elements of risk in excess of the amounts recognized for financial statement purposes. These risks include: the risk that changes in the value of a derivative may not correlate perfectly with the underlying asset, rate or index, counterparty credit risk related to over the counter derivative counterparties’ failure to perform under contract terms, liquidity risk related to the lack of a liquid market for these contracts allowing the fund to close out its position(s) and documentation risk relating to disagreement over contract terms. No such investments were held by the Series as of April 30, 2012.
Investing in securities of foreign companies and foreign governments involves special risks and considerations not typically associated with investing in securities of domestic companies and the U.S. Government. These risks include revaluation of currencies and future adverse political and economic developments. Moreover, securities of foreign companies and foreign governments and their markets may be less liquid and their prices more volatile than those of comparable domestic companies and the U.S. Government.
| 8. | Federal Income Tax Information |
The amount and characterization of certain income and capital gains to be distributed are determined in accordance with federal income tax regulations, which may differ from accounting principles generally accepted in the United States of America. The Series may periodically make reclassifications among its capital accounts to reflect income and gains available for distribution (or available capital loss carryovers) under income tax regulations, without impacting the Series’ net asset value. Any such reclassifications are not reflected in the financial highlights.
18
Dividend Focus Series
Notes to Financial Statements (continued)
(unaudited)
| 8. | Federal Income Tax Information (continued) |
The final determination of the tax character of current year distributions will be made at the conclusion of the fiscal year. The tax character of distributions paid for the year ended October 31, 2011 was as follows:
Ordinary income $ 467,218
Long-term capital gains 200,328
The Regulated Investment Company Modernization Act of 2010 (the “Act”) was enacted on December 22, 2010. The Act made changes to several tax rules including the unlimited carryover of future capital losses, which will retain their character as short-term and/or long-term losses. Prior to the Act, net capital losses incurred by the Series were carried forward for eight years and treated as short-term losses. The Act requires that post-enactment net capital losses be used before pre-enactment net capital losses.
At April 30, 2012, the identified cost of investments for federal income tax purposes, the resulting gross unrealized appreciation and depreciation, and the net unrealized appreciation were as follows:
| | | | |
Cost for federal income tax
purposes | | $ | 121,512,773 | |
Unrealized appreciation | | | 7,991,400 | |
Unrealized depreciation | | | (1,492,271 | ) |
| | | | |
Net unrealized appreciation | | $ | 6,499,129 | |
| | | | |
19
Dividend Focus Series
Renewal of Investment Advisory Agreement
(unaudited)
At the Manning & Napier Fund, Inc. (the “Fund”) Board of Directors’ (the “Board”) meeting, held on November 18, 2011, the Investment Advisory Agreement (the “Agreement”) between the Fund and Manning & Napier Advisors, LLC (the “Advisor”) was reviewed by the Board for renewal. In connection with the decision whether to renew the Agreement, a variety of material was prepared for and reviewed by the Board.
Representatives of the Advisor attended the meeting and presented additional oral and written information to the Board to assist the Board in its considerations. The discussion immediately below outlines the materials and information presented to the Board in connection with the Board’s 2011 Annual Review of the Agreement and the conclusions made by the Directors when determining to continue the Agreement.
| | • | | The Board considered the services provided by the Advisor under the Agreement including, among others: deciding what securities to purchase and sell for each Series; arranging for the purchase and sale of such securities by placing orders with broker-dealers; administering the affairs of the Fund (including the books and records of the Fund not maintained by third party service providers such as the custodian or sub-transfer agent); arranging for the insurance coverage for the Fund; and supervising the preparation of tax returns, SEC filings (including registration statements) and reports to shareholders for the Fund. The Board also considered the nature and quality of such services provided under the Agreement in light of the Advisor’s services provided to the Fund for 25 years. The Board discussed the quality of these services with representatives from the Advisor and concluded that the Advisor was performing its services to the Fund required under the Agreement in a reasonable manner. |
| | • | | The Board considered the investment performance of the various Series of the Fund. The investment performance for each Series was reviewed on a cumulative basis since inception and on a one year basis. In addition, annualized performance for the following time periods was considered: inception, three year, five year, ten year, and current market cycle. A market cycle includes periods of both rising and falling markets. Returns for established benchmark indices for each Series were provided for each time period. The Board noted that the various Series were competitive against their respective benchmarks and/or peer groups over various time periods, but in particular over the full market cycle period relevant for the Series. In addition, the Board considered at the meeting (and considers on a quarterly basis) a peer group performance analysis consisting of Morningstar universes of mutual funds with similar investment objectives. The Board discussed the performance with representatives from the Advisor and concluded that the investment performance of each of the Fund’s Series was reasonable based on the Fund’s actual performance and comparative performance, especially performance over the current market cycle. |
| | • | | The Board considered the costs of the Advisor’s services and the profits of the Advisor as they relate to the Advisor’s services to the Fund under the Agreement. In reviewing the Advisor’s costs and profits, the Board discussed the Advisor’s revenues generated from the Fund (on both an actual and adjusted basis) and its expenses associated with providing the services under the Agreement. In addition, the Board reviewed the Advisor’s expenses associated with Fund activities outside of the Agreement (such as expense reimbursements pursuant to expense caps and payments made by the Advisor to third party platforms on which shares of the Fund are available for purchase). It was noted by representatives of the Advisor that 10 of the 29 active Series of the Fund are currently experiencing expenses above the capped expense ratios. After discussing the above costs and profits, the Board concluded that the Advisor’s profitability relating to its services provided under the Agreement was reasonable. |
| | • | | The Board considered the fees and expenses of the various Series of the Fund. The Advisor presented the advisory fees and total expenses for each Series, including the advisory fee adjusted for any expense waivers or reimbursements (either contractual or voluntary) paid by the Advisor. The advisory fees and expense ratios of each Series were compared to an average (on both a mean and median basis) of similar funds as disclosed on the Morningstar database. Representatives of the Advisor discussed with the Board the levels of its advisory fee for each Series of the Fund and as compared to the median and mean advisory fees for similar funds as listed on Morningstar. Expense ratios for every Series, except the Pro-Blend Class R and Class C, and Target Class R and Class C (and a few Class K), are currently below the median and mean for similar funds as listed on Morningstar. Based on their review of the information provided, the Board concluded that the fees and expenses of each Series of the Fund were reasonable on a comparative basis. |
20
Dividend Focus Series
Renewal of Investment Advisory Agreement
(unaudited)
| | • | | The Board also considered the other benefits the Advisor derives from its relationship with the Fund. Such other benefits include certain research products provided by soft dollars. Given the level of soft dollar transactions involving the Fund, the Board concluded that these additional benefits to the Advisor were reasonable. |
| | • | | In addition to the factors described above, the Board considered the Advisor’s personnel, investment strategies, policies and procedures relating to compliance with personal securities transactions, and reputation, expertise and resources in domestic and foreign financial markets. The Board concluded that these factors support the conclusion that the Advisor performs its services in a reasonable manner. |
| | • | | The Board did not consider economies of scale at this time because of the multiple uses of the Fund (for the Advisor’s discretionary investment account clients in addition to direct investors), the current profitability of the Advisor’s services to the Fund under the Agreement, and the overall size of the Fund complex. |
Based on the Board’s deliberations and their evaluation of the information described above, the Board, including a majority of Directors that are not “interested persons” as defined in the Investment Company Act of 1940, concluded that the compensation under the Agreement was fair and reasonable in light of the services and expenses and such other matters as the Directors considered to be relevant in the exercise of their reasonable judgment. Accordingly, the Board approved the renewal of the Agreement. In the course of their deliberations, the Directors did not identify any particular information that was all important or controlling.
21
Dividend Focus Series
Literature Requests
(unaudited)
Proxy Voting Policies and Procedures
A description of the policies and procedures that the Fund uses to determine how to vote proxies relating to portfolio securities is available, without charge, upon request:
| | | | |
| By phone | | 1-800-466-3863 | | |
| On the Securities and Exchange | | | | |
| Commission’s (SEC) web site | | http://www.sec.gov | | |
Proxy Voting Record
Information regarding how the Fund voted proxies relating to portfolio securities during the most recent 12-month period ended June 30th is available, without charge, upon request:
| | | | |
| By phone | | 1-800-466-3863 | | |
| On the SEC’s web site | | http://www.sec.gov | | |
Quarterly Portfolio Holdings
The Series’ complete schedule of portfolio holdings for the 1st and 3rd quarters of each fiscal year are provided on Form N-Q, and are available, without charge, upon request:
| | | | |
| By phone | | 1-800-466-3863 | | |
| On the SEC’s web site | | http://www.sec.gov | | |
The Series’ Form N-Q may be reviewed and copied at the SEC’s Public Reference Room in Washington, D.C. Information on the operation of the Public Reference Room may be obtained by calling 1-800-SEC-0330.
Prospectus and Statement of Additional Information (SAI)
The prospectus and SAI provide additional information about each Series, including charges, expenses and risks. These documents are available, without charge, upon request:
| | | | |
| By phone | | 1-800-466-3863 | | |
| On the SEC’s web site | | http://www.sec.gov | | |
| On our web site | | http://www.manning-napier.com | | |
Additional information available at www.manning-napier.com
1. Fund Holdings - Month-End
2. Fund Holdings - Quarter-End
3. Shareholder Report - Annual
4. Shareholder Report - Semi-Annual
The Fund also offers electronic notification or “e-delivery” when certain documents are available on-line to be downloaded or reviewed. Direct shareholders can elect to receive electronic notification when shareholder reports, prospectus updates, and/or statements are available. If you do not currently have on-line access to your account, you can establish access by going to www.manning-napier.com, click on “Login” in the top corner of the page, and follow the prompts to self-enroll. Once enrolled, you can set your electronic notification preferences by clicking on the Account Options tab located within the green toolbar and then select E-Delivery Option. Should you have any questions on either how to establish on-line access or how to update your account settings, please contact Investor Services at 1-800-466-3863.
MNDIV-04/12-SAR


| | | | | | |
| | | | OVERSEAS SERIES | | |
www.manning-napier.com | | | |  |
Overseas Series
Shareholder Expense Example
(unaudited)
As a shareholder of the Series, you may incur two types of costs: (1) transaction costs, including potential wire charges on redemptions and (2) ongoing costs, including management fees and other Series expenses. This example is intended to help you understand your ongoing costs (in dollars) of investing in the Series and to compare these costs with the ongoing costs of investing in other mutual funds.
The example is based on an investment of $1,000 invested at the beginning of the period and held for the entire period (November 1, 2011 to April 30, 2012).
Actual Expenses
The first line of the table below provides information about actual account values and actual expenses. You may use the information in this line, together with the amount you invested, to estimate the expenses that you paid over the period. Simply divide your account value by $1,000 (for example, an $8,600 account value divided by $1,000 = 8.6), then multiply the result by the number in the first line under the heading entitled “Expenses Paid During Period” to estimate the expenses you paid on your account during this period.
Hypothetical Example for Comparison Purposes
The second line of the table below provides information about hypothetical account values and hypothetical expenses based on the Series’ actual expense ratio and an assumed rate of return of 5% per year before expenses, which is not the Series’ actual return. The hypothetical account values and expenses may not be used to estimate the actual ending account balance or expenses you paid during the period. You may use this information to compare the ongoing costs of investing in the Series and other funds. To do so, compare this 5% hypothetical example with the 5% hypothetical examples that appear in the shareholder reports of the other funds.
Please note that the expenses shown in the table are meant to highlight your ongoing costs only and do not reflect any transaction costs. Therefore, the second line of the table is useful in comparing ongoing costs only, and will not help you determine the relative total costs of owning different funds. In addition, if these transaction costs were included, your costs would have been higher.
| | | | | | |
| | | BEGINNING
ACCOUNT VALUE
11/1/11 | | ENDING
ACCOUNT VALUE
4/30/12 | | EXPENSES PAID
DURING PERIOD*
11/1/11-4/30/12 |
Actual | | $1,000.00 | | $1,045.60 | | $3.81 |
Hypothetical (5% return before expenses) | | $1,000.00 | | $1,021.13 | | $3.77 |
*Expenses are equal to the Series’ annualized expense ratio (for the six-month period) of 0.75%, multiplied by the average account value over the period, multiplied by 182/366 (to reflect the one-half year period). Expenses are based on the most recent fiscal half year.
1
Overseas Series
Portfolio Composition as of April 30, 2012
(unaudited)
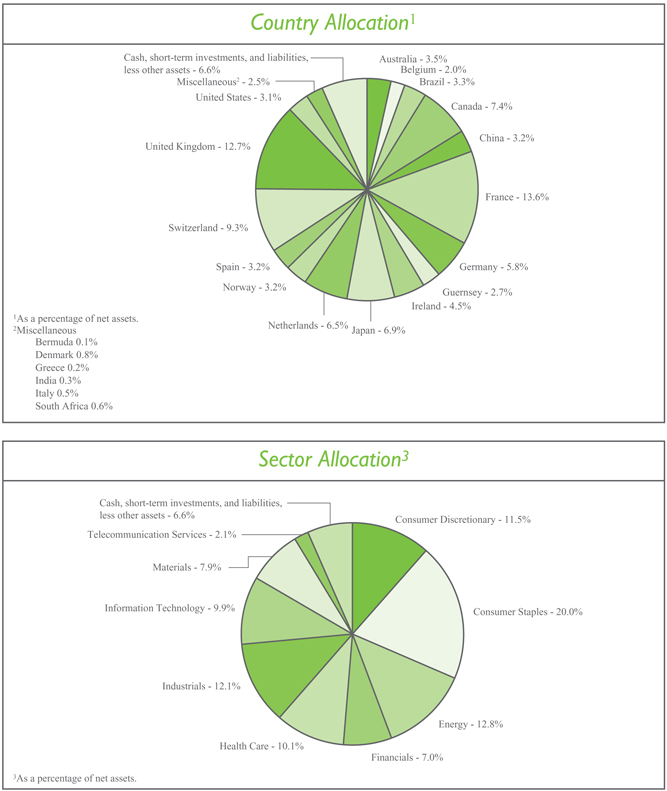
2
Overseas Series
Investment Portfolio - April 30, 2012
(unaudited)
| | | | | | | | | | |
| | | SHARES | | | VALUE (NOTE 2) | | | |
| | | |
COMMON STOCKS - 93.4% | | | | | | | | | | |
| | | |
Consumer Discretionary - 11.5% | | | | | | | | | | |
Automobiles - 2.3% | | | | | | | | | | |
Suzuki Motor Corp. (Japan)1 | | | 769,400 | | | $ | 18,108,937 | | | |
Toyota Motor Corp. (Japan)1 | | | 547,200 | | | | 22,423,035 | | | |
| | | | | | | | | | |
| | | | | | | 40,531,972 | | | |
| | | | | | | | | | |
Diversified Consumer Services - 0.9% | | | | | | | | | | |
Anhanguera Educacional Participacoes S.A. (Brazil) | | | 1,128,080 | | | | 14,925,466 | | | |
| | | | | | | | | | |
Hotels, Restaurants & Leisure - 2.0% | | | | | | | | | | |
Accor S.A. (France)1 | | | 991,010 | | | | 34,269,707 | | | |
| | | | | | | | | | |
Internet & Catalog Retail - 0.5% | | | | | | | | | | |
Ocado Group plc (United Kingdom)*1 | | | 4,171,760 | | | | 8,794,099 | | | |
| | | | | | | | | | |
Media - 3.4% | | | | | | | | | | |
British Sky Broadcasting Group plc (United Kingdom)1 | | | 248,750 | | | | 2,737,527 | | | |
Societe Television Francaise 1 (France)1 | | | 2,951,620 | | | | 28,589,620 | | | |
Virgin Media, Inc. - ADR (United Kingdom) | | | 1,150,170 | | | | 28,248,175 | | | |
| | | | | | | | | | |
| | | | | | | 59,575,322 | | | |
| | | | | | | | | | |
Multiline Retail - 1.3% | | | | | | | | | | |
Marks & Spencer Group plc (United Kingdom)1 | | | 3,910,400 | | | | 22,663,814 | | | |
| | | | | | | | | | |
Textiles, Apparel & Luxury Goods - 1.1% | | | | | | | | | | |
Adidas AG (Germany)1 | | | 236,490 | | | | 19,725,563 | | | |
| | | | | | | | | | |
Total Consumer Discretionary | | | | | | | 200,485,943 | | | |
| | | | | | | | | | |
Consumer Staples - 20.0% | | | | | | | | | | |
Beverages - 3.4% | | | | | | | | | | |
Anheuser-Busch InBev N.V. (Belgium)1 | | | 457,690 | | | | 32,988,140 | | | |
Carlsberg A/S - Class B (Denmark)1 | | | 56,600 | | | | 4,885,811 | | | |
Heineken N.V. (Netherlands)1 | | | 405,960 | | | | 22,201,357 | | | |
| | | | | | | | | | |
| | | | | | | 60,075,308 | | | |
| | | | | | | | | | |
Food & Staples Retailing - 6.6% | | | | | | | | | | |
Carrefour S.A. (France)1 | | | 1,621,970 | | | | 32,579,603 | | | |
Distribuidora Internacional de Alimentacion S.A. (Spain)*1 | | | 805,180 | | | | 3,865,864 | | | |
Koninklijke Ahold N.V. (Netherlands)1 | | | 2,581,770 | | | | 32,768,859 | | | |
Tesco plc (United Kingdom)1 | | | 9,020,830 | | | | 46,481,478 | | | |
| | | | | | | | | | |
| | | | | | | 115,695,804 | | | |
| | | | | | | | | | |
Food Products - 7.0% | | | | | | | | | | |
Danone (France)1 | | | 684,500 | | | | 48,188,052 | | | |
Nestle S.A. (Switzerland)1 | | | 744,080 | | | | 45,604,125 | | | |
Unilever plc - ADR (United Kingdom) | | | 845,710 | | | | 29,024,767 | | | |
| | | | | | | | | | |
| | | | | | | 122,816,944 | | | |
| | | | | | | | | | |
Household Products - 0.8% | | | | | | | | | | |
Reckitt Benckiser Group plc (United Kingdom)1 | | | 241,860 | | | | 14,079,503 | | | |
| | | | | | | | | | |
The accompanying notes are an integral part of the financial statements.
3
Overseas Series
Investment Portfolio - April 30, 2012
(unaudited)
| | | | | | | | | | |
| | | SHARES | | | VALUE (NOTE 2) | | | |
| | | |
COMMON STOCKS (continued) | | | | | | | | | | |
| | | |
Consumer Staples (continued) | | | | | | | | | | |
Personal Products - 2.2% | | | | | | | | | | |
Beiersdorf AG (Germany)1 | | | 282,850 | | | $ | 19,849,445 | | | |
Natura Cosmeticos S.A. (Brazil) | | | 787,840 | | | | 17,801,468 | | | |
| | | | | | | | | | |
| | | | | | | 37,650,913 | | | |
| | | | | | | | | | |
Total Consumer Staples | | | | | | | 350,318,472 | | | |
| | | | | | | | | | |
Energy - 12.8% | | | | | | | | | | |
Energy Equipment & Services - 6.2% | | | | | | | | | | |
Compagnie Generale de Geophysique - Veritas (CGG - Veritas) (France)*1 | | | 675,400 | | | | 19,368,947 | | | |
Petroleum Geo-Services ASA (Norway)*1 | | | 674,430 | | | | 10,202,624 | | | |
Schlumberger Ltd. (United States) | | | 723,780 | | | | 53,661,049 | | | |
Trican Well Service Ltd. (Canada) | | | 1,710,020 | | | | 24,736,737 | | | |
| | | | | | | | | | |
| | | | | | | 107,969,357 | | | |
| | | | | | | | | | |
Oil, Gas & Consumable Fuels - 6.6% | | | | | | | | | | |
Cameco Corp. (Canada) | | | 1,756,660 | | | | 38,822,186 | | | |
Encana Corp. (Canada) | | | 506,070 | | | | 10,597,106 | | | |
Petroleo Brasileiro S.A. - ADR (Brazil) | | | 809,920 | | | | 17,947,827 | | | |
Talisman Energy, Inc. (Canada) | | | 3,676,470 | | | | 48,084,216 | | | |
| | | | | | | | | | |
| | | | | | | 115,451,335 | | | |
| | | | | | | | | | |
Total Energy | | | | | | | 223,420,692 | | | |
| | | | | | | | | | |
Financials - 7.0% | | | | | | | | | | |
Commercial Banks - 2.6% | | | | | | | | | | |
Banco Santander S.A. (Spain)1 | | | 2,817,879 | | | | 17,692,368 | | | |
HSBC Holdings plc (United Kingdom)1 | | | 3,136,640 | | | | 28,315,039 | | | |
| | | | | | | | | | |
| | | | | | | 46,007,407 | | | |
| | | | | | | | | | |
Diversified Financial Services - 2.5% | | | | | | | | | | |
Deutsche Boerse AG (Germany)1 | | | 706,450 | | | | 44,357,125 | | | |
| | | | | | | | | | |
Insurance - 1.1% | | | | | | | | | | |
Mapfre S.A. (Spain)1 | | | 6,451,600 | | | | 18,676,736 | | | |
| | | | | | | | | | |
Real Estate Investment Trusts (REITS) - 0.8% | | | | | | | | | | |
Land Securities Group plc (United Kingdom)1 | | | 1,215,450 | | | | 14,353,651 | | | |
| | | | | | | | | | |
Total Financials | | | | | | | 123,394,919 | | | |
| | | | | | | | | | |
Health Care - 10.1% | | | | | | | | | | |
Health Care Equipment & Supplies - 1.9% | | | | | | | | | | |
Mindray Medical International Ltd. - ADR (China) | | | 704,180 | | | | 23,068,937 | | | |
Straumann Holding AG (Switzerland)1 | | | 57,570 | | | | 9,566,216 | | | |
| | | | | | | | | | |
| | | | | | | 32,635,153 | | | |
| | | | | | | | | | |
Health Care Providers & Services - 3.5% | | | | | | | | | | |
Life Healthcare Group Holdings Ltd. (South Africa)1 | | | 2,854,910 | | | | 9,877,457 | | | |
The accompanying notes are an integral part of the financial statements.
4
Overseas Series
Investment Portfolio - April 30, 2012
(unaudited)
| | | | | | | | | | |
| | | SHARES | | | VALUE (NOTE 2) | | | |
| | | |
COMMON STOCKS (continued) | | | | | | | | | | |
| | | |
Health Care (continued) | | | | | | | | | | |
Health Care Providers & Services (continued) | | | | | | | | | | |
Sonic Healthcare Ltd. (Australia)1 | | | 3,966,430 | | | $ | 51,887,420 | | | |
| | | | | | | | | | |
| | | | | | | 61,764,877 | | | |
| | | | | | | | | | |
Life Sciences Tools & Services - 3.6% | | | | | | | | | | |
Lonza Group AG (Switzerland)1 | | | 831,070 | | | | 37,499,001 | | | |
QIAGEN N.V. (Netherlands)*1 | | | 1,189,700 | | | | 19,671,129 | | | |
WuXi PharmaTech (Cayman), Inc. - ADR (China)* | | | 435,490 | | | | 6,262,346 | | | |
| | | | | | | | | | |
| | | | | | | 63,432,476 | | | |
| | | | | | | | | | |
Pharmaceuticals - 1.1% | | | | | | | | | | |
Dr. Reddy’s Laboratories Ltd. - ADR (India) | | | 162,180 | | | | 5,486,549 | | | |
Santen Pharmaceutical Co. Ltd. (Japan)1 | | | 337,000 | | | | 14,103,097 | | | |
| | | | | | | | | | |
| | | | | | | 19,589,646 | | | |
| | | | | | | | | | |
Total Health Care | | | | | | | 177,422,152 | | | |
| | | | | | | | | | |
Industrials - 12.1% | | | | | | | | | | |
Aerospace & Defense - 1.0% | | | | | | | | | | |
European Aeronautic Defence and Space Co. N.V. (Netherlands)1 | | | 457,720 | | | | 18,088,433 | | | |
| | | | | | | | | | |
Air Freight & Logistics - 0.4% | | | | | | | | | | |
PostNL N.V. (Netherlands)1 | | | 1,698,280 | | | | 7,390,083 | | | |
| | | | | | | | | | |
Airlines - 3.5% | | | | | | | | | | |
Ryanair Holdings plc - ADR (Ireland)* | | | 1,813,710 | | | | 61,067,616 | | | |
| | | | | | | | | | |
Commercial Services & Supplies - 0.9% | | | | | | | | | | |
Edenred (France)1 | | | 517,510 | | | | 16,533,132 | | | |
| | | | | | | | | | |
Electrical Equipment - 1.3% | | | | | | | | | | |
Nexans S.A. (France)1 | | | 258,000 | | | | 12,930,680 | | | |
Prysmian S.p.A. (Italy)1 | | | 560,310 | | | | 9,126,811 | | | |
| | | | | | | | | | |
| | | | | | | 22,057,491 | | | |
| | | | | | | | | | |
Industrial Conglomerates - 1.1% | | | | | | | | | | |
Siemens AG (Germany)1 | | | 198,450 | | | | 18,420,163 | | | |
| | | | | | | | | | |
Machinery - 0.4% | | | | | | | | | | |
Westport Innovations, Inc. - ADR (Canada)* | | | 227,170 | | | | 7,110,421 | | | |
| | | | | | | | | | |
Marine - 1.0% | | | | | | | | | | |
D/S Norden (Denmark)1 | | | 98,250 | | | | 2,788,455 | | | |
Diana Shipping, Inc. - ADR (Greece)* | | | 347,880 | | | | 2,734,337 | | | |
Mitsui OSK Lines Ltd. (Japan)1 | | | 1,148,000 | | | | 4,449,549 | | | |
Nippon Yusen Kabushiki Kaisha (Japan)1 | | | 1,542,000 | | | | 4,558,207 | | | |
Pacific Basin Shipping Ltd. (Bermuda)1,2 | | | 5,053,000 | | | | 2,644,283 | | | |
| | | | | | | | | | |
| | | | | | | 17,174,831 | | | |
| | | | | | | | | | |
Professional Services - 1.6% | | | | | | | | | | |
Adecco S.A. (Switzerland)1 | | | 267,360 | | | | 13,042,711 | | | |
The accompanying notes are an integral part of the financial statements.
5
Overseas Series
Investment Portfolio - April 30, 2012
(unaudited)
| | | | | | | | | | |
| | | SHARES | | | VALUE (NOTE 2) | | | |
| | | |
COMMON STOCKS (continued) | | | | | | | | | | |
| | | |
Industrials (continued) | | | | | | | | | | |
Professional Services (continued) | | | | | | | | | | |
Randstad Holding N.V. (Netherlands)1 | | | 405,780 | | | $ | 14,057,706 | | | |
| | | | | | | | | | |
| | | | | | | 27,100,417 | | | |
| | | | | | | | | | |
Road & Rail - 0.4% | | | | | | | | | | |
All America Latina Logistica S.A. (Brazil) | | | 1,587,700 | | | | 7,188,233 | | | |
| | | | | | | | | | |
Transportation Infrastructure - 0.5% | | | | | | | | | | |
Groupe Eurotunnel S.A. (France)1 | | | 1,136,550 | | | | 9,562,483 | | | |
| | | | | | | | | | |
Total Industrials | | | | | | | 211,693,303 | | | |
| | | | | | | | | | |
Information Technology - 9.9% | | | | | | | | | | |
Communications Equipment - 1.0% | | | | | | | | | | |
Alcatel-Lucent - ADR (France)* | | | 11,573,700 | | | | 17,476,287 | | | |
| | | | | | | | | | |
Electronic Equipment, Instruments & Components - 1.1% | | | | | | | | | | |
Nippon Electric Glass Co. Ltd. (Japan)1 | | | 2,265,500 | | | | 18,304,710 | | | |
| | | | | | | | | | |
Internet Software & Services - 1.5% | | | | | | | | | | |
Tencent Holdings Ltd. (China)1 | | | 836,300 | | | | 26,162,646 | | | |
| | | | | | | | | | |
IT Services - 4.6% | | | | | | | | | | |
Amadeus IT Holding S.A. - Class A (Spain)1 | | | 740,910 | | | | 15,167,796 | | | |
Amdocs Ltd. - ADR (Guernsey)* | | | 1,469,671 | | | | 47,029,472 | | | |
Cap Gemini S.A. (France)1 | | | 482,970 | | | | 18,868,312 | | | |
| | | | | | | | | | |
| | | | | | | 81,065,580 | | | |
| | | | | | | | | | |
Semiconductors & Semiconductor Equipment - 1.7% | | | | | | | | | | |
Sumco Corp. (Japan)*1 | | | 1,002,000 | | | | 10,636,904 | | | |
Tokyo Electron Ltd. (Japan)1 | | | 339,380 | | | | 18,807,110 | | | |
| | | | | | | | | | |
| | | | | | | 29,444,014 | | | |
| | | | | | | | | | |
Total Information Technology | | | | | | | 172,453,237 | | | |
| | | | | | | | | | |
Materials - 7.9% | | | | | | | | | | |
Chemicals - 4.7% | | | | | | | | | | |
Chr. Hansen Holding A/S (Denmark)1 | | | 231,570 | | | | 6,425,631 | | | |
Johnson Matthey plc (United Kingdom)1 | | | 741,300 | | | | 27,836,899 | | | |
Shin-Etsu Chemical Co. Ltd. (Japan)1 | | | 163,400 | | | | 9,431,407 | | | |
Syngenta AG (Switzerland)1 | | | 108,510 | | | | 38,051,926 | | | |
| | | | | | | | | | |
| | | | | | | 81,745,863 | | | |
| | | | | | | | | | |
Construction Materials - 2.1% | | | | | | | | | | |
CRH plc (Ireland)1 | | | 919,570 | | | | 18,639,868 | | | |
Holcim Ltd. (Switzerland)1 | | | 307,900 | | | | 19,204,403 | | | |
| | | | | | | | | | |
| | | | | | | 37,844,271 | | | |
| | | | | | | | | | |
Metals & Mining - 1.1% | | | | | | | | | | |
Alumina Ltd. (Australia)1 | | | 7,605,880 | | | | 9,084,904 | | | |
Norsk Hydro ASA (Norway)1 | | | 1,730,350 | | | | 8,437,569 | | | |
The accompanying notes are an integral part of the financial statements.
6
Overseas Series
Investment Portfolio - April 30, 2012
(unaudited)
| | | | | | | | | | |
| | | SHARES | | | VALUE (NOTE 2) | | | |
| | | |
COMMON STOCKS (continued) | | | | | | | | | | |
| | | |
Materials (continued) | | | | | | | | | | |
Metals & Mining (continued) | | | | | | | | | | |
Umicore S.A. (Belgium)1 | | | 32,650 | | | $ | 1,773,014 | | | |
| | | | | | | | | | |
| | | | | | | 19,295,487 | | | |
| | | | | | | | | | |
Total Materials | | | | | | | 138,885,621 | | | |
| | | | | | | | | | |
Telecommunication Services - 2.1% | | | | | | | | | | |
Diversified Telecommunication Services - 2.1% | | | | | | | | | | |
Telenor ASA (Norway)1 | | | 2,035,830 | | | | 37,421,425 | | | |
| | | | | | | | | | |
TOTAL COMMON STOCKS
(Identified Cost $1,646,795,341) | | | | | | | 1,635,495,764 | | | |
| | | | | | | | | | |
SHORT-TERM INVESTMENTS - 7.9% | | | | | | | | | | |
| | | |
Dreyfus Cash Management, Inc. - Institutional Shares3, 0.06% | | | | | | | | | | |
(Identified Cost $138,537,719) | | | 138,537,719 | | | | 138,537,719 | | | |
| | | | | | | | | | |
TOTAL INVESTMENTS - 101.3%
(Identified Cost $1,785,333,060) | | | | | | | 1,774,033,483 | | | |
LIABILITIES, LESS OTHER ASSETS - (1.3%) | | | | | | | (22,465,040 | ) | | |
| | | | | | | | | | |
NET ASSETS - 100% | | | | | | $ | 1,751,568,443 | | | |
| | | | | | | | | | |
ADR - American Depository Receipt
*Non-income producing security
1 A factor from a third party vendor was applied to determine the security’s fair value following the close of local trading.
2 Traded on Hong Kong exchange.
3 Rate shown is the current yield as of April 30, 2012.
The Series’ portfolio holds, as a percentage of net assets, greater than 10% in the following countries:
France - 13.6%; United Kingdom - 12.7%.
The accompanying notes are an integral part of the financial statements.
7
Overseas Series
Statement of Assets & Liabilities
April 30, 2012 (unaudited)
| | | | |
ASSETS: | | | | |
| |
Investments, at value (identified cost $1,785,333,060) (Note 2) | | $ | 1,774,033,483 | |
Foreign currency (identified cost $16,922,504) | | | 16,923,838 | |
Cash | | | 840,221 | |
Dividends receivable | | | 9,653,355 | |
Foreign tax reclaims receivable | | | 1,839,537 | |
Receivable for fund shares sold | | | 1,135,591 | |
| | | | |
| |
TOTAL ASSETS | | | 1,804,426,025 | |
| | | | |
| |
LIABILITIES: | | | | |
| |
Accrued management fees (Note 3) | | | 985,888 | |
Accrued fund accounting and administration fees (Note 3) | | | 60,369 | |
Accrued directors’ fees (Note 3) | | | 465 | |
Accrued Chief Compliance Officer service fees (Note 3) | | | 415 | |
Accrued transfer agent fees (Note 3) | | | 178 | |
Payable for securities purchased | | | 50,751,302 | |
Payable for fund shares repurchased | | | 988,277 | |
Other payables and accrued expenses | | | 70,688 | |
| | | | |
| |
TOTAL LIABILITIES | | | 52,857,582 | |
| | | | |
| |
TOTAL NET ASSETS | | $ | 1,751,568,443 | |
| | | | |
| |
NET ASSETS CONSIST OF: | | | | |
| |
Capital stock | | $ | 779,978 | |
Additional paid-in-capital | | | 1,783,256,373 | |
Undistributed net investment income | | | 13,459,649 | |
Accumulated net realized loss on investments, foreign currency and translation of other assets and liabilities | | | (34,743,569 | ) |
Net unrealized depreciation on investments, foreign currency and translation of other assets and liabilities | | | (11,183,988 | ) |
| | | | |
| |
TOTAL NET ASSETS | | $ | 1,751,568,443 | |
| | | | |
| |
NET ASSET VALUE, OFFERING PRICE AND REDEMPTION PRICE PER SHARE - Class A ($1,751,568,443/77,997,769 shares) | | $ | 22.46 | |
| | | | |
The accompanying notes are an integral part of the financial statements.
8
Overseas Series
Statement of Operations
For the Six Months Ended April 30, 2012 (unaudited)
| | | | |
INVESTMENT INCOME: | | | | |
Dividends (net of foreign taxes withheld, $2,193,070) | | $ | 19,342,122 | |
| | | | |
| |
EXPENSES: | | | | |
| |
Management fees (Note 3) | | | 5,415,914 | |
Fund accounting and administration fees (Note 3) | | | 114,768 | |
Directors’ fees (Note 3) | | | 15,297 | |
Transfer agent fees (Note 3) | | | 2,293 | |
Chief Compliance Officer service fees (Note 3) | | | 1,246 | |
Custodian fees | | | 129,283 | |
Miscellaneous | | | 100,591 | |
| | | | |
| |
Total Expenses | | | 5,779,392 | |
| | | | |
| |
NET INVESTMENT INCOME | | | 13,562,730 | |
| | | | |
| |
REALIZED AND UNREALIZED GAIN (LOSS) ON INVESTMENTS AND FOREIGN CURRENCY: | | | | |
| |
Net realized gain (loss) on- | | | | |
Investments | | | (25,223,820 | ) |
Foreign currency and translation of other assets and liabilities (net of Brazilian tax of $54,086) | | | (564,272 | ) |
| | | | |
| |
| | | (25,788,092 | ) |
| | | | |
| |
Net change in unrealized appreciation (depreciation) on- | | | | |
Investments | | | 89,598,014 | |
Foreign currency and translation of other assets and liabilities | | | 156,251 | |
| | | | |
| |
| | | 89,754,265 | |
| | | | |
| |
NET REALIZED AND UNREALIZED GAIN (LOSS) ON INVESTMENTS AND FOREIGN CURRENCY | | | 63,966,173 | |
| | | | |
| |
NET INCREASE IN NET ASSETS RESULTING FROM OPERATIONS | | $ | 77,528,903 | |
| | | | |
The accompanying notes are an integral part of the financial statements.
9
Overseas Series
Statements of Changes in Net Assets
| | | | | | | | |
| | | FOR THE SIX
MONTHS ENDED
4/30/12
(UNAUDITED) | | | FOR THE YEAR ENDED
10/31/11 | |
INCREASE (DECREASE) IN NET ASSETS: | | | | | | | | |
| | |
OPERATIONS: | | | | | | | | |
| | |
Net investment income | | $ | 13,562,730 | | | $ | 34,731,762 | |
Net realized gain (loss) on investments and foreign currency | | | (25,788,092 | ) | | | 33,909,582 | |
Net change in unrealized appreciation (depreciation) on investments and foreign currency | | | 89,754,265 | | | | (166,547,551 | ) |
| | | | | | | | |
| | |
Net increase (decrease) from operations | | | 77,528,903 | | | | (97,906,207 | ) |
| | | | | | | | |
| | |
DISTRIBUTIONS TO SHAREHOLDERS (Note 8): | | | | | | | | |
| | |
From net investment income | | | (35,331,200 | ) | | | (9,601,100 | ) |
From net realized gain on investments | | | (34,111,953 | ) | | | (31,173 | ) |
| | | | | | | | |
| | |
Total distributions to shareholders | | | (69,443,153 | ) | | | (9,632,273 | ) |
| | | | | | | | |
| | |
CAPITAL STOCK ISSUED AND REPURCHASED: | | | | | | | | |
| | |
Net increase from capital share transactions (Note 5) | | | 407,295,383 | | | | 525,453,301 | |
| | | | | | | | |
| | |
Net increase in net assets | | | 415,381,133 | | | | 417,914,821 | |
| | |
NET ASSETS: | | | | | | | | |
| | |
Beginning of period | | | 1,336,187,310 | | | | 918,272,489 | |
| | | | | | | | |
| | |
End of period (including undistributed net investment income of $13,459,649 and $35,228,119, respectively) | | $ | 1,751,568,443 | | | $ | 1,336,187,310 | |
| | | | | | | | |
The accompanying notes are an integral part of the financial statements.
10
Overseas Series
Financial Highlights
| | | | | | | | | | | | | | | | | | | | | | | | |
| | | FOR THE SIX MONTHS ENDED | | | FOR THE YEARS ENDED | |
| | | 4/30/12
(UNAUDITED) | | | 10/31/11 | | | 10/31/10 | | | 10/31/09 | | | 10/31/08 | | | 10/31/07 | |
Per share data (for a share outstanding throughout each period): | | | | | | | | | | | | | | | | | | | | | | | | |
Net asset value - Beginning of period | | $ | 22.63 | | | $ | 24.22 | | | $ | 21.68 | | | $ | 17.78 | | | $ | 33.55 | | | $ | 26.69 | |
| | | | | | | | | | | | | | | | | | | | | | | | |
Income (loss) from investment operations: | | | | | | | | | | | | | | | | | | | | | | | | |
Net investment income | | | 0.19 | 1 | | | 0.75 | 1 | | | 0.32 | 1 | | | 0.36 | 1 | | | 0.34 | | | | 0.40 | 1 |
Net realized and unrealized gain (loss) on investments | | | 0.67 | | | | (2.09 | ) | | | 2.41 | | | | 4.35 | | | | (13.17 | ) | | | 7.16 | |
| | | | | | | | | | | | | | | | | | | | | | | | |
| | | | | | |
Total from investment operations | | | 0.86 | | | | (1.34 | ) | | | 2.73 | | | | 4.71 | | | | (12.83 | ) | | | 7.56 | |
| | | | | | | | | | | | | | | | | | | | | | | | |
| | | | | | |
Less distributions to shareholders: | | | | | | | | | | | | | | | | | | | | | | | | |
From net investment income | | | (0.52 | ) | | | (0.25 | ) | | | (0.19 | ) | | | (0.42 | ) | | | (0.29 | ) | | | (0.17 | ) |
From net realized gain on investments | | | (0.51 | ) | | | — | 2 | | | — | | | | (0.39 | ) | | | (2.65 | ) | | | (0.53 | ) |
| | | | | | | | | | | | | | | | | | | | | | | | |
| | | | | | |
Total distributions to shareholders | | | (1.03 | ) | | | (0.25 | ) | | | (0.19 | ) | | | (0.81 | ) | | | (2.94 | ) | | | (0.70 | ) |
| | | | | | | | | | | | | | | | | | | | | | | | |
| | | | | | |
Net asset value - End of period | | $ | 22.46 | | | $ | 22.63 | | | $ | 24.22 | | | $ | 21.68 | | | $ | 17.78 | | | $ | 33.55 | |
| | | | | | | | | | | | | | | | | | | | | | | | |
| | | | | | |
Net assets - End of period(000’s omitted) | | $ | 1,751,568 | | | $ | 1,336,187 | | | $ | 918,272 | | | $ | 448,441 | | | $ | 174,371 | | | $ | 216,637 | |
| | | | | | | | | | | | | | | | | | | | | | | | |
| | | | | | |
Total return3 | | | 4.56 | % | | | (5.61 | %) | | | 12.68 | % | | | 28.10 | % | | | (41.58 | %) | | | 28.88 | % |
Ratios (to average net assets)/Supplemental Data: | | | | | | | | | | | | | | | | | | | | | | | | |
Expenses* | | | 0.75 | %4 | | | 0.75 | % | | | 0.75 | % | | | 0.75 | % | | | 0.80 | % | | | 0.84 | % |
Net investment income | | | 1.75 | %4 | | | 3.04 | % | | | 1.42 | % | | | 1.97 | % | | | 1.48 | % | | | 1.34 | % |
Portfolio turnover | | | 25 | % | | | 37 | % | | | 36 | % | | | 49 | % | | | 43 | % | | | 54 | % |
|
| *For certain periods presented, the investment advisor did not impose all or a portion of its management fees and/or other fees. If these expenses had been incurred by the Series, the expense ratio (to average net assets) would have increased by the following amount: | |
| | | | | | |
| | | N/A | | | | 0.01 | % | | | 0.01 | % | | | 0.05 | % | | | 0.03 | % | | | N/A | |
1Calculated based on average shares outstanding during the periods.
2Less than $0.01 per share.
3Represents aggregate total return for the periods indicated, and assumes reinvestment of all distributions. Total return would have been lower had certain expenses not been waived or reimbursed during certain periods. Periods less than one year are not annualized.
4Annualized.
The accompanying notes are an integral part of the financial statements.
11
Overseas Series
Notes to Financial Statements
(unaudited)
Overseas Series (the “Series”) is a no-load diversified series of Manning & Napier Fund, Inc. (the “Fund”). The Fund is organized in Maryland and is registered under the Investment Company Act of 1940, as amended, as an open-end management investment company.
The Series’ investment objective is to provide long-term growth by investing primarily in common stocks of issuers from outside the United States.
The Fund’s Advisor is Manning & Napier Advisors, LLC (the “Advisor”). Shares of the Series are offered to investors, clients and employees of the Advisor and its affiliates. The total authorized capital stock of the Fund consists of 15 billion shares of common stock each having a par value of $0.01. As of April 30, 2012, 9.8 billion shares have been designated in total among 41 series, of which 200 million have been designated as Overseas Series Class A common stock.
| 2. | Significant Accounting Policies |
Security Valuation
Portfolio securities, including domestic equities, foreign equities, warrants and options, listed on an exchange other than the NASDAQ National Market System are valued at the latest quoted sales price of the exchange on which the security is primarily traded. Securities not traded on valuation date or securities not listed on an exchange are valued at the latest quoted bid price provided by the Fund’s pricing service. Securities listed on the NASDAQ National Market System are valued in accordance with the NASDAQ Official Closing Price.
Short-term investments that mature in sixty days or less are valued at amortized cost, which approximates fair value. Investments in open-end investment companies are valued at their net asset value per share on valuation date.
Volume and level of activity in established markets for an asset or liability are evaluated to determine whether recent transactions and quoted prices are determinative of fair value. Where there have been significant decreases in volume and level of activity, further analysis and adjustment may be necessary to estimate fair value. The Series measures fair value in these instances by the use of inputs and valuation techniques which may be based upon current market prices of securities that are comparable in coupon, rating, maturity and industry and/or expectation of future cash flows. As a result of trading in relatively thin markets and/or markets that experience significant volatility, the prices used by the Series to value these securities may differ from the value that would be realized if these securities were sold, and the differences could be material.
Securities for which representative valuations or prices are not available from the Series’ pricing service may be valued at fair value as determined in good faith by the Advisor under procedures approved by and under the general supervision and responsibility of the Fund’s Board of Directors (the “Board”). Due to the inherent uncertainty of valuations of such securities, the fair value may differ significantly from the values that would have been used had a ready market for such securities existed. If trading or events occurring after the close of the principal market in which securities are traded are expected to materially affect the value of those securities, then they may be valued at their fair value, taking this trading or these events into account. In accordance with the procedures approved by the Board, the values of certain securities trading outside the U.S. were adjusted following the close of local trading using a factor from a third party vendor. The third party vendor uses statistical analyses and quantitative models, which consider among other things subsequent movement and changes in the prices of indices, securities and exchange rates in other markets, to determine the factors which are used to adjust local market prices. The value of securities used for net asset value calculation under these procedures may differ from published prices for the same securities. It is the Fund’s policy to classify each foreign equity security where a factor from a third party vendor is provided as a Level 2 security.
Various inputs are used in determining the value of the Series’ assets or liabilities carried at fair value. These inputs are summarized in three broad levels. Level 1 includes quoted prices in active markets for identical assets and liabilities. Level 2 includes other significant observable inputs (including quoted prices for similar securities, interest rates, prepayment speeds, credit risk, etc.). Level 3 includes significant unobservable inputs (including the Series’ own assumptions in determining the fair value of investments). A financial instrument’s level within the fair value hierarchy is based on the lowest level of any input both
12
Overseas Series
Notes to Financial Statements (continued)
(unaudited)
| 2. | Significant Accounting Policies (continued) |
Security Valuation (continued)
individually and in aggregate that is significant to the fair value measurement. The inputs or methodology used for valuing securities are not necessarily an indication of the risk associated with investing in those securities.
The following is a summary of the valuation levels used for major security types as of April 30, 2012 in valuing the Series’ assets or liabilities carried at fair value:
| | | | | | | | | | | | | | | | |
| DESCRIPTION | | TOTAL | | | LEVEL 1 | | | LEVEL 2 | | | LEVEL 3 | |
Assets: | | | | | | | | | | | | | | | | |
Equity Securities*: | | | | | | | | | | | | | | | | |
Consumer Discretionary | | $ | 200,485,943 | | | $ | 43,173,641 | | | $ | 157,312,302 | | | $ | — | |
Consumer Staples | | | 350,318,472 | | | | 46,826,235 | | | | 303,492,237 | | | | — | |
Energy | | | 223,420,692 | | | | 193,849,121 | | | | 29,571,571 | | | | — | |
Financials | | | 123,394,919 | | | | — | | | | 123,394,919 | | | | — | |
Health Care | | | 177,422,152 | | | | 34,817,832 | | | | 142,604,320 | | | | — | |
Industrials | | | 211,693,303 | | | | 78,100,607 | | | | 133,592,696 | | | | — | |
Information Technology | | | 172,453,237 | | | | 64,505,759 | | | | 107,947,478 | | | | — | |
Materials | | | 138,885,621 | | | | — | | | | 138,885,621 | | | | — | |
Telecommunication Services | | | 37,421,425 | | | | — | | | | 37,421,425 | | | | — | |
Mutual Funds | | | 138,537,719 | | | | 138,537,719 | | | | — | | | | — | |
| | | | | | | | | | | | | | | | |
Total assets | | $ | 1,774,033,483 | | | $ | 599,810,914 | | | $ | 1,174,222,569 | | | $ | — | |
| | | | | | | | | | | | | | | | |
*Includes common stock, warrants and rights. Please see the Investment Portfolio for foreign securities where a factor from a third party vendor was applied to determine the security’s fair value following the close of local trading. Such securities are included in Level 2 in the table above.
There were no Level 3 securities held by the Series as of October 31, 2011 or April 30, 2012.
The Fund’s policy is to recognize transfers in and transfers out of the valuation levels as of the beginning of the reporting period. There were no transfers between Level 1 and Level 2 during the six months ended April 30, 2012.
Recent Accounting Standard
In May 2011, the Financial Accounting Standards Board (“FASB”) issued Accounting Standards Update No. 2011-04, “Fair Value Measurements (Topic 820) - Amendments to Achieve Common Fair Value Measurement and Disclosure Requirements in U.S. GAAP and IFRSs” (“ASU 2011-04”). ASU 2011-04 clarifies the application of existing fair value measurement requirements, changes certain principles related to measuring fair value, and requires additional disclosures about fair value measurements.
Required disclosures are expanded under the new guidance, especially for fair value measurements that are categorized within Level 3 of the fair value hierarchy, for which quantitative information about the unobservable inputs used, and a narrative description of the valuation processes in place and sensitivity of recurring Level 3 measurements to changes in unobservable inputs will be required.
ASU 2011-04 is effective for interim and annual periods beginning after December 15, 2011 and is to be applied prospectively. Management is currently assessing the impact of this guidance, but does not expect it to have a material impact on the Series’ financial statements.
Security Transactions, Investment Income and Expenses
Security transactions are accounted for on trade date. Dividend income is recorded on the ex-dividend date, except that if the ex-dividend date has passed, certain dividends from foreign securities are recorded as soon as the Series is informed of the
13
Overseas Series
Notes to Financial Statements (continued)
(unaudited)
| 2. | Significant Accounting Policies (continued) |
Security Transactions, Investment Income and Expenses (continued)
ex-dividend date. Non-cash dividends, if any, are recorded at the fair value of the securities received. Interest income, including amortization of premium and accretion of discounts using the effective interest method, is earned from settlement date and accrued daily.
Expenses are recorded on an accrual basis. Most expenses of the Fund can be attributed to a specific series. Expenses which cannot be directly attributed are apportioned among the series in the Fund in such a manner as deemed equitable by the Fund’s Board, taking into consideration, among other things, the nature and type of expense.
The Series uses the identified cost method for determining realized gain or loss on investments for both financial statement and federal income tax reporting purposes.
Foreign Currency Translation
The books and records of the Series are maintained in U.S. dollars. Foreign currencies, investments and other assets and liabilities are translated into U.S. dollars at the current exchange rates. Purchases and sales of investment securities and income and expenses are translated on the respective dates of such transactions. The Series does not isolate realized and unrealized gains and losses attributable to changes in the exchange rates from gains and losses that arise from changes in the fair value of investments. Such fluctuations are included with net realized and unrealized gain or loss on investments. Net realized foreign currency gains and losses represent foreign currency gains and losses between trade date and settlement date on securities transactions, gains and losses on disposition of foreign currencies and the difference between the amount of income and foreign withholding taxes recorded on the books of the Series and the amounts actually received or paid.
Federal Taxes
The Series’ policy is to comply with the provisions of the Internal Revenue Code applicable to regulated investment companies. The Series is not subject to federal income tax or excise tax to the extent that the Series distributes to shareholders each year its taxable income, including any net realized gains on investments, in accordance with requirements of the Internal Revenue Code. Accordingly, no provision for federal income tax or excise tax has been made in the financial statements.
Management evaluates its tax positions to determine if the tax positions taken meet the minimum recognition threshold in connection with accounting for uncertainties in income tax positions taken or expected to be taken for the purposes of measuring and recognizing tax liabilities in the financial statements. Recognition of tax benefits of an uncertain tax position is required only when the position is “more likely than not” to be sustained assuming examination by taxing authorities. At April 30, 2012, the Series has recorded no liability for net unrecognized tax benefits relating to uncertain income tax positions taken or expected to be taken in future tax returns.
The Series files income tax returns in the U.S. federal jurisdiction, various states and foreign jurisdictions, as required. No income tax returns are currently under investigation. The statute of limitations on the Series’ tax returns remains open for the years ended October 31, 2008 through October 31, 2011. The Series is not aware of any tax positions for which it is reasonably possible that the total amounts of unrecognized tax benefits will significantly change in the next twelve months.
Foreign Taxes
Based on the Series’ understanding of the tax rules and rates related to income, gains and currency purchase/repatriation transactions for foreign jurisdictions in which it invests, the Series will provide for foreign taxes, and where appropriate, deferred foreign tax.
Distributions of Income and Gains
Distributions to shareholders of net investment income and net realized gains are made annually. An additional distribution may be necessary to avoid taxation of the Series. Distributions are recorded on the ex-dividend date.
Indemnifications
The Fund’s organizational documents provide former and current directors and officers with a limited indemnification against liabilities arising in connection with the performance of their duties to the Fund. In the normal course of business, the Fund may
14
Overseas Series
Notes to Financial Statements (continued)
(unaudited)
| 2. | Significant Accounting Policies (continued) |
Indemnifications (continued)
also enter into contracts that provide general indemnifications. The Fund’s maximum exposure under these arrangements is unknown as this would be dependent on future claims that may be made against the Fund. The risk of material loss from such claims is considered remote.
Other
The preparation of financial statements in conformity with accounting principles generally accepted in the United States of America requires management to make estimates and assumptions that affect the reported amounts of assets and liabilities and the disclosure of contingent assets and liabilities at the date of the financial statements and the reported amounts of income and expenses during the reporting period. Actual results could differ from those estimates.
| 3. | Transactions with Affiliates |
The Fund has an Investment Advisory Agreement (the “Agreement”) with the Advisor, for which the Series pays a fee, computed daily and payable monthly, at an annual rate of 0.70% of the Series’ average daily net assets.
Under the Agreement, personnel of the Advisor provide the Series with advice and assistance in the choice of investments and the execution of securities transactions, and otherwise maintain the Series’ organization. The Advisor also provides the Fund with necessary office space and fund administration and support services. The salaries of all officers of the Fund (except a percentage of the Fund’s Chief Compliance Officer’s salary, which is paid by the Fund), and of all Directors who are “affiliated persons” of the Fund, or of the Advisor, and all personnel of the Fund, or of the Advisor, performing services relating to research, statistical and investment activities, are paid by the Advisor. Each “non-affiliated” Director receives an annual stipend, which is allocated among all the active series of the Fund. In addition, these Directors also receive a fee per Board meeting attended plus a fee for each committee meeting attended.
The Advisor has contractually agreed, until at least February 28, 2013, to waive its fee and, if necessary, pay other operating expenses of the Series in order to maintain total direct annual fund operating expenses for the Series at no more than 0.75% of average daily net assets each year. For the six months ended April 30, 2012, the Advisor did not waive fees or reimburse expenses for the Series. The Advisor is not eligible to recoup any expenses that have been waived or reimbursed in prior years.
Manning & Napier Investor Services, Inc., a registered broker-dealer affiliate of the Advisor, acts as distributor for the Fund’s shares. The services of Manning & Napier Investor Services, Inc. are provided at no additional cost to the Series.
The Advisor has agreements with BNY Mellon Investment Servicing (U.S.) Inc. (“BNY”) under which BNY serves as sub-accountant services agent and sub-transfer agent. The Fund pays the Advisor an annual fee related to fund accounting and administration of 0.0175% on the first $3 billion of average daily net assets (excluding Target Series); 0.015% on the next $3 billion of average daily net assets (excluding Target Series); and 0.01% of the average daily net assets in excess of $6 billion (excluding Target Series); plus a base fee of $25,500 per series. Transfer Agent fees are charged to the Fund on a per account basis. Additionally, certain transaction and cusip-based fees and out-of-pocket expenses, including charges for reporting relating to the Fund’s compliance program, are charged.
Expenses not directly attributable to a series are allocated based on each series’ relative net assets or number of accounts, depending on the expense.
| 4. | Purchases and Sales of Securities |
For the six months ended April 30, 2012, purchases and sales of securities, other than U.S. Government securities and short-term securities, were $668,262,311 and $360,065,168, respectively. There were no purchases or sales of U.S. Government securities.
15
Overseas Series
Notes to Financial Statements (continued)
(unaudited)
| 5. | Capital Stock Transactions |
Transactions in Class A shares of Overseas Series were:
| | | | | | | | | | | | | | | | |
| | | FOR THE SIX MONTHS ENDED 4/30/12 | | | FOR THE YEAR ENDED 10/31/11 | |
| | | SHARES | | | AMOUNT | | | SHARES | | | AMOUNT | |
Sold | | | 21,349,407 | | | $ | 463,088,130 | | | | 25,644,794 | | | $ | 638,310,503 | |
Reinvested | | | 3,272,558 | | | | 62,996,742 | | | | 347,072 | | | | 8,409,551 | |
Repurchased | | | (5,672,454 | ) | | | (118,789,489 | ) | | | (4,851,651 | ) | | | (121,266,753 | ) |
| | | | | | | | | | | | | | | | |
Total | | | 18,949,511 | | | $ | 407,295,383 | | | | 21,140,215 | | | $ | 525,453,301 | |
| | | | | | | | | | | | | | | | |
At April 30, 2012, the retirement plan of the Advisor and its affiliates owned 186,208 shares of the Series (0.2% of shares outstanding) valued at $4,182,231.
The Series may trade in instruments including written and purchased options, forward foreign currency exchange contracts and futures contracts and other derivatives in the normal course of investing activities to assist in managing exposure to various market risks. The Series may be subject to various elements of risk, which may involve, to a varying degree, elements of risk in excess of the amounts recognized for financial statement purposes. These risks include: the risk that changes in the value of a derivative may not correlate perfectly with the underlying asset, rate or index, counterparty credit risk related to over the counter derivative counterparties’ failure to perform under contract terms, liquidity risk related to the lack of a liquid market for these contracts allowing the fund to close out its position(s) and documentation risk relating to disagreement over contract terms. No such investments were held by the Series as of April 30, 2012.
Investing in securities of foreign companies and foreign governments involves special risks and considerations not typically associated with investing in securities of domestic companies and the U.S. Government. These risks include revaluation of currencies and future adverse political and economic developments. Moreover, securities of foreign companies and foreign governments and their markets may be less liquid and their prices more volatile than those of comparable domestic companies and the U.S. Government.
| 8. | Federal Income Tax Information |
The amount and characterization of certain income and capital gains to be distributed are determined in accordance with federal income tax regulations, which may differ from accounting principles generally accepted in the United States of America. The Series may periodically make reclassifications among its capital accounts to reflect income and gains available for distribution (or available capital loss carryovers) under income tax regulations, without impacting the Series’ net asset value. Any such reclassifications are not reflected in the financial highlights.
The final determination of the tax character of current year distributions will be made at the conclusion of the fiscal year. The tax character of distributions paid for the year ended October 31, 2011, were as follows:
Ordinary income $ 9,632,273
The Regulated Investment Company Modernization Act of 2010 (the “Act”) was enacted on December 22, 2010. The Act made changes to several tax rules including the unlimited carryover of future capital losses, which will retain their character as short-term and/or long-term losses. Prior to the Act, net capital losses incurred by the Series were carried forward for eight years and treated as short-term losses. The Act requires that post-enactment net capital losses be used before pre-enactment net capital losses.
16
Overseas Series
Notes to Financial Statements (continued)
(unaudited)
| 8. | Federal Income Tax Information (continued) |
At April 30, 2012, the identified cost of investments for federal income tax purposes, the resulting gross unrealized appreciation and depreciation, and the net unrealized depreciation were as follows:
| | | | |
Cost for federal income tax purposes | | $ | 1,803,039,579 | |
Unrealized appreciation | | | 119,886,780 | |
Unrealized depreciation | | | (148,892,876 | ) |
| | | | |
Net unrealized depreciation | | $ | (29,006,096 | ) |
| | | | |
17
Overseas Series
Renewal of Investment Advisory Agreement
(unaudited)
At the Manning & Napier Fund, Inc. (the “Fund”) Board of Directors’ (the “Board”) meeting, held on November 18, 2011, the Investment Advisory Agreement (the “Agreement”) between the Fund and Manning & Napier Advisors, LLC (the “Advisor”) was reviewed by the Board for renewal. In connection with the decision whether to renew the Agreement, a variety of material was prepared for and reviewed by the Board.
Representatives of the Advisor attended the meeting and presented additional oral and written information to the Board to assist the Board in its considerations. The discussion immediately below outlines the materials and information presented to the Board in connection with the Board’s 2011 Annual Review of the Agreement and the conclusions made by the Directors when determining to continue the Agreement.
| | • | | The Board considered the services provided by the Advisor under the Agreement including, among others: deciding what securities to purchase and sell for each Series; arranging for the purchase and sale of such securities by placing orders with broker-dealers; administering the affairs of the Fund (including the books and records of the Fund not maintained by third party service providers such as the custodian or sub-transfer agent); arranging for the insurance coverage for the Fund; and supervising the preparation of tax returns, SEC filings (including registration statements) and reports to shareholders for the Fund. The Board also considered the nature and quality of such services provided under the Agreement in light of the Advisor’s services provided to the Fund for 25 years. The Board discussed the quality of these services with representatives from the Advisor and concluded that the Advisor was performing its services to the Fund required under the Agreement in a reasonable manner. |
| | • | | The Board considered the investment performance of the various Series of the Fund. The investment performance for each Series was reviewed on a cumulative basis since inception and on a one year basis. In addition, annualized performance for the following time periods was considered: inception, three year, five year, ten year, and current market cycle. A market cycle includes periods of both rising and falling markets. Returns for established benchmark indices for each Series were provided for each time period. The Board noted that the various Series were competitive against their respective benchmarks and/or peer groups over various time periods, but in particular over the full market cycle period relevant for the Series. In addition, the Board considered at the meeting (and considers on a quarterly basis) a peer group performance analysis consisting of Morningstar universes of mutual funds with similar investment objectives. The Board discussed the performance with representatives from the Advisor and concluded that the investment performance of each of the Fund’s Series was reasonable based on the Fund’s actual performance and comparative performance, especially performance over the current market cycle. |
| | • | | The Board considered the costs of the Advisor’s services and the profits of the Advisor as they relate to the Advisor’s services to the Fund under the Agreement. In reviewing the Advisor’s costs and profits, the Board discussed the Advisor’s revenues generated from the Fund (on both an actual and adjusted basis) and its expenses associated with providing the services under the Agreement. In addition, the Board reviewed the Advisor’s expenses associated with Fund activities outside of the Agreement (such as expense reimbursements pursuant to expense caps and payments made by the Advisor to third party platforms on which shares of the Fund are available for purchase). It was noted by representatives of the Advisor that 10 of the 29 active Series of the Fund are currently experiencing expenses above the capped expense ratios. After discussing the above costs and profits, the Board concluded that the Advisor’s profitability relating to its services provided under the Agreement was reasonable. |
| | • | | The Board considered the fees and expenses of the various Series of the Fund. The Advisor presented the advisory fees and total expenses for each Series, including the advisory fee adjusted for any expense waivers or reimbursements (either contractual or voluntary) paid by the Advisor. The advisory fees and expense ratios of each Series were compared to an average (on both a mean and median basis) of similar funds as disclosed on the Morningstar database. Representatives of the Advisor discussed with the Board the levels of its advisory fee for each Series of the Fund and as compared to the median and mean advisory fees for similar funds as listed on Morningstar. Expense ratios for every Series, except the Pro-Blend Class R and Class C, and Target Class R and Class C (and a few Class K), are currently below the median and mean for similar funds as listed on Morningstar. Based on their review of the information provided, the Board concluded that the fees and expenses of each Series of the Fund were reasonable on a comparative basis. |
18
Overseas Series
Renewal of Investment Advisory Agreement
(unaudited)
| | • | | The Board also considered the other benefits the Advisor derives from its relationship with the Fund. Such other benefits include certain research products provided by soft dollars. Given the level of soft dollar transactions involving the Fund, the Board concluded that these additional benefits to the Advisor were reasonable. |
| | • | | In addition to the factors described above, the Board considered the Advisor’s personnel, investment strategies, policies and procedures relating to compliance with personal securities transactions, and reputation, expertise and resources in domestic and foreign financial markets. The Board concluded that these factors support the conclusion that the Advisor performs its services in a reasonable manner. |
| | • | | The Board did not consider economies of scale at this time because of the multiple uses of the Fund (for the Advisor’s discretionary investment account clients in addition to direct investors), the current profitability of the Advisor’s services to the Fund under the Agreement, and the overall size of the Fund complex. |
Based on the Board’s deliberations and their evaluation of the information described above, the Board, including a majority of Directors that are not “interested persons” as defined in the Investment Company Act of 1940, concluded that the compensation under the Agreement was fair and reasonable in light of the services and expenses and such other matters as the Directors considered to be relevant in the exercise of their reasonable judgment. Accordingly, the Board approved the renewal of the Agreement. In the course of their deliberations, the Directors did not identify any particular information that was all important or controlling.
19
{This page intentionally left blank}
20
Overseas Series
Literature Requests
(unaudited)
Proxy Voting Policies and Procedures
A description of the policies and procedures that the Fund uses to determine how to vote proxies relating to portfolio securities is available, without charge, upon request:
| | | | |
| By phone | | 1-800-466-3863 | | |
| On the Securities and Exchange | | | | |
| Commission’s (SEC) web site | | http://www.sec.gov | | |
Proxy Voting Record
Information regarding how the Fund voted proxies relating to portfolio securities during the most recent 12-month period ended June 30th is available, without charge, upon request:
| | | | |
| By phone | | 1-800-466-3863 | | |
| On the SEC’s web site | | http://www.sec.gov | | |
Quarterly Portfolio Holdings
The Series’ complete schedule of portfolio holdings for the 1st and 3rd quarters of each fiscal year are provided on Form N-Q, and are available, without charge, upon request:
| | | | |
| By phone | | 1-800-466-3863 | | |
| On the SEC’s web site | | http://www.sec.gov | | |
The Series’ Form N-Q may be reviewed and copied at the SEC’s Public Reference Room in Washington, D.C. Information on the operation of the Public Reference Room may be obtained by calling 1-800-SEC-0330.
Prospectus and Statement of Additional Information (SAI)
The prospectus and SAI provide additional information about each Series, including charges, expenses and risks. These documents are available, without charge, upon request:
| | | | |
| By phone | | 1-800-466-3863 | | |
| On the SEC’s web site | | http://www.sec.gov | | |
| On our web site | | http://www.manning-napier.com | | |
Additional information available at www.manning-napier.com
1. Fund Holdings - Month-End
2. Fund Holdings - Quarter-End
3. Shareholder Report - Annual
4. Shareholder Report - Semi-Annual
The Fund also offers electronic notification or “e-delivery” when certain documents are available on-line to be downloaded or reviewed. Direct shareholders can elect to receive electronic notification when shareholder reports, prospectus updates, and/or statements are available. If you do not currently have on-line access to your account, you can establish access by going to www.manning-napier.com, click on “Login” in the top corner of the page, and follow the prompts to self-enroll. Once enrolled, you can set your electronic notification preferences by clicking on the Account Options tab located within the green toolbar and then select E-Delivery Option. Should you have any questions on either how to establish on-line access or how to update your account settings, please contact Investor Services at 1-800-466-3863.
MNOVS-04/12-SAR


| | | | | | |
| | | | PRO-BLEND® CONSERVATIVE TERM SERIES | | |
| | | | PRO-BLEND® MODERATE TERM SERIES | | |
| | | | PRO-BLEND® EXTENDED TERM SERIES | | |
| | | | PRO-BLEND® MAXIMUM TERM SERIES | | |
www.manning-napier.com | | | | 
|
Shareholder Expense Example - Pro-Blend® Conservative Term Series
(unaudited)
As a shareholder of the Series, you may incur two types of costs: (1) transaction costs, including potential wire charges on redemptions and (2) ongoing costs, including management fees and other Series expenses. This example is intended to help you understand your ongoing costs (in dollars) of investing in the Series and to compare these costs with the ongoing costs of investing in other mutual funds.
The example is based on an investment of $1,000 invested at the beginning of the period and held for the entire period (November 1, 2011 to April 30, 2012).
Actual Expenses
The Actual lines of the table below provide information about actual account values and actual expenses. You may use the information in these lines, together with the amount you invested, to estimate the expenses that you paid over the period. Simply divide your account value by $1,000 (for example, an $8,600 account value divided by $1,000 = 8.6), then multiply the result by the number in the Actual line for the Class in which you have invested under the heading entitled “Expenses Paid During Period” to estimate the expenses you paid on your account during this period.
Hypothetical Example for Comparison Purposes
The Hypothetical lines of the table below provide information about hypothetical account values and hypothetical expenses based on the Class’ actual expense ratio and an assumed rate of return of 5% per year before expenses, which is not the Class’ actual return. The hypothetical account values and expenses may not be used to estimate the actual ending account balance or expenses you paid during the period. You may use this information to compare the ongoing costs of investing in the Series and other funds. To do so, compare this 5% hypothetical example for the Class in which you have invested with the 5% hypothetical examples that appear in the shareholder reports of the other funds.
Please note that the expenses shown in the table are meant to highlight your ongoing costs only and do not reflect any transaction costs. Therefore, the Hypothetical lines of the table are useful in comparing ongoing costs only, and will not help you determine the relative total costs of owning different funds. In addition, if these transaction costs were included, your costs would have been higher.
| | | | | | | | |
| | | BEGINNING
ACCOUNT VALUE
11/1/11 | | ENDING
ACCOUNT VALUE
4/30/12 | | EXPENSES PAID
DURING PERIOD
11/1/11-4/30/12* | | ANNUALIZED
EXPENSE RATIO |
Class S | | | | | | | | |
Actual | | $1,000.00 | | $1,040.70 | | $4.41 | | 0.87% |
Hypothetical (5% return before expenses) | | $1,000.00 | | $1,020.54 | | $4.37 | | 0.87% |
Class I | | | | | | | | |
Actual | | $1,000.00 | | $1,042.00 | | $3.40 | | 0.67% |
Hypothetical (5% return before expenses) | | $1,000.00 | | $1,021.53 | | $3.37 | | 0.67% |
Class C | | | | | | | | |
Actual | | $1,000.00 | | $1,037.10 | | $8.46 | | 1.67% |
Hypothetical (5% return before expenses) | | $1,000.00 | | $1,016.56 | | $8.37 | | 1.67% |
Class R | | | | | | | | |
Actual | | $1,000.00 | | $1,039.00 | | $5.93 | | 1.17% |
Hypothetical (5% return before expenses) | | $1,000.00 | | $1,019.05 | | $5.87 | | 1.17% |
*Expenses are equal to the Class’ annualized expense ratio (for the six-month period), multiplied by the average account value over the period, multiplied by 182/366 to reflect the one-half year period.
1
Portfolio Composition - Pro-Blend® Conservative Term Series
As of April 30, 2012 (unaudited)
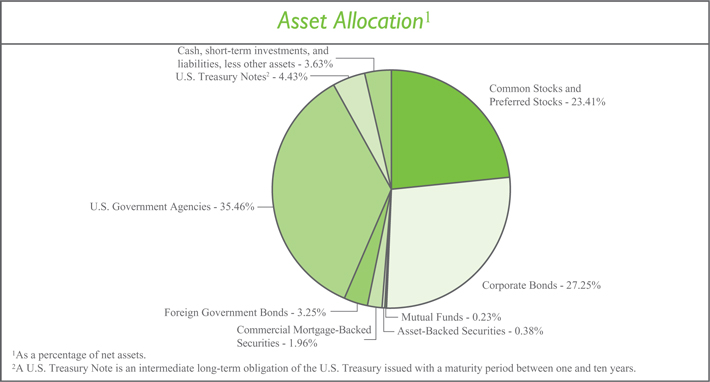
| | | | | | | | | | | | |
| Sector Allocation3 | | | | | Top Five Stock Holdings4 | |
Financials | | | 16.63 | % | | | | Google, Inc. - Class A | | | 0.86 | % |
Consumer Discretionary | | | 8.58 | % | | | | Cerner Corp. | | | 0.83 | % |
Information Technology | | | 5.70 | % | | | | Monsanto Co. | | | 0.79 | % |
Industrials | | | 4.15 | % | | | | Time Warner, Inc. | | | 0.67 | % |
Energy | | | 3.78 | % | | | | EMC Corp. | | | 0.59 | % |
Health Care | | | 3.76 | % | | | | | | | | |
Materials | | | 3.21 | % | | | | | |
Consumer Staples | | | 3.04 | % | | | | | | | | |
Telecommunication Services | | | 0.88 | % | | | | 4As a percentage of total investments. | |
Utilities | | | 0.55 | % | | | | Top Five Bond Holdings5 | |
| | | | | | | | | Fannie Mae, 4.375%, 3/15/2013 | | | 2.67 | % |
| | | | | | Freddie Mac, 0.875%, 10/28/2013 | | | 2.57 | % |
| | | | Freddie Mac, 2.00%, 8/25/2016 | | | 2.46 | % |
| | | | Fannie Mae, 1.375%, 11/15/2016 | | | 2.20 | % |
| | | | | | | | | Fannie Mae, 2.50%, 5/15/2014 | | | 1.87 | % |
| | | | | | | | | | | | | |
| 3Including common stocks, preferred stocks, and corporate bonds, as a percentage of total investments. | | | | | | | | | |
| | | | 5As a percentage of total investments. | | | | |
2
Investment Portfolio - April 30, 2012
(unaudited)
| | | | | | | | |
| PRO-BLEND® CONSERVATIVE TERM SERIES | | SHARES | | | VALUE (NOTE 2) | |
| | |
COMMON STOCKS - 23.17% | | | | | | | | |
| | |
Consumer Discretionary - 4.13% | | | | | | | | |
Auto Components - 0.02% | | | | | | | | |
Hankook Tire Co. Ltd. (South Korea)1 | | | 5,450 | | | $ | 229,912 | |
| | | | | | | | |
Automobiles - 0.28% | | | | | | | | |
Suzuki Motor Corp. (Japan)1 | | | 4,700 | | | | 110,621 | |
Tesla Motors, Inc.* | | | 4,490 | | | | 148,754 | |
Toyota Motor Corp. (Japan)1 | | | 2,600 | | | | 106,542 | |
Toyota Motor Corp. - ADR (Japan) | | | 36,040 | | | | 2,947,351 | |
Yamaha Motor Co. Ltd. (Japan)1 | | | 12,200 | | | | 162,950 | |
| | | | | | | | |
| | | | | | | 3,476,218 | |
| | | | | | | | |
| | |
Distributors - 0.01% | | | | | | | | |
Inchcape plc (United Kingdom)1 | | | 25,370 | | | | 150,725 | |
| | | | | | | | |
Diversified Consumer Services - 0.03% | | | | | | | | |
Anhanguera Educacional Participacoes S.A. (Brazil) | | | 10,310 | | | | 136,410 | |
Capella Education Co.* | | | 3,600 | | | | 117,756 | |
Grand Canyon Education, Inc.* | | | 8,050 | | | | 139,989 | |
| | | | | | | | |
| | | | | | | 394,155 | |
| | | | | | | | |
| | |
Hotels, Restaurants & Leisure - 0.49% | | | | | | | | |
Accor S.A. (France)1 | | | 24,030 | | | | 830,971 | |
Carnival Corp. | | | 139,440 | | | | 4,530,406 | |
Hyatt Hotels Corp. - Class A* | | | 4,520 | | | | 194,496 | |
Intercontinental Hotels Group plc (United Kingdom)1 | | | 15,500 | | | | 369,581 | |
Orient-Express Hotels Ltd. - Class A - ADR (Bermuda) | | | 11,040 | | | | 118,018 | |
TUI Travel plc (United Kingdom)1 | | | 20,420 | | | | 63,324 | |
| | | | | | | | |
| | | | | | | 6,106,796 | |
| | | | | | | | |
| | |
Household Durables - 0.13% | | | | | | | | |
Corporacion Geo S.A.B. de C.V. - Class B (Mexico)* | | | 25,250 | | | | 33,729 | |
DR Horton, Inc. | | | 19,490 | | | | 318,661 | |
Lennar Corp. - Class A | | | 16,150 | | | | 448,001 | |
LG Electronics, Inc. (South Korea)1 | | | 2,150 | | | | 132,653 | |
NVR, Inc.* | | | 360 | | | | 282,218 | |
Rodobens Negocios Imobiliarios S.A. (Brazil) | | | 17,780 | | | | 103,724 | |
Toll Brothers, Inc.* | | | 11,860 | | | | 301,244 | |
| | | | | | | | |
| | | | | | | 1,620,230 | |
| | | | | | | | |
| | |
Internet & Catalog Retail - 0.44% | | | | | | | | |
Amazon.com, Inc.* | | | 22,610 | | | | 5,243,259 | |
Blue Nile, Inc.* | | | 970 | | | | 29,372 | |
Ocado Group plc (United Kingdom)*1 | | | 101,830 | | | | 214,658 | |
| | | | | | | | |
| | | | | | | 5,487,289 | |
| | | | | | | | |
| | |
Media - 2.59% | | | | | | | | |
AMC Networks, Inc. - Class A* | | | 88,520 | | | | 3,762,100 | |
The accompanying notes are an integral part of the financial statements.
3
Investment Portfolio - April 30, 2012
(unaudited)
| | | | | | | | |
| PRO-BLEND® CONSERVATIVE TERM SERIES | | SHARES | | | VALUE
(NOTE 2) | |
| | |
COMMON STOCKS (continued) | | | | | | | | |
| | |
Consumer Discretionary (continued) | | | | | | | | |
Media (continued) | | | | | | | | |
DIRECTV - Class A* | | | 100,070 | | | $ | 4,930,449 | |
Imax Corp. (Canada)* | | | 8,690 | | | | 208,299 | |
Mediaset Espana Comunicacion S.A. (Spain)1 | | | 48,350 | | | | 220,092 | |
News Corp. - Class A | | | 202,230 | | | | 3,963,708 | |
Reed Elsevier plc - ADR (United Kingdom) | | | 1,308 | | | | 43,229 | |
Societe Television Francaise 1 (France)1 | | | 16,930 | | | | 163,985 | |
Time Warner, Inc. | | | 225,050 | | | | 8,430,373 | |
Valassis Communications, Inc.* | | | 4,450 | | | | 89,000 | |
Virgin Media, Inc. - ADR (United Kingdom) | | | 193,770 | | | | 4,758,991 | |
The Walt Disney Co. | | | 122,980 | | | | 5,301,668 | |
Wolters Kluwer N.V. (Netherlands)1 | | | 8,040 | | | | 138,990 | |
Zon Multimedia Servicos de Telecomunicacoes e Multimedia SGPS S.A. (Portugal)1 | | | 61,000 | | | | 205,854 | |
| | | | | | | | |
| | | | | | | 32,216,738 | |
| | | | | | | | |
| | |
Multiline Retail - 0.02% | | | | | | | | |
Marks & Spencer Group plc (United Kingdom)1 | | | 18,990 | | | | 110,062 | |
PPR (France)1 | | | 745 | | | | 124,675 | |
| | | | | | | | |
| | | | | | | 234,737 | |
| | | | | | | | |
| | |
Specialty Retail - 0.11% | | | | | | | | |
Aeropostale, Inc.* | | | 6,750 | | | | 149,715 | |
American Eagle Outfitters, Inc. | | | 8,150 | | | | 146,781 | |
Belle International Holdings Ltd. (Hong Kong)1 | | | 60,000 | | | | 117,074 | |
Chico’s FAS, Inc. | | | 10,960 | | | | 168,346 | |
Dick’s Sporting Goods, Inc. | | | 5,330 | | | | 269,698 | |
Group 1 Automotive, Inc. | | | 1,410 | | | | 81,611 | |
Inditex S.A. (Spain)1 | | | 900 | | | | 81,121 | |
KOMERI Co. Ltd. (Japan)1 | | | 1,500 | | | | 42,026 | |
Penske Automotive Group, Inc. | | | 2,810 | | | | 74,296 | |
Sonic Automotive, Inc. - Class A | | | 6,850 | | | | 115,217 | |
Teavana Holdings, Inc.* | | | 7,840 | | | | 163,778 | |
| | | | | | | | |
| | | | | | | 1,409,663 | |
| | | | | | | | |
| | |
Textiles, Apparel & Luxury Goods - 0.01% | | | | | | | | |
Adidas AG (Germany)1 | | | 1,530 | | | | 127,617 | |
| | | | | | | | |
Total Consumer Discretionary | | | | | | | 51,454,080 | |
| | | | | | | | |
Consumer Staples - 2.41% | | | | | | | | |
Beverages - 0.75% | | | | | | | | |
Anheuser-Busch InBev N.V. (Belgium)1 | | | 67,890 | | | | 4,893,192 | |
The Boston Beer Co., Inc. - Class A* | | | 1,030 | | | | 106,420 | |
C&C Group plc (Ireland)*1 | | | 20,630 | | | | 103,469 | |
Carlsberg A/S - Class B (Denmark)1 | | | 2,200 | | | | 189,908 | |
Cia Cervecerias Unidas S.A. - ADR (Chile) | | | 1,950 | | | | 139,659 | |
The accompanying notes are an integral part of the financial statements.
4
Investment Portfolio - April 30, 2012
(unaudited)
| | | | | | | | |
| PRO-BLEND® CONSERVATIVE TERM SERIES | | SHARES | | | VALUE (NOTE 2) | |
| | |
COMMON STOCKS (continued) | | | | | | | | |
| | |
Consumer Staples (continued) | | | | | | | | |
Beverages (continued) | | | | | | | | |
The Coca-Cola Co. | | | 46,640 | | | $ | 3,559,565 | |
Diageo plc (United Kingdom)1 | | | 11,380 | | | | 287,041 | |
Heineken N.V. (Netherlands)1 | | | 2,200 | | | | 120,315 | |
| | | | | | | | |
| | | | | | | 9,399,569 | |
| | | | | | | | |
| | |
Food & Staples Retailing - 0.37% | | | | | | | | |
Carrefour S.A. (France)1 | | | 9,650 | | | | 193,834 | |
Casino Guichard-Perrachon S.A. (France)1 | | | 1,100 | | | | 108,074 | |
Distribuidora Internacional de Alimentacion S.A. (Spain)*1 | | | 26,470 | | | | 127,089 | |
Koninklijke Ahold N.V. (Netherlands)1 | | | 9,120 | | | | 115,755 | |
The Kroger Co. | | | 155,920 | | | | 3,628,258 | |
SUPERVALU, Inc. | | | 11,870 | | | | 70,508 | |
Tesco plc (United Kingdom)1 | | | 58,505 | | | | 301,458 | |
| | | | | | | | |
| | | | | | | 4,544,976 | |
| | | | | | | | |
| | |
Food Products - 1.24% | | | | | | | | |
Barry Callebaut AG (Switzerland)1 | | | 180 | | | | 173,286 | |
Biostime International Holdings Ltd. (Cayman Islands)1 | | | 19,500 | | | | 55,935 | |
BRF - Brasil Foods S.A. (Brazil) | | | 9,030 | | | | 163,911 | |
Danone (France)1 | | | 4,920 | | | | 346,363 | |
Flowers Foods, Inc. | | | 4,110 | | | | 88,159 | |
Grupo Bimbo S.A.B. de C.V. - Class A (Mexico) | | | 74,480 | | | | 177,710 | |
Kraft Foods, Inc. - Class A | | | 130,090 | | | | 5,186,688 | |
M Dias Branco S.A. (Brazil) | | | 2,700 | | | | 77,906 | |
Nestle S.A. (Switzerland)1 | | | 60,550 | | | | 3,711,066 | |
Suedzucker AG (Germany)1 | | | 2,950 | | | | 89,833 | |
Unilever plc - ADR (United Kingdom) | | | 158,530 | | | | 5,440,750 | |
| | | | | | | | |
| | | | | | | 15,511,607 | |
| | | | | | | | |
| | |
Household Products - 0.03% | | | | | | | | |
Reckitt Benckiser Group plc (United Kingdom)1 | | | 6,610 | | | | 384,791 | |
| | | | | | | | |
Personal Products - 0.01% | | | | | | | | |
Beiersdorf AG (Germany)1 | | | 930 | | | | 65,264 | |
| | | | | | | | |
Tobacco - 0.01% | | | | | | | | |
Gudang Garam Tbk PT (Indonesia)1 | | | 21,000 | | | | 134,866 | |
| | | | | | | | |
Total Consumer Staples | | | | | | | 30,041,073 | |
| | | | | | | | |
Energy - 2.10% | | | | | | | | |
Energy Equipment & Services - 1.12% | | | | | | | | |
Baker Hughes, Inc. | | | 91,295 | | | | 4,027,022 | |
Calfrac Well Services Ltd. (Canada) | | | 5,040 | | | | 138,264 | |
CARBO Ceramics, Inc. | | | 520 | | | | 43,727 | |
Compagnie Generale de Geophysique - Veritas (CGG - Veritas) (France)*1 | | | 2,850 | | | | 81,732 | |
Heckmann Corp.* | | | 19,940 | | | | 75,772 | |
The accompanying notes are an integral part of the financial statements.
5
Investment Portfolio - April 30, 2012
(unaudited)
| | | | | | | | |
| PRO-BLEND® CONSERVATIVE TERM SERIES | | SHARES | | | VALUE (NOTE 2) | |
| | |
COMMON STOCKS (continued) | | | | | | | | |
| | |
Energy (continued) | | | | | | | | |
Energy Equipment & Services (continued) | | | | | | | | |
ION Geophysical Corp.* | | | 9,000 | | | $ | 56,070 | |
Key Energy Services, Inc.* | | | 6,510 | | | | 82,417 | |
Petroleum Geo-Services ASA (Norway)*1 | | | 7,500 | | | | 113,458 | |
Poseidon Concepts Corp. (Canada) | | | 6,300 | | | | 81,823 | |
Schlumberger Ltd. | | | 66,160 | | | | 4,905,102 | |
Trican Well Service Ltd. (Canada) | | | 18,600 | | | | 269,063 | |
Weatherford International Ltd. - ADR (Switzerland)* | | | 286,834 | | | | 4,093,121 | |
| | | | | | | | |
| | | | | | | 13,967,571 | |
| | | | | | | | |
| | |
Oil, Gas & Consumable Fuels - 0.98% | | | | | | | | |
Apache Corp. | | | 17,280 | | | | 1,657,843 | |
Cameco Corp. (Canada) | | | 7,780 | | | | 171,938 | |
Hess Corp. | | | 131,270 | | | | 6,844,418 | |
Paladin Energy Ltd. (Australia)*2 | | | 75,420 | | | | 124,447 | |
Petroleo Brasileiro S.A. - ADR (Brazil) | | | 7,510 | | | | 166,422 | |
Range Resources Corp. | | | 39,380 | | | | 2,625,071 | |
Royal Dutch Shell plc - Class B (Netherlands)1 | | | 2,646 | | | | 96,829 | |
Royal Dutch Shell plc - Class B - ADR (Netherlands) | | | 2,580 | | | | 189,269 | |
Statoil ASA (Norway)1 | | | 5,550 | | | | 148,920 | |
Talisman Energy, Inc. (Canada) | | | 17,720 | | | | 231,758 | |
| | | | | | | | |
| | | | | | | 12,256,915 | |
| | | | | | | | |
| | |
Total Energy | | | | | | | 26,224,486 | |
| | | | | | | | |
Financials - 3.17% | | | | | | | | |
Capital Markets - 0.02% | | | | | | | | |
Deutsche Bank AG (Germany)1 | | | 2,280 | | | | 98,982 | |
Evercore Partners, Inc. - Class A | | | 2,190 | | | | 57,882 | |
Greenhill & Co., Inc. | | | 700 | | | | 27,195 | |
Lazard Ltd. - Class A - ADR (Bermuda) | | | 1,590 | | | | 43,741 | |
| | | | | | | | |
| | | | | | | 227,800 | |
| | | | | | | | |
| | |
Commercial Banks - 0.24% | | | | | | | | |
Banco Bilbao Vizcaya Argentaria S.A. - ADR (Spain) | | | 12,920 | | | | 87,210 | |
Banco Santander S.A. - ADR (Spain) | | | 36,710 | | | | 232,374 | |
Barclays plc (United Kingdom)1 | | | 53,130 | | | | 188,099 | |
BNP Paribas S.A. (France)1 | | | 5,750 | | | | 232,066 | |
CIT Group, Inc.* | | | 7,580 | | | | 286,903 | |
First Commonwealth Financial Corp. | | | 56,190 | | | | 361,302 | |
Hong Leong Financial Group Berhad (Malaysia)1 | | | 44,060 | | | | 173,559 | |
HSBC Holdings plc (United Kingdom)1 | | | 8,500 | | | | 76,731 | |
HSBC Holdings plc - ADR (United Kingdom) | | | 6,077 | | | | 274,498 | |
ICICI Bank Ltd. - ADR (India) | | | 8,860 | | | | 300,265 | |
Standard Chartered plc (United Kingdom)1 | | | 4,590 | | | | 112,206 | |
The accompanying notes are an integral part of the financial statements.
6
Investment Portfolio - April 30, 2012
(unaudited)
| | | | | | | | |
| PRO-BLEND® CONSERVATIVE TERM SERIES | | SHARES | | | VALUE (NOTE 2) | |
| | |
COMMON STOCKS (continued) | | | | | | | | |
| | |
Financials (continued) | | | | | | | | |
Commercial Banks (continued) | | | | | | | | |
U.S. Bancorp | | | 11,620 | | | $ | 373,815 | |
Wells Fargo & Co. | | | 8,950 | | | | 299,199 | |
| | | | | | | | |
| | | | | | | 2,998,227 | |
| | | | | | | | |
| | |
Consumer Finance - 0.66% | | | | | | | | |
American Express Co. | | | 54,810 | | | | 3,300,110 | |
Discover Financial Services | | | 144,030 | | | | 4,882,617 | |
| | | | | | | | |
| | | | | | | 8,182,727 | |
| | | | | | | | |
| | |
Diversified Financial Services - 0.43% | | | | | | | | |
CME Group, Inc. | | | 1,390 | | | | 369,490 | |
Deutsche Boerse AG (Germany)*1 | | | 4,380 | | | | 275,015 | |
ING Groep N.V. (Netherlands)*1 | | | 185 | | | | 1,305 | |
JPMorgan Chase & Co. | | | 8,130 | | | | 349,427 | |
JSE Ltd. (South Africa)1 | | | 46,804 | | | | 495,654 | |
Moody’s Corp. | | | 94,300 | | | | 3,861,585 | |
| | | | | | | | |
| | | | | | | 5,352,476 | |
| | | | | | | | |
| | |
Insurance - 0.17% | | | | | | | | |
Admiral Group plc (United Kingdom)1 | | | 17,370 | | | | 341,379 | |
Allianz SE (Germany)1 | | | 3,600 | | | | 401,548 | |
The Allstate Corp. | | | 9,090 | | | | 302,970 | |
AXA S.A. (France)1 | | | 1,230 | | | | 17,478 | |
Brasil Insurance Participacoes e Administracao S.A. (Brazil) | | | 21,600 | | | | 232,414 | |
Mapfre S.A. (Spain)1 | | | 137,180 | | | | 397,122 | |
Muenchener Rueckversicherungs AG (MunichRe) (Germany)1 | | | 1,195 | | | | 173,574 | |
Zurich Insurance Group AG (Switzerland)1 | | | 1,080 | | | | 264,603 | |
| | | | | | | | |
| | | | | | | 2,131,088 | |
| | | | | | | | |
| | |
Real Estate Investment Trusts (REITS) - 1.64% | | | | | | | | |
Alexandria Real Estate Equities, Inc. | | | 14,150 | | | | 1,060,118 | |
Alstria Office REIT AG (Germany)1 | | | 19,820 | | | | 211,302 | |
American Assets Trust, Inc. | | | 10,140 | | | | 238,391 | |
American Campus Communities, Inc. | | | 10,250 | | | | 455,612 | |
Apartment Investment & Management Co. - Class A | | | 11,860 | | | | 321,999 | |
Associated Estates Realty Corp. | | | 4,790 | | | | 81,095 | |
AvalonBay Communities, Inc. | | | 1,690 | | | | 245,726 | |
BioMed Realty Trust, Inc. | | | 85,830 | | | | 1,701,151 | |
Boston Properties, Inc. | | | 6,660 | | | | 720,945 | |
Camden Property Trust | | | 5,020 | | | | 339,703 | |
CBL & Associates Properties, Inc. | | | 12,160 | | | | 226,541 | |
Cedar Realty Trust, Inc. | | | 12,250 | | | | 63,945 | |
Coresite Realty Corp. | | | 14,830 | | | | 369,415 | |
Corporate Office Properties Trust | | | 56,480 | | | | 1,330,104 | |
The accompanying notes are an integral part of the financial statements.
7
Investment Portfolio - April 30, 2012
(unaudited)
| | | | | | | | |
| PRO-BLEND® CONSERVATIVE TERM SERIES | | SHARES | | | VALUE (NOTE 2) | |
| | |
COMMON STOCKS (continued) | | | | | | | | |
| | |
Financials (continued) | | | | | | | | |
Real Estate Investment Trusts (REITS) (continued) | | | | | | | | |
CubeSmart | | | 25,840 | | | $ | 324,550 | |
Digital Realty Trust, Inc. | | | 24,640 | | | | 1,850,218 | |
DuPont Fabros Technology, Inc. | | | 61,800 | | | | 1,677,870 | |
Education Realty Trust, Inc. | | | 18,930 | | | | 213,341 | |
Equity Lifestyle Properties, Inc. | | | 3,510 | | | | 245,489 | |
Equity One, Inc. | | | 14,130 | | | | 293,621 | |
Equity Residential | | | 4,010 | | | | 246,374 | |
General Growth Properties, Inc. | | | 21,590 | | | | 384,302 | |
HCP, Inc. | | | 12,420 | | | | 514,809 | |
Health Care REIT, Inc. | | | 9,410 | | | | 533,171 | |
Healthcare Realty Trust, Inc. | | | 7,690 | | | | 165,181 | |
Home Properties, Inc. | | | 6,300 | | | | 384,615 | |
Host Hotels & Resorts, Inc. | | | 38,587 | | | | 642,088 | |
Kimco Realty Corp. | | | 9,390 | | | | 182,260 | |
Land Securities Group plc (United Kingdom)1 | | | 8,260 | | | | 97,545 | |
LTC Properties, Inc. | | | 5,200 | | | | 173,056 | |
The Macerich Co. | | | 3,170 | | | | 195,177 | |
Mack-Cali Realty Corp. | | | 8,870 | | | | 254,746 | |
Mid-America Apartment Communities, Inc. | | | 6,020 | | | | 409,781 | |
National Retail Properties, Inc. | | | 6,620 | | | | 181,256 | |
Pebblebrook Hotel Trust | | | 30,460 | | | | 733,477 | |
Potlatch Corp. | | | 2,620 | | | | 82,006 | |
ProLogis, Inc. | | | 4,000 | | | | 143,120 | |
Public Storage | | | 1,980 | | | | 283,655 | |
Realty Income Corp. | | | 6,750 | | | | 265,545 | |
Simon Property Group, Inc. | | | 5,980 | | | | 930,488 | |
Sovran Self Storage, Inc. | | | 10,060 | | | | 530,162 | |
Tanger Factory Outlet Centers | | | 3,790 | | | | 118,703 | |
Taubman Centers, Inc. | | | 1,850 | | | | 142,783 | |
UDR, Inc. | | | 25,140 | | | | 661,936 | |
Unibail-Rodamco SE (France)1 | | | 930 | | | | 174,019 | |
| | | | | | | | |
| | | | | | | 20,401,391 | |
| | | | | | | | |
| | |
Real Estate Management & Development - 0.01% | | | | | | | | |
General Shopping Brasil S.A. (Brazil)* | | | 15,670 | | | | 94,950 | |
| | | | | | | | |
Thrifts & Mortgage Finance - 0.00% | | | | | | | | |
Aareal Bank AG (Germany)*1 | | | 3,745 | | | | 72,333 | |
| | | | | | | | |
Total Financials | | | | | | | 39,460,992 | |
| | | | | | | | |
Health Care - 2.78% | | | | | | | | |
Biotechnology - 0.13% | | | | | | | | |
Dendreon Corp.* | | | 31,250 | | | | 364,063 | |
Exact Sciences Corp.* | | | 37,470 | | | | 403,552 | |
The accompanying notes are an integral part of the financial statements.
8
Investment Portfolio - April 30, 2012
(unaudited)
| | | | | | | | |
| PRO-BLEND® CONSERVATIVE TERM SERIES | | SHARES | | | VALUE (NOTE 2) | |
| | |
COMMON STOCKS (continued) | | | | | | | | |
| | |
Health Care (continued) | | | | | | | | |
Biotechnology (continued) | | | | | | | | |
Myriad Genetics, Inc.* | | | 32,660 | | | $ | 849,487 | |
| | | | | | | | |
| | | | | | | 1,617,102 | |
| | | | | | | | |
| | |
Health Care Equipment & Supplies - 0.60% | | | | | | | | |
Abaxis, Inc.* | | | 15,250 | | | | 543,205 | |
Alere, Inc.* | | | 21,620 | | | | 516,502 | |
Becton, Dickinson and Co. | | | 40,690 | | | | 3,192,131 | |
BioMerieux (France)1 | | | 5,040 | | | | 413,031 | |
DexCom, Inc.* | | | 26,280 | | | | 257,281 | |
HeartWare International, Inc.* | | | 6,640 | | | | 517,654 | |
Insulet Corp.* | | | 27,890 | | | | 498,115 | |
Mindray Medical International Ltd. - ADR (China) | | | 5,460 | | | | 178,870 | |
Quidel Corp.* | | | 19,500 | | | | 322,140 | |
Sirona Dental Systems, Inc.* | | | 5,920 | | | | 299,019 | |
Straumann Holding AG (Switzerland)1 | | | 2,305 | | | | 383,014 | |
Thoratec Corp.* | | | 9,730 | | | | 338,701 | |
| | | | | | | | |
| | | | | | | 7,459,663 | |
| | | | | | | | |
| | |
Health Care Providers & Services - 0.10% | | | | | | | | |
Amil Participacoes S.A. (Brazil) | | | 12,540 | | | | 122,627 | |
China Cord Blood Corp. - ADR (Hong Kong)* | | | 37,000 | | | | 108,040 | |
Odontoprev S.A. (Brazil) | | | 47,730 | | | | 252,153 | |
Sonic Healthcare Ltd. (Australia)1 | | | 60,980 | | | | 797,719 | |
| | | | | | | | |
| | | | | | | 1,280,539 | |
| | | | | | | | |
| | |
Health Care Technology - 1.09% | | | | | | | | |
Allscripts Healthcare Solutions, Inc.* | | | 212,120 | | | | 2,350,290 | |
Cerner Corp.* | | | 128,600 | | | | 10,428,174 | |
Computer Programs & Systems, Inc. | | | 5,410 | | | | 322,382 | |
Greenway Medical Technologies, Inc.* | | | 19,490 | | | | 300,146 | |
Quality Systems, Inc. | | | 5,580 | | | | 208,692 | |
| | | | | | | | |
| | | | | | | 13,609,684 | |
| | | | | | | | |
| | |
Life Sciences Tools & Services - 0.61% | | | | | | | | |
Luminex Corp.* | | | 14,000 | | | | 350,560 | |
QIAGEN N.V. (Netherlands)*1 | | | 5,750 | | | | 95,074 | |
QIAGEN N.V. - ADR (Netherlands)* | | | 252,720 | | | | 4,228,006 | |
Waters Corp.* | | | 27,220 | | | | 2,289,474 | |
WuXi PharmaTech (Cayman), Inc. - ADR (China)* | | | 39,190 | | | | 563,552 | |
| | | | | | | | |
| | | | | | | 7,526,666 | |
| | | | | | | | |
| | |
Pharmaceuticals - 0.25% | | | | | | | | |
AstraZeneca plc (United Kingdom)1 | | | 615 | | | | 26,950 | |
AstraZeneca plc - ADR (United Kingdom) | | | 6,080 | | | | 266,912 | |
The accompanying notes are an integral part of the financial statements.
9
Investment Portfolio - April 30, 2012
(unaudited)
| | | | | | | | |
| PRO-BLEND® CONSERVATIVE TERM SERIES | | SHARES | | | VALUE (NOTE 2) | |
| | |
COMMON STOCKS (continued) | | | | | | | | |
| | |
Health Care (continued) | | | | | | | | |
Pharmaceuticals (continued) | | | | | | | | |
Bayer AG (Germany)1 | | | 4,310 | | | $ | 303,699 | |
Dr. Reddy’s Laboratories Ltd. - ADR (India) | | | 7,750 | | | | 262,183 | |
GlaxoSmithKline plc (United Kingdom)1 | | | 5,525 | | | | 127,636 | |
Green Cross Corp. (South Korea)1 | | | 3,690 | | | | 436,087 | |
Hikma Pharmaceuticals plc (United Kingdom)1 | | | 35,430 | | | | 361,148 | |
Novo Nordisk A/S - Class B (Denmark)1 | | | 1,220 | | | | 179,856 | |
Optimer Pharmaceuticals, Inc.* | | | 28,010 | | | | 414,548 | |
Sanofi (France)1 | | | 851 | | | | 65,001 | |
Santen Pharmaceutical Co. Ltd. (Japan)1 | | | 1,400 | | | | 58,589 | |
Shire plc (Ireland)1 | | | 5,745 | | | | 187,245 | |
Teva Pharmaceutical Industries Ltd. - ADR (Israel) | | | 3,880 | | | | 177,471 | |
UCB S.A. (Belgium)1 | | | 5,770 | | | | 269,806 | |
| | | | | | | | |
| | | | | | | 3,137,131 | |
| | | | | | | | |
Total Health Care | | | | | | | 34,630,785 | |
| | | | | | | | |
Industrials - 1.46% | | | | | | | | |
Aerospace & Defense - 0.01% | | | | | | | | |
European Aeronautic Defence and Space Co. N.V. (Netherlands)1 | | | 3,150 | | | | 124,483 | |
| | | | | | | | |
Air Freight & Logistics - 0.03% | | | | | | | | |
FedEx Corp. | | | 4,000 | | | | 352,960 | |
PostNL N.V. (Netherlands)1 | | | 10,260 | | | | 44,646 | |
| | | | | | | | |
| | | | | | | 397,606 | |
| | | | | | | | |
| | |
Airlines - 0.41% | | | | | | | | |
Copa Holdings S.A. - ADR - Class A (Panama) | | | 4,000 | | | | 325,240 | |
Deutsche Lufthansa AG (Germany)1 | | | 6,570 | | | | 85,557 | |
Ryanair Holdings plc - ADR (Ireland)* | | | 7,710 | | | | 259,596 | |
Southwest Airlines Co. | | | 478,845 | | | | 3,964,837 | |
Spirit Airlines, Inc.* | | | 6,900 | | | | 165,738 | |
US Airways Group, Inc.* | | | 26,780 | | | | 274,763 | |
| | | | | | | | |
| | | | | | | 5,075,731 | |
| | | | | | | | |
| | |
Commercial Services & Supplies - 0.05% | | | | | | | | |
Edenred (France)1 | | | 12,060 | | | | 385,286 | |
Interface, Inc. - Class A | | | 2,430 | | | | 34,409 | |
Tomra Systems ASA (Norway)1 | | | 26,250 | | | | 204,883 | |
| | | | | | | | |
| | | | | | | 624,578 | |
| | | | | | | | |
| | |
Construction & Engineering - 0.00% | | | | | | | | |
MYR Group, Inc.* | | | 2,460 | | | | 41,131 | |
| | | | | | | | |
Electrical Equipment - 0.08% | | | | | | | | |
ABB Ltd. (Asea Brown Boveri) - ADR (Switzerland) | | | 7,950 | | | | 150,017 | |
Alstom S.A. (France)1 | | | 8,390 | | | | 300,065 | |
The accompanying notes are an integral part of the financial statements.
10
Investment Portfolio - April 30, 2012
(unaudited)
| | | | | | | | |
| PRO-BLEND® CONSERVATIVE TERM SERIES | | SHARES | | | VALUE (NOTE 2) | |
| | |
COMMON STOCKS (continued) | | | | | | | | |
| | |
Industrials (continued) | | | | | | | | |
Electrical Equipment (continued) | | | | | | | | |
Nexans S.A. (France)1 | | | 840 | | | $ | 42,100 | |
Polypore International, Inc.* | | | 5,320 | | | | 198,702 | |
Prysmian S.p.A. (Italy)1 | | | 7,600 | | | | 123,795 | |
Schneider Electric S.A. (France)1 | | | 2,080 | | | | 128,119 | |
| | | | | | | | |
| | | | | | | 942,798 | |
| | | | | | | | |
| | |
Industrial Conglomerates - 0.03% | | | | | | | | |
Siemens AG (Germany)1 | | | 4,620 | | | | 428,829 | |
| | | | | | | | |
Machinery - 0.39% | | | | | | | | |
Astec Industries, Inc.* | | | 1,300 | | | | 40,677 | |
FANUC Corp. (Japan)1 | | | 2,000 | | | | 337,301 | |
Flowserve Corp. | | | 33,041 | | | | 3,797,402 | |
Graham Corp. | | | 1,870 | | | | 41,290 | |
Titan International, Inc. | | | 3,800 | | | | 109,782 | |
Wabash National Corp.* | | | 19,870 | | | | 166,312 | |
Westport Innovations, Inc. - ADR (Canada)* | | | 13,020 | | | | 407,526 | |
| | | | | | | | |
| | | | | | | 4,900,290 | |
| | | | | | | | |
| | |
Marine - 0.02% | | | | | | | | |
Baltic Trading Ltd. | | | 5,560 | | | | 25,854 | |
D/S Norden (Denmark)1 | | | 3,140 | | | | 89,117 | |
Mitsui OSK Lines Ltd. (Japan)1 | | | 4,000 | | | | 15,504 | |
Nippon Yusen Kabushiki Kaisha (Japan)1 | | | 6,000 | | | | 17,736 | |
Pacific Basin Shipping Ltd. (Bermuda)1,3 | | | 28,000 | | | | 14,653 | |
Sinotrans Shipping Ltd. (Hong Kong)1 | | | 170,000 | | | | 40,460 | |
| | | | | | | | |
| | | | | | | 203,324 | |
| | | | | | | | |
| | |
Professional Services - 0.08% | | | | | | | | |
The Advisory Board Co.* | | | 6,160 | | | | 561,546 | |
Qualicorp S.A. (Brazil)* | | | 48,020 | | | | 418,441 | |
| | | | | | | | |
| | | | | | | 979,987 | |
| | | | | | | | |
| | |
Road & Rail - 0.30% | | | | | | | | |
All America Latina Logistica S.A. (Brazil) | | | 71,640 | | | | 324,347 | |
Norfolk Southern Corp. | | | 43,900 | | | | 3,201,627 | |
RailAmerica, Inc.* | | | 9,930 | | | | 230,177 | |
| | | | | | | | |
| | | | | | | 3,756,151 | |
| | | | | | | | |
| | |
Transportation Infrastructure - 0.06% | | | | | | | | |
Groupe Eurotunnel S.A. (France)1 | | | 44,610 | | | | 375,331 | |
Malaysia Airports Holdings Berhad (Malaysia)1 | | | 191,750 | | | | 366,444 | |
| | | | | | | | |
| | | | | | | 741,775 | |
| | | | | | | | |
Total Industrials | | | | | | | 18,216,683 | |
| | | | | | | | |
The accompanying notes are an integral part of the financial statements.
11
Investment Portfolio - April 30, 2012
(unaudited)
| | | | | | | | |
| PRO-BLEND® CONSERVATIVE TERM SERIES | | SHARES | | | VALUE (NOTE 2) | |
| | |
COMMON STOCKS (continued) | | | | | | | | |
| | |
Information Technology - 5.20% | | | | | | | | |
Communications Equipment - 1.06% | | | | | | | | |
Alcatel-Lucent - ADR (France)* | | | 128,570 | | | $ | 194,141 | |
Cisco Systems, Inc. | | | 238,158 | | | | 4,798,884 | |
Infinera Corp.* | | | 71,690 | | | | 513,300 | |
Juniper Networks, Inc.* | | | 210,090 | | | | 4,502,229 | |
Qualcomm, Inc. | | | 43,920 | | | | 2,803,853 | |
Riverbed Technology, Inc.* | | | 21,160 | | | | 417,487 | |
| | | | | | | | |
| | | | | | | 13,229,894 | |
| | | | | | | | |
| | |
Computers & Peripherals - 0.66% | | | | | | | | |
Apple, Inc.* | | | 900 | | | | 525,816 | |
EMC Corp.* | | | 264,810 | | | | 7,470,290 | |
Immersion Corp.* | | | 41,020 | | | | 223,559 | |
| | | | | | | | |
| | | | | | | 8,219,665 | |
| | | | | | | | |
| | |
Electronic Equipment, Instruments & Components - 0.45% | | | | | | | | |
Amphenol Corp. - Class A | | | 3,450 | | | | 200,583 | |
Corning, Inc. | | | 314,390 | | | | 4,511,497 | |
Hitachi Ltd. (Japan)1 | | | 61,400 | | | | 391,072 | |
Keyence Corp. (Japan)1 | | | 660 | | | | 155,776 | |
Maxwell Technologies, Inc.* | | | 5,210 | | | | 49,547 | |
Nippon Electric Glass Co. Ltd. (Japan)1 | | | 32,800 | | | | 265,016 | |
| | | | | | | | |
| | | | | | | 5,573,491 | |
| | | | | | | | |
| | |
Internet Software & Services - 1.03% | | | | | | | | |
The Active Network, Inc.* | | | 31,330 | | | | 526,344 | |
comScore, Inc.* | | | 19,750 | | | | 393,420 | |
Google, Inc. - Class A* | | | 17,795 | | | | 10,770,068 | |
LogMeIn, Inc.* | | | 2,890 | | | | 104,069 | |
Tencent Holdings Ltd. (China)1 | | | 15,600 | | | | 488,027 | |
Velti plc - ADR (Ireland)* | | | 44,090 | | | | 526,875 | |
| | | | | | | | |
| | | | | | | 12,808,803 | |
| | | | | | | | |
| | |
IT Services - 1.20% | | | | | | | | |
Amadeus IT Holding S.A. - Class A (Spain)1 | | | 120,300 | | | | 2,462,763 | |
Amdocs Ltd. - ADR (Guernsey)* | | | 17,140 | | | | 548,480 | |
Cap Gemini S.A. (France)1 | | | 16,320 | | | | 637,578 | |
Euronet Worldwide, Inc.* | | | 17,100 | | | | 369,873 | |
MasterCard, Inc. - Class A | | | 11,930 | | | | 5,395,581 | |
Visa, Inc. - Class A | | | 42,080 | | | | 5,174,998 | |
The Western Union Co. | | | 22,320 | | | | 410,242 | |
| | | | | | | | |
| | | | | | | 14,999,515 | |
| | | | | | | | |
| | |
Semiconductors & Semiconductor Equipment - 0.09% | | | | | | | | |
Aixtron SE NA (Germany)1 | | | 9,200 | | | | 168,094 | |
The accompanying notes are an integral part of the financial statements.
12
Investment Portfolio - April 30, 2012
(unaudited)
| | | | | | | | |
PRO-BLEND® CONSERVATIVE TERM SERIES | | SHARES | | | VALUE (NOTE 2) | |
| | |
COMMON STOCKS (continued) | | | | | | | | |
| | |
Information Technology (continued) | | | | | | | | |
Semiconductors & Semiconductor Equipment (continued) | | | | | | | | |
Samsung Electronics Co. Ltd. (South Korea)1 | | | 260 | | | $ | 318,230 | |
Sumco Corp. (Japan)*1 | | | 22,300 | | | | 236,729 | |
Tokyo Electron Ltd. (Japan)1 | | | 3,900 | | | | 216,123 | |
Veeco Instruments, Inc.* | | | 5,200 | | | | 156,988 | |
| | | | | | | | |
| | | | | | | 1,096,164 | |
| | | | | | | | |
| | |
Software - 0.71% | | | | | | | | |
Autodesk, Inc.* | | | 108,140 | | | | 4,257,472 | |
Aveva Group plc (United Kingdom)1 | | | 6,270 | | | | 169,775 | |
Electronic Arts, Inc.* | | | 264,460 | | | | 4,067,395 | |
RealPage, Inc.* | | | 13,310 | | | | 241,577 | |
SAP AG (Germany)1 | | | 2,290 | | | | 151,858 | |
| | | | | | | | |
| | | | | | | 8,888,077 | |
| | | | | | | | |
Total Information Technology | | | | | | | 64,815,609 | |
| | | | | | | | |
Materials - 1.44% | | | | | | | | |
Chemicals - 1.11% | | | | | | | | |
Arkema S.A. (France)1 | | | 2 | | | | 177 | |
BASF SE (Germany)1 | | | 3,350 | | | | 275,815 | |
Calgon Carbon Corp.* | | | 9,140 | | | | 126,498 | |
Flotek Industries, Inc.* | | | 5,370 | | | | 73,247 | |
Johnson Matthey plc (United Kingdom)1 | | | 9,480 | | | | 355,988 | |
Linde AG (Germany)1 | | | 1,490 | | | | 255,033 | |
Monsanto Co. | | | 129,730 | | | | 9,882,831 | |
Shin-Etsu Chemical Co. Ltd. (Japan)1 | | | 1,200 | | | | 69,264 | |
Syngenta AG (Switzerland)1 | | | 8,010 | | | | 2,808,920 | |
| | | | | | | | |
| | | | | | | 13,847,773 | |
| | | | | | | | |
| | |
Construction Materials - 0.02% | | | | | | | | |
CRH plc (Ireland)1 | | | 5,320 | | | | 107,837 | |
Eagle Materials, Inc. | | | 2,260 | | | | 79,597 | |
Holcim Ltd. (Switzerland)1 | | | 1,230 | | | | 76,718 | |
| | | | | | | | |
| | | | | | | 264,152 | |
| | | | | | | | |
| | |
Metals & Mining - 0.31% | | | | | | | | |
Alcoa, Inc. | | | 383,680 | | | | 3,733,206 | |
Alumina Ltd. (Australia)1 | | | 41,870 | | | | 50,012 | |
Norsk Hydro ASA (Norway)1 | | | 9,330 | | | | 45,495 | |
| | | | | | | | |
| | | | | | | 3,828,713 | |
| | | | | | | | |
Total Materials | | | | | | | 17,940,638 | |
| | | | | | | | |
Telecommunication Services - 0.45% | | | | | | | | |
Diversified Telecommunication Services - 0.41% | | | | | | | | |
Swisscom AG - ADR (Switzerland)4 | | | 3,150 | | | | 116,707 | |
The accompanying notes are an integral part of the financial statements.
13
Investment Portfolio - April 30, 2012
(unaudited)
| | | | | | | | |
| PRO-BLEND® CONSERVATIVE TERM SERIES | | SHARES | | | VALUE (NOTE 2) | |
| | |
COMMON STOCKS (continued) | | | | | | | | |
| | |
Telecommunication Services (continued) | | | | | | | | |
Diversified Telecommunication Services (continued) | | | | | | | | |
Telefonica S.A. - ADR (Spain) | | | 19,310 | | | $ | 282,505 | |
Telenor ASA (Norway)1 | | | 241,940 | | | | 4,447,198 | |
Telenor ASA - ADR (Norway)4 | | | 4,550 | | | | 250,659 | |
| | | | | | | | |
| | | | | | | 5,097,069 | |
| | | | | | | | |
| | |
Wireless Telecommunication Services - 0.04% | | | | | | | | |
DiGi.com Berhad (Malaysia)1 | | | 255,910 | | | | 340,576 | |
MTN Group Ltd. (South Africa)1 | | | 4,350 | | | | 76,072 | |
SK Telecom Co. Ltd. - ADR (South Korea) | | | 11,320 | | | | 153,046 | |
| | | | | | | | |
| | | | | | | 569,694 | |
| | | | | | | | |
Total Telecommunication Services | | | | | | | 5,666,763 | |
| | | | | | | | |
Utilities - 0.03% | | | | | | | | |
Electric Utilities - 0.01% | | | | | | | | |
E.ON AG (Germany)1 | | | 4,875 | | | | 110,378 | |
| | | | | | | | |
Multi-Utilities - 0.01% | | | | | | | | |
National Grid plc (United Kingdom)1 | | | 8,760 | | | | 94,595 | |
| | | | | | | | |
Water Utilities - 0.01% | | | | | | | | |
Cia de Saneamento de Minas Gerais - Copasa MG (Brazil) | | | 5,860 | | | | 137,266 | |
| | | | | | | | |
Total Utilities | | | | | | | 342,239 | |
| | | | | | | | |
TOTAL COMMON STOCKS | | | | | | | | |
(Identified Cost $258,091,635) | | | | | | | 288,793,348 | |
| | | | | | | | |
| | |
PREFERRED STOCKS - 0.24% | | | | | | | | |
| | |
Financials - 0.24% | | | | | | | | |
Commercial Banks - 0.15% | | | | | | | | |
BB&T Corp. (non-cumulative), 5.85%5 | | | 23,500 | | | | 587,500 | |
PNC Financial Services Group, Inc., Series K (non-cumulative), 8.25%5 | | | 180,000 | | | | 186,667 | |
U.S. Bancorp., Series F (non-cumulative), 6.50%5 | | | 39,000 | | | | 1,055,340 | |
| | | | | | | | |
| | | | | | | 1,829,507 | |
| | | | | | | | |
| | |
Diversified Financial Services - 0.05% | | | | | | | | |
Bank of America Corp., Series M (non-cumulative), 8.125%5 | | | 585,000 | | | | 606,177 | |
| | | | | | | | |
Real Estate Investment Trusts (REITS) - 0.04% | | | | | | | | |
Public Storage, Series Q, 6.50% | | | 18,560 | | | | 510,771 | |
| | | | | | | | |
Total Financials | | | | | | | 2,946,455 | |
| | | | | | | | |
TOTAL PREFERRED STOCKS | | | | | | | | |
(Identified Cost $2,798,208) | | | | | | | 2,946,455 | |
| | | | | | | | |
The accompanying notes are an integral part of the financial statements.
14
Investment Portfolio - April 30, 2012
(unaudited)
| | | | | | | | |
| PRO-BLEND® CONSERVATIVE TERM SERIES | | PRINCIPAL
AMOUNT | | | VALUE (NOTE 2) | |
| | |
CORPORATE BONDS - 27.25% | | | | | | | | |
| | |
Convertible Corporate Bonds - 0.09% | | | | | | | | |
Financials - 0.04% | | | | | | | | |
Real Estate Investment Trusts (REITS) - 0.04% | | | | | | | | |
BioMed Realty LP6, 3.75%, 1/15/2030 | | $ | 410,000 | | | $ | 495,075 | |
| | | | | | | | |
Health Care - 0.01% | | | | | | | | |
Health Care Equipment & Supplies - 0.01% | | | | | | | | |
Alere, Inc., 3.00%, 5/15/2016 | | | 180,000 | | | | 174,600 | |
| | | | | | | | |
Information Technology - 0.01% | | | | | | | | |
Computers & Peripherals - 0.01% | | | | | | | | |
EMC Corp., 1.75%, 12/1/2013 | | | 40,000 | | | | 71,100 | |
| | | | | | | | |
Materials - 0.03% | | | | | | | | |
Containers & Packaging - 0.03% | | | | | | | | |
Owens-Brockway Glass Container, Inc.6, 3.00%, 6/1/2015 | | | 360,000 | | | | 351,450 | |
| | | | | | | | |
Total Convertible Corporate Bonds | | | | | | | | |
(Identified Cost $1,032,794) | | | | | | | 1,092,225 | |
| | | | | | | | |
Non-Convertible Corporate Bonds - 27.16% | | | | | | | | |
Consumer Discretionary - 4.52% | | | | | | | | |
Auto Components - 0.02% | | | | | | | | |
UCI International, Inc., 8.625%, 2/15/2019 | | | 295,000 | | | | 302,375 | |
| | | | | | | | |
Hotels, Restaurants & Leisure - 0.38% | | | | | | | | |
International Game Technology, 7.50%, 6/15/2019 | | | 4,000,000 | | | | 4,751,708 | |
| | | | | | | | |
Household Durables - 0.49% | | | | | | | | |
Newell Rubbermaid, Inc., 4.70%, 8/15/2020 | | | 820,000 | | | | 887,428 | |
Taylor Morrison Communities, Inc. - Monarch Communities, Inc.6, 7.75%, 4/15/2020 | | | 340,000 | | | | 350,200 | |
Tupperware Brands Corp., 4.75%, 6/1/2021 | | | 4,750,000 | | | | 4,885,703 | |
| | | | | | | | |
| | | | | | | 6,123,331 | |
| | | | | | | | |
| | |
Media - 3.09% | | | | | | | | |
Cablevision Systems Corp., 8.625%, 9/15/2017 | | | 290,000 | | | | 318,275 | |
Columbus International, Inc. (Barbados)6, 11.50%, 11/20/2014 | | | 130,000 | | | | 141,050 | |
Comcast Corp., 5.15%, 3/1/2020 | | | 8,000,000 | | | | 9,334,400 | |
DIRECTV Holdings LLC - DIRECTV Financing Co., Inc., 5.20%, 3/15/2020 | | | 6,000,000 | | | | 6,667,542 | |
Discovery Communications LLC, 5.05%, 6/1/2020 | | | 6,580,000 | | | | 7,518,295 | |
Intelsat Jackson Holdings S.A. (Luxembourg), 7.25%, 4/1/2019 | | | 305,000 | | | | 317,963 | |
Kabel BW GmbH (Germany)6, 7.50%, 3/15/2019 | | | 280,000 | | | | 298,900 | |
MDC Partners, Inc. (Canada), 11.00%, 11/1/2016 | | | 270,000 | | | | 293,625 | |
Nara Cable Funding Ltd. (Ireland)6, 8.875%, 12/1/2018 | | | 370,000 | | | | 338,550 | |
NBCUniversal Media LLC, 5.15%, 4/30/2020 | | | 980,000 | | | | 1,127,606 | |
Time Warner, Inc., 4.875%, 3/15/2020 | | | 6,000,000 | | | | 6,718,200 | |
Time Warner, Inc., 4.75%, 3/29/2021 | | | 4,215,000 | | | | 4,702,106 | |
Unitymedia Hessen GmbH & Co. KG - Unitymedia NRW GmbH (Germany)6, 8.125%, 12/1/2017 | | | 475,000 | | | | 509,437 | |
The accompanying notes are an integral part of the financial statements.
15
Investment Portfolio - April 30, 2012
(unaudited)
| | | | | | | | |
| PRO-BLEND® CONSERVATIVE TERM SERIES | | PRINCIPAL
AMOUNT | | | VALUE (NOTE 2) | |
| | |
CORPORATE BONDS (continued) | | | | | | | | |
| | |
Non-Convertible Corporate Bonds (continued) | | | | | | | | |
Consumer Discretionary (continued) | | | | | | | | |
Media (continued) | | | | | | | | |
XM Satellite Radio, Inc.6, 7.625%, 11/1/2018 | | $ | 170,000 | | | $ | 185,300 | |
| | | | | | | | |
| | | | | | | 38,471,249 | |
| | | | | | | | |
| | |
Multiline Retail - 0.03% | | | | | | | | |
Target Corp., 6.00%, 1/15/2018 | | | 325,000 | | | | 399,394 | |
| | | | | | | | |
Specialty Retail - 0.45% | | | | | | | | |
Advance Auto Parts, Inc., 4.50%, 1/15/2022 | | | 1,490,000 | | | | 1,570,327 | |
The Home Depot, Inc., 5.40%, 3/1/2016 | | | 510,000 | | | | 588,630 | |
Lowe’s Companies, Inc., 6.10%, 9/15/2017 | | | 1,800,000 | | | | 2,176,681 | |
Rent-A-Center, Inc., 6.625%, 11/15/2020 | | | 550,000 | | | | 574,750 | |
Toys R Us Property Co. II LLC, 8.50%, 12/1/2017 | | | 605,000 | | | | 629,200 | |
| | | | | | | | |
| | | | | | | 5,539,588 | |
| | | | | | | | |
| | |
Textiles, Apparel & Luxury Goods - 0.06% | | | | | | | | |
Jones Group - Apparel Group Holdings - Apparel Group USA - Footwear Accessories Retail, 6.875%, 3/15/2019 | | | 330,000 | | | | 321,337 | |
VF Corp., 5.95%, 11/1/2017 | | | 330,000 | | | | 393,885 | |
| | | | | | | | |
| | | | | | | 715,222 | |
| | | | | | | | |
Total Consumer Discretionary | | | | | | | 56,302,867 | |
| | | | | | | | |
Consumer Staples - 0.65% | | | | | | | | |
Beverages - 0.06% | | | | | | | | |
Constellation Brands, Inc., 7.25%, 9/1/2016 | | | 305,000 | | | | 344,650 | |
Constellation Brands, Inc., 7.25%, 5/15/2017 | | | 155,000 | | | | 175,150 | |
PepsiCo, Inc., 5.00%, 6/1/2018 | | | 110,000 | | | | 129,616 | |
PepsiCo, Inc., 7.90%, 11/1/2018 | | | 63,000 | | | | 85,482 | |
| | | | | | | | |
| | | | | | | 734,898 | |
| | | | | | | | |
| | |
Food Products - 0.56% | | | | | | | | |
Kraft Foods, Inc., 6.125%, 2/1/2018 | | | 335,000 | | | | 403,350 | |
Kraft Foods, Inc., 5.375%, 2/10/2020 | | | 5,665,000 | | | | 6,635,970 | |
| | | | | | | | |
| | | | | | | 7,039,320 | |
| | | | | | | | |
| | |
Personal Products - 0.03% | | | | | | | | |
Revlon Consumer Products Corp., 9.75%, 11/15/2015 | | | 335,000 | | | | 361,381 | |
| | | | | | | | |
Total Consumer Staples | | | | | | | 8,135,599 | |
| | | | | | | | |
Energy - 1.71% | | | | | | | | |
Energy Equipment & Services - 0.81% | | | | | | | | |
Baker Hughes, Inc., 7.50%, 11/15/2018 | | | 305,000 | | | | 405,913 | |
Calfrac Holdings LP6, 7.50%, 12/1/2020 | | | 665,000 | | | | 651,700 | |
Schlumberger Oilfield plc (United Kingdom)6, 4.20%, 1/15/2021 | | | 125,000 | | | | 138,141 | |
SESI LLC, 6.375%, 5/1/2019 | | | 280,000 | | | | 291,200 | |
Thermon Industries, Inc., 9.50%, 5/1/2017 | | | 307,000 | | | | 337,700 | |
The accompanying notes are an integral part of the financial statements.
16
Investment Portfolio - April 30, 2012
(unaudited)
| | | | | | | | |
| PRO-BLEND® CONSERVATIVE TERM SERIES | | PRINCIPAL
AMOUNT | | | VALUE (NOTE 2) | |
| | |
CORPORATE BONDS (continued) | | | | | | | | |
| | |
Non-Convertible Corporate Bonds (continued) | | | | | | | | |
Energy (continued) | | | | | | | | |
Energy Equipment & Services (continued) | | | | | | | | |
Trinidad Drilling Ltd. (Canada)6, 7.875%, 1/15/2019 | | $ | 330,000 | | | $ | 351,450 | |
Weatherford International Ltd. (Switzerland), 9.625%, 3/1/2019 | | | 6,000,000 | | | | 7,937,274 | |
| | | | | | | | |
| | | | | | | 10,113,378 | |
| | | | | | | | |
Oil, Gas & Consumable Fuels - 0.90% | | | | | | | | |
Anadarko Petroleum Corp., 5.95%, 9/15/2016 | | | 2,950,000 | | | | 3,410,625 | |
Anadarko Petroleum Corp., 8.70%, 3/15/2019 | | | 1,220,000 | | | | 1,623,081 | |
Anadarko Petroleum Corp., 6.95%, 6/15/2019 | | | 3,000,000 | | | | 3,696,840 | |
Apache Corp., 6.90%, 9/15/2018 | | | 155,000 | | | | 196,671 | |
Chaparral Energy, Inc., 8.25%, 9/1/2021 | | | 295,000 | | | | 314,175 | |
Chaparral Energy, Inc.6, 7.625%, 11/15/2022 | | | 200,000 | | | | 204,000 | |
Chesapeake Oilfield Operating LLC - Chesapeake Oilfield Finance, Inc.6, 6.625%, 11/15/2019 | | | 530,000 | | | | 498,200 | |
Energy XXI Gulf Coast, Inc., 9.25%, 12/15/2017 | | | 305,000 | | | | 334,737 | |
PBF Holding Co. LLC - PBF Finance Corp.6, 8.25%, 2/15/2020 | | | 370,000 | | | | 382,950 | |
Targa Resources Partners LP - Targa Resources Partners Finance Corp., 8.25%, 7/1/2016 | | | 175,000 | | | | 184,188 | |
Tesoro Corp., 9.75%, 6/1/2019 | | | 255,000 | | | | 290,063 | |
| | | | | | | | |
| | | | | | | 11,135,530 | |
| | | | | | | | |
Total Energy | | | | | | | 21,248,908 | |
| | | | | | | | |
Financials - 13.31% | | | | | | | | |
Capital Markets - 3.12% | | | | | | | | |
Barclays Bank plc (United Kingdom)6, 2.50%, 9/21/2015 | | | 1,305,000 | | | | 1,338,391 | |
BNP Paribas Home Loan Covered Bonds S.A. (France)6, 2.20%, 11/2/2015 | | | 1,305,000 | | | | 1,308,351 | |
The Charles Schwab Corp., 4.45%, 7/22/2020 | | | 7,000,000 | | | | 7,763,840 | |
Credit Suisse AG (Switzerland)6, 2.60%, 5/27/2016 | | | 7,795,000 | | | | 7,979,500 | |
GFI Group, Inc., 8.375%, 7/19/2018 | | | 435,000 | | | | 401,287 | |
Goldman Sachs Capital I, 6.345%, 2/15/2034 | | | 380,000 | | | | 354,379 | |
Goldman Sachs Capital II7, 5.793%, 6/1/2043 | | | 1,500,000 | | | | 1,031,250 | |
The Goldman Sachs Group, Inc., 6.15%, 4/1/2018 | | | 335,000 | | | | 364,644 | |
The Goldman Sachs Group, Inc., 5.375%, 3/15/2020 | | | 8,165,000 | | | | 8,471,808 | |
Jefferies Group, Inc., 8.50%, 7/15/2019 | | | 1,405,000 | | | | 1,552,525 | |
Merrill Lynch & Co., Inc., 6.05%, 8/15/2012 | | | 4,500,000 | | | | 4,565,205 | |
Morgan Stanley, 5.50%, 1/26/2020 | | | 2,650,000 | | | | 2,590,306 | |
Morgan Stanley, 5.75%, 1/25/2021 | | | 1,000,000 | | | | 987,434 | |
Neuberger Berman Group LLC - Neuberger Berman Finance Corp.6, 5.625%, 3/15/2020 | | | 70,000 | | | | 71,050 | |
Neuberger Berman Group LLC - Neuberger Berman Finance Corp.6, 5.875%, 3/15/2022 | | | 140,000 | | | | 142,450 | |
| | | | | | | | |
| | | | | | | 38,922,420 | |
| | | | | | | | |
The accompanying notes are an integral part of the financial statements.
17
Investment Portfolio - April 30, 2012
(unaudited)
| | | | | | | | |
| PRO-BLEND® CONSERVATIVE TERM SERIES | | PRINCIPAL
AMOUNT | | | VALUE (NOTE 2) | |
| | |
CORPORATE BONDS (continued) | | | | | | | | |
| | |
Non-Convertible Corporate Bonds (continued) | | | | | | | | |
Financials (continued) | | | | | | | | |
Commercial Banks - 4.73% | | | | | | | | |
Bank of Montreal (Canada)6, 1.30%, 10/31/2014 | | $ | 4,535,000 | | | $ | 4,595,107 | |
Bank of Montreal (Canada)6, 2.625%, 1/25/2016 | | | 3,620,000 | | | | 3,816,161 | |
Bank of Nova Scotia (Canada)6, 1.45%, 7/26/2013 | | | 6,935,000 | | | | 7,018,296 | |
Bank of Nova Scotia (Canada)6, 1.65%, 10/29/2015 | | | 1,305,000 | | | | 1,330,412 | |
Canadian Imperial Bank of Commerce (Canada)6, 1.50%, 12/12/2014 | | | 3,240,000 | | | | 3,298,589 | |
CIT Group, Inc., 5.25%, 3/15/2018 | | | 355,000 | | | | 365,650 | |
Intesa Sanpaolo S.p.A. (Italy)6, 6.50%, 2/24/2021 | | | 490,000 | | | | 445,193 | |
KeyBank National Association, 5.45%, 3/3/2016 | | | 550,000 | | | | 610,839 | |
Manufacturers & Traders Trust Co., 6.625%, 12/4/2017 | | | 315,000 | | | | 366,608 | |
National Bank of Canada (Canada)6, 2.20%, 10/19/2016 | | | 6,175,000 | | | | 6,402,950 | |
National City Corp., 6.875%, 5/15/2019 | | | 7,000,000 | | | | 8,286,649 | |
PNC Bank National Association, 5.25%, 1/15/2017 | | | 195,000 | | | | 217,249 | |
Royal Bank of Canada (Canada)6, 3.125%, 4/14/2015 | | | 5,815,000 | | | | 6,161,865 | |
Santander Holdings USA, Inc., 4.625%, 4/19/2016 | | | 140,000 | | | | 139,517 | |
Santander Issuances S.A. Unipersonal (Spain)6, 5.911%, 6/20/2016 | | | 450,000 | | | | 437,912 | |
Societe Generale S.A. (France)6, 5.75%, 4/20/2016 | | | 490,000 | | | | 472,351 | |
The Toronto-Dominion Bank (Canada)6, 2.20%, 7/29/2015 | | | 1,305,000 | | | | 1,356,238 | |
The Toronto-Dominion Bank (Canada)6, 1.625%, 9/14/2016 | | | 7,075,000 | | | | 7,158,711 | |
U.S. Bank National Association, 6.30%, 2/4/2014 | | | 100,000 | | | | 109,052 | |
Wachovia Corp., 5.25%, 8/1/2014 | | | 5,935,000 | | | | 6,381,627 | |
| | | | | | | | |
| | | | | | | 58,970,976 | |
| | | | | | | | |
| | |
Consumer Finance - 0.94% | | | | | | | | |
American Express Co., 8.125%, 5/20/2019 | | | 7,025,000 | | | | 9,304,395 | |
American Express Co.7, 6.80%, 9/1/2066 | | | 1,190,000 | | | | 1,215,585 | |
Credit Acceptance Corp., 9.125%, 2/1/2017 | | | 550,000 | | | | 598,125 | |
Discover Financial Services6, 5.20%, 4/27/2022 | | | 520,000 | | | | 539,656 | |
| | | | | | | | |
| | | | | | | 11,657,761 | |
| | | | | | | | |
| | |
Diversified Financial Services - 1.66% | | | | | | | | |
Bank of America Corp., 4.875%, 1/15/2013 | | | 1,800,000 | | | | 1,843,063 | |
Bank of America Corp., 5.75%, 8/15/2016 | | | 205,000 | | | | 213,966 | |
Bank of America Corp., 5.65%, 5/1/2018 | | | 460,000 | | | | 486,509 | |
Bank of America Corp., 7.625%, 6/1/2019 | | | 4,315,000 | | | | 4,973,266 | |
Bank of America Corp.8, 5.13%, 2/24/2026 | | | 353,000 | | | | 345,043 | |
Citigroup, Inc., 8.50%, 5/22/2019 | | | 7,080,000 | | | | 8,796,751 | |
CNH Capital LLC6, 6.25%, 11/1/2016 | | | 310,000 | | | | 330,537 | |
JPMorgan Chase & Co., 6.30%, 4/23/2019 | | | 2,000,000 | | | | 2,341,754 | |
JPMorgan Chase & Co., 4.95%, 3/25/2020 | | | 1,255,000 | | | | 1,378,171 | |
| | | | | | | | |
| | | | | | | 20,709,060 | |
| | | | | | | | |
| | |
Insurance - 0.22% | | | | | | | | |
American International Group, Inc., 4.25%, 5/15/2013 | | | 200,000 | | | | 204,016 | |
The accompanying notes are an integral part of the financial statements.
18
Investment Portfolio - April 30, 2012
(unaudited)
| | | | | | | | |
| PRO-BLEND® CONSERVATIVE TERM SERIES | | PRINCIPAL
AMOUNT | | | VALUE (NOTE 2) | |
| | |
CORPORATE BONDS (continued) | | | | | | | | |
| | |
Non-Convertible Corporate Bonds (continued) | | | | | | | | |
Financials (continued) | | | | | | | | |
Insurance (continued) | | | | | | | | |
Fidelity National Financial, Inc., 6.60%, 5/15/2017 | | $ | 1,075,000 | | | $ | 1,145,227 | |
Genworth Financial, Inc., 7.625%, 9/24/2021 | | | 1,165,000 | | | | 1,150,319 | |
Hartford Financial Services Group, Inc.7, 8.125%, 6/15/2038 | | | 235,000 | | | | 246,750 | |
| | | | | | | | |
| | | | | | | 2,746,312 | |
| | | | | | | | |
| | |
Real Estate Investment Trusts (REITS) - 2.64% | | | | | | | | |
BioMed Realty LP, 3.85%, 4/15/2016 | | | 470,000 | | | | 487,774 | |
Boston Properties LP, 5.875%, 10/15/2019 | | | 5,150,000 | | | | 5,966,033 | |
Camden Property Trust, 5.70%, 5/15/2017 | | | 2,270,000 | | | | 2,553,089 | |
Digital Realty Trust LP, 5.25%, 3/15/2021 | | | 880,000 | | | | 932,059 | |
DuPont Fabros Technology LP, 8.50%, 12/15/2017 | | | 450,000 | | | | 496,125 | |
HCP, Inc., 6.70%, 1/30/2018 | | | 6,255,000 | | | | 7,319,107 | |
Health Care REIT, Inc., 6.20%, 6/1/2016 | | | 520,000 | | | | 576,848 | |
Health Care REIT, Inc., 4.95%, 1/15/2021 | | | 4,000,000 | | | | 4,152,952 | |
Mack-Cali Realty LP, 7.75%, 8/15/2019 | | | 315,000 | | | | 387,515 | |
National Retail Properties, Inc., 6.875%, 10/15/2017 | | | 280,000 | | | | 321,409 | |
Simon Property Group LP, 10.35%, 4/1/2019 | | | 6,180,000 | | | | 8,573,149 | |
UDR, Inc., 4.625%, 1/10/2022 | | | 1,080,000 | | | | 1,129,580 | |
| | | | | | | | |
| | | | | | | 32,895,640 | |
| | | | | | | | |
Total Financials | | | | | | | 165,902,169 | |
| | | | | | | | |
Health Care - 1.00% | | | | | | | | |
Biotechnology - 0.57% | | | | | | | | |
Amgen, Inc., 3.45%, 10/1/2020 | | | 7,000,000 | | | | 7,161,784 | |
| | | | | | | | |
Health Care Equipment & Supplies - 0.13% | | | | | | | | |
Alere, Inc., 9.00%, 5/15/2016 | | | 577,000 | | | | 596,474 | |
Fresenius Medical Care US Finance, Inc., 6.875%, 7/15/2017 | | | 395,000 | | | | 432,031 | |
Fresenius US Finance II, Inc.6, 9.00%, 7/15/2015 | | | 470,000 | | | | 538,738 | |
| | | | | | | | |
| | | | | | | 1,567,243 | |
| | | | | | | | |
| | |
Health Care Providers & Services - 0.18% | | | | | | | | |
HCA, Inc., 6.50%, 2/15/2020 | | | 340,000 | | | | 363,800 | |
Health Management Associates, Inc., 6.125%, 4/15/2016 | | | 640,000 | | | | 672,000 | |
STHI Holding Corp.6, 8.00%, 3/15/2018 | | | 300,000 | | | | 319,500 | |
UnitedHealth Group, Inc., 4.70%, 2/15/2021 | | | 790,000 | | | | 901,177 | |
| | | | | | | | |
| | | | | | | 2,256,477 | |
| | | | | | | | |
| | |
Life Sciences Tools & Services - 0.04% | | | | | | | | |
Thermo Fisher Scientific, Inc., 4.50%, 3/1/2021 | | | 450,000 | | | | 514,559 | |
| | | | | | | | |
Pharmaceuticals - 0.08% | | | | | | | | |
Novartis Securities Investment Ltd. (Bermuda), 5.125%, 2/10/2019 | | | 525,000 | | | | 624,894 | |
The accompanying notes are an integral part of the financial statements.
19
Investment Portfolio - April 30, 2012
(unaudited)
| | | | | | | | |
| PRO-BLEND® CONSERVATIVE TERM SERIES | | PRINCIPAL
AMOUNT | | | VALUE (NOTE 2) | |
| | |
CORPORATE BONDS (continued) | | | | | | | | |
| | |
Non-Convertible Corporate Bonds (continued) | | | | | | | | |
Health Care (continued) | | | | | | | | |
Pharmaceuticals (continued) | | | | | | | | |
Valeant Pharmaceuticals International6, 6.75%, 8/15/2021 | | $ | 350,000 | | | $ | 340,375 | |
| | | | | | | | |
| | | | | | | 965,269 | |
| | | | | | | | |
Total Health Care | | | | | | | 12,465,332 | |
| | | | | | | | |
Industrials - 2.72% | | | | | | | | |
Aerospace & Defense - 0.26% | | | | | | | | |
The Boeing Co., 6.00%, 3/15/2019 | | | 2,410,000 | | | | 3,000,185 | |
Ducommun, Inc., 9.75%, 7/15/2018 | | | 295,000 | | | | 311,963 | |
| | | | | | | | |
| | | | | | | 3,312,148 | |
| | | | | | | | |
| | |
Air Freight & Logistics - 0.54% | | | | | | | | |
Aguila 3 S.A. (Luxembourg)6, 7.875%, 1/31/2018 | | | 570,000 | | | | 597,075 | |
FedEx Corp., 8.00%, 1/15/2019 | | | 4,690,000 | | | | 6,165,132 | |
| | | | | | | | |
| | | | | | | 6,762,207 | |
| | | | | | | | |
| | |
Airlines - 0.23% | | | | | | | | |
Continental Airlines, Inc.6, 6.75%, 9/15/2015 | | | 640,000 | | | | 655,200 | |
Delta Air Lines Pass-Through Trust, Series 2007-1, Class A, 6.821%, 8/10/2022 | | | 128,263 | | | | 138,845 | |
Delta Air Lines Pass-Through Trust, Series 2010-1, Class B, 6.375%, 1/2/2016 | | | 395,000 | | | | 395,000 | |
Delta Air Lines Pass-Through Trust, Series 2010-2, Class B, 6.75%, 11/23/2015 | | | 135,000 | | | | 135,675 | |
Southwest Airlines Co., 5.25%, 10/1/2014 | | | 355,000 | | | | 381,481 | |
Southwest Airlines Co., 5.75%, 12/15/2016 | | | 1,070,000 | | | | 1,190,521 | |
| | | | | | | | |
| | | | | | | 2,896,722 | |
| | | | | | | | |
| | |
Building Products - 0.09% | | | | | | | | |
Building Materials Corp. of America6, 6.875%, 8/15/2018 | | | 175,000 | | | | 183,750 | |
Building Materials Corp. of America6, 7.50%, 3/15/2020 | | | 315,000 | | | | 335,475 | |
Owens Corning, 9.00%, 6/15/2019 | | | 445,000 | | | | 552,110 | |
| | | | | | | | |
| | | | | | | 1,071,335 | |
| | | | | | | | |
| | |
Commercial Services & Supplies - 0.37% | | | | | | | | |
Garda World Security Corp. (Canada)6, 9.75%, 3/15/2017 | | | 435,000 | | | | 461,100 | |
International Lease Finance Corp., 8.625%, 1/15/2022 | | | 295,000 | | | | 337,448 | |
Waste Management, Inc., 7.375%, 3/11/2019 | | | 3,000,000 | | | | 3,815,145 | |
| | | | | | | | |
| | | | | | | 4,613,693 | |
| | | | | | | | |
| | |
Industrial Conglomerates - 0.75% | | | | | | | | |
General Electric Capital Corp., 5.625%, 5/1/2018 | | | 1,800,000 | | | | 2,086,243 | |
General Electric Capital Corp., 5.50%, 1/8/2020 | | | 2,610,000 | | | | 2,984,261 | |
General Electric Co., 5.25%, 12/6/2017 | | | 180,000 | | | | 210,063 | |
Textron, Inc., 5.60%, 12/1/2017 | | | 3,150,000 | | | | 3,447,218 | |
Textron, Inc., 7.25%, 10/1/2019 | | | 350,000 | | | | 407,790 | |
The accompanying notes are an integral part of the financial statements.
20
Investment Portfolio - April 30, 2012
(unaudited)
| | | | | | | | |
| PRO-BLEND® CONSERVATIVE TERM SERIES | | PRINCIPAL
AMOUNT | | | VALUE (NOTE 2) | |
| | |
CORPORATE BONDS (continued) | | | | | | | | |
| | |
Non-Convertible Corporate Bonds (continued) | | | | | | | | |
Industrials (continued) | | | | | | | | |
Industrial Conglomerates (continued) | | | | | | | | |
Tyco Electronics Group S.A. (Luxembourg), 4.875%, 1/15/2021 | | $ | 170,000 | | | $ | 187,460 | |
| | | | | | | | |
| | | | | | | 9,323,035 | |
| | | | | | | | |
| | |
Machinery - 0.32% | | | | | | | | |
Caterpillar Financial Services Corp., 7.05%, 10/1/2018 | | | 305,000 | | | | 391,080 | |
Dynacast International LLC - Dynacast Finance, Inc.6, 9.25%, 7/15/2019 | | | 430,000 | | | | 451,500 | |
John Deere Capital Corp., 5.75%, 9/10/2018 | | | 2,060,000 | | | | 2,517,135 | |
Kennametal, Inc., 3.875%, 2/15/2022 | | | 570,000 | | | | 580,931 | |
| | | | | | | | |
| | | | | | | 3,940,646 | |
| | | | | | | | |
| | |
Marine - 0.04% | | | | | | | | |
Navios Maritime Holdings, Inc. - Navios Maritime Finance US, Inc. (Marshall Island), 8.875%, 11/1/2017 | | | 485,000 | | | | 498,337 | |
| | | | | | | | |
Road & Rail - 0.12% | | | | | | | | |
Avis Budget Car Rental LLC - Avis Budget Finance, Inc., 8.25%, 1/15/2019 | | | 320,000 | | | | 335,200 | |
JB Hunt Transport Services, Inc., 3.375%, 9/15/2015 | | | 935,000 | | | | 968,043 | |
Union Pacific Corp., 5.65%, 5/1/2017 | | | 175,000 | | | | 205,208 | |
| | | | | | | | |
| | | | | | | 1,508,451 | |
| | | | | | | | |
Total Industrials | | | | | | | 33,926,574 | |
| | | | | | | | |
Information Technology - 0.54% | | | | | | | | |
Communications Equipment - 0.08% | | | | | | | | |
Hughes Satellite Systems Corp., 6.50%, 6/15/2019 | | | 580,000 | | | | 620,600 | |
ViaSat, Inc.6, 6.875%, 6/15/2020 | | | 300,000 | | | | 303,750 | |
| | | | | | | | |
| | | | | | | 924,350 | |
| | | | | | | | |
| | |
Electronic Equipment, Instruments & Components - 0.36% | | | | | | | | |
Amphenol Corp., 4.00%, 2/1/2022 | | | 305,000 | | | | 312,387 | |
Corning, Inc., 6.625%, 5/15/2019 | | | 3,200,000 | | | | 3,881,968 | |
CPI International, Inc., 8.00%, 2/15/2018 | | | 275,000 | | | | 242,344 | |
| | | | | | | | |
| | | | | | | 4,436,699 | |
| | | | | | | | |
| | |
IT Services - 0.05% | | | | | | | | |
The Western Union Co., 5.253%, 4/1/2020 | | | 590,000 | | | | 669,857 | |
| | | | | | | | |
Semiconductors & Semiconductor Equipment - 0.02% | | | | | | | | |
Advanced Micro Devices, Inc., 7.75%, 8/1/2020 | | | 85,000 | | | | 93,713 | |
MagnaChip Semiconductor S.A. - MagnaChip Semiconductor Finance Co., 10.50%, 4/15/2018 | | | 180,000 | | | | 202,050 | |
| | | | | | | | |
| | | | | | | 295,763 | |
| | | | | | | | |
| | |
Software - 0.03% | | | | | | | | |
Sophia LP - Sophia Finance, Inc.6, 9.75%, 1/15/2019 | | | 315,000 | | | | 337,837 | |
| | | | | | | | |
Total Information Technology | | | | | | | 6,664,506 | |
| | | | | | | | |
The accompanying notes are an integral part of the financial statements.
21
Investment Portfolio - April 30, 2012
(unaudited)
| | | | | | | | |
| PRO-BLEND® CONSERVATIVE TERM SERIES | | PRINCIPAL
AMOUNT | | | VALUE (NOTE 2) | |
| | |
CORPORATE BONDS (continued) | | | | | | | | |
| | |
Non-Convertible Corporate Bonds (continued) | | | | | | | | |
Materials - 1.76% | | | | | | | | |
Chemicals - 0.09% | | | | | | | | |
E.I. du Pont de Nemours & Co., 6.00%, 7/15/2018 | | $ | 320,000 | | | $ | 397,208 | |
LyondellBasell Industries N.V. (Netherlands)6, 5.00%, 4/15/2019 | | | 340,000 | | | | 351,050 | |
Taminco Global Chemical Corp.6, 9.75%, 3/31/2020 | | | 320,000 | | | | 334,400 | |
| | | | | | | | |
| | | | | | | 1,082,658 | |
| | | | | | | | |
| | |
Containers & Packaging - 0.06% | | | | | | | | |
Longview Fibre Paper & Packaging, Inc.6, 8.00%, 6/1/2016 | | | 290,000 | | | | 292,900 | |
Reynolds Group Issuer, Inc. - Reynolds Group Issuer LLC6, 9.875%, 8/15/2019 | | | 480,000 | | | | 500,400 | |
| | | | | | | | |
| | | | | | | 793,300 | |
| | | | | | | | |
| | |
Metals & Mining - 0.65% | | | | | | | | |
Alcoa, Inc., 5.72%, 2/23/2019 | | | 2,032,000 | | | | 2,198,677 | |
Alcoa, Inc., 5.87%, 2/23/2022 | | | 295,000 | | | | 315,503 | |
Allegheny Technologies, Inc., 5.95%, 1/15/2021 | | | 550,000 | | | | 609,562 | |
ArcelorMittal (Luxembourg), 5.50%, 3/1/2021 | | | 930,000 | | | | 916,024 | |
BHP Billiton Finance (USA) Ltd. (Australia), 6.50%, 4/1/2019 | | | 925,000 | | | | 1,170,897 | |
Calcipar S.A. (Luxembourg)6, 6.875%, 5/1/2018 | | | 340,000 | | | | 348,500 | |
Cliffs Natural Resources, Inc., 4.80%, 10/1/2020 | | | 615,000 | | | | 645,121 | |
FMG Resources August 2006 Pty. Ltd. (Australia)6, 6.875%, 2/1/2018 | | | 485,000 | | | | 498,337 | |
Rio Tinto Finance USA Ltd. (Australia), 3.75%, 9/20/2021 | | | 770,000 | | | | 815,924 | |
Teck Resources Ltd. (Canada), 3.00%, 3/1/2019 | | | 575,000 | | | | 574,280 | |
| | | | | | | | |
| | | | | | | 8,092,825 | |
| | | | | | | | |
| | |
Paper & Forest Products - 0.96% | | | | | | | | |
International Paper Co., 9.375%, 5/15/2019 | | | 8,500,000 | | | | 11,360,080 | |
International Paper Co., 7.50%, 8/15/2021 | | | 490,000 | | | | 622,080 | |
| | | | | | | | |
| | | | | | | 11,982,160 | |
| | | | | | | | |
Total Materials | | | | | | | 21,950,943 | |
| | | | | | | | |
Telecommunication Services - 0.43% | | | | | | | | |
Diversified Telecommunication Services - 0.27% | | | | | | | | |
Inmarsat Finance plc (United Kingdom)6, 7.375%, 12/1/2017 | | | 675,000 | | | | 725,625 | |
Sable International Finance Ltd. (Cayman Islands)6, 8.75%, 2/1/2020 | | | 370,000 | | | | 393,125 | |
UPCB Finance III Ltd. (Cayman Islands)6, 6.625%, 7/1/2020 | | | 340,000 | | | | 345,100 | |
UPCB Finance VI Ltd. (Cayman Islands)6, 6.875%, 1/15/2022 | | | 345,000 | | | | 354,487 | |
Verizon Communications, Inc., 3.00%, 4/1/2016 | | | 475,000 | | | | 506,423 | |
Wind Acquisition Finance S.A. (Luxembourg)6, 11.75%, 7/15/2017 | | | 160,000 | | | | 157,200 | |
Wind Acquisition Finance S.A. (Luxembourg)6, 7.25%, 2/15/2018 | | | 630,000 | | | | 598,500 | |
Windstream Corp., 7.50%, 6/1/2022 | | | 295,000 | | | | 309,013 | |
| | | | | | | | |
| | | | | | | 3,389,473 | |
| | | | | | | | |
| | |
Wireless Telecommunication Services - 0.16% | | | | | | | | |
CC Holdings GS V LLC - Crown Castle GS III Corp.6, 7.75%, 5/1/2017 | | | 550,000 | | | | 599,500 | |
The accompanying notes are an integral part of the financial statements.
22
Investment Portfolio - April 30, 2012
(unaudited)
| | | | | | | | |
| PRO-BLEND® CONSERVATIVE TERM SERIES | | PRINCIPAL
AMOUNT/
SHARES | | | VALUE (NOTE 2) | |
| | |
CORPORATE BONDS (continued) | | | | | | | | |
| | |
Non-Convertible Corporate Bonds (continued) | | | | | | | | |
Telecommunication Services (continued) | | | | | | | | |
Wireless Telecommunication Services (continued) | | | | | | | | |
Crown Castle Towers LLC6, 6.113%, 1/15/2020 | | $ | 390,000 | | | $ | 445,369 | |
Crown Castle Towers LLC6, 4.883%, 8/15/2020 | | | 224,000 | | | | 237,600 | |
NII Capital Corp., 8.875%, 12/15/2019 | | | 230,000 | | | | 231,725 | |
NII Capital Corp., 7.625%, 4/1/2021 | | | 305,000 | | | | 283,650 | |
SBA Tower Trust6, 5.101%, 4/15/2017 | | | 200,000 | | | | 217,641 | |
| | | | | | | | |
| | | | | | | 2,015,485 | |
| | | | | | | | |
Total Telecommunication Services | | | | | | | 5,404,958 | |
| | | | | | | | |
Utilities - 0.52% | | | | | | | | |
Electric Utilities - 0.51% | | | | | | | | |
Allegheny Energy Supply Co. LLC6, 5.75%, 10/15/2019 | | | 365,000 | | | | 402,211 | |
Exelon Generation Co. LLC, 5.20%, 10/1/2019 | | | 5,000,000 | | | | 5,632,165 | |
Southwestern Electric Power Co., 6.45%, 1/15/2019 | | | 335,000 | | | | 401,398 | |
| | | | | | | | |
| | | | | | | 6,435,774 | |
| | | | | | | | |
| | |
Multi-Utilities - 0.01% | | | | | | | | |
CenterPoint Energy Resources Corp., Series B, 7.875%, 4/1/2013 | | | 85,000 | | | | 90,300 | |
| | | | | | | | |
Total Utilities | | | | | | | 6,526,074 | |
| | | | | | | | |
Total Non-Convertible Corporate Bonds | | | | | | | | |
(Identified Cost $316,424,150) | | | | | | | 338,527,930 | |
| | | | | | | | |
TOTAL CORPORATE BONDS | | | | | | | | |
(Identified Cost $317,456,944) | | | | | | | 339,620,155 | |
| | | | | | | | |
| | |
MUTUAL FUNDS - 0.23% | | | | | | | | |
| | |
iShares iBoxx Investment Grade Corporate Bond Fund | | | | | | | | |
(Identified Cost $2,896,457) | | | 24,610 | | | | 2,866,573 | |
| | | | | | | | |
| | |
U.S. TREASURY SECURITIES - 4.43% | | | | | | | | |
| | |
U.S. Treasury Notes - 4.43% | | | | | | | | |
U.S. Treasury Note, 0.625%, 2/28/2013 | | $ | 10,000,000 | | | | 10,035,550 | |
U.S. Treasury Note, 0.25%, 1/31/2014 | | | 8,000,000 | | | | 8,000,312 | |
U.S. Treasury Note, 2.125%, 12/31/2015 | | | 13,800,000 | | | | 14,602,125 | |
U.S. Treasury Note, 2.00%, 4/30/2016 | | | 5,000,000 | | | | 5,276,170 | |
U.S. Treasury Note, 2.75%, 12/31/2017 | | | 12,650,000 | | | | 13,887,322 | |
U.S. Treasury Note, 3.75%, 11/15/2018 | | | 3,000,000 | | | | 3,488,907 | |
| | | | | | | | |
| | |
TOTAL U.S. TREASURY SECURITIES | | | | | | | | |
(Identified Cost $52,918,436) | | | | | | | 55,290,386 | |
| | | | | | | | |
The accompanying notes are an integral part of the financial statements.
23
Investment Portfolio - April 30, 2012
(unaudited)
| | | | | | | | |
| PRO-BLEND® CONSERVATIVE TERM SERIES | | PRINCIPAL
AMOUNT | | | VALUE (NOTE 2) | |
| | |
ASSET-BACKED SECURITIES - 0.38% | | | | | | | | |
| | |
Credit Acceptance Auto Loan Trust, Series 2012-1A, Class A6, 2.20%, 9/16/2019 | | $ | 2,560,000 | | | $ | 2,566,788 | |
FDIC Trust, Series 2011-R1, Class A6, 2.672%, 7/25/2026 | | | 1,605,194 | | | | 1,648,757 | |
Hertz Vehicle Financing LLC, Series 2009-2A, Class A26, 5.29%, 3/25/2016 | | | 170,000 | | | | 186,333 | |
Hertz Vehicle Financing LLC, Series 2010-1A, Class A26, 3.74%, 2/25/2017 | | | 300,000 | | | | 317,819 | |
| | | | | | | | |
TOTAL ASSET-BACKED SECURITIES | | | | | | | | |
(Identified Cost $4,634,493) | | | | | | | 4,719,697 | |
| | | | | | | | |
| | |
COMMERCIAL MORTGAGE-BACKED SECURITIES - 1.96% | | | | | | | | |
| | |
Americold LLC Trust, Series 2010-ARTA, Class A16, 3.847%, 1/14/2029 | | | 450,169 | | | | 477,288 | |
Banc of America Merrill Lynch Commercial Mortgage, Inc., Series 2006-2, Class A47, 5.731%, 5/10/2045 | | | 100,000 | | | | 114,175 | |
Banc of America Merrill Lynch Commercial Mortgage, Inc., Series 2006-4, Class A4, 5.634%, 7/10/2046 | | | 1,500,000 | | | | 1,695,118 | |
Bear Stearns Commercial Mortgage Securities, Series 2005-PWR9, Class A4A, 4.871%, 9/11/2042 | | | 900,000 | | | | 986,643 | |
Bear Stearns Commercial Mortgage Securities, Series 2006-PW12, Class A47, 5.719%, 9/11/2038 | | | 795,000 | | | | 905,394 | |
Bear Stearns Commercial Mortgage Securities, Series 2006-PW13, Class A4, 5.54%, 9/11/2041 | | | 950,000 | | | | 1,079,633 | |
CFCRE Commercial Mortgage Trust, Series 2011-C1, Class A26, 3.759%, 4/15/2044 | | | 660,000 | | | | 702,021 | |
Citigroup - Deutsche Bank Commercial Mortgage Trust, Series 2005-CD1, Class A47, 5.213%, 7/15/2044 | | | 550,000 | | | | 612,995 | |
Citigroup Commercial Mortgage Trust, Series 2006-C4, Class A37, 5.73%, 3/15/2049 | | | 100,000 | | | | 112,968 | |
Commercial Mortgage Pass-Through Certificates, Series 2006-C7, Class A47, 5.749%, 6/10/2046 | | | 400,000 | | | | 452,568 | |
Commercial Mortgage Pass-Through Certificates, Series 2010-C1, Class A16, 3.156%, 7/10/2046 | | | 247,242 | | | | 258,347 | |
DBUBS Mortgage Trust, Series 2011-LC1A, Class A16, 3.742%, 11/10/2046 | | | 980,534 | | | | 1,047,548 | |
FREMF Mortgage Trust, Series 2011-K701, Class B6,7, 4.287%, 7/25/2048 | | | 1,000,000 | | | | 1,019,610 | |
FREMF Mortgage Trust, Series 2011-K702, Class B6,7, 4.77%, 4/25/2044 | | | 1,430,000 | | | | 1,461,729 | |
Greenwich Capital Commercial Funding Corp., Series 2006-GG7, Class A47, 5.874%, 7/10/2038 | | | 500,000 | | | | 569,895 | |
GS Mortgage Securities Corp. II, Series 2010-C2, Class A16, 3.849%, 12/10/2043 | | | 1,257,530 | | | | 1,352,251 | |
JP Morgan Chase Commercial Mortgage Securities Corp., Series 2005-CB13, Class A47, 5.284%, 1/12/2043 | | | 1,370,000 | | | | 1,498,950 | |
JP Morgan Chase Commercial Mortgage Securities Corp., Series 2005-LDP5, Class A47, 5.198%, 12/15/2044 | | | 325,000 | | | | 363,781 | |
JP Morgan Chase Commercial Mortgage Securities Corp., Series 2006-LDP7, Class A47, 5.87%, 4/15/2045 | | | 1,230,000 | | | | 1,407,878 | |
LB-UBS Commercial Mortgage Trust, Series 2006-C4, Class A47, 5.87%, 6/15/2038 | | | 1,290,000 | | | | 1,471,954 | |
LSTAR Commercial Mortgage Trust, Series 2011-1, Class A6, 3.913%, 6/25/2043 | | | 1,247,757 | | | | 1,312,571 | |
Merrill Lynch - Countrywide Commercial Mortgage Trust, Series 2006-3, Class A47, 5.414%, 7/12/2046 | | | 100,000 | | | | 111,836 | |
Morgan Stanley Capital I, Series 2005-IQ10, Class A4A7, 5.23%, 9/15/2042 | | | 750,000 | | | | 827,071 | |
Morgan Stanley Capital I, Series 2011-C1, Class A26, 3.884%, 9/15/2047 | | | 800,000 | | | | 856,174 | |
The accompanying notes are an integral part of the financial statements.
24
Investment Portfolio - April 30, 2012
(unaudited)
| | | | | | | | |
| PRO-BLEND® CONSERVATIVE TERM SERIES | | PRINCIPAL
AMOUNT | | | VALUE (NOTE 2) | |
| | |
COMMERCIAL MORTGAGE-BACKED SECURITIES (continued) | | | | | | | | |
| | |
Vornado DP LLC, Series 2010-VNO, Class A2FX6, 4.004%, 9/13/2028 | | $ | 155,000 | | | $ | 168,428 | |
Wachovia Bank Commercial Mortgage Trust, Series 2005-C21,
Class A47, 5.204%, 10/15/2044 | | | 100,000 | | | | 110,437 | |
Wachovia Bank Commercial Mortgage Trust, Series 2006-C25,
Class A47, 5.734%, 5/15/2043 | | | 100,000 | | | | 113,432 | |
Wachovia Bank Commercial Mortgage Trust, Series 2006-C26,
Class A37, 6.004%, 6/15/2045 | | | 1,090,000 | | | | 1,249,048 | |
Wells Fargo Commercial Mortgage Trust, Series 2010-C1,
Class A26, 4.393%, 11/15/2043 | | | 265,000 | | | | 293,843 | |
WF-RBS Commercial Mortgage Trust, Series 2011-C2,
Class A26, 3.791%, 2/15/2044 | | | 1,670,000 | | | | 1,774,213 | |
| | | | | | | | |
TOTAL COMMERCIAL MORTGAGE-BACKED SECURITIES
(Identified Cost $23,277,503) | | | | | | | 24,407,799 | |
| | | | | | | | |
| | |
FOREIGN GOVERNMENT BONDS - 3.25% | | | | | | | | |
| | |
Province of British Columbia Canada (Canada), 2.85%, 6/15/2015 | | | 5,100,000 | | | | 5,425,171 | |
Province of Manitoba Canada (Canada), 2.625%, 7/15/2015 | | | 1,000,000 | | | | 1,056,763 | |
Province of Manitoba Canada, Series FH (Canada), 4.90%, 12/6/2016 | | | 2,620,000 | | | | 3,057,181 | |
Province of New Brunswick Canada (Canada), 5.20%, 2/21/2017 | | | 5,000,000 | | | | 5,880,200 | |
Province of Nova Scotia Canada (Canada), 5.125%, 1/26/2017 | | | 2,000,000 | | | | 2,344,298 | |
Province of Ontario Canada (Canada), 2.30%, 5/10/2016 | | | 10,315,000 | | | | 10,733,376 | |
Province of Quebec Canada (Canada), 5.125%, 11/14/2016 | | | 9,100,000 | | | | 10,624,905 | |
Republic of Italy (Italy), 2.125%, 10/5/2012 | | | 1,460,000 | | | | 1,459,422 | |
| | | | | | | | |
| | |
TOTAL FOREIGN GOVERNMENT BONDS
(Identified Cost $40,059,808) | | | | | | | 40,581,316 | |
| | | | | | | | |
| | |
U.S. GOVERNMENT AGENCIES - 35.46% | | | | | | | | |
| | |
Mortgage-Backed Securities - 11.23% | | | | | | | | |
Fannie Mae, Pool #805347, 5.50%, 1/1/2020 | | | 6,510 | | | | 7,157 | |
Fannie Mae, Pool #816064, 4.50%, 4/1/2020 | | | 73,222 | | | | 80,139 | |
Fannie Mae, Pool #851149, 5.00%, 4/1/2021 | | | 90,718 | | | | 98,623 | |
Fannie Mae, Pool #888468, 5.50%, 9/1/2021 | | | 3,058,146 | | | | 3,349,466 | |
Fannie Mae, Pool #995233, 5.50%, 10/1/2021 | | | 210,947 | | | | 231,173 | |
Fannie Mae, Pool #888017, 6.00%, 11/1/2021 | | | 264,287 | | | | 289,777 | |
Fannie Mae, Pool #995329, 5.50%, 12/1/2021 | | | 1,928,680 | | | | 2,112,407 | |
Fannie Mae, Pool #888136, 6.00%, 12/1/2021 | | | 340,645 | | | | 373,500 | |
Fannie Mae, Pool #899287, 5.00%, 2/1/2022 | | | 33,912 | | | | 36,793 | |
Fannie Mae, Pool #888815, 4.50%, 11/1/2022 | | | 286,898 | | | | 309,156 | |
Fannie Mae, Pool #888810, 5.50%, 11/1/2022 | | | 3,381,699 | | | | 3,703,841 | |
Fannie Mae, Pool #AA1563, 4.50%, 2/1/2024 | | | 395,649 | | | | 425,108 | |
Fannie Mae, Pool #AC1557, 4.50%, 9/1/2024 | | | 632,592 | | | | 679,693 | |
Fannie Mae, Pool #AD0462, 5.50%, 10/1/2024 | | | 203,162 | | | | 222,028 | |
Fannie Mae, Pool #357319, 6.00%, 12/1/2032 | | | 66,599 | | | | 74,656 | |
Fannie Mae, Pool #790393, 6.50%, 9/1/2034 | | | 1,609 | | | | 1,835 | |
The accompanying notes are an integral part of the financial statements.
25
Investment Portfolio - April 30, 2012
(unaudited)
| | | | | | | | |
| PRO-BLEND® CONSERVATIVE TERM SERIES | | PRINCIPAL
AMOUNT | | | VALUE
(NOTE 2) | |
| | |
U.S. GOVERNMENT AGENCIES (continued) | | | | | | | | |
| | |
Mortgage-Backed Securities (continued) | | | | | | | | |
Fannie Mae, Pool #745147, 4.50%, 12/1/2035 | | $ | 233,869 | | | $ | 250,656 | |
Fannie Mae, Pool #745418, 5.50%, 4/1/2036 | | | 5,306,481 | | | | 5,833,191 | |
Fannie Mae, Pool #886904, 6.50%, 9/1/2036 | | | 453,155 | | | | 512,091 | |
Fannie Mae, Pool #901895, 6.50%, 9/1/2036 | | | 37,126 | | | | 41,955 | |
Fannie Mae, Pool #888021, 6.00%, 12/1/2036 | | | 2,112,980 | | | | 2,342,849 | |
Fannie Mae, Pool #909786, 5.50%, 3/1/2037 | | | 2,034,073 | | | | 2,225,800 | |
Fannie Mae, Pool #899393, 6.00%, 4/1/2037 | | | 69,118 | | | | 76,637 | |
Fannie Mae, Pool #939487, 5.00%, 6/1/2037 | | | 36,979 | | | | 40,182 | |
Fannie Mae, Pool #918516, 5.50%, 6/1/2037 | | | 1,066,640 | | | | 1,167,179 | |
Fannie Mae, Pool #949709, 6.50%, 9/1/2037 | | | 824 | | | | 931 | |
Fannie Mae, Pool #950248, 6.00%, 10/1/2037 | | | 104,780 | | | | 116,178 | |
Fannie Mae, Pool #960196, 5.00%, 11/1/2037 | | | 17,487 | | | | 19,002 | |
Fannie Mae, Pool #933521, 5.00%, 1/1/2038 | | | 273,981 | | | | 297,713 | |
Fannie Mae, Pool #929084, 5.00%, 2/1/2038 | | | 112,006 | | | | 121,708 | |
Fannie Mae, Pool #972107, 5.00%, 2/1/2038 | | | 409,152 | | | | 444,593 | |
Fannie Mae, Pool #961950, 5.00%, 3/1/2038 | | | 3,529 | | | | 3,834 | |
Fannie Mae, Pool #973091, 5.00%, 3/1/2038 | | | 13,343 | | | | 14,499 | |
Fannie Mae, Pool #889260, 5.00%, 4/1/2038 | | | 218,662 | | | | 237,603 | |
Fannie Mae, Pool #912948, 5.00%, 5/1/2038 | | | 543,872 | | | | 590,982 | |
Fannie Mae, Pool #975840, 5.00%, 5/1/2038 | | | 412,360 | | | | 448,079 | |
Fannie Mae, Pool #976516, 5.00%, 5/1/2038 | | | 17,734 | | | | 19,270 | |
Fannie Mae, Pool #981636, 5.00%, 6/1/2038 | | | 11,745 | | | | 12,762 | |
Fannie Mae, Pool #981650, 5.00%, 6/1/2038 | | | 183,993 | | | | 199,931 | |
Fannie Mae, Pool #985554, 5.00%, 6/1/2038 | | | 23,438 | | | | 25,468 | |
Fannie Mae, Pool #982317, 6.00%, 6/1/2038 | | | 43,036 | | | | 47,623 | |
Fannie Mae, Pool #934329, 5.00%, 7/1/2038 | | | 156,315 | | | | 169,856 | |
Fannie Mae, Pool #995196, 6.00%, 7/1/2038 | | | 7,823,134 | | | | 8,674,206 | |
Fannie Mae, Pool #986458, 6.00%, 8/1/2038 | | | 197,723 | | | | 218,800 | |
Fannie Mae, Pool #987831, 6.00%, 9/1/2038 | | | 548,050 | | | | 606,473 | |
Fannie Mae, Pool #988990, 6.00%, 9/1/2038 | | | 12,081 | | | | 13,369 | |
Fannie Mae, Pool #990897, 6.00%, 9/1/2038 | | | 1,066,693 | | | | 1,180,404 | |
Fannie Mae, Pool #AD0220, 6.00%, 10/1/2038 | | | 969,741 | | | | 1,075,238 | |
Fannie Mae, Pool #983839, 5.00%, 11/1/2038 | | | 15,877 | | | | 17,253 | |
Fannie Mae, Pool #993920, 6.00%, 11/1/2038 | | | 325,608 | | | | 360,318 | |
Fannie Mae, Pool #257497, 6.00%, 12/1/2038 | | | 236,617 | | | | 261,840 | |
Fannie Mae, Pool #AA0675, 6.00%, 12/1/2038 | | | 202,808 | | | | 224,428 | |
Fannie Mae, Pool #971022, 5.00%, 1/1/2039 | | | 445,343 | | | | 483,919 | |
Fannie Mae, Pool #992293, 5.00%, 1/1/2039 | | | 141,431 | | | | 153,682 | |
Fannie Mae, Pool #994216, 5.00%, 1/1/2039 | | | 33,950 | | | | 36,891 | |
Fannie Mae, Pool #AA1717, 5.00%, 1/1/2039 | | | 166,635 | | | | 181,069 | |
Fannie Mae, Pool #AA1810, 5.00%, 1/1/2039 | | | 447,998 | | | | 487,365 | |
Fannie Mae, Pool #988811, 6.00%, 1/1/2039 | | | 240,097 | | | | 265,692 | |
Fannie Mae, Pool #983686, 5.00%, 2/1/2039 | | | 595,601 | | | | 647,937 | |
The accompanying notes are an integral part of the financial statements.
26
Investment Portfolio - April 30, 2012
(unaudited)
| | | | | | | | |
| PRO-BLEND® CONSERVATIVE TERM SERIES | | PRINCIPAL
AMOUNT | | | VALUE
(NOTE 2) | |
| | |
U.S. GOVERNMENT AGENCIES (continued) | | | | | | | | |
| | |
Mortgage-Backed Securities (continued) | | | | | | | | |
Fannie Mae, Pool #AA1686, 5.00%, 3/1/2039 | | $ | 117,423 | | | $ | 127,741 | |
Fannie Mae, Pool #AA4461, 5.00%, 3/1/2039 | | | 25,080 | | | | 27,284 | |
Fannie Mae, Pool #AA3636, 6.00%, 3/1/2039 | | | 143,430 | | | | 158,719 | |
Fannie Mae, Pool #AA5087, 5.00%, 4/1/2039 | | | 38,214 | | | | 41,572 | |
Fannie Mae, Pool #AA7681, 4.50%, 6/1/2039 | | | 6,292,412 | | | | 6,741,115 | |
Fannie Mae, Pool #AD0527, 5.50%, 6/1/2039 | | | 2,082,160 | | | | 2,278,420 | |
Fannie Mae, Pool #AA6788, 6.00%, 8/1/2039 | | | 854,669 | | | | 945,778 | |
Fannie Mae, Pool #AC2881, 6.00%, 8/1/2039 | | | 143,115 | | | | 158,371 | |
Fannie Mae, Pool #AC1901, 5.00%, 9/1/2039 | | | 172,884 | | | | 190,183 | |
Fannie Mae, Pool #AC0463, 5.00%, 11/1/2039 | | | 350,178 | | | | 380,948 | |
Fannie Mae, Pool #AC5111, 5.00%, 11/1/2039 | | | 849,886 | | | | 924,566 | |
Fannie Mae, Pool #MA0258, 4.50%, 12/1/2039 | | | 7,278,290 | | | | 7,797,295 | |
Fannie Mae, Pool #MA0259, 5.00%, 12/1/2039 | | | 295,032 | | | | 320,957 | |
Fannie Mae, Pool #AC8573, 5.00%, 1/1/2040 | | | 642,845 | | | | 699,332 | |
Fannie Mae, Pool #AC8791, 5.00%, 1/1/2040 | | | 28,844 | | | | 31,478 | |
Fannie Mae, Pool #AE0061, 6.00%, 2/1/2040 | | | 3,130,752 | | | | 3,465,286 | |
Fannie Mae, Pool #AE0951, 4.50%, 2/1/2041 | | | 4,422,947 | | | | 4,738,341 | |
Fannie Mae, Pool #AH9054, 4.50%, 4/1/2041 | | | 1,679,113 | | | | 1,802,783 | |
Fannie Mae, Pool #AI2468, 4.50%, 5/1/2041 | | | 1,020,132 | | | | 1,095,267 | |
Fannie Mae, Pool #AL0160, 4.50%, 5/1/2041 | | | 4,223,104 | | | | 4,534,145 | |
Fannie Mae, Pool #AJ1415, 4.50%, 9/1/2041 | | | 1,096,171 | | | | 1,176,906 | |
Fannie Mae, Pool #AE0604, 6.00%, 7/1/2039 | | | 7,288,665 | | | | 8,105,726 | |
Freddie Mac, Pool #B16835, 5.50%, 10/1/2019 | | | 4,720 | | | | 5,138 | |
Freddie Mac, Pool #G11850, 5.50%, 7/1/2020 | | | 1,101,380 | | | | 1,199,047 | |
Freddie Mac, Pool #G11912, 5.50%, 3/1/2021 | | | 140,088 | | | | 153,430 | |
Freddie Mac, Pool #G12610, 6.00%, 3/1/2022 | | | 334,044 | | | | 362,114 | |
Freddie Mac, Pool #G12655, 6.00%, 5/1/2022 | | | 233,107 | | | | 252,695 | |
Freddie Mac, Pool #J06512, 5.00%, 12/1/2022 | | | 54,292 | | | | 58,604 | |
Freddie Mac, Pool #G12966, 5.50%, 1/1/2023 | | | 23,921 | | | | 25,952 | |
Freddie Mac, Pool #G12988, 6.00%, 1/1/2023 | | | 192,522 | | | | 208,579 | |
Freddie Mac, Pool #G13078, 6.00%, 3/1/2023 | | | 339,727 | | | | 373,953 | |
Freddie Mac, Pool #G13136, 4.50%, 5/1/2023 | | | 37,622 | | | | 40,245 | |
Freddie Mac, Pool #G13331, 5.50%, 10/1/2023 | | | 164,721 | | | | 178,710 | |
Freddie Mac, Pool #G01736, 6.50%, 9/1/2034 | | | 4,619 | | | | 5,287 | |
Freddie Mac, Pool #G08216, 5.50%, 8/1/2037 | | | 3,336,440 | | | | 3,637,892 | |
Freddie Mac, Pool #G03332, 6.00%, 10/1/2037 | | | 374,032 | | | | 413,261 | |
Freddie Mac, Pool #G03696, 5.50%, 1/1/2038 | | | 1,614,278 | | | | 1,760,130 | |
Freddie Mac, Pool #G03926, 6.00%, 2/1/2038 | | | 6,703,638 | | | | 7,406,734 | |
Freddie Mac, Pool #G04731, 5.50%, 4/1/2038 | | | 3,962,087 | | | | 4,320,067 | |
Freddie Mac, Pool #G04176, 5.50%, 5/1/2038 | | | 1,695,043 | | | | 1,847,134 | |
Freddie Mac, Pool #A78227, 5.50%, 6/1/2038 | | | 1,266,241 | | | | 1,379,856 | |
Freddie Mac, Pool #G08273, 5.50%, 6/1/2038 | | | 3,902,631 | | | | 4,252,800 | |
Freddie Mac, Pool #G04471, 5.50%, 7/1/2038 | | | 680,400 | | | | 741,450 | |
The accompanying notes are an integral part of the financial statements.
27
Investment Portfolio - April 30, 2012
(unaudited)
| | | | | | | | |
| PRO-BLEND® CONSERVATIVE TERM SERIES | | PRINCIPAL
AMOUNT | | | VALUE (NOTE 2) | |
| | |
U.S. GOVERNMENT AGENCIES (continued) | | | | | | | | |
| | |
Mortgage-Backed Securities (continued) | | | | | | | | |
Freddie Mac, Pool #G05671, 5.50%, 8/1/2038 | | $ | 2,978,744 | | | $ | 3,252,533 | |
Freddie Mac, Pool #A86522, 4.50%, 5/1/2039 | | | 9,475,631 | | | | 10,109,869 | |
Freddie Mac, Pool #G06021, 5.50%, 1/1/2040 | | | 3,609,368 | | | | 3,935,480 | |
Freddie Mac, Pool #G05923, 5.50%, 2/1/2040 | | | 3,169,961 | | | | 3,456,372 | |
Freddie Mac, Pool #G05900, 6.00%, 3/1/2040 | | | 1,206,961 | | | | 1,333,551 | |
Freddie Mac, Pool #G05906, 6.00%, 4/1/2040 | | | 731,333 | | | | 808,037 | |
GNMA, Pool #398655, 6.50%, 5/15/2026 | | | 738 | | | | 851 | |
GNMA, Pool #452826, 9.00%, 1/15/2028 | | | 1,957 | | | | 1,986 | |
GNMA, Pool #460820, 6.00%, 6/15/2028 | | | 9,215 | | | | 10,480 | |
GNMA, Pool #458983, 6.00%, 1/15/2029 | | | 18,770 | | | | 21,339 | |
GNMA, Pool #530481, 8.00%, 8/15/2030 | | | 15,817 | | | | 16,453 | |
GNMA, Pool #577796, 6.00%, 1/15/2032 | | | 11,360 | | | | 12,936 | |
GNMA, Pool #671304, 5.50%, 6/15/2037 | | | 75,122 | | | | 83,994 | |
GNMA, Pool #671531, 5.50%, 9/15/2037 | | | 50,886 | | | | 56,896 | |
GNMA, Pool #671161, 5.50%, 11/15/2037 | | | 249,893 | | | | 279,407 | |
GNMA, Pool #672715, 5.50%, 5/15/2038 | | | 145,754 | | | | 162,945 | |
| | | | | | | | |
| | |
Total Mortgage-Backed Securities | | | | | | | | |
(Identified Cost $137,053,871) | | | | | | | 140,053,228 | |
| | | | | | | | |
| | |
Other Agencies - 24.23% | | | | | | | | |
Fannie Mae, 4.375%, 3/15/2013 | | | 32,396,000 | | | | 33,562,418 | |
Fannie Mae, 3.875%, 7/12/2013 | | | 11,000,000 | | | | 11,480,425 | |
Fannie Mae, 2.50%, 5/15/2014 | | | 22,500,000 | | | | 23,511,442 | |
Fannie Mae, 3.00%, 9/16/2014 | | | 11,000,000 | | | | 11,686,587 | |
Fannie Mae, 0.625%, 10/30/2014 | | | 16,000,000 | | | | 16,073,456 | |
Fannie Mae, 2.375%, 7/28/2015 | | | 15,500,000 | | | | 16,385,732 | |
Fannie Mae, 5.25%, 9/15/2016 | | | 9,500,000 | | | | 11,266,230 | |
Fannie Mae, 1.375%, 11/15/2016 | | | 27,000,000 | | | | 27,564,921 | |
Fannie Mae, 6.25%, 5/15/2029 | | | 2,334,000 | | | | 3,244,549 | |
Fannie Mae, 7.25%, 5/15/2030 | | | 2,102,000 | | | | 3,238,987 | |
Fannie Mae, 6.625%, 11/15/2030 | | | 2,220,000 | | | | 3,241,415 | |
Federal Farm Credit Bank, 5.125%, 8/25/2016 | | | 3,640,000 | | | | 4,294,308 | |
Federal Home Loan Bank, 3.625%, 10/18/2013 | | | 5,500,000 | | | | 5,765,474 | |
Federal Home Loan Bank, 5.00%, 11/17/2017 | | | 7,985,000 | | | | 9,643,421 | |
Freddie Mac, 0.875%, 10/28/2013 | | | 32,000,000 | | | | 32,273,888 | |
Freddie Mac, 0.75%, 11/25/2014 | | | 14,000,000 | | | | 14,112,224 | |
Freddie Mac, 2.875%, 2/9/2015 | | | 12,110,000 | | | | 12,903,774 | |
Freddie Mac, 2.00%, 8/25/2016 | | | 29,500,000 | | | | 30,914,112 | |
Freddie Mac, 1.00%, 3/8/2017 | | | 7,000,000 | | | | 6,994,603 | |
Freddie Mac, 2.375%, 1/13/2022 | | | 17,150,000 | | | | 17,253,535 | |
Freddie Mac, 6.75%, 3/15/2031 | | | 2,190,000 | | | | 3,240,988 | |
The accompanying notes are an integral part of the financial statements.
28
Investment Portfolio - April 30, 2012
(unaudited)
| | | | | | | | |
| PRO-BLEND® CONSERVATIVE TERM SERIES | | PRINCIPAL
AMOUNT/
SHARES | | | VALUE (NOTE 2) | |
| | |
U.S. GOVERNMENT AGENCIES (continued) | | | | | | | | |
| | |
Other Agencies (continued) | | | | | | | | |
Freddie Mac, 6.25%, 7/15/2032 | | $ | 2,334,000 | | | $ | 3,339,032 | |
| | | | | | | | |
| | |
Total Other Agencies | | | | | | | | |
(Identified Cost $296,268,016) | | | | | | | 301,991,521 | |
| | | | | | | | |
| | | | | | | | |
TOTAL U.S. GOVERNMENT AGENCIES | | | | | | | | |
(Identified Cost $433,321,887) | | | | | | | 442,044,749 | |
| | | | | | | | |
| | | | | | | | |
SHORT-TERM INVESTMENTS - 4.36% | | | | | | | | |
| | |
Dreyfus Cash Management, Inc. - Institutional Shares9, 0.06%, | | | | | | | | |
(Identified Cost $54,304,964) | | | 54,304,964 | | | | 54,304,964 | |
| | | | | | | | |
| | |
TOTAL INVESTMENTS - 100.73% | | | | | | | | |
(Identified Cost $1,189,760,335) | | | | | | | 1,255,575,442 | |
LIABILITIES, LESS OTHER ASSETS - (0.73%) | | | | | | | (9,137,810 | ) |
| | | | | | | | |
NET ASSETS - 100% | | | | | | $ | 1,246,437,632 | |
| | | | | | | | |
ADR - American Depository Receipt
*Non-income producing security
1A factor from a third party vendor was applied to determine the security’s fair value following the close of local trading.
2Traded on Canadian exchange.
3Traded on Hong Kong exchange.
4Latest quoted sales price is not available and the latest quoted bid price was used to value the security.
5The rate shown is a fixed rate as of April 30, 2012; the rate becomes floating, based on LIBOR plus a spread, at dates ranging from 2013 to 2022.
6Restricted securities - Investment in securities that are restricted as to public resale under the Securities Act of 1933, as amended. These securities have been sold under Rule 144A and have been determined to be liquid. These securities amount to $85,870,088, or 6.89%, of the Series’ net assets as of April 30, 2012.
7The coupon rate is floating and is the effective rate as of April 30, 2012.
8Represents a step-up bond that pays initial coupon rate for the first period and then a higher coupon rate for the following periods. Rate shown reflects the current coupon as of April 30, 2012.
9Rate shown is the current yield as of April 30, 2012.
The accompanying notes are an integral part of the financial statements.
29
Statement of Assets and Liabilities - Pro-Blend® Conservative Term Series
April 30, 2012 (unaudited)
| | | | |
ASSETS: | | | | |
| |
Investments, at value (identified cost $1,189,760,335) (Note 2) | | $ | 1,255,575,442 | |
Foreign currency (identified cost $240,920) | | | 240,732 | |
Interest receivable | | | 7,811,362 | |
Receivable for fund shares sold | | | 2,783,567 | |
Receivable for securities sold | | | 770,393 | |
Dividends receivable | | | 182,437 | |
Foreign tax reclaims receivable | | | 158,433 | |
Other assets | | | 93,303 | |
| | | | |
| |
TOTAL ASSETS | | | 1,267,615,669 | |
| | | | |
| |
LIABILITIES: | | | | |
| |
Accrued management fees (Note 3) | | | 601,031 | |
Accrued shareholder services fees (Class S) (Note 3) | | | 153,803 | |
Accrued fund accounting and administration fees (Note 3) | | | 62,981 | |
Accrued distribution and service (Rule 12b-1) fees (Class C) (Class R) (Note 3) | | | 49,498 | |
Accrued transfer agent fees (Note 3) | | | 33,618 | |
Accrued directors’ fees (Note 3) | | | 2,380 | |
Accrued Chief Compliance Officer service fees (Note 3) | | | 415 | |
Payable for securities purchased | | | 17,638,938 | |
Payable for fund shares repurchased | | | 2,582,675 | |
Other payables and accrued expenses | | | 52,698 | |
| | | | |
| |
TOTAL LIABILITIES | | | 21,178,037 | |
| | | | |
| |
TOTAL NET ASSETS | | $ | 1,246,437,632 | |
| | | | |
| |
NET ASSETS CONSIST OF: | | | | |
| |
Capital stock | | $ | 988,754 | |
Additional paid-in-capital | | | 1,168,110,420 | |
Undistributed net investment income | | | 5,850,732 | |
Accumulated net realized gain on investments, foreign currency and translation of other assets and liabilities | | | 5,665,214 | |
Net unrealized appreciation on investments, foreign currency and translation of other assets and liabilities | | | 65,822,512 | |
| | | | |
| |
TOTAL NET ASSETS | | $ | 1,246,437,632 | |
| | | | |
The accompanying notes are an integral part of the financial statements.
30
Statement of Assets and Liabilities - Pro-Blend® Conservative Term Series
April 30, 2012 (unaudited)
| | | | |
| |
NET ASSET VALUE, OFFERING PRICE AND REDEMPTION PRICE PER SHARE - Class S
($958,222,135/71,981,017 shares) | | $ | 13.31 | |
| | | | |
| |
NET ASSET VALUE, OFFERING PRICE AND REDEMPTION PRICE PER SHARE - Class I
($221,078,304/20,476,529 shares) | | $ | 10.80 | |
| | | | |
| |
NET ASSET VALUE, OFFERING PRICE AND REDEMPTION PRICE PER SHARE - Class C
($57,207,983/5,468,614 shares) | | $ | 10.46 | |
| | | | |
| |
NET ASSET VALUE, OFFERING PRICE AND REDEMPTION PRICE PER SHARE - Class R
($9,929,210/949,248 shares) | | $ | 10.46 | |
| | | | |
The accompanying notes are an integral part of the financial statements.
31
Statement of Operations - Pro-Blend® Conservative Term Series
For the Six Months Ended April 30, 2012 (unaudited)
| | | | |
INVESTMENT INCOME: | | | | |
| |
Interest | | $ | 12,480,610 | |
Dividends (net of foreign taxes withheld, $90,279) | | | 2,328,804 | |
| | | | |
| |
Total Investment Income | | | 14,809,414 | |
| | | | |
| |
EXPENSES: | | | | |
| |
Management fees (Note 3) | | | 3,468,832 | |
Shareholder services fees (Class S) (Note 3) | | | 904,512 | |
Distribution and service (Rule 12b-1) fees (Class C) (Note 3) | | | 245,338 | |
Fund accounting and administration fees (Note 3) | | | 125,005 | |
Transfer agent fees (Note 3) | | | 90,002 | |
Distribution and service (Rule 12b-1) fees (Class R) (Note 3) | | | 14,970 | |
Directors’ fees (Note 3) | | | 13,231 | |
Chief Compliance Officer service fees (Note 3) | | | 1,246 | |
Custodian fees | | | 42,037 | |
Miscellaneous | | | 155,235 | |
| | | | |
| |
Total Expenses | | | 5,060,408 | |
| | | | |
| |
NET INVESTMENT INCOME | | | 9,749,006 | |
| | | | |
| |
REALIZED AND UNREALIZED GAIN (LOSS) ON INVESTMENTS AND FOREIGN CURRENCY: | | | | |
| |
Net realized gain (loss) on-
Investments | | | 5,968,826 | |
Foreign currency and translation of other assets and liabilities (net of Brazilian tax of $4,350) | | | (32,982 | ) |
Forward foreign currency exchange contracts | | | 11,060 | |
| | | | |
| |
| | | 5,946,904 | |
| | | | |
| |
Net change in unrealized appreciation (depreciation) on-
Investments | | | 31,715,651 | |
Foreign currency and translation of other assets and liabilities | | | (778 | ) |
Forward foreign currency exchange contracts | | | (132 | ) |
| | | | |
| |
| | | 31,714,741 | |
| | | | |
| |
NET REALIZED AND UNREALIZED GAIN (LOSS) ON INVESTMENTS AND FOREIGN CURRENCY | | | 37,661,645 | |
| | | | |
| |
NET INCREASE IN NET ASSETS RESULTING FROM OPERATIONS | | $ | 47,410,651 | |
| | | | |
The accompanying notes are an integral part of the financial statements.
32
Statements of Changes in Net Assets - Pro-Blend® Conservative Term Series
| | | | | | | | |
| | | FOR THE SIX
MONTHS ENDED
4/30/12
(UNAUDITED) | | | FOR THE YEAR ENDED
10/31/11 | |
INCREASE (DECREASE) IN NET ASSETS: | | | | | | | | |
| | |
OPERATIONS: | | | | | | | | |
| | |
Net investment income | | $ | 9,749,006 | | | $ | 18,446,768 | |
Net realized gain (loss) on investments and foreign currency (net of Brazilian tax of $4,350 and $30,868, respectively) | | | 5,946,904 | | | | 18,539,491 | |
Net change in unrealized appreciation (depreciation) on investments and foreign currency | | | 31,714,741 | | | | (9,715,102 | ) |
| | | | | | | | |
| | |
Net increase from operations | | | 47,410,651 | | | | 27,271,157 | |
| | | | | | | | |
| | |
DISTRIBUTIONS TO SHAREHOLDERS (Note 8): | | | | | | | | |
| | |
From net investment income (Class S) | | | (10,238,360 | ) | | | (13,191,554 | ) |
From net investment income (Class I) | | | (2,724,216 | ) | | | (3,512,349 | ) |
From net investment income (Class C) | | | (517,279 | ) | | | (371,207 | ) |
From net investment income (Class R) | | | (77,695 | ) | | | (4,541 | ) |
From net realized gain on investments (Class S) | | | (14,036,266 | ) | | | (17,869,909 | ) |
From net realized gain on investments (Class I) | | | (3,415,773 | ) | | | (4,243,177 | ) |
From net realized gain on investments (Class C) | | | (925,150 | ) | | | (600,819 | ) |
From net realized gain on investments (Class R) | | | (105,151 | ) | | | (201 | ) |
| | | | | | | | |
| | |
Total distributions to shareholders | | | (32,039,890 | ) | | | (39,793,757 | ) |
| | | | | | | | |
| | |
CAPITAL STOCK ISSUED AND REPURCHASED: | | | | | | | | |
| | |
Net increase from capital share transactions (Note 5) | | | 133,303,435 | | | | 269,691,096 | |
| | | | | | | | |
| | |
Net increase in net assets | | | 148,674,196 | | | | 257,168,496 | |
| | |
NET ASSETS: | | | | | | | | |
| | |
Beginning of period | | | 1,097,763,436 | | | | 840,594,940 | |
| | | | | | | | |
| | |
End of period (including undistributed net investment income of $5,850,732 and $9,659,276,respectively) | | $ | 1,246,437,632 | | | $ | 1,097,763,436 | |
| | | | | | | | |
The accompanying notes are an integral part of the financial statements.
33
Financial Highlights - Pro-Blend® Conservative Term Series - Class S
| | | | | | | | | | | | | | | | | | | | | | | | |
| | | FOR THE SIX | | | FOR THE YEARS ENDED | |
| | | MONTHS ENDED
4/30/12
(UNAUDITED) | | | 10/31/11 | | | 10/31/10 | | | 10/31/09 | | | 10/31/08 | | | 10/31/07 | |
Per share data (for a share outstanding throughout each period): | | | | | | | | | | | | | | | | | | | | | | | | |
Net asset value - Beginning of period | | $ | 13.16 | | | $ | 13.37 | | | $ | 12.21 | | | $ | 11.13 | | | $ | 12.74 | | | $ | 12.35 | |
| | | | | | | | | | | | | | | | | | | | | | | | |
Income (loss) from investment operations: | | | | | | | | | | | | | | | | | | | | | | | | |
Net investment income | | | 0.11 | 1 | | | 0.25 | 1 | | | 0.29 | 1 | | | 0.23 | 1 | | | 0.24 | | | | 0.30 | |
Net realized and unrealized gain (loss) on investments | | | 0.40 | | | | 0.12 | | | | 1.07 | | | | 1.07 | | | | (1.15 | ) | | | 0.65 | |
| | | | | | | | | | | | | | | | | | | | | | | | |
| | | | | | |
Total from investment operations | | | 0.51 | | | | 0.37 | | | | 1.36 | | | | 1.30 | | | | (0.91 | ) | | | 0.95 | |
| | | | | | | | | | | | | | | | | | | | | | | | |
| | | | | | |
Less distributions to shareholders: | | | | | | | | | | | | | | | | | | | | | | | | |
From net investment income | | | (0.15 | ) | | | (0.24 | ) | | | (0.20 | ) | | | (0.22 | ) | | | (0.27 | ) | | | (0.31 | ) |
From net realized gain on investments | | | (0.21 | ) | | | (0.34 | ) | | | — | | | | — | | | | (0.43 | ) | | | (0.25 | ) |
| | | | | | | | | | | | | | | | | | | | | | | | |
| | | | | | |
Total distributions to shareholders | | | (0.36 | ) | | | (0.58 | ) | | | (0.20 | ) | | | (0.22 | ) | | | (0.70 | ) | | | (0.56 | ) |
| | | | | | | | | | | | | | | | | | | | | | | | |
| | | | | | |
Net asset value - End of period | | $ | 13.31 | | | $ | 13.16 | | | $ | 13.37 | | | $ | 12.21 | | | $ | 11.13 | | | $ | 12.74 | |
| | | | | | | | | | | | | | | | | | | | | | | | |
| | | | | | |
Net assets - End of period (000’s omitted) | | $ | 958,222 | | | $ | 870,693 | | | $ | 683,681 | | | $ | 328,201 | | | $ | 139,174 | | | $ | 110,567 | |
| | | | | | | | | | | | | | | | | | | | | | | | |
| | | | | | |
Total return2 | | | 4.07 | % | | | 2.87 | % | | | 11.26 | % | | | 11.83 | % | | | (7.52 | %) | | | 7.95 | % |
Ratios (to average net assets)/ Supplemental Data: | | | | | | | | | | | | | | | | | | | | | | | | |
Expenses* | | | 0.87 | %3 | | | 0.89 | % | | | 0.90 | % | | | 0.90 | % | | | 0.92 | % | | | 0.99 | % |
Net investment income | | | 1.69 | %3 | | | 1.87 | % | | | 2.28 | % | | | 1.97 | % | | | 2.33 | % | | | 2.73 | % |
Series portfolio turnover | | | 20 | % | | | 25 | % | | | 42 | % | | | 47 | % | | | 45 | % | | | 49 | % |
| |
| * For certain periods presented, the investment advisor did not impose all or a portion of its management fees and/or other fees. If these expenses had been incurred by the Class, the expense ratio (to average net assets) would have increased by the following amount: | | | | | |
| | | | | | |
| | | N/A | | | | N/A | | | | 0.00 | %4 | | | 0.03 | % | | | 0.05 | % | | | N/A | |
1Calculated based on average shares outstanding during the period.
2Represents aggregate total return for the periods indicated, and assumes reinvestment of all distributions. Total return would have been lower had certain expenses not been waived or reimbursed during the periods. Periods less than one year are not annualized.
3Annualized.
4Less than 0.01%.
The accompanying notes are an integral part of the financial statements.
34
Financial Highlights - Pro-Blend® Conservative Term Series - Class I
| | | | | | | | | | | | | | | | | | | | |
| | | FOR THE SIX MONTHS ENDED
4/30/12 | | | FOR THE YEARS ENDED | | | FOR THE PERIOD 3/28/081 TO
10/31/08 | |
| | (UNAUDITED) | | | 10/31/11 | | | 10/31/10 | | | 10/31/09 | | |
Per share data (for a share outstanding throughout each period): | | | | | | | | | | | | | | | | | | | | |
Net asset value - Beginning of period | | $ | 10.75 | | | $ | 11.03 | | | $ | 10.11 | | | $ | 9.27 | | | $ | 10.00 | |
| | | | | | | | | | | | | | | | | | | | |
Income (loss) from investment operations: | | | | | | | | | | | | | | | | | | | | |
Net investment income | | | 0.10 | 2 | | | 0.22 | 2 | | | 0.26 | 2 | | | 0.21 | 2 | | | 0.06 | |
Net realized and unrealized gain (loss) on investments | | | 0.33 | | | | 0.10 | | | | 0.88 | | | | 0.87 | | | | (0.74 | ) |
| | | | | | | | | | | | | | | | | | | | |
| | | | | |
Total from investment operations | | | 0.43 | | | | 0.32 | | | | 1.14 | | | | 1.08 | | | | (0.68 | ) |
| | | | | | | | | | | | | | | | | | | | |
Less distributions to shareholders: | | | | | | | | | | | | | | | | | | | | |
From net investment income | | | (0.17 | ) | | | (0.26 | ) | | | (0.22 | ) | | | (0.24 | ) | | | (0.05 | ) |
From net realized gain on investments | | | (0.21 | ) | | | (0.34 | ) | | | — | | | | — | | | | — | |
| | | | | | | | | | | | | | | | | | | | |
| | | | | |
Total distributions to shareholders | | | (0.38 | ) | | | (0.60 | ) | | | (0.22 | ) | | | (0.24 | ) | | | (0.05 | ) |
| | | | | | | | | | | | | | | | | | | | |
| | | | | |
Net asset value - End of period | | $ | 10.80 | | | $ | 10.75 | | | $ | 11.03 | | | $ | 10.11 | | | $ | 9.27 | |
| | | | | | | | | | | | | | | | | | | | |
| | | | | |
Net assets - End of period (000’s omitted) | | $ | 221,078 | | | $ | 181,345 | | | $ | 139,399 | | | $ | 95,879 | | | $ | 77 | |
| | | | | | | | | | | | | | | | | | | | |
| | | | | |
Total return3 | | | 4.20 | % | | | 3.07 | % | | | 11.49 | % | | | 11.94 | % | | | (6.81 | %) |
Ratios (to average net assets)/ | | | | | | | | | | | | | | | | | | | | |
Supplemental Data: | | | | | | | | | | | | | | | | | | | | |
Expenses* | | | 0.67 | %4 | | | 0.69 | % | | | 0.70 | % | | | 0.70 | % | | | 0.70 | %4 |
Net investment income | | | 1.89 | %4 | | | 2.07 | % | | | 2.48 | % | | | 2.17 | % | | | 1.81 | %4 |
Series portfolio turnover | | | 20 | % | | | 25 | % | | | 42 | % | | | 47 | % | | | 45 | % |
|
| * For certain periods presented, the investment advisor did not impose all or a portion of its management fees and/or other fees. If these expenses had been incurred by the Class, the expense ratio (to average net assets) would have increased by the following amount: | |
| | | | | |
| | | N/A | | | | N/A | | | | 0.00 | %5 | | | 0.03 | % | | | 0.15 | %4 |
1Commencement of operations.
2Calculated based on average shares outstanding during the period.
3Represents aggregate total return for the periods indicated, and assumes reinvestment of all distributions. Total return would have been lower had certain expenses not been waived during the periods. Periods less than one year are not annualized.
4Annualized.
5Less than 0.01%.
The accompanying notes are an integral part of the financial statements.
35
Financial Highlights - Pro-Blend® Conservative Term Series - Class C
| | | | | | | | | | | | |
| | | FOR THE SIX
MONTHS ENDED
4/30/12
(UNAUDITED) | | | FOR THE
YEAR ENDED
10/31/11 | | | FOR THE PERIOD
1/4/101 TO
10/31/10 | |
Per share data (for a share outstanding throughout each period): | | | | | | | | | | | | |
Net asset value - Beginning of period | | $ | 10.42 | | | $ | 10.73 | | | $ | 10.00 | |
| | | | | | | | | | | | |
Income from investment operations: | | | | | | | | | | | | |
Net investment income2 | | | 0.05 | | | | 0.11 | | | | 0.12 | |
Net realized and unrealized gain on investments | | | 0.32 | | | | 0.10 | | | | 0.68 | |
| | | | | | | | | | | | |
| | | |
Total from investment operations | | | 0.37 | | | | 0.21 | | | | 0.80 | |
| | | | | | | | | | | | |
| | | |
Less distributions to shareholders: | | | | | | | | | | | | |
From net investment income | | | (0.12 | ) | | | (0.18 | ) | | | (0.07 | ) |
From net realized gain on investments | | | (0.21 | ) | | | (0.34 | ) | | | — | |
| | | | | | | | | | | | |
| | | |
Total distributions to shareholders | | | (0.33 | ) | | | (0.52 | ) | | | (0.07 | ) |
| | | | | | | | | | | | |
| | | |
Net asset value - End of period | | $ | 10.46 | | | $ | 10.42 | | | $ | 10.73 | |
| | | | | | | | | | | | |
| | | |
Net assets - End of period (000’s omitted) | | $ | 57,208 | | | $ | 42,898 | | | $ | 17,514 | |
| | | | | | | | | | | | |
| | | |
Total return3 | | | 3.71 | % | | | 2.06 | % | | | 8.03 | % |
Ratios (to average net assets)/ Supplemental Data: | | | | | | | | | | | | |
Expenses* | | | 1.67 | %4 | | | 1.69 | % | | | 1.70 | %4 |
Net investment income | | | 0.89 | %4 | | | 1.03 | % | | | 1.43 | %4 |
Series portfolio turnover | | | 20 | % | | | 25 | % | | | 42 | % |
|
| * For certain periods presented, the investment advisor did not impose all or a portion of its management fees and/or other fees. If these expenses had been incurred by the Class, the expense ratio (to average net assets) would have increased by the following amount: | |
| | | |
| | | N/A | | | | N/A | | | | 0.00 | %4,5 |
1Commencement of operations.
2Calculated based on average shares outstanding during the period.
3Represents aggregate total return for the period indicated, and assumes reinvestment of all distributions. Total return would have been lower had certain expenses not been waived or reimbursed during the period. Periods less than one year are not annualized.
4Annualized.
5Less than 0.01%.
The accompanying notes are an integral part of the financial statements.
36
Financial Highlights - Pro-Blend® Conservative Term Series - Class R
| | | | | | | | | | | | |
| | | FOR THE SIX
MONTHS ENDED
4/30/12
(UNAUDITED) | | | FOR THE
YEAR ENDED
10/31/11 | | | FOR THE PERIOD
6/30/101 TO
10/31/10 | |
Per share data (for a share outstanding throughout each period): | | | | | | | | | | | | |
Net asset value - Beginning of period | | $ | 10.44 | | | $ | 10.76 | | | $ | 10.00 | |
| | | | | | | | | | | | |
Income from investment operations: | | | | | | | | | | | | |
Net investment income2 | | | 0.07 | | | | 0.13 | | | | 0.05 | |
Net realized and unrealized gain on investments | | | 0.32 | | | | 0.13 | | | | 0.71 | |
| | | | | | | | | | | | |
| | | |
Total from investment operations | | | 0.39 | | | | 0.26 | | | | 0.76 | |
| | | | | | | | | | | | |
| | | |
Less distributions to shareholders: | | | | | | | | | | | | |
From net investment income | | | (0.16 | ) | | | (0.24 | ) | | | — | |
From net realized gain on investments | | | (0.21 | ) | | | (0.34 | ) | | | — | |
| | | | | | | | | | | | |
| | | |
Total distributions to shareholders | | | (0.37 | ) | | | (0.58 | ) | | | — | |
| | | | | | | | | | | | |
| | | |
Net asset value - End of period | | $ | 10.46 | | | $ | 10.44 | | | $ | 10.76 | |
| | | | | | | | | | | | |
| | | |
Net assets - End of period (000’s omitted) | | $ | 9,929 | | | $ | 2,828 | | | $ | 1 | |
| | | | | | | | | | | | |
| | | |
Total return3 | | | 3.90 | % | | | 2.61 | % | | | 7.60 | % |
Ratios (to average net assets)/ Supplemental Data: | | | | | | | | | | | | |
Expenses | | | 1.17 | %4 | | | 1.19 | % | | | 1.20 | %4 |
Net investment income | | | 1.40 | %4 | | | 1.31 | % | | | 1.51 | %4 |
Series portfolio turnover | | | 20 | % | | | 25 | % | | | 42 | % |
1Commencement of operations.
2Calculated based on average shares outstanding during the period.
3Represents aggregate total return for the period indicated, and assumes reinvestment of all distributions. Total return would have been lower had certain expenses not been waived or reimbursed during the period. Periods less than one year are not annualized.
4Annualized.
The accompanying notes are an integral part of the financial statements.
37
Shareholder Expense Example - Pro-Blend® Moderate Term Series
(unaudited)
As a shareholder of the Series, you may incur two types of costs: (1) transaction costs, including potential wire charges on redemptions and (2) ongoing costs, including management fees and other Series expenses. This example is intended to help you understand your ongoing costs (in dollars) of investing in the Series and to compare these costs with the ongoing costs of investing in other mutual funds.
The example is based on an investment of $1,000 invested at the beginning of the period and held for the entire period (November 1, 2011 to April 30, 2012).
Actual Expenses
The Actual lines of the table below provide information about actual account values and actual expenses. You may use the information in these lines, together with the amount you invested, to estimate the expenses that you paid over the period. Simply divide your account value by $1,000 (for example, an $8,600 account value divided by $1,000 = 8.6), then multiply the result by the number in the Actual line for the Class in which you have invested under the heading entitled “Expenses Paid During Period” to estimate the expenses you paid on your account during this period.
Hypothetical Example for Comparison Purposes
The Hypothetical lines of the table below provide information about hypothetical account values and hypothetical expenses based on the Class’ actual expense ratio and an assumed rate of return of 5% per year before expenses, which is not the Class’ actual return. The hypothetical account values and expenses may not be used to estimate the actual ending account balance or expenses you paid during the period. You may use this information to compare the ongoing costs of investing in the Series and other funds. To do so, compare this 5% hypothetical example for the Class in which you have invested with the 5% hypothetical examples that appear in the shareholder reports of the other funds.
Please note that the expenses shown in the table are meant to highlight your ongoing costs only and do not reflect any transaction costs. Therefore, the Hypothetical lines of the table are useful in comparing ongoing costs only, and will not help you determine the relative total costs of owning different funds. In addition, if these transaction costs were included, your costs would have been higher.
| | | | | | | | |
| | | BEGINNING
ACCOUNT VALUE
11/1/11 | | ENDING
ACCOUNT VALUE
4/30/12 | | EXPENSES PAID
DURING PERIOD
11/1/11-4/30/12* | | ANNUALIZED
EXPENSE RATIO |
Class S | | | | | | | | |
Actual | | $1,000.00 | | $1,054.70 | | $5.47 | | 1.07% |
Hypothetical (5% return before expenses) | | $1,000.00 | | $1,019.54 | | $5.37 | | 1.07% |
Class I | | | | | | | | |
Actual | | $1,000.00 | | $1,056.90 | | $4.19 | | 0.82% |
Hypothetical (5% return before expenses) | | $1,000.00 | | $1,020.79 | | $4.12 | | 0.82% |
Class C | | | | | | | | |
Actual | | $1,000.00 | | $1,051.60 | | $9.28 | | 1.82% |
Hypothetical (5% return before expenses) | | $1,000.00 | | $1,015.81 | | $9.12 | | 1.82% |
Class R | | | | | | | | |
Actual | | $1,000.00 | | $1,054.30 | | $6.74 | | 1.32% |
Hypothetical (5% return before expenses) | | $1,000.00 | | $1,018.30 | | $6.62 | | 1.32% |
*Expenses are equal to the Class’ annualized expense ratio (for the six-month period), multiplied by the average account value over the period, multiplied by 182/366 to reflect the one-half year period.
38
Portfolio Composition - Pro-Blend® Moderate Term Series
As of April 30, 2012 (unaudited)
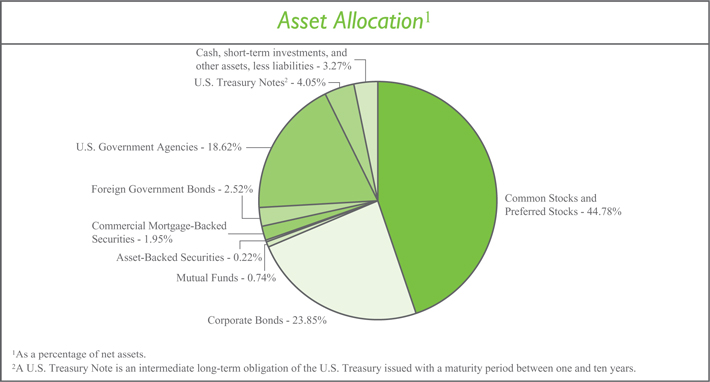
| | | | |
| Sector Allocation3 | |
Financials | | | 17.62 | % |
Information Technology | | | 10.77 | % |
Consumer Discretionary | | | 10.43 | % |
Health Care | | | 6.81 | % |
Industrials | | | 5.75 | % |
Energy | | | 5.41 | % |
Consumer Staples | | | 5.04 | % |
Materials | | | 4.72 | % |
Telecommunication Services | | | 1.83 | % |
Utilities | | | 0.30 | % |
| | | | | |
| | | | | |
| 3Including common stocks, preferred stocks, and corporate bonds, as a percentage of total investments. | |
| | | | |
| Top Ten Stock Holdings4 | |
Cerner Corp. | | | 1.64 | % |
Google, Inc. - Class A | | | 1.56 | % |
Monsanto Co. | | | 1.48 | % |
Time Warner, Inc. | | | 1.25 | % |
EMC Corp. | | | 1.11 | % |
Hess Corp. | | | 0.98 | % |
Anheuser-Busch InBev N.V. (Belgium) | | | 0.83 | % |
MasterCard, Inc. - Class A | | | 0.80 | % |
Visa, Inc. - Class A | | | 0.80 | % |
Amazon.com, Inc. | | | 0.80 | % |
| | | | | |
| | | | | |
| 4As a percentage of total investments. | | | | |
39
Investment Portfolio - April 30, 2012
(unaudited)
| | | | | | | | |
| PRO-BLEND® MODERATE TERM SERIES | | SHARES | | | VALUE (NOTE 2) | |
| | |
COMMON STOCKS - 44.43% | | | | | | | | |
| | |
Consumer Discretionary - 7.80% | | | | | | | | |
Auto Components - 0.05% | | | | | | | | |
Hankook Tire Co. Ltd. (South Korea)1 | | | 13,160 | | | $ | 555,164 | |
| | | | | | | | |
Automobiles - 0.52% | | | | | | | | |
Hyundai Motor Co. (South Korea)1 | | | 1,100 | | | | 259,677 | |
Suzuki Motor Corp. (Japan)1 | | | 9,500 | | | | 223,596 | |
Tesla Motors, Inc.* | | | 11,910 | | | | 394,578 | |
Toyota Motor Corp. (Japan)1 | | | 5,200 | | | | 213,084 | |
Toyota Motor Corp. - ADR (Japan) | | | 63,470 | | | | 5,190,577 | |
Yamaha Motor Co. Ltd. (Japan)1 | | | 24,400 | | | | 325,901 | |
| | | | | | | | |
| | | | | | | 6,607,413 | |
| | | | | | | | |
| | |
Distributors - 0.02% | | | | | | | | |
Inchcape plc (United Kingdom)1 | | | 47,340 | | | | 281,251 | |
| | | | | | | | |
Diversified Consumer Services - 0.06% | | | | | | | | |
Anhanguera Educacional Participacoes S.A. (Brazil) | | | 22,890 | | | | 302,854 | |
Capella Education Co.* | | | 6,730 | | | | 220,138 | |
Grand Canyon Education, Inc.* | | | 15,070 | | | | 262,067 | |
| | | | | | | | |
| | | | | | | 785,059 | |
| | | | | | | | |
| | |
Hotels, Restaurants & Leisure - 0.88% | | | | | | | | |
7 Days Group Holdings Ltd. - ADR (Cayman Islands)* | | | 2,710 | | | | 34,553 | |
Accor S.A. (France)1 | | | 34,720 | | | | 1,200,638 | |
Carnival Corp. | | | 271,880 | | | | 8,833,381 | |
Hyatt Hotels Corp. - Class A* | | | 5,310 | | | | 228,489 | |
Intercontinental Hotels Group plc (United Kingdom)1 | | | 21,040 | | | | 501,676 | |
Orient-Express Hotels Ltd. - Class A - ADR (Bermuda) | | | 20,590 | | | | 220,107 | |
TUI Travel plc (United Kingdom)1 | | | 39,870 | | | | 123,640 | |
| | | | | | | | |
| | | | | | | 11,142,484 | |
| | | | | | | | |
| | |
Household Durables - 0.18% | | | | | | | | |
Corporacion Geo S.A.B. de C.V. - Class B (Mexico)* | | | 55,360 | | | | 73,950 | |
DR Horton, Inc. | | | 22,160 | | | | 362,316 | |
Lennar Corp. - Class A | | | 20,240 | | | | 561,458 | |
LG Electronics, Inc. (South Korea)1 | | | 4,910 | | | | 302,942 | |
NVR, Inc.* | | | 430 | | | | 337,094 | |
Rodobens Negocios Imobiliarios S.A. (Brazil) | | | 36,860 | | | | 215,032 | |
Toll Brothers, Inc.* | | | 16,510 | | | | 419,354 | |
| | | | | | | | |
| | | | | | | 2,272,146 | |
| | | | | | | | |
| | |
Internet & Catalog Retail - 0.84% | | | | | | | | |
Amazon.com, Inc.* | | | 43,350 | | | | 10,052,865 | |
Blue Nile, Inc.* | | | 1,880 | | | | 56,926 | |
Ocado Group plc (United Kingdom)*1 | | | 215,910 | | | | 455,140 | |
| | | | | | | | |
| | | | | | | 10,564,931 | |
| | | | | | | | |
The accompanying notes are an integral part of the financial statements.
40
Investment Portfolio - April 30, 2012
(unaudited)
| | | | | | | | |
| PRO-BLEND® MODERATE TERM SERIES | | SHARES | | | VALUE (NOTE 2) | |
| | |
COMMON STOCKS (continued) | | | | | | | | |
| | |
Consumer Discretionary (continued) | | | | | | | | |
Media - 4.94% | | | | | | | | |
AMC Networks, Inc. - Class A* | | | 170,550 | | | $ | 7,248,375 | |
DIRECTV - Class A* | | | 188,980 | | | | 9,311,045 | |
Imax Corp. (Canada)* | | | 17,710 | | | | 424,509 | |
Mediaset Espana Comunicacion S.A. (Spain)1 | | | 119,970 | | | | 546,110 | |
News Corp. - Class A | | | 405,420 | | | | 7,946,232 | |
Reed Elsevier plc - ADR (United Kingdom) | | | 4,434 | | | | 146,544 | |
Societe Television Francaise 1 (France)1 | | | 37,310 | | | | 361,388 | |
Time Warner, Inc. | | | 420,940 | | | | 15,768,412 | |
Valassis Communications, Inc.* | | | 8,290 | | | | 165,800 | |
Virgin Media, Inc. - ADR (United Kingdom) | | | 405,440 | | | | 9,957,606 | |
The Walt Disney Co. | | | 230,080 | | | | 9,918,749 | |
Wolters Kluwer N.V. (Netherlands)1 | | | 15,630 | | | | 270,201 | |
Zon Multimedia Servicos de Telecomunicacoes e Multimedia SGPS S.A. (Portugal)1 | | | 135,390 | | | | 456,894 | |
| | | | | | | | |
| | | | | | | 62,521,865 | |
| | | | | | | | |
| | |
Multiline Retail - 0.04% | | | | | | | | |
Marks & Spencer Group plc (United Kingdom)1 | | | 42,270 | | | | 244,988 | |
PPR (France)1 | | | 1,625 | | | | 271,942 | |
| | | | | | | | |
| | | | | | | 516,930 | |
| | | | | | | | |
| | |
Specialty Retail - 0.24% | | | | | | | | |
Aeropostale, Inc.* | | | 12,520 | | | | 277,694 | |
American Eagle Outfitters, Inc. | | | 15,280 | | | | 275,193 | |
Belle International Holdings Ltd. (Hong Kong)1 | | | 113,000 | | | | 220,490 | |
Chico’s FAS, Inc. | | | 23,930 | | | | 367,565 | |
Dick’s Sporting Goods, Inc. | | | 11,070 | | | | 560,142 | |
Group 1 Automotive, Inc. | | | 2,890 | | | | 167,273 | |
Inditex S.A. (Spain)1 | | | 1,900 | | | | 171,255 | |
KOMERI Co. Ltd. (Japan)1 | | | 4,800 | | | | 134,482 | |
Penske Automotive Group, Inc. | | | 7,670 | | | | 202,795 | |
Select Comfort Corp.* | | | 4,210 | | | | 121,585 | |
Sonic Automotive, Inc. - Class A | | | 12,780 | | | | 214,960 | |
Teavana Holdings, Inc.* | | | 14,580 | | | | 304,576 | |
| | | | | | | | |
| | | | | | | 3,018,010 | |
| | | | | | | | |
| | |
Textiles, Apparel & Luxury Goods - 0.03% | | | | | | | | |
Adidas AG (Germany)1 | | | 4,150 | | | | 346,150 | |
| | | | | | | | |
Total Consumer Discretionary | | | | | | | 98,611,403 | |
| | | | | | | | |
Consumer Staples - 4.78% | | | | | | | | |
Beverages - 1.51% | | | | | | | | |
Anheuser-Busch InBev N.V. (Belgium)1 | | | 145,040 | | | | 10,453,800 | |
The Boston Beer Co., Inc. - Class A* | | | 2,040 | | | | 210,773 | |
C&C Group plc (Ireland)*1 | | | 40,880 | | | | 205,033 | |
The accompanying notes are an integral part of the financial statements.
41
Investment Portfolio - April 30, 2012
(unaudited)
| | | | | | | | |
| PRO-BLEND® MODERATE TERM SERIES | | SHARES | | | VALUE (NOTE 2) | |
| | |
COMMON STOCKS (continued) | | | | | | | | |
| | |
Consumer Staples (continued) | | | | | | | | |
Beverages (continued) | | | | | | | | |
Carlsberg A/S - Class B (Denmark)1 | | | 4,100 | | | $ | 353,919 | |
Cia Cervecerias Unidas S.A. - ADR (Chile) | | | 3,630 | | | | 259,981 | |
The Coca-Cola Co. | | | 86,800 | | | | 6,624,576 | |
Diageo plc (United Kingdom)1 | | | 22,700 | | | | 572,569 | |
Heineken N.V. (Netherlands)1 | | | 4,360 | | | | 238,442 | |
Kirin Holdings Co. Ltd. (Japan)1 | | | 15,200 | | | | 193,533 | |
| | | | | | | | |
| | | | | | | 19,112,626 | |
| | | | | | | | |
| | |
Food & Staples Retailing - 0.73% | | | | | | | | |
Carrefour S.A. (France)1 | | | 23,260 | | | | 467,211 | |
Casino Guichard-Perrachon S.A. (France)1 | | | 2,420 | | | | 237,762 | |
Distribuidora Internacional de Alimentacion S.A. (Spain)*1 | | | 55,640 | | | | 267,141 | |
Koninklijke Ahold N.V. (Netherlands)1 | | | 32,290 | | | | 409,838 | |
The Kroger Co. | | | 291,710 | | | | 6,788,092 | |
SUPERVALU, Inc. | | | 22,500 | | | | 133,650 | |
Tesco plc (United Kingdom)1 | | | 182,805 | | | | 941,936 | |
| | | | | | | | |
| | | | | | | 9,245,630 | |
| | | | | | | | |
| | |
Food Products - 2.41% | | | | | | | | |
Barry Callebaut AG (Switzerland)1 | | | 370 | | | | 356,199 | |
Biostime International Holdings Ltd. (Cayman Islands)1 | | | 37,000 | | | | 106,134 | |
BRF - Brasil Foods S.A. (Brazil) | | | 16,810 | | | | 305,131 | |
Charoen Pokphand Foods PCL (Thailand)1 | | �� | 182,500 | | | | 227,012 | |
Danone (France)1 | | | 13,550 | | | | 953,905 | |
Flowers Foods, Inc. | | | 8,085 | | | | 173,423 | |
Grupo Bimbo S.A.B. de C.V. - Class A (Mexico) | | | 138,570 | | | | 330,629 | |
Kraft Foods, Inc. - Class A | | | 241,460 | | | | 9,627,010 | |
M Dias Branco S.A. (Brazil) | | | 5,100 | | | | 147,155 | |
Nestle S.A. (Switzerland)1 | | | 131,880 | | | | 8,082,830 | |
Suedzucker AG (Germany)1 | | | 6,710 | | | | 204,332 | |
Unilever plc - ADR (United Kingdom) | | | 288,829 | | | | 9,912,611 | |
| | | | | | | | |
| | | | | | | 30,426,371 | |
| | | | | | | | |
| | |
Household Products - 0.06% | | | | | | | | |
Reckitt Benckiser Group plc (United Kingdom)1 | | | 13,150 | | | | 765,507 | |
| | | | | | | | |
Personal Products - 0.05% | | | | | | | | |
Beiersdorf AG (Germany)1 | | | 3,150 | | | | 221,056 | |
Kao Corp. (Japan)1 | | | 3,300 | | | | 88,425 | |
Natura Cosmeticos S.A. (Brazil) | | | 15,200 | | | | 343,448 | |
| | | | | | | | |
| | | | | | | 652,929 | |
| | | | | | | | |
| | |
Tobacco - 0.02% | | | | | | | | |
Gudang Garam Tbk PT (Indonesia)1 | | | 38,000 | | | | 244,043 | |
| | | | | | | | |
Total Consumer Staples | | | | | | | 60,447,106 | |
| | | | | | | | |
The accompanying notes are an integral part of the financial statements.
42
Investment Portfolio - April 30, 2012
(unaudited)
| | | | | | | | |
| PRO-BLEND® MODERATE TERM SERIES | | SHARES | | | VALUE (NOTE 2) | |
| | |
COMMON STOCKS (continued) | | | | | | | | |
| | |
Energy - 3.96% | | | | | | | | |
Energy Equipment & Services - 2.10% | | | | | | | | |
Baker Hughes, Inc. | | | 168,990 | | | $ | 7,454,149 | |
Calfrac Well Services Ltd. (Canada) | | | 9,700 | | | | 266,103 | |
CARBO Ceramics, Inc. | | | 970 | | | | 81,567 | |
Compagnie Generale de Geophysique - Veritas (CGG - Veritas) (France)*1 | | | 5,310 | | | | 152,279 | |
Heckmann Corp.* | | | 37,210 | | | | 141,398 | |
ION Geophysical Corp.* | | | 18,000 | | | | 112,140 | |
Key Energy Services, Inc.* | | | 12,140 | | | | 153,692 | |
Petroleum Geo-Services ASA (Norway)*1 | | | 16,200 | | | | 245,070 | |
Poseidon Concepts Corp. (Canada) | | | 11,750 | | | | 152,607 | |
Schlumberger Ltd. | | | 126,315 | | | | 9,364,994 | |
Trican Well Service Ltd. (Canada) | | | 40,240 | | | | 582,102 | |
Weatherford International Ltd. - ADR (Switzerland)* | | | 552,520 | | | | 7,884,460 | |
| | | | | | | | |
| | | | | | | 26,590,561 | |
| | | | | | | | |
| | |
Oil, Gas & Consumable Fuels - 1.86% | | | | | | | | |
Apache Corp. | | | 32,670 | | | | 3,134,360 | |
Cameco Corp. (Canada) | | | 18,770 | | | | 414,817 | |
Hess Corp. | | | 238,710 | | | | 12,446,339 | |
Pacific Rubiales Energy Corp. (Canada) | | | 10,100 | | | | 289,754 | |
Paladin Energy Ltd. (Australia)*2 | | | 140,800 | | | | 232,327 | |
Petroleo Brasileiro S.A. - ADR (Brazil) | | | 24,330 | | | | 539,153 | |
Range Resources Corp. | | | 74,310 | | | | 4,953,505 | |
Royal Dutch Shell plc - Class B (Netherlands)1 | | | 6,202 | | | | 226,960 | |
Royal Dutch Shell plc - Class B - ADR (Netherlands) | | | 6,790 | | | | 498,114 | |
Statoil ASA (Norway)1 | | | 10,790 | | | | 289,521 | |
Talisman Energy, Inc. (Canada) | | | 34,450 | | | | 450,568 | |
| | | | | | | | |
| | | | | | | 23,475,418 | |
| | | | | | | | |
Total Energy | | | | | | | 50,065,979 | |
| | | | | | | | |
Financials - 5.67% | | | | | | | | |
Capital Markets - 0.09% | | | | | | | | |
The Charles Schwab Corp. | | | 38,300 | | | | 547,690 | |
Deutsche Bank AG (Germany)1 | | | 4,210 | | | | 182,769 | |
Evercore Partners, Inc. - Class A | | | 4,660 | | | | 123,164 | |
Greenhill & Co., Inc. | | | 3,980 | | | | 154,623 | |
Lazard Ltd. - Class A - ADR (Bermuda) | | | 3,570 | | | | 98,211 | |
| | | | | | | | |
| | | | | | | 1,106,457 | |
| | | | | | | | |
| | |
Commercial Banks - 0.50% | | | | | | | | |
Banco Bilbao Vizcaya Argentaria S.A. - ADR (Spain) | | | 25,790 | | | | 174,083 | |
Banco Santander S.A. (Spain)1 | | | 32,800 | | | | 205,938 | |
Banco Santander S.A. - ADR (Spain) | | | 68,360 | | | | 432,719 | |
Barclays plc (United Kingdom)1 | | | 98,070 | | | | 347,202 | |
The accompanying notes are an integral part of the financial statements.
43
Investment Portfolio - April 30, 2012
(unaudited)
| | | | | | | | |
| PRO-BLEND® MODERATE TERM SERIES | | SHARES | | | VALUE (NOTE 2) | |
| | |
COMMON STOCKS (continued) | | | | | | | | |
| | |
Financials (continued) | | | | | | | | |
Commercial Banks (continued) | | | | | | | | |
BNP Paribas S.A. (France)1 | | | 9,640 | | | $ | 389,064 | |
CIT Group, Inc.* | | | 13,970 | | | | 528,765 | |
First Commonwealth Financial Corp. | | | 131,350 | | | | 844,581 | |
Hong Leong Financial Group Berhad (Malaysia)1 | | | 86,900 | | | | 342,313 | |
HSBC Holdings plc (United Kingdom)1 | | | 32,900 | | | | 296,994 | |
HSBC Holdings plc - ADR (United Kingdom) | | | 14,572 | | | | 658,217 | |
ICICI Bank Ltd. - ADR (India) | | | 16,350 | | | | 554,101 | |
Standard Chartered plc (United Kingdom)1 | | | 12,270 | | | | 299,949 | |
U.S. Bancorp | | | 18,760 | | | | 603,509 | |
Wells Fargo & Co. | | | 17,330 | | | | 579,342 | |
| | | | | | | | |
| | | | | | | 6,256,777 | |
| | | | | | | | |
| | |
Consumer Finance - 1.26% | | | | | | | | |
American Express Co. | | | 111,500 | | | | 6,713,415 | |
Discover Financial Services | | | 273,130 | | | | 9,259,107 | |
| | | | | | | | |
| | | | | | | 15,972,522 | |
| | | | | | | | |
| | |
Diversified Financial Services - 0.89% | | | | | | | | |
CME Group, Inc. | | | 2,910 | | | | 773,536 | |
Deutsche Boerse AG (Germany)*1 | | | 11,900 | | | | 747,186 | |
ING Groep N.V. (Netherlands)*1 | | | 4,775 | | | | 33,687 | |
JPMorgan Chase & Co. | | | 16,900 | | | | 726,362 | |
JSE Ltd. (South Africa)1 | | | 122,580 | | | | 1,298,122 | |
Moody’s Corp. | | | 188,740 | | | | 7,728,903 | |
| | | | | | | | |
| | | | | | | 11,307,796 | |
| | | | | | | | |
| | |
Insurance - 0.37% | | | | | | | | |
Admiral Group plc (United Kingdom)1 | | | 32,550 | | | | 639,716 | |
Allianz SE (Germany)1 | | | 7,010 | | | | 781,903 | |
The Allstate Corp. | | | 17,600 | | | | 586,608 | |
AXA S.A. (France)1 | | | 4,080 | | | | 57,977 | |
Brasil Insurance Participacoes e Administracao S.A. (Brazil) | | | 55,600 | | | | 598,251 | |
Mapfre S.A. (Spain)1 | | | 314,900 | | | | 911,604 | |
Muenchener Rueckversicherungs AG (MunichRe) (Germany)1 | | | 3,525 | | | | 512,006 | |
Zurich Insurance Group AG (Switzerland)1 | | | 2,280 | | | | 558,607 | |
| | | | | | | | |
| | | | | | | 4,646,672 | |
| | | | | | | | |
| | |
Real Estate Investment Trusts (REITS) - 2.51% | | | | | | | | |
Alexandria Real Estate Equities, Inc. | | | 22,840 | | | | 1,711,173 | |
Alstria Office REIT AG (Germany)1 | | | 38,200 | | | | 407,253 | |
American Assets Trust, Inc. | | | 12,960 | | | | 304,690 | |
American Campus Communities, Inc. | | | 14,830 | | | | 659,193 | |
Apartment Investment & Management Co. - Class A | | | 14,110 | | | | 383,086 | |
Associated Estates Realty Corp. | | | 5,940 | | | | 100,564 | |
The accompanying notes are an integral part of the financial statements.
44
Investment Portfolio - April 30, 2012
(unaudited)
| | | | | | | | |
| PRO-BLEND® MODERATE TERM SERIES | | SHARES | | | VALUE (NOTE 2) | |
| | |
COMMON STOCKS (continued) | | | | | | | | |
| | |
Financials (continued) | | | | | | | | |
Real Estate Investment Trusts (REITS) (continued) | | | | | | | | |
AvalonBay Communities, Inc. | | | 2,130 | | | $ | 309,702 | |
BioMed Realty Trust, Inc. | | | 161,140 | | | | 3,193,795 | |
Boston Properties, Inc. | | | 8,650 | | | | 936,363 | |
Camden Property Trust | | | 6,420 | | | | 434,441 | |
CBL & Associates Properties, Inc. | | | 14,580 | | | | 271,625 | |
Cedar Realty Trust, Inc. | | | 14,260 | | | | 74,437 | |
Coresite Realty Corp. | | | 17,260 | | | | 429,947 | |
Corporate Office Properties Trust | | | 105,450 | | | | 2,483,347 | |
CubeSmart | | | 30,510 | | | | 383,206 | |
Digital Realty Trust, Inc. | | | 44,390 | | | | 3,333,245 | |
DuPont Fabros Technology, Inc. | | | 123,780 | | | | 3,360,627 | |
Education Realty Trust, Inc. | | | 32,910 | | | | 370,896 | |
Equity Lifestyle Properties, Inc. | | | 4,600 | | | | 321,724 | |
Equity One, Inc. | | | 16,730 | | | | 347,649 | |
Equity Residential | | | 4,640 | | | | 285,082 | |
General Growth Properties, Inc. | | | 29,160 | | | | 519,048 | |
HCP, Inc. | | | 16,710 | | | | 692,629 | |
Health Care REIT, Inc. | | | 12,490 | | | | 707,683 | |
Healthcare Realty Trust, Inc. | | | 10,040 | | | | 215,659 | |
Home Properties, Inc. | | | 10,250 | | | | 625,763 | |
Host Hotels & Resorts, Inc. | | | 51,294 | | | | 853,532 | |
Kimco Realty Corp. | | | 11,120 | | | | 215,839 | |
Land Securities Group plc (United Kingdom)1 | | | 31,610 | | | | 373,293 | |
LTC Properties, Inc. | | | 7,050 | | | | 234,624 | |
The Macerich Co. | | | 4,210 | | | | 259,210 | |
Mack-Cali Realty Corp. | | | 11,970 | | | | 343,778 | |
Mid-America Apartment Communities, Inc. | | | 9,110 | | | | 620,118 | |
National Retail Properties, Inc. | | | 11,060 | | | | 302,823 | |
Pebblebrook Hotel Trust | | | 47,130 | | | | 1,134,890 | |
Potlatch Corp. | | | 3,130 | | | | 97,969 | |
ProLogis, Inc. | | | 7,550 | | | | 270,139 | |
Public Storage | | | 2,330 | | | | 333,796 | |
Realty Income Corp. | | | 9,080 | | | | 357,207 | |
Simon Property Group, Inc. | | | 8,330 | | | | 1,296,148 | |
Sovran Self Storage, Inc. | | | 12,950 | | | | 682,465 | |
Tanger Factory Outlet Centers | | | 6,410 | | | | 200,761 | |
Taubman Centers, Inc. | | | 3,490 | | | | 269,358 | |
UDR, Inc. | | | 32,900 | | | | 866,257 | |
Unibail-Rodamco SE (France)1 | | | 1,110 | | | | 207,700 | |
| | | | | | | | |
| | | | | | | 31,782,734 | |
| | | | | | | | |
| | |
Real Estate Management & Development - 0.04% | | | | | | | | |
General Shopping Brasil S.A. (Brazil)* | | | 63,530 | | | | 384,949 | |
The accompanying notes are an integral part of the financial statements.
45
Investment Portfolio - April 30, 2012
(unaudited)
| | | | | | | | |
| PRO-BLEND® MODERATE TERM SERIES | | SHARES | | | VALUE (NOTE 2) | |
| | |
COMMON STOCKS (continued) | | | | | | | | |
| | |
Financials (continued) | | | | | | | | |
Real Estate Management & Development (continued) | | | | | | | | |
Thomas Properties Group, Inc. | | | 31,900 | | | $ | 155,672 | |
| | | | | | | | |
| | | | | | | 540,621 | |
| | | | | | | | |
Thrifts & Mortgage Finance - 0.01% | | | | | | | | |
Aareal Bank AG (Germany)*1 | | | 8,370 | | | | 161,662 | |
| | | | | | | | |
| | |
Total Financials | | | | | | | 71,775,241 | |
| | | | | | | | |
Health Care - 5.51% | | | | | | | | |
Biotechnology - 0.26% | | | | | | | | |
Dendreon Corp.* | | | 57,430 | | | | 669,059 | |
Exact Sciences Corp.* | | | 72,990 | | | | 786,102 | |
Myriad Genetics, Inc.* | | | 71,540 | | | | 1,860,755 | |
| | | | | | | | |
| | | | | | | 3,315,916 | |
| | | | | | | | |
| | |
Health Care Equipment & Supplies - 1.20% | | | | | | | | |
Abaxis, Inc.* | | | 31,440 | | | | 1,119,893 | |
Alere, Inc.* | | | 46,300 | | | | 1,106,107 | |
Becton, Dickinson and Co. | | | 77,680 | | | | 6,093,996 | |
BioMerieux (France)1 | | | 10,240 | | | | 839,174 | |
DexCom, Inc.* | | | 51,120 | | | | 500,465 | |
HeartWare International, Inc.* | | | 12,220 | | | | 952,671 | |
Insulet Corp.* | | | 57,770 | | | | 1,031,772 | |
Mindray Medical International Ltd. - ADR (China) | | | 15,430 | | | | 505,487 | |
Neogen Corp.* | | | 6,500 | | | | 253,435 | |
Quidel Corp.* | | | 35,180 | | | | 581,174 | |
Sirona Dental Systems, Inc.* | | | 12,740 | | | | 643,497 | |
Straumann Holding AG (Switzerland)1 | | | 5,370 | | | | 892,315 | |
Thoratec Corp.* | | | 18,980 | | | | 660,694 | |
| | | | | | | | |
| | | | | | | 15,180,680 | |
| | | | | | | | |
| | |
Health Care Providers & Services - 0.24% | | | | | | | | |
Amil Participacoes S.A. (Brazil) | | | 34,230 | | | | 334,731 | |
China Cord Blood Corp. - ADR (Hong Kong)* | | | 80,000 | | | | 233,600 | |
Odontoprev S.A. (Brazil) | | | 117,630 | | | | 621,427 | |
Sonic Healthcare Ltd. (Australia)1 | | | 140,860 | | | | 1,842,680 | |
| | | | | | | | |
| | | | | | | 3,032,438 | |
| | | | | | | | |
| | |
Health Care Technology - 2.11% | | | | | | | | |
Allscripts Healthcare Solutions, Inc.* | | | 406,610 | | | | 4,505,239 | |
Cerner Corp.* | | | 255,218 | | | | 20,695,628 | |
Computer Programs & Systems, Inc. | | | 10,140 | | | | 604,243 | |
Greenway Medical Technologies, Inc.* | | | 34,630 | | | | 533,302 | |
Quality Systems, Inc. | | | 10,460 | | | | 391,204 | |
| | | | | | | | |
| | | | | | | 26,729,616 | |
| | | | | | | | |
The accompanying notes are an integral part of the financial statements.
46
Investment Portfolio - April 30, 2012
(unaudited)
| | | | | | | | |
| PRO-BLEND® MODERATE TERM SERIES | | SHARES | | | VALUE (NOTE 2) | |
| | |
COMMON STOCKS (continued) | | | | | | | | |
| | |
Health Care (continued) | | | | | | | | |
Life Sciences Tools & Services - 1.18% | | | | | | | | |
Lonza Group AG (Switzerland)1 | | | 7,590 | | | $ | 342,471 | |
Luminex Corp.* | | | 27,530 | | | | 689,351 | |
QIAGEN N.V. (Netherlands)*1 | | | 11,170 | | | | 184,691 | |
QIAGEN N.V. - ADR (Netherlands)* | | | 481,310 | | | | 8,052,316 | |
Waters Corp.* | | | 52,580 | | | | 4,422,504 | |
WuXi PharmaTech (Cayman), Inc. - ADR (China)* | | | 82,460 | | | | 1,185,775 | |
| | | | | | | | |
| | | | | | | 14,877,108 | |
| | | | | | | | |
| | |
Pharmaceuticals - 0.52% | | | | | | | | |
AstraZeneca plc (United Kingdom)1 | | | 1,890 | | | | 82,823 | |
AstraZeneca plc - ADR (United Kingdom) | | | 11,950 | | | | 524,605 | |
Bayer AG (Germany)1 | | | 9,575 | | | | 674,690 | |
Dr. Reddy’s Laboratories Ltd. - ADR (India) | | | 14,350 | | | | 485,461 | |
GlaxoSmithKline plc (United Kingdom)1 | | | 12,270 | | | | 283,456 | |
Green Cross Corp. (South Korea)1 | | | 7,180 | | | | 848,538 | |
Hikma Pharmaceuticals plc (United Kingdom)1 | | | 74,740 | | | | 761,847 | |
Novo Nordisk A/S - Class B (Denmark)1 | | | 2,330 | | | | 343,496 | |
Optimer Pharmaceuticals, Inc.* | | | 53,190 | | | | 787,212 | |
Sanofi (France)1 | | | 1,960 | | | | 149,708 | |
Santen Pharmaceutical Co. Ltd. (Japan)1 | | | 2,700 | | | | 112,992 | |
Shire plc (Ireland)1 | | | 16,965 | | | | 552,935 | |
Takeda Pharmaceutical Co. Ltd. (Japan)1 | | | 2,400 | | | | 104,724 | |
Teva Pharmaceutical Industries Ltd. - ADR (Israel) | | | 7,240 | | | | 331,158 | |
UCB S.A. (Belgium)1 | | | 10,740 | | | | 502,204 | |
| | | | | | | | |
| | | | | | | 6,545,849 | |
| | | | | | | | |
Total Health Care | | | | | | | 69,681,607 | |
| | | | | | | | |
Industrials - 2.93% | | | | | | | | |
Aerospace & Defense - 0.02% | | | | | | | | |
European Aeronautic Defence and Space Co. N.V. (Netherlands)1 | | | 6,190 | | | | 244,620 | |
| | | | | | | | |
Air Freight & Logistics - 0.06% | | | | | | | | |
FedEx Corp. | | | 7,400 | | | | 652,976 | |
PostNL N.V. (Netherlands)1 | | | 19,940 | | | | 86,769 | |
| | | | | | | | |
| | | | | | | 739,745 | |
| | | | | | | | |
| | |
Airlines - 0.79% | | | | | | | | |
Copa Holdings S.A. - ADR - Class A (Panama) | | | 9,310 | | | | 756,996 | |
Deutsche Lufthansa AG (Germany)1 | | | 15,825 | | | | 206,079 | |
Ryanair Holdings plc - ADR (Ireland)* | | | 20,830 | | | | 701,346 | |
Southwest Airlines Co. | | | 911,545 | | | | 7,547,593 | |
Spirit Airlines, Inc.* | | | 13,000 | | | | 312,260 | |
US Airways Group, Inc.* | | | 51,540 | | | | 528,800 | |
| | | | | | | | |
| | | | | | | 10,053,074 | |
| | | | | | | | |
The accompanying notes are an integral part of the financial statements.
47
Investment Portfolio - April 30, 2012
(unaudited)
| | | | | | | | |
| PRO-BLEND® MODERATE TERM SERIES | | SHARES | | | VALUE (NOTE 2) | |
| | |
COMMON STOCKS (continued) | | | | | | | | |
| | |
Industrials (continued) | | | | | | | | |
Commercial Services & Supplies - 0.14% | | | | | | | | |
Edenred (France)1 | | | 34,340 | | | $ | 1,097,076 | |
Interface, Inc. - Class A | | | 4,760 | | | | 67,402 | |
Ritchie Bros. Auctioneers, Inc. (Canada) | | | 10,800 | | | | 228,204 | |
Tomra Systems ASA (Norway)1 | | | 49,750 | | | | 388,303 | |
| | | | | | | | |
| | | | | | | 1,780,985 | |
| | | | | | | | |
| | |
Construction & Engineering - 0.01% | | | | | | | | |
MYR Group, Inc.* | | | 4,850 | | | | 81,092 | |
| | | | | | | | |
Electrical Equipment - 0.14% | | | | | | | | |
ABB Ltd. (Asea Brown Boveri) - ADR (Switzerland) | | | 14,800 | | | | 279,276 | |
Alstom S.A. (France)1 | | | 15,620 | | | | 558,643 | |
Nexans S.A. (France)1 | | | 1,630 | | | | 81,694 | |
Polypore International, Inc.* | | | 10,160 | | | | 379,476 | |
Prysmian S.p.A. (Italy)1 | | | 14,760 | | | | 240,424 | |
Schneider Electric S.A. (France)1 | | | 3,960 | | | | 243,919 | |
| | | | | | | | |
| | | | | | | 1,783,432 | |
| | | | | | | | |
| | |
Industrial Conglomerates - 0.08% | | | | | | | | |
Siemens AG (Germany)1 | | | 10,750 | | | | 997,817 | |
| | | | | | | | |
Machinery - 0.83% | | | | | | | | |
AGCO Corp.* | | | 5,300 | | | | 246,874 | |
Astec Industries, Inc.* | | | 2,450 | | | | 76,661 | |
FANUC Corp. (Japan)1 | | | 3,800 | | | | 640,872 | |
Flowserve Corp. | | | 63,650 | | | | 7,315,295 | |
Graham Corp. | | | 7,910 | | | | 174,653 | |
Pall Corp. | | | 4,800 | | | | 286,128 | |
Pentair, Inc. | | | 6,900 | | | | 299,046 | |
Titan International, Inc. | | | 8,050 | | | | 232,565 | |
Wabash National Corp.* | | | 42,470 | | | | 355,474 | |
Westport Innovations, Inc. - ADR (Canada)* | | | 29,170 | | | | 913,021 | |
| | | | | | | | |
| | | | | | | 10,540,589 | |
| | | | | | | | |
| | |
Marine - 0.04% | | | | | | | | |
Baltic Trading Ltd. | | | 10,880 | | | | 50,592 | |
D/S Norden (Denmark)1 | | | 6,410 | | | | 181,924 | |
Mitsui OSK Lines Ltd. (Japan)1 | | | 8,000 | | | | 31,007 | |
Nippon Yusen Kabushiki Kaisha (Japan)1 | | | 11,000 | | | | 32,516 | |
Pacific Basin Shipping Ltd. (Bermuda)1,3 | | | 55,000 | | | | 28,782 | |
Sinotrans Shipping Ltd. (Hong Kong)1 | | | 656,500 | | | | 156,247 | |
| | | | | | | | |
| | | | | | | 481,068 | |
| | | | | | | | |
| | |
Professional Services - 0.15% | | | | | | | | |
The Advisory Board Co.* | | | 11,930 | | | | 1,087,539 | |
The accompanying notes are an integral part of the financial statements.
48
Investment Portfolio - April 30, 2012
(unaudited)
| | | | | | | | |
| PRO-BLEND® MODERATE TERM SERIES | | SHARES | | | VALUE (NOTE 2) | |
| | |
COMMON STOCKS (continued) | | | | | | | | |
| | |
Industrials (continued) | | | | | | | | |
Professional Services (continued) | | | | | | | | |
Qualicorp S.A. (Brazil)* | | | 87,570 | | | $ | 763,076 | |
| | | | | | | | |
| | | | | | | 1,850,615 | |
| | | | | | | | |
| | |
Road & Rail - 0.56% | | | | | | | | |
All America Latina Logistica S.A. (Brazil) | | | 172,990 | | | | 783,204 | |
Norfolk Southern Corp | | | 80,740 | | | | 5,888,368 | |
RailAmerica, Inc.* | | | 18,550 | | | | 429,989 | |
| | | | | | | | |
| | | | | | | 7,101,561 | |
| | | | | | | | |
| | |
Transportation Infrastructure - 0.11% | | | | | | | | |
Groupe Eurotunnel S.A. (France)1 | | | 74,880 | | | | 630,011 | |
Malaysia Airports Holdings Berhad (Malaysia)1 | | | 379,920 | | | | 726,047 | |
| | | | | | | | |
| | | | | | | 1,356,058 | |
| | | | | | | | |
Total Industrials | | | | | | | 37,010,656 | |
| | | | | | | | |
Information Technology - 10.04% | | | | | | | | |
Communications Equipment - 2.12% | | | | | | | | |
Alcatel-Lucent - ADR (France)* | | | 417,200 | | | | 629,972 | |
Cisco Systems, Inc. | | | 497,604 | | | | 10,026,721 | |
Infinera Corp.* | | | 156,790 | | | | 1,122,616 | |
Juniper Networks, Inc.* | | | 428,750 | | | | 9,188,113 | |
Qualcomm, Inc. | | | 78,380 | | | | 5,003,779 | |
Riverbed Technology, Inc.* | | | 41,230 | | | | 813,468 | |
| | | | | | | | |
| | | | | | | 26,784,669 | |
| | | | | | | | |
| | |
Computers & Peripherals - 1.22% | | | | | | | | |
Apple, Inc.* | | | 1,680 | | | | 981,523 | |
EMC Corp.* | | | 496,100 | | | | 13,994,981 | |
Immersion Corp.* | | | 87,100 | | | | 474,695 | |
| | | | | | | | |
| | | | | | | 15,451,199 | |
| | | | | | | | |
| | |
Electronic Equipment, Instruments & Components - 0.86% | | | | | | | | |
Amphenol Corp. - Class A | | | 6,430 | | | | 373,840 | |
Corning, Inc. | | | 611,340 | | | | 8,772,729 | |
Hitachi Ltd. (Japan)1 | | | 114,200 | | | | 727,368 | |
Keyence Corp. (Japan)1 | | | 1,123 | | | | 265,080 | |
Maxwell Technologies, Inc.* | | | 24,960 | | | | 237,370 | |
Nippon Electric Glass Co. Ltd. (Japan)1 | | | 64,500 | | | | 521,145 | |
| | | | | | | | |
| | | | | | | 10,897,532 | |
| | | | | | | | |
| | |
Internet Software & Services - 1.96% | | | | | | | | |
The Active Network, Inc.* | | | 64,730 | | | | 1,087,464 | |
comScore, Inc.* | | | 42,020 | | | | 837,038 | |
Google, Inc. - Class A* | | | 32,666 | | | | 19,770,443 | |
LogMeIn, Inc.* | | | 5,360 | | | | 193,014 | |
The accompanying notes are an integral part of the financial statements.
49
Investment Portfolio - April 30, 2012
(unaudited)
| | | | | | | | |
| PRO-BLEND® MODERATE TERM SERIES | | SHARES | | | VALUE (NOTE 2) | |
| | |
COMMON STOCKS (continued) | | | | | | | | |
| | |
Information Technology (continued) | | | | | | | | |
Internet Software & Services (continued) | | | | | | | | |
NHN Corp. (South Korea)1 | | | 2,280 | | | $ | 515,429 | |
Tencent Holdings Ltd. (China)1 | | | 32,700 | | | | 1,022,980 | |
Velti plc - ADR (Ireland)* | | | 114,130 | | | | 1,363,853 | |
| | | | | | | | |
| | | | | | | 24,790,221 | |
| | | | | | | | |
| | |
IT Services - 2.30% | | | | | | | | |
Amadeus IT Holding S.A. - Class A (Spain)1 | | | 246,240 | | | | 5,040,987 | |
Amdocs Ltd. - ADR (Guernsey)* | | | 31,560 | | | | 1,009,920 | |
Cap Gemini S.A. (France)1 | | | 31,780 | | | | 1,241,557 | |
Euronet Worldwide, Inc.* | | | 36,700 | | | | 793,821 | |
MasterCard, Inc. - Class A | | | 22,440 | | | | 10,148,939 | |
Visa, Inc. - Class A | | | 81,770 | | | | 10,056,075 | |
The Western Union Co. | | | 41,580 | | | | 764,240 | |
| | | | | | | | |
| | | | | | | 29,055,539 | |
| | | | | | | | |
| | |
Semiconductors & Semiconductor Equipment - 0.20% | | | | | | | | |
Aixtron SE NA (Germany)1 | | | 17,600 | | | | 321,572 | |
Samsung Electronics Co. Ltd. (South Korea)1 | | | 590 | | | | 722,137 | |
Sumco Corp. (Japan)*1 | | | 49,600 | | | | 526,537 | |
Tokyo Electron Ltd. (Japan)1 | | | 12,160 | | | | 673,860 | |
Veeco Instruments, Inc.* | | | 9,800 | | | | 295,862 | |
| | | | | | | | |
| | | | | | | 2,539,968 | |
| | | | | | | | |
| | |
Software - 1.38% | | | | | | | | |
Autodesk, Inc.* | | | 208,650 | | | | 8,214,551 | |
Aveva Group plc (United Kingdom)1 | | | 11,560 | | | | 313,015 | |
Electronic Arts, Inc.* | | | 516,160 | | | | 7,938,541 | |
RealPage, Inc.* | | | 37,090 | | | | 673,183 | |
SAP AG (Germany)1 | | | 5,630 | | | | 373,344 | |
| | | | | | | | |
| | | | | | | 17,512,634 | |
| | | | | | | | |
Total Information Technology | | | | | | | 127,031,762 | |
| | | | | | | | |
Materials - 2.69% | | | | | | | | |
Chemicals - 2.10% | | | | | | | | |
Arkema S.A. (France)1 | | | 20 | | | | 1,774 | |
BASF SE (Germany)1 | | | 6,510 | | | | 535,987 | |
Calgon Carbon Corp.* | | | 21,105 | | | | 292,093 | |
Flotek Industries, Inc.* | | | 9,940 | | | | 135,582 | |
Johnson Matthey plc (United Kingdom)1 | | | 20,640 | | | | 775,062 | |
Linde AG (Germany)1 | | | 2,980 | | | | 510,065 | |
Monsanto Co. | | | 246,160 | | | | 18,752,469 | |
Shin-Etsu Chemical Co. Ltd. (Japan)1 | | | 2,200 | | | | 126,983 | |
The accompanying notes are an integral part of the financial statements.
50
Investment Portfolio - April 30, 2012
(unaudited)
| | | | | | | | |
| PRO-BLEND® MODERATE TERM SERIES | | SHARES | | | VALUE (NOTE 2) | |
| | |
COMMON STOCKS (continued) | | | | | | | | |
| | |
Materials (continued) | | | | | | | | |
Chemicals (continued) | | | | | | | | |
Syngenta AG (Switzerland)1 | | | 15,470 | | | $ | 5,424,968 | |
| | | | | | | | |
| | | | | | | 26,554,983 | |
| | | | | | | | |
| | |
Construction Materials - 0.04% | | | | | | | | |
CRH plc (Ireland)1 | | | 10,340 | | | | 209,594 | |
Eagle Materials, Inc. | | | 4,210 | | | | 148,276 | |
Holcim Ltd. (Switzerland)1 | | | 2,450 | | | | 152,812 | |
| | | | | | | | |
| | | | | | | 510,682 | |
| | | | | | | | |
| | |
Metals & Mining - 0.55% | | | | | | | | |
Alcoa, Inc. | | | 698,690 | | | | 6,798,254 | |
Alumina Ltd. (Australia)1 | | | 81,380 | | | | 97,205 | |
Norsk Hydro ASA (Norway)1 | | | 18,130 | | | | 88,406 | |
| | | | | | | | |
| | | | | | | 6,983,865 | |
| | | | | | | | |
Total Materials | | | | | | | 34,049,530 | |
| | | | | | | | |
Telecommunication Services - 0.98% | | | | | | | | |
Diversified Telecommunication Services - 0.87% | | | | | | | | |
Swisscom AG - ADR (Switzerland)4 | | | 7,815 | | | | 289,546 | |
Telefonica S.A. - ADR (Spain) | | | 37,580 | | | | 549,795 | |
Telenor ASA (Norway)1 | | | 522,710 | | | | 9,608,146 | |
Telenor ASA - ADR (Norway)4 | | | 8,880 | | | | 489,199 | |
| | | | | | | | |
| | | | | | | 10,936,686 | |
| | | | | | | | |
| | |
Wireless Telecommunication Services - 0.11% | | | | | | | | |
DiGi.com Berhad (Malaysia)1 | | | 476,000 | | | | 633,482 | |
MTN Group Ltd. (South Africa)1 | | | 8,310 | | | | 145,324 | |
SK Telecom Co. Ltd. - ADR (South Korea) | | | 48,180 | | | | 651,394 | |
| | | | | | | | |
| | | | | | | 1,430,200 | |
| | | | | | | | |
Total Telecommunication Services | | | | | | | 12,366,886 | |
| | | | | | | | |
Utilities - 0.07% | | | | | | | | |
Electric Utilities - 0.03% | | | | | | | | |
E.ON AG (Germany)1 | | | 14,270 | | | | 323,097 | |
| | | | | | | | |
Multi-Utilities - 0.02% | | | | | | | | |
GDF Suez (France)1 | | | 3,795 | | | | 87,377 | |
National Grid plc (United Kingdom)1 | | | 20,900 | | | | 225,690 | |
| | | | | | | | |
| | | | | | | 313,067 | |
| | | | | | | | |
| | |
Water Utilities - 0.02% | | | | | | | | |
Cia de Saneamento de Minas Gerais - Copasa MG (Brazil) | | | 13,330 | | | | 312,244 | |
| | | | | | | | |
Total Utilities | | | | | | | 948,408 | |
| | | | | | | | |
TOTAL COMMON STOCKS | | | | | | | | |
(Identified Cost $506,377,984) | | | | | | | 561,988,578 | |
| | | | | | | | |
The accompanying notes are an integral part of the financial statements.
51
Investment Portfolio - April 30, 2012
(unaudited)
| | | | | | | | |
| PRO-BLEND® MODERATE TERM SERIES | | SHARES/
PRINCIPAL
AMOUNT | | | VALUE
(NOTE 2) | |
| | |
PREFERRED STOCKS - 0.35% | | | | | | | | |
| | |
Financials - 0.35% | | | | | | | | |
Commercial Banks - 0.18% | | | | | | | | |
BB&T Corp. (non-cumulative), 5.85%5 | | | 44,000 | | | $ | 1,100,000 | |
PNC Financial Services Group, Inc., Series K (non-cumulative), 8.25%5 | | | 350,000 | | | | 362,963 | |
U.S. Bancorp., Series F (non-cumulative), 6.50%5 | | | 29,800 | | | | 806,388 | |
| | | | | | | | |
| | | | | | | 2,269,351 | |
| | | | | | | | |
| | |
Diversified Financial Services - 0.09% | | | | | | | | |
Bank of America Corp., Series M (non-cumulative), 8.125%5 | | | 1,085,000 | | | | 1,124,277 | |
| | | | | | | | |
Real Estate Investment Trusts (REITS) - 0.08% | | | | | | | | |
Public Storage, Series Q, 6.50% | | | 37,110 | | | | 1,021,267 | |
| | | | | | | | |
Total Financials | | | | | | | 4,414,895 | |
| | | | | | | | |
TOTAL PREFERRED STOCKS
(Identified Cost $4,215,643) | | | | | | | 4,414,895 | |
| | | | | | | | |
| | |
CORPORATE BONDS - 23.85% | | | | | | | | |
| | |
Convertible Corporate Bonds - 0.19% | | | | | | | | |
Financials - 0.08% | | | | | | | | |
Real Estate Investment Trusts (REITS) - 0.08% | | | | | | | | |
BioMed Realty LP6 , 3.75%, 1/15/2030 | | $ | 825,000 | | | | 996,187 | |
| | | | | | | | |
Health Care - 0.03% | | | | | | | | |
Health Care Equipment & Supplies - 0.03% | | | | | | | | |
Alere, Inc., 3.00%, 5/15/2016 | | | 330,000 | | | | 320,100 | |
Medtronic, Inc., 1.625%, 4/15/2013 | | | 90,000 | | | | 90,562 | |
| | | | | | | | |
Total Health Care | | | | | | | 410,662 | |
| | | | | | | | |
Information Technology - 0.03% | | | | | | | | |
Computers & Peripherals - 0.03% | | | | | | | | |
EMC Corp., 1.75%, 12/1/2013 | | | 215,000 | | | | 382,163 | |
| | | | | | | | |
Materials - 0.05% | | | | | | | | |
Containers & Packaging - 0.05% | | | | | | | | |
Owens-Brockway Glass Container, Inc.6, 3.00%, 6/1/2015 | | | 655,000 | | | | 639,444 | |
| | | | | | | | |
Total Convertible Corporate Bonds
(Identified Cost $2,245,151) | | | | | | | 2,428,456 | |
| | | | | | | | |
Non-Convertible Corporate Bonds - 23.66% | | | | | | | | |
Consumer Discretionary - 2.63% | | | | | | | | |
Auto Components - 0.05% | | | | | | | | |
UCI International, Inc., 8.625%, 2/15/2019 | | | 625,000 | | | | 640,625 | |
| | | | | | | | |
Hotels, Restaurants & Leisure - 0.31% | | | | | | | | |
International Game Technology, 7.50%, 6/15/2019 | | | 2,415,000 | | | | 2,868,844 | |
Yum! Brands, Inc., 3.875%, 11/1/2020 | | | 960,000 | | | | 1,020,722 | |
| | | | | | | | |
| | | | | | | 3,889,566 | |
| | | | | | | | |
The accompanying notes are an integral part of the financial statements.
52
Investment Portfolio - April 30, 2012
(unaudited)
| | | | | | | | |
| PRO-BLEND® MODERATE TERM SERIES | | PRINCIPAL
AMOUNT | | | VALUE (NOTE 2) | |
| | |
CORPORATE BONDS (continued) | | | | | | | | |
| | |
Non-Convertible Corporate Bonds (continued) | | | | | | | | |
Consumer Discretionary (continued) | | | | | | | | |
Household Durables - 0.51% | | | | | | | | |
Newell Rubbermaid, Inc., 4.70%, 8/15/2020 | | $ | 1,855,000 | | | $ | 2,007,535 | |
Taylor Morrison Communities, Inc. - Monarch Communities, Inc.6, 7.75%, 4/15/2020 | | | 620,000 | | | | 638,600 | |
Tupperware Brands Corp., 4.75%, 6/1/2021 | | | 3,750,000 | | | | 3,857,134 | |
| | | | | | | | |
| | | | | | | 6,503,269 | |
| | | | | | | | |
| | |
Media - 0.94% | | | | | | | | |
Cablevision Systems Corp., 8.625%, 9/15/2017 | | | 535,000 | | | | 587,163 | |
Columbus International, Inc. (Barbados)6, 11.50%, 11/20/2014 | | | 210,000 | | | | 227,850 | |
DIRECTV Holdings LLC - DIRECTV Financing Co., Inc., 5.20%, 3/15/2020 | | | 1,740,000 | | | | 1,933,587 | |
Discovery Communications LLC, 5.05%, 6/1/2020 | | | 1,715,000 | | | | 1,959,556 | |
Intelsat Jackson Holdings S.A. (Luxembourg), 7.25%, 4/1/2019 | | | 565,000 | | | | 589,013 | |
Kabel BW GmbH (Germany)6, 7.50%, 3/15/2019 | | | 310,000 | | | | 330,925 | |
MDC Partners, Inc. (Canada), 11.00%, 11/1/2016 | | | 545,000 | | | | 592,687 | |
Nara Cable Funding Ltd. (Ireland)6, 8.875%, 12/1/2018 | | | 680,000 | | | | 622,200 | |
NBCUniversal Media LLC, 5.15%, 4/30/2020 | | | 1,940,000 | | | | 2,232,199 | |
Time Warner, Inc., 4.75%, 3/29/2021 | | | 1,435,000 | | | | 1,600,836 | |
Unitymedia Hessen GmbH & Co. KG - Unitymedia NRW GmbH (Germany)6, 8.125%, 12/1/2017 | | | 865,000 | | | | 927,713 | |
XM Satellite Radio, Inc.6, 7.625%, 11/1/2018 | | | 300,000 | | | | 327,000 | |
| | | | | | | | |
| | | | | | | 11,930,729 | |
| | | | | | | | |
| | |
Multiline Retail - 0.08% | | | | | | | | |
Target Corp., 6.00%, 1/15/2018 | | | 790,000 | | | | 970,834 | |
| | | | | | | | |
Specialty Retail - 0.63% | | | | | | | | |
Advance Auto Parts, Inc., 4.50%, 1/15/2022 | | | 1,955,000 | | | | 2,060,396 | |
The Home Depot, Inc., 5.40%, 3/1/2016 | | | 1,615,000 | | | | 1,863,994 | |
Lowe’s Companies, Inc., 6.10%, 9/15/2017 | | | 620,000 | | | | 749,745 | |
O’Reilly Automotive, Inc., 4.875%, 1/14/2021 | | | 920,000 | | | | 996,757 | |
Rent-A-Center, Inc., 6.625%, 11/15/2020 | | | 1,025,000 | | | | 1,071,125 | |
Toys R Us Property Co. II LLC, 8.50%, 12/1/2017 | | | 1,110,000 | | | | 1,154,400 | |
| | | | | | | | |
| | | | | | | 7,896,417 | |
| | | | | | | | |
| | |
Textiles, Apparel & Luxury Goods - 0.11% | | | | | | | | |
Jones Group - Apparel Group Holdings - Apparel Group USA - Footwear Accessories Retail, 6.875%, 3/15/2019 | | | 615,000 | | | | 598,856 | |
VF Corp., 5.95%, 11/1/2017 | | | 640,000 | | | | 763,898 | |
| | | | | | | | |
| | | | | | | 1,362,754 | |
| | | | | | | | |
Total Consumer Discretionary | | | | | | | 33,194,194 | |
| | | | | | | | |
Consumer Staples - 0.26% | | | | | | | | |
Beverages - 0.12% | | | | | | | | |
Beam, Inc., 5.375%, 1/15/2016 | | | 234,000 | | | | 260,156 | |
Constellation Brands, Inc., 7.25%, 9/1/2016 | | | 565,000 | | | | 638,450 | |
The accompanying notes are an integral part of the financial statements.
53
Investment Portfolio - April 30, 2012
(unaudited)
| | | | | | | | |
| PRO-BLEND® MODERATE TERM SERIES | | PRINCIPAL
AMOUNT | | | VALUE (NOTE 2) | |
| | |
CORPORATE BONDS (continued) | | | | | | | | |
| | |
Non-Convertible Corporate Bonds (continued) | | | | | | | | |
Consumer Staples (continued) | | | | | | | | |
Beverages (continued) | | | | | | | | |
Constellation Brands, Inc., 7.25%, 5/15/2017 | | $ | 290,000 | | | $ | 327,700 | |
PepsiCo, Inc., 7.90%, 11/1/2018 | | | 187,000 | | | | 253,732 | |
| | | | | | | | |
| | | | | | | 1,480,038 | |
| | | | | | | | |
| | |
Food Products - 0.09% | | | | | | | | |
Kraft Foods, Inc., 6.125%, 2/1/2018 | | | 950,000 | | | | 1,143,828 | |
| | | | | | | | |
Personal Products - 0.05% | | | | | | | | |
Revlon Consumer Products Corp., 9.75%, 11/15/2015 | | | 620,000 | | | | 668,825 | |
| | | | | | | | |
Total Consumer Staples | | | | | | | 3,292,691 | |
| | | | | | | | |
Energy - 1.44% | | | | | | | | |
Energy Equipment & Services - 0.87% | | | | | | | | |
Baker Hughes, Inc., 7.50%, 11/15/2018 | | | 1,085,000 | | | | 1,443,984 | |
Calfrac Holdings LP6, 7.50%, 12/1/2020 | | | 1,230,000 | | | | 1,205,400 | |
Schlumberger Oilfield plc (United Kingdom)6, 4.20%, 1/15/2021 | | | 905,000 | | | | 1,000,137 | |
SESI LLC, 6.375%, 5/1/2019 | | | 565,000 | | | | 587,600 | |
Thermon Industries, Inc., 9.50%, 5/1/2017 | | | 567,000 | | | | 623,700 | |
Trinidad Drilling Ltd. (Canada)6, 7.875%, 1/15/2019 | | | 590,000 | | | | 628,350 | |
Weatherford International Ltd. (Switzerland), 9.625%, 3/1/2019 | | | 4,175,000 | | | | 5,523,020 | |
| | | | | | | | |
| | | | | | | 11,012,191 | |
| | | | | | | | |
| | |
Oil, Gas & Consumable Fuels - 0.57% | | | | | | | | |
Anadarko Petroleum Corp., 5.95%, 9/15/2016 | | | 2,100,000 | | | | 2,427,902 | |
Anadarko Petroleum Corp., 8.70%, 3/15/2019 | | | 425,000 | | | | 565,417 | |
Chaparral Energy, Inc., 8.25%, 9/1/2021 | | | 550,000 | | | | 585,750 | |
Chaparral Energy, Inc.6, 7.625%, 11/15/2022 | | | 370,000 | | | | 377,400 | |
Chesapeake Oilfield Operating LLC - Chesapeake Oilfield Finance, Inc.6, 6.625%, 11/15/2019 | | | 990,000 | | | | 930,600 | |
Energy XXI Gulf Coast, Inc., 9.25%, 12/15/2017 | | | 560,000 | | | | 614,600 | |
PBF Holding Co. LLC - PBF Finance Corp.6, 8.25%, 2/15/2020 | | | 680,000 | | | | 703,800 | |
Targa Resources Partners LP - Targa Resources Partners Finance Corp., 8.25%, 7/1/2016 | | | 465,000 | | | | 489,413 | |
Tesoro Corp., 9.75%, 6/1/2019 | | | 485,000 | | | | 551,687 | |
| | | | | | | | |
| | | | | | | 7,246,569 | |
| | | | | | | | |
Total Energy | | | | | | | 18,258,760 | |
| | | | | | | | |
Financials - 11.51% | | | | | | | | |
Capital Markets - 3.48% | | | | | | | | |
Barclays Bank plc (United Kingdom)6, 2.50%, 9/21/2015 | | | 4,045,000 | | | | 4,148,499 | |
BNP Paribas Home Loan Covered Bonds S.A. (France)6, 2.20%, 11/2/2015 | | | 4,045,000 | | | | 4,055,388 | |
The Charles Schwab Corp., 4.45%, 7/22/2020 | | | 4,740,000 | | | | 5,257,229 | |
Credit Suisse AG (Switzerland)6, 2.60%, 5/27/2016 | | | 5,710,000 | | | | 5,845,150 | |
GFI Group, Inc., 8.375%, 7/19/2018 | | | 800,000 | | | | 738,000 | |
The accompanying notes are an integral part of the financial statements.
54
Investment Portfolio - April 30, 2012
(unaudited)
| | | | | | | | |
| PRO-BLEND® MODERATE TERM SERIES | | PRINCIPAL
AMOUNT | | | VALUE (NOTE 2) | |
| | |
CORPORATE BONDS (continued) | | | | | | | | |
| | |
Non-Convertible Corporate Bonds (continued) | | | | | | | | |
Financials (continued) | | | | | | | | |
Capital Markets (continued) | | | | | | | | |
Goldman Sachs Capital I, 6.345%, 2/15/2034 | | $ | 795,000 | | | $ | 741,398 | |
Goldman Sachs Capital II7, 5.793%, 6/1/2043 | | | 1,215,000 | | | | 835,313 | |
The Goldman Sachs Group, Inc., 6.15%, 4/1/2018 | | | 890,000 | | | | 968,756 | |
The Goldman Sachs Group, Inc., 5.375%, 3/15/2020 | | | 4,285,000 | | | | 4,446,013 | |
Jefferies Group, Inc., 8.50%, 7/15/2019 | | | 2,470,000 | | | | 2,729,350 | |
Merrill Lynch & Co., Inc., 6.05%, 8/15/2012 | | | 4,625,000 | | | | 4,692,016 | |
Merrill Lynch & Co., Inc., 6.875%, 4/25/2018 | | | 1,250,000 | | | | 1,392,927 | |
Morgan Stanley, 5.55%, 4/27/2017 | | | 687,000 | | | | 698,906 | |
Morgan Stanley, 7.30%, 5/13/2019 | | | 940,000 | | | | 1,008,935 | |
Morgan Stanley, 5.50%, 1/26/2020 | | | 4,255,000 | | | | 4,159,152 | |
Morgan Stanley, 5.75%, 1/25/2021 | | | 1,900,000 | | | | 1,876,125 | |
Neuberger Berman Group LLC - Neuberger Berman Finance Corp.6, 5.625%, 3/15/2020 | | | 130,000 | | | | 131,950 | |
Neuberger Berman Group LLC - Neuberger Berman Finance Corp.6, 5.875%, 3/15/2022 | | | 260,000 | | | | 264,550 | |
| | | | | | | | |
| | | | | | | 43,989,657 | |
| | | | | | | | |
| | |
Commercial Banks - 3.36% | | | | | | | | |
Bank of Montreal (Canada)6, 1.30%, 10/31/2014 | | | 3,430,000 | | | | 3,475,461 | |
Bank of Montreal (Canada)6, 2.625%, 1/25/2016 | | | 2,730,000 | | | | 2,877,933 | |
Bank of Nova Scotia (Canada)6, 1.45%, 7/26/2013 | | | 2,200,000 | | | | 2,226,424 | |
Bank of Nova Scotia (Canada)6, 1.65%, 10/29/2015 | | | 4,045,000 | | | | 4,123,768 | |
Canadian Imperial Bank of Commerce (Canada)6, 1.50%, 12/12/2014 | | | 2,450,000 | | | | 2,494,303 | |
CIT Group, Inc., 5.25%, 3/15/2018 | | | 645,000 | | | | 664,350 | |
Intesa Sanpaolo S.p.A. (Italy)6, 6.50%, 2/24/2021 | | | 975,000 | | | | 885,844 | |
KeyBank National Association, 5.45%, 3/3/2016 | | | 1,340,000 | | | | 1,488,225 | |
Manufacturers & Traders Trust Co., 6.625%, 12/4/2017 | | | 2,050,000 | | | | 2,385,862 | |
National Bank of Canada (Canada)6, 2.20%, 10/19/2016 | | | 4,650,000 | | | | 4,821,655 | |
National City Corp., 6.875%, 5/15/2019 | | | 820,000 | | | | 970,722 | |
PNC Bank National Association, 5.25%, 1/15/2017 | | | 545,000 | | | | 607,184 | |
Royal Bank of Canada (Canada)6, 3.125%, 4/14/2015 | | | 5,215,000 | | | | 5,526,075 | |
Santander Holdings USA, Inc., 4.625%, 4/19/2016 | | | 260,000 | | | | 259,103 | |
Santander Issuances S.A. Unipersonal (Spain)6, 5.911%, 6/20/2016 | | | 900,000 | | | | 875,824 | |
Societe Generale S.A. (France)6, 5.75%, 4/20/2016 | | | 970,000 | | | | 935,062 | |
The Toronto-Dominion Bank (Canada)6, 2.20%, 7/29/2015 | | | 4,045,000 | | | | 4,203,819 | |
The Toronto-Dominion Bank (Canada)6, 1.625%, 9/14/2016 | | | 2,300,000 | | | | 2,327,214 | |
Wachovia Corp., 5.25%, 8/1/2014 | | | 1,300,000 | | | | 1,397,829 | |
| | | | | | | | |
| | | | | | | 42,546,657 | |
| | | | | | | | |
| | |
Consumer Finance - 0.81% | | | | | | | | |
American Express Co., 8.125%, 5/20/2019 | | | 5,465,000 | | | | 7,238,223 | |
American Express Co.7, 6.80%, 9/1/2066 | | | 950,000 | | | | 970,425 | |
The accompanying notes are an integral part of the financial statements.
55
Investment Portfolio - April 30, 2012
(unaudited)
| | | | | | | | |
| PRO-BLEND® MODERATE TERM SERIES | | PRINCIPAL
AMOUNT | | | VALUE (NOTE 2) | |
| | |
CORPORATE BONDS (continued) | | | | | | | | |
| | |
Non-Convertible Corporate Bonds (continued) | | | | | | | | |
Financials (continued) | | | | | | | | |
Consumer Finance (continued) | | | | | | | | |
Credit Acceptance Corp., 9.125%, 2/1/2017 | | $ | 1,020,000 | | | $ | 1,109,250 | |
Discover Financial Services6, 5.20%, 4/27/2022 | | | 960,000 | | | | 996,288 | |
| | | | | | | | |
| | | | | | | 10,314,186 | |
| | | | | | | | |
| | |
Diversified Financial Services - 1.58% | | | | | | | | |
Bank of America Corp., 5.75%, 8/15/2016 | | | 980,000 | | | | 1,022,861 | |
Bank of America Corp., 5.65%, 5/1/2018 | | | 850,000 | | | | 898,984 | |
Bank of America Corp., 7.625%, 6/1/2019 | | | 4,455,000 | | | | 5,134,624 | |
Bank of America Corp.8, 5.13%, 2/24/2026 | | | 940,000 | | | | 918,811 | |
Citigroup, Inc., 8.50%, 5/22/2019 | | | 4,520,000 | | | | 5,616,005 | |
CNH Capital LLC6, 6.25%, 11/1/2016 | | | 575,000 | | | | 613,094 | |
JPMorgan Chase & Co., 6.30%, 4/23/2019 | | | 1,130,000 | | | | 1,323,091 | |
JPMorgan Chase & Co., 4.95%, 3/25/2020 | | | 4,040,000 | | | | 4,436,502 | |
| | | | | | | | |
| | | | | | | 19,963,972 | |
| | | | | | | | |
| | |
Insurance - 0.42% | | | | | | | | |
American International Group, Inc., 4.25%, 5/15/2013 | | | 485,000 | | | | 494,739 | |
Fidelity National Financial, Inc., 6.60%, 5/15/2017 | | | 1,985,000 | | | | 2,114,674 | |
Genworth Financial, Inc., 7.625%, 9/24/2021 | | | 2,175,000 | | | | 2,147,591 | |
Hartford Financial Services Group, Inc.7, 8.125%, 6/15/2038 | | | 485,000 | | | | 509,250 | |
| | | | | | | | |
| | | | | | | 5,266,254 | |
| | | | | | | | |
| | |
Real Estate Investment Trusts (REITS) - 1.86% | | | | | | | | |
BioMed Realty LP, 3.85%, 4/15/2016 | | | 950,000 | | | | 985,926 | |
Boston Properties LP, 5.875%, 10/15/2019 | | | 1,285,000 | | | | 1,488,612 | |
Boston Properties LP, 5.625%, 11/15/2020 | | | 410,000 | | | | 471,992 | |
Camden Property Trust, 5.70%, 5/15/2017 | | | 705,000 | | | | 792,920 | |
Digital Realty Trust LP, 5.875%, 2/1/2020 | | | 4,750,000 | | | | 5,233,075 | |
DuPont Fabros Technology LP, 8.50%, 12/15/2017 | | | 840,000 | | | | 926,100 | |
HCP, Inc., 6.70%, 1/30/2018 | | | 3,675,000 | | | | 4,300,195 | |
Health Care REIT, Inc., 6.20%, 6/1/2016 | | | 3,640,000 | | | | 4,037,939 | |
Mack-Cali Realty LP, 7.75%, 8/15/2019 | | | 770,000 | | | | 947,259 | |
National Retail Properties, Inc., 6.875%, 10/15/2017 | | | 650,000 | | | | 746,129 | |
Simon Property Group LP, 10.35%, 4/1/2019 | | | 1,060,000 | | | | 1,470,475 | |
UDR, Inc., 4.625%, 1/10/2022 | | | 1,980,000 | | | | 2,070,896 | |
| | | | | | | | |
| | | | | | | 23,471,518 | |
| | | | | | | | |
Total Financials | | | | | | | 145,552,244 | |
| | | | | | | | |
Health Care - 1.26% | | | | | | | | |
Biotechnology - 0.38% | | | | | | | | |
Amgen, Inc., 3.45%, 10/1/2020 | | | 4,750,000 | | | | 4,859,782 | |
| | | | | | | | |
Health Care Equipment & Supplies - 0.30% | | | | | | | | |
Alere, Inc., 9.00%, 5/15/2016 | | | 790,000 | | | | 816,662 | |
The accompanying notes are an integral part of the financial statements.
56
Investment Portfolio - April 30, 2012
(unaudited)
| | | | | | | | |
| PRO-BLEND® MODERATE TERM SERIES | | PRINCIPAL
AMOUNT | | | VALUE (NOTE 2) | |
| | |
CORPORATE BONDS (continued) | | | | | | | | |
| | |
Non-Convertible Corporate Bonds (continued) | | | | | | | | |
Health Care (continued) | | | | | | | | |
Health Care Equipment & Supplies (continued) | | | | | | | | |
CR Bard, Inc., 4.40%, 1/15/2021 | | $ | 905,000 | | | $ | 1,026,178 | |
Fresenius Medical Care US Finance, Inc., 6.875%, 7/15/2017 | | | 785,000 | | | | 858,594 | |
Fresenius US Finance II, Inc.6, 9.00%, 7/15/2015 | | | 975,000 | | | | 1,117,594 | |
| | | | | | | | |
| | | | | | | 3,819,028 | |
| | | | | | | | |
| | |
Health Care Providers & Services - 0.33% | | | | | | | | |
HCA, Inc., 6.50%, 2/15/2020 | | | 630,000 | | | | 674,100 | |
Health Management Associates, Inc., 6.125%, 4/15/2016 | | | 1,185,000 | | | | 1,244,250 | |
STHI Holding Corp.6, 8.00%, 3/15/2018 | | | 600,000 | | | | 639,000 | |
UnitedHealth Group, Inc., 4.70%, 2/15/2021 | | | 1,450,000 | | | | 1,654,059 | |
| | | | | | | | |
| | | | | | | 4,211,409 | |
| | | | | | | | |
| | |
Life Sciences Tools & Services - 0.08% | | | | | | | | |
Thermo Fisher Scientific, Inc., 4.50%, 3/1/2021 | | | 830,000 | | | | 949,076 | |
| | | | | | | | |
Pharmaceuticals - 0.17% | | | | | | | | |
Novartis Securities Investment Ltd. (Bermuda), 5.125%, 2/10/2019 | | | 1,275,000 | | | | 1,517,599 | |
Valeant Pharmaceuticals International6, 6.75%, 8/15/2021 | | | 645,000 | | | | 627,263 | |
| | | | | | | | |
| | | | | | | 2,144,862 | |
| | | | | | | | |
Total Health Care | | | | | | | 15,984,157 | |
| | | | | | | | |
Industrials - 2.82% | | | | | | | | |
Aerospace & Defense - 0.16% | | | | | | | | |
The Boeing Co., 6.00%, 3/15/2019 | | | 1,185,000 | | | | 1,475,195 | |
Ducommun, Inc., 9.75%, 7/15/2018 | | | 570,000 | | | | 602,775 | |
| | | | | | | | |
| | | | | | | 2,077,970 | |
| | | | | | | | |
| | |
Air Freight & Logistics - 0.15% | | | | | | | | |
Aguila 3 S.A. (Luxembourg)6, 7.875%, 1/31/2018 | | | 1,045,000 | | | | 1,094,637 | |
FedEx Corp., 8.00%, 1/15/2019 | | | 570,000 | | | | 749,280 | |
| | | | | | | | |
| | | | | | | 1,843,917 | |
| | | | | | | | |
| | |
Airlines - 0.37% | | | | | | | | |
Continental Airlines, Inc.6, 6.75%, 9/15/2015 | | | 1,190,000 | | | | 1,218,262 | |
Delta Air Lines Pass-Through Trust, Series 2007-1, Class A, 6.821%, 8/10/2022 | | | 293,174 | | | | 317,360 | |
Delta Air Lines Pass-Through Trust, Series 2010-1, Class B, 6.375%, 1/2/2016 | | | 515,000 | | | | 515,000 | |
Delta Air Lines Pass-Through Trust, Series 2010-2, Class B, 6.75%, 11/23/2015 | | | 290,000 | | | | 291,450 | |
Southwest Airlines Co., 5.25%, 10/1/2014 | | | 1,030,000 | | | | 1,106,831 | |
Southwest Airlines Co., 5.75%, 12/15/2016 | | | 1,120,000 | | | | 1,246,152 | |
| | | | | | | | |
| | | | | | | 4,695,055 | |
| | | | | | | | |
| | |
Building Products - 0.16% | | | | | | | | |
Building Materials Corp. of America6, 6.875%, 8/15/2018 | | | 345,000 | | | | 362,250 | |
Building Materials Corp. of America6, 7.50%, 3/15/2020 | | | 555,000 | | | | 591,075 | |
The accompanying notes are an integral part of the financial statements.
57
Investment Portfolio - April 30, 2012
(unaudited)
| | | | | | | | |
| PRO-BLEND® MODERATE TERM SERIES | | PRINCIPAL
AMOUNT | | | VALUE (NOTE 2) | |
| | |
CORPORATE BONDS (continued) | | | | | | | | |
| | |
Non-Convertible Corporate Bonds (continued) | | | | | | | | |
Industrials (continued) | | | | | | | | |
Building Products (continued) | | | | | | | | |
Owens Corning, 9.00%, 6/15/2019 | | $ | 830,000 | | | $ | 1,029,778 | |
| | | | | | | | |
| | | | | | | 1,983,103 | |
| | | | | | | | |
| | |
Commercial Services & Supplies - 0.28% | | | | | | | | |
Garda World Security Corp. (Canada)6, 9.75%, 3/15/2017 | | | 795,000 | | | | 842,700 | |
International Lease Finance Corp., 8.625%, 1/15/2022 | | | 550,000 | | | | 629,139 | |
Waste Management, Inc., 7.375%, 3/11/2019 | | | 1,665,000 | | | | 2,117,405 | |
| | | | | | | | |
| | | | | | | 3,589,244 | |
| | | | | | | | |
| | |
Industrial Conglomerates - 0.73% | | | | | | | | |
General Electric Capital Corp., 5.625%, 5/1/2018 | | | 335,000 | | | | 388,273 | |
General Electric Capital Corp., 5.50%, 1/8/2020 | | | 4,860,000 | | | | 5,556,900 | |
General Electric Co., 5.25%, 12/6/2017 | | | 550,000 | | | | 641,860 | |
Textron, Inc., 7.25%, 10/1/2019 | | | 1,000,000 | | | | 1,165,115 | |
Tyco Electronics Group S.A. (Luxembourg), 4.875%, 1/15/2021 | | | 1,350,000 | | | | 1,488,656 | |
| | | | | | | | |
| | | | | | | 9,240,804 | |
| | | | | | | | |
| | |
Machinery - 0.53% | | | | | | | | |
Caterpillar Financial Services Corp., 7.05%, 10/1/2018 | | | 1,500,000 | | | | 1,923,343 | |
Caterpillar Financial Services Corp., 7.15%, 2/15/2019 | | | 295,000 | | | | 383,402 | |
Dynacast International LLC - Dynacast Finance, Inc.6, 9.25%, 7/15/2019 | | | 830,000 | | | | 871,500 | |
John Deere Capital Corp., 5.50%, 4/13/2017 | | | 120,000 | | | | 143,354 | |
John Deere Capital Corp., 5.75%, 9/10/2018 | | | 1,895,000 | | | | 2,315,519 | |
Kennametal, Inc., 3.875%, 2/15/2022 | | | 1,055,000 | | | | 1,075,233 | |
| | | | | | | | |
| | | | | | | 6,712,351 | |
| | | | | | | | |
| | |
Marine - 0.07% | | | | | | | | |
Navios Maritime Holdings, Inc. - Navios Maritime Finance US, Inc. (Marshall Island), 8.875%, 11/1/2017 | | | 900,000 | | | | 924,750 | |
| | | | | | | | |
Road & Rail - 0.37% | | | | | | | | |
Avis Budget Car Rental LLC - Avis Budget Finance, Inc., 8.25%, 1/15/2019 | | | 595,000 | | | | 623,263 | |
JB Hunt Transport Services, Inc., 3.375%, 9/15/2015 | | | 2,305,000 | | | | 2,386,459 | |
Union Pacific Corp., 5.65%, 5/1/2017 | | | 815,000 | | | | 955,681 | |
Union Pacific Corp., 7.875%, 1/15/2019 | | | 495,000 | | | | 646,111 | |
| | | | | | | | |
| | | | | | | 4,611,514 | |
| | | | | | | | |
Total Industrials | | | | | | | 35,678,708 | |
| | | | | | | | |
Information Technology - 0.69% | | | | | | | | |
Communications Equipment - 0.14% | | | | | | | | |
Hughes Satellite Systems Corp., 6.50%, 6/15/2019 | | | 1,070,000 | | | | 1,144,900 | |
ViaSat, Inc.6, 6.875%, 6/15/2020 | | | 555,000 | | | | 561,937 | |
| | | | | | | | |
| | | | | | | 1,706,837 | |
| | | | | | | | |
The accompanying notes are an integral part of the financial statements.
58
Investment Portfolio - April 30, 2012
(unaudited)
| | | | | | | | |
| PRO-BLEND® MODERATE TERM SERIES | | PRINCIPAL
AMOUNT | | | VALUE
(NOTE 2) | |
| | |
CORPORATE BONDS (continued) | | | | | | | | |
| | |
Non-Convertible Corporate Bonds (continued) | | | | | | | | |
Information Technology (continued) | | | | | | | | |
Computers & Peripherals - 0.19% | | | | | | | | |
Dell, Inc., 5.875%, 6/15/2019 | | $ | 1,250,000 | | | $ | 1,505,809 | |
Hewlett-Packard Co., 5.50%, 3/1/2018 | | | 815,000 | | | | 930,133 | |
| | | | | | | | |
| | | | | | | 2,435,942 | |
| | | | | | | | |
| | |
Electronic Equipment, Instruments & Components - 0.13% | | | | | | | | |
Amphenol Corp., 4.00%, 2/1/2022 | | | 565,000 | | | | 578,684 | |
Corning, Inc., 6.625%, 5/15/2019 | | | 460,000 | | | | 558,033 | |
CPI International, Inc., 8.00%, 2/15/2018 | | | 580,000 | | | | 511,125 | |
| | | | | | | | |
| | | | | | | 1,647,842 | |
| | | | | | | | |
| | |
IT Services - 0.12% | | | | | | | | |
The Western Union Co., 5.253%, 4/1/2020 | | | 1,350,000 | | | | 1,532,724 | |
| | | | | | | | |
Semiconductors & Semiconductor Equipment - 0.06% | | | | | | | | |
Advanced Micro Devices, Inc., 7.75%, 8/1/2020 | | | 170,000 | | | | 187,425 | |
MagnaChip Semiconductor S.A. - MagnaChip Semiconductor Finance Co., 10.50%, 4/15/2018 | | | 465,000 | | | | 521,963 | |
| | | | | | | | |
| | | | | | | 709,388 | |
| | | | | | | | |
| | |
Software - 0.05% | | | | | | | | |
Sophia LP - Sophia Finance, Inc.6, 9.75%, 1/15/2019 | | | 585,000 | | | | 627,413 | |
| | | | | | | | |
Total Information Technology | | | | | | | 8,660,146 | |
| | | | | | | | |
Materials - 1.97% | | | | | | | | |
Chemicals - 0.21% | | | | | | | | |
E.I. du Pont de Nemours & Co., 6.00%, 7/15/2018 | | | 1,185,000 | | | | 1,470,912 | |
LyondellBasell Industries N.V. (Netherlands)6, 5.00%, 4/15/2019 | | | 620,000 | | | | 640,150 | |
Taminco Global Chemical Corp.6, 9.75%, 3/31/2020 | | | 595,000 | | | | 621,775 | |
| | | | | | | | |
| | | | | | | 2,732,837 | |
| | | | | | | | |
| | |
Containers & Packaging - 0.12% | | | | | | | | |
Longview Fibre Paper & Packaging, Inc.6, 8.00%, 6/1/2016 | | | 570,000 | | | | 575,700 | |
Reynolds Group Issuer, Inc. - Reynolds Group Issuer LLC6, 9.875%, 8/15/2019 | | | 890,000 | | | | 927,825 | |
| | | | | | | | |
| | | | | | | 1,503,525 | |
| | | | | | | | |
| | |
Metals & Mining - 1.33% | | | | | | | | |
Alcoa, Inc., 5.72%, 2/23/2019 | | | 2,166,000 | | | | 2,343,668 | |
Alcoa, Inc., 5.87%, 2/23/2022 | | | 210,000 | | | | 224,596 | |
Allegheny Technologies, Inc., 5.95%, 1/15/2021 | | | 1,345,000 | | | | 1,490,657 | |
ArcelorMittal (Luxembourg), 5.50%, 3/1/2021 | | | 1,900,000 | | | | 1,871,447 | |
BHP Billiton Finance (USA) Ltd. (Australia), 6.50%, 4/1/2019 | | | 1,145,000 | | | | 1,449,381 | |
Calcipar S.A. (Luxembourg)6, 6.875%, 5/1/2018 | | | 630,000 | | | | 645,750 | |
Cliffs Natural Resources, Inc., 5.90%, 3/15/2020 | | | 4,750,000 | | | | 5,307,854 | |
FMG Resources August 2006 Pty. Ltd. (Australia)6, 6.875%, 2/1/2018 | | | 900,000 | | | | 924,750 | |
Rio Tinto Finance USA Ltd. (Australia), 3.75%, 9/20/2021 | | | 1,420,000 | | | | 1,504,690 | |
The accompanying notes are an integral part of the financial statements.
59
Investment Portfolio - April 30, 2012
(unaudited)
| | | | | | | | |
| PRO-BLEND® MODERATE TERM SERIES | | PRINCIPAL
AMOUNT | | | VALUE (NOTE 2) | |
| | |
CORPORATE BONDS (continued) | | | | | | | | |
| | |
Non-Convertible Corporate Bonds (continued) | | | | | | | | |
Materials (continued) | | | | | | | | |
Metals & Mining (continued) | | | | | | | | |
Teck Resources Ltd. (Canada), 3.00%, 3/1/2019 | | $ | 1,065,000 | | | $ | 1,063,666 | |
| | | | | | | | |
| | | | | | | 16,826,459 | |
| | | | | | | | |
| | |
Paper & Forest Products - 0.31% | | | | | | | | |
International Paper Co., 9.375%, 5/15/2019 | | | 1,777,000 | | | | 2,374,925 | |
International Paper Co., 7.50%, 8/15/2021 | | | 1,195,000 | | | | 1,517,113 | |
| | | | | | | | |
| | | | | | | 3,892,038 | |
| | | | | | | | |
Total Materials | | | | | | | 24,954,859 | |
| | | | | | | | |
Telecommunication Services - 0.86% | | | | | | | | |
Diversified Telecommunication Services - 0.53% | | | | | | | | |
Inmarsat Finance plc (United Kingdom)6, 7.375%, 12/1/2017 | | | 1,480,000 | | | | 1,591,000 | |
Sable International Finance Ltd. (Cayman Islands)6, 8.75%, 2/1/2020 | | | 685,000 | | | | 727,813 | |
UPCB Finance III Ltd. (Cayman Islands)6, 6.625%, 7/1/2020 | | | 690,000 | | | | 700,350 | |
UPCB Finance VI Ltd. (Cayman Islands)6, 6.875%, 1/15/2022 | | | 635,000 | | | | 652,463 | |
Verizon Communications, Inc., 3.00%, 4/1/2016 | | | 955,000 | | | | 1,018,177 | |
Wind Acquisition Finance S.A. (Luxembourg)6, 11.75%, 7/15/2017 | | | 460,000 | | | | 451,950 | |
Wind Acquisition Finance S.A. (Luxembourg)6, 7.25%, 2/15/2018 | | | 990,000 | | | | 940,500 | |
Windstream Corp., 7.50%, 6/1/2022 | | | 550,000 | | | | 576,125 | |
| | | | | | | | |
| | | | | | | 6,658,378 | |
| | | | | | | | |
| | |
Wireless Telecommunication Services - 0.33% | | | | | | | | |
CC Holdings GS V LLC - Crown Castle GS III Corp.6, 7.75%, 5/1/2017 | | | 970,000 | | | | 1,057,300 | |
Crown Castle Towers LLC6, 6.113%, 1/15/2020 | | | 1,040,000 | | | | 1,187,651 | |
Crown Castle Towers LLC6, 4.883%, 8/15/2020 | | | 333,000 | | | | 353,218 | |
NII Capital Corp., 8.875%, 12/15/2019 | | | 585,000 | | | | 589,387 | |
NII Capital Corp., 7.625%, 4/1/2021 | | | 375,000 | | | | 348,750 | |
SBA Tower Trust6, 5.101%, 4/15/2017 | | | 575,000 | | | | 625,719 | |
| | | | | | | | |
| | | | | | | 4,162,025 | |
| | | | | | | | |
Total Telecommunication Services | | | | | | | 10,820,403 | |
| | | | | | | | |
Utilities - 0.22% | | | | | | | | |
Electric Utilities - 0.22% | | | | | | | | |
Allegheny Energy Supply Co. LLC6, 5.75%, 10/15/2019 | | | 705,000 | | | | 776,873 | |
Exelon Generation Co. LLC, 5.35%, 1/15/2014 | | | 710,000 | | | | 757,407 | |
Exelon Generation Co. LLC, 5.20%, 10/1/2019 | | | 175,000 | | | | 197,126 | |
Southwestern Electric Power Co., 6.45%, 1/15/2019 | | | 850,000 | | | | 1,018,473 | |
| | | | | | | | |
| | | | | | | 2,749,879 | |
| | | | | | | | |
The accompanying notes are an integral part of the financial statements.
60
Investment Portfolio - April 30, 2012
(unaudited)
| | | | | | | | |
| PRO-BLEND® MODERATE TERM SERIES | | PRINCIPAL
AMOUNT/
SHARES | | | VALUE (NOTE 2) | |
| | |
CORPORATE BONDS (continued) | | | | | | | | |
| | |
Non-Convertible Corporate Bonds (continued) | | | | | | | | |
Utilities (continued) | | | | | | | | |
Multi-Utilities - 0.00% | | | | | | | | |
CenterPoint Energy Resources Corp., Series B, 7.875%, 4/1/2013 | | $ | 50,000 | | | $ | 53,118 | |
| | | | | | | | |
Total Utilities | | | | | | | 2,802,997 | |
| | | | | | | | |
Total Non-Convertible Corporate Bonds | | | | | | | | |
(Identified Cost $281,729,050) | | | | | | | 299,199,159 | |
| | | | | | | | |
TOTAL CORPORATE BONDS | | | | | | | | |
(Identified Cost $283,974,201) | | | | | | | 301,627,615 | |
| | | | | | | | |
| | |
MUTUAL FUNDS - 0.74% | | | | | | | | |
| | |
iShares iBoxx High Yield Corporate Bond Fund | | | 39,130 | | | | 3,568,656 | |
iShares iBoxx Investment Grade Corporate Bond Fund | | | 45,660 | | | | 5,318,477 | |
iShares S&P India Nifty 50 Index Fund | | | 11,200 | | | | 254,576 | |
PowerShares India Portfolio | | | 13,600 | | | | 242,624 | |
| | | | | | | | |
TOTAL MUTUAL FUNDS | | | | | | | | |
(Identified Cost $9,423,239) | | | | | | | 9,384,333 | |
| | | | | | | | |
| | |
U.S. TREASURY SECURITIES - 4.05% | | | | | | | | |
| | |
U.S. Treasury Notes - 4.05% | | | | | | | | |
U.S. Treasury Note, 0.25%, 1/31/2014 | | $ | 14,000,000 | | | | 14,000,546 | |
U.S. Treasury Note, 0.25%, 2/28/2014 | | | 20,000,000 | | | | 19,999,220 | |
U.S. Treasury Note, 2.375%, 2/28/2015 | | | 16,270,000 | | | | 17,176,288 | |
| | | | | | | | |
TOTAL U.S. TREASURY SECURITIES | | | | | | | | |
(Identified Cost $50,192,084) | | | | | | | 51,176,054 | |
| | | | | | | | |
| | |
ASSET-BACKED SECURITIES - 0.22% | | | | | | | | |
| | |
FDIC Trust, Series 2011-R1, Class A6, 2.672%, 7/25/2026 | | | 1,698,126 | | | | 1,744,212 | |
Hertz Vehicle Financing LLC, Series 2009-2A, Class A26, 5.29%, 3/25/2016 | | | 335,000 | | | | 367,185 | |
Hertz Vehicle Financing LLC, Series 2010-1A, Class A26, 3.74%, 2/25/2017 | | | 690,000 | | | | 730,985 | |
| | | | | | | | |
TOTAL ASSET-BACKED SECURITIES | | | | | | | | |
(Identified Cost $2,722,611) | | | | | | | 2,842,382 | |
| | | | | | | | |
| | |
COMMERCIAL MORTGAGE-BACKED SECURITIES - 1.95% | | | | | | | | |
| | |
Americold LLC Trust, Series 2010-ARTA, Class A16, 3.847%, 1/14/2029 | | | 373,640 | | | | 396,149 | |
Banc of America Merrill Lynch Commercial Mortgage, Inc., Series 2006-2, Class A47, 5.731%, 5/10/2045 | | | 1,005,000 | | | | 1,147,455 | |
Banc of America Merrill Lynch Commercial Mortgage, Inc., Series 2006-4, Class A4, 5.634%, 7/10/2046 | | | 1,130,000 | | | | 1,276,989 | |
Bear Stearns Commercial Mortgage Securities, Series 2005-PWR9, Class A4A, 4.871%, 9/11/2042 | | | 1,090,000 | | | | 1,194,934 | |
The accompanying notes are an integral part of the financial statements.
61
Investment Portfolio - April 30, 2012
(unaudited)
| | | | | | | | |
| PRO-BLEND® MODERATE TERM SERIES | | PRINCIPAL
AMOUNT | | | VALUE (NOTE 2) | |
| | |
COMMERCIAL MORTGAGE-BACKED SECURITIES (continued) | | | | | | | | |
| | |
Bear Stearns Commercial Mortgage Securities, Series 2006-PW12, Class A47, 5.719%, 9/11/2038 | | $ | 765,000 | | | $ | 871,228 | |
Bear Stearns Commercial Mortgage Securities, Series 2006-PW13, Class A4, 5.54%, 9/11/2041 | | | 1,155,000 | | | | 1,312,607 | |
CFCRE Commercial Mortgage Trust, Series 2011-C1, Class A26, 3.759%, 4/15/2044 | | | 540,000 | | | | 574,381 | |
Citigroup - Deutsche Bank Commercial Mortgage Trust, Series 2005-CD1, Class A47, 5.213%, 7/15/2044 | | | 1,060,000 | | | | 1,181,409 | |
Citigroup Commercial Mortgage Trust, Series 2006-C4, Class A37, 5.73%, 3/15/2049 | | | 160,000 | | | | 180,748 | |
Commercial Mortgage Pass-Through Certificates, Series 2006-C7, Class A47, 5.749%, 6/10/2046 | | | 225,000 | | | | 254,569 | |
Commercial Mortgage Pass-Through Certificates, Series 2010-C1, Class A16, 3.156%, 7/10/2046 | | | 407,222 | | | | 425,512 | |
DBUBS Mortgage Trust, Series 2011-LC1A, Class A16, 3.742%, 11/10/2046 | | | 541,489 | | | | 578,496 | |
FREMF Mortgage Trust, Series 2011-K701, Class B6,7, 4.287%, 7/25/2048 | | | 750,000 | | | | 764,708 | |
FREMF Mortgage Trust, Series 2011-K702, Class B6,7, 4.77%, 4/25/2044 | | | 885,000 | | | | 904,636 | |
Greenwich Capital Commercial Funding Corp., Series 2006-GG7, Class A47, 5.874%, 7/10/2038 | | | 600,000 | | | | 683,874 | |
GS Mortgage Securities Corp. II, Series 2010-C2, Class A16, 3.849%, 12/10/2043 | | | 1,039,881 | | | | 1,118,208 | |
JP Morgan Chase Commercial Mortgage Securities Corp., Series 2005-CB13, Class A47, 5.284%, 1/12/2043 | | | 1,750,000 | | | | 1,914,717 | |
JP Morgan Chase Commercial Mortgage Securities Corp., Series 2005-LDP5, Class A47, 5.198%, 12/15/2044 | | | 475,000 | | | | 531,680 | |
JP Morgan Chase Commercial Mortgage Securities Corp., Series 2006-LDP7, Class A47, 5.87%, 4/15/2045 | | | 1,670,000 | | | | 1,911,509 | |
LB-UBS Commercial Mortgage Trust, Series 2006-C4, Class A47, 5.87%, 6/15/2038 | | | 925,000 | | | | 1,055,471 | |
LSTAR Commercial Mortgage Trust, Series 2011-1, Class A6, 3.913%, 6/25/2043 | | | 669,251 | | | | 704,016 | |
Merrill Lynch - Countrywide Commercial Mortgage Trust, Series 2006-3, Class A47, 5.414%, 7/12/2046 | | | 175,000 | | | | 195,713 | |
Morgan Stanley Capital I, Series 2005-HQ7, Class A47, 5.201%, 11/14/2042 | | | 125,000 | | | | 138,714 | |
Morgan Stanley Capital I, Series 2005-IQ10, Class A4A7, 5.23%, 9/15/2042 | | | 425,000 | | | | 468,673 | |
Morgan Stanley Capital I, Series 2011-C1, Class A26, 3.884%, 9/15/2047 | | | 800,000 | | | | 856,174 | |
OBP Depositor LLC Trust, Series 2010-OBP, Class A6, 4.646%, 7/15/2045 | | | 115,000 | | | | 130,884 | |
Vornado DP LLC, Series 2010-VNO, Class A2FX6, 4.004%, 9/13/2028 | | | 350,000 | | | | 380,321 | |
Wachovia Bank Commercial Mortgage Trust, Series 2005-C21, Class A47, 5.204%, 10/15/2044 | | | 625,000 | | | | 690,233 | |
Wachovia Bank Commercial Mortgage Trust, Series 2006-C25, Class A47, 5.734%, 5/15/2043 | | | 215,000 | | | | 243,878 | |
Wachovia Bank Commercial Mortgage Trust, Series 2006-C26, Class A37, 6.004%, 6/15/2045 | | | 850,000 | | | | 974,029 | |
Wells Fargo Commercial Mortgage Trust, Series 2010-C1, Class A26, 4.393%, 11/15/2043 | | | 545,000 | | | | 604,318 | |
WF-RBS Commercial Mortgage Trust, Series 2011-C2, Class A26, 3.791%, 2/15/2044 . | | | 940,000 | | | | 998,659 | |
| | | | | | | | |
TOTAL COMMERCIAL MORTGAGE-BACKED SECURITIES
(Identified Cost $23,543,632) | | | | | | | 24,664,892 | |
| | | | | | | | |
The accompanying notes are an integral part of the financial statements.
62
Investment Portfolio - April 30, 2012
(unaudited)
| | | | | | | | |
| PRO-BLEND® MODERATE TERM SERIES | | PRINCIPAL
AMOUNT | | | VALUE (NOTE 2) | |
| | |
FOREIGN GOVERNMENT BONDS - 2.52% | | | | | | | | |
| | |
Province of British Columbia Canada (Canada), 2.85%, 6/15/2015 | | $ | 3,800,000 | | | $ | 4,042,284 | |
Province of Manitoba Canada (Canada), 2.625%, 7/15/2015 | | | 1,000,000 | | | | 1,056,763 | |
Province of Manitoba Canada, Series FH (Canada), 4.90%, 12/6/2016 | | | 2,250,000 | | | | 2,625,441 | |
Province of New Brunswick Canada (Canada), 5.20%, 2/21/2017 | | | 3,800,000 | | | | 4,468,952 | |
Province of Nova Scotia Canada (Canada), 5.125%, 1/26/2017 | | | 2,000,000 | | | | 2,344,298 | |
Province of Ontario Canada (Canada), 2.30%, 5/10/2016 | | | 7,600,000 | | | | 7,908,256 | |
Province of Quebec Canada (Canada), 5.125%, 11/14/2016 | | | 6,900,000 | | | | 8,056,247 | |
Republic of Italy (Italy), 2.125%, 10/5/2012 | | | 1,445,000 | | | | 1,444,428 | |
| | | | | | | | |
TOTAL FOREIGN GOVERNMENT BONDS
(Identified Cost $31,526,873) | | | | | | | 31,946,669 | |
| | | | | | | | |
| | |
U.S. GOVERNMENT AGENCIES - 18.62% | | | | | | | | |
| | |
Mortgage-Backed Securities - 7.89% | | | | | | | | |
Fannie Mae, Pool #888468, 5.50%, 9/1/2021 | | | 2,851,754 | | | | 3,123,413 | |
Fannie Mae, Pool #995233, 5.50%, 10/1/2021 | | | 198,358 | | | | 217,378 | |
Fannie Mae, Pool #888017, 6.00%, 11/1/2021 | | | 246,454 | | | | 270,225 | |
Fannie Mae, Pool #995329, 5.50%, 12/1/2021 | | | 1,798,377 | | | | 1,969,692 | |
Fannie Mae, Pool #888136, 6.00%, 12/1/2021 | | | 317,101 | | | | 347,686 | |
Fannie Mae, Pool #888810, 5.50%, 11/1/2022 | | | 3,152,475 | | | | 3,452,781 | |
Fannie Mae, Pool #AD0462, 5.50%, 10/1/2024 | | | 189,674 | | | | 207,288 | |
Fannie Mae, Pool #745418, 5.50%, 4/1/2036 | | | 5,354,472 | | | | 5,885,945 | |
Fannie Mae, Pool #888021, 6.00%, 12/1/2036 | | | 1,046,030 | | | | 1,159,826 | |
Fannie Mae, Pool #909786, 5.50%, 3/1/2037 | | | 1,552,161 | | | | 1,698,464 | |
Fannie Mae, Pool #889575, 6.00%, 6/1/2038 | | | 2,556,549 | | | | 2,829,081 | |
Fannie Mae, Pool #995196, 6.00%, 7/1/2038 | | | 10,864,397 | | | | 12,046,325 | |
Fannie Mae, Pool #AD0220, 6.00%, 10/1/2038 | | | 504,265 | | | | 559,124 | |
Fannie Mae, Pool #AD0258, 5.50%, 3/1/2039 | | | 3,274,775 | | | | 3,583,448 | |
Fannie Mae, Pool #AA7681, 4.50%, 6/1/2039 | | | 4,688,464 | | | | 5,022,792 | |
Fannie Mae, Pool #AD0527, 5.50%, 6/1/2039 | | | 1,290,527 | | | | 1,412,169 | |
Fannie Mae, Pool #MA0258, 4.50%, 12/1/2039 | | | 5,416,402 | | | | 5,802,638 | |
Fannie Mae, Pool #AE0061, 6.00%, 2/1/2040 | | | 5,632,181 | | | | 6,234,002 | |
Fannie Mae, Pool #AE0951, 4.50%, 2/1/2041 | | | 3,322,124 | | | | 3,559,020 | |
Fannie Mae, Pool #AH9054, 4.50%, 4/1/2041 | | | 1,259,334 | | | | 1,352,087 | |
Fannie Mae, Pool #AI2468, 4.50%, 5/1/2041 | | | 797,557 | | | | 856,299 | |
Fannie Mae, Pool #AL0160, 4.50%, 5/1/2041 | | | 3,248,541 | | | | 3,487,804 | |
Fannie Mae, Pool #AJ1415, 4.50%, 9/1/2041 | | | 803,858 | | | | 863,064 | |
Fannie Mae, Pool #AD0207, 6.00%, 10/1/2038 | | | 1,454,090 | | | | 1,612,279 | |
Freddie Mac, Pool #G11850, 5.50%, 7/1/2020 | | | 1,027,123 | | | | 1,118,205 | |
Freddie Mac, Pool #G12610, 6.00%, 3/1/2022 | | | 311,369 | | | | 337,533 | |
Freddie Mac, Pool #G12655, 6.00%, 5/1/2022 | | | 217,580 | | | | 235,863 | |
Freddie Mac, Pool #G12988, 6.00%, 1/1/2023 | | | 179,672 | | | | 194,657 | |
Freddie Mac, Pool #G13078, 6.00%, 3/1/2023 | | | 316,891 | | | | 348,816 | |
Freddie Mac, Pool #G13331, 5.50%, 10/1/2023 | | | 155,713 | | | | 168,937 | |
The accompanying notes are an integral part of the financial statements.
63
Investment Portfolio - April 30, 2012
(unaudited)
| | | | | | | | |
| PRO-BLEND® MODERATE TERM SERIES | | PRINCIPAL
AMOUNT/
SHARES | | | VALUE (NOTE 2) | |
| | |
U.S. GOVERNMENT AGENCIES (continued) | | | | | | | | |
| | |
Mortgage-Backed Securities (continued) | | | | | | | | |
Freddie Mac, Pool #G03332, 6.00%, 10/1/2037 | | $ | 667,096 | | | $ | 737,063 | |
Freddie Mac, Pool #G03696, 5.50%, 1/1/2038 | | | 1,255,343 | | | | 1,368,765 | |
Freddie Mac, Pool #G03926, 6.00%, 2/1/2038 | | | 3,351,819 | | | | 3,703,367 | |
Freddie Mac, Pool #G04731, 5.50%, 4/1/2038 | | | 3,023,353 | | | | 3,296,517 | |
Freddie Mac, Pool #G08273, 5.50%, 6/1/2038 | | | 2,978,116 | | | | 3,245,332 | |
Freddie Mac, Pool #G05671, 5.50%, 8/1/2038 | | | 2,314,991 | | | | 2,527,771 | |
Freddie Mac, Pool #A86522, 4.50%, 5/1/2039 | | | 7,124,014 | | | | 7,600,850 | |
Freddie Mac, Pool #G06021, 5.50%, 1/1/2040 | | | 1,630,618 | | | | 1,777,947 | |
Freddie Mac, Pool #G05923, 5.50%, 2/1/2040 | | | 1,585,218 | | | | 1,728,445 | |
Freddie Mac, Pool #G05900, 6.00%, 3/1/2040 | | | 2,145,025 | | | | 2,370,002 | |
Freddie Mac, Pool #G05906, 6.00%, 4/1/2040 | | | 1,329,696 | | | | 1,469,159 | |
GNMA, Pool #286310, 9.00%, 2/15/2020 | | | 927 | | | | 969 | |
GNMA, Pool #263096, 9.50%, 3/15/2020 | | | 1,545 | | | | 1,580 | |
| | | | | | | | |
Total Mortgage-Backed Securities
(Identified Cost $98,053,413) | | | | | | | 99,784,608 | |
| | | | | | | | |
Other Agencies - 10.73% | | | | | | | | |
Fannie Mae, 1.625%, 10/26/2015 | | | 26,930,000 | | | | 27,818,097 | |
Fannie Mae, 5.25%, 9/15/2016 | | | 17,000,000 | | | | 20,160,623 | |
Fannie Mae, 1.375%, 11/15/2016 | | | 6,000,000 | | | | 6,125,538 | |
Fannie Mae, 6.25%, 5/15/2029 | | | 980,000 | | | | 1,362,321 | |
Fannie Mae, 7.25%, 5/15/2030 | | | 882,000 | | | | 1,359,080 | |
Fannie Mae, 6.625%, 11/15/2030 | | | 932,000 | | | | 1,360,811 | |
Federal Home Loan Bank, 1.375%, 5/28/2014 | | | 8,735,000 | | | | 8,931,826 | |
Freddie Mac, 2.875%, 2/9/2015 | | | 20,000,000 | | | | 21,310,940 | |
Freddie Mac, 1.00%, 3/8/2017 | | | 25,000,000 | | | | 24,980,725 | |
Freddie Mac, 1.25%, 5/12/2017 | | | 5,000,000 | | | | 5,036,930 | |
Freddie Mac, 2.375%, 1/13/2022 | | | 14,330,000 | | | | 14,416,510 | |
Freddie Mac, 6.75%, 3/15/2031 | | | 920,000 | | | | 1,361,511 | |
Freddie Mac, 6.25%, 7/15/2032 | | | 1,020,000 | | | | 1,459,217 | |
| | | | | | | | |
Total Other Agencies
(Identified Cost $133,052,744) | | | | | | | 135,684,129 | |
| | | | | | | | |
| | | | | | | | |
TOTAL U.S. GOVERNMENT AGENCIES
(Identified Cost $231,106,157) | | | | | | | 235,468,737 | |
| | | | | | | | |
| | | | | | | | |
SHORT-TERM INVESTMENTS - 3.20% | | | | | | | | |
| | |
Dreyfus Cash Management, Inc. - Institutional Shares9, 0.06%, (Identified Cost $40,487,054) | | | 40,487,054 | | | | 40,487,054 | |
| | | | | | | | |
The accompanying notes are an integral part of the financial statements.
64
Investment Portfolio - April 30, 2012
(unaudited)
| | | | |
| PRO-BLEND® MODERATE TERM SERIES | | VALUE (NOTE 2) | |
TOTAL INVESTMENTS - 99.93% | | | | |
(Identified Cost $1,183,569,478) | | $ | 1,264,001,209 | |
OTHER ASSETS, LESS LIABILITIES - 0.07% | | | 871,637 | |
| | | | |
NET ASSETS - 100% | | $ | 1,264,872,846 | |
| | | | |
ADR - American Depository Receipt
* Non-income producing security
1A factor from a third party vendor was applied to determine the security’s fair value following the close of local trading.
2Traded on Canadian exchange.
3Traded on Hong Kong exchange.
4Latest quoted sales price is not available and the latest quoted bid price was used to value the security.
5The rate shown is a fixed rate as of April 30, 2012; the rate becomes floating, based on LIBOR plus a spread, at dates ranging from 2013 to 2022.
6Restricted securities - Investment in securities that are restricted as to public resale under the Securities Act of 1933, as amended. These securities have been sold under Rule 144A and have been determined to be liquid. These securities amount to $93,617,169, or 7.40%, of the Series’ net assets as of April 30, 2012.
7The coupon rate is floating and is the effective rate as of April 30, 2012.
8Represents a step-up bond that pays initial coupon rate for the first period and then a higher coupon rate for the following periods. Rate shown reflects the current coupon as of April 30, 2012.
9Rate shown is the current yield as of April 30, 2012.
The accompanying notes are an integral part of the financial statements.
65
Statement of Assets and Liabilities - Pro-Blend® Moderate Term Series
April 30, 2012 (unaudited)
| | | | |
ASSETS: | | | | |
| |
Investments, at value (identified cost $1,183,569,478) (Note 2) | | $ | 1,264,001,209 | |
Foreign currency (identified cost $383,551) | | | 383,316 | |
Cash | | | 326,074 | |
Interest receivable | | | 5,758,097 | |
Receivable for securities sold | | | 1,622,925 | |
Receivable for fund shares sold | | | 1,299,486 | |
Dividends receivable | | | 386,720 | |
Foreign tax reclaims receivable | | | 354,687 | |
Other assets | | | 240,624 | |
| | | | |
| |
TOTAL ASSETS | | | 1,274,373,138 | |
| | | | |
| |
LIABILITIES: | | | | |
| |
Accrued management fees (Note 3) | | | 767,955 | |
Accrued shareholder services fees (Class S) (Note 3) | | | 148,200 | |
Accrued distribution and service (Rule 12b-1) fees (Class C) (Class R) (Note 3) | | | 69,597 | |
Accrued fund accounting and administration fees (Note 3) | | | 59,233 | |
Accrued transfer agent fees (Note 3) | | | 27,828 | |
Accrued directors’ fees (Note 3) | | | 3,390 | |
Accrued Chief Compliance Officer service fees (Note 3) | | | 415 | |
Payable for securities purchased | | | 5,718,172 | |
Payable for fund shares repurchased | | | 2,634,787 | |
Other payables and accrued expenses | | | 70,715 | |
| | | | |
| |
TOTAL LIABILITIES | | | 9,500,292 | |
| | | | |
| |
TOTAL NET ASSETS | | $ | 1,264,872,846 | |
| | | | |
| |
NET ASSETS CONSIST OF: | | | | |
| |
Capital stock | | $ | 1,066,199 | |
Additional paid-in-capital | | | 1,173,674,380 | |
Undistributed net investment income | | | 5,309,592 | |
Accumulated net realized gain on investments, foreign currency and translation of other assets and liabilities | | | 4,375,132 | |
Net unrealized appreciation on investments, foreign currency and translation of other assets and liabilities | | | 80,447,543 | |
| | | | |
| |
TOTAL NET ASSETS | | $ | 1,264,872,846 | |
| | | | |
The accompanying notes are an integral part of the financial statements.
66
Statement of Assets and Liabilities - Pro-Blend® Moderate Term Series
April 30, 2012 (unaudited)
| | | | |
| |
NET ASSET VALUE, OFFERING PRICE AND REDEMPTION PRICE PER SHARE - Class S
($724,814,930/55,435,291 shares) | | $ | 13.07 | |
| | | | |
| |
NET ASSET VALUE, OFFERING PRICE AND REDEMPTION PRICE PER SHARE - Class I
($438,475,181/41,683,425 shares) | | $ | 10.52 | |
| | | | |
| |
NET ASSET VALUE, OFFERING PRICE AND REDEMPTION PRICE PER SHARE - Class C
($72,768,344/6,859,492 shares) | | $ | 10.61 | |
| | | | |
| |
NET ASSET VALUE, OFFERING PRICE AND REDEMPTION PRICE PER SHARE - Class R
($28,814,391/2,641,649 shares) | | $ | 10.91 | |
| | | | |
The accompanying notes are an integral part of the financial statements.
67
Statement of Operations - Pro-Blend® Moderate Term Series
For the Six Months Ended April 30, 2012 (unaudited)
| | | | |
INVESTMENT INCOME: | | | | |
| |
Interest | | $ | 10,686,974 | |
Dividends (net of foreign taxes withheld, $200,219) | | | 4,528,988 | |
| | | | |
| |
Total Investment Income | | | 15,215,962 | |
| | | | |
| |
EXPENSES: | | | | |
| |
Management fees (Note 3) | | | 4,395,270 | |
Shareholder services fees (Class S) (Note 3) | | | 869,945 | |
Distribution and service (Rule 12b-1) fees (Class C) (Note 3) | | | 319,862 | |
Fund accounting and administration fees (Note 3) | | | 117,072 | |
Transfer agent fees (Note 3) | | | 65,961 | |
Distribution and service (Rule 12b-1) fees (Class R) (Note 3) | | | 60,427 | |
Directors’ fees (Note 3) | | | 14,440 | |
Chief Compliance Officer service fees (Note 3) | | | 1,246 | |
Custodian fees | | | 48,236 | |
Miscellaneous | | | 153,329 | |
| | | | |
| |
Total Expenses | | | 6,045,788 | |
| | | | |
| |
NET INVESTMENT INCOME | | | 9,170,174 | |
| | | | |
| |
REALIZED AND UNREALIZED GAIN (LOSS) ON INVESTMENTS AND FOREIGN CURRENCY: | | | | |
| |
Net realized gain (loss) on-
Investments | | | 4,970,730 | |
Foreign currency and translation of other assets and liabilities (net of Brazilian tax of $1,629) | | | (68,265 | ) |
Forward foreign currency exchange contracts | | | 28,622 | |
| | | | |
| | | 4,931,087 | |
| | | | |
| |
Net change in unrealized appreciation (depreciation) on-
Investments | | | 50,765,993 | |
Foreign currency and translation of other assets and liabilities | | | (9,550 | ) |
Forward foreign currency exchange contracts | | | (343 | ) |
| | | | |
| | | 50,756,100 | |
| | | | |
| |
NET REALIZED AND UNREALIZED GAIN ON INVESTMENTS AND FOREIGN CURRENCY | | | 55,687,187 | |
| | | | |
| |
NET INCREASE IN NET ASSETS RESULTING FROM OPERATIONS | | $ | 64,857,361 | |
| | | | |
The accompanying notes are an integral part of the financial statements.
68
Statements of Changes in Net Assets - Pro-Blend® Moderate Term Series
| | | | | | | | |
| | | FOR THE SIX
MONTHS ENDED
4/30/12
(UNAUDITED) | | | FOR THE YEAR ENDED 10/31/11 | |
INCREASE (DECREASE) IN NET ASSETS: | | | | | | | | |
| | |
OPERATIONS: | | | | | | | | |
| | |
Net investment income | | $ | 9,170,174 | | | $ | 18,384,602 | |
Net realized gain (loss) on investments and foreign currency (net of Brazilian tax of $1,629 and $80,120, respectively) | | | 4,931,087 | | | | 36,912,629 | |
Net change in unrealized appreciation (depreciation) on investments and foreign currency | | | 50,756,100 | | | | (26,676,941 | ) |
| | | | | | | | |
| | |
Net increase from operations | | | 64,857,361 | | | | 28,620,290 | |
| | | | | | | | |
| | |
DISTRIBUTIONS TO SHAREHOLDERS (Note 8): | | | | | | | | |
| | |
From net investment income (Class S) | | | (7,006,109 | ) | | | (9,718,456 | ) |
From net investment income (Class I) | | | (5,148,743 | ) | | | (6,475,725 | ) |
From net investment income (Class C) | | | (540,343 | ) | | | (482,924 | ) |
From net investment income (Class R) | | | (294,156 | ) | | | (15,533 | ) |
From net realized gain on investments (Class S) | | | (20,279,851 | ) | | | (9,435,174 | ) |
From net realized gain on investments (Class I) | | | (13,096,537 | ) | | | (5,280,876 | ) |
From net realized gain on investments (Class C) | | | (2,173,898 | ) | | | (612,007 | ) |
From net realized gain on investments (Class R) | | | (828,847 | ) | | | (6,337 | ) |
| | | | | | | | |
| | |
Total distributions to shareholders | | | (49,368,484 | ) | | | (32,027,032 | ) |
| | | | | | | | |
| | |
CAPITAL STOCK ISSUED AND REPURCHASED: | | | | | | | | |
| | |
Net increase from capital share transactions (Note 5) | | | 137,493,662 | | | | 155,736,834 | |
| | | | | | | | |
| | |
Net increase in net assets | | | 152,982,539 | | | | 152,330,092 | |
| | |
NET ASSETS: | | | | | | | | |
| | |
Beginning of period | | | 1,111,890,307 | | | | 959,560,215 | |
| | | | | | | | |
| | |
End of period (including undistributed net investment income of $5,309,592 and $9,128,769, respectively) | | $ | 1,264,872,846 | | | $ | 1,111,890,307 | |
| | | | | | | | |
The accompanying notes are an integral part of the financial statements.
69
Financial Highlights - Pro-Blend® Moderate Term Series - Class S
| | | | | | | | | | | | | | | | | | | | | | | | |
| | | FOR THE SIX
MONTHS ENDED 4/30/12 | | | FOR THE YEARS ENDED | |
| | (UNAUDITED) | | | 10/31/11 | | | 10/31/10 | | | 10/31/09 | | | 10/31/08 | | | 10/31/07 | |
Per share data (for a share outstanding throughout each period): | | | | | | | | | | | | | | | | | | | | | | | | |
Net asset value - Beginning of period | | $ | 12.92 | | | $ | 12.94 | | | $ | 11.61 | | | $ | 10.41 | | | $ | 14.18 | | | $ | 13.55 | |
| | | | | | | | | | | | | | | | | | | | | | | | |
Income (loss) from investment operations: | | | | | | | | | | | | | | | | | | | | | | | | |
Net investment income | | | 0.10 | 1 | | | 0.22 | 1 | | | 0.19 | 1 | | | 0.16 | 1 | | | 0.23 | | | | 0.24 | |
Net realized and unrealized gain (loss) on investments | | | 0.56 | | | | 0.14 | | | | 1.28 | | | | 1.23 | | | | (2.75 | ) | | | 1.19 | |
| | | | | | | | | | | | | | | | | | | | | | | | |
| | | | | | |
Total from investment operations | | | 0.66 | | | | 0.36 | | | | 1.47 | | | | 1.39 | | | | (2.52 | ) | | | 1.43 | |
| | | | | | | | | | | | | | | | | | | | | | | | |
| | | | | | |
Less distributions to shareholders: | | | | | | | | | | | | | | | | | | | | | | | | |
From net investment income | | | (0.13 | ) | | | (0.19 | ) | | | (0.14 | ) | | | (0.19 | ) | | | (0.23 | ) | | | (0.23 | ) |
From net realized gain on investments | | | (0.38 | ) | | | (0.19 | ) | | | — | | | | — | | | | (1.02 | ) | | | (0.57 | ) |
| | | | | | | | | | | | | | | | | | | | | | | | |
| | | | | | |
Total distributions to shareholders | | | (0.51 | ) | | | (0.38 | ) | | | (0.14 | ) | | | (0.19 | ) | | | (1.25 | ) | | | (0.80 | ) |
| | | | | | | | | | | | | | | | | | | | | | | | |
| | | | | | |
Net asset value - End of period | | $ | 13.07 | | | $ | 12.92 | | | $ | 12.94 | | | $ | 11.61 | | | $ | 10.41 | | | $ | 14.18 | |
| | | | | | | | | | | | | | | | | | | | | | | | |
| | | | | | |
Net assets - End of period (000’s omitted) | | $ | 724,815 | | | $ | 682,409 | | | $ | 633,304 | | | $ | 396,927 | | | $ | 218,807 | | | $ | 379,385 | |
| | | | | | | | | | | | | | | | | | | | | | | | |
| | | | | | |
Total return2 | | | 5.47 | % | | | 2.78 | % | | | 12.81 | % | | | 13.65 | % | | | (19.28 | %) | | | 10.91 | % |
Ratios (to average net assets)/ | | | | | | | | | | | | | | | | | | | | | | | | |
Supplemental Data: | | | | | | | | | | | | | | | | | | | | | | | | |
Expenses* | | | 1.07 | %3 | | | 1.07 | % | | | 1.09 | % | | | 1.10 | % | | | 1.10 | % | | | 1.11 | % |
Net investment income | | | 1.53 | %3 | | | 1.68 | % | | | 1.60 | % | | | 1.49 | % | | | 1.74 | % | | | 1.86 | % |
Series portfolio turnover | | | 23 | % | | | 52 | % | | | 56 | % | | | 58 | % | | | 75 | % | | | 78 | % |
|
| * For certain periods presented, the investment advisor did not impose all or a portion of its management fees and/or other fees. If these expenses had been incurred by the Class, the expense ratio (to average net assets) would have increased by the following amount: | |
| | | | | | |
| | | N/A | | | | N/A | | | | 0.00 | %4 | | | 0.02 | % | | | 0.02 | % | | | N/A | |
1Calculated based on average shares outstanding during the period.
2Represents aggregate total return for the periods indicated, and assumes reinvestment of all distributions. Total return would have been lower had certain expenses not been waived or reimbursed during the periods. Periods less than one year are not annualized.
3Annualized.
4Less than 0.01%.
The accompanying notes are an integral part of the financial statements.
70
Financial Highlights - Pro-Blend® Moderate Term Series - Class I
| | | | | | | | | | | | | | | | | | | | |
| | | FOR THE SIX MONTHS ENDED
4/30/12
(UNAUDITED) | | | FOR THE YEARS ENDED | | | FOR THE PERIOD 3/28/081 TO
10/31/08 | |
| | | 10/31/11 | | | 10/31/10 | | | 10/31/09 | | | | |
Per share data (for a share outstanding throughout each period): | | | | | | | | | | | | | | | | | | | | |
Net asset value - Beginning of period | | $ | 10.50 | | | $ | 10.60 | | | $ | 9.54 | | | $ | 8.59 | | | $ | 10.00 | |
| | | | | | | | | | | | | | | | | | | | |
Income (loss) from investment operations: | | | | | | | | | | | | | | | | | | | | |
Net investment income | | | 0.09 | 2 | | | 0.20 | 2 | | | 0.18 | 2 | | | 0.15 | 2 | | | 0.06 | |
Net realized and unrealized gain (loss) on investments | | | 0.46 | | | | 0.11 | | | | 1.06 | | | | 1.02 | | | | (1.42 | ) |
| | | | | | | | | | | | | | | | | | | | |
| | | | | |
Total from investment operations | | | 0.55 | | | | 0.31 | | | | 1.24 | | | | 1.17 | | | | (1.36 | ) |
| | | | | | | | | | | | | | | | | | | | |
| | | | | |
Less distributions to shareholders: | | | | | | | | | | | | | | | | | | | | |
From net investment income | | | (0.15 | ) | | | (0.22 | ) | | | (0.18 | ) | | | (0.22 | ) | | | (0.05 | ) |
From net realized gain on investments | | | (0.38 | ) | | | (0.19 | ) | | | — | | | | — | | | | — | |
| | | | | | | | | | | | | | | | | | | | |
| | | | | |
Total distributions to shareholders | | | (0.53 | ) | | | (0.41 | ) | | | (0.18 | ) | | | (0.22 | ) | | | (0.05 | ) |
| | | | | | | | | | | | | | | | | | | | |
| | | | | |
Net asset value - End of period | | $ | 10.52 | | | $ | 10.50 | | | $ | 10.60 | | | $ | 9.54 | | | $ | 8.59 | |
| | | | | | | | | | | | | | | | | | | | |
| | | | | |
Net assets - End of period (000’s omitted) | | $ | 438,475 | | | $ | 352,611 | | | $ | 294,000 | | | $ | 44,134 | | | $ | 322 | |
| | | | | | | | | | | | | | | | | | | | |
| | | | | |
Total return3 | | | 5.69 | % | | | 2.93 | % | | | 13.13 | % | | | 14.11 | % | | | (13.64 | %) |
Ratios (to average net assets)/ Supplemental Data: | | | | | | | | | | | | | | | | | | | | |
Expenses* | | | 0.82 | %4 | | | 0.82 | % | | | 0.84 | % | | | 0.85 | % | | | 0.85 | %4 |
Net investment income | | | 1.78 | %4 | | | 1.93 | % | | | 1.85 | % | | | 1.67 | % | | | 1.47 | %4 |
Series portfolio turnover | | | 23 | % | | | 52 | % | | | 56 | % | | | 58 | % | | | 75 | % |
|
| * For certain periods presented, the investment advisor did not impose all or a portion of its management fees and/or other fees. If these expenses had been incurred by the Class, the expense ratio (to average net assets) would have increased by the following amount: | |
| | | | | |
| | | N/A | | | | N/A | | | | 0.00 | %5 | | | 0.02 | % | | | 0.10 | %4 |
1Commencement of operations.
2Calculated based on average shares outstanding during the period.
3Represents aggregate total return for the periods indicated, and assumes reinvestment of all distributions. Total return would have been lower had certain expenses not been waived or reimbursed during the periods. Periods less than one year are not annualized.
4Annualized.
5Less than 0.01%.
The accompanying notes are an integral part of the financial statements.
71
Financial Highlights - Pro-Blend® Moderate Term Series - Class C
| | | | | | | | | | | | |
| | | FOR THE SIX
MONTHS ENDED
4/30/12
(UNAUDITED) | | | FOR THE
YEAR ENDED
10/31/11 | | | FOR THE PERIOD
1/4/101 TO
10/31/10 | |
Per share data (for a share outstanding throughout each period): | | | | | | | | | | | | |
Net asset value - Beginning of period | | $ | 10.58 | | | $ | 10.69 | | | $ | 10.00 | |
| | | | | | | | | | | | |
| | | |
Income from investment operations: | | | | | | | | | | | | |
Net investment income2 | | | 0.04 | | | | 0.10 | | | | 0.07 | |
Net realized and unrealized gain on investments | | | 0.46 | | | | 0.11 | | | | 0.67 | |
| | | | | | | | | | | | |
Total from investment operations | | | 0.50 | | | | 0.21 | | | | 0.74 | |
| | | | | | | | | | | | |
Less distributions to shareholders: | | | | | | | | | | | | |
From net investment income | | | (0.09 | ) | | | (0.13 | ) | | | (0.05 | ) |
From net realized gain on investments | | | (0.38 | ) | | | (0.19 | ) | | | — | |
| | | | | | | | | | | | |
Total distributions to shareholders | | | (0.47 | ) | | | (0.32 | ) | | | (0.05 | ) |
| | | | | | | | | | | | |
| | | |
Net asset value - End of period | | $ | 10.61 | | | $ | 10.58 | | | $ | 10.69 | |
| | | | | | | | | | | | |
| | | |
Net assets - End of period (000’s omitted) | | $ | 72,768 | | | $ | 58,316 | | | $ | 32,019 | |
| | | | | | | | | | | | |
| | | |
Total return3 | | | 5.16 | % | | | 1.97 | % | | | 7.41 | % |
Ratios (to average net assets)/ Supplemental Data: | | | | | | | | | | | | |
Expenses* | | | 1.82 | %4 | | | 1.82 | % | | | 1.84 | %4 |
Net investment income | | | 0.78 | %4 | | | 0.92 | % | | | 0.85 | %4 |
Series portfolio turnover | | | 23 | % | | | 52 | % | | | 56 | % |
|
| * For certain periods presented, the investment advisor did not impose all or a portion of its management fees and/or other fees. If these expenses had been incurred by the Class, the expense ratio (to average net assets) would have increased by the following amount: | |
| | | |
| | | N/A | | | | N/A | | | | 0.00 | %4,5 |
1Commencement of operations.
2Calculated based on average shares outstanding during the period.
3Represents aggregate total return for the period indicated, and assumes reinvestment of all distributions. Total return would have been lower had certain expenses not been waived during the period. Periods less than one year are not annualized.
4Annualized.
5Less than 0.01%.
The accompanying notes are an integral part of the financial statements.
72
Financial Highlights - Pro-Blend® Moderate Term Series - Class R
| | | | | | | | | | | | |
| | | FOR THE SIX
MONTHS ENDED
4/30/12
(UNAUDITED) | | | FOR THE
YEAR ENDED
10/31/11 | | | FOR THE PERIOD
6/30/101 TO
10/31/10 | |
Per share data (for a share outstanding throughout the period): | | | | | | | | | | | | |
Net asset value - Beginning of period | | $ | 10.88 | | | $ | 10.99 | | | $ | 10.00 | |
| | | | | | | | | | | | |
Income from investment operations: | | | | | | | | | | | | |
Net investment income2 | | | 0.07 | | | | 0.11 | | | | 0.02 | |
Net realized and unrealized gain on investments | | | 0.48 | | | | 0.16 | | | | 0.97 | |
| | | | | | | | | | | | |
| | | |
Total from investment operations | | | 0.55 | | | | 0.27 | | | | 0.99 | |
| | | | | | | | | | | | |
| | | |
Less distributions to shareholders: | | | | | | | | | | | | |
From net investment income | | | (0.14 | ) | | | (0.19 | ) | | | — | |
From net realized gain on investments | | | (0.38 | ) | | | (0.19 | ) | | | — | |
| | | | | | | | | | | | |
| | | |
Total distributions to shareholders | | | (0.52 | ) | | | (0.38 | ) | | | — | |
| | | | | | | | | | | | |
| | | |
Net asset value - End of period | | $ | 10.91 | | | $ | 10.88 | | | $ | 10.99 | |
| | | | | | | | | | | | |
| | | |
Net assets - End of period (000’s omitted) | | $ | 28,814 | | | $ | 18,554 | | | $ | 237 | |
| | | | | | | | | | | | |
| | | |
Total return3 | | | 5.43 | % | | | 2.50 | % | | | 9.90 | % |
Ratios (to average net assets)/ | | | | | | | | | | | | |
Supplemental Data: | | | | | | | | | | | | |
Expenses | | | 1.32 | %4 | | | 1.32 | % | | | 1.34 | %4 |
Net investment income | | | 1.28 | %4 | | | 1.05 | % | | | 0.65 | %4 |
Series portfolio turnover | | | 23 | % | | | 52 | % | | | 56 | % |
1Commencement of operations.
2Calculated based on average shares outstanding during the period.
3Represents aggregate total return for the period indicated, and assumes reinvestment of all distributions. Total return would have been lower had certain expenses not been waived during the period. Periods less than one year are not annualized.
4Annualized.
The accompanying notes are an integral part of the financial statements.
73
Shareholder Expense Example - Pro-Blend® Extended Term Series
(unaudited)
As a shareholder of the Series, you may incur two types of costs: (1) transaction costs, including potential wire charges on redemptions and (2) ongoing costs, including management fees and other Series expenses. This example is intended to help you understand your ongoing costs (in dollars) of investing in the Series and to compare these costs with the ongoing costs of investing in other mutual funds.
The example is based on an investment of $1,000 invested at the beginning of the period and held for the entire period (November 1, 2011 to April 30, 2012).
Actual Expenses
The Actual lines of the table below provide information about actual account values and actual expenses. You may use the information in these lines, together with the amount you invested, to estimate the expenses that you paid over the period. Simply divide your account value by $1,000 (for example, an $8,600 account value divided by $1,000 = 8.6), then multiply the result by the number in the Actual line for the Class in which you have invested under the heading entitled “Expenses Paid During Period” to estimate the expenses you paid on your account during this period.
Hypothetical Example for Comparison Purposes
The Hypothetical lines of the table below provide information about hypothetical account values and hypothetical expenses based on the Class’ actual expense ratio and an assumed rate of return of 5% per year before expenses, which is not the Class’ actual return. The hypothetical account values and expenses may not be used to estimate the actual ending account balance or expenses you paid during the period. You may use this information to compare the ongoing costs of investing in the Series and other funds. To do so, compare this 5% hypothetical example for the Class in which you have invested with the 5% hypothetical examples that appear in the shareholder reports of the other funds.
Please note that the expenses shown in the table are meant to highlight your ongoing costs only and do not reflect any transaction costs. Therefore, the Hypothetical lines of the table are useful in comparing ongoing costs only, and will not help you determine the relative total costs of owning different funds. In addition, if these transaction costs were included, your costs would have been higher.
| | | | | | | | |
| | | BEGINNING
ACCOUNT VALUE
11/1/11 | | ENDING
ACCOUNT VALUE
4/30/12 | | EXPENSES PAID
DURING PERIOD
11/1/11-4/30/12* | | ANNUALIZED
EXPENSE RATIO |
Class S | | | | | | | | |
Actual | | $1,000.00 | | $1,058.50 | | $5.53 | | 1.08% |
Hypothetical (5% return before expenses) | | $1,000.00 | | $1,019.49 | | $5.42 | | 1.08% |
Class I | | | | | | | | |
Actual | | $1,000.00 | | $1,060.70 | | $4.25 | | 0.83% |
Hypothetical (5% return before expenses) | | $1,000.00 | | $1,020.74 | | $4.17 | | 0.83% |
Class C | | | | | | | | |
Actual | | $1,000.00 | | $1,054.90 | | $9.35 | | 1.83% |
Hypothetical (5% return before expenses) | | $1,000.00 | | $1,015.76 | | $9.17 | | 1.83% |
Class R | | | | | | | | |
Actual | | $1,000.00 | | $1,057.70 | | $6.80 | | 1.33% |
Hypothetical (5% return before expenses) | | $1,000.00 | | $1,018.25 | | $6.67 | | 1.33% |
*Expenses are equal to the Class’ annualized expense ratio (for the six-month period), multiplied by the average account value over the period, multiplied by 182/366 to reflect the one-half year period.
74
Portfolio Composition - Pro-Blend® Extended Term Series
As of April 30, 2012 (unaudited)
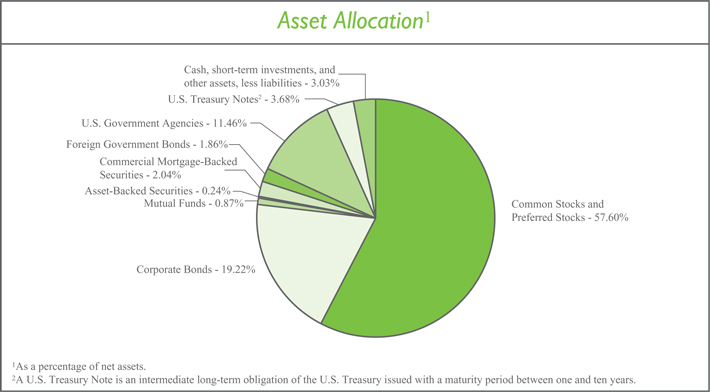
| | | | | | | | |
| Sector Allocation3 | | | | Top Ten Stock Holdings4 |
Financials | | 16.65% | | | | Google, Inc. - Class A | | 2.08% |
Information Technology | | 13.83% | | | | Monsanto Co. | | 2.00% |
Consumer Discretionary | | 12.33% | | | | Time Warner, Inc. | | 1.63% |
Health Care | | 7.55% | | | | Cerner Corp. | | 1.56% |
Consumer Staples | | 6.80% | | | | EMC Corp. | | 1.49% |
Industrials | | 6.29% | | | | Hess Corp. | | 1.26% |
Energy | | 5.80% | | | | Anheuser-Busch InBev N.V. (Belgium) | | 1.15% |
Materials | | 5.00% | | | | Unilever plc - ADR (United Kingdom) | | 1.11% |
Telecommunication Services | | 2.18% | | | | MasterCard, Inc. - Class A | | 1.07% |
Utilities | | 0.41% | | | | Visa, Inc. - Class A | | 1.06% |
| | | | | | | | | |
| | | | | | | | | |
| 3Including common stocks, preferred stocks, and corporate bonds, as a percentage of total investments. | | | | 4As a percentage of total investments. | | |
| | | | | | |
| | | | | | |
| | | | | | | | | |
75
Investment Portfolio - April 30, 2012
(unaudited)
| | | | | | | | |
| PRO-BLEND® EXTENDED TERM SERIES | | SHARES | | | VALUE (NOTE 2) | |
| | |
COMMON STOCKS - 57.23% | | | | | | | | |
| | |
Consumer Discretionary - 10.21% | | | | | | | | |
Auto Components - 0.10% | | | | | | | | |
Halla Climate Control Corp. (South Korea)1 | | | 12,700 | | | $ | 256,848 | |
Hankook Tire Co. Ltd. (South Korea)1 | | | 17,860 | | | | 753,437 | |
Mando Corp. (South Korea)1 | | | 1,500 | �� | | | 238,877 | |
| | | | | | | | |
| | | | | | | 1,249,162 | |
| | | | | | | | |
| | |
Automobiles - 0.68% | | | | | | | | |
Hyundai Motor Co. (South Korea)1 | | | 1,300 | | | | 306,891 | |
Suzuki Motor Corp. (Japan)1 | | | 13,300 | | | | 313,035 | |
Tesla Motors, Inc.* | | | 12,170 | | | | 403,192 | |
Toyota Motor Corp. (Japan)1 | | | 7,200 | | | | 295,040 | |
Toyota Motor Corp. - ADR (Japan) | | | 83,180 | | | | 6,802,460 | |
Yamaha Motor Co. Ltd. (Japan)1 | | | 34,000 | | | | 454,124 | |
| | | | | | | | |
| | | | | | | 8,574,742 | |
| | | | | | | | |
| | |
Distributors - 0.03% | | | | | | | | |
Inchcape plc (United Kingdom)1 | | | 62,340 | | | | 370,367 | |
| | | | | | | | |
Diversified Consumer Services - 0.08% | | | | | | | | |
Anhanguera Educacional Participacoes S.A. (Brazil) | | | 28,790 | | | | 380,916 | |
Capella Education Co.* | | | 9,120 | | | | 298,315 | |
Grand Canyon Education, Inc.* | | | 20,410 | | | | 354,930 | |
| | | | | | | | |
| | | | | | | 1,034,161 | |
| | | | | | | | |
| | |
Hotels, Restaurants & Leisure - 1.12% | | | | | | | | |
Accor S.A. (France)1 | | | 37,760 | | | | 1,305,763 | |
Carnival Corp. | | | 354,350 | | | | 11,512,832 | |
Hyatt Hotels Corp. - Class A* | | | 6,130 | | | | 263,774 | |
Intercontinental Hotels Group plc (United Kingdom)1 | | | 20,970 | | | | 500,007 | |
Orient-Express Hotels Ltd. - Class A - ADR (Bermuda) | | | 27,990 | | | | 299,213 | |
TUI Travel plc (United Kingdom)1 | | | 56,260 | | | | 174,467 | |
| | | | | | | | |
| | | | | | | 14,056,056 | |
| | | | | | | | |
| | |
Household Durables - 0.20% | | | | | | | | |
Corporacion Geo S.A.B. de C.V. - Class B (Mexico)* | | | 63,860 | | | | 85,304 | |
DR Horton, Inc. | | | 25,760 | | | | 421,176 | |
Lennar Corp. - Class A | | | 21,820 | | | | 605,287 | |
LG Electronics, Inc. (South Korea)1 | | | 5,450 | | | | 336,259 | |
NVR, Inc.* | | | 490 | | | | 384,131 | |
Rodobens Negocios Imobiliarios S.A. (Brazil) | | | 50,510 | | | | 294,663 | |
Toll Brothers, Inc.* | | | 16,080 | | | | 408,432 | |
| | | | | | | | |
| | | | | | | 2,535,252 | |
| | | | | | | | |
| | |
Internet & Catalog Retail - 1.10% | | | | | | | | |
Amazon.com, Inc.* | | | 56,980 | | | | 13,213,662 | |
Blue Nile, Inc.* | | | 2,620 | | | | 79,334 | |
The accompanying notes are an integral part of the financial statements.
76
Investment Portfolio - April 30, 2012
(unaudited)
| | | | | | | | |
| PRO-BLEND® EXTENDED TERM SERIES | | SHARES | | | VALUE (NOTE 2) | |
| | |
COMMON STOCKS (continued) | | | | | | | | |
| | |
Consumer Discretionary (continued) | | | | | | | | |
Internet & Catalog Retail (continued) | | | | | | | | |
Ocado Group plc (United Kingdom)*1 | | | 268,930 | | | $ | 566,906 | |
| | | | | | | | |
| | | | | | | 13,859,902 | |
| | | | | | | | |
| | |
Media - 6.51% | | | | | | | | |
AMC Networks, Inc. - Class A* | | | 225,220 | | | | 9,571,850 | |
DIRECTV - Class A* | | | 250,190 | | | | 12,326,861 | |
Imax Corp. (Canada)* | | | 22,990 | | | | 551,070 | |
Mediaset Espana Comunicacion S.A. (Spain)1 | | | 128,620 | | | | 585,486 | |
News Corp. - Class A | | | 534,430 | | | | 10,474,828 | |
Reed Elsevier plc - ADR (United Kingdom) | | | 7,379 | | | | 243,876 | |
Societe Television Francaise 1 (France)1 | | | 47,150 | | | | 456,699 | |
Time Warner, Inc. | | | 549,500 | | | | 20,584,270 | |
Valassis Communications, Inc.* | | | 11,110 | | | | 222,200 | |
Virgin Media, Inc. - ADR (United Kingdom) | | | 527,410 | | | | 12,953,190 | |
The Walt Disney Co. | | | 303,960 | | | | 13,103,716 | |
Wolters Kluwer N.V. (Netherlands)1 | | | 21,550 | | | | 372,542 | |
Zon Multimedia Servicos de Telecomunicacoes e Multimedia SGPS S.A. (Portugal)1 | | | 161,000 | | | | 543,319 | |
| | | | | | | | |
| | | | | | | 81,989,907 | |
| | | | | | | | |
| | |
Multiline Retail - 0.05% | | | | | | | | |
Marks & Spencer Group plc (United Kingdom)1 | | | 52,450 | | | | 303,989 | |
PPR (France)1 | | | 2,230 | | | | 373,189 | |
| | | | | | | | |
| | | | | | | 677,178 | |
| | | | | | | | |
| | |
Specialty Retail - 0.31% | | | | | | | | |
Aeropostale, Inc.* | | | 16,810 | | | | 372,846 | |
American Eagle Outfitters, Inc. | | | 20,660 | | | | 372,087 | |
Belle International Holdings Ltd. (Hong Kong)1 | | | 153,000 | | | | 298,539 | |
Chico’s FAS, Inc. | | | 29,500 | | | | 453,120 | |
Dick’s Sporting Goods, Inc. | | | 14,770 | | | | 747,362 | |
Group 1 Automotive, Inc. | | | 3,980 | | | | 230,362 | |
Inditex S.A. (Spain)1 | | | 2,600 | | | | 234,349 | |
KOMERI Co. Ltd. (Japan)1 | | | 7,100 | | | | 198,921 | |
Penske Automotive Group, Inc. | | | 8,000 | | | | 211,520 | |
Select Comfort Corp.* | | | 5,580 | | | | 161,150 | |
Sonic Automotive, Inc. - Class A | | | 11,430 | | | | 192,253 | |
Teavana Holdings, Inc.* | | | 19,580 | | | | 409,026 | |
| | | | | | | | |
| | | | | | | 3,881,535 | |
| | | | | | | | |
| | |
Textiles, Apparel & Luxury Goods - 0.03% | | | | | | | | |
Adidas AG (Germany)1 | | | 5,220 | | | | 435,399 | |
| | | | | | | | |
Total Consumer Discretionary | | | | | | | 128,663,661 | |
| | | | | | | | |
The accompanying notes are an integral part of the financial statements.
77
Investment Portfolio - April 30, 2012
(unaudited)
| | | | | | | | |
| PRO-BLEND® EXTENDED TERM SERIES | | SHARES | | | VALUE (NOTE 2) | |
| | |
COMMON STOCKS (continued) | | | | | | | | |
| | |
Consumer Staples - 6.54% | | | | | | | | |
Beverages - 2.09% | | | | | | | | |
Anheuser-Busch InBev N.V. (Belgium)1 | | | 201,810 | | | $ | 14,545,515 | |
The Boston Beer Co., Inc. - Class A* | | | 2,840 | | | | 293,429 | |
C&C Group plc (Ireland)*1 | | | 57,090 | | | | 286,334 | |
Carlsberg A/S - Class B (Denmark)1 | | | 5,550 | | | | 479,086 | |
Cia Cervecerias Unidas S.A. - ADR (Chile) | | | 4,870 | | | | 348,789 | |
The Coca-Cola Co. | | | 118,120 | | | | 9,014,918 | |
Diageo plc (United Kingdom)1 | | | 31,790 | | | | 801,849 | |
Heineken N.V. (Netherlands)1 | | | 6,220 | | | | 340,163 | |
Kirin Holdings Co. Ltd. (Japan)1 | | | 21,000 | | | | 267,381 | |
| | | | | | | | |
| | | | | | | 26,377,464 | |
| | | | | | | | |
| | |
Food & Staples Retailing - 0.98% | | | | | | | | |
Carrefour S.A. (France)1 | | | 29,020 | | | | 582,908 | |
Casino Guichard-Perrachon S.A. (France)1 | | | 3,380 | | | | 332,081 | |
Distribuidora Internacional de Alimentacion S.A. (Spain)*1 | | | 73,750 | | | | 354,092 | |
Koninklijke Ahold N.V. (Netherlands)1 | | | 40,390 | | | | 512,646 | |
The Kroger Co. | | | 394,730 | | | | 9,185,367 | |
SUPERVALU, Inc. | | | 33,330 | | | | 197,980 | |
Tesco plc (United Kingdom)1 | | | 229,210 | | | | 1,181,046 | |
| | | | | | | | |
| | | | | | | 12,346,120 | |
| | | | | | | | |
| | |
Food Products - 3.30% | | | | | | | | |
Barry Callebaut AG (Switzerland)1 | | | 500 | | | | 481,350 | |
Biostime International Holdings Ltd. (Cayman Islands)1 | | | 49,000 | | | | 140,555 | |
BRF - Brasil Foods S.A. (Brazil) | | | 22,850 | | | | 414,768 | |
Charoen Pokphand Foods PCL (Thailand)1 | | | 234,500 | | | | 291,695 | |
Danone (France)1 | | | 17,500 | | | | 1,231,981 | |
Flowers Foods, Inc. | | | 11,340 | | | | 243,243 | |
Grupo Bimbo S.A.B. de C.V. - Class A (Mexico) | | | 188,350 | | | | 449,404 | |
Kraft Foods, Inc. - Class A | | | 327,700 | | | | 13,065,399 | |
M Dias Branco S.A. (Brazil) | | | 6,800 | | | | 196,207 | |
Nestle S.A. (Switzerland)1 | | | 176,920 | | | | 10,843,299 | |
Suedzucker AG (Germany)1 | | | 7,300 | | | | 222,299 | |
Unilever plc - ADR (United Kingdom) | | | 408,105 | | | | 14,006,164 | |
| | | | | | | | |
| | | | | | | 41,586,364 | |
| | | | | | | | |
| | |
Household Products - 0.09% | | | | | | | | |
Reckitt Benckiser Group plc (United Kingdom)1 | | | 18,500 | | | | 1,076,949 | |
| | | | | | | | |
Personal Products - 0.05% | | | | | | | | |
Beiersdorf AG (Germany)1 | | | 2,630 | | | | 184,564 | |
Kao Corp. (Japan)1 | | | 3,000 | | | | 80,386 | |
Natura Cosmeticos S.A. (Brazil) | | | 18,800 | | | | 424,791 | |
| | | | | | | | |
| | | | | | | 689,741 | |
| | | | | | | | |
The accompanying notes are an integral part of the financial statements.
78
Investment Portfolio - April 30, 2012
(unaudited)
| | | | | | | | |
| PRO-BLEND® EXTENDED TERM SERIES | | SHARES | | | VALUE (NOTE 2) | |
| | |
COMMON STOCKS (continued) | | | | | | | | |
| | |
Consumer Staples (continued) | | | | | | | | |
Tobacco - 0.03% | | | | | | | | |
Gudang Garam Tbk PT (Indonesia)1 | | | 51,000 | | | $ | 327,531 | |
| | | | | | | | |
Total Consumer Staples | | | | | | | 82,404,169 | |
| | | | | | | | |
Energy - 4.72% | | | | | | | | |
Energy Equipment & Services - 2.82% | | | | | | | | |
Baker Hughes, Inc. | | | 228,410 | | | | 10,075,165 | |
Calfrac Well Services Ltd. (Canada) | | | 13,400 | | | | 367,606 | |
CARBO Ceramics, Inc. | | | 1,320 | | | | 110,999 | |
Compagnie Generale de Geophysique - Veritas (CGG - Veritas) (France)*1 | | | 7,060 | | | | 202,465 | |
Heckmann Corp.* | | | 49,000 | | | | 186,200 | |
ION Geophysical Corp.* | | | 24,000 | | | | 149,520 | |
Key Energy Services, Inc.* | | | 15,990 | | | | 202,433 | |
Petroleum Geo-Services ASA (Norway)*1 | | | 19,000 | | | | 287,428 | |
Poseidon Concepts Corp. (Canada) | | | 15,830 | | | | 205,597 | |
Schlumberger Ltd. | | | 167,180 | | | | 12,394,725 | |
Trican Well Service Ltd. (Canada) | | | 50,350 | | | | 728,351 | |
Weatherford International Ltd. - ADR (Switzerland)* | | | 745,020 | | | | 10,631,435 | |
| | | | | | | | |
| | | | | | | 35,541,924 | |
| | | | | | | | |
| | |
Oil, Gas & Consumable Fuels - 1.90% | | | | | | | | |
Apache Corp. | | | 43,350 | | | | 4,158,999 | |
Cameco Corp. (Canada) | | | 23,120 | | | | 510,952 | |
Hess Corp. | | | 305,390 | | | | 15,923,035 | |
Pacific Rubiales Energy Corp. (Canada) | | | 12,500 | | | | 358,607 | |
Paladin Energy Ltd. (Australia)*2 | | | 187,520 | | | | 309,417 | |
Petroleo Brasileiro S.A. - ADR (Brazil) | | | 29,940 | | | | 663,470 | |
Royal Dutch Shell plc - Class B (Netherlands)1 | | | 9,249 | | | | 338,463 | |
Royal Dutch Shell plc - Class B - ADR (Netherlands) | | | 9,190 | | | | 674,178 | |
Statoil ASA (Norway)1 | | | 14,880 | | | | 399,266 | |
Talisman Energy, Inc. (Canada) | | | 47,460 | | | | 620,725 | |
| | | | | | | | |
| | | | | | | 23,957,112 | |
| | | | | | | | |
Total Energy | | | | | | | 59,499,036 | |
| | | | | | | | |
Financials - 6.97% | | | | | | | | |
Capital Markets - 0.11% | | | | | | | | |
The Charles Schwab Corp. | | | 57,200 | | | | 817,960 | |
Deutsche Bank AG (Germany)1 | | | 5,590 | | | | 242,679 | |
Evercore Partners, Inc. - Class A | | | 6,150 | | | | 162,545 | |
Greenhill & Co., Inc. | | | 2,140 | | | | 83,139 | |
Lazard Ltd. - Class A - ADR (Bermuda) | | | 4,820 | | | | 132,598 | |
| | | | | | | | |
| | | | | | | 1,438,921 | |
| | | | | | | | |
| | |
Commercial Banks - 0.65% | | | | | | | | |
Banco Bilbao Vizcaya Argentaria S.A. - ADR (Spain) | | | 35,280 | | | | 238,140 | |
The accompanying notes are an integral part of the financial statements.
79
Investment Portfolio - April 30, 2012
(unaudited)
| | | | | | | | |
| PRO-BLEND® EXTENDED TERM SERIES | | SHARES | | | VALUE (NOTE 2) | |
| | |
COMMON STOCKS (continued) | | | | | | | | |
| | |
Financials (continued) | | | | | | | | |
Commercial Banks (continued) | | | | | | | | |
Banco Santander S.A. (Spain)1 | | | 31,900 | | | $ | 200,288 | |
Banco Santander S.A. - ADR (Spain) | | | 92,460 | | | | 585,272 | |
Barclays plc (United Kingdom)1 | | | 131,600 | | | | 465,910 | |
BNP Paribas S.A. (France)1 | | | 13,100 | | | | 528,707 | |
CIT Group, Inc.* | | | 18,790 | | | | 711,202 | |
First Commonwealth Financial Corp. | | | 149,370 | | | | 960,449 | |
Hong Leong Financial Group Berhad (Malaysia)1 | | | 145,670 | | | | 573,817 | |
HSBC Holdings plc (United Kingdom)1 | | | 40,950 | | | | 369,663 | |
HSBC Holdings plc - ADR (United Kingdom) | | | 17,182 | | | | 776,111 | |
ICICI Bank Ltd. - ADR (India) | | | 21,950 | | | | 743,886 | |
Standard Chartered plc (United Kingdom)1 | | | 12,880 | | | | 314,860 | |
U.S. Bancorp. | | | 28,350 | | | | 912,020 | |
Wells Fargo & Co. | | | 24,230 | | | | 810,009 | |
| | | | | | | | |
| | | | | | | 8,190,334 | |
| | | | | | | | |
| | |
Consumer Finance - 1.70% | | | | | | | | |
American Express Co. | | | 148,220 | | | | 8,924,326 | |
Discover Financial Services | | | 369,240 | | | | 12,517,236 | |
| | | | | | | | |
| | | | | | | 21,441,562 | |
| | | | | | | | |
| | |
Diversified Financial Services - 1.15% | | | | | | | | |
CME Group, Inc. | | | 3,000 | | | | 797,460 | |
Deutsche Boerse AG (Germany)*1 | | | 15,620 | | | | 980,761 | |
ING Groep N.V. (Netherlands)*1 | | | 4,650 | | | | 32,805 | |
JPMorgan Chase & Co. | | | 17,065 | | | | 733,454 | |
JSE Ltd. (South Africa)1 | | | 144,600 | | | | 1,531,314 | |
Moody’s Corp. | | | 253,060 | | | | 10,362,807 | |
| | | | | | | | |
| | | | | | | 14,438,601 | |
| | | | | | | | |
| | |
Insurance - 0.47% | | | | | | | | |
Admiral Group plc (United Kingdom)1 | | | 44,030 | | | | 865,337 | |
Allianz SE (Germany)1 | | | 9,660 | | | | 1,077,487 | |
The Allstate Corp. | | | 24,610 | | | | 820,251 | |
AXA S.A. (France)1 | | | 4,550 | | | | 64,656 | |
Brasil Insurance Participacoes e Administracao S.A. (Brazil) | | | 67,500 | | | | 726,294 | |
Mapfre S.A. (Spain)1 | | | 366,670 | | | | 1,061,473 | |
Muenchener Rueckversicherungs AG (MunichRe) (Germany)1 | | | 3,955 | | | | 574,464 | |
Zurich Insurance Group AG (Switzerland)1 | | | 2,910 | | | | 712,959 | |
| | | | | | | | |
| | | | | | | 5,902,921 | |
| | | | | | | | |
| | |
Real Estate Investment Trusts (REITS) - 2.82% | | | | | | | | |
Alexandria Real Estate Equities, Inc. | | | 32,410 | | | | 2,428,157 | |
Alstria Office REIT AG (Germany)1 | | | 53,410 | | | | 569,407 | |
American Assets Trust, Inc. | | | 13,520 | | | | 317,855 | |
The accompanying notes are an integral part of the financial statements.
80
Investment Portfolio - April 30, 2012
(unaudited)
| | | | | | | | |
| PRO-BLEND® EXTENDED TERM SERIES | | SHARES | | | VALUE
(NOTE 2) | |
| | |
COMMON STOCKS (continued) | | | | | | | | |
| | |
Financials (continued) | | | | | | | | |
Real Estate Investment Trusts (REITS) (continued) | | | | | | | | |
American Campus Communities, Inc. | | | 16,140 | | | $ | 717,423 | |
Apartment Investment & Management Co. - Class A | | | 14,030 | | | | 380,915 | |
Associated Estates Realty Corp. | | | 6,030 | | | | 102,088 | |
AvalonBay Communities, Inc. | | | 2,220 | | | | 322,788 | |
BioMed Realty Trust, Inc. | | | 190,280 | | | | 3,771,350 | |
Boston Properties, Inc. | | | 8,960 | | | | 969,920 | |
Camden Property Trust | | | 6,960 | | | | 470,983 | |
CBL & Associates Properties, Inc. | | | 16,700 | | | | 311,121 | |
Cedar Realty Trust, Inc. | | | 16,240 | | | | 84,773 | |
Coresite Realty Corp. | | | 19,780 | | | | 492,720 | |
Corporate Office Properties Trust | | | 131,880 | | | | 3,105,774 | |
CubeSmart | | | 34,780 | | | | 436,837 | |
Digital Realty Trust, Inc. | | | 52,720 | | | | 3,958,745 | |
DuPont Fabros Technology, Inc. | | | 149,580 | | | | 4,061,097 | |
Education Realty Trust, Inc. | | | 37,860 | | | | 426,682 | |
Equity Lifestyle Properties, Inc. | | | 4,240 | | | | 296,546 | |
Equity One, Inc. | | | 19,330 | | | | 401,677 | |
Equity Residential | | | 4,840 | | | | 297,370 | |
General Growth Properties, Inc. | | | 24,930 | | | | 443,754 | |
HCP, Inc. | | | 14,780 | | | | 612,631 | |
Health Care REIT, Inc. | | | 13,260 | | | | 751,312 | |
Healthcare Realty Trust, Inc. | | | 10,870 | | | | 233,488 | |
Home Properties, Inc. | | | 11,420 | | | | 697,191 | |
Host Hotels & Resorts, Inc. | | | 53,424 | | | | 888,975 | |
Kimco Realty Corp. | | | 12,840 | | | | 249,224 | |
Land Securities Group plc (United Kingdom)1 | | | 34,670 | | | | 409,430 | |
LTC Properties, Inc. | | | 4,080 | | | | 135,782 | |
The Macerich Co. | | | 2,230 | | | | 137,301 | |
Mack-Cali Realty Corp. | | | 17,020 | | | | 488,814 | |
Mid-America Apartment Communities, Inc. | | | 9,683 | | | | 659,122 | |
National Retail Properties, Inc. | | | 7,710 | | | | 211,100 | |
Pebblebrook Hotel Trust | | | 47,440 | | | | 1,142,355 | |
Potlatch Corp. | | | 3,550 | | | | 111,115 | |
ProLogis, Inc. | | | 7,890 | | | | 282,304 | |
Public Storage | | | 2,660 | | | | 381,072 | |
Realty Income Corp. | | | 9,500 | | | | 373,730 | |
Simon Property Group, Inc. | | | 8,150 | | | | 1,268,140 | |
Sovran Self Storage, Inc. | | | 13,360 | | | | 704,072 | |
Tanger Factory Outlet Centers | | | 4,410 | | | | 138,121 | |
Taubman Centers, Inc. | | | 1,900 | | | | 146,642 | |
UDR, Inc. | | | 34,330 | | | | 903,909 | |
The accompanying notes are an integral part of the financial statements.
81
Investment Portfolio - April 30, 2012
(unaudited)
| | | | | | | | |
| PRO-BLEND® EXTENDED TERM SERIES | | SHARES | | | VALUE (NOTE 2) | |
| | |
COMMON STOCKS (continued) | | | | | | | | |
| | |
Financials (continued) | | | | | | | | |
Real Estate Investment Trusts (REITS) (continued) | | | | | | | | |
Unibail-Rodamco SE (France)1 | | | 1,290 | | | $ | 241,381 | |
| | | | | | | | |
| | | | | | | 35,535,193 | |
| | | | | | | | |
| | |
Real Estate Management & Development - 0.05% | | | | | | | | |
General Shopping Brasil S.A. (Brazil)* | | | 72,560 | | | | 439,665 | |
Thomas Properties Group, Inc. | | | 53,780 | | | | 262,446 | |
| | | | | | | | |
| | | | | | | 702,111 | |
| | | | | | | | |
| | |
Thrifts & Mortgage Finance - 0.02% | | | | | | | | |
Aareal Bank AG (Germany)*1 | | | 11,235 | | | | 216,998 | |
| | | | | | | | |
Total Financials | | | | | | | 87,866,641 | |
| | | | | | | | |
Health Care - 6.61% | | | | | | | | |
Biotechnology - 0.34% | | | | | | | | |
Dendreon Corp.* | | | 76,160 | | | | 887,264 | |
Exact Sciences Corp.* | | | 100,790 | | | | 1,085,508 | |
Myriad Genetics, Inc.* | | | 86,120 | | | | 2,239,981 | |
| | | | | | | | |
| | | | | | | 4,212,753 | |
| | | | | | | | |
| | |
Health Care Equipment & Supplies - 1.50% | | | | | | | | |
Abaxis, Inc.* | | | 40,080 | | | | 1,427,650 | |
Alere, Inc.* | | | 56,400 | | | | 1,347,396 | |
Becton, Dickinson and Co. | | | 102,320 | | | | 8,027,004 | |
BioMerieux (France)1 | | | 12,810 | | | | 1,049,786 | |
DexCom, Inc.* | | | 71,455 | | | | 699,544 | |
HeartWare International, Inc.* | | | 16,170 | | | | 1,260,613 | |
Insulet Corp.* | | | 71,690 | | | | 1,280,383 | |
Mindray Medical International Ltd. - ADR (China) | | | 15,040 | | | | 492,710 | |
Neogen Corp.* | | | 7,600 | | | | 296,324 | |
Quidel Corp.* | | | 45,390 | | | | 749,843 | |
Sirona Dental Systems, Inc.* | | | 16,780 | | | | 847,558 | |
Straumann Holding AG (Switzerland)1 | | | 4,169 | | | | 692,749 | |
Thoratec Corp.* | | | 22,320 | | | | 776,959 | |
| | | | | | | | |
| | | | | | | 18,948,519 | |
| | | | | | | | |
| | |
Health Care Providers & Services - 0.31% | | | | | | | | |
Amil Participacoes S.A. (Brazil) | | | 40,950 | | | | 400,445 | |
China Cord Blood Corp. - ADR (Hong Kong)* | | | 105,000 | | | | 306,600 | |
Odontoprev S.A. (Brazil) | | | 159,630 | | | | 843,309 | |
Sonic Healthcare Ltd. (Australia)1 | | | 177,490 | | | | 2,321,861 | |
| | | | | | | | |
| | | | | | | 3,872,215 | |
| | | | | | | | |
| | |
Health Care Technology - 2.20% | | | | | | | | |
Allscripts Healthcare Solutions, Inc.* | | | 545,310 | | | | 6,042,035 | |
Cerner Corp.* | | | 242,126 | | | | 19,633,997 | |
The accompanying notes are an integral part of the financial statements.
82
Investment Portfolio - April 30, 2012
(unaudited)
| | | | | | | | |
| PRO-BLEND® EXTENDED TERM SERIES | | SHARES | | | VALUE (NOTE 2) | |
| | |
COMMON STOCKS (continued) | | | | | | | | |
| | |
Health Care (continued) | | | | | | | | |
Health Care Technology (continued) | | | | | | | | |
Computer Programs & Systems, Inc. | | | 13,640 | | | $ | 812,808 | |
Greenway Medical Technologies, Inc.* | | | 47,280 | | | | 728,112 | |
Quality Systems, Inc. | | | 14,070 | | | | 526,218 | |
| | | | | | | | |
| | | | | | | 27,743,170 | |
| | | | | | | | |
| | |
Life Sciences Tools & Services - 1.56% | | | | | | | | |
Lonza Group AG (Switzerland)1 | | | 10,170 | | | | 458,884 | |
Luminex Corp.* | | | 37,100 | | | | 928,984 | |
QIAGEN N.V. (Netherlands)*1 | | | 15,390 | | | | 254,466 | |
QIAGEN N.V. - ADR (Netherlands)* | | | 639,059 | | | | 10,691,457 | |
Waters Corp.* | | | 69,800 | | | | 5,870,878 | |
WuXi PharmaTech (Cayman), Inc. - ADR (China)* | | | 102,470 | | | | 1,473,519 | |
| | | | | | | | |
| | | | | | | 19,678,188 | |
| | | | | | | | |
| | |
Pharmaceuticals - 0.70% | | | | | | | | |
AstraZeneca plc (United Kingdom)1 | | | 2,540 | | | | 111,307 | |
AstraZeneca plc - ADR (United Kingdom) | | | 16,540 | | | | 726,106 | |
Bayer AG (Germany)1 | | | 13,685 | | | | 964,296 | |
Dr. Reddy’s Laboratories Ltd. - ADR (India) | | | 19,240 | | | | 650,889 | |
GlaxoSmithKline plc (United Kingdom)1 | | | 16,925 | | | | 390,993 | |
Green Cross Corp. (South Korea)1 | | | 9,920 | | | | 1,172,354 | |
Hikma Pharmaceuticals plc (United Kingdom)1 | | | 92,840 | | | | 946,346 | |
Novo Nordisk A/S - Class B (Denmark)1 | | | 3,250 | | | | 479,125 | |
Optimer Pharmaceuticals, Inc.* | | | 71,920 | | | | 1,064,416 | |
Sanofi (France)1 | | | 2,170 | | | | 165,748 | |
Santen Pharmaceutical Co. Ltd. (Japan)1 | | | 3,700 | | | | 154,841 | |
Shire plc (Ireland)1 | | | 21,165 | | | | 689,824 | |
Takeda Pharmaceutical Co. Ltd. (Japan)1 | | | 3,000 | | | | 130,905 | |
Teva Pharmaceutical Industries Ltd. - ADR (Israel) | | | 9,790 | | | | 447,795 | |
UCB S.A. (Belgium)1 | | | 14,570 | | | | 681,296 | |
| | | | | | | | |
| | | | | | | 8,776,241 | |
| | | | | | | | |
Total Health Care | | | | | | | 83,231,086 | |
| | | | | | | | |
Industrials - 3.97% | | | | | | | | |
Aerospace & Defense - 0.03% | | | | | | | | |
European Aeronautic Defence and Space Co. N.V. (Netherlands)1 | | | 8,720 | | | | 344,602 | |
| | | | | | | | |
Air Freight & Logistics - 0.06% | | | | | | | | |
FedEx Corp. | | | 6,700 | | | | 591,208 | |
PostNL N.V. (Netherlands)1 | | | 27,470 | | | | 119,536 | |
| | | | | | | | |
| | | | | | | 710,744 | |
| | | | | | | | |
| | |
Airlines - 1.09% | | | | | | | | |
Copa Holdings S.A. - ADR - Class A (Panama) | | | 11,400 | | | | 926,934 | |
Deutsche Lufthansa AG (Germany)1 | | | 19,235 | | | | 250,485 | |
The accompanying notes are an integral part of the financial statements.
83
Investment Portfolio - April 30, 2012
(unaudited)
| | | | | | | | |
| PRO-BLEND® EXTENDED TERM SERIES | | SHARES | | | VALUE (NOTE 2) | |
| | |
COMMON STOCKS (continued) | | | | | | | | |
| | |
Industrials (continued) | | | | | | | | |
Airlines (continued) | | | | | | | | |
Ryanair Holdings plc - ADR (Ireland)* | | | 28,480 | | | $ | 958,922 | |
Southwest Airlines Co. | | | 1,259,845 | | | | 10,431,517 | |
Spirit Airlines, Inc.* | | | 17,500 | | | | 420,350 | |
US Airways Group, Inc.* | | | 71,190 | | | | 730,409 | |
| | | | | | | | |
| | | | | | | 13,718,617 | |
| | | | | | | | |
| | |
Commercial Services & Supplies - 0.18% | | | | | | | | |
Edenred (France)1 | | | 42,080 | | | | 1,344,349 | |
Interface, Inc. - Class A | | | 6,620 | | | | 93,739 | |
Ritchie Bros. Auctioneers, Inc. (Canada) | | | 13,100 | | | | 276,803 | |
Tomra Systems ASA (Norway)1 | | | 65,630 | | | | 512,247 | |
| | | | | | | | |
| | | | | | | 2,227,138 | |
| | | | | | | | |
| | |
Construction & Engineering - 0.01% | | | | | | | | |
MYR Group, Inc.* | | | 6,860 | | | | 114,699 | |
| | | | | | | | |
Electrical Equipment - 0.19% | | | | | | | | |
ABB Ltd. (Asea Brown Boveri) - ADR (Switzerland) | | | 20,120 | | | | 379,664 | |
Alstom S.A. (France)1 | | | 21,220 | | | | 758,925 | |
Nexans S.A. (France)1 | | | 2,200 | | | | 110,262 | |
Polypore International, Inc.* | | | 14,690 | | | | 548,672 | |
Prysmian S.p.A. (Italy)1 | | | 20,340 | | | | 331,315 | |
Schneider Electric S.A. (France)1 | | | 5,520 | | | | 340,008 | |
| | | | | | | | |
| | | | | | | 2,468,846 | |
| | | | | | | | |
| | |
Industrial Conglomerates - 0.10% | | | | | | | | |
Siemens AG (Germany)1 | | | 13,730 | | | | 1,274,421 | |
| | | | | | | | |
Machinery - 1.15% | | | | | | | | |
AGCO Corp.* | | | 6,400 | | | | 298,112 | |
Astec Industries, Inc.* | | | 3,280 | | | | 102,631 | |
Deere & Co. | | | 2,800 | | | | 230,608 | |
FANUC Corp. (Japan)1 | | | 7,000 | | | | 1,180,554 | |
Flowserve Corp. | | | 83,360 | | | | 9,580,565 | |
Graham Corp. | | | 5,190 | | | | 114,595 | |
Pall Corp. | | | 5,650 | | | | 336,797 | |
Pentair, Inc. | | | 8,300 | | | | 359,722 | |
Titan International, Inc. | | | 11,080 | | | | 320,101 | |
Trinity Industries, Inc. | | | 7,500 | | | | 222,000 | |
Turk Traktor ve Ziraat Makineleri AS (Turkey)1 | | | 23,900 | | | | 418,628 | |
Wabash National Corp.* | | | 52,230 | | | | 437,165 | |
Westport Innovations, Inc. - ADR (Canada)* | | | 27,640 | | | | 865,132 | |
| | | | | | | | |
| | | | | | | 14,466,610 | |
| | | | | | | | |
| | |
Marine - 0.04% | | | | | | | | |
Baltic Trading Ltd. | | | 15,120 | | | | 70,308 | |
The accompanying notes are an integral part of the financial statements.
84
Investment Portfolio - April 30, 2012
(unaudited)
| | | | | | | | |
| PRO-BLEND® EXTENDED TERM SERIES | | SHARES | | | VALUE (NOTE 2) | |
| | |
COMMON STOCKS (continued) | | | | | | | | |
| | |
Industrials (continued) | | | | | | | | |
Marine (continued) | | | | | | | | |
D/S Norden (Denmark)1 | | | 8,840 | | | $ | 250,890 | |
Mitsui OSK Lines Ltd. (Japan)1 | | | 10,000 | | | | 38,759 | |
Nippon Yusen Kabushiki Kaisha (Japan)1 | | | 15,000 | | | | 44,341 | |
Pacific Basin Shipping Ltd. (Bermuda)1,3 | | | 77,000 | | | | 40,295 | |
Sinotrans Shipping Ltd. (Hong Kong)1 | | | 433,500 | | | | 103,173 | |
| | | | | | | | |
| | | | | | | 547,766 | |
| | | | | | | | |
| | |
Professional Services - 0.20% | | | | | | | | |
The Advisory Board Co.* | | | 16,110 | | | | 1,468,588 | |
Qualicorp S.A. (Brazil)* | | | 116,760 | | | | 1,017,435 | |
| | | | | | | | |
| | | | | | | 2,486,023 | |
| | | | | | | | |
| | |
Road & Rail - 0.76% | | | | | | | | |
All America Latina Logistica S.A. (Brazil) | | | 216,770 | | | | 981,415 | |
Norfolk Southern Corp. | | | 110,480 | | | | 8,057,306 | |
RailAmerica, Inc.* | | | 25,140 | | | | 582,745 | |
| | | | | | | | |
| | | | | | | 9,621,466 | |
| | | | | | | | |
Trading Companies & Distributors - 0.03% | | | | | | | | |
Mills Estruturas e Servicos de Engenharia S.A. (Brazil) | | | 29,200 | | | | 379,754 | |
| | | | | | | | |
Transportation Infrastructure - 0.13% | | | | | | | | |
Groupe Eurotunnel S.A. (France)1 | | | 86,400 | | | | 726,935 | |
Malaysia Airports Holdings Berhad (Malaysia)1 | | | 481,310 | | | | 919,808 | |
| | | | | | | | |
| | | | | | | 1,646,743 | |
| | | | | | | | |
Total Industrials | | | | | | | 50,007,429 | |
| | | | | | | | |
Information Technology - 13.22% | | | | | | | | |
Communications Equipment - 2.81% | | | | | | | | |
Alcatel-Lucent - ADR (France)* | | | 506,850 | | | | 765,344 | |
Cisco Systems, Inc. | | | 649,405 | | | | 13,085,511 | |
Infinera Corp.* | | | 192,250 | | | | 1,376,510 | |
Juniper Networks, Inc.* | | | 567,010 | | | | 12,151,024 | |
Qualcomm, Inc. | | | 108,460 | | | | 6,924,086 | |
Riverbed Technology, Inc.* | | | 56,950 | | | | 1,123,624 | |
| | | | | | | | |
| | | | | | | 35,426,099 | |
| | | | | | | | |
| | |
Computers & Peripherals - 1.63% | | | | | | | | |
Apple, Inc.* | | | 2,280 | | | | 1,332,067 | |
EMC Corp.* | | | 663,290 | | | | 18,711,411 | |
Immersion Corp.* | | | 90,760 | | | | 494,642 | |
| | | | | | | | |
| | | | | | | 20,538,120 | |
| | | | | | | | |
| | |
Electronic Equipment, Instruments & Components - 1.10% | | | | | | | | |
Amphenol Corp. - Class A | | | 8,740 | | | | 508,144 | |
Corning, Inc. | | | 764,570 | | | | 10,971,580 | |
The accompanying notes are an integral part of the financial statements.
85
Investment Portfolio - April 30, 2012
(unaudited)
| | | | | | | | |
| PRO-BLEND® EXTENDED TERM SERIES | | SHARES | | | VALUE (NOTE 2) | |
| | |
COMMON STOCKS (continued) | | | | | | | | |
| | |
Information Technology (continued) | | | | | | | | |
Electronic Equipment, Instruments & Components (continued) | | | | | | | | |
Hitachi Ltd. (Japan)1 | | | 155,200 | | | $ | 988,507 | |
Keyence Corp. (Japan)1 | | | 1,609 | | | | 379,835 | |
Maxwell Technologies, Inc.* | | | 30,930 | | | | 294,144 | |
Nippon Electric Glass Co. Ltd. (Japan)1 | | | 89,500 | | | | 723,139 | |
| | | | | | | | |
| | | | | | | 13,865,349 | |
| | | | | | | | |
Internet Software & Services - 2.56% | | | | | | | | |
The Active Network, Inc.* | | | 78,650 | | | | 1,321,320 | |
comScore, Inc.* | | | 50,280 | | | | 1,001,578 | |
Google, Inc. - Class A* | | | 43,250 | | | | 26,176,198 | |
LogMeIn, Inc.* | | | 7,200 | | | | 259,272 | |
NHN Corp. (South Korea)1 | | | 2,800 | | | | 632,982 | |
Tencent Holdings Ltd. (China)1 | | | 41,500 | | | | 1,298,278 | |
Velti plc - ADR (Ireland)* | | | 136,558 | | | | 1,631,868 | |
| | | | | | | | |
| | | | | | | 32,321,496 | |
| | | | | | | | |
IT Services - 3.03% | | | | | | | | |
Amadeus IT Holding S.A. - Class A (Spain)1 | | | 298,250 | | | | 6,105,728 | |
Amdocs Ltd. - ADR (Guernsey)* | | | 43,120 | | | | 1,379,840 | |
Cap Gemini S.A. (France)1 | | | 43,850 | | | | 1,713,099 | |
Cielo S.A. (Brazil) | | | — | | | | 6 | |
Euronet Worldwide, Inc.* | | | 51,000 | | | | 1,103,130 | |
MasterCard, Inc. - Class A | | | 29,670 | | | | 13,418,851 | |
Visa, Inc. - Class A | | | 109,040 | | | | 13,409,739 | |
The Western Union Co. | | | 56,410 | | | | 1,036,816 | |
| | | | | | | | |
| | | | | | | 38,167,209 | |
| | | | | | | | |
| | |
Semiconductors & Semiconductor Equipment - 0.24% | | | | | | | | |
Aixtron SE NA (Germany)1 | | | 23,700 | | | | 433,026 | |
Samsung Electronics Co. Ltd. (South Korea)1 | | | 670 | | | | 820,054 | |
Sumco Corp. (Japan)*1 | | | 61,500 | | | | 652,864 | |
Tokyo Electron Ltd. (Japan)1 | | | 12,000 | | | | 664,993 | |
Veeco Instruments, Inc.* | | | 13,300 | | | | 401,527 | |
| | | | | | | | |
| | | | | | | 2,972,464 | |
| | | | | | | | |
| | |
Software - 1.85% | | | | | | | | |
Autodesk, Inc.* | | �� | 279,005 | | | | 10,984,427 | |
Aveva Group plc (United Kingdom)1 | | | 15,390 | | | | 416,721 | |
Electronic Arts, Inc.* | | | 688,130 | | | | 10,583,439 | |
RealPage, Inc.* | | | 45,060 | | | | 817,839 | |
SAP AG (Germany)1 | | | 7,670 | | | | 508,624 | |
| | | | | | | | |
| | | | | | | 23,311,050 | |
| | | | | | | | |
Total Information Technology | | | | | | | 166,601,787 | |
| | | | | | | | |
The accompanying notes are an integral part of the financial statements.
86
Investment Portfolio - April 30, 2012
(unaudited)
| | | | | | | | |
| PRO-BLEND® EXTENDED TERM SERIES | | SHARES | | | VALUE (NOTE 2) | |
| | |
COMMON STOCKS (continued) | | | | | | | | |
| | |
Materials - 3.56% | | | | | | | | |
Chemicals - 2.75% | | | | | | | | |
Arkema S.A. (France)1 | | | 67 | | | $ | 5,942 | |
BASF SE (Germany)1 | | | 8,980 | | | | 739,349 | |
Calgon Carbon Corp.* | | | 22,965 | | | | 317,836 | |
Flotek Industries, Inc.* | | | 13,180 | | | | 179,775 | |
Johnson Matthey plc (United Kingdom)1 | | | 25,190 | | | | 945,921 | |
Linde AG (Germany)1 | | | 4,170 | | | | 713,749 | |
Monsanto Co. | | | 331,440 | | | | 25,249,099 | |
Shin-Etsu Chemical Co. Ltd. (Japan)1 | | | 3,100 | | | | 178,931 | |
Syngenta AG (Switzerland)1 | | | 17,960 | | | | 6,298,153 | |
| | | | | | | | |
| | | | | | | 34,628,755 | |
| | | | | | | | |
| | |
Construction Materials - 0.06% | | | | | | | | |
CRH plc (Ireland)1 | | | 14,240 | | | | 288,648 | |
Eagle Materials, Inc. | | | 5,700 | | | | 200,754 | |
Holcim Ltd. (Switzerland)1 | | | 3,450 | | | | 215,184 | |
| | | | | | | | |
| | | | | | | 704,586 | |
| | | | | | | | |
| | |
Metals & Mining - 0.75% | | | | | | | | |
Alcoa, Inc. | | | 946,580 | | | | 9,210,223 | |
Alumina Ltd. (Australia)1 | | | 112,110 | | | | 133,911 | |
Norsk Hydro ASA (Norway)1 | | | 24,980 | | | | 121,808 | |
| | | | | | | | |
| | | | | | | 9,465,942 | |
| | | | | | | | |
Total Materials | | | | | | | 44,799,283 | |
| | | | | | | | |
Telecommunication Services - 1.34% | | | | | | | | |
Diversified Telecommunication Services - 1.19% | | | | | | | | |
Swisscom AG - ADR (Switzerland)4 | | | 9,800 | | | | 363,090 | |
Telefonica S.A. - ADR (Spain) | | | 51,840 | | | | 758,419 | |
Telenor ASA (Norway)1 | | | 713,370 | | | | 13,112,746 | |
Telenor ASA - ADR (Norway)4 | | | 12,530 | | | | 690,278 | |
| | | | | | | | |
| | | | | | | 14,924,533 | |
| | | | | | | | |
| | |
Wireless Telecommunication Services - 0.15% | | | | | | | | |
DiGi.com Berhad (Malaysia)1 | | | 647,300 | | | | 861,456 | |
MTN Group Ltd. (South Africa)1 | | | 11,020 | | | | 192,716 | |
SK Telecom Co. Ltd. - ADR (South Korea) | | | 63,500 | | | | 858,520 | |
| | | | | | | | |
| | | | | | | 1,912,692 | |
| | | | | | | | |
Total Telecommunication Services | | | | | | | 16,837,225 | |
| | | | | | | | |
| | |
Utilities - 0.09% | | | | | | | | |
Electric Utilities - 0.03% | | | | | | | | |
E.ON AG (Germany)1 | | | 17,750 | | | | 401,891 | |
| | | | | | | | |
Multi-Utilities - 0.03% | | | | | | | | |
GDF Suez (France)1 | | | 4,147 | | | | 95,481 | |
The accompanying notes are an integral part of the financial statements.
87
Investment Portfolio - April 30, 2012
(unaudited)
| | | | | | | | |
| PRO-BLEND® EXTENDED TERM SERIES | | SHARES/
PRINCIPAL
AMOUNT | | | VALUE (NOTE 2) | |
| | |
COMMON STOCKS (continued) | | | | | | | | |
| | |
Utilities (continued) | | | | | | | | |
Multi-Utilities (continued) | | | | | | | | |
National Grid plc (United Kingdom)1 | | | 22,535 | | | $ | 243,345 | |
| | | | | | | | |
| | | | | | | 338,826 | |
| | | | | | | | |
| | |
Water Utilities - 0.03% | | | | | | | | |
Cia de Saneamento de Minas Gerais - Copasa MG (Brazil) | | | 19,030 | | | | 445,762 | |
| | | | | | | | |
Total Utilities | | | | | | | 1,186,479 | |
| | | | | | | | |
TOTAL COMMON STOCKS | | | | | | | | |
(Identified Cost $648,345,560) | | | | | | | 721,096,796 | |
| | | | | | | | |
| | |
PREFERRED STOCKS - 0.37% | | | | | | | | |
| | |
Financials - 0.37% | | | | | | | | |
Commercial Banks - 0.19% | | | | | | | | |
BB&T Corp. (non-cumulative), 5.85%5 | | | 43,910 | | | | 1,097,750 | |
PNC Financial Services Group, Inc., Series K (non-cumulative), 8.25%5 | | | 480,000 | | | | 497,778 | |
U.S. Bancorp., Series F (non-cumulative), 6.50%5 | | | 30,400 | | | | 822,624 | |
| | | | | | | | |
| | | | | | | 2,418,152 | |
| | | | | | | | |
| | |
Diversified Financial Services - 0.09% | | | | | | | | |
Bank of America Corp., Series M (non-cumulative), 8.125%5 | | | 1,105,000 | | | | 1,145,001 | |
| | | | | | | | |
Real Estate Investment Trusts (REITS) - 0.09% | | | | | | | | |
Public Storage, Series Q, 6.50% | | | 39,780 | | | | 1,094,745 | |
| | | | | | | | |
Total Financials | | | | | | | 4,657,898 | |
| | | | | | | | |
TOTAL PREFERRED STOCKS | | | | | | | | |
(Identified Cost $4,433,529) | | | | | | | 4,657,898 | |
| | | | | | | | |
| | |
CORPORATE BONDS - 19.22% | | | | | | | | |
| | |
Convertible Corporate Bonds - 0.22% | | | | | | | | |
Financials - 0.08% | | | | | | | | |
Real Estate Investment Trusts (REITS) - 0.08% | | | | | | | | |
BioMed Realty LP6 , 3.75%, 1/15/2030 | | $ | 850,000 | | | | 1,026,375 | |
| | | | | | | | |
Health Care - 0.04% | | | | | | | | |
Health Care Equipment & Supplies - 0.04% | | | | | | | | |
Alere, Inc., 3.00%, 5/15/2016 | | | 330,000 | | | | 320,100 | |
The accompanying notes are an integral part of the financial statements.
88
Investment Portfolio - April 30, 2012
(unaudited)
| | | | | | | | |
| PRO-BLEND® EXTENDED TERM SERIES | | PRINCIPAL
AMOUNT | | | VALUE (NOTE 2) | |
| | |
CORPORATE BONDS (continued) | | | | | | | | |
| | |
Convertible Corporate Bonds (continued) | | | | | | | | |
Health Care (continued) | | | | | | | | |
Health Care Equipment & Supplies (continued) | | | | | | | | |
Medtronic, Inc., 1.625%, 4/15/2013 | | $ | 140,000 | | | $ | 140,875 | |
| | | | | | | | |
Total Health Care | | | | | | | 460,975 | |
| | | | | | | | |
Information Technology - 0.05% | | | | | | | | |
Computers & Peripherals - 0.05% | | | | | | | | |
EMC Corp., 1.75%, 12/1/2013 | | | 335,000 | | | | 595,463 | |
| | | | | | | | |
Materials - 0.05% | | | | | | | | |
Containers & Packaging - 0.05% | | | | | | | | |
Owens-Brockway Glass Container, Inc.6, 3.00%, 6/1/2015 | | | 660,000 | | | | 644,325 | |
| | | | | | | | |
Total Convertible Corporate Bonds | | | | | | | | |
(Identified Cost $2,481,097) | | | | | | | 2,727,138 | |
| | | | | | | | |
Non-Convertible Corporate Bonds - 19.00% | | | | | | | | |
Consumer Discretionary - 2.12% | | | | | | | | |
Auto Components - 0.05% | | | | | | | | |
UCI International, Inc., 8.625%, 2/15/2019 | | | 635,000 | | | | 650,875 | |
| | | | | | | | |
Hotels, Restaurants & Leisure - 0.21% | | | | | | | | |
International Game Technology, 7.50%, 6/15/2019 | | | 1,290,000 | | | | 1,532,426 | |
Yum! Brands, Inc., 3.875%, 11/1/2020 | | | 980,000 | | | | 1,041,987 | |
| | | | | | | | |
| | | | | | | 2,574,413 | |
| | | | | | | | |
| | |
Household Durables - 0.17% | | | | | | | | |
Taylor Morrison Communities, Inc. - Monarch Communities, Inc.6, 7.75%, 4/15/2020 | | | 630,000 | | | | 648,900 | |
Tupperware Brands Corp., 4.75%, 6/1/2021 | | | 1,500,000 | | | | 1,542,854 | |
| | | | | | | | |
| | | | | | | 2,191,754 | |
| | | | | | | | |
| | |
Media - 0.94% | | | | | | | | |
Cablevision Systems Corp., 8.625%, 9/15/2017 | | | 540,000 | | | | 592,650 | |
Columbus International, Inc. (Barbados)6, 11.50%, 11/20/2014 | | | 295,000 | | | | 320,075 | |
DIRECTV Holdings LLC - DIRECTV Financing Co., Inc., 5.20%, 3/15/2020 | | | 1,330,000 | | | | 1,477,972 | |
Discovery Communications LLC, 5.05%, 6/1/2020 | | | 1,350,000 | | | | 1,542,507 | |
Intelsat Jackson Holdings S.A. (Luxembourg), 7.25%, 4/1/2019 | | | 575,000 | | | | 599,437 | |
Kabel BW GmbH (Germany)6, 7.50%, 3/15/2019 | | | 595,000 | | | | 635,163 | |
MDC Partners, Inc. (Canada), 11.00%, 11/1/2016 | | | 560,000 | | | | 609,000 | |
Nara Cable Funding Ltd. (Ireland)6 , 8.875%, 12/1/2018 | | | 695,000 | | | | 635,925 | |
NBCUniversal Media LLC, 5.15%, 4/30/2020 | | | 2,055,000 | | | | 2,364,520 | |
Time Warner, Inc., 4.75%, 3/29/2021 | | | 1,480,000 | | | | 1,651,036 | |
Unitymedia Hessen GmbH & Co. KG - Unitymedia NRW GmbH (Germany)6 , 8.125%, 12/1/2017 | | | 865,000 | | | | 927,713 | |
XM Satellite Radio, Inc.6, 7.625%, 11/1/2018 | | | 425,000 | | | | 463,250 | |
| | | | | | | | |
| | | | | | | 11,819,248 | |
| | | | | | | | |
The accompanying notes are an integral part of the financial statements.
89
Investment Portfolio - April 30, 2012
(unaudited)
| | | | | | | | |
| PRO-BLEND® EXTENDED TERM SERIES | | PRINCIPAL
AMOUNT | | | VALUE (NOTE 2) | |
| | |
CORPORATE BONDS (continued) | | | | | | | | |
| | |
Non-Convertible Corporate Bonds (continued) | | | | | | | | |
Consumer Discretionary (continued) | | | | | | | | |
Multiline Retail - 0.08% | | | | | | | | |
Target Corp., 6.00%, 1/15/2018 | | $ | 845,000 | | | $ | 1,038,424 | |
| | | | | | | | |
Specialty Retail - 0.54% | | | | | | | | |
Advance Auto Parts, Inc., 4.50%, 1/15/2022 | | | 2,000,000 | | | | 2,107,822 | |
The Home Depot, Inc., 5.40%, 3/1/2016 | | | 1,220,000 | | | | 1,408,095 | |
Lowe’s Companies, Inc., 6.10%, 9/15/2017 | | | 850,000 | | | | 1,027,877 | |
Rent-A-Center, Inc., 6.625%, 11/15/2020 | | | 1,020,000 | | | | 1,065,900 | |
Toys R Us Property Co. II LLC, 8.50%, 12/1/2017 | | | 1,090,000 | | | | 1,133,600 | |
| | | | | | | | |
| | | | | | | 6,743,294 | |
| | | | | | | | |
| | |
Textiles, Apparel & Luxury Goods - 0.13% | | | | | | | | |
Jones Group - Apparel Group Holdings - Apparel Group USA - Footwear Accessories Retail, 6.875%, 3/15/2019 | | | 625,000 | | | | 608,594 | |
VF Corp., 5.95%, 11/1/2017 | | | 880,000 | | | | 1,050,360 | |
| | | | | | | | |
| | | | | | | 1,658,954 | |
| | | | | | | | |
| | |
Total Consumer Discretionary | | | | | | | 26,676,962 | |
| | | | | | | | |
Consumer Staples - 0.25% | | | | | | | | |
Beverages - 0.11% | | | | | | | | |
Beam, Inc., 5.375%, 1/15/2016 | | | 229,000 | | | | 254,598 | |
Constellation Brands, Inc., 7.25%, 9/1/2016 | | | 575,000 | | | | 649,750 | |
Constellation Brands, Inc., 7.25%, 5/15/2017 | | | 285,000 | | | | 322,050 | |
PepsiCo, Inc., 7.90%, 11/1/2018 | | | 163,000 | | | | 221,168 | |
| | | | | | | | |
| | | | | | | 1,447,566 | |
| | | | | | | | |
| | |
Food Products - 0.09% | | | | | | | | |
Kraft Foods, Inc., 6.125%, 2/1/2018 | | | 895,000 | | | | 1,077,606 | |
| | | | | | | | |
Personal Products - 0.05% | | | | | | | | |
Revlon Consumer Products Corp., 9.75%, 11/15/2015 | | | 620,000 | | | | 668,825 | |
| | | | | | | | |
Total Consumer Staples | | | | | | | 3,193,997 | |
| | | | | | | | |
Energy - 1.08% | | | | | | | | |
Energy Equipment & Services - 0.50% | | | | | | | | |
Baker Hughes, Inc., 7.50%, 11/15/2018 | | | 805,000 | | | | 1,071,343 | |
Calfrac Holdings LP6 , 7.50%, 12/1/2020 | | | 1,250,000 | | | | 1,225,000 | |
Schlumberger Oilfield plc (United Kingdom)6 , 4.20%, 1/15/2021 | | | 400,000 | | | | 442,050 | |
SESI LLC, 6.375%, 5/1/2019 | | | 600,000 | | | | 624,000 | |
Thermon Industries, Inc., 9.50%, 5/1/2017 | | | 576,000 | | | | 633,600 | |
Trinidad Drilling Ltd. (Canada)6 , 7.875%, 1/15/2019 | | | 595,000 | | | | 633,675 | |
Weatherford International Ltd. (Switzerland), 9.625%, 3/1/2019 | | | 1,245,000 | | | | 1,646,984 | |
| | | | | | | | |
| | | | | | | 6,276,652 | |
| | | | | | | | |
| | |
Oil, Gas & Consumable Fuels - 0.58% | | | | | | | | |
Anadarko Petroleum Corp., 5.95%, 9/15/2016 | | | 1,690,000 | | | | 1,953,883 | |
The accompanying notes are an integral part of the financial statements.
90
Investment Portfolio - April 30, 2012
(unaudited)
| | | | | | | | |
| PRO-BLEND® EXTENDED TERM SERIES | | PRINCIPAL
AMOUNT | | | VALUE (NOTE 2) | |
| | |
CORPORATE BONDS (continued) | | | | | | | | |
| | |
Non-Convertible Corporate Bonds (continued) | | | | | | | | |
Energy (continued) | | | | | | | | |
Oil, Gas & Consumable Fuels (continued) | | | | | | | | |
Chaparral Energy, Inc., 8.25%, 9/1/2021 | | $ | 560,000 | | | $ | 596,400 | |
Chaparral Energy, Inc.6, 7.625%, 11/15/2022 | | | 355,000 | | | | 362,100 | |
Chesapeake Oilfield Operating LLC - Chesapeake Oilfield Finance, Inc.6, 6.625%, 11/15/2019 | | | 985,000 | | | | 925,900 | |
Energy XXI Gulf Coast, Inc., 9.25%, 12/15/2017 | | | 570,000 | | | | 625,575 | |
PBF Holding Co. LLC - PBF Finance Corp.6, 8.25%, 2/15/2020 | | | 695,000 | | | | 719,325 | |
Shell International Finance B.V. (Netherlands), 4.30%, 9/22/2019 | | | 910,000 | | | | 1,043,277 | |
Targa Resources Partners LP - Targa Resources Partners Finance Corp., 8.25%, 7/1/2016 | | | 465,000 | | | | 489,412 | |
Tesoro Corp., 9.75%, 6/1/2019 | | | 495,000 | | | | 563,063 | |
| | | | | | | | |
| | | | | | | 7,278,935 | |
| | | | | | | | |
Total Energy | | | | | | | 13,555,587 | |
| | | | | | | | |
Financials - 9.21% | | | | | | | | |
Capital Markets - 2.61% | | | | | | | | |
Barclays Bank plc (United Kingdom)6, 2.50%, 9/21/2015 | | | 5,370,000 | | | | 5,507,402 | |
BNP Paribas Home Loan Covered Bonds S.A. (France)6, 2.20%, 11/2/2015 | | | 5,370,000 | | | | 5,383,790 | |
Credit Suisse AG (Switzerland)6, 2.60%, 5/27/2016 | | | 2,995,000 | | | | 3,065,889 | |
GFI Group, Inc., 8.375%, 7/19/2018 | | | 795,000 | | | | 733,387 | |
Goldman Sachs Capital II7, 5.793%, 6/1/2043 | | | 2,005,000 | | | | 1,378,438 | |
The Goldman Sachs Group, Inc., 6.15%, 4/1/2018 | | | 885,000 | | | | 963,314 | |
The Goldman Sachs Group, Inc., 5.375%, 3/15/2020 | | | 3,290,000 | | | | 3,413,625 | |
Jefferies Group, Inc., 8.50%, 7/15/2019 | | | 2,465,000 | | | | 2,723,825 | |
Merrill Lynch & Co., Inc., 6.05%, 8/15/2012 | | | 4,725,000 | | | | 4,793,465 | |
Morgan Stanley, 5.55%, 4/27/2017 | | | 1,210,000 | | | | 1,230,969 | |
Morgan Stanley, 7.30%, 5/13/2019 | | | 1,355,000 | | | | 1,454,369 | |
Morgan Stanley, 5.75%, 1/25/2021 | | | 1,900,000 | | | | 1,876,125 | |
Neuberger Berman Group LLC - Neuberger Berman Finance Corp.6, 5.625%, 3/15/2020 | | | 130,000 | | | | 131,950 | |
Neuberger Berman Group LLC - Neuberger Berman Finance Corp.6, 5.875%, 3/15/2022 | | | 260,000 | | | | 264,550 | |
| | | | | | | | |
| | | | | | | 32,921,098 | |
| | | | | | | | |
| | |
Commercial Banks - 3.10% | | | | | | | | |
Bank of Montreal (Canada)6, 1.30%, 10/31/2014 | | | 2,285,000 | | | | 2,315,285 | |
Bank of Montreal (Canada)6, 2.625%, 1/25/2016 | | | 1,845,000 | | | | 1,944,977 | |
Bank of Nova Scotia (Canada)6, 1.45%, 7/26/2013 | | | 2,150,000 | | | | 2,175,824 | |
Bank of Nova Scotia (Canada)6, 1.65%, 10/29/2015 | | | 5,370,000 | | | | 5,474,570 | |
Canadian Imperial Bank of Commerce (Canada)6, 1.50%, 12/12/2014 | | | 1,640,000 | | | | 1,669,656 | |
CIT Group, Inc., 5.25%, 3/15/2018 | | | 655,000 | | | | 674,650 | |
Intesa Sanpaolo S.p.A. (Italy)6, 6.50%, 2/24/2021 | | | 1,030,000 | | | | 935,815 | |
KeyBank National Association, 5.45%, 3/3/2016 | | | 1,310,000 | | | | 1,454,907 | |
The accompanying notes are an integral part of the financial statements.
91
Investment Portfolio - April 30, 2012
(unaudited)
| | | | | | | | |
| PRO-BLEND® EXTENDED TERM SERIES | | PRINCIPAL
AMOUNT | | | VALUE (NOTE 2) | |
| | |
CORPORATE BONDS (continued) | | | | | | | | |
| | |
Non-Convertible Corporate Bonds (continued) | | | | | | | | |
Financials (continued) | | | | | | | | |
Commercial Banks (continued) | | | | | | | | |
Manufacturers & Traders Trust Co., 6.625%, 12/4/2017 | | $ | 1,830,000 | | | $ | 2,129,818 | |
National Bank of Canada (Canada)6, 2.20%, 10/19/2016 | | | 3,120,000 | | | | 3,235,175 | |
National City Corp., 6.875%, 5/15/2019 | | | 1,465,000 | | | | 1,734,277 | |
PNC Bank National Association, 5.25%, 1/15/2017 | | | 1,035,000 | | | | 1,153,092 | |
Royal Bank of Canada (Canada)6, 3.125%, 4/14/2015 | | | 4,725,000 | | | | 5,006,846 | |
Santander Holdings USA, Inc., 4.625%, 4/19/2016 | | | 265,000 | | | | 264,085 | |
Santander Issuances S.A. Unipersonal (Spain)6, 5.911%, 6/20/2016 | | | 950,000 | | | | 924,481 | |
Societe Generale S.A. (France)6, 5.75%, 4/20/2016 | | | 1,025,000 | | | | 988,081 | |
The Toronto-Dominion Bank (Canada)6, 2.20%, 7/29/2015 | | | 5,370,000 | | | | 5,580,842 | |
Wachovia Corp., 5.25%, 8/1/2014 | | | 1,270,000 | | | | 1,365,571 | |
| | | | | | | | |
| | | | | | | 39,027,952 | |
| | | | | | | | |
| | |
Consumer Finance - 0.64% | | | | | | | | |
American Express Co., 8.125%, 5/20/2019 | | | 3,825,000 | | | | 5,066,094 | |
American Express Co.7, 6.80%, 9/1/2066 | | | 930,000 | | | | 949,995 | |
Credit Acceptance Corp., 9.125%, 2/1/2017 | | | 1,030,000 | | | | 1,120,125 | |
Discover Financial Services6, 5.20%, 4/27/2022 | | | 980,000 | | | | 1,017,044 | |
| | | | | | | | |
| | | | | | | 8,153,258 | |
| | | | | | | | |
| | |
Diversified Financial Services - 1.21% | | | | | | | | |
Bank of America Corp., 5.75%, 8/15/2016 | | | 685,000 | | | | 714,959 | |
Bank of America Corp., 5.65%, 5/1/2018 | | | 860,000 | | | | 909,560 | |
Bank of America Corp., 7.625%, 6/1/2019 | | | 3,660,000 | | | | 4,218,344 | |
Bank of America Corp.8, 5.13%, 2/24/2026 | | | 970,000 | | | | 948,135 | |
Citigroup, Inc., 8.50%, 5/22/2019 | | | 2,700,000 | | | | 3,354,693 | |
CNH Capital LLC6, 6.25%, 11/1/2016 | | | 585,000 | | | | 623,756 | |
JPMorgan Chase & Co., 6.30%, 4/23/2019 | | | 860,000 | | | | 1,006,954 | |
JPMorgan Chase & Co., 4.95%, 3/25/2020 | | | 3,130,000 | | | | 3,437,191 | |
| | | | | | | | |
| | | | | | | 15,213,592 | |
| | | | | | | | |
| | |
Insurance - 0.48% | | | | | | | | |
American International Group, Inc., 4.25%, 5/15/2013 | | | 1,245,000 | | | | 1,270,001 | |
Fidelity National Financial, Inc., 6.60%, 5/15/2017 | | | 2,025,000 | | | | 2,157,287 | |
Genworth Financial, Inc., 7.625%, 9/24/2021 | | | 2,170,000 | | | | 2,142,654 | |
Hartford Financial Services Group, Inc.7, 8.125%, 6/15/2038 | | | 495,000 | | | | 519,750 | |
| | | | | | | | |
| | | | | | | 6,089,692 | |
| | | | | | | | |
| | |
Real Estate Investment Trusts (REITS) - 1.17% | | | | | | | | |
BioMed Realty LP, 3.85%, 4/15/2016 | | | 1,145,000 | | | | 1,188,300 | |
Boston Properties LP, 5.875%, 10/15/2019 | | | 1,255,000 | | | | 1,453,859 | |
Camden Property Trust, 5.70%, 5/15/2017 | | | 980,000 | | | | 1,102,215 | |
Digital Realty Trust LP, 5.25%, 3/15/2021 | | | 1,870,000 | | | | 1,980,625 | |
DuPont Fabros Technology LP, 8.50%, 12/15/2017 | | | 850,000 | | | | 937,125 | |
The accompanying notes are an integral part of the financial statements.
92
Investment Portfolio - April 30, 2012
(unaudited)
| | | | | | | | |
| PRO-BLEND® EXTENDED TERM SERIES | | PRINCIPAL
AMOUNT | | | VALUE (NOTE 2) | |
| | |
CORPORATE BONDS (continued) | | | | | | | | |
| | |
Non-Convertible Corporate Bonds (continued) | | | | | | | | |
Financials (continued) | | | | | | | | |
Real Estate Investment Trusts (REITS) (continued) | | | | | | | | |
HCP, Inc., 6.70%, 1/30/2018 | | $ | 1,270,000 | | | $ | 1,486,054 | |
Health Care REIT, Inc., 6.20%, 6/1/2016 | | | 1,240,000 | | | | 1,375,562 | |
Mack-Cali Realty LP, 7.75%, 8/15/2019 | | | 755,000 | | | | 928,806 | |
National Retail Properties, Inc., 6.875%, 10/15/2017 | | | 650,000 | | | | 746,129 | |
Simon Property Group LP, 10.35%, 4/1/2019 | | | 1,035,000 | | | | 1,435,794 | |
UDR, Inc., 4.625%, 1/10/2022 | | | 1,980,000 | | | | 2,070,896 | |
| | | | | | | | |
| | | | | | | 14,705,365 | |
| | | | | | | | |
Total Financials | | | | | | | 116,110,957 | |
| | | | | | | | |
Health Care - 0.91% | | | | | | | | |
Health Care Equipment & Supplies - 0.32% | | | | | | | | |
Alere, Inc., 9.00%, 5/15/2016 | | | 944,000 | | | | 975,860 | |
CR Bard, Inc., 4.40%, 1/15/2021 | | | 925,000 | | | | 1,048,856 | |
Fresenius Medical Care US Finance, Inc., 6.875%, 7/15/2017 | | | 835,000 | | | | 913,281 | |
Fresenius US Finance II, Inc.6, 9.00%, 7/15/2015 | | | 1,005,000 | | | | 1,151,981 | |
| | | | | | | | |
| | | | | | | 4,089,978 | |
| | | | | | | | |
| | |
Health Care Providers & Services - 0.34% | | | | | | | | |
HCA, Inc., 6.50%, 2/15/2020 | | | 635,000 | | | | 679,450 | |
Health Management Associates, Inc., 6.125%, 4/15/2016 | | | 1,205,000 | | | | 1,265,250 | |
STHI Holding Corp.6, 8.00%, 3/15/2018 | | | 635,000 | | | | 676,275 | |
UnitedHealth Group, Inc., 4.70%, 2/15/2021 | | | 1,460,000 | | | | 1,665,466 | |
| | | | | | | | |
| | | | | | | 4,286,441 | |
| | | | | | | | |
| | |
Life Sciences Tools & Services - 0.08% | | | | | | | | |
Thermo Fisher Scientific, Inc., 4.50%, 3/1/2021 | | | 850,000 | | | | 971,945 | |
| | | | | | | | |
Pharmaceuticals - 0.17% | | | | | | | | |
Novartis Securities Investment Ltd. (Bermuda), 5.125%, 2/10/2019 | | | 1,245,000 | | | | 1,481,891 | |
Valeant Pharmaceuticals International6, 6.75%, 8/15/2021 | | | 655,000 | | | | 636,987 | |
| | | | | | | | |
| | | | | | | 2,118,878 | |
| | | | | | | | |
Total Health Care | | | | | | | 11,467,242 | |
| | | | | | | | |
Industrials - 2.32% | | | | | | | | |
Aerospace & Defense - 0.15% | | | | | | | | |
The Boeing Co., 6.00%, 3/15/2019 | | | 980,000 | | | | 1,219,992 | |
Ducommun, Inc., 9.75%, 7/15/2018 | | | 590,000 | | | | 623,925 | |
| | | | | | | | |
| | | | | | | 1,843,917 | |
| | | | | | | | |
| | |
Air Freight & Logistics - 0.17% | | | | | | | | |
Aguila 3 S.A. (Luxembourg)6, 7.875%, 1/31/2018 | | | 1,025,000 | | | | 1,073,688 | |
FedEx Corp., 8.00%, 1/15/2019 | | | 785,000 | | | | 1,031,904 | |
| | | | | | | | |
| | | | | | | 2,105,592 | |
| | | | | | | | |
The accompanying notes are an integral part of the financial statements.
93
Investment Portfolio - April 30, 2012
(unaudited)
| | | | | | | | |
| PRO-BLEND® EXTENDED TERM SERIES | | PRINCIPAL
AMOUNT | | | VALUE (NOTE 2) | |
| | |
CORPORATE BONDS (continued) | | | | | | | | |
| | |
Non-Convertible Corporate Bonds (continued) | | | | | | | | |
Industrials (continued) | | | | | | | | |
Airlines - 0.41% | | | | | | | | |
Continental Airlines, Inc.6, 6.75%, 9/15/2015 | | $ | 1,210,000 | | | $ | 1,238,737 | |
Delta Air Lines Pass-Through Trust, Series 2007-1, Class A, 6.821%, 8/10/2022 | | | 296,838 | | | | 321,327 | |
Delta Air Lines Pass-Through Trust, Series 2010-1, Class B, 6.375%, 1/2/2016 | | | 545,000 | | | | 545,000 | |
Delta Air Lines Pass-Through Trust, Series 2010-2, Class B, 6.75%, 11/23/2015 | | | 290,000 | | | | 291,450 | |
Southwest Airlines Co., 5.25%, 10/1/2014 | | | 945,000 | | | | 1,015,490 | |
Southwest Airlines Co., 5.75%, 12/15/2016 | | | 1,580,000 | | | | 1,757,965 | |
| | | | | | | | |
| | | | | | | 5,169,969 | |
| | | | | | | | |
| | |
Building Products - 0.16% | | | | | | | | |
Building Materials Corp. of America6, 6.875%, 8/15/2018 | | | 340,000 | | | | 357,000 | |
Building Materials Corp. of America6, 7.50%, 3/15/2020 | | | 570,000 | | | | 607,050 | |
Owens Corning, 9.00%, 6/15/2019 | | | 830,000 | | | | 1,029,779 | |
| | | | | | | | |
| | | | | | | 1,993,829 | |
| | | | | | | | |
| | |
Commercial Services & Supplies - 0.23% | | | | | | | | |
Garda World Security Corp. (Canada)6, 9.75%, 3/15/2017 | | | 785,000 | | | | 832,100 | |
International Lease Finance Corp., 8.625%, 1/15/2022 | | | 545,000 | | | | 623,420 | |
Waste Management, Inc., 7.375%, 3/11/2019 | | | 1,110,000 | | | | 1,411,604 | |
| | | | | | | | |
| | | | | | | 2,867,124 | |
| | | | | | | | �� |
| | |
Industrial Conglomerates - 0.52% | | | | | | | | |
General Electric Capital Corp., 5.625%, 5/1/2018 | | | 460,000 | | | | 533,151 | |
General Electric Capital Corp., 5.50%, 1/8/2020 | | | 4,020,000 | | | | 4,596,448 | |
Textron, Inc., 7.25%, 10/1/2019 | | | 940,000 | | | | 1,095,208 | |
Tyco Electronics Group S.A. (Luxembourg), 4.875%, 1/15/2021 | | | 325,000 | | | | 358,380 | |
| | | | | | | | |
| | | | | | | 6,583,187 | |
| | | | | | | | |
| | |
Machinery - 0.39% | | | | | | | | |
Caterpillar Financial Services Corp., 7.05%, 10/1/2018 | | | 815,000 | | | | 1,045,017 | |
Dynacast International LLC - Dynacast Finance, Inc.6, 9.25%, 7/15/2019 | | | 875,000 | | | | 918,750 | |
John Deere Capital Corp., 5.50%, 4/13/2017 | | | 275,000 | | | | 328,519 | |
John Deere Capital Corp., 5.75%, 9/10/2018 | | | 1,295,000 | | | | 1,582,373 | |
Kennametal, Inc., 3.875%, 2/15/2022 | | | 1,075,000 | | | | 1,095,616 | |
| | | | | | | | |
| | | | | | | 4,970,275 | |
| | | | | | | | |
| | |
Marine - 0.07% | | | | | | | | |
Navios Maritime Holdings, Inc. - Navios Maritime Finance US, Inc. (Marshall Island), 8.875%, 11/1/2017 | | | 905,000 | | | | 929,888 | |
| | | | | | | | |
Road & Rail - 0.22% | | | | | | | | |
Avis Budget Car Rental LLC - Avis Budget Finance, Inc., 8.25%, 1/15/2019 | | | 605,000 | | | | 633,737 | |
JB Hunt Transport Services, Inc., 3.375%, 9/15/2015 | | | 1,150,000 | | | | 1,190,641 | |
The accompanying notes are an integral part of the financial statements.
94
Investment Portfolio - April 30, 2012
(unaudited)
| | | | | | | | |
| PRO-BLEND® EXTENDED TERM SERIES | | PRINCIPAL
AMOUNT | | | VALUE (NOTE 2) | |
| | |
CORPORATE BONDS (continued) | | | | | | | | |
| | |
Non-Convertible Corporate Bonds (continued) | | | | | | | | |
Industrials (continued) | | | | | | | | |
Road & Rail (continued) | | | | | | | | |
Union Pacific Corp., 5.65%, 5/1/2017 | | $ | 810,000 | | | $ | 949,818 | |
| | | | | | | | |
| | | | | | | 2,774,196 | |
| | | | | | | | |
| | |
Total Industrials | | | | | | | 29,237,977 | |
| | | | | | | | |
Information Technology - 0.55% | | | | | | | | |
Communications Equipment - 0.14% | | | | | | | | |
Hughes Satellite Systems Corp., 6.50%, 6/15/2019 | | | 1,090,000 | | | | 1,166,300 | |
ViaSat, Inc.6, 6.875%, 6/15/2020 | | | 565,000 | | | | 572,063 | |
| | | | | | | | |
| | | | | | | 1,738,363 | |
| | | | | | | | |
| | |
Electronic Equipment, Instruments & Components - 0.18% | | | | | | | | |
Amphenol Corp., 4.00%, 2/1/2022 | | | 575,000 | | | | 588,926 | |
Corning, Inc., 6.625%, 5/15/2019 | | | 1,000,000 | | | | 1,213,115 | |
CPI International, Inc., 8.00%, 2/15/2018 | | | 575,000 | | | | 506,719 | |
| | | | | | | | |
| | | | | | | 2,308,760 | |
| | | | | | | | |
| | |
IT Services - 0.12% | | | | | | | | |
The Western Union Co., 5.253%, 4/1/2020 | | | 1,350,000 | | | | 1,532,724 | |
| | | | | | | | |
Semiconductors & Semiconductor Equipment - 0.06% | | | | | | | | |
Advanced Micro Devices, Inc., 7.75%, 8/1/2020 | | | 240,000 | | | | 264,600 | |
MagnaChip Semiconductor S.A. - MagnaChip Semiconductor Finance Co., 10.50%, 4/15/2018 | | | 455,000 | | | | 510,737 | |
| | | | | | | | |
| | | | | | | 775,337 | |
| | | | | | | | |
| | |
Software - 0.05% | | | | | | | | |
Sophia LP - Sophia Finance, Inc.6, 9.75%, 1/15/2019 | | | 595,000 | | | | 638,137 | |
| | | | | | | | |
Total Information Technology | | | | | | | 6,993,321 | |
| | | | | | | | |
Materials - 1.39% | | | | | | | | |
Chemicals - 0.19% | | | | | | | | |
E.I. du Pont de Nemours & Co., 6.00%, 7/15/2018 | | | 855,000 | | | | 1,061,291 | |
LyondellBasell Industries N.V. (Netherlands)6, 5.00%, 4/15/2019 | | | 630,000 | | | | 650,475 | |
Taminco Global Chemical Corp.6, 9.75%, 3/31/2020 | | | 605,000 | | | | 632,225 | |
| | | | | | | | |
| | | | | | | 2,343,991 | |
| | | | | | | | |
| | |
Containers & Packaging - 0.12% | | | | | | | | |
Longview Fibre Paper & Packaging, Inc.6, 8.00%, 6/1/2016 | | | 600,000 | | | | 606,000 | |
Reynolds Group Issuer, Inc. - Reynolds Group Issuer LLC6, 9.875%, 8/15/2019 | | | 900,000 | | | | 938,250 | |
| | | | | | | | |
| | | | | | | 1,544,250 | |
| | | | | | | | |
| | |
Metals & Mining - 0.96% | | | | | | | | |
Alcoa, Inc., 5.72%, 2/23/2019 | | | 1,562,000 | | | | 1,690,125 | |
Allegheny Technologies, Inc., 5.95%, 1/15/2021 | | | 1,765,000 | | | | 1,956,141 | |
ArcelorMittal (Luxembourg), 5.50%, 3/1/2021 | | | 1,970,000 | | | | 1,940,395 | |
The accompanying notes are an integral part of the financial statements.
95
Investment Portfolio - April 30, 2012
(unaudited)
| | | | | | | | |
| PRO-BLEND® EXTENDED TERM SERIES | | PRINCIPAL
AMOUNT | | | VALUE (NOTE 2) | |
| | |
CORPORATE BONDS (continued) | | | | | | | | |
| | |
Non-Convertible Corporate Bonds (continued) | | | | | | | | |
Materials (continued) | | | | | | | | |
Metals & Mining (continued) | | | | | | | | |
BHP Billiton Finance (USA) Ltd. (Australia), 6.50%, 4/1/2019 | | $ | 830,000 | | | $ | 1,050,643 | |
Calcipar S.A. (Luxembourg)6, 6.875%, 5/1/2018 | | | 630,000 | | | | 645,750 | |
Cliffs Natural Resources, Inc., 4.80%, 10/1/2020 | | | 1,165,000 | | | | 1,222,059 | |
FMG Resources August 2006 Pty. Ltd. (Australia)6, 6.875%, 2/1/2018 | | | 910,000 | | | | 935,025 | |
Rio Tinto Finance USA Ltd. (Australia), 3.75%, 9/20/2021 | | | 1,460,000 | | | | 1,547,076 | |
Teck Resources Ltd. (Canada), 3.00%, 3/1/2019 | | | 1,090,000 | | | | 1,088,634 | |
| | | | | | | | |
| | | | | | | 12,075,848 | |
| | | | | | | | |
| | |
Paper & Forest Products - 0.12% | | | | | | | | |
International Paper Co., 7.50%, 8/15/2021 | | | 1,210,000 | | | | 1,536,157 | |
| | | | | | | | |
Total Materials | | | | | | | 17,500,246 | |
| | | | | | | | |
Telecommunication Services - 0.85% | | | | | | | | |
Diversified Telecommunication Services - 0.51% | | | | | | | | |
Inmarsat Finance plc (United Kingdom)6, 7.375%, 12/1/2017 | | | 1,215,000 | | | | 1,306,125 | |
Sable International Finance Ltd. (Cayman Islands)6, 8.75%, 2/1/2020 | | | 695,000 | | | | 738,438 | |
UPCB Finance III Ltd. (Cayman Islands)6, 6.625%, 7/1/2020 | | | 700,000 | | | | 710,500 | |
UPCB Finance VI Ltd. (Cayman Islands)6, 6.875%, 1/15/2022 | | | 650,000 | | | | 667,875 | |
Verizon Communications, Inc., 3.00%, 4/1/2016 | | | 980,000 | | | | 1,044,831 | |
Wind Acquisition Finance S.A. (Luxembourg)6, 11.75%, 7/15/2017 | | | 455,000 | | | | 447,037 | |
Wind Acquisition Finance S.A. (Luxembourg)6, 7.25%, 2/15/2018 | | | 1,015,000 | | | | 964,250 | |
Windstream Corp., 7.50%, 6/1/2022 | | | 560,000 | | | | 586,600 | |
| | | | | | | | |
| | | | | | | 6,465,656 | |
| | | | | | | | |
| | |
Wireless Telecommunication Services - 0.34% | | | | | | | | |
CC Holdings GS V LLC - Crown Castle GS III Corp.6, 7.75%, 5/1/2017 | | | 985,000 | | | | 1,073,650 | |
Crown Castle Towers LLC6, 6.113%, 1/15/2020 | | | 1,045,000 | | | | 1,193,361 | |
Crown Castle Towers LLC6, 4.883%, 8/15/2020 | | | 353,000 | | | | 374,432 | |
NII Capital Corp., 8.875%, 12/15/2019 | | | 590,000 | | | | 594,425 | |
NII Capital Corp., 7.625%, 4/1/2021 | | | 375,000 | | | | 348,750 | |
SBA Tower Trust6, 5.101%, 4/15/2017 | | | 575,000 | | | | 625,719 | |
| | | | | | | | |
| | | | | | | 4,210,337 | |
| | | | | | | | |
Total Telecommunication Services | | | | | | | 10,675,993 | |
| | | | | | | | |
Utilities - 0.32% | | | | | | | | |
Electric Utilities - 0.31% | | | | | | | | |
Allegheny Energy Supply Co. LLC6, 5.75%, 10/15/2019 | | | 1,660,000 | | | | 1,829,232 | |
Exelon Generation Co. LLC, 5.35%, 1/15/2014 | | | 895,000 | | | | 954,760 | |
Southwestern Electric Power Co., 6.45%, 1/15/2019 | | | 880,000 | | | | 1,054,420 | |
| | | | | | | | |
| | | | | | | 3,838,412 | |
| | | | | | | | |
The accompanying notes are an integral part of the financial statements.
96
Investment Portfolio - April 30, 2012
(unaudited)
| | | | | | | | |
| PRO-BLEND® EXTENDED TERM SERIES | | PRINCIPAL
AMOUNT/
SHARES | | | VALUE (NOTE 2) | |
| | |
CORPORATE BONDS (continued) | | | | | | | | |
| | |
Non-Convertible Corporate Bonds (continued) | | | | | | | | |
Utilities (continued) | | | | | | | | |
Multi-Utilities - 0.01% | | | | | | | | |
CenterPoint Energy Resources Corp., Series B, 7.875%, 4/1/2013 | | $ | 135,000 | | | $ | 143,418 | |
| | | | | | | | |
Total Utilities | | | | | | | 3,981,830 | |
| | | | | | | | |
Total Non-Convertible Corporate Bonds (Identified Cost $227,141,562) | | | | | | | 239,394,112 | |
| | | | | | | | |
TOTAL CORPORATE BONDS (Identified Cost $229,622,659) | | | | | | | 242,121,250 | |
| | | | | | | | |
| | |
MUTUAL FUNDS - 0.87% | | | | | | | | |
iShares iBoxx High Yield Corporate Bond Fund | | | 53,626 | | | | 4,890,691 | |
iShares iBoxx Investment Grade Corporate Bond Fund | | | 46,500 | | | | 5,416,320 | |
iShares S&P India Nifty 50 Index Fund | | | 13,700 | | | | 311,401 | |
PowerShares India Portfolio | | | 16,900 | | | | 301,496 | |
| | | | | | | | |
| | |
TOTAL MUTUAL FUNDS (Identified Cost $10,963,807) | | | | | | | 10,919,908 | |
| | | | | | | | |
| | |
U.S. TREASURY SECURITIES - 3.68% | | | | | | | | |
| | |
U.S. Treasury Notes - 3.68% | | | | | | | | |
U.S. Treasury Note, 0.25%, 1/31/2014 | | $ | 8,000,000 | | | | 8,000,312 | |
U.S. Treasury Note, 2.375%, 8/31/2014 | | | 394,000 | | | | 412,807 | |
U.S. Treasury Note, 2.375%, 10/31/2014 | | | 428,000 | | | | 449,567 | |
U.S. Treasury Note, 2.375%, 2/28/2015 | | | 850,000 | | | | 897,348 | |
U.S. Treasury Note, 1.25%, 9/30/2015 | | | 576,000 | | | | 591,075 | |
U.S. Treasury Note, 1.375%, 11/30/2015 | | | 565,000 | | | | 582,126 | |
U.S. Treasury Note, 2.00%, 4/30/2016 | | | 338,000 | | | | 356,669 | |
U.S. Treasury Note, 1.00%, 8/31/2016 | | | 20,350,000 | | | | 20,636,162 | |
U.S. Treasury Note, 3.125%, 10/31/2016 | | | 235,000 | | | | 259,987 | |
U.S. Treasury Note, 2.625%, 4/30/2018 | | | 13,000,000 | | | | 14,193,361 | |
| | | | | | | | |
TOTAL U.S. TREASURY SECURITIES (Identified Cost $45,962,380) | | | | | | | 46,379,414 | |
| | | | | | | | |
| | |
ASSET-BACKED SECURITIES - 0.24% | | | | | | | | |
FDIC Trust, Series 2011-R1, Class A6, 2.672%, 7/25/2026 | | | 1,784,300 | | | | 1,832,724 | |
Hertz Vehicle Financing LLC, Series 2009-2A, Class A26, 5.29%, 3/25/2016 | | | 470,000 | | | | 515,155 | |
Hertz Vehicle Financing LLC, Series 2010-1A, Class A26, 3.74%, 2/25/2017 | | | 700,000 | | | | 741,579 | |
| | | | | | | | |
TOTAL ASSET-BACKED SECURITIES (Identified Cost $2,953,762) | | | | | | | 3,089,458 | |
| | | | | | | | |
The accompanying notes are an integral part of the financial statements.
97
Investment Portfolio - April 30, 2012
(unaudited)
| | | | | | | | |
| PRO-BLEND® EXTENDED TERM SERIES | | PRINCIPAL
AMOUNT | | | VALUE
(NOTE 2) | |
| | |
COMMERCIAL MORTGAGE-BACKED SECURITIES - 2.04% | | | | | | | | |
| | |
Americold LLC Trust, Series 2010-ARTA, Class A16 , 3.847%, 1/14/2029 | | $ | 283,607 | | | $ | 300,692 | |
Banc of America Merrill Lynch Commercial Mortgage, Inc., Series 2006-2, Class A47 , 5.731%, 5/10/2045 | | | 3,155,000 | | | | 3,602,209 | |
Banc of America Merrill Lynch Commercial Mortgage, Inc., Series 2006-4, Class A4, 5.634%, 7/10/2046 | | | 850,000 | | | | 960,567 | |
Bear Stearns Commercial Mortgage Securities, Series 2005-PWR9, Class A4A, 4.871%, 9/11/2042 | | | 2,020,000 | | | | 2,214,465 | |
Bear Stearns Commercial Mortgage Securities, Series 2006-PW12, Class A47 , 5.719%, 9/11/2038 | | | 605,000 | | | | 689,010 | |
Bear Stearns Commercial Mortgage Securities, Series 2006-PW13, Class A4, 5.54%, 9/11/2041 | | | 695,000 | | | | 789,837 | |
CFCRE Commercial Mortgage Trust, Series 2011-C1, Class A26 , 3.759%, 4/15/2044 | | | 420,000 | | | | 446,741 | |
Citigroup - Deutsche Bank Commercial Mortgage Trust, Series 2005-CD1, Class A47 , 5.213%, 7/15/2044 | | | 420,000 | | | | 468,106 | |
Citigroup Commercial Mortgage Trust, Series 2006-C4, Class A37 , 5.73%, 3/15/2049 | | | 160,000 | | | | 180,748 | |
Commercial Mortgage Pass-Through Certificates, Series 2006-C7, Class A47 , 5.749%, 6/10/2046 | | | 270,000 | | | | 305,483 | |
Commercial Mortgage Pass-Through Certificates, Series 2010-C1, Class A16 , 3.156%, 7/10/2046 | | | 436,309 | | | | 455,906 | |
DBUBS Mortgage Trust, Series 2011-LC1A, Class A16 , 3.742%, 11/10/2046 | | | 336,601 | | | | 359,606 | |
FREMF Mortgage Trust, Series 2011-K701, Class B6,7 , 4.287%, 7/25/2048 | | | 550,000 | | | | 560,786 | |
FREMF Mortgage Trust, Series 2011-K702, Class B6,7 , 4.77%, 4/25/2044 | | | 675,000 | | | | 689,977 | |
Greenwich Capital Commercial Funding Corp., Series 2006-GG7, Class A47 , 5.874%, 7/10/2038 | | | 615,000 | | | | 700,971 | |
GS Mortgage Securities Corp. II, Series 2010-C2, Class A16 , 3.849%, 12/10/2043 | | | 725,498 | | | | 780,145 | |
JP Morgan Chase Commercial Mortgage Securities Corp., Series 2005-CB13,
Class A47 , 5.284%, 1/12/2043 | | | 1,605,000 | | | | 1,756,069 | |
JP Morgan Chase Commercial Mortgage Securities Corp., Series 2005-LDP5,
Class A47 , 5.198%, 12/15/2044 | | | 325,000 | | | | 363,781 | |
JP Morgan Chase Commercial Mortgage Securities Corp., Series 2006-LDP7,
Class A47 , 5.87%, 4/15/2045 | | | 1,460,000 | | | | 1,671,139 | |
LB-UBS Commercial Mortgage Trust, Series 2006-C4, Class A47 , 5.87%, 6/15/2038 | | | 775,000 | | | | 884,314 | |
LSTAR Commercial Mortgage Trust, Series 2011-1, Class A6 , 3.913%, 6/25/2043 | | | 404,576 | | | | 425,591 | |
Merrill Lynch - Countrywide Commercial Mortgage Trust, Series 2006-3, Class A47 , 5.414%, 7/12/2046 | | | 175,000 | | | | 195,713 | |
Morgan Stanley Capital I, Series 2005-HQ7, Class A47 , 5.201%, 11/14/2042 | | | 125,000 | | | | 138,714 | |
Morgan Stanley Capital I, Series 2005-IQ10, Class A4A7 , 5.23%, 9/15/2042 | | | 345,000 | | | | 380,453 | |
Morgan Stanley Capital I, Series 2011-C1, Class A26 , 3.884%, 9/15/2047 | | | 765,000 | | | | 818,716 | |
OBP Depositor LLC Trust, Series 2010-OBP, Class A6 , 4.646%, 7/15/2045 | | | 115,000 | | | | 130,884 | |
Vornado DP LLC, Series 2010-VNO, Class A2FX6 , 4.004%, 9/13/2028 | | | 350,000 | | | | 380,321 | |
Wachovia Bank Commercial Mortgage Trust, Series 2005-C21, Class A47 , 5.204%, 10/15/2044 | | | 2,425,000 | | | | 2,678,102 | |
Wachovia Bank Commercial Mortgage Trust, Series 2006-C25, Class A47 , 5.734%, 5/15/2043 | | | 215,000 | | | | 243,878 | |
Wachovia Bank Commercial Mortgage Trust, Series 2006-C26, Class A37 , 6.004%, 6/15/2045 | | | 750,000 | | | | 859,437 | |
The accompanying notes are an integral part of the financial statements.
98
Investment Portfolio - April 30, 2012
(unaudited)
| | | | | | | | |
| PRO-BLEND® EXTENDED TERM SERIES | | PRINCIPAL
AMOUNT | | | VALUE (NOTE 2) | |
| | |
COMMERCIAL MORTGAGE-BACKED SECURITIES (continued) | | | | | | | | |
| | |
Wells Fargo Commercial Mortgage Trust, Series 2010-C1, Class A26 , 4.393%, 11/15/2043 | | $ | 600,000 | | | $ | 665,304 | |
WF-RBS Commercial Mortgage Trust, Series 2011-C2, Class A26 , 3.791%, 2/15/2044 | | | 575,000 | | | | 610,882 | |
| | | | | | | | |
TOTAL COMMERCIAL MORTGAGE-BACKED SECURITIES
(Identified Cost $24,644,870) | | | | | | | 25,708,547 | |
| | | | | | | | |
| | |
FOREIGN GOVERNMENT BONDS - 1.86% | | | | | | | | |
| | |
Province of British Columbia Canada (Canada), 2.85%, 6/15/2015 | | | 2,500,000 | | | | 2,659,398 | |
Province of Manitoba Canada (Canada), 2.625%, 7/15/2015 | | | 1,000,000 | | | | 1,056,763 | |
Province of Manitoba Canada, Series FH (Canada), 4.90%, 12/6/2016 | | | 1,400,000 | | | | 1,633,608 | |
Province of New Brunswick Canada (Canada), 5.20%, 2/21/2017 | | | 3,200,000 | | | | 3,763,328 | |
Province of Nova Scotia Canada (Canada), 5.125%, 1/26/2017 | | | 2,000,000 | | | | 2,344,298 | |
Province of Ontario Canada (Canada), 2.30%, 5/10/2016 | | | 5,000,000 | | | | 5,202,800 | |
Province of Quebec Canada (Canada), 5.125%, 11/14/2016 | | | 4,600,000 | | | | 5,370,831 | |
Republic of Italy (Italy), 2.125%, 10/5/2012 | | | 1,440,000 | | | | 1,439,430 | |
| | | | | | | | |
TOTAL FOREIGN GOVERNMENT BONDS
(Identified Cost $23,162,798) | | | | | | | 23,470,456 | |
| | | | | | | | |
| | |
U.S. GOVERNMENT AGENCIES - 11.46% | | | | | | | | |
| | |
Mortgage-Backed Securities - 5.62% | | | | | | | | |
Fannie Mae, Pool #621881, 5.50%, 1/1/2017 | | | 715 | | | | 783 | |
Fannie Mae, Pool #888468, 5.50%, 9/1/2021 | | | 2,079,894 | | | | 2,278,026 | |
Fannie Mae, Pool #995233, 5.50%, 10/1/2021 | | | 143,810 | | | | 157,599 | |
Fannie Mae, Pool #888017, 6.00%, 11/1/2021 | | | 179,697 | | | | 197,029 | |
Fannie Mae, Pool #995329, 5.50%, 12/1/2021 | | | 1,311,648 | | | | 1,436,597 | |
Fannie Mae, Pool #888136, 6.00%, 12/1/2021 | | | 231,707 | | | | 254,055 | |
Fannie Mae, Pool #888810, 5.50%, 11/1/2022 | | | 2,299,967 | | | | 2,519,063 | |
Fannie Mae, Pool #990895, 5.50%, 10/1/2023 | | | 176,213 | | | | 192,576 | |
Fannie Mae, Pool #AD0462, 5.50%, 10/1/2024 | | | 138,252 | | | | 151,090 | |
Fannie Mae, Pool #888021, 6.00%, 12/1/2036 | | | 523,015 | | | | 579,913 | |
Fannie Mae, Pool #909786, 5.50%, 3/1/2037 | | | 1,172,307 | | | | 1,282,806 | |
Fannie Mae, Pool #995196, 6.00%, 7/1/2038 | | | 138,998 | | | | 154,120 | |
Fannie Mae, Pool #AD0220, 6.00%, 10/1/2038 | | | 244,375 | | | | 270,960 | |
Fannie Mae, Pool #AA7681, 4.50%, 6/1/2039 | | | 3,146,206 | | | | 3,370,557 | |
Fannie Mae, Pool #AD0527, 5.50%, 6/1/2039 | | | 829,895 | | | | 908,119 | |
Fannie Mae, Pool #MA0258, 4.50%, 12/1/2039 | | | 3,656,071 | | | | 3,916,781 | |
Fannie Mae, Pool #AE0061, 6.00%, 2/1/2040 | | | 5,024,011 | | | | 5,560,847 | |
Fannie Mae, Pool #AE0951, 4.50%, 2/1/2041 | | | 2,201,645 | | | | 2,358,641 | |
Fannie Mae, Pool #AH9054, 4.50%, 4/1/2041 | | | 839,556 | | | | 901,391 | |
Fannie Mae, Pool #AI2468, 4.50%, 5/1/2041 | | | 528,614 | | | | 567,547 | |
Fannie Mae, Pool #AL0160, 4.50%, 5/1/2041 | | | 2,111,552 | | | | 2,267,072 | |
Fannie Mae, Pool #AJ1415, 4.50%, 9/1/2041 | | | 529,816 | | | | 568,838 | |
Fannie Mae, Pool #AD0207, 6.00%, 10/1/2038 | | | 8,297,498 | | | | 9,200,175 | |
The accompanying notes are an integral part of the financial statements.
99
Investment Portfolio - April 30, 2012
(unaudited)
| | | | | | | | |
| PRO-BLEND® EXTENDED TERM SERIES | | PRINCIPAL AMOUNT/
SHARES | | | VALUE (NOTE 2) | |
| | |
U.S. GOVERNMENT AGENCIES (continued) | | | | | | | | |
| | |
Mortgage-Backed Securities (continued) | | | | | | | | |
Freddie Mac, Pool #G11850, 5.50%, 7/1/2020 | | $ | 749,033 | | | $ | 815,455 | |
Freddie Mac, Pool #G12610, 6.00%, 3/1/2022 | | | 227,058 | | | | 246,137 | |
Freddie Mac, Pool #G12655, 6.00%, 5/1/2022 | | | 158,698 | | | | 172,033 | |
Freddie Mac, Pool #G12988, 6.00%, 1/1/2023 | | | 131,025 | | | | 141,953 | |
Freddie Mac, Pool #G13078, 6.00%, 3/1/2023 | | | 231,028 | | | | 254,302 | |
Freddie Mac, Pool #G13331, 5.50%, 10/1/2023 | | | 105,524 | | | | 114,486 | |
Freddie Mac, Pool #G03332, 6.00%, 10/1/2037 | | | 600,387 | | | | 663,357 | |
Freddie Mac, Pool #G03696, 5.50%, 1/1/2038 | | | 1,177,852 | | | | 1,284,273 | |
Freddie Mac, Pool #G03926, 6.00%, 2/1/2038 | | | 1,675,909 | | | | 1,851,684 | |
Freddie Mac, Pool #G04731, 5.50%, 4/1/2038 | | | 2,283,226 | | | | 2,489,519 | |
Freddie Mac, Pool #G08273, 5.50%, 6/1/2038 | | | 2,249,058 | | | | 2,450,858 | |
Freddie Mac, Pool #G04601, 5.50%, 7/1/2038 | | | 6,797,113 | | | | 7,451,601 | |
Freddie Mac, Pool #G05671, 5.50%, 8/1/2038 | | | 2,174,504 | | | | 2,374,371 | |
Freddie Mac, Pool #A86522, 4.50%, 5/1/2039 | | | 4,703,233 | | | | 5,018,037 | |
Freddie Mac, Pool #A89760, 4.50%, 12/1/2039 | | | 655,835 | | | | 699,733 | |
Freddie Mac, Pool #G06021, 5.50%, 1/1/2040 | | | 1,238,869 | | | | 1,350,803 | |
Freddie Mac, Pool #G05923, 5.50%, 2/1/2040 | | | 792,609 | | | | 864,223 | |
Freddie Mac, Pool #G05900, 6.00%, 3/1/2040 | | | 1,934,578 | | | | 2,137,481 | |
Freddie Mac, Pool #G05906, 6.00%, 4/1/2040 | | | 1,227,412 | | | | 1,356,146 | |
| | | | | | | | |
Total Mortgage-Backed Securities
(Identified Cost $69,561,630) | | | | | | | 70,831,037 | |
| | | | | | | | |
| | |
Other Agencies - 5.84% | | | | | | | | |
Fannie Mae, 1.375%, 11/15/2016 | | | 25,000,000 | | | | 25,523,075 | |
Fannie Mae, 6.25%, 5/15/2029 | | | 2,436,000 | | | | 3,386,342 | |
Fannie Mae, 7.25%, 5/15/2030 | | | 2,196,000 | | | | 3,383,832 | |
Fannie Mae, 6.625%, 11/15/2030 | | | 2,318,000 | | | | 3,384,505 | |
Freddie Mac, 3.75%, 3/27/2019 | | | 17,000,000 | | | | 19,437,239 | |
Freddie Mac, 2.375%, 1/13/2022 | | | 11,460,000 | | | | 11,529,184 | |
Freddie Mac, 6.75%, 3/15/2031 | | | 2,284,000 | | | | 3,380,098 | |
Freddie Mac, 6.25%, 7/15/2032 | | | 2,436,000 | | | | 3,484,954 | |
| | | | | | | | |
Total Other Agencies
(Identified Cost $72,063,890) | | | | | | | 73,509,229 | |
| | | | | | | | |
TOTAL U.S. GOVERNMENT AGENCIES
(Identified Cost $141,625,520) | | | | | | | 144,340,266 | |
| | | | | | | | |
| | |
SHORT-TERM INVESTMENTS - 3.00% | | | | | | | | |
Dreyfus Cash Management, Inc. - Institutional Shares9 , 0.06%, (Identified Cost $37,801,259) | | | 37,801,259 | | | | 37,801,259 | |
| | | | | | | | |
The accompanying notes are an integral part of the financial statements.
100
Investment Portfolio - April 30, 2012
(unaudited)
| | | | |
| PRO-BLEND® EXTENDED TERM SERIES | | VALUE (NOTE 2) | |
TOTAL INVESTMENTS - 99.97%
(Identified Cost $1,169,516,144) | | $ | 1,259,585,252 | |
OTHER ASSETS, LESS LIABILITIES - 0.03% | | | 333,386 | |
| | | | |
NET ASSETS - 100% | | $ | 1,259,918,638 | |
| | | | |
ADR - American Depository Receipt
*Non-income producing security
1A factor from a third party vendor was applied to determine the security’s fair value following the close of local trading.
2Traded on Canadian exchange.
3Traded on Hong Kong exchange.
4Latest quoted sales price is not available and the latest quoted bid price was used to value the security.
5The rate shown is a fixed rate as of April 30, 2012; the rate becomes floating, based on LIBOR plus a spread, at dates ranging from 2013 to 2022.
6Restricted securities - Investment in securities that are restricted as to public resale under the Securities Act of 1933, as amended. These securities have been sold under Rule 144A and have been determined to be liquid. These securities amount to $88,611,830, or 7.03%, of the Series’ net assets as of April 30, 2012.
7The coupon rate is floating and is the effective rate as of April 30, 2012.
8Represents a step-up bond that pays initial coupon rate for the first period and then a higher coupon rate for the following periods. Rate shown reflects the current coupon as of April 30, 2012.
9Rate shown is the current yield as of April 30, 2012.
The accompanying notes are an integral part of the financial statements.
101
Statement of Assets and Liabilities - Pro-Blend® Extended Term Series
April 30, 2012 (unaudited)
| | | | |
ASSETS: | | | | |
| |
Investments, at value (identified cost $1,169,516,144) (Note 2) | | $ | 1,259,585,252 | |
Foreign currency (identified cost $406,943) | | | 404,596 | |
Interest receivable | | | 4,717,584 | |
Receivable for fund shares sold | | | 1,905,882 | |
Receivable for securities sold | | | 1,919,107 | |
Dividends receivable | | | 488,919 | |
Foreign tax reclaims receivable | | | 475,696 | |
Other assets | | | 239,396 | |
| | | | |
| |
TOTAL ASSETS | | | 1,269,736,432 | |
| | | | |
| |
LIABILITIES: | | | | |
| |
Accrued management fees (Note 3) | | | 768,142 | |
Accrued shareholder services fees (Class S) (Note 3) | | | 151,063 | |
Accrued distribution and services (Rule 12b-1) fees (Class C) (Class R) (Note 3) | | | 75,230 | |
Accrued fund accounting and administration fees (Note 3) | | | 58,214 | |
Accrued transfer agent fees (Note 3) | | | 44,065 | |
Accrued directors’ fees (Note 3) | | | 3,558 | |
Accrued Chief Compliance Officer service fees (Note 3) | | | 415 | |
Payable for securities purchased | | | 6,213,771 | |
Payable for fund shares repurchased | | | 2,388,333 | |
Other payables and accrued expenses | | | 115,003 | |
| | | | |
| |
TOTAL LIABILITIES | | | 9,817,794 | |
| | | | |
| |
TOTAL NET ASSETS | | $ | 1,259,918,638 | |
| | | | |
| |
NET ASSETS CONSIST OF: | | | | |
| |
Capital stock | | $ | 968,330 | |
Additional paid-in-capital | | | 1,157,399,681 | |
Undistributed net investment income | | | 4,328,056 | |
Accumulated net realized gain on investments, foreign currency and translation of other assets and liabilities | | | 7,130,731 | |
Net unrealized appreciation on investments, foreign currency and translation of other assets and liabilities | | | 90,091,840 | |
| | | | |
| |
TOTAL NET ASSETS | | $ | 1,259,918,638 | |
| | | | |
The accompanying notes are an integral part of the financial statements.
102
Statement of Assets and Liabilities - Pro-Blend® Extended Term Series
April 30, 2012 (unaudited)
| | | | |
| |
NET ASSET VALUE, OFFERING PRICE AND REDEMPTION PRICE PER SHARE - Class S
($738,141,712/46,949,250 shares) | | $ | 15.72 | |
| | | | |
| |
NET ASSET VALUE, OFFERING PRICE AND REDEMPTION PRICE PER SHARE - Class I
($415,302,565/40,182,017 shares) | | $ | 10.34 | |
| | | | |
| |
NET ASSET VALUE, OFFERING PRICE AND REDEMPTION PRICE PER SHARE - Class C
($78,879,596/7,271,655 shares) | | $ | 10.85 | |
| | | | |
| |
NET ASSET VALUE, OFFERING PRICE AND REDEMPTION PRICE PER SHARE - Class R
($27,594,765/2,430,108 shares) | | $ | 11.36 | |
| | | | |
The accompanying notes are an integral part of the financial statements.
103
Statement of Operations - Pro-Blend® Extended Term Series
For the Six Months Ended April 30, 2012 (unaudited)
| | | | |
INVESTMENT INCOME: | | | | |
| |
Interest | | $ | 8,332,091 | |
Dividends (net of foreign taxes withheld, $269,997) | | | 5,881,637 | |
| | | | |
| |
Total Investment Income | | | 14,213,728 | |
| | | | |
| |
EXPENSES: | | | | |
| |
Management fees (Note 3) | | | 4,420,240 | |
Shareholder services fees (Class S) (Note 3) | | | 900,247 | |
Distribution and service (Rule 12b-1) fees (Class C) (Note 3) | | | 365,349 | |
Fund accounting and administration fees (Note 3) | | | 115,487 | |
Transfer agent fees (Note 3) | | | 84,960 | |
Distribution and service (Rule 12b-1) fees (Class R) (Note 3) | | | 54,511 | |
Directors’ fees (Note 3) | | | 14,855 | |
Chief Compliance Officer service fees (Note 3) | | | 1,246 | |
Custodian fees | | | 52,117 | |
Miscellaneous | | | 174,189 | |
| | | | |
| |
Total Expenses | | | 6,183,201 | |
| | | | |
| |
NET INVESTMENT INCOME | | | 8,030,527 | |
| | | | |
| |
REALIZED AND UNREALIZED GAIN (LOSS) ON INVESTMENTS AND FOREIGN CURRENCY: | | | | |
| |
Net realized gain (loss) on-
Investments | | | 8,757,390 | |
Foreign currency and translation of other assets and liabilities (net of Brazilian tax of $7,790) | | | (72,056 | ) |
Forward foreign currency exchange contracts | | | 28,317 | |
| | | | |
| |
| | | 8,713,651 | |
| | | | |
| |
Net change in unrealized appreciation (depreciation) on-
Investments | | | 53,316,925 | |
Foreign currency and translation of other assets and liabilities | | | (9,799 | ) |
Forward foreign currency exchange contracts | | | (340 | ) |
| | | | |
| | | 53,306,786 | |
| | | | |
| |
NET REALIZED AND UNREALIZED GAIN ON INVESTMENTS AND FOREIGN CURRENCY | | | 62,020,437 | |
| | | | |
| |
NET INCREASE IN NET ASSETS RESULTING FROM OPERATIONS | | $ | 70,050,964 | |
| | | | |
The accompanying notes are an integral part of the financial statements.
104
Statements of Changes in Net Assets - Pro-Blend® Extended Term Series
| | | | | | | | |
| | | FOR THE SIX
MONTHS ENDED
4/30/12
(UNAUDITED) | | | FOR THE
YEAR ENDED 10/31/11 | |
INCREASE (DECREASE) IN NET ASSETS: | | | | | | | | |
| | |
OPERATIONS: | | | | | | | | |
| | |
Net investment income | | $ | 8,030,527 | | | $ | 16,744,293 | |
Net realized gain (loss) on investments and foreign currency (net of Brazilian tax of $7,790 and $73,275, respectively) | | | 8,713,651 | | | | 48,161,280 | |
Net change in unrealized appreciation (depreciation) on investments and foreign currency | | | 53,306,786 | | | | (33,340,882 | ) |
| | | | | | | | |
| | |
Net increase from operations | | | 70,050,964 | | | | 31,564,691 | |
| | | | | | | | |
| | |
DISTRIBUTIONS TO SHAREHOLDERS (Note 8): | | | | | | | | |
| | |
From net investment income (Class S) | | | (5,795,978 | ) | | | (8,968,239 | ) |
From net investment income (Class I) | | | (4,686,269 | ) | | | (6,522,174 | ) |
From net investment income (Class C) | | | (594,898 | ) | | | (562,393 | ) |
From net investment income (Class R) | | | (254,010 | ) | | | (10,782 | ) |
From net realized gain on investments (Class S) | | | (21,181,714 | ) | | | — | |
From net realized gain on investments (Class I) | | | (14,551,102 | ) | | | — | |
From net realized gain on investments (Class C) | | | (2,996,571 | ) | | | — | |
From net realized gain on investments (Class R) | | | (855,544 | ) | | | — | |
| | | | | | | | |
| | |
Total distributions to shareholders | | | (50,916,086 | ) | | | (16,063,588 | ) |
| | | | | | | | |
| | |
CAPITAL STOCK ISSUED AND REPURCHASED: | | | | | | | | |
| | |
Net increase from capital share transactions (Note 5) | | | 125,898,197 | | | | 115,070,014 | |
| | | | | | | | |
| | |
Net increase in net assets | | | 145,033,075 | | | | 130,571,117 | |
| | |
NET ASSETS: | | | | | | | | |
| | |
Beginning of period | | | 1,114,885,563 | | | | 984,314,446 | |
| | | | | | | | |
| | |
End of period (including undistributed net investment income of $4,328,056 and $7,628,684, respectively) | | $ | 1,259,918,638 | | | $ | 1,114,885,563 | |
| | | | | | | | |
The accompanying notes are an integral part of the financial statements.
105
Financial Highlights - Pro-Blend® Extended Term Series - Class S
| | | | | | | | | | | | | | | | | | | | | | | | |
| | | FOR THE SIX | | | FOR THE YEARS ENDED | | | | |
| | | MONTHS ENDED
4/30/12
(UNAUDITED) | | | 10/31/11 | | | 10/31/10 | | | 10/31/09 | | | 10/31/08 | | | 10/31/07 | |
Per share data (for a share outstanding throughout each period): | | | | | | | | | | | | | | | | | | | | | | | | |
Net asset value - Beginning of period | | $ | 15.46 | | | $ | 15.16 | | | $ | 13.32 | | | $ | 11.75 | | | $ | 17.82 | | | $ | 17.12 | |
| | | | | | | | | | | | | | | | | | | | | | | | |
Income (loss) from investment operations: | | | | | | | | | | | | | | | | | | | | | | | | |
Net investment income | | | 0.10 | 1 | | | 0.23 | 1 | | | 0.22 | 1 | | | 0.17 | 1 | | | 0.22 | | | | 0.22 | |
Net realized and unrealized gain (loss) on investments | | | 0.75 | | | | 0.26 | | | | 1.78 | | | | 1.60 | | | | (4.36 | ) | | | 1.88 | |
| | | | | | | | | | | | | | | | | | | | | | | | |
| | | | | | |
Total from investment operations | | | 0.85 | | | | 0.49 | | | | 2.00 | | | | 1.77 | | | | (4.14 | ) | | | 2.10 | |
| | | | | | | | | | | | | | | | | | | | | | | | |
| | | | | | |
Less distributions to shareholders: | | | | | | | | | | | | | | | | | | | | | | | | |
From net investment income | | | (0.13 | ) | | | (0.19 | ) | | | (0.16 | ) | | | (0.20 | ) | | | (0.21 | ) | | | (0.25 | ) |
From net realized gain on investments | | | (0.46 | ) | | | — | | | | — | | | | — | | | | (1.72 | ) | | | (1.15 | ) |
| | | | | | | | | | | | | | | | | | | | | | | | |
| | | | | | |
Total distributions to shareholders | | | (0.59 | ) | | | (0.19 | ) | | | (0.16 | ) | | | (0.20 | ) | | | (1.93 | ) | | | (1.40 | ) |
| | | | | | | | | | | | | | | | | | | | | | | | |
| | | | | | |
Net asset value - End of period | | $ | 15.72 | | | $ | 15.46 | | | $ | 15.16 | | | $ | 13.32 | | | $ | 11.75 | | | $ | 17.82 | |
| | | | | | | | | | | | | | | | | | | | | | | | |
| | | | | | |
Net assets - End of period (000’s omitted) | | $ | 738,142 | | | $ | 716,536 | | | $ | 676,524 | | | $ | 511,700 | | | $ | 424,876 | | | $ | 596,991 | |
| | | | | | | | | | | | | | | | | | | | | | | | |
| | | | | | |
Total return2 | | | 5.85 | % | | | 3.26 | % | | | 15.17 | % | | | 15.47 | % | | | (25.70 | %) | | | 12.95 | % |
Ratios (to average net assets)/ | | | | | | | | | | | | | | | | | | | | | | | | |
Supplemental Data: | | | | | | | | | | | | | | | | | | | | | | | | |
Expenses* | | | 1.08 | %3 | | | 1.08 | % | | | 1.07 | % | | | 1.10 | % | | | 1.10 | % | | | 1.11 | % |
Net investment income | | | 1.33 | %3 | | | 1.49 | % | | | 1.52 | % | | | 1.48 | % | | | 1.50 | % | | | 1.37 | % |
Series portfolio turnover | | | 25 | % | | | 65 | % | | | 62 | % | | | 62 | % | | | 76 | % | | | 82 | % |
|
| * For certain periods presented, the investment advisor did not impose all or a portion of its management fees and/or other fees. If these expenses had been incurred by the Class, the expense ratio (to average net assets) would have increased by the following amount: | |
| | | | | | |
| | | N/A | | | | N/A | | | | 0.00 | %4 | | | 0.01 | % | | | 0.00 | %4 | | | N/A | |
1Calculated based on average shares outstanding during the period.
2Represents aggregate total return for the periods indicated, and assumes reinvestment of all distributions. Total return would have been lower had certain expenses not been waived or reimbursed during the periods. Periods less than one year are not annualized.
3Annualized.
4Less than 0.01%.
The accompanying notes are an integral part of the financial statements.
106
Financial Highlights - Pro-Blend® Extended Term Series - Class I
| | | | | | | | | | | | | | | | | | | | |
| | | | | | FOR THE YEARS ENDED 10/31/11 | | | | |
| | | FOR THE SIX MONTHS ENDED
4/30/12
(UNAUDITED) | | | 10/31/11 | | | 10/31/10 | | | 10/31/09 | | | FOR THE PERIOD 3/28/081 TO
10/31/08 | |
Per share data (for a share outstanding throughout each period): | | | | | | | | | | | | | | | | | | | | |
Net asset value - Beginning of period | | $ | 10.38 | | | $ | 10.26 | | | $ | 9.08 | | | $ | 8.10 | | | $ | 10.00 | |
| | | | | | | | | | | | | | | | | | | | |
Income (loss) from investment operations: | | | | | | | | | | | | | | | | | | | | |
Net investment income | | | 0.08 | 2 | | | 0.18 | 2 | | | 0.17 | 2 | | | 0.13 | 2 | | | 0.08 | |
Net realized and unrealized gain (loss) on investments | | | 0.49 | | | | 0.17 | | | | 1.22 | | | | 1.10 | | | | (1.91 | ) |
| | | | | | | | | | | | | | | | | | | | |
| | | | | |
Total from investment operations | | | 0.57 | | | | 0.35 | | | | 1.39 | | | | 1.23 | | | | (1.83 | ) |
| | | | | | | | | | | | | | | | | | | | |
| | | | | |
Less distributions to shareholders: | | | | | | | | | | | | | | | | | | | | |
From net investment income | | | (0.15 | ) | | | (0.23 | ) | | | (0.21 | ) | | | (0.25 | ) | | | (0.07 | ) |
From net realized gain on investments | | | (0.46 | ) | | | — | | | | — | | | | — | | | | — | |
| | | | | | | | | | | | | | | | | | | | |
| | | | | |
Total distributions to shareholders | | | (0.61 | ) | | | (0.23 | ) | | | (0.21 | ) | | | (0.25 | ) | | | (0.07 | ) |
| | | | | | | | | | | | | | | | | | | | |
| | | | | |
Net asset value - End of period | | $ | 10.34 | | | $ | 10.38 | | | $ | 10.26 | | | $ | 9.08 | | | $ | 8.10 | |
| | | | | | | | | | | | | | | | | | | | |
| | | | | |
Net assets - End of period (000’s omitted) | | $ | 415,303 | | | $ | 321,632 | | | $ | 278,210 | | | $ | 98,015 | | | $ | 1,084 | |
| | | | | | | | | | | | | | | | | | | | |
| | | | | |
Total return3 | | | 6.07 | % | | | 3.43 | % | | | 15.39 | % | | | 15.82 | % | | | (18.46 | %) |
Ratios (to average net assets)/ | | | | | | | | | | | | | | | | | | | | |
Supplemental Data: | | | | | | | | | | | | | | | | | | | | |
Expenses* | | | 0.83 | %4 | | | 0.83 | % | | | 0.83 | % | | | 0.85 | % | | | 0.85 | %4 |
Net investment income | | | 1.59 | %4 | | | 1.74 | % | | | 1.76 | % | | | 1.59 | % | | | 1.62 | %4 |
Series portfolio turnover | | | 25 | % | | | 65 | % | | | 62 | % | | | 62 | % | | | 76 | % |
|
| * For certain periods presented, the investment advisor did not impose all or a portion of its management fees and/or other fees. If these expenses had been incurred by the Class, the expense ratio (to average net assets) would have increased by the following amount: | |
| | | | | |
| | | N/A | | | | N/A | | | | 0.00 | %5 | | | 0.00 | %5 | | | 0.02 | %4 |
1Commencement of operations.
2Calculated based on average shares outstanding during the period.
3Represents aggregate total return for the periods indicated, and assumes reinvestment of all distributions. Total return would have been lower had certain expenses not been waived or reimbursed during the periods. Periods less than one year are not annualized.
4Annualized. 5Less than 0.01%.
The accompanying notes are an integral part of the financial statements.
107
Financial Highlights - Pro-Blend® Extended Term Series - Class C
| | | | | | | | | | | | |
| | | FOR THE SIX
MONTHS ENDED
4/30/12
(UNAUDITED) | | | FOR THE
YEAR ENDED
10/31/11 | | | FOR THE PERIOD
1/4/101 TO
10/31/10 | |
Per share data (for a share outstanding throughout each period): | | | | | | | | | | | | |
Net asset value - Beginning of period | | $ | 10.86 | | | $ | 10.74 | | | $ | 10.00 | |
| | | | | | | | | | | | |
Income from investment operations: | | | | | | | | | | | | |
Net investment income2 | | | 0.03 | | | | 0.08 | | | | 0.06 | |
Net realized and unrealized gain on investments | | | 0.51 | | | | 0.19 | | | | 0.73 | |
| | | | | | | | | | | | |
| | | |
Total from investment operations | | | 0.54 | | | | 0.27 | | | | 0.79 | |
| | | | | | | | | | | | |
| | | |
Less distributions to shareholders: | | | | | | | | | | | | |
From net investment income | | | (0.09 | ) | | | (0.15 | ) | | | (0.05 | ) |
From net realized gain on investments | | | (0.46 | ) | | | — | | | | — | |
| | | | | | | | | | | | |
| | | |
Total distributions to shareholders | | | (0.55 | ) | | | (0.15 | ) | | | (0.05 | ) |
| | | | | | | | | | | | |
| | | |
Net asset value - End of period | | $ | 10.85 | | | $ | 10.86 | | | $ | 10.74 | |
| | | | | | | | | | | | |
| | | |
Net assets - End of period (000’s omitted) | | $ | 78,880 | | | $ | 68,436 | | | $ | 29,468 | |
| | | | | | | | | | | | |
| | | |
Total return3 | | | 5.49 | % | | | 2.49 | % | | | 7.97 | % |
Ratios (to average net assets)/ | | | | | | | | | | | | |
Supplemental Data: | | | | | | | | | | | | |
Expenses* | | | 1.83 | %4 | | | 1.83 | % | | | 1.83 | %4 |
Net investment income | | | 0.59 | %4 | | | 0.71 | % | | | 0.75 | %4 |
Series portfolio turnover | | | 25 | % | | | 65 | % | | | 62 | % |
|
| * For certain periods presented, the investment advisor did not impose all or a portion of its management fees and/or other fees. If these expenses had been incurred by the Class, the expense ratio (to average net assets) would have increased by the following amount: | |
| | | |
| | | N/A | | | | N/A | | | | 0.00 | %4,5 |
1Commencement of operations.
2Calculated based on average shares outstanding during the period.
3Represents aggregate total return for the period indicated, and assumes reinvestment of all distributions. Total return would have been lower had certain expenses not been waived during the period. Periods less than one year are not annualized.
4Annualized. 5Less than 0.01%.
The accompanying notes are an integral part of the financial statements.
108
Financial Highlights - Pro-Blend® Extended Term Series - Class R
| | | | | | | | | | | | |
| | | FOR THE SIX
MONTHS ENDED
4/30/12
(UNAUDITED) | | | FOR THE
YEAR ENDED
10/31/11 | | | FOR THE PERIOD
6/30/101 TO
10/31/10 | |
Per share data (for a share outstanding throughout each period): | | | | | | | | | | | | |
Net asset value - Beginning of period | | $ | 11.36 | | | $ | 11.22 | | | $ | 10.00 | |
| | | | | | | | | | | | |
Income from investment operations: | | | | | | | | | | | | |
Net investment income2 | | | 0.06 | | | | 0.11 | | | | 0.02 | |
Net realized and unrealized gain on investments | | | 0.54 | | | | 0.23 | | | | 1.20 | |
| | | | | | | | | | | | |
| | | |
Total from investment operations | | | 0.60 | | | | 0.34 | | | | 1.22 | |
| | | | | | | | | | | | |
| | | |
Less distributions to shareholders: | | | | | | | | | | | | |
From net investment income | | | (0.14 | ) | | | (0.20 | ) | | | — | |
From net realized gain on investments | | | (0.46 | ) | | | — | | | | — | |
| | | | | | | | | | | | |
| | | |
Total distributions to shareholders | | | (0.60 | ) | | | (0.20 | ) | | | — | |
| | | | | | | | | | | | |
| | | |
Net asset value - End of period | | $ | 11.36 | | | $ | 11.36 | | | $ | 11.22 | |
| | | | | | | | | | | | |
| | | |
Net assets - End of period (000’s omitted) | | $ | 27,595 | | | $ | 8,281 | | | $ | 112 | |
| | | | | | | | | | | | |
| | | |
Total return3 | | | 5.77 | % | | | 3.04 | % | | | 12.20 | % |
Ratios (to average net assets)/ | | | | | | | | | | | | |
Supplemental Data: | | | | | | | | | | | | |
Expenses | | | 1.33 | %4 | | | 1.33 | % | | | 1.33 | %4 |
Net investment income | | | 1.09 | %4 | | | 0.97 | % | | | 0.43 | %4 |
Series portfolio turnover | | | 25 | % | | | 65 | % | | | 62 | % |
1Commencement of operations.
2Calculated based on average shares outstanding during the period.
3Represents aggregate total return for the period indicated, and assumes reinvestment of all distributions. Total return would have been lower had certain expenses not been waived during the period. Periods less than one year are not annualized.
4Annualized.
The accompanying notes are an integral part of the financial statements.
109
Shareholder Expense Example - Pro-Blend® Maximum Term Series
(unaudited)
As a shareholder of the Series, you may incur two types of costs: (1) transaction costs, including potential wire charges on redemptions and (2) ongoing costs, including management fees and other Series expenses. This example is intended to help you understand your ongoing costs (in dollars) of investing in the Series and to compare these costs with the ongoing costs of investing in other mutual funds.
The example is based on an investment of $1,000 invested at the beginning of the period and held for the entire period (November 1, 2011 to April 30, 2012).
Actual Expenses
The Actual lines of the table below provide information about actual account values and actual expenses. You may use the information in these lines, together with the amount you invested, to estimate the expenses that you paid over the period. Simply divide your account value by $1,000 (for example, an $8,600 account value divided by $1,000 = 8.6), then multiply the result by the number in the Actual line for the Class in which you have invested under the heading entitled “Expenses Paid During Period” to estimate the expenses you paid on your account during this period.
Hypothetical Example for Comparison Purposes
The Hypothetical lines of the table below provide information about hypothetical account values and hypothetical expenses based on the Class’ actual expense ratio and an assumed rate of return of 5% per year before expenses, which is not the Class’ actual return. The hypothetical account values and expenses may not be used to estimate the actual ending account balance or expenses you paid during the period. You may use this information to compare the ongoing costs of investing in the Series and other funds. To do so, compare this 5% hypothetical example for the Class in which you have invested with the 5% hypothetical examples that appear in the shareholder reports of the other funds.
Please note that the expenses shown in the table are meant to highlight your ongoing costs only and do not reflect any transaction costs. Therefore, the Hypothetical lines of the table are useful in comparing ongoing costs only, and will not help you determine the relative total costs of owning different funds. In addition, if these transaction costs were included, your costs would have been higher.
| | | | | | | | |
| | | BEGINNING
ACCOUNT VALUE
11/1/11 | | ENDING
ACCOUNT VALUE
4/30/12 | | EXPENSES PAID
DURING PERIOD
11/1/11-4/30/12* | | ANNUALIZED
EXPENSE RATIO |
Class S | | | | | | | | |
Actual | | $1,000.00 | | $1,070.80 | | $5.66 | | 1.10% |
Hypothetical (5% return before expenses) | | $1,000.00 | | $1,019.39 | | $5.52 | | 1.10% |
Class I | | | | | | | | |
Actual | | $1,000.00 | | $1,072.60 | | $4.38 | | 0.85% |
Hypothetical (5% return before expenses) | | $1,000.00 | | $1,020.64 | | $4.27 | | 0.85% |
Class C | | | | | | | | |
Actual | | $1,000.00 | | $1,067.50 | | $9.51 | | 1.85% |
Hypothetical (5% return before expenses) | | $1,000.00 | | $1,015.66 | | $9.27 | | 1.85% |
Class R | | | | | | | | |
Actual | | $1,000.00 | | $1,068.90 | | $6.94 | | 1.35% |
Hypothetical (5% return before expenses) | | $1,000.00 | | $1,018.15 | | $6.77 | | 1.35% |
*Expenses are equal to the Class’ annualized expense ratio (for the six-month period), multiplied by the average account value over the period, multiplied by 182/366 to reflect the one-half year period.
110
Portfolio Composition - Pro-Blend® Maximum Term Series
As of April 30, 2012 (unaudited)
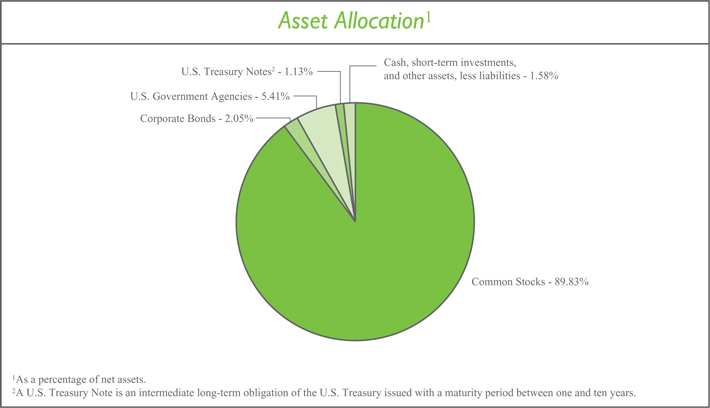
| | | | | | | | | | | | |
| Sector Allocation3 | | | | | Top Ten Stock Holdings4 | |
Information Technology | | | 18.41 | % | | | | Google, Inc. - Class A | | | 2.75 | % |
Consumer Discretionary | | | 17.43 | % | | | | Cerner Corp. | | | 2.46 | % |
Financials | | | 13.51 | % | | | | Monsanto Co. | | | 2.39 | % |
Health Care | | | 12.08 | % | | | | EMC Corp. | | | 2.17 | % |
Industrials | | | 8.92 | % | | | | DIRECTV - Class A | | | 2.00 | % |
Energy | | | 8.54 | % | | | | Time Warner, Inc. | | | 1.90 | % |
Consumer Staples | | | 7.63 | % | | | | Amazon.com, Inc. | | | 1.88 | % |
Materials | | | 4.32 | % | | | | Moody’s Corp. | | | 1.74 | % |
Telecommunication Services | | | 1.68 | % | | | | Carnival Corp. | | | 1.73 | % |
Utilities | | | 0.13 | % | | | | Hess Corp. | | | 1.57 | % |
| | | | | | | | | | | | | |
| | | | | | | | | | | | | |
| 3Including common stocks, preferred stocks, and corporate bonds, as a percentage of total investments. | | | | | 4As a percentage of total investments. | | | | |
| | | | | | | | |
| | | | | | | | |
| | | | | | | | | | | | | |
111
Investment Portfolio - April 30, 2012
(unaudited)
| | | | | | | | |
| PRO-BLEND® MAXIMUM TERM SERIES | | SHARES | | | VALUE (NOTE 2) | |
| | |
COMMON STOCKS - 89.83% | | | | | | | | |
| | |
Consumer Discretionary - 17.28% | | | | | | | | |
Auto Components - 0.13% | | | | | | | | |
Halla Climate Control Corp. (South Korea)1 | | | 9,500 | | | $ | 192,130 | |
Hankook Tire Co. Ltd. (South Korea)1 | | | 15,270 | | | | 644,176 | |
Mando Corp. (South Korea)1 | | | 1,100 | | | | 175,176 | |
| | | | | | | | |
| | | | | | | 1,011,482 | |
| | | | | | | | |
| | |
Automobiles - 0.77% | | | | | | | | |
Hyundai Motor Co. (South Korea)1 | | | 1,000 | | | | 236,070 | |
Suzuki Motor Corp. (Japan)1 | | | 10,200 | | | | 240,072 | |
Tesla Motors, Inc.* | | | 9,390 | | | | 311,091 | |
Toyota Motor Corp. (Japan)1 | | | 5,500 | | | | 225,378 | |
Toyota Motor Corp. - ADR (Japan) | | | 56,940 | | | | 4,656,553 | |
Yamaha Motor Co. Ltd. (Japan)1 | | | 26,000 | | | | 347,271 | |
| | | | | | | | |
| | | | | | | 6,016,435 | |
| | | | | | | | |
| | |
Distributors - 0.03% | | | | | | | | |
Inchcape plc (United Kingdom)1 | | | 43,220 | | | | 256,774 | |
| | | | | | | | |
Diversified Consumer Services - 0.10% | | | | | | | | |
Anhanguera Educacional Participacoes S.A. (Brazil) | | | 24,120 | | | | 319,128 | |
Capella Education Co.* | | | 6,200 | | | | 202,802 | |
Grand Canyon Education, Inc.* | | | 13,880 | | | | 241,373 | |
| | | | | | | | |
| | | | | | | 763,303 | |
| | | | | | | | |
| | |
Hotels, Restaurants & Leisure - 2.34% | | | | | | | | |
Accor S.A. (France)1 | | | 124,190 | | | | 4,294,563 | |
Carnival Corp. | | | 414,700 | | | | 13,473,603 | |
Hyatt Hotels Corp. - Class A* | | | 1,950 | | | | 83,909 | |
Intercontinental Hotels Group plc (United Kingdom)1 | | | 4,620 | | | | 110,159 | |
Orient-Express Hotels Ltd. - Class A - ADR (Bermuda) | | | 19,020 | | | | 203,324 | |
TUI Travel plc (United Kingdom)1 | | | 44,130 | | | | 136,851 | |
| | | | | | | | |
| | | | | | | 18,302,409 | |
| | | | | | | | |
| | |
Household Durables - 0.15% | | | | | | | | |
Corporacion Geo S.A.B. de C.V. - Class B (Mexico)* | | | 66,310 | | | | 88,577 | |
DR Horton, Inc. | | | 7,590 | | | | 124,097 | |
Lennar Corp. - Class A | | | 8,080 | | | | 224,139 | |
LG Electronics, Inc. (South Korea)1 | | | 3,720 | | | | 229,520 | |
NVR, Inc.* | | | 170 | | | | 133,270 | |
Rodobens Negocios Imobiliarios S.A. (Brazil) | | | 43,750 | | | | 255,227 | |
Toll Brothers, Inc.* | | | 4,230 | | | | 107,442 | |
| | | | | | | | |
| | | | | | | 1,162,272 | |
| | | | | | | | |
| | |
Internet & Catalog Retail - 1.92% | | | | | | | | |
Amazon.com, Inc.* | | | 62,920 | | | | 14,591,148 | |
Blue Nile, Inc.* | | | 2,020 | | | | 61,166 | |
The accompanying notes are an integral part of the financial statements.
112
Investment Portfolio - April 30, 2012
(unaudited)
| | | | | | | | |
| PRO-BLEND® MAXIMUM TERM SERIES | | SHARES | | | VALUE (NOTE 2) | |
| | |
COMMON STOCKS (continued) | | | | | | | | |
| | |
Consumer Discretionary (continued) | | | | | | | | |
Internet & Catalog Retail (continued) | | | | | | | | |
Ocado Group plc (United Kingdom)*1 | | | 207,710 | | | $ | 437,854 | |
| | | | | | | | |
| | | | | | | 15,090,168 | |
| | | | | | | | |
| | |
Media - 10.71% | | | | | | | | |
AMC Networks, Inc. - Class A* | | | 217,590 | | | | 9,247,575 | |
DIRECTV - Class A* | | | 315,100 | | | | 15,524,977 | |
Discovery Communications, Inc. - Class A* | | | 195,250 | | | | 10,625,505 | |
Mediaset Espana Comunicacion S.A. (Spain)1 | | | 97,570 | | | | 444,144 | |
News Corp. - Class A | | | 474,210 | | | | 9,294,516 | |
Reed Elsevier plc - ADR (United Kingdom) | | | 5,125 | | | | 169,381 | |
Societe Television Francaise 1 (France)1 | | | 39,080 | | | | 378,532 | |
Time Warner, Inc. | | | 394,960 | | | | 14,795,202 | |
Valassis Communications, Inc.* | | | 7,510 | | | | 150,200 | |
Virgin Media, Inc. - ADR (United Kingdom) | | | 354,650 | | | | 8,710,204 | |
The Walt Disney Co. | | | 204,480 | | | | 8,815,133 | |
The Washington Post Co. - Class B | | | 12,980 | | | | 4,908,647 | |
Wolters Kluwer N.V. (Netherlands)1 | | | 17,270 | | | | 298,553 | |
Zon Multimedia Servicos de Telecomunicacoes e Multimedia SGPS S.A. (Portugal)1 | | | 155,650 | | | | 525,265 | |
| | | | | | | | |
| | | | | | | 83,887,834 | |
| | | | | | | | |
| | |
Multiline Retail - 0.08% | | | | | | | | |
Marks & Spencer Group plc (United Kingdom)1 | | | 48,350 | | | | 280,226 | |
PPR (France)1 | | | 1,965 | | | | 328,841 | |
| | | | | | | | |
| | | | | | | 609,067 | |
| | | | | | | | |
| | |
Specialty Retail - 1.01% | | | | | | | | |
Aeropostale, Inc.* | | | 11,330 | | | | 251,299 | |
American Eagle Outfitters, Inc. | | | 14,040 | | | | 252,860 | |
Belle International Holdings Ltd. (Hong Kong)1 | | | 103,000 | | | | 200,977 | |
Chico’s FAS, Inc. | | | 15,650 | | | | 240,384 | |
Dick’s Sporting Goods, Inc. | | | 115,330 | | | | 5,835,698 | |
Group 1 Automotive, Inc. | | | 3,230 | | | | 186,952 | |
Inditex S.A. (Spain)1 | | | 2,300 | | | | 207,308 | |
KOMERI Co. Ltd. (Japan)1 | | | 5,400 | | | | 151,292 | |
Penske Automotive Group, Inc. | | | 6,550 | | | | 173,182 | |
Sonic Automotive, Inc. - Class A | | | 9,350 | | | | 157,267 | |
Teavana Holdings, Inc.* | | | 13,210 | | | | 275,957 | |
| | | | | | | | |
| | | | | | | 7,933,176 | |
| | | | | | | | |
Textiles, Apparel & Luxury Goods - 0.04% | | | | | | | | |
Adidas AG (Germany)1 | | | 4,050 | | | | 337,809 | |
| | | | | | | | |
Total Consumer Discretionary | | | | | | | 135,370,729 | |
| | | | | | | | |
The accompanying notes are an integral part of the financial statements.
113
Investment Portfolio - April 30, 2012
(unaudited)
| | | | | | | | |
| PRO-BLEND® MAXIMUM TERM SERIES | | SHARES | | | VALUE (NOTE 2) | |
| | |
COMMON STOCKS (continued) | | | | | | | | |
| | |
Consumer Staples - 7.56% | | | | | | | | |
Beverages - 2.63% | | | | | | | | |
Anheuser-Busch InBev N.V. (Belgium)1 | | | 167,520 | | | $ | 12,074,053 | |
The Boston Beer Co., Inc. - Class A* | | | 2,190 | | | | 226,271 | |
C&C Group plc (Ireland)*1 | | | 44,110 | | | | 221,233 | |
Carlsberg A/S - Class B (Denmark)1 | | | 3,750 | | | | 323,707 | |
Cia Cervecerias Unidas S.A. - ADR (Chile) | | | 3,430 | | | | 245,657 | |
The Coca-Cola Co. | | | 81,790 | | | | 6,242,213 | |
Companhia de Bebidas das Americas (AmBev) - ADR (Brazil) | | | 3,400 | | | | 142,732 | |
Diageo plc (United Kingdom)1 | | | 24,560 | | | | 619,484 | |
Heineken N.V. (Netherlands)1 | | | 5,460 | | | | 298,599 | |
Kirin Holdings Co. Ltd. (Japan)1 | | | 18,000 | | | | 229,184 | |
| | | | | | | | |
| | | | | | | 20,623,133 | |
| | | | | | | | |
| | |
Food & Staples Retailing - 1.42% | | | | | | | | |
Carrefour S.A. (France)1 | | | 24,970 | | | | 501,558 | |
Casino Guichard-Perrachon S.A. (France)1 | | | 2,880 | | | | 282,957 | |
Distribuidora Internacional de Alimentacion S.A. (Spain)*1 | | | 62,700 | | | | 301,038 | |
Koninklijke Ahold N.V. (Netherlands)1 | | | 163,230 | | | | 2,071,781 | |
The Kroger Co. | | | 291,760 | | | | 6,789,255 | |
Raia Drogasil S.A. (Brazil) | | | 14,500 | | | | 155,030 | |
SUPERVALU, Inc. | | | 27,000 | | | | 160,380 | |
Tesco plc (United Kingdom)1 | | | 171,040 | | | | 881,315 | |
| | | | | | | | |
| | | | | | | 11,143,314 | |
| | | | | | | | |
| | |
Food Products - 3.33% | | | | | | | | |
Barry Callebaut AG (Switzerland)1 | | | 390 | | | | 375,453 | |
Biostime International Holdings Ltd. (Cayman Islands)1 | | | 33,000 | | | | 94,660 | |
BRF - Brasil Foods S.A. (Brazil) | | | 15,610 | | | | 283,349 | |
Charoen Pokphand Foods PCL (Thailand)1 | | | 166,600 | | | | 207,234 | |
Danone (France)1 | | | 127,510 | | | | 8,976,565 | |
Flowers Foods, Inc. | | | 8,820 | | | | 189,189 | |
Grupo Bimbo S.A.B. de C.V. - Class A (Mexico) | | | 128,690 | | | | 307,055 | |
M Dias Branco S.A. (Brazil) | | | 4,800 | | | | 138,499 | |
Nestle S.A. (Switzerland)1 | | | 60,780 | | | | 3,725,162 | |
Suedzucker AG (Germany)1 | | | 6,820 | | | | 207,682 | |
Unilever plc - ADR (United Kingdom) | | | 337,274 | | | | 11,575,244 | |
| | | | | | | | |
| | | | | | | 26,080,092 | |
| | | | | | | | |
| | |
Household Products - 0.11% | | | | | | | | |
Reckitt Benckiser Group plc (United Kingdom)1 | | | 14,820 | | | | 862,723 | |
| | | | | | | | |
Personal Products - 0.04% | | | | | | | | |
Kao Corp. (Japan)1 | | | 3,900 | | | | 104,502 | |
Natura Cosmeticos S.A. (Brazil) | | | 9,270 | | | | 209,458 | |
| | | | | | | | |
| | | | | | | 313,960 | |
| | | | | | | | |
The accompanying notes are an integral part of the financial statements.
114
Investment Portfolio - April 30, 2012
(unaudited)
| | | | | | | | |
| PRO-BLEND® MAXIMUM TERM SERIES | | SHARES | | | VALUE (NOTE 2) | |
| | |
COMMON STOCKS (continued) | | | | | | | | |
| | |
Consumer Staples (continued) | | | | | | | | |
Tobacco - 0.03% | | | | | | | | |
Gudang Garam Tbk PT (Indonesia)1 | | | 34,500 | | | $ | 221,565 | |
| | | | | | | | |
Total Consumer Staples | | | | | | | 59,244,787 | |
| | | | | | | | |
Energy - 8.47% | | | | | | | | |
Energy Equipment & Services - 4.40% | | | | | | | | |
Baker Hughes, Inc. | | | 207,817 | | | | 9,166,808 | |
Calfrac Well Services Ltd. (Canada) | | | 11,300 | | | | 309,996 | |
Cameron International Corp.* | | | 99,810 | | | | 5,115,262 | |
CARBO Ceramics, Inc. | | | 900 | | | | 75,681 | |
Compagnie Generale de Geophysique - Veritas (CGG - Veritas) (France)*1 | | | 4,720 | | | | 135,359 | |
Heckmann Corp.* | | | 33,970 | | | | 129,086 | |
ION Geophysical Corp.* | | | 22,000 | | | | 137,060 | |
Key Energy Services, Inc.* | | | 11,080 | | | | 140,273 | |
Petroleum Geo-Services ASA (Norway)*1 | | | 14,000 | | | | 211,789 | |
Poseidon Concepts Corp. (Canada) | | | 10,710 | | | | 139,099 | |
Schlumberger Ltd. | | | 141,500 | | | | 10,490,810 | |
Tidewater, Inc. | | | 2,800 | | | | 154,084 | |
Trican Well Service Ltd. (Canada) | | | 44,200 | | | | 639,387 | |
Weatherford International Ltd. - ADR (Switzerland)* | | | 530,166 | | | | 7,565,469 | |
| | | | | | | | |
| | | | | | | 34,410,163 | |
| | | | | | | | |
| | |
Oil, Gas & Consumable Fuels - 4.07% | | | | | | | | |
Apache Corp. | | | 28,720 | | | | 2,755,397 | |
Cameco Corp. (Canada) | | | 16,960 | | | | 374,816 | |
Chesapeake Energy Corp. | | | 147,330 | | | | 2,716,765 | |
Encana Corp. (Canada) | | | 194,770 | | | | 4,078,484 | |
EOG Resources, Inc. | | | 25,100 | | | | 2,756,231 | |
Hess Corp. | | | 234,140 | | | | 12,208,060 | |
Pacific Rubiales Energy Corp. (Canada) | | | 9,200 | | | | 263,935 | |
Paladin Energy Ltd. (Australia)*2 | | | 127,940 | | | | 211,107 | |
Petroleo Brasileiro S.A. - ADR (Brazil) | | | 21,710 | | | | 481,094 | |
Range Resources Corp. | | | 65,880 | | | | 4,391,561 | |
Royal Dutch Shell plc - Class B (Netherlands)1 | | | 7,474 | | | | 273,508 | |
Royal Dutch Shell plc - Class B - ADR (Netherlands) | | | 7,420 | | | | 544,331 | |
Statoil ASA (Norway)1 | | | 11,920 | | | | 319,842 | |
Talisman Energy, Inc. (Canada) | | | 40,030 | | | | 523,549 | |
| | | | | | | | |
| | | | | | | 31,898,680 | |
| | | | | | | | |
Total Energy | | | | | | | 66,308,843 | |
| | | | | | | | |
Financials - 11.41% | | | | | | | | |
Capital Markets - 1.11% | | | | | | | | |
The Charles Schwab Corp. | | | 573,670 | | | | 8,203,481 | |
Deutsche Bank AG (Germany)1 | | | 3,960 | | | | 171,915 | |
The accompanying notes are an integral part of the financial statements.
115
Investment Portfolio - April 30, 2012
(unaudited)
| | | | | | | | |
| PRO-BLEND® MAXIMUM TERM SERIES | | SHARES | | | VALUE (NOTE 2) | |
| | |
COMMON STOCKS (continued) | | | | | | | | |
| | |
Financials (continued) | | | | | | | | |
Capital Markets (continued) | | | | | | | | |
Evercore Partners, Inc. - Class A | | | 5,420 | | | $ | 143,251 | |
Greenhill & Co., Inc. | | | 1,880 | | | | 73,038 | |
Lazard Ltd. - Class A - ADR (Bermuda) | | | 4,250 | | | | 116,917 | |
| | | | | | | | |
| | | | | | | 8,708,602 | |
| | | | | | | | |
| | |
Commercial Banks - 1.70% | | | | | | | | |
Banco Bilbao Vizcaya Argentaria S.A. - ADR (Spain) | | | 28,160 | | | | 190,080 | |
Banco Santander S.A. (Spain)1 | | | 1,193,881 | | | | 7,495,915 | |
Banco Santander S.A. - ADR (Spain) | | | 62,740 | | | | 397,144 | |
Barclays plc (United Kingdom)1 | | | 88,550 | | | | 313,498 | |
BNP Paribas S.A. (France)1 | | | 10,210 | | | | 412,069 | |
CIT Group, Inc.* | | | 12,690 | | | | 480,317 | |
First Commonwealth Financial Corp. | | | 121,280 | | | | 779,830 | |
Hong Leong Financial Group Berhad (Malaysia)1 | | | 105,620 | | | | 416,054 | |
HSBC Holdings plc (United Kingdom)1 | | | 32,180 | | | | 290,495 | |
HSBC Holdings plc - ADR (United Kingdom) | | | 12,295 | | | | 555,365 | |
ICICI Bank Ltd. - ADR (India) | | | 14,770 | | | | 500,555 | |
Standard Chartered plc (United Kingdom)1 | | | 11,010 | | | | 269,147 | |
U.S. Bancorp. | | | 17,220 | | | | 553,967 | |
Wells Fargo & Co. | | | 18,770 | | | | 627,481 | |
| | | | | | | | |
| | | | | | | 13,281,917 | |
| | | | | | | | |
| | |
Consumer Finance - 1.93% | | | | | | | | |
American Express Co. | | | 102,600 | | | | 6,177,546 | |
Discover Financial Services | | | 262,870 | | | | 8,911,293 | |
| | | | | | | | |
| | | | | | | 15,088,839 | |
| | | | | | | | |
| | |
Diversified Financial Services - 3.96% | | | | | | | | |
CME Group, Inc. | | | 28,220 | | | | 7,501,440 | |
Deutsche Boerse AG (Germany)*1 | | | 127,220 | | | | 7,987,987 | |
ING Groep N.V. (Netherlands)*1 | | | 5,355 | | | | 37,779 | |
JPMorgan Chase & Co. | | | 18,951 | | | | 814,514 | |
JSE Ltd. (South Africa)1 | | | 112,540 | | | | 1,191,799 | |
Moody’s Corp. | | | 329,490 | | | | 13,492,615 | |
| | | | | | | | |
| | | | | | | 31,026,134 | |
| | | | | | | | |
| | |
Insurance - 0.62% | | | | | | | | |
Admiral Group plc (United Kingdom)1 | | | 29,920 | | | | 588,028 | |
Allianz SE (Germany)1 | | | 7,740 | | | | 863,328 | |
The Allstate Corp. | | | 19,070 | | | | 635,603 | |
AXA S.A. (France)1 | | | 4,615 | | | | 65,580 | |
Brasil Insurance Participacoes e Administracao S.A. (Brazil) | | | 52,400 | | | | 563,819 | |
Mapfre S.A. (Spain)1 | | | 296,900 | | | | 859,496 | |
Muenchener Rueckversicherungs AG (MunichRe) (Germany)1 | | | 3,663 | | | | 532,051 | |
The accompanying notes are an integral part of the financial statements.
116
Investment Portfolio - April 30, 2012
(unaudited)
| | | | | | | | |
| PRO-BLEND® MAXIMUM TERM SERIES | | SHARES | | | VALUE
(NOTE 2) | |
| | |
COMMON STOCKS (continued) | | | | | | | | |
| | |
Financials (continued) | | | | | | | | |
Insurance (continued) | | | | | | | | |
Zurich Insurance Group AG (Switzerland)1 | | | 2,910 | | | $ | 712,959 | |
| | | | | | | | |
| | | | | | | 4,820,864 | |
| | | | | | | | |
| | |
Real Estate Investment Trusts (REITS) - 2.03% | | | | | | | | |
Alexandria Real Estate Equities, Inc. | | | 3,800 | | | | 284,696 | |
Alstria Office REIT AG (Germany)1 | | | 41,540 | | | | 442,861 | |
American Assets Trust, Inc. | | | 3,990 | | | | 93,805 | |
American Campus Communities, Inc. | | | 10,740 | | | | 477,393 | |
Apartment Investment & Management Co. - Class A | | | 14,700 | | | | 399,105 | |
Associated Estates Realty Corp. | | | 5,310 | | | | 89,898 | |
AvalonBay Communities, Inc. | | | 1,710 | | | | 248,634 | |
BioMed Realty Trust, Inc. | | | 34,100 | | | | 675,862 | |
Boston Properties, Inc. | | | 3,220 | | | | 348,565 | |
Camden Property Trust | | | 3,500 | | | | 236,845 | |
CBL & Associates Properties, Inc. | | | 6,030 | | | | 112,339 | |
Cedar Realty Trust, Inc. | | | 5,770 | | | | 30,119 | |
Coresite Realty Corp. | | | 6,970 | | | | 173,623 | |
Corporate Office Properties Trust | | | 20,750 | | | | 488,663 | |
CubeSmart | | | 12,470 | | | | 156,623 | |
Digital Realty Trust, Inc. | | | 33,150 | | | | 2,489,233 | |
DuPont Fabros Technology, Inc. | | | 96,550 | | | | 2,621,333 | |
Education Realty Trust, Inc. | | | 18,150 | | | | 204,551 | |
Equity Lifestyle Properties, Inc. | | | 3,820 | | | | 267,171 | |
Equity One, Inc. | | | 6,630 | | | | 137,771 | |
Equity Residential | | | 3,720 | | | | 228,557 | |
General Growth Properties, Inc. | | | 11,050 | | | | 196,690 | |
HCP, Inc. | | | 7,450 | | | | 308,803 | |
Health Care REIT, Inc. | | | 5,330 | | | | 301,998 | |
Healthcare Realty Trust, Inc. | | | 2,240 | | | | 48,115 | |
Home Properties, Inc. | | | 7,540 | | | | 460,317 | |
Host Hotels & Resorts, Inc. | | | 19,393 | | | | 322,699 | |
Kimco Realty Corp. | | | 4,410 | | | | 85,598 | |
Land Securities Group plc (United Kingdom)1 | | | 8,400 | | | | 99,198 | |
LTC Properties, Inc. | | | 3,200 | | | | 106,496 | |
The Macerich Co. | | | 1,600 | | | | 98,512 | |
Mack-Cali Realty Corp. | | | 8,340 | | | | 239,525 | |
Mid-America Apartment Communities, Inc. | | | 5,100 | | | | 347,157 | |
National Retail Properties, Inc. | | | 6,590 | | | | 180,434 | |
Pebblebrook Hotel Trust | | | 26,950 | | | | 648,956 | |
Potlatch Corp. | | | 1,240 | | | | 38,812 | |
ProLogis, Inc. | | | 2,960 | | | | 105,909 | |
Public Storage | | | 950 | | | | 136,097 | |
Realty Income Corp. | | | 5,130 | | | | 201,814 | |
The accompanying notes are an integral part of the financial statements.
117
Investment Portfolio - April 30, 2012
(unaudited)
| | | | | | | | |
| PRO-BLEND® MAXIMUM TERM SERIES | | SHARES | | | VALUE (NOTE 2) | |
| | |
COMMON STOCKS (continued) | | | | | | | | |
| | |
Financials (continued) | | | | | | | | |
Real Estate Investment Trusts (REITS) (continued) | | | | | | | | |
Simon Property Group, Inc. | | | 3,890 | | | $ | 605,284 | |
Sovran Self Storage, Inc. | | | 6,630 | | | | 349,401 | |
Tanger Factory Outlet Centers | | | 3,680 | | | | 115,258 | |
Taubman Centers, Inc. | | | 1,360 | | | | 104,965 | |
UDR, Inc. | | | 17,710 | | | | 466,304 | |
Unibail-Rodamco SE (France)1 | | | 440 | | | | 82,332 | |
| | | | | | | | |
| | | | | | | 15,858,321 | |
| | | | | | | | |
| | |
Real Estate Management & Development - 0.04% | | | | | | | | |
General Shopping Brasil S.A. (Brazil)* | | | 48,420 | | | | 293,393 | |
Thomas Properties Group, Inc. | | | 11,440 | | | | 55,827 | |
| | | | | | | | |
| | | | | | | 349,220 | |
| | | | | | | | |
| | |
Thrifts & Mortgage Finance - 0.02% | | | | | | | | |
Aareal Bank AG (Germany)*1 | | | 9,707 | | | | 187,486 | |
| | | | | | | | |
Total Financials | | | | | | | 89,321,383 | |
| | | | | | | | |
Health Care - 11.98% | | | | | | | | |
Biotechnology - 0.94% | | | | | | | | |
Dendreon Corp.* | | | 51,730 | | | | 602,655 | |
Exact Sciences Corp.* | | | 75,970 | | | | 818,197 | |
Myriad Genetics, Inc.* | | | 226,950 | | | | 5,902,969 | |
| | | | | | | | |
| | | | | | | 7,323,821 | |
| | | | | | | | |
| | |
Health Care Equipment & Supplies - 4.67% | | | | | | | | |
Abaxis, Inc.* | | | 32,970 | | | | 1,174,391 | |
Alere, Inc.* | | | 435,379 | | | | 10,401,204 | |
Becton, Dickinson and Co. | | | 105,365 | | | | 8,265,884 | |
BioMerieux (France)1 | | | 8,070 | | | | 661,341 | |
Boston Scientific Corp.* | | | 854,160 | | | | 5,347,042 | |
DexCom, Inc.* | | | 52,704 | | | | 515,972 | |
HeartWare International, Inc.* | | | 12,890 | | | | 1,004,904 | |
Insulet Corp.* | | | 52,300 | | | | 934,078 | |
Mindray Medical International Ltd. - ADR (China) | | | 11,550 | | | | 378,378 | |
Neogen Corp.* | | | 5,700 | | | | 222,243 | |
Quidel Corp.* | | | 34,730 | | | | 573,740 | |
Sirona Dental Systems, Inc.* | | | 15,580 | | | | 786,946 | |
Straumann Holding AG (Switzerland)1 | | | 1,250 | | | | 207,708 | |
Thoratec Corp.* | | | 17,700 | | | | 616,137 | |
Volcano Corp.* | | | 201,380 | | | | 5,467,467 | |
| | | | | | | | |
| | | | | | | 36,557,435 | |
| | | | | | | | |
| | |
Health Care Providers & Services - 0.44% | | | | | | | | |
Amil Participacoes S.A. (Brazil) | | | 39,510 | | | | 386,363 | |
China Cord Blood Corp. - ADR (Hong Kong)* | | | 98,000 | | | | 286,160 | |
The accompanying notes are an integral part of the financial statements.
118
Investment Portfolio - April 30, 2012
(unaudited)
| | | | | | | | |
| PRO-BLEND® MAXIMUM TERM SERIES | | SHARES | | | VALUE (NOTE 2) | |
| | |
COMMON STOCKS (continued) | | | | | | | | |
| | |
Health Care (continued) | | | | | | | | |
Health Care Providers & Services (continued) | | | | | | | | |
Odontoprev S.A. (Brazil) | | | 138,960 | | | $ | 734,112 | |
Sonic Healthcare Ltd. (Australia)1 | | | 157,370 | | | | 2,058,658 | |
| | | | | | | | |
| | | | | | | 3,465,293 | |
| | | | | | | | |
| | |
Health Care Technology - 3.43% | | | | | | | | |
Allscripts Healthcare Solutions, Inc.* | | | 570,410 | | | | 6,320,143 | |
Cerner Corp.* | | | 235,846 | | | | 19,124,752 | |
Computer Programs & Systems, Inc. | | | 9,340 | | | | 556,571 | |
Greenway Medical Technologies, Inc.* | | | 32,590 | | | | 501,886 | |
Quality Systems, Inc. | | | 9,630 | | | | 360,162 | |
| | | | | | | | |
| | | | | | | 26,863,514 | |
| | | | | | | | |
| | |
Life Sciences Tools & Services - 1.67% | | | | | | | | |
Luminex Corp.* | | | 26,250 | | | | 657,300 | |
QIAGEN N.V. (Netherlands)*1 | | | 12,980 | | | | 214,618 | |
QIAGEN N.V. - ADR (Netherlands)* | | | 428,830 | | | | 7,174,326 | |
Waters Corp.* | | | 46,960 | | | | 3,949,806 | |
WuXi PharmaTech (Cayman), Inc. - ADR (China)* | | | 75,470 | | | | 1,085,259 | |
| | | | | | | | |
| | | | | | | 13,081,309 | |
| | | | | | | | |
| | |
Pharmaceuticals - 0.83% | | | | | | | | |
AstraZeneca plc (United Kingdom)1 | | | 2,175 | | | | 95,312 | |
AstraZeneca plc - ADR (United Kingdom) | | | 12,710 | | | | 557,969 | |
Bayer AG (Germany)1 | | | 11,706 | | | | 824,848 | |
Dr. Reddy’s Laboratories Ltd. - ADR (India) | | | 13,570 | | | | 459,073 | |
GlaxoSmithKline plc (United Kingdom)1 | | | 14,755 | | | | 340,863 | |
Green Cross Corp. (South Korea)1 | | | 7,780 | | | | 919,447 | |
Hikma Pharmaceuticals plc (United Kingdom)1 | | | 58,560 | | | | 596,919 | |
Novo Nordisk A/S - Class B (Denmark)1 | | | 2,470 | | | | 364,135 | |
Optimer Pharmaceuticals, Inc.* | | | 43,940 | | | | 650,312 | |
Sanofi (France)1 | | | 1,987 | | | | 151,770 | |
Santen Pharmaceutical Co. Ltd. (Japan)1 | | | 3,100 | | | | 129,732 | |
Shire plc (Ireland)1 | | | 16,590 | | | | 540,713 | |
Takeda Pharmaceutical Co. Ltd. (Japan)1 | | | 2,700 | | | | 117,815 | |
Teva Pharmaceutical Industries Ltd. - ADR (Israel) | | | 6,650 | | | | 304,171 | |
UCB S.A. (Belgium)1 | | | 10,000 | | | | 467,602 | |
| | | | | | | | |
| | | | | | | 6,520,681 | |
| | | | | | | | |
Total Health Care | | | | | | | 93,812,053 | |
| | | | | | | | |
Industrials - 8.79% | | | | | | | | |
Aerospace & Defense - 0.03% | | | | | | | | |
European Aeronautic Defence and Space Co. N.V. (Netherlands)1 | | | 6,890 | | | | 272,283 | |
| | | | | | | | |
Air Freight & Logistics - 1.39% | | | | | | | | |
FedEx Corp | | | 61,490 | | | | 5,425,878 | |
The accompanying notes are an integral part of the financial statements.
119
Investment Portfolio - April 30, 2012
(unaudited)
| | | | | | | | |
| PRO-BLEND® MAXIMUM TERM SERIES | | SHARES | | | VALUE (NOTE 2) | |
| | |
COMMON STOCKS (continued) | | | | | | | | |
| | |
Industrials (continued) | | | | | | | | |
Air Freight & Logistics (continued) | | | | | | | | |
PostNL N.V. (Netherlands)1 | | | 23,170 | | | $ | 100,824 | |
United Parcel Service, Inc. - Class B | | | 68,423 | | | | 5,346,573 | |
| | | | | | | | |
| | | | | | | 10,873,275 | |
| | | | | | | | |
| | |
Airlines - 2.67% | | | | | | | | |
Copa Holdings S.A. - ADR - Class A (Panama) | | | 8,600 | | | | 699,266 | |
Deutsche Lufthansa AG (Germany)1 | | | 17,640 | | | | 229,714 | |
Ryanair Holdings plc - ADR (Ireland)* | | | 278,770 | | | | 9,386,186 | |
Southwest Airlines Co. | | | 1,169,357 | | | | 9,682,276 | |
Spirit Airlines, Inc.* | | | 11,900 | | | | 285,838 | |
US Airways Group, Inc.* | | | 60,050 | | | | 616,113 | |
| | | | | | | | |
| | | | | | | 20,899,393 | |
| | | | | | | | |
| | |
Commercial Services & Supplies - 0.22% | | | | | | | | |
Edenred (France)1 | | | 33,190 | | | | 1,060,336 | |
Interface, Inc. - Class A | | | 5,060 | | | | 71,650 | |
Ritchie Bros. Auctioneers, Inc. (Canada) | | | 10,170 | | | | 214,892 | |
Tomra Systems ASA (Norway)1 | | | 47,870 | | | | 373,629 | |
| | | | | | | | |
| | | | | | | 1,720,507 | |
| | | | | | | | |
| | |
Construction & Engineering - 1.01% | | | | | | | | |
MYR Group, Inc.* | | | 5,380 | | | | 89,954 | |
Quanta Services, Inc.* | | | 353,590 | | | | 7,821,411 | |
| | | | | | | | |
| | | | | | | 7,911,365 | |
| | | | | | | | |
| | |
Electrical Equipment - 0.23% | | | | | | | | |
ABB Ltd. (Asea Brown Boveri) - ADR (Switzerland) | | | 13,740 | | | | 259,274 | |
Alstom S.A. (France)1 | | | 14,500 | | | | 518,586 | |
Nexans S.A. (France)1 | | | 2,050 | | | | 102,744 | |
Polypore International, Inc.* | | | 11,100 | | | | 414,585 | |
Prysmian S.p.A. (Italy)1 | | | 17,160 | | | | 279,517 | |
Schneider Electric S.A. (France)1 | | | 4,200 | | | | 258,702 | |
| | | | | | | | |
| | | | | | | 1,833,408 | |
| | | | | | | | |
| | |
Industrial Conglomerates - 0.14% | | | | | | | | |
Siemens AG (Germany)1 | | | 11,480 | | | | 1,065,576 | |
| | | | | | | | |
Machinery - 1.86% | | | | | | | | |
AGCO Corp.* | | | 5,210 | | | | 242,682 | |
Astec Industries, Inc.* | | | 2,380 | | | | 74,470 | |
Deere & Co. | | | 2,000 | | | | 164,720 | |
FANUC Corp. (Japan)1 | | | 3,500 | | | | 590,277 | |
Flowserve Corp. | | | 56,240 | | | | 6,463,663 | |
Graham Corp. | | | 4,030 | | | | 88,982 | |
Pall Corp. | | | 47,900 | | | | 2,855,319 | |
The accompanying notes are an integral part of the financial statements.
120
Investment Portfolio - April 30, 2012
(unaudited)
| | | | | | | | |
| PRO-BLEND® MAXIMUM TERM SERIES | | SHARES | | | VALUE (NOTE 2) | |
| | |
COMMON STOCKS (continued) | | | | | | | | |
| | |
Industrials (continued) | | | | | | | | |
Machinery (continued) | | | | | | | | |
Pentair, Inc. | | | 5,510 | | | $ | 238,803 | |
Titan International, Inc. | | | 10,040 | | | | 290,056 | |
Trinity Industries, Inc. | | | 5,500 | | | | 162,800 | |
Wabash National Corp.* | | | 30,000 | | | | 251,100 | |
Westport Innovations, Inc. - ADR (Canada)* | | | 101,220 | | | | 3,168,186 | |
| | | | | | | | |
| | | | | | | 14,591,058 | |
| | | | | | | | |
| | |
Marine - 0.06% | | | | | | | | |
Baltic Trading Ltd. | | | 11,570 | | | | 53,800 | |
D/S Norden (Denmark)1 | | | 8,020 | | | | 227,617 | |
Mitsui OSK Lines Ltd. (Japan)1 | | | 7,000 | | | | 27,131 | |
Nippon Yusen Kabushiki Kaisha (Japan)1 | | | 10,000 | | | | 29,560 | |
Pacific Basin Shipping Ltd. (Bermuda)1,3 | | | 60,000 | | | | 31,399 | |
Sinotrans Shipping Ltd. (Hong Kong)1 | | | 309,000 | | | | 73,542 | |
| | | | | | | | |
| | | | | | | 443,049 | |
| | | | | | | | |
| | |
Professional Services - 0.23% | | | | | | | | |
The Advisory Board Co.* | | | 11,690 | | | | 1,065,660 | |
Qualicorp S.A. (Brazil)* | | | 80,180 | | | | 698,680 | |
| | | | | | | | |
| | | | | | | 1,764,340 | |
| | | | | | | | |
| | |
Road & Rail - 0.83% | | | | | | | | |
All America Latina Logistica S.A. (Brazil) | | | 135,210 | | | | 612,157 | |
Norfolk Southern Corp. | | | 75,770 | | | | 5,525,906 | |
RailAmerica, Inc.* | | | 17,070 | | | | 395,683 | |
| | | | | | | | |
| | | | | | | 6,533,746 | |
| | | | | | | | |
| | |
Transportation Infrastructure - 0.12% | | | | | | | | |
Groupe Eurotunnel S.A. (France)1 | | | 39,430 | | | | 331,748 | |
Malaysia Airports Holdings Berhad (Malaysia)1 | | | 327,440 | | | | 625,755 | |
| | | | | | | | |
| | | | | | | 957,503 | |
| | | | | | | | |
Total Industrials | | | | | | | 68,865,503 | |
| | | | | | | | |
Information Technology - 18.26% | | | | | | | | |
Communications Equipment - 4.34% | | | | | | | | |
Alcatel-Lucent - ADR (France)* | | | 380,160 | | | | 574,042 | |
Cisco Systems, Inc. | | | 443,470 | | | | 8,935,920 | |
Infinera Corp.* | | | 150,340 | | | | 1,076,434 | |
Juniper Networks, Inc.* | | | 397,890 | | | | 8,526,783 | |
Qualcomm, Inc. | | | 77,380 | | | | 4,939,939 | |
Riverbed Technology, Inc.* | | | 502,740 | | | | 9,919,060 | |
| | | | | | | | |
| | | | | | | 33,972,178 | |
| | | | | | | | |
| | |
Computers & Peripherals - 2.33% | | | | | | | | |
Apple, Inc.* | | | 1,670 | | | | 975,681 | |
The accompanying notes are an integral part of the financial statements.
121
Investment Portfolio - April 30, 2012
(unaudited)
| | | | | | | | |
| PRO-BLEND® MAXIMUM TERM SERIES | | SHARES | | | VALUE (NOTE 2) | |
| | |
COMMON STOCKS (continued) | | | | | | | | |
| | |
Information Technology (continued) | | | | | | | | |
Computers & Peripherals (continued) | | | | | | | | |
EMC Corp.* | | | 596,440 | | | $ | 16,825,572 | |
Immersion Corp.* | | | 87,850 | | | | 478,783 | |
| | | | | | | | |
| | | | | | | 18,280,036 | |
| | | | | | | | |
| | |
Electronic Equipment, Instruments & Components - 2.04% | | | | | | | | |
Amphenol Corp. - Class A | | | 68,290 | | | | 3,970,381 | |
Corning, Inc. | | | 713,900 | | | | 10,244,465 | |
Hitachi Ltd. (Japan)1 | | | 106,000 | | | | 675,140 | |
Keyence Corp. (Japan)1 | | | 1,146 | | | | 270,532 | |
Maxwell Technologies, Inc.* | | | 23,250 | | | | 221,107 | |
Nippon Electric Glass Co. Ltd. (Japan)1 | | | 70,700 | | | | 571,239 | |
| | | | | | | | |
| | | | | | | 15,952,864 | |
| | | | | | | | |
| | |
Internet Software & Services - 3.26% | | | | | | | | |
The Active Network, Inc.* | | | 59,530 | | | | 1,000,104 | |
comScore, Inc.* | | | 36,100 | | | | 719,112 | |
Google, Inc. - Class A* | | | 35,269 | | | | 21,345,857 | |
LogMeIn, Inc.* | | | 4,890 | | | | 176,089 | |
NHN Corp. (South Korea)1 | | | 2,000 | | | | 452,130 | |
Tencent Holdings Ltd. (China)1 | | | 31,000 | | | | 969,798 | |
Velti plc - ADR (Ireland)* | | | 70,210 | | | | 839,009 | |
| | | | | | | | |
| | | | | | | 25,502,099 | |
| | | | | | | | |
| | |
IT Services - 3.91% | | | | | | | | |
Amadeus IT Holding S.A. - Class A (Spain)1 | | | 210,180 | | | | 4,302,773 | |
Amdocs Ltd. - ADR (Guernsey)* | | | 158,690 | | | | 5,078,080 | |
Cap Gemini S.A. (France)1 | | | 34,680 | | | | 1,354,852 | |
Cielo S.A. (Brazil) | | | — | | | | 6 | |
Euronet Worldwide, Inc.* | | | 40,000 | | | | 865,200 | |
MasterCard, Inc. - Class A | | | 20,510 | | | | 9,276,058 | |
Visa, Inc. - Class A | | | 73,650 | | | | 9,057,477 | |
The Western Union Co. | | | 38,330 | | | | 704,505 | |
| | | | | | | | |
| | | | | | | 30,638,951 | |
| | | | | | | | |
| | |
Semiconductors & Semiconductor Equipment - 0.28% | | | | | | | | |
Aixtron SE NA (Germany)1 | | | 15,700 | | | | 286,857 | |
Samsung Electronics Co. Ltd. (South Korea)1 | | | 460 | | | | 563,022 | |
Sumco Corp. (Japan)*1 | | | 55,600 | | | | 590,231 | |
Tokyo Electron Ltd. (Japan)1 | | | 9,300 | | | | 515,370 | |
Veeco Instruments, Inc.* | | | 9,000 | | | | 271,710 | |
| | | | | | | | |
| | | | | | | 2,227,190 | |
| | | | | | | | |
| | |
Software - 2.10% | | | | | | | | |
Autodesk, Inc.* | | | 207,870 | | | | 8,183,842 | |
The accompanying notes are an integral part of the financial statements.
122
Investment Portfolio - April 30, 2012
(unaudited)
| | | | | | | | |
| PRO-BLEND® MAXIMUM TERM SERIES | | SHARES | | | VALUE (NOTE 2) | |
| | |
COMMON STOCKS (continued) | | | | | | | | |
| | |
Information Technology (continued) | | | | | | | | |
Software (continued) | | | | | | | | |
Aveva Group plc (United Kingdom)1 | | | 10,950 | | | $ | 296,497 | |
Electronic Arts, Inc.* | | | 455,670 | | | | 7,008,205 | |
RealPage, Inc.* | | | 27,570 | | | | 500,395 | |
SAP AG (Germany)1 | | | 6,540 | | | | 433,689 | |
| | | | | | | | |
| | | | | | | 16,422,628 | |
| | | | | | | | |
Total Information Technology | | | | | | | 142,995,946 | |
| | | | | | | | |
Materials - 4.28% | | | | | | | | |
Chemicals - 3.39% | | | | | | | | |
Arkema S.A. (France)1 | | | 40 | | | | 3,548 | |
BASF SE (Germany)1 | | | 7,190 | | | | 591,973 | |
Calgon Carbon Corp.* | | | 22,488 | | | | 311,234 | |
Chr. Hansen Holding A/S (Denmark)1 | | | 5,800 | | | | 160,939 | |
Flotek Industries, Inc.* | | | 9,360 | | | | 127,670 | |
Johnson Matthey plc (United Kingdom)1 | | | 19,780 | | | | 742,768 | |
Linde AG (Germany)1 | | | 3,230 | | | | 552,856 | |
Monsanto Co. | | | 243,470 | | | | 18,547,545 | |
Shin-Etsu Chemical Co. Ltd. (Japan)1 | | | 2,600 | | | | 150,071 | |
Syngenta AG (Switzerland)1 | | | 15,350 | | | | 5,382,887 | |
| | | | | | | | |
| | | | | | | 26,571,491 | |
| | | | | | | | |
| | |
Construction Materials - 0.07% | | | | | | | | |
CRH plc (Ireland)1 | | | 12,010 | | | | 243,445 | |
Eagle Materials, Inc. | | | 3,880 | | | | 136,654 | |
Holcim Ltd. (Switzerland)1 | | | 2,710 | | | | 169,029 | |
| | | | | | | | |
| | | | | | | 549,128 | |
| | | | | | | | |
| | |
Metals & Mining - 0.82% | | | | | | | | |
Alcoa, Inc. | | | 638,840 | | | | 6,215,913 | |
Alumina Ltd. (Australia)1 | | | 94,560 | | | | 112,948 | |
Norsk Hydro ASA (Norway)1 | | | 21,070 | | | | 102,742 | |
| | | | | | | | |
| | | | | | | 6,431,603 | |
| | | | | | | | |
Total Materials | | | | | | | 33,552,222 | |
| | | | | | | | |
Telecommunication Services - 1.67% | | | | | | | | |
Diversified Telecommunication Services - 1.49% | | | | | | | | |
Swisscom AG - ADR (Switzerland)4 | | | 9,116 | | | | 337,748 | |
Telefonica S.A. - ADR (Spain) | | | 39,010 | | | | 570,716 | |
Telenor ASA (Norway)1 | | | 553,990 | | | | 10,183,117 | |
Telenor ASA - ADR (Norway)4 | | | 9,830 | | | | 541,535 | |
| | | | | | | | |
| | | | | | | 11,633,116 | |
| | | | | | | | |
| | |
Wireless Telecommunication Services - 0.18% | | | | | | | | |
DiGi.com Berhad (Malaysia)1 | | | 440,500 | | | | 586,237 | |
The accompanying notes are an integral part of the financial statements.
123
Investment Portfolio - April 30, 2012
(unaudited)
| | | | | | | | |
| PRO-BLEND® MAXIMUM TERM SERIES | | SHARES/
PRINCIPAL
AMOUNT | | | VALUE (NOTE 2) | |
| | |
COMMON STOCKS (continued) | | | | | | | | |
| | |
Telecommunication Services (continued) | | | | | | | | |
Wireless Telecommunication Services (continued) | | | | | | | | |
MTN Group Ltd. (South Africa)1 | | | 7,410 | | | $ | 129,585 | |
SK Telecom Co. Ltd. - ADR (South Korea) | | | 53,960 | | | | 729,539 | |
| | | | | | | | |
| | | | | | | 1,445,361 | |
| | | | | | | | |
Total Telecommunication Services | | | | | | | 13,078,477 | |
| | | | | | | | |
Utilities - 0.13% | | | | | | | | |
Electric Utilities - 0.04% | | | | | | | | |
E.ON AG (Germany)1 | | | 13,630 | | | | 308,607 | |
| | | | | | | | |
Multi-Utilities - 0.05% | | | | | | | | |
GDF Suez (France)1 | | | 4,464 | | | | 102,780 | |
National Grid plc (United Kingdom)1 | | | 24,670 | | | | 266,400 | |
| | | | | | | | |
| | | | | | | 369,180 | |
| | | | | | | | |
| | |
Water Utilities - 0.04% | | | | | | | | |
Cia de Saneamento de Minas Gerais - Copasa MG (Brazil) | | | 15,510 | | | | 363,309 | |
| | | | | | | | |
Total Utilities | | | | | | | 1,041,096 | |
| | | | | | | | |
TOTAL COMMON STOCKS | | | | | | | | |
(Identified Cost $650,187,924) | | | | | | | 703,591,039 | |
| | | | | | | | |
| | |
CORPORATE BONDS - 2.05% | | | | | | | | |
| | |
Non-Convertible Corporate Bonds - 2.05% | | | | | | | | |
Financials - 1.99% | | | | | | | | |
Capital Markets - 0.73% | | | | | | | | |
Barclays Bank plc (United Kingdom)5, 2.50%, 9/21/2015 | | $ | 2,425,000 | | | | 2,487,048 | |
BNP Paribas Home Loan Covered Bonds S.A. (France)5 , 2.20%, 11/2/2015 | | | 2,425,000 | | | | 2,431,227 | |
The Goldman Sachs Group, Inc., 5.375%, 3/15/2020 | | | 410,000 | | | | 425,406 | |
Morgan Stanley, 5.50%, 1/26/2020 | | | 405,000 | | | | 395,877 | |
| | | | | | | | |
| | | | | | | 5,739,558 | |
| | | | | | | | |
| | |
Commercial Banks - 1.05% | | | | | | | | |
Bank of Nova Scotia (Canada)5, 1.45%, 7/26/2013 | | | 970,000 | | | | 981,651 | |
Bank of Nova Scotia (Canada)5, 1.65%, 10/29/2015 | | | 2,425,000 | | | | 2,472,222 | |
Royal Bank of Canada (Canada)5, 3.125%, 4/14/2015 | | | 2,135,000 | | | | 2,262,353 | |
The Toronto-Dominion Bank (Canada)5, 2.20%, 7/29/2015 | | | 2,425,000 | | | | 2,520,213 | |
| | | | | | | | |
| | | | | | | 8,236,439 | |
| | | | | | | | |
| | |
Consumer Finance - 0.05% | | | | | | | | |
American Express Co., 8.125%, 5/20/2019 | | | 315,000 | | | | 417,208 | |
| | | | | | | | |
Diversified Financial Services - 0.16% | | | | | | | | |
Bank of America Corp., 7.625%, 6/1/2019 | | | 340,000 | | | | 391,868 | |
Citigroup, Inc., 8.50%, 5/22/2019 | | | 330,000 | | | | 410,018 | |
The accompanying notes are an integral part of the financial statements.
124
Investment Portfolio - April 30, 2012
(unaudited)
| | | | | | | | |
| PRO-BLEND® MAXIMUM TERM SERIES | | PRINCIPAL
AMOUNT/
SHARES | | | VALUE (NOTE 2) | |
| | |
CORPORATE BONDS (continued) | | | | | | | | |
| | |
Non-Convertible Corporate Bonds (continued) | | | | | | | | |
Financials (continued) | | | | | | | | |
Diversified Financial Services (continued) | | | | | | | | |
JPMorgan Chase & Co., 4.95%, 3/25/2020 | | $ | 385,000 | | | $ | 422,786 | |
| | | | | | | | |
| | | | | | | 1,224,672 | |
| | | | | | | | |
Total Financials | | | | | | | 15,617,877 | |
| | | | | | | | |
Industrials - 0.06% | | | | | | | | |
Industrial Conglomerates - 0.06% | | | | | | | | |
General Electric Capital Corp., 5.50%, 1/8/2020 | | | 375,000 | | | | 428,773 | |
| | | | | | | | |
TOTAL CORPORATE BONDS
(Identified Cost $15,447,955) | | | | | | | 16,046,650 | |
| | | | | | | | |
| | |
U.S. TREASURY SECURITIES - 1.13% | | | | | | | | |
| | |
U.S. Treasury Notes - 1.13% | | | | | | | | |
U.S. Treasury Note, 3.125%, 10/31/2016 (Identified Cost $8,808,954) | | | 8,000,000 | | | | 8,850,624 | |
| | | | | | | | |
| | |
U.S. GOVERNMENT AGENCIES - 5.41% | | | | | | | | |
| | |
Other Agencies - 5.41% | | | | | | | | |
Fannie Mae, 1.25%, 1/30/2017 | | | 22,000,000 | | | | 22,268,774 | |
Fannie Mae, 6.25%, 5/15/2029 | | | 1,608,000 | | | | 2,235,319 | |
Fannie Mae, 7.25%, 5/15/2030 | | | 1,448,000 | | | | 2,231,233 | |
Fannie Mae, 6.625%, 11/15/2030 | | | 1,528,000 | | | | 2,231,028 | |
Freddie Mac, 5.25%, 4/18/2016 | | | 7,556,000 | | | | 8,877,356 | |
Freddie Mac, 6.75%, 3/15/2031 | | | 1,508,000 | | | | 2,231,694 | |
Freddie Mac, 6.25%, 7/15/2032 | | | 1,608,000 | | | | 2,300,413 | |
| | | | | | | | |
| | | | | | | | |
TOTAL U.S. GOVERNMENT AGENCIES
(Identified Cost $41,623,746) | | | | | | | 42,375,817 | |
| | | | | | | | |
| | | | | | | | |
SHORT-TERM INVESTMENTS - 0.75% | | | | | | | | |
Dreyfus Cash Management, Inc. - Institutional Shares6, 0.06%, (Identified Cost $5,888,812) | | | 5,888,812 | | | | 5,888,812 | |
| | | | | | | | |
| | | | | | | | |
TOTAL INVESTMENTS - 99.17%
(Identified Cost $721,957,391) | | | | | | | 776,752,942 | |
OTHER ASSETS, LESS LIABILITIES - 0.83% | | | | | | | 6,474,653 | |
| | | | | | | | |
NET ASSETS - 100% | | | | | | $ | 783,227,595 | |
| | | | | | | | |
The accompanying notes are an integral part of the financial statements.
125
Investment Portfolio - April 30, 2012
(unaudited)
ADR - American Depository Receipt
*Non-income producing security
1A factor from a third party vendor was applied to determine the security’s fair value following the close of local trading.
2Traded on Canadian exchange.
3Traded on Hong Kong exchange.
4Latest quoted sales price is not available and the latest quoted bid price was used to value the security.
5Restricted securities - Investment in securities that are restricted as to public resale under the Securities Act of 1933, as amended. These securities have been sold under rule 144A and have been determined to be liquid. These securities amount to $13,154,714, or 1.68%, of the Series’ net assets as of April 30, 2012.
6Rate shown is the current yield as of April 30, 2012.
126
Statement of Assets and Liabilities - Pro-Blend® Maximum Term Series
April 30, 2012 (unaudited)
| | | | |
ASSETS: | | | | |
| |
Investments, at value (identified cost $721,957,391) (Note 2) | | $ | 776,752,942 | |
Cash | | | 724,300 | |
Foreign currency (identified cost $116,654) | | | 114,908 | |
Receivable for securities sold | | | 11,278,475 | |
Dividends receivable | | | 876,866 | |
Receivable for fund shares sold | | | 649,571 | |
Foreign tax reclaims receivable | | | 585,383 | |
Interest receivable | | | 373,626 | |
| | | | |
| |
TOTAL ASSETS | | | 791,356,071 | |
| | | | |
| |
LIABILITIES: | | | | |
| |
Accrued management fees (Note 3) | | | 481,504 | |
Accrued shareholder services fees (Class S) (Note 3) | | | 103,538 | |
Accrued transfer agent fees (Note 3) | | | 58,635 | |
Accrued fund accounting and administration fees (Note 3) | | | 31,669 | |
Accrued distribution and service (Rule 12b-1) fees (Class C) (Class R)(Note 3) | | | 20,701 | |
Accrued directors’ fees (Note 3) | | | 3,647 | |
Accrued Chief Compliance Officer service fees (Note 3) | | | 415 | |
Payable for securities purchased | | | 4,300,890 | |
Payable for fund shares repurchased | | | 3,035,913 | |
Other payables and accrued expenses | | | 91,564 | |
| | | | |
| |
TOTAL LIABILITIES | | | 8,128,476 | |
| | | | |
| |
TOTAL NET ASSETS | | $ | 783,227,595 | |
| | | | |
| |
NET ASSETS CONSIST OF: | | | | |
| |
Capital stock | | $ | 560,954 | |
Additional paid-in-capital | | | 728,482,571 | |
Undistributed net investment income | | | 795,661 | |
Accumulated net realized loss on investments, foreign currency and translation of other assets and liabilities | | | (1,447,301 | ) |
Net unrealized appreciation on investments, foreign currency and translation of other assets and liabilities | | | 54,835,710 | |
| | | | |
| |
TOTAL NET ASSETS | | $ | 783,227,595 | |
| | | | |
The accompanying notes are an integral part of the financial statements.
127
Statement of Assets and Liabilities - Pro-Blend® Maximum Term Series
April 30, 2012 (unaudited)
| | | | |
| |
NET ASSET VALUE, OFFERING PRICE AND REDEMPTION PRICE PER SHARE - Class S
($496,539,072/29,704,991 shares) | | $ | 16.72 | |
| | | | |
| |
NET ASSET VALUE, OFFERING PRICE AND REDEMPTION PRICE PER SHARE - Class I
($255,035,459/23,658,778 shares) | | $ | 10.78 | |
| | | | |
| |
NET ASSET VALUE, OFFERING PRICE AND REDEMPTION PRICE PER SHARE - Class C
($20,794,637/1,853,843 shares) | | $ | 11.22 | |
| | | | |
| |
NET ASSET VALUE, OFFERING PRICE AND REDEMPTION PRICE PER SHARE - Class R
($10,858,427/877,760 shares) | | $ | 12.37 | |
| | | | |
The accompanying notes are an integral part of the financial statements.
128
Statement of Operations - Pro-Blend® Maximum Term Series
For the Six Months Ended April 30, 2012 (unaudited)
| | | | |
INVESTMENT INCOME: | | | | |
| |
Dividends (net of foreign taxes withheld, $262,702) | | $ | 4,926,567 | |
Interest | | | 671,325 | |
| | | | |
| |
Total Investment Income | | | 5,597,892 | |
| | | | |
| |
EXPENSES: | | | | |
| |
Management fees (Note 3) | | | 2,834,204 | |
Shareholder services fees (Class S) (Note 3) | | | 626,085 | |
Transfer agent fees (Note 3) | | | 104,054 | |
Fund accounting and administration fees (Note 3) | | | 68,128 | |
Distribution and service (Rule 12b-1) fees (Class C) (Note 3) | | | 93,984 | |
Distribution and service (Rule 12b-1) fees (Class R) (Note 3) | | | 20,965 | |
Directors’ fees (Note 3) | | | 10,821 | |
Chief Compliance Officer service fees (Note 3) | | | 1,246 | |
Custodian fees | | | 43,452 | |
Miscellaneous | | | 134,375 | |
| | | | |
| |
Total Expenses | | | 3,937,314 | |
| | | | |
| |
NET INVESTMENT INCOME | | | 1,660,578 | |
| | | | |
| |
REALIZED AND UNREALIZED GAIN (LOSS) ON INVESTMENTS AND FOREIGN CURRENCY: | | | | |
| |
Net realized gain (loss) on-
Investments | | | 16,700,575 | |
Foreign currency and translation of other assets and liabilities (net of Brazilian tax of $1,515) | | | 8,157 | |
| | | | |
| |
| | | 16,708,732 | |
| | | | |
| |
Net change in unrealized appreciation (depreciation) on-
Investments | | | 34,665,715 | |
Foreign currency and translation of other assets and liabilities | | | (37,464 | ) |
| | | | |
| |
| | | 34,628,251 | |
| | | | |
| |
NET REALIZED AND UNREALIZED GAIN (LOSS) ON INVESTMENTS AND FOREIGN CURRENCY | | | 51,336,983 | |
| | | | |
| |
NET INCREASE IN NET ASSETS RESULTING FROM OPERATIONS | | $ | 52,997,561 | |
| | | | |
The accompanying notes are an integral part of the financial statements.
129
Statements of Changes in Net Assets - Pro-Blend® Maximum Term Series
| | | | | | | | |
| | | FOR THE SIX
MONTHS ENDED
4/30/12
(UNAUDITED) | | | FOR THE YEAR ENDED
10/31/11 | |
INCREASE (DECREASE) IN NET ASSETS: | | | | | | | | |
| | |
OPERATIONS: | | | | | | | | |
| | |
Net investment income | | $ | 1,660,578 | | | $ | 5,050,643 | |
Net realized gain (loss) on investments and foreign currency (net of Brazilian tax of $1,515 and $61,928, respectively) | | | 16,708,732 | | | | 36,622,584 | |
Net change in unrealized appreciation (depreciation) on investments and foreign currency | | | 34,628,251 | | | | (37,022,155 | ) |
| | | | | | | | |
| | |
Net increase from operations | | | 52,997,561 | | | | 4,651,072 | |
| | | | | | | | |
| | |
DISTRIBUTIONS TO SHAREHOLDERS (Note 8): | | | | | | | | |
| | |
From net investment income (Class S) | | | (1,359,611 | ) | | | (2,786,497 | ) |
From net investment income (Class I) | | | (1,387,803 | ) | | | (2,324,919 | ) |
From net investment income (Class C) | | | (15,318 | ) | | | (42,076 | ) |
From net investment income (Class R) | | | (38,419 | ) | | | (2,032 | ) |
| | | | | | | | |
| | |
Total distributions to shareholders | | | (2,801,151 | ) | | | (5,155,524 | ) |
| | | | | | | | |
| | |
CAPITAL STOCK ISSUED AND REPURCHASED: | | | | | | | | |
| | |
Net increase (decrease) from capital share transactions (Note 5) | | | (11,300,017 | ) | | | 7,297,306 | |
| | | | | | | | |
| | |
Net increase in net assets | | | 38,896,393 | | | | 6,792,854 | |
| | |
NET ASSETS: | | | | | | | | |
| | |
Beginning of period | | | 744,331,202 | | | | 737,538,348 | |
| | | | | | | | |
| | |
End of period (including undistributed net investment income of $795,661 and $1,936,234, respectively) | | $ | 783,227,595 | | | $ | 744,331,202 | |
| | | | | | | | |
The accompanying notes are an integral part of the financial statements.
130
Financial Highlights - Pro-Blend® Maximum Term Series - Class S
| | | | | | | | | | | | | | | | | | | | | | | | |
| | | FOR THE SIX | | | FOR THE YEARS ENDED | |
| | | MONTHS ENDED
4/30/12
(UNAUDITED) | | | 10/31/11 | | | 10/31/10 | | | 10/31/09 | | | 10/31/08 | | | 10/31/07 | |
Per share data (for a share outstanding throughout each period): | | | | | | | | | | | | | | | | | | | | | | | | |
Net asset value - Beginning of period | | $ | 15.66 | | | $ | 15.59 | | | $ | 13.35 | | | $ | 11.50 | | | $ | 19.57 | | | $ | 18.35 | |
| | | | | | | | | | | | | | | | | | | | | | | | |
Income (loss) from investment operations: | | | | | | | | | | | | | | | | | | | | | | | | |
Net investment income | | | 0.03 | 1 | | | 0.10 | 1 | | | 0.08 | 1 | | | 0.06 | 1 | | | 0.12 | | | | 0.11 | |
Net realized and unrealized gain (loss) on investments | | | 1.07 | | | | 0.05 | | | | 2.21 | | | | 1.90 | | | | (6.22 | ) | | | 2.41 | |
| | | | | | | | | | | | | | | | | | | | | | | | |
| | | | | | |
Total from investment operations | | | 1.10 | | | | 0.15 | | | | 2.29 | | | | 1.96 | | | | (6.10 | ) | | | 2.52 | |
| | | | | | | | | | | | | | | | | | | | | | | | |
| | | | | | |
Less distributions to shareholders: | | | | | | | | | | | | | | | | | | | | | | | | |
From net investment income | | | (0.04 | ) | | | (0.08 | ) | | | (0.05 | ) | | | (0.11 | ) | | | (0.10 | ) | | | (0.15 | ) |
From net realized gain on investments | | | — | | | | — | | | | — | | | | — | | | | (1.87 | ) | | | (1.15 | ) |
| | | | | | | | | | | | | | | | | | | | | | | | |
| | | | | | |
Total distributions to shareholders | | | (0.04 | ) | | | (0.08 | ) | | | (0.05 | ) | | | (0.11 | ) | | | (1.97 | ) | | | (1.30 | ) |
| | | | | | | | | | | | | | | | | | | | | | | | |
| | | | | | |
Net asset value - End of period | | $ | 16.72 | | | $ | 15.66 | | | $ | 15.59 | | | $ | 13.35 | | | $ | 11.50 | | | $ | 19.57 | |
| | | | | | | | | | | | | | | | | | | | | | | | |
| | | | | | |
Net assets - End of period (000’s omitted) | | $ | 496,539 | | | $ | 512,215 | | | $ | 539,781 | | | $ | 443,770 | | | $ | 342,015 | | | $ | 517,766 | |
| | | | | | | | | | | | | | | | | | | | | | | | |
| | | | | | |
Total return2 | | | 7.08 | % | | | 0.94 | % | | | 17.17 | % | | | 17.34 | % | | | (34.19 | %) | | | 14.37 | % |
Ratios (to average net assets)/ | | | | | | | | | | | | | | | | | | | | | | | | |
Supplemental Data: | | | | | | | | | | | | | | | | | | | | | | | | |
Expenses* | | | 1.10 | %3 | | | 1.09 | % | | | 1.10 | % | | | 1.10 | % | | | 1.10 | % | | | 1.12 | % |
Net investment income | | | 0.38 | %3 | | | 0.59 | % | | | 0.54 | % | | | 0.55 | % | | | 0.77 | % | | | 0.67 | % |
Series portfolio turnover | | | 28 | % | | | 65 | % | | | 68 | % | | | 67 | % | | | 82 | % | | | 61 | % |
|
| * For certain periods presented, the investment advisor did not impose all or a portion of its management fees and/or other fees. If these expenses had been incurred by the Class, the expense ratio (to average net assets) would have increased by the following amount: | |
| | | | | | |
| | | N/A | | | | N/A | | | | 0.00 | %4 | | | 0.03 | % | | | 0.04 | % | | | N/A | |
1Calculated based on average shares outstanding during the period.
2Represents aggregate total return for the periods indicated, and assumes reinvestment of all distributions. Total return would have been lower had certain expenses not been waived or reimbursed during the periods. Periods less than one year are not annualized.
3Annualized.
4Less than 0.01%.
The accompanying notes are an integral part of the financial statements.
131
Financial Highlights - Pro-Blend® Maximum Term Series - Class I
| | | | | | | | | | | | | | | | | | | | |
| | | FOR THE SIX | | | FOR THE YEARS ENDED | | | | |
| | | MONTHS ENDED
4/30/12
(UNAUDITED) | | | 10/31/11 | | | 10/31/10 | | | 10/31/09 | | | FOR THE PERIOD 3/28/081 TO
10/31/08 | |
Per share data (for a share outstanding throughout each period): | | | | | | | | | | | | | | | | | | | | |
Net asset value - Beginning of period | | $ | 10.12 | | | $ | 10.12 | | | $ | 8.70 | | | $ | 7.57 | | | $ | 10.00 | |
| | | | | | | | | | | | | | | | | | | | |
Income (loss) from investment operations: | | | | | | | | | | | | | | | | | | | | |
Net investment income | | | 0.03 | 2 | | | 0.09 | 2 | | | 0.08 | 2 | | | 0.05 | 2 | | | 0.05 | |
Net realized and unrealized gain (loss) on investments | | | 0.70 | | | | 0.03 | | | | 1.43 | | | | 1.24 | | | | (2.44 | ) |
| | | | | | | | | | | | | | | | | | | | |
| | | | | |
Total from investment operations | | | 0.73 | | | | 0.12 | | | | 1.51 | | | | 1.29 | | | | (2.39 | ) |
| | | | | | | | | | | | | | | | | | | | |
| | | | | |
Less distributions to shareholders: | | | | | | | | | | | | | | | | | | | | |
From net investment income | | | (0.07 | ) | | | (0.12 | ) | | | (0.09 | ) | | | (0.16 | ) | | | (0.04 | ) |
| | | | | | | | | | | | | | | | | | | | |
| | | | | |
Net asset value - End of period | | $ | 10.78 | | | $ | 10.12 | | | $ | 10.12 | | | $ | 8.70 | | | $ | 7.57 | |
| | | | | | | | | | | | | | | | | | | | |
| | | | | |
Net assets - End of period (000’s omitted) | | $ | 255,035 | | | $ | 210,597 | | | $ | 190,344 | | | $ | 52,271 | | | $ | 2,597 | |
| | | | | | | | | | | | | | | | | | | | |
| | | | | |
Total return3 | | | 7.26 | % | | | 1.14 | % | | | 17.47 | % | | | 17.58 | % | | | (24.01 | %) |
Ratios (to average net assets)/ | | | | | | | | | | | | | | | | | | | | |
Supplemental Data: | | | | | | | | | | | | | | | | | | | | |
Expenses* | | | 0.85 | %4 | | | 0.84 | % | | | 0.85 | % | | | 0.85 | % | | | 0.85 | %4 |
Net investment income | | | 0.64 | %4 | | | 0.83 | % | | | 0.81 | % | | | 0.68 | % | | | 0.88 | %4 |
Series portfolio turnover | | | 28 | % | | | 65 | % | | | 68 | % | | | 67 | % | | | 82 | % |
|
| * For certain periods presented, the investment advisor did not impose all or a portion of its management fees and/or other fees. If these expenses had been incurred by the Class, the expense ratio (to average net assets) would have increased by the following amount: | |
| | | | | |
| | | N/A | | | | N/A | | | | 0.00 | %5 | | | 0.02 | % | | | 0.08 | %4 |
1Commencement of operations.
2Calculated based on average shares outstanding during the period.
3Represents aggregate total return for the periods indicated, and assumes reinvestment of all distributions. Total return would have been lower had certain expenses not been waived or reimbursed during the periods. Periods less than one year are not annualized.
4Annualized.
5Less than 0.01%.
The accompanying notes are an integral part of the financial statements.
132
Financial Highlights - Pro-Blend® Maximum Term Series - Class C
| | | | | | | | | | | | |
| | | FOR THE SIX
MONTHS ENDED
4/30/12
(UNAUDITED) | | | FOR THE
YEAR ENDED
10/31/11 | | | FOR THE PERIOD
1/4/101 TO
10/31/10 | |
Per share data (for a share outstanding throughout each period): | | | | | | | | | | | | |
Net asset value - Beginning of period | | $ | 10.52 | | | $ | 10.54 | | | $ | 10.00 | |
| | | | | | | | | | | | |
Income (loss) from investment operations: | | | | | | | | | | | | |
Net investment loss2 | | | (0.02 | ) | | | (0.02 | ) | | | (0.01 | ) |
Net realized and unrealized gain on investments | | | 0.73 | | | | 0.04 | | | | 0.58 | |
| | | | | | | | | | | | |
| | | |
Total from investment operations | | | 0.71 | | | | 0.02 | | | | 0.57 | |
| | | | | | | | | | | | |
| | | |
Less distributions to shareholders: | | | | | | | | | | | | |
From net investment income | | | (0.01 | ) | | | (0.04 | ) | | | (0.03 | ) |
| | | | | | | | | | | | |
| | | |
Net asset value - End of period | | $ | 11.22 | | | $ | 10.52 | | | $ | 10.54 | |
| | | | | | | | | | | | |
| | | |
Net assets - End of period (000’s omitted) | | $ | 20,795 | | | $ | 18,102 | | | $ | 7,383 | |
| | | | | | | | | | | | |
| | | |
Total return3 | | | 6.75 | % | | | 0.15 | % | | | 5.68 | % |
Ratios (to average net assets)/ | | | | | | | | | | | | |
Supplemental Data: | | | | | | | | | | | | |
Expenses* | | | 1.85 | %4 | | | 1.84 | % | | | 1.85 | %4 |
Net investment loss | | | (0.36 | %)4 | | | (0.15 | %) | | | (0.13 | %)4 |
Series portfolio turnover | | | 28 | % | | | 65 | % | | | 68 | % |
|
| * For certain periods presented, the investment advisor did not impose all or a portion of its management fees and/or other fees. If these expenses had been incurred by the Class, the expense ratio (to average net assets) would have increased by the following amount: | |
| | | |
| | | N/A | | | | N/A | | | | 0.01 | %4 |
1Commencement of operations.
2Calculated based on average shares outstanding during the period.
3Represents aggregate total return for the period indicated, and assumes reinvestment of all distributions. Total return would have been lower had certain expenses not been waived or reimbursed during the period. Periods less than one year are not annualized.
4Annualized.
The accompanying notes are an integral part of the financial statements.
133
Financial Highlights - Pro-Blend® Maximum Term Series - Class R
| | | | | | | | | | | | |
| | | FOR THE SIX
MONTHS ENDED
4/30/12
(UNAUDITED) | | | FOR THE
YEAR ENDED
10/31/11 | | | FOR THE PERIOD
6/30/101 TO
10/31/10 | |
Per share data (for a share outstanding throughout each period): | | | | | | | | | | | | |
Net asset value - Beginning of period | | $ | 11.63 | | | $ | 11.64 | | | $ | 10.00 | |
| | | | | | | | | | | | |
Income (loss) from investment operations: | | | | | | | | | | | | |
Net investment income (loss)2 | | | 0.01 | | | | 0.00 | 3 | | | (0.01 | ) |
Net realized and unrealized gain on investments | | | 0.78 | | | | 0.09 | | | | 1.65 | |
| | | | | | | | | | | | |
| | | |
Total from investment operations | | | 0.79 | | | | 0.09 | | | | 1.64 | |
| | | | | | | | | | | | |
| | | |
Less distributions to shareholders: | | | | | | | | | | | | |
From net investment income | | | (0.05 | ) | | | (0.10 | ) | | | — | |
| | | | | | | | | | | | |
| | | |
Net asset value - End of period | | $ | 12.37 | | | $ | 11.63 | | | $ | 11.64 | |
| | | | | | | | | | | | |
| | | |
Net assets - End of period (000’s omitted) | | $ | 10,858 | | | $ | 3,418 | | | $ | 31 | |
| | | | | | | | | | | | |
| | | |
Total return4 | | | 6.89 | % | | | 0.71 | % | | | 16.40 | % |
Ratios (to average net assets)/ | | | | | | | | | | | | |
Supplemental Data: | | | | | | | | | | | | |
Expenses | | | 1.35 | %5 | | | 1.34 | % | | | 1.35 | %5 |
Net investment income | | | 0.14 | %5 | | | 0.04 | % | | | (0.38 | %)5 |
Series portfolio turnover | | | 28 | % | | | 65 | % | | | 68 | % |
1Commencement of operations.
2Calculated based on average shares outstanding during the period.
3Less than $0.01.
4Represents aggregate total return for the period indicated, and assumes reinvestment of all distributions. Total return would have been lower had certain expenses not been waived or reimbursed during the period. Periods less than one year are not annualized.
5Annualized.
The accompanying notes are an integral part of the financial statements.
134
Notes to Financial Statements
Pro-Blend® Conservative Term Series, Pro-Blend® Moderate Term Series, Pro-Blend® Extended Term Series and Pro-Blend® Maximum Term Series (each the “Series”) are no-load diversified series of Manning & Napier Fund, Inc. (the “Fund”). The Fund is organized in Maryland and is registered under the Investment Company Act of 1940 (the “1940 Act”), as amended, as an open-end management investment company.
The Series are asset allocation funds. Each invests in a combination of stocks, bonds and cash and is managed according to specific goals. The goals are as follows: Pro-Blend® Conservative Term Series - primary goal is preservation of capital; secondary goal is long-term growth of capital. Pro-Blend® Moderate Term Series - equal emphasis on long-term growth of capital and preservation of capital. Pro-Blend® Extended Term Series - primary goal is long-term growth of capital; secondary goal is preservation of capital. Pro-Blend® Maximum Term Series - primary goal is long-term growth of capital.
Each Series is authorized to issue six classes of shares (Class C, R, E, I, S and Z). Currently, only Class S, I, C and R shares have been issued. Each class of shares is substantially the same, except that class-specific transfer agency distribution and shareholder servicing expenses are borne by the specific class of shares to which they relate.
The Fund’s Advisor is Manning & Napier Advisors, LLC (the “Advisor”). Shares of each Series are offered to investors and employees of the Advisor and its affiliates. The total authorized capital stock of the Fund consists of 15 billion shares of common stock each having a par value of $0.01. As of April 30, 2012, 9.8 billion shares have been designated in total among 41 series, of which 162.5 million have been designated as Pro-Blend® Conservative Term Series Class S common stock, 75 million have been designated as Pro-Blend® Conservative Term Series Class I common stock, 125 million each have been designated as Class S common stock and Class I common stock for Pro-Blend® Moderate Term Series, 125 million each have been designated as Class S common stock for Pro-Blend® Extended Term Series and Pro-Blend® Maximum Term Series, 200 million each have been designated as Class I common stock for Pro-Blend® Extended Term Series and Pro-Blend® Maximum Term Series, 25 million each have been designated as Class C common stock for Pro-Blend® Conservative Term Series, Pro-Blend® Moderate Term Series, Pro-Blend® Extended Term Series and Pro-Blend® Maximum Term Series and 52.5 million each have been designated as Class R common stock for Pro-Blend® Conservative Term Series, Pro-Blend® Moderate Term Series, Pro-Blend® Extended Term Series and Pro-Blend® Maximum Term Series.
| 2. | Significant Accounting Policies |
Security Valuation
Portfolio securities, including domestic equities, foreign equities, warrants and options, listed on an exchange other than the NASDAQ National Market System are valued at the latest quoted sales price of the exchange on which the security is primarily traded. Securities not traded on valuation date or securities not listed on an exchange are valued at the latest quoted bid price provided by the Fund’s pricing service. Securities listed on the NASDAQ National Market System are valued in accordance with the NASDAQ Official Closing Price.
Debt securities, including government bonds, foreign bonds, asset-backed securities, structured notes, supranational obligations, sovereign bonds, corporate bonds and mortgage-backed securities will normally be valued on the basis of evaluated bid prices provided directly by an independent pricing service. The pricing services use multiple valuation techniques to determine fair value. In instances where sufficient market activity exists, the pricing services may utilize a market-based approach through which quotes from market makers are used to determine fair value. In instances where sufficient market activity may not exist or is limited, the pricing services also utilize proprietary valuation models which may consider market characteristics such as a benchmark yield curves, option-adjusted spreads, credit spreads, estimated defaulted rates, coupon rates, anticipated timing of principal repayments, underlying collateral and other unique security features in order to estimate the relevant cash flows, which are then discounted to calculate the fair value. Certain investments in securities held by the Series may be valued on a basis of a price provided directly by a principal market maker. These prices may differ from the value that would have been used had a broader market for securities existed.
Short-term investments that mature in sixty days or less are valued at amortized cost, which approximates fair value. Investments in open-end investment companies are valued at their net asset value per share on valuation date.
135
Notes to Financial Statements (continued)
| 2. | Significant Accounting Policies (continued) |
Security Valuation (continued)
Volume and level of activity in established markets for an asset or liability are evaluated to determine whether recent transactions and quoted prices are determinative of fair value. Where there have been significant decreases in volume and level of activity, further analysis and adjustment may be necessary to estimate fair value. The Series measure fair value in these instances by the use of inputs and valuation techniques which may be based upon current market prices of securities that are comparable in coupon, rating, maturity and industry and/or expectation of future cash flows. As a result of trading in relatively thin markets and/or markets that experience significant volatility, the prices used by the Series to value these securities may differ from the value that would be realized if these securities were sold, and the differences could be material.
Securities for which representative valuations or prices are not available from the Series’ pricing service may be valued at fair value as determined in good faith by the Advisor under procedures approved by and under the general supervision and responsibility of the Fund’s Board of Directors (the “Board”). Due to the inherent uncertainty of valuations of such securities, the fair value may differ significantly from the values that would have been used had a ready market for such securities existed. If trading or events occurring after the close of the principal market in which securities are traded are expected to materially affect the value of those securities, then they may be valued at their fair value, taking this trading or these events into account. In accordance with the procedures approved by the Board, the values of certain securities trading outside the U.S. were adjusted following the close of local trading using a factor from a third party vendor. The third party vendor uses statistical analyses and quantitative models, which consider among other things subsequent movement and changes in the prices of indices, securities and exchange rates in other markets, to determine the factors which are used to adjust local market prices. The value of securities used for net asset value calculation under these procedures may differ from published prices for the same securities. It is the Fund’s policy to classify each foreign equity security where a factor from a third party vendor is provided as a Level 2 security.
Various inputs are used in determining the value of the Series’ assets or liabilities carried at fair value. These inputs are summarized in three broad levels. Level 1 includes quoted prices in active markets for identical assets and liabilities. Level 2 includes other significant observable inputs (including quoted prices for similar securities, interest rates, prepayment speeds, credit risk, etc.). Level 3 includes significant unobservable inputs (including the Series’ own assumptions in determining the fair value of investments). A financial instruments’ level with in the fair value hierarchy is based on the lowest level of any input both individually and in aggregate that is significant to their fair value measure. The inputs or methodology used for valuing securities are not necessarily an indication of the risk associated with investing in those securities.
The following is a summary of the valuation levels used for major security types as of April 30, 2012 in valuing the Series’ assets or liabilities carried at fair value:
| | | | | | | | | | | | | | | | |
| | | PRO-BLEND® CONSERVATIVE TERM SERIES | |
| DESCRIPTION | | TOTAL | | | LEVEL 1 | | | LEVEL 2 | | | LEVEL 3 | |
Assets: | | | | | | | | | | | | | | | | |
Equity Securities*: | | | | | | | | | | | | | | | | |
Consumer Discretionary | | $ | 51,454,080 | | | $ | 47,750,647 | | | $ | 3,703,433 | | | $ | — | |
Consumer Staples | | | 30,041,073 | | | | 18,639,534 | | | | 11,401,539 | | | | — | |
Energy | | | 26,224,486 | | | | 25,783,547 | | | | 440,939 | | | | — | |
Financials | | | 39,460,992 | | | | 35,656,472 | | | | 3,804,520 | | | | — | |
Health Care | | | 34,630,785 | | | | 30,925,930 | | | | 3,704,855 | | | | — | |
Industrials | | | 18,216,683 | | | | 15,092,374 | | | | 3,124,309 | | | | — | |
Information Technology | | | 64,815,609 | | | | 59,154,568 | | | | 5,661,041 | | | | — | |
Materials | | | 17,940,638 | | | | 13,895,379 | | | | 4,045,259 | | | | — | |
Telecommunication Services | | | 5,666,763 | | | | 435,551 | | | | 5,231,212 | | | | — | |
Utilities | | | 342,239 | | | | 137,266 | | | | 204,973 | | | | — | |
Preferred Securities: | | | | | | | | | | | | | | | | |
Financials | | | 2,946,455 | | | | 1,098,271 | | | | 1,848,184 | | | | — | |
136
Notes to Financial Statements (continued)
| 2. | Significant Accounting Policies (continued) |
Security Valuation (continued)
| | | | | | | | | | | | | | | | |
| | | PRO-BLEND® CONSERVATIVE TERM SERIES | | | | |
| DESCRIPTION | | TOTAL | | | LEVEL 1 | | | LEVEL 2 | | | LEVEL 3 | |
Debt securities: | | | | | | | | | | | | | | | | |
U.S. Treasury and other U.S. Government agencies | | $ | 497,335,135 | | | $ | — | | | $ | 497,335,135 | | | $ | — | |
Corporate Debt: | | | | | | | | | | | | | | | | |
Consumer Discretionary | | | 56,302,867 | | | | — | | | | 56,302,867 | | | | — | |
Consumer Staples | | | 8,135,599 | | | | — | | | | 8,135,599 | | | | — | |
Energy | | | 21,248,908 | | | | — | | | | 21,248,908 | | | | — | |
Financials | | | 165,902,169 | | | | — | | | | 165,902,169 | | | | — | |
Health Care | | | 12,465,332 | | | | — | | | | 12,465,332 | | | | — | |
Industrials | | | 33,926,574 | | | | — | | | | 33,926,574 | | | | — | |
Information Technology | | | 6,664,506 | | | | — | | | | 6,664,506 | | | | — | |
Materials | | | 21,950,943 | | | | — | | | | 21,950,943 | | | | — | |
Telecommunication Services | | | 5,404,958 | | | | — | | | | 5,404,958 | | | | — | |
Utilities | | | 6,526,074 | | | | — | | | | 6,526,074 | | | | — | |
Convertible corporate debt: | | | | | | | | | | | | | | | | |
Financials | | | 495,075 | | | | — | | | | 495,075 | | | | — | |
Health Care | | | 174,600 | | | | — | | | | 174,600 | | | | — | |
Information Technology | | | 71,100 | | | | — | | | | 71,100 | | | | — | |
Materials | | | 351,450 | | | | — | | | | 351,450 | | | | — | |
Asset-backed securities | | | 4,719,697 | | | | — | | | | 4,719,697 | | | | — | |
Commercial mortgage-backed securities | | | 24,407,799 | | | | — | | | | 24,407,799 | | | | — | |
Foreign government bonds | | | 40,581,316 | | | | — | | | | 40,581,316 | | | | — | |
Mutual funds | | | 57,171,537 | | | | 57,171,537 | | | | — | | | | — | |
| | | | | | | | | | | | | | | | |
Total assets | | $ | 1,255,575,442 | | | $ | 305,741,076 | | | $ | 949,834,366 | | | $ | — | |
| | | | | | | | | | | | | | | | |
| | | | | | | | | | | | | | | | |
| | | PRO-BLEND® MODERATE TERM SERIES | | | | |
| DESCRIPTION | | TOTAL | | | LEVEL 1 | | | LEVEL 2 | | | LEVEL 3 | |
Assets: | | | | | | | | | | | | | | | | |
Equity Securities*: | | | | | | | | | | | | | | | | |
Consumer Discretionary | | $ | 98,611,403 | | | $ | 91,144,794 | | | $ | 7,466,609 | | | $ | — | |
Consumer Staples | | | 60,447,106 | | | | 34,856,479 | | | | 25,590,627 | | | | — | |
Energy | | | 50,065,979 | | | | 49,152,149 | | | | 913,830 | | | | — | |
Financials | | | 71,775,241 | | | | 63,020,296 | | | | 8,754,945 | | | | — | |
Health Care | | | 69,681,607 | | | | 61,162,863 | | �� | | 8,518,744 | | | | — | |
Industrials | | | 37,010,656 | | | | 30,437,906 | | | | 6,572,750 | | | | — | |
Information Technology | | | 127,031,762 | | | | 114,766,751 | | | | 12,265,011 | | | | — | |
Materials | | | 34,049,530 | | | | 26,126,674 | | | | 7,922,856 | | | | — | |
Telecommunication Services | | | 12,366,886 | | | | 1,201,189 | | | | 11,165,697 | | | | — | |
Utilities | | | 948,408 | | | | 312,244 | | | | 636,164 | | | | — | |
Preferred Securities: | | | | | | | | | | | | | | | | |
Financials | | | 4,414,895 | | | | 2,121,267 | | | | 2,293,628 | | | | — | |
Debt securities: | | | | | | | | | | | | | | | | |
U.S. Treasury and other U.S. Government agencies | | | 286,644,791 | | | | — | | | | 286,644,791 | | | | — | |
Corporate Debt: | | | | | | | | | | | | | | | | |
Consumer Discretionary | | | 33,194,194 | | | | — | | | | 33,194,194 | | | | — | |
137
Notes to Financial Statements (continued)
| 2. | Significant Accounting Policies (continued) |
Security Valuation (continued)
| | | | | | | | | | | | | | | | |
| | | PRO-BLEND® MODERATE TERM SERIES | | | | |
| DESCRIPTION | | TOTAL | | | LEVEL 1 | | | LEVEL 2 | | | LEVEL 3 | |
Consumer Staples | | $ | 3,292,691 | | | $ | — | | | $ | 3,292,691 | | | $ | — | |
Energy | | | 18,258,760 | | | | — | | | | 18,258,760 | | | | — | |
Financials | | | 145,552,244 | | | | — | | | | 145,552,244 | | | | — | |
Health Care | | | 15,984,157 | | | | — | | | | 15,984,157 | | | | — | |
Industrials | | | 35,678,708 | | | | — | | | | 35,678,708 | | | | — | |
Information Technology | | | 8,660,146 | | | | — | | | | 8,660,146 | | | | — | |
Materials | | | 24,954,859 | | | | — | | | | 24,954,859 | | | | — | |
Telecommunication Services | | | 10,820,403 | | | | — | | | | 10,820,403 | | | | — | |
Utilities | | | 2,802,997 | | | | — | | | | 2,802,997 | | | | — | |
Convertible corporate debt: | | | | | | | | | | | | | | | | |
Financials | | | 996,187 | | | | — | | | | 996,187 | | | | — | |
Health Care | | | 410,662 | | | | — | | | | 410,662 | | | | — | |
Information Technology | | | 382,163 | | | | — | | | | 382,163 | | | | — | |
Materials | | | 639,444 | | | | — | | | | 639,444 | | | | — | |
Asset-backed securities | | | 2,842,382 | | | | — | | | | 2,842,382 | | | | — | |
Commercial mortgage-backed securities | | | 24,664,892 | | | | — | | | | 24,664,892 | | | | — | |
Foreign government bonds | | | 31,946,669 | | | | — | | | | 31,946,669 | | | | — | |
Mutual funds | | | 49,871,387 | | | | 49,871,387 | | | | — | | | | — | |
| | | | | | | | | | | | | | | | |
Total assets | | $ | 1,264,001,209 | | | $ | 524,173,999 | | | $ | 739,827,210 | | | $ | — | |
| | | | | | | | | | | | | | | | |
| | | | | | | | | | | | | | | | |
| | | PRO-BLEND® EXTENDED TERM SERIES | | | | |
| DESCRIPTION | | TOTAL | | | LEVEL 1 | | | LEVEL 2 | | | LEVEL 3 | |
Assets: | | | | | | | | | | | | | | | | |
Equity Securities*: | | | | | | | | | | | | | | | | |
Consumer Discretionary | | $ | 128,663,661 | | | $ | 118,989,208 | | | $ | 9,674,453 | | | $ | — | |
Consumer Staples | | | 82,404,169 | | | | 47,840,459 | | | | 34,563,710 | | | | — | |
Energy | | | 59,499,036 | | | | 58,271,414 | | | | 1,227,622 | | | | — | |
Financials | | | 87,866,641 | | | | 76,832,245 | | | | 11,034,396 | | | | — | |
Health Care | | | 83,231,086 | | | | 72,566,305 | | | | 10,664,781 | | | | — | |
Industrials | | | 50,007,429 | | | | 40,897,896 | | | | 9,109,533 | | | | — | |
Information Technology | | | 166,601,787 | | | | 151,263,937 | | | | 15,337,850 | | | | — | |
Materials | | | 44,799,283 | | | | 35,157,687 | | | | 9,641,596 | | | | — | |
Telecommunication Services | | | 16,837,225 | | | | 1,616,939 | | | | 15,220,286 | | | | — | |
Utilities | | | 1,186,479 | | | | 445,762 | | | | 740,717 | | | | — | |
Preferred Securities: | | | | | | | | | | | | | | | | |
Financials | | | 4,657,898 | | | | 2,192,495 | | | | 2,465,403 | | | | — | |
Debt securities: | | | | | | | | | | | | | | | | |
U.S. Treasury and other U.S. Government agencies | | | 190,719,680 | | | | — | | | | 190,719,680 | | | | — | |
Corporate Debt: | | | | | | | | | | | | | | | | |
Consumer Discretionary | | | 26,676,962 | | | | — | | | | 26,676,962 | | | | — | |
Consumer Staples | | | 3,193,997 | | | | — | | | | 3,193,997 | | | | — | |
Energy | | | 13,555,587 | | | | — | | | | 13,555,587 | | | | — | |
Financials | | | 116,110,957 | | | | — | | | | 116,110,957 | | | | — | |
Health Care | | | 11,467,242 | | | | — | | | | 11,467,242 | | | | — | |
Industrials | | | 29,237,977 | | | | — | | | | 29,237,977 | | | | — | |
138
Notes to Financial Statements (continued)
| 2. | Significant Accounting Policies (continued) |
Security Valuation (continued)
| | | | | | | | | | | | | | | | |
| | | PRO-BLEND® EXTENDED TERM SERIES | | | | |
| DESCRIPTION | | TOTAL | | | LEVEL 1 | | | LEVEL 2 | | | LEVEL 3 | |
Information Technology | | $ | 6,993,321 | | | $ | — | | | $ | 6,993,321 | | | $ | — | |
Materials | | | 17,500,246 | | | | — | | | | 17,500,246 | | | | — | |
Telecommunication Services | | | 10,675,993 | | | | — | | | | 10,675,993 | | | | — | |
Utilities | | | 3,981,830 | | | | — | | | | 3,981,830 | | | | — | |
Convertible corporate debt: | | | | | | | | | | | | | | | | |
Financials | | | 1,026,375 | | | | — | | | | 1,026,375 | | | | — | |
Health Care | | | 460,975 | | | | — | | | | 460,975 | | | | — | |
Information Technology | | | 595,463 | | | | — | | | | 595,463 | | | | — | |
Materials | | | 644,325 | | | | — | | | | 644,325 | | | | — | |
Asset-backed securities | | | 3,089,458 | | | | — | | | | 3,089,458 | | | | — | |
Commercial mortgage-backed securities | | | 25,708,547 | | | | — | | | | 25,708,547 | | | | — | |
Foreign government bonds | | | 23,470,456 | | | | — | | | | 23,470,456 | | | | — | |
Mutual funds | | | 48,721,167 | | | | 48,721,167 | | | | — | | | | — | |
| | | | | | | | | | | | | | | | |
Total assets | | $ | 1,259,585,252 | | | $ | 654,795,514 | | | $ | 604,789,738 | | | $ | — | |
| | | | | | | | | | | | | | | | |
| | | | | | | | | | | | | | | | |
| | | PRO-BLEND® MAXIMUM TERM SERIES | | | | |
| DESCRIPTION | | TOTAL | | | LEVEL 1 | | | LEVEL 2 | | | LEVEL 3 | |
Assets: | | | | | | | | | | | | | | | | |
Equity Securities*: | | | | | | | | | | | | | | | | |
Consumer Discretionary | | $ | 135,370,729 | | | $ | 124,691,788 | | | $ | 10,678,941 | | | $ | — | |
Consumer Staples | | | 59,244,787 | | | | 26,664,332 | | | | 32,580,455 | | | | — | |
Energy | | | 66,308,843 | | | | 65,368,345 | | | | 940,498 | | | | — | |
Financials | | | 89,321,383 | | | | 66,301,406 | | | | 23,019,977 | | | | — | |
Health Care | | | 93,812,053 | | | | 86,120,572 | | | | 7,691,481 | | | | — | |
Industrials | | | 68,865,503 | | | | 62,666,563 | | | | 6,198,940 | | | | — | |
Information Technology | | | 142,995,946 | | | | 131,713,816 | | | | 11,282,130 | | | | — | |
Materials | | | 33,552,222 | | | | 25,339,016 | | | | 8,213,206 | | | | — | |
Telecommunication Services | | | 13,078,477 | | | | 1,300,255 | | | | 11,778,222 | | | | — | |
Utilities | | | 1,041,096 | | | | 363,309 | | | | 677,787 | | | | — | |
Debt securities: | | | | | | | | | | | | | | | | |
U.S. Treasury and other U.S. Government agencies | | | 51,226,441 | | | | — | | | | 51,226,441 | | | | — | |
Corporate Debt: | | | | | | | | | | | | | | | | |
Financials | | | 15,617,877 | | | | — | | | | 15,617,877 | | | | — | |
Industrials | | | 428,773 | | | | — | | | | 428,773 | | | | — | |
Mutual funds | | | 5,888,812 | | | | 5,888,812 | | | | — | | | | — | |
| | | | | | | | | | | | | | | | |
Total assets | | $ | 776,752,942 | | | $ | 596,418,214 | | | $ | 180,334,728 | | | $ | — | |
| | | | | | | | | | | | | | | | |
There were no Level 3 securities held by any of the Pro-Blend® Series as of October 31, 2011 or April 30, 2012.
*Includes common stock, warrants and rights. Please see the Investment Portfolio for each of the Series for foreign securities where a factor from a third party vendor was applied to determine the securities’ fair value following the close of local trading. Such securities are included in Level 2 in the table above.
The Fund’s policy is to recognize transfers in and transfers out of the valuation levels as of the beginning of the reporting period. There were no transfers between Level 1 and Level 2 during the six months ended April 30, 2012.
139
Notes to Financial Statements (continued)
| 2. | Significant Accounting Policies (continued) |
Recent Accounting Standard
In May 2011, the Financial Accounting Standards Board (“FASB”) issued Accounting Standards Update No. 2011-04, “Fair Value Measurements (Topic 820) - Amendments to Achieve Common Fair Value Measurement and Disclosure Requirements in U.S. GAAP and IFRSs” (“ASU 2011-04”). ASU 2011-04 clarifies the application of existing fair value measurement requirements, changes certain principles related to measuring fair value, and requires additional disclosures about fair value measurements.
Required disclosures are expanded under the new guidance, especially for fair value measurements that are categorized within Level 3 of the fair value hierarchy, for which quantitative information about the unobservable inputs used, and a narrative description of the valuation processes in place and sensitivity of recurring Level 3 measurements to changes in unobservable inputs will be required.
ASU 2011-04 is effective for interim and annual periods beginning after December 15, 2011 and is to be applied prospectively. Management is currently assessing the impact of this guidance, but does not expect it to have a material impact on the Series’ financial statements.
Security Transactions, Investment Income and Expenses
Security transactions are accounted for on trade date. Dividend income is recorded on the ex-dividend date, except that if the ex-dividend date has passed, certain dividends from foreign securities are recorded as soon as the Series is informed of the ex-dividend date. Non-cash dividends, if any, are recorded at the fair value of the securities received. Interest income, including amortization of premium and accretion of discounts using the effective interest method, is earned from settlement date and accrued daily.
Expenses are recorded on an accrual basis. Most expenses of the Fund can be attributed to a specific series. Expenses which cannot be directly attributed are apportioned among the series in the Fund in such a manner as deemed equitable by the Fund’s Board, taking into consideration, among other things, the nature and type of expense.
Income, expenses (other than class specific expenses), and realized and unrealized gains and losses are prorated among the classes based on the relative net assets of each class. Class specific expenses are directly charged to that Class.
The Series use the identified cost method for determining realized gain or loss on investments for both financial statement and federal income tax reporting purposes.
Foreign Currency Translation
The books and records of the Series are maintained in U.S. dollars. Foreign currencies, investments and other assets and liabilities are translated into U.S. dollars at the current exchange rates. Purchases and sales of investment securities and income and expenses are translated on the respective dates of such transactions. The Series do not isolate realized and unrealized gains and losses attributable to changes in the exchange rates from gains and losses that arise from changes in the fair value of investments. Such fluctuations are included with net realized and unrealized gain or loss on investments. Net realized foreign currency gains and losses represent foreign currency gains and losses between trade date and settlement date on securities transactions, gains and losses on disposition of foreign currencies and the difference between the amount of income and foreign withholding taxes recorded on the books of the Series and the amounts actually received or paid.
Forward Foreign Currency Exchange Contracts
The Series may purchase or sell forward foreign currency exchange contracts in order to hedge a portfolio position or specific transaction. Risks may arise if the counterparties to a contract are unable to meet the terms of the contract or if the value of the foreign currency moves unfavorably.
All forward foreign currency exchange contracts are adjusted daily by the exchange rate of the underlying currency and, for financial statement purposes, any gain or loss is recorded as unrealized gain or loss until a contract has been closed. Realized and unrealized gain or loss arising from a transaction is included in net realized and unrealized gain (loss) on investments.
140
Notes to Financial Statements (continued)
| 2. | Significant Accounting Policies (continued) |
Forward Foreign Currency Exchange Contracts (continued)
Each Series may regularly trade forward foreign currency exchange contracts with off-balance sheet risk in the normal course of its investing activities to assist in managing exposure to changes in foreign currency exchange rates.
The notional or contractual amount of these instruments represents the investment the Series have in forward foreign currency exchange contracts and does not necessarily represent the amounts potentially at risk. The measurement of the risks associated with forward foreign currency exchange contracts is meaningful only when all related and offsetting transactions are considered. Investments in forward foreign currency exchange contacts held by each Series, if any, on April 30, 2012 are shown at the end of each Investment Portfolio. The average volume of derivative activity (measured in terms of notional amounts) during the six months ended April 30, 2012 was $61,226, $157,899 and $154,676 for Pro-Blend® Conservative Term Series, Pro-Blend® Moderate Term Series and Pro-Blend® Extended Term Series, respectively.
Securities Purchased on a When-Issued Basis or Forward Commitment
Each Series may purchase securities on a when-issued basis or forward commitment. These transactions involve a commitment by the Series to purchase securities for a predetermined price with payment and delivery taking place beyond the customary settlement period. When such purchases are outstanding, the Series will designate liquid assets in an amount sufficient to meet the purchase price. When purchasing a security on a delayed delivery basis, the Series assumes the rights and risks of ownership of the security, including the risk of price and yield fluctuations, and takes such fluctuations into account when determining its net asset value. The Series may sell the when-issued securities before they are delivered, which may result in a capital gain or loss.
In connection with its ability to purchase or sell securities on a forward commitment basis, the Series may enter into forward roll transactions principally using To Be Announced (TBA) securities. Forward roll transactions require the sale of securities for delivery in the current month, and a simultaneous agreement to repurchase substantially similar (same type, coupon and maturity) securities on a specified future date. Risks of entering into forward roll transactions include the potential inability of the counterparty to meet the terms of the agreement; the potential of the Series to receive inferior securities at redelivery as compared to the securities sold to the counterparty; counterparty credit risk; and the potential pay down speed variance between the mortgage-backed pools. During the roll period, the Series forgoes principal and interest paid on the securities. The Series account for such dollar rolls as purchases and sales. Information regarding securities purchased on a when-issued basis is included in each applicable Series’ Investment Portfolio. None of the Series had TBA dollar rolls outstanding as of April 30, 2012.
Restricted Securities
Restricted securities are purchased in private placement transactions, are not registered under the Securities Act of 1933, as amended, and may have contractual restrictions on resale. Information regarding restricted securities is included at the end of each applicable Series’ Investment Portfolio.
Federal Taxes
Each Series’ policy is to comply with the provisions of the Internal Revenue Code applicable to regulated investment companies. The Series are not subject to federal income tax or excise tax to the extent that each Series distributes to shareholders each year its taxable income, including any net realized gains on investments, in accordance with requirements of the Internal Revenue Code. Accordingly, no provision for federal income tax or excise tax has been made in the financial statements.
Management evaluates its tax positions to determine if the tax positions taken meet the minimum recognition threshold in connection with accounting for uncertainties in income tax positions taken or expected to be taken for the purposes of measuring and recognizing tax liabilities in the financial statements. Recognition of tax benefits of an uncertain tax position is required only when the position is “more likely than not” to be sustained assuming examination by taxing authorities. At April 30, 2012, the Series have recorded no liability for net unrecognized tax benefits relating to uncertain income tax positions taken or expected to be taken in future tax returns.
141
Notes to Financial Statements (continued)
| 2. | Significant Accounting Policies (continued) |
Federal Taxes (continued)
The Series file income tax returns in the U.S. federal jurisdiction, various states and foreign jurisdictions, as required. No income tax returns are currently under investigation. The statute of limitations on the Series’ tax returns remains open for the years ended October 31, 2008 through October 31, 2011. The Fund is not aware of any tax positions for which it is reasonably possible that the total amounts of unrecognized tax benefits will significantly change in the next twelve months.
Foreign Taxes
Based on the Series’ understanding of the tax rules and rates related to income, gains and currency purchase/repatriation transactions for foreign jurisdictions in which it invests, the Series will provide for foreign taxes, and where appropriate, deferred foreign tax.
Distributions of Income and Gains
Distributions to shareholders of net investment income are made semi-annually. Distributions of net realized gains are made annually. An additional distribution may be necessary to avoid taxation of a Series. Distributions are recorded on the ex-dividend date.
Indemnifications
The Fund’s organizational documents provide former and current directors and officers with a limited indemnification against liabilities arising in connection with the performance of their duties to the Fund. In the normal course of business, the Fund may also enter into contracts that provide general indemnifications. The Fund’s maximum exposure under these arrangements is unknown as this would be dependent on future claims that may be made against the Fund. The risk of material loss from such claims is considered remote.
Other
The preparation of financial statements in conformity with accounting principles generally accepted in the United States of America requires management to make estimates and assumptions that affect the reported amounts of assets and liabilities and the disclosure of contingent assets and liabilities at the date of the financial statements and the reported amounts of income and expenses during the reporting period. Actual results could differ from those estimates.
| 3. | Transactions with Affiliates |
The Fund has an Investment Advisory Agreement (the “Agreement”) with the Advisor, for which each Series pays a fee, computed daily and payable monthly, at an annual rate of 0.60% for Pro-Blend® Conservative Term Series and 0.75% for Pro-Blend® Moderate Term Series, Pro-Blend® Extended Term Series and Pro-Blend® Maximum Term Series, of the Series’ average daily net assets.
Under the Agreement, personnel of the Advisor provide the Series with advice and assistance in the choice of investments and the execution of securities transactions, and otherwise maintain the Series’ organization. The Advisor also provides the Fund with necessary office space and fund administration and support services. The salaries of all officers of the Fund (except a percentage of the Fund’s Chief Compliance Officer’s salary, which is paid by the Fund), and of all Directors who are “affiliated persons” of the Fund, or of the Advisor, and all personnel of the Fund, or of the Advisor, performing services relating to research, statistical and investment activities, are paid by the Advisor. Each “non-affiliated” Director receives an annual stipend, which is allocated among all the active series of the Fund. In addition, these Directors also receive a fee per Board meeting attended plus a fee for each committee meeting attended.
Class S shares of each Series are subject to a shareholder services fee in accordance with a shareholder services plan adopted by the Fund’s Board. The shareholder services fee is intended to compensate financial intermediaries, including affiliates of the Fund, in connection with the provision of direct client service, personal services, maintenance of shareholder accounts and reporting services. For these services, Class S of each Series pays a fee, computed daily and payable monthly, at an annual rate of 0.20% for Pro-Blend® Conservative Term Series Class S and 0.25% for Pro-Blend® Moderate Term Series Class S, Pro-Blend® Extended Term Series Class S and Pro-Blend® Maximum Term Series Class S, of the Class’ average daily
142
Notes to Financial Statements (continued)
| 3. | Transactions with Affiliates (continued) |
net assets. The Fund has a Shareholder Services Agreement with the Advisor, for which the Advisor receives the shareholder services fee as stated above.
The Advisor has contractually agreed, until at least February 28, 2013, to waive its fee and, if necessary, pay other operating expenses of the Series in order to maintain total direct annual fund operating expenses for the Series at no more than the amounts presented in the following table, exclusive of shareholder services fees and distribution and service fees (12b-1), of average daily net assets each year. In addition, the Advisor has voluntarily agreed to waive fees and reimburse expenses during the current fiscal year in order to keep total direct annual fund operating expenses for the Series at no more than the amounts presented in the following table, inclusive of shareholder services fees and distribution and service fees (12b-1), of average daily net assets each year.
| | | | |
| SERIES/CLASS | | EXPENSE LIMIT | | VOLUNTARY EXPENSE LIMITATION |
Pro-Blend® Conservative Term Series Class S | | 0.80% | | 0.90% |
Pro-Blend® Conservative Term Series Class I | | 0.70% | | — |
Pro-Blend® Conservative Term Series Class C | | 0.80% | | 1.70% |
Pro-Blend® Conservative Term Series Class R | | 0.80% | | 1.20% |
Pro-Blend® Moderate Term Series Class S | | 0.95% | | 1.10% |
Pro-Blend® Moderate Term Series Class I | | 0.85% | | — |
Pro-Blend® Moderate Term Series Class C | | 0.95% | | 1.85% |
Pro-Blend® Moderate Term Series Class R | | 0.95% | | 1.35% |
Pro-Blend® Extended Term Series Class S | | 0.95% | | 1.10% |
Pro-Blend® Extended Term Series Class I | | 0.85% | | — |
Pro-Blend® Extended Term Series Class C | | 0.95% | | 1.85% |
Pro-Blend® Extended Term Series Class R | | 0.95% | | 1.35% |
Pro-Blend® Maximum Term Series Class S | | 0.95% | | 1.10% |
Pro-Blend® Maximum Term Series Class I | | 0.85% | | — |
Pro-Blend® Maximum Term Series Class C | | 0.95% | | 1.85% |
Pro-Blend® Maximum Term Series Class R | | 0.95% | | 1.35% |
The Advisor may change or eliminate all or part of its voluntary waiver at any time. For the six months ended April 30, 2012, the Advisor did not waive fees or reimburse expenses for any of the Series.
The Advisor is not eligible to recoup any expenses that have been waived or reimbursed in prior years.
Manning & Napier Investor Services, Inc., a registered broker-dealer affiliate of the Advisor, acts as distributor for the Fund’s shares. Each Series compensates the distributor for distributing and servicing the Series’ Class C and Class R shares pursuant to a distribution plan adopted under Rule 12b-1 of the 1940 Act, regardless of expenses actually incurred. Under the agreement, each Series pays distribution and services fees to the distributor at an annual rate of 1.00% of average daily net assets attributable to Class C shares and an annual rate of 0.50% of daily net assets attributable to Class R shares. There are no distribution and services fees on the Class S or Class I shares of each Series. The fees are accrued daily and paid monthly.
The Advisor has agreements with BNY Mellon Investment Servicing (U.S.) Inc. (“BNY”) under which BNY serves as sub-accountant services agent and sub-transfer agent. The Fund pays the Advisor an annual fee related to fund accounting and administration of 0.0175% on the first $3 billion of average daily net assets (excluding Target Series); 0.015% on the next $3 billion of average daily net assets (excluding Target Series); and 0.01% of the average daily net assets in excess of $6 billion (excluding Target Series); plus a base fee of $25,500 per series. Transfer Agent fees are charged to the Fund on a per account basis. Additionally, certain transaction and cusip-based fees and out-of-pocket expenses, including charges for reporting relating to the Fund’s compliance program, are charged.
Expenses not directly attributable to a series are allocated based on each series’ relative net assets or number of accounts, depending on the expense.
143
Notes to Financial Statements (continued)
| 4. | Purchases and Sales of Securities |
For the six months ended April 30, 2012, purchases and sales of securities, other than short-term securities, were as follows:
| | | | | | | | | | | | | | | | |
| | | PURCHASES | | | | | | SALES | | | | |
| SERIES | | OTHER
ISSUERS | | | GOVERNMENT | | | OTHER
ISSUERS | | | GOVERNMENT | |
Pro-Blend® Conservative Term Series | | $ | 179,102,517 | | | $ | 185,738,905 | | | $ | 135,782,893 | | | $ | 86,089,242 | |
Pro-Blend® Moderate Term Series | | | 237,220,636 | | | | 144,807,777 | | | | 233,065,210 | | | | 34,328,014 | |
Pro-Blend® Extended Term Series | | | 255,052,573 | | | | 134,683,234 | | | | 214,462,072 | | | | 77,398,478 | |
Pro-Blend® Maximum Term Series | | | 175,579,679 | | | | 44,501,580 | | | | 178,499,866 | | | | 27,393,125 | |
| 5. | Capital Stock Transactions |
Transactions in Class S, Class I, Class C and Class R shares:
| | | | | | | | | | | | | | | | |
PRO-BLEND® CONSERVATIVE TERM SERIES CLASS S: | | FOR THE SIX MONTHS ENDED 4/30/12 | | | FOR THE YEAR ENDED 10/31/11 | |
| | | SHARES | | | AMOUNT | | | SHARES | | | AMOUNT | |
Sold | | | 16,719,091 | | | $ | 218,365,373 | | | | 41,128,782 | | | $ | 538,739,989 | |
Reinvested | | | 1,849,804 | | | | 23,363,027 | | | | 2,348,318 | | | | 29,945,209 | |
Repurchased | | | (12,758,174 | ) | | | (166,986,117 | ) | | | (28,447,470 | ) | | | (372,362,380 | ) |
| | | | | | | | | | | | | | | | |
Total | | | 5,810,721 | | | $ | 74,742,283 | | | | 15,029,630 | | | $ | 196,322,818 | |
| | | | | | | | | | | | | | | | |
| | | | | | | | | | | | | | | | |
PRO-BLEND® CONSERVATIVE TERM SERIES CLASS I: | | FOR THE SIX MONTHS ENDED 4/30/12 | | | FOR THE YEAR ENDED 10/31/11 | |
| | | SHARES | | | AMOUNT | | | SHARES | | | AMOUNT | |
Sold | | | 6,952,280 | | | $ | 73,214,021 | | | | 6,621,598 | | | $ | 70,534,777 | |
Reinvested | | | 377,703 | | | | 3,863,900 | | | | 464,786 | | | | 4,845,089 | |
Repurchased | | | (3,728,694 | ) | | | (39,428,958 | ) | | | (2,853,614 | ) | | | (30,612,336 | ) |
| | | | | | | | | | | | | | | | |
Total | | | 3,601,289 | | | $ | 37,648,963 | | | | 4,232,770 | | | $ | 44,767,530 | |
| | | | | | | | | | | | | | | | |
| | | | | | | | | | | | | | | | |
PRO-BLEND® CONSERVATIVE TERM SERIES CLASS C: | | FOR THE SIX MONTHS ENDED 4/30/12 | | | FOR THE YEAR ENDED 10/31/11 | |
| | | SHARES | | | AMOUNT | | | SHARES | | | AMOUNT | |
Sold | | | 1,512,787 | | | $ | 15,615,937 | | | | 2,878,263 | | | $ | 29,930,044 | |
Reinvested | | | 137,731 | | | | 1,370,422 | | | | 87,934 | | | | 892,913 | |
Repurchased | | | (297,447 | ) | | | (3,056,691 | ) | | | (482,213 | ) | | | (5,010,887 | ) |
| | | | | | | | | | | | | | | | |
Total | | | 1,353,071 | | | $ | 13,929,668 | | | | 2,483,984 | | | $ | 25,812,070 | |
| | | | | | | | | | | | | | | | |
| | | | | | | | | | | | | | | | |
PRO-BLEND® CONSERVATIVE TERM SERIES CLASS R: | | FOR THE SIX MONTHS ENDED 4/30/12 | | | FOR THE YEAR ENDED 10/31/11 | |
| | | SHARES | | | AMOUNT | | | SHARES | | | AMOUNT | |
Sold | | | 735,752 | | | $ | 7,577,160 | | | | 313,344 | | | $ | 3,231,709 | |
Reinvested | | | 17,695 | | | | 175,711 | | | | 456 | | | | 4,741 | |
Repurchased | | | (75,137 | ) | | | (770,350 | ) | | | (42,968 | ) | | | (447,772 | ) |
| | | | | | | | | | | | | | | | |
Total | | | 678,310 | | | $ | 6,982,521 | | | | 270,832 | | | $ | 2,788,678 | |
| | | | | | | | | | | | | | | | |
144
Notes to Financial Statements (continued)
| 5. | Capital Stock Transactions (continued) |
| | | | | | | | | | | | | | | | |
PRO-BLEND® MODERATE TERM SERIES CLASS S: | | FOR THE SIX MONTHS ENDED 4/30/12 | | | FOR THE YEAR ENDED 10/31/11 | |
| | SHARES | | | AMOUNT | | | SHARES | | | AMOUNT | |
Sold | | | 8,052,225 | | | $ | 102,810,193 | | | | 21,968,787 | | | $ | 286,379,412 | |
Reinvested | | | 2,221,877 | | | | 26,795,850 | | | | 1,475,969 | | | | 18,769,387 | |
Repurchased | | | (7,657,008 | ) | | | (97,733,043 | ) | | | (19,552,324 | ) | | | (255,845,262 | ) |
| | | | | | | | | | | | | | | | |
Total | | | 2,617,094 | | | $ | 31,873,000 | | | | 3,892,432 | | | $ | 49,303,537 | |
| | | | | | | | | | | | | | | | |
| | | | |
| | | | | | | | | | | | | | | | |
PRO-BLEND® MODERATE TERM SERIES CLASS I: | | FOR THE SIX MONTHS ENDED 4/30/12 | | | FOR THE YEAR ENDED 10/31/11 | |
| | SHARES | | | AMOUNT | | | SHARES | | | AMOUNT | |
Sold | | | 10,525,197 | | | $ | 107,151,566 | | | | 10,586,608 | | | $ | 112,330,732 | |
Reinvested | | | 1,496,933 | | | | 14,505,281 | | | | 931,494 | | | | 9,639,123 | |
Repurchased | | | (3,909,912 | ) | | | (39,730,007 | ) | | | (5,691,539 | ) | | | (60,329,149 | ) |
| | | | | | | | | | | | | | | | |
Total | | | 8,112,218 | | | $ | 81,926,840 | | | | 5,826,563 | | | $ | 61,640,706 | |
| | | | | | | | | | | | | | | | |
| | | | |
| | | | | | | | | | | | | | | | |
PRO-BLEND® MODERATE TERM SERIES CLASS C: | | FOR THE SIX MONTHS ENDED 4/30/12 | | | FOR THE YEAR ENDED 10/31/11 | |
| | SHARES | | | AMOUNT | | | | | | | |
Sold | | | 1,569,974 | | | $ | 16,332,220 | | | | 3,188,019 | | | $ | 34,023,071 | |
Reinvested | | | 269,846 | | | | 2,647,188 | | | | 101,484 | | | | 1,061,587 | |
Repurchased | | | (491,656 | ) | | | (5,137,597 | ) | | | (773,849 | ) | | | (8,231,166 | ) |
| | | | | | | | | | | | | | | | |
Total | | | 1,348,164 | | | $ | 13,841,811 | | | | 2,515,654 | | | $ | 26,853,492 | |
| | | | | | | | | | | | | | | | |
| | | | |
| | | | | | | | | | | | | | | | |
PRO-BLEND® MODERATE TERM SERIES CLASS R: | | FOR THE SIX MONTHS ENDED 4/30/12 | | | FOR THE YEAR ENDED 10/31/11 | |
| | SHARES | | | AMOUNT | | | SHARES | | | AMOUNT | |
Sold | | | 1,063,862 | | | $ | 11,271,114 | | | | 1,781,246 | | | $ | 19,006,290 | |
Reinvested | | | 110,982 | | | | 1,117,588 | | | | 2,016 | | | | 21,870 | |
Repurchased | | | (238,340 | ) | | | (2,536,691 | ) | | | (99,656 | ) | | | (1,089,061 | ) |
| | | | | | | | | | | | | | | | |
Total | | | 936,504 | | | $ | 9,852,011 | | | | 1,683,606 | | | $ | 17,939,099 | |
| | | | | | | | | | | | | | | | |
| | | | |
| | | | | | | | | | | | | | | | |
PRO-BLEND® EXTENDED TERM SERIES CLASS S: | | FOR THE SIX MONTHS ENDED 4/30/12 | | | FOR THE YEAR ENDED 10/31/11 | |
| | SHARES | | | AMOUNT | | | SHARES | | | AMOUNT | |
Sold | | | 5,153,156 | | | $ | 78,537,555 | | | | 16,001,971 | | | $ | 251,124,390 | |
Reinvested | | | 1,837,166 | | | | 26,326,833 | | | | 564,378 | | | | 8,698,817 | |
Repurchased | | | (6,382,719 | ) | | | (97,895,146 | ) | | | (14,847,080 | ) | | | (232,518,001 | ) |
| | | | | | | | | | | | | | | | |
Total | | | 607,603 | | | $ | 6,969,242 | | | | 1,719,269 | | | $ | 27,305,206 | |
| | | | | | | | | | | | | | | | |
| | | | |
| | | | | | | | | | | | | | | | |
PRO-BLEND® EXTENDED TERM SERIES CLASS I: | | FOR THE SIX MONTHS ENDED 4/30/12 | | | FOR THE YEAR ENDED 10/31/11 | |
| | SHARES | | | AMOUNT | | | SHARES | | | AMOUNT | |
Sold | | | 13,510,865 | | | $ | 133,602,428 | | | | 12,745,928 | | | $ | 134,769,394 | |
Reinvested | | | 1,170,823 | | | | 11,017,451 | | | | 363,643 | | | | 3,769,679 | |
Repurchased | | | (5,477,351 | ) | | | (54,243,678 | ) | | | (9,261,024 | ) | | | (98,182,021 | ) |
| | | | | | | | | | | | | | | | |
Total | | | 9,204,337 | | | $ | 90,376,201 | | | | 3,848,547 | | | $ | 40,357,052 | |
| | | | | | | | | | | | | | | | |
145
Notes to Financial Statements (continued)
| 5. | Capital Stock Transactions (continued) |
| | | | | | | | | | | | | | | | |
PRO-BLEND® EXTENDED TERM SERIES CLASS C: | | FOR THE SIX MONTHS ENDED 4/30/12 | | | FOR THE YEAR ENDED 10/31/11 | |
| | SHARES | | | AMOUNT | | | SHARES | | | AMOUNT | |
Sold | | | 1,083,750 | | | $ | 11,509,386 | | | | 4,089,975 | | | $ | 45,138,799 | |
Reinvested | | | 359,929 | | | | 3,566,891 | | | | 50,691 | | | | 552,372 | |
Repurchased | | | (475,367 | ) | | | (5,061,785 | ) | | | (581,472 | ) | | | (6,343,489 | ) |
| | | | | | | | | | | | | | | | |
Total | | | 968,312 | | | $ | 10,014,492 | | | | 3,559,194 | | | $ | 39,347,682 | |
| | | | | | | | | | | | | | | | |
| | | | |
| | | | | | | | | | | | | | | | |
PRO-BLEND® EXTENDED TERM SERIES CLASS R: | | FOR THE SIX MONTHS ENDED 4/30/12 | | | FOR THE YEAR ENDED 10/31/11 | |
| | SHARES | | | AMOUNT | | | SHARES | | | AMOUNT | |
Sold | | | 1,812,700 | | | $ | 19,875,643 | | | | 742,885 | | | $ | 8,337,390 | |
Reinvested | | | 107,100 | | | | 1,109,554 | | | | 933 | | | | 10,782 | |
Repurchased | | | (218,734 | ) | | | (2,446,935 | ) | | | (24,790 | ) | | | (288,098 | ) |
| | | | | | | | | | | | | | | | |
Total | | | 1,701,066 | | | $ | 18,538,262 | | | | 719,028 | | | $ | 8,060,074 | |
| | | | | | | | | | | | | | | | |
| | | | |
| | | | | | | | | | | | | | | | |
‘PRO-BLEND® MAXIMUM TERM SERIES CLASS S: | | FOR THE SIX MONTHS ENDED 4/30/12 | | | FOR THE YEAR ENDED 10/31/11 | |
| | SHARES | | | AMOUNT | | | SHARES | | | AMOUNT | |
Sold | | | 2,676,019 | | | $ | 42,952,132 | | | | 10,313,961 | | | $ | 170,140,771 | |
Reinvested | | | 89,561 | | | | 1,327,303 | | | | 167,146 | | | | 2,721,541 | |
Repurchased | | | (5,776,097 | ) | | | (92,871,026 | ) | | | (12,380,054 | ) | | | (201,770,974 | ) |
| | | | | | | | | | | | | | | | |
Total | | | (3,010,517 | ) | | $ | (48,591,591 | ) | | | (1,898,947 | ) | | $ | (28,908,662 | ) |
| | | | | | | | | | | | | | | | |
| | | | |
| | | | | | | | | | | | | | | | |
PRO-BLEND® MAXIMUM TERM SERIES CLASS I: | | FOR THE SIX MONTHS ENDED 4/30/12 | | | FOR THE YEAR ENDED 10/31/11 | |
| | SHARES | | | AMOUNT | | | SHARES | | | AMOUNT | |
Sold | | | 7,798,965 | | | $ | 78,864,181 | | | | 8,318,101 | | | $ | 88,898,033 | |
Reinvested | | | 72,111 | | | | 688,656 | | | | 94,403 | | | | 994,204 | |
Repurchased | | | (5,014,608 | ) | | | (50,414,727 | ) | | | (6,413,546 | ) | | | (68,366,415 | ) |
| | | | | | | | | | | | | | | | |
Total | | | 2,856,468 | | | $ | 29,138,110 | | | | 1,998,958 | | | $ | 21,525,822 | |
| | | | | | | | | | | | | | | | |
| | | | |
| | | | | | | | | | | | | | | | |
PRO-BLEND® MAXIMUM TERM SERIES CLASS C: | | FOR THE SIX MONTHS ENDED 4/30/12 | | | FOR THE YEAR ENDED 10/31/11 | |
| | SHARES | | | AMOUNT | | | SHARES | | | AMOUNT | |
Sold | | | 338,763 | | | $ | 3,674,027 | | | | 1,158,000 | | | $ | 12,880,192 | |
Reinvested | | | 1,483 | | | | 14,790 | | | | 3,732 | | | | 41,088 | |
Repurchased | | | (206,446 | ) | | | (2,233,354 | ) | | | (141,903 | ) | | | (1,528,428 | ) |
| | | | | | | | | | | | | | | | |
Total | | | 133,800 | | | $ | 1,455,463 | | | | 1,019,829 | | | $ | 11,392,852 | |
| | | | | | | | | | | | | | | | |
| | | | |
| | | | | | | | | | | | | | | | |
PRO-BLEND® MAXIMUM TERM SERIES CLASS R: | | FOR THE SIX MONTHS ENDED 4/30/12 | | | FOR THE YEAR ENDED 10/31/11 | |
| | SHARES | | | AMOUNT | | | SHARES | | | AMOUNT | |
Sold | | | 649,796 | | | $ | 7,484,989 | | | | 319,544 | | | $ | 3,625,125 | |
Reinvested | | | 3,422 | | | | 37,565 | | | | 166 | | | | 2,032 | |
Repurchased | | | (69,438 | ) | | | (824,553 | ) | | | (28,368 | ) | | | (339,863 | ) |
| | | | | | | | | | | | | | | | |
Total | | | 583,780 | | | $ | 6,698,001 | | | | 291,342 | | | $ | 3,287,294 | |
| | | | | | | | | | | | | | | | |
146
Notes to Financial Statements (continued)
| 5. | Capital Stock Transactions (continued) |
At April 30, 2012, the retirement plan of the Advisor and its affiliates owned the following:
| | | | | | | | | | | | |
| SERIES | | SHARES
OWNED | | | PERCENTAGE
OF SERIES
SHARES
OUTSTANDING | | | VALUE | |
Pro-Blend® Conservative Term Series | | | 111,100 | | | | 0.1 | % | | $ | 1,199,881 | |
Pro-Blend® Moderate Term Series | | | 248,040 | | | | 0.2 | % | | | 2,609,382 | |
Pro-Blend® Extended Term Series | | | 1,674,678 | | | | 1.7 | % | | | 17,316,168 | |
Pro-Blend® Maximum Term Series | | | 1,644,768 | | | | 2.9 | % | | | 17,730,595 | |
In addition, one shareholder owned 14,892,998 shares of Pro-Blend® Moderate Term Series (14.0% of shares outstanding) valued at $156,674,341. The Target 2030 Series, another series of the Fund, owned 10,744,667 shares of Pro-Blend® Extended Term Series (11.1% of shares outstanding) valued at $111,099,857. The Target 2040 Series, another series of the Fund, owned 7,021,587 shares of Pro-Blend® Maximum Term Series (12.5% of shares outstanding) valued at $75,692,710. Investment activities of these shareholders may have a material effect on the Series.
The Series may trade in instruments including written and purchased options, forward foreign currency exchange contracts and futures contracts and other derivatives in the normal course of investing activities to assist in managing exposure to various market risks. The Series may be subject to various elements of risk which may involve, to a varying degree, elements of risk in excess of the amounts recognized for financial statement purposes. These risks include: the risk that changes in the value of a derivative may not correlate perfectly with the underlying asset, rate or index, counterparty credit risk related to over the counter derivative counterparties’ failure to perform under contract terms, liquidity risk related to the lack of a liquid market for these contracts allowing the fund to close out its position(s) and documentation risk relating to disagreement over contract terms. No such investments were held by the Series as of April 30, 2012.
Investing in securities of foreign companies and foreign governments involves special risks and considerations not typically associated with investing in securities of domestic companies and the U.S. Government. These risks include revaluation of currencies and future adverse political and economic developments. Moreover, securities of foreign companies and foreign governments and their markets may be less liquid and their prices more volatile than those of comparable domestic companies and the U.S. Government.
| 8. | Federal Income Tax Information |
The amount and characterization of certain income and capital gains to be distributed are determined in accordance with federal income tax regulations, which may differ from accounting principles generally accepted in the United States of America. The Series may periodically make reclassifications among its capital accounts to reflect income and gains available for distribution (or available capital loss carryovers) under income tax regulations, without impacting the Series’ net asset value. Any such reclassifications are not reflected in the financial highlights.
The final determination of the tax character of current year distributions will be made at the conclusion of the fiscal year. The tax character of distributions paid for the year ended October 31, 2011 were as follows:
| | | | | | | | | | | | | | | | |
| | | PRO-BLEND®
CONSERVATIVE
TERM SERIES | | | PRO-BLEND®
MODERATE
TERM SERIES | | | PRO-BLEND®
EXTENDED
TERM SERIES | | | PRO-BLEND®
MAXIMUM
TERM SERIES | |
Ordinary income | | $ | 24,078,415 | | | $ | 16,673,921 | | | $ | 16,063,588 | | | $ | 5,155,524 | |
Long-term capital gains | | | 15,715,342 | | | | 15,353,111 | | | | — | | | | — | |
147
Notes to Financial Statements (continued)
| 8. | Federal Income Tax Information (continued) |
At October 31, 2011, the Pro-Blend® Maximum Term Series had a capital loss carryover of $15,938,718, available to the extent allowed by tax law to offset future net capital gain, if any, which will expire on October 31, 2017.
The Regulated Investment Company Modernization Act of 2010 (the “Act”) was enacted on December 22, 2010. The Act made changes to several tax rules including the unlimited carryover of future capital losses, which will retain their character as short-term and/or long-term losses. Prior to the Act, net capital losses incurred by the Series were carried forward for eight years and treated as short-term losses. The Act requires that post-enactment net capital losses be used before pre-enactment net capital losses.
At April 30, 2012, the identified cost of investments for federal income tax purposes, the resulting gross unrealized appreciation and depreciation, and the net unrealized appreciation were as follows:
| | | | | | | | | | | | | | | | |
| | | PRO-BLEND®
CONSERVATIVE
TERM SERIES | | | PRO-BLEND®
MODERATE TERM SERIES | | | PRO-BLEND®
EXTENDED TERM SERIES | | | PRO-BLEND®
MAXIMUM TERM SERIES | |
Cost for federal income tax purposes | | $ | 1,189,971,341 | | | $ | 1,184,180,165 | | | $ | 1,170,715,637 | | | $ | 723,973,954 | |
Unrealized appreciation | | | 77,510,685 | | | | 105,473,845 | | | | 124,136,606 | | | | 92,514,026 | |
Unrealized depreciation | | | (11,906,584 | ) | | | (25,652,801 | ) | | | (35,266,991 | ) | | | (39,735,038 | ) |
| | | | | | | | | | | | | | | | |
Net unrealized appreciation | | $ | 65,604,101 | | | $ | 79,821,044 | | | $ | 88,869,615 | | | $ | 52,778,988 | |
148
Renewal of Investment Advisory Agreement
(unaudited)
At the Manning & Napier Fund, Inc. (the “Fund”) Board of Directors’ (the “Board”) meeting, held on November 18, 2011, the Investment Advisory Agreement (the “Agreement”) between the Fund and Manning & Napier Advisors, LLC (the “Advisor”) was reviewed by the Board for renewal. In connection with the decision whether to renew the Agreement, a variety of material was prepared for and reviewed by the Board.
Representatives of the Advisor attended the meeting and presented additional oral and written information to the Board to assist the Board in its considerations. The discussion immediately below outlines the materials and information presented to the Board in connection with the Board’s 2011 Annual Review of the Agreement and the conclusions made by the Directors when determining to continue the Agreement.
| | • | | The Board considered the services provided by the Advisor under the Agreement including, among others: deciding what securities to purchase and sell for each Series; arranging for the purchase and sale of such securities by placing orders with broker-dealers; administering the affairs of the Fund (including the books and records of the Fund not maintained by third party service providers such as the custodian or sub-transfer agent); arranging for the insurance coverage for the Fund; and supervising the preparation of tax returns, SEC filings (including registration statements) and reports to shareholders for the Fund. The Board also considered the nature and quality of such services provided under the Agreement in light of the Advisor’s services provided to the Fund for 25 years. The Board discussed the quality of these services with representatives from the Advisor and concluded that the Advisor was performing its services to the Fund required under the Agreement in a reasonable manner. |
| | • | | The Board considered the investment performance of the various Series of the Fund. The investment performance for each Series was reviewed on a cumulative basis since inception and on a one year basis. In addition, annualized performance for the following time periods was considered: inception, three year, five year, ten year, and current market cycle. A market cycle includes periods of both rising and falling markets. Returns for established benchmark indices for each Series were provided for each time period. The Board noted that the various Series were competitive against their respective benchmarks and/or peer groups over various time periods, but in particular over the full market cycle period relevant for the Series. In addition, the Board considered at the meeting (and considers on a quarterly basis) a peer group performance analysis consisting of Morningstar universes of mutual funds with similar investment objectives. The Board discussed the performance with representatives from the Advisor and concluded that the investment performance of each of the Fund’s Series was reasonable based on the Fund’s actual performance and comparative performance, especially performance over the current market cycle. |
| | • | | The Board considered the costs of the Advisor’s services and the profits of the Advisor as they relate to the Advisor’s services to the Fund under the Agreement. In reviewing the Advisor’s costs and profits, the Board discussed the Advisor’s revenues generated from the Fund (on both an actual and adjusted basis) and its expenses associated with providing the services under the Agreement. In addition, the Board reviewed the Advisor’s expenses associated with Fund activities outside of the Agreement (such as expense reimbursements pursuant to expense caps and payments made by the Advisor to third party platforms on which shares of the Fund are available for purchase). It was noted by representatives of the Advisor that 10 of the 29 active Series of the Fund are currently experiencing expenses above the capped expense ratios. After discussing the above costs and profits, the Board concluded that the Advisor’s profitability relating to its services provided under the Agreement was reasonable. |
| | • | | The Board considered the fees and expenses of the various Series of the Fund. The Advisor presented the advisory fees and total expenses for each Series, including the advisory fee adjusted for any expense waivers or reimbursements (either contractual or voluntary) paid by the Advisor. The advisory fees and expense ratios of each Series were compared to an average (on both a mean and median basis) of similar funds as disclosed on the Morningstar database. Representatives of the Advisor discussed with the Board the levels of its advisory fee for each Series of the Fund and as compared to the median and mean advisory fees for similar funds as listed on Morningstar. Expense ratios for every Series, except the Pro-Blend Class R and Class C, and Target Class R and Class C (and a few Class K), are currently below the median and mean for similar funds as listed on Morningstar. Based on their review of the information provided, the Board concluded that the fees and expenses of each Series of the Fund were reasonable on a comparative basis. |
149
Renewal of Investment Advisory Agreement
(unaudited)
| | • | | The Board also considered the other benefits the Advisor derives from its relationship with the Fund. Such other benefits include certain research products provided by soft dollars. Given the level of soft dollar transactions involving the Fund, the Board concluded that these additional benefits to the Advisor were reasonable. |
| | • | | In addition to the factors described above, the Board considered the Advisor’s personnel, investment strategies, policies and procedures relating to compliance with personal securities transactions, and reputation, expertise and resources in domestic and foreign financial markets. The Board concluded that these factors support the conclusion that the Advisor performs its services in a reasonable manner. |
| | • | | The Board did not consider economies of scale at this time because of the multiple uses of the Fund (for the Advisor’s discretionary investment account clients in addition to direct investors), the current profitability of the Advisor’s services to the Fund under the Agreement, and the overall size of the Fund complex. |
Based on the Board’s deliberations and their evaluation of the information described above, the Board, including a majority of Directors that are not “interested persons” as defined in the Investment Company Act of 1940, concluded that the compensation under the Agreement was fair and reasonable in light of the services and expenses and such other matters as the Directors considered to be relevant in the exercise of their reasonable judgment. Accordingly, the Board approved the renewal of the Agreement. In the course of their deliberations, the Directors did not identify any particular information that was all important or controlling.
150
{This page intentionally left blank}
151
{This page intentionally left blank}
152
Literature Requests
(unaudited)
Proxy Voting Policies and Procedures
A description of the policies and procedures that the Fund uses to determine how to vote proxies relating to portfolio securities is available, without charge, upon request:
| | | | |
| By phone | | 1-800-466-3863 | | |
On the Securities and Exchange Commission’s (SEC) web site | | http://www.sec.gov | | |
Proxy Voting Record
Information regarding how the Fund voted proxies relating to portfolio securities during the most recent 12-month period ended June 30th is available, without charge, upon request:
| | | | |
| By phone | | 1-800-466-3863 | | |
| On the SEC’s web site | | http://www.sec.gov | | |
Quarterly Portfolio Holdings
The Series’ complete schedule of portfolio holdings for the 1st and 3rd quarters of each fiscal year are provided on Form N-Q, and are available, without charge, upon request:
| | | | |
| By phone | | 1-800-466-3863 | | |
| On the SEC’s web site | | http://www.sec.gov | | |
The Series’ Form N-Q may be reviewed and copied at the SEC’s Public Reference Room in Washington, D.C. Information on the operation of the Public Reference Room may be obtained by calling 1-800-SEC-0330.
Prospectus and Statement of Additional Information (SAI)
The prospectus and SAI provide additional information about each Series, including charges, expenses and risks. These documents are available, without charge, upon request:
| | | | |
| By phone | | 1-800-466-3863 | | |
| On the SEC’s web site | | http://www.sec.gov | | |
| On the Advisor’s web site | | http://www.manning-napier.com | | |
Additional information available at www.manning-napier.com
1. Fund Holdings - Month-End
2. Fund Holdings - Quarter-End
3. Shareholder Report - Annual
4. Shareholder Report - Semi-Annual
The Fund also offers electronic notification or “e-delivery” when certain documents are available on-line to be downloaded or reviewed. Direct shareholders can elect to receive electronic notification when shareholder reports, prospectus updates, and / or quarterly statements are available. If you do not currently have on-line access to your account, you can establish access by going to www.manning-napier.com, click on “Login” in the top corner of the page, and follow the prompts to self-enroll. Once enrolled, you can set your electronic notification preferences by clicking on the Account Options tab located within the green toolbar and then select E-Delivery Option. Should you have any questions on either how to establish on-line access or how to update your account settings, please contact Investor Services at 1-800-466-3863.
MNPRO-04/12-SAR

Not applicable for Semi-Annual Reports.
ITEM 3: | AUDIT COMMITTEE FINANCIAL EXPERT |
Not applicable for Semi-Annual Reports.
ITEM 4: | PRINCIPAL ACCOUNTANT FEES AND SERVICES |
Not applicable for Semi-Annual Reports.
ITEM 5: | AUDIT COMMITTEE OF LISTED REGISTRANTS |
Not applicable.
(a) | See Investment Portfolios under Item 1 on this Form N-CSR. |
ITEM 7: | DISCLOSURE OF PROXY VOTING POLICIES AND PROCEDURES FOR CLOSED-END MANAGEMENT INVESTMENT COMPANIES |
Not applicable.
ITEM 8: | PORTFOLIO MANAGERS OF CLOSED-END MANAGEMENT INVESTMENT COMPANIES |
Not applicable.
ITEM 9: | PURCHASES OF EQUITY SECURITIES BY CLOSED-END MANAGEMENT INVESTMENT COMPANY AND AFFILIATED PURCHASERS |
Not applicable.
ITEM 10: | SUBMISSION OF MATTERS TO A VOTE OF SECURITY HOLDERS |
There have been no material changes to the procedure by which shareholders may recommend nominees to the registrant’s board of directors.
ITEM 11: | CONTROLS AND PROCEDURES |
(a) Based on their evaluation of the Funds’ disclosure controls and procedures, as of a date within 90 days of the filing date, the Funds’ Principal Executive Officer and Principal Financial Officer have concluded that the Funds’ disclosure controls and procedures are: (i) reasonably designed to ensure that information required to be disclosed in this report is appropriately communicated to the Funds’ officers to allow timely decisions regarding disclosures required in this report; (ii) reasonably designed to ensure that information required to be disclosed in this report is recorded, processed, summarized and reported in a timely manner; and (iii) are effective in achieving the goals described in (i) and (ii) above.
(b) During the second fiscal quarter of the period covered by this report, there have been no changes in the Funds’ internal control over financial reporting that the above officers believe to have materially affected, or to be reasonably likely to materially affect, the Funds’ internal control over financial reporting.
(a)(1) | Not applicable for Semi-Annual Reports. |
(a)(2) | Separate certifications for the Registrant’s principal executive officer and principal financial officer, as required by Section 302 of the Sarbanes-Oxley Act of 2002 and Rule 30a-2(a) under the Investment Company Act of 1940, are attached as EX-99.CERT. |
(b) | A certification of the Registrant’s principal executive officer and principal financial officer, as required by 18 U.S.C Section 1350, as adopted pursuant to Section 906 of the Sarbanes-Oxley Act of 2002, and Rule 30a-2(b) under the Investment Company Act of 1940, is attached as EX- 99.906CERT. The certification furnished pursuant to this paragraph is not deemed to be “filed” for purposes of Section 18 of the Securities Exchange Act of 1934, or otherwise subject to the liability of that section. Such certification is not deemed to be incorporated by reference into any filing under the Securities Act of 1933 or the Securities Exchange Act of 1934, except to the extent that the Registrant specifically incorporates them by reference. |
SIGNATURES
Pursuant to the requirements of the Securities Exchange Act of 1934 and the Investment Company Act of 1940, the registrant has duly caused this report to be signed on its behalf by the undersigned, thereunto duly authorized.
Manning & Napier Fund, Inc.
/s/ B. Reuben Auspitz
B. Reuben Auspitz
President & Principal Executive Officer of Manning & Napier Fund, Inc.
June 18, 2012
Pursuant to the requirements of the Securities Exchange Act of 1934 and the Investment Company Act of 1940, this report has been signed below by the following persons on behalf of the registrant and in the capacities and on the dates indicated.
/s/ B. Reuben Auspitz
B. Reuben Auspitz
President & Principal Executive Officer of Manning & Napier Fund, Inc.
June 18, 2012
/s/ Christine Glavin
Christine Glavin
Chief Financial Officer & Principal Financial Officer of Manning & Napier Fund, Inc.
June 18, 2012