UNITED STATES
SECURITIES AND EXCHANGE COMMISSION
Washington, D.C. 20549
FORM N-CSR
CERTIFIED SHAREHOLDER REPORT OF REGISTERED
MANAGEMENT INVESTMENT COMPANIES
Investment Company Act file number 811-04087
Manning & Napier Fund, Inc.
(Exact name of registrant as specified in charter)
290 Woodcliff Drive, Fairport, NY 14450
(Address of principal executive offices)(Zip Code)
B. Reuben Auspitz 290 Woodcliff Drive, Fairport, NY 14450
(Name and address of agent for service)
Registrant’s telephone number, including area code: 585-325-6880
Date of fiscal year end: December 31, 2010
Date of reporting period: January 1, 2010 through June 30, 2010
Form N-CSR is to be used by management investment companies to file reports with the Commission not later than 10 days after the transmission to stockholders of any report that is required to be transmitted to stockholders under Rule 30e-1 under the Investment Company Act of 1940 (17 CFR 270.30e-1). The Commission may use the information provided on Form N-CSR in its regulatory, disclosure review, inspection, and policymaking roles.
A registrant is required to disclose the information specified by Form N-CSR, and the Commission will make this information public. A registrant is not required to respond to the collection of information contained in Form N-CSR unless the Form displays a currently valid Office of Management and Budget (“OMB”) control number. Please direct comments concerning the accuracy of the information collection burden estimate and any suggestions for reducing the burden to Secretary, Securities and Exchange Commission, 100 F Street, NE, Washington, DC 20549. The OMB has reviewed this collection of information under the clearance requirements of 44 U.S.C. § 3507.
ITEM 1: REPORTS TO STOCKHOLDERS.

Shareholder Expense Example (unaudited)
As a shareholder of the Series, you may incur two types of costs: (1) transaction costs and (2) ongoing costs, including management fees and other Series expenses. This example is intended to help you understand your ongoing costs (in dollars) of investing in the Series and to compare these costs with the ongoing costs of investing in other mutual funds.
The example is based on an investment of $1,000 invested at the beginning of the period and held for the entire period (January 1, 2010 to June 30, 2010).
Actual Expenses
The first line of the table below provides information about actual account values and actual expenses. You may use the information in this line, together with the amount you invested, to estimate the expenses that you paid over the period. Simply divide your account value by $1,000 (for example, an $8,600 account value divided by $1,000 = 8.6), then multiply the result by the number in the first line under the heading entitled “Expenses Paid During Period” to estimate the expenses you paid on your account during this period.
Hypothetical Example for Comparison Purposes
The second line of the table below provides information about hypothetical account values and hypothetical expenses based on the Series’ actual expense ratio and an assumed rate of return of 5% per year before expenses, which is not the Series’ actual return. The hypothetical account values and expenses may not be used to estimate the actual ending account balance or expenses you paid during the period. You may use this information to compare the ongoing costs of investing in the Series and other funds. To do so, compare this 5% hypothetical example with the 5% hypothetical examples that appear in the shareholder reports of the other funds.
Please note that the expenses shown in the table are meant to highlight your ongoing costs only and do not reflect any transaction costs. Therefore, the second line of the table is useful in comparing ongoing costs only, and will not help you determine the relative total costs of owning different funds. In addition, if these transaction costs were included, your costs would have been higher.
| | | | | | |
| | | Beginning
Account Value
1/1/10 | | Ending
Account Value
6/30/10 | | Expenses Paid
During Period*
1/1/10-6/30/10 |
Actual | | $1,000.00 | | $974.60 | | $5.29 |
Hypothetical
(5% return before expenses) | | $1,000.00 | | $1,019.44 | | $5.41 |
*Expenses are equal to the Series’ annualized expense ratio (for the six-month period) of 1.08%, multiplied by the average account value over the period, multiplied by 181/365 (to reflect the one-half year period). Expenses are based on the most recent fiscal half year. The Series’ total return would have been lower had certain expenses not been waived during the period.
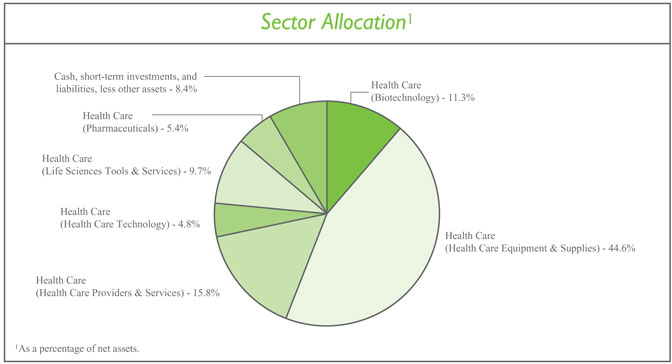
Portfolio Composition as of June 30, 2010 (unaudited)
| | | | | | | | |
Top Ten Stock Holdings2 |
Celera Corp. | | 4.3% | | | | Zoll Medical Corp. | | 3.7% |
Gen-Probe, Inc. | | 4.3% | | | | DENTSPLY International, Inc. | | 3.5% |
Caliper Life Sciences, Inc. | | 4.1% | | | | Cochlear Ltd. (Australia) | | 3.4% |
Inverness Medical Innovations, Inc. | | 4.0% | | | | ICON plc - ADR (Ireland) | | 3.1% |
VCA Antech, Inc. | | 3.9% | | | | Sonic Healthcare Ltd. (Australia) | | 3.0% |
| | | | | |
2 As a percentage of total investments. | | | | | | | | |
Investment Portfolio - June 30, 2010 (unaudited)
| | | | | | | |
| | | Shares | | Value (Note 2) | | |
| | | |
COMMON STOCKS - 91.6% | | | | | | | |
| | | |
Financials - 0.0% | | | | | | | |
Insurance - 0.0% | | | | | | | |
Avalon HealthCare Holdings, Inc.*1,2,3,4 | | 38,359 | | $ | — | | |
| | | | | | | |
| | | |
Health Care - 91.6% | | | | | | | |
Biotechnology - 11.3% | | | | | | | |
Amgen, Inc.* | | 145,770 | | | 7,667,502 | | |
Basilea Pharmaceutica AG (Switzerland)* | | 77,000 | | | 4,300,598 | | |
Celera Corp.* | | 1,731,750 | | | 11,342,963 | | |
Grifols S.A. (Spain) | | 583,000 | | | 6,014,932 | | |
| | | | | | | |
| | | | | 29,325,995 | | |
| | | | | | | |
Health Care Equipment & Supplies - 44.6% | | | | | | | |
Ansell Ltd. (Australia) | | 389,470 | | | 4,304,497 | | |
Baxter International, Inc | | 96,000 | | | 3,901,440 | | |
Becton, Dickinson and Co | | 57,000 | | | 3,854,340 | | |
Cochlear Ltd. (Australia) | | 141,230 | | | 8,835,198 | | |
Covidien plc (Ireland) | | 148,601 | | | 5,970,788 | | |
DENTSPLY International, Inc | | 307,000 | | | 9,182,370 | | |
DexCom, Inc.* | | 575,000 | | | 6,647,000 | | |
Gen-Probe, Inc.* | | 246,000 | | | 11,173,320 | | |
Hologic, Inc.* | | 310,000 | | | 4,318,300 | | |
Insulet Corp.* | | 394,000 | | | 5,929,700 | | |
Inverness Medical Innovations, Inc.* | | 273,000 | | | 7,278,180 | | |
Inverness Medical Innovations, Inc.*2,5 | | 122,000 | | | 3,252,520 | | |
Nobel Biocare Holding AG (Switzerland) | | 242,000 | | | 4,198,544 | | |
OraSure Technologies, Inc.* | | 958,430 | | | 4,437,531 | | |
Shandong Weigao Group Medical Polymer Co. Ltd. - Class H (China) | | 1,708,000 | | | 7,501,522 | | |
Sirona Dental Systems, Inc.* | | 223,000 | | | 7,769,320 | | |
Straumann Holding AG (Switzerland) | | 32,717 | | | 7,111,929 | | |
Zoll Medical Corp.* | | 355,000 | | | 9,620,500 | | |
| | | | | | | |
| | | | | 115,286,999 | | |
| | | | | | | |
Health Care Providers & Services - 15.8% | | | | | | | |
AMN Healthcare Services, Inc.* | | 656,000 | | | 4,906,880 | | |
Bio-Reference Laboratories, Inc.* | | 280,000 | | | 6,207,600 | | |
Cross Country Healthcare, Inc.* | | 475,900 | | | 4,278,341 | | |
Diagnosticos da America S.A. (Brazil)* | | 772,000 | | | 7,262,360 | | |
Sonic Healthcare Ltd. (Australia) | | 910,000 | | | 7,989,311 | | |
VCA Antech, Inc.* | | 414,000 | | | 10,250,640 | | |
| | | | | | | |
| | | | | 40,895,132 | | |
| | | | | | | |
Health Care Technology - 4.8% | | | | | | | |
Allscripts - Misys Healthcare Solutions, Inc.* | | 277,000 | | | 4,459,700 | | |
Cerner Corp.* | | 104,000 | | | 7,892,560 | | |
| | | | | | | |
| | | | | 12,352,260 | | |
| | | | | | | |
| | | | |
| | The accompanying notes are an integral part of the financial statements. | | 3 |
Investment Portfolio - June 30, 2010 (unaudited)
| | | | | | | |
| | | Shares | | Value (Note 2) | | |
COMMON STOCKS (continued) | | | | | | | |
| | | |
Health Care (continued) | | | | | | | |
Life Sciences Tools & Services - 9.7% | | | | | | | |
Caliper Life Sciences, Inc.* | | 2,507,223 | | $ | 10,705,843 | | |
ICON plc - ADR (Ireland)* | | 277,880 | | | 8,027,953 | | |
Sequenom, Inc.* | | 1,085,000 | | | 6,412,350 | | |
| | | | | | | |
| | | | | 25,146,146 | | |
| | | | | | | |
Pharmaceuticals - 5.4% | | | | | | | |
Green Cross Corp. (South Korea) | | 59,000 | | | 6,783,746 | | |
UCB S.A. (Belgium) | | 228,939 | | | 7,232,732 | | |
| | | | | | | |
| | | | | 14,016,478 | | |
| | | | | | | |
Total Health Care | | | | | 237,023,010 | | |
| | | | | | | |
TOTAL COMMON STOCKS | | | | | | | |
(Identified Cost $221,423,465) | | | | | 237,023,010 | | |
| | | | | | | |
| | | |
PREFERRED STOCKS - 0.0%** | | | | | | | |
| | | |
Financials - 0.0% | | | | | | | |
Insurance - 0.0% | | | | | | | |
Avalon HealthCare Holdings, Inc. - Series D*2,3,4,6 | | | | | | | |
(Identified Cost $2,312,500) | | 925,000 | | | — | | |
| | | | | | | |
| | | |
WARRANTS - 0.0%** | | | | | | | |
| | | |
Financials - 0.0% | | | | | | | |
Insurance - 0.0% | | | | | | | |
Avalon HealthCare Holdings, Inc., 2/27/20142,3,4,7 | | 38,359 | | | — | | |
| | | | | | | |
| | | |
Health Care - 0.0%** | | | | | | | |
Life Sciences Tools & Services - 0.0%** | | | | | | | |
Caliper Life Sciences, Inc., 8/15/20102,3,8 | | 285,000 | | | 8,370 | | |
Caliper Life Sciences, Inc., 8/10/2011 | | 401,109 | | | 48,133 | | |
| | | | | | | |
| | | |
Total Health Care | | | | | 56,503 | | |
| | | | | | | |
TOTAL WARRANTS | | | | | | | |
(Identified Cost $560,760) | | | | | 56,503 | | |
| | | | | | | |
| | | | |
| 4 | | The accompanying notes are an integral part of the financial statements. | | |
Investment Portfolio - June 30, 2010 (unaudited)
| | | | | | |
| | | Shares/
Principal Amount | | Value (Note 2) | | |
SHORT-TERM INVESTMENTS - 9.9% | | | | | | |
| | | |
Dreyfus Cash Management, Inc. - Institutional Shares9 , 0.13% | | 15,766,326 | | $15,766,326 | | |
Federal Home Loan Bank Discount Note10, 0.11%, 8/9/2010 | | $10,000,000 | | 9,998,808 | | |
| | | | | | |
TOTAL SHORT-TERM INVESTMENTS | | | | | | |
(Identified Cost $25,765,134) | | | | 25,765,134 | | |
| | | | | | |
| | | |
TOTAL INVESTMENTS - 101.5% | | | | | | |
(Identified Cost $250,061,859) | | | | 262,844,647 | | |
LIABILITIES, LESS OTHER ASSETS - (1.5%) | | | | (4,000,271) | | |
| | | | | | |
NET ASSETS - 100% | | | | $258,844,376 | | |
| | | | | | |
ADR - American Depository Receipt
| * | Non-income producing security |
| 1 | This security was acquired on February 27, 2009 at a cost of $76,718 ($2.00 per share) and has been determined to be illiquid under guidelines established by the Board of Directors (see Note 2 to the financial statements). |
| 2 | Restricted securities - Investment in securities that are restricted as to public resale under the Securities Act of 1933, as amended. These securities amount to $3,260,890, or 1.3%, of the Series’ net assets as of June 30, 2010 (see Note 2 to the financial statements). |
| 3 | Security has been valued at fair value. |
| 4 | Affiliated company as defined by the Investment Company Act of 1940. |
| 5 | This security was acquired on February 3, 2006 at a cost of $2,978,020 ($24.41 per share) and has been determined to be liquid under guidelines established by the Board of Directors (see Note 2 to the financial statements). |
| 6 | This security was acquired on June 22, 2007 at a cost of $2,312,500 ($2.50 per share) and has been determined to be illiquid under guidelines established by the Board of Directors (see Note 2 to the financial statements). |
| 7 | This security was acquired on February 27, 2009 at a cost of $19,180 ($0.50 per warrant) and has been determined to be illiquid under guidelines established by the Board of Directors (see Note 2 to the financial statements). |
| 8 | This security was acquired on August 11, 2005 at a cost of $365,484 ($1.28 per warrant) and has been determined to be illiquid under guidelines established by the Board of Directors (see Note 2 to the financial statements). |
| 9 | Rate shown is the current yield as of June 30, 2010. |
| 10 | Rate shown reflects the annualized yield at time of purchase. |
| | | | |
| | The accompanying notes are an integral part of the financial statements. | | 5 |
Statement of Assets and Liabilities (unaudited)
June 30, 2010
| | | | |
ASSETS: | | | | |
| |
Investments, at value (identified cost $250,061,859) (Note 2) | | $ | 262,844,647 | |
Receivable for securities sold | | | 2,087,259 | |
Receivable for fund shares sold | | | 155,520 | |
Foreign tax reclaims receivable | | | 130,748 | |
Dividends receivable | | | 18,158 | |
| | | | |
| |
TOTAL ASSETS | | | 265,236,332 | |
| | | | |
| |
LIABILITIES: | | | | |
| |
Accrued management fees (Note 3) | | | 217,829 | |
Accrued transfer agent fees (Note 3) | | | 9,346 | |
Accrued fund accounting and administration fees (Note 3) | | | 4,426 | |
Accrued Chief Compliance Officer service fees (Note 3) | | | 820 | |
Payable for securities purchased | | | 5,333,030 | |
Payable for fund shares repurchased | | | 809,533 | |
Other payables and accrued expenses | | | 16,972 | �� |
| | | | |
| |
TOTAL LIABILITIES | | | 6,391,956 | |
| | | | |
| |
TOTAL NET ASSETS | | $ | 258,844,376 | |
| | | | |
| |
NET ASSETS CONSIST OF: | | | | |
| |
Capital stock | | $ | 250,367 | |
Additional paid-in-capital | | | 273,071,262 | |
Undistributed net investment loss | | | (413,116 | ) |
Accumulated net realized loss on investments, foreign currency and translation of other assets and liabilities | | | (26,844,926 | ) |
Net unrealized appreciation on investments, foreign currency and translation of other assets and liabilities | | | 12,780,789 | |
| | | | |
TOTAL NET ASSETS | | $ | 258,844,376 | |
| | | | |
| |
NET ASSET VALUE, OFFERING PRICE AND REDEMPTION PRICE PER SHARE - CLASS A ($258,844,376/25,036,670 shares) | | $ | 10.34 | |
| | | | |
| | | | |
| 6 | | The accompanying notes are an integral part of the financial statements. | | |
Statement of Operations (unaudited)
For the Six Months Ended June 30, 2010
| | | | |
INVESTMENT INCOME: | | | | |
| |
Dividends (net of foreign taxes withheld, $103,572) | | $ | 1,098,708 | |
Interest | | | 489 | |
| | | | |
| |
Total Investment Income | | | 1,099,197 | |
| | | | |
| |
EXPENSES: | | | | |
| |
Management fees (Note 3) | | | 1,394,064 | |
Fund accounting and administration fees (Note 3) | | | 31,892 | |
Transfer agent fees (Note 3) | | | 14,049 | |
Directors’ fees (Note 3) | | | 6,373 | |
Chief Compliance Officer service fees (Note 3) | | | 1,761 | |
Miscellaneous | | | 64,932 | |
| | | | |
Total Expenses | | | 1,513,071 | |
Less reduction of expenses (Note 3) | | | (758 | ) |
| | | | |
Net Expenses | | | 1,512,313 | |
| | | | |
NET INVESTMENT LOSS | | | (413,116 | ) |
| | | | |
| |
REALIZED AND UNREALIZED GAIN (LOSS) ON INVESTMENTS AND FOREIGN CURRENCY: | | | | |
| |
Net realized gain (loss) on-
Investments | | | 12,434,729 | |
Foreign currency and translation of other assets and liabilities | | | (57,519 | ) |
| | | | |
| | | 12,377,210 | |
| | | | |
| |
Net change in unrealized appreciation (depreciation) on-
Investments | | | (18,634,685 | ) |
Foreign currency and translation of other assets and liabilities | | | (5,706 | ) |
| | | | |
| | | (18,640,391 | ) |
| | | | |
| |
NET REALIZED AND UNREALIZED GAIN (LOSS) ON INVESTMENTS AND FOREIGN CURRENCY | | | (6,263,181 | ) |
| | | | |
| |
NET DECREASE IN NET ASSETS RESULTING FROM OPERATIONS | | $ | (6,676,297 | ) |
| | | | |
| | | | |
| | The accompanying notes are an integral part of the financial statements. | | 7 |
Statements of Changes in Net Assets
| | | | | | | | |
| | | For the Six
Months Ended
6/30/10
(unaudited) | | | For the Year Ended
12/31/09 | |
INCREASE (DECREASE) IN NET ASSETS: | | | | | | | | |
| | |
OPERATIONS: | | | | | | | | |
| | |
Net investment loss | | $ | (413,116 | ) | | $ | (1,203,760 | ) |
Net realized gain (loss) on investments, foreign currency and written options | | | 12,377,210 | | | | (3,756,944 | ) |
Net change in unrealized appreciation (depreciation) on investments and foreign currency | | | (18,640,391 | ) | | | 99,105,593 | |
| | | | | | | | |
| | |
Net increase (decrease) from operations | | | (6,676,297 | ) | | | 94,144,889 | |
| | | | | | | | |
| | |
CAPITAL STOCK ISSUED AND REPURCHASED: | | | | | | | | |
| | |
Net decrease from capital share transactions (Note 5) | | | (7,423,290 | ) | | | (3,905,204 | ) |
| | | | | | | | |
| | |
Net increase (decrease) in net assets | | | (14,099,587 | ) | | | 90,239,685 | |
| | |
NET ASSETS: | | | | | | | | |
| | |
Beginning of period | | | 272,943,963 | | | | 182,704,278 | |
| | | | | | | | |
| | |
End of period (including undistributed net investment income (loss) of $(413,116) and $0, respectively) | | $ | 258,844,376 | | | $ | 272,943,963 | |
| | | | | | | | |
| | | | |
| 8 | | The accompanying notes are an integral part of the financial statements. | | |
| | | | | | | | | | | | |
| | | For the Six
Months Ended
6/30/10 | | For the Years Ended |
| | | (unaudited) | | 12/31/09 | | 12/31/08 | | 12/31/07 | | 12/31/06 | | 12/31/05 |
Per share data (for a share outstanding throughout each period): | | | | | | | | | | | | |
Net asset value - Beginning of period | | $10.61 | | $6.99 | | $11.54 | | $11.41 | | $12.10 | | $11.89 |
| | | | | | | | | | | | |
| | | | | | |
Income (loss) from investment operations: | | | | | | | | | | | | |
Net investment loss | | (0.02)1 | | (0.05)1 | | (0.06) | | (0.08) | | (0.05) | | (0.04) |
Net realized and unrealized gain (loss) on investments | | (0.25) | | 3.67 | | (4.38) | | 1.25 | | 1.56 | | 1.71 |
| | | | | | | | | | | | |
Total from investment operations | | (0.27) | | 3.62 | | (4.44) | | 1.17 | | 1.51 | | 1.67 |
| | | | | | | | | | | | |
Less distributions to shareholders: | | | | | | | | | | | | |
From net realized gain on investments | | — | | — | | (0.11) | | (1.04) | | (2.20) | | (1.46) |
| | | | | | | | | | | | |
Net asset value - End of period | | $10.34 | | $10.61 | | $6.99 | | $11.54 | | $11.41 | | $12.10 |
| | | | | | | | | | | | |
Net assets - End of period | | | | | | | | | | | | |
(000’s omitted) | | $258,844 | | $272,944 | | $182,704 | | $299,669 | | $233,072 | | $221,302 |
| | | | | | | | | | | | |
Total return2 | | (2.54%) | | 51.79% | | (38.77%) | | 10.62% | | 12.52% | | 14.16% |
Ratios (to average net assets)/ Supplemental Data: | | | | | | | | | | | | |
Expenses* | | 1.08%3 | | 1.11% | | 1.12% | | 1.12% | | 1.14% | | 1.17% |
Net investment loss | | (0.30%)3 | | (0.55%) | | (0.65%) | | (0.75%) | | (0.51%) | | (0.32%) |
Portfolio turnover | | 35% | | 95% | | 94% | | 95% | | 93% | | 110% |
|
*The investment advisor did not impose all or a portion of its management fees, CCO fees, fund accounting and transfer agent fees, and other fees in some periods and in some periods paid a portion of the Series’ expenses. If these expenses had been incurred by the Series, the expense ratio (to average net assets) would have been increased by the following amounts: |
| | 0.00%3,4 | | 0.01% | | N/A | | N/A | | N/A | | N/A |
1Calculated based on average shares outstanding during the periods.
2Represents aggregate total return for the periods indicated, and assumes reinvestment of all distributions. Total return would have been lower had certain expenses not been waived or reimbursed during certain periods. Periods less than one year are not annualized.
3Annualized.
4Less than 0.01%.
| | | | |
| | The accompanying notes are an integral part of the financial statements. | | 9 |
Notes to Financial Statements (unaudited)
Life Sciences Series (the “Series”) is a no-load diversified series of Manning & Napier Fund, Inc. (the “Fund”). The Fund is organized in Maryland and is registered under the Investment Company Act of 1940 (the “1940 Act”), as amended, as an open-end management investment company.
The Series’ investment objective is to provide long-term growth by investing principally in the common stocks of companies in the life sciences industry.
The Fund’s Advisor is Manning & Napier Advisors, Inc. (the “Advisor”). On November 5, 1999, the Series resumed sales of shares to advisory clients and employees of the Advisor and its affiliates. On May 1, 2001, the Series began offering shares directly to investors. Previously, the Series was available from time to time to advisory clients and employees of the Advisor. The total authorized capital stock of the Fund consists of 10.0 billion shares of common stock each having a par value of $0.01. As of June 30, 2010, 6.2 billion shares have been designated in total among 29 series, of which 100 million have been designated as Life Sciences Series Class A common stock.
| 2. | SIGNIFICANT ACCOUNTING POLICIES |
Security Valuation
Portfolio securities, including domestic equities, foreign equities, warrants and options, listed on an exchange other than the NASDAQ National Market System are valued at the latest quoted sales price of the exchange on which the security is primarily traded. Securities not traded on valuation date or securities not listed on an exchange are valued at the latest quoted bid price provided by the Fund’s pricing service. Securities listed on the NASDAQ National Market System are valued in accordance with the NASDAQ Official Closing Price.
Short-term investments that mature in sixty days or less are valued at amortized cost, which approximates market value. Investments in open-end investment companies are valued at their net asset value per share on valuation date.
Volume and level of activity in established markets for an asset or liability are evaluated to determine whether recent transactions and quoted prices are determinative of fair value. Where there have been significant decreases in volume and level of activity, further analysis and adjustment may be necessary to estimate fair value. The Series measures fair value in these instances by the use of inputs and valuation techniques which may be based upon current market prices of securities that are comparable in coupon, rating, maturity and industry and/or expectation of future cash flows. As a result of trading in relatively thin markets and/or markets that experience significant volatility, the prices used by the Series to value these securities may differ from the value that would be realized if these securities were sold, and the differences could be material.
Securities for which representative valuations or prices are not available from the Fund’s pricing service may be valued at fair value. Due to the inherent uncertainty of valuations of such securities, the fair value may differ significantly from the values that would have been used had a ready market for such securities existed. If trading or events occurring after the close of the principal market in which securities are traded are expected to materially affect the value of those securities, then they may be valued at their fair value, taking this trading or these events into account. Fair value is determined in good faith by the Advisor under procedures approved by and under the general supervision and responsibility of the Fund’s Board of Directors (the “Board”).
Various inputs are used in determining the value of the Series’ assets or liabilities carried at market value. These inputs are summarized in three broad levels. Level 1 includes quoted prices in active markets for identical assets and liabilities. Level 2 includes other significant observable inputs (including quoted prices for similar securities, interest rates, prepayment speeds, credit risk, etc.). Level 3 includes significant unobservable inputs (including the Series’ own assumptions in determining the fair value of investments). The inputs or methodology used for valuing securities are not necessarily an indication of the risk associated with investing in those securities.
Notes to Financial Statements (unaudited)
| 2. | SIGNIFICANT ACCOUNTING POLICIES (continued) |
Security Valuation (continued)
The following is a summary of the valuation levels used for major security types as of June 30, 2010 in valuing the Series’ assets or liabilities carried at market value:
| | | | | | | | | | | | | | |
| Description | | 6/30/10 | | Level 1 | | Level 2 | | | Level 3 | |
Equity securities* | | $ | 237,079,513 | | $ | 237,071,143 | | $ | — | | | $ | 8,370 | |
Preferred securities | | | — | | | — | | | — | | | | — | |
Debt securities: | | | — | | | — | | | | | | | — | |
U.S. Treasury and other U.S. | | | | | | | | | | | | | | |
Government agencies | | | 9,998,808 | | | — | | | 9,998,808 | | | | — | |
Mutual funds | | | 15,766,326 | | | 15,766,326 | | | — | | | | — | |
Other financial instruments** | | | — | | | — | | | — | | | | — | |
| | | | | | | | | | | | | | |
Total | | $ | 262,844,647 | | $ | 252,837,469 | | $ | 9,998,808 | | | $ | 8,370 | |
| | | | | | | | | | | | | | |
The following table is a reconciliation of Level 3 investments for which significant unobservable inputs were used to determine fair value: | |
| Level 3 reconciliation | | | | | | Equity
Securities | | | Preferred
Securities | |
Balance as of December 31, 2009 (market value) | | | | | | | | $ | 37,739 | | | $ | 231,250 | |
Realized gain/loss | | | | | | | | | — | | | | — | |
Change in unrealized appreciation (depreciation)*** | | | | | | | | | (29,369 | ) | | | (231,250 | ) |
Net purchases (sales) | | | | | | | | | — | | | | — | |
Transfers in and/or out of Level 3 | | | | | | | | | — | | | | — | |
| | | | | | | | | | | | | | |
Balance as of June 30, 2010 (market value) | | | | | | | | $ | 8,370 | | | $ | — | |
| | | | | | | | | | | | | | |
*Includes common stock, warrants and rights. Please see the Investment Portfolio for industry classification.
**Other financial instruments are derivative instruments not reflected in the Investment Portfolio, such as futures, forwards and swap contracts, which are valued at the unrealized appreciation/depreciation on the instrument. As of June 30, 2010, the Series did not hold any derivative instruments.
***The change in unrealized appreciation (depreciation) on securities still held at June 30, 2010 was $(260,619), which is included in the related net change in unrealized appreciation/depreciation on the Statement of Operations.
The Fund’s policy is to recognize transfers in and transfers out of the valuation levels as of the end of the reporting period. There were no significant transfers between Level 1 and Level 2 as of June 30, 2010.
Additional disclosure surrounding the activity in Level 3 fair value measurement will also be effective for fiscal years beginning after December 15, 2010. Management has concluded that this will not have a material impact on the Series’ financial statements.
Security Transactions, Investment Income and Expenses
Security transactions are accounted for on trade date. Dividend income is recorded on the ex-dividend date, except that if the ex-dividend date has passed, certain dividends from foreign securities are recorded as soon as the Fund is informed of the ex-dividend date. Non-cash dividends, if any, are recorded at the fair market value of the securities
11
Notes to Financial Statements (unaudited)
| 2. | SIGNIFICANT ACCOUNTING POLICIES (continued) |
Security Transactions, Investment Income and Expenses (continued)
received. Interest income, including amortization of premium and accretion of discounts using the effective interest method, is earned from settlement date and accrued daily.
Expenses are recorded on an accrual basis. Most expenses of the Fund can be attributed to a specific series. Expenses which cannot be directly attributed are apportioned among the series in the Fund in such a manner as deemed equitable by the Fund’s Board, taking into consideration, among other things, the nature and type of expense.
The Series uses the identified cost method for determining realized gain or loss on investments for both financial statement and federal income tax reporting purposes.
Foreign Currency Translation
The books and records of the Series are maintained in U.S. dollars. Foreign currencies, investments and other assets and liabilities are translated into U.S. dollars at the current exchange rates. Purchases and sales of investment securities and income and expenses are translated on the respective dates of such transactions. The Series does not isolate realized and unrealized gains and losses attributable to changes in the exchange rates from gains and losses that arise from changes in the market value of investments. Such fluctuations are included with net realized and unrealized gain or loss on investments. Net realized foreign currency gains and losses represent foreign currency gains and losses between trade date and settlement date on securities transactions, gains and losses on disposition of foreign currencies and the difference between the amount of income and foreign withholding taxes recorded on the books of the Series and the amounts actually received or paid.
Restricted securities
Restricted securities are purchased in private placement transactions, are not registered under the Securities Act of 1933, as amended, and may have contractual restrictions on resale. Information regarding restricted securities is included at the end of the Series’ Investment Portfolio.
Illiquid Securities
A security may be considered illiquid if so deemed in good faith by the Advisor under procedures approved by and under the general supervision and responsibility of the Fund’s Board. Securities that are illiquid are marked with the applicable footnote on the Investment Portfolio. As of June 30, 2010, the aggregate value of securities deemed illiquid was $8,370, representing less than 0.01% of the Series’ net assets.
Affiliated Companies
The 1940 Act defines “affiliated companies” to include securities in which a series owns 5% or more of the outstanding voting securities of the issuer. The following transactions were effected in shares of Avalon HealthCare Holdings, Inc. - Series D, Avalon HealthCare Holdings, Inc., and Avalon HealthCare Holdings, Inc. - Warrants 2/27/2014 for the six months ended June 30, 2010:
| | | | | | | | | | | | | | | | | |
Name of Issuer | | Number of
Shares
Held as of
12/31/09 | | Gross
Additions | | Gross
Reductions | | Number of
Shares
Held as of
6/30/10 | | Value
as of
6/30/10 | | Investment
Income | | Realized
Gain |
Avalon | | | | | | | | | | | | | | | | | |
HealthCare | | | | | | | | | | | | | | | | | |
Holdings, Inc. - | | | | | | | | | | | | | | | | | |
Series D | | 925,000 | | — | | — | | 925,000 | | $ | — | | $ | — | | $ | — |
Avalon | | | | | | | | | | | | | | | | | |
HealthCare | | | | | | | | | | | | | | | | | |
Holdings, Inc. | | 38,359 | | — | | — | | 38,359 | | $ | — | | $ | — | | $ | — |
12
Notes to Financial Statements (unaudited)
| 2. | SIGNIFICANT ACCOUNTING POLICIES (continued) |
Affiliated Companies (continued)
| | | | | | | | | | | | | | | | | |
Name of Issuer | | Number of
Shares
Held as of
12/31/09 | | Gross
Additions | | Gross
Reductions | | Number of
Shares
Held as of
6/30/10 | | Value
as of
6/30/10 | | Investment
Income | | Realized
Gain |
Avalon | | | | | | | | | | | | | | | | | |
HealthCare | | | | | | | | | | | | | | | | | |
Holdings, Inc. - | | | | | | | | | | | | | | | | | |
Warrants | | | | | | | | | | | | | | | | | |
2/27/2014 | | 38,359 | | — | | — | | 38,359 | | $ | — | | $ | — | | $ | — |
Federal Taxes
The Series’ policy is to comply with the provisions of the Internal Revenue Code applicable to regulated investment companies. The Series is not subject to federal income tax or excise tax to the extent that the Series distributes to shareholders each year its taxable income, including any net realized gains on investments, in accordance with requirements of the Internal Revenue Code. Accordingly, no provision for federal income tax or excise tax has been made in the financial statements.
Management evaluates its tax positions to determine if the tax positions taken meet the minimum recognition threshold in connection with accounting for uncertainties in income tax positions taken or expected to be taken for the purposes of measuring and recognizing tax liabilities in the financial statements. Recognition of tax benefits of an uncertain tax position is required only when the position is “more likely than not” to be sustained assuming examination by taxing authorities. At June 30, 2010, the Series has recorded no liability for net unrecognized tax benefits relating to uncertain income tax positions taken or expected to be taken in future tax returns.
The Series files income tax returns in the U.S. federal jurisdiction, various states and foreign jurisdictions, as required. No income tax returns are currently under investigation. The statute of limitations on the Series’ tax returns remains open for the years ended December 31, 2006 through December 31, 2009. The Fund is not aware of any tax positions for which it is reasonably possible that the total amounts of unrecognized tax benefits will significantly change in the next twelve months.
Additionally, based on the Fund’s understanding of the tax rules and rates related to income, gains and transactions for foreign jurisdictions in which it invests, the Series will provide for foreign taxes, and where appropriate, deferred foreign tax.
Distributions of Income and Gains
Distributions to shareholders of net investment income and net realized gains are made annually. An additional distribution may be necessary to avoid taxation of the Series. Distributions are recorded on the ex-dividend date.
Indemnifications
The Fund’s organizational documents provide former and current directors and officers with a limited indemnification against liabilities arising in connection with the performance of their duties to the Fund. In the normal course of business, the Fund may also enter into contracts that provide general indemnifications. The Fund’s maximum exposure under these arrangements is unknown as this would be dependent on future claims that may be made against the Fund. The risk of material loss from such claims is considered remote.
Other
The preparation of financial statements in conformity with accounting principles generally accepted in the United States of America requires management to make estimates and assumptions that affect the reported amounts of
13
Notes to Financial Statements (unaudited)
assets and liabilities and the disclosure of contingent assets and liabilities at the date of the financial statements and the reported amounts of income and expenses during the reporting period. Actual results could differ from those estimates.
| 3. | TRANSACTIONS WITH AFFILIATES |
The Fund has an Investment Advisory Agreement (the “Agreement”) with the Advisor, for which the Series pays a fee, computed daily and payable monthly, at an annual rate of 1.00% of the Series’ average daily net assets.
Under the Agreement, personnel of the Advisor provide the Series with advice and assistance in the choice of investments and the execution of securities transactions, and otherwise maintain the Series’ organization. The Advisor also provides the Fund with necessary office space and fund administration and support services. The salaries of all officers of the Fund (except a percentage of the Fund’s Chief Compliance Officer’s salary, which is paid by the Fund), and of all Directors who are “affiliated persons” of the Fund, or of the Advisor, and all personnel of the Fund, or of the Advisor, performing services relating to research, statistical and investment activities, are paid by the Advisor. Each “non-affiliated” Director receives an annual stipend, which is allocated among all the active series of the Fund. In addition, these Directors also receive a fee per Board meeting attended for each active series of the Fund plus a fee for each committee meeting attended.
Manning & Napier Investor Services, Inc., a registered broker-dealer affiliate of the Advisor, acts as distributor for the Fund’s shares. The services of Manning & Napier Investor Services, Inc. are provided at no additional cost to the Series.
For the six months ended June 30, 2010, the Advisor voluntarily waived fees of $758, which is included as a reduction of expenses on the Statement of Operations. The Advisor is not eligible to recoup any expenses that have been waived or reimbursed in prior years.
The Advisor has entered into agreements with PNC Global Investment Servicing (U.S.) Inc. (“PNCGIS”) under which PNCGIS serves as sub-accountant services agent and sub-transfer agent. The Fund pays the Advisor an annual fee of 0.0175% on the first $3 billion of average daily net assets (excluding Target Series); 0.015% on the next $3 billion of average daily net assets (excluding Target Series); and 0.01% of the average daily net assets in excess of $6 billion (excluding Target Series); plus a base fee of $25,500 per Series. Additionally, certain transaction-, account-, and cusip-based fees and out-of-pocket expenses, including charges for reporting relating to the Fund’s compliance program, are charged.
On July 1, 2010, The PNC Financial Services Group, Inc. sold the outstanding stock of PNC Global Investment Servicing Inc. to The Bank of New York Mellon Corporation. At the closing of the sale, PNCGIS changed its name to BNY Mellon Investment Servicing (US) Inc.
| 4. | PURCHASES AND SALES OF SECURITIES |
For the six months ended June 30, 2010, purchases and sales of securities, other than U.S. Government securities and short-term securities, were $92,151,352 and $116,749,564, respectively. There were no purchases or sales of U.S. Government securities.
14
Notes to Financial Statements (unaudited)
| 5. | CAPITAL STOCK TRANSACTIONS |
Transactions in shares of Life Sciences Series were:
| | | | | | | | | | | | | | |
| | | For the Six Months Ended 6/30/10 | | | For the Year Ended 12/31/09 | |
| | | Shares | | | Amount | | | Shares | | | Amount | |
Sold | | 1,286,435 | | | $ | 14,205,811 | | | 3,589,547 | | | $ | 27,786,051 | |
Reinvested | | — | | | | — | | | — | | | | — | |
Repurchased | | (1,967,059 | ) | | | (21,629,101 | ) | | (4,015,779 | ) | | | (31,691,255 | ) |
| | | | | | | | | | | | | | |
Total | | (680,624 | ) | | $ | (7,423,290 | ) | | (426,232 | ) | | $ | (3,905,204 | ) |
| | | | | | | | | | | | | | |
Substantially all of the Series’ shares represent investments by fiduciary accounts over which the Advisor has sole investment discretion.
The Series may trade in instruments including written and purchased options, forward foreign currency exchange contracts and futures contracts and other derivatives in the normal course of investing activities to assist in managing exposure to various market risks. The Series may be subject to various elements of risk and may involve, to a varying degree, elements of risk in excess of the amounts recognized for financial statement purposes. These risks include: the risk that changes in the value of a derivative may not correlate perfectly with the underlying asset, rate or index, counterparty credit risk related to over the counter derivatives counterparties’ failure to perform under contract terms, liquidity risk related to the lack of a liquid market for these contracts allowing the fund to close out its position(s) and documentation risk relating to disagreement over contract terms. No such investments were held by the Series during the six months ended June 30, 2010.
Investing in securities of foreign companies and foreign governments involves special risks and considerations not typically associated with investing in securities of domestic companies and the U.S. Government. These risks include revaluation of currencies and future adverse political and economic developments. Moreover, securities of foreign companies and foreign governments and their markets may be less liquid and their prices more volatile than those of comparable domestic companies and the U.S. Government.
| 8. | LIFE SCIENCES SECURITIES |
The Series may focus its investments in certain related life sciences industries; hence, the Series may subject itself to a greater degree of risk than a series that is more diversified.
| 9. | FEDERAL INCOME TAX INFORMATION |
The amount and characterization of certain income and capital gains to be distributed are determined in accordance with federal income tax regulations, which may differ from accounting principles generally accepted in the United States of America. The Series may periodically make reclassifications among its capital accounts to reflect income and gains available for distribution (or available capital loss carryovers) under income tax regulations without impacting the Series’ net asset value. Any such reclassifications are not reflected in the financial highlights.
Notes to Financial Statements (unaudited)
| 9. | FEDERAL INCOME TAX INFORMATION (continued) |
At December 31, 2009, the Series had a capital loss carryover of $37,719,346, available to the extent allowed by tax law to offset future net capital gain, if any, which will expire as follows:
| | | | |
| | | Loss Carryover | | Expiration Date |
| | $33,158,704 | | December 31, 2016 |
| | $4,560,642 | | December 31, 2017 |
At June 30, 2010 the identified cost of investments for federal income tax purposes, the resulting gross unrealized appreciation and depreciation, and the net unrealized appreciation were as follows:
| | | | |
Cost for federal income tax purposes | | $ | 251,499,757 | |
Unrealized appreciation | | $ | 31,891,568 | |
Unrealized depreciation | | | (20,546,678 | ) |
| | | | |
Net unrealized appreciation | | $ | 11,344,890 | |
| | | | |
There were no subsequent events that require recognition or disclosure. In preparing these financial statements, management of the Fund has evaluated events and transactions for potential recognition or disclosure through the date the financial statements were issued.
16
This Page Intentionally Left Blank
Literature Requests (unaudited)
Proxy Voting Policies and Procedures
A description of the policies and procedures that the Fund uses to determine how to vote proxies relating to portfolio securities is available, without charge, upon request:
| | |
By phone | | 1-800-466-3863 |
On the Securities and Exchange | | |
Commission’s (SEC) web site | | http://www.sec.gov |
Proxy Voting Record
Information regarding how the Fund voted proxies relating to portfolio securities during the most recent 12-month period ended June 30th is available, without charge, upon request:
| | |
By phone | | 1-800-466-3863 |
On the SEC’s web site | | http://www.sec.gov |
Quarterly Portfolio Holdings
The Series’ complete schedule of portfolio holdings for the 1st and 3rd quarters of each fiscal year are provided on Form N-Q, and are available, without charge, upon request:
| | |
By phone | | 1-800-466-3863 |
On the SEC’s web site | | http://www.sec.gov |
The Series’ Form N-Q may be reviewed and copied at the SEC’s Public Reference Room in Washington, D.C. Information on the operation of the Public Reference Room may be obtained by calling 1-800-SEC-0330.
Prospectus and Statement of Additional Information (SAI)
The prospectus and SAI provide additional information about each Series, including charges, expenses and risks. These documents are available, without charge, upon request:
| | |
By phone | | 1-800-466-3863 |
On the SEC’s web site | | http://www.sec.gov |
On the Advisor’s web site | | http://www.manningnapieradvisors.com |
Additional information available at www.manningnapieradvisors.com
1. Fund Holdings - Month-End
2. Fund Holdings - Quarter-End
3. Shareholder Report - Annual
4. Shareholder Report - Semi-Annual
MNLFSC-06/10-SAR

Shareholder Expense Example (unaudited)
As a shareholder of the Series, you may incur two types of costs: (1) transaction costs and (2) ongoing costs, including management fees and other Series expenses. This example is intended to help you understand your ongoing costs (in dollars) of investing in the Series and to compare these costs with the ongoing costs of investing in other mutual funds.
The example is based on an investment of $1,000 invested at the beginning of the period and held for the entire period (January 1, 2010 to June 30, 2010).
Actual Expenses
The first line of the table below provides information about actual account values and actual expenses. You may use the information in this line, together with the amount you invested, to estimate the expenses that you paid over the period. Simply divide your account value by $1,000 (for example, an $8,600 account value divided by $1,000 = 8.6), then multiply the result by the number in the first line under the heading entitled “Expenses Paid During Period” to estimate the expenses you
paid on your account during this period.
Hypothetical Example for Comparison Purposes
The second line of the table below provides information about hypothetical account values and hypothetical expenses based on the Series’ actual expense ratio and an assumed rate of return of 5% per year before expenses, which is not the Series’ actual return. The hypothetical account values and expenses may not be used to estimate the actual ending account balance or expenses you paid during the period. You may use this information to compare the ongoing costs of investing in the Series and other funds. To do so, compare this 5% hypothetical example with the 5% hypothetical examples that appear in the shareholder reports of the other funds.
Please note that the expenses shown in the table are meant to highlight your ongoing costs only and do not reflect any transaction costs. Therefore, the second line of the table is useful in comparing ongoing costs only, and will not help you determine the relative total costs of owning different funds. In addition, if these transaction costs were included, your costs would have been higher.
| | | | | | |
| | | Beginning
Account Value
1/1/10 | | Ending
Account Value
6/30/10 | | Expenses Paid
During Period*
1/1/10-06/30/10 |
Actual | | $1,000.00 | | $925.60 | | $5.35 |
Hypothetical
(5% return before expenses) | | $1,000.00 | | $1,019.24 | | $5.61 |
*Expenses are equal to the Series’ annualized expense ratio (for the six-month period) of 1.12%, multiplied by the average account value over the period, multiplied by 181/365 (to reflect the one-half year period). Expenses are based on the most recent fiscal half year. The Series’ total return would have been lower had certain expenses not been waived during the period.
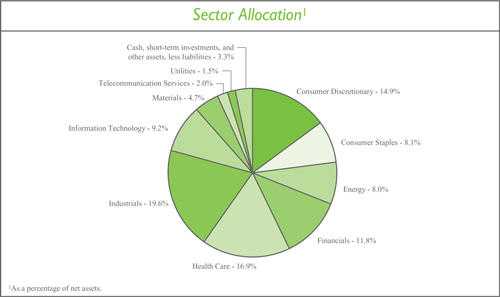
Portfolio Composition as of June 30, 2010 (unaudited)
| | | |
Market Capitalization |
Average | | $ | 1,797 Million |
Median | | | 1,347 Million |
Weighted Average | | | 1,773 Million |
| | |
Top Ten Stock Holdings2 |
| Diagnosticos da America S.A. (Brazil) | | 3.7% |
| AirTran Holdings, Inc. | | 3.1% |
| Dick’s Sporting Goods, Inc. | | 2.8% |
| Zoll Medical Corp. | | 2.7% |
| Tomra Systems ASA (Norway) | | 2.5% |
| First Commonwealth Financial Corp. | | 2.4% |
| Inverness Medical Innovations, Inc. | | 2.2% |
| BJ’s Wholesale Club, Inc. | | 2.2% |
| Cerner Corp. | | 2.2% |
| Calgon Carbon Corp. | | 2.0% |
| | | |
| | | |
2 As a percentage of total investments. | | |
Investment Portfolio - June 30, 2010 (unaudited)
| | | | | | | |
| | | Shares | | Value
(Note 2) | | |
| | | |
COMMON STOCKS - 96.7% | | | | | | | |
| | | |
Consumer Discretionary - 14.9% | | | | | | | |
Auto Components - 0.1% | | | | | | | |
Motorcar Parts of America, Inc.* | | 28,670 | | $ | 182,915 | | |
| | | | | | | |
Distributors - 1.4% | | | | | | | |
Inchcape plc (United Kingdom)* | | 585,651 | | | 2,152,549 | | |
| | | | | | | |
Hotels, Restaurants & Leisure - 4.0% | | | | | | | |
Choice Hotels International, Inc. | | 52,060 | | | 1,572,732 | | |
International Game Technology | | 94,470 | | | 1,483,179 | | |
Wendy’s - Arby’s Group, Inc. - Class A | | 783,990 | | | 3,135,960 | | |
| | | | | | | |
| | | | | 6,191,871 | | |
| | | | | | | |
Household Durables - 2.8% | | | | | | | |
NVR, Inc.* | | 4,180 | | | 2,738,025 | | |
Rodobens Negocios Imobiliarios S.A. (Brazil) | | 253,670 | | | 1,651,315 | | |
| | | | | | | |
| | | | | 4,389,340 | | |
| | | | | | | |
Multiline Retail - 0.9% | | | | | | | |
Nordstrom, Inc. | | 42,020 | | | 1,352,624 | | |
| | | | | | | |
Specialty Retail - 5.7% | | | | | | | |
Dick’s Sporting Goods, Inc.* | | 183,380 | | | 4,564,328 | | |
The Finish Line, Inc. - Class A | | 137,030 | | | 1,908,828 | | |
Lumber Liquidators Holdings, Inc.* | | 105,560 | | | 2,462,715 | | |
| | | | | | | |
| | | | | 8,935,871 | | |
| | | | | | | |
Total Consumer Discretionary | | | | | 23,205,170 | | |
| | | | | | | |
Consumer Staples - 8.1% | | | | | | | |
Food & Staples Retailing - 4.0% | | | | | | | |
BJ’s Wholesale Club, Inc.* | | 95,260 | | | 3,525,573 | | |
SUPERVALU, Inc | | 248,100 | | | 2,689,404 | | |
| | | | | | | |
| | | | | 6,214,977 | | |
| | | | | | | |
Food Products - 2.6% | | | | | | | |
Flowers Foods, Inc | | 128,450 | | | 3,138,033 | | |
Tootsie Roll Industries, Inc | | 42,966 | | | 1,016,146 | | |
| | | | | | | |
| | | | | 4,154,179 | | |
| | | | | | | |
Personal Products - 1.5% | | | | | | | |
Alberto-Culver Co | | 85,360 | | | 2,312,402 | | |
| | | | | | | |
Total Consumer Staples | | | | | 12,681,558 | | |
| | | | | | | |
Energy - 8.0% | | | | | | | |
Energy Equipment & Services - 4.6% | | | | | | | |
Calfrac Well Services Ltd. (Canada) | | 132,210 | | | 2,427,979 | | |
Dril-Quip, Inc.* | | 56,690 | | | 2,495,494 | | |
| | | | |
| | The accompanying notes are an integral part of the financial statements. | | 3 |
Investment Portfolio - June 30, 2010 (unaudited)
| | | | | | | |
| | | Shares | | Value (Note 2) | | |
| | | |
COMMON STOCKS (continued) | | | | | | | |
| | | |
Energy (continued) | | | | | | | |
Energy Equipment & Services (continued) | | | | | | | |
Trican Well Service Ltd. (Canada) | | 180,290 | | $ | 2,308,349 | | |
| | | | | | | |
| | | | | 7,231,822 | | |
| | | | | | | |
Oil, Gas & Consumable Fuels - 3.4% | | | | | | | |
Forest Oil Corp.* | | 50,270 | | | 1,375,387 | | |
Mariner Energy, Inc.* | | 76,770 | | | 1,649,020 | | |
Uranium One, Inc. (Canada)* | | 913,620 | | | 2,222,794 | | |
| | | | | | | |
| | | | | 5,247,201 | | |
| | | | | | | |
Total Energy | | | | | 12,479,023 | | |
| | | | | | | |
Financials - 11.8% | | | | | | | |
Commercial Banks - 4.2% | | | | | | | |
First Commonwealth Financial Corp | | 733,470 | | | 3,850,718 | | |
First Financial Bancorp | | 105,550 | | | 1,577,972 | | |
Wilmington Trust Corp. | | 100,650 | | | 1,116,209 | | |
| | | | | | | |
| | | | | 6,544,899 | | |
| | | | | | | |
Real Estate Investment Trusts (REITS) - 4.3% | | | | | | | |
American Campus Communities, Inc | | 63,600 | | | 1,735,644 | | |
Corporate Office Properties Trust | | 85,740 | | | 3,237,542 | | |
Home Properties, Inc | | 37,670 | | | 1,697,787 | | |
| | | | | | | |
| | | | | 6,670,973 | | |
| | | | | | | |
Thrifts & Mortgage Finance - 3.3% | | | | | | | |
First Niagara Financial Group, Inc | | 253,610 | | | 3,177,733 | | |
NewAlliance Bancshares, Inc | | 175,460 | | | 1,966,907 | | |
| | | | | | | |
| | | | | 5,144,640 | | |
| | | | | | | |
Total Financials | | | | | 18,360,512 | | |
| | | | | | | |
Health Care - 16.9% | | | | | | | |
Biotechnology - 1.0% | | | | | | | |
Celera Corp.* | | 250,160 | | | 1,638,548 | | |
| | | | | | | |
Health Care Equipment & Supplies - 6.7% | | | | | | | |
Ansell Ltd. (Australia) | | 40,873 | | | 451,736 | | |
Inverness Medical Innovations, Inc.* | | 135,100 | | | 3,601,766 | | |
OraSure Technologies, Inc.* | | 436,500 | | | 2,020,995 | | |
Zoll Medical Corp.* | | 162,290 | | | 4,398,059 | | |
| | | | | | | |
| | | | | 10,472,556 | | |
| | | | | | | |
Health Care Providers & Services - 6.9% | | | | | | | |
AMN Healthcare Services, Inc.* | | 198,620 | | | 1,485,678 | | |
Cross Country Healthcare, Inc.* | | 114,590 | | | 1,030,164 | | |
Diagnosticos da America S.A. (Brazil)* | | 629,000 | | | 5,917,130 | | |
| | | | |
| 4 | | The accompanying notes are an integral part of the financial statements. | | |
Investment Portfolio - June 30, 2010 (unaudited)
| | | | | | | |
| | | Shares | | Value (Note 2) | | |
| | | |
COMMON STOCKS (continued) | | | | | | | |
| | | |
Health Care (continued) | | | | | | | |
Health Care Providers & Services (continued) | | | | | | | |
VCA Antech, Inc.* | | 95,140 | | $ | 2,355,667 | | |
| | | | | | | |
| | | | | 10,788,639 | | |
| | | | | | | |
Health Care Technology - 2.3% | | | | | | | |
Cerner Corp.* | | 46,280 | | | 3,512,189 | | |
| | | | | | | |
Total Health Care | | | | | 26,411,932 | | |
| | | | | | | |
Industrials - 19.6% | | | | | | | |
Airlines - 4.6% | | | | | | | |
AirTran Holdings, Inc.* | | 1,041,540 | | | 5,051,469 | | |
Copa Holdings S.A. - Class A (Panama) | | 49,220 | | | 2,176,508 | | |
| | | | | | | |
| | | | | 7,227,977 | | |
| | | | | | | |
Commercial Services & Supplies - 2.6% | | | | | | | |
Tomra Systems ASA (Norway) | | 962,570 | | | 4,037,980 | | |
| | | | | | | |
Construction & Engineering - 1.1% | | | | | | | |
MYR Group, Inc.* | | 99,700 | | | 1,663,993 | | |
| | | | | | | |
Machinery - 6.4% | | | | | | | |
ArvinMeritor, Inc.* | | 140,360 | | | 1,838,716 | | |
Astec Industries, Inc.* | | 54,260 | | | 1,504,630 | | |
Lindsay Corp | | 71,800 | | | 2,275,342 | | |
SmartHeat, Inc. (China)* | | 93,610 | | | 534,513 | | |
Titan International, Inc. | | 110,190 | | | 1,098,594 | | |
Wabtec Corp | | 67,360 | | | 2,686,991 | | |
| | | | | | | |
| | | | | 9,938,786 | | |
| | | | | | | |
Road & Rail - 4.9% | | | | | | | |
Heartland Express, Inc. | | 216,350 | | | 3,141,402 | | |
Knight Transportation, Inc. | | 145,450 | | | 2,943,908 | | |
RailAmerica, Inc.* | | 158,060 | | | 1,567,955 | | |
| | | | | | | |
| | | | | 7,653,265 | | |
| | | | | | | |
Total Industrials | | | | | 30,522,001 | | |
| | | | | | | |
Information Technology - 9.2% | | | | | | | |
Communications Equipment - 3.0% | | | | | | | |
Infinera Corp.* | | 419,180 | | | 2,695,327 | | |
Riverbed Technology, Inc.* | | 74,280 | | | 2,051,614 | | |
| | | | | | | |
| | | | | 4,746,941 | | |
| | | | | | | |
Computers & Peripherals - 1.2% | | | | | | | |
Compellent Technologies, Inc.* | | 148,180 | | | 1,795,942 | | |
| | | | | | | |
Electronic Equipment, Instruments & Components - 1.9% | | | | | | | |
Cogent, Inc.* | | 333,010 | | | 3,000,420 | | |
| | | | | | | |
| | | | |
| | The accompanying notes are an integral part of the financial statements. | | 5 |
Investment Portfolio - June 30, 2010 (unaudited)
| | | | | | | | |
| | | Shares | | Value (Note 2) | | | |
| | | |
COMMON STOCKS (continued) | | | | | | | | |
| | | |
Information Technology (continued) | | | | | | | | |
IT Services - 1.1% | | | | | | | | |
Telvent GIT S.A. (Spain)* | | 100,400 | | $ | 1,676,680 | | | |
| | | | | | | | |
Software - 2.0% | | | | | | | | |
Fortinet, Inc.* | | 103,550 | | | 1,702,362 | | | |
Sonic Solutions, Inc.* | | 162,580 | | | 1,357,543 | | | |
| | | | | | | | |
| | | | | 3,059,905 | | | |
| | | | | | | | |
Total Information Technology | | | | | 14,279,888 | | | |
| | | | | | | | |
Materials - 4.7% | | | | | | | | |
Chemicals - 3.1% | | | | | | | | |
Calgon Carbon Corp.* | | 244,600 | | | 3,238,504 | | | |
The Scotts Miracle-Gro Co. - Class A | | 35,400 | | | 1,572,114 | | | |
| | | | | | | | |
| | | | | 4,810,618 | | | |
| | | | | | | | |
Construction Materials - 1.6% | | | | | | | | |
Eagle Materials, Inc | | 94,140 | | | 2,441,050 | | | |
| | | | | | | | |
Total Materials | | | | | 7,251,668 | | | |
| | | | | | | | |
Telecommunication Services - 2.0% | | | | | | | | |
Wireless Telecommunication Services - 2.0% | | | | | | | | |
SBA Communications Corp. - Class A* | | 93,550 | | | 3,181,635 | | | |
| | | | | | | | |
Utilities - 1.5% | | | | | | | | |
Independent Power Producers & Energy Traders - 1.5% | | | | | | | | |
Mirant Corp.* | | 104,160 | | | 1,099,930 | | | |
RRI Energy, Inc.* | | 312,670 | | | 1,185,019 | | | |
| | | | | | | | |
Total Utilities | | | | | 2,284,949 | | | |
| | | | | | | | |
TOTAL COMMON STOCKS | | | | | | | | |
(Identified Cost $144,069,411) | | | | | 150,658,336 | | | |
| | | | | | | | |
SHORT-TERM INVESTMENTS - 6.7% | | | | | | | | |
Dreyfus Cash Management, Inc. - Institutional Shares1 , 0.13% | | | | | | | | |
(Identified Cost $10,428,744) | | 10,428,744 | | | 10,428,744 | | | |
| | | | | | | | |
TOTAL INVESTMENTS - 103.4% | | | | | | | | |
(Identified Cost $154,498,155) | | | | | 161,087,080 | | | |
LIABILITIES, LESS OTHER ASSETS - (3.4%) | | | | | (5,246,781 | ) | | |
| | | | | | | | |
NET ASSETS - 100% | | | | $ | 155,840,299 | | | |
| | | | | | | | |
*Non-income producing security
1Rate shown is the current yield as of June 30, 2010.
| | | | |
| 6 | | The accompanying notes are an integral part of the financial statements. | | |
Statement of Assets and Liabilities (unaudited)
June 30, 2010
| | | | |
ASSETS: | | | | |
| |
Investments, at value (identified cost $154,498,155) (Note 2) | | $ | 161,087,080 | |
Receivable for securities sold | | | 155,151 | |
Receivable for fund shares sold | | | 111,236 | |
Dividends receivable | | | 101,734 | |
| | | | |
| |
TOTAL ASSETS | | | 161,455,201 | |
| | | | |
| |
LIABILITIES: | | | | |
| |
Accrued management fees (Note 3) | | | 135,035 | |
Accrued transfer agent fees (Note 3) | | | 11,108 | |
Accrued fund accounting and administration fees (Note 3) | | | 3,242 | |
Accrued Chief Compliance Officer service fees (Note 3) | | | 820 | |
Payable for securities purchased | | | 4,949,551 | |
Payable for fund shares repurchased | | | 494,541 | |
Other payables and accrued expenses | | | 20,605 | |
| | | | |
| |
TOTAL LIABILITIES | | | 5,614,902 | |
| | | | |
| |
TOTAL NET ASSETS | | $ | 155,840,299 | |
| | | | |
| |
NET ASSETS CONSIST OF: | | | | |
| |
Capital stock | | $ | 227,816 | |
Additional paid-in-capital | | | 234,041,369 | |
Undistributed net investment loss | | | (48,805 | ) |
Accumulated net realized loss on investments, foreign currency and translation of other assets and liabilities | | | (84,968,659 | ) |
Net unrealized appreciation on investments, foreign currency and translation of other assets and liabilities | | | 6,588,578 | |
| | | | |
| |
TOTAL NET ASSETS | | $ | 155,840,299 | |
| | | | |
| |
NET ASSET VALUE, OFFERING PRICE AND REDEMPTION PRICE PER SHARE - CLASS A ($155,840,299/22,781,596 shares) | | $ | 6.84 | |
| | | | |
| | | | |
| | The accompanying notes are an integral part of the financial statements. | | 7 |
Statement of Operations (unaudited)
For the Six Months Ended June 30, 2010
| | | | |
INVESTMENT INCOME: | | | | |
| |
Dividends (net of foreign taxes withheld, $15,645) | | $ | 919,616 | |
Interest | | | 55 | |
| | | | |
| |
Total Investment Income | | | 919,671 | |
| | | | |
| |
EXPENSES: | | | | |
| |
Management fees (Note 3) | | | 864,737 | |
Fund accounting and administration fees (Note 3) | | | 24,959 | |
Transfer agent fees (Note 3) | | | 16,007 | |
Directors’ fees (Note 3) | | | 6,373 | |
Chief Compliance Officer service fees (Note 3) | | | 1,761 | |
Miscellaneous | | | 55,397 | |
| | | | |
Total Expenses | | | 969,234 | |
Less reduction of expenses (Note 3) | | | (758 | ) |
| | | | |
| |
Net Expenses | | | 968,476 | |
| | | | |
| |
NET INVESTMENT LOSS | | | (48,805 | ) |
| | | | |
| |
REALIZED AND UNREALIZED GAIN (LOSS) ON INVESTMENTS AND FOREIGN CURRENCY: | | | | |
| |
Net realized gain (loss) on- | | | | |
Investments | | | 8,490,056 | |
Foreign currency and translation of other assets and liabilities | | | (4,531 | ) |
| | | | |
| | | 8,485,525 | |
| | | | |
Net change in unrealized appreciation (depreciation) on- | | | | |
Investments | | | (20,952,416 | ) |
Foreign currency and translation of other assets and liabilities | | | (556 | ) |
| | | | |
| |
| | | (20,952,972 | ) |
| | | | |
| |
NET REALIZED AND UNREALIZED GAIN (LOSS) ON INVESTMENTS AND FOREIGN CURRENCY | | | (12,467,447 | ) |
| | | | |
| |
NET DECREASE IN NET ASSETS RESULTING FROM OPERATIONS | | $ | (12,516,252 | ) |
| | | | |
| | | | |
8 | | The accompanying notes are an integral part of the financial statements. | | |
Statements of Changes in Net Assets
| | | | | | | | |
| | | For the Six
Months Ended
6/30/10
(unaudited) | | | For the Year Ended
12/31/09 | |
INCREASE (DECREASE) IN NET ASSETS: | | | | | | | | |
| | |
OPERATIONS: | | | | | | | | |
| | |
Net investment loss | | $ | (48,805 | ) | | $ | (481,098 | ) |
Net realized gain (loss) on investments and foreign currency | | | 8,485,525 | | | | (22,236,560 | ) |
Net change in unrealized appreciation (depreciation) on investments and foreign currency | | | (20,952,972 | ) | | | 78,307,749 | |
| | | | | | | | |
| | |
Net increase (decrease) from operations | | | (12,516,252 | ) | | | 55,590,091 | |
| | | | | | | | |
| | |
CAPITAL STOCK ISSUED AND REPURCHASED: | | | | | | | | |
| | |
Net decrease from capital share transactions (Note 5) | | | (3,553,438 | ) | | | (3,842,395 | ) |
| | | | | | | | |
| | |
Net increase (decrease) in net assets | | | (16,069,690 | ) | | | 51,747,696 | |
| | |
NET ASSETS: | | | | | | | | |
| | |
Beginning of period | | | 171,909,989 | | | | 120,162,293 | |
| | | | | | | | |
| | |
End of period (including undistributed net investment income (loss) of $(48,805) and $0, respectively) | | $ | 155,840,299 | | | $ | 171,909,989 | |
| | | | | | | | |
| | | | |
| | The accompanying notes are an integral part of the financial statements. | | 9 |
Financial Highlights
| | | | | | | | | | | | |
| | | For the Six
Months Ended
6/30/10 | | For the Years Ended |
| | | (unaudited) | | 12/31/09 | | 12/31/08 | | 12/31/07 | | 12/31/06 | | 12/31/05 |
Per share data (for a share outstanding throughout each period): | | | | | | | | | | | | |
Net asset value - Beginning of period | | $7.39 | | $4.98 | | $10.21 | | $13.08 | | $13.66 | | $15.01 |
| | | | | | | | | | | | |
| | | | | | |
Income (loss) from investment operations: | | | | | | | | | | | | |
Net investment loss | | —1,2 | | (0.02)1 | | (0.02) | | (0.01) | | (0.05) | | (0.07) |
Net realized and unrealized gain (loss) on investments | | (0.55) | | 2.43 | | (5.12) | | (1.25) | | 2.55 | | 2.20 |
| | | | | | | | | | | | |
Total from investment operations | | (0.55) | | 2.41 | | (5.14) | | (1.26) | | 2.50 | | 2.13 |
| | | | | | | | | | | | |
Less distributions to shareholders: | | | | | | | | | | | | |
From net realized gain on investments | | — | | — | | (0.09) | | (1.61) | | (3.08) | | (3.48) |
| | | | | | | | | | | | |
Net asset value - End of period | | $6.84 | | $7.39 | | $4.98 | | $10.21 | | $13.08 | | $13.66 |
| | | | | | | | | | | | |
Net assets - End of period | | | | | | | | | | | | |
(000’s omitted) | | $155,840 | | $171,910 | | $120,162 | | $184,998 | | $175,491 | | $154,416 |
| | | | | | | | | | | | |
Total return3 | | (7.44%) | | 48.39% | | (50.68%) | | (9.32%) | | 18.06% | | 14.11% |
Ratios (to average net assets)/ Supplemental Data: | | | | | | | | | | | | |
Expenses* | | 1.12%4 | | 1.15% | | 1.15% | | 1.14% | | 1.16% | | 1.19% |
Net investment loss | | (0.06%)4 | | (0.34%) | | (0.39%) | | (0.08%) | | (0.40%) | | (0.51%) |
Portfolio turnover | | 32% | | 76% | | 68% | | 64% | | 85% | | 55% |
|
*The investment advisor did not impose all or a portion of its management fees, CCO fees, fund accounting and transfer agent fees, and other fees in some periods and in some periods paid a portion of the Series’ expenses. If these expenses had been incurred by the Series, the expense ratio (to average net assets) would have been increased by the following amounts: |
| | 0.00%2,4 | | 0.00%2 | | N/A | | N/A | | N/A | | N/A |
1Calculated based on average shares outstanding during the periods.
2Less than 0.01%.
3Represents aggregate total return for the periods indicated, and assumes reinvestment of all distributions. Total return would have been lower had certain expenses not been waived or reimbursed during the periods. Periods less than one year are not annualized.
4Annualized.
| | | | |
| 10 | | The accompanying notes are an integral part of the financial statements. | | |
Notes to Financial Statements (unaudited)
Small Cap Series (the “Series”) is a no-load diversified series of Manning & Napier Fund, Inc. (the “Fund”). The Fund is organized in Maryland and is registered under the Investment Company Act of 1940, as amended, as an open-end management investment company.
The Series’ investment objective is to provide long-term growth by investing principally in the common stocks of companies with small market capitalizations.
The Series is authorized to issue five classes of shares (Class A, B, D, E and Z). Currently, only Class A shares have been issued. Each class of shares is substantially the same, except that class-specific distribution and shareholder servicing expenses are borne by the specific class of shares to which they relate.
The Fund’s Advisor is Manning & Napier Advisors, Inc. (the “Advisor”). Shares of the Series are offered to investors, clients and employees of the Advisor and its affiliates. The total authorized capital stock of the Fund consists of 10.0 billion shares of common stock each having a par value of $0.01. As of June 30, 2010, 6.2 billion shares have been designated in total among 29 series, of which 87.5 million have been designated as Small Cap Series Class A common stock.
| 2. | SIGNIFICANT ACCOUNTING POLICIES |
Security Valuation
Portfolio securities, including domestic equities, foreign equities, warrants and options, listed on an exchange other than the NASDAQ National Market System are valued at the latest quoted sales price of the exchange on which the security is primarily traded. Securities not traded on valuation date or securities not listed on an exchange are valued at the latest quoted bid price provided by the Fund’s pricing service. Securities listed on the NASDAQ National Market System are valued in accordance with the NASDAQ Official Closing Price.
Short-term investments that mature in sixty days or less are valued at amortized cost, which approximates market value. Investments in open-end investment companies are valued at their net asset value per share on valuation date.
Volume and level of activity in established markets for an asset or liability are evaluated to determine whether recent transactions and quoted prices are determinative of fair value. Where there have been significant decreases in volume and level of activity, further analysis and adjustment may be necessary to estimate fair value. The Series measures fair value in these instances by the use of inputs and valuation techniques which may be based upon current market prices of securities that are comparable in coupon, rating, maturity and industry and/or expectation of future cash flows. As a result of trading in relatively thin markets and/or markets that experience significant volatility, the prices used by the Series to value these securities may differ from the value that would be realized if these securities were sold, and the differences could be material.
Securities for which representative valuations or prices are not available from the Fund’s pricing service may be valued at fair value. Due to the inherent uncertainty of valuations of such securities, the fair value may differ significantly from the values that would have been used had a ready market for such securities existed. If trading or events occurring after the close of the principal market in which securities are traded are expected to materially affect the value of those securities, then they may be valued at their fair value, taking this trading or these events into account. Fair value is determined in good faith by the Advisor under procedures approved by and under the general supervision and responsibility of the Fund’s Board of Directors (the “Board”).
Various inputs are used in determining the value of the Series’ assets or liabilities carried at market value. These inputs are summarized in three broad levels. Level 1 includes quoted prices in active markets for identical assets and liabilities. Level 2 includes other significant observable inputs (including quoted prices for similar securities,
Notes to Financial Statements (unaudited)
| 2. | SIGNIFICANT ACCOUNTING POLICIES (continued) |
Security Valuation (continued)
interest rates, prepayment speeds, credit risk, etc.). Level 3 includes significant unobservable inputs (including the Series’ own assumptions in determining the fair value of investments). The inputs or methodology used for valuing securities are not necessarily an indication of the risk associated with investing in those securities.
The following is a summary of the valuation levels used for major security types as of June 30, 2010 in valuing the Series’ assets or liabilities carried at market value:
| | | | | | | | | | | | |
| Description | | 6/30/10 | | Level 1 | | Level 2 | | Level 3 |
Equity securities* | | $ | 150,658,336 | | $ | 150,658,336 | | $ | — | | $ | — |
Preferred securities | | | — | | | — | | | — | | | — |
Debt securities | | | — | | | — | | | — | | | — |
Mutual funds | | | 10,428,744 | | | 10,428,744 | | | — | | | — |
Other financial instruments** | | | — | | | — | | | — | | | — |
| | | | | | | | | | | | |
Total | | $ | 161,087,080 | | $ | 161,087,080 | | $ | — | | $ | — |
| | | | | | | | | | | | |
*Includes common stock, warrants and rights. Please see the Investment Portfolio for industry classification.
**Other financial instruments are derivative instruments not reflected in the Investment Portfolio, such as futures, forwards and swap contracts, which are valued at the unrealized appreciation/depreciation on the instrument. As of June 30, 2010, the Series did not hold any derivative instruments.
There were no Level 3 securities held by the Series as of December 31, 2009 or June 30, 2010.
The Fund’s policy is to recognize transfers in and transfers out of the valuation levels as of the end of the reporting period. There were no significant transfers between Level 1 and Level 2 as of June 30, 2010.
Additional disclosure surrounding the activity in Level 3 fair value measurement will also be effective for fiscal years beginning after December 15, 2010. Management has concluded that this will not have a material impact on the Series’ financial statements.
Security Transactions, Investment Income and Expenses
Security transactions are accounted for on trade date. Dividend income is recorded on the ex-dividend date, except that if the ex-dividend date has passed, certain dividends from foreign securities are recorded as soon as the Fund is informed of the ex-dividend date. Non-cash dividends, if any, are recorded at the fair market value of the securities received. Interest income, including amortization of premium and accretion of discounts using the effective interest method, is earned from settlement date and accrued daily.
Expenses are recorded on an accrual basis. Most expenses of the Fund can be attributed to a specific series. Expenses which cannot be directly attributed are apportioned among the series in the Fund in such a manner as deemed equitable by the Fund’s Board, taking into consideration, among other things, the nature and type of expense.
The Series uses the identified cost method for determining realized gain or loss on investments for both financial statement and federal income tax reporting purposes.
Foreign Currency Translation
The books and records of the Series are maintained in U.S. dollars. Foreign currencies, investments and other assets and liabilities are translated into U.S. dollars at the current exchange rates. Purchases and sales of investment securities and income and expenses are translated on the respective dates of such transactions. The Series does
12
Notes to Financial Statements (unaudited)
| 2. | SIGNIFICANT ACCOUNTING POLICIES (continued) |
Foreign Currency Translation (continued)
not isolate realized and unrealized gains and losses attributable to changes in the exchange rates from gains and losses that arise from changes in the market value of investments. Such fluctuations are included with net realized and unrealized gain or loss on investments. Net realized foreign currency gains and losses represent foreign currency gains and losses between trade date and settlement date on securities transactions, gains and losses on disposition of foreign currencies and the difference between the amount of income and foreign withholding taxes recorded on the books of the Series and the amounts actually received or paid.
Federal Taxes
The Series’ policy is to comply with the provisions of the Internal Revenue Code applicable to regulated investment companies. The Series is not subject to federal income tax or excise tax to the extent that the Series distributes to shareholders each year its taxable income, including any net realized gains on investments, in accordance with requirements of the Internal Revenue Code. Accordingly, no provision for federal income tax or excise tax has been made in the financial statements.
Management evaluates its tax positions to determine if the tax positions taken meet the minimum recognition threshold in connection with accounting for uncertainties in income tax positions taken or expected to be taken for the purposes of measuring and recognizing tax liabilities in the financial statements. Recognition of tax benefits of an uncertain tax position is required only when the position is “more likely than not” to be sustained assuming examination by taxing authorities. At June 30, 2010, the Series has recorded no liability for net unrecognized tax benefits relating to uncertain income tax positions taken or expected to be taken in future tax returns.
The Series files income tax returns in the U.S. federal jurisdiction, various states and foreign jurisdictions, as required. No income tax returns are currently under investigation. The statute of limitations on the Series’ tax returns remains open for the years ended December 31, 2006 through December 31, 2009. The Fund is not aware of any tax positions for which it is reasonably possible that the total amounts of unrecognized tax benefits will significantly change in the next twelve months.
Additionally, based on the Fund’s understanding of the tax rules and rates related to income, gains and transactions for foreign jurisdictions in which it invests, the Series will provide for foreign taxes, and where appropriate, deferred foreign tax.
Distributions of Income and Gains
Distributions to shareholders of net investment income and net realized gains are made annually. An additional distribution may be necessary to avoid taxation of the Series. Distributions are recorded on the ex-dividend date.
Indemnifications
The Fund’s organizational documents provide former and current directors and officers with a limited indemnification against liabilities arising in connection with the performance of their duties to the Fund. In the normal course of business, the Fund may also enter into contracts that provide general indemnifications. The Fund’s maximum exposure under these arrangements is unknown as this would be dependent on future claims that may be made against the Fund. The risk of material loss from such claims is considered remote.
Other
The preparation of financial statements in conformity with accounting principles generally accepted in the United States of America requires management to make estimates and assumptions that affect the reported amounts of assets and liabilities and the disclosure of contingent assets and liabilities at the date of the financial statements and the reported amounts of income and expenses during the reporting period. Actual results could differ from those estimates.
13
Notes to Financial Statements (unaudited)
| 3. | TRANSACTIONS WITH AFFILIATES |
The Fund has an Investment Advisory Agreement (the “Agreement”) with the Advisor, for which the Series pays a fee, computed daily and payable monthly, at an annual rate of 1.00% of the Series’ average daily net assets.
Under the Agreement, personnel of the Advisor provide the Series with advice and assistance in the choice of investments and the execution of securities transactions, and otherwise maintain the Series’ organization. The Advisor also provides the Fund with necessary office space and fund administration and support services. The salaries of all officers of the Fund (except a percentage of the Fund’s Chief Compliance Officer’s salary, which is paid by the Fund), and of all Directors who are “affiliated persons” of the Fund, or of the Advisor, and all personnel of the Fund, or of the Advisor, performing services relating to research, statistical and investment activities, are paid by the Advisor. Each “non-affiliated” Director receives an annual stipend, which is allocated among all the active series of the Fund. In addition, these Directors also receive a fee per Board meeting attended for each active series of the Fund plus a fee for each committee meeting attended.
Manning & Napier Investor Services, Inc., a registered broker-dealer affiliate of the Advisor, acts as distributor for the Fund’s shares. The services of Manning & Napier Investor Services, Inc. are provided at no additional cost to the Series.
For the six months ended June 30, 2010, the Advisor voluntarily waived fees of $758, which is included as a reduction of expenses on the Statement of Operations. The Advisor is not eligible to recoup any expenses that have been waived or reimbursed in prior years.
The Advisor has entered into agreements with PNC Global Investment Servicing (U.S.) Inc. (“PNCGIS”) under which PNCGIS serves as sub-accountant services agent and sub-transfer agent. The Fund pays the Advisor an annual fee of 0.0175% on the first $3 billion of average daily net assets (excluding Target Series); 0.015% on the next $3 billion of average daily net assets (excluding Target Series); and 0.01% of the average daily net assets in excess of $6 billion (excluding Target Series); plus a base fee of $25,500 per Series. Additionally, certain transaction-, account-, and cusip-based fees and out-of-pocket expenses, including charges for reporting relating to the Fund’s compliance program, are charged.
On July 1, 2010, The PNC Financial Services Group, Inc. sold the outstanding stock of PNC Global Investment Servicing Inc. to The Bank of New York Mellon Corporation. At the closing of the sale, PNCGIS changed its name to BNY Mellon Investment Servicing (US) Inc.
| 4. | PURCHASES AND SALES OF SECURITIES |
For the six months ended June 30, 2010, purchases and sales of securities, other than U.S. Government securities and short-term securities, were $52,877,325 and $57,100,315, respectively. There were no purchases or sales of U.S. Government securities.
Notes to Financial Statements (unaudited)
| 5. | CAPITAL STOCK TRANSACTIONS |
Transactions in Class A shares of Small Cap Series were:
| | | | | | | | | | | | | | |
| | | For the Six Months Ended 6/30/10 | | | For the Year Ended 12/31/09 | |
| | | Shares | | | Amount | | | Shares | | | Amount | |
Sold | | 1,096,791 | | | $ | 8,290,556 | | | 3,622,635 | | | $ | 20,933,139 | |
Reinvested | | — | | | | — | | | — | | | | — | |
Repurchased | | (1,568,947 | ) | | | (11,843,994 | ) | | (4,476,178 | ) | | | (24,775,534 | ) |
| | | | | | | | | | | | | | |
Total | | (472,156 | ) | | $ | (3,553,438 | ) | | (853,543 | ) | | $ | (3,842,395 | ) |
| | | | | | | | | | | | | | |
Approximately 90% of the Series’ shares represent investments by fiduciary accounts over which the Advisor has sole investment discretion.
The Series may trade in instruments including written and purchased options, forward foreign currency exchange contracts and futures contracts and other derivatives in the normal course of investing activities to assist in managing exposure to various market risks. The Series may be subject to various elements of risk and may involve, to a varying degree, elements of risk in excess of the amounts recognized for financial statement purposes. These risks include: the risk that changes in the value of a derivative may not correlate perfectly with the underlying asset, rate or index, counterparty credit risk related to over the counter derivatives counterparties’ failure to perform under contract terms, liquidity risk related to the lack of a liquid market for these contracts allowing the fund to close out its position(s) and documentation risk relating to disagreement over contract terms. No such investments were held by the Series during the six months ended June 30, 2010.
Investing in securities of foreign companies and foreign governments involves special risks and considerations not typically associated with investing in securities of domestic companies and the U.S. Government. These risks include revaluation of currencies and future adverse political and economic developments. Moreover, securities of foreign companies and foreign governments and their markets may be less liquid and their prices more volatile than those of comparable domestic companies and the U.S. Government.
| 8. | FEDERAL INCOME TAX INFORMATION |
The amount and characterization of certain income and capital gains to be distributed are determined in accordance with federal income tax regulations, which may differ from accounting principles generally accepted in the United States of America. The Series may periodically make reclassifications among its capital accounts to reflect income and gains available for distribution (or available capital loss carryovers) under income tax regulations without impacting the Series’ net asset value. Any such reclassifications are not reflected in the financial highlights.
At December 31, 2009, the Series had a capital loss carryover of $93,440,871, available to the extent allowed by tax law to offset future net capital gain, if any, which will expire as follows:
Notes to Financial Statements (unaudited)
| 8. | FEDERAL INCOME TAX INFORMATION (continued) |
| | | | |
| | | Loss Carryover | | Expiration Date |
| | $41,066,982 | | December 31, 2016 |
| | $52,373,889 | | December 31, 2017 |
At June 30, 2010, the identified cost of investments for federal income tax purposes, the resulting gross unrealized appreciation and depreciation, and the net unrealized appreciation were as follows:
| | | | |
Cost for federal income tax purposes | | $ | 154,510,983 | |
Unrealized appreciation | | $ | 19,346,105 | |
Unrealized depreciation | | | (12,770,008 | ) |
| | | | |
Net unrealized appreciation | | $ | 6,576,097 | |
| | | | |
There were no subsequent events that require recognition or disclosure. In preparing these financial statements, management of the Fund has evaluated events and transactions for potential recognition or disclosure through the date the financial statements were issued.
16
This Page Intentionally Left Blank
Literature Requests (unaudited)
Proxy Voting Policies and Procedures
A description of the policies and procedures that the Fund uses to determine how to vote proxies relating to portfolio securities is available, without charge, upon request:
| | |
By phone | | 1-800-466-3863 |
On the Securities and Exchange Commission’s (SEC) web site | | http://www.sec.gov |
Proxy Voting Record
Information regarding how the Fund voted proxies relating to portfolio securities during the most recent 12-month period ended June 30th is available, without charge, upon request:
| | |
By phone | | 1-800-466-3863 |
On the SEC’s web site | | http://www.sec.gov |
Quarterly Portfolio Holdings
The Series’ complete schedule of portfolio holdings for the 1st and 3rd quarters of each fiscal year are provided on Form N-Q, and are available, without charge, upon request:
| | |
By phone | | 1-800-466-3863 |
On the SEC’s web site | | http://www.sec.gov |
The Series’ Form N-Q may be reviewed and copied at the SEC’s Public Reference Room in Washington, D.C. Information on the operation of the Public Reference Room may be obtained by calling 1-800-SEC-0330.
Prospectus and Statement of Additional Information (SAI)
The prospectus and SAI provide additional information about each Series, including charges, expenses and risks. These documents are available, without charge, upon request:
| | |
By phone | | 1-800-466-3863 |
On the SEC’s web site | | http://www.sec.gov |
On the Advisor’s web site | | http://www.manningnapieradvisors.com |
Additional information available at www.manningnapieradvisors.com
1. Fund Holdings - Month-End
2. Fund Holdings - Quarter-End
3. Shareholder Report - Annual
4. Shareholder Report - Semi-Annual
MNSMCP-06/10-SAR

Shareholder Expense Example (unaudited)
As a shareholder of the Series, you may incur two types of costs: (1) transaction costs and (2) ongoing costs, including management fees and other Series expenses. This example is intended to help you understand your ongoing costs (in dollars) of investing in the Series and to compare these costs with the ongoing costs of investing in other mutual funds.
The example is based on an investment of $1,000 invested at the beginning of the period and held for the entire period (January 1, 2010 to June 30, 2010).
Actual Expenses
The first line of the table below provides information about actual account values and actual expenses. You may use the information in this line, together with the amount you invested, to estimate the expenses that you paid over the period. Simply divide your account value by $1,000 (for example, an $8,600 account value divided by $1,000 = 8.6), then multiply the result by the number in the first line under the heading entitled “Expenses Paid During Period” to estimate the expenses you paid on your account during this period.
Hypothetical Example for Comparison Purposes
The second line of the table below provides information about hypothetical account values and hypothetical expenses based on the Series’ actual expense ratio and an assumed rate of return of 5% per year before expenses, which is not the Series’ actual return. The hypothetical account values and expenses may not be used to estimate the actual ending account balance or expenses you paid during the period. You may use this information to compare the ongoing costs of investing in the Series and other funds. To do so, compare this 5% hypothetical example with the 5% hypothetical examples that appear in the shareholder reports of the other funds.
Please note that the expenses shown in the table are meant to highlight your ongoing costs only and do not reflect any transaction costs. Therefore, the second line of the table is useful in comparing ongoing costs only, and will not help you determine the relative total costs of owning different funds. In addition, if these transaction costs were included, your costs would have been higher.
| | | | | | |
| | | Beginning Account Value
1/1/10 | | Ending
Account Value
6/30/10 | | Expenses Paid
During Period
1/1/10-6/30/10* |
Actual | | $1,000.00 | | $ 888.00 | | $5.24 |
Hypothetical
(5% return before expenses) | | $1,000.00 | | $1,019.24 | | $5.61 |
*Expenses are equal to the Series’ annualized expense ratio (for the six-month period) of 1.12%, multiplied by the average account value over the period, multiplied by 181/365 (to reflect the one-half year period). Expenses are based on the most recent fiscal half year. The Series’ total return would have been lower had certain expenses not been waived during the period.
Portfolio Composition as of June 30, 2010 (unaudited)
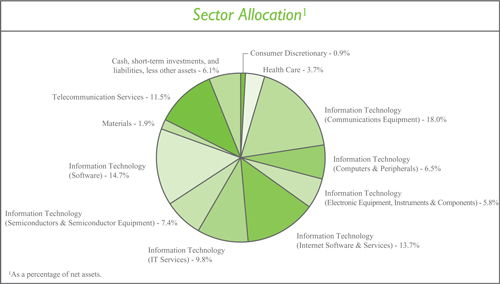
| | | | | | |
Top Ten Stock Holdings2 | | |
Crown Castle International Corp. | | 4.3% | | Infinera Corp. | | 3.4% |
Autodesk, Inc. | | 4.2% | | EMC Corp. | | 3.3% |
Google, Inc. - Class A | | 3.8% | | Microsoft Corp. | | 3.3% |
QUALCOMM, Inc. | | 3.8% | | SAP AG - ADR (Germany) | | 3.2% |
Cerner Corp. | | 3.6% | | Amdocs Ltd. (Guernsey) | | 3.2% |
| | | | | | | |
2As a percentage of total investments. | | | | | | |
Investment Portfolio - June 30, 2010 (unaudited)
| | | | | | | |
| | | Shares | | Value
(Note 2) | | |
| | | |
COMMON STOCKS - 92.1% | | | | | | | |
| | | |
Consumer Discretionary - 0.9% | | | | | | | |
Internet & Catalog Retail - 0.9% | | | | | | | |
Amazon.com, Inc.* | | 12,200 | | $ | 1,332,972 | | |
| | | | | | | |
Health Care - 3.7% | | | | | | | |
Health Care Technology - 3.7% | | | | | | | |
Cerner Corp.* | | 67,580 | | | 5,128,646 | | |
| | | | | | | |
Information Technology - 75.9% | | | | | | | |
Communications Equipment - 18.0% | | | | | | | |
Alcatel-Lucent - ADR (France)* | | 1,085,600 | | | 2,757,424 | | |
Cisco Systems, Inc.* | | 194,000 | | | 4,134,140 | | |
Infinera Corp.* | | 752,830 | | | 4,840,697 | | |
Juniper Networks, Inc.* | | 187,800 | | | 4,285,596 | | |
QUALCOMM, Inc. | | 164,130 | | | 5,390,029 | | |
Riverbed Technology, Inc.* | | 140,000 | | | 3,866,800 | | |
| | | | | | | |
| | | | | 25,274,686 | | |
| | | | | | | |
Computers & Peripherals - 6.5% | | | | | | | |
Apple, Inc.* | | 5,400 | | | 1,358,262 | | |
Compellent Technologies, Inc.* | | 258,000 | | | 3,126,960 | | |
EMC Corp.* | | 254,000 | | | 4,648,200 | | |
| | | | | | | |
| | | | | 9,133,422 | | |
| | | | | | | |
Electronic Equipment, Instruments & Components - 5.8% | | | | | | | |
Amphenol Corp. - Class A | | 35,200 | | | 1,382,656 | | |
Cogent, Inc.* | | 490,000 | | | 4,414,900 | | |
LoJack Corp.* | | 646,826 | | | 2,386,788 | | |
| | | | | | | |
| | | | | 8,184,344 | | |
| | | | | | | |
Internet Software & Services - 13.7% | | | | | | | |
comScore, Inc.* | | 231,000 | | | 3,804,570 | | |
Google, Inc. - Class A* | | 12,230 | | | 5,441,738 | | |
MercadoLibre, Inc. (Argentina)* | | 25,580 | | | 1,344,229 | | |
NetEase.com, Inc. - ADR (China)* | | 91,900 | | | 2,914,149 | | |
Tencent Holdings Ltd. (China) | | 91,500 | | | 1,533,441 | | |
Vocus, Inc.* | | 279,000 | | | 4,263,120 | | |
| | | | | | | |
| | | | | 19,301,247 | | |
| | | | | | | |
IT Services - 9.8% | | | | | | | |
Accenture plc - Class A (Ireland) | | 112,000 | | | 4,328,800 | | |
Amdocs Ltd. (Guernsey)* | | 168,000 | | | 4,510,800 | | |
Cap Gemini S.A. (France) | | 89,000 | | | 3,950,126 | | |
Telvent GIT S.A. (Spain)* | | 54,662 | | | 912,855 | | |
| | | | | | | |
| | | | | 13,702,581 | | |
| | | | | | | |
Semiconductors & Semiconductor Equipment - 7.4% | | | | | | | |
Advantest Corp. (Japan) | | 196,000 | | | 4,176,486 | | |
| | | | |
| | The accompanying notes are an integral part of the financial statements. | | 3 |
Investment Portfolio - June 30, 2010 (unaudited)
| | | | | | | | |
| | | Shares/ Principal Amount | | Value (Note 2) | | |
| | | |
COMMON STOCKS (continued) | | | | | | | | |
| | | |
Information Technology (continued) | | | | | | | | |
Semiconductors & Semiconductor Equipment (continued) | | | | | | | | |
Sumco Corp. (Japan)* | | | 201,500 | | $ | 3,393,468 | | |
Tokyo Electron Ltd. (Japan) | | | 51,000 | | | 2,800,487 | | |
| | | | | | | | |
| | | | | | 10,370,441 | | |
| | | | | | | | |
Software - 14.7% | | | | | | | | |
Adobe Systems, Inc.* | | | 48,650 | | | 1,285,820 | | |
Autodesk, Inc.* | | | 243,000 | | | 5,919,480 | | |
Fortinet, Inc.* | | | 262,000 | | | 4,307,280 | | |
Microsoft Corp. | | | 201,900 | | | 4,645,719 | | |
SAP AG - ADR (Germany) | | | 103,000 | | | 4,562,900 | | |
| | | | | | | | |
| | | | | | 20,721,199 | | |
| | | | | | | | |
Total Information Technology | | | | | | 106,687,920 | | |
| | | | | | | | |
Materials - 1.9% | | | | | | | | |
Chemicals - 1.9% | | | | | | | | |
Monsanto Co. | | | 57,790 | | | 2,671,054 | | |
| | | | | | | | |
Telecommunication Services - 9.7% | | | | | | | | |
Wireless Telecommunication Services - 9.7% | | | | | | | | |
American Tower Corp. - Class A* | | | 81,000 | | | 3,604,500 | | |
Crown Castle International Corp.* | | | 165,000 | | | 6,147,900 | | |
SBA Communications Corp. - Class A* | | | 114,000 | | | 3,877,140 | | |
| | | | | | | | |
Total Telecommunication Services | | | | | | 13,629,540 | | |
| | | | | | | | |
TOTAL COMMON STOCKS | | | | | | | | |
(Identified Cost $128,556,795) | | | | | | 129,450,132 | | |
| | | | | | | | |
CORPORATE BONDS - 1.8% | | | | | | | | |
Non-Convertible Corporate Bonds - 1.8% | | | | | | | | |
Telecommunication Services - 1.8% | | | | | | | | |
Diversified Telecommunication Services - 1.8% | | | | | | | | |
Clearwire Communications LLC - Clearwire Finance, Inc.1, 12.00%, 12/1/2015 | | | | | | | | |
(Identified Cost $2,517,779) | | $ | 2,500,000 | | | 2,490,625 | | |
| | | | | | | | |
SHORT-TERM INVESTMENTS - 7.4% | | | | | | | | |
Dreyfus Cash Management, Inc. - Institutional Shares2, 0.13% | | | | | | | | |
(Identified Cost $10,372,395) | | | 10,372,395 | | | 10,372,395 | | |
| | | | | | | | |
| | | | |
| 4 | | The accompanying notes are an integral part of the financial statements. | | |
Investment Portfolio - June 30, 2010 (unaudited)
| | | | | | | | |
| | | | | Value (Note 2) | | | |
TOTAL INVESTMENTS - 101.3% | | | | | | | | |
(Identified Cost $141,446,969) | | | | $ | 142,313,152 | | | |
LIABILITIES, LESS OTHER ASSETS - (1.3%) | | | | | (1,793,704 | ) | | |
| | | | | | | | |
NET ASSETS - 100% | | | | $ | 140,519,448 | | | |
| | | | | | | | |
ADR - American Depository Receipt
*Non-income producing security
1Restricted securities - Investment in securities that are restricted as to public resale under the Securities Act of 1933, as amended. This security has been sold under rule 144A and has been determined to be liquid under guidelines established by the Board of Directors. This security amounts to $2,490,625, or 1.8%, of the Series’ net assets as of June 30, 2010 (see Note 2 to the financial statements).
2Rate shown is the current yield as of June 30, 2010.
| | | | |
| | The accompanying notes are an integral part of the financial statements. | | 5 |
Statement of Assets and Liabilities (unaudited)
June 30, 2010
| | | | |
ASSETS: | | | | |
| |
Investments, at value (identified cost $141,446,969) (Note 2) | | $ | 142,313,152 | |
Receivable for fund shares sold | | | 121,757 | |
Interest receivable | | | 24,590 | |
Dividends receivable | | | 12,680 | |
Foreign tax reclaims receivable | | | 7,951 | |
| | | | |
| |
TOTAL ASSETS | | | 142,480,130 | |
| | | | |
| |
LIABILITIES: | | | | |
| |
Accrued management fees (Note 3) | | | 121,303 | |
Accrued transfer agent fees (Note 3) | | | 8,955 | |
Accrued fund accounting and administration fees (Note 3) | | | 3,080 | |
Accrued Chief Compliance Officer service fees (Note 3) | | | 820 | |
Payable for securities purchased | | | 1,503,310 | |
Payable for fund shares repurchased | | | 306,634 | |
Other payables and accrued expenses | | | 16,580 | |
| | | | |
| |
TOTAL LIABILITIES | | | 1,960,682 | |
| | | | |
| |
TOTAL NET ASSETS | | $ | 140,519,448 | |
| | | | |
| |
NET ASSETS CONSIST OF: | | | | |
| |
Capital stock | | $ | 162,559 | |
Additional paid-in-capital | | | 172,914,572 | |
Undistributed net investment loss | | | (412,372 | ) |
Accumulated net realized loss on investments, foreign currency and translation of other assets and liabilities | | | (33,011,494 | ) |
Net unrealized appreciation on investments | | | 866,183 | |
| | | | |
| |
TOTAL NET ASSETS | | $ | 140,519,448 | |
| | | | |
| |
NET ASSET VALUE, OFFERING PRICE AND REDEMPTION PRICE PER SHARE - CLASS A ($140,519,448/16,255,887 shares) | | $ | 8.64 | |
| | | | |
| | | | |
| 6 | | The accompanying notes are an integral part of the financial statements. | | |
Statement of Operations (unaudited)
For the Six Months Ended June 30, 2010
| | | | |
INVESTMENT INCOME: | | | | |
| |
Dividends (net of foreign taxes withheld, $41,355) | | $ | 308,061 | |
Interest | | | 148,183 | |
| | | | |
| |
Total Investment Income | | | 456,244 | |
| | | | |
| |
EXPENSES: | | | | |
| |
Management fees (Note 3) | | | 775,435 | |
Fund accounting and administration fees (Note 3) | | | 23,790 | |
Transfer agent fees (Note 3) | | | 12,713 | |
Directors’ fees (Note 3) | | | 6,373 | |
Chief Compliance Officer service fees (Note 3) | | | 1,761 | |
Miscellaneous | | | 49,302 | |
| | | | |
| |
Total Expenses | | | 869,374 | |
Less reduction of expenses (Note 3) | | | (758 | ) |
| | | | |
| |
Net Expenses | | | 868,616 | |
| | | | |
| |
NET INVESTMENT LOSS | | | (412,372 | ) |
| | | | |
| |
REALIZED AND UNREALIZED LOSS ON INVESTMENTS AND FOREIGN CURRENCY: | | | | |
| |
Net realized loss on-
Investments | | | (1,541,953 | ) |
Foreign currency and translation of other assets and liabilities | | | (1,587 | ) |
| | | | |
| |
| | | (1,543,540 | ) |
| | | | |
| |
Net change in unrealized appreciation on investments | | | (15,656,548 | ) |
| | | | |
| |
NET REALIZED AND UNREALIZED LOSS ON INVESTMENTS AND FOREIGN CURRENCY | | | (17,200,088 | ) |
| | | | |
| |
NET DECREASE IN NET ASSETS RESULTING FROM OPERATIONS | | $ | (17,612,460 | ) |
| | | | |
| | | | |
| | The accompanying notes are an integral part of the financial statements. | | 7 |
Statements of Changes in Net Assets
| | | | | | | | |
| | | For the Six
Months Ended
6/30/10
(unaudited) | | | For the Year Ended
12/31/09 | |
| INCREASE (DECREASE) IN NET ASSETS: | | | | | | |
| | |
| OPERATIONS: | | | | | | |
| | |
Net investment loss | | $ | (412,372 | ) | | $ | (1,012,429 | ) |
Net realized gain (loss) on investments and foreign currency | | | (1,543,540 | ) | | | 4,676,879 | |
Net change in unrealized appreciation (depreciation) on investments and foreign currency | | | (15,656,548 | ) | | | 66,974,543 | |
| | | | | | | | |
| | |
Net increase (decrease) from operations | | | (17,612,460 | ) | | | 70,638,993 | |
| | | | | | | | |
| | |
CAPITAL STOCK ISSUED AND REPURCHASED: | | | | | | | | |
| | |
Net increase (decrease) from capital share transactions (Note 5) | | | 401,371 | | | | (36,020,529 | ) |
| | | | | | | | |
| | |
Net increase (decrease) in net assets | | | (17,211,089 | ) | | | 34,618,464 | |
| | |
NET ASSETS: | | | | | | | | |
| | |
Beginning of period | | | 157,730,537 | | | | 123,112,073 | |
| | | | | | | | |
| | |
End of period (including undistributed net investment income (loss) of $(412,372) and $0, respectively) | | $ | 140,519,448 | | | $ | 157,730,537 | |
| | | | | | | | |
| | | | |
| 8 | | The accompanying notes are an integral part of the financial statements. | | |
Financial Highlights
| | | | | | | | | | | | |
| | | For the Six
Months Ended
6/30/10 | | | | For the Years Ended | | |
| | | (unaudited) | | 12/31/09 | | 12/31/08 | | 12/31/07 | | 12/31/06 | | 12/31/05 |
Per share data (for a share outstanding throughout each period): | | | | | | | | | | | | |
Net asset value - Beginning of period | | $9.73 | | $6.01 | | $11.29 | | $10.41 | | $8.37 | | $8.19 |
| | | | | | | | | | | | |
Income (loss) from investment operations: | | | | | | | | | | | | |
Net investment loss | | (0.03)1 | | (0.05)1 | | (0.05) | | (0.05) | | (0.01) | | (0.03) |
Net realized and unrealized gain (loss) on investments | | (1.06) | | 3.77 | | (5.09) | | 2.34 | | 2.05 | | 0.21 |
| | | | | | | | | | | | |
Total from investment operations | | (1.09) | | 3.72 | | (5.14) | | 2.29 | | 2.04 | | 0.18 |
| | | | | | | | | | | | |
Less distributions to shareholders: | | | | | | | | | | | | |
From net realized gain on investments | | — | | — | | (0.14) | | (1.41) | | — | | — |
| | | | | | | | | | | | |
Net asset value - End of period | | $8.64 | | $9.73 | | $6.01 | | $11.29 | | $10.41 | | $8.37 |
| | | | | | | | | | | | |
Net assets - End of period
(000’s omitted) | | $140,519 | | $157,731 | | $123,112 | | $227,679 | | $167,252 | | $110,656 |
| | | | | | | | | | | | |
Total return2 | | (11.20%) | | 61.90% | | (45.86%) | | 22.55% | | 24.37% | | 2.20% |
Ratios (to average net assets)/Supplemental Data: | | | | | | | | | | | | |
Expenses* | | 1.12%3 | | 1.13% | | 1.13% | | 1.13% | | 1.16% | | 1.20% |
Net investment loss | | (0.53%)3 | | (0.68%) | | (0.53%) | | (0.53%) | | (0.14%) | | (0.48%) |
Portfolio turnover | | 33% | | 55% | | 65% | | 79% | | 83% | | 116% |
*The investment advisor did not impose all or a portion of its management fees, CCO fees, fund accounting and transfer agent fees, and other fees in some periods and in some periods paid a portion of the Series’ expenses. If these expenses had been incurred by the Series, the expense ratio (to average net assets) would have been increased by the following amounts: |
| | 0.00%3,4 | | 0.00%4 | | N/A | | N/A | | N/A | | 0.03% |
1Calculated based on average shares outstanding during the periods.
2Represents aggregate total return for the periods indicated, and assumes reinvestment of all distributions. Total return would have been lower had certain expenses not been waived or reimbursed during the periods. Periods less than one year are not annualized.
3Annualized.
4Less than 0.01%.
| | | | |
| | The accompanying notes are an integral part of the financial statements. | | 9 |
Notes to Financial Statements (unaudited)
Technology Series (the “Series”) is a no-load diversified series of Manning & Napier Fund, Inc. (the “Fund”). The Fund is organized in Maryland and is registered under the Investment Company Act of 1940, as amended, as an open-end management investment company.
The Series’ investment objective is to provide long-term growth by investing principally in the common stocks of companies in technology-based industries.
The Fund’s Advisor is Manning & Napier Advisors, Inc. (the “Advisor”). On August 8, 2000, the Series resumed sales of shares to advisory clients and employees of the Advisor and its affiliates. The Series resumed offering shares directly to investors on May 18, 2004, as it had done previously from time to time. The total authorized capital stock of the Fund consists of 10.0 billion shares of common stock each having a par value of $0.01. As of June 30, 2010, 6.2 billion shares have been designated in total among 29 series, of which 100 million have been designated as Technology Series Class A common stock.
| 2. | SIGNIFICANT ACCOUNTING POLICIES |
Security Valuation
Portfolio securities, including domestic equities, foreign equities, warrants and options, listed on an exchange other than the NASDAQ National Market System are valued at the latest quoted sales price of the exchange on which the security is primarily traded. Securities not traded on valuation date or securities not listed on an exchange are valued at the latest quoted bid price provided by the Fund’s pricing service. Securities listed on the NASDAQ National Market System are valued in accordance with the NASDAQ Official Closing Price.
Debt securities, including corporate bonds will normally be valued on the basis of evaluated bid prices provided by an independent pricing service. Certain investments in securities held by the Series may be valued on a basis of a price provided by a principal market maker. These prices may differ from the value that would have been used had a broader market for securities existed.
Short-term investments that mature in sixty days or less are valued at amortized cost, which approximates market value. Investments in open-end investment companies are valued at their net asset value per share on valuation date.
Volume and level of activity in established markets for an asset or liability are evaluated to determine whether recent transactions and quoted prices are determinative of fair value. Where there have been significant decreases in volume and level of activity, further analysis and adjustment may be necessary to estimate fair value. The Series measures fair value in these instances by the use of inputs and valuation techniques which may be based upon current market prices of securities that are comparable in coupon, rating, maturity and industry and/or expectation of future cash flows. As a result of trading in relatively thin markets and/or markets that experience significant volatility, the prices used by the Series to value these securities may differ from the value that would be realized if these securities were sold, and the differences could be material.
Securities for which representative valuations or prices are not available from the Fund’s pricing service may be valued at fair value. Due to the inherent uncertainty of valuations of such securities, the fair value may differ significantly from the values that would have been used had a ready market for such securities existed. If trading or events occurring after the close of the principal market in which securities are traded are expected to materially affect the value of those securities, then they may be valued at their fair value, taking this trading or these events into account. Fair value is determined in good faith by the Advisor under procedures approved by and under the general supervision and responsibility of the Fund’s Board of Directors (the “Board”).
Notes to Financial Statements (unaudited)
| 2. | SIGNIFICANT ACCOUNTING POLICIES (continued) |
Security Valuation (continued)
Various inputs are used in determining the value of the Series’ assets or liabilities carried at market value. These inputs are summarized in three broad levels. Level 1 includes quoted prices in active markets for identical assets and liabilities. Level 2 includes other significant observable inputs (including quoted prices for similar securities, interest rates, prepayment speeds, credit risk, etc.). Level 3 includes significant unobservable inputs (including the Series’ own assumptions in determining the fair value of investments). The inputs or methodology used for valuing securities are not necessarily an indication of the risk associated with investing in those securities.
The following is a summary of the valuation levels used for major security types as of June 30, 2010 in valuing the Series’ assets or liabilities carried at market value:
| | | | | | | | | | | | |
| Description | | 6/30/10 | | Level 1 | | Level 2 | | Level 3 |
Equity securities* | | $ | 129,450,132 | | $ | 129,450,132 | | $ | — | | $ | — |
Preferred securities | | | — | | | — | | | — | | | — |
Debt securities: | | | | | | | | | | | | |
Corporate debt | | | 2,490,625 | | | — | | | 2,490,625 | | | — |
Mutual funds | | | 10,372,395 | | | 10,372,395 | | | — | | | — |
Other financial instruments** | | | — | | | — | | | — | | | — |
| | | | | | | | | | | | |
Total | | $ | 142,313,152 | | $ | 139,822,527 | | $ | 2,490,625 | | $ | — |
| | | | | | | | | | | | |
*Includes common stock, warrants and rights. Please see the Investment Portfolio for industry classification.
**Other financial instruments are derivative instruments not reflected in the Investment Portfolio, such as futures, forwards and swap contracts, which are valued at the unrealized appreciation/depreciation on the instrument. As of June 30, 2010, the Series did not hold any derivative instruments.
There were no Level 3 securities held by the Series as of December 31, 2009 or June 30, 2010.
The Fund’s policy is to recognize transfers in and transfers out of the valuation levels as of the end of the reporting period. There were no significant transfers between Level 1 and Level 2 as of June 30, 2010.
Additional disclosure surrounding the activity in Level 3 fair value measurement will also be effective for fiscal years beginning after December 15, 2010. Management has concluded that this will not have a material impact on the Series’ financial statements.
Security Transactions, Investment Income and Expenses
Security transactions are accounted for on trade date. Dividend income is recorded on the ex-dividend date, except that if the ex-dividend date has passed, certain dividends from foreign securities are recorded as soon as the Fund is informed of the ex-dividend date. Non-cash dividends, if any, are recorded at the fair market value of the securities received. Interest income, including amortization of premium and accretion of discounts using the effective interest method, is earned from settlement date and accrued daily.
Expenses are recorded on an accrual basis. Most expenses of the Fund can be attributed to a specific series. Expenses which cannot be directly attributed are apportioned among the series in the Fund in such a manner as deemed equitable by the Fund’s Board, taking into consideration, among other things, the nature and type of expense.
The Series uses the identified cost method for determining realized gain or loss on investments for both financial statement and federal income tax reporting purposes.
11
Notes to Financial Statements (unaudited)
| 2. | SIGNIFICANT ACCOUNTING POLICIES (continued) |
Foreign Currency Translation
The books and records of the Series are maintained in U.S. dollars. Foreign currencies, investments and other assets and liabilities are translated into U.S. dollars at the current exchange rates. Purchases and sales of investment securities and income and expenses are translated on the respective dates of such transactions. The Series does not isolate realized and unrealized gains and losses attributable to changes in the exchange rates from gains and losses that arise from changes in the market value of investments. Such fluctuations are included with net realized and unrealized gain or loss on investments. Net realized foreign currency gains and losses represent foreign currency gains and losses between trade date and settlement date on securities transactions, gains and losses on disposition of foreign currencies and the difference between the amount of income and foreign withholding taxes recorded on the books of the Series and the amounts actually received or paid.
Federal Taxes
The Series’ policy is to comply with the provisions of the Internal Revenue Code applicable to regulated investment companies. The Series is not subject to federal income tax or excise tax to the extent that the Series distributes to shareholders each year its taxable income, including any net realized gains on investments, in accordance with requirements of the Internal Revenue Code. Accordingly, no provision for federal income tax or excise tax has been made in the financial statements.
Management evaluates its tax positions to determine if the tax positions taken meet the minimum recognition threshold in connection with accounting for uncertainties in income tax positions taken or expected to be taken for the purposes of measuring and recognizing tax liabilities in the financial statements. Recognition of tax benefits of an uncertain tax position is required only when the position is “more likely than not” to be sustained assuming examination by taxing authorities. At June 30, 2010, the Series has recorded no liability for net unrecognized tax benefits relating to uncertain income tax positions taken or expected to be taken in future tax returns.
The Series files income tax returns in the U.S. federal jurisdiction, various states and foreign jurisdictions, as required. No income tax returns are currently under investigation. The statute of limitations on the Series’ tax returns remains open for the years ended December 31, 2006 through December 31, 2009. The Fund is not aware of any tax positions for which it is reasonably possible that the total amounts of unrecognized tax benefits will significantly change in the next twelve months.
Additionally, based on the Fund’s understanding of the tax rules and rates related to income, gains and transactions for foreign jurisdictions in which it invests, the Series will provide for foreign taxes, and where appropriate, deferred foreign tax.
Distributions of Income and Gains
Distributions to shareholders of net investment income and net realized gains are made annually. An additional distribution may be necessary to avoid taxation of the Series. Distributions are recorded on the ex-dividend date.
Indemnifications
The Fund’s organizational documents provide former and current directors and officers with a limited indemnification against liabilities arising in connection with the performance of their duties to the Fund. In the normal course of business, the Fund may also enter into contracts that provide general indemnifications. The Fund’s maximum exposure under these arrangements is unknown as this would be dependent on future claims that may be made against the Fund. The risk of material loss from such claims is considered remote.
Other
The preparation of financial statements in conformity with accounting principles generally accepted in the United States of America requires management to make estimates and assumptions that affect the reported amounts of
12
Notes to Financial Statements (unaudited)
| 2. | SIGNIFICANT ACCOUNTING POLICIES (continued) |
Other (continued)
assets and liabilities and the disclosure of contingent assets and liabilities at the date of the financial statements and the reported amounts of income and expenses during the reporting period. Actual results could differ from those estimates.
| 3. | TRANSACTIONS WITH AFFILIATES |
The Fund has an Investment Advisory Agreement (the “Agreement”) with the Advisor, for which the Series pays a fee, computed daily and payable monthly, at an annual rate of 1.00% of the Series’ average daily net assets.
Under the Agreement, personnel of the Advisor provide the Series with advice and assistance in the choice of investments and the execution of securities transactions, and otherwise maintain the Series’ organization. The Advisor also provides the Fund with necessary office space and fund administration and support services. The salaries of all officers of the Fund (except a percentage of the Fund’s Chief Compliance Officer’s salary, which is paid by the Fund), and of all Directors who are “affiliated persons” of the Fund, or of the Advisor, and all personnel of the Fund, or of the Advisor, performing services relating to research, statistical and investment activities, are paid by the Advisor. Each “non-affiliated” Director receives an annual stipend, which is allocated among all the active series of the Fund. In addition, these Directors also receive a fee per Board meeting attended for each active series of the Fund plus a fee for each committee meeting attended.
The Advisor has contractually agreed, until at least April 30, 2011, to waive its fee and, if necessary, pay other operating expenses of the Series in order to maintain total direct annual fund operating expenses for the Series at no more than 1.20% of average daily net assets each year. For the six months ended June 30, 2010, the Advisor voluntarily waived fees of $758, which is included as a reduction of expenses on the Statement of Operations. The Advisor is not eligible to recoup any expenses that have been waived or reimbursed in prior years.
Manning & Napier Investor Services, Inc., a registered broker-dealer affiliate of the Advisor, acts as distributor for the Fund’s shares. The services of Manning & Napier Investor Services, Inc. are provided at no additional cost to the Series.
The Advisor has entered into agreements with PNC Global Investment Servicing (U.S.) Inc. (“PNCGIS”) under which PNCGIS serves as sub-accountant services agent and sub-transfer agent. The Fund pays the Advisor an annual fee of 0.0175% on the first $3 billion of average daily net assets (excluding Target Series); 0.015% on the next $3 billion of average daily net assets (excluding Target Series); and 0.01% of the average daily net assets in excess of $6 billion (excluding Target Series); plus a base fee of $25,500 per Series. Additionally, certain transaction-, account-, and cusip-based fees and out-of-pocket expenses, including charges for reporting relating to the Fund’s compliance program, are charged.
On July 1, 2010, The PNC Financial Services Group, Inc. sold the outstanding stock of PNC Global Investment Servicing Inc. to The Bank of New York Mellon Corporation. At the closing of the sale, PNCGIS changed its name to BNY Mellon Investment Servicing (US) Inc.
| 4. | PURCHASES AND SALES OF SECURITIES |
For the six months ended June 30, 2010, purchases and sales of securities, other than U.S. Government securities and short-term securities, were $54,268,779 and $47,897,647, respectively. There were no purchases or sales of U.S. Government securities.
13
Notes to Financial Statements (unaudited)
| 5. | CAPITAL STOCK TRANSACTIONS |
Transactions in shares of Technology Series were:
| | | | | | | | | | | | | | |
| | | For the Six Months Ended 6/30/10 | | | For the Year Ended 12/31/09 | |
| | | Shares | | | Amount | | | Shares | | | Amount | |
Sold | | 859,903 | | | $ | 8,307,960 | | | 1,678,722 | | | $ | 12,866,101 | |
Reinvested | | — | | | | — | | | — | | | | — | |
Repurchased | | (818,799 | ) | | | (7,906,589 | ) | | (5,953,766 | ) | | | (48,886,630 | ) |
| | | | | | | | | | | | | | |
Total | | 41,104 | | | $ | 401,371 | | | (4,275,044 | ) | | $ | (36,020,529 | ) |
| | | | | | | | | | | | | | |
Substantially all of the Series’ shares represent investments by fiduciary accounts over which the Advisor has sole investment discretion.
The Series may trade in instruments including written and purchased options, forward foreign currency exchange contracts and futures contracts and other derivatives in the normal course of investing activities to assist in managing exposure to various market risks. The Series may be subject to various elements of risk and may involve, to a varying degree, elements of risk in excess of the amounts recognized for financial statement purposes. These risks include: the risk that changes in the value of a derivative may not correlate perfectly with the underlying asset, rate or index, counterparty credit risk related to over the counter derivatives counterparties’ failure to perform under contract terms, liquidity risk related to the lack of a liquid market for these contracts allowing the fund to close out its position(s) and documentation risk relating to disagreement over contract terms. No such investments were held by the Series during the six months ended June 30, 2010.
Investing in securities of foreign companies and foreign governments involves special risks and considerations not typically associated with investing in securities of domestic companies and the U.S. Government. These risks include revaluation of currencies and future adverse political and economic developments. Moreover, securities of foreign companies and foreign governments and their markets may be less liquid and their prices more volatile than those of comparable domestic companies and the U.S. Government.
The Series may focus its investments in certain related technology industries; hence, the Series may subject itself to a greater degree of risk than a series that is more diversified.
| 9. | FEDERAL INCOME TAX INFORMATION |
The amount and characterization of certain income and capital gains to be distributed are determined in accordance with federal income tax regulations, which may differ from accounting principles generally accepted in the United States of America. The Series may periodically make reclassifications among its capital accounts to reflect income and gains available for distribution (or available capital loss carryovers) under income tax regulations without impacting the Series’ net asset value. Any such reclassifications are not reflected in the financial highlights.
For the year ended December 31, 2009, the Series elected to defer capital losses of $224,297, attributable to Post-October losses.
Notes to Financial Statements (unaudited)
| 9. | FEDERAL INCOME TAX INFORMATION (continued) |
At December 31, 2009, the Series had a capital loss carryover of $30,994,029, available to the extent allowed by tax law to offset future net capital gain, if any, which will expire as follows:
| | |
| Loss Carryover | | Expiration Date |
$19,643,426 | | December 31, 2016 |
$11,350,603 | | December 31, 2017 |
At June 30, 2010, the identified cost of investments for federal income tax purposes, the resulting gross unrealized appreciation and depreciation, and the net unrealized appreciation were as follows:
| | | | | | |
Cost for federal income tax purposes | | $ | 141,696,597 | | | |
Unrealized appreciation | | $ | 13,659,360 | | | |
Unrealized depreciation | | | (13,042,805 | ) | | |
| | | | | | |
Net unrealized appreciation | | $ | 616,555 | | | |
| | | | | | |
There were no subsequent events that require recognition or disclosure. In preparing these financial statements, management of the Fund has evaluated events and transactions for potential recognition or disclosure through the date the financial statements were issued.
15
This Page Intentionally Left Blank
This Page Intentionally Left Blank
Literature Requests (unaudited)
Proxy Voting Policies and Procedures
A description of the policies and procedures that the Fund uses to determine how to vote proxies relating to portfolio securities is available, without charge, upon request:
| | |
By phone | | 1-800-466-3863 |
On the Securities and Exchange | | |
Commission’s (SEC) web site | | http://www.sec.gov |
Proxy Voting Record
Information regarding how the Fund voted proxies relating to portfolio securities during the most recent 12-month period ended June 30th is available, without charge, upon request:
| | |
By phone | | 1-800-466-3863 |
On the SEC’s web site | | http://www.sec.gov |
Quarterly Portfolio Holdings
The Series’ complete schedule of portfolio holdings for the 1st and 3rd quarters of each fiscal year are provided on Form N-Q, and are available, without charge, upon request:
| | |
By phone | | 1-800-466-3863 |
On the SEC’s web site | | http://www.sec.gov |
The Series’ Form N-Q may be reviewed and copied at the SEC’s Public Reference Room in Washington, D.C. Information on the operation of the Public Reference Room may be obtained by calling 1-800-SEC-0330.
Prospectus and Statement of Additional Information (SAI)
The prospectus and SAI provide additional information about each Series, including charges, expenses and risks. These documents are available, without charge, upon request:
| | | | |
By phone | | | | 1-800-466-3863 |
On the SEC’s web site | | | | http://www.sec.gov |
On the Advisor’s web site | | | | http://www.manningnapieradvisors.com |
Additional information available at www.manningnapieradvisors.com
1. Fund Holdings - Month-End
2. Fund Holdings - Quarter-End
3. Shareholder Report - Annual
4. Shareholder Report - Semi-Annual
MNTECH-06/10-SAR

Shareholder Expense Example (unaudited)
As a shareholder of the Series, you may incur two types of costs: (1) transaction costs and (2) ongoing costs, including management fees and other Series expenses. This example is intended to help you understand your ongoing costs (in dollars) of investing in the Series and to compare these costs with the ongoing costs of investing in other mutual funds.
The example is based on an investment of $1,000 invested at the beginning of the period and held for the entire period (January 1, 2010 to June 30, 2010).
Actual Expenses
The first line of the table below provides information about actual account values and actual expenses. You may use the information in this line, together with the amount you invested, to estimate the expenses that you paid over the period. Simply divide your account value by $1,000 (for example, an $8,600 account value divided by $1,000 = 8.6), then multiply the result by the number in the first line under the heading entitled “Expenses Paid During Period” to estimate the expenses you paid on your account during this period.
Hypothetical Example for Comparison Purposes
The second line of the table below provides information about hypothetical account values and hypothetical expenses based on the Series’ actual expense ratio and an assumed rate of return of 5% per year before expenses, which is not the Series’ actual return. The hypothetical account values and expenses may not be used to estimate the actual ending account balance or expenses you paid during the period. You may use this information to compare the ongoing costs of investing in the Series and other funds. To do so, compare this 5% hypothetical example with the 5% hypothetical examples that appear in the shareholder reports of the other funds.
Please note that the expenses shown in the table are meant to highlight your ongoing costs only and do not reflect any transaction costs. Therefore, the second line of the table is useful in comparing ongoing costs only, and will not help you determine the relative total costs of owning different funds. In addition, if these transaction costs were included, your costs would have been higher.
| | | | | | |
| | | Beginning
Account Value
1/1/10 | | Ending
Account Value
6/30/10 | | Expenses Paid
During Period*
1/1/10-6/30/10 |
Actual | | $1,000.00 | | $ 915.30 | | $5.41 |
Hypothetical
(5% return before expenses) | | $1,000.00 | | $1,019.14 | | $5.71 |
*Expenses are equal to the Series’ annualized expense ratio (for the six-month period) of 1.14%, multiplied by the average account value over the period, multiplied by 181/365 (to reflect the one-half year period). Expenses are based on the most recent fiscal half year. The Series’ total return would have been lower had certain expenses not been waived during the period.
Portfolio Composition as of June 30, 2010 (unaudited)
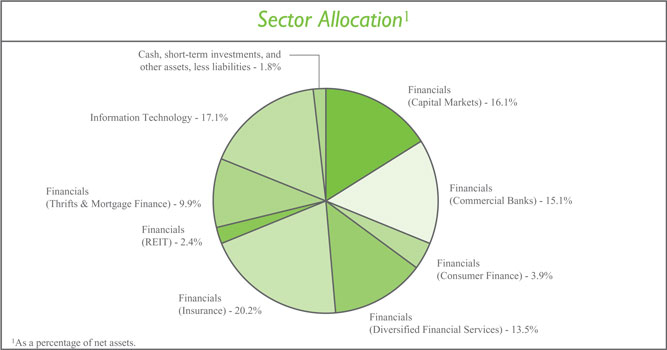
| | | | | | | | |
| Top Ten Stock Holdings2 |
JPMorgan Chase & Co. | | 4.9% | | | | Willis Group Holdings plc (United Kingdom) | | 3.2% |
The Bank of New York Mellon Corp. | | 4.5% | | | | HSBC Holdings plc - ADR (United Kingdom) | | 3.1% |
Moody’s Corp. | | 4.5% | | | | ICICI Bank Ltd. - ADR (India) | | 3.1% |
The Progressive Corp. | | 4.1% | | | | GAM Holding Ltd. (Switzerland) | | 3.1% |
The Western Union Co. | | 3.8% | | | | First Niagara Financial Group, Inc. | | 3.1% |
| | | | | |
2 As a percentage of total investments. | | | | | | | | |
Investment Portfolio - June 30, 2010 (unaudited)
| | | | | | | |
| | | Shares | | Value
(Note 2) | | |
| | | |
COMMON STOCKS - 98.2% | | | | | | | |
| | | |
Financials - 81.1% | | | | | | | |
Capital Markets - 16.1% | | | | | | | |
The Bank of New York Mellon Corp.1 | | 219,000 | | $ | 5,407,110 | | |
Credit Suisse Group AG - ADR (Switzerland) | | 28,600 | | | 1,070,498 | | |
GAM Holding Ltd. (Switzerland)* | | 342,110 | | | 3,729,455 | | |
The Goldman Sachs Group, Inc. | | 18,300 | | | 2,402,241 | | |
Legg Mason, Inc. | | 120,960 | | | 3,390,509 | | |
Northern Trust Corp. | | 54,000 | | | 2,521,800 | | |
State Street Corp. | | 31,000 | | | 1,048,420 | | |
| | | | | | | |
| | | | | 19,570,033 | | |
| | | | | | | |
Commercial Banks - 15.1% | | | | | | | |
Banco Santander S.A. - ADR (Spain) | | 123,000 | | | 1,291,500 | | |
Barclays plc - ADR (United Kingdom) | | 66,000 | | | 1,048,740 | | |
First Commonwealth Financial Corp. | | 423,000 | | | 2,220,750 | | |
First Financial Bancorp | | 80,000 | | | 1,196,000 | | |
HSBC Holdings plc - ADR (United Kingdom) | | 83,540 | | | 3,808,589 | | |
ICICI Bank Ltd. - ADR (India) | | 103,400 | | | 3,736,876 | | |
Societe Generale - ADR (France)2 | | 117,550 | | | 967,436 | | |
U.S. Bancorp | | 105,160 | | | 2,350,326 | | |
Wilmington Trust Corp. | | 156,000 | | | 1,730,040 | | |
| | | | | | | |
| | | | | 18,350,257 | | |
| | | | | | | |
Consumer Finance - 3.9% | | | | | | | |
American Express Co. | | 90,000 | | | 3,573,000 | | |
Discover Financial Services | | 83,000 | | | 1,160,340 | | |
| | | | | | | |
| | | | | 4,733,340 | | |
| | | | | | | |
Diversified Financial Services - 13.5% | | | | | | | |
Bank of America Corp. | | 82,000 | | | 1,178,340 | | |
Deutsche Boerse AG (Germany) | | 37,000 | | | 2,265,897 | | |
Financiere Marc de Lacharriere S.A. (Fimalac) (France) | | 42,400 | | | 1,633,242 | | |
JPMorgan Chase & Co. | | 161,000 | | | 5,894,210 | | |
Moody’s Corp. | | 271,000 | | | 5,398,320 | | |
| | | | | | | |
| | | | | 16,370,009 | | |
| | | | | | | |
Insurance - 20.2% | | | | | | | |
Allianz SE (Germany) | | 37,000 | | | 3,703,348 | | |
The Allstate Corp. | | 124,000 | | | 3,562,520 | | |
Brown & Brown, Inc. | | 190,000 | | | 3,636,600 | | |
Principal Financial Group, Inc. | | 50,000 | | | 1,172,000 | | |
The Progressive Corp. | | 262,280 | | | 4,909,882 | | |
Willis Group Holdings plc (United Kingdom) | | 128,000 | | | 3,846,400 | | |
Zurich Financial Services AG (Switzerland) | | 16,500 | | | 3,666,326 | | |
| | | | | | | |
| | | | | 24,497,076 | | |
| | | | | | | |
| | | | |
| 3 | | The accompanying notes are an integral part of the financial statements. | | |
Investment Portfolio - June 30, 2010 (unaudited)
| | | | | | | |
| | | Shares | | Value (Note 2) | | |
COMMON STOCKS (continued) | | | | | | | |
| | | |
Financials (continued) | | | | | | | |
Real Estate Investment Trusts (REITS) - 2.4% | | | | | | | |
Corporate Office Properties Trust | | 76,000 | | $ | 2,869,760 | | |
| | | | | | | |
Thrifts & Mortgage Finance - 9.9% | | | | | | | |
First Niagara Financial Group, Inc. | | 296,000 | | | 3,708,880 | | |
Hudson City Bancorp, Inc. | | 98,000 | | | 1,200,500 | | |
NewAlliance Bancshares, Inc. | | 318,000 | | | 3,564,780 | | |
People’s United Financial, Inc. | | 261,540 | | | 3,530,790 | | |
| | | | | | | |
| | | | | 12,004,950 | | |
| | | | | | | |
Total Financials | | | | | 98,395,425 | | |
| | | | | | | |
Information Technology - 17.1% | | | | | | | |
IT Services - 17.1% | | | | | | | |
Automatic Data Processing, Inc. | | 85,550 | | | 3,444,243 | | |
Cielo S.A. (Brazil) | | 330,000 | | | 2,804,543 | | |
MasterCard, Inc. - Class A | | 13,000 | | | 2,593,890 | | |
Paychex, Inc. | | 90,000 | | | 2,337,300 | | |
Redecard S.A. (Brazil) | | 173,000 | | | 2,445,003 | | |
Visa, Inc. - Class A | | 36,000 | | | 2,547,000 | | |
The Western Union Co. | | 305,000 | | | 4,547,550 | | |
| | | | | | | |
Total Information Technology | | | | | 20,719,529 | | |
| | | | | | | |
TOTAL COMMON STOCKS | | | | | | | |
(Identified Cost $131,766,004) | | | | | 119,114,954 | | |
| | | | | | | |
| | | |
SHORT-TERM INVESTMENTS - 1.6% | | | | | | | |
| | | |
Dreyfus Cash Management, Inc. - Institutional Shares3, 0.13% | | | | | | | |
(Identified Cost $1,908,232) | | 1,908,232 | | | 1,908,232 | | |
| | | | | | | |
| | | |
TOTAL INVESTMENTS - 99.8% | | | | | | | |
(Identified Cost $133,674,236) | | | | | 121,023,186 | | |
| | | | | | | |
OTHER ASSETS, LESS LIABILITIES - 0.2% | | | | | 235,952 | | |
| | | | | | | |
NET ASSETS - 100% | | | | $ | 121,259,138 | | |
| | | | | | | |
ADR - American Depository Receipt
*Non-income producing security
1The Bank of New York Mellon Corp. is the Series’ custodian.
2Latest quoted sales price is not available and the latest quoted bid price was used to value the security.
3Rate shown is the current yield as of June 30, 2010.
| | | | |
| | The accompanying notes are an integral part of the financial statements. | | 4 |
Statement of Assets and Liabilities (unaudited)
June 30, 2010
| | | | |
ASSETS: | | | | |
| |
Investments, at value (identified cost $133,674,236) (Note 2) | | $ | 121,023,186 | |
Receivable for securities sold | | | 1,397,081 | |
Dividends receivable | | | 255,133 | |
Receivable for fund shares sold | | | 107,405 | |
Foreign tax reclaims receivable | | | 92,936 | |
| | | | |
| |
TOTAL ASSETS | | | 122,875,741 | |
| | | | |
| |
LIABILITIES: | | | | |
| |
Accrued management fees (Note 3) | | | 103,747 | |
Accrued transfer agent fees (Note 3) | | | 8,489 | |
Accrued fund accounting and administration fees (Note 3) | | | 2,798 | |
Accrued Chief Compliance Officer service fees (Note 3) | | | 829 | |
Payable for securities purchased | | | 1,215,411 | |
Payable for fund shares repurchased | | | 263,127 | |
Other payables and accrued expenses | | | 22,202 | |
| | | | |
| |
TOTAL LIABILITIES | | | 1,616,603 | |
| | | | |
| |
TOTAL NET ASSETS | | $ | 121,259,138 | |
| | | | |
| |
NET ASSETS CONSIST OF: | | | | |
| |
Capital stock | | $ | 238,564 | |
Additional paid-in-capital | | | 241,115,298 | |
Undistributed net investment income | | | 1,400,624 | |
Accumulated net realized loss on investments, foreign currency and translation of other assets and liabilities | | | (108,838,498 | ) |
Net unrealized depreciation on investments, foreign currency and translation of other assets and liabilities | | | (12,656,850 | ) |
| | | | |
TOTAL NET ASSETS | | $ | 121,259,138 | |
| | | | |
| |
NET ASSET VALUE, OFFERING PRICE AND REDEMPTION PRICE PER SHARE - Class A ($121,259,138/23,856,357 shares) | | $ | 5.08 | |
| | | | |
| | | | |
| 5 | | The accompanying notes are an integral part of the financial statements. | | |
Statement of Operations (unaudited)
For the Six Months Ended June 30, 2010
| | | | |
INVESTMENT INCOME: | | | | |
| |
Dividends (net of foreign taxes withheld, $93,703) | | $ | 2,113,947 | |
| | | | |
| |
EXPENSES: | | | | |
| |
Management fees (Note 3) | | | 661,314 | |
Fund accounting and administration fees (Note 3) | | | 22,195 | |
Transfer agent fees (Note 3) | | | 12,420 | |
Directors’ fees (Note 3) | | | 6,373 | |
Chief Compliance Officer service fees (Note 3) | | | 1,761 | |
Miscellaneous | | | 53,210 | |
| | | | |
Total Expenses | | | 757,273 | |
Less reduction of expenses (Note 3) | | | (758 | ) |
| | | | |
Net Expenses | | | 756,515 | |
| | | | |
NET INVESTMENT INCOME | | | 1,357,432 | |
| | | | |
| |
REALIZED AND UNREALIZED GAIN (LOSS) ON INVESTMENTS AND FOREIGN CURRENCY: | | | | |
| |
Net realized gain (loss) on-
Investments | | | 1,608,421 | |
Foreign currency and translation of other assets and liabilities | | | (5,782 | ) |
| | | | |
| | | 1,602,639 | |
| | | | |
| |
Net change in unrealized depreciation on-
Investments | | | (14,052,150 | ) |
Foreign currency and translation of other assets and liabilities | | | (6,445 | ) |
| | | | |
| |
| | | (14,058,595 | ) |
| | | | |
| |
NET REALIZED AND UNREALIZED GAIN (LOSS) ON INVESTMENTS AND FOREIGN CURRENCY | | | (12,455,956 | ) |
| | | | |
| |
NET DECREASE IN NET ASSETS RESULTING FROM OPERATIONS | | $ | (11,098,524 | ) |
| | | | |
| | | | |
| | The accompanying notes are an integral part of the financial statements. | | 6 |
Statements of Changes in Net Assets
| | | | | | | | |
| | | For the Six
Months Ended
6/30/10
(unaudited) | | | For the
Year Ended
12/31/09 | |
INCREASE (DECREASE) IN NET ASSETS: | | | | | | | | |
| | |
OPERATIONS: | | | | | | | | |
| | |
Net investment income | | $ | 1,357,432 | | | $ | 2,884,947 | |
Net realized gain (loss) on investments and foreign currency | | | 1,602,639 | | | | (42,361,984 | ) |
Net change in unrealized appreciation (depreciation) on investments and foreign currency | | | (14,058,595 | ) | | | 57,427,697 | |
| | | | | | | | |
| | |
Net increase (decrease) from operations | | | (11,098,524 | ) | | | 17,950,660 | |
| | | | | | | | |
| | |
DISTRIBUTIONS TO SHAREHOLDERS (Note 9): | | | | | | | | |
| | |
From net investment income | | | — | | | | (2,990,961 | ) |
| | | | | | | | |
| | |
CAPITAL STOCK ISSUED AND REPURCHASED: | | | | | | | | |
| | |
Net increase (decrease) from capital share transactions (Note 5) | | | 1,942,688 | | | | (13,914,002 | ) |
| | | | | | | | |
| | |
Net increase (decrease) in net assets | | | (9,155,836 | ) | | | 1,045,697 | |
| | |
NET ASSETS: | | | | | | | | |
| | |
Beginning of period | | | 130,414,974 | | | | 129,369,277 | |
| | | | | | | | |
| | |
End of period (including undistributed net investment income of $1,400,624 and $43,192, respectively) | | $ | 121,259,138 | | | $ | 130,414,974 | |
| | | | | | | | |
| | | | |
| 7 | | The accompanying notes are an integral part of the financial statements. | | |
Financial Highlights
| | | | | | | | | | | | | | |
| | | For the Six
Months Ended
6/30/10 | | | | | For the Years Ended | | | | For the Period
7/1/051 to | |
| | | (unaudited) | | 12/31/09 | | | 12/31/08 | | 12/31/07 | | 12/31/06 | | 12/31/05 | |
Per share data (for a share outstanding throughout each period): | | | | | | | | | | | | | | |
Net asset value - Beginning of period | | $5.55 | | $5.14 | | | $9.34 | | $12.51 | | $10.70 | | $10.00 | |
| | | | | | | | | | | | | | |
| | | | | | |
Income (loss) from investment operations: | | | | | | | | | | | | | | |
Net investment income | | 0.062 | | 0.102 | | | 0.17 | | 0.19 | | 0.10 | | 0.05 | |
Net realized and unrealized gain (loss) on investments | | (0.53) | | 0.44 | | | (4.19) | | (2.36) | | 2.00 | | 0.69 | |
| | | | | | | | | | | | | | |
Total from investment operations | | (0.47) | | 0.54 | | | (4.02) | | (2.17) | | 2.10 | | 0.74 | |
| | | | | | | | | | | | | | |
Less distributions to shareholders: | | | | | | | | | | | | | | |
From net investment income | | — | | (0.13) | | | (0.18) | | (0.18) | | (0.11) | | (0.04) | |
From net realized gain on investments | | — | | — | | | — | | (0.82) | | (0.18) | | — | |
| | | | | | | | | | | | | | |
Total distributions to shareholders | | — | | (0.13) | | | (0.18) | | (1.00) | | (0.29) | | (0.04) | |
| | | | | | | | | | | | | | |
Net asset value - End of period | | $5.08 | | $5.55 | | | $5.14 | | $9.34 | | $12.51 | | $10.70 | |
| | | | | | | | | | | | | | |
Net assets - End of period | | | | | | | | | | | | | | |
(000’s omitted) | | $121,259 | | $130,415 | | | $129,369 | | $220,097 | | $132,855 | | $49,674 | |
| | | | | | | | | | | | | | |
Total return3 | | (8.47%) | | 10.54% | | | (42.98%) | | (17.46%) | | 19.62% | | 7.39% | |
Ratios (to average net assets)/ Supplemental Data: | | | | | | | | | | | | | | |
Expenses* | | 1.14%4 | | 1.14% | | | 1.12% | | 1.15% | | 1.18% | | 1.20% | 4 |
Net investment income | | 2.05%4 | | 2.01% | | | 2.34% | | 1.72% | | 1.14% | | 0.95% | 4 |
Portfolio turnover | | 30% | | 98% | | | 41% | | 38% | | 30% | | 6% | |
|
*The investment advisor did not impose all or a portion of its management fees, CCO fees and fund accounting and transfer agent fees, and other fees in some periods and in some periods paid a portion of the Series’ expenses. If these expenses had been incurred by the Series, the expense ratio (to average net assets) would have been increased by the following amounts: | |
| | 0.00%4,5 | | 0.00% | 5 | | N/A | | N/A | | N/A | | 0.16% | 4 |
1Commencement of operations.
2Calculated based on average shares outstanding during the periods.
3Represents aggregate total return for the periods indicated, and assumes reinvestment of all distributions. Total return would have been lower had certain expenses not been waived or reimbursed during the periods. Periods less than one year are not annualized.
4Annualized.
5Less than 0.01%.
| | | | |
| | The accompanying notes are an integral part of the financial statements. | | 8 |
Notes to Financial Statements (unaudited)
Financial Services Series (the “Series”) is a no-load diversified series of Manning & Napier Fund, Inc. (the “Fund”). The Fund is organized in Maryland and is registered under the Investment Company Act of 1940, as amended, as an open-end management investment company.
The Series’ investment objective is to provide long-term growth by investing principally in the common stocks of companies in the financial services industry.
The Fund’s Advisor is Manning & Napier Advisors, Inc. (the “Advisor”). Shares of the Series are offered to investors, clients and employees of the Advisor and its affiliates. The total authorized capital stock of the Fund consists of 10.0 billion shares of common stock each having a par value of $0.01. As of June 30, 2010, 6.2 billion shares have been designated in total among 29 series, of which 100 million have been designated as Financial Services Series Class A common stock.
| 2. | SIGNIFICANT ACCOUNTING POLICIES |
Security Valuation
Portfolio securities, including domestic equities, foreign equities, warrants and options, listed on an exchange other than the NASDAQ National Market System are valued at the latest quoted sales price of the exchange on which the security is primarily traded. Securities not traded on valuation date or securities not listed on an exchange are valued at the latest quoted bid price provided by the Fund’s pricing service. Securities listed on the NASDAQ National Market System are valued in accordance with the NASDAQ Official Closing Price.
Short-term investments that mature in sixty days or less are valued at amortized cost, which approximates market value. Investments in open-end investment companies are valued at their net asset value per share on valuation date.
Volume and level of activity in established markets for an asset or liability are evaluated to determine whether recent transactions and quoted prices are determinative of fair value. Where there have been significant decreases in volume and level of activity, further analysis and adjustment may be necessary to estimate fair value. The Series measures fair value in these instances by the use of inputs and valuation techniques which may be based upon current market prices of securities that are comparable in coupon, rating, maturity and industry and/or expectation of future cash flows. As a result of trading in relatively thin markets and/or markets that experience significant volatility, the prices used by the Series to value these securities may differ from the value that would be realized if these securities were sold, and the differences could be material.
Securities for which representative valuations or prices are not available from the Fund’s pricing service may be valued at fair value. Due to the inherent uncertainty of valuations of such securities, the fair value may differ significantly from the values that would have been used had a ready market for such securities existed. If trading or events occurring after the close of the principal market in which securities are traded are expected to materially affect the value of those securities, then they may be valued at their fair value, taking this trading or these events into account. Fair value is determined in good faith by the Advisor under procedures approved by and under the general supervision and responsibility of the Fund’s Board of Directors (the “Board”).
Various inputs are used in determining the value of the Series’ assets or liabilities carried at market value. These inputs are summarized in three broad levels. Level 1 includes quoted prices in active markets for identical assets and liabilities. Level 2 includes other significant observable inputs (including quoted prices for similar securities, interest rates, prepayment speeds, credit risk, etc.). Level 3 includes significant unobservable inputs (including the Series’ own assumptions in determining the fair value of investments). The inputs or methodology used for valuing securities are not necessarily an indication of the risk associated with investing in those securities.
Notes to Financial Statements (unaudited)
| 2. | SIGNIFICANT ACCOUNTING POLICIES (continued) |
Security Valuation (continued)
The following is a summary of the valuation levels used for major security types as of June 30, 2010 in valuing the Series’ assets or liabilities carried at market value:
| | | | | | | | | | | | |
| Description | | 6/30/10 | | Level 1 | | Level 2 | | Level 3 |
Equity securities* | | $ | 119,114,954 | | $ | 118,147,518 | | $ | 967,436 | | $ | — |
Preferred securities | | | — | | | — | | | — | | | — |
Debt securities | | | — | | | — | | | — | | | — |
Mutual funds | | | 1,908,232 | | | 1,908,232 | | | — | | | — |
Other financial instruments** | | | — | | | — | | | — | | | — |
| | | | | | | | | | | | |
Total | | $ | 121,023,186 | | $ | 120,055,750 | | $ | 967,436 | | $ | — |
| | | | | | | | | | | | |
*Includes common stock, warrants and rights. Please see the Investment Portfolio for industry classification and for securities where a latest quoted sales price is not available and the latest quoted bid price was used to value the security. Such securities are included in Level 2 in the table above.
**Other financial instruments are derivative instruments not reflected in the Investment Portfolio, such as futures, forwards and swap contracts, which are valued at the unrealized appreciation/depreciation on the instrument. As of June 30, 2010, the Series did not hold any derivative instruments.
There were no Level 3 securities held by the Series as of December 31, 2009 or June 30, 2010.
The Fund’s policy is to recognize transfers in and transfers out of the valuation levels as of the end of the reporting period. There were no significant transfers between Level 1 and Level 2 as of June 30, 2010.
Additional disclosure surrounding the activity in Level 3 fair value measurement will also be effective for fiscal years beginning after December 15, 2010. Management has concluded that this will not have a material impact on the Series’ financial statements.
Security Transactions, Investment Income and Expenses
Security transactions are accounted for on trade date. Dividend income is recorded on the ex-dividend date, except that if the ex-dividend date has passed, certain dividends from foreign securities are recorded as soon as the Fund is informed of the ex-dividend date. Non-cash dividends, if any, are recorded at the fair market value of the securities received. Interest income, including amortization of premium and accretion of discounts using the effective interest method, is earned from settlement date and accrued daily.
Expenses are recorded on an accrual basis. Most expenses of the Fund can be attributed to a specific series. Expenses which cannot be directly attributed are apportioned among the series in the Fund in such a manner as deemed equitable by the Fund’s Board, taking into consideration, among other things, the nature and type of expense.
The Series uses the identified cost method for determining realized gain or loss on investments for both financial statement and federal income tax reporting purposes.
Foreign Currency Translation
The books and records of the Series are maintained in U.S. dollars. Foreign currencies, investments and other assets and liabilities are translated into U.S. dollars at the current exchange rates. Purchases and sales of investment securities and income and expenses are translated on the respective dates of such transactions. The Series does not isolate realized and unrealized gains and losses attributable to changes in the exchange rates from gains and
10
Notes to Financial Statements (unaudited)
| 2. | SIGNIFICANT ACCOUNTING POLICIES (continued) |
Foreign Currency Translation (continued)
losses that arise from changes in the market value of investments. Such fluctuations are included with net realized and unrealized gain or loss on investments. Net realized foreign currency gains and losses represent foreign currency gains and losses between trade date and settlement date on securities transactions, gains and losses on disposition of foreign currencies and the difference between the amount of income and foreign withholding taxes recorded on the books of the Series and the amounts actually received or paid.
Federal Taxes
The Series’ policy is to comply with the provisions of the Internal Revenue Code applicable to regulated investment companies. The Series is not subject to federal income tax or excise tax to the extent that the Series distributes to shareholders each year its taxable income, including any net realized gains on investments, in accordance with requirements of the Internal Revenue Code. Accordingly, no provision for federal income tax or excise tax has been made in the financial statements.
Management evaluates its tax positions to determine if the tax positions taken meet the minimum recognition threshold in connection with accounting for uncertainties in income tax positions taken or expected to be taken for the purposes of measuring and recognizing tax liabilities in the financial statements. Recognition of tax benefits of an uncertain tax position is required only when the position is “more likely than not” to be sustained assuming examination by taxing authorities. At June 30, 2010, the Series has recorded no liability for net unrecognized tax benefits relating to uncertain income tax positions taken or expected to be taken in future tax returns.
The Series files income tax returns in the U.S. federal jurisdiction, various states and foreign jurisdictions, as required. No income tax returns are currently under investigation. The statute of limitations on the Series’ tax returns remains open for the years ended December 31, 2006 through December 31, 2009. The Fund is not aware of any tax positions for which it is reasonably possible that the total amounts of unrecognized tax benefits will significantly change in the next twelve months.
Additionally, based on the Fund’s understanding of the tax rules and rates related to income, gains and transactions for foreign jurisdictions in which it invests, the Series will provide for foreign taxes, and where appropriate, deferred foreign tax.
Distributions of Income and Gains
Distributions to shareholders of net investment income and net realized gains are made annually. An additional distribution may be necessary to avoid taxation of the Series. Distributions are recorded on the ex-dividend date.
Indemnifications
The Fund’s organizational documents provide former and current directors and officers with a limited indemnification against liabilities arising in connection with the performance of their duties to the Fund. In the normal course of business, the Fund may also enter into contracts that provide general indemnifications. The Fund’s maximum exposure under these arrangements is unknown as this would be dependent on future claims that may be made against the Fund. The risk of material loss from such claims is considered remote.
Other
The preparation of financial statements in conformity with accounting principles generally accepted in the United States of America requires management to make estimates and assumptions that affect the reported amounts of assets and liabilities and the disclosure of contingent assets and liabilities at the date of the financial statements and the reported amounts of income and expenses during the reporting period. Actual results could differ from those estimates.
11
Notes to Financial Statements (unaudited)
| 3. | TRANSACTIONS WITH AFFILIATES |
The Fund has an Investment Advisory Agreement (the “Agreement”) with the Advisor, for which the Series pays a fee, computed daily and payable monthly, at an annual rate of 1.00% of the Series’ average daily net assets.
Under the Agreement, personnel of the Advisor provide the Series with advice and assistance in the choice of investments and the execution of securities transactions, and otherwise maintain the Series’ organization. The Advisor also provides the Fund with necessary office space and fund administration and support services. The salaries of all officers of the Fund (except a percentage of the Fund’s Chief Compliance Officer’s salary, which is paid by the Fund), and of all Directors who are “affiliated persons” of the Fund, or of the Advisor, and all personnel of the Fund, or of the Advisor, performing services relating to research, statistical and investment activities, are paid by the Advisor. Each “non-affiliated” Director receives an annual stipend, which is allocated among all the active series of the Fund. In addition, these Directors also receive a fee per Board meeting attended for each active series of the Fund plus a fee for each committee meeting attended.
The Advisor has contractually agreed, until at least April 30, 2011, to waive its fee and, if necessary, pay other operating expenses of the Series in order to maintain total direct annual fund operating expenses for the Series at no more than 1.20% of average daily net assets each year. For the six months ended June 30, 2010, the Advisor voluntarily waived fees of $758, which is included as a reduction of expenses on the Statement of Operations. The Advisor is not eligible to recoup any expenses that have been waived or reimbursed in prior years.
Manning & Napier Investor Services, Inc., a registered broker-dealer affiliate of the Advisor, acts as distributor for the Fund’s shares. The services of Manning & Napier Investor Services, Inc. are provided at no additional cost to the Series.
The Advisor has entered into agreements with PNC Global Investment Servicing (U.S.) Inc. (“PNCGIS”) under which PNCGIS serves as sub-accountant services agent and sub-transfer agent. The Fund pays the Advisor an annual fee of 0.0175% on the first $3 billion of average daily net assets (excluding Target Series); 0.015% on the next $3 billion of average daily net assets (excluding Target Series); and 0.01% of the average daily net assets in excess of $6 billion (excluding Target Series); plus a base fee of $25,500 per Series. Additionally, certain transaction-, account-, and cusip-based fees and out-of-pocket expenses, including charges for reporting relating to the Fund’s compliance program, are charged.
On July 1, 2010, The PNC Financial Services Group, Inc. sold the outstanding stock of PNC Global Investment Servicing Inc. to The Bank of New York Mellon Corporation. At the closing of the sale, PNCGIS changed its name to BNY Mellon Investment Servicing (US) Inc.
| 4. | PURCHASES AND SALES OF SECURITIES |
For the six months ended June 30, 2010, purchases and sales of securities, other than U.S. Government securities and short-term securities, were $41,535,915 and $38,111,416, respectively. There were no purchases or sales of U.S. Government securities.
12
Notes to Financial Statements (unaudited)
| 5. | CAPITAL STOCK TRANSACTIONS |
Transactions in shares of Financial Services Series were:
| | | | | | | | | | | | | | |
| | | For the Six Months
Ended 6/30/10 | | | For the Year
Ended 12/31/09 | |
| | | Shares | | | Amount | | | Shares | | | Amount | |
Sold | | 1,561,212 | | | $ | 8,773,646 | | | 11,190,234 | | | $ | 55,137,124 | |
Reinvested | | — | | | | — | | | 534,460 | | | | 2,895,097 | |
Repurchased | | (1,216,401 | ) | | | (6,830,958 | ) | | (13,401,764 | ) | | | (71,946,223 | ) |
| | | | | | | | | | | | | | |
Total | | 344,811 | | | $ | 1,942,688 | | | (1,677,070 | ) | | $ | (13,914,002 | ) |
| | | | | | | | | | | | | | |
Substantially all of the Series’ shares represent investments by fiduciary accounts over which the Advisor has sole investment discretion.
The Series may trade in instruments including written and purchased options, forward foreign currency exchange contracts and futures contracts and other derivatives in the normal course of investing activities to assist in managing exposure to various market risks. The Series may be subject to various elements of risk and may involve, to a varying degree, elements of risk in excess of the amounts recognized for financial statement purposes. These risks include: the risk that changes in the value of a derivative may not correlate perfectly with the underlying asset, rate or index, counterparty credit risk related to over the counter derivatives counterparties’ failure to perform under contract terms, liquidity risk related to the lack of a liquid market for these contracts allowing the fund to close out its position(s) and documentation risk relating to disagreement over contract terms. No such investments were held by the Series on June 30, 2010.
Investing in securities of foreign companies and foreign governments involves special risks and considerations not typically associated with investing in securities of domestic companies and the U.S. Government. These risks include revaluation of currencies and future adverse political and economic developments. Moreover, securities of foreign companies and foreign governments and their markets may be less liquid and their prices more volatile than those of comparable domestic companies and the U.S. Government.
| 8. | FINANCIAL SERVICES SECURITIES |
The Series may focus its investments in certain related financial services industries; hence, the Series may subject itself to a greater degree of risk than a series that is more diversified.
| 9. | FEDERAL INCOME TAX INFORMATION |
The amount and characterization of certain income and capital gains to be distributed are determined in accordance with federal income tax regulations, which may differ from accounting principles generally accepted in the United States of America. The Series may periodically make reclassifications among its capital accounts to reflect income and gains available for distribution (or available capital loss carryovers) under income tax regulations without impacting the Series’ net asset value. Any such reclassifications are not reflected in the financial highlights.
13
Notes to Financial Statements (unaudited)
| 9. | FEDERAL INCOME TAX INFORMATION (continued) |
The final determination of the tax character of current year distributions will be made at the conclusion of the fiscal year. The tax character of distributions paid for the year ended December 31, 2009 were as follows:
| | |
| Ordinary income | | $2,990,961 |
For the year ended December 31, 2009, the Series elected to defer $8,331,249 of capital losses attributable to Post-October losses.
At December 31, 2009, the Series had a capital loss carryover of $101,937,888, available to the extent allowed by tax law to offset future net capital gain, if any, which will expire as follows:
| | | | |
| | | Loss Carryover | | Expiration Date |
| | $50,750,211 | | December 31, 2016 |
| | $51,187,677 | | December 31, 2017 |
At June 30, 2010, the identified cost of investments for federal income tax purposes, the resulting gross unrealized appreciation and depreciation, and the net unrealized depreciation were as follows:
| | | | |
Cost for federal income tax purposes | | $ | 133,846,236 | |
Unrealized appreciation | | $ | 2,526,690 | |
Unrealized depreciation | | | (15,349,740 | ) |
| | | | |
Net unrealized depreciation | | $ | (12,823,050 | ) |
| | | | |
There were no subsequent events that require recognition or disclosure. In preparing these financial statements, management of the Fund has evaluated events and transactions for potential recognition or disclosure through the date the financial statements were issued.
14
Literature Requests (unaudited)
Proxy Voting Policies and Procedures
A description of the policies and procedures that the Fund uses to determine how to vote proxies relating to portfolio securities is available, without charge, upon request:
| | |
By phone | | 1-800-466-3863 |
On the Securities and Exchange | | |
Commission’s (SEC) web site | | http://www.sec.gov |
Proxy Voting Record
Information regarding how the Fund voted proxies relating to portfolio securities during the most recent 12-month period ended June 30th is available, without charge, upon request:
| | |
By phone | | 1-800-466-3863 |
On the SEC’s web site | | http://www.sec.gov |
Quarterly Portfolio Holdings
The Series’ complete schedule of portfolio holdings for the 1st and 3rd quarters of each fiscal year are provided on Form N-Q, and are available, without charge, upon request:
| | |
By phone | | 1-800-466-3863 |
On the SEC’s web site | | http://www.sec.gov |
The Series’ Form N-Q may be reviewed and copied at the SEC’s Public Reference Room in Washington, D.C. Information on the operation of the Public Reference Room may be obtained by calling 1-800-SEC-0330.
Prospectus and Statement of Additional Information (SAI)
The prospectus and SAI provide additional information about each Series, including charges, expenses and risks. These documents are available, without charge, upon request:
| | |
By phone | | 1-800-466-3863 |
On the SEC’s web site | | http://www.sec.gov |
On the Advisor’s web site | | http://www.manningnapieradvisors.com |
Additional information available at www.manningnapieradvisors.com
1. Fund Holdings - Month-End
2. Fund Holdings - Quarter-End
3. Shareholder Report - Annual
4. Shareholder Report - Semi-Annual
MNFIN-06/10-SAR

Shareholder Expense Example (unaudited)
As a shareholder of the Series, you may incur two types of costs: (1) transaction costs and (2) ongoing costs, including management fees and other Series expenses. This example is intended to help you understand your ongoing costs (in dollars) of investing in the Series and to compare these costs with the ongoing costs of investing in other mutual funds.
The example is based on an investment of $1,000 invested at the beginning of the period and held for the entire period (January 1, 2010*to June 30, 2010).
Actual Expenses
The first line of the table below provides information about actual account values and actual expenses. You may use the information in this line, together with the amount you invested, to estimate the expenses that you paid over the period. Simply divide your account value by $1,000 (for example, an $8,600 account value divided by $1,000 = 8.6), then multiply the result by the number in the first line under the heading entitled “Expenses Paid During Period” to estimate the expenses you paid on your account during this period.
Hypothetical Example for Comparison Purposes
The second line of the table below provides information about hypothetical account values and hypothetical expenses based on the Series’ actual expense ratio and an assumed rate of return of 5% per year before expenses, which is not the Series’ actual return. The hypothetical account values and expenses may not be used to estimate the actual ending account balance or expenses you paid during the period. You may use this information to compare the ongoing costs of investing in the Series and other funds. To do so, compare this 5% hypothetical example with the 5% hypothetical examples that appear in the shareholder reports of the other funds.
Please note that the expenses shown in the table are meant to highlight your ongoing costs only and do not reflect any transaction costs. Therefore, the second line of the table is useful in comparing ongoing costs only, and will not help you determine the relative total costs of owning different funds. In addition, if these transaction costs were included, your costs would have been higher.
| | | | | | |
| | | Beginning
Account Value
1/1/10 | | Ending
Account Value
6/30/10 | | Expenses Paid
During Period*
1/1/10-6/30/10 |
Actual | | $1,000.00 | | $1,060.30 | | $6.13 |
Hypothetical
(5% return before expenses) | | $1,000.00 | | $1,018.84 | | $6.01 |
*Expenses are equal to the Series’ annualized expense ratio (for the six-month period) of 1.20%, multiplied by the average account value over the period, multiplied by 181/365 (to reflect the one-half year period). Expenses are based on the most recent fiscal half year. The Series’ total return would have been lower had certain expenses not been waived during the period.
Portfolio Composition as of June 30, 2010 (unaudited)
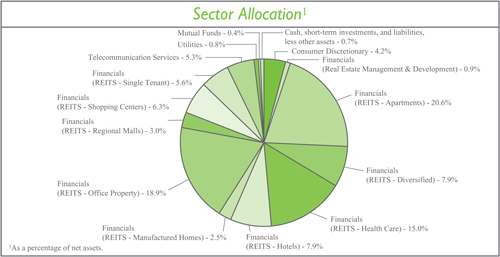
| | | | | | | | |
| Top Ten Stock Holdings2 |
BioMed Realty Trust, Inc. | | 5.0% | | | | Digital Realty Trust, Inc. | | 3.3% |
HCP, Inc. | | 4.7% | | | | Host Hotels & Resorts, Inc. | | 3.2% |
Corporate Office Properties Trust | | 4.5% | | | | UDR, Inc. | | 3.2% |
DuPont Fabros Technology, Inc. | | 3.7% | | | | AvalonBay Communities, Inc. | | 3.1% |
Apartment Investment & Management Co. - Class A | | 3.4% | | | | Alexandria Real Estate Equities, Inc. | | 3.1% |
| | | | | |
2 As a percentage of total investments. | | | | | | | | |
Investment Portfolio - June 30, 2010 (unaudited)
| | | | | | | |
| | | Shares | | Value (Note 2) | | |
| | | |
COMMON STOCKS - 98.9% | | | | | | | |
| | | |
Consumer Discretionary - 4.2% | | | | | | | |
Hotels, Restaurants & Leisure - 4.2% | | | | | | | |
Choice Hotels International, Inc. | | 61,460 | | $ | 1,856,707 | | |
Hyatt Hotels Corp. - Class A* | | 34,690 | | | 1,286,652 | | |
| | | | | | | |
Total Consumer Discretionary | | | | | 3,143,359 | | |
| | | | | | | |
Financials - 88.6% | | | | | | | |
Real Estate Management & Development - 0.9% | | | | | | | |
CB Richard Ellis Group, Inc. - Class A* | | 46,600 | | | 634,226 | | |
| | | | | | | |
REITS - Apartments - 20.6% | | | | | | | |
American Campus Communities, Inc. | | 71,210 | | | 1,943,321 | | |
Apartment Investment & Management Co. - Class A | | 131,000 | | | 2,537,470 | | |
AvalonBay Communities, Inc. | | 25,070 | | | 2,340,786 | | |
Camden Property Trust | | 49,710 | | | 2,030,654 | | |
Equity Residential | | 30,000 | | | 1,249,200 | | |
Home Properties, Inc. | | 43,540 | | | 1,962,348 | | |
Mid-America Apartment Communities, Inc. | | 20,430 | | | 1,051,532 | | |
UDR, Inc. | | 127,550 | | | 2,440,031 | | |
| | | | | | | |
| | | | | 15,555,342 | | |
| | | | | | | |
REITS - Diversified - 7.9% | | | | | | | |
Digital Realty Trust, Inc. | | 42,940 | | | 2,476,779 | | |
DuPont Fabros Technology, Inc. | | 113,500 | | | 2,787,560 | | |
Lexington Realty Trust | | 120,000 | | | 721,200 | | |
| | | | | | | |
| | | | | 5,985,539 | | |
| | | | | | | |
REITS - Health Care - 15.0% | | | | | | | |
Cogdell Spencer, Inc. | | 303,800 | | | 2,053,688 | | |
HCP, Inc. | | 110,990 | | | 3,579,428 | | |
Health Care REIT, Inc. | | 42,020 | | | 1,769,882 | | |
Healthcare Realty Trust, Inc. | | 96,990 | | | 2,130,870 | | |
National Health Investors, Inc. | | 20,300 | | | 782,768 | | |
Omega Healthcare Investors, Inc. | | 52,230 | | | 1,040,944 | | |
| | | | | | | |
| | | | | 11,357,580 | | |
| | | | | | | |
REITS - Hotels - 7.9% | | | | | | | |
DiamondRock Hospitality Co.* | | 79,410 | | | 652,750 | | |
Host Hotels & Resorts, Inc. | | 182,030 | | | 2,453,764 | | |
LaSalle Hotel Properties | | 47,540 | | | 977,898 | | |
Pebblebrook Hotel Trust* | | 100,000 | | | 1,885,000 | | |
| | | | | | | |
| | | | | 5,969,412 | | |
| | | | | | | |
REITS - Manufactured Homes - 2.5% | | | | | | | |
Equity Lifestyle Properties, Inc. | | 39,030 | | | 1,882,417 | | |
| | | | | | | |
REITS - Office Property - 18.9% | | | | | | | |
Alexandria Real Estate Equities, Inc. | | 36,920 | | | 2,339,620 | | |
| | | | |
| | The accompanying notes are an integral part of the financial statements. | | 3 |
Investment Portfolio - June 30, 2010 (unaudited)
| | | | | | | |
| | | Shares | | Value (Note 2) | | |
| | | |
COMMON STOCKS (continued) | | | | | | | |
| | | |
Financials (continued) | | | | | | | |
REITS - Office Property (continued) | | | | | | | |
BioMed Realty Trust, Inc. | | 235,710 | | $ | 3,792,574 | | |
Boston Properties, Inc. | | 32,120 | | | 2,291,441 | | |
Corporate Office Properties Trust | | 90,740 | | | 3,426,342 | | |
Douglas Emmett, Inc. | | 101,000 | | | 1,436,220 | | |
Mack-Cali Realty Corp. | | 33,400 | | | 992,982 | | |
| | | | | | | |
| | | | | 14,279,179 | | |
| | | | | | | |
REITS - Regional Malls - 3.0% | | | | | | | |
Simon Property Group, Inc. | | 28,000 | | | 2,261,000 | | |
| | | | | | | |
REITS - Shopping Centers - 6.3% | | | | | | | |
Acadia Realty Trust | | 64,750 | | | 1,089,095 | | |
Equity One, Inc. | | 43,000 | | | 670,800 | | |
Tanger Factory Outlet Centers | | 50,110 | | | 2,073,552 | | |
Westfield Group (Australia) | | 87,740 | | | 899,557 | | |
| | | | | | | |
| | | | | 4,733,004 | | |
| | | | | | | |
REITS - Single Tenant - 5.6% | | | | | | | |
National Retail Properties, Inc. | | 93,700 | | | 2,008,928 | | |
Realty Income Corp. | | 73,920 | | | 2,241,994 | | |
| | | | | | | |
| | | | | 4,250,922 | | |
| | | | | | | |
Total Financials | | | | | 66,908,621 | | |
| | | | | | | |
Telecommunication Services - 5.3% | | | | | | | |
Wireless Telecommunication Services - 5.3% | | | | | | | |
American Tower Corp. - Class A* | | 31,490 | | | 1,401,305 | | |
Crown Castle International Corp.* | | 35,040 | | | 1,305,590 | | |
SBA Communications Corp. - Class A* | | 39,020 | | | 1,327,070 | | |
| | | | | | | |
Total Telecommunication Services | | | | | 4,033,965 | | |
| | | | | | | |
Utilities - 0.8% | | | | | | | |
Electric Utilities - 0.8% | | | | | | | |
Prime Infrastructure Group (Australia) | | 216,000 | | | 592,727 | | |
| | | | | | | |
TOTAL COMMON STOCKS | | | | | | | |
(Identified Cost $69,143,968) | | | | | 74,678,672 | | |
| | | | | | | |
MUTUAL FUNDS - 0.4% | | | | | | | |
iShares Dow Jones US Real Estate Index Fund | | | | | | | |
(Identified Cost $299,071) | | 6,600 | | | 311,586 | | |
| | | | | | | |
SHORT-TERM INVESTMENTS - 0.7% | | | | | | | |
Dreyfus Cash Management, Inc. - Institutional Shares1 , 0.13% | | | | | | | |
(Identified Cost $554,674) | | 554,674 | | | 554,674 | | |
| | | | | | | |
| | | | |
| 4 | | The accompanying notes are an integral part of the financial statements. | | |
Investment Portfolio - June 30, 2010 (unaudited)
| | | | |
| | | Value (Note 2) | |
TOTAL INVESTMENTS - 100.0% | | | | |
(Identified Cost $69,997,713) | | $ | 75,544,932 | |
LIABILITIES, LESS OTHER ASSETS - 0.0%** | | | (4,156 | ) |
| | | | |
NET ASSETS - 100% | | $ | 75,540,776 | |
| | | | |
REITS - Real Estate Investment Trusts
*Non-income producing security
**Less than 0.01%
1 Rate shown is the current yield as of June 30, 2010.
| | | | |
| | The accompanying notes are an integral part of the financial statements. | | 5 |
Statement of Assets and Liabilities (unaudited)
June 30, 2010
| | | |
ASSETS: | | | |
| |
Investments, at value (identified cost $69,997,713) (Note 2) | | $ | 75,544,932 |
Cash | | | 2,826 |
Dividends receivable | | | 293,968 |
Receivable for fund shares sold | | | 50,309 |
| | | |
| |
TOTAL ASSETS | | | 75,892,035 |
| | | |
| |
LIABILITIES: | | | |
| |
Accrued management fees (Note 3) | | | 64,420 |
Accrued transfer agent fees (Note 3) | | | 4,309 |
Accrued directors’ fees (Note 3) | | | 2,833 |
Accrued fund accounting and administration fees (Note 3) | | | 1,877 |
Accrued Chief Compliance Officer service fees (Note 3) | | | 706 |
Payable for fund shares repurchased | | | 248,191 |
Audit fees payable | | | 24,995 |
Other payables and accrued expenses | | | 3,928 |
| | | |
| |
TOTAL LIABILITIES | | | 351,259 |
| | | |
| |
TOTAL NET ASSETS | | $ | 75,540,776 |
| | | |
| |
NET ASSETS CONSIST OF: | | | |
| |
Capital stock | | $ | 67,144 |
Additional paid-in-capital | | | 67,430,241 |
Undistributed net investment income | | | 839,429 |
Accumulated net realized gain on investments, foreign currency and translation of other assets and liabilities | | | 1,657,091 |
Net unrealized appreciation on investments, foreign currency and translation of other assets and liabilities | | | 5,546,871 |
| | | |
TOTAL NET ASSETS | | $ | 75,540,776 |
| | | |
| |
NET ASSET VALUE, OFFERING PRICE AND REDEMPTION PRICE PER SHARE - Class A ($75,540,776/6,714,375 shares) | | $ | 11.25 |
| | | |
| | | | |
| 6 | | The accompanying notes are an integral part of the financial statements. | | |
Statement of Operations (unaudited)
For the Six Months Ended June 30, 2010
| | | | |
INVESTMENT INCOME: | | | | |
| |
Dividends (net of foreign taxes withheld, $1,173) | | $ | 1,275,285 | |
| | | | |
| |
EXPENSES: | | | | |
| |
Management fees (Note 3) | | | 375,235 | |
Fund accounting and administration fees (Note 3) | | | 18,151 | |
Transfer agent fees (Note 3) | | | 10,601 | |
Directors’ fees (Note 3) | | | 6,122 | |
Chief Compliance Officer service fees (Note 3) | | | 1,761 | |
Miscellaneous | | | 44,715 | |
| | | | |
| |
Total Expenses | | | 456,585 | |
Less reduction of expenses (Note 3) | | | (6,303 | ) |
| | | | |
| |
Net Expenses | | | 450,282 | |
| | | | |
| |
NET INVESTMENT INCOME | | | 825,003 | |
| | | | |
| |
REALIZED AND UNREALIZED GAIN (LOSS) ON INVESTMENTS AND FOREIGN CURRENCY: | | | | |
| |
Net realized gain on- | | | | |
Investments | | | 1,584,372 | |
Foreign currency and translation of other assets and liabilities | | | 1,190 | |
| | | | |
| | | 1,585,562 | |
| | | | |
Net change in unrealized appreciation (depreciation) on- | | | | |
Investments | | | 1,852,630 | |
Foreign currency and translation of other assets and liabilities | | | (348 | ) |
| | | | |
| |
| | | 1,852,282 | |
| | | | |
| |
NET REALIZED AND UNREALIZED GAIN (LOSS) ON INVESTMENTS AND FOREIGN CURRENCY | | | 3,437,844 | |
| | | | |
| |
NET INCREASE IN NET ASSETS RESULTING FROM OPERATIONS | | $ | 4,262,847 | |
| | | | |
| | | | |
| | The accompanying notes are an integral part of the financial statements. | | 7 |
Statements of Changes in Net Assets
| | | | | | | |
| | | For the Six
Months Ended
6/30/10
(unaudited) | | | | For the Period
11/10/091 to
12/31/09 | |
INCREASE (DECREASE) IN NET ASSETS: | | | | | | | |
| | | |
OPERATIONS: | | | | | | | |
| | | |
Net investment income | | $ 825,003 | | | | $ 118,419 | |
Net realized gain on investments and foreign currency | | 1,585,562 | | | | 112,303 | |
Net change in unrealized appreciation (depreciation) on investments and foreign currency | | 1,852,282 | | | | 3,694,589 | |
| | | | | | | |
| | | |
Net increase from operations | | 4,262,847 | | | | 3,925,311 | |
| | | | | | | |
| | | |
DISTRIBUTIONS TO SHAREHOLDERS (Note 9): | | | | | | | |
| | | |
From net investment income | | — | | | | (103,993 | ) |
From net realized gain on investments | | — | | | | (40,774 | ) |
| | | | | | | |
| | | |
Total distributions to shareholders | | — | | | | (144,767 | ) |
| | | | | | | |
| | | |
CAPITAL STOCK ISSUED AND REPURCHASED: | | | | | | | |
| | | |
Net increase from capital share transactions (Note 5) | | 2,099,343 | | | | 65,398,042 | |
| | | | | | | |
| | | |
Net increase in net assets | | 6,362,190 | | | | 69,178,586 | |
| | | |
NET ASSETS: | | | | | | | |
| | | |
Beginning of period | | 69,178,586 | | | | — | |
| | | | | | | |
| | | |
End of period (including undistributed net investment income of $839,429 and $14,426, respectively) | | $ 75,540,776 | | | | $ 69,178,586 | |
| | | | | | | |
1Commencement of operations.
| | | | |
| 8 | | The accompanying notes are an integral part of the financial statements. | | |
Financial Highlights
| | | | |
| | | For the Six
Months Ended
6/30/10
(unaudited) | | For the Period
11/10/091 to
12/31/09 |
Per share data (for a share outstanding throughout each period): | | | | |
Net asset value - Beginning of period | | $10.61 | | $10.00 |
| | | | |
Income from investment operations: | | | | |
Net investment income2 | | 0.12 | | 0.02 |
Net realized and unrealized gain on investments | | 0.52 | | 0.62 |
| | | | |
Total from investment operations | | 0.64 | | 0.64 |
| | | | |
Less distributions to shareholders: | | | | |
From net investment income | | — | | (0.02) |
From net realized gain on investments | | — | | (0.01) |
| | | | |
Total distributions to shareholders | | — | | (0.03) |
| | | | |
Net asset value - End of period | | $11.25 | | $10.61 |
| | | | |
Net assets - End of period (000’s omitted) | | $75,541 | | $69,179 |
| | | | |
Total return3 | | 6.03% | | 6.36% |
Ratios (to average net assets)/Supplemental Data: | | | | |
Expenses* | | 1.20%4 | | 1.20%4 |
Net investment income | | 2.20%4 | | 1.43%4 |
Portfolio turnover | | 12% | | 3% |
|
* The investment advisor did not impose all or a portion of its management fees, and other fees in some periods and in some periods paid a portion of the series’ expenses. If these expenses had been incurred by the Series, the expense ratio (to average net assets) would have been increased by the following amounts: |
| | 0.02%4 | | 0.38%4 |
1Commencement of operations.
2Calculated based on average shares outstanding during the periods.
3Represents aggregate total return for the periods indicated, and assumes reinvestment of all distributions. Total return would have been lower had certain expenses not been waived or reimbursed during the periods. Periods less than one year are not annualized.
4Annualized.
| | | | |
| | The accompanying notes are an integral part of the financial statements. | | 9 |
Notes to Financial Statements (unaudited)
Real Estate Series (the “Series”) is a no-load non-diversified series of Manning & Napier Fund, Inc. (the “Fund”). The Fund is organized in Maryland and is registered under the Investment Company Act of 1940, as amended, as an open-end management investment company.
The Series’ investment objective is to provide long-term growth by investing principally in the common stocks of companies in real estate-based industries.
The Fund’s Advisor is Manning & Napier Advisors, Inc. (the “Advisor”). Shares of the Series are offered to investors, clients and employees of the Advisor and its affiliates. The total authorized capital stock of the Fund consists of 10.0 billion shares of common stock each having a par value of $0.01. As of June 30, 2010, 6.2 billion shares have been designated in total among 29 series, of which 100 million have been designated as Real Estate Series Class A common stock.
| 2. | SIGNIFICANT ACCOUNTING POLICIES |
Security Valuation
Portfolio securities, including domestic equities, foreign equities, warrants and options, listed on an exchange other than the NASDAQ National Market System are valued at the latest quoted sales price of the exchange on which the security is primarily traded. Securities not traded on valuation date or securities not listed on an exchange are valued at the latest quoted bid price provided by the Fund’s pricing service. Securities listed on the NASDAQ National Market System are valued in accordance with the NASDAQ Official Closing Price.
Short-term investments that mature in sixty days or less are valued at amortized cost, which approximates market value. Investments in open-end investment companies are valued at their net asset value per share on valuation date.
Volume and level of activity in established markets for an asset or liability are evaluated to determine whether recent transactions and quoted prices are determinative of fair value. Where there have been significant decreases in volume and level of activity, further analysis and adjustment may be necessary to estimate fair value. The Series measures fair value in these instances by the use of inputs and valuation techniques which may be based upon current market prices of securities that are comparable in coupon, rating, maturity and industry and/or expectation of future cash flows. As a result of trading in relatively thin markets and/or markets that experience significant volatility, the prices used by the Series to value these securities may differ from the value that would be realized if these securities were sold, and the differences could be material.
Securities for which representative valuations or prices are not available from the Fund’s pricing service may be valued at fair value. Due to the inherent uncertainty of valuations of such securities, the fair value may differ significantly from the values that would have been used had a ready market for such securities existed. If trading or events occurring after the close of the principal market in which securities are traded are expected to materially affect the value of those securities, then they may be valued at their fair value, taking this trading or these events into account. Fair value is determined in good faith by the Advisor under procedures approved by and under the general supervision and responsibility of the Fund’s Board of Directors (the “Board”).
Various inputs are used in determining the value of the Series’ assets or liabilities carried at market value. These inputs are summarized in three broad levels. Level 1 includes quoted prices in active markets for identical assets and liabilities. Level 2 includes other significant observable inputs (including quoted prices for similar securities, interest rates, prepayment speeds, credit risk, etc.). Level 3 includes significant unobservable inputs (including the Series’ own assumptions in determining the fair value of investments). The inputs or methodology used for valuing securities are not necessarily an indication of the risk associated with investing in those securities.
Notes to Financial Statements (unaudited)
| 2. | SIGNIFICANT ACCOUNTING POLICIES (continued) |
Security Valuation (continued)
The following is a summary of the valuation levels used for major security types as of June 30, 2010 in valuing the Series’ assets or liabilities carried at market value:
| | | | | | | | | | | | |
| Description | | 6/30/10 | | Level 1 | | Level 2 | | Level 3 |
Equity securities* | | $ | 74,678,672 | | $ | 74,678,672 | | $ | — | | $ | — |
Preferred securities | | | — | | | — | | | — | | | — |
Debt securities | | | — | | | — | | | — | | | — |
Mutual funds | | | 866,260 | | | 866,260 | | | — | | | — |
Other financial instruments** | | | — | | | — | | | — | | | — |
| | | | | | | | | | | | |
Total | | $ | 75,544,932 | | $ | 75,544,932 | | $ | — | | $ | — |
| | | | | | | | | | | | |
*Includes common stock, warrants and rights. Please see the Investment Portfolio for industry classification.
**Other financial instruments are derivative instruments not reflected in the Investment Portfolio, such as futures, forwards and swap contracts, which are valued at the unrealized appreciation/depreciation on the instrument. As of June 30, 2010, the Series did not hold any derivative instruments.
There were no Level 3 securities held by the Series as of December 31, 2009 or June 30, 2010.
The Fund’s policy is to recognize transfers in and transfers out of the valuation levels as of the end of the reporting period. There were no significant transfers between Level 1 and Level 2 as of June 30, 2010.
Additional disclosure surrounding the activity in Level 3 fair value measurement will also be effective for fiscal years beginning after December 15, 2010. Management has concluded that this will not have a material impact on the Series’ financial statements.
Security Transactions, Investment Income and Expenses
Security transactions are accounted for on trade date. Dividend income is recorded on the ex-dividend date, except that if the ex-dividend date has passed, certain dividends from foreign securities are recorded as soon as the Fund is informed of the ex-dividend date. Non-cash dividends, if any, are recorded at the fair market value of the securities received. Interest income, including amortization of premium and accretion of discounts using the effective interest method, is earned from settlement date and accrued daily.
Expenses are recorded on an accrual basis. Most expenses of the Fund can be attributed to a specific series. Expenses which cannot be directly attributed are apportioned among the series in the Fund in such a manner as deemed equitable by the Fund’s Board, taking into consideration, among other things, the nature and type of expense.
The Fund records distributions received in excess of income from underlying investments as a reduction of cost of investments and/or realized gain. Such amounts are based on estimates if actual amounts are not available and actual amounts of income, realized gain and return of capital may differ from the estimated amounts. The Fund adjusts the estimated amounts of components of distributions (and consequently its net investment income) as necessary once the issuers provide information about the actual composition of the distributions.
The Series uses the identified cost method for determining realized gain or loss on investments for both financial statement and federal income tax reporting purposes.
11
Notes to Financial Statements (unaudited)
| 2. | SIGNIFICANT ACCOUNTING POLICIES (continued) |
Foreign Currency Translation
The books and records of the Series are maintained in U.S. dollars. Foreign currencies, investments and other assets and liabilities are translated into U.S. dollars at the current exchange rates. Purchases and sales of investment securities and income and expenses are translated on the respective dates of such transactions. The Series does not isolate realized and unrealized gains and losses attributable to changes in the exchange rates from gains and losses that arise from changes in the market value of investments. Such fluctuations are included with net realized and unrealized gain or loss on investments. Net realized foreign currency gains and losses represent foreign currency gains and losses between trade date and settlement date on securities transactions, gains and losses on disposition of foreign currencies and the difference between the amount of income and foreign withholding taxes recorded on the books of the Series and the amounts actually received or paid.
Federal Taxes
The Series’ policy is to comply with the provisions of the Internal Revenue Code applicable to regulated investment companies. The Series is not subject to federal income tax or excise tax to the extent that the Series distributes to shareholders each year its taxable income, including any net realized gains on investments, in accordance with requirements of the Internal Revenue Code. Accordingly, no provision for federal income tax or excise tax has been made in the financial statements.
Management evaluates its tax positions to determine if the tax positions taken meet the minimum recognition threshold in connection with accounting for uncertainties in income tax positions taken or expected to be taken for the purposes of measuring and recognizing tax liabilities in the financial statements. Recognition of tax benefits of an uncertain tax position is required only when the position is “more likely than not” to be sustained assuming examination by taxing authorities. At June 30, 2010, the Series has recorded no liability for net unrecognized tax benefits relating to uncertain income tax positions taken or expected to be taken in future tax returns.
The Series files income tax returns in the U.S. federal jurisdiction, various states and foreign jurisdictions, as required. No income tax returns are currently under investigation. The statute of limitations on the Series’ tax returns remains open for period ended December 31, 2009. The Fund is not aware of any tax positions for which it is reasonably possible that the total amounts of unrecognized tax benefits will significantly change in the next twelve months.
Additionally, based on the Fund’s understanding of the tax rules and rates related to income, gains and transactions for foreign jurisdictions in which it invests, the Series will provide for foreign taxes, and where appropriate, deferred foreign tax.
Distributions of Income and Gains
Distributions to shareholders of net investment income and net realized gains are made annually. An additional distribution may be necessary to avoid taxation of the Series. Distributions are recorded on the ex-dividend date.
Indemnifications
The Fund’s organizational documents provide former and current directors and officers with a limited indemnification against liabilities arising in connection with the performance of their duties to the Fund. In the normal course of business, the Fund may also enter into contracts that provide general indemnifications. The Fund’s maximum exposure under these arrangements is unknown as this would be dependent on future claims that may be made against the Fund. The risk of material loss from such claims is considered remote.
Other
The preparation of financial statements in conformity with accounting principles generally accepted in the United States of America requires management to make estimates and assumptions that affect the reported amounts of
12
Notes to Financial Statements (unaudited)
| 2. | SIGNIFICANT ACCOUNTING POLICIES (continued) |
Other (continued)
assets and liabilities and the disclosure of contingent assets and liabilities at the date of the financial statements and the reported amounts of income and expenses during the reporting period. Actual results could differ from those estimates.
| 3. | TRANSACTIONS WITH AFFILIATES |
The Fund has an Investment Advisory Agreement (the “Agreement”) with the Advisor, for which the Series pays a fee, computed daily and payable monthly, at an annual rate of 1.00% of the Series’ average daily net assets.
Under the Agreement, personnel of the Advisor provide the Series with advice and assistance in the choice of investments and the execution of securities transactions, and otherwise maintain the Series’ organization. The Advisor also provides the Fund with necessary office space and fund administration and support services. The salaries of all officers of the Fund (except a percentage of the Fund’s Chief Compliance Officer’s salary, which is paid by the Fund), and of all Directors who are “affiliated persons” of the Fund, or of the Advisor, and all personnel of the Fund, or of the Advisor, performing services relating to research, statistical and investment activities, are paid by the Advisor. Each “non-affiliated” Director receives an annual stipend, which is allocated among all the active series of the Fund. In addition, these Directors also receive a fee per Board meeting attended for each active series of the Fund plus a fee for each committee meeting attended.
The Advisor has contractually agreed, until at least April 30, 2011, to waive its fee and, if necessary, pay other operating expenses of the Series in order to maintain total direct annual fund operating expenses for the Series at no more than 1.20% of average daily net assets each year. Accordingly, the Advisor waived fees of $5,545 for the six months ended June 30, 2010, which is included as a reduction of expenses on the Statement of Operations. For the six months ended June 30, 2010, the Advisor voluntarily waived additional fees of $758, which is also included as a reduction of expenses on the Statement of Operations. The Advisor is not eligible to recoup any expense that has been waived or reimbursed in prior years.
Manning & Napier Investor Services, Inc., a registered broker-dealer affiliate of the Advisor, acts as distributor for the Fund’s shares. The services of Manning & Napier Investor Services, Inc. are provided at no additional cost to the Series.
The Advisor has entered into agreements with PNC Global Investment Servicing (U.S.) Inc. (“PNCGIS”) under which PNCGIS serves as sub-accountant services agent and sub-transfer agent. The Fund pays the Advisor an annual fee of 0.0175% on the first $3 billion of average daily net assets (excluding Target Series); 0.015% on the next $3 billion of average daily net assets (excluding Target Series); and 0.01% of the average daily net assets in excess of $6 billion (excluding Target Series); plus a base fee of $25,500 per Series. Additionally, certain transaction-, account-, and cusip-based fees and out-of-pocket expenses, including charges for reporting relating to the Fund’s compliance program, are charged.
On July 1, 2010, The PNC Financial Services Group, Inc. sold the outstanding stock of PNC Global Investment Servicing Inc. to The Bank of New York Mellon Corporation. At the closing of the sale, PNCGIS changed its name to BNY Mellon Investment Servicing (US) Inc.
| 4. | PURCHASES AND SALES OF SECURITIES |
For the six months ended June 30, 2010, purchases and sales of securities, other than U.S. Government securities and short-term securities, were $11,862,218 and $8,710,400, respectively. There were no purchases or sales of U.S. Government securities.
13
Notes to Financial Statements (unaudited)
| 5. | CAPITAL STOCK TRANSACTIONS |
Transactions in shares of Real Estate Series were:
| | | | | | | | | | | | | | |
| | | For the Six Months Ended 6/30/10 | | | For the period 11/10/09
(commencement of operations) to 12/31/09 | |
| | | Shares | | | Amount | | | Shares | | | Amount | |
Sold | | 521,042 | | | $ | 5,833,446 | | | 6,617,571 | | | $ | 66,420,562 | |
Reinvested | | — | | | | — | | | 13,571 | | | | 139,922 | |
Repurchased | | (324,570 | ) | | | (3,734,103 | ) | | (113,239 | ) | | | (1,162,442 | ) |
| | | | | | | | | | | | | | |
Total | | 196,472 | | | $ | 2,099,343 | | | 6,517,903 | | | $ | 65,398,042 | |
| | | | | | | | | | | | | | |
Substantially all of the Series’ shares represent investments by fiduciary accounts over which the Advisor has sole investment discretion.
The Series may trade in instruments including written and purchased options, forward foreign currency exchange contracts and futures contracts and other derivatives in the normal course of investing activities to assist in managing exposure to various market risks. The Series may be subject to various elements of risk and may involve, to a varying degree, elements of risk in excess of the amounts recognized for financial statement purposes. These risks include: the risk that changes in the value of a derivative may not correlate perfectly with the underlying asset, rate or index, counterparty credit risk related to over the counter derivatives counterparties’ failure to perform under contract terms, liquidity risk related to the lack of a liquid market for these contracts allowing the fund to close out its position(s) and documentation risk relating to disagreement over contract terms. No such investments were held by the Series on June 30, 2010.
Investing in securities of foreign companies and foreign governments involves special risks and considerations not typically associated with investing in securities of domestic companies and the U.S. Government. These risks include revaluation of currencies and future adverse political and economic developments. Moreover, securities of foreign companies and foreign governments and their markets may be less liquid and their prices more volatile than those of comparable domestic companies and the U.S. Government.
The Series may focus its investments in certain related real estate industries; hence, the Series may subject itself to a greater degree of risk than a series that is more diversified.
| 9. | FEDERAL INCOME TAX INFORMATION |
The amount and characterization of certain income and capital gains to be distributed are determined in accordance with federal income tax regulations, which may differ from accounting principles generally accepted in the United States of America. The Series may periodically make reclassifications among its capital accounts to reflect income and gains available for distribution (or available capital loss carryovers) under income tax regulations without impacting the Series’ net asset value. Any such reclassifications are not reflected in the financial highlights.
14
Notes to Financial Statements (unaudited)
| 9. | FEDERAL INCOME TAX INFORMATION (continued) |
The final determination of the tax character of current year distributions will be made at the conclusion of the fiscal year. The tax character of distributions paid for the period November 10, 2009 (commencement of operations) to December 31, 2009 were as follows:
| | | |
Ordinary income | | $ | 103,993 |
Long-term capital gains | | | 40,774 |
At June 30, 2010, the identified cost of investments for federal income tax purposes, the resulting gross unrealized appreciation and depreciation, and the net unrealized appreciation were as follows:
| | | | |
Cost for federal income tax purposes | | $ | 69,997,713 | |
Unrealized appreciation | | $ | 6,653,503 | |
Unrealized depreciation | | | (1,106,284 | ) |
| | | | |
Net unrealized appreciation | | $ | 5,547,219 | |
| | | | |
There were no subsequent events that require recognition or disclosure. In preparing these financial statements, management of the Fund has evaluated events and transactions for potential recognition or disclosure through the date the financial statements were issued.
15
This Page Intentionally Left Blank
This Page Intentionally Left Blank
Literature Requests (unaudited)
Proxy Voting Policies and Procedures
A description of the policies and procedures that the Fund uses to determine how to vote proxies relating to portfolio securities is available, without charge, upon request:
| | |
By phone | | 1-800-466-3863 |
On the Securities and Exchange | | |
Commission’s (SEC) web site | | http://www.sec.gov |
Proxy Voting Record
Information regarding how the Fund voted proxies relating to portfolio securities during the most recent 12-month period ended June 30th is available, without charge, upon request:
| | |
By phone | | 1-800-466-3863 |
On the SEC’s web site | | http://www.sec.gov |
Quarterly Portfolio Holdings
The Series’ complete schedule of portfolio holdings for the 1st and 3rd quarters of each fiscal year are provided on Form N-Q, and are available, without charge, upon request:
| | |
By phone | | 1-800-466-3863 |
On the SEC’s web site | | http://www.sec.gov |
The Series’ Form N-Q may be reviewed and copied at the SEC’s Public Reference Room in Washington, D.C. Information on the operation of the Public Reference Room may be obtained by calling 1-800-SEC-0330.
Prospectus and Statement of Additional Information (SAI)
The prospectus and SAI provide additional information about each Series, including charges, expenses and risks. These documents are available, without charge, upon request:
| | |
By phone | | 1-800-466-3863 |
On the SEC’s web site | | http://www.sec.gov |
On the Advisor’s web site | | http://www.manningnapieradvisors.com |
Additional information available at www.manningnapieradvisors.com
1. Fund Holdings - Month-End
2. Fund Holdings - Quarter-End
3. Shareholder Report - Annual
4. Shareholder Report - Semi-Annual
MNRE-06/10-SAR

Shareholder Expense Example (unaudited)
As a shareholder of the Series, you may incur two types of costs: (1) transaction costs and (2) ongoing costs, including management fees and other Series expenses. This example is intended to help you understand your ongoing costs (in dollars) of investing in the Series and to compare these costs with the ongoing costs of investing in other mutual funds.
The example is based on an investment of $1,000 invested at the beginning of the period and held for the entire period (January 1, 2010 to June 30, 2010).
Actual Expenses
The first line of the table below provides information about actual account values and actual expenses. You may use the information in this line, together with the amount you invested, to estimate the expenses that you paid over the period. Simply divide your account value by $1,000 (for example, an $8,600 account value divided by $1,000 = 8.6), then multiply the result by the number in the first line under the heading entitled “Expenses Paid During Period” to estimate the expenses you paid on your account during this period.
Hypothetical Example for Comparison Purposes
The second line of the table below provides information about hypothetical account values and hypothetical expenses based on the Series’ actual expense ratio and an assumed rate of return of 5% per year before expenses, which is not the Series’ actual return. The hypothetical account values and expenses may not be used to estimate the actual ending account balance or expenses you paid during the period. You may use this information to compare the ongoing costs of investing in the Series and other funds. To do so, compare this 5% hypothetical example with the 5% hypothetical examples that appear in the shareholder reports of the other funds.
Please note that the expenses shown in the table are meant to highlight your ongoing costs only and do not reflect any transaction costs. Therefore, the second line of the table is useful in comparing ongoing costs only, and will not help you determine the relative total costs of owning different funds. In addition, if these transaction costs were included, your costs would have been higher.
| | | | | | |
| | | Beginning
Account Value
1/1/10 | | Ending
Account Value
6/30/10 | | Expenses Paid
During Period*
1/1/10-6/30/10 |
Actual | | $1,000.00 | | $899.90 | | $5.32 |
Hypothetical
(5% return before expenses) | | $1,000.00 | | $1,019.19 | | $5.66 |
*Expenses are equal to the Series’ annualized expense ratio (for the six-month period) of 1.13%, multiplied by the average account value over the period, multiplied by 181/365 (to reflect the one-half year period). Expenses are based on the most recent fiscal half year. The Series’ total return would have been lower had certain expenses not been waived during the period.
Portfolio Composition as of June 30, 2010 (unaudited)
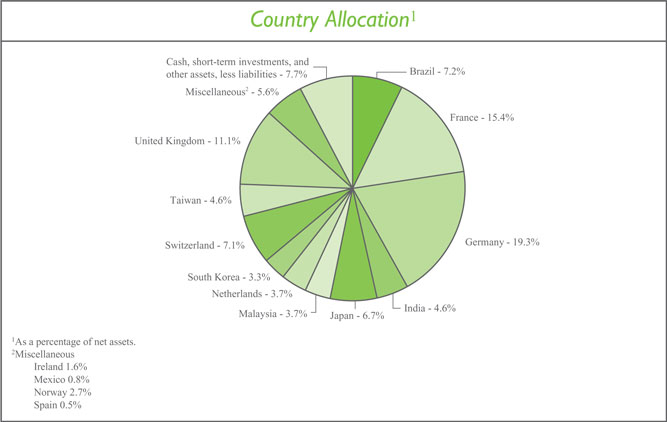
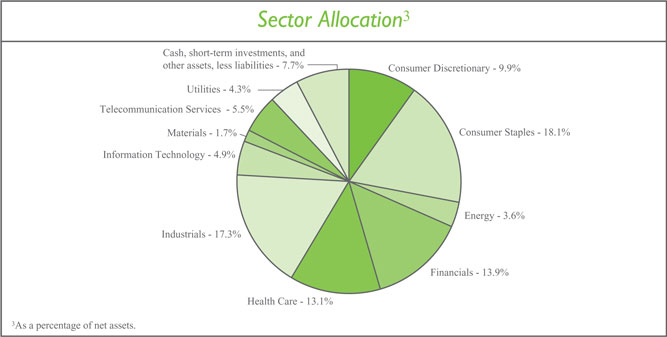
Investment Portfolio - June 30, 2010 (unaudited)
| | | | | | | |
| | | Shares | | Value (Note 2) | | |
| | | |
COMMON STOCKS - 92.3% | | | | | | | |
| | | |
Consumer Discretionary - 9.9% | | | | | | | |
Auto Components - 1.6% | | | | | | | |
Hankook Tire Co. Ltd. (South Korea) | | 178,870 | | $ | 4,091,293 | | |
| | | | | | | |
Automobiles - 1.3% | | | | | | | |
Hero Honda Motors Ltd. (India) | | 42,450 | | | 1,872,342 | | |
Maruti Suzuki India Ltd. (India) | | 44,940 | | | 1,377,615 | | |
| | | | | | | |
| | | | | 3,249,957 | | |
| | | | | | | |
Household Durables - 3.0% | | | | | | | |
Corporacion Geo S.A.B. de C.V. - Class B (Mexico)* | | 783,010 | | | 2,089,351 | | |
LG Electronics, Inc. (South Korea) | | 32,640 | | | 2,510,841 | | |
PDG Realty S.A. Empreendimentos e Participacoes (Brazil) | | 43,537 | | | 364,698 | | |
Rodobens Negocios Imobiliarios S.A. (Brazil) | | 367,000 | | | 2,389,058 | | |
| | | | | | | |
| | | | | 7,353,948 | | |
| | | | | | | |
Media - 2.2% | | | | | | | |
Reed Elsevier plc - ADR (United Kingdom) | | 60,311 | | | 1,767,112 | | |
Societe Television Francaise 1 (France) | | 108,530 | | | 1,430,017 | | |
Wolters Kluwer N.V. (Netherlands) | | 114,447 | | | 2,207,740 | | |
| | | | | | | |
| | | | | 5,404,869 | | |
| | | | | | | |
Multiline Retail - 1.2% | | | | | | | |
PPR (France) | | 22,930 | | | 2,875,503 | | |
| | | | | | | |
Specialty Retail - 0.6% | | | | | | | |
Komeri Co. Ltd. (Japan) | | 67,000 | | | 1,514,822 | | |
| | | | | | | |
Total Consumer Discretionary | | | | | 24,490,392 | | |
| | | | | | | |
Consumer Staples - 18.1% | | | | | | | |
Beverages - 2.8% | | | | | | | |
Diageo plc (United Kingdom) | | 162,810 | | | 2,578,494 | | |
Kirin Holdings Co. Ltd. (Japan) | | 215,000 | | | 2,728,383 | | |
United Spirits Ltd. (India) | | 57,400 | | | 1,619,299 | | |
| | | | | | | |
| | | | | 6,926,176 | | |
| | | | | | | |
Food & Staples Retailing - 6.1% | | | | | | | |
Carrefour S.A. (France) | | 165,082 | | | 6,609,255 | | |
Casino Guichard-Perrachon S.A. (France) | | 34,170 | | | 2,606,541 | | |
President Chain Store Corp. (Taiwan) | | 702,320 | | | 2,078,665 | | |
Tesco plc (United Kingdom) | | 667,410 | | | 3,789,767 | | |
| | | | | | | |
| | | | | 15,084,228 | | |
| | | | | | | |
Food Products - 6.7% | | | | | | | |
Danone S.A. (France) | | 40,012 | | | 2,162,652 | | |
IOI Corp. Berhad (Malaysia) | | 560,800 | | | 867,833 | | |
Nestle S.A. (Switzerland) | | 105,220 | | | 5,095,778 | | |
Suedzucker AG (Germany) | | 90,690 | | | 1,645,763 | | |
| | | | |
| | The accompanying notes are an integral part of the financial statements. | | 3 |
Investment Portfolio - June 30, 2010 (unaudited)
| | | | | | | |
| | | Shares | | Value (Note 2) | | |
| | | |
COMMON STOCKS (continued) | | | | | | | |
| | | |
Consumer Staples (continued) | | | | | | | |
Food Products (continued) | | | | | | | |
Unilever plc - ADR (United Kingdom) | | 261,230 | | $ | 6,982,678 | | |
| | | | | | | |
| | | | | 16,754,704 | | |
| | | | | | | |
Household Products - 2.5% | | | | | | | |
Hindustan Unilever Ltd. (India) | | 250,540 | | | 1,443,255 | | |
Kao Corp. (Japan) | | 47,000 | | | 1,112,605 | | |
Reckitt Benckiser Group plc (United Kingdom) | | 78,270 | | | 3,662,657 | | |
| | | | | | | |
| | | | | 6,218,517 | | |
| | | | | | | |
Total Consumer Staples | | | | | 44,983,625 | | |
| | | | | | | |
Energy - 3.6% | | | | | | | |
Oil, Gas & Consumable Fuels - 3.6% | | | | | | | |
Royal Dutch Shell plc - Class B (Netherlands) | | 88,430 | | | 2,154,928 | | |
Royal Dutch Shell plc - Class B - ADR (Netherlands) | | 87,780 | | | 4,238,018 | | |
Total S.A. (France) | | 56,580 | | | 2,557,572 | | |
| | | | | | | |
Total Energy | | | | | 8,950,518 | | |
| | | | | | | |
Financials - 13.9% | | | | | | | |
Capital Markets - 0.7% | | | | | | | |
Daiwa Securities Group, Inc. (Japan) | | 98,000 | | | 418,979 | | |
Nomura Holdings, Inc. (Japan) | | 78,900 | | | 436,375 | | |
OSK Holdings Berhad (Malaysia) | | 2,089,500 | | | 826,119 | | |
OSK Ventures International Berhad (Malaysia)* | | 202,575 | | | 29,408 | | |
| | | | | | | |
| | | | | 1,710,881 | | |
| | | | | | | |
Commercial Banks - 4.8% | | | | | | | |
Axis Bank Ltd. (India) | | 67,600 | | | 1,808,295 | | |
BNP Paribas (France) | | 28,330 | | | 1,550,986 | | |
The Chugoku Bank Ltd. (Japan) | | 137,000 | | | 1,626,986 | | |
Credit Agricole S.A. (France) | | 63,090 | | | 666,188 | | |
The Hachijuni Bank Ltd. (Japan) | | 244,000 | | | 1,382,616 | | |
Hong Leong Financial Group Berhad (Malaysia) | | 816,800 | | | 2,121,788 | | |
Mitsubishi UFJ Financial Group, Inc. (Japan) | | 170,000 | | | 778,714 | | |
Royal Bank of Scotland Group plc (United Kingdom)* | | 277,092 | | | 171,521 | | |
Societe Generale (France) | | 15,410 | | | 646,355 | | |
The Sumitomo Trust & Banking Co. Ltd. (Japan) | | 247,000 | | | 1,276,695 | | |
| | | | | | | |
| | | | | 12,030,144 | | |
| | | | | | | |
Diversified Financial Services - 0.2% | | | | | | | |
ING Groep N.V. (Netherlands)* | | 65,395 | | | 493,885 | | |
| | | | | | | |
Insurance - 6.2% | | | | | | | |
Allianz SE (Germany) | | 40,870 | | | 4,090,698 | | |
Amil Participacoes S.A. (Brazil) | | 350,000 | | | 2,840,720 | | |
AXA S.A. (France) | | 56,372 | | | 878,572 | | |
| | | | |
| 4 | | The accompanying notes are an integral part of the financial statements. | | |
Investment Portfolio - June 30, 2010 (unaudited)
| | | | | | | |
| | | Shares | | Value (Note 2) | | |
| | | |
COMMON STOCKS (continued) | | | | | | | |
| | | |
Financials (continued) | | | | | | | |
Insurance (continued) | | | | | | | |
Muenchener Rueckversicherungs-Gesellschaft AG (MunichRe) (Germany) | | 40,610 | | $ | 5,132,366 | | |
Zurich Financial Services AG (Switzerland) | | 10,500 | | | 2,333,117 | | |
| | | | | | | |
| | | | | 15,275,473 | | |
| | | | | | | |
Real Estate Investment Trusts (REITS) - 1.2% | | | | | | | |
Alstria Office REIT AG (Germany) | | 313,480 | | | 2,990,051 | | |
| | | | | | | |
Real Estate Management & Development - 0.0%** | | | | | | | |
OSK Property Holdings Berhad (Malaysia) | | 243,091 | | | 39,796 | | |
| | | | | | | |
Thrifts & Mortgage Finance - 0.8% | | | | | | | |
Aareal Bank AG (Germany)* | | 115,790 | | | 1,950,459 | | |
| | | | | | | |
Total Financials | | | | | 34,490,689 | | |
| | | | | | | |
Health Care - 13.1% | | | | | | | |
Health Care Equipment & Supplies - 0.8% | | | | | | | |
Straumann Holding AG (Switzerland) | | 8,894 | | | 1,933,353 | | |
| | | | | | | |
Health Care Providers & Services - 1.7% | | | | | | | |
OdontoPrev S.A. (Brazil)* | | 123,000 | | | 4,252,188 | | |
| | | | | | | |
Pharmaceuticals - 10.6% | | | | | | | |
AstraZeneca plc (United Kingdom) | | 27,960 | | | 1,323,849 | | |
AstraZeneca plc - ADR (United Kingdom) | | 46,350 | | | 2,184,476 | | |
Bayer AG (Germany) | | 187,350 | | | 10,538,667 | | |
GlaxoSmithKline plc (United Kingdom) | | 172,980 | | | 2,954,073 | | |
Novartis AG - ADR (Switzerland) | | 49,000 | | | 2,367,680 | | |
Sanofi-Aventis S.A. (France) | | 26,423 | | | 1,600,385 | | |
Shire plc (Ireland) | | 195,160 | | | 4,006,421 | | |
Takeda Pharmaceutical Co. Ltd. (Japan) | | 34,900 | | | 1,507,866 | | |
| | | | | | | |
| | | | | 26,483,417 | | |
| | | | | | | |
| | | |
Total Health Care | | | | | 32,668,958 | | |
| | | | | | | |
Industrials - 17.3% | | | | | | | |
Airlines - 1.1% | �� | | | | | | |
Deutsche Lufthansa AG (Germany)* | | 206,580 | | | 2,877,306 | | |
| | | | | | | |
Commercial Services & Supplies - 2.5% | | | | | | | |
Taiwan Secom Co. Ltd. (Taiwan) | | 777,210 | | | 1,221,515 | | |
Tomra Systems ASA (Norway) | | 1,189,080 | | | 4,988,188 | | |
| | | | | | | |
| | | | | 6,209,703 | | |
| | | | | | | |
Construction & Engineering - 0.6% | | | | | | | |
Larsen & Toubro Ltd. (India) | | 41,270 | | | 1,607,393 | | |
| | | | | | | |
Electrical Equipment - 5.2% | | | | | | | |
ABB Ltd. (Asea Brown Boveri) - ADR (Switzerland) | | 138,000 | | | 2,384,640 | | |
Alstom S.A. (France) | | 97,560 | | | 4,471,420 | | |
| | | | |
| | The accompanying notes are an integral part of the financial statements. | | 5 |
Investment Portfolio - June 30, 2010 (unaudited)
| | | | | | | |
| | | Shares | | Value (Note 2) | | |
| | | |
COMMON STOCKS (continued) | | | | | | | |
| | | |
Industrials (continued) | | | | | | | |
Electrical Equipment (continued) | | | | | | | |
Bharat Heavy Electricals Ltd. (India) | | 30,080 | | $ | 1,593,019 | | |
Schneider Electric S.A. (France) | | 26,590 | | | 2,719,609 | | |
Teco Electric and Machinery Co. Ltd. (Taiwan) | | 4,084,000 | | | 1,690,466 | | |
| | | | | | | |
| | | | | 12,859,154 | | |
| | | | | | | |
Industrial Conglomerates - 3.4% | | | | | | | |
Siemens AG (Germany) | | 92,300 | | | 8,354,586 | | |
| | | | | | | |
Machinery - 0.9% | | | | | | | |
FANUC Ltd. (Japan) | | 19,400 | | | 2,224,917 | | |
| | | | | | | |
Road & Rail - 2.3% | | | | | | | |
All America Latina Logistica S.A. (Brazil) | | 722,000 | | | 5,644,000 | | |
| | | | | | | |
Transportation Infrastructure - 1.3% | | | | | | | |
Malaysia Airports Holdings Berhad (Malaysia) | | 2,148,700 | | | 3,318,456 | | |
| | | | | | | |
Total Industrials | | | | | 43,095,515 | | |
| | | | | | | |
Information Technology - 4.9% | | | | | | | |
Communications Equipment - 0.3% | | | | | | | |
D-Link Corp. (Taiwan) | | 1,120,606 | | | 856,197 | | |
| | | | | | | |
Electronic Equipment, Instruments & Components - 1.1% | | | | | | | |
Keyence Corp. (Japan) | | 6,845 | | | 1,600,250 | | |
Yageo Corp. (Taiwan) | | 2,931,000 | | | 1,194,968 | | |
| | | | | | | |
| | | | | 2,795,218 | | |
| | | | | | | |
IT Services - 1.0% | | | | | | | |
Cap Gemini S.A. (France) | | 56,320 | | | 2,499,675 | | |
| | | | | | | |
Semiconductors & Semiconductor Equipment - 1.1% | | | | | | | |
Taiwan Semiconductor Manufacturing Co. Ltd. - ADR (Taiwan) | | 275,315 | | | 2,687,074 | | |
| | | | | | | |
Software - 1.4% | | | | | | | |
SAP AG (Germany) | | 76,970 | | | 3,452,431 | | |
| | | | | | | |
Total Information Technology | | | | | 12,290,595 | | |
| | | | | | | |
Materials - 1.7% | | | | | | | |
Chemicals - 1.1% | | | | | | | |
Arkema S.A. (France) | | 1,229 | | | 43,118 | | |
BASF SE (Germany) | | 47,000 | | | 2,592,655 | | |
| | | | | | | |
| | | | | 2,635,773 | | |
| | | | | | | |
Construction Materials - 0.6% | | | | | | | |
Taiwan Cement Corp. (Taiwan) | | 1,899,827 | | | 1,614,157 | | |
| | | | | | | |
Total Materials | | | | | 4,249,930 | | |
| | | | | | | |
Telecommunication Services - 5.5% | | | | | | | |
Diversified Telecommunication Services - 4.0% | | | | | | | |
France Telecom S.A. (France) | | 155,920 | | | 2,723,681 | | |
| | | | |
| 6 | | The accompanying notes are an integral part of the financial statements. | | |
Investment Portfolio - June 30, 2010 (unaudited)
| | | | | | | |
| | | Shares | | Value (Note 2) | | |
| | | |
COMMON STOCKS (continued) | | | | | | | |
Telecommunication Services (continued) | | | | | | | |
Diversified Telecommunication Services (continued) | | | | | | | |
France Telecom S.A. - ADR (France) | | 38,800 | | $ | 671,628 | | |
Swisscom AG - ADR (Switzerland)1 | | 106,400 | | | 3,580,360 | | |
Telefonica S.A. - ADR (Spain) | | 22,850 | | | 1,268,860 | | |
Telenor ASA - ADR (Norway)1 | | 45,480 | | | 1,711,412 | | |
| | | | | | | |
| | | | | 9,955,941 | | |
| | | | | | | |
Wireless Telecommunication Services - 1.5% | | | | | | | |
Digi.Com Berhad (Malaysia) | | 284,200 | | | 2,019,027 | | |
SK Telecom Co. Ltd. - ADR (South Korea) | | 114,190 | | | 1,682,019 | | |
| | | | | | | |
| | | | | 3,701,046 | | |
| | | | | | | |
Total Telecommunication Services | | | | | 13,656,987 | | |
| | | | | | | |
Utilities - 4.3% | | | | | | | |
Electric Utilities - 1.8% | | | | | | | |
E.ON AG (Germany) | | 164,441 | | | 4,460,112 | | |
| | | | | | | |
Multi-Utilities - 1.5% | | | | | | | |
GDF Suez (France) | | 51,850 | | | 1,490,015 | | |
National Grid plc (United Kingdom) | | 286,530 | | | 2,101,990 | | |
| | | | | | | |
| | | | | 3,592,005 | | |
| | | | | | | |
Water Utilities - 1.0% | | | | | | | |
Cia de Saneamento de Minas Gerais - Copasa MG (Brazil)* | | 182,000 | | | 2,520,776 | | |
| | | | | | | |
Total Utilities | | | | | 10,572,893 | | |
| | | | | | | |
TOTAL COMMON STOCKS | | | | | | | |
(Identified Cost $237,128,268) | | | | | 229,450,102 | | |
| | | | | | | |
| | | |
SHORT-TERM INVESTMENTS - 7.6% | | | | | | | |
| | | |
Dreyfus Cash Management, Inc. - Institutional Shares2 , 0.13% | | | | | | | |
(Identified Cost $18,868,206) | | 18,868,206 | | | 18,868,206 | | |
| | | | | | | |
| | | |
TOTAL INVESTMENTS - 99.9% | | | | | | | |
(Identified Cost $255,996,474) | | | | | 248,318,308 | | |
OTHER ASSETS, LESS LIABILITIES - 0.1% | | | | | 321,574 | | |
| | | | | | | |
NET ASSETS - 100% | | | | $ | 248,639,882 | | |
| | | | | | | |
ADR - American Depository Receipt
| * | Non-income producing security |
| 1 | Latest quoted sales price is not available and the latest quoted bid price was used to value the security. |
| 2 | Rate shown is the current yield as of June 30, 2010. |
The Series’ portfolio holds, as a percentage of net assets, greater than 10% in the following countries:
Germany - 19.3%; France - 15.4%; United Kingdom - 11.1%.
| | | | |
| | The accompanying notes are an integral part of the financial statements. | | 7 |
Statement of Assets & Liabilities (unaudited)
June 30, 2010
| | | | |
Investments, at value (identified cost $255,996,474) (Note 2) | | $ | 248,318,308 | |
Foreign currency, at value (cost $89,638) | | | 89,305 | |
Foreign tax reclaims receivable | | | 468,192 | |
Dividends receivable | | | 430,471 | |
Receivable for fund shares sold | | | 186,922 | |
Prepaid and other expenses | | | 2,616 | |
| | | | |
| |
TOTAL ASSETS | | | 249,495,814 | |
| | | | |
| |
LIABILITIES: | | | | |
| |
Accrued management fees (Note 3) | | | 205,683 | |
Accrued transfer agent fees (Note 3) | | | 9,198 | |
Accrued fund accounting and administration fees (Note 3) | | | 3,653 | |
Accrued Chief Compliance Officer service fees (Note 3) | | | 820 | |
Payable for fund shares repurchased | | | 481,348 | |
Accrued capital gains tax payable (Note 2) | | | 155,230 | |
| | | | |
| |
TOTAL LIABILITIES | | | 855,932 | |
| | | | |
| |
TOTAL NET ASSETS | | $ | 248,639,882 | |
| | | | |
| |
NET ASSETS CONSIST OF: | | | | |
| |
Capital stock | | $ | 329,419 | |
Additional paid-in-capital | | | 247,594,850 | |
Undistributed net investment income | | | 3,480,678 | |
Accumulated net realized gain on investments, foreign currency and translation of other assets and liabilities | | | 5,100,844 | |
Net unrealized depreciation on investments (net of accrued capital gains tax of $155,230), foreign currency and translation of other assets and liabilities | | | (7,865,909 | ) |
| | | | |
TOTAL NET ASSETS | | $ | 248,639,882 | |
| | | | |
| |
NET ASSET VALUE, OFFERING PRICE AND REDEMPTION PRICE PER SHARE - Class A ($248,639,882/32,941,852 shares) | | $ | 7.55 | |
| | | | |
| | | | |
| 8 | | The accompanying notes are an integral part of the financial statements. | | |
Statement of Operations (unaudited)
For the Six Months Ended June 30, 2010
| | | | |
INVESTMENT INCOME: | | | | |
| |
Dividends (net of foreign taxes withheld, $637,225) | | $ | 5,398,259 | |
| | | | |
| |
EXPENSES: | | | | |
| |
Management fees (Note 3) | | | 1,287,968 | |
Fund accounting and administration fees (Note 3) | | | 30,999 | |
Transfer agent fees (Note 3) | | | 12,989 | |
Directors’ fees (Note 3) | | | 6,373 | |
Chief Compliance Officer service fees (Note 3) | | | 1,761 | |
Miscellaneous | | | 116,665 | |
| | | | |
Total Expenses | | | 1,456,755 | |
Less reduction of expenses (Note 3) | | | (758 | ) |
| | | | |
Net Expenses | | | 1,455,997 | |
| | | | |
NET INVESTMENT INCOME | | | 3,942,262 | |
| | | | |
| |
REALIZED AND UNREALIZED GAIN (LOSS) ON INVESTMENTS AND FOREIGN CURRENCY: | | | | |
| |
Net realized gain (loss) on-
Investments (net of foreign capital gains tax of $99,848) (Note 2) | | | 4,107,383 | |
Foreign currency, and translation of other assets and liabilities | | | (81,228 | ) |
| | | | |
| | | 4,026,155 | |
| | | | |
| |
Net change in unrealized depreciation on-
Investments (net of change in accrued capital gains tax of $120,974) | | | (34,977,508 | ) |
Foreign currency, and translation of other assets and liabilities | | | (38,059 | ) |
| | | | |
| | | (35,015,567 | ) |
| | | | |
| |
NET REALIZED AND UNREALIZED GAIN (LOSS) ON INVESTMENTS AND FOREIGN CURRENCY | | | (30,989,412 | ) |
| | | | |
| |
NET DECREASE IN NET ASSETS RESULTING FROM OPERATIONS | | $ | (27,047,150 | ) |
| | | | |
| | | | |
| | The accompanying notes are an integral part of the financial statements. | | 9 |
Statements of Changes in Net Assets
| | | | | | | | |
| | | For the Six
Months Ended
6/30/10
(unaudited) | | | For the Year Ended
12/31/09 | |
INCREASE (DECREASE) IN NET ASSETS: | | | | | | | | |
| | |
OPERATIONS: | | | | | | | | |
| | |
Net investment income | | $ | 3,942,262 | | | $ | 3,790,908 | |
Net realized gain on investments and foreign currency | | | 4,026,155 | | | | 8,560,500 | |
Net change in unrealized appreciation (depreciation) on investments (net of change in accrued capital gains tax of $120,974 and $34,256, respectively) and foreign currency | | | (35,015,567 | ) | | | 48,051,482 | |
| | | | | | | | |
| | |
Net increase (decrease) from operations | | | (27,047,150 | ) | | | 60,402,890 | |
| | | | | | | | |
| | |
DISTRIBUTIONS TO SHAREHOLDERS (Note 8): | | | | | | | | |
| | |
From net investment income | | | — | | | | (4,479,987 | ) |
From net realized gain on investments | | | — | | | | (7,507,773 | ) |
| | | | | | | | |
| | |
Total distributions to shareholders | | | — | | | | (11,987,760 | ) |
| | | | | | | | |
| | |
CAPITAL STOCK ISSUED AND REPURCHASED: | | | | | | | | |
| | |
Net increase from capital share transactions (Note 5) | | | 8,586,632 | | | | 36,412,740 | |
| | | | | | | | |
| | |
Net increase (decrease) in net assets | | | (18,460,518 | ) | | | 84,827,870 | |
| | |
NET ASSETS: | | | | | | | | |
| | |
Beginning of period | | | 267,100,400 | | | | 182,272,530 | |
| | | | | | | | |
| | |
End of period (including undistributed net investment income of $3,480,678 and accumulated net investment loss of $461,584, respectively) | | $ | 248,639,882 | | | $ | 267,100,400 | |
| | | | | | | | |
| | | | |
| 10 | | The accompanying notes are an integral part of the financial statements. | | |
| | | | | | | | | | | | | |
| | | For the Six
Months Ended
6/30/10 | | For the Years Ended |
| | | (unaudited) | | 12/31/09 | | | 12/31/08 | | 12/31/07 | | 12/31/06 | | 12/31/05 |
Per share data (for a share outstanding throughout each period): | | | | | | | | | | | | | |
Net asset value - Beginning of period | | $8.39 | | $6.57 | | | $10.87 | | $9.84 | | $9.90 | | $9.52 |
| | | | | | | | | | | | | |
| | | | | | |
Income (loss) from investment operations: | | | | | | | | | | | | | |
Net investment income | | 0.121 | | 0.141 | | | 0.22 | | 0.15 | | 0.15 | | 0.11 |
Net realized and unrealized gain (loss) on investments | | (0.96) | | 2.10 | | | (3.82) | | 1.12 | | 2.01 | | 1.21 |
| | | | | | | | | | | | | |
Total from investment operations | | (0.84) | | 2.24 | | | (3.60) | | 1.27 | | 2.16 | | 1.32 |
| | | | | | | | | | | | | |
Less distributions to shareholders: | | | | | | | | | | | | | |
From net investment income | | — �� | | (0.16) | | | (0.21) | | (0.14) | | (0.15) | | (0.11) |
From net realized gain on investments | | — | | (0.26) | | | (0.49) | | (0.10) | | (2.07) | | (0.83) |
| | | | | | | | | | | | | |
Total distributions to shareholders | | — | | (0.42) | | | (0.70) | | (0.24) | | (2.22) | | (0.94) |
| | | | | | | | | | | | | |
Net asset value - End of period | | $7.55 | | $8.39 | | | $6.57 | | $10.87 | | $9.84 | | $9.90 |
| | | | | | | | | | | | | |
Net assets - End of period | | | | | | | | | | | | | |
(000’s omitted) | | $248,640 | | $267,100 | | | $182,273 | | $270,080 | | $215,981 | | $193,168 |
| | | | | | | | | | | | | |
Total return2 | | (10.01%) | | 34.23% | | | (33.25%) | | 13.01% | | 21.96% | | 13.99% |
Ratios (to average net assets)/ Supplemental Data: | | | | | | | | | | | | | |
Expenses* | | 1.13%3 | | 1.15% | | | 1.15% | | 1.16% | | 1.18% | | 1.24% |
Net investment income | | 3.06%3 | | 1.90% | | | 2.49% | | 1.47% | | 1.39% | | 1.10% |
Portfolio turnover | | 10% | | 17% | | | 9% | | 20% | | 30% | | 35% |
*The investment advisor did not impose all of its management fees, CCO fees and fund accounting and transfer agent fees, and other fees in some periods and in some periods paid a portion of the Series’ expenses. If these expenses had been incurred by the Series, the expense ratio (to average net assets) would have been increased by the following amounts: |
| | 0.00%3,4 | | 0.00% | 4 | | N/A | | N/A | | N/A | | N/A |
1Calculated based on average shares outstanding during the periods.
2Represents aggregate total return for the periods indicated, and assumes reinvestment of all distributions. Total return would have been lower had certain expenses not been waived or reimbursed during the periods. Periods less than one year are not annualized.
3Annualized.
4Less than 0.01%.
| | | | |
| | The accompanying notes are an integral part of the financial statements. | | 11 |
Notes to Financial Statements (unaudited)
International Series (the “Series”) is a no-load diversified series of Manning & Napier Fund, Inc. (the “Fund”). The Fund is organized in Maryland and is registered under the Investment Company Act of 1940, as amended, as an open-end management investment company.
The Series’ investment objective is to provide long-term growth by investing principally in the common stocks of companies located outside the United States.
The Fund’s Advisor is Manning & Napier Advisors, Inc. (the “Advisor”). Shares of the Series are offered to investors, clients and employees of the Advisor and its affiliates. The Series resumed offering shares directly to investors on May 18, 2004, as it had done previously from time to time. The total authorized capital stock of the Fund consists of 10.0 billion shares of common stock each having a par value of $0.01. As of June 30, 2010, 6.2 billion shares have been designated in total among 29 series, of which 100 million have been designated as International Series Class A common stock.
| 2. | SIGNIFICANT ACCOUNTING POLICIES |
Security Valuation
Portfolio securities, including domestic equities, foreign equities, warrants and options, listed on an exchange other than the NASDAQ National Market System are valued at the latest quoted sales price of the exchange on which the security is primarily traded. Securities not traded on valuation date or securities not listed on an exchange are valued at the latest quoted bid price provided by the Fund’s pricing service. Securities listed on the NASDAQ National Market System are valued in accordance with the NASDAQ Official Closing Price.
Short-term investments that mature in sixty days or less are valued at amortized cost, which approximates market value. Investments in open-end investment companies are valued at their net asset value per share on valuation date.
Volume and level of activity in established markets for an asset or liability are evaluated to determine whether recent transactions and quoted prices are determinative of fair value. Where there have been significant decreases in volume and level of activity, further analysis and adjustment may be necessary to estimate fair value. The Series measures fair value in these instances by the use of inputs and valuation techniques which may be based upon current market prices of securities that are comparable in coupon, rating, maturity and industry and/or expectation of future cash flows. As a result of trading in relatively thin markets and/or markets that experience significant volatility, the prices used by the Series to value these securities may differ from the value that would be realized if these securities were sold, and the differences could be material.
Securities for which representative valuations or prices are not available from the Fund’s pricing service may be valued at fair value. Due to the inherent uncertainty of valuations of such securities, the fair value may differ significantly from the values that would have been used had a ready market for such securities existed. If trading or events occurring after the close of the principal market in which securities are traded are expected to materially affect the value of those securities, then they may be valued at their fair value, taking this trading or these events into account. Fair value is determined in good faith by the Advisor under procedures approved by and under the general supervision and responsibility of the Fund’s Board of Directors (the “Board”).
Various inputs are used in determining the value of the Series’ assets or liabilities carried at market value. These inputs are summarized in three broad levels. Level 1 includes quoted prices in active markets for identical assets and liabilities. Level 2 includes other significant observable inputs (including quoted prices for similar securities, interest rates, prepayment speeds, credit risk, etc.). Level 3 includes significant unobservable inputs (including the Series’ own assumptions in determining the fair value of investments.) The inputs or methodology used for valuing securities are not necessarily an indication of the risk associated with investing in those securities.
Notes to Financial Statements (unaudited)
| 2. | SIGNIFICANT ACCOUNTING POLICIES (continued) |
Security Valuation (continued)
The following is a summary of the valuation levels used for major security types as of June 30, 2010 in valuing the Series’ assets or liabilities carried at market value:
| | | | | | | | | | | | |
| Description | | 6/30/10 | | Level 1 | | Level 2 | | Level 3 |
Equity securities* | | $ | 229,450,102 | | $ | 224,158,330 | | $ | 5,291,772 | | $ | — |
Preferred securities | | | — | | | — | | | — | | | — |
Debt securities | | | — | | | — | | | — | | | — |
Mutual funds | | | 18,868,206 | | | 18,868,206 | | | — | | | — |
Other financial instruments** | | | — | | | — | | | — | | | — |
| | | | | | | | | | | | |
Total | | $ | 248,318,308 | | $ | 243,026,536 | | $ | 5,291,772 | | $ | — |
| | | | | | | | | | | | |
*Includes common stock, warrants and rights. Please see the Investment Portfolio for industry classification and for securities where a latest quoted sales price is not available and the last quoted bid price was used to value the security. Such securities are included in Level 2 in the table above.
**Other financial instruments are derivative instruments not reflected in the Investment Portfolio, such as futures, forwards and swap contracts, which are valued at the unrealized appreciation/depreciation on the instrument. As of June 30, 2010, the Series did not hold any derivative instruments.
There were no Level 3 securities held by the Series as of December 31, 2009 or June 30, 2010.
The Fund’s policy is to recognize transfers in and transfers out of the valuation levels as of the end of the reporting period. There were no significant transfers between Level 1 and Level 2 as of June 30, 2010.
Additional disclosure surrounding the activity in Level 3 fair value measurement will also be effective for fiscal years beginning after December 15, 2010. Management has concluded that this will not have a material impact on the Series’ financial statements.
Security Transactions, Investment Income and Expenses
Security transactions are accounted for on trade date. Dividend income is recorded on the ex-dividend date, except that if the ex-dividend date has passed, certain dividends from foreign securities are recorded as soon as the Fund is informed of the ex-dividend date. Non-cash dividends, if any, are recorded at the fair market value of the securities received. Interest income, including amortization of premium and accretion of discounts using the effective interest method, is earned from settlement date and accrued daily.
Expenses are recorded on an accrual basis. Most expenses of the Fund can be attributed to a specific series. Expenses which cannot be directly attributed are apportioned among the series in the Fund in such a manner as deemed equitable by the Fund’s Board, taking into consideration, among other things, the nature and type of expense.
The Series uses the identified cost method for determining realized gain or loss on investments for both financial statement and federal income tax reporting purposes.
Foreign Currency Translation
The books and records of the Series are maintained in U.S. dollars. Foreign currencies, investments and other assets and liabilities are translated into U.S. dollars at the current exchange rates. Purchases and sales of investment securities and income and expenses are translated on the respective dates of such transactions. The Series does not isolate realized and unrealized gains and losses attributable to changes in the exchange rates from gains and losses that arise from changes in the market value of investments. Such fluctuations are included with net realized
13
Notes to Financial Statements (unaudited)
| 2. | SIGNIFICANT ACCOUNTING POLICIES (continued) |
Foreign Currency Translation (continued)
and unrealized gain or loss on investments. Net realized foreign currency gains and losses represent foreign currency gains and losses between trade date and settlement date on securities transactions, gains and losses on disposition of foreign currencies and the difference between the amount of income and foreign withholding taxes recorded on the books of the Series and the amounts actually received or paid.
Federal Taxes
The Series’ policy is to comply with the provisions of the Internal Revenue Code applicable to regulated investment companies. The Series is not subject to federal income tax or excise tax to the extent that the Series distributes to shareholders each year its taxable income, including any net realized gains on investments, in accordance with requirements of the Internal Revenue Code. Accordingly, no provision for federal income tax or excise tax has been made in the financial statements.
Management evaluates its tax positions to determine if the tax positions taken meet the minimum recognition threshold in connection with accounting for uncertainties in income tax positions taken or expected to be taken for the purposes of measuring and recognizing tax liabilities in the financial statements. Recognition of tax benefits of an uncertain tax position is required only when the position is “more likely than not” to be sustained assuming examination by taxing authorities. At June 30, 2010, the Series has recorded no liability for net unrecognized tax benefits relating to uncertain income tax positions taken or expected to be taken in future tax returns.
The Series files income tax returns in the U.S. federal jurisdiction, various states and foreign jurisdictions, as required. No income tax returns are currently under investigation. The statute of limitations on the Series’ tax returns remains open for the years ended December 31, 2006 through December 31, 2009. The Fund is not aware of any tax positions for which it is reasonably possible that the total amounts of unrecognized tax benefits will significantly change in the next twelve months.
Additionally, based on the Fund’s understanding of the tax rules and rates related to income, gains and transactions for foreign jurisdictions in which it invests, the Series will provide for foreign taxes, and where appropriate, deferred foreign tax.
Distributions of Income and Gains
Distributions to shareholders of net investment income and net realized gains are made annually. An additional distribution may be necessary to avoid taxation of the Series. Distributions are recorded on the ex-dividend date.
Indemnifications
The Fund’s organizational documents provide former and current directors and officers with a limited indemnification against liabilities arising in connection with the performance of their duties to the Fund. In the normal course of business, the Fund may also enter into contracts that provide general indemnifications. The Fund’s maximum exposure under these arrangements is unknown as this would be dependent on future claims that may be made against the Fund. The risk of material loss from such claims is considered remote.
Other
The preparation of financial statements in conformity with accounting principles generally accepted in the United States of America requires management to make estimates and assumptions that affect the reported amounts of assets and liabilities and the disclosure of contingent assets and liabilities at the date of the financial statements and the reported amounts of income and expenses during the reporting period. Actual results could differ from those estimates.
14
Notes to Financial Statements (unaudited)
| 3. | TRANSACTIONS WITH AFFILIATES |
The Fund has an Investment Advisory Agreement (the “Agreement”) with the Advisor, for which the Series pays a fee, computed daily and payable monthly, at an annual rate of 1.00% of the Series’ average daily net assets.
Under the Agreement, personnel of the Advisor provide the Series with advice and assistance in the choice of investments and the execution of securities transactions, and otherwise maintain the Series’ organization. The Advisor also provides the Fund with necessary office space and fund administration and support services. The salaries of all officers of the Fund (except a percentage of the Fund’s Chief Compliance Officer’s salary, which is paid by the Fund), and of all Directors who are “affiliated persons” of the Fund, or of the Advisor, and all personnel of the Fund, or of the Advisor, performing services relating to research, statistical and investment activities, are paid by the Advisor. Each “non-affiliated” Director receives an annual stipend, which is allocated among all the active series of the Fund. In addition, these Directors also receive a fee per Board meeting attended for each active series of the Fund plus a fee for each committee meeting attended.
For the six months ended June 30, 2010, the Advisor voluntarily waived fees of $758, which is included as a reduction of expenses on the Statement of Operations. The Advisor is not eligible to recoup any expense that has been waived or reimbursed in prior years.
Manning & Napier Investor Services, Inc., a registered broker-dealer affiliate of the Advisor, acts as distributor for the Fund’s shares. The services of Manning & Napier Investor Services, Inc. are provided at no additional cost to the Series.
The Advisor has entered into agreements with PNC Global Investment Servicing (U.S.) Inc. (“PNCGIS”) under which PNCGIS serves as sub-accountant services agent and sub-transfer agent. The Fund pays the Advisor an annual fee of 0.0175% on the first $3 billion of average daily net assets (excluding Target Series); 0.015% on the next $3 billion of average daily net assets (excluding Target Series); and 0.01% of the average daily net assets in excess of $6 billion (excluding Target Series); plus a base fee of $25,500 per Series. Additionally, certain transaction-, account-, and cusip-based fees and out-of-pocket expenses, including charges for reporting relating to the Fund’s compliance program, are charged.
On July 1, 2010, The PNC Financial Services Group, Inc. sold the outstanding stock of PNC Global Investment Servicing Inc. to The Bank of New York Mellon Corporation. At the closing of the sale, PNCGIS changed its name to BNY Mellon Investment Servicing (US) Inc.
| 4. | PURCHASES AND SALES OF SECURITIES |
For the six months ended June 30, 2010, purchases and sales of securities, other than U.S. Government securities and short-term securities, were $25,011,565 and $23,490,364, respectively. There were no purchases or sales of U.S. Government securities.
Notes to Financial Statements (unaudited)
| 5. | CAPITAL STOCK TRANSACTIONS |
Transactions in shares of International Series were:
| | | | | | | | | | | | | | |
| | | For the Six Months Ended 6/30/10 | | | For the Year Ended 12/31/09 | |
| | | Shares | | | Amount | | | Shares | | | Amount | |
Sold | | 2,561,562 | | | $ | 20,316,580 | | | 6,129,853 | | | $ | 48,093,794 | |
Reinvested | | — | | | | — | | | 1,415,130 | | | | 11,706,962 | |
Repurchased | | (1,461,862 | ) | | | (11,729,948 | ) | | (3,449,201 | ) | | | (23,388,016 | ) |
| | | | | | | | | | | | | | |
Total | | 1,099,700 | | | $ | 8,586,632 | | | 4,095,782 | | | $ | 36,412,740 | |
| | | | | | | | | | | | | | |
Substantially all of the Series’ shares represent investments by fiduciary accounts over which the Advisor has sole investment discretion.
The Series may trade in instruments including written and purchased options, forward foreign currency exchange contracts and futures contracts and other derivatives in the normal course of investing activities to assist in managing exposure to various market risks. The Series may be subject to various elements of risk and may involve, to a varying degree, elements of risk in excess of the amounts recognized for financial statement purposes. These risks include: the risk that changes in the value of a derivative may not correlate perfectly with the underlying asset, rate or index, counterparty credit risk related to over the counter derivatives counterparties’ failure to perform under contract terms, liquidity risk related to the lack of a liquid market for these contracts allowing the fund to close out its position(s) and documentation risk relating to disagreement over contract terms. No such investments were held by the Series on June 30, 2010.
Investing in securities of foreign companies and foreign governments involves special risks and considerations not typically associated with investing in securities of domestic companies and the U.S. Government. These risks include revaluation of currencies and future adverse political and economic developments. Moreover, securities of foreign companies and foreign governments and their markets may be less liquid and their prices more volatile than those of comparable domestic companies and the U.S. Government.
| 8. | FEDERAL INCOME TAX INFORMATION |
The amount and characterization of certain income and capital gains to be distributed are determined in accordance with federal income tax regulations, which may differ from accounting principles generally accepted in the United States of America. The Series may periodically make reclassifications among its capital accounts to reflect income and gains available for distribution (or available capital loss carryovers) under income tax regulations without impacting the Series’ net asset value. Any such reclassifications are not reflected in the financial highlights.
The final determination of the tax character of current year distributions will be made at the conclusion of the fiscal year. The tax character of distributions paid for the year ended December 31, 2009 were as follows:
| | | |
Ordinary income | | $ | 11,987,760 |
For the year ended December 31, 2009, the Series elected to defer $146,329 and $22,282 of capital and currency losses, respectively, attributable to Post-October losses.
Notes to Financial Statements (unaudited)
| 8. | FEDERAL INCOME TAX INFORMATION (continued) |
At June 30, 2010, the identified cost of investments for federal income tax purposes, the resulting gross unrealized appreciation and depreciation, and the net unrealized depreciation were as follows:
| | | | |
Cost for federal income tax purposes | | $ | 255,996,474 | |
Unrealized appreciation | | $ | 26,563,010 | |
Unrealized depreciation | | | (34,241,176 | ) |
| | | | |
Net unrealized depreciation | | $ | (7,678,166 | ) |
| | | | |
There were no subsequent events that require recognition or disclosure. In preparing these financial statements, management of the Fund has evaluated events and transactions for potential recognition or disclosure through the date the financial statements were issued.
17
Literature Requests (unaudited)
Proxy Voting Policies and Procedures
A description of the policies and procedures that the Fund uses to determine how to vote proxies relating to portfolio securities is available, without charge, upon request:
| | |
By phone | | 1-800-466-3863 |
On the Securities and Exchange Commission’s (SEC) web site | | http://www.sec.gov |
Proxy Voting Record
Information regarding how the Fund voted proxies relating to portfolio securities during the most recent 12-month period ended June 30th is available, without charge, upon request:
| | |
By phone | | 1-800-466-3863 |
On the SEC’s web site | | http://www.sec.gov |
Quarterly Portfolio Holdings
The Series’ complete schedule of portfolio holdings for the 1st and 3rd quarters of each fiscal year are provided on Form N-Q, and are available, without charge, upon request:
| | |
By phone | | 1-800-466-3863 |
On the SEC’s web site | | http://www.sec.gov |
The Series’ Form N-Q may be reviewed and copied at the SEC’s Public Reference Room in Washington, D.C. Information on the operation of the Public Reference Room may be obtained by calling 1-800-SEC-0330.
Prospectus and Statement of Additional Information (SAI)
The prospectus and SAI provide additional information about each Series, including charges, expenses and risks. These documents are available, without charge, upon request:
| | |
By phone | | 1-800-466-3863 |
On the SEC’s web site | | http://www.sec.gov |
On the Advisor’s web site | | http://www.manningnapieradvisors.com |
Additional information available at www.manningnapieradvisors.com
1. Fund Holdings - Month-End
2. Fund Holdings - Quarter-End
3. Shareholder Report - Annual
4. Shareholder Report - Semi-Annual
MNINT-06/10-SAR

Shareholder Expense Example (unaudited)
As a shareholder of the Series, you may incur two types of costs: (1) transaction costs and (2) ongoing costs, including management fees and other Series expenses. This example is intended to help you understand your ongoing costs (in dollars) of investing in the Series and to compare these costs with the ongoing costs of investing in other mutual funds.
The example is based on an investment of $1,000 invested at the beginning of the period and held for the entire period (January 1, 2010 to June 30, 2010).
Actual Expenses
The first line of the table below provides information about actual account values and actual expenses. You may use the information in this line, together with the amount you invested, to estimate the expenses that you paid over the period. Simply divide your account value by $1,000 (for example, an $8,600 account value divided by $1,000 = 8.6), then multiply the result by the number in the first line under the heading entitled “Expenses Paid During Period” to estimate the expenses you paid on your account during this period.
Hypothetical Example for Comparison Purposes
The second line of the table below provides information about hypothetical account values and hypothetical expenses based on the Series’ actual expense ratio and an assumed rate of return of 5% per year before expenses, which is not the Series’ actual return. The hypothetical account values and expenses may not be used to estimate the actual ending account balance or expenses you paid during the period. You may use this information to compare the ongoing costs of investing in the Series and other funds. To do so, compare this 5% hypothetical example with the 5% hypothetical examples that appear in the shareholder reports of the other funds.
Please note that the expenses shown in the table are meant to highlight your ongoing costs only and do not reflect any transaction costs. Therefore, the second line of the table is useful in comparing ongoing costs only, and will not help you determine the relative total costs of owning different funds. In addition, if these transaction costs were included, your costs would have been higher.
| | | | | | |
| | | Beginning Account Value 1/1/10 | | Ending Account Value 6/30/10 | | Expenses Paid During Period* 1/1/10-6/30/10 |
Actual | | $1,000.00 | | $885.50 | | $5.24 |
Hypothetical
(5% return before expenses) | | $1,000.00 | | $1,019.24 | | $5.61 |
*Expenses are equal to the Series’ annualized expense ratio (for the six-month period) of 1.12%, multiplied by the average account value over the period, multiplied by 181/365 (to reflect the one-half year period). Expenses are based on the most recent fiscal half year. The Series’ total return would have been lower had certain expenses not been waived during the period.
Portfolio Composition as of June 30, 2010 (unaudited)
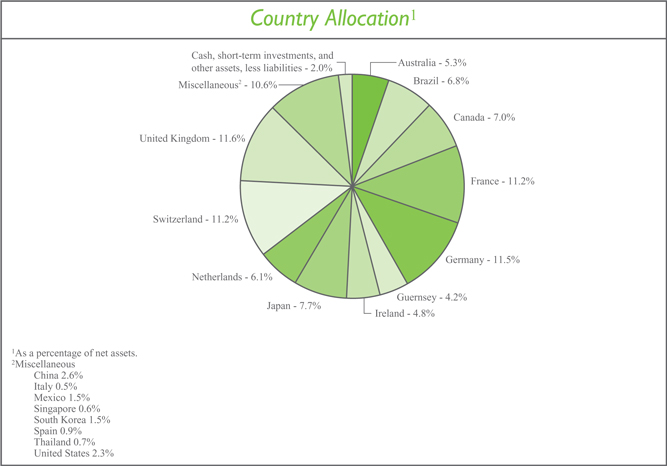
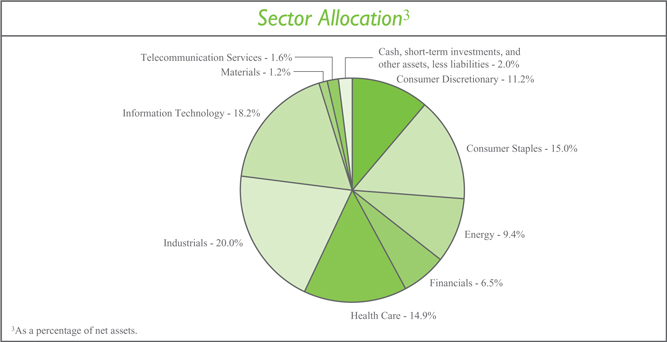
Investment Portfolio - June 30, 2010 (unaudited)
| | | | | | | |
| | | Shares | | Value (Note 2) | | |
| | | |
COMMON STOCKS - 97.0% | | | | | | | |
| | | |
Consumer Discretionary - 11.2% | | | | | | | |
Automobiles - 2.2% | | | | | | | |
Bayerische Motoren Werke AG (BMW) (Germany) | | 1,752,300 | | $ | 85,851,472 | | |
Suzuki Motor Corp. (Japan) | | 1,290,200 | | | 25,639,104 | | |
| | | | | | | |
| | | | | 111,490,576 | | |
| | | | | | | |
Hotels, Restaurants & Leisure - 0.3% | | | | | | | |
Club Mediterranee S.A. (France)* | | 852,070 | | | 12,774,381 | | |
| | | | | | | |
Leisure Equipment & Products - 0.5% | | | | | | | |
Sankyo Co. Ltd. (Japan) | | 573,200 | | | 26,094,328 | | |
| | | | | | | |
Media - 5.8% | | | | | | | |
Grupo Televisa S.A. - ADR (Mexico) | | 4,136,240 | | | 72,011,939 | | |
Mediaset S.p.A. (Italy) | | 4,111,660 | | | 23,581,106 | | |
Reed Elsevier plc (United Kingdom) | | 7,692,400 | | | 57,351,065 | | |
Societe Television Francaise 1 (France) | | 8,054,970 | | | 106,134,198 | | |
Virgin Media, Inc. (United States) | | 1,525,230 | | | 25,456,089 | | |
| | | | | | | |
| | | | | 284,534,397 | | |
| | | | | | | |
Multiline Retail - 1.3% | | | | | | | |
Marks & Spencer Group plc (United Kingdom) | | 13,137,700 | | | 65,129,059 | | |
| | | | | | | |
Textiles, Apparel & Luxury Goods - 1.1% | | | | | | | |
Adidas AG (Germany) | | 1,102,590 | | | 53,763,667 | | |
| | | | | | | |
Total Consumer Discretionary | | | | | 553,786,408 | | |
| | | | | | | |
Consumer Staples - 14.0% | | | | | | | |
Beverages - 3.1% | | | | | | | |
Cia de Bebidas das Americas - ADR (Brazil) | | 439,040 | | | 44,347,430 | | |
Heineken N.V. (Netherlands) | | 2,532,650 | | | 107,994,406 | | |
| | | | | | | |
| | | | | 152,341,836 | | |
| | | | | | | |
Food & Staples Retailing - 4.9% | | | | | | | |
Carrefour S.A. (France) | | 3,017,720 | | | 120,818,031 | | |
Tesco plc (United Kingdom) | | 21,822,970 | | | 123,917,795 | | |
| | | | | | | |
| | | | | 244,735,826 | | |
| | | | | | | |
Food Products - 6.0% | | | | | | | |
Danone S.A. (France) | | 1,476,360 | | | 79,797,388 | | |
Nestle S.A. (Switzerland) | | 2,293,350 | | | 111,066,355 | | |
Unilever plc - ADR (United Kingdom) | | 3,896,910 | | | 104,164,404 | | |
| | | | | | | |
| | | | | 295,028,147 | | |
| | | | | | | |
Total Consumer Staples | | | | | 692,105,809 | | |
| | | | | | | |
Energy - 9.4% | | | | | | | |
Energy Equipment & Services - 5.9% | | | | | | | |
Calfrac Well Services Ltd. (Canada) | | 1,296,670 | | | 23,812,783 | | |
Compagnie Generale de Geophysique - Veritas (CGG - Veritas) (France)* | | 4,693,170 | | | 84,651,068 | | |
| | | | |
| 3 | | The accompanying notes are an integral part of the financial statements. | | |
Investment Portfolio - June 30, 2010 (unaudited)
| | | | | | | |
| | | Shares | | Value (Note 2) | | |
| | | |
COMMON STOCKS (continued) | | | | | | | |
| | | |
Energy (continued) | | | | | | | |
Energy Equipment & Services (continued) | | | | | | | |
Schlumberger Ltd. (United States) | | 1,598,520 | | $ | 88,462,097 | | |
Trican Well Service Ltd. (Canada)1 | | 7,415,430 | | | 94,943,695 | | |
| | | | | | | |
| | | | | 291,869,643 | | |
| | | | | | | |
Oil, Gas & Consumable Fuels - 3.5% | | | | | | | |
Cameco Corp. (Canada) | | 1,586,190 | | | 33,754,123 | | |
Talisman Energy, Inc. (Canada) | | 6,488,650 | | | 98,132,793 | | |
Uranium One, Inc. (Canada)* | | 17,130,530 | | | 41,677,773 | | |
| | | | | | | |
| | | | | 173,564,689 | | |
| | | | | | | |
Total Energy | | | | | 465,434,332 | | |
| | | | | | | |
Financials - 6.5% | | | | | | | |
Commercial Banks - 1.1% | | | | | | | |
HSBC Holdings plc (United Kingdom) | | 5,796,780 | | | 53,282,210 | | |
| | | | | | | |
Diversified Financial Services - 2.6% | | | | | | | |
Deutsche Boerse AG (Germany) | | 1,674,730 | | | 102,561,239 | | |
Financiere Marc de Lacharriere S.A. (Fimalac) (France) | | 710,101 | | | 27,352,990 | | |
| | | | | | | |
| | | | | 129,914,229 | | |
| | | | | | | |
Insurance - 2.8% | | | | | | | |
Allianz SE (Germany) | | 855,040 | | | 85,581,374 | | |
Willis Group Holdings plc (United Kingdom) | | 1,760,430 | | | 52,900,921 | | |
| | | | | | | |
| | | | | 138,482,295 | | |
| | | | | | | |
Total Financials | | | | | 321,678,734 | | |
| | | | | | | |
Health Care - 14.9% | | | | | | | |
Biotechnology - 1.6% | | | | | | | |
CSL Ltd. (Australia) | | 2,351,280 | | | 64,482,085 | | |
Grifols S.A. (Spain) | | 1,269,496 | | | 13,097,654 | | |
| | | | | | | |
| | | | | 77,579,739 | | |
| | | | | | | |
Health Care Equipment & Supplies - 4.3% | | | | | | | |
Cochlear Ltd. (Australia) | | 872,270 | | | 54,568,282 | | |
Covidien plc (Ireland) | | 1,715,940 | | | 68,946,469 | | |
Nobel Biocare Holding AG (Switzerland) | | 2,200,746 | | | 38,181,519 | | |
Straumann Holding AG (Switzerland) | | 243,248 | | | 52,876,566 | | |
| | | | | | | |
| | | | | 214,572,836 | | |
| | | | | | | |
Health Care Providers & Services - 4.9% | | | | | | | |
BML, Inc. (Japan) | | 829,800 | | | 18,901,965 | | |
Bumrungrad Hospital Public Co. Ltd. - NVDR (Thailand) | | 35,555,100 | | | 34,029,271 | | |
Diagnosticos da America S.A. (Brazil)* | | 5,072,850 | | | 47,721,326 | | |
| | | | |
| | The accompanying notes are an integral part of the financial statements. | | 4 |
Investment Portfolio - June 30, 2010 (unaudited)
| | | | | | | |
| | | Shares | | Value (Note 2) | | |
| | | |
COMMON STOCKS (continued) | | | | | | | |
| | | |
Health Care (continued) | | | | | | | |
Health Care Providers & Services (continued) | | | | | | | |
Sonic Healthcare Ltd. (Australia) | | 16,077,890 | | $ | 141,155,239 | | |
| | | | | | | |
| | | | | 241,807,801 | | |
| | | | | | | |
Life Sciences Tools & Services - 3.2% | | | | | | | |
Lonza Group AG (Switzerland) | | 2,338,292 | | | 156,739,432 | | |
| | | | | | | |
Pharmaceuticals - 0.9% | | | | | | | |
Santen Pharmaceutical Co. Ltd. (Japan) | | 1,230,500 | | | 44,465,843 | | |
| | | | | | | |
Total Health Care | | | | | 735,165,651 | | |
| | | | | | | |
Industrials - 20.0% | | | | | | | |
Aerospace & Defense - 1.6% | | | | | | | |
Empresa Brasileira de Aeronautica S.A. (Embraer) - ADR (Brazil) | | 3,821,100 | | | 80,052,045 | | |
| | | | | | | |
Air Freight & Logistics - 3.2% | | | | | | | |
TNT N.V. (Netherlands) | | 6,214,430 | | | 157,914,126 | | |
| | | | | | | |
Airlines - 3.0% | | | | | | | |
Ryanair Holdings plc - ADR (Ireland)* | | 4,183,630 | | | 113,334,536 | | |
Singapore Airlines Ltd. (Singapore) | | 3,062,800 | | | 31,956,607 | | |
| | | | | | | |
| | | | | 145,291,143 | | |
| | | | | | | |
Electrical Equipment - 6.0% | | | | | | | |
ABB Ltd. (Asea Brown Boveri) - ADR (Switzerland) | | 6,704,090 | | | 115,846,675 | | |
Gamesa Corporacion Tecnologica S.A. (Spain) | | 3,402,700 | | | 29,534,783 | | |
Nexans S.A. (France) | | 716,640 | | | 42,270,508 | | |
Trina Solar Ltd. - ADR (China)* | | 2,552,410 | | | 44,105,645 | | |
Yingli Green Energy Holding Co. Ltd.- ADR (China)* | | 6,065,350 | | | 61,745,263 | | |
| | | | | | | |
| | | | | 293,502,874 | | |
| | | | | | | |
Industrial Conglomerates - 2.2% | | | | | | | |
Siemens AG (Germany) | | 1,216,990 | | | 110,156,525 | | |
| | | | | | | |
Professional Services - 2.3% | | | | | | | |
Adecco S.A. (Switzerland) | | 1,634,529 | | | 78,477,410 | | |
Randstad Holding N.V. (Netherlands) | | 912,909 | | | 36,208,916 | | |
| | | | | | | |
| | | | | 114,686,326 | | |
| | | | | | | |
Road & Rail - 1.7% | | | | | | | |
All America Latina Logistica S.A. (Brazil) | | 5,379,340 | | | 42,051,240 | | |
Canadian National Railway Co. (Canada) | | 734,340 | | | 42,136,429 | | |
| | | | | | | |
| | | | | 84,187,669 | | |
| | | | | | | |
Total Industrials | | | | | 985,790,708 | | |
| | | | | | | |
Information Technology - 18.2% | | | | | | | |
Communications Equipment - 1.5% | | | | | | | |
Alcatel-Lucent - ADR (France)* | | 29,070,460 | | | 73,838,969 | | |
| | | | | | | |
| | | | |
| 5 | | The accompanying notes are an integral part of the financial statements. | | |
Investment Portfolio - June 30, 2010 (unaudited)
| | | | | | | |
| | | Shares | | Value (Note 2) | | |
| | | |
COMMON STOCKS (continued) | | | | | | | |
| | | |
Information Technology (continued) | | | | | | | |
IT Services - 7.7% | | | | | | | |
Accenture plc - Class A (Ireland) | | 1,378,690 | | $ | 53,286,368 | | |
Amdocs Ltd. (Guernsey)* | | 7,661,380 | | | 205,708,053 | | |
Cielo S.A. (Brazil) | | 7,249,150 | | | 61,607,735 | | |
Redecard S.A. (Brazil) | | 4,197,550 | | | 59,323,823 | | |
| | | | | | | |
| | | | | 379,925,979 | | |
| | | | | | | |
Semiconductors & Semiconductor Equipment - 4.3% | | | | | | | |
Advantest Corp. (Japan) | | 4,859,300 | | | 103,544,887 | | |
Sumco Corp. (Japan)* | | 2,998,400 | | | 50,496,156 | | |
Tokyo Electron Ltd. (Japan) | | 1,041,080 | | | 57,167,261 | | |
| | | | | | | |
| | | | | 211,208,304 | | |
| | | | | | | |
Software - 4.7% | | | | | | | |
Misys plc (United Kingdom) | | 19,995,418 | | | 69,907,767 | | |
SAP AG - ADR (Germany) | | 1,827,900 | | | 80,975,970 | | |
Shanda Interactive Entertainment Ltd. - ADR (China)* | | 579,532 | | | 22,990,034 | | |
Square Enix Holdings Co. Ltd. (Japan) | | 2,862,700 | | | 53,164,660 | | |
UbiSoft Entertainment S.A. (France)* | | 638,406 | | | 4,833,168 | | |
| | | | | | | |
| | | | | 231,871,599 | | |
| | | | | | | |
Total Information Technology | | | | | 896,844,851 | | |
| | | | | | | |
Materials - 1.2% | | | | | | | |
Chemicals - 1.0% | | | | | | | |
Johnson Matthey plc (United Kingdom) | | 2,087,070 | | | 46,587,210 | | |
| | | | | | | |
Paper & Forest Products - 0.2% | | | | | | | |
Norbord, Inc. (Canada)* | | 1,120,342 | | | 11,976,414 | | |
| | | | | | | |
Total Materials | | | | | 58,563,624 | | |
| | | | | | | |
Telecommunication Services - 1.6% | | | | | | | |
Wireless Telecommunication Services - 1.6% | | | | | | | |
SK Telecom Co. Ltd. - ADR (South Korea) | | 5,160,950 | | | 76,020,793 | | |
| | | | | | | |
TOTAL COMMON STOCKS | | | | | | | |
(Identified Cost $5,138,068,946) | | | | | 4,785,390,910 | | |
| | | | | | | |
| | | |
PREFERRED STOCKS - 1.0% | | | | | | | |
| | | |
Consumer Staples - 1.0% | | | | | | | |
Household Products - 1.0% | | | | | | | |
Henkel AG & Co. KGaA (Germany) | | | | | | | |
(Identified Cost $36,696,378) | | 1,048,140 | | | 51,397,004 | | |
| | | | | | | |
| | | | |
| | The accompanying notes are an integral part of the financial statements. | | 6 |
Investment Portfolio - June 30, 2010 (unaudited)
| | | | | | | |
| | | Shares | | Value (Note 2) | | |
| | | |
SHORT-TERM INVESTMENTS - 1.5% | | | | | | | |
Dreyfus Cash Management, Inc. - Institutional Shares2, 0.13% | | | | | | | |
(Identified Cost $72,828,148) | | 72,828,148 | | $ | 72,828,148 | | |
| | | | | | | |
| | | |
TOTAL INVESTMENTS - 99.5% | | | | | | | |
(Identified Cost $5,247,593,472) | | | | | 4,909,616,062 | | |
OTHER ASSETS, LESS LIABILITIES - 0.5% | | | | | 26,233,147 | | |
| | | | | | | |
NET ASSETS - 100% | | | | $ | 4,935,849,209 | | |
| | | | | | | |
ADR - American Depository Receipt
NVDR - Non-Voting Depository Receipt
| * | Non-income producing security |
| 1 | Affiliated company as defined by the Investment Company Act of 1940 (see Note 2 to the financial statements). |
| 2 | Rate shown is the current yield as of June 30, 2010. |
| | The Series’ portfolio holds, as a percentage of net assets, greater than 10% in the following countries: |
| | United Kingdom - 11.6%; Germany - 11.5%; Switzerland - 11.2%; France - 11.2%. |
| | | | |
| 7 | | The accompanying notes are an integral part of the financial statements. | | |
Statement of Assets and Liabilities (unaudited)
June 30, 2010
| | | | |
ASSETS: | | | | |
| |
Investments, at value (identified cost $5,247,593,472) (Note 2) | | $ | 4,909,616,062 | |
Cash | | | 690,204 | |
Foreign currency, at value (cost $20,967) | | | 22,615 | |
Receivable for fund shares sold | | | 18,175,137 | |
Receivable for securities sold | | | 11,554,884 | |
Dividends receivable | | | 9,475,271 | |
Foreign tax reclaims receivable | | | 4,789,831 | |
| | | | |
| |
TOTAL ASSETS | | | 4,954,324,004 | |
| | | | |
| |
LIABILITIES: | | | | |
| |
Accrued management fees (Note 3) | | | 4,271,869 | |
Accrued transfer agent fees (Note 3) | | | 879,750 | |
Accrued fund accounting and administration fees (Note 3) | | | 62,359 | |
Accrued Chief Compliance Officer service fees (Note 3) | | | 820 | |
Payable for fund shares repurchased | | | 13,160,820 | |
Other payables and accrued expenses | | | 99,177 | |
| | | | |
| |
TOTAL LIABILITIES | | | 18,474,795 | |
| | | | |
| |
TOTAL NET ASSETS | | $ | 4,935,849,209 | |
| | | | |
| |
NET ASSETS CONSIST OF: | | | | |
| |
Capital stock | | $ | 6,861,922 | |
Additional paid-in-capital | | | 5,250,991,800 | |
Undistributed net investment income | | | 41,238,330 | |
Accumulated net realized loss on investments, foreign currency and translation of other assets and liabilities | | | (25,198,055 | ) |
Net unrealized depreciation on investments, foreign currency and translation of other assets and liabilities | | | (338,044,788 | ) |
| | | | |
TOTAL NET ASSETS | | $ | 4,935,849,209 | |
| | | | |
| |
NET ASSET VALUE, OFFERING PRICE AND REDEMPTION PRICE PER SHARE - Class A ($4,935,849,209/686,192,169 shares) | | $ | 7.19 | |
| | | | |
| | | | |
| | The accompanying notes are an integral part of the financial statements. | | 8 |
Statement of Operations (unaudited)
For the Six Months Ended June 30, 2010
| | | | |
INVESTMENT INCOME: | | | | |
| |
Dividends (net of foreign taxes withheld, $8,289,555) | | $ | 68,486,707 | |
| | | | |
| |
EXPENSES: | | | | |
| |
Management fees (Note 3) | | | 26,546,194 | |
Transfer agent fees (Note 3) | | | 1,986,092 | |
Fund accounting and administration fees (Note 3) | | | 361,119 | |
Directors’ fees (Note 3) | | | 6,373 | |
Chief Compliance Officer service fees (Note 3) | | | 1,761 | |
Miscellaneous | | | 911,768 | |
| | | | |
| |
Total Expenses | | | 29,813,307 | |
Less reduction of expenses (Note 3) | | | (758 | ) |
| | | | |
| |
Net Expenses | | | 29,812,549 | |
| | | | |
| |
NET INVESTMENT INCOME | | | 38,674,158 | |
| | | | |
| |
REALIZED AND UNREALIZED GAIN (LOSS) ON INVESTMENTS AND FOREIGN CURRENCY: | | | | |
| |
Net realized loss on- | | | | |
Investments | | | (15,460,285 | ) |
Foreign currency and translation of other assets and liabilities | | | (525,875 | ) |
| | | | |
| |
| | | (15,986,160 | ) |
| | | | |
| |
Net change in unrealized appreciation (depreciation) on- | | | | |
Investments | | | (682,365,442 | ) |
Foreign currency and translation of other assets and liabilities | | | (164,536 | ) |
| | | | |
| |
| | | (682,529,978 | ) |
| | | | |
| |
NET REALIZED AND UNREALIZED GAIN (LOSS) ON INVESTMENTS AND FOREIGN CURRENCY | | | (698,516,138 | ) |
| | | | |
| |
NET DECREASE IN NET ASSETS RESULTING FROM OPERATIONS | | $ | (659,841,980 | ) |
| | | | |
| | | | |
| 9 | | The accompanying notes are an integral part of the financial statements. | | |
Statements of Changes in Net Assets
| | | | | | | | | | |
| | | For the Six
Months Ended
6/30/10
(unaudited) | | | | | For the
Year Ended
12/31/09 | |
INCREASE (DECREASE) IN NET ASSETS: | | | | | | | | | | |
| | | |
OPERATIONS: | | | | | | | | | | |
| | | |
Net investment income | | $ | 38,674,158 | | | | | $ | 16,004,364 | |
Net realized gain (loss) on investments and foreign currency | | | (15,986,160 | ) | | | | | 32,401,977 | |
Net change in unrealized appreciation (depreciation) on investments and foreign currency | | | (682,529,978 | ) | | | | | 859,900,733 | |
| | | | | | | | | | |
| | | |
Net increase (decrease) from operations | | | (659,841,980 | ) | | | | | 908,307,074 | |
| | | | | | | | | | |
| | | |
DISTRIBUTIONS TO SHAREHOLDERS (Note 8): | | | | | | | | | | |
| | | |
From net investment income | | | — | | | | | | (30,333,272 | ) |
| | | | | | | | | | |
| | | |
CAPITAL STOCK ISSUED AND REPURCHASED: | | | | | | | | | | |
| | | |
Net increase from capital share transactions (Note 5) | | | 678,231,765 | | | | | | 2,699,428,129 | |
| | | | | | | | | | |
| | | |
Net increase in net assets | | | 18,389,785 | | | | | | 3,577,401,931 | |
| | | |
NET ASSETS: | | | | | | | | | | |
| | | |
Beginning of period | | | 4,917,459,424 | | | | | | 1,340,057,493 | |
| | | | | | | | | | |
| | | |
End of period (including undistributed net investment income of $41,238,330 and $2,564,172, respectively) | | | $4,935,849,209 | | | | | $ | 4,917,459,424 | |
| | | | | | | | | | |
| | | | |
| | The accompanying notes are an integral part of the financial statements. | | 10 |
Financial Highlights
| | | | | | | | | | | | | | | | | |
| | | For the Six
Months Ended
6/30/10
(unaudited) | | For the Years Ended | |
| | | | 12/31/09 | | | 12/31/08 | | | 12/31/07 | | | 12/31/06 | | | 12/31/05 | |
Per share data (for a share outstanding throughout each period): | | | | | | | | | | | | | | | | | |
Net asset value - Beginning of period | | $8.12 | | $5.88 | | | $10.07 | | | $9.58 | | | $8.46 | | | $8.33 | |
| | | | | | | | | | | | | | | | | |
| | | | | | |
Income (loss) from investment operations: | | | | | | | | | | | | | | | | | |
Net investment income | | 0.061 | | 0.04 | 1 | | 0.10 | | | 0.05 | | | 0.12 | | | 0.07 | |
Net realized and unrealized gain (loss) on investments | | (0.99) | | 2.26 | | | (4.08 | ) | | 1.36 | | | 2.71 | | | 0.87 | |
| | | | | | | | | | | | | | | | | |
Total from investment operations | | (0.93) | | 2.30 | | | (3.98 | ) | | 1.41 | | | 2.83 | | | 0.94 | |
| | | | | | | | | | | | | | | | | |
Less distributions to shareholders: | | | | | | | | | | | | | | | | | |
From net investment income | | — | | (0.06 | ) | | (0.03 | ) | | (0.05 | ) | | (0.14 | ) | | (0.07 | ) |
From net realized gain on investments | | — | | — | | | (0.18 | ) | | (0.87 | ) | | (1.57 | ) | | (0.74 | ) |
| | | | | | | | | | | | | | | | | |
Total distributions to shareholders | | — | | (0.06 | ) | | (0.21 | ) | | (0.92 | ) | | (1.71 | ) | | (0.81 | ) |
| | | | | | | | | | | | | | | | | |
Net asset value - End of period | | $7.19 | | $8.12 | | | $5.88 | | | $10.07 | | | $9.58 | | | $8.46 | |
| | | | | | | | | | | | | | | | | |
Net assets - End of period
(000’s omitted) | | $4,935,849 | | $4,917,459 | | | $1,340,057 | | | $841,864 | | | $317,121 | | | $206,636 | |
| | | | | | | | | | | | | | | | | |
Total return2 | | (11.45%) | | 39.12% | | | (40.07% | ) | | 15.13% | | | 33.88% | | | 11.33% | |
Ratios (to average net assets)/ | | | | | | | | | | | | | | | | | |
Supplemental Data: | | | | | | | | | | | | | | | | | |
Expenses* | | 1.12%3 | | 1.17% | | | 1.16% | | | 1.14% | | | 1.16% | | | 1.21% | |
Net investment income | | 1.46%3 | | 0.60% | | | 2.17% | | | 0.75% | | | 1.35% | | | 0.95% | |
Portfolio turnover | | 18% | | 42% | | | 34% | | | 49% | | | 64% | | | 46% | |
|
*The investment advisor did not impose all of its management fees, CCO fees, fund accounting and transfer agent fees, and other fees in some periods and in some periods paid a portion of the Series’ expenses. If these expenses had been incurred by the Series, the expense ratio (to average net assets) would have been increased by the following amounts: | |
| | 0.00%3,4 | | 0.00%4 | | | N/A | | | N/A | | | N/A | | | N/A | |
1Calculated based on average shares outstanding during the periods.
2Represents aggregate total return for the periods indicated, and assumes reinvestment of all distributions. Total returns would have been lower had certain expenses not been waived or reimbursed during certain periods. Periods less than one year are not annualized.
3 Annualized.
4 Less than 0.01%.
| | | | |
| 11 | | The accompanying notes are an integral part of the financial statements. | | |
Notes to Financial Statements (unaudited)
World Opportunities Series (the “Series”) is a no-load diversified series of Manning & Napier Fund, Inc. (the “Fund”). The Fund is organized in Maryland and is registered under the Investment Company Act of 1940, as amended, as an open-end management investment company.
The Series’ investment objective is to provide long-term growth by investing principally in the common stocks of companies located around the world.
The Series is authorized to issue five classes of shares (Class A, B, D, E and Z). Currently, only Class A shares have been issued. Each class of shares is substantially the same, except that class-specific distribution and shareholder servicing expenses are borne by the specific class of shares to which they relate.
The Fund’s Advisor is Manning & Napier Advisors, Inc. (the “Advisor”). Shares of the Series are offered to investors, clients and employees of the Advisor and its affiliates. The total authorized capital stock of the Fund consists of 10.0 billion shares of common stock each having a par value of $0.01. As of June 30, 2010, 6.2 billion shares have been designated in total among 29 series, of which 2.5 billion have been designated as World Opportunities Series Class A common stock.
| 2. | SIGNIFICANT ACCOUNTING POLICIES |
Security Valuation
Portfolio securities, including domestic equities, foreign equities, warrants and options, listed on an exchange other than the NASDAQ National Market System are valued at the latest quoted sales price of the exchange on which the security is primarily traded. Securities not traded on valuation date or securities not listed on an exchange are valued at the latest quoted bid price provided by the Fund’s pricing service. Securities listed on the NASDAQ National Market System are valued in accordance with the NASDAQ Official Closing Price.
Short-term investments that mature in sixty days or less are valued at amortized cost, which approximates market value. Investments in open-end investment companies are valued at their net asset value per share on valuation date.
Volume and level of activity in established markets for an asset or liability are evaluated to determine whether recent transactions and quoted prices are determinative of fair value. Where there have been significant decreases in volume and level of activity, further analysis and adjustment may be necessary to estimate fair value. The Series measures fair value in these instances by the use of inputs and valuation techniques which may be based upon current market prices of securities that are comparable in coupon, rating, maturity and industry and/or expectation of future cash flows. As a result of trading in relatively thin markets and/or markets that experience significant volatility, the prices used by the Series to value these securities may differ from the value that would be realized if these securities were sold, and the differences could be material.
Securities for which representative valuations or prices are not available from the Fund’s pricing service may be valued at fair value. Due to the inherent uncertainty of valuations of such securities, the fair value may differ significantly from the values that would have been used had a ready market for such securities existed. If trading or events occurring after the close of the principal market in which securities are traded are expected to materially affect the value of those securities, then they may be valued at their fair value, taking this trading or these events into account. Fair value is determined in good faith by the Advisor under procedures approved by and under the general supervision and responsibility of the Fund’s Board of Directors (the “Board”).
Various inputs are used in determining the value of the Series’ assets or liabilities carried at market value. These inputs are summarized in three broad levels. Level 1 includes quoted prices in active markets for identical assets and liabilities. Level 2 includes other significant observable inputs (including quoted prices for similar securities,
Notes to Financial Statements (unaudited)
| 2. | SIGNIFICANT ACCOUNTING POLICIES (continued) |
Security Valuation (continued)
interest rates, prepayment speeds, credit risk, etc.). Level 3 includes significant unobservable inputs (including the Series’ own assumptions in determining the fair value of investments.) The inputs or methodology used for valuing securities are not necessarily an indication of the risk associated with investing in those securities.
The following is a summary of the valuation levels used for major security types as of June 30, 2010 in valuing the Series’ assets or liabilities carried at market value:
| | | | | | | | | | | | |
| Description | | 6/30/10 | | Level 1 | | Level 2 | | Level 3 |
Equity securities* | | $ | 4,785,390,910 | | $ | 4,785,390,910 | | $ | — | | $ | — |
Preferred securities | | | 51,397,004 | | | 51,397,004 | | | — | | | — |
Debt securities | | | — | | | — | | | — | | | — |
Mutual funds | | | 72,828,148 | | | 72,828,148 | | | — | | | — |
Other financial instruments** | | | — | | | — | | | — | | | — |
| | | | | | | | | | | | |
Total | | $ | 4,909,616,062 | | $ | 4,909,616,062 | | $ | — | | $ | — |
| | | | | | | | | | | | |
*Includes common stock, warrants and rights. Please see the Investment Portfolio for industry classification.
**Other financial instruments are derivative instruments not reflected in the Investment Portfolio, such as futures, forwards and swap contracts, which are valued at the unrealized appreciation/depreciation on the instrument. As of June 30, 2010, the Series did not hold any derivative instruments.
There were no Level 3 securities held by the Series as of December 31, 2009 or June 30, 2010.
The Fund’s policy is to recognize transfers in and transfers out of the valuation levels as of the end of the reporting period. There were no significant transfers between Level 1 and Level 2 as of June 30, 2010.
Additional disclosure surrounding the activity in Level 3 fair value measurement will also be effective for fiscal years beginning after December 15, 2010. Management has concluded that this will not have a material impact on the Series’ financial statements.
Security Transactions, Investment Income and Expenses
Security transactions are accounted for on trade date. Dividend income is recorded on the ex-dividend date, except that if the ex-dividend date has passed, certain dividends from foreign securities are recorded as soon as the Fund is informed of the ex-dividend date. Non-cash dividends, if any, are recorded at the fair market value of the securities received. Interest income, including amortization of premium and accretion of discounts using the effective interest method, is earned from settlement date and accrued daily.
Expenses are recorded on an accrual basis. Most expenses of the Fund can be attributed to a specific series. Expenses which cannot be directly attributed are apportioned among the series in the Fund in such a manner as deemed equitable by the Fund’s Board, taking into consideration, among other things, the nature and type of expense.
The Series uses the identified cost method for determining realized gain or loss on investments for both financial statement and federal income tax reporting purposes.
Foreign Currency Translation
The books and records of the Series are maintained in U.S. dollars. Foreign currencies, investments and other assets and liabilities are translated into U.S. dollars at the current exchange rates. Purchases and sales of investment
13
Notes to Financial Statements (unaudited)
| 2. | SIGNIFICANT ACCOUNTING POLICIES (continued) |
Foreign Currency Translation (continued)
securities and income and expenses are translated on the respective dates of such transactions. The Series does not isolate realized and unrealized gains and losses attributable to changes in the exchange rates from gains and losses that arise from changes in the market value of investments. Such fluctuations are included with net realized and unrealized gain or loss on investments. Net realized foreign currency gains and losses represent foreign currency gains and losses between trade date and settlement date on securities transactions, gains and losses on disposition of foreign currencies and the difference between the amount of income and foreign withholding taxes recorded on the books of the Series and the amounts actually received or paid.
Affiliated Companies
The 1940 Act defines “affiliated companies” to include securities in which a series owns 5% or more of the outstanding voting securities of the issuer. The following transactions were effected in shares of Calfrac Well Services Ltd. (Canada) and Trican Well Service Ltd. (Canada) for the six months ended June 30, 2010:
| | | | | | | | | | | | | | | | | |
| Name of Issuer | | Number of
Shares Held as of 12/31/09 | | Gross Additions | | Gross Reductions | | Number of Shares Held as of 6/30/10 | | Value as of 6/30/10 | | Investment Income | | Realized Gain |
Calfrac Well Service Ltd. (Canada)* | | 3,375,150 | | — | | 2,078,480 | | 1,296,670 | | $ | 23,812,783 | | $ | — | | $ | 6,107,092 |
Trican Well Service Ltd. (Canada) | | 7,415,430 | | — | | — | | 7,415,430 | | $ | 94,943,695 | | $ | 304,808 | | $ | — |
* Security was an affiliated company for the period December 31, 2009 through April 16, 2010.
Federal Taxes
The Series’ policy is to comply with the provisions of the Internal Revenue Code applicable to regulated investment companies. The Series is not subject to federal income tax or excise tax to the extent that the Series distributes to shareholders each year its taxable income, including any net realized gains on investments, in accordance with requirements of the Internal Revenue Code. Accordingly, no provision for federal income tax or excise tax has been made in the financial statements.
Management evaluates its tax positions to determine if the tax positions taken meet the minimum recognition threshold in connection with accounting for uncertainties in income tax positions taken or expected to be taken for the purposes of measuring and recognizing tax liabilities in the financial statements. Recognition of tax benefits of an uncertain tax position is required only when the position is “more likely than not” to be sustained assuming examination by taxing authorities. At June 30, 2010, the Series has recorded no liability for net unrecognized tax benefits relating to uncertain income tax positions taken or expected to be taken in future tax returns.
The Series files income tax returns in the U.S. federal jurisdiction, various states and foreign jurisdictions, as required. No income tax returns are currently under investigation. The statute of limitations on the Series’ tax returns remains open for the years ended December 31, 2006 through December 31, 2009. The Fund is not aware of any tax positions for which it is reasonably possible that the total amounts of unrecognized tax benefits will significantly change in the next twelve months.
Additionally, based on the Fund’s understanding of the tax rules and rates related to income, gains and transactions for foreign jurisdictions in which it invests, the Series will provide for foreign taxes, and where appropriate, deferred foreign tax.
14
Notes to Financial Statements (unaudited)
| 2. | SIGNIFICANT ACCOUNTING POLICIES (continued) |
Distributions of Income and Gains
Distributions to shareholders of net investment income and net realized gains are made annually. An additional distribution may be necessary to avoid taxation of the Series. Distributions are recorded on the ex-dividend date.
Indemnifications
The Fund’s organizational documents provide former and current directors and officers with a limited indemnification against liabilities arising in connection with the performance of their duties to the Fund. In the normal course of business, the Fund may also enter into contracts that provide general indemnifications. The Fund’s maximum exposure under these arrangements is unknown as this would be dependent on future claims that may be made against the Fund. The risk of material loss from such claims is considered remote.
Other
The preparation of financial statements in conformity with accounting principles generally accepted in the United States of America requires management to make estimates and assumptions that affect the reported amounts of assets and liabilities and the disclosure of contingent assets and liabilities at the date of the financial statements and the reported amounts of income and expenses during the reporting period. Actual results could differ from those estimates.
| 3. | TRANSACTIONS WITH AFFILIATES |
The Fund has an Investment Advisory Agreement (the “Agreement”) with the Advisor, for which the Series pays a fee, computed daily and payable monthly, at an annual rate of 1.00% of the Series’ average daily net assets.
Under the Agreement, personnel of the Advisor provide the Series with advice and assistance in the choice of investments and the execution of securities transactions, and otherwise maintain the Series’ organization. The Advisor also provides the Fund with necessary office space and fund administration and support services. The salaries of all officers of the Fund (except a percentage of the Fund’s Chief Compliance Officer’s salary, which is paid by the Fund), and of all Directors who are “affiliated persons” of the Fund, or of the Advisor, and all personnel of the Fund, or of the Advisor, performing services relating to research, statistical and investment activities, are paid by the Advisor. Each “non-affiliated” Director receives an annual stipend, which is allocated among all the active series of the Fund. In addition, these Directors also receive a fee per Board meeting attended for each active series of the Fund plus a fee for each committee meeting attended.
For the six months ended June 30, 2010, the Advisor voluntarily waived fees of $758, which is included as a reduction of expenses on the Statement of Operations. The Advisor is not eligible to recoup any expense that has been waived or reimbursed in prior years.
Manning & Napier Investor Services, Inc., a registered broker-dealer affiliate of the Advisor, acts as distributor for the Fund’s shares. The services of Manning & Napier Investor Services, Inc. are provided at no additional cost to the Series.
The Advisor has entered into agreements with PNC Global Investment Servicing (U.S.) Inc. (“PNCGIS”) under which PNCGIS serves as sub-accountant services agent and sub-transfer agent. The Fund pays the Advisor an annual fee of 0.0175% on the first $3 billion of average daily net assets (excluding Target Series); 0.015% on the next $3 billion of average daily net assets (excluding Target Series); and 0.01% of the average daily net assets in excess of $6 billion (excluding Target Series); plus a base fee of $25,500 per Series. Additionally, certain transaction-, account-, and cusip-based fees and out-of-pocket expenses, including charges for reporting relating to the Fund’s compliance program, are charged.
15
Notes to Financial Statements (unaudited)
| 3. | TRANSACTIONS WITH AFFILIATES (continued) |
On July 1, 2010, The PNC Financial Services Group, Inc. sold the outstanding stock of PNC Global Investment Servicing Inc. to The Bank of New York Mellon Corporation. At the closing of the sale, PNCGIS changed its name to BNY Mellon Investment Servicing (US) Inc.
| 4. | PURCHASES AND SALES OF SECURITIES |
For the six months ended June 30, 2010, purchases and sales of securities, other than U.S. Government securities and short-term securities, were $1,767,418,775 and $874,665,454, respectively. There were no purchases or sales of U.S. Government securities.
| 5. | CAPITAL STOCK TRANSACTIONS |
Transactions in Class A shares of World Opportunities Series were:
| | | | | | | | | | | | | | |
| | | For the Six Months Ended 6/30/10 | | | For the Year Ended 12/31/09 | |
| | | Shares | | | Amount | | | Shares | | | Amount | |
Sold | | 215,549,306 | | | $ | 1,709,991,255 | | | 473,021,745 | | | $ | 3,314,846,649 | |
Reinvested | | — | | | | — | | | 2,714,538 | | | | 21,626,348 | |
Repurchased | | (134,840,790 | ) | | | (1,031,759,490 | ) | | (98,321,062 | ) | | | (637,044,868 | ) |
| | | | | | | | | | | | | | |
Total | | 80,708,516 | | | $ | 678,231,765 | | | 377,415,221 | | | $ | 2,699,428,129 | |
| | | | | | | | | | | | | | |
Approximately 3% of the Series’ shares represent investments by fiduciary accounts over which the Advisor has sole investment discretion.
The Series may trade in instruments including written and purchased options, forward foreign currency exchange contracts and futures contracts and other derivatives in the normal course of investing activities to assist in managing exposure to various market risks. The Series may be subject to various elements of risk and may involve, to a varying degree, elements of risk in excess of the amounts recognized for financial statement purposes. These risks include: the risk that changes in the value of a derivative may not correlate perfectly with the underlying asset, rate or index, counterparty credit risk related to over the counter derivatives counterparties’ failure to perform under contract terms, liquidity risk related to the lack of a liquid market for these contracts allowing the fund to close out its position(s) and documentation risk relating to disagreement over contract terms. No such investments were held by the Series on June 30, 2010.
Investing in securities of foreign companies and foreign governments involves special risks and considerations not typically associated with investing in securities of domestic companies and the U.S. Government. These risks include revaluation of currencies and future adverse political and economic developments. Moreover, securities of foreign companies and foreign governments and their markets may be less liquid and their prices more volatile than those of comparable domestic companies and the U.S. Government.
16
Notes to Financial Statements (unaudited)
| 8. | FEDERAL INCOME TAX INFORMATION |
The amount and characterization of certain income and capital gains to be distributed are determined in accordance with federal income tax regulations, which may differ from accounting principles generally accepted in the United States of America. The Series may periodically make reclassifications among its capital accounts to reflect income and gains available for distribution (or available capital loss carryovers) under income tax regulations without impacting the Series’ net asset value. Any such reclassifications are not reflected in the financial highlights.
The final determination of the tax character of current year distributions will be made at the conclusion of the fiscal year. The tax character of distributions paid for the year ended December 31, 2009 were as follows:
| | | |
Ordinary income | | $ | 30,333,272 |
At June 30, 2010, the identified cost of investments for federal income tax purposes, the resulting gross unrealized appreciation and depreciation, and the net unrealized depreciation were as follows:
| | | | |
Cost for federal income tax purposes | | $ | 5,307,879,992 | |
Unrealized appreciation | | $ | 190,558,306 | |
Unrealized depreciation | | | (588,822,236 | ) |
| | | | |
Net unrealized depreciation | | $ | (398,263,930 | ) |
| | | | |
There were no subsequent events that require recognition or disclosure. In preparing these financial statements, management of the Fund has evaluated events and transactions for potential recognition or disclosure through the date the financial statements were issued.
17
Literature Requests (unaudited)
Proxy Voting Policies and Procedures
A description of the policies and procedures that the Fund uses to determine how to vote proxies relating to portfolio securities is available, without charge, upon request:
| | |
By phone | | 1-800-466-3863 |
On the Securities and Exchange Commission’s (SEC) web site | | http://www.sec.gov |
Proxy Voting Record
Information regarding how the Fund voted proxies relating to portfolio securities during the most recent 12-month period ended June 30th is available, without charge, upon request:
| | |
By phone | | 1-800-466-3863 |
On the SEC’s web site | | http://www.sec.gov |
Quarterly Portfolio Holdings
The Series’ complete schedule of portfolio holdings for the 1st and 3rd quarters of each fiscal year are provided on Form N-Q, and are available, without charge, upon request:
| | |
By phone | | 1-800-466-3863 |
On the SEC’s web site | | http://www.sec.gov |
The Series’ Form N-Q may be reviewed and copied at the SEC’s Public Reference Room in Washington, D.C. Information on the operation of the Public Reference Room may be obtained by calling 1-800-SEC-0330.
Prospectus and Statement of Additional Information (SAI)
The prospectus and SAI provide additional information about each Series, including charges, expenses and risks. These documents are available, without charge, upon request:
| | |
By phone | | 1-800-466-3863 |
On the SEC’s web site | | http://www.sec.gov |
On the Advisor’s web site | | http://www.manningnapieradvisors.com |
Additional information available at www.manningnapieradvisors.com
1. Fund Holdings - Month-End
2. Fund Holdings - Quarter-End
3. Shareholder Report - Annual
4. Shareholder Report - Semi-Annual
MNWO-06/10-SAR

Shareholder Expense Example (unaudited)
As a shareholder of the Series, you may incur two types of costs: (1) transaction costs and (2) ongoing costs, including management fees and other Series expenses. This example is intended to help you understand your ongoing costs (in dollars) of investing in the Series and to compare these costs with the ongoing costs of investing in other mutual funds.
The example is based on an investment of $1,000 invested at the beginning of the period and held for the entire period (January 1, 2010 to June 30, 2010).
Actual Expenses
The first line of the table below provides information about actual account values and actual expenses. You may use the information in this line, together with the amount you invested, to estimate the expenses that you paid over the period. Simply divide your account value by $1,000 (for example, an $8,600 account value divided by $1,000 = 8.6), then multiply the result by the number in the first line under the heading entitled “Expenses Paid During Period” to estimate the expenses you paid on your account during this period.
Hypothetical Example for Comparison Purposes
The second line of the table below provides information about hypothetical account values and hypothetical expenses based on the Series’ actual expense ratio and an assumed rate of return of 5% per year before expenses, which is not the Series’ actual return. The hypothetical account values and expenses may not be used to estimate the actual ending account balance or expenses you paid during the period. You may use this information to compare the ongoing costs of investing in the Series and other funds. To do so, compare this 5% hypothetical example with the 5% hypothetical examples that appear in the shareholder reports of the other funds.
Please note that the expenses shown in the table are meant to highlight your ongoing costs only and do not reflect any transaction costs. Therefore, the second line of the table is useful in comparing ongoing costs only, and will not help you determine the relative total costs of owning different funds. In addition, if these transaction costs were included, your costs would have been higher.
| | | | | | |
| | | Beginning
Account Value
1/1/10 | | Ending
Account Value
6/30/10 | | Expenses Paid
During Period*
1/1/10-6/30/10 |
Actual | | $1,000.00 | | $1,023.60 | | $4.26 |
Hypothetical
(5% return before expenses) | | $1,000.00 | | $1,020.58 | | $4.26 |
*Expenses are equal to the Series’ annualized expense ratio (for the six-month period) of 0.85%, multiplied by the average account value over the period, multiplied by 181/365 (to reflect the one-half year period). Expenses are based on the most recent fiscal half year. The Series’ total return would have been lower had certain expenses not been waived during the period.
Portfolio Composition as of June 30, 2010 (unaudited)
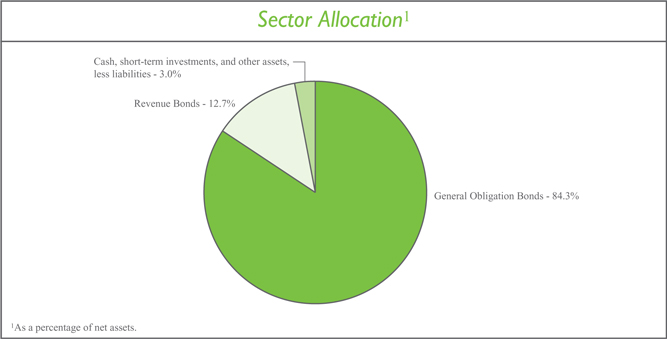
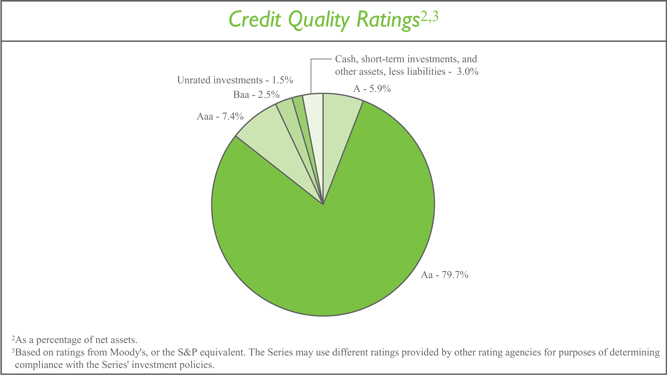
Investment Portfolio - June 30, 2010 (unaudited)
| | | | | | | | | | |
| | | Coupon
Rate | | Maturity
Date | | Credit
Rating 1
(unaudited) | | Principal
Amount | | Value
(Note 2) |
OHIO MUNICIPAL SECURITIES - 97.0% | | | | | | | | | | |
Akron, Various Purposes Impt., G.O. Bond | | 4.250% | | 12/1/2028 | | AA2 | | $ 200,000 | | $ 196,978 |
American Municipal Power-Ohio, Inc., Prairie State Energy Campus Project, Series A, Revenue Bond | | 5.250% | | 2/15/2023 | | A1 | | 150,000 | | 161,272 |
Avon, Public Impt., Series B, G.O. Bond | | 5.000% | | 12/1/2023 | | Aa1 | | 100,000 | | 110,027 |
Batavia Local School District, G.O. Bond, NATL | | 5.625% | | 12/1/2022 | | A1 | | 200,000 | | 226,730 |
Bedford Heights, Series A, G.O. Bond, AMBAC | | 5.650% | | 12/1/2014 | | Aa3 | | 25,000 | | 26,993 |
Big Walnut Local School District, Delaware County, School Facilities Construction & Impt., G.O. Bond, AGM | | 4.500% | | 12/1/2029 | | Aa2 | | 200,000 | | 202,150 |
Brunswick, Limited Tax, Capital Impt., G.O. Bond | | 4.000% | | 12/1/2025 | | Aa2 | | 100,000 | | 98,987 |
Butler County, G.O. Bond, AMBAC | | 5.000% | | 12/1/2016 | | Aa1 | | 110,000 | | 128,172 |
Canal Winchester Local School District, G.O. Bond, AGM | | 4.250% | | 12/1/2027 | | Aa3 | | 500,000 | | 497,550 |
Canal Winchester Local School District, Prerefunded Balance, Series B, G.O. Bond, NATL | | 5.000% | | 12/1/2025 | | A1 | | 355,000 | | 408,339 |
Cincinnati City School District, G.O. Bond | | 4.500% | | 6/1/2018 | | Aa2 | | 100,000 | | 111,232 |
Cincinnati City School District, G.O. Bond | | 5.000% | | 6/1/2031 | | Aa2 | | 265,000 | | 278,531 |
Cincinnati Water Systems, Series B, Revenue Bond, NATL | | 5.000% | | 12/1/2023 | | Aa1 | | 600,000 | | 657,648 |
Cincinnati, Public Impt., Series A, G.O. Bond | | 5.000% | | 12/1/2021 | | Aa1 | | 220,000 | | 247,700 |
Cleveland Heights & University Heights City School District, Library Impt., G.O. Bond | | 5.125% | | 12/1/2026 | | Aa2 | | 200,000 | | 207,014 |
Cleveland, Income Tax, Revenue Bond | | 5.250% | | 5/15/2024 | | AA2 | | 500,000 | | 537,295 |
Cleveland, Water Utility Impt., Series O, Revenue Bond, NATL | | 5.000% | | 1/1/2037 | | Aa1 | | 380,000 | | 390,176 |
Columbus City School District, School Facilities Construction & Impt., G.O. Bond | | 4.500% | | 12/1/2029 | | Aa2 | | 500,000 | | 504,375 |
Columbus City School District, School Facilities Construction & Impt., G.O. Bond, AGM | | 4.250% | | 12/1/2032 | | Aa2 | | 500,000 | | 485,200 |
Columbus, Limited Tax, Series 2, G.O. Bond | | 5.000% | | 7/1/2017 | | Aaa | | 250,000 | | 284,340 |
Columbus, Sewer Impt., Series A, Revenue Bond | | 4.250% | | 6/1/2030 | | Aa1 | | 250,000 | | 245,930 |
Cuyahoga Falls, G.O. Bond, NATL | | 5.000% | | 12/1/2021 | | Aa2 | | 750,000 | | 812,460 |
Eaton Community City Schools, G.O. Bond, FGRNA | | 4.125% | | 12/1/2026 | | Aa2 | | 500,000 | | 488,030 |
Elyria City School District, G.O. Bond, XLCA | | 4.750% | | 12/1/2027 | | A1 | | 100,000 | | 101,647 |
Euclid, G.O. Bond, NATL | | 4.250% | | 12/1/2023 | | Aa2 | | 465,000 | | 476,699 |
Fairbanks Local School District, School Facilities Construction & Impt., G.O. Bond, AGM | | 4.500% | | 12/1/2028 | | Aa3 | | 400,000 | | 401,844 |
| | | | |
| | The accompanying notes are an integral part of the financial statements. | | 3 |
Investment Portfolio - June 30, 2010 (unaudited)
| | | | | | | | | | |
| | | Coupon
Rate | | Maturity
Date | | Credit
Rating 1
(unaudited) | | Principal
Amount | | Value
(Note 2) |
OHIO MUNICIPAL SECURITIES (continued) | | | | | | | | | | |
Fairborn School District, G.O. Bond, AGM | | 5.000% | | 12/1/2021 | | Aa3 | | $ 400,000 | | $ 440,620 |
Fairfield County, Building Impt., Prerefunded Balance, G.O. Bond | | 5.000% | | 12/1/2018 | | Aa2 | | 250,000 | | 266,272 |
Fairview Park City School District, G.O. Bond, NATL | | 5.000% | | 12/1/2029 | | Aa3 | | 315,000 | | 322,289 |
Franklin County, Various Purposes Impt., G.O. Bond | | 5.000% | | 12/1/2027 | | Aaa | | 500,000 | | 544,870 |
Geneva Area City School District, G.O. Bond, NATL | | 4.500% | | 12/1/2030 | | Aa3 | | 120,000 | | 120,828 |
Granville Exempt Village School District, G.O. Bond, AGM | | 4.375% | | 12/1/2031 | | Aa1 | | 500,000 | | 499,640 |
Greater Cleveland Regional Transit Authority, Capital Impt., G.O. Bond, FGRNA | | 4.125% | | 12/1/2023 | | Aa2 | | 450,000 | | 452,313 |
Greene County, Limited Tax, G.O. Bond | | 4.500% | | 12/1/2035 | | Aa2 | | 250,000 | | 247,377 |
Hamilton City School District, G.O. Bond, AGM | | 4.250% | | 12/1/2030 | | Aa3 | | 500,000 | | 486,005 |
Hamilton County, Sewer Impt., Series A, Revenue Bond | | 5.000% | | 12/1/2032 | | Aa2 | | 100,000 | | 104,726 |
Hamilton Electric System, Series A, Revenue Bond, AGC | | 4.125% | | 10/1/2024 | | Aa3 | | 300,000 | | 302,052 |
Hamilton Waterworks System, Series A, Revenue Bond, AGC | | 4.625% | | 10/15/2029 | | Aa3 | | 100,000 | �� | 100,859 |
Hancock County, Various Purposes Impt., G.O. Bond, NATL | | 4.000% | | 12/1/2016 | | Aa2 | | 200,000 | | 218,038 |
Harrison, Various Purposes Impt., G.O. Bond, AGM | | 5.250% | | 12/1/2038 | | Aa3 | | 275,000 | | 290,466 |
Huber Heights City School District, G.O. Bond | | 5.000% | | 12/1/2036 | | Aa2 | | 450,000 | | 468,158 |
Indian Hill Exempt Village School District, G.O. Bond | | 4.375% | | 12/1/2022 | | Aaa | | 250,000 | | 263,975 |
Indian Lake Local School District, School Facilities Construction & Impt., G.O. Bond, NATL | | 4.500% | | 12/1/2021 | | Aa3 | | 235,000 | | 247,728 |
Ironton City School District, G.O. Bond, NATL | | 4.250% | | 12/1/2028 | | Baa1 | | 500,000 | | 478,400 |
Kettering City School District, G.O. Bond, AGM . | | 4.250% | | 12/1/2025 | | Aa2 | | 750,000 | | 761,670 |
Lakewood, Water System, Revenue Bond, AMBAC | | 4.500% | | 7/1/2028 | | WR3 | | 500,000 | | 477,295 |
Licking Heights Local School District, School Facilities Construction & Impt., Series A, G.O. Bond, NATL | | 5.000% | | 12/1/2022 | | Aa2 | | 250,000 | | 265,950 |
Lima, Revenue Bond, AGM | | 3.750% | | 12/1/2023 | | Aa3 | | 225,000 | | 222,235 |
Lima, Revenue Bond, AGM | | 4.300% | | 12/1/2029 | | Aa3 | | 200,000 | | 197,452 |
Lorain City School District, Classroom Facilities Impt., Unrefunded Balance, G.O. Bond, NATL | | 4.750% | | 12/1/2025 | | Aa2 | | 335,000 | | 346,598 |
| | | | |
| 4 | | The accompanying notes are an integral part of the financial statements. | | |
Investment Portfolio - June 30, 2010 (unaudited)
| | | | | | | | | | |
| | | Coupon
Rate | | Maturity
Date | | Credit
Rating 1
(unaudited) | | Principal
Amount | | Value
(Note 2) |
OHIO MUNICIPAL SECURITIES (continued) | | | | | | | | | | |
Lorain County, Sewer System Impt., G.O. Bond | | 5.000% | | 12/1/2039 | | Aa2 | | $ 200,000 | | $ 200,738 |
Lucas County, G.O. Bond | | 4.100% | | 12/1/2027 | | AA2 | | 100,000 | | 100,698 |
Lucas County, G.O. Bond | | 4.500% | | 10/1/2035 | | Aa2 | | 300,000 | | 293,334 |
Mansfield, Limited Tax, Various Purposes Impt., G.O. Bond, AGC | | 5.500% | | 12/1/2029 | |
Aa3 | | 100,000 | | 102,133 |
Marion, Limited Tax, Series A, G.O. Bond, AGC | | 4.300% | | 12/1/2030 | | Aa3 | | 100,000 | | 98,130 |
Marysville Exempt Village School District, G.O. Bond, AGM | | 5.000% | | 12/1/2023 | | Aa3 | | 500,000 | | 531,945 |
Marysville, Sewer & Wastewater, Revenue Bond, XLCA | | 4.750% | | 12/1/2046 | | Aa3 | | 180,000 | | 176,116 |
Maumee City School District, G.O. Bond, AGM | | 4.600% | | 12/1/2031 | | Aa3 | | 260,000 | | 262,002 |
Maumee Public Impt., G.O. Bond, NATL | | 4.125% | | 12/1/2018 | | Aa2 | | 375,000 | | 401,786 |
Miamisburg City School District, G.O. Bond | | 5.000% | | 12/1/2033 | | Aa2 | | 250,000 | | 264,415 |
Monroe Local School District, G.O. Bond, AMBAC | | 5.500% | | 12/1/2024 | | Aa3 | | 500,000 | | 570,335 |
Mount Healthy City School District, G.O. Bond, AGM | | 5.000% | | 12/1/2031 | | Aa3 | | 200,000 | | 208,216 |
Muskingum County, Limited Tax, Various Purposes Impt., G.O. Bond, AGC | | 4.300% | | 12/1/2028 | | Aa2 | | 145,000 | | 143,975 |
New Albany Plain Local School District, G.O. Bond, FGRNA | | 5.000% | | 12/1/2030 | | AA2 | | 140,000 | | 141,242 |
New Albany Plain Local School District, Prerefunded Balance, G.O. Bond, FGIC | | 5.000% | | 12/1/2025 | | Aa1 | | 45,000 | | 48,888 |
New Albany Plain Local School District, Prerefunded Balance, G.O. Bond, FGIC | | 5.000% | | 12/1/2025 | | Aa1 | | 85,000 | | 92,343 |
New Albany Plain Local School District, Prerefunded Balance, G.O. Bond, FGIC | | 5.000% | | 12/1/2029 | | Aa1 | | 95,000 | | 103,207 |
New Albany Plain Local School District, Unrefunded Balance, G.O. Bond, FGIC | | 5.000% | | 12/1/2025 | | Aa1 | | 185,000 | | 187,116 |
New Albany Plain Local School District, Unrefunded Balance, G.O. Bond, FGRNA | | 5.000% | | 12/1/2029 | | Aa1 | | 130,000 | | 130,845 |
North Royalton, Various Purposes Impt., G.O. Bond | | 5.250% | | 12/1/2028 | | Aa2 | | 1,025,000 | | 1,110,454 |
Ohio State Water Development Authority, Pollution Control, Revenue Bond | | 5.250% | | 12/1/2015 | | Aaa | | 200,000 | | 235,642 |
Ohio State Water Development Authority, Pure Water, Series I, Revenue Bond, AMBAC | | 6.000% | | 12/1/2016 | | Aaa | | 35,000 | | 39,609 |
Ohio State, Infrastructure Impt., Series A, Prerefunded Balance, G.O. Bond | | 5.000% | | 3/1/2017 | | Aa1 | | 250,000 | | 292,988 |
Ohio State, School Services, Series A, G.O. Bond | | 4.500% | | 9/15/2025 | | Aa1 | | 700,000 | | 720,300 |
| | | | |
| | The accompanying notes are an integral part of the financial statements. | | 5 |
Investment Portfolio - June 30, 2010 (unaudited)
| | | | | | | | | | |
| | | Coupon
Rate | | Maturity
Date | | Credit
Rating 1
(unaudited) | | Principal
Amount | | Value
(Note 2) |
OHIO MUNICIPAL SECURITIES (continued) | | | | | | | | | | |
Olentangy Local School District, Series A, G.O. Bond, AGM | | 4.500% | | 12/1/2032 | | Aa1 | | $800,000 | | $789,960 |
Orange City School District, G.O. Bond | | 4.500% | | 12/1/2023 | | Aaa | | 500,000 | | 524,585 |
Painesville City School District, G.O. Bond, FGRNA | | 4.500% | | 12/1/2025 | | Aa3 | | 170,000 | | 172,375 |
Pickerington Local School District, G.O. Bond, NATL | | 4.300% | | 12/1/2024 | | Baa1 | | 300,000 | | 302,403 |
Pickerington Local School District, School Facilities Construction & Impt., G.O. Bond, NATL | | 4.250% | | 12/1/2034 | | Aa2 | | 230,000 | | 222,852 |
South Range Local School District, G.O. Bond, XLCA | | 4.500% | | 12/1/2035 | | A2 | | 225,000 | | 218,358 |
South-Western City School District, Franklin & Pickway County, G.O. Bond, AGM | | 4.250% | | 12/1/2026 | | Aa2 | | 600,000 | | 601,656 |
Springboro Community City School District, G.O. Bond, AGM | | 5.250% | | 12/1/2032 | | Aa3 | | 150,000 | | 171,069 |
Sugarcreek Local School District, G.O. Bond, AGM | | 4.250% | | 12/1/2031 | | Aa2 | | 750,000 | | 724,372 |
Sylvania City School District, G.O. Bond, AGC | | 5.000% | | 12/1/2025 | | Aa2 | | 270,000 | | 288,527 |
Tallmadge City School District, School Facilities, G.O. Bond, AGM | | 5.000% | | 12/1/2031 | | AAA2 | | 200,000 | | 208,572 |
Tallmadge, G.O. Bond | | 4.250% | | 12/1/2030 | | Aa2 | | 180,000 | | 176,857 |
Tecumseh Local School District, G.O. Bond, FGRNA | | 4.750% | | 12/1/2027 | | A1 | | 195,000 | | 197,943 |
Toledo, Capital Impt., G.O. Bond, AGC | | 4.000% | | 12/1/2024 | | Aa3 | | 100,000 | | 97,323 |
Toledo, Waterworks, Revenue Bond, NATL | | 5.000% | | 11/15/2023 | | Aa3 | | 100,000 | | 104,263 |
Trotwood-Madison City School District, G.O. Bond, AGM | | 4.250% | | 12/1/2022 | | Aa3 | | 250,000 | | 254,665 |
Troy, G.O. Bond | | 4.750% | | 12/1/2024 | | Aa1 | | 250,000 | | 260,992 |
Van Buren Local School District, School Facilities Construction & Impt., Prerefunded Balance, G.O. Bond, AGM | | 5.250% | | 12/1/2016 | | Aa3 | | 300,000 | | 320,421 |
Vandalia Butler City School District, G.O. Bond | | 5.000% | | 12/1/2038 | | Aa2 | | 500,000 | | 522,660 |
Vandalia, G.O. Bond, AMBAC | | 5.000% | | 12/1/2015 | | Aa2 | | 235,000 | | 259,525 |
Wadsworth City School District, G.O. Bond, AGC | | 5.000% | | 12/1/2037 | | AAA2 | | 180,000 | | 185,389 |
Warren County, Highway Impt., G.O. Bond | | 4.000% | | 12/1/2022 | | Aa1 | | 100,000 | | 103,114 |
Washington Court House City School District, G.O. Bond, FGRNA | | 5.000% | | 12/1/2029 | | A1 | | 500,000 | | 512,610 |
Wood County, G.O. Bond | | 5.400% | | 12/1/2013 | | Aa2 | | 20,000 | | 20,060 |
| | | | | | | | | | |
TOTAL MUNICIPAL BONDS
(Identified Cost $29,453,624) | | | | | | | | | | 30,110,143 |
| | | | | | | | | | |
| | | | |
| 6 | | The accompanying notes are an integral part of the financial statements. | | |
Investment Portfolio - June 30, 2010 (unaudited)
| | | | | | | |
| | | Shares | | Value (Note 2) | | |
SHORT-TERM INVESTMENTS - 2.6% | | | | | | | |
| | | |
Dreyfus AMT - Free Municipal Reserves - Class R | | | | | | | |
(Identified Cost $798,631) | | 798,631 | | $ | 798,631 | | |
| | | | | | | |
TOTAL INVESTMENTS - 99.6%
(Identified Cost $30,252,255) | | | | | 30,908,774 | | |
OTHER ASSETS, LESS LIABILITIES - 0.4% | | | | | 112,560 | | |
| | | | | | | |
NET ASSETS - 100% | | | | $ | 31,021,334 | | |
| | | | | | | |
KEY:
G.O. Bond - General Obligation Bond
Impt. - Improvement
Scheduled principal and interest payments are guaranteed by:
AGC (Assured Guaranty Corp.)
AGM (Assurance Guaranty Municipal Corp.) (formerly known as FSA (Financial Security Assurance, Inc.))
AMBAC (AMBAC Assurance Corp.)
FGIC (Financial Guaranty Insurance Co.)
FGRNA (FGIC reinsured by NATL)
NATL (National Public Finance Guarantee Corp.)
XLCA (XL Capital Assurance)
The insurance does not guarantee the market value of the municipal bonds.
| 1 | Credit ratings from Moody’s (unaudited). |
| 2 | Credit ratings from S&P (unaudited). |
| 3 | Credit rating has been withdrawn. As of June 30, 2010, there is no rating available. |
The Series’ portfolio holds, as a percentage of net assets, greater than 10% in bonds insured by the following companies:
AGM - 27.6%; NATL - 26.1%.
| | | | |
| | The accompanying notes are an integral part of the financial statements. | | 7 |
Statement of Assets and Liabilities (unaudited)
June 30, 2010
| | | |
ASSETS: | | | |
| |
Investments, at value (identified cost $30,252,255) (Note 2) | | $ | 30,908,774 |
Interest receivable | | | 156,941 |
Dividends receivable | | | 42 |
Prepaid expenses | | | 383 |
| | | |
| |
TOTAL ASSETS | | | 31,066,140 |
| | | |
| |
LIABILITIES: | | | |
| |
Accrued management fees (Note 3) | | | 13,477 |
Accrued Chief Compliance Officer service fees (Note 3) | | | 820 |
Accrued transfer agent fees (Note 3) | | | 653 |
Accrued fund accounting and administration fees (Note 3) | | | 411 |
Audit fees payable | | | 18,149 |
Payable for fund shares repurchased | | | 9,013 |
Legal fees payable | | | 2,283 |
| | | |
| |
TOTAL LIABILITIES | | | 44,806 |
| | | |
| |
TOTAL NET ASSETS | | $ | 31,021,334 |
| | | |
| |
NET ASSETS CONSIST OF: | | | |
| |
Capital stock | | $ | 28,906 |
Additional paid-in-capital | | | 30,209,642 |
Undistributed net investment income | | | 126,267 |
Net unrealized appreciation on investments | | | 656,519 |
| | | |
| |
TOTAL NET ASSETS | | $ | 31,021,334 |
| | | |
| |
NET ASSET VALUE, OFFERING PRICE AND REDEMPTION PRICE PER SHARE - Class A ($31,021,334/2,890,569 shares) | | $ | 10.73 |
| | | |
| | | | |
| 8 | | The accompanying notes are an integral part of the financial statements. | | |
Statement of Operations (unaudited)
For the Six Months Ended June 30, 2010
| | | | |
INVESTMENT INCOME: | | | | |
| |
Interest | | $ | 563,914 | |
Dividends | | | 50 | |
| | | | |
| |
Total Investment Income | | | 563,964 | |
| | | | |
| |
EXPENSES: | | | | |
| |
Management fees (Note 3) | | | 68,518 | |
Fund accounting and administration fees (Note 3) | | | 19,602 | |
Directors’ fees (Note 3) | | | 6,373 | |
Chief Compliance Officer service fees (Note 3) | | | 1,761 | |
Transfer agent fees (Note 3) | | | 1,647 | |
Audit fees | | | 15,098 | |
Miscellaneous | | | 6,361 | |
| | | | |
| |
Total Expenses | | | 119,360 | |
Less reduction of expenses (Note 3) | | | (2,879 | ) |
| | | | |
| |
Net Expenses | | | 116,481 | |
| | | | |
| |
NET INVESTMENT INCOME | | | 447,483 | |
| | | | |
| |
REALIZED AND UNREALIZED GAIN ON INVESTMENTS: | | | | |
| |
Net change in unrealized appreciation on investments | | | 206,464 | |
| | | | |
| |
NET REALIZED AND UNREALIZED GAIN ON INVESTMENTS | | | 206,464 | |
| | | | |
| |
NET INCREASE IN NET ASSETS RESULTING FROM OPERATIONS | | $ | 653,947 | |
| | | | |
| | | | |
| | The accompanying notes are an integral part of the financial statements. | | 9 |
Statements of Changes in Net Assets
| | | | | | | | |
| | | For the Six
Months Ended
6/30/10
(unaudited) | | | For the
Year Ended
12/31/09 | |
INCREASE (DECREASE) IN NET ASSETS: | | | | | | | | |
| | |
OPERATIONS: | | | | | | | | |
| | |
Net investment income | | $ | 447,483 | | | $ | 749,727 | |
Net realized gain on investments | | | — | | | | 130,404 | |
Net change in unrealized appreciation on investments | | | 206,464 | | | | 1,786,693 | |
| | | | | | | | |
| | |
Net increase from operations | | | 653,947 | | | | 2,666,824 | |
| | | | | | | | |
| | |
DISTRIBUTIONS TO SHAREHOLDERS (Note 8): | | | | | | | | |
| | |
From net investment income | | | (374,355 | ) | | | (774,410 | ) |
From net realized gain on investments | | | — | | | | (221,596 | ) |
| | | | | | | | |
| | |
Total distributions to shareholders | | | (374,355 | ) | | | (996,006 | ) |
| | | | | | | | |
| | |
CAPITAL STOCK ISSUED AND REPURCHASED: | | | | | | | | |
| | |
Net increase from capital share transactions (Note 5) | | | 5,866,675 | | | | 2,359,995 | |
| | | | | | | | |
| | |
Net increase in net assets | | | 6,146,267 | | | | 4,030,813 | |
| | |
NET ASSETS: | | | | | | | | |
| | |
Beginning of period | | | 24,875,067 | | | | 20,844,254 | |
| | | | | | | | |
| | |
End of period (including undistributed net investment income of $126,267 and $53,139, respectively) | | $ | 31,021,334 | | | $ | 24,875,067 | |
| | | | | | | | |
| | | | |
| 10 | | The accompanying notes are an integral part of the financial statements. | | |
Financial Highlights
| | | | | | | | | | | | |
| | | For the Six
Months Ended
6/30/10 | | | | For the Years Ended | | |
| | | (unaudited) | | 12/31/09 | | 12/31/08 | | 12/31/07 | | 12/31/06 | | 12/31/05 |
Per share data (for a share outstanding throughout each period): | | | | | | | | | | | | |
Net asset value - Beginning of period | | $10.62 | | $9.82 | | $10.43 | | $10.46 | | $10.52 | | $10.59 |
| | | | | | | | | | | | |
Income (loss) from investment operations: | | | | | | | | | | | | |
Net investment income | | 0.171 | | 0.361 | | 0.38 | | 0.34 | | 0.38 | | 0.38 |
Net realized and unrealized gain (loss) on investments | | 0.08 | | 0.91 | | (0.57) | | —2 | | (0.05) | | (0.08) |
| | | | | | | | | | | | |
Total from investment operations | | 0.25 | | 1.27 | | (0.19) | | 0.34 | | 0.33 | | 0.30 |
| | | | | | | | | | | | |
Less distributions to shareholders: | | | | | | | | | | | | |
From net investment income | | (0.14) | | (0.37) | | (0.36) | | (0.37) | | (0.38) | | (0.36) |
From net realized gain on investments | | — | | (0.10) | | (0.06) | | — | | (0.01) | | (0.01) |
| | | | | | | | | | | | |
Total distributions to shareholders | | (0.14) | | (0.47) | | (0.42) | | (0.37) | | (0.39) | | (0.37) |
| | | | | | | | | | | | |
Net asset value - End of period | | $10.73 | | $10.62 | | $9.82 | | $10.43 | | $10.46 | | $10.52 |
| | | | | | | | | | | | |
Net assets - End of period
(000’s omitted) | | $31,021 | | $24,875 | | $20,844 | | $26,432 | | $20,612 | | $15,988 |
| | | | | | | | | | | | |
Total return3 | | 2.36% | | 13.09% | | (1.74%) | | 3.28% | | 3.19% | | 2.85% |
Ratios (to average net assets)/
Supplemental Data: | | | | | | | | | | | | |
Expenses* | | 0.85%4 | | 0.85% | | 0.85% | | 0.85% | | 0.85% | | 0.85% |
Net investment income | | 3.27%4 | | 3.39% | | 3.58% | | 3.47% | | 3.81% | | 3.65% |
Portfolio turnover | | 0%5 | | 11% | | 15% | | 3% | | 9% | | 9% |
* The investment advisor did not impose all or a portion of its management fees, CCO fees, fund accounting and transfer agent fees, and other fees in some periods and in some periods paid a portion of the Series’ expenses. If these expenses had been incurred by the Series, the expense ratio (to average net assets) would have been increased by the following amounts: |
| | 0.02%4 | | 0.03% | | 0.01% | | 0.00%6 | | 0.07% | | 0.15% |
1Calculated based on average shares outstanding during the periods.
2Less than $0.01 per share.
3Represents aggregate total return for the periods indicated, and assumes reinvestment of all distributions. Total return would have been lower had certain expenses not been waived or reimbursed during the periods. Periods less than one year are not annualized.
4 Annualized.
5 Less than 1%.
6 Less than 0.01%.
| | | | |
| | The accompanying notes are an integral part of the financial statements. | | 11 |
Notes to Financial Statements (unaudited)
Ohio Tax Exempt Series (the “Series”) is a no-load diversified series of Manning & Napier Fund, Inc. (the “Fund”).
The Fund is organized in Maryland and is registered under the Investment Company Act of 1940, as amended, as an open-end management investment company.
The Series’ investment objective is to provide as high a level of current income exempt from federal income tax and Ohio State personal income tax as the Advisor believes is consistent with the preservation of capital.
The Fund’s Advisor is Manning & Napier Advisors, Inc. (the “Advisor”). Shares of the Series are offered to investors, clients and employees of the Advisor and its affiliates. The total authorized capital stock of the Fund consists of 10.0 billion shares of common stock each having a par value of $0.01. As of June 30, 2010, 6.2 billion shares have been designated in total among 29 series, of which 100 million have been designated as Ohio Tax Exempt Series Class A common stock.
| 2. | SIGNIFICANT ACCOUNTING POLICIES |
Security Valuation
Municipal securities will normally be valued on the basis of market valuations provided by an independent pricing service (the “Service”). The Service utilizes the latest price quotations and a matrix system (which considers such factors as security prices of similar securities, yields, maturities and ratings). The Service has been approved by the Fund’s Board of Directors (the “Board”).
Short-term investments that mature in sixty days or less are valued at amortized cost, which approximates market value. Investments in open-end investment companies are valued at their net asset value per share on valuation date.
Volume and level of activity in established markets for an asset or liability are evaluated to determine whether recent transactions and quoted prices are determinative of fair value. Where there have been significant decreases in volume and level of activity, further analysis and adjustment may be necessary to estimate fair value. The Series measures fair value in these instances by the use of inputs and valuation techniques which may be based upon current market prices of securities that are comparable in coupon, rating, maturity and industry and/or expectation of future cash flows. As a result of trading in relatively thin markets and/or markets that experience significant volatility, the prices used by the Series to value these securities may differ from the value that would be realized if these securities were sold, and the differences could be material.
Securities for which representative valuations or prices are not available from the Fund’s pricing service may be valued at fair value. Due to the inherent uncertainty of valuations of such securities, the fair value may differ significantly from the values that would have been used had a ready market for such securities existed. If trading or events occurring after the close of the principal market in which securities are traded are expected to materially affect the value of those securities, then they may be valued at their fair value, taking this trading or these events into account. Fair value is determined in good faith by the Advisor under procedures approved by and under the general supervision and responsibility of the Board.
Various inputs are used in determining the value of the Series’ assets or liabilities carried at market value. These inputs are summarized in three broad levels. Level 1 includes quoted prices in active markets for identical assets and liabilities. Level 2 includes other significant observable inputs (including quoted prices for similar securities, interest rates, prepayment speeds, credit risk, etc.). Level 3 includes significant unobservable inputs (including the Series’ own assumptions in determining the fair value of investments). The inputs or methodology used for valuing securities are not necessarily an indication of the risk associated with investing in those securities.
12
Notes to Financial Statements (unaudited)
| 2. | SIGNIFICANT ACCOUNTING POLICIES (continued) |
Security Valuation (continued)
The following is a summary of the valuation levels used for major security types as of June 30, 2010 in valuing the Series’ assets or liabilities carried at market value:
| | | | | | | | | | | | |
| Description | | 6/30/10 | | Level 1 | | Level 2 | | Level 3 |
Equity securities* | | $ | — | | $ | — | | $ | — | | $ | — |
Preferred securities | | | — | | | — | | | — | | | — |
Debt securities: | | | | | | | | | | | | |
States and political subdivisions (municipals) | | | 30,110,143 | | | — | | | 30,110,143 | | | — |
Mutual funds | | | 798,631 | | | 798,631 | | | — | | | — |
Other financialinstruments** | | | — | | | — | | | — | | | — |
| | | | | | | | | | | | |
Total | | $ | 30,908,774 | | $ | 798,631 | | $ | 30,110,143 | | $ | — |
| | | | | | | | | | | | |
*Includes common stock, warrants and rights. Please see the Investment Portfolio for industry classification.
**Other financial instruments are derivative instruments not reflected in the Investment Portfolio, such as futures, forwards and swap contracts, which are valued at the unrealized appreciation/depreciation on the instrument. As of June 30, 2010, the Series did not hold any derivative instruments.
There were no Level 3 securities held by the Series as of December 31, 2009 or June 30, 2010.
The Fund’s policy is to recognize transfers in and transfers out of the valuation levels as of the end of the reporting period. There were no significant transfers between Level 1 and Level 2 as of June 30, 2010.
Additional disclosure surrounding the activity in Level 3 fair value measurement will also be effective for fiscal years beginning after December 15, 2010. Management has concluded that this will not have a material impact on the Series’ financial statements.
Security Transactions, Investment Income and Expenses
Security transactions are accounted for on trade date. Dividend income is recorded on the ex-dividend date, except that if the ex-dividend date has passed, certain dividends from foreign securities are recorded as soon as the Fund is informed of the ex-dividend date. Non-cash dividends, if any, are recorded at the fair market value of the securities received. Interest income, including amortization of premium and accretion of discounts using the effective interest method, is earned from settlement date and accrued daily.
Expenses are recorded on an accrual basis. Most expenses of the Fund can be attributed to a specific series. Expenses which cannot be directly attributed are apportioned among the series in the Fund in such a manner as deemed equitable by the Fund’s Board, taking into consideration, among other things, the nature and type of expense.
The Series uses the identified cost method for determining realized gain or loss on investments for both financial statement and federal income tax reporting purposes.
Federal Taxes
The Series’ policy is to comply with the provisions of the Internal Revenue Code applicable to regulated investment companies. The Series is not subject to federal income tax or excise tax to the extent that the Series distributes to shareholders each year its taxable income, including any net realized gains on investments, in accordance with
13
Notes to Financial Statements (unaudited)
| 2. | SIGNIFICANT ACCOUNTING POLICIES (continued) |
Federal Taxes (continued)
requirements of the Internal Revenue Code. Accordingly, no provision for federal income tax or excise tax has been made in the financial statements.
Management evaluates its tax positions to determine if the tax positions taken meet the minimum recognition threshold in connection with accounting for uncertainties in income tax positions taken or expected to be taken for the purposes of measuring and recognizing tax liabilities in the financial statements. Recognition of tax benefits of an uncertain tax position is required only when the position is “more likely than not” to be sustained assuming examination by taxing authorities. At June 30, 2010, the Series has recorded no liability for net unrecognized tax benefits relating to uncertain income tax positions taken or expected to be taken in future tax returns.
The Series files income tax returns in the U.S. federal jurisdiction and various states, as required. No income tax returns are currently under investigation. The statute of limitations on the Series’ tax returns remains open for the years ended December 31, 2006 through December 31, 2009. The Fund is not aware of any tax positions for which it is reasonably possible that the total amounts of unrecognized tax benefits will significantly change in the next twelve months.
Distributions of Income and Gains
Distributions to shareholders of net investment income are made quarterly. Distributions of net realized gains are made annually. An additional distribution may be necessary to avoid taxation of the Series. Distributions are recorded on the ex-dividend date.
Indemnifications
The Fund’s organizational documents provide former and current directors and officers with a limited indemnification against liabilities arising in connection with the performance of their duties to the Fund. In the normal course of business, the Fund may also enter into contracts that provide general indemnifications. The Fund’s maximum exposure under these arrangements is unknown as this would be dependent on future claims that may be made against the Fund. The risk of material loss from such claims is considered remote.
Other
The preparation of financial statements in conformity with accounting principles generally accepted in the United States of America requires management to make estimates and assumptions that affect the reported amounts of assets and liabilities and the disclosure of contingent assets and liabilities at the date of the financial statements and the reported amounts of income and expenses during the reporting period. Actual results could differ from those estimates.
| 3. | TRANSACTIONS WITH AFFILIATES |
The Fund has an Investment Advisory Agreement (the “Agreement”) with the Advisor, for which the Series pays a fee, computed daily and payable monthly, at an annual rate of 0.50% of the Series’ average daily net assets.
Under the Agreement, personnel of the Advisor provide the Series with advice and assistance in the choice of investments and the execution of securities transactions, and otherwise maintain the Series’ organization. The Advisor also provides the Fund with necessary office space and fund administration and support services. The salaries of all officers of the Fund (except a percentage of the Fund’s Chief Compliance Officer’s salary, which is paid by the Fund), and of all Directors who are “affiliated persons” of the Fund, or of the Advisor, and all personnel of the Fund, or of the Advisor, performing services relating to research, statistical and investment activities, are paid by the Advisor. Each “non-affiliated” Director receives an annual stipend, which is allocated among all the active series of the Fund. In addition, these Directors also receive a fee per Board meeting attended for each active series of the Fund plus a fee for each committee meeting attended.
14
Notes to Financial Statements (unaudited)
| 3. | TRANSACTIONS WITH AFFILIATES (continued) |
The Advisor has contractually agreed, until at least April 30, 2011, to waive its fee and, if necessary, pay other operating expenses of the Series in order to maintain total direct annual fund operating expenses for the Series at no more than 0.85% of average daily net assets each year. Accordingly, the Advisor waived fees of $2,121 for the six months ended June 30, 2010, which is reflected as a reduction of expenses on the Statement of Operations. For the six months ended June 30, 2010, the Advisor voluntarily waived additional fees of $758, which is also included as a reduction of expenses in the Statement of Operations. The Advisor is not eligible to recoup any expenses that have been waived or reimbursed in prior years.
Manning & Napier Investor Services, Inc., a registered broker-dealer affiliate of the Advisor, acts as distributor for the Fund’s shares. The services of Manning & Napier Investor Services, Inc. are provided at no additional cost to the Series.
The Advisor has entered into agreements with PNC Global Investment Servicing (U.S.) Inc. (“PNCGIS”) under which PNCGIS serves as sub-accountant services agent and sub-transfer agent. The Fund pays the Advisor an annual fee of 0.0175% on the first $3 billion of average daily net assets (excluding Target Series); 0.015% on the next $3 billion of average daily net assets (excluding Target Series); and 0.01% of the average daily net assets in excess of $6 billion (excluding Target Series); plus a base fee of $25,500 per Series. Additionally, certain transaction-, account-, and cusip-based fees and out-of-pocket expenses, including charges for reporting relating to the Fund’s compliance program, are charged.
On July 1, 2010, The PNC Financial Services Group, Inc. sold the outstanding stock of PNC Global Investment Servicing Inc. to The Bank of New York Mellon Corporation. At the closing of the sale, PNCGIS changed its name to BNY Mellon Investment Servicing (US) Inc.
| 4. | PURCHASES AND SALES OF SECURITIES |
For the six months ended June 30, 2010, purchases and sales of securities, other than U.S. Government securities and short-term securities, were $6,133,533 and $5,000, respectively. There were no purchases or sales of U.S. Government securities.
| 5. | CAPITAL STOCK TRANSACTIONS |
Transactions in shares of Ohio Tax Exempt Series were:
| | | | | | | | | | | | | | |
| | | For the Six Months
Ended 6/30/10 | | | For the Year
Ended 12/31/09 | |
| | | Shares | | | Amount | | | Shares | | | Amount | |
Sold | | 623,705 | | | $ | 6,680,473 | | | 673,194 | | | $ | 7,080,565 | |
Reinvested | | 33,184 | | | | 354,689 | | | 91,022 | | | | 955,397 | |
Repurchased | | (109,108 | ) | | | (1,168,487 | ) | | (543,835 | ) | | | (5,675,967 | ) |
| | | | | | | | | | | | | | |
Total | | 547,781 | | | $ | 5,866,675 | | | 220,381 | | | | 2,359,995 | |
| | | | | | | | | | | | | | |
Substantially all of the Series’ shares represent investments by fiduciary accounts over which the Advisor has sole investment discretion.
The Series may trade in instruments including written and purchased options, forward foreign currency exchange contracts and futures contracts and other derivatives in the normal course of investing activities to assist in managing exposure to various market risks. The Series may be subject to various elements of risk and may involve, to a
15
Notes to Financial Statements (unaudited)
| 6. | FINANCIAL INSTRUMENTS (continued) |
varying degree, elements of risk in excess of the amounts recognized for financial statement purposes. These risks include: the risk that changes in the value of a derivative may not correlate perfectly with the underlying asset, rate or index, counterparty credit risk related to over the counter derivatives counterparties’ failure to perform under contract terms, liquidity risk related to the lack of a liquid market for these contracts allowing the fund to close out its position(s) and documentation risk relating to disagreement over contract terms. No such investments were held by the Series during the six months ended June 30, 2010.
| 7. | CONCENTRATION OF CREDIT |
The Series primarily invests in debt obligations issued by the State of Ohio and its political subdivisions, agencies and public authorities to obtain funds for various public purposes. The Series is more susceptible to factors adversely affecting issues of Ohio municipal securities than is a municipal bond fund that is not concentrated in these issues to the same extent.
| 8. | FEDERAL INCOME TAX INFORMATION |
The amount and characterization of certain income and capital gains to be distributed are determined in accordance with federal income tax regulations, which may differ from accounting principles generally accepted in the United States of America. The Series may periodically make reclassifications among its capital accounts to reflect income and gains available for distribution (or available capital loss carryovers) under income tax regulations without impacting the Series’ net asset value. Any such reclassifications are not reflected in the financial highlights.
The final determination of the tax character of current year distributions will be made at the conclusion of the fiscal year. The tax character of distributions paid for the year ended December 31, 2009 were as follows:
| | | |
Tax exempt income | | $ | 774,419 |
Long-term capital gains | | | 221,587 |
At June 30, 2010, the identified cost of investments for federal income tax purposes, the resulting gross unrealized appreciation and depreciation, and the net unrealized appreciation were as follows:
| | | | |
Cost for federal income tax purposes | | $ | 30,252,255 | |
Unrealized appreciation | | $ | 742,621 | |
Unrealized depreciation | | | (86,102 | ) |
| | | | |
Net unrealized appreciation | | $ | 656,519 | |
| | | | |
There were no subsequent events that require recognition or disclosure. In preparing these financial statements, management of the Fund has evaluated events and transactions for potential recognition or disclosure through the date the financial statements were issued.
16
This Page Intentionally Left Blank
17
Literature Requests (unaudited)
Proxy Voting Policies and Procedures
A description of the policies and procedures that the Fund uses to determine how to vote proxies relating to portfolio securities is available, without charge, upon request:
| | |
By phone | | 1-800-466-3863 |
On the Securities and Exchange | | |
Commission’s (SEC) web site | | http://www.sec.gov |
Proxy Voting Record
Information regarding how the Fund voted proxies relating to portfolio securities during the most recent 12-month period ended June 30th is available, without charge, upon request:
| | |
By phone | | 1-800-466-3863 |
On the SEC’s web site | | http://www.sec.gov |
Quarterly Portfolio Holdings
The Series’ complete schedule of portfolio holdings for the 1st and 3rd quarters of each fiscal year are provided on Form N-Q, and are available, without charge, upon request:
| | |
By phone | | 1-800-466-3863 |
On the SEC’s web site | | http://www.sec.gov |
The Series’ Form N-Q may be reviewed and copied at the SEC’s Public Reference Room in Washington, D.C. Information on the operation of the Public Reference Room may be obtained by calling 1-800-SEC-0330.
Prospectus and Statement of Additional Information (SAI)
The prospectus and SAI provide additional information about each Series, including charges, expenses and risks. These documents are available, without charge, upon request:
| | |
By phone | | 1-800-466-3863 |
On the SEC’s web site | | http://www.sec.gov |
On the Advisor’s web site | | http://www.manningnapieradvisors.com |
Additional information available at www.manningnapieradvisors.com
1. Fund Holdings - Month-End
2. Fund Holdings - Quarter-End
3. Shareholder Report - Annual
4. Shareholder Report - Semi-Annual
MNOHTES-06/10-SAR

Shareholder Expense Example (unaudited)
As a shareholder of the Series, you may incur two types of costs: (1) transaction costs and (2) ongoing costs, including management fees and other Series expenses. This example is intended to help you understand your ongoing costs (in dollars) of investing in the Series and to compare these costs with the ongoing costs of investing in other mutual funds.
The example is based on an investment of $1,000 invested at the beginning of the period and held for the entire period (January 1, 2010 to June 30, 2010).
Actual Expenses
The first line of the table below provides information about actual account values and actual expenses. You may use the information in this line, together with the amount you invested, to estimate the expenses that you paid over the period. Simply divide your account value by $1,000 (for example, an $8,600 account value divided by $1,000 = 8.6), then multiply the result by the number in the first line under the heading entitled “Expenses Paid During Period” to estimate the expenses you paid on your account during this period.
Hypothetical Example for Comparison Purposes
The second line of the table below provides information about hypothetical account values and hypothetical expenses based on the Series’ actual expense ratio and an assumed rate of return of 5% per year before expenses, which is not the Series’ actual return. The hypothetical account values and expenses may not be used to estimate the actual ending account balance or expenses you paid during the period. You may use this information to compare the ongoing costs of investing in the Series and other funds. To do so, compare this 5% hypothetical example with the 5% hypothetical examples that appear in the shareholder reports of the other funds.
Please note that the expenses shown in the table are meant to highlight your ongoing costs only and do not reflect any transaction costs. Therefore, the second line of the table is useful in comparing ongoing costs only, and will not help you determine the relative total costs of owning different funds. In addition, if these transaction costs were included, your costs would have been higher.
| | | | | | |
| | | Beginning
Account Value
1/1/10 | | Ending
Account Value
6/30/10 | | Expenses Paid
During Period*
1/1/10-6/30/10 |
Actual | | $1,000.00 | | $1,026.10 | | $2.91 |
Hypothetical
(5% return before expenses) | | $1,000.00 | | $1,021.92 | | $2.91 |
*Expenses are equal to the Series’ annualized expense ratio (for the six-month period) of 0.58%, multiplied by the average account value over the period, multiplied by 181/365 (to reflect the one-half year period). Expenses are based on the most recent fiscal half year. The Series’ total return would have been lower had certain expenses not been waived during the period.
Portfolio Composition as of June 30, 2010 (unaudited)
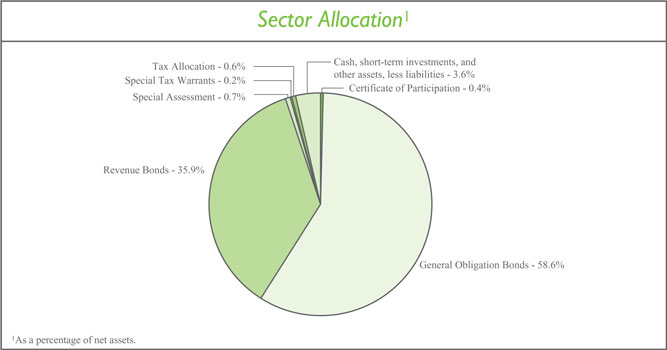
| | |
Credit Quality Ratings2,3 |
Aaa | | 20.8% |
Aa | | 57.1% |
A | | 12.9% |
Baa | | 4.4% |
Unrated investments | | 1.2% |
Cash, short-term investments, and other
assets, less liabilities | | 3.6% |
| |
| 2 As a percentage of net assets. |
3 Based on ratings from Moody’s, or the S&P equivalent. The Series may use different ratings provided by other rating agencies for purposes of determining compliance with the Series’ investment policies. |
| | |
Top Ten States4 |
Texas | | 5.2% |
Florida | | 5.2% |
South Carolina | | 5.0% |
Washington | | 4.9% |
New York | | 4.5% |
Indiana | | 4.3% |
Massachusetts | | 4.0% |
Michigan | | 3.6% |
Ohio | | 3.3% |
Kansas | | 3.2% |
| | | |
4 As a percentage of total investments. | | |
Investment Portfolio - June 30, 2010 (unaudited)
| | | | | | | | | | | | | | | | |
| | | Coupon
Rate | | | Maturity
Date | | Credit
Rating 1
(unaudited) | | | Principal
Amount | | Value
(Note 2) | | |
MUNICIPAL BONDS - 96.4% | | | | | | | | | | | | | | | | |
| | | | | | |
ALABAMA - 1.2% | | | | | | | | | | | | | | | | |
Alabama State, Series C, G.O. Bond | | 3.250 | % | | 6/1/2021 | | Aa1 | | | $ | 1,500,000 | | $ | 1,491,510 | | |
Fort Payne Waterworks Board, Revenue Bond, AMBAC | | 3.500 | % | | 7/1/2015 | | WR | 3 | | | 665,000 | | | 684,431 | | |
Hoover Board of Education, Special Tax Warrants, NATL | | 5.250 | % | | 2/15/2017 | | Aa2 | | | | 500,000 | | | 512,065 | | |
Odenville Utilities Board, Water, Revenue Bond, NATL | | 4.300 | % | | 8/1/2028 | | Baa1 | | | | 500,000 | | | 500,220 | | |
| | | | | | | | | | | | | | | | |
| | | | | | | | | | | | | | 3,188,226 | | |
| | | | | | | | | | | | | | | | |
| | | | | | |
ALASKA - 0.2% | | | | | | | | | | | | | | | | |
Alaska Municipal Bond Bank Authority, Series 1, Revenue Bond, NATL | | 4.100 | % | | 6/1/2017 | | Aa3 | | | | 455,000 | | | 474,083 | | |
| | | | | | | | | | | | | | | | |
| | | | | | |
ARIZONA - 2.7% | | | | | | | | | | | | | | | | |
Goodyear, G.O. Bond, NATL | | 4.375 | % | | 7/1/2020 | | Aa2 | | | | 680,000 | | | 717,536 | | |
Mesa, G.O. Bond, FGRNA | | 4.125 | % | | 7/1/2027 | | Aa2 | | | | 2,215,000 | | | 2,194,954 | | |
Phoenix, Series B, G.O. Bond | | 4.200 | % | | 7/1/2021 | | Aa1 | | | | 1,500,000 | | | 1,572,720 | | |
Salt River Project Agricultural Impt. & Power District, Series A, Revenue Bond | | 5.000 | % | | 1/1/2035 | | Aa1 | | | | 1,700,000 | | | 1,756,083 | | |
Yuma County Library District, Series A, G.O. Bond, AMBAC | | 4.500 | % | | 7/1/2035 | | Aa3 | | | | 1,200,000 | | | 1,147,908 | | |
| | | | | | | | | | | | | | | | |
| | | | | | | | | | | | | | 7,389,201 | | |
| | | | | | | | | | | | | | | | |
| | | | | | |
ARKANSAS - 0.9% | | | | | | | | | | | | | | | | |
Arkansas State, Water Utility Impt., Series A, G.O. Bond | | 4.500 | % | | 7/1/2044 | | Aa1 | | | | 1,000,000 | | | 1,012,060 | | |
Bentonville School District No. 6, Series A, G.O. Bond | | 4.500 | % | | 6/1/2040 | | Aa2 | | | | 1,000,000 | | | 983,800 | | |
Hot Springs, Public Impt., Revenue Bond, AGC. | | 4.625 | % | | 12/1/2037 | | AAA | 2 | | | 500,000 | | | 506,270 | | |
| | | | | | | | | | | | | | | | |
| | | | | | | | | | | | | | 2,502,130 | | |
| | | | | | | | | | | | | | | | |
| | | | | | |
CALIFORNIA - 3.2% | | | | | | | | | | | | | | | | |
California State, G.O. Bond | | 5.250 | % | | 2/1/2023 | | A1 | | | | 500,000 | | | 539,565 | | |
California State, G.O. Bond | | 4.750 | % | | 12/1/2028 | | A1 | | | | 795,000 | | | 761,069 | | |
California State, Various Purposes, G.O. Bond, AMBAC | | 4.250 | % | | 12/1/2035 | | A1 | | | | 1,140,000 | | | 947,465 | | |
Campbell Union School District, G.O. Bond, AGM | | 4.375 | % | | 8/1/2027 | | Aa2 | | | | 1,810,000 | | | 1,783,158 | | |
| | | | |
| 3 | | The accompanying notes are an integral part of the financial statements. | | |
Investment Portfolio - June 30, 2010 (unaudited)
| | | | | | | | | | | | | | | | |
| | | Coupon
Rate | | | Maturity
Date | | Credit
Rating 1
(unaudited) | | | Principal
Amount | | Value
(Note 2) | | |
MUNICIPAL BONDS (continued) | | | | | | | | | | | | | | | | |
| | | | | | |
CALIFORNIA (continued) | | | | | | | | | | | | | | | | |
Chula Vista Elementary School District, Series F, G.O. Bond, NATL | | 4.800 | % | | 8/1/2024 | | Baa1 | | | $ | 435,000 | | $ | 441,068 | | |
Chula Vista Elementary School District, Series F, G.O. Bond, NATL | | 4.875 | % | | 8/1/2025 | | Baa1 | | | | 425,000 | | | 430,712 | | |
Los Angeles Unified School District, Series B, G.O. Bond, AMBAC | | 4.500 | % | | 7/1/2027 | | Aa2 | | | | 840,000 | | | 812,834 | | |
Oak Valley Hospital District, G.O. Bond, FGRNA | | 4.500 | % | | 7/1/2025 | | A1 | | | | 1,395,000 | | | 1,299,652 | | |
Richmond Joint Powers Financing Authority, Series A, Tax Allocation, NATL | | 5.250 | % | | 9/1/2025 | | Baa1 | | | | 1,570,000 | | | 1,573,062 | | |
| | | | | | | | | | | | | | | | |
| | | | | | | | | | | | | | 8,588,585 | | |
| | | | | | | | | | | | | | | | |
COLORADO - 0.9% | | | | | | | | | | | | | | | | |
Colorado Water Resources & Power Development Authority, Water Resource, Series D, Revenue Bond, AGM | | 4.375 | % | | 8/1/2035 | | Aa2 | | | | 1,420,000 | | | 1,387,155 | | |
Commerce City, Certificate of Participation, AMBAC | | 4.750 | % | | 12/15/2032 | | A | 2 | | | 1,000,000 | | | 967,780 | | |
| | | | | | | | | | | | | | | | |
| | | | | | | | | | | | | | 2,354,935 | | |
| | | | | | | | | | | | | | | | |
CONNECTICUT - 0.6% | | | | | | | | | | | | | | | | |
Stamford, G.O. Bond | | 4.400 | % | | 2/15/2026 | | Aa1 | | | | 1,545,000 | | | 1,577,507 | | |
| | | | | | | | | | | | | | | | |
| | | | | | |
DELAWARE - 1.1% | | | | | | | | | | | | | | | | |
New Castle County, Series A, G.O. Bond | | 4.250 | % | | 7/15/2025 | | Aaa | | | | 1,500,000 | | | 1,549,455 | | |
New Castle County, Series A, G.O. Bond | | 4.250 | % | | 7/15/2026 | | Aaa | | | | 1,265,000 | | | 1,300,230 | | |
| | | | | | | | | | | | | | | | |
| | | | | | | | | | | | | | 2,849,685 | | |
| | | | | | | | | | | | | | | | |
DISTRICT OF COLUMBIA - 0.9% | | | | | | | | | | | | | | | | |
District of Columbia, Series A, G.O. Bond, FGRNA | | 4.750 | % | | 6/1/2033 | | Aa2 | | | | 2,500,000 | | | 2,516,025 | | |
| | | | | | | | | | | | | | | | |
| | | | | | |
FLORIDA - 5.2% | | | | | | | | | | | | | | | | |
Cape Coral, Water Utility Impt., Special | | | | | | | | | | | | | | | | |
Assessment, NATL | | 4.500 | % | | 7/1/2021 | | A2 | | | | 1,855,000 | | | 1,874,440 | | |
Florida State Board of Education, Capital Outlay, Public Education, Series A, G.O. Bond, AGM | | 4.500 | % | | 6/1/2025 | | Aa1 | | | | 1,280,000 | | | 1,303,706 | | |
| | | | |
| | The accompanying notes are an integral part of the financial statements. | | 4 |
Investment Portfolio - June 30, 2010 (unaudited)
| | | | | | | | | | | | | | | | |
| | | Coupon
Rate | | | Maturity
Date | | Credit
Rating 1
(unaudited) | | | Principal
Amount | | Value
(Note 2) | | |
MUNICIPAL BONDS (continued) | | | | | | | | | | | | | | | | |
| | | | | | |
FLORIDA (continued) | | | | | | | | | | | | | | | | |
Florida State Board of Education, Capital Outlay, Public Education, Series D, G.O. Bond | | 5.000 | % | | 6/1/2016 | | Aa1 | | | $ | 2,000,000 | | $ | 2,268,960 | | |
Florida State Department of Transportation, G.O. Bond | | 5.000 | % | | 7/1/2027 | | Aa1 | | | | 1,000,000 | | | 1,051,420 | | |
Fort Lauderdale, Water Utility Impt., Revenue Bond | | 4.500 | % | | 9/1/2038 | | Aa1 | | | | 1,000,000 | | | 971,930 | | |
Miami-Dade County, Water & Sewer Systems, Revenue Bond, AGM | | 5.000 | % | | 10/1/2039 | | Aa2 | | | | 1,500,000 | | | 1,548,510 | | |
Palm Beach County, FPL Reclaimed Water Project, Revenue Bond | | 5.000 | % | | 10/1/2040 | | Aaa | | | | 1,020,000 | | | 1,062,106 | | |
Panama City Beach, Water Utility Impt., Revenue Bond, AGC | | 5.000 | % | | 6/1/2039 | | AAA | 2 | | | 1,000,000 | | | 1,022,350 | | |
Tampa Bay Water Utility System, Revenue Bond | | 5.000 | % | | 10/1/2038 | | Aa2 | | | | 1,000,000 | | | 1,038,980 | | |
Tohopekaliga Water Authority, Utility System, Series A, Revenue Bond, AGM | | 5.000 | % | | 10/1/2028 | | Aa2 | | | | 510,000 | | | 523,658 | | |
Winter Park, Electric Impt., Series A, Revenue Bond, AGM | | 5.000 | % | | 10/1/2029 | | Aa3 | | | | 1,000,000 | | | 1,032,080 | | |
Winter Park, Impt., Revenue Bond | | 5.000 | % | | 12/1/2034 | | Aa2 | | | | 250,000 | | | 256,602 | | |
| | | | | | | | | | | | | | | | |
| | | | | | | | | | | | | | 13,954,742 | | |
| | | | | | | | | | | | | | | | |
GEORGIA - 2.5% | | | | | | | | | | | | | | | | |
Atlanta, Prerefunded Balance, G.O. Bond | | 5.600 | % | | 12/1/2018 | | Aa2 | | | | 350,000 | | | 354,910 | | |
Atlanta, Water & Wastewater, Revenue Bond, AGM | | 5.000 | % | | 11/1/2043 | | Aa3 | | | | 1,500,000 | | | 1,490,265 | | |
Atlanta, Water & Wastewater, Series A, Revenue Bond, NATL | | 5.000 | % | | 11/1/2033 | | A1 | | | | 310,000 | | | 305,778 | | |
DeKalb County, Special Transportation Parks & Greenspace, G.O. Bond | | 4.375 | % | | 12/1/2030 | | Aa1 | | | | 1,000,000 | | | 1,017,590 | | |
Fulton County, Water Utility Impt., Revenue Bond, FGRNA | | 5.000 | % | | 1/1/2035 | | Aa2 | | | | 1,000,000 | | | 1,017,330 | | |
Georgia State, Series B, G.O. Bond | | 5.650 | % | | 3/1/2012 | | Aaa | | | | 5,000 | | | 5,435 | | |
Georgia State, Series B, G.O. Bond | | 4.000 | % | | 3/1/2022 | | Aaa | | | | 1,270,000 | | | 1,306,513 | | |
Georgia State, Unrefunded Balance, Series B, G.O. Bond | | 5.650 | % | | 3/1/2012 | | Aaa | | | | 195,000 | | | 211,799 | | |
Madison, Water & Sewer, Revenue Bond, AMBAC | | 4.625 | % | | 7/1/2030 | | WR | 3 | | | 1,000,000 | | | 953,530 | | |
| | | | | | | | | | | | | | | | |
| | | | | | | | | | | | | | 6,663,150 | | |
| | | | | | | | | | | | | | | | |
| | | | |
| 5 | | The accompanying notes are an integral part of the financial statements. | | |
Investment Portfolio - June 30, 2010 (unaudited)
| | | | | | | | | | | | | | | | |
| | | Coupon
Rate | | | Maturity
Date | | Credit
Rating 1
(unaudited) | | | Principal
Amount | | Value
(Note 2) | | |
MUNICIPAL BONDS (continued) | | | | | | | | | | | | | | | | |
| | | | | | |
ILLINOIS - 2.7% | | | | | | | | | | | | | | | | |
Chicago, Series A, G.O. Bond, AGM | | 4.750 | % | | 1/1/2038 | | Aa2 | | | $ | 1,500,000 | | $ | 1,475,115 | | |
Chicago, Unrefunded Balance, Series A, G.O. Bond, NATL | | 5.000 | % | | 1/1/2034 | | Aa2 | | | | 520,000 | | | 524,618 | | |
Cook County, Series A, G.O. Bond, FGRNA | | 5.000 | % | | 11/15/2022 | | Aa2 | | | | 265,000 | | | 267,266 | | |
Illinois State, G.O. Bond | | 5.000 | % | | 12/1/2027 | | A1 | | | | 600,000 | | | 600,924 | | |
Illinois State, G.O. Bond, NATL | | 5.250 | % | | 10/1/2018 | | A1 | | | | 2,000,000 | | | 2,118,860 | | |
Illinois State, Series 1995 A, Certificate of Participation, NATL | | 5.600 | % | | 7/1/2010 | | Baa1 | | | | 100,000 | | | 100,012 | | |
Springfield Metropolitan Sanitation District, Series A, G.O. Bond | | 4.750 | % | | 1/1/2034 | | AA | 2 | | | 1,115,000 | | | 1,129,004 | | |
Springfield, Electric Power & Light, Revenue Bond, NATL | | 5.000 | % | | 3/1/2035 | | Aa3 | | | | 1,000,000 | | | 1,015,710 | | |
| | | | | | | | | | | | | | | | |
| | | | | | | | | | | | | | 7,231,509 | | |
| | | | | | | | | | | | | | | | |
INDIANA - 4.3% | | | | | | | | | | | | | | | | |
Avon Community School Building Corp., Revenue Bond, AMBAC | | 4.250 | % | | 7/15/2018 | | A | 2 | | | 1,450,000 | | | 1,540,118 | | |
Avon Community School Building Corp., Revenue Bond, AMBAC | | 4.750 | % | | 1/15/2032 | | A | 2 | | | 1,015,000 | | | 1,001,501 | | |
Frankfort High School Elementary School Building Corp., Revenue Bond, AGM | | 4.750 | % | | 7/15/2025 | | Aa3 | | | | 1,500,000 | | | 1,563,915 | | |
Indiana Municipal Power Agency, Series A, Revenue Bond, NATL | | 5.000 | % | | 1/1/2042 | | A1 | | | | 1,000,000 | | | 1,007,720 | | |
Indianapolis Local Public Impt. Bond Bank, Waterworks Project, Series A, Revenue Bond, AGC | | 5.500 | % | | 1/1/2038 | | Aa3 | | | | 1,000,000 | | | 1,081,750 | | |
La Porte County, G.O. Bond, FGRNA | | 5.200 | % | | 1/15/2018 | | A1 | | | | 300,000 | | | 311,853 | | |
Noblesville, Sewage Works, Revenue Bond, AMBAC | | 5.000 | % | | 1/1/2024 | | Aa2 | | | | 550,000 | | | 557,337 | | |
North Lawrence Community Schools Building Corp., Revenue Bond, AGM | | 5.000 | % | | 7/15/2020 | | Aa3 | | | | 450,000 | | | 476,572 | | |
Plainfield, Series A, Revenue Bond | | 4.650 | % | | 1/1/2027 | | A | 2 | | | 645,000 | | | 643,529 | | |
Shelbyville Central Renovation School Building Corp., Revenue Bond, NATL | | 5.000 | % | | 7/15/2018 | | Baa1 | | | | 3,000,000 | | | 3,303,840 | | |
| | | | | | | | | | | | | | | | |
| | | | | | | | | | | | | | 11,488,135 | | |
| | | | | | | | | | | | | | | | |
IOWA - 2.0% | | | | | | | | | | | | | | | | |
Cedar Rapids, Public Impt., Series A, G.O. Bond | | 4.000 | % | | 6/1/2030 | | Aaa | | | | 440,000 | | | 431,688 | | |
| | | | |
| | The accompanying notes are an integral part of the financial statements. | | 6 |
Investment Portfolio - June 30, 2010 (unaudited)
| | | | | | | | | | | | | | | | |
| | | Coupon
Rate | | | Maturity
Date | | Credit
Rating 1
(unaudited) | | | Principal
Amount | | Value
(Note 2) | | |
MUNICIPAL BONDS (continued) | | | | | | | | | | | | | | | | |
| | | | | | |
IOWA (continued) | | | | | | | | | | | | | | | | |
Indianola Community School District, G.O. Bond, FGRNA | | 5.200 | % | | 6/1/2021 | | A1 | | | $ | 425,000 | | $ | 454,593 | | |
Iowa City Community School District, G.O. Bond, AGM | | 4.000 | % | | 6/1/2018 | | Aaa | | | | 425,000 | | | 439,170 | | |
Linn-Mar Community School District, Revenue Bond | | 4.625 | % | | 7/1/2029 | | A2 | | | | 1,000,000 | | | 988,170 | | |
Polk County, Series C, G.O. Bond | | 4.000 | % | | 6/1/2017 | | Aaa | | | | 995,000 | | | 1,059,804 | | |
Polk County, Series C, G.O. Bond | | 4.125 | % | | 6/1/2025 | | Aaa | | | | 2,075,000 | | | 2,116,728 | | |
| | | | | | | | | | | | | | | | |
| | | | | | | | | | | | | | 5,490,153 | | |
| | | | | | | | | | | | | | | | |
KANSAS - 3.2% | | | | | | | | | | | | | | | | |
Johnson & Miami Counties Unified School District No. 230, G.O. Bond, FGRNA | | 4.000 | % | | 9/1/2022 | | Aa3 | | | | 1,000,000 | | | 1,005,530 | | |
Johnson County Water District No. 1, Revenue Bond | | 3.250 | % | | 12/1/2030 | | Aaa | | | | 1,000,000 | | | 857,000 | | |
Miami County Unified School District No. 416 Louisburg, G.O. Bond, NATL | | 5.000 | % | | 9/1/2018 | | Baa1 | | | | 2,000,000 | | | 2,165,880 | | |
Scott County, G.O. Bond | | 4.750 | % | | 4/1/2040 | | A | 2 | | | 1,000,000 | | | 1,001,480 | | |
Sedgwick County Unified School District No. 265, G.O. Bond, AGM | | 5.000 | % | | 10/1/2025 | | Aa3 | | | | 1,090,000 | | | 1,132,477 | | |
Seward County, G.O. Bond, AGM | | 5.000 | % | | 8/1/2040 | | Aa3 | | | | 1,000,000 | | | 1,036,040 | | |
Shawnee County Unified School District No. 450, Shawnee Heights, G.O. Bond, AGM | | 4.200 | % | | 9/1/2020 | | Aa3 | | | | 700,000 | | | 728,336 | | |
Shawnee County Unified School District No. 450, Shawnee Heights, G.O. Bond, AGM | | 4.250 | % | | 9/1/2021 | | Aa3 | | | | 580,000 | | | 600,381 | | |
Wyandotte County Unified School District No. 204 Bonner Springs, Unrefunded Balance, Series A, G.O. Bond, AGM | | 5.375 | % | | 9/1/2015 | | Aa3 | | | | 110,000 | | | 110,800 | | |
| | | | | | | | | | | | | | | | |
| | | | | | | | | | | | | | 8,637,924 | | |
| | | | | | | | | | | | | | | | |
KENTUCKY - 1.0% | | | | | | | | | | | | | | | | |
Lexington-Fayette Urban County Government Public Facilities Corp., Revenue Bond, NATL. | | 4.000 | % | | 10/1/2018 | | Aa2 | | | | 1,655,000 | | | 1,728,184 | | |
Lexington-Fayette Urban County Government, Series A, Revenue Bond | | 3.625 | % | | 7/1/2020 | | Aa3 | | | | 1,000,000 | | | 1,034,400 | | |
| | | | | | | | | | | | | | | | |
| | | | | | | | | | | | | | 2,762,584 | | |
| | | | | | | | | | | | | | | | |
LOUISIANA - 0.9% | | | | | | | | | | | | | | | | |
Caddo Parish Parishwide School District, G.O. Bond, NATL | | 4.350 | % | | 3/1/2026 | | Aa2 | | | | 660,000 | | | 672,256 | | |
| | | | |
| 7 | | The accompanying notes are an integral part of the financial statements. | | |
Investment Portfolio - June 30, 2010 (unaudited)
| | | | | | | | | | | | | | | | |
| | | Coupon
Rate | | | Maturity
Date | | Credit
Rating 1
(unaudited) | | | Principal
Amount | | Value
(Note 2) | | |
MUNICIPAL BONDS (continued) | | | | | | | | | | | | | | | | |
| | | | | | |
LOUISIANA (continued) | | | | | | | | | | | | | | | | |
Caddo Parish Parishwide School District, G.O. Bond, NATL | | 4.375 | % | | 3/1/2027 | | Aa2 | | | $ | 1,090,000 | | $ | 1,107,898 | | |
New Orleans, Sewage Service, Revenue Bond, FGIC | | 5.250 | % | | 6/1/2012 | | A3 | | | | 300,000 | | | 300,129 | | |
Orleans Parish Parishwide School District, Series A, G.O. Bond, FGIC | | 5.125 | % | | 9/1/2016 | | WR | 3 | | | 400,000 | | | 400,192 | | |
| | | | | | | | | | | | | | | | |
| | | | | | | | | | | | | | 2,480,475 | | |
| | | | | | | | | | | | | | | | |
MARYLAND - 1.5% | | | | | | | | | | | | | | | | |
Anne Arundel County, Water & Sewer, G.O. Bond | | 4.125 | % | | 3/1/2024 | | Aa1 | | | | 345,000 | | | 356,830 | | |
Anne Arundel County, Water & Sewer, G.O. Bond | | 4.200 | % | | 3/1/2025 | | Aa1 | | | | 1,770,000 | | | 1,826,888 | | |
Baltimore County, Metropolitan District, G.O. Bond | | 4.250 | % | | 9/1/2029 | | Aaa | | | | 1,000,000 | | | 1,018,430 | | |
Maryland State, State and Local Facilities, G.O. Bond | | 4.250 | % | | 8/1/2021 | | Aaa | | | | 750,000 | | | 804,067 | | |
| | | | | | | | | | | | | | | | |
| | | | | | | | | | | | | | 4,006,215 | | |
| | | | | | | | | | | | | | | | |
MASSACHUSETTS - 4.0% | | | | | | | | | | | | | | | | |
Beverly, Municipal Purpose Loan, G.O. Bond | | 4.500 | % | | 1/15/2035 | | AA | 2 | | | 695,000 | | | 685,833 | | |
Boston Water & Sewer Commission, Series A, Revenue Bond | | 5.000 | % | | 11/1/2031 | | Aa1 | | | | 1,000,000 | | | 1,086,970 | | |
Boston, Series A, G.O. Bond, NATL | | 4.125 | % | | 1/1/2021 | | Aaa | | | | 1,000,000 | | | 1,035,790 | | |
Boston, Series A, G.O. Bond, NATL | | 4.125 | % | | 1/1/2022 | | Aaa | | | | 410,000 | | | 422,198 | | |
Cambridge, Series A, G.O. Bond | | 4.000 | % | | 2/1/2026 | | Aaa | | | | 850,000 | | | 868,760 | | |
Cambridge, Series A, G.O. Bond | | 4.000 | % | | 2/1/2027 | | Aaa | | | | 850,000 | | | 862,775 | | |
Lowell, State Qualified, G.O. Bond, AMBAC | | 5.000 | % | | 2/1/2020 | | Aa2 | | | | 500,000 | | | 530,835 | | |
Massachusetts State, Series C, G.O. Bond, AMBAC | | 5.750 | % | | 8/1/2010 | | Aa1 | | | | 400,000 | | | 401,888 | | |
Massachusetts State, Series C, G.O. Bond, AMBAC | | 5.500 | % | | 12/1/2023 | | Aa1 | | | | 1,000,000 | | | 1,216,410 | | |
Massachusetts State, Series D, G.O. Bond | | 5.250 | % | | 10/1/2014 | | Aa1 | | | | 1,000,000 | | | 1,155,030 | | |
Massachusetts Water Resources Authority, Series A, Revenue Bond, AGM | | 4.375 | % | | 8/1/2032 | | Aa1 | | | | 2,000,000 | | | 1,992,080 | | |
Plymouth, Prerefunded Balance, G.O. Bond, NATL | | 5.250 | % | | 10/15/2020 | | Aa1 | | | | 100,000 | | | 102,447 | | |
Richmond, G.O. Bond, NATL | | 5.000 | % | | 4/15/2021 | | Aa2 | | | | 400,000 | | | 407,328 | | |
| | | | | | | | | | | | | | | | |
| | | | | | | | | | | | | | 10,768,344 | | |
| | | | | | | | | | | | | | | | |
| | | | |
| | The accompanying notes are an integral part of the financial statements. | | 8 |
Investment Portfolio - June 30, 2010 (unaudited)
| | | | | | | | | | | | | | | | |
| | | Coupon
Rate | | | Maturity
Date | | Credit
Rating 1
(unaudited) | | | Principal
Amount | | Value
(Note 2) | | |
MUNICIPAL BONDS (continued) | | | | | | | | | | | | | | | | |
| | | | | | |
MICHIGAN - 3.6% | | | | | | | | | | | | | | | | |
Bendle Public School District, G.O. Bond, FGRNA | | 4.500 | % | | 5/1/2028 | | Aa2 | | | $ | 640,000 | | $ | 624,621 | | |
Detroit City School District, Series B, G.O. Bond, FGIC | | 5.000 | % | | 5/1/2033 | | Aa2 | | | | 750,000 | | | 715,575 | | |
Detroit Sewer Disposal System, Series B, Revenue Bond, FGRNA | | 4.625 | % | | 7/1/2034 | | A1 | | | | 1,500,000 | | | 1,369,080 | | |
Detroit Water Supply System, Revenue Bond, NATL | | 5.250 | % | | 7/1/2023 | | A1 | | | | 2,000,000 | | | 2,041,240 | | |
Grand Rapids Public Schools, G.O. Bond, NATL | | 4.125 | % | | 5/1/2023 | | Aa3 | | | | 1,200,000 | | | 1,204,068 | | |
Muskegon Public Schools, G.O. Bond, AGM | | 5.000 | % | | 5/1/2020 | | Aa2 | | | | 1,000,000 | | | 1,064,690 | | |
Saginaw City School District, G.O. Bond, AGM | | 4.500 | % | | 5/1/2031 | | Aa2 | | | | 1,695,000 | | | 1,643,591 | | |
Warren Woods Public Schools, School Building & Site, G.O. Bond, AGM | | 4.500 | % | | 5/1/2026 | | Aa2 | | | | 1,015,000 | | | 1,020,115 | | |
| | | | | | | | | | | | | | | | |
| | | | | | | | | | | | | | 9,682,980 | | |
| | | | | | | | | | | | | | | | |
MINNESOTA - 2.1% | | | | | | | | | | | | | | | | |
Brooklyn Center Independent School District No. 286, Series A, G.O. Bond, NATL | | 4.375 | % | | 2/1/2026 | | Aa2 | | | | 1,105,000 | | | 1,127,741 | | |
Hennepin County, Series A, G.O. Bond | | 4.500 | % | | 12/1/2025 | | Aaa | | | | 1,500,000 | | | 1,565,895 | | |
Minnesota State, G.O. Bond | | 5.000 | % | | 8/1/2013 | | Aa1 | | | | 2,000,000 | | | 2,251,160 | | |
Pine County, Series A, G.O. Bond, FGRNA | | 4.400 | % | | 2/1/2028 | | AAA | 2 | | | 555,000 | | | 563,220 | | |
Western Minnesota Municipal Power Agency, Revenue Bond | | 6.625 | % | | 1/1/2016 | | Aaa | | | | 175,000 | | | 202,249 | | |
| | | | | | | | | | | | | | | | |
| | | | | | | | | | | | | | 5,710,265 | | |
| | | | | | | | | | | | | | | | |
MISSISSIPPI - 0.2% | | | | | | | | | | | | | | | | |
Biloxi Public School District, Prerefunded Balance, Revenue Bond, NATL | | 5.000 | % | | 4/1/2017 | | A1 | | | | 500,000 | | | 517,500 | | |
| | | | | | | | | | | | | | | | |
| | | | | | |
MISSOURI - 1.6% | | | | | | | | | | | | | | | | |
Columbia, Water & Electric, Series A, Revenue Bond | | 4.125 | % | | 10/1/2033 | | AA | 2 | | | 995,000 | | | 953,956 | | |
Missouri State, Water Pollution Control, Series A, G.O. Bond | | 4.500 | % | | 12/1/2030 | | Aaa | | | | 2,375,000 | | | 2,458,220 | | |
Springfield, Electric Light & Power Impt., Revenue Bond, FGRNA | | 4.750 | % | | 8/1/2031 | | Aa3 | | | | 1,015,000 | | | 1,022,968 | | |
| | | | | | | | | | | | | | | | |
| | | | | | | | | | | | | | 4,435,144 | | |
| | | | | | | | | | | | | | | | |
| | | | |
| 9 | | The accompanying notes are an integral part of the financial statements. | | |
Investment Portfolio - June 30, 2010 (unaudited)
| | | | | | | | | | | | | | | |
| | | Coupon
Rate | | | Maturity
Date | | Credit
Rating 1
(unaudited) | | Principal
Amount | | Value
(Note 2) | | |
MUNICIPAL BONDS (continued) | | | | | | | | | | | | | | | |
| | | | | | |
NEBRASKA - 1.7% | | | | | | | | | | | | | | | |
Omaha Metropolitan Utilities District, Series A, Revenue Bond, AGM | | 4.375 | % | | 12/1/2031 | | Aa2 | | $ | 2,640,000 | | $ | 2,627,196 | | |
Omaha Public Power District, Series AA, Revenue Bond, FGRNA | | 4.500 | % | | 2/1/2034 | | Aa2 | | | 1,950,000 | | | 1,927,575 | | |
| | | | | | | | | | | | | | | |
| | | | | | | | | | | | | 4,554,771 | | |
| | | | | | | | | | | | | | | |
NEVADA - 3.2% | | | | | | | | | | | | | | | |
Clark County, G.O. Bond, AGM | | 4.750 | % | | 6/1/2027 | | Aaa | | | 3,000,000 | | | 3,069,780 | | |
Las Vegas Valley Water District, Water Impt., Series A, G.O. Bond, AGM | | 4.750 | % | | 6/1/2033 | | Aa1 | | | 1,500,000 | | | 1,501,470 | | |
Nevada State, Capital Impt., G.O. Bond | | 5.000 | % | | 6/1/2019 | | Aa1 | | | 2,040,000 | | | 2,268,195 | | |
Nevada State, Project Nos. 66 & 67, Unrefunded Balance, Series A, G.O. Bond, FGRNA | | 5.000 | % | | 5/15/2028 | | Aa1 | | | 125,000 | | | 125,876 | | |
North Las Vegas, G.O. Bond, NATL | | 5.000 | % | | 5/1/2024 | | A1 | | | 1,500,000 | | | 1,548,915 | | |
| | | | | | | | | | | | | | | |
| | | | | | | | | | | | | 8,514,236 | | |
| | | | | | | | | | | | | | | |
NEW HAMPSHIRE - 0.3% | | | | | | | | | | | | | | | |
New Hampshire Municipal Bond Bank, Series D, Revenue Bond | | 4.625 | % | | 7/15/2039 | | Aa2 | | | 835,000 | | | 843,283 | | |
| | | | | | | | | | | | | | | |
| | | | | | |
NEW JERSEY - 2.4% | | | | | | | | | | | | | | | |
East Brunswick Township Board of Education, G.O. Bond, AGM | | 4.500 | % | | 11/1/2028 | | Aa2 | | | 835,000 | | | 854,439 | | |
East Brunswick Township Board of Education, G.O. Bond, AGM | | 4.500 | % | | 11/1/2029 | | Aa2 | | | 1,000,000 | | | 1,019,430 | | |
Hudson County, G.O. Bond, CIFG | | 4.250 | % | | 9/1/2021 | | Aa3 | | | 930,000 | | | 975,737 | | |
Morris County Impt. Authority, School District, Morris Hills Regional District, Revenue Bond. | | 3.700 | % | | 10/1/2018 | | Aaa | | | 540,000 | | | 565,531 | | |
New Jersey Transportation Trust Fund Authority, Transportation System, Series A, Revenue Bond, AGM | | 4.250 | % | | 12/15/2022 | | Aa3 | | | 2,000,000 | | | 2,000,140 | | |
Sparta Township Board of Education, G.O. Bond, AGM | | 4.300 | % | | 2/15/2030 | | Aa2 | | | 1,000,000 | | | 993,660 | | |
| | | | | | | | | | | | | | | |
| | | | | | | | | | | | | 6,408,937 | | |
| | | | | | | | | | | | | | | |
| | | | |
| | The accompanying notes are an integral part of the financial statements. | | 10 |
Investment Portfolio - June 30, 2010 (unaudited)
| | | | | | | | | | | | | | | | |
| | | Coupon
Rate | | | Maturity
Date | | Credit
Rating 1
(unaudited) | | | Principal
Amount | | Value
(Note 2) | | |
MUNICIPAL BONDS (continued) | | | | | | | | | | | | | | | | |
| | | | | | |
NEW MEXICO - 0.3% | | | | | | | | | | | | | | | | |
New Mexico Finance Authority, Public Project Revolving Fund, Series A-1, Revenue Bond, NATL | | 3.250 | % | | 6/1/2013 | | Aa1 | | | $ | 700,000 | | $ | 744,303 | | |
| | | | | | | | | | | | | | | | |
| | | | | | |
NEW YORK - 4.4% | | | | | | | | | | | | | | | | |
Hampton Bays Union Free School District, G.O. Bond, AGM | | 4.375 | % | | 9/15/2029 | | Aa3 | | | | 2,225,000 | | | 2,265,451 | | |
New York City Municipal Water Finance Authority, Water & Sewer Systems, Series A, Revenue Bond | | 5.750 | % | | 6/15/2040 | | Aa1 | | | | 2,590,000 | | | 2,918,852 | | |
New York City Municipal Water Finance Authority, Water & Sewer Systems, Series E, Revenue Bond, FGRNA | | 5.000 | % | | 6/15/2026 | | Aa1 | | | | 750,000 | | | 769,440 | | |
New York State Dormitory Authority, University of Rochester, Series E, Revenue Bond | | 4.000 | % | | 7/1/2022 | | Aa3 | | | | 930,000 | | | 952,627 | | |
New York State Power Authority, Series A, Revenue Bond, NATL | | 4.500 | % | | 11/15/2047 | | Aa2 | | | | 1,000,000 | | | 987,640 | | |
New York State Urban Development Corp., Series B, Revenue Bond, NATL | | 5.000 | % | | 1/1/2019 | | WR | 3 | | | 1,000,000 | | | 1,097,030 | | |
Port Authority of New York & New Jersey, Revenue Bond | | 4.500 | % | | 10/15/2037 | | Aa2 | | | | 1,000,000 | | | 1,005,220 | | |
Sachem Central School District of Holbrook, G.O. Bond, FGRNA | | 4.375 | % | | 10/15/2030 | | AA | 2 | | | 2,000,000 | | | 2,015,760 | | |
| | | | | | | | | | | | | | | | |
| | | | | | | | | | | | | | 12,012,020 | | |
| | | | | | | | | | | | | | | | |
NORTH CAROLINA - 1.9% | | | | | | | | | | | | | | | | |
Charlotte, Series B, Revenue Bond | | 4.625 | % | | 7/1/2039 | | Aaa | | | | 1,000,000 | | | 1,006,770 | | |
Mecklenburg County, Public Impt., Series A, G.O. Bond | | 4.125 | % | | 2/1/2022 | | Aaa | | | | 1,455,000 | | | 1,514,975 | | |
North Carolina Municipal Power Agency No. 1 Catawba, Series A, Revenue Bond | | 5.000 | % | | 1/1/2030 | | A2 | | | | 1,000,000 | | | 1,025,060 | | |
North Carolina State, Highway Impt., Revenue Bond, NATL | | 4.000 | % | | 3/1/2018 | | Aa2 | | | | 1,355,000 | | | 1,459,755 | | |
| | | | | | | | | | | | | | | | |
| | | | | | | | | | | | | | 5,006,560 | | |
| | | | | | | | | | | | | | | | |
NORTH DAKOTA - 0.7% | | | | | | | | | | | | | | | | |
Fargo, Series A, G.O. Bond, NATL | | 4.700 | % | | 5/1/2030 | | Aa1 | | | | 1,840,000 | | | 1,874,150 | | |
| | | | | | | | | | | | | | | | |
| | | | |
| 11 | | The accompanying notes are an integral part of the financial statements. | | |
Investment Portfolio - June 30, 2010 (unaudited)
| | | | | | | | | | | | | | | |
| | | Coupon
Rate | | | Maturity
Date | | Credit
Rating 1
(unaudited) | | Principal
Amount | | Value
(Note 2) | | |
MUNICIPAL BONDS (continued) | | | | | | | | | | | | | | | |
| | | | | | |
OHIO - 3.2% | | | | | | | | | | | | | | | |
Brookville Local School District, G.O. Bond, AGM | | 4.125 | % | | 12/1/2026 | | Aa3 | | $ | 660,000 | | $ | 654,152 | | |
Columbus City School District, G.O. Bond, AGM | | 4.375 | % | | 12/1/2032 | | Aa2 | | | 1,000,000 | | | 988,000 | | |
Columbus, Limited Tax, Series 2, G.O. Bond | | 5.000 | % | | 7/1/2017 | | Aaa | | | 1,000,000 | | | 1,137,360 | | |
Licking Heights Local School District, School Facilities Construction & Impt., Series A, G.O. Bond, NATL | | 5.000 | % | | 12/1/2022 | | Aa2 | | | 1,450,000 | | | 1,542,510 | | |
Newark City School District, G.O. Bond, FGRNA | | 4.250 | % | | 12/1/2027 | | A1 | | | 500,000 | | | 495,730 | | |
Ohio State, Conservation Project, Series A, Prerefunded Balance, G.O. Bond | | 5.000 | % | | 3/1/2015 | | Aa1 | | | 1,000,000 | | | 1,140,140 | | |
Pickerington Local School District, School Facilities Construction & Impt., G.O. Bond, NATL | | 4.250 | % | | 12/1/2034 | | Aa2 | | | 2,500,000 | | | 2,422,300 | | |
Springfield City School District, Prerefunded Balance, G.O. Bond, FGIC | | 5.200 | % | | 12/1/2023 | | A1 | | | 325,000 | | | 352,947 | | |
| | | | | | | | | | | | | | | |
| | | | | | | | | | | | | 8,733,139 | | |
| | | | | | | | | | | | | | | |
OKLAHOMA - 1.1% | | | | | | | | | | | | | | | |
Oklahoma City Water Utilities Trust, Series A, Revenue Bond | | 4.125 | % | | 7/1/2039 | | Aa1 | | | 1,000,000 | | | 972,770 | | |
Oklahoma City, G.O. Bond, NATL | | 4.250 | % | | 3/1/2023 | | Aaa | | | 2,000,000 | | | 2,076,140 | | |
| | | | | | | | | | | | | | | |
| | | | | | | | | | | | | 3,048,910 | | |
| | | | | | | | | | | | | | | |
OREGON - 2.4% | | | | | | | | | | | | | | | |
Clackamas County School District No. 12 North Clackamas, Series A, G.O. Bond, AGM | | 4.750 | % | | 6/15/2031 | | Aa1 | | | 870,000 | | | 895,952 | | |
Metro, G.O. Bond | | 5.000 | % | | 6/1/2022 | | Aaa | | | 3,000,000 | | | 3,364,770 | | |
Portland, Water Utility Impt., Series A, Revenue Bond, NATL | | 4.500 | % | | 10/1/2031 | | Aa1 | | | 550,000 | | | 554,438 | | |
Salem, Water & Sewer, Revenue Bond, AGM | | 5.000 | % | | 5/1/2014 | | Aa3 | | | 1,120,000 | | | 1,267,818 | | |
Washington County School District No. 15 Forest Grove, Prerefunded Balance, G.O. Bond, AGM | | 5.500 | % | | 6/15/2017 | | Aa1 | | | 500,000 | | | 524,810 | | |
| | | | | | | | | | | | | | | |
| | | | | | | | | | | | | 6,607,788 | | |
| | | | | | | | | | | | | | | |
PENNSYLVANIA - 3.0% | | | | | | | | | | | | | | | |
Allegheny County, Series C-62B, G.O. Bond | | 5.000 | % | | 11/1/2029 | | A1 | | | 750,000 | | | 785,865 | | |
| | | | |
| | The accompanying notes are an integral part of the financial statements. | | 12 |
Investment Portfolio - June 30, 2010 (unaudited)
| | | | | | | | | | | | | | | | |
| | | Coupon
Rate | | | Maturity
Date | | Credit
Rating 1
(unaudited) | | | Principal
Amount | | Value
(Note 2) | | |
MUNICIPAL BONDS (continued) | | | | | | | | | | | | | | | | |
| | | | | | |
PENNSYLVANIA (continued) | | | | | | | | | | | | | | | | |
Erie Water Authority, Series 2006, Revenue Bond, AGM | | 5.000 | % | | 12/1/2036 | | AAA | 2 | | $ | 1,000,000 | | $ | 1,032,580 | | |
Jenkintown School District, Series A, G.O. Bond, FGRNA | | 4.500 | % | | 5/15/2032 | | A | 2 | | | 1,000,000 | | | 984,900 | | |
Lancaster School District, G.O. Bond, AGM | | 5.000 | % | | 6/1/2019 | | Aa3 | | | | 1,200,000 | | | 1,344,876 | | |
Pennsylvania Turnpike Commission, Prerefunded Balance, Revenue Bond, AMBAC | | 5.375 | % | | 7/15/2019 | | Aa3 | | | | 530,000 | | | 563,443 | | |
Philadelphia, Water & Wastewater, Revenue Bond, NATL | | 5.600 | % | | 8/1/2018 | | A | 2 | | | 20,000 | | | 23,545 | | |
Philadelphia, Water & Wastewater, Series A, Revenue Bond, AMRAG | | 5.000 | % | | 8/1/2021 | | Aa3 | | | | 1,000,000 | | | 1,082,490 | | |
Plum Boro School District, Series A, G.O. Bond, FGRNA | | 4.500 | % | | 9/15/2030 | | A | 2 | | | 855,000 | | | 852,700 | | |
Uniontown Area School District, G.O. Bond, AGM | | 4.350 | % | | 10/1/2034 | | Aa3 | | | | 1,500,000 | | | 1,439,505 | | |
| | | | | | | | | | | | | | | | |
| | | | | | | | | | | | | | 8,109,904 | | |
| | | | | | | | | | | | | | | | |
RHODE ISLAND - 1.2% | | | | | | | | | | | | | | | | |
Narragansett Bay Commission, Series A, Revenue Bond, NATL | | 5.000 | % | | 8/1/2035 | | Baa1 | | | | 1,000,000 | | | 1,019,730 | | |
Rhode Island Clean Water Finance Agency, Series A, Revenue Bond, NATL | | 5.000 | % | | 10/1/2035 | | Baa1 | | | | 1,000,000 | | | 967,880 | | |
Rhode Island State, Series B, G.O. Bond | | 5.000 | % | | 4/1/2023 | | Aa2 | | | | 1,110,000 | | | 1,233,421 | | |
| | | | | | | | | | | | | | | | |
| | | | | | | | | | | | | | 3,221,031 | | |
| | | | | | | | | | | | | | | | |
SOUTH CAROLINA - 5.0% | | | | | | | | | | | | | | | | |
Beaufort County School District, Series B, G.O. Bond | | 5.000 | % | | 3/1/2017 | | Aa1 | | | | 1,000,000 | | | 1,166,500 | | |
Beaufort County, G.O. Bond, NATL | | 4.250 | % | | 3/1/2024 | | Aa1 | | | | 790,000 | | | 813,921 | | |
Charleston County, Transportation Sales Tax, G.O. Bond | | 5.000 | % | | 11/1/2017 | | Aaa | | | | 1,000,000 | | | 1,158,010 | | |
Columbia, Water Utility Impt., Revenue Bond | | 5.000 | % | | 2/1/2027 | | Aa1 | | | | 1,750,000 | | | 1,920,293 | | |
Lexington, Waterworks & Sewer System, Revenue Bond, AGC | | 5.000 | % | | 1/15/2039 | | Aa3 | | | | 1,565,000 | | | 1,600,729 | | |
Richland County School District No. 1, Series B, G.O. Bond | | 4.450 | % | | 3/1/2026 | | Aa1 | | | | 1,005,000 | | | 1,037,019 | | |
South Carolina Transportation Infrastructure Bank, Series B, Revenue Bond, AMBAC | | 4.250 | % | | 10/1/2027 | | Aa3 | | | | 2,000,000 | | | 1,961,500 | | |
| | | | |
| 13 | | The accompanying notes are an integral part of the financial statements. | | |
Investment Portfolio - June 30, 2010 (unaudited)
| | | | | | | | | | | | | | | | |
| | | Coupon
Rate | | | Maturity
Date | | Credit
Rating 1
(unaudited) | | | Principal
Amount | | Value
(Note 2) | | |
MUNICIPAL BONDS (continued) | | | | | | | | | | | | | | | | |
| | | | | | |
SOUTH CAROLINA (continued) | | | | | | | | | | | | | | | | |
South Carolina, State Institutional - South Carolina State University, Series D, G.O. Bond | | 4.250 | % | | 10/1/2026 | | Aaa | | | $ | 1,250,000 | | $ | 1,290,125 | | |
Spartanburg Sanitation Sewer District, Series B, Revenue Bond, NATL | | 5.000 | % | | 3/1/2032 | | A1 | | | | 1,500,000 | | | 1,521,465 | | |
Sumter, Water Utility Impt., Revenue Bond, XLCA | | 4.500 | % | | 12/1/2032 | | A1 | | | | 1,000,000 | | | 971,080 | | |
| | | | | | | | | | | | | | | | |
| | | | | | | | | | | | | | 13,440,642 | | |
| | | | | | | | | | | | | | | | |
TENNESSEE - 0.3% | | | | | | | | | | | | | | | | |
Claiborne County, Series A, G.O. Bond | | 4.125 | % | | 4/1/2030 | | A | 2 | | | 750,000 | | | 736,335 | | |
| | | | | | | | | | | | | | | | |
| | | | | | |
TEXAS - 5.2% | | | | | | | | | | | | | | | | |
Alamo Community College District, Series A, G.O. Bond, NATL | | 5.000 | % | | 8/15/2024 | | Aaa | | | | 1,020,000 | | | 1,099,458 | | |
Alvin Independent School District, G.O. Bond | | 4.375 | % | | 2/15/2024 | | Aaa | | | | 750,000 | | | 775,395 | | |
Canyon Independent School District, G.O. Bond | | 4.700 | % | | 2/15/2025 | | AAA | 2 | | | 1,440,000 | | | 1,523,002 | | |
Clear Creek Independent School District, G.O. Bond, AGM | | 4.000 | % | | 2/15/2029 | | Aa2 | | | | 2,340,000 | | | 2,241,884 | | |
Del Valle Independent School District, School Building, G.O. Bond | | 5.000 | % | | 6/15/2019 | | AAA | 2 | | | 1,845,000 | | | 2,071,142 | | |
Fort Bend County, G.O. Bond, NATL | | 4.750 | % | | 3/1/2031 | | Aa1 | | | | 1,000,000 | | | 1,024,630 | | |
Huntsville Independent School District, G.O. Bond | | 4.500 | % | | 2/15/2029 | | Aaa | | | | 1,220,000 | | | 1,235,701 | | |
McKinney, Waterworks & Sewer, Revenue Bond, FGRNA | | 4.750 | % | | 3/15/2024 | | Aa2 | | | | 1,000,000 | | | 1,026,440 | | |
San Antonio, Water, Revenue Bond, FGRNA | | 4.375 | % | | 5/15/2029 | | Aa1 | | | | 1,400,000 | | | 1,400,350 | | |
University of Texas, Financing System, Series F, Revenue Bond | | 4.750 | % | | 8/15/2028 | | Aaa | | | | 1,000,000 | | | 1,052,740 | | |
Waller Consolidated Independent School District, G.O. Bond | | 4.750 | % | | 2/15/2023 | | Aaa | | | | 500,000 | | | 504,055 | | |
| | | | | | | | | | | | | | | | |
| | | | | | | | | | | | | | 13,954,797 | | |
| | | | | | | | | | | | | | | | |
UTAH - 2.2% | | | | | | | | | | | | | | | | |
Mountain Regional Water Special Service District, Revenue Bond, NATL | | 5.000 | % | | 12/15/2030 | | Baa1 | | | | 1,240,000 | | | 1,236,825 | | |
Ogden City School District, G.O. Bond | | 4.250 | % | | 6/15/2025 | | Aa2 | | | | 1,500,000 | | | 1,536,585 | | |
Ogden, Water Utility Impt., Revenue Bond, AGM | | 4.500 | % | | 6/15/2038 | | Aa3 | | | | 750,000 | | | 724,515 | | |
| | | | |
| | The accompanying notes are an integral part of the financial statements. | | 14 |
Investment Portfolio - June 30, 2010 (unaudited)
| | | | | | | | | | | | | | | | |
| | | Coupon
Rate | | | Maturity
Date | | Credit
Rating 1
(unaudited) | | | Principal
Amount | | Value
(Note 2) | | |
MUNICIPAL BONDS (continued) | | | | | | | | | | | | | | | | |
| | | | | | |
UTAH (continued) | | | | | | | | | | | | | | | | |
Provo City School District, Series B, G.O. Bond | | 4.000 | % | | 6/15/2014 | | Aaa | | | $ | 1,100,000 | | $ | 1,212,343 | | |
St. George, Parks and Recreation, G.O. Bond, AMBAC | | 4.000 | % | | 8/1/2019 | | Aa2 | | | | 795,000 | | | 826,522 | | |
Utah State Building Ownership Authority, Series C, Revenue Bond, AGM | | 5.500 | % | | 5/15/2011 | | Aa1 | | | | 300,000 | | | 313,257 | | |
| | | | | | | | | | | | | | | | |
| | | | | | | | | | | | | | 5,850,047 | | |
| | | | | | | | | | | | | | | | |
VERMONT - 0.4% | | | | | | | | | | | | | | | | |
Vermont State, Series D, G.O. Bond | | 4.500 | % | | 7/15/2025 | | Aaa | | | | 1,000,000 | | | 1,062,560 | | |
| | | | | | | | | | | | | | | | |
| | | | | | |
VIRGINIA - 2.7% | | | | | | | | | | | | | | | | |
Fairfax County, Public Impt., Series A, G.O. Bond | | 4.000 | % | | 4/1/2017 | | Aaa | | | | 2,000,000 | | | 2,166,080 | | |
Fairfax County, Public Impt., Series A, G.O. Bond | | 4.250 | % | | 4/1/2027 | | Aaa | | | | 1,500,000 | | | 1,532,955 | | |
Norfolk, Capital Impt., G.O. Bond, FGRNA | | 4.250 | % | | 10/1/2024 | | Aa2 | | | | 2,500,000 | | | 2,551,050 | | |
Norfolk, Capital Impt., G.O. Bond, NATL | | 4.375 | % | | 3/1/2024 | | Aa2 | | | | 685,000 | | | 703,653 | | |
Richmond, Series B, G.O. Bond, AGM | | 4.750 | % | | 7/15/2023 | | Aa2 | | | | 400,000 | | | 415,932 | | |
| | | | | | | | | | | | | | | | |
| | | | | | | | | | | | | | 7,369,670 | | |
| | | | | | | | | | | | | | | | |
WASHINGTON - 4.9% | | | | | | | | | | | | | | | | |
Franklin County, G.O. Bond, FGRNA | | 5.125 | % | | 12/1/2022 | | A | 2 | | | 1,000,000 | | | 1,031,990 | | |
Grant County Public Utility District No. 2 Priest Rapids, Series A, Revenue Bond, NATL | | 5.000 | % | | 1/1/2043 | | Aa3 | | | | 1,000,000 | | | 1,014,400 | | |
King County School District No. 411 Issaquah, Series A, G.O. Bond, AGM | | 5.250 | % | | 12/1/2018 | | Aaa | | | | 2,420,000 | | | 2,717,079 | | |
King County, Sewer Impt., G.O. Bond, FGRNA . | | 5.000 | % | | 1/1/2035 | | Aa1 | | | | 1,255,000 | | | 1,291,646 | | |
King County, Sewer Impt., Revenue Bond, AGM | | 5.000 | % | | 1/1/2024 | | Aa2 | | | | 1,460,000 | | | 1,592,130 | | |
King County, Sewer Impt., Series A, Revenue Bond, NATL | | 4.500 | % | | 1/1/2032 | | Aa2 | | | | 1,070,000 | | | 1,055,491 | | |
Seattle, Drain & Wastewater, Revenue Bond, NATL | | 4.375 | % | | 2/1/2026 | | Aa1 | | | | 2,000,000 | | | 2,032,560 | | |
Tacoma, Sewer Impt., Revenue Bond, FGRNA | | 5.125 | % | | 12/1/2036 | | Aa2 | | | | 1,275,000 | | | 1,323,272 | | |
Washington State, Motor Vehicle Fuel Tax, Series B, G.O. Bond, AMBAC | | 5.000 | % | | 1/1/2025 | | Aa1 | | | | 1,000,000 | | | 1,081,130 | | |
| | | | | | | | | | | | | | | | |
| | | | | | | | | | | | | | 13,139,698 | | |
| | | | | | | | | | | | | | | | |
| | | | |
| 15 | | The accompanying notes are an integral part of the financial statements. | | |
Investment Portfolio - June 30, 2010 (unaudited)
| | | | | | | | | | | | | | | | |
| | | Coupon
Rate | | | Maturity
Date | | Credit
Rating 1
(unaudited) | | | Principal
Amount/
Shares | | Value (Note 2) | | |
MUNICIPAL BONDS (continued) | | | | | | | | | | | | | | | | |
| | | | | | |
WEST VIRGINIA - 0.3% | | | | | | | | | | | | | | | | |
West Virginia State Water Development Authority, Series A, Revenue Bond, FGRNA | | 4.250 | % | | 11/1/2026 | | A | 2 | | $ | 820,000 | | $ | 812,333 | | |
| | | | | | | | | | | | | | | | |
| | | | | | |
WISCONSIN - 2.8% | | | | | | | | | | | | | | | | |
Central Brown County Water Authority, Water Systems, Revenue Bond, AMBAC | | 5.000 | % | | 12/1/2035 | | A | 2 | | | 1,500,000 | | | 1,509,135 | | |
Eau Claire, Series B, G.O. Bond, NATL | | 4.000 | % | | 4/1/2015 | | Aa1 | | | | 1,195,000 | | | 1,325,147 | | |
Madison, Water Utility Impt., Series A, Revenue Bond | | 4.250 | % | | 1/1/2030 | | Aa1 | | | | 1,000,000 | | | 983,580 | | |
Milwaukee County Metropolitan Sewer District, Series F, G.O. Bond | | 5.000 | % | | 10/1/2018 | | Aaa | | | | 1,050,000 | | | 1,234,517 | | |
Oshkosh, Corporate Purposes, Series A, G.O. Bond, FGRNA | | 5.050 | % | | 12/1/2021 | | Aa2 | | | | 450,000 | | | 473,247 | | |
Stoughton Area School District, G.O. Bond, FGRNA | | 4.875 | % | | 4/1/2016 | | Aa2 | | | | 500,000 | | | 514,420 | | |
Wisconsin Public Power, Inc., Series A, Revenue Bond, AMBAC | | 5.000 | % | | 7/1/2035 | | A1 | | | | 870,000 | | | 872,671 | | |
Wisconsin State, Transportation, Series A, Revenue Bond, AGM | | 5.000 | % | | 7/1/2025 | | Aa2 | | | | 700,000 | | | 742,525 | | |
| | | | | | | | | | | | | | | | |
| | | | | | | | | | | | | | 7,655,242 | | |
| | | | | | | | | | | | | | | | |
WYOMING - 0.3% | | | | | | | | | | | | | | | | |
Wyoming Municipal Power Agency, Series A, Revenue Bond | | 5.375 | % | | 1/1/2042 | | A2 | | | | 710,000 | | | 734,112 | | |
| | | | | | | | | | | | | | | | |
TOTAL MUNICIPAL BONDS | | | | | | | | | | | | | | | | |
(Identified Cost $253,215,570) | | | | | | | | | | | | | | 259,703,965 | | |
| | | | | | | | | | | | | | | | |
| | | | | | |
SHORT-TERM INVESTMENTS - 3.0% | | | | | | | | | | | | | | | | |
| | | | | | |
Dreyfus AMT - Free Municipal Reserves - Class R | | | | | | | | | | | | | | | | |
(Identified Cost $8,234,364) | | | | | | | | | | | 8,234,364 | | | 8,234,364 | | |
| | | | | | | | | | | | | | | | |
TOTAL INVESTMENTS - 99.4% | | | | | | | | | | | | | | | | |
(Identified Cost $261,449,934) | | | | | | | | | | | | | | 267,938,329 | | |
OTHER ASSETS, LESS LIABILITIES - 0.6% | | | | | | | | | | | | | | 1,566,746 | | |
| | | | | | | | | | | | | | | | |
NET ASSETS - 100% | | | | | | | | | | | | | $ | 269,505,075 | | |
| | | | | | | | | | | | | | | | |
| | | | |
| | The accompanying notes are an integral part of the financial statements. | | 16 |
Investment Portfolio - June 30, 2010 (unaudited)
KEY:
G.O. Bond - General Obligation Bond
Impt. - Improvement
No. - Number
Scheduled principal and interest payments are guaranteed by:
AGC (Assurance Guaranty Corp.)
AGM (Assurance Guaranty Municipal Corp.) (formerly known as FSA (Financial Security Assurance, Inc.))
AMBAC (AMBAC Assurance Corp.)
AMRAG (AMBAC reinsured by AGC)
CIFG (CIFG North America, Inc.)
FGIC (Financial Guaranty Insurance Co.)
FGRNA (FGIC reinsured by NATL)
NATL (National Public Finance Guarantee Corp.)
XLCA (XL Capital Assurance)
The insurance does not guarantee the market value of the municipal bonds.
| 1 | Credit ratings from Moody’s (unaudited). |
| 2 | Credit ratings from S&P (unaudited). |
| 3 | Credit rating has been withdrawn. As of June 30, 2010, there is no rating available. |
The Series’ portfolio holds, as a percentage of net assets, greater than 10% in bonds insured by the following companies:
NATL - 31.8%; AGM - 19.9% .
| | | | |
| 17 | | The accompanying notes are an integral part of the financial statements. | | |
Statement of Assets and Liabilities (unaudited)
June 30, 2010
| | | |
ASSETS: | | | |
| |
Investments, at value (identified cost $261,449,934) (Note 2) | | $ | 267,938,329 |
Interest receivable | | | 3,214,480 |
Receivable for fund shares sold | | | 216,630 |
Dividends receivable | | | 425 |
| | | |
| |
TOTAL ASSETS | | | 271,369,864 |
| | | |
| |
LIABILITIES: | | | |
| |
Accrued management fees (Note 3) | | | 110,578 |
Accrued fund accounting and administration fees (Note 3) | | | 2,906 |
Accrued transfer agent fees (Note 3) | | | 1,653 |
Accrued Chief Compliance Officer service fees (Note 3) | | | 820 |
Payable for securities purchased | | | 1,330,938 |
Payable for fund shares repurchased | | | 404,639 |
Other payables and accrued expenses | | | 13,255 |
| | | |
| |
TOTAL LIABILITIES | | | 1,864,789 |
| | | |
| |
TOTAL NET ASSETS | | $ | 269,505,075 |
| | | |
| |
NET ASSETS CONSIST OF: | | | |
| |
Capital stock | | $ | 239,814 |
Additional paid-in-capital | | | 261,663,998 |
Undistributed net investment income | | | 1,084,228 |
Accumulated net realized gain on investments | | | 28,640 |
Net unrealized appreciation on investments | | | 6,488,395 |
| | | |
TOTAL NET ASSETS | | $ | 269,505,075 |
| | | |
| |
NET ASSET VALUE, OFFERING PRICE AND REDEMPTION PRICE PER SHARE - Class A ($269,505,075/23,981,439 shares) | | $ | 11.24 |
| | | |
| | | | |
| | The accompanying notes are an integral part of the financial statements. | | 18 |
Statement of Operations (unaudited)
For the Six Months Ended June 30, 2010
| | | | |
INVESTMENT INCOME: | | | | |
| |
Interest | | $ | 5,138,390 | |
Dividends | | | 498 | |
| | | | |
| |
Total Investment Income | | | 5,138,888 | |
| | | | |
| |
EXPENSES: | | | | |
| |
Management fees (Note 3) | | | 622,102 | |
Fund accounting and administration fees (Note 3) | | | 43,431 | |
Directors’ fees (Note 3) | | | 6,373 | |
Transfer agent fees (Note 3) | | | 3,047 | |
Chief Compliance Officer service fees (Note 3) | | | 1,761 | |
Miscellaneous | | | 43,498 | |
| | | | |
Total Expenses | | | 720,212 | |
Less reduction of expenses (Note 3) | | | (758 | ) |
| | | | |
Net Expenses | | | 719,454 | |
| | | | |
NET INVESTMENT INCOME | | | 4,419,434 | |
| | | | |
| |
REALIZED AND UNREALIZED GAIN ON INVESTMENTS: | | | | |
| |
Net realized gain on investments | | | 25,411 | |
Net change in unrealized appreciation on investments | | | 2,016,438 | |
| | | | |
| |
NET REALIZED AND UNREALIZED GAIN ON INVESTMENTS | | | 2,041,849 | |
| | | | |
| |
NET INCREASE IN NET ASSETS RESULTING FROM OPERATIONS | | $ | 6,461,283 | |
| | | | |
| | | | |
| 19 | | The accompanying notes are an integral part of the financial statements. | | |
Statement of Changes in Net Assets
| | | | | | | | |
| | | For the Six
Months Ended
6/30/10
(unaudited) | | | For the
Year Ended
12/31/09 | |
INCREASE (DECREASE) IN NET ASSETS: | | | | | | | | |
| | |
OPERATIONS: | | | | | | | | |
| | |
Net investment income | | $ | 4,419,434 | | | $ | 7,635,785 | |
Net realized gain on investments | | | 25,411 | | | | 243,778 | |
Net change in unrealized appreciation on investments | | | 2,016,438 | | | | 16,756,505 | |
| | | | | | | | |
| | |
Net increase from operations | | | 6,461,283 | | | | 24,636,068 | |
| | | | | | | | |
| | |
DISTRIBUTIONS TO SHAREHOLDERS (Note 7): | | | | | | | | |
| | |
From net investment income | | | (4,994,529 | ) | | | (8,260,550 | ) |
From net realized gain on investments | | | — | | | | (515,923 | ) |
| | | | | | | | |
| | |
Total distributions to shareholders | | | (4,994,529 | ) | | | (8,776,473 | ) |
| | | | | | | | |
| | |
CAPITAL STOCK ISSUED AND REPURCHASED: | | | | | | | | |
| | |
Net increase from capital share transactions (Note 5) | | | 33,552,290 | | | | 20,890,861 | |
| | | | | | | | |
| | |
Net increase in net assets | | | 35,019,044 | | | | 36,750,456 | |
| | |
NET ASSETS: | | | | | | | | |
| | |
Beginning of period | | | 234,486,031 | | | | 197,735,575 | |
| | | | | | | | |
| | |
End of period (including undistributed net investment income of $1,084,228 and $1,659,323, respectively) | | $ | 269,505,075 | | | $ | 234,486,031 | |
| | | | | | | | |
| | | | |
| | The accompanying notes are an integral part of the financial statements. | | 20 |
Financial Highlights
| | | | | | | | | | | | | |
| | | For the Six
Months Ended
6/30/10 | | For the Years Ended |
| | | (unaudited) | | 12/31/09 | | 12/31/08 | | 12/31/07 | | | 12/31/06 | | 12/31/05 |
Per share data (for a share outstanding throughout each period): | | | | | | | | | | | | | |
Net asset value - Beginning of period | | $11.17 | | $10.34 | | $10.92 | | $10.95 | | | $10.90 | | $10.99 |
| | | | | | | | | | | | | |
| | | | | | |
Income (loss) from investment operations: | | | | | | | | | | | | | |
Net investment income | | 0.201 | | 0.401 | | 0.42 | | 0.36 | | | 0.37 | | 0.37 |
Net realized and unrealized gain (loss) on investments | | 0.09 | | 0.90 | | (0.62) | | (0.02) | | | 0.05 | | (0.09) |
| | | | | | | | | | | | | |
Total from investment operations | | 0.29 | | 1.30 | | (0.20) | | 0.34 | | | 0.42 | | 0.28 |
| | | | | | | | | | | | | |
Less distributions to shareholders: | | | | | | | | | | | | | |
From net investment income | | (0.22) | | (0.44) | | (0.36) | | (0.37) | | | (0.36) | | (0.36) |
From net realized gain on investments | | — | | (0.03) | | (0.02) | | — | 2 | | (0.01) | | (0.01) |
| | | | | | | | | | | | | |
Total distributions to shareholders | | (0.22) | | (0.47) | | (0.38) | | (0.37) | | | (0.37) | | (0.37) |
| | | | | | | | | | | | | |
Net asset value - End of period | | $11.24 | | $11.17 | | $10.34 | | $10.92 | | | $10.95 | | $10.90 |
| | | | | | | | | | | | | |
Net assets - End of period | | | | | | | | | | | | | |
(000’s omitted) | | $269,505 | | $234,486 | | $197,736 | | $235,709 | | | $167,689 | | $112,965 |
| | | | | | | | | | | | | |
Total return3 | | 2.61% | | 12.75% | | (1.79%) | | 3.20% | | | 3.94% | | 2.60% |
Ratios (to average net assets)/ Supplemental Data: | | | | | | | | | | | | | |
Expenses* | | 0.58%4 | | 0.60% | | 0.61% | | 0.62% | | | 0.66% | | 0.71% |
Net investment income | | 3.55%4 | | 3.65% | | 3.75% | | 3.65% | | | 3.71% | | 3.58% |
Portfolio turnover | | 1% | | 8% | | 7% | | 3% | | | 5% | | 2% |
|
*The investment advisor did not impose all or a portion of its management fees, CCO fees, fund accounting and transfer agent fees, and other fees in some periods and in some periods paid a portion of the Series’ expenses. If these expenses had been incurred by the Series, the expense ratio (to average net assets) would have been increased by the following amounts: |
| | 0.00% 4,5 | | 0.01% | | N/A | | N/A | | | N/A | | N/A |
1Calculated based on average shares outstanding during the periods.
2Less than $0.01 per share.
3Represents aggregate total return for the periods indicated, and assumes reinvestment of all distributions. Total return would have been lower had certain expenses not been waived or reimbursed during the periods. Periods less than one year are not annualized.
4Annualized.
5Less than 0.01%.
| | | | |
| 21 | | The accompanying notes are an integral part of the financial statements. | | |
Notes to Financial Statements (unaudited)
Diversified Tax Exempt Series (the “Series”) is a no-load diversified series of Manning & Napier Fund, Inc. (the “Fund”). The Fund is organized in Maryland and is registered under the Investment Company Act of 1940, as amended, as an open-end management investment company.
The Series’ investment objective is to provide as high a level of current income exempt from federal income tax as the Advisor believes is consistent with the preservation of capital.
The Fund’s Advisor is Manning & Napier Advisors, Inc. (the “Advisor”). Shares of the Series are offered to investors, clients and employees of the Advisor and its affiliates. The total authorized capital stock of the Fund consists of 10.0 billion shares of common stock each having a par value of $0.01. As of June 30, 2010, 6.2 billion shares have been designated in total among 29 series, of which 100 million have been designated as Diversified Tax Exempt Series Class A common stock.
| 2. | SIGNIFICANT ACCOUNTING POLICIES |
Security Valuation
Municipal securities will normally be valued on the basis of market valuations provided by an independent pricing service (the “Service”). The Service utilizes the latest price quotations and a matrix system (which considers such factors as security prices of similar securities, yields, maturities and ratings). The Service has been approved by the Fund’s Board of Directors (the “Board”).
Short-term investments that mature in sixty days or less are valued at amortized cost, which approximates market value. Investments in open-end investment companies are valued at their net asset value per share on valuation date.
Volume and level of activity in established markets for an asset or liability are evaluated to determine whether recent transactions and quoted prices are determinative of fair value. Where there have been significant decreases in volume and level of activity, further analysis and adjustment may be necessary to estimate fair value. The Series measures fair value in these instances by the use of inputs and valuation techniques which may be based upon current market prices of securities that are comparable in coupon, rating, maturity and industry and/or expectation of future cash flows. As a result of trading in relatively thin markets and/or markets that experience significant volatility, the prices used by the Series to value these securities may differ from the value that would be realized if these securities were sold, and the differences could be material.
Securities for which representative valuations or prices are not available from the Fund’s pricing service may be valued at fair value. Due to the inherent uncertainty of valuations of such securities, the fair value may differ significantly from the values that would have been used had a ready market for such securities existed. If trading or events occurring after the close of the principal market in which securities are traded are expected to materially affect the value of those securities, then they may be valued at their fair value, taking this trading or these events into account. Fair value is determined in good faith by the Advisor under procedures approved by and under the general supervision and responsibility of the Board.
Various inputs are used in determining the value of the Series’ assets or liabilities carried at market value. These inputs are summarized in three broad levels. Level 1 includes quoted prices in active markets for identical assets and liabilities. Level 2 includes other significant observable inputs (including quoted prices for similar securities, interest rates, prepayment speeds, credit risk, etc.). Level 3 includes significant unobservable inputs (including the Series’ own assumptions in determining the fair value of investments). The inputs or methodology used for valuing securities are not necessarily an indication of the risk associated with investing in those securities.
The following is a summary of the valuation levels used for major security types as of June 30, 2010 in valuing the Series’ assets or liabilities carried at market value:
Notes to Financial Statements (unaudited)
| 2. | SIGNIFICANT ACCOUNTING POLICIES (continued) |
Security Valuation (continued)
| | | | | | | | | | | | |
| Description | | 6/30/10 | | Level 1 | | Level 2 | | Level 3 |
Equity securities* | | $ | — | | $ | — | | $ | — | | $ | — |
Preferred securities | | | — | | | — | | | — | | | — |
Debt securities: | | | | | | | | | | | | |
States and political subdivisions (municipals) | | | 259,703,965 | | | — | | | 259,703,965 | | | — |
Mutual funds | | | 8,234,364 | | | 8,234,364 | | | — | | | — |
Other financial instruments** | | | — | | | — | | | — | | | — |
| | | | | | | | | | | | |
Total | | $ | 267,938,329 | | $ | 8,234,364 | | $ | 259,703,965 | | $ | — |
| | | | | | | | | | | | |
*Includes common stock, warrants and rights. Please see the Investment Portfolio for industry classification.
**Other financial instruments are derivative instruments not reflected in the Investment Portfolio, such as futures, forwards and swap contracts, which are valued at the unrealized appreciation/depreciation on the instrument. As of June 30, 2010, the Series did not hold any derivative instruments.
There were no Level 3 securities held by the Series as of December 31, 2009 or June 30, 2010.
The Fund’s policy is to recognize transfers in and transfers out of the valuation levels as of the end of the reporting period. There were no significant transfers between Level 1 and Level 2 as of June 30, 2010.
Additional disclosure surrounding the activity in Level 3 fair value measurement will also be effective for fiscal years beginning after December 15, 2010. Management has concluded that this will not have a material impact on the Series’ financial statements.
Security Transactions, Investment Income and Expenses
Security transactions are accounted for on trade date. Dividend income is recorded on the ex-dividend date, except that if the ex-dividend date has passed, certain dividends from foreign securities are recorded as soon as the Fund is informed of the ex-dividend date. Non-cash dividends, if any, are recorded at the fair market value of the securities received. Interest income, including amortization of premium and accretion of discounts using the effective interest method, is earned from settlement date and accrued daily.
Expenses are recorded on an accrual basis. Most expenses of the Fund can be attributed to a specific series. Expenses which cannot be directly attributed are apportioned among the series in the Fund in such a manner as deemed equitable by the Fund’s Board, taking into consideration, among other things, the nature and type of expense.
The Series uses the identified cost method for determining realized gain or loss on investments for both financial statement and federal income tax reporting purposes.
Federal Taxes
The Series’ policy is to comply with the provisions of the Internal Revenue Code applicable to regulated investment companies. The Series is not subject to federal income tax or excise tax to the extent that the Series distributes to shareholders each year its taxable income, including any net realized gains on investments, in accordance with requirements of the Internal Revenue Code. Accordingly, no provision for federal income tax or excise tax has been made in the financial statements.
23
Notes to Financial Statements (unaudited)
| 2. | SIGNIFICANT ACCOUNTING POLICIES (continued) |
Federal Taxes (continued)
Management evaluates its tax positions to determine if the tax positions taken meet the minimum recognition threshold in connection with accounting for uncertainties in income tax positions taken or expected to be taken for the purposes of measuring and recognizing tax liabilities in the financial statements. Recognition of tax benefits of an uncertain tax position is required only when the position is “more likely than not” to be sustained assuming examination by taxing authorities. At June 30, 2010, the Series has recorded no liability for net unrecognized tax benefits relating to uncertain income tax positions taken or expected to be taken in future tax returns.
The Series files income tax returns in the U.S. federal jurisdiction and various states, as required. No income tax returns are currently under investigation. The statute of limitations on the Series’ tax returns remains open for the years ended December 31, 2006 through December 31, 2009. The Fund is not aware of any tax positions for which it is reasonably possible that the total amounts of unrecognized tax benefits will significantly change in the next twelve months.
Distributions of Income and Gains
Distributions to shareholders of net investment income are made quarterly. Distributions of net realized gains are made annually. An additional distribution may be necessary to avoid taxation of the Series. Distributions are recorded on the ex-dividend date.
Indemnifications
The Fund’s organizational documents provide former and current directors and officers with a limited indemnification against liabilities arising in connection with the performance of their duties to the Fund. In the normal course of business, the Fund may also enter into contracts that provide general indemnifications. The Fund’s maximum exposure under these arrangements is unknown as this would be dependent on future claims that may be made against the Fund. The risk of material loss from such claims is considered remote.
Other
The preparation of financial statements in conformity with accounting principles generally accepted in the United States of America requires management to make estimates and assumptions that affect the reported amounts of assets and liabilities and the disclosure of contingent assets and liabilities at the date of the financial statements and the reported amounts of income and expenses during the reporting period. Actual results could differ from those estimates.
| 3. | TRANSACTIONS WITH AFFILIATES |
The Fund has an Investment Advisory Agreement (the “Agreement”) with the Advisor, for which the Series pays a fee, computed daily and payable monthly, at an annual rate of 0.50% of the Series’ average daily net assets.
Under the Agreement, personnel of the Advisor provide the Series with advice and assistance in the choice of investments and the execution of securities transactions, and otherwise maintain the Series’ organization. The Advisor also provides the Fund with necessary office space and fund administration and support services. The salaries of all officers of the Fund (except a percentage of the Fund’s Chief Compliance Officer’s salary, which is paid by the Fund), and of all Directors who are “affiliated persons” of the Fund, or of the Advisor, and all personnel of the Fund, or of the Advisor, performing services relating to research, statistical and investment activities, are paid by the Advisor. Each “non-affiliated” Director receives an annual stipend, which is allocated among all the active series of the Fund. In addition, these Directors also receive a fee per Board meeting attended for each active series of the Fund plus a fee for each committee meeting attended.
The Advisor has contractually agreed, until at least April 30, 2011, to waive its fee and, if necessary, pay other operating expenses of the Series in order to maintain total direct annual fund operating expenses for the Series at
24
Notes to Financial Statements (unaudited)
| 3. | TRANSACTIONS WITH AFFILIATES (continued) |
no more than 0.85% of average daily net assets each year. For the six months ended June 30, 2010, the Advisor voluntarily waived fees of $758, which are included as a reduction of expenses on the Statement of Operations. The Advisor is not eligible to recoup any expenses that have been waived or reimbursed in prior years.
Manning & Napier Investor Services, Inc., a registered broker-dealer affiliate of the Advisor, acts as distributor for the Fund’s shares. The services of Manning & Napier Investor Services, Inc. are provided at no additional cost to the Series.
The Advisor has entered into agreements with PNC Global Investment Servicing (U.S.) Inc. (“PNCGIS”) under which PNCGIS serves as sub-accountant services agent and sub-transfer agent. The Fund pays the Advisor an annual fee of 0.0175% on the first $3 billion of average daily net assets (excluding Target Series); 0.015% on the next $3 billion of average daily net assets (excluding Target Series); and 0.01% of the average daily net assets in excess of $6 billion (excluding Target Series); plus a base fee of $25,500 per Series. Additionally, certain transaction-, account-, and cusip-based fees and out-of-pocket expenses, including charges for reporting relating to the Fund’s compliance program, are charged.
On July 1, 2010, The PNC Financial Services Group, Inc. sold the outstanding stock of PNC Global Investment Servicing Inc. to The Bank of New York Mellon Corporation. At the closing of the sale, PNCGIS changed its name to BNY Mellon Investment Servicing (US) Inc.
| 4. | PURCHASES AND SALES OF SECURITIES |
For the six months ended June 30, 2010, purchases and sales of securities, other than U.S. Government securities and short-term securities, were $35,352,992 and $2,483,000, respectively. There were no purchases or sales of U.S. Government securities.
| 5. | CAPITAL STOCK TRANSACTIONS |
Transactions in shares of Diversified Tax Exempt Series were:
| | | | | | | | | | | | | | |
| | | For the Six Months Ended 6/30/10 | | | For the Year Ended 12/31/09 | |
| | | Shares | | | Amount | | | Shares | | | Amount | |
Sold | | 4,330,789 | | | $ | 48,781,826 | | | 4,637,961 | | | $ | 51,174,088 | |
Reinvested | | 417,247 | | | | 4,674,751 | | | 749,319 | | | | 8,166,096 | |
Repurchased | | (1,764,063 | ) | | | (19,904,287 | ) | | (3,520,939 | ) | | | (38,449,323 | ) |
| | | | | | | | | | | | | | |
Total | | 2,983,973 | | | $ | 33,552,290 | | | 1,866,341 | | | $ | 20,890,861 | |
| | | | | | | | | | | | | | |
Substantially all of the Series’ shares represent investments by fiduciary accounts over which the Advisor has sole investment discretion.
The Series may trade in instruments including written and purchased options, forward foreign currency exchange contracts and futures contracts and other derivatives in the normal course of investing activities to assist in managing exposure to various market risks. The Series may be subject to various elements of risk and may involve, to a varying degree, elements of risk in excess of the amounts recognized for financial statement purposes. These risks include: the risk that changes in the value of a derivative may not correlate perfectly with the underlying asset, rate or index, counterparty credit risk related to over the counter derivatives counterparties’ failure to perform under contract terms, liquidity risk related to the lack of a liquid market for these contracts allowing the fund to close out
25
Notes to Financial Statements (unaudited)
| 6. | FINANCIAL INSTRUMENTS (continued) |
its position(s) and documentation risk relating to disagreement over contract terms. No such investments were held by the Series during the six months ended June 30, 2010.
| 7. | FEDERAL INCOME TAX INFORMATION |
The amount and characterization of certain income and capital gains to be distributed are determined in accordance with federal income tax regulations, which may differ from accounting principles generally accepted in the United States of America. The Series may periodically make reclassifications among its capital accounts to reflect income and gains available for distribution (or available capital loss carryovers) under income tax regulations without impacting the Series’ net asset value. Any such reclassifications are not reflected in the financial highlights.
The final determination of the tax character of current year distributions will be made at the conclusion of the fiscal year. The tax character of distributions paid for the year ended December 31, 2009 were as follows:
| | | |
Ordinary income | | $ | 42,152 |
Tax exempt income | | | 8,218,398 |
Long-term capital gains | | | 515,923 |
At June 30, 2010, the identified cost of investments for federal income tax purposes, the resulting gross unrealized appreciation and depreciation, and the net unrealized appreciation were as follows:
| | | | |
Cost for federal income tax purposes | | $ | 261,449,934 | |
Unrealized appreciation | | $ | 7,678,879 | |
Unrealized depreciation | | | (1,190,484 | ) |
| | | | |
Net unrealized appreciation | | $ | 6,488,395 | |
| | | | |
There were no subsequent events that require recognition or disclosure. In preparing these financial statements, management of the Fund has evaluated events and transactions for potential recognition or disclosure through the date the financial statements were issued.
26
Literature Requests (unaudited)
Proxy Voting Policies and Procedures
A description of the policies and procedures that the Fund uses to determine how to vote proxies relating to portfolio securities is available, without charge, upon request:
| | |
By phone | | 1-800-466-3863 |
On the Securities and Exchange | | |
Commission’s (SEC) web site | | http://www.sec.gov |
Proxy Voting Record
Information regarding how the Fund voted proxies relating to portfolio securities during the most recent 12-month period ended June 30th is available, without charge, upon request:
| | |
By phone | | 1-800-466-3863 |
On the SEC’s web site | | http://www.sec.gov |
Quarterly Portfolio Holdings
The Series’ complete schedule of portfolio holdings for the 1st and 3rd quarters of each fiscal year are provided on Form N-Q, and are available, without charge, upon request:
| | |
By phone | | 1-800-466-3863 |
On the SEC’s web site | | http://www.sec.gov |
The Series’ Form N-Q may be reviewed and copied at the SEC’s Public Reference Room in Washington, D.C. Information on the operation of the Public Reference Room may be obtained by calling 1-800-SEC-0330.
Prospectus and Statement of Additional Information (SAI)
The prospectus and SAI provide additional information about each Series, including charges, expenses and risks. These documents are available, without charge, upon request:
| | |
By phone | | 1-800-466-3863 |
On the SEC’s web site | | http://www.sec.gov |
On the Advisor’s web site | | http://www.manningnapieradvisors.com |
Additional information available at www.manningnapieradvisors.com
1. Fund Holdings - Month-End
2. Fund Holdings - Quarter-End
3. Shareholder Report - Annual
4. Shareholder Report - Semi-Annual
MNDTES-06/10-SAR
Shareholder Expense Example (unaudited)
As a shareholder of the Series, you may incur two types of costs: (1) transaction costs and (2) ongoing costs, including management fees and other Series expenses. This example is intended to help you understand your ongoing costs (in dollars) of investing in the Series and to compare these costs with the ongoing costs of investing in other mutual funds.
The example is based on an investment of $1,000 invested at the beginning of the period and held for the entire period (January 1, 2010 to June 30, 2010).
Actual Expenses
The first line of the table below provides information about actual account values and actual expenses. You may use the information in this line, together with the amount you invested, to estimate the expenses that you paid over the period. Simply divide your account value by $1,000 (for example, an $8,600 account value divided by $1,000 = 8.6), then multiply the result by the number in the first line under the heading entitled “Expenses Paid During Period” to estimate the expenses you paid on your account during this period.
Hypothetical Example for Comparison Purposes
The second line of the table below provides information about hypothetical account values and hypothetical expenses based on the Series’ actual expense ratio and an assumed rate of return of 5% per year before expenses, which is not the Series’ actual return. The hypothetical account values and expenses may not be used to estimate the actual ending account balance or expenses you paid during the period. You may use this information to compare the ongoing costs of investing in the Series and other funds. To do so, compare this 5% hypothetical example with the 5% hypothetical examples that appear in the shareholder reports of the other funds.
Please note that the expenses shown in the table are meant to highlight your ongoing costs only and do not reflect any transaction costs. Therefore, the second line of the table is useful in comparing ongoing costs only, and will not help you determine the relative total costs of owning different funds. In addition, if these transaction costs were included, your costs would have been higher.
| | | | | | |
| | | Beginning
Account Value
1/1/10 | | Ending
Account Value
6/30/10 | | Expenses Paid
During Period*
1/1/10-6/30/10 |
Actual | | $1,000.00 | | $1,024.80 | | $3.06 |
Hypothetical
(5% return before expenses) | | $1,000.00 | | $1,021.77 | | $3.06 |
*Expenses are equal to the Series’ annualized expense ratio (for the six-month period) of 0.61%, multiplied by the average account value over the period, multiplied by 181/365 (to reflect the one-half year period). Expenses are based on the most recent fiscal half year. The Series’ total return would have been lower had certain expenses not been waived during the period.
Portfolio Composition as of June 30, 2010 (unaudited)
2
Investment Portfolio - June 30, 2010 (unaudited)
| | | | | | | | | | |
| | | Coupon
Rate | | Maturity
Date | | Credit
Rating 1
(unaudited) | | Principal
Amount | | Value
(Note 2) |
NEW YORK MUNICIPAL BONDS - 96.0% | | | | | | | | | | |
Arlington Central School District, G.O. Bond, NATL | | 4.625% | | 12/15/2024 | | Aa2 | | $ 845,000 | | $ 869,868 |
Arlington Central School District, G.O. Bond, NATL | | 4.625% | | 12/15/2025 | | Aa2 | | 365,000 | | 374,311 |
Bethlehem, Public Impt., G.O. Bond | | 4.500% | | 12/1/2033 | | AA2 | | 335,000 | | 343,730 |
Bethlehem, Public Impt., G.O. Bond | | 4.500% | | 12/1/2035 | | AA2 | | 425,000 | | 434,554 |
Briarcliff Manor, Public Impt., Series A, G.O. Bond, AMBAC | | 4.000% | | 10/1/2025 | | Aa2 | | 280,000 | | 284,528 |
Brookhaven, Public Impt., G.O. Bond, FGRNA | | 4.000% | | 5/1/2023 | | Aa2 | | 900,000 | | 916,335 |
Brookhaven, Public Impt., G.O. Bond, FGRNA | | 4.000% | | 5/1/2024 | | Aa2 | | 815,000 | | 824,878 |
Buffalo Fiscal Stability Authority, Sales Tax & State Aid, Series B, Revenue Bond, NATL | | 5.000% | | 9/1/2016 | | Aa1 | | 525,000 | | 593,045 |
Chautauqua County, Public Impt., G.O. Bond | | 4.250% | | 1/15/2027 | | A2 | | 665,000 | | 664,202 |
Chautauqua County, Public Impt., Series B, G.O. Bond, NATL | | 4.500% | | 12/15/2018 | | Aa3 | | 485,000 | | 524,799 |
Cleveland Hill Union Free School District, G.O. Bond, AGM | | 3.750% | | 6/15/2025 | | AAA2 | | 475,000 | | 474,183 |
Clifton Park Water Authority, Revenue Bond | | 4.250% | | 10/1/2029 | | AA2 | | 250,000 | | 248,360 |
Dryden Central School District, G.O. Bond, AGM | | 5.500% | | 6/15/2011 | | Aa3 | | 200,000 | | 208,650 |
Dutchess County, Public Impt., Prerefunded Balance, G.O. Bond, NATL | | 4.000% | | 12/15/2016 | | Aa1 | | 315,000 | | 353,644 |
Dutchess County, Public Impt., Unrefunded Balance, G.O. Bond, NATL | | 4.000% | | 12/15/2016 | | Aa1 | | 360,000 | | 388,152 |
East Rochester Union Free School District, G.O. Bond | | 3.500% | | 3/15/2023 | | AA2 | | 380,000 | | 380,950 |
Franklin Square Union Free School District, G.O. Bond, FGRNA | | 5.000% | | 1/15/2021 | | Aa2 | | 520,000 | | 530,410 |
Gates Chili Central School District, G.O. Bond | | 2.500% | | 6/15/2016 | | Aa3 | | 555,000 | | 566,400 |
Gates Chili Central School District, G.O. Bond | | 3.000% | | 6/15/2017 | | Aa3 | | 590,000 | | 611,293 |
Geneva, Public Impt., G.O. Bond, AGM | | 3.250% | | 5/15/2018 | | Aa3 | | 590,000 | | 608,974 |
Greece Central School District, G.O. Bond, AGM | | 4.000% | | 6/15/2019 | | Aa3 | | 2,675,000 | | 2,867,038 |
Hampton Bays Union Free School District, G.O. Bond, AGM | | 4.250% | | 9/15/2026 | | Aa3 | | 1,140,000 | | 1,169,344 |
Haverstraw-Stony Point Central School District, G.O. Bond, AGM | | 4.500% | | 10/15/2032 | | Aa2 | | 2,000,000 | | 2,004,820 |
Hempstead, Public Impt., Series A, G.O. Bond | | 4.000% | | 4/15/2021 | | Aaa | | 1,500,000 | | 1,597,305 |
Johnson City Central School District, G.O. Bond, FGRNA | | 4.250% | | 6/15/2024 | | A2 | | 500,000 | | 502,345 |
Johnson City Central School District, G.O. Bond, FGRNA | | 4.375% | | 6/15/2028 | | A2 | | 1,000,000 | | 991,380 |
Johnson City Central School District, G.O. Bond, FGRNA | | 4.375% | | 6/15/2030 | | A2 | | 985,000 | | 953,618 |
| | | | |
| | The accompanying notes are an integral part of the financial statements. | | 3 |
Investment Portfolio - June 30, 2010 (unaudited)
| | | | | | | | | | |
| | | Coupon
Rate | | Maturity
Date | | Credit
Rating 1
(unaudited) | | Principal
Amount | | Value
(Note 2) |
NEW YORK MUNICIPAL BONDS (continued) | | | | | | | | | | |
Lake George Central School District, G.O. Bond | | 3.750% | | 7/15/2025 | | AA2 | | $ 335,000 | | $ 331,764 |
Long Island Power Authority, Electric Systems, Series A, Revenue Bond | | 5.750% | | 4/1/2039 | | A3 | | 675,000 | | 741,069 |
Long Island Power Authority, Electric Systems, Series A, Revenue Bond, FGRNA | | 5.000% | | 12/1/2019 | | A3 | | 1,000,000 | | 1,097,020 |
Long Island Power Authority, Electric Systems, Series A, Revenue Bond, FGRNA | | 5.000% | | 12/1/2025 | | A3 | | 1,690,000 | | 1,771,880 |
Long Island Power Authority, Electric Systems, Series F, Revenue Bond, NATL | | 4.500% | | 5/1/2028 | | A3 | | 1,880,000 | | 1,889,156 |
Maine-Endwell Central School District, G.O. Bond, AGC | | 4.000% | | 6/15/2025 | | AAA2 | | 1,000,000 | | 1,011,260 |
Mamaroneck Union Free School District, G.O. Bond | | 3.500% | | 6/15/2025 | | Aaa | | 1,000,000 | | 983,380 |
Metropolitan Transportation Authority, Dedicated Tax Fund, Series A, Revenue Bond, NATL | | 5.000% | | 11/15/2030 | | Aa3 | | 750,000 | | 772,283 |
Metropolitan Transportation Authority, Dedicated Tax Fund, Series B, Revenue Bond | | 5.000% | | 11/15/2034 | | AA2 | | 1,000,000 | | 1,047,990 |
Metropolitan Transportation Authority, Series A, Revenue Bond, AGM | | 5.000% | | 11/15/2030 | | Aa3 | | 500,000 | | 511,570 |
Metropolitan Transportation Authority, Series A, Revenue Bond, FGRNA | | 5.000% | | 11/15/2025 | | A2 | | 1,500,000 | | 1,538,040 |
Metropolitan Transportation Authority, Series B, Revenue Bond, AGM | | 4.500% | | 11/15/2032 | | Aa3 | | 500,000 | | 494,415 |
Metropolitan Transportation Authority, Series F, Revenue Bond | | 5.000% | | 11/15/2030 | | A2 | | 640,000 | | 655,098 |
Minisink Valley Central School District, G.O. Bond | | 3.500% | | 4/15/2025 | | AA2 | | 900,000 | | 872,307 |
Monroe County Water Authority, Revenue Bond | | 4.250% | | 8/1/2030 | | Aa2 | | 405,000 | | 405,976 |
Monroe County Water Authority, Revenue Bond | | 4.500% | | 8/1/2035 | | Aa2 | | 275,000 | | 274,989 |
Monroe County, Public Impt., G.O. Bond, AMBAC | | 4.125% | | 6/1/2020 | | A3 | | 1,000,000 | | 1,004,840 |
Nassau County Interim Finance Authority, Sales Tax Secured, Series A, Revenue Bond, AMBAC | | 4.750% | | 11/15/2023 | | Aa1 | | 1,000,000 | | 1,042,760 |
Nassau County, General Impt., Series C, G.O. Bond, AGC | | 5.000% | | 10/1/2028 | | Aa3 | | 1,000,000 | | 1,082,270 |
Nassau County, Public Impt., Series A, G.O. Bond, AGC | | 5.000% | | 5/1/2022 | | Aa3 | | 500,000 | | 561,530 |
New Hyde Park & Garden City Park, Union Free School District, G.O. Bond, AGM | | 4.125% | | 6/15/2023 | | Aa2 | | 200,000 | | 204,514 |
| | | | |
| 4 | | The accompanying notes are an integral part of the financial statements. | | |
Investment Portfolio - June 30, 2010 (unaudited)
| | | | | | | | | | |
| | | Coupon
Rate | | Maturity
Date | | Credit
Rating 1
(unaudited) | | Principal
Amount | | Value
(Note 2) |
NEW YORK MUNICIPAL BONDS (continued) | | | | | | | | | | |
New Hyde Park & Garden City Park, Union Free School District, G.O. Bond, AGM | | 4.125% | | 6/15/2024 | | Aa2 | | $ 250,000 | | $ 254,383 |
New York City Municipal Water Finance Authority, Water & Sewer Systems, Series A, Revenue Bond | | 4.250% | | 6/15/2033 | | Aa1 | | 1,250,000 | | 1,234,625 |
New York City Municipal Water Finance Authority, Water & Sewer Systems, Series A, Revenue Bond | | 4.500% | | 6/15/2037 | | Aa1 | | 1,000,000 | | 987,670 |
New York City Municipal Water Finance Authority, Water & Sewer Systems, Series A, Revenue Bond | | 5.750% | | 6/15/2040 | | Aa1 | | 1,000,000 | | 1,126,970 |
New York City Municipal Water Finance Authority, Water & Sewer Systems, Series A, Revenue Bond, AMBAC | | 5.000% | | 6/15/2035 | | Aa1 | | 750,000 | | 767,145 |
New York City Municipal Water Finance Authority, Water & Sewer Systems, Series D, Revenue Bond, AMBAC | | 4.500% | | 6/15/2036 | | Aa1 | | 500,000 | | 494,700 |
New York City Municipal Water Finance Authority, Water & Sewer Systems, Series E, Revenue Bond, FGRNA | | 5.000% | | 6/15/2026 | | Aa1 | | 750,000 | | 769,440 |
New York City, G.O. Bond, XLCA | | 5.000% | | 9/1/2019 | | Aa2 | | 500,000 | | 548,090 |
New York City, Series A, G.O. Bond, CIFG | | 5.000% | | 8/1/2024 | | Aa2 | | 1,000,000 | | 1,062,460 |
New York City, Series G, G.O. Bond | | 5.000% | | 8/1/2023 | | Aa2 | | 1,250,000 | | 1,352,875 |
New York Municipal Bond Bank Agency, Revenue Bond, AGM | | 5.000% | | 4/15/2018 | | AAA2 | | 1,000,000 | | 1,127,630 |
New York Municipal Bond Bank Agency, Series A1, Revenue Bond, AGM | | 5.000% | | 5/15/2017 | | AAA2 | | 215,000 | | 242,881 |
New York State Dormitory Authority, Columbia University, Revenue Bond | | 5.000% | | 7/1/2038 | | Aaa | | 900,000 | | 953,523 |
New York State Dormitory Authority, Columbia University, Series A, Revenue Bond | | 5.000% | | 7/1/2025 | | Aaa | | 500,000 | | 520,400 |
New York State Dormitory Authority, Cornell University, Series C, Revenue Bond | | 5.000% | | 7/1/2037 | | Aa1 | | 1,000,000 | | 1,058,090 |
New York State Dormitory Authority, Education, Series F, Revenue Bond | | 5.000% | | 3/15/2023 | | Aa3 | | 1,475,000 | | 1,572,571 |
New York State Dormitory Authority, New York University, Series A, Revenue Bond | | 5.000% | | 7/1/2039 | | Aa3 | | 1,000,000 | | 1,044,960 |
New York State Dormitory Authority, Series A, Revenue Bond, AGM | | 5.000% | | 10/1/2018 | | Aa3 | | 250,000 | | 281,145 |
New York State Dormitory Authority, Series A, Revenue Bond, AGM | | 5.000% | | 10/1/2021 | | Aa3 | | 250,000 | | 279,022 |
New York State Dormitory Authority, Series A, Revenue Bond, AGM | | 4.000% | | 10/1/2025 | | Aa3 | | 1,500,000 | | 1,478,025 |
| | | | |
| | The accompanying notes are an integral part of the financial statements. | | 5 |
Investment Portfolio - June 30, 2010 (unaudited)
| | | | | | | | | | |
| | | Coupon
Rate | | Maturity
Date | | Credit
Rating 1
(unaudited) | | Principal
Amount | | Value
(Note 2) |
NEW YORK MUNICIPAL BONDS (continued) | | | | | | | | | | |
New York State Dormitory Authority, Series A, Revenue Bond, AGM | | 4.375% | | 10/1/2030 | | Aa3 | | $1,500,000 | | $1,475,940 |
New York State Dormitory Authority, Series B, Revenue Bond, AGM | | 4.400% | | 10/1/2030 | | Aa3 | | 140,000 | | 136,490 |
New York State Dormitory Authority, Series B, Revenue Bond, AGM | | 4.750% | | 10/1/2040 | | Aa3 | | 1,360,000 | | 1,353,418 |
New York State Dormitory Authority, University of Rochester, Series A, Revenue Bond | | 5.125% | | 7/1/2039 | | Aa3 | | 1,000,000 | | 1,045,090 |
New York State Environmental Facilities Corp., Clean Water & Drinking, Revenue Bond | | 4.500% | | 6/15/2022 | | Aaa | | 300,000 | | 310,071 |
New York State Environmental Facilities Corp., Clean Water & Drinking, Revenue Bond, NATL | | 5.000% | | 6/15/2021 | | Aaa | | 600,000 | | 644,298 |
New York State Environmental Facilities Corp., Clean Water & Drinking, Series A, Revenue Bond | | 4.500% | | 6/15/2036 | | Aaa | | 1,000,000 | | 1,001,170 |
New York State Environmental Facilities Corp., Clean Water & Drinking, Series B, Revenue Bond | | 5.000% | | 6/15/2027 | | Aaa | | 1,000,000 | | 1,040,810 |
New York State Environmental Facilities Corp., Clean Water & Drinking, Series B, Revenue Bond | | 4.500% | | 6/15/2036 | | Aa1 | | 1,500,000 | | 1,499,970 |
New York State Environmental Facilities Corp., Personal Income Tax, Series A, Revenue Bond | | 5.000% | | 12/15/2019 | | AAA2 | | 750,000 | | 825,548 |
New York State Environmental Facilities Corp., Pollution Control, Unrefunded Balance, Series A, Revenue Bond | | 5.200% | | 6/15/2015 | | Aaa | | 25,000 | | 25,088 |
New York State Environmental Facilities Corp., Pollution Control, Unrefunded Balance, Series B, Revenue Bond | | 5.200% | | 5/15/2014 | | Aaa | | 440,000 | | 470,901 |
New York State Housing Finance Agency, State University Construction, Series A, Revenue Bond | | 8.000% | | 5/1/2011 | | Aa3 | | 65,000 | | 67,558 |
New York State Municipal Bond Bank Agency, Series B1, Revenue Bond | | 4.125% | | 12/15/2029 | | A2 | | 420,000 | | 409,017 |
New York State Municipal Bond Bank Agency, Series B1, Revenue Bond | | 4.500% | | 12/15/2034 | | A2 | | 215,000 | | 210,930 |
New York State Power Authority, Series A, Revenue Bond, NATL | | 4.500% | | 11/15/2047 | | Aa2 | | 2,000,000 | | 1,975,280 |
New York State Thruway Authority, Highway & Bridge, Prerefunded Balance, Series A, Revenue Bond, FGIC | | 5.500% | | 4/1/2015 | | Aa2 | | 320,000 | | 335,920 |
| | | | |
| 6 | | The accompanying notes are an integral part of the financial statements. | | |
Investment Portfolio - June 30, 2010 (unaudited)
| | | | | | | | | | |
| | | Coupon
Rate | | Maturity
Date | | Credit
Rating 1
(unaudited) | | Principal
Amount | | Value
(Note 2) |
NEW YORK MUNICIPAL BONDS (continued) | | | | | | | | | | |
New York State Thruway Authority, Highway & Bridge, Prerefunded Balance, Series B, Revenue Bond, NATL | | 5.250% | | 4/1/2016 | | AAA2 | | $ 300,000 | | $ 318,672 |
New York State Thruway Authority, Highway & Bridge, Series B, Revenue Bond, AMBAC | | 5.000% | | 4/1/2021 | | AA2 | | 1,500,000 | | 1,621,770 |
New York State Thruway Authority, Highway & Bridge, Series C, Revenue Bond, AMBAC | | 5.000% | | 4/1/2020 | | Aa3 | | 750,000 | | 794,528 |
New York State Thruway Authority, Highway & Bridge, Series C, Revenue Bond, NATL | | 5.250% | | 4/1/2011 | | Aa2 | | 1,000,000 | | 1,036,450 |
New York State Thruway Authority, Personal Income Tax, Prerefunded Balance, Series A, Revenue Bond, AGM | | 5.000% | | 3/15/2014 | | Aa3 | | 500,000 | | 557,760 |
New York State Thruway Authority, Personal Income Tax, Prerefunded Balance, Series A, Revenue Bond, NATL | | 5.000% | | 3/15/2016 | | AAA2 | | 300,000 | | 334,656 |
New York State Thruway Authority, Series F, Revenue Bond, AMBAC | | 5.000% | | 1/1/2026 | | A1 | | 340,000 | | 351,900 |
New York State Urban Development Corp., Correctional Capital Facilities, Series A, Revenue Bond, AGM | | 5.250% | | 1/1/2014 | | Aa3 | | 500,000 | | 533,820 |
New York State Urban Development Corp., Personal Income Tax, Series C, Revenue Bond, NATL | | 4.250% | | 3/15/2024 | | Baa1 | | 1,000,000 | | 1,033,700 |
New York State Urban Development Corp., Service Contract, Series B, Revenue Bond | | 5.250% | | 1/1/2022 | | AA2 | | 2,350,000 | | 2,586,645 |
New York State, Series A, G.O. Bond | | 4.600% | | 3/15/2013 | | Aa2 | | 475,000 | | 491,991 |
New York State, Series A, G.O. Bond | | 4.500% | | 3/15/2019 | | Aa2 | | 500,000 | | 535,410 |
New York State, Series A, G.O. Bond | | 4.500% | | 3/1/2040 | | Aa2 | | 1,500,000 | | 1,490,190 |
New York State, Series C, G.O. Bond, AGM | | 5.000% | | 4/15/2012 | | Aa2 | | 700,000 | | 754,803 |
Niagara County, Series B, G.O. Bond, NATL | | 5.200% | | 1/15/2011 | | Baa1 | | 400,000 | | 409,948 |
Niagara Falls City School District, G.O. Bond, AGM | | 4.375% | | 9/15/2029 | | AAA2 | | 885,000 | | 894,275 |
Niagara-Wheatfield Central School District, G.O. Bond, FGRNA | | 4.125% | | 2/15/2019 | | Aa3 | | 610,000 | | 655,799 |
Niagara-Wheatfield Central School District, G.O. Bond, FGRNA | | 4.125% | | 2/15/2020 | | Aa3 | | 850,000 | | 898,816 |
Niskayuna Central School District, G.O Bond, AGC | | 4.000% | | 4/15/2022 | | Aa2 | | 400,000 | | 416,124 |
Palmyra Macedon Central School District, G.O. Bond | | 3.750% | | 6/15/2024 | | Aa3 | | 500,000 | | 503,315 |
Penfield Central School District, G.O. Bond | | 4.000% | | 6/15/2024 | | Aa2 | | 1,025,000 | | 1,057,492 |
Perinton, Public Impt., G.O. Bond | | 4.250% | | 12/15/2031 | | AA2 | | 175,000 | | 175,810 |
Phelps-Clifton Springs Central School District, Series B, G.O. Bond, NATL | | 5.000% | | 6/15/2021 | | A1 | | 850,000 | | 888,454 |
| | | | |
| | The accompanying notes are an integral part of the financial statements. | | 7 |
Investment Portfolio - June 30, 2010 (unaudited)
| | | | | | | | | | |
| | | Coupon
Rate | | Maturity
Date | | Credit
Rating 1
(unaudited) | | Principal
Amount | | Value
(Note 2) |
NEW YORK MUNICIPAL BONDS (continued) | | | | | | | | | | |
Phelps-Clifton Springs Central School District, Series B, G.O. Bond, NATL | | 5.000% | | 6/15/2022 | | A1 | | $ 450,000 | | $ 469,264 |
Pleasantville Union Free School District, G.O. Bond | | 4.250% | | 5/1/2038 | | Aa2 | | 500,000 | | 482,630 |
Pleasantville Union Free School District, G.O. Bond | | 4.375% | | 5/1/2039 | | Aa2 | | 500,000 | | 488,040 |
Port Authority of New York & New Jersey, Revenue Bond | | 5.000% | | 7/15/2024 | | Aa2 | | 3,000,000 | | 3,330,540 |
Port Authority of New York & New Jersey, Revenue Bond | | 4.750% | | 7/15/2030 | | Aa2 | | 495,000 | | 515,810 |
Port Authority of New York & New Jersey, Revenue Bond | | 5.000% | | 10/1/2030 | | Aa2 | | 1,000,000 | | 1,058,750 |
Port Authority of New York & New Jersey, Revenue Bond | | 4.500% | | 10/15/2037 | | Aa2 | | 400,000 | | 402,088 |
Pulaski Central School District, Series A, G.O. Bond, FGRNA | | 4.500% | | 6/15/2026 | | A2 | | 425,000 | | 435,935 |
Ramapo, Public Impt., Series B, G.O. Bond, NATL | | 4.375% | | 5/1/2031 | | Aa2 | | 435,000 | | 439,333 |
Ramapo, Public Impt., Series B, G.O. Bond, NATL | | 4.375% | | 5/1/2032 | | Aa2 | | 510,000 | | 514,024 |
Ramapo, Public Impt., Series B, G.O. Bond, NATL | | 4.500% | | 5/1/2033 | | Aa2 | | 410,000 | | 412,907 |
Ravena Coeymans Selkirk Central School District, G.O. Bond, AGM | | 4.250% | | 6/15/2014 | | Aa3 | | 1,180,000 | | 1,290,247 |
Rochester, Series A, G.O. Bond, AMBAC | | 5.000% | | 8/15/2020 | | Aa3 | | 250,000 | | 290,832 |
Rochester, Series A, G.O. Bond, AMBAC | | 5.000% | | 8/15/2022 | | A2 | | 95,000 | | 110,697 |
Sachem Central School District of Holbrook, G.O. Bond, FGRNA | | 4.250% | | 10/15/2028 | | AA2 | | 330,000 | | 333,432 |
Sachem Central School District of Holbrook, G.O. Bond, FGRNA | | 4.375% | | 10/15/2030 | | AA2 | | 1,000,000 | | 1,007,880 |
Sachem Central School District of Holbrook, Series B, G.O. Bond, FGRNA | | 4.250% | | 10/15/2026 | | AA2 | | 1,200,000 | | 1,223,844 |
Saratoga County Water Authority, Water Utility Impt., Revenue Bond | | 5.000% | | 9/1/2038 | | AA2 | | 950,000 | | 989,368 |
Saratoga County, Public Impt., Series A, G.O. Bond | | 4.750% | | 7/15/2036 | | Aa1 | | 820,000 | | 842,599 |
Schenectady, G.O. Bond, NATL | | 5.300% | | 2/1/2011 | | A1 | | 250,000 | | 250,945 |
Schroon Lake Central School District, G.O. Bond, AGM | | 4.000% | | 6/15/2027 | | Aa3 | | 490,000 | | 495,620 |
Schuylerville Central School District, G.O. Bond, AGM | | 4.000% | | 6/15/2025 | | AAA2 | | 500,000 | | 512,185 |
Somers Central School District, G.O. Bond, NATL | | 4.000% | | 12/1/2023 | | Aa2 | | 400,000 | | 406,268 |
| | | | |
| 8 | | The accompanying notes are an integral part of the financial statements. | | |
Investment Portfolio - June 30, 2010 (unaudited)
| | | | | | | | | | |
| | | Coupon
Rate | | Maturity
Date | | Credit
Rating 1
(unaudited) | | Principal
Amount | | Value
(Note 2) |
NEW YORK MUNICIPAL BONDS (continued) | | | | | | | | | | |
South Glens Falls Central School District, Unrefunded Balance, G.O. Bond, FGRNA | | 5.375% | | 6/15/2018 | | A1 | | $ 95,000 | | $ 97,452 |
Spencerport Fire District, G.O. Bond, AGC | | 4.500% | | 11/15/2031 | | AAA2 | | 290,000 | | 296,220 |
Spencerport Fire District, G.O. Bond, AGC | | 4.500% | | 11/15/2032 | | AAA2 | | 250,000 | | 254,393 |
St. Lawrence County, Public Impt., G.O. Bond, FGRNA | | 4.500% | | 5/15/2031 | | A2 | | 1,185,000 | | 1,173,861 |
St. Lawrence County, Public Impt., G.O. Bond, FGRNA | | 4.500% | | 5/15/2032 | | A2 | | 1,000,000 | | 984,900 |
Suffolk County Water Authority, Revenue Bond, NATL | | 4.500% | | 6/1/2027 | | Baa1 | | 1,160,000 | | 1,171,693 |
Suffolk County Water Authority, Series A, Revenue Bond | | 4.500% | | 6/1/2030 | | AA2 | | 640,000 | | 648,902 |
Suffolk County Water Authority, Series A, Revenue Bond, NATL | | 4.500% | | 6/1/2032 | | Baa1 | | 1,000,000 | | 1,002,330 |
Suffolk County, Public Impt., Series A, G.O. Bond, NATL | | 4.250% | | 5/1/2024 | | Aa2 | | 1,000,000 | | 1,023,680 |
Syracuse, Public Impt., Series A, G.O. Bond, FGRNA | | 4.250% | | 12/1/2028 | | A1 | | 600,000 | | 577,692 |
Syracuse, Public Impt., Series A, G.O. Bond, FGRNA | | 4.250% | | 12/1/2029 | | A1 | | 600,000 | | 566,568 |
Syracuse, Public Impt., Series A, G.O. Bond, NATL | | 4.250% | | 6/15/2023 | | A1 | | 690,000 | | 681,927 |
Syracuse, Public Impt., Series A, G.O. Bond, NATL | | 4.375% | | 6/15/2025 | | A1 | | 990,000 | | 969,230 |
Syracuse, Public Impt., Series C, G.O. Bond, AMBAC | | 5.400% | | 8/1/2017 | | A1 | | 700,000 | | 710,108 |
Syracuse, Public Impt., Series C, G.O. Bond, AMBAC | | 5.500% | | 8/1/2018 | | A1 | | 850,000 | | 862,351 |
Tarrytown Union Free School District, G.O. Bond, AMBAC | | 4.250% | | 1/15/2030 | | Aa2 | | 215,000 | | 215,841 |
Tarrytown Union Free School District, G.O. Bond, AMBAC | | 4.375% | | 1/15/2032 | | Aa2 | | 1,090,000 | | 1,092,376 |
Triborough Bridge & Tunnel Authority, General Purposes, Prerefunded Balance, Series A, Revenue Bond, NATL | | 4.750% | | 1/1/2019 | | AA2 | | 300,000 | | 349,245 |
Triborough Bridge & Tunnel Authority, General Purposes, Prerefunded Balance, Series A, Revenue Bond, NATL | | 5.000% | | 1/1/2032 | | AAA2 | | 1,695,000 | | 1,813,023 |
Triborough Bridge & Tunnel Authority, General Purposes, Series B, Revenue Bond | | 5.000% | | 11/15/2020 | | Aa2 | | 750,000 | | 813,082 |
Triborough Bridge & Tunnel Authority, General Purposes, Unrefunded Balance, Series A, Revenue Bond, NATL | | 5.000% | | 1/1/2032 | | Aa2 | | 305,000 | | 313,955 |
| | | | |
| | The accompanying notes are an integral part of the financial statements. | | 9 |
Investment Portfolio - June 30, 2010 (unaudited)
| | | | | | | | | | |
| | | Coupon
Rate | | Maturity
Date | | Credit
Rating 1
(unaudited) | | Principal
Amount/
Shares | | Value
(Note 2) |
NEW YORK MUNICIPAL BONDS (continued) | | | | | | | | | | |
Triborough Bridge & Tunnel Authority, Series C, Revenue Bond | | 5.000% | | 11/15/2038 | | Aa2 | | $ 900,000 | | $ 940,005 |
Triborough Bridge & Tunnel Authority, Subordinate Bonds, Revenue Bond, FGRNA . | | 5.000% | | 11/15/2032 | | Aa3 | | 1,000,000 | | 1,023,930 |
Ulster County, Public Impt., G.O. Bond, XLCA | | 4.500% | | 11/15/2026 | | AA2 | | 560,000 | | 577,237 |
Union Endicott Central School District, G.O. Bond, FGRNA | | 4.125% | | 6/15/2014 | | A2 | | 605,000 | | 659,063 |
Union Endicott Central School District, G.O. Bond, FGRNA | | 4.125% | | 6/15/2015 | | A2 | | 865,000 | | 943,066 |
Village of Fayetteville, Public Impt., Series A, G.O. Bond, AGM | | 4.000% | | 6/15/2025 | | AAA2 | | 555,000 | | 562,909 |
Wayne County, Public Impt., G.O. Bond, NATL | | 4.125% | | 6/1/2024 | | Aa2 | | 500,000 | | 509,600 |
West Seneca Central School District, G.O. Bond, AGM | | 5.000% | | 5/1/2011 | | Aa3 | | 300,000 | | 311,757 |
Westchester County, Series B, G.O. Bond | | 4.300% | | 12/15/2011 | | Aaa | | 15,000 | | 15,876 |
Westchester County, Series B, G.O. Bond | | 3.700% | | 12/15/2015 | | Aaa | | 1,000,000 | | 1,070,410 |
Westhampton Beach Union Free School District, G.O. Bond, NATL | | 4.000% | | 7/15/2018 | | Aa2 | | 726,000 | | 772,319 |
White Plains City School District, Series B, G.O. Bond | | 4.650% | | 5/15/2031 | | Aa2 | | 685,000 | | 699,008 |
Yonkers, Series B, G.O. Bond, NATL | | 5.000% | | 8/1/2023 | | A2 | | 1,125,000 | | 1,146,589 |
Yonkers, Series B, G.O. Bond, NATL | | 5.000% | | 8/1/2030 | | A2 | | 1,095,000 | | 1,085,364 |
| | | | | | | | | | |
TOTAL MUNICIPAL BONDS
(Identified Cost $125,790,152) | | | | | | | | | | 129,146,859 |
| | | | | | | | | | |
| | | | | |
SHORT-TERM INVESTMENTS - 2.9% | | | | | | | | | | |
| | | | | |
Dreyfus BASIC New York Municipal Money Market Fund
(Identified Cost $3,915,607) | | | | | | | | 3,915,607 | | 3,915,607 |
| | | | | | | | | | |
TOTAL INVESTMENTS - 98.9%
(Identified Cost $129,705,759) | | | | | | | | | | 133,062,466 |
OTHER ASSETS, LESS LIABILITIES - 1.1% | | | | | | | | | | 1,544,930 |
| | | | | | | | | | |
NET ASSETS - 100% | | | | | | | | | | $ 134,607,396 |
| | | | | | | | | | |
| | | | |
| 10 | | The accompanying notes are an integral part of the financial statements. | | |
Investment Portfolio - June 30, 2010 (unaudited)
KEY:
G.O. Bond - General Obligation Bond
Impt. - Improvement
Scheduled principal and interest payments are guaranteed by:
AGC (Assured Guaranty Corp.)
AGM (Assurance Guaranty Municipal Corp.) (formerly known as FSA (Financial Security Assurance, Inc.))
AMBAC (AMBAC Assurance Corp.)
CIFG (CIFG North America, Inc.)
FGIC (Financial Guaranty Insurance Co.)
FGRNA (FGIC reinsured by NATL)
NATL (National Public Finance Guarantee Corp.) XLCA (XL Capital Assurance)
The insurance does not guarantee the market value of the municipal bonds.
1Credit ratings from Moody’s (unaudited).
2Credit ratings from S&P (unaudited).
The Series’ portfolio holds, as a percentage of net assets, greater than 10% in bonds insured by the following companies:
NATL - 34.3%; AGM - 15.7% .
| | | | |
| | The accompanying notes are an integral part of the financial statements. | | 11 |
Statement of Assets and Liabilities (unaudited)
June 30, 2010
| | | |
ASSETS: | | | |
| |
Investments, at value (identified cost $129,705,759) (Note 2) | | $ | 133,062,466 |
Interest receivable | | | 1,175,557 |
Receivable for fund shares sold | | | 563,614 |
Dividends receivable | | | 111 |
| | | |
| |
TOTAL ASSETS | | | 134,801,748 |
| | | |
| |
LIABILITIES: | | | |
| |
Accrued management fees (Note 3) | | | 55,123 |
Accrued transfer agent fees (Note 3) | | | 1,671 |
Accrued fund accounting and administration fees (Note 3) | | | 1,248 |
Accrued Chief Compliance Officer service fees (Note 3) | | | 820 |
Payable for fund shares repurchased | | | 116,018 |
Audit fees payable | | | 17,776 |
Other payables and accrued expenses | | | 1,696 |
| | | |
| |
TOTAL LIABILITIES | | | 194,352 |
| | | |
| |
TOTAL NET ASSETS | | $ | 134,607,396 |
| | | |
| |
NET ASSETS CONSIST OF: | | | |
| |
Capital stock | | $ | 126,667 |
Additional paid-in-capital | | | 130,466,241 |
Undistributed net investment income | | | 567,946 |
Accumulated net realized gain on investments | | | 89,835 |
Net unrealized appreciation on investments | | | 3,356,707 |
| | | |
| |
TOTAL NET ASSETS | | $ | 134,607,396 |
| | | |
| |
NET ASSET VALUE, OFFERING PRICE AND REDEMPTION PRICE PER SHARE - Class A ($134,607,396/12,666,687 shares) | | $ | 10.63 |
| | | |
| | | | |
| 12 | | The accompanying notes are an integral part of the financial statements. | | |
Statement of Operations (unaudited)
For the Six Months Ended June 30, 2010
| | | | |
INVESTMENT INCOME: | | | | |
| |
Interest | | $ | 2,454,373 | |
Dividends | | | 147 | |
| | | | |
| |
Total Investment Income | | | 2,454,520 | |
| | | | |
| |
EXPENSES: | | | | |
| |
Management fees (Note 3) | | | 299,960 | |
Fund accounting and administration fees (Note 3) | | | 29,916 | |
Directors’ fees (Note 3) | | | 6,373 | |
Transfer agent fees (Note 3) | | | 3,152 | |
Chief Compliance Officer service fees (Note 3) | | | 1,761 | |
Miscellaneous | | | 26,382 | |
| | | | |
| |
Total Expenses | | | 367,544 | |
Less reduction of expenses (Note 3) | | | (758 | ) |
| | | | |
| |
Net Expenses | | | 366,786 | |
| | | | |
| |
NET INVESTMENT INCOME | | | 2,087,734 | |
| | | | |
| |
REALIZED AND UNREALIZED GAIN ON INVESTMENTS: | | | | |
| |
Net realized gain on investments | | | 30,319 | |
Net change in unrealized appreciation on investments | | | 757,998 | |
| | | | |
| |
NET REALIZED AND UNREALIZED GAIN ON INVESTMENTS | | | 788,317 | |
| | | | |
| |
NET INCREASE IN NET ASSETS RESULTING FROM OPERATIONS | | $ | 2,876,051 | |
| | | | |
| | | | |
| | The accompanying notes are an integral part of the financial statements. | | 13 |
Statements of Changes in Net Assets
| | | | | | | | |
| | | For the Six
Months Ended
6/30/10
(unaudited) | | | For the
Year Ended
12/31/09 | |
INCREASE (DECREASE) IN NET ASSETS: | | | | | | | | |
| | |
OPERATIONS: | | | | | | | | |
| | |
Net investment income | | $ | 2,087,734 | | | $ | 3,752,622 | |
Net realized gain on investments | | | 30,319 | | | | 236,539 | |
Net change in unrealized appreciation on investments | | | 757,998 | | | | 7,946,641 | |
| | | | | | | | |
| | |
Net increase from operations | | | 2,876,051 | | | | 11,935,802 | |
| | | | | | | | |
| | |
DISTRIBUTIONS TO SHAREHOLDERS (Note 8): | | | | | | | | |
| | |
From net investment income | | | (2,097,563 | ) | | | (4,042,429 | ) |
From net realized gain on investments | | | — | | | | (341,360 | ) |
| | | | | | | | |
| | |
Total distributions to shareholders | | | (2,097,563 | ) | | | (4,383,789 | ) |
| | | | | | | | |
| | |
CAPITAL STOCK ISSUED AND REPURCHASED: | | | | | | | | |
| | |
Net increase from capital share transactions (Note 5) | | | 23,296,893 | | | | 5,778,371 | |
| | | | | | | | |
| | |
Net increase in net assets | | | 24,075,381 | | | | 13,330,384 | |
| | |
NET ASSETS: | | | | | | | | |
| | |
Beginning of period | | | 110,532,015 | | | | 97,201,631 | |
| | | | | | | | |
| | |
End of period (including undistributed net investment income of $567,946 and $577,775, respectively) | | $ | 134,607,396 | | | $ | 110,532,015 | |
| | | | | | | | |
| | | | |
| 14 | | The accompanying notes are an integral part of the financial statements. | | |
Financial Highlights
| | | | | | | | | | | | |
| | | For the Six
Months Ended
6/30/10 | | For the Years Ended |
| | | (unaudited) | | 12/31/09 | | 12/31/08 | | 12/31/07 | | 12/31/06 | | 12/31/05 |
Per share data (for a share outstanding throughout each period): | | | | | | | | | | | | |
Net asset value - Beginning of period | | $10.55 | | $9.79 | | $10.41 | | $10.44 | | $10.45 | | $10.58 |
| | | | | | | | | | | | |
Income (loss) from investment operations: | | | | | | | | | | | | |
Net investment income | | 0.181 | | 0.381 | | 0.38 | | 0.37 | | 0.38 | | 0.37 |
Net realized and unrealized gain (loss) on investments | | 0.08 | | 0.82 | | (0.63) | | (0.01) | | (0.02) | | (0.13) |
| | | | | | | | | | | | |
Total from investment operations | | 0.26 | | 1.20 | | (0.25) | | 0.36 | | 0.36 | | 0.24 |
| | | | | | | | | | | | |
Less distributions to shareholders: | | | | | | | | | | | | |
From net investment income | | (0.18) | | (0.41) | | (0.36) | | (0.37) | | (0.36) | | (0.36) |
From net realized gain on investments | | — | | (0.03) | | (0.01) | | (0.02) | | (0.01) | | (0.01) |
| | | | | | | | | | | | |
Total distributions to shareholders | | (0.18) | | (0.44) | | (0.37) | | (0.39) | | (0.37) | | (0.37) |
| | | | | | | | | | | | |
Net asset value - End of period | | $10.63 | | $10.55 | | $9.79 | | $10.41 | | $10.44 | | $10.45 |
| | | | | | | | | | | | |
Net assets - End of period
(000’s omitted) | | $134,607 | | $110,532 | | $97,202 | | $111,704 | | $92,910 | | $82,405 |
| | | | | | | | | | | | |
Total return2 | | 2.48% | | 12.46% | | (2.37%) | | 3.44% | | 3.48% | | 2.33% |
Ratios (to average net assets)/
Supplemental Data: | | | | | | | | | | | | |
Expenses* | | 0.61%3 | | 0.64% | | 0.64% | | 0.65% | | 0.68% | | 0.72% |
Net investment income | | 3.48%3 | | 3.64% | | 3.71% | | 3.66% | | 3.68% | | 3.55% |
Portfolio turnover | | 6% | | 10% | | 11% | | 7% | | 8% | | 6% |
* The investment advisor did not impose all or a portion of its management fees, CCO fees, fund accounting and transfer agent fees, and other fees in some periods and in some periods paid a portion of the Series’ expenses. If these expenses had been incurred by the Series, the expense ratio (to average net assets) would have been increased by the following amounts: |
| | 0.00%3,4 | | 0.00%4 | | N/A | | N/A | | N/A | | N/A |
1Calculated based on average shares outstanding during the periods.
2Represents aggregate total return for the periods indicated, and assumes reinvestment of all distributions. Total return would have been lower had certain expenses not been waived or reimbursed during the periods. Periods less than one year are not annualized.
3 Annualized.
4 Less than 0.01%.
| | | | |
| | The accompanying notes are an integral part of the financial statements. | | 15 |
Notes to Financial Statements (unaudited)
New York Tax Exempt Series (the “Series”) is a no-load diversified series of Manning & Napier Fund, Inc. (the “Fund”). The Fund is organized in Maryland and is registered under the Investment Company Act of 1940, as amended, as an open-end management investment company.
The Series’ investment objective is to provide as high a level of current income exempt from federal income tax and New York State personal income tax as the Advisor believes is consistent with the preservation of capital.
The Fund’s Advisor is Manning & Napier Advisors, Inc. (the “Advisor”). Shares of the Series are offered to investors, clients and employees of the Advisor and its affiliates. The total authorized capital stock of the Fund consists of 10.0 billion shares of common stock each having a par value of $0.01. As of June 30, 2010, 6.2 billion shares have been designated in total among 29 series, of which 100 million have been designated as New York Tax Exempt Series Class A common stock.
| 2. | SIGNIFICANT ACCOUNTING POLICIES |
Security Valuation
Municipal securities will normally be valued on the basis of market valuations provided by an independent pricing service (the “Service”). The Service utilizes the latest price quotations and a matrix system (which considers such factors as security prices of similar securities, yields, maturities and ratings). The Service has been approved by the Fund’s Board of Directors (the “Board”).
Short-term investments that mature in sixty days or less are valued at amortized cost, which approximates market value. Investments in open-end investment companies are valued at their net asset value per share on valuation date.
Volume and level of activity in established markets for an asset or liability are evaluated to determine whether recent transactions and quoted prices are determinative of fair value. Where there have been significant decreases in volume and level of activity, further analysis and adjustment may be necessary to estimate fair value. The Series measures fair value in these instances by the use of inputs and valuation techniques which may be based upon current market prices of securities that are comparable in coupon, rating, maturity and industry and/or expectation of future cash flows. As a result of trading in relatively thin markets and/or markets that experience significant volatility, the prices used by the Series to value these securities may differ from the value that would be realized if these securities were sold, and the differences could be material.
Securities for which representative valuations or prices are not available from the Fund’s pricing service may be valued at fair value. Due to the inherent uncertainty of valuations of such securities, the fair value may differ significantly from the values that would have been used had a ready market for such securities existed. If trading or events occurring after the close of the principal market in which securities are traded are expected to materially affect the value of those securities, then they may be valued at their fair value, taking this trading or these events into account. Fair value is determined in good faith by the Advisor under procedures approved by and under the general supervision and responsibility of the Board.
Various inputs are used in determining the value of the Series’ assets or liabilities carried at market value. These inputs are summarized in three broad levels. Level 1 includes quoted prices in active markets for identical assets and liabilities. Level 2 includes other significant observable inputs (including quoted prices for similar securities, interest rates, prepayment speeds, credit risk, etc.). Level 3 includes significant unobservable inputs (including the Series’ own assumptions in determining the fair value of investments). The inputs or methodology used for valuing securities are not necessarily an indication of the risk associated with investing in those securities.
16
Notes to Financial Statements (unaudited)
| 2. | SIGNIFICANT ACCOUNTING POLICIES (continued) |
Security Valuation (continued)
The following is a summary of the valuation levels used for major security types as of June 30, 2010 in valuing the Series’ assets or liabilities carried at market value:
| | | | | | | | | | | | |
| Description | | 6/30/10 | | Level 1 | | Level 2 | | Level 3 |
Equity securities* | | $ | — | | $ | — | | $ | — | | $ | — |
Preferred securities | | | — | | | — | | | — | | | — |
Debt securities: | | | | | | | | | | | | |
States and political subdivisions (municipals) | | | 129,146,859 | | | — | | | 129,146,859 | | | — |
Mutual funds | | | 3,915,607 | | | 3,915,607 | | | — | | | — |
Other financial instruments** | | | — | | | — | | | — | | | — |
| | | | | | | | | | | | |
Total | | $ | 133,062,466 | | $ | 3,915,607 | | $ | 129,146,859 | | $ | — |
| | | | | | | | | | | | |
*Includes common stock, warrants and rights. Please see the Investment Portfolio for industry classification.
**Other financial instruments are derivative instruments not reflected in the Investment Portfolio, such as futures, forwards and swap contracts, which are valued at the unrealized appreciation/depreciation on the instrument. As of June 30, 2010, the Series did not hold any derivative instruments.
There were no Level 3 securities held by the Series as of December 31, 2009 or June 30, 2010.
The Fund’s policy is to recognize transfers in and transfers out of the valuation levels as of the end of the reporting period. There were no significant transfers between Level 1 and Level 2 as of June 30, 2010.
Additional disclosure surrounding the activity in Level 3 fair value measurement will also be effective for fiscal years beginning after December 15, 2010. Management has concluded that this will not have a material impact on the Series’ financial statements.
Security Transactions, Investment Income and Expenses
Security transactions are accounted for on trade date. Dividend income is recorded on the ex-dividend date, except that if the ex-dividend date has passed, certain dividends from foreign securities are recorded as soon as the Fund is informed of the ex-dividend date. Non-cash dividends, if any, are recorded at the fair market value of the securities received. Interest income, including amortization of premium and accretion of discounts using the effective interest method, is earned from settlement date and accrued daily.
Expenses are recorded on an accrual basis. Most expenses of the Fund can be attributed to a specific series. Expenses which cannot be directly attributed are apportioned among the series in the Fund in such a manner as deemed equitable by the Fund’s Board, taking into consideration, among other things, the nature and type of expense.
The Series uses the identified cost method for determining realized gain or loss on investments for both financial statement and federal income tax reporting purposes.
Federal Taxes
The Series’ policy is to comply with the provisions of the Internal Revenue Code applicable to regulated investment companies. The Series is not subject to federal income tax or excise tax to the extent that the Series distributes to shareholders each year its taxable income, including any net realized gains on investments, in accordance with
17
Notes to Financial Statements (unaudited)
| 2. | SIGNIFICANT ACCOUNTING POLICIES (continued) |
Federal Taxes (continued)
requirements of the Internal Revenue Code. Accordingly, no provision for federal income tax or excise tax has been made in the financial statements.
Management evaluates its tax positions to determine if the tax positions taken meet the minimum recognition threshold in connection with accounting for uncertainties in income tax positions taken or expected to be taken for the purposes of measuring and recognizing tax liabilities in the financial statements. Recognition of tax benefits of an uncertain tax position is required only when the position is “more likely than not” to be sustained assuming examination by taxing authorities. At June 30, 2010, the Series has recorded no liability for net unrecognized tax benefits relating to uncertain income tax positions taken or expected to be taken in future tax returns.
The Series files income tax returns in the U.S. federal jurisdiction and various states, as required. No income tax returns are currently under investigation. The statute of limitations on the Series’ tax returns remains open for the years ended December 31, 2006 through December 31, 2009. The Fund is not aware of any tax positions for which it is reasonably possible that the total amounts of unrecognized tax benefits will significantly change in the next twelve months.
Distributions of Income and Gains
Distributions to shareholders of net investment income are made quarterly. Distributions of net realized gains are made annually. An additional distribution may be necessary to avoid taxation of the Series. Distributions are recorded on the ex-dividend date.
Indemnifications
The Fund’s organizational documents provide former and current directors and officers with a limited indemnification against liabilities arising in connection with the performance of their duties to the Fund. In the normal course of business, the Fund may also enter into contracts that provide general indemnifications. The Fund’s maximum exposure under these arrangements is unknown as this would be dependent on future claims that may be made against the Fund. The risk of material loss from such claims is considered remote.
Other
The preparation of financial statements in conformity with accounting principles generally accepted in the United States of America requires management to make estimates and assumptions that affect the reported amounts of assets and liabilities and the disclosure of contingent assets and liabilities at the date of the financial statements and the reported amounts of income and expenses during the reporting period. Actual results could differ from those estimates.
| 3. | TRANSACTIONS WITH AFFILIATES |
The Fund has an Investment Advisory Agreement (the “Agreement”) with the Advisor, for which the Series pays a fee, computed daily and payable monthly, at an annual rate of 0.50% of the Series’ average daily net assets.
Under the Agreement, personnel of the Advisor provide the Series with advice and assistance in the choice of investments and the execution of securities transactions, and otherwise maintain the Series’ organization. The Advisor also provides the Fund with necessary office space and fund administration and support services. The salaries of all officers of the Fund (except a percentage of the Fund’s Chief Compliance Officer’s salary, which is paid by the Fund), and of all Directors who are “affiliated persons” of the Fund, or of the Advisor, and all personnel of the Fund, or of the Advisor, performing services relating to research, statistical and investment activities, are paid by the Advisor. Each “non-affiliated” Director receives an annual stipend, which is allocated among all the active series of the Fund. In addition, these Directors also receive a fee per Board meeting attended for each active series of the Fund plus a fee for each committee meeting attended.
18
Notes to Financial Statements (unaudited)
| 3. | TRANSACTIONS WITH AFFILIATES (continued) |
The Advisor has contractually agreed, until at least April 30, 2011, to waive its fee and, if necessary, pay other operating expenses of the Series in order to maintain total direct annual fund operating expenses for the Series at no more than 0.85% of average daily net assets each year. For the six months ended June 30, 2010, the Advisor voluntarily waived fees of $758, which is reflected as a reduction of expenses on the Statement of Operations. The Advisor is not eligible to recoup any expenses that have been waived or reimbursed in prior years.
Manning & Napier Investor Services, Inc., a registered broker-dealer affiliate of the Advisor, acts as distributor for the Fund’s shares. The services of Manning & Napier Investor Services, Inc. are provided at no additional cost to the Series.
The Advisor has entered into agreements with PNC Global Investment Servicing (U.S.) Inc. (“PNCGIS”) under which PNCGIS serves as sub-accountant services agent and sub-transfer agent. The Fund pays the Advisor an annual fee of 0.0175% on the first $3 billion of average daily net assets (excluding Target Series); 0.015% on the next $3 billion of average daily net assets (excluding Target Series); and 0.01% of the average daily net assets in excess of $6 billion (excluding Target Series); plus a base fee of $25,500 per Series. Additionally, certain transaction-, account-, and cusip-based fees and out-of-pocket expenses, including charges for reporting relating to the Fund’s compliance program, are charged.
On July 1, 2010, The PNC Financial Services Group, Inc. sold the outstanding stock of PNC Global Investment Servicing Inc. to The Bank of New York Mellon Corporation. At the closing of the sale, PNCGIS changed its name to BNY Mellon Investment Servicing (US) Inc.
| 4. | PURCHASES AND SALES OF SECURITIES |
For the six months ended June 30, 2010, purchases and sales of securities, other than U.S. Government securities and short-term securities, were $29,134,914 and $6,559,150, respectively. There were no purchases or sales of U.S. Government securities.
| 5. | CAPITAL STOCK TRANSACTIONS |
Transactions in shares of New York Tax Exempt Series were:
| | | | | | | | | | | | | | |
| | | For the Six Months
Ended 6/30/10 | | | For the Year
Ended 12/31/09 | |
| | | Shares | | | Amount | | | Shares | | | Amount | |
Sold | | 2,487,254 | | | $ | 26,465,851 | | | 1,541,814 | | | $ | 16,071,689 | |
Reinvested | | 186,720 | | | | 1,976,067 | | | 399,655 | | | | 4,143,970 | |
Repurchased | | (483,357 | ) | | | (5,145,025 | ) | | (1,396,044 | ) | | | (14,437,288 | ) |
| | | | | | | | | | | | | | |
Total | | 2,190,617 | | | $ | 23,296,893 | | | 545,425 | | | $ | 5,778,371 | |
| | | | | | | | | | | | | | |
Substantially all of the Series’ shares represent investments by fiduciary accounts over which the Advisor has sole investment discretion.
The Series may trade in instruments including written and purchased options, forward foreign currency exchange contracts and futures contracts and other derivatives in the normal course of investing activities to assist in managing exposure to various market risks. The Series may be subject to various elements of risk and may involve, to a varying degree, elements of risk in excess of the amounts recognized for financial statement purposes. These risks include: the risk that changes in the value of a derivative may not correlate perfectly with the underlying asset, rate
19
Notes to Financial Statements (unaudited)
| 6. | FINANCIAL INSTRUMENTS (continued) |
or index, counterparty credit risk related to over the counter derivatives counterparties’ failure to perform under contract terms, liquidity risk related to the lack of a liquid market for these contracts allowing the fund to close out its position(s) and documentation risk relating to disagreement over contract terms. No such investments were held by the Series on June 30, 2010.
| 7. | CONCENTRATION OF CREDIT |
The Series primarily invests in debt obligations issued by the State of New York and its political subdivisions, agencies and public authorities to obtain funds for various public purposes. The Series is more susceptible to factors adversely affecting issues of New York municipal securities than is a municipal bond fund that is not concentrated in these issues to the same extent.
| 8. | FEDERAL INCOME TAX INFORMATION |
The amount and characterization of certain income and capital gains to be distributed are determined in accordance with federal income tax regulations, which may differ from accounting principles generally accepted in the United States of America. The Series may periodically make reclassifications among its capital accounts to reflect income and gains available for distribution (or available capital loss carryovers) under income tax regulations without impacting the Series’ net asset value. Any such reclassifications are not reflected in the financial highlights.
The final determination of the tax character of current year distributions will be made at the conclusion of the fiscal year. The tax character of distributions paid for the year ended December 31, 2009 were as follows:
| | | |
Ordinary income | | $ | 6,320 |
Tax exempt income | | | 4,036,109 |
Long-term capital gains | | | 341,360 |
At June 30, 2010, the identified cost of investments for federal income tax purposes, the resulting gross unrealized appreciation and depreciation, and the net unrealized appreciation were as follows:
| | | | |
Cost for federal income tax purposes | | $ | 129,705,759 | |
Unrealized appreciation | | $ | 3,641,830 | |
Unrealized depreciation | | | (285,123 | ) |
| | | | |
Net unrealized appreciation | | $ | 3,356,707 | |
| | | | |
There were no subsequent events that require recognition or disclosure. In preparing these financial statements, management of the Fund has evaluated events and transactions for potential recognition or disclosure through the date the financial statements were issued.
20
This Page Intentionally Left Blank
21
Literature Requests (unaudited)
Proxy Voting Policies and Procedures
A description of the policies and procedures that the Fund uses to determine how to vote proxies relating to portfolio securities is available, without charge, upon request:
| | |
By phone | | 1-800-466-3863 |
On the Securities and Exchange | | |
Commission’s (SEC) web site | | http://www.sec.gov |
Proxy Voting Record
Information regarding how the Fund voted proxies relating to portfolio securities during the most recent 12-month period ended June 30th is available, without charge, upon request:
| | |
By phone | | 1-800-466-3863 |
On the SEC’s web site | | http://www.sec.gov |
Quarterly Portfolio Holdings
The Series’ complete schedule of portfolio holdings for the 1st and 3rd quarters of each fiscal year are provided on Form N-Q, and are available, without charge, upon request:
| | |
By phone | | 1-800-466-3863 |
On the SEC’s web site | | http://www.sec.gov |
The Series’ Form N-Q may be reviewed and copied at the SEC’s Public Reference Room in Washington, D.C. Information on the operation of the Public Reference Room may be obtained by calling 1-800-SEC-0330.
Prospectus and Statement of Additional Information (SAI)
The prospectus and SAI provide additional information about each Series, including charges, expenses and risks. These documents are available, without charge, upon request:
| | |
By phone | | 1-800-466-3863 |
On the SEC’s web site | | http://www.sec.gov |
On the Advisor’s web site | | http://www.manningnapieradvisors.com |
Additional information available at www.manningnapieradvisors.com
1. Fund Holdings - Month-End
2. Fund Holdings - Quarter-End
3. Shareholder Report - Annual
4. Shareholder Report - Semi-Annual
MNNYTES-06/10-SAR

Shareholder Expense Example (unaudited)
As a shareholder of the Series, you may incur two types of costs: (1) transaction costs and (2) ongoing costs, including management fees and other Series expenses. This example is intended to help you understand your ongoing costs (in dollars) of investing in the Series and to compare these costs with the ongoing costs of investing in other mutual funds.
The example is based on an investment of $1,000 invested at the beginning of the period and held for the entire period (January 1, 2010 to June 30, 2010).
Actual Expenses
The first line of the table below provides information about actual account values and actual expenses. You may use the information in this line, together with the amount you invested, to estimate the expenses that you paid over the period. Simply divide your account value by $1,000 (for example, an $8,600 account value divided by $1,000 = 8.6), then multiply the result by the number in the first line under the heading entitled “Expenses Paid During Period” to estimate the expenses you paid on your account during this period.
Hypothetical Example for Comparison Purposes
The second line of the table below provides information about hypothetical account values and hypothetical expenses based on the Series’ actual expense ratio and an assumed rate of return of 5% per year before expenses, which is not the Series’ actual return. The hypothetical account values and expenses may not be used to estimate the actual ending account balance or expenses you paid during the period. You may use this information to compare the ongoing costs of investing in the Series and other funds. To do so, compare this 5% hypothetical example with the 5% hypothetical examples that appear in the shareholder reports of the other funds.
Please note that the expenses shown in the table are meant to highlight your ongoing costs only and do not reflect any transaction costs. Therefore, the second line of the table is useful in comparing ongoing costs only, and will not help you determine the relative total costs of owning different funds. In addition, if these transaction costs were included, your costs would have been higher.
| | | | | | |
| | | Beginning
Account Value
1/1/10 | | Ending
Account Value
6/30/10 | | Expenses Paid
During
Period*
1/1/10-6/30/10 |
Actual | | $1,000.00 | | $1,060.70 | | $3.88 |
Hypothetical
(5% return before expenses) | | $1,000.00 | | $1,021.03 | | $3.81 |
*Expenses are equal to the Series’ annualized expense ratio (for the six-month period) of 0.76%, multiplied by the average account value over the period, multiplied by 181/365 (to reflect the one-half year period). Expenses are based on the most recent fiscal half year. The Series’ total return would have been lower had certain expenses not been waived during the period.
Portfolio Composition as of June 30, 2010 (unaudited)
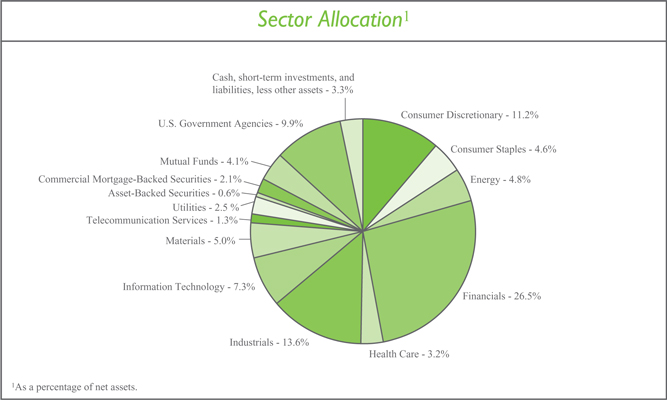
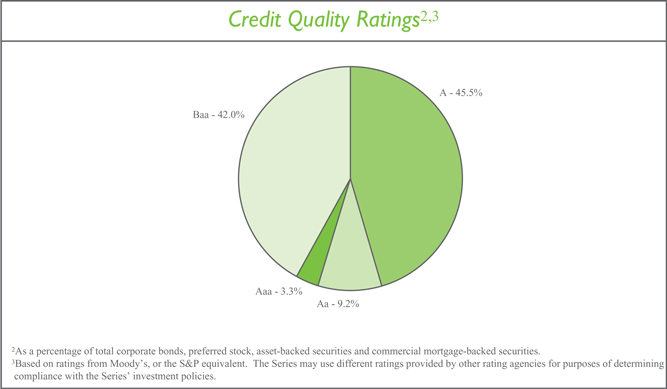
Investment Portfolio - June 30, 2010 (unaudited)
| | | | | | | | |
| | | Credit Rating 1
(unaudited) | | Principal Amount | | Value (Note 2) |
| | | |
CORPORATE BONDS - 78.6% | | | | | | | | |
| | | |
Convertible Corporate Bonds - 1.5% | | | | | | | | |
Consumer Discretionary - 0.3% | | | | | | | | |
Hotels, Restaurants & Leisure - 0.3% | | | | | | | | |
Carnival Corp., 2.00%, 4/15/2021 | | A3 | | $ | 305,000 | | $ | 315,675 |
| | | | | | | | |
Health Care - 0.7% | | | | | | | | |
Biotechnology - 0.6% | | | | | | | | |
Amgen, Inc., 0.375%, 2/1/2013 | | A3 | | | 530,000 | | | 523,375 |
| | | | | | | | |
Health Care Equipment & Supplies - 0.1% | | | | | | | | |
Medtronic, Inc., 1.625%, 4/15/2013 | | A1 | | | 120,000 | | | 120,300 |
| | | | | | | | |
Total Health Care | | | | | | | | 643,675 |
| | | | | | | | |
Information Technology - 0.5% | | | | | | | | |
Computers & Peripherals - 0.5% | | | | | | | | |
EMC Corp., 1.75%, 12/1/2013 | | A2 | | | 395,000 | | | 500,169 |
| | | | | | | | |
Total Convertible Corporate Bonds
(Identified Cost $1,500,324) | | | | | | | | 1,459,519 |
| | | | | | | | |
Non-Convertible Corporate Bonds - 77.1% | | | | | | | | |
Consumer Discretionary - 10.9% | | | | | | | | |
Hotels, Restaurants & Leisure - 1.2% | | | | | | | | |
International Game Technology, 7.50%, 6/15/2019 | | Baa2 | | | 1,025,000 | | | 1,190,241 |
| | | | | | | | |
Household Durables - 1.3% | | | | | | | | |
Newell Rubbermaid, Inc., 10.60%, 4/15/2019 | | Baa3 | | | 890,000 | | | 1,228,413 |
| | | | | | | | |
Media - 4.8% | | | | | | | | |
Comcast Corp., 6.50%, 11/15/2035 | | Baa1 | | | 570,000 | | | 619,878 |
Comcast Corp., 6.95%, 8/15/2037 | | Baa1 | | | 665,000 | | | 756,455 |
DIRECTV Holdings LLC, 5.20%, 3/15/2020 | | Baa2 | | | 775,000 | | | 807,715 |
Discovery Communications LLC, 5.05%, 6/1/2020 | | Baa2 | | | 880,000 | | | 914,732 |
Time Warner, Inc., 7.625%, 4/15/2031 | | Baa2 | | | 735,000 | | | 884,186 |
The Walt Disney Co., 5.50%, 3/15/2019 | | A2 | | | 500,000 | | | 576,262 |
| | | | | | | | |
| | | | | | | | 4,559,228 |
| | | | | | | | |
Multiline Retail - 0.8% | | | | | | | | |
Target Corp., 6.00%, 1/15/2018 | | A2 | | | 670,000 | | | 791,622 |
| | | | | | | | |
Specialty Retail - 2.2% | | | | | | | | |
The Home Depot, Inc., 5.40%, 3/1/2016 | | Baa1 | | | 1,065,000 | | | 1,185,359 |
Lowe’s Companies, Inc., 6.10%, 9/15/2017 | | A1 | | | 745,000 | | | 877,455 |
| | | | | | | | |
| | | | | | | | 2,062,814 |
| | | | | | | | |
Textiles, Apparel & Luxury Goods - 0.6% | | | | | | | | |
VF Corp., 5.95%, 11/1/2017 | | A3 | | | 485,000 | | | 551,722 |
| | | | | | | | |
Total Consumer Discretionary | | | | | | | | 10,384,040 |
| | | | | | | | |
| | | | |
| 3 | | The accompanying notes are an integral part of the financial statements. | | |
Investment Portfolio - June 30, 2010 (unaudited)
| | | | | | | | |
| | | Credit Rating 1
(unaudited) | | Principal Amount | | Value (Note 2) |
| | | |
CORPORATE BONDS (continued) | | | | | | | | |
| | | |
Non-Convertible Corporate Bonds (continued) | | | | | | | | |
Consumer Staples - 4.6% | | | | | | | | |
Beverages - 1.8% | | | | | | | | |
The Coca-Cola Co., 5.35%, 11/15/2017 | | Aa3 | | $ | 680,000 | | $ | 777,645 |
PepsiCo, Inc., 7.90%, 11/1/2018 | | Aa3 | | | 730,000 | | | 943,860 |
| | | | | | | | |
| | | | | | | | 1,721,505 |
| | | | | | | | |
Food & Staples Retailing - 0.7% | | | | | | | | |
The Kroger Co., 5.50%, 2/1/2013 | | Baa2 | | | 230,000 | | | 250,467 |
The Kroger Co., 6.15%, 1/15/2020 | | Baa2 | | | 335,000 | | | 386,983 |
| | | | | | | | |
| | | | | | | | 637,450 |
| | | | | | | | |
Food Products - 2.1% | | | | | | | | |
General Mills, Inc., 5.65%, 2/15/2019 | | Baa1 | | | 765,000 | | | 869,253 |
Grupo Bimbo SAB de CV (Mexico)3, 4.875%, 6/30/2020 | | Baa2 | | | 500,000 | | | 504,008 |
Kraft Foods, Inc., 6.125%, 2/1/2018 | | Baa2 | | | 565,000 | | | 641,217 |
| | | | | | | | |
| | | | | | | | 2,014,478 |
| | | | | | | | |
Total Consumer Staples | | | | | | | | 4,373,433 |
| | | | | | | | |
Energy - 4.8% | | | | | | | | |
Energy Equipment & Services - 2.9% | | | | | | | | |
Baker Hughes, Inc., 7.50%, 11/15/2018 | | A2 | | | 620,000 | | | 758,021 |
Weatherford International Ltd. (Switzerland), 9.625%, 3/1/2019 | | Baa1 | | | 1,635,000 | | | 1,968,852 |
| | | | | | | | |
| | | | | | | | 2,726,873 |
| | | | | | | | |
Oil, Gas & Consumable Fuels - 1.9% | | | | | | | | |
Apache Corp., 6.90%, 9/15/2018 | | A3 | | | 630,000 | | | 765,833 |
Shell International Finance B.V. (Netherlands), 4.30%, 9/22/2019. | | Aa1 | | | 1,000,000 | | | 1,031,984 |
| | | | | | | | |
| | | | | | | | 1,797,817 |
| | | | | | | | |
Total Energy | | | | | | | | 4,524,690 |
| | | | | | | | |
Financials - 25.1% | | | | | | | | |
Capital Markets - 5.0% | | | | | | | | |
Goldman Sachs Capital I, 6.345%, 2/15/2034 | | A3 | | | 830,000 | | | 744,739 |
Goldman Sachs Capital II4, 5.793%, 12/29/2049 | | Baa2 | | | 1,285,000 | | | 970,175 |
The Goldman Sachs Group, Inc., 6.15%, 4/1/2018 | | A1 | | | 690,000 | | | 722,787 |
Merrill Lynch & Co., Inc., 6.11%, 1/29/2037 | | A3 | | | 665,000 | | | 603,937 |
Morgan Stanley, 5.55%, 4/27/2017 | | A2 | | | 1,727,000 | | | 1,712,966 |
| | | | | | | | |
| | | | | | | | 4,754,604 |
| | | | | | | | |
Commercial Banks - 6.8% | | | | | | | | |
Household Finance Co., 6.375%, 11/27/2012 | | A3 | | | 785,000 | | | 847,752 |
HSBC Finance Corp., 7.00%, 5/15/2012 | | A3 | | | 1,025,000 | | | 1,103,681 |
KeyBank National Association, 5.45%, 3/3/2016 | | A3 | | | 1,050,000 | | | 1,086,847 |
Manufacturers & Traders Trust Co., 6.625%, 12/4/2017 | | A3 | | | 1,110,000 | | | 1,230,232 |
PNC Bank National Association5, 5.25%, 1/15/2017 | | A2 | | | 880,000 | | | 934,811 |
| | | | |
| | The accompanying notes are an integral part of the financial statements. | | 4 |
Investment Portfolio - June 30, 2010 (unaudited)
| | | | | | | | |
| | | Credit Rating 1
(unaudited) | | Principal Amount | | Value (Note 2) |
| | | |
CORPORATE BONDS (continued) | | | | | | | | |
| | | |
Non-Convertible Corporate Bonds (continued) | | | | | | | | |
Financials (continued) | | | | | | | | |
Commercial Banks (continued) | | | | | | | | |
USB Capital XIII Trust, 6.625%, 12/15/2039 | | A2 | | $ | 395,000 | | $ | 416,464 |
Wachovia Corp., 5.25%, 8/1/2014 | | A2 | | | 805,000 | | | 852,484 |
| | | | | | | | |
| | | | | | | | 6,472,271 |
| | | | | | | | |
Consumer Finance - 1.0% | | | | | | | | |
American Express Co., 8.125%, 5/20/2019 | | A3 | | | 795,000 | | | 987,067 |
| | | | | | | | |
Diversified Financial Services - 3.5% | | | | | | | | |
Bank of America Corp., 7.625%, 6/1/2019 | | A2 | | | 845,000 | | | 967,954 |
Citigroup, Inc., 8.50%, 5/22/2019 | | A3 | | | 1,190,000 | | | 1,418,627 |
JPMorgan Chase & Co., 6.30%, 4/23/2019 | | Aa3 | | | 785,000 | | | 886,654 |
| | | | | | | | |
| | | | | | | | 3,273,235 |
| | | | | | | | |
Insurance - 1.7% | | | | | | | | |
American International Group, Inc., 4.25%, 5/15/2013 | | A3 | | | 660,000 | | | 636,900 |
Fidelity National Financial, Inc., 6.60%, 5/15/2017 | | Baa3 | | | 995,000 | | | 992,084 |
| | | | | | | | |
| | | | | | | | 1,628,984 |
| | | | | | | | |
Real Estate Investment Trusts (REITS) - 7.1% | | | | | | | | |
AvalonBay Communities, Inc., 6.10%, 3/15/2020 | | Baa1 | | | 720,000 | | | 795,770 |
Boston Properties LP, 5.875%, 10/15/2019 | | Baa2 | | | 745,000 | | | 797,049 |
Camden Property Trust, 5.70%, 5/15/2017 | | Baa1 | | | 780,000 | | | 812,355 |
HCP, Inc., 6.70%, 1/30/2018 | | Baa3 | | | 750,000 | | | 790,707 |
Health Care REIT, Inc., 6.20%, 6/1/2016 | | Baa2 | | | 375,000 | | | 407,327 |
Mack-Cali Realty LP, 7.75%, 8/15/2019 | | Baa2 | | | 735,000 | | | 863,714 |
National Retail Properties, Inc., 6.875%, 10/15/2017 | | Baa2 | | | 890,000 | | | 973,267 |
Simon Property Group LP, 10.35%, 4/1/2019 | | A3 | | | 990,000 | | | 1,317,744 |
| | | | | | | | |
| | | | | | | | 6,757,933 |
| | | | | | | | |
Total Financials | | | | | | | | 23,874,094 |
| | | | | | | | |
Health Care - 2.5% | | | | | | | | |
Health Care Equipment & Supplies - 0.7% | | | | | | | | |
Becton Dickinson and Co., 6.00%, 5/15/2039 | | A2 | | | 535,000 | | | 625,357 |
| | | | | | | | |
Pharmaceuticals - 1.8% | | | | | | | | |
Abbott Laboratories, 5.60%, 11/30/2017 | | A1 | | | 675,000 | | | 783,517 |
Novartis Securities Investment Ltd. (Bermuda), 5.125%, 2/10/2019 | | Aa2 | | | 870,000 | | | 973,918 |
| | | | | | | | |
| | | | | | | | 1,757,435 |
| | | | | | | | |
Total Health Care | | | | | | | | 2,382,792 |
| | | | | | | | |
| | | |
Industrials - 13.6% | | | | | | | | |
Aerospace & Defense - 1.4% | | | | | | | | |
The Boeing Co., 6.00%, 3/15/2019 | | A2 | | | 500,000 | | | 588,848 |
| | | | |
| 5 | | The accompanying notes are an integral part of the financial statements. | | |
Investment Portfolio - June 30, 2010 (unaudited)
| | | | | | | | |
| | | Credit Rating 1
(unaudited) | | Principal Amount | | Value (Note 2) |
| | | |
CORPORATE BONDS (continued) | | | | | | | | |
| | | |
Non-Convertible Corporate Bonds (continued) | | | | | | | | |
Industrials (continued) | | | | | | | | |
Aerospace & Defense (continued) | | | | | | | | |
Honeywell International, Inc., 5.30%, 3/1/2018 | | A2 | | $ | 690,000 | | $ | 787,923 |
| | | | | | | | |
| | | | | | | | 1,376,771 |
| | | | | | | | |
Air Freight & Logistics - 1.1% | | | | | | | | |
FedEx Corp., 8.00%, 1/15/2019 | | Baa2 | | | 790,000 | | | 1,003,244 |
| | | | | | | | |
Airlines - 2.4% | | | | | | | | |
Continental Airlines Pass Through Trust, Series 1997-4, Class A, 6.90%, 1/2/2018 | | Baa2 | | | 306,819 | | | 306,819 |
Delta Air Lines, Inc., 7.111%, 9/18/2011 | | BBB2 | | | 295,000 | | | 304,587 |
Delta Air Lines, Inc.6, 6.20%, 7/2/2018 | | Baa2 | | | 500,000 | | | 504,375 |
Delta Air Lines, Inc., 6.821%, 8/10/2022 | | Baa1 | | | 172,753 | | | 170,594 |
Southwest Airlines Co., 5.25%, 10/1/2014 | | Baa3 | | | 910,000 | | | 957,850 |
| | | | | | | | |
| | | | | | | | 2,244,225 |
| | | | | | | | |
Commercial Services & Supplies - 0.9% | | | | | | | | |
Waste Management, Inc., 7.375%, 3/11/2019 | | Baa3 | | | 715,000 | | | 866,465 |
| | | | | | | | |
Industrial Conglomerates - 4.3% | | | | | | | | |
GE Capital Trust I4, 6.375%, 11/15/2067 | | Aa3 | | | 1,145,000 | | | 1,064,850 |
General Electric Capital Corp., 5.625%, 5/1/2018 | | Aa2 | | | 350,000 | | | 371,950 |
General Electric Capital Corp., Series A, 6.75%, 3/15/2032 | | Aa2 | | | 740,000 | | | 796,415 |
General Electric Co., 5.25%, 12/6/2017 | | Aa2 | | | 370,000 | | | 402,340 |
Textron, Inc., 7.25%, 10/1/2019 | | Baa3 | | | 1,245,000 | | | 1,421,326 |
| | | | | | | | |
| | | | | | | | 4,056,881 |
| | | | | | | | |
Machinery - 1.9% | | | | | | | | |
Caterpillar Financial Services Corp., 7.05%, 10/1/2018 | | A2 | | | 660,000 | | | 796,102 |
John Deere Capital Corp., 5.50%, 4/13/2017 | | A2 | | | 225,000 | | | 253,845 |
John Deere Capital Corp., 5.75%, 9/10/2018 | | A2 | | | 700,000 | | | 800,861 |
| | | | | | | | |
| | | | | | | | 1,850,808 |
| | | | | | | | |
Road & Rail - 1.6% | | | | | | | | |
CSX Corp., 6.00%, 10/1/2036 | | Baa3 | | | 730,000 | | | 782,426 |
Union Pacific Corp., 5.65%, 5/1/2017 | | Baa2 | | | 705,000 | | | 785,604 |
| | | | | | | | |
| | | | | | | | 1,568,030 |
| | | | | | | | |
Total Industrials | | | | | | | | 12,966,424 |
| | | | | | | | |
Information Technology - 6.8% | | | | | | | | |
Communications Equipment - 1.3% | | | | | | | | |
Cisco Systems, Inc., 5.90%, 2/15/2039 | | A1 | | | 1,065,000 | | | 1,183,818 |
| | | | | | | | |
Computers & Peripherals - 3.0% | | | | | | | | |
Dell, Inc., 5.875%, 6/15/2019 | | A2 | | | 1,055,000 | | | 1,185,571 |
Hewlett-Packard Co., 5.50%, 3/1/2018 | | A2 | | | 680,000 | | | 783,179 |
| | | | |
| | The accompanying notes are an integral part of the financial statements. | | 6 |
Investment Portfolio - June 30, 2010 (unaudited)
| | | | | | | | |
| | | Credit Rating 1
(unaudited) | | Principal Amount | | Value (Note 2) |
| | | |
CORPORATE BONDS (continued) | | | | | | | | |
| | | |
Non-Convertible Corporate Bonds (continued) | | | | | | | | |
Information Technology (continued) | | | | | | | | |
Computers & Peripherals (continued) | | | | | | | | |
International Business Machines Corp., 5.60%, 11/30/2039 | | A1 | | $ | 819,000 | | $ | 910,511 |
| | | | | | | | |
| | | | | | | | 2,879,261 |
| | | | | | | | |
Electronic Equipment, Instruments & Components - 0.7% | | | | | | | | |
Corning, Inc., 6.20%, 3/15/2016 | | Baa1 | | | 610,000 | | | 688,222 |
| | | | | | | | |
IT Services - 1.0% | | | | | | | | |
The Western Union Co.3, 5.253%, 4/1/2020 | | A3 | | | 895,000 | | | 954,867 |
| | | | | | | | |
Software - 0.8% | | | | | | | | |
Oracle Corp., 5.00%, 7/8/2019 | | A2 | | | 700,000 | | | 776,511 |
| | | | | | | | |
Total Information Technology | | | | | | | | 6,482,679 |
| | | | | | | | |
Materials - 5.0% | | | | | | | | |
Chemicals - 0.8% | | | | | | | | |
E.I. du Pont de Nemours & Co., 6.00%, 7/15/2018 | | A2 | | | 670,000 | | | 786,304 |
| | | | | | | | |
Metals & Mining - 3.0% | | | | | | | | |
Alcoa, Inc., 5.87%, 2/23/2022 | | Baa3 | | | 660,000 | | | 613,650 |
BHP Billiton Finance (USA) Ltd. (Australia), 6.50%, 4/1/2019 | | A1 | | | 810,000 | | | 971,389 |
Teck Resources Ltd. (Canada), 10.75%, 5/15/2019 | | Baa3 | | | 1,065,000 | | | 1,304,944 |
| | | | | | | | |
| | | | | | | | 2,889,983 |
| | | | | | | | |
Paper & Forest Products - 1.2% | | | | | | | | |
International Paper Co., 7.50%, 8/15/2021 | | Baa3 | | | 940,000 | | | 1,100,642 |
| | | | | | | | |
Total Materials | | | | | | | | 4,776,929 |
| | | | | | | | |
Telecommunication Services - 1.3% | | | | | | | | |
Wireless Telecommunication Services - 1.3% | | | | | | | | |
Crown Castle Towers LLC3, 6.113%, 1/15/2020 | | A2 | | | 745,000 | | | 817,678 |
SBA Tower Trust3, 5.101%, 4/15/2017 | | A2 | | | 375,000 | | | 399,469 |
| | | | | | | | |
Total Telecommunication Services | | | | | | | | 1,217,147 |
| | | | | | | | |
Utilities - 2.5% | | | | | | | | |
Electric Utilities - 2.1% | | | | | | | | |
Exelon Generation Co. LLC, 5.35%, 1/15/2014 | | A3 | | | 580,000 | | | 632,264 |
Exelon Generation Co. LLC, 6.20%, 10/1/2017 | | A3 | | | 350,000 | | | 397,870 |
Southwestern Electric Power Co., 6.45%, 1/15/2019 | | Baa3 | | | 855,000 | | | 939,996 |
| | | | | | | | |
| | | | | | | | 1,970,130 |
| | | | | | | | |
| | | | |
| 7 | | The accompanying notes are an integral part of the financial statements. | | |
Investment Portfolio - June 30, 2010 (unaudited)
| | | | | | | | |
| | | Credit Rating 1
(unaudited) | | Principal Amount/ Shares | | Value (Note 2) |
| | | |
CORPORATE BONDS (continued) | | | | | | | | |
| | | |
Non-Convertible Corporate Bonds (continued) | | | | | | | | |
| | | |
Utilities (continued) | | | | | | | | |
Multi-Utilities - 0.4% | | | | | | | | |
CenterPoint Energy Resources Corp., Series B, 7.875%, 4/1/2013 | | Baa3 | | $ | 335,000 | | $ | 383,868 |
| | | | | | | | |
Total Utilities | | | | | | | | 2,353,998 |
| | | | | | | | |
Total Non-Convertible Corporate Bonds
(Identified Cost $67,613,172) | | | | | | | | 73,336,226 |
| | | | | | | | |
TOTAL CORPORATE BONDS
(Identified Cost $69,113,496) | | | | | | | | 74,795,745 |
| | | | | | | | |
| | | |
PREFERRED STOCKS - 1.4% | | | | | | | | |
| | | |
Financials - 1.4% | | | | | | | | |
Commercial Banks - 0.3% | | | | | | | | |
PNC Financial Services Group, Inc., Series K5 | | Baa3 | | | 290,000 | | | 297,692 |
| | | | | | | | |
Diversified Financial Services - 1.1% | | | | | | | | |
JPMorgan Chase & Co., Series 1 | | Baa1 | | | 965,000 | | | 994,654 |
| | | | | | | | |
| | | |
TOTAL PREFERRED STOCKS
(Identified Cost $1,252,726) | | | | | | | | 1,292,346 |
| | | | | | | | |
| | | |
ASSET-BACKED SECURITIES - 0.6% | | | | | | | | |
Capital Auto Receivables Asset Trust, Series 2007-1, Class A4A, 5.01%, 4/16/2012 | | Aaa | | | 44,725 | | | 45,690 |
Capital Auto Receivables Asset Trust, Series 2007-3, Class A4, 5.21%, 3/17/2014 | | Aaa | | | 40,000 | | | 41,406 |
Ford Credit Auto Owner Trust, Series 2008-C, Class A4B4 , 1.98%, 4/15/2013 | | Aaa | | | 50,000 | | | 51,001 |
Hertz Vehicle Financing LLC, Series 2009-2A, Class A23 , 5.29%, 3/25/2016 | | Aaa | | | 370,000 | | | 400,367 |
| | | | | | | | |
TOTAL ASSET-BACKED SECURITIES
(Identified Cost $496,410) | | | | | | | | 538,464 |
| | | | | | | | |
COMMERCIAL MORTGAGE-BACKED SECURITIES - 2.1% | | | | | | | | |
American Tower Trust, Series 2007-1A, Class AFX3, 5.420%, 4/15/2037 | | Aaa | | | 400,000 | | | 430,403 |
Banc of America Commercial Mortgage, Inc., Series 2006-2, Class A44, 5.738%, 5/10/2045 | | AAA2 | | | 100,000 | | | 105,913 |
Banc of America Commercial Mortgage, Inc., Series 2006-4, Class A4, 5.634%, 7/10/2046 | | Aaa | | | 100,000 | | | 102,772 |
Citigroup Commercial Mortgage Trust, Series 2006-C4, Class A34, 5.729%, 3/15/2049 | | Aaa | | | 110,000 | | | 117,299 |
| | | | |
| | The accompanying notes are an integral part of the financial statements. | | 8 |
Investment Portfolio - June 30, 2010 (unaudited)
| | | | | | | | |
| | | Credit Rating 1
(unaudited) | | Principal Amount/ Shares | | Value (Note 2) |
| | | |
COMMERCIAL MORTGAGE-BACKED SECURITIES (continued) | | | | | | | | |
Commercial Mortgage Pass-Through Certificates, Series 2006-C7, Class A44, 5.768%, 6/10/2046 | | AAA2 | | $ | 100,000 | | $ | 106,324 |
Crown Castle Towers LLC, Series 2006-1A, Class AFX3, 5.245%, 11/15/2036 | | Aaa | | | 115,000 | | | 119,030 |
JP Morgan Chase Commercial Mortgage Securities Corp., Series 2005-LDP5, Class A44, 5.195%, 12/15/2044 | | Aaa | | | 150,000 | | | 159,555 |
JP Morgan Chase Commercial Mortgage Securities Corp., Series 2006-LDP7, Class A44, 5.874%, 4/15/2045 | | Aaa | | | 100,000 | | | 106,565 |
LB-UBS Commercial Mortgage Trust, Series 2006-C4, Class A44, 5.882%, 6/15/2038 | | Aaa | | | 100,000 | | | 107,388 |
Morgan Stanley Capital I, Series 2005-HQ7, Class A44, 5.206%, 11/14/2042 | | Aaa | | | 100,000 | | | 106,678 |
OBP Depositor LLC Trust, Series 2010-OBP, Class A3,6, 4.646%, 7/15/2045 | | AAA2 | | | 100,000 | | | 99,999 |
Wachovia Bank Commercial Mortgage Trust, Series 2005-C21, Class A44, 5.208%, 10/15/2044 | | Aaa | | | 150,000 | | | 160,502 |
| | | | | | | | |
Wachovia Bank Commercial Mortgage Trust, Series 2006-C25, Class A44, 5.738%, 5/15/2043 | | Aaa | | | 115,000 | | | 124,053 |
Wachovia Bank Commercial Mortgage Trust, Series 2006-C26, Class A3, 6.011%, 6/15/2045 | | Aaa | | | 150,000 | | | 159,617 |
| | | | | | | | |
TOTAL COMMERCIAL MORTGAGE-BACKED SECURITIES
(Identified Cost $1,969,210) | | | | | | | | 2,006,098 |
| | | | | | | | |
MUTUAL FUNDS - 4.1% | | | | | | | | |
iShares iBoxx Investment Grade Corporate Bond Fund
(Identified Cost $3,454,665) | | | | | 36,380 | | | 3,945,775 |
| | | | | | | | |
U.S. GOVERNMENT AGENCIES - 9.9% | | | | | | | | |
Other Agencies - 9.9% | | | | | | | | |
Fannie Mae, 1.875%, 4/20/2012 | | | | | 2,214,000 | | | 2,260,339 |
Fannie Mae, 1.75%, 8/10/2012 | | | | | 3,265,000 | | | 3,328,645 |
Federal Home Loan Bank, 4.50%, 11/15/2012 | | | | | 545,000 | | | 590,651 |
Federal Home Loan Bank, 3.375%, 2/27/2013 | | | | | 530,000 | | | 562,155 |
Freddie Mac, 1.75%, 6/15/2012 | | | | | 830,000 | | | 846,289 |
Freddie Mac, 5.50%, 8/20/2012 | | | | | 1,660,000 | | | 1,824,660 |
| | | | | | | | |
TOTAL U.S. GOVERNMENT AGENCIES
(Identified Cost $9,312,007) | | | | | | | | 9,412,739 |
| | | | | | | | |
SHORT-TERM INVESTMENTS - 4.6% | | | | | | | | |
Dreyfus Cash Management, Inc. - Institutional Shares7, 0.13%, (Identified Cost $4,372,313) | | | | | 4,372,313 | | | 4,372,313 |
| | | | | | | | |
| | | | |
| 9 | | The accompanying notes are an integral part of the financial statements. | | |
Investment Portfolio - June 30, 2010 (unaudited)
| | | | | | | | |
| | | | | | | Value (Note 2) | |
| | | |
TOTAL INVESTMENTS - 101.3%
(Identified Cost $89,970,827) | | | | | | $ | 96,363,480 | |
LIABILITIES, LESS OTHER ASSETS - (1.3%) | | | | | | | (1,227,498 | ) |
| | | | | | | | |
NET ASSETS - 100% | | | | | | $ | 95,135,982 | |
| | | | | | | | |
| 1 | Credit ratings from Moody’s (unaudited). |
| 2 | Credit ratings from S&P (unaudited). |
| 3 | Restricted securities - Investment in securities that are restricted as to public resale under the Securities Act of 1933, as amended. These securities have been sold under rule 144A and have been determined to be liquid under guidelines established by the Board of Directors. These securities amount to $3,725,821, or 3.9% of the Series’ net assets as of June 30, 2010 (see Note 2 to the financial statements). |
| 4 | The coupon rate is floating and is the stated rate as of June 30, 2010. |
| 5 | PNC Global Investment Servicing (U.S.) Inc. serves as sub-accountant and sub-transfer agent to the Series. |
| 6 | Security has been valued at fair value. |
| 7 | Rate shown is the current yield as of June 30, 2010. |
| | | | |
| | The accompanying notes are an integral part of the financial statements. | | 10 |
Statement of Assets and Liabilities (unaudited)
June 30, 2010
| | | | |
ASSETS: | | | | |
| |
Investments, at value (identified cost $89,970,827) (Note 2) | | $ | 96,363,480 | |
Cash | | | 648,050 | |
Interest receivable | | | 1,125,012 | |
Receivable for fund shares sold | | | 829,587 | |
Dividends receivable | | | 289 | |
| | | | |
| |
TOTAL ASSETS | | | 98,966,418 | |
| | | | |
| |
LIABILITIES: | | | | |
| |
Accrued management fees (Note 3) | | | 44,432 | |
Accrued Chief Compliance Officer service fees (Note 3) | | | 828 | |
Accrued transfer agent fees (Note 3) | | | 811 | |
Payable for securities purchased | | | 3,766,716 | |
Other payables and accrued expenses | | | 17,649 | |
| | | | |
| |
TOTAL LIABILITIES | | | 3,830,436 | |
| | | | |
| |
TOTAL NET ASSETS | | $ | 95,135,982 | |
| | | | |
| |
NET ASSETS CONSIST OF: | | | | |
| |
Capital stock | | $ | 86,404 | |
Additional paid-in-capital | | | 87,917,884 | |
Undistributed net investment income | | | 1,708,411 | |
Accumulated net realized loss on investments | | | (969,370 | ) |
Net unrealized appreciation on investments | | | 6,392,653 | |
| | | | |
| | | | |
TOTAL NET ASSETS | | $ | 95,135,982 | |
| |
NET ASSET VALUE, OFFERING PRICE AND REDEMPTION PRICE PER SHARE -
Class A ($95,135,982/8,640,383 shares) | | $ | 11.01 | |
| | | | |
| | | | |
| 11 | | The accompanying notes are an integral part of the financial statements. | | |
Statement of Operations (unaudited)
For the Six Months Ended June 30, 2010
| | | | |
INVESTMENT INCOME: | | | | |
| |
Interest | | $ | 1,897,103 | |
Dividends | | | 117,418 | |
| | | | |
| |
Total Investment Income | | | 2,014,521 | |
| | | | |
| |
EXPENSES: | | | | |
| |
Management fees (Note 3) | | | 243,869 | |
Fund accounting and administration fees (Note 3) | | | 22,398 | |
Directors’ fees (Note 3) | | | 6,373 | |
Chief Compliance Officer service fees (Note 3) | | | 1,761 | |
Transfer agent fees (Note 3) | | | 1,725 | |
Audit fees | | | 15,955 | |
Miscellaneous | | | 16,538 | |
| | | | |
| |
Total Expenses | | | 308,619 | |
Less reduction of expenses (Note 3) | | | (758 | ) |
| | | | |
| |
Net Expenses | | | 307,861 | |
| | | | |
| |
NET INVESTMENT INCOME | | | 1,706,660 | |
| | | | |
| |
REALIZED AND UNREALIZED GAIN (LOSS) ON INVESTMENTS: | | | | |
| |
Net realized loss on investments | | | (108,769 | ) |
Net change in unrealized appreciation on investments | | | 3,297,605 | |
| | | | |
| |
NET REALIZED AND UNREALIZED GAIN (LOSS) ON INVESTMENTS | | | 3,188,836 | |
| | | | |
| |
NET INCREASE IN NET ASSETS RESULTING FROM OPERATIONS | | $ | 4,895,496 | |
| | | | |
| | | | |
| | The accompanying notes are an integral part of the financial statements. | | 12 |
Statement of Changes in Net Assets
| | | | | | | | |
| | | For the Six
Months Ended
6/30/10
(unaudited) | | | For the Year Ended 12/31/09 | |
INCREASE (DECREASE) IN NET ASSETS: | | | | | | | | |
| | |
OPERATIONS: | | | | | | | | |
| | |
Net investment income | | $ | 1,706,660 | | | $ | 2,981,016 | |
Net realized gain (loss) on investments | | | (108,769 | ) | | | 196,512 | |
Net change in unrealized appreciation on investments | | | 3,297,605 | | | | 3,411,672 | |
| | | | | | | | |
| | |
Net increase from operations | | | 4,895,496 | | | | 6,589,200 | |
| | | | | | | | |
| | |
DISTRIBUTIONS TO SHAREHOLDERS (Note 8): | | | | | | | | |
| | |
From net investment income | | | — | | | | (2,992,322 | ) |
| | | | | | | | |
| | |
CAPITAL STOCK ISSUED AND REPURCHASED: | | | | | | | | |
| | |
Net increase from capital share transactions (Note 5) | | | 13,639,665 | | | | 19,933,271 | |
| | | | | | | | |
| | |
Net increase in net assets | | | 18,535,161 | | | | 23,530,149 | |
| | |
NET ASSETS: | | | | | | | | |
| | |
Beginning of period | | | 76,600,821 | | | | 53,070,672 | |
| | | | | | | | |
| | |
End of period (including undistributed net investment income of $1,708,411 and $1,751, respectively) | | $ | 95,135,982 | | | $ | 76,600,821 | |
| | | | | | | | |
| | | | |
| 13 | | The accompanying notes are an integral part of the financial statements. | | |
Financial Highlights
| | | | | | | | | | | | | |
| | | For the Six
Months Ended
6/30/10 | | For the Years Ended | | For the
Period
4/21/051to |
| | | (unaudited) | | 12/31/09 | | | 12/31/08 | | 12/31/07 | | 12/31/06 | | 12/31/05 |
Per share data (for a share outstanding throughout each period): | | | | | | | | | | | | | |
Net asset value - Beginning of period | | $10.38 | | $9.69 | | | $10.05 | | $9.98 | | $9.89 | | $10.00 |
| | | | | | | | | | | | | |
| | | | | | |
Income (loss) from investment operations: | | | | | | | | | | | | | |
Net investment income | | 0.222 | | 0.492 | | | 0.45 | | 0.42 | | 0.36 | | 0.21 |
Net realized and unrealized gain (loss) on investments | | 0.41 | | 0.62 | | | (0.30) | | 0.13 | | 0.09 | | (0.11) |
| | | | | | | | | | | | | |
Total from investment operations | | 0.63 | | 1.11 | | | 0.15 | | 0.55 | | 0.45 | | 0.10 |
| | | | | | | | | | | | | |
Less distributions to shareholders: | | | | | | | | | | | | | |
From net investment income | | — | | (0.42) | | | (0.46) | | (0.42) | | (0.36) | | (0.21) |
From net realized gain on investments | | — | | — | | | (0.05) | | (0.06) | | — | | — |
| | | | | | | | | | | | | |
Total distributions to shareholders | | — | | (0.42) | | | (0.51) | | (0.48) | | (0.36) | | (0.21) |
| | | | | | | | | | | | | |
Net asset value - End of period | | $11.01 | | $10.38 | | | $9.69 | | $10.05 | | $9.98 | | $9.89 |
| | | | | | | | | | | | | |
Net assets - End of period | | | | | | | | | | | | | |
(000’s omitted) | | $95,136 | | $76,601 | | | $53,071 | | $49,909 | | $45,696 | | $28,578 |
| | | | | | | | | | | | | |
Total return3 | | 6.07% | | 11.46% | | | 1.66% | | 5.58% | | 4.51% | | 0.98% |
Ratios (to average net assets)/ Supplemental Data: | | | | | | | | | | | | | |
Expenses* | | 0.76%4 | | 0.79% | | | 0.80% | | 0.80% | | 0.80% | | 0.80%4 |
Net investment income | | 4.20%4 | | 4.84% | | | 4.73% | | 4.21% | | 3.87% | | 3.08%4 |
Portfolio turnover | | 7% | | 67% | | | 53% | | 346% | | 313% | | 293% |
|
*The investment advisor did not impose all or a portion of its management fees, CCO fees, fund accounting and transfer agent fees, and other fees in some periods and in some periods paid a portion of the Series’ expenses. If these expenses had been incurred by the Series, the expense ratio (to average net assets) would have been increased by the following amounts: |
| | | | | | |
| | 0.00%4 ,5 | | 0.00% | 5 | | 0.03% | | 0.04% | | 0.08% | | 0.20%4 |
1Commencement of operations.
2Calculated based on average shares outstanding during the periods.
3Represents aggregate total return for the periods indicated, and assumes reinvestment of all distributions. Total return would have been lower had certain expenses not been waived or reimbursed during the periods. Periods less than one year are not annualized.
4Annualized.
5Less than 0.01%.
| | | | |
| | The accompanying notes are an integral part of the financial statements. | | 14 |
Notes to Financial Statements (unaudited)
Core Bond Series (the “Series”) is a no-load diversified series of Manning & Napier Fund, Inc. (the “Fund”). The Fund is organized in Maryland and is registered under the Investment Company Act of 1940, as amended, as an open-end management investment company.
The Series’ investment objective is to provide long-term total return by investing primarily in investment-grade bonds and other financial instruments, including derivatives, with economic characteristics similar to bonds.
The Fund’s Advisor is Manning & Napier Advisors, Inc. (the “Advisor”). Shares of the Series are offered to investors, clients and employees of the Advisor and its affiliates. The total authorized capital stock of the Fund consists of 10.0 billion shares of common stock each having a par value of $0.01. As of June 30, 2010, 6.2 billion shares have been designated in total among 29 series, of which 125 million have been designated as Core Bond Series Class A common stock.
| 2. | SIGNIFICANT ACCOUNTING POLICIES |
Security Valuation
Portfolio securities, including domestic equities, foreign equities, warrants and options, listed on an exchange other than the NASDAQ National Market System are valued at the latest quoted sales price of the exchange on which the security is primarily traded. Securities not traded on valuation date or securities not listed on an exchange are valued at the latest quoted bid price provided by the Fund’s pricing service. Securities listed on the NASDAQ National Market System are valued in accordance with the NASDAQ Official Closing Price.
Debt securities, including government bonds, foreign bonds, asset-backed securities, structured notes, supranational obligations, sovereign bonds, corporate bonds and mortgage-backed securities will normally be valued on the basis of evaluated bid prices provided by an independent pricing service. Certain investments in securities held by the Series may be valued on a basis of a price provided by a principal market maker. These prices may differ from the value that would have been used had a broader market for securities existed.
Municipal securities will normally be valued on the basis of market valuations provided by an independent pricing service that utilizes the latest price quotations and a matrix system (which considers such factors as security prices of similar securities, yields, maturities and ratings).
Short-term investments that mature in sixty days or less are valued at amortized cost, which approximates market value. Investments in open-end investment companies are valued at their net asset value per share on valuation date.
Volume and level of activity in established markets for an asset or liability are evaluated to determine whether recent transactions and quoted prices are determinative of fair value. Where there have been significant decreases in volume and level of activity, further analysis and adjustment may be necessary to estimate fair value. The Series measures fair value in these instances by the use of inputs and valuation techniques which may be based upon current market prices of securities that are comparable in coupon, rating, maturity and industry and/or expectation of future cash flows. As a result of trading in relatively thin markets and/or markets that experience significant volatility, the prices used by the Series to value these securities may differ from the value that would be realized if these securities were sold, and the differences could be material.
Securities for which representative valuations or prices are not available from the Fund’s pricing service may be valued at fair value. Due to the inherent uncertainty of valuations of such securities, the fair value may differ significantly from the values that would have been used had a ready market for such securities existed. If trading or events occurring after the close of the principal market in which securities are traded are expected to materially affect the value of those securities, then they may be valued at their fair value, taking this trading or these events into account.
Notes to Financial Statements (unaudited)
| 2. | SIGNIFICANT ACCOUNTING POLICIES (continued) |
Security Valuation (continued)
Fair value is determined in good faith by the Advisor under procedures approved by and under the general supervision and responsibility of the Fund’s Board of Directors (the “Board”).
Various inputs are used in determining the value of the Series’ assets or liabilities carried at market value. These inputs are summarized in three broad levels. Level 1 includes quoted prices in active markets for identical assets and liabilities. Level 2 includes other significant observable inputs (including quoted prices for similar securities, interest rates, prepayment speeds, credit risk, etc.). Level 3 includes significant unobservable inputs (including the Series’ own assumptions in determining the fair value of investments). The inputs or methodology used for valuing securities are not necessarily an indication of the risk associated with investing in those securities.
The following is a summary of the valuation levels used for major security types as of June 30, 2010 in valuing the Series’ assets or liabilities carried at market value:
| | | | | | | | | | | | |
| Description | | 6/30/10 | | Level 1 | | Level 2 | | Level 3 |
Equity securities* | | $ | — | | $ | — | | $ | — | | $ | — |
Preferred securities | | | 1,292,346 | | | — | | | 1,292,346 | | | — |
Debt securities: | | | | | | | | | | | | |
U.S. Treasury and other U.S. | | | | | | | | | | | | |
Government agencies | | | 9,412,739 | | | — | | | 9,412,739 | | | — |
States and political subdivisions (municipals) | | | — | | | — | | | — | | | — |
Corporate debt | | | 73,336,226 | | | — | | | 73,336,226 | | | — |
Convertible corporate debt | | | 1,459,519 | | | — | | | 1,459,519 | | | — |
Asset backed securities | | | 538,464 | | | — | | | 538,464 | | | — |
Commercial mortgage backed securities | | | 2,006,098 | | | — | | | 2,006,098 | | | — |
Mutual funds | | | 8,318,088 | | | 8,318,088 | | | — | | | — |
Other financial instruments** | | | — | | | — | | | — | | | — |
| | | | | | | | | | | | |
Total | | $ | 96,363,480 | | $ | 8,318,088 | | $ | 88,045,392 | | $ | — |
| | | | | | | | | | | | |
*Includes common stock, warrants and rights. Please see the Investment Portfolio for industry classification.
**Other financial instruments are derivative instruments not reflected in the Investment Portfolio, such as futures, forwards and swap contracts, which are valued at the unrealized appreciation/depreciation on the instrument. As of June 30, 2010, the Series did not hold any derivative instruments.
There were no Level 3 securities held by the Series as of December 31, 2009 or June 30, 2010.
The Fund’s policy is to recognize transfers in and transfers out of the valuation levels as of the end of the reporting period. There were no significant transfers between Level 1 and Level 2 as of June 30, 2010.
16
Notes to Financial Statements (unaudited)
| 2. | SIGNIFICANT ACCOUNTING POLICIES (continued) |
Security Valuation (continued)
Additional disclosure surrounding the activity in Level 3 fair value measurement will also be effective for fiscal years beginning after December 15, 2010. Management has concluded that this will not have a material impact on the Series’ financial statements.
Security Transactions, Investment Income and Expenses
Security transactions are accounted for on trade date. Dividend income is recorded on the ex-dividend date, except that if the ex-dividend date has passed, certain dividends from foreign securities are recorded as soon as the Fund is informed of the ex-dividend date. Non-cash dividends, if any, are recorded at the fair market value of the securities received. Interest income, including amortization of premium and accretion of discounts using the effective interest method, is earned from settlement date and accrued daily.
Expenses are recorded on an accrual basis. Most expenses of the Fund can be attributed to a specific series. Expenses which cannot be directly attributed are apportioned among the series in the Fund in such a manner as deemed equitable by the Fund’s Board, taking into consideration, among other things, the nature and type of expense.
The Series uses the identified cost method for determining realized gain or loss on investments for both financial statement and federal income tax reporting purposes.
Foreign Currency Translation
The books and records of the Series are maintained in U.S. dollars. Foreign currencies, investments and other assets and liabilities are translated into U.S. dollars at the current exchange rates. Purchases and sales of investment securities and income and expenses are translated on the respective dates of such transactions. The Series does not isolate realized and unrealized gains and losses attributable to changes in the exchange rates from gains and losses that arise from changes in the market value of investments. Such fluctuations are included with net realized and unrealized gain or loss on investments. Net realized foreign currency gains and losses represent foreign currency gains and losses between trade date and settlement date on securities transactions, gains and losses on disposition of foreign currencies and the difference between the amount of income and foreign withholding taxes recorded on the books of the Series and the amounts actually received or paid.
Securities Purchased on a When-Issued Basis or Forward Commitment
The Series may purchase securities on a when-issued basis or forward commitment. These transactions involve a commitment by the Series to purchase securities for a predetermined price with payment and delivery taking place beyond the customary settlement period. When such purchases are outstanding, the Series will designate liquid assets in an amount sufficient to meet the purchase price. When purchasing a security on a delayed delivery basis, the Series assumes the rights and risks of ownership of the security, including the risk of price and yield fluctuations, and takes such fluctuations into account when determining its net asset value. The Series may sell the when-issued securities before they are delivered, which may result in a capital gain or loss.
In connection with its ability to purchase or sell securities on a forward commitment basis, the Series may enter into forward roll transactions principally using To Be Announced (TBA) securities. Forward roll transactions require the sale of securities for delivery in the current month, and a simultaneous agreement to repurchase substantially similar (same type, coupon and maturity) securities on a specified future date. Risks of entering into forward roll transactions include the potential inability of the counterparty to meet the terms of the agreement; the potential of the Series to receive inferior securities at redelivery as compared to the securities sold to the counterparty; counterparty credit risk; and the potential pay down speed variance between the mortgage-backed pools. During the roll period, the Series forgoes principal and interest paid on the securities. The Series accounts for such dollar rolls as purchases and sales. Information regarding securities purchased on a when-issued basis is included in the Series’ Investment Portfolio. No such investments were held by the Series as of June 30, 2010.
17
Notes to Financial Statements (unaudited)
| 2. | SIGNIFICANT ACCOUNTING POLICIES (continued) |
Restricted Securities
Restricted securities are purchased in private placement transactions, are not registered under the Securities Act of 1933, as amended, and may have contractual restrictions on resale. Information regarding restricted securities is included at the end of the Series’ Investment Portfolio.
Illiquid Securities
A security may be considered illiquid if so deemed in good faith by the Advisor under procedures approved by and under the general supervision and responsibility of the Fund’s Board. No such investments were held by the Series on June 30, 2010.
Federal Taxes
The Series’ policy is to comply with the provisions of the Internal Revenue Code applicable to regulated investment companies. The Series is not subject to federal income tax or excise tax to the extent that the Series distributes to shareholders each year its taxable income, including any net realized gains on investments, in accordance with requirements of the Internal Revenue Code. Accordingly, no provision for federal income tax or excise tax has been made in the financial statements.
Management evaluates its tax positions to determine if the tax positions taken meet the minimum recognition threshold in connection with accounting for uncertainties in income tax positions taken or expected to be taken for the purposes of measuring and recognizing tax liabilities in the financial statements. Recognition of tax benefits of an uncertain tax position is required only when the position is “more likely than not” to be sustained assuming examination by taxing authorities. At June 30, 2010, the Series has recorded no liability for net unrecognized tax benefits relating to uncertain income tax positions taken or expected to be taken in future tax returns.
The Series files income tax returns in the U.S. federal jurisdiction, various states and foreign jurisdictions, as required. No income tax returns are currently under investigation. The statute of limitations on the Series’ tax returns remains open for the years ended December 31, 2006 through December 31, 2009. The Fund is not aware of any tax positions for which it is reasonably possible that the total amounts of unrecognized tax benefits will significantly change in the next twelve months.
Additionally, based on the Fund’s understanding of the tax rules and rates related to income, gains and transactions for foreign jurisdictions in which it invests, the Series will provide for foreign taxes, and where appropriate, deferred foreign tax.
Distributions of Income and Gains
Distributions to shareholders of net investment income and net realized gains are made annually. An additional distribution may be necessary to avoid taxation of the Series. Distributions are recorded on the ex-dividend date.
Indemnifications
The Fund’s organizational documents provide former and current directors and officers with a limited indemnification against liabilities arising in connection with the performance of their duties to the Fund. In the normal course of business, the Fund may also enter into contracts that provide general indemnifications. The Fund’s maximum exposure under these arrangements is unknown as this would be dependent on future claims that may be made against the Fund. The risk of material loss from such claims is considered remote.
Other
The preparation of financial statements in conformity with accounting principles generally accepted in the United States of America requires management to make estimates and assumptions that affect the reported amounts of
18
Notes to Financial Statements (unaudited)
Other (continued)
assets and liabilities and the disclosure of contingent assets and liabilities at the date of the financial statements and the reported amounts of income and expenses during the reporting period. Actual results could differ from those estimates.
| 3. | TRANSACTIONS WITH AFFILIATES |
The Fund has an Investment Advisory Agreement (the “Agreement”) with the Advisor, for which the Series pays a fee, computed daily and payable monthly, at an annual rate of 0.60% of the Series’ average daily net assets.
Under the Agreement, personnel of the Advisor provide the Series with advice and assistance in the choice of investments and the execution of securities transactions, and otherwise maintain the Series’ organization. The Advisor also provides the Fund with necessary office space and fund administration and support services. The salaries of all officers of the Fund (except a percentage of the Fund’s Chief Compliance Officer’s salary, which is paid by the Fund), and of all Directors who are “affiliated persons” of the Fund, or of the Advisor, and all personnel of the Fund, or of the Advisor, performing services relating to research, statistical and investment activities, are paid by the Advisor. Each “non-affiliated” Director receives an annual stipend, which is allocated among all the active series of the Fund. In addition, these Directors also receive a fee per Board meeting attended for each active series of the Fund plus a fee for each committee meeting attended.
The Advisor has contractually agreed, until at least April 30, 2011, to waive its fee and, if necessary, pay other operating expenses of the Series in order to maintain total direct annual fund operating expenses for the Series at no more than 0.80% of average daily net assets each year. For the six months ended June 30, 2010, the Advisor voluntarily waived fees of $758, which is included as a reduction of expenses on the Statement of Operations. The Advisor is not eligible to recoup any expenses that have been waived or reimbursed in prior years.
Manning & Napier Investor Services, Inc., a registered broker-dealer affiliate of the Advisor, acts as distributor for the Fund’s shares. The services of Manning & Napier Investor Services, Inc. are provided at no additional cost to the Series.
The Advisor has entered into agreements with PNC Global Investment Servicing (U.S.) Inc. (“PNCGIS”) under which PNCGIS serves as sub-accountant services agent and sub-transfer agent. The Fund pays the Advisor an annual fee of 0.0175% on the first $3 billion of average daily net assets (excluding Target Series); 0.015% on the next $3 billion of average daily net assets (excluding Target Series); and 0.01% of the average daily net assets in excess of $6 billion (excluding Target Series); plus a base fee of $25,500 per Series. Additionally, certain transaction-, account-, and cusip-based fees and out-of-pocket expenses, including charges for reporting relating to the Fund’s compliance program, are charged.
On July 1, 2010, The PNC Financial Services Group, Inc. sold the outstanding stock of PNC Global Investment Servicing Inc. to The Bank of New York Mellon Corporation. At the closing of the sale, PNCGIS changed its name to BNY Mellon Investment Servicing (US) Inc.
| 4. | PURCHASES AND SALES OF SECURITIES |
For the six months ended June 30, 2010, purchases and sales of securities, other than U.S. Government securities and short-term securities, were $20,649,000 and $3,713,921, respectively. Purchases and sales of U.S. Government securities, other than short-term securities, were $0 and $2,039,918, respectively.
19
Notes to Financial Statements (unaudited)
| 5. | CAPITAL STOCK TRANSACTIONS |
Transactions in shares of Core Bond Series were:
| | | | | | | | | | | | | | |
| | | For the Six Months Ended 6/30/10 | | | For the Year Ended 12/31/09 | |
| | | Shares | | | Amount | | | Shares | | | Amount | |
Sold | | 1,736,420 | | | $ | 18,688,117 | | | 2,334,851 | | | $ | 24,190,684 | |
Reinvested | | — | | | | — | | | 282,320 | | | | 2,942,598 | |
Repurchased | | (477,562 | ) | | | (5,048,452 | ) | | (711,761 | ) | | | (7,200,011 | ) |
| | | | | | | | | | | | | | |
Total | | 1,258,858 | | | | 13,639,665 | | | 1,905,410 | | | | 19,933,271 | |
| | | | | | | | | | | | | | |
Substantially all of the Series’ shares represent investments by fiduciary accounts over which the Advisor has sole investment discretion. At June 30, 2010, two shareholders owned 1,729,616 shares of the Series (20.0% of shares outstanding) valued at $19,043,072. Investment activities of this shareholder may have a material effect on the Series.
The Series may trade in instruments including written and purchased options, forward foreign currency exchange contracts and futures contracts and other derivatives in the normal course of investing activities to assist in managing exposure to various market risks. The Series may be subject to various elements of risk and may involve, to a varying degree, elements of risk in excess of the amounts recognized for financial statement purposes. These risks include: the risk that changes in the value of a derivative may not correlate perfectly with the underlying asset, rate or index, counterparty credit risk related to over the counter derivatives counterparties’ failure to perform under contract terms, liquidity risk related to the lack of a liquid market for these contracts allowing the fund to close out its position(s) and documentation risk relating to disagreement over contract terms. No such investments were held by the Series during the six months ended June 30, 2010.
Investing in securities of foreign companies and foreign governments involves special risks and considerations not typically associated with investing in securities of domestic companies and the U.S. Government. These risks include revaluation of currencies and future adverse political and economic developments. Moreover, securities of foreign companies and foreign governments and their markets may be less liquid and their prices more volatile than those of comparable domestic companies and the U.S. Government.
| 8. | FEDERAL INCOME TAX INFORMATION |
The amount and characterization of certain income and capital gains to be distributed are determined in accordance with federal income tax regulations, which may differ from accounting principles generally accepted in the United States of America. The Series may periodically make reclassifications among its capital accounts to reflect income and gains available for distribution (or available capital loss carryovers) under income tax regulations without impacting the Series’ net asset value. Any such reclassifications are not reflected in the financial highlights.
The final determination of the tax character of current year distributions will be made at the conclusion of the fiscal year. The tax character of distributions paid for the year ended December 31, 2009 were as follows:
| | | |
Ordinary income | | $ | 2,992,322 |
20
Notes to Financial Statements (unaudited)
| 8. | FEDERAL INCOME TAX INFORMATION (continued) |
At December 31, 2009, the Series had a capital loss carryover of $860,601, available to the extent allowed by tax law to offset future net capital gain, if any, will expire as follows:
| | |
| Loss Carryover | | Expiration Date |
$840,304 | | December 31, 2016 |
20,297 | | December 31, 2017 |
At June 30, 2010, the identified cost of investments for federal income tax purposes, the resulting gross unrealized appreciation and depreciation, and the net unrealized appreciation were as follows:
| | | | |
Cost for federal income tax purposes | | $ | 89,970,827 | |
Unrealized appreciation | | $ | 6,548,278 | |
Unrealized depreciation | | | (155,625 | ) |
| | | | |
Net unrealized appreciation | | $ | 6,392,653 | |
| | | | |
There were no subsequent events that require recognition or disclosure. In preparing these financial statements, management of the Fund has evaluated events and transactions for potential recognition or disclosure through the date the financial statements were issued.
21
Literature Requests (unaudited)
Proxy Voting Policies and Procedures
A description of the policies and procedures that the Fund uses to determine how to vote proxies relating to portfolio securities is available, without charge, upon request:
| | |
By phone | | 1-800-466-3863 |
On the Securities and Exchange | | |
Commission’s (SEC) web site | | http://www.sec.gov |
Proxy Voting Record
Information regarding how the Fund voted proxies relating to portfolio securities during the most recent 12-month period ended June 30th is available, without charge, upon request:
| | |
By phone | | 1-800-466-3863 |
On the SEC’s web site | | http://www.sec.gov |
Quarterly Portfolio Holdings
The Series’ complete schedule of portfolio holdings for the 1st and 3rd quarters of each fiscal year are provided on Form N-Q, and are available, without charge, upon request:
| | |
By phone | | 1-800-466-3863 |
On the SEC’s web site | | http://www.sec.gov |
The Series’ Form N-Q may be reviewed and copied at the SEC’s Public Reference Room in Washington, D.C. Information on the operation of the Public Reference Room may be obtained by calling 1-800-SEC-0330.
Prospectus and Statement of Additional Information (SAI)
The prospectus and SAI provide additional information about each Series, including charges, expenses and risks. These documents are available, without charge, upon request:
| | |
By phone | | 1-800-466-3863 |
On the SEC’s web site | | http://www.sec.gov |
On the Advisor’s web site | | http://www.manningnapieradvisors.com |
Additional information available at www.manningnapieradvisors.com
1. Fund Holdings - Month-End
2. Fund Holdings - Quarter-End
3. Shareholder Report - Annual
4. Shareholder Report - Semi-Annual
MNCRBND-06/10-SAR

Shareholder Expense Example (unaudited)
As a shareholder of the Series, you may incur two types of costs: (1) transaction costs and (2) ongoing costs, including management fees and other Series expenses. This example is intended to help you understand your ongoing costs (in dollars) of investing in the Series and to compare these costs with the ongoing costs of investing in other mutual funds.
The example is based on an investment of $1,000 invested at the beginning of the period and held for the entire period (January 1, 2010 to June 30, 2010).
Actual Expenses
The first line of the table below provides information about actual account values and actual expenses. You may use the information in this line, together with the amount you invested, to estimate the expenses that you paid over the period. Simply divide your account value by $1,000 (for example, an $8,600 account value divided by $1,000 = 8.6), then multiply the result by the number in the first line under the heading entitled “Expenses Paid During Period” to estimate the expenses you paid on your account during this period.
Hypothetical Example for Comparison Purposes
The second line of the table below provides information about hypothetical account values and hypothetical expenses based on the Series’ actual expense ratio and an assumed rate of return of 5% per year before expenses, which is not the Series’ actual return. The hypothetical account values and expenses may not be used to estimate the actual ending account balance or expenses you paid during the period. You may use this information to compare the ongoing costs of investing in the Series and other funds. To do so, compare this 5% hypothetical example with the 5% hypothetical examples that appear in the shareholder reports of the other funds.
Please note that the expenses shown in the table are meant to highlight your ongoing costs only and do not reflect any transaction costs. Therefore, the second line of the table is useful in comparing ongoing costs only, and will not help you determine the relative total costs of owning different funds. In addition, if these transaction costs were included, your costs would have been higher.
| | | | | | |
| | | Beginning
Account Value
1/1/10 | | Ending
Account Value
6/30/10 | | Expenses Paid
During Period*
1/1/10-6/30/10 |
Actual Hypothetical | | $1,000.00 | | $1,057.20 | | $3.83 |
(5% return before expenses) | | $1,000.00 | | $1,021.08 | | $3.76 |
*Expenses are equal to the Series’ annualized expense ratio (for the six-month period) of 0.75%, multiplied by the average account value over the period, multiplied by 181/365 (to reflect the one-half year period). Expenses are based on the most recent fiscal half year. The Series’ total return would have been lower had certain expenses not been waived during the period.
Portfolio Composition as of June 30, 2010 (unaudited)
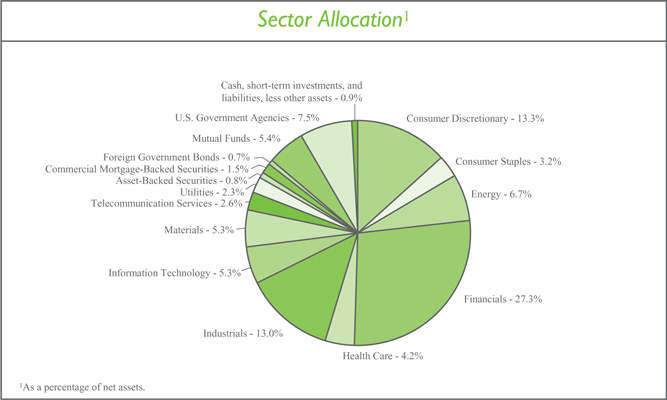
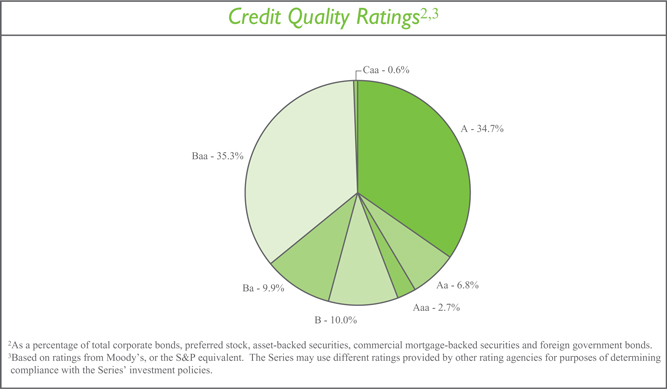
Investment Portfolio - June 30, 2010 (unaudited)
| | | | | | | | |
| | | Credit Rating 1
(unaudited) | | Principal Amount | | Value (Note 2) |
| | | |
CORPORATE BONDS - 80.9% | | | | | | | | |
| | | |
Convertible Corporate Bonds - 1.7% | | | | | | | | |
Consumer Discretionary - 0.3% | | | | | | | | |
Hotels, Restaurants & Leisure - 0.3% | | | | | | | | |
Carnival Corp., 2.00%, 4/15/2021 | �� | A3 | | $ | 1,680,000 | | $ | 1,738,800 |
| | | | | | | | |
Health Care - 0.8% | | | | | | | | |
Biotechnology - 0.7% | | | | | | | | |
Amgen, Inc., 0.375%, 2/1/2013 | | A3 | | | 3,270,000 | | | 3,229,125 |
| | | | | | | | |
Health Care Equipment & Supplies - 0.1% | | | | | | | | |
Medtronic, Inc., 1.625%, 4/15/2013 | | A1 | | | 665,000 | | | 666,663 |
| | | | | | | | |
Total Health Care | | | | | | | | 3,895,788 |
| | | | | | | | |
Industrials - 0.2% | | | | | | | | |
Airlines - 0.2% | | | | | | | | |
AirTran Holdings, Inc., 5.25%, 11/1/2016 | | CCC2 | | | 1,000,000 | | | 1,046,250 |
| | | | | | | | |
Information Technology - 0.4% | | | | | | | | |
Computers & Peripherals - 0.4% | | | | | | | | |
EMC Corp., 1.75%, 12/1/2013 | | A2 | | | 1,685,000 | | | 2,133,631 |
| | | | | | | | |
Total Convertible Corporate Bonds
(Identified Cost $8,848,932) | | | | | | | | 8,814,469 |
| | | | | | | | |
Non-Convertible Corporate Bonds - 79.2% | | | | | | | | |
Consumer Discretionary - 13.0% | | | | | | | | |
Hotels, Restaurants & Leisure - 1.7% | | | | | | | | |
International Game Technology, 7.50%, 6/15/2019 | | Baa2 | | | 4,075,000 | | | 4,731,935 |
Scientific Games International, Inc., 9.25%, 6/15/2019 | | B1 | | | 1,000,000 | | | 1,022,500 |
Wendy’s - Arby’s Restaurants LLC, 10.00%, 7/15/2016 | | B3 | | | 1,000,000 | | | 1,040,000 |
Wyndham Worldwide Corp., 9.875%, 5/1/2014 | | Ba1 | | | 405,000 | | | 452,446 |
Wyndham Worldwide Corp., 6.00%, 12/1/2016 | | Ba1 | | | 800,000 | | | 776,136 |
Yonkers Racing Corp.3, 11.375%, 7/15/2016 | | B1 | | | 470,000 | | | 503,487 |
| | | | | | | | |
| | | | | | | | 8,526,504 |
| | | | | | | | |
Household Durables - 1.8% | | | | | | | | |
Fortune Brands, Inc., 5.375%, 1/15/2016 | | Baa3 | | | 4,485,000 | | | 4,835,162 |
Newell Rubbermaid, Inc., 10.60%, 4/15/2019 | | Baa3 | | | 3,195,000 | | | 4,409,864 |
| | | | | | | | |
| | | | | | | | 9,245,026 |
| | | | | | | | |
Media - 6.2% | | | | | | | | |
Cablevision Systems Corp.3, 8.625%, 9/15/2017 | | B1 | | | 1,965,000 | | | 2,004,300 |
Columbus International, Inc. (Barbados)3, 11.50%, 11/20/2014 | | B2 | | | 900,000 | | | 958,566 |
Comcast Corp., 6.50%, 11/15/2035 | | Baa1 | | | 4,540,000 | | | 4,937,273 |
Comcast Corp., 6.95%, 8/15/2037 | | Baa1 | | | 1,855,000 | | | 2,110,111 |
DIRECTV Holdings LLC, 5.20%, 3/15/2020 | | Baa2 | | | 4,710,000 | | | 4,908,823 |
Discovery Communications LLC, 5.05%, 6/1/2020 | | Baa2 | | | 4,875,000 | | | 5,067,406 |
Sirius XM Radio, Inc.3, 9.75%, 9/1/2015 | | B1 | | | 1,405,000 | | | 1,492,813 |
Time Warner, Inc., 7.625%, 4/15/2031 | | Baa2 | | | 4,105,000 | | | 4,938,208 |
| | | | |
| 3 | | The accompanying notes are an integral part of the financial statements. | | |
Investment Portfolio - June 30, 2010 (unaudited)
| | | | | | | | |
| | | Credit Rating 1
(unaudited) | | Principal Amount | | Value (Note 2) |
| | | |
CORPORATE BONDS (continued) | | | | | | | | |
| | | |
Non-Convertible Corporate Bonds (continued) | | | | | | | | |
Consumer Discretionary (continued) | | | | | | | | |
Media (continued) | | | | | | | | |
Unitymedia Hessen GmbH & Co. KG (Germany)3, 8.125%, 12/1/2017 | | B1 | | $ | 600,000 | | $ | 722,706 |
UPC Holding B.V. (Netherlands)3, 9.875%, 4/15/2018 | | B2 | | | 1,405,000 | | | 1,412,025 |
Virgin Media Finance plc, Series 1 (United Kingdom), 9.50%, 8/15/2016 | | B1 | | | 1,365,000 | | | 1,441,781 |
WMG Acquisition Corp., 9.50%, 6/15/2016 | | Ba2 | | | 1,000,000 | | | 1,065,000 |
| | | | | | | | |
| | | | | | | | 31,059,012 |
| | | | | | | | |
Multiline Retail - 0.8% | | | | | | | | |
Target Corp., 6.00%, 1/15/2018 | | A2 | | | 3,225,000 | | | 3,810,421 |
| | | | | | | | |
Specialty Retail - 1.9% | | | | | | | | |
The Home Depot, Inc., 5.40%, 3/1/2016 | | Baa1 | | | 4,325,000 | | | 4,813,781 |
Lowe’s Companies, Inc., 6.10%, 9/15/2017 | | A1 | | | 3,175,000 | | | 3,739,490 |
Toys R Us Property Co. LLC3, 8.50%, 12/1/2017 | | Ba2 | | | 920,000 | | | 943,000 |
| | | | | | | | |
| | | | | | | | 9,496,271 |
| | | | | | | | |
Textiles, Apparel & Luxury Goods - 0.6% | | | | | | | | |
VF Corp., 5.95%, 11/1/2017 | | A3 | | | 2,815,000 | | | 3,202,262 |
| | | | | | | | |
Total Consumer Discretionary | | | | | | | | 65,339,496 |
| | | | | | | | |
Consumer Staples - 3.2% | | | | | | | | |
Beverages - 1.3% | | | | | | | | |
CEDC Finance Corp. International, Inc.3, 9.125%, 12/1/2016 | | B1 | | | 1,215,000 | | | 1,172,475 |
Constellation Brands, Inc., 8.375%, 12/15/2014 | | Ba3 | | | 1,205,000 | | | 1,283,325 |
PepsiCo, Inc., 7.90%, 11/1/2018 | | Aa3 | | | 3,330,000 | | | 4,305,550 |
| | | | | | | | |
| | | | | | | | 6,761,350 |
| | | | | | | | |
Food & Staples Retailing - 0.1% | | | | | | | | |
Ingles Markets, Inc., 8.875%, 5/15/2017 | | B1 | | | 395,000 | | | 401,913 |
| | | | | | | | |
Food Products - 1.6% | | | | | | | | |
General Mills, Inc., 5.65%, 2/15/2019 | | Baa1 | | | 3,260,000 | | | 3,704,266 |
Kraft Foods, Inc., 6.125%, 2/1/2018 | | Baa2 | | | 3,610,000 | | | 4,096,982 |
| | | | | | | | |
| | | | | | | | 7,801,248 |
| | | | | | | | |
Household Products - 0.0%* | | | | | | | | |
The Procter & Gamble Co., 4.85%, 12/15/2015 | | Aa3 | | | 25,000 | | | 28,287 |
| | | | | | | | |
Personal Products - 0.2% | | | | | | | | |
Revlon Consumer Products Corp.3, 9.75%, 11/15/2015 | | B3 | | | 1,215,000 | | | 1,245,375 |
| | | | | | | | |
Total Consumer Staples | | | | | | | | 16,238,173 |
| | | | | | | | |
Energy - 6.7% | | | | | | | | |
Energy Equipment & Services - 2.5% | | | | | | | | |
Baker Hughes, Inc., 7.50%, 11/15/2018 | | A2 | | | 3,155,000 | | | 3,857,347 |
| | | | |
| | The accompanying notes are an integral part of the financial statements. | | 4 |
Investment Portfolio - June 30, 2010 (unaudited)
| | | | | | | | |
| | | Credit Rating 1
(unaudited) | | Principal Amount | | Value (Note 2) |
| | | |
CORPORATE BONDS (continued) | | | | | | | | |
| | | |
Non-Convertible Corporate Bonds (continued) | | | | | | | | |
Energy (continued) | | | | | | | | |
Energy Equipment & Services (continued) | | | | | | | | |
Cie Generale de Geophysique - Veritas (France), 7.75%, 5/15/2017 | | Ba3 | | $ | 1,000,000 | | $ | 947,500 |
Complete Production Services, Inc., 8.00%, 12/15/2016 | | B1 | | | 1,155,000 | | | 1,129,013 |
Hornbeck Offshore Services, Inc., 8.00%, 9/1/2017 | | Ba3 | | | 500,000 | | | 445,000 |
Key Energy Services, Inc., 8.375%, 12/1/2014 | | B1 | | | 1,000,000 | | | 993,750 |
Thermon Industries, Inc.3, 9.50%, 5/1/2017 | | B1 | | | 830,000 | | | 842,450 |
Weatherford International Ltd. (Switzerland), 9.625%, 3/1/2019 | | Baa1 | | | 3,705,000 | | | 4,461,528 |
| | | | | | | | |
| | | | | | | | 12,676,588 |
| | | | | | | | |
| | | |
Oil, Gas & Consumable Fuels - 4.2% | | | | | | | | |
Alon Refining Krotz Springs, Inc., 13.50%, 10/15/2014 | | B2 | | | 1,000,000 | | | 965,000 |
Anadarko Petroleum Corp., 5.95%, 9/15/2016 | | Ba1 | | | 5,825,000 | | | 5,013,560 |
Apache Corp., 6.90%, 9/15/2018 | | A3 | | | 2,275,000 | | | 2,765,508 |
Aquilex Holdings LLC - Aquilex Finance Corp.3, 11.125%, 12/15/2016 | | B3 | | | 740,000 | | | 740,000 |
Arch Western Finance LLC, 6.75%, 7/1/2013 | | B1 | | | 1,465,000 | | | 1,468,662 |
Chaparral Energy, Inc., 8.875%, 2/1/2017 | | Caa1 | | | 1,055,000 | | | 970,600 |
Chesapeake Energy Corp., 9.50%, 2/15/2015 | | Ba3 | | | 1,000,000 | | | 1,105,000 |
Coffeyville Resources LLC - Coffeyville Finance, Inc.3, 9.00%, 4/1/2015 | | Ba3 | | | 415,000 | | | 410,850 |
Coffeyville Resources LLC - Coffeyville Finance, Inc.3, 10.875%, 4/1/2017 | | B3 | | | 395,000 | | | 385,125 |
Crosstex Energy LP - Crosstex Energy Finance Corp., 8.875%, 2/15/2018 | | B3 | | | 1,000,000 | | | 998,750 |
Martin Midstream Partners LP - Martin Midstream Finance Corp.3, 8.875%, 4/1/2018 | | B3 | | | 840,000 | | | 831,600 |
Niska Gas Storage US LLC - Niska Gas Storage Canada ULC3 , 8.875%, 3/15/2018 | | B1 | | | 605,000 | | | 614,075 |
Plains Exploration & Production Co., 8.625%, 10/15/2019 | | B1 | | | 1,535,000 | | | 1,554,188 |
Targa Resources Partners LP - Targa Resources Partners Finance Corp., 8.25%, 7/1/2016 | | B2 | | | 750,000 | | | 736,875 |
Tesoro Corp., 9.75%, 6/1/2019 | | Ba1 | | | 1,180,000 | | | 1,224,250 |
Whiting Petroleum Corp., 7.00%, 2/1/2014 | | B1 | | | 1,000,000 | | | 1,020,000 |
| | | | | | | | |
| | | | | | | | 20,804,043 |
| | | | | | | | |
| | | |
Total Energy | | | | | | | | 33,480,631 |
| | | | | | | | |
Financials - 25.0% | | | | | | | | |
Capital Markets - 4.8% | | | | | | | | |
Goldman Sachs Capital I, 6.345%, 2/15/2034 | | A3 | | | 3,450,000 | | | 3,095,602 |
Goldman Sachs Capital II4, 5.793%, 12/29/2049 | | Baa2 | | | 4,205,000 | | | 3,174,775 |
The Goldman Sachs Group, Inc., 6.15%, 4/1/2018 | | A1 | | | 3,385,000 | | | 3,545,845 |
| | | | |
| 5 | | The accompanying notes are an integral part of the financial statements. | | |
Investment Portfolio - June 30, 2010 (unaudited)
| | | | | | | | |
| | | Credit Rating 1
(unaudited) | | Principal Amount | | Value (Note 2) |
| | | |
CORPORATE BONDS (continued) | | | | | | | | |
| | | |
Non-Convertible Corporate Bonds (continued) | | | | | | | | |
Financials (continued) | | | | | | | | |
Capital Markets (continued) | | | | | | | | |
The Goldman Sachs Group, Inc., 5.375%, 3/15/2020 | | A1 | | $ | 4,510,000 | | $ | 4,456,403 |
Merrill Lynch & Co., Inc., 6.11%, 1/29/2037 | | A3 | | | 1,785,000 | | | 1,621,094 |
Morgan Stanley, 5.55%, 4/27/2017 | | A2 | | | 3,544,000 | | | 3,515,202 |
Morgan Stanley, 5.50%, 1/26/2020 | | A2 | | | 4,485,000 | | | 4,338,789 |
| | | | | | | | |
| | | | | | | | 23,747,710 |
| | | | | | | | |
Commercial Banks - 6.0% | | | | | | | | |
Household Finance Co., 6.375%, 11/27/2012 | | A3 | | | 4,335,000 | | | 4,681,535 |
KeyBank National Association, 5.45%, 3/3/2016 | | A3 | | | 4,640,000 | | | 4,802,827 |
Manufacturers & Traders Trust Co., 6.625%, 12/4/2017 | | A3 | | | 4,605,000 | | | 5,103,800 |
National City Corp., 6.875%, 5/15/2019 | | Baa1 | | | 1,920,000 | | | 2,155,236 |
PNC Bank National Association5, 5.25%, 1/15/2017 | | A2 | | | 5,640,000 | | | 5,991,287 |
U.S. Bank National Association, 6.375%, 8/1/2011 | | Aa2 | | | 85,000 | | | 89,744 |
USB Capital XIII Trust, 6.625%, 12/15/2039 | | A2 | | | 2,040,000 | | | 2,150,854 |
Wachovia Corp., 5.25%, 8/1/2014 | | A2 | | | 4,500,000 | | | 4,765,437 |
| | | | | | | | |
| | | | | | | | 29,740,720 |
| | | | | | | | |
Consumer Finance - 1.8% | | | | | | | | |
American Express Co., 8.125%, 5/20/2019 | | A3 | | | 3,935,000 | | | 4,885,672 |
American Express Co.4, 6.80%, 9/1/2066 | | Baa2 | | | 3,445,000 | | | 3,281,363 |
Credit Acceptance Corp.3, 9.125%, 2/1/2017 | | B1 | | | 1,000,000 | | | 1,005,000 |
| | | | | | | | |
| | | | | | | | 9,172,035 |
| | | | | | | | |
Diversified Financial Services - 3.5% | | | | | | | | |
Bank of America Corp., 5.75%, 8/15/2016 | | A3 | | | 3,715,000 | | | 3,848,640 |
Bank of America Corp., 7.625%, 6/1/2019 | | A2 | | | 3,315,000 | | | 3,797,359 |
Citigroup, Inc., 8.50%, 5/22/2019 | | A3 | | | 4,110,000 | | | 4,899,630 |
JPMorgan Chase & Co., 6.30%, 4/23/2019 | | Aa3 | | | 4,300,000 | | | 4,856,828 |
| | | | | | | | |
| | | | | | | | 17,402,457 |
| | | | | | | | |
Insurance - 1.1% | | | | | | | | |
American International Group, Inc., 4.25%, 5/15/2013 | | A3 | | | 1,840,000 | | | 1,775,600 |
Fidelity National Financial, Inc., 6.60%, 5/15/2017 | | Baa3 | | | 2,475,000 | | | 2,467,746 |
Hartford Financial Services Group, Inc.4, 8.125%, 6/15/2038 | | Ba1 | | | 1,615,000 | | | 1,465,612 |
| | | | | | | | |
| | | | | | | | 5,708,958 |
| | | | | | | | |
Real Estate Investment Trusts (REITS) - 7.8% | | | | | | | | |
AvalonBay Communities, Inc., 6.10%, 3/15/2020 | | Baa1 | | | 4,380,000 | | | 4,840,934 |
Boston Properties LP, 5.875%, 10/15/2019 | | Baa2 | | | 4,455,000 | | | 4,766,249 |
Camden Property Trust, 5.70%, 5/15/2017 | | Baa1 | | | 4,025,000 | | | 4,191,961 |
Digital Realty Trust LP3, 5.875%, 2/1/2020 | | Baa2 | | | 1,000,000 | | | 1,020,247 |
DuPont Fabros Technology LP3, 8.50%, 12/15/2017 | | Ba2 | | | 1,475,000 | | | 1,511,875 |
Felcor Lodging LP, 10.00%, 10/1/2014 | | B2 | | | 1,000,000 | | | 1,045,000 |
| | | | |
| | The accompanying notes are an integral part of the financial statements. | | 6 |
Investment Portfolio - June 30, 2010 (unaudited)
| | | | | | | | |
| | | Credit Rating 1
(unaudited) | | Principal Amount | | Value (Note 2) |
| | | |
CORPORATE BONDS (continued) | | | | | | | | |
| | | |
Non-Convertible Corporate Bonds (continued) | | | | | | | | |
Financials (continued) | | | | | | | | |
Real Estate Investment Trusts (REITS) (continued) | | | | | | | | |
HCP, Inc., 6.70%, 1/30/2018 | | Baa3 | | $ | 4,500,000 | | $ | 4,744,242 |
Health Care REIT, Inc., 6.20%, 6/1/2016 | | Baa2 | | | 4,390,000 | | | 4,768,435 |
Host Hotels & Resorts LP, 6.375%, 3/15/2015 | | Ba1 | | | 740,000 | | | 725,200 |
Mack-Cali Realty LP, 7.75%, 8/15/2019 | | Baa2 | | | 2,665,000 | | | 3,131,697 |
National Retail Properties, Inc., 6.875%, 10/15/2017 | | Baa2 | | | 2,365,000 | | | 2,586,265 |
Omega Healthcare Investors, Inc.3, 7.50%, 2/15/2020 | | Ba3 | | | 1,000,000 | | | 997,500 |
Simon Property Group LP, 10.35%, 4/1/2019 | | A3 | | | 3,670,000 | | | 4,884,972 |
| | | | | | | | |
| | | | | | | | 39,214,577 |
| | | | | | | | |
Total Financials | | | | | | | | 124,986,457 |
| | | | | | | | |
Health Care - 3.4% | | | | | | | | |
Health Care Equipment & Supplies - 1.3% | | | | | | | | |
Becton Dickinson and Co., 6.00%, 5/15/2039 | | A2 | | | 3,350,000 | | | 3,915,788 |
Fresenius Medical Care Capital Trust IV, 7.875%, 6/15/2011 | | Ba3 | | | 1,000,000 | | | 1,033,750 |
Inverness Medical Innovations, Inc., 9.00%, 5/15/2016 | | B3 | | | 1,600,000 | | | 1,604,000 |
| | | | | | | | |
| | | | | | | | 6,553,538 |
| | | | | | | | |
Health Care Providers & Services - 0.6% | | | | | | | | |
BioScrip, Inc.3, 10.25%, 10/1/2015 | | B3 | | | 795,000 | | | 787,050 |
HCA, Inc., 8.50%, 4/15/2019 | | Ba3 | | | 1,000,000 | | | 1,060,000 |
Health Management Associates, Inc., 6.125%, 4/15/2016 | | BB2 | | | 1,050,000 | | | 994,875 |
| | | | | | | | |
| | | | | | | | 2,841,925 |
| | | | | | | | |
Life Sciences Tools & Services - 0.2% | | | | | | | | |
PharmaNet Development Group, Inc.3, 10.875%, 4/15/2017 | | B3 | | | 825,000 | | | 804,375 |
| | | | | | | | |
Pharmaceuticals - 1.3% | | | | | | | | |
Abbott Laboratories, 5.875%, 5/15/2016 | | A1 | | | 500,000 | | | 584,946 |
Novartis Securities Investment Ltd. (Bermuda), 5.125%, 2/10/2019 | | Aa2 | | | 4,420,000 | | | 4,947,951 |
Valeant Pharmaceuticals International3, 7.625%, 3/15/2020 | | Ba3 | | | 1,000,000 | | | 1,180,000 |
| | | | | | | | |
| | | | | | | | 6,712,897 |
| | | | | | | | |
Total Health Care | | | | | | | | 16,912,735 |
| | | | | | | | |
Industrials - 12.8% | | | | | | | | |
Aerospace & Defense - 0.9% | | | | | | | | |
The Boeing Co., 6.00%, 3/15/2019 | | A2 | | | 3,465,000 | | | 4,080,717 |
Kratos Defense & Security Solutions, Inc.3, 10.00%, 6/1/2017 | | B3 | | | 525,000 | | | 532,875 |
| | | | | | | | |
| | | | | | | | 4,613,592 |
| | | | | | | | |
Air Freight & Logistics - 0.1% | | | | | | | | |
FedEx Corp., 8.00%, 1/15/2019 | | Baa2 | | | 435,000 | | | 552,420 |
| | | | | | | | |
| | | | |
| 7 | | The accompanying notes are an integral part of the financial statements. | | |
Investment Portfolio - June 30, 2010 (unaudited)
| | | | | | | | |
| | | Credit Rating 1
(unaudited) | | Principal Amount | | Value (Note 2) |
| | | |
CORPORATE BONDS (continued) | | | | | | | | |
| | | |
Non-Convertible Corporate Bonds (continued) | | | | | | | | |
Industrials (continued) | | | | | | | | |
Airlines - 1.7% | | | | | | | | |
AirTran Airways, Inc.6,7, 10.41%, 4/1/2017 | | B1 | | $ | 600,725 | | $ | 564,681 |
Continental Airlines Pass Through Trust, Series
1997-4, Class A, 6.90%, 1/2/2018 | | Baa2 | | | 358,921 | | | 358,921 |
Delta Air Lines, Inc., 7.111%, 9/18/2011 | | BBB2 | | | 1,245,000 | | | 1,285,462 |
Delta Air Lines, Inc.3, 9.50%, 9/15/2014 | | Ba2 | | | 1,000,000 | | | 1,050,000 |
Delta Air Lines, Inc., 6.821%, 8/10/2022 | | Baa1 | | | 1,264,046 | | | 1,248,246 |
Southwest Airlines Co., 5.25%, 10/1/2014 | | Baa3 | | | 3,925,000 | | | 4,131,384 |
| | | | | | | | |
| | | | | | | | 8,638,694 |
| | | | | | | | |
| | | |
Building Products - 0.6% | | | | | | | | |
Building Materials Corp. of America3, 7.50%, 3/15/2020 | | B3 | | | 400,000 | | | 393,000 |
Owens Corning, 9.00%, 6/15/2019 | | Ba1 | | | 1,095,000 | | | 1,294,705 |
USG Corp.3, 9.75%, 8/1/2014 | | B2 | | | 1,000,000 | | | 1,040,000 |
| | | | | | | | |
| | | | | | | | 2,727,705 |
| | | | | | | | |
| | | |
Commercial Services & Supplies - 1.3% | | | | | | | | |
Clean Harbors, Inc., 7.625%, 8/15/2016 | | Ba2 | | | 1,000,000 | | | 1,027,500 |
Garda World Security Corp. (Canada)3, 9.75%, 3/15/2017 | | B3 | | | 800,000 | | | 812,000 |
Waste Management, Inc., 7.375%, 3/11/2019 | | Baa3 | | | 3,930,000 | | | 4,762,527 |
| | | | | | | | |
| | | | | | | | 6,602,027 |
| | | | | | | | |
| | | |
Industrial Conglomerates - 3.9% | | | | | | | | |
GE Capital Trust I4, 6.375%, 11/15/2067 | | Aa3 | | | 3,545,000 | | | 3,296,850 |
General Electric Capital Corp., 5.625%, 5/1/2018 | | Aa2 | | | 2,150,000 | | | 2,284,835 |
General Electric Capital Corp., 5.50%, 1/8/2020 | | Aa2 | | | 3,105,000 | | | 3,281,224 |
General Electric Capital Corp., Series A, 6.75%, 3/15/2032 | | Aa2 | | | 3,695,000 | | | 3,976,696 |
General Electric Co., 5.25%, 12/6/2017 | | Aa2 | | | 2,100,000 | | | 2,283,553 |
Textron, Inc., 7.25%, 10/1/2019 | | Baa3 | | | 3,790,000 | | | 4,326,766 |
| | | | | | | | |
| | | | | | | | 19,449,924 |
| | | | | | | | |
| | | |
Machinery - 2.0% | | | | | | | | |
Caterpillar Financial Services Corp., 7.05%, 10/1/2018 | | A2 | | | 3,385,000 | | | 4,083,038 |
John Deere Capital Corp., 5.50%, 4/13/2017 | | A2 | | | 1,240,000 | | | 1,398,969 |
John Deere Capital Corp., 5.75%, 9/10/2018 | | A2 | | | 3,795,000 | | | 4,341,810 |
| | | | | | | | |
| | | | | | | | 9,823,817 |
| | | | | | | | |
| | | |
Marine - 0.4% | | | | | | | | |
Navios Maritime Holdings, Inc. - Navios Maritime Finance US, Inc. (Marshall Island)3, 8.875%, 11/1/2017 | | Ba3 | | | 1,115,000 | | | 1,123,362 |
United Maritime Group LLC - United Maritime Group Finance Corp.3, 11.75%, 6/15/2015 | | B3 | | | 740,000 | | | 699,300 |
| | | | | | | | |
| | | | | | | | |
| | | | | | | | 1,822,662 |
| | | | | | | | |
| | | | |
| | The accompanying notes are an integral part of the financial statements. | | 8 |
Investment Portfolio - June 30, 2010 (unaudited)
| | | | | | | | |
| | | Credit Rating 1
(unaudited) | | Principal Amount | | Value (Note 2) |
| | | |
CORPORATE BONDS (continued) | | | | | | | | |
| | | |
Non-Convertible Corporate Bonds (continued) | | | | | | | | |
Industrials (continued) | | | | | | | | |
Road & Rail - 1.9% | | | | | | | | |
CSX Corp., 6.00%, 10/1/2036 | | Baa3 | | $ | 4,530,000 | | $ | 4,855,327 |
RailAmerica, Inc., 9.25%, 7/1/2017 | | B1 | | | 710,000 | | | 743,725 |
Union Pacific Corp., 5.65%, 5/1/2017 | | Baa2 | | | 3,675,000 | | | 4,095,170 |
| | | | | | | | |
| | | | | | | | 9,694,222 |
| | | | | | | | |
Total Industrials | | | | | | | | 63,925,063 |
| | | | | | | | |
Information Technology - 4.9% | | | | | | | | |
Communications Equipment - 1.5% | | | | | | | | |
Alcatel-Lucent USA, Inc., 6.50%, 1/15/2028 | | B1 | | | 1,000,000 | | | 660,000 |
Cisco Systems, Inc., 5.90%, 2/15/2039 | | A1 | | | 3,705,000 | | | 4,118,352 |
Hughes Network Systems LLC - HNS Finance Corp., 9.50%, 4/15/2014 | | B1 | | | 1,280,000 | | | 1,296,000 |
Nokia Corp. (Finland), 5.375%, 5/15/2019 | | A2 | | | 1,500,000 | | | 1,578,134 |
| | | | | | | | |
| | | | | | | | 7,652,486 |
| | | | | | | | |
Computers & Peripherals - 1.0% | | | | | | | | |
International Business Machines Corp., 5.60%, 11/30/2039 | | A1 | | | 4,506,000 | | | 5,009,478 |
| | | | | | | | |
Electronic Equipment, Instruments &
Components - 0.9% | | | | | | | | |
Corning, Inc., 6.20%, 3/15/2016 | | Baa1 | | | 3,915,000 | | | 4,417,032 |
| | | | | | | | |
IT Services - 1.0% | | | | | | | | |
The Western Union Co.3, 5.253%, 4/1/2020 | | A3 | | | 4,810,000 | | | 5,131,741 |
| | | | | | | | |
Semiconductors & Semiconductor Equipment - 0.5% | | | | | | | | |
Advanced Micro Devices, Inc.3, 8.125%, 12/15/2017 | | Ba3 | | | 1,475,000 | | | 1,467,625 |
MagnaChip Semiconductor S.A. - MagnaChip Semiconductor Finance Co.3, 10.50%, 4/15/2018 | | B2 | | | 830,000 | | | 844,525 |
| | | | | | | | |
| | | | | | | | 2,312,150 |
| | | | | | | | |
Total Information Technology | | | | | | | | 24,522,887 |
| | | | | | | | |
Materials - 5.3% | | | | | | | | |
Chemicals - 0.9% | | | | | | | | |
E.I. du Pont de Nemours & Co., 6.00%, 7/15/2018 | | A2 | | | 3,435,000 | | | 4,031,275 |
Solutia, Inc., 7.875%, 3/15/2020 | | B2 | | | 400,000 | | | 399,000 |
| | | | | | | | |
| | | | | | | | 4,430,275 |
| | | | | | | | |
Containers & Packaging - 0.1% | | | | | | | | |
BWAY Holding Co.3, 10.00%, 6/15/2018 | | B3 | | | 700,000 | | | 729,750 |
| | | | | | | | |
Metals & Mining - 3.0% | | | | | | | | |
Alcoa, Inc., 5.87%, 2/23/2022 | | Baa3 | | | 2,185,000 | | | 2,031,552 |
BHP Billiton Finance (USA) Ltd. (Australia), 6.50%, 4/1/2019 | | A1 | | | 3,230,000 | | | 3,873,565 |
Cliffs Natural Resources, Inc., 5.90%, 3/15/2020 | | Baa3 | | | 1,000,000 | | | 1,072,354 |
Steel Dynamics, Inc., 7.75%, 4/15/2016 | | Ba2 | | | 805,000 | | | 809,025 |
| | | | |
| 9 | | The accompanying notes are an integral part of the financial statements. | | |
Investment Portfolio - June 30, 2010 (unaudited)
| | | | | | | | |
| | | Credit Rating 1
(unaudited) | | Principal Amount | | Value (Note 2) |
| | | |
CORPORATE BONDS (continued) | | | | | | | | |
| | | |
Non-Convertible Corporate Bonds (continued) | | | | | | | | |
Materials (continued) | | | | | | | | |
Metals & Mining (continued) | | | | | | | | |
Teck Resources Ltd. (Canada), 10.75%, 5/15/2019 | | Baa3 | | $ | 5,895,000 | | $ | 7,223,143 |
| | | | | | | | |
| | | | | | | | 15,009,639 |
| | | | | | | | |
Paper & Forest Products - 1.3% | | | | | | | | |
Georgia-Pacific LLC3, 8.25%, 5/1/2016 | | Ba2 | | | 1,100,000 | | | 1,172,875 |
Georgia-Pacific LLC3, 7.125%, 1/15/2017 | | Ba2 | | | 270,000 | | | 275,400 |
International Paper Co., 7.50%, 8/15/2021 | | Baa3 | | | 4,140,000 | | | 4,847,505 |
| | | | | | | | |
| | | | | | | | 6,295,780 |
| | | | | | | | |
Total Materials | | | | | | | | 26,465,444 |
| | | | | | | | |
Telecommunication Services - 2.6% | | | | | | | | |
Diversified Telecommunication Services - 0.6% | | | | | | | | |
Clearwire Communications LLC - Clearwire Finance, Inc.3, 12.00%, 12/1/2015 | | Caa1 | | | 410,000 | | | 408,463 |
Clearwire Communications LLC - Clearwire Finance, Inc.3, 12.00%, 12/1/2015 | | Caa1 | | | 370,000 | | | 366,762 |
Intelsat Subsidiary Holding Co. Ltd. (Bermuda)3, 8.875%, 1/15/2015 | | B3 | | | 1,210,000 | | | 1,223,613 |
Wind Acquisition Finance S.A. (Luxembourg)3, 11.75%, 7/15/2017 | | B2 | | | 1,080,000 | | | 1,107,000 |
| | | | | | | | |
| | | | | | | | 3,105,838 |
| | | | | | | | |
Wireless Telecommunication Services - 2.0% | | | | | | | | |
CC Holdings GS V LLC - Crown Castle GS III Corp.3, 7.75%, 5/1/2017 | | Baa3 | | | 1,000,000 | | | 1,057,500 |
Crown Castle Towers LLC3, 6.113%, 1/15/2020 | | A2 | | | 4,070,000 | | | 4,467,045 |
NII Capital Corp., 10.00%, 8/15/2016 | | B1 | | | 1,000,000 | | | 1,052,500 |
SBA Telecommunications, Inc.3, 8.00%, 8/15/2016 | | Ba3 | | | 1,000,000 | | | 1,035,000 |
SBA Tower Trust3, 5.101%, 4/15/2017 | | A2 | | | 2,095,000 | | | 2,231,703 |
| | | | | | | | |
| | | | | | | | 9,843,748 |
| | | | | | | | |
Total Telecommunication Services | | | | | | | | 12,949,586 |
| | | | | | | | |
Utilities - 2.3% | | | | | | | | |
Electric Utilities - 1.9% | | | | | | | | |
Allegheny Energy Supply Co. LLC3, 5.75%, 10/15/2019 | | Baa3 | | | 2,385,000 | | | 2,367,363 |
Exelon Generation Co. LLC, 5.35%, 1/15/2014 | | A3 | | | 3,355,000 | | | 3,657,322 |
Southwestern Electric Power Co., 6.45%, 1/15/2019 | | Baa3 | | | 3,240,000 | | | 3,562,092 |
| | | | | | | | |
| | | | | | | | 9,586,777 |
| | | | | | | | |
Independent Power Producers & Energy
Traders - 0.2% | | | | | | | | |
Mirant Mid Atlantic Pass Through Trust, Series B, 9.125%, 6/30/2017 | | Ba1 | | | 389,120 | | | 402,253 |
| | | | |
| | The accompanying notes are an integral part of the financial statements. | | 10 |
Investment Portfolio - June 30, 2010 (unaudited)
| | | | | | | | |
| | | Credit Rating 1
(unaudited) | | Principal Amount/ Shares | | Value (Note 2) |
| | | |
CORPORATE BONDS (continued) | | | | | | | | |
| | | |
Non-Convertible Corporate Bonds (continued) | | | | | | | | |
Utilities (continued) | | | | | | | | |
Independent Power Producers & Energy Traders (continued) | | | |
Mirant Mid Atlantic Pass Through Trust, Series C, 10.06%, 12/30/2028 | | Ba1 | | $ | 487,147 | | $ | 522,465 |
| | | | | | | | |
| | | | | | | | 924,718 |
| | | | | | | | |
Multi-Utilities - 0.2% | | | | | | | | |
CenterPoint Energy Resources Corp., Series B, 7.875%, 4/1/2013 | | Baa3 | | | 770,000 | | | 882,322 |
DCP Midstream LLC, 7.875%, 8/16/2010 | | Baa2 | | | 30,000 | | | 30,220 |
| | | | | | | | |
| | | | | | | | 912,542 |
| | | | | | | | |
Total Utilities | | | | | | | | 11,424,037 |
| | | | | | | | |
Total Non-Convertible Corporate Bonds
(Identified Cost $366,716,386) | | | | | | | | 396,244,509 |
| | | | | | | | |
TOTAL CORPORATE BONDS
(Identified Cost $375,565,318) | | | | | | | | 405,058,978 |
| | | | | | | | |
| | | |
PREFERRED STOCKS - 2.3% | | | | | | | | |
| | | |
Financials - 2.3% | | | | | | | | |
Commercial Banks - 1.0% | | | | | | | | |
PNC Financial Services Group, Inc., Series K5 | | Baa3 | | | 1,850,000 | | | 1,899,069 |
Wells Fargo & Co., Series K | | Ba1 | | | 3,145,000 | | | 3,239,350 |
| | | | | | | | |
| | | | | | | | 5,138,419 |
| | | | | | | | |
Diversified Financial Services - 1.3% | | | | | | | | |
Bank of America Corp., Series K | | Ba3 | | | 3,350,000 | | | 3,235,866 |
JPMorgan Chase & Co., Series 1 | | Baa1 | | | 2,985,000 | | | 3,076,729 |
| | | | | | | | |
| | | | | | | | 6,312,595 |
| | | | | | | | |
TOTAL PREFERRED STOCKS
(Identified Cost $10,895,302) | | | | | | | | 11,451,014 |
| | | | | | | | |
ASSET-BACKED SECURITIES - 0.8% | | | | | | | | |
Capital Auto Receivables Asset Trust, Series 2007-1, Class A4A, 5.01%, 4/16/2012 | | Aaa | | $ | 268,351 | | | 274,139 |
Capital Auto Receivables Asset Trust, Series 2007-3, Class A4, 5.21%, 3/17/2014 | | Aaa | | | 200,000 | | | 207,031 |
Ford Credit Auto Owner Trust, Series 2008-C, Class A4B4, 1.98%, 4/15/2013 | | Aaa | | | 300,000 | | | 306,007 |
Hertz Vehicle Financing LLC, Series 2009-2A, Class A23, 5.29%, 3/25/2016 | | Aaa | | | 2,585,000 | | | 2,797,155 |
| | | | |
| 11 | | The accompanying notes are an integral part of the financial statements. | | |
Investment Portfolio - June 30, 2010 (unaudited)
| | | | | | | | |
| | | Credit Rating 1
(unaudited) | | Principal Amount | | Value (Note 2) |
| | | |
ASSET-BACKED SECURITIES (continued) | | | | | | | | |
SLM Student Loan Trust, Series 2002-4, Class A44, 0.397%, 3/15/2017 | | Aaa | | $ | 468,673 | | $ | 468,071 |
| | | | | | | | |
| | | |
TOTAL ASSET-BACKED SECURITIES
(Identified Cost $3,765,204) | | | | | | | | 4,052,403 |
| | | | | | | | |
| | | |
COMMERCIAL MORTGAGE-BACKED SECURITIES - 1.5% | | | | | | | | |
Banc of America Commercial Mortgage, Inc., Series
2006-2, Class A44, 5.738%, 5/10/2045 | | AAA2 | | | 400,000 | | | 423,650 |
Banc of America Commercial Mortgage, Inc., Series
2006-4, Class A4, 5.634%, 7/10/2046 | | Aaa | | | 335,000 | | | 344,286 |
Bear Stearns Commercial Mortgage Securities, Series 2006-PW12, Class A44, 5.722%, 9/11/2038 | | Aaa | | | 190,000 | | | 203,870 |
Bear Stearns Commercial Mortgage Securities, Series 2006-PW13, Class A4, 5.54%, 9/11/2041 | | AAA2 | | | 525,000 | | | 547,676 |
Citigroup Commercial Mortgage Trust, Series 2006-C4, Class A34, 5.729%, 3/15/2049 | | Aaa | | | 575,000 | | | 613,154 |
Commercial Mortgage Pass-Through Certificates, Series 2006-C7, Class A44, 5.768%, 6/10/2046 | | AAA2 | | | 410,000 | | | 435,927 |
JP Morgan Chase Commercial Mortgage Securities Corp., Series 2005-LDP5, Class A44, 5.195%, 12/15/2044 | | Aaa | | | 820,000 | | | 872,232 |
JP Morgan Chase Commercial Mortgage Securities Corp., Series 2006-LDP7, Class A44, 5.874%, 4/15/2045 | | Aaa | | | 330,000 | | | 351,666 |
LB-UBS Commercial Mortgage Trust, Series 2006-C4, Class A44, 5.882%, 6/15/2038 | | Aaa | | | 365,000 | | | 391,967 |
Morgan Stanley Capital I, Series 2005-HQ7, Class A44, 5.206%, 11/14/2042 | | Aaa | | | 385,000 | | | 410,712 |
OBP Depositor LLC Trust, Series 2010-OBP, Class A3,6, 4.646%, 7/15/2045 | | AAA2 | | | 420,000 | | | 419,998 |
Wachovia Bank Commercial Mortgage Trust, Series
2005-C21, Class A44, 5.208%, 10/15/2044 | | Aaa | | | 820,000 | | | 877,413 |
Wachovia Bank Commercial Mortgage Trust, Series
2006-C25, Class A44, 5.738%, 5/15/2043 | | Aaa | | | 770,000 | | | 830,616 |
Wachovia Bank Commercial Mortgage Trust, Series
2006-C26, Class A3, 6.011%, 6/15/2045 | | Aaa | | | 900,000 | | | 957,700 |
| | | | | | | | |
| | | |
TOTAL COMMERCIAL MORTGAGE-BACKED SECURITIES
(Identified Cost $7,579,598) | | | | | | | | 7,680,867 |
| | | | | | | | |
| | | |
FOREIGN GOVERNMENT BONDS - 0.7% | | | | | | | | |
Hellenic Republic Government Bond (Greece),
6.00%, 7/19/2019 (Identified Cost $5,171,280) | | Ba1 | | | 4,000,000 | | | 3,502,201 |
| | | | | | | | |
| | | | |
| | The accompanying notes are an integral part of the financial statements. | | 12 |
Investment Portfolio - June 30, 2010 (unaudited)
| | | | | | | | | |
| | | Shares/ Principal Amount | | Value (Note 2) | | | |
| | | |
MUTUAL FUNDS - 5.4% | | | | | | | | | |
iShares iBoxx High Yield Corporate Bond Fund | | | 81,310 | | $ | 6,903,219 | | | |
iShares iBoxx Investment Grade Corporate Bond Fund | | | 183,390 | | | 19,890,479 | | | |
John Hancock Preferred Income Fund | | | 10,500 | | | 182,070 | | | |
| | | | | | | | | |
TOTAL MUTUAL FUNDS
(Identified Cost $22,465,226) | | | | | | 26,975,768 | | | |
| | | | | | | | | |
| | | |
U.S. GOVERNMENT AGENCIES - 7.5% | | | | | | | | | |
| | | |
Other Agencies - 7.5% | | | | | | | | | |
Fannie Mae, 1.75%, 8/10/2012 | | $ | 2,611,000 | | | 2,661,896 | | | |
Federal Home Loan Bank, 4.50%, 11/15/2012 | | | 655,000 | | | 709,866 | | | |
Federal Home Loan Bank, 3.375%, 2/27/2013 | | | 640,000 | | | 678,828 | | | |
Freddie Mac, 1.75%, 6/15/2012 | | | 16,160,000 | | | 16,477,140 | | | |
Freddie Mac, 5.50%, 8/20/2012 | | | 15,570,000 | | | 17,114,435 | | | |
| | | | | | | | | |
TOTAL U.S. GOVERNMENT AGENCIES
(Identified Cost $37,235,242) | | | | | | 37,642,165 | | | |
| | | | | | | | | |
| | | |
SHORT-TERM INVESTMENTS - 1.5% | | | | | | | | | |
| | | |
Dreyfus Cash Management, Inc. - Institutional Shares8, 0.13%, (Identified Cost $7,373,309) | | | 7,373,309 | | | 7,373,309 | | | |
| | | | | | | | | |
TOTAL INVESTMENTS - 100.6%
(Identified Cost $470,050,479) | | | | | | 503,736,705 | | | |
LIABILITIES, LESS OTHER ASSETS - (0.6%) | | | | | | (3,213,990 | ) | | |
| | | | | | | | | |
NET ASSETS - 100% | | | | | $ | 500,522,715 | | | |
| | | | | | | | | |
| | | | | | | | |
| FORWARD FOREIGN CURRENCY EXCHANGE CONTRACTS OPEN AT JUNE 30, 2010: |
| Settlement Date | | Contracts to Deliver | | In Exchange For | | Contracts At Value | | Unrealized Appreciation |
7/28/2010 | | EUR4,000,000 | | $4,916,920 | | $4,892,047 | | $24,873 |
1Credit ratings from Moody’s (unaudited).
2Credit ratings from S&P (unaudited).
3Restricted securities - Investment in securities that are restricted as to public resale under the Securities Act of 1933, as amended. These securities have been sold under rule 144A and have been determined to be liquid under guidelines established by the Board of Directors. These securities amount to $54,338,949, or 10.9%, of the Series’ net assets as of June 30, 2010 (see Note 2 to the financial statements).
4The coupon rate is floating and is the stated rate as of June 30, 2010.
5PNC Global Investment Servicing (U.S.) Inc. serves as sub-accountant and sub-transfer agent to the Series.
6 Security has been valued at fair value.
7Restricted securities - Investment in securities that are restricted as to public resale under the Securities Act of 1933, as amended. This security was acquired on December 2, 2009 at a cost of $234,298 ($88.00 per share) and on March 5, 2010 at a cost of $315,915 ($94.75 per share). This security has been sold under rule 144A and has been determined to be illiquid under guidelines established by the Board of Directors. This security amounts to $564,681, or 0.1%, of the Series’ net assets as of June 30, 2010 (see Note 2 to the financial statements).
8 Rate shown is the current yield as of June 30, 2010.
| | | | |
| 13 | | The accompanying notes are an integral part of the financial statements. | | |
Statement of Assets and Liabilities (unaudited)
June 30, 2010
| | | | |
ASSETS: | | | | |
| |
Investments, at value (identified cost $470,050,479) (Note 2) | | $ | 503,736,705 | |
Cash | | | 448,650 | |
Interest receivable | | | 7,200,972 | |
Receivable for fund shares sold | | | 157,763 | |
Unrealized appreciation on foreign forward currency contracts (Note 2) | | | 24,873 | |
Dividends receivable | | | 1,038 | |
| | | | |
| |
TOTAL ASSETS | | | 511,570,001 | |
| | | | |
| |
LIABILITIES: | | | | |
| |
Accrued management fees (Note 3) | | | 287,833 | |
Accrued transfer agent fees (Note 3) | | | 3,198 | |
Accrued fund accounting and administration fees (Note 3) | | | 2,427 | |
Accrued Chief Compliance Officer service fees (Note 3) | | | 828 | |
Payable for securities purchased | | | 7,757,019 | |
Payable for fund shares repurchased | | | 2,979,988 | |
Other payables and accrued expenses | | | 15,993 | |
| | | | |
| |
TOTAL LIABILITIES | | | 11,047,286 | |
| | | | |
| |
TOTAL NET ASSETS | | $ | 500,522,715 | |
| | | | |
| |
NET ASSETS CONSIST OF: | | | | |
| |
Capital stock | | $ | 451,527 | |
Additional paid-in-capital | | | 457,263,119 | |
Undistributed net investment income | | | 11,165,698 | |
Accumulated net realized loss on investments, foreign currency and translation of other assets and liabilities | | | (2,034,421 | ) |
Net unrealized appreciation on investments, foreign currency and translation of other assets and liabilities | | | 33,676,792 | |
| | | | |
| |
TOTAL NET ASSETS | | $ | 500,522,715 | |
| | | | |
| |
NET ASSET VALUE, OFFERING PRICE AND REDEMPTION PRICE PER SHARE - Class A ($500,522,715/45,152,662 shares) | | $ | 11.09 | |
| | | | |
| | | | |
| | The accompanying notes are an integral part of the financial statements. | | 14 |
Statement of Operations (unaudited)
For the Six Months Ended June 30, 2010
| | | | |
INVESTMENT INCOME: | | | | |
| |
Interest | | $ | 11,252,041 | |
Dividends | | | 1,231,932 | |
| | | | |
| |
Total Investment Income | | | 12,483,973 | |
| | | | |
| |
EXPENSES: | | | | |
| |
Management fees (Note 3) | | | 1,526,896 | |
Fund accounting and administration fees (Note 3) | | | 47,307 | |
Directors’ fees (Note 3) | | | 6,373 | |
Transfer agent fees (Note 3) | | | 4,956 | |
Chief Compliance Officer service fees (Note 3) | | | 1,761 | |
Miscellaneous | | | 53,487 | |
| | | | |
| |
Total Expenses | | | 1,640,780 | |
Less reduction of expenses (Note 3) | | | (758 | ) |
| | | | |
| |
Net Expenses | | | 1,640,022 | |
| | | | |
| |
NET INVESTMENT INCOME | | | 10,843,951 | |
| | | | |
| |
REALIZED AND UNREALIZED GAIN ON INVESTMENTS AND FOREIGN CURRENCY: | | | | |
| |
Net realized gain on- | | | | |
Investments | | | 284,238 | |
Foreign currency and translation of other assets and liabilities | | | 130,221 | |
| | | | |
| |
| | | 414,459 | |
| | | | |
| |
Net change in unrealized appreciation on- | | | | |
Investments | | | 13,039,136 | |
Foreign currency and translation of other assets and liabilities | | | 47 | |
| | | | |
| | | 13,039,183 | |
| | | | |
| |
NET REALIZED AND UNREALIZED GAIN ON INVESTMENTS AND FOREIGN CURRENCY | | | 13,453,642 | |
| | | | |
| |
NET INCREASE IN NET ASSETS RESULTING FROM OPERATIONS | | $ | 24,297,593 | |
| | | | |
| | | | |
| 15 | | The accompanying notes are an integral part of the financial statements. | | |
Statements of Changes in Net Assets
| | | | | | | |
| | | For the Six
Months Ended
6/30/10
(unaudited) | | For the Year Ended
12/31/09 | |
INCREASE (DECREASE) IN NET ASSETS: | | | | | | | |
| | |
OPERATIONS: | | | | | | | |
| | |
Net investment income | | $ | 10,843,951 | | $ | 19,821,911 | |
Net realized gain on investments and foreign currency | | | 414,459 | | | 2,769,225 | |
Net change in unrealized appreciation on investments and foreign currency | | | 13,039,183 | | | 24,535,497 | |
| | | | | | | |
| | |
Net increase from operations | | | 24,297,593 | | | 47,126,633 | |
| | | | | | | |
| | |
DISTRIBUTIONS TO SHAREHOLDERS (Note 8): | | | | | | | |
| | |
From net investment income | | | — | | | (19,892,958 | ) |
| | | | | | | |
| | |
CAPITAL STOCK ISSUED AND REPURCHASED: | | | | | | | |
| | |
Net increase from capital share transactions (Note 5) | | | 80,916,777 | | | 27,443,626 | |
| | | | | | | |
| | |
Net increase in net assets | | | 105,214,370 | | | 54,677,301 | |
| | |
NET ASSETS: | | | | | | | |
| | |
Beginning of period | | | 395,308,345 | | | 340,631,044 | |
| | | | | | | |
| | |
End of period (including undistributed net investment income of $11,165,698 and $321,747, respectively) | | $ | 500,522,715 | | $ | 395,308,345 | |
| | | | | | | |
| | | | |
| | The accompanying notes are an integral part of the financial statements. | | 16 |
Financial Highlights
| | | | | | | | | | | | |
| | | For the Six
Months Ended
6/30/10 | | | | For the Years Ended | | For the
Period
4/21/051 to |
| | | (unaudited) | | 12/31/09 | | 12/31/08 | | 12/31/07 | | 12/31/06 | | 12/31/05 |
| Per share data (for a share outstanding throughout each period): | | | | | | | | | | | | |
| Net asset value - Beginning of period | | $10.49 | | $9.66 | | $10.02 | | $9.98 | | $9.89 | | $10.00 |
| | | | | | | | | | | | |
| | | | | | |
Income (loss) from investment operations: | | | | | | | | | | | | |
Net investment income | | 0.272 | | 0.572 | | 0.42 | | 0.40 | | 0.37 | | 0.22 |
Net realized and unrealized gain (loss) on investments | | 0.33 | | 0.82 | | (0.32) | | 0.03 | | 0.08 | | (0.12) |
| | | | | | | | | | | | |
Total from investment operations | | 0.60 | | 1.39 | | 0.10 | | 0.43 | | 0.45 | | 0.10 |
| | | | | | | | | | | | |
Less distributions to shareholders: | | | | | | | | | | | | |
From net investment income | | — | | (0.56) | | (0.45) | | (0.39) | | (0.36) | | (0.21) |
From net realized gain on investments | | — | | — | | (0.01) | | — | | — | | — |
| | | | | | | | | | | | |
Total distributions to shareholders | | — | | (0.56) | | (0.46) | | (0.39) | | (0.36) | | (0.21) |
| | | | | | | | | | | | |
Net asset value - End of period | | $11.09 | | $10.49 | | $9.66 | | $10.02 | | $9.98 | | $9.89 |
| | | | | | | | | | | | |
Net assets - End of period
(000’s omitted) | | $500,523 | | $395,308 | | $340,631 | | $278,494 | | $224,145 | | $175,594 |
| | | | | | | | | | | | |
Total return3 | | 5.72% | | 14.35% | | 1.24% | | 4.34% | | 4.59% | | 1.04% |
Ratios (to average net assets)/ Supplemental Data: | | | | | | | | | | | | |
Expenses* | | 0.75%4 | | 0.78% | | 0.80% | | 0.81% | | 0.83% | | 0.88%4 |
Net investment income | | 4.97%4 | | 5.60% | | 4.84% | | 4.20% | | 3.95% | | 3.12%4 |
Portfolio turnover | | 11% | | 72% | | 63% | | 341% | | 315% | | 290% |
|
*The investment advisor did not impose all or a portion of its management fees, CCO fees, fund accounting and transfer agent fees and other fees in some periods and in some periods paid a portion of the Series’ expenses. If these expenses had been incurred by the Series, the expense ratio (to average net assets) would have been increased by the following amounts: |
| | 0.00%4,5 | | 0.00%5 | | N/A | | N/A | | N/A | | N/A |
1Commencement of operations.
2Calculated based on average shares outstanding during the periods.
3Represents aggregate total return for the periods indicated, and assumes reinvestment of all distributions. Total return would have been lower had certain expenses not been waived or reimbursed during the periods. Periods less than one year are not annualized.
4Annualized.
5Less than 0.01%.
| | | | |
| 17 | | The accompanying notes are an integral part of the financial statements. | | |
Notes to Financial Statements (unaudited)
Core Plus Bond Series (the “Series”) is a no-load diversified series of Manning & Napier Fund, Inc. (the “Fund”). The Fund is organized in Maryland and is registered under the Investment Company Act of 1940, as amended, as an open-end management investment company.
The Series’ investment objective is to provide long-term total return by investing primarily in bonds and other financial instruments, including derivatives, with economic characteristics similar to bonds.
The Fund’s Advisor is Manning & Napier Advisors, Inc. (the “Advisor”). Shares of the Series are offered to investors, clients and employees of the Advisor and its affiliates. The total authorized capital stock of the Fund consists of 10.0 billion shares of common stock each having a par value of $0.01. As of June 30, 2010, 6.2 billion shares have been designated in total among 29 series, of which 125 million have been designated as Core Plus Bond Series Class A common stock.
| 2. | SIGNIFICANT ACCOUNTING POLICIES |
Security Valuation
Portfolio securities, including domestic equities, foreign equities, warrants and options, listed on an exchange other than the NASDAQ National Market System are valued at the latest quoted sales price of the exchange on which the security is primarily traded. Securities not traded on valuation date or securities not listed on an exchange are valued at the latest quoted bid price provided by the Fund’s pricing service. Securities listed on the NASDAQ National Market System are valued in accordance with the NASDAQ Official Closing Price.
Debt securities, including government bonds, foreign bonds, asset-backed securities, structured notes, supranational obligations, sovereign bonds, corporate bonds and mortgage-backed securities will normally be valued on the basis of evaluated bid prices provided by an independent pricing service. Certain investments in securities held by the Series may be valued on a basis of a price provided by a principal market maker. These prices may differ from the value that would have been used had a broader market for securities existed.
Municipal securities will normally be valued on the basis of market valuations provided by an independent pricing service that utilizes the latest price quotations and a matrix system (which considers such factors as security prices of similar securities, yields, maturities and ratings).
Short-term investments that mature in sixty days or less are valued at amortized cost, which approximates market value. Investments in open-end investment companies are valued at their net asset value per share on valuation date.
Volume and level of activity in established markets for an asset or liability are evaluated to determine whether recent transactions and quoted prices are determinative of fair value. Where there have been significant decreases in volume and level of activity, further analysis and adjustment may be necessary to estimate fair value. The Series measures fair value in these instances by the use of inputs and valuation techniques which may be based upon current market prices of securities that are comparable in coupon, rating, maturity and industry and/or expectation of future cash flows. As a result of trading in relatively thin markets and/or markets that experience significant volatility, the prices used by the Series to value these securities may differ from the value that would be realized if these securities were sold, and the differences could be material.
Securities for which representative valuations or prices are not available from the Fund’s pricing service may be valued at fair value. Due to the inherent uncertainty of valuations of such securities, the fair value may differ significantly from the values that would have been used had a ready market for such securities existed. If trading or events occurring after the close of the principal market in which securities are traded are expected to materially affect the value of those securities, then they may be valued at their fair value, taking this trading or these events into account.
Notes to Financial Statements (unaudited)
| 2. | SIGNIFICANT ACCOUNTING POLICIES (continued) |
Security Valuation (continued)
Fair value is determined in good faith by the Advisor under procedures approved by and under the general supervision and responsibility of the Fund’s Board of Directors (the “Board”).
Various inputs are used in determining the value of the Series’ assets or liabilities carried at market value. These inputs are summarized in three broad levels. Level 1 includes quoted prices in active markets for identical assets and liabilities. Level 2 includes other significant observable inputs (including quoted prices for similar securities, interest rates, prepayment speeds, credit risk, etc.). Level 3 includes significant unobservable inputs (including the Series’ own assumptions in determining the fair value of investments). The inputs or methodology used for valuing securities are not necessarily an indication of the risk associated with investing in those securities.
The following is a summary of the valuation levels used for major security types as of June 30, 2010 in valuing the Series’ assets or liabilities carried at market value:
| | | | | | | | | | | | |
| Description | | 6/30/10 | | Level 1 | | Level 2 | | Level 3 |
Equity securities* | | $ | — | | $ | — | | $ | — | | $ | — |
Preferred securities | | | 11,451,014 | | | — | | | 11,451,014 | | | — |
Debt securities: | | | | | | | | | | | | |
U.S. Treasury and other U.S. Government agencies | | | 37,642,165 | | | — | | | 37,642,165 | | | — |
States and political subdivisions (municipals) | | | — | | | — | | | — | | | — |
Corporate debt | | | 396,244,509 | | | — | | | 395,679,828 | | | 564,681 |
Convertible corporate debt | | | 8,814,469 | | | — | | | 8,814,469 | | | — |
Asset backed securities | | | 4,052,403 | | | — | | | 4,052,403 | | | — |
Commercial mortgage backed securities | | | 7,680,867 | | | — | | | 7,680,867 | | | — |
Foreign government bonds | | | 3,502,201 | | | — | | | 3,502,201 | | | — |
Mutual funds | | | 34,349,077 | | | 34,349,077 | | | — | | | — |
Other financial instruments** | | | — | | | — | | | — | | | — |
| | | | | | | | | | | | |
Total | | $ | 503,736,705 | | $ | 34,349,077 | | $ | 468,822,947 | | $ | 564,681 |
| | | | | | | | | | | | |
19
Notes to Financial Statements (unaudited)
| 2. | SIGNIFICANT ACCOUNTING POLICIES (continued) |
Security Valuation (continued)
The following table is a reconciliation of Level 3 investments for which significant unobservable inputs were used to determine fair value:
| | | |
| Level 3 Reconciliation | | Corporate
Debt |
Balance as of December 31, 2009 (market value) | | $ | 244,111 |
Accrued discounts/premiums | | | 2,049 |
Change in unrealized appreciation/depreciation*** | | | 9,454 |
Net realized gain | | | 902 |
Net purchases/sales | | | 308,165 |
| | | |
Balance as of June 30, 2010 (market value) | | $ | 564,681 |
| | | |
*Includes common stock, warrants and rights. Please see the Investment Portfolio for industry classification and for securities where a latest quoted sales price is not available and the latest quoted bid price was used to value the security. Such securities are included in Level 2 in the table above.
**Other financial instruments are derivative instruments not reflected in the Investment Portfolio, such as futures, forwards and swap contracts, which are valued at the unrealized appreciation/depreciation on the instrument.
***The change in unrealized appreciation (depreciation) on securities still held at June 30, 2010 was $9,454, which is included in the related net change in unrealized appreciation/depreciation on the Statement of Operations.
The Fund’s policy is to recognize transfers in and transfers out of the valuation levels as of the end of the reporting period. There were no significant transfers between Level 1 and Level 2 as of June 30, 2010.
Additional disclosure surrounding the activity in Level 3 fair value measurement will also be effective for fiscal years beginning after December 15, 2010. Management has concluded that this will not have a material impact on the Series’ financial statements.
Security Transactions, Investment Income and Expenses
Security transactions are accounted for on trade date. Dividend income is recorded on the ex-dividend date, except that if the ex-dividend date has passed, certain dividends from foreign securities are recorded as soon as the Fund is informed of the ex-dividend date. Non-cash dividends, if any, are recorded at the fair market value of the securities received. Interest income, including amortization of premium and accretion of discounts using the effective interest method, is earned from settlement date and accrued daily.
Expenses are recorded on an accrual basis. Most expenses of the Fund can be attributed to a specific series. Expenses which cannot be directly attributed are apportioned among the series in the Fund in such a manner as deemed equitable by the Fund’s Board, taking into consideration, among other things, the nature and type of expense.
The Series uses the identified cost method for determining realized gain or loss on investments for both financial statement and federal income tax reporting purposes.
Foreign Currency Translation
The books and records of the Series are maintained in U.S. dollars. Foreign currencies, investments and other assets and liabilities are translated into U.S. dollars at the current exchange rates. Purchases and sales of investment securities and income and expenses are translated on the respective dates of such transactions. The Series does not isolate realized and unrealized gains and losses attributable to changes in the exchange rates from gains and losses that arise from changes in the market value of investments. Such fluctuations are included with net realized
20
Notes to Financial Statements (unaudited)
| 2. | SIGNIFICANT ACCOUNTING POLICIES (continued) |
Foreign Currency Translation (continued)
and unrealized gain or loss on investments. Net realized foreign currency gains and losses represent foreign currency gains and losses between trade date and settlement date on securities transactions, gains and losses on disposition of foreign currencies and the difference between the amount of income and foreign withholding taxes recorded on the books of the Series and the amounts actually received or paid.
Forward Foreign Currency Exchange Contracts
The Series may purchase or sell forward foreign currency exchange contracts in order to hedge a portfolio position or specific transaction. Risks may arise if the counterparties to a contract are unable to meet the terms of the contract or if the value of the foreign currency moves unfavorably.
All forward foreign currency exchange contracts are adjusted daily by the exchange rate of the underlying currency and, for financial statement purposes, any gain or loss is recorded as unrealized gain or loss until a contract has been closed. Realized and unrealized gain or loss arising from a transaction is included in net realized and unrealized gain (loss) on investments.
The Series may regularly trade forward foreign currency exchange contracts with off-balance sheet risk in the normal course of its investing activities to assist in managing exposure to changes in foreign currency exchange rates.
The notional or contractual amount of these instruments represents the investment the Series has in forward foreign currency exchange contracts and does not necessarily represent the amounts potentially at risk. The measurement of the risks associated with forward foreign currency exchange contracts is meaningful only when all related and offsetting transactions are considered. Investments in forward foreign currency exchange contacts held by the Series, if any, on June 30, 2010 are shown at the end of the Investment Portfolio, which is indicative of volume of derivative activity during the period.
Securities Purchased on a When-Issued Basis or Forward Commitment
The Series may purchase securities on a when-issued basis or forward commitment. These transactions involve a commitment by the Series to purchase securities for a predetermined price with payment and delivery taking place beyond the customary settlement period. When such purchases are outstanding, the Series will designate liquid assets in an amount sufficient to meet the purchase price. When purchasing a security on a delayed delivery basis, the Series assumes the rights and risks of ownership of the security, including the risk of price and yield fluctuations, and takes such fluctuations into account when determining its net asset value. The Series may sell the when-issued securities before they are delivered, which may result in a capital gain or loss. No such investments were held by the Series on June 30, 2010.
In connection with its ability to purchase or sell securities on a forward commitment basis, the Series may enter into forward roll transactions principally using To Be Announced (TBA) securities. Forward roll transactions require the sale of securities for delivery in the current month, and a simultaneous agreement to repurchase substantially similar (same type, coupon and maturity) securities on a specified future date. Risks of entering into forward roll transactions include the potential inability of the counterparty to meet the terms of the agreement; the potential of the Series to receive inferior securities at redelivery as compared to the securities sold to the counterparty; counterparty credit risk; and the potential pay down speed variance between the mortgage-backed pools. During the roll period, the Series forgoes principal and interest paid on the securities. The Series accounts for such dollar rolls as purchases and sales. Information regarding securities purchased on a when-issued basis is included in the Series’ Investment Portfolio. No such investments were held by the Series on June 30, 2010.
21
Notes to Financial Statements (unaudited)
| 2. | SIGNIFICANT ACCOUNTING POLICIES (continued) |
Restricted Securities
Restricted securities are purchased in private placement transactions, are not registered under the Securities Act of 1933, as amended, and may have contractual restrictions on resale. Information regarding restricted securities is included at the end of the Series’ Investment Portfolio.
Illiquid Securities
A security may be considered illiquid if so deemed in good faith by the Advisor under procedures approved by and under the general supervision and responsibility of the Fund’s Board. Securities that are illiquid are marked with the applicable footnote on the Investment Portfolio. As of June 30, 2010, the aggregate value of securities deemed illiquid was $564,681, representing 0.1% of the Series’ net assets.
Federal Taxes
The Series’ policy is to comply with the provisions of the Internal Revenue Code applicable to regulated investment companies. The Series is not subject to federal income tax or excise tax to the extent that the Series distributes to shareholders each year its taxable income, including any net realized gains on investments, in accordance with requirements of the Internal Revenue Code. Accordingly, no provision for federal income tax or excise tax has been made in the financial statements.
Management evaluates its tax positions to determine if the tax positions taken meet the minimum recognition threshold in connection with accounting for uncertainties in income tax positions taken or expected to be taken for the purposes of measuring and recognizing tax liabilities in the financial statements. Recognition of tax benefits of an uncertain tax position is required only when the position is “more likely than not” to be sustained assuming examination by taxing authorities. At June 30, 2010, the Series has recorded no liability for net unrecognized tax benefits relating to uncertain income tax positions taken or expected to be taken in future tax returns.
The Series files income tax returns in the U.S. federal jurisdiction, various states and foreign jurisdictions, as required. No income tax returns are currently under investigation. The statute of limitations on the Series’ tax returns remains open for the years ended December 31, 2006 through December 31, 2009. The Fund is not aware of any tax positions for which it is reasonably possible that the total amounts of unrecognized tax benefits will significantly change in the next twelve months.
Additionally, based on the Fund’s understanding of the tax rules and rates related to income, gains and transactions for foreign jurisdictions in which it invests, the Series will provide for foreign taxes, and where appropriate, deferred foreign tax.
Distributions of Income and Gains
Distributions to shareholders of net investment income and net realized gains are made annually. An additional distribution may be necessary to avoid taxation of the Series. Distributions are recorded on the ex-dividend date.
Indemnifications
The Fund’s organizational documents provide former and current directors and officers with a limited indemnification against liabilities arising in connection with the performance of their duties to the Fund. In the normal course of business, the Fund may also enter into contracts that provide general indemnifications. The Fund’s maximum exposure under these arrangements is unknown as this would be dependent on future claims that may be made against the Fund. The risk of material loss from such claims is considered remote.
Other
The preparation of financial statements in conformity with accounting principles generally accepted in the United States of America requires management to make estimates and assumptions that affect the reported amounts of
22
Notes to Financial Statements (unaudited)
| 2. | SIGNIFICANT ACCOUNTING POLICIES (continued) |
Other (continued)
assets and liabilities and the disclosure of contingent assets and liabilities at the date of the financial statements and the reported amounts of income and expenses during the reporting period. Actual results could differ from those estimates.
| 3. | TRANSACTIONS WITH AFFILIATES |
The Fund has an Investment Advisory Agreement (the “Agreement”) with the Advisor, for which the Series pays a fee, computed daily and payable monthly, at an annual rate of 0.70% of the Series’ average daily net assets.
Under the Agreement, personnel of the Advisor provide the Series with advice and assistance in the choice of investments and the execution of securities transactions, and otherwise maintain the Series’ organization. The Advisor also provides the Fund with necessary office space and fund administration and support services. The salaries of all officers of the Fund (except a percentage of the Fund’s Chief Compliance Officer’s salary, which is paid by the Fund), and of all Directors who are “affiliated persons” of the Fund, or of the Advisor, and all personnel of the Fund, or of the Advisor, performing services relating to research, statistical and investment activities, are paid by the Advisor. Each “non-affiliated” Director receives an annual stipend, which is allocated among all the active series of the Fund. In addition, these Directors also receive a fee per Board meeting attended for each active series of the Fund plus a fee for each committee meeting attended.
The Advisor has contractually agreed, until at least April 30, 2011, to waive its fee and, if necessary, pay other operating expenses of the Series in order to maintain total direct annual fund operating expenses for the Series at no more than 0.90% of average daily net assets each year. For the six months ended June 30, 2010, the Advisor voluntarily waived fees of $758, which is included as a reduction of expenses on the Statement of Operations. The Advisor is not eligible to recoup any expenses that have been waived or reimbursed in prior years.
Manning & Napier Investor Services, Inc., a registered broker-dealer affiliate of the Advisor, acts as distributor for the Fund’s shares. The services of Manning & Napier Investor Services, Inc. are provided at no additional cost to the Series.
The Advisor has entered into agreements with PNC Global Investment Servicing (U.S.) Inc. (“PNCGIS”) under which PNCGIS serves as sub-accountant services agent and sub-transfer agent. The Fund pays the Advisor an annual fee of 0.0175% on the first $3 billion of average daily net assets (excluding Target Series); 0.015% on the next $3 billion of average daily net assets (excluding Target Series); and 0.01% of the average daily net assets in excess of $6 billion (excluding Target Series); plus a base fee of $25,500 per Series. Additionally, certain transaction-, account-, and cusip-based fees and out-of-pocket expenses, including charges for reporting relating to the Fund’s compliance program, are charged.
On July 1, 2010, The PNC Financial Services Group, Inc. sold the outstanding stock of PNC Global Investment Servicing Inc. to The Bank of New York Mellon Corporation. At the closing of the sale, PNCGIS changed its name to BNY Mellon Investment Servicing (US) Inc.
| 4. | PURCHASES AND SALES OF SECURITIES |
For the six months ended June 30, 2010, purchases and sales of securities, other than U.S. Government securities and short-term securities, were $144,975,643 and $38,750,958, respectively. Purchases and sales of U.S. Government securities, other than short-term securities, were $0 and $6,452,367, respectively.
23
Notes to Financial Statements (unaudited)
| 5. | CAPITAL STOCK TRANSACTIONS |
Transactions in shares of Core Plus Bond Series were:
| | | | | | | | | | | | | | |
| | | For the Six Months Ended 6/30/10 | | | For the Year Ended 12/31/09 | |
| | | Shares | | | Amount | | | Shares | | | Amount | |
Sold | | 9,827,565 | | | $ | 106,626,085 | | | 5,159,453 | | | $ | 53,012,979 | |
Reinvested | | — | | | | — | | | 1,861,873 | | | | 19,585,357 | |
Repurchased | | (2,365,259 | ) | | | (25,709,308 | ) | | (4,577,661 | ) | | | (45,154,710 | ) |
| | | | | | | | | | | | | | |
Total | | 7,462,306 | | | $ | 80,916,777 | | | 2,443,665 | | | $ | 27,443,626 | |
| | | | | | | | | | | | | | |
Substantially all of the Series’ shares represent investments by fiduciary accounts over which the Advisor has sole investment discretion.
The Series may trade in instruments including written and purchased options, forward foreign currency exchange contracts and futures contracts and other derivatives in the normal course of investing activities to assist in managing exposure to various market risks. The Series may be subject to various elements of risk and may involve, to a varying degree, elements of risk in excess of the amounts recognized for financial statement purposes. These risks include: the risk that changes in the value of a derivative may not correlate perfectly with the underlying asset, rate or index, counterparty credit risk related to over the counter derivatives counterparties’ failure to perform under contract terms, liquidity risk related to the lack of a liquid market for these contracts allowing the fund to close out its position(s) and documentation risk relating to disagreement over contract terms. No such investments were held by the Series on June 30, 2010, except forward foreign currency exchange contracts, as shown at the end the Investment Portfolio.
Investing in securities of foreign companies and foreign governments involves special risks and considerations not typically associated with investing in securities of domestic companies and the U.S. Government. These risks include revaluation of currencies and future adverse political and economic developments. Moreover, securities of foreign companies and foreign governments and their markets may be less liquid and their prices more volatile than those of comparable domestic companies and the U.S. Government.
| 8. | FEDERAL INCOME TAX INFORMATION |
The amount and characterization of certain income and capital gains to be distributed are determined in accordance with federal income tax regulations, which may differ from accounting principles generally accepted in the United States of America. The Series may periodically make reclassifications among its capital accounts to reflect income and gains available for distribution (or available capital loss carryovers) under income tax regulations without impacting the Series’ net asset value. Any such reclassifications are not reflected in the financial highlights.
The final determination of the tax character of current year distributions will be made at the conclusion of the fiscal year. The tax character of distributions paid for the year ended December 31, 2009 were as follows:
| | | |
Ordinary income | | $ | 19,892,958 |
At December 31, 2009, the Series had a capital loss carryover of $2,448,880, available to the extent allowed by tax law to offset future net capital gain, if any, which will expire on December 31, 2016.
24
Notes to Financial Statements (unaudited)
| 8. | FEDERAL INCOME TAX INFORMATION (continued) |
For the year ended December 31, 2009, the Series elected to defer $12,216 of currency losses attributable to Post-October losses.
At June 30, 2010, the identified cost of investments for federal income tax purposes, the resulting gross unrealized appreciation and depreciation, and the net unrealized appreciation were as follows:
| | | | |
Cost for federal income tax purposes | | $ | 470,050,479 | |
Unrealized appreciation | | $ | 36,698,374 | |
Unrealized depreciation | | | (3,012,148 | ) |
| | | | |
Net unrealized appreciation | | $ | 33,686,226 | |
| | | | |
There were no subsequent events that require recognition or disclosure. In preparing these financial statements, management of the Fund has evaluated events and transactions for potential recognition or disclosure through the date the financial statements were issued.
25
Literature Requests (unaudited)
Proxy Voting Policies and Procedures
A description of the policies and procedures that the Fund uses to determine how to vote proxies relating to portfolio securities is available, without charge, upon request:
| | |
By phone | | 1-800-466-3863 |
On the Securities and Exchange | | |
Commission’s (SEC) web site | | http://www.sec.gov |
Proxy Voting Record
Information regarding how the Fund voted proxies relating to portfolio securities during the most recent 12-month period ended June 30th is available, without charge, upon request:
| | |
By phone | | 1-800-466-3863 |
On the SEC’s web site | | http://www.sec.gov |
Quarterly Portfolio Holdings
The Series’ complete schedule of portfolio holdings for the 1st and 3rd quarters of each fiscal year are provided on
Form N-Q, and are available, without charge, upon request:
| | |
By phone | | 1-800-466-3863 |
On the SEC’s web site | | http://www.sec.gov |
The Series’ Form N-Q may be reviewed and copied at the SEC’s Public Reference Room in Washington, D.C. Information on the operation of the Public Reference Room may be obtained by calling 1-800-SEC-0330.
Prospectus and Statement of Additional Information (SAI)
The prospectus and SAI provide additional information about each Series, including charges, expenses and risks. These documents are available, without charge, upon request:
| | |
By phone | | 1-800-466-3863 |
On the SEC’s web site | | http://www.sec.gov |
On the Advisor’s web site | | http://www.manningnapieradvisors.com |
Additional information available at www.manningnapieradvisors.com
1. Fund Holdings - Month-End
2. Fund Holdings - Quarter-End
3. Shareholder Report - Annual
4. Shareholder Report - Semi-Annual
MNCRPLBND-06/10-SAR

Shareholder Expense Example (unaudited)
As a shareholder of the Series, you may incur two types of costs: (1) transaction costs and (2) ongoing costs, including management fees and other Series expenses. This example is intended to help you understand your ongoing costs (in dollars) of investing in the Series and to compare these costs with the ongoing costs of investing in other mutual funds.
The example is based on an investment of $1,000 invested at the beginning of the period and held for the entire period (January 1, 2010 to June 30, 2010).
Actual Expenses
The first line of the table below provides information about actual account values and actual expenses. You may use the information in this line, together with the amount you invested, to estimate the expenses that you paid over the period. Simply divide your account value by $1,000 (for example, an $8,600 account value divided by $1,000 = 8.6), then multiply the result by the number in the first line under the heading entitled “Expenses Paid During Period” to estimate the expenses you paid on your account during this period.
Hypothetical Example for Comparison Purposes
The second line of the table below provides information about hypothetical account values and hypothetical expenses based on the Series’ actual expense ratio and an assumed rate of return of 5% per year before expenses, which is not the Series’ actual return. The hypothetical account values and expenses may not be used to estimate the actual ending account balance or expenses you paid during the period. You may use this information to compare the ongoing costs of investing in the Series and other funds. To do so, compare this 5% hypothetical example with the 5% hypothetical examples that appear in the shareholder reports of the other funds.
Please note that the expenses shown in the table are meant to highlight your ongoing costs only and do not reflect any transaction costs. Therefore, the second line of the table is useful in comparing ongoing costs only, and will not help you determine the relative total costs of owning different funds. In addition, if these transaction costs were included, your costs would have been higher.
| | | | | | |
| | | Beginning
Account Value
1/1/10 | | Ending
Account Value
6/30/10 | | Expenses Paid
During Period*
1/1/10-6/30/10 |
Actual | | $1,000.00 | | $1,037.60 | | $5.61 |
Hypothetical
(5% return before expenses) | | $1,000.00 | | $1,019.29 | | $5.56 |
*Expenses are equal to the Series’ annualized expense ratio (for the six-month period) of 1.11%, multiplied by the average account value over the period, multiplied by 181/365 (to reflect the one-half year period). Expenses are based on the most recent fiscal half year. The Series’ total return would have been lower had certain expenses not been waived during the period.
Portfolio Composition as of June 30, 2010 (unaudited)
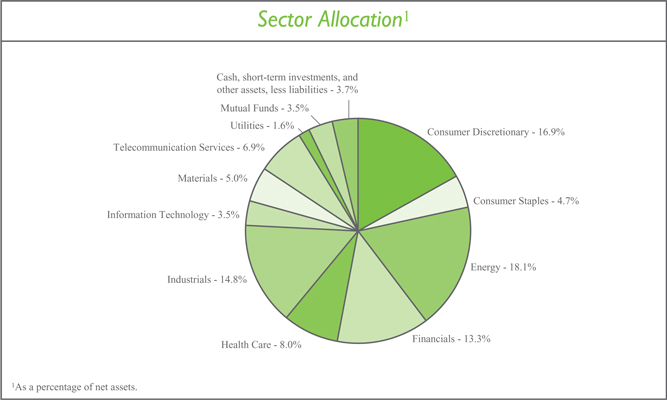
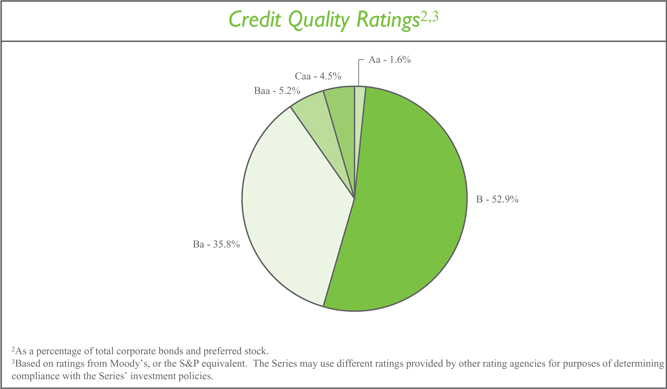
Investment Portfolio - June 30, 2010 (unaudited)
| | | | | | | | | | | |
| | | Credit
Rating 1
(unaudited) | | | Principal
Amount | | Value (Note 2) | | |
| | | | |
CORPORATE BONDS - 89.9% | | | | | | | | | | | |
| | | | |
Convertible Corporate Bonds - 0.3% | | | | | | | | | | | |
Industrials - 0.3% | | | | | | | | | | | |
Airlines - 0.3% | | | | | | | | | | | |
AirTran Holdings, Inc., 5.25%, 11/1/2016 | | | | | | | | | | | |
(Identified Cost $485,300) | | CCC | 2 | | $ | 460,000 | | $ | 481,275 | | |
| | | | | | | | | | | |
| | | | |
Non-Convertible Corporate Bonds - 89.6% | | | | | | | | | | | |
Consumer Discretionary - 16.9% | | | | | | | | | | | |
Diversified Consumer Services - 0.9% | | | | | | | | | | | |
Affinion Group, Inc., 11.50%, 10/15/2015 | | Caa1 | | | | 1,275,000 | | | 1,338,750 | | |
| | | | | | | | | | | |
Hotels, Restaurants & Leisure - 5.0% | | | | | | | | | | | |
Scientific Games Corp.3, 7.875%, 6/15/2016 | | B1 | | | | 1,450,000 | | | 1,421,000 | | |
Scientific Games International, Inc., 9.25%, 6/15/2019 | | B1 | | | | 1,000,000 | | | 1,022,500 | | |
Wendy’s - Arby’s Restaurants LLC, 10.00%, 7/15/2016 | | B3 | | | | 1,700,000 | | | 1,768,000 | | |
Wyndham Worldwide Corp., 9.875%, 5/1/2014 | | Ba1 | | | | 570,000 | | | 636,776 | | |
Wyndham Worldwide Corp., 6.00%, 12/1/2016 | | Ba1 | | | | 1,400,000 | | | 1,358,238 | | |
Yonkers Racing Corp.3, 11.375%, 7/15/2016 | | B1 | | | | 765,000 | | | 819,506 | | |
| | | | | | | | | | | |
| | | | | | | | | 7,026,020 | | |
| | | | | | | | | | | |
Media - 9.6% | | | | | | | | | | | |
Cablevision Systems Corp.3, 8.625%, 9/15/2017 | | B1 | | | | 2,030,000 | | | 2,070,600 | | |
Columbus International, Inc. (Barbados)3, 11.50%, 11/20/2014 | | B2 | | | | 1,770,000 | | | 1,885,179 | | |
MDC Partners, Inc. (Canada)3, 11.00%, 11/1/2016 | | B2 | | | | 955,000 | | | 1,017,075 | | |
Sirius XM Radio, Inc.3, 9.75%, 9/1/2015 | | B1 | | | | 940,000 | | | 998,750 | | |
Unitymedia Hessen GmbH & Co. KG (Germany)3, 8.125%, 12/1/2017 | | B1 | | | | 650,000 | | | 637,000 | | |
Unitymedia Hessen GmbH & Co. KG (Germany)3, 8.125%, 12/1/2017 | | B1 | | | | 525,000 | | | 632,368 | | |
UPC Holding B.V. (Netherlands)3, 9.875%, 4/15/2018 | | B2 | | | | 1,935,000 | | | 1,944,675 | | |
Virgin Media Finance plc (United Kingdom), 8.375%, 10/15/2019 | | B1 | | | | 935,000 | | | 946,687 | | |
Virgin Media Finance plc, Series 1 (United Kingdom), 9.50%, 8/15/2016 | | B1 | | | | 1,035,000 | | | 1,093,219 | | |
WMG Acquisition Corp., 9.50%, 6/15/2016 | | Ba2 | | | | 1,105,000 | | | 1,176,825 | | |
XM Satellite Radio, Inc.3, 11.25%, 6/15/2013 | | B2 | | | | 965,000 | | | 1,030,137 | | |
| | | | | | | | | | | |
| | | | | | | | | 13,432,515 | | |
| | | | | | | | | | | |
Specialty Retail - 1.4% | | | | | | | | | | | |
Toys R Us Property Co. LLC3, 8.50%, 12/1/2017 | | Ba2 | | | | 1,885,000 | | | 1,932,125 | | |
| | | | | | | | | | | |
Total Consumer Discretionary | | | | | | | | | 23,729,410 | | |
| | | | | | | | | | | |
Consumer Staples - 4.7% | | | | | | | | | | | |
Beverages - 2.7% | | | | | | | | | | | |
CEDC Finance Corp. International, Inc.3, 9.125%, 12/1/2016 | | B1 | | | | 1,885,000 | | | 1,819,025 | | |
| | | | |
| 3 | | The accompanying notes are an integral part of the financial statements. | | |
Investment Portfolio - June 30, 2010 (unaudited)
| | | | | | | | | | |
| | | Credit
Rating 1
(unaudited) | | Principal
Amount | | Value
(Note 2) | | |
| | | | |
CORPORATE BONDS (continued) | | | | | | | | | | |
| | | | |
Non-Convertible Corporate Bonds (continued) | | | | | | | | | | |
Consumer Staples (continued) | | | | | | | | | | |
Beverages (continued) | | | | | | | | | | |
Constellation Brands, Inc., 8.375%, 12/15/2014 | | Ba3 | | $ | 1,830,000 | | $ | 1,948,950 | | |
| | | | | | | | | | |
| | | | | | | | 3,767,975 | | |
| | | | | | | | | | |
Food & Staples Retailing - 0.5% | | | | | | | | | | |
Ingles Markets, Inc., 8.875%, 5/15/2017 | | B1 | | | 640,000 | | | 651,200 | | |
| | | | | | | | | | |
Personal Products - 1.5% | | | | | | | | | | |
Revlon Consumer Products Corp.3, 9.75%, 11/15/2015 | | B3 | | | 2,055,000 | | | 2,106,375 | | |
| | | | | | | | | | |
Total Consumer Staples | | | | | | | | 6,525,550 | | |
| | | | | | | | | | |
Energy - 18.1% | | | | | | | | | | |
Energy Equipment & Services - 5.5% | | | | | | | | | | |
Cie Generale de Geophysique - Veritas (France), 7.50%, 5/15/2015 | | Ba3 | | | 2,000,000 | | | 1,905,000 | | |
Complete Production Services, Inc., 8.00%, 12/15/2016 | | B1 | | | 2,150,000 | | | 2,101,625 | | |
Hornbeck Offshore Services, Inc., 8.00%, 9/1/2017 | | Ba3 | | | 1,340,000 | | | 1,192,600 | | |
Key Energy Services, Inc., 8.375%, 12/1/2014 | | B1 | | | 1,150,000 | | | 1,142,813 | | |
Thermon Industries, Inc.3, 9.50%, 5/1/2017 | | B1 | | | 1,355,000 | | | 1,375,325 | | |
| | | | | | | | | | |
| | | | | | | | 7,717,363 | | |
| | | | | | | | | | |
Oil, Gas & Consumable Fuels - 12.6% | | | | | | | | | | |
Alon Refining Krotz Springs, Inc., 13.50%, 10/15/2014 | | B2 | | | 920,000 | | | 887,800 | | |
Aquilex Holdings LLC - Aquilex Finance Corp.3, 11.125%, 12/15/2016 | | B3 | | | 1,185,000 | | | 1,185,000 | | |
Arch Coal, Inc.3, 8.75%, 8/1/2016 | | B1 | | | 725,000 | | | 755,812 | | |
Arch Western Finance LLC, 6.75%, 7/1/2013 | | B1 | | | 1,290,000 | | | 1,293,225 | | |
Chaparral Energy, Inc., 8.875%, 2/1/2017 | | Caa1 | | | 1,495,000 | | | 1,375,400 | | |
Chesapeake Energy Corp., 9.50%, 2/15/2015 | | Ba3 | | | 1,115,000 | | | 1,232,075 | | |
Coffeyville Resources LLC - Coffeyville Finance, Inc.3, 9.00%, 4/1/2015 | | Ba3 | | | 670,000 | | | 663,300 | | |
Coffeyville Resources LLC - Coffeyville Finance, Inc.3, 10.875%, 4/1/2017 | | B3 | | | 640,000 | | | 624,000 | | |
Crosstex Energy LP - Crosstex Energy Finance Corp., 8.875%, 2/15/2018 | | B3 | | | 1,330,000 | | | 1,328,338 | | |
Martin Midstream Partners LP - Martin Midstream Finance Corp.3, 8.875%, 4/1/2018 | | B3 | | | 1,360,000 | | | 1,346,400 | | |
Niska Gas Storage US LLC - Niska Gas Storage Canada ULC3, 8.875%, 3/15/2018 | | B1 | | | 970,000 | | | 984,550 | | |
Plains Exploration & Production Co., 8.625%, 10/15/2019 | | B1 | | | 2,130,000 | | | 2,156,625 | | |
Targa Resources Partners LP - Targa Resources Partners Finance Corp., 8.25%, 7/1/2016 | | B2 | | | 1,410,000 | | | 1,385,325 | | |
Tesoro Corp., 9.75%, 6/1/2019 | | Ba1 | | | 1,940,000 | | | 2,012,750 | | |
| | | | |
| | The accompanying notes are an integral part of the financial statements. | | 4 |
Investment Portfolio - June 30, 2010 (unaudited)
| | | | | | | | | | | |
| | | Credit
Rating 1
(unaudited) | | | Principal
Amount | | Value (Note 2) | | |
| | | | |
CORPORATE BONDS (continued) | | | | | | | | | | | |
| | | | |
Non-Convertible Corporate Bonds (continued) | | | | | | | | | | | |
Energy (continued) | | | | | | | | | | | |
Oil, Gas & Consumable Fuels (continued) | | | | | | | | | | | |
Whiting Petroleum Corp., 7.00%, 2/1/2014 | | B1 | | | $ | 485,000 | | $ | 494,700 | | |
| | | | | | | | | | | |
| | | | | | | | | 17,725,300 | | |
| | | | | | | | | | | |
Total Energy | | | | | | | | | 25,442,663 | | |
| | | | | | | | | | | |
Financials - 10.4% | | | | | | | | | | | |
Capital Markets - 0.9% | | | | | | | | | | | |
Goldman Sachs Capital II4, 5.793%, 12/29/2049 | | Baa2 | | | | 1,650,000 | | | 1,245,750 | | |
| | | | | | | | | | | |
Commercial Banks - 0.5% | | | | | | | | | | | |
Wilmington Trust Corp., 8.50%, 4/2/2018 | | Ba1 | | | | 755,000 | | | 764,481 | | |
| | | | | | | | | | | |
Consumer Finance - 2.9% | | | | | | | | | | | |
American Express Co.4, 6.80%, 9/1/2066 | | Baa2 | | | | 2,940,000 | | | 2,800,350 | | |
Credit Acceptance Corp.3, 9.125%, 2/1/2017 | | B1 | | | | 1,215,000 | | | 1,221,075 | | |
| | | | | | | | | | | |
| | | | | | | | | 4,021,425 | | |
| | | | | | | | | | | |
Insurance - 1.5% | | | | | | | | | | | |
Hartford Financial Services Group, Inc.4, 8.125%, 6/15/2038 | | Ba1 | | | | 2,250,000 | | | 2,041,875 | | |
| | | | | | | | | | | |
Real Estate Investment Trusts (REITS) - 4.6% | | | | | | | | | | | |
DuPont Fabros Technology LP3, 8.50%, 12/15/2017 | | Ba2 | | | | 2,495,000 | | | 2,557,375 | | |
Felcor Lodging LP, 10.00%, 10/1/2014 | | B2 | | | | 1,370,000 | | | 1,431,650 | | |
Host Hotels & Resorts LP, 6.875%, 11/1/2014 | | BB | 2 | | | 665,000 | | | 663,338 | | |
Host Hotels & Resorts LP, 6.375%, 3/15/2015 | | Ba1 | | | | 550,000 | | | 539,000 | | |
Omega Healthcare Investors, Inc.3, 7.50%, 2/15/2020 | | Ba3 | | | | 1,335,000 | | | 1,331,662 | | |
| | | | | | | | | | | |
| | | | | | | | | 6,523,025 | | |
| | | | | | | | | | | |
Total Financials | | | | | | | | | 14,596,556 | | |
| | | | | | | | | | | |
Health Care - 8.0% | | | | | | | | | | | |
Health Care Equipment & Supplies - 2.8% | | | | | | | | | | | |
Fresenius Medical Care Capital Trust IV, 7.875%, 6/15/2011 | | Ba3 | | | | 965,000 | | | 997,569 | | |
Fresenius US Finance II, Inc.3, 9.00%, 7/15/2015 | | Ba1 | | | | 270,000 | | | 292,612 | | |
Inverness Medical Innovations, Inc., 7.875%, 2/1/2016 | | B2 | | | | 1,725,000 | | | 1,686,187 | | |
Inverness Medical Innovations, Inc., 9.00%, 5/15/2016 | | B3 | | | | 983,000 | | | 985,458 | | |
| | | | | | | | | | | |
| | | | | | | | | 3,961,826 | | |
| | | | | | | | | | | |
Health Care Providers & Services - 3.1% | | | | | | | | | | | |
BioScrip, Inc.3, 10.25%, 10/1/2015 | | B3 | | | | 1,285,000 | | | 1,272,150 | | |
HCA, Inc., 7.875%, 2/15/2020 | | Ba3 | | | | 1,170,000 | | | 1,203,638 | | |
Health Management Associates, Inc., 6.125%, 4/15/2016 | | BB | 2 | | | 1,935,000 | | | 1,833,412 | | |
| | | | | | | | | | | |
| | | | | | | | | 4,309,200 | | |
| | | | | | | | | | | |
Life Sciences Tools & Services - 0.9% | | | | | | | | | | | |
PharmaNet Development Group, Inc.3, 10.875%, 4/15/2017 | | B3 | | | | 1,350,000 | | | 1,316,250 | | |
| | | | | | | | | | | |
| | | | |
| 5 | | The accompanying notes are an integral part of the financial statements. | | |
Investment Portfolio - June 30, 2010 (unaudited)
| | | | | | | | | | |
| | | Credit
Rating 1
(unaudited) | | Principal
Amount | | Value (Note 2) | | |
| | | | |
CORPORATE BONDS (continued) | | | | | | | | | | |
| | | | |
Non-Convertible Corporate Bonds (continued) | | | | | | | | | | |
Health Care (continued) | | | | | | | | | | |
Pharmaceuticals - 1.2% | | | | | | | | | | |
Valeant Pharmaceuticals International3, 7.625%, 3/15/2020 | | Ba3 | | $ | 1,395,000 | | $ | 1,646,100 | | |
| | | | | | | | | | |
Total Health Care | | | | | | | | 11,233,376 | | |
| | | | | | | | | | |
Industrials - 14.5% | | | | | | | | | | |
Aerospace & Defense - 1.2% | | | | | | | | | | |
GeoEye, Inc.3, 9.625%, 10/1/2015 | | B1 | | | 945,000 | | | 963,900 | | |
Kratos Defense & Security Solutions, Inc.3, 10.00%, 6/1/2017 | | B3 | | | 750,000 | | | 761,250 | | |
| | | | | | | | | | |
| | | | | | | | 1,725,150 | | |
| | | | | | | | | | |
Airlines - 2.7% | | | | | | | | | | |
AirTran Airways, Inc.5,6, 10.41%, 4/1/2017 | | B1 | | | 1,378,951 | | | 1,296,214 | | |
Delta Air Lines, Inc.3, 9.50%, 9/15/2014 | | Ba2 | | | 2,420,000 | | | 2,541,000 | | |
| | | | | | | | | | |
| | | | | | | | 3,837,214 | | |
| | | | | | | | | | |
Building Products - 2.6% | | | | | | | | | | |
Building Materials Corp. of America3, 7.50%, 3/15/2020 | | B3 | | | 645,000 | | | 633,713 | | |
Owens Corning, 9.00%, 6/15/2019 | | Ba1 | | | 1,140,000 | | | 1,347,912 | | |
USG Corp.3, 9.75%, 8/1/2014 | | B2 | | | 1,525,000 | | | 1,586,000 | | |
| | | | | | | | | | |
| | | | | | | | 3,567,625 | | |
| | | | | | | | | | |
Commercial Services & Supplies - 3.4% | | | | | | | | | | |
ACCO Brands Corp., 10.625%, 3/15/2015 | | B1 | | | 910,000 | | | 987,350 | | |
Clean Harbors, Inc., 7.625%, 8/15/2016 | | Ba2 | | | 1,190,000 | | | 1,222,725 | | |
Corrections Corp. of America, 6.25%, 3/15/2013 | | Ba2 | | | 965,000 | | | 972,238 | | |
Corrections Corp. of America, 7.75%, 6/1/2017 | | Ba2 | | | 275,000 | | | 285,312 | | |
Garda World Security Corp. (Canada)3, 9.75%, 3/15/2017 | | B3 | | | 1,290,000 | | | 1,309,350 | | |
| | | | | | | | | | |
| | | | | | | | 4,776,975 | | |
| | | | | | | | | | |
Industrial Conglomerates - 1.5% | | | | | | | | | | |
GE Capital Trust I4, 6.375%, 11/15/2067 | | Aa3 | | | 2,250,000 | | | 2,092,500 | | |
| | | | | | | | | | |
Machinery - 0.7% | | | | | | | | | | |
Case New Holland, Inc.3, 7.875%, 12/1/2017 | | Ba3 | | | 1,000,000 | | | 1,007,500 | | |
| | | | | | | | | | |
Marine - 1.8% | | | | | | | | | | |
Navios Maritime Holdings, Inc. - Navios Maritime Finance US, Inc. (Marshall Island)3, 8.875%, 11/1/2017 | | Ba3 | | | 1,335,000 | | | 1,345,012 | | |
United Maritime Group LLC - United Maritime Group Finance Corp.3, 11.75%, 6/15/2015 | | B3 | | | 1,185,000 | | | 1,119,825 | | |
| | | | | | | | | | |
| | | | | | | | 2,464,837 | | |
| | | | | | | | | | |
Road & Rail - 0.6% | | | | | | | | | | |
RailAmerica, Inc., 9.25%, 7/1/2017 | | B1 | | | 773,000 | | | 809,718 | | |
| | | | | | | | | | |
Total Industrials | | | | | | | | 20,281,519 | | |
| | | | | | | | | | |
| | | | |
| | The accompanying notes are an integral part of the financial statements. | | 6 |
Investment Portfolio - June 30, 2010 (unaudited)
| | | | | | | | | | |
| | | Credit
Rating 1
(unaudited) | | Principal
Amount | | Value
(Note 2) | | |
| | | | |
CORPORATE BONDS (continued) | | | | | | | | | | |
| | | | |
Non-Convertible Corporate Bonds (continued) | | | | | | | | | | |
Information Technology - 3.5% | | | | | | | | | | |
Communications Equipment - 2.0% | | | | | | | | | | |
Alcatel-Lucent USA, Inc., 6.45%, 3/15/2029 | | B1 | | $ | 1,580,000 | | $ | 1,042,800 | | |
Hughes Network Systems LLC - HNS Finance Corp., 9.50%, 4/15/2014 | | B1 | | | 1,775,000 | | | 1,797,187 | | |
| | | | | | | | | | |
| | | | | | | | 2,839,987 | | |
| | | | | | | | | | |
Semiconductors & Semiconductor Equipment - 1.5% | | | | | | | | | | |
Advanced Micro Devices, Inc.3, 8.125%, 12/15/2017 | | Ba3 | | | 645,000 | | | 641,775 | | |
MagnaChip Semiconductor S.A. - MagnaChip Semiconductor Finance Co.3, 10.50%, 4/15/2018 | | B2 | | | 1,360,000 | | | 1,383,800 | | |
| | | | | | | | | | |
| | | | | | | | 2,025,575 | | |
| | | | | | | | | | |
Total Information Technology | | | | | | | | 4,865,562 | | |
| | | | | | | | | | |
Materials - 5.0% | | | | | | | | | | |
Chemicals - 0.4% | | | | | | | | | | |
Solutia, Inc., 7.875%, 3/15/2020 | | B2 | | | 645,000 | | | 643,388 | | |
| | | | | | | | | | |
Containers & Packaging - 2.2% | | | | | | | | | | |
Ball Corp., 6.625%, 3/15/2018 | | Ba1 | | | 965,000 | | | 967,412 | | |
BWAY Holding Co.3, 10.00%, 6/15/2018 | | B3 | | | 690,000 | | | 719,325 | | |
Reynolds Group Issuer, Inc. - Reynolds Group Issuer LLC3, 8.50%, 5/15/2018 | | Caa1 | | | 1,375,000 | | | 1,349,219 | | |
| | | | | | | | | | |
| | | | | | | | 3,035,956 | | |
| | | | | | | | | | |
Metals & Mining - 0.9% | | | | | | | | | | |
Steel Dynamics, Inc., 7.75%, 4/15/2016 | | Ba2 | | | 1,300,000 | | | 1,306,500 | | |
| | | | | | | | | | |
Paper & Forest Products - 1.5% | | | | | | | | | | |
Georgia-Pacific LLC3, 8.25%, 5/1/2016 | | Ba2 | | | 1,000,000 | | | 1,066,250 | | |
Georgia-Pacific LLC3, 7.125%, 1/15/2017 | | Ba2 | | | 1,000,000 | | | 1,020,000 | | |
| | | | | | | | | | |
| | | | | | | | 2,086,250 | | |
| | | | | | | | | | |
Total Materials | | | | | | | | 7,072,094 | | |
| | | | | | | | | | |
Telecommunication Services - 6.9% | | | | | | | | | | |
Diversified Telecommunication Services - 3.6% | | | | | | | | | | |
Clearwire Communications LLC - Clearwire Finance, Inc.3, 12.00%, 12/1/2015 | | Caa1 | | | 1,000,000 | | | 996,250 | | |
Clearwire Communications LLC - Clearwire Finance, Inc.3, 12.00%, 12/1/2015 | | Caa1 | | | 275,000 | | | 272,594 | | |
Intelsat Subsidiary Holding Co. Ltd. (Bermuda)3, 8.875%, 1/15/2015 | | B3 | | | 1,955,000 | | | 1,976,994 | | |
Wind Acquisition Finance S.A. (Luxembourg)3, 11.75%, 7/15/2017 | | B2 | | | 1,800,000 | | | 1,845,000 | | |
| | | | | | | | | | |
| | | | | | | | 5,090,838 | | |
| | | | | | | | | | |
| | | | |
| 7 | | The accompanying notes are an integral part of the financial statements. | | |
Investment Portfolio - June 30, 2010 (unaudited)
| | | | | | | | | | |
| | | | | Principal
Amount/
Shares | | Value (Note 2) | | |
| | | | |
CORPORATE BONDS (continued) | | | | | | | | | | |
| | | | |
Non-Convertible Corporate Bonds (continued) | | | | | | | | | | |
Telecommunication Services (continued) | | | | | | | | | | |
Wireless Telecommunication Services - 3.3% | | | | | | | | | | |
CC Holdings GS V LLC - Crown Castle GS III Corp.3, 7.75%, 5/1/2017 | | Baa3 | | $ | 1,315,000 | | $ | 1,390,612 | | |
NII Capital Corp., 8.875%, 12/15/2019 | | B1 | | | 1,845,000 | | | 1,863,450 | | |
SBA Telecommunications, Inc.3, 8.00%, 8/15/2016 | | Ba3 | | | 1,300,000 | | | 1,345,500 | | |
| | | | | | | | | | |
| | | | | | | | 4,599,562 | | |
| | | | | | | | | | |
Total Telecommunication Services | | | | | | | | 9,690,400 | | |
| | | | | | | | | | |
Utilities - 1.6% | | | | | | | | | | |
Independent Power Producers & Energy Traders - 1.6% | | | | | | | | | | |
Mirant Americas Generation LLC, 9.125%, 5/1/2031 | | B3 | | | 1,450,000 | | | 1,334,000 | | |
North American Energy Alliance LLC - North American Energy Alliance Finance Corp.3, 10.875%, 6/1/2016 | | Ba3 | | | 945,000 | | | 973,350 | | |
| | | | | | | | | | |
Total Utilities | | | | | | | | 2,307,350 | | |
| | | | | | | | | | |
Total Non-Convertible Corporate Bonds | | | | | | | | | | |
(Identified Cost $124,980,992) | | | | | | | | 125,744,480 | | |
| | | | | | | | | | |
TOTAL CORPORATE BONDS | | | | | | | | | | |
(Identified Cost $125,466,292) | | | | | | | | 126,225,755 | | |
| | | | | | | | | | |
| | | | |
PREFERRED STOCKS - 2.9% | | | | | | | | | | |
| | | | |
Financials - 2.9% | | | | | | | | | | |
Commercial Banks - 1.0% | | | | | | | | | | |
Wells Fargo & Co., Series K | | Ba1 | | | 1,335,000 | | | 1,375,050 | | |
| | | | | | | | | | |
Diversified Financial Services - 1.9% | | | | | | | | | | |
Bank of America Corp., Series K | | Ba3 | | | 1,410,000 | | | 1,361,961 | | |
JPMorgan Chase & Co., Series 1 | | Baa1 | | | 1,275,000 | | | 1,314,181 | | |
| | | | | | | | | | |
| | | | | | | | 2,676,142 | | |
| | | | | | | | | | |
TOTAL PREFERRED STOCKS | | | | | | | | | | |
(Identified Cost $3,817,346) | | | | | | | | 4,051,192 | | |
| | | | | | | | | | |
| | | | |
MUTUAL FUNDS - 3.5% | | | | | | | | | | |
| | | | |
iShares iBoxx High Yield Corporate Bond Fund | | | | | | | | | | |
(Identified Cost $5,017,834) | | | | | 58,390 | | | 4,957,311 | | |
| | | | | | | | | | |
| | | | |
SHORT-TERM INVESTMENTS - 2.3% | | | | | | | | | | |
Dreyfus Cash Management, Inc. - Institutional Shares7, 0.13%, | | | | | | | | | | |
(Identified Cost $3,156,655) | | | | | 3,156,655 | | | 3,156,655 | | |
| | | | | | | | | | |
| | | | |
| | The accompanying notes are an integral part of the financial statements. | | 8 |
Investment Portfolio - June 30, 2010 (unaudited)
| | | | | | | | | |
| | | | | | | Value (Note 2) | | |
| | | | |
TOTAL INVESTMENTS - 98.6% | | | | | | | | | |
(Identified Cost $137,458,127) | | | | | | $ | 138,390,913 | | |
OTHER ASSETS, LESS LIABILITIES - 1.4% | | | | | | | 2,032,156 | | |
| | | | | | | | | |
NET ASSETS - 100% | | | | | | $ | 140,423,069 | | |
| | | | | | | | | |
| 1 | Credit ratings from Moody’s (unaudited). |
| 2 | Credit ratings from S&P (unaudited). |
| 3 | Restricted securities - Investment in securities that are restricted as to public resale under the Securities Act of 1933, as amended. These securities have been sold under rule 144A and have been determined to be liquid under guidelines established by the Board of Directors. These securities amount to $61,133,645, or 43.5%, of the Series’ net assets as of June 30, 2010 (see Note 2 to the financial statements). |
| 4 | The coupon rate is floating and is the stated rate as of June 30, 2010. |
| 5 | Security has been valued at fair value. |
| 6 | Restricted securities - Investment in securities that are restricted as to public resale under the Securities Act of 1933, as amended. This security was acquired on October 13, 2009 at a cost of $519,171 ($87.00 per share) and on December 2, 2009 at a cost of $686,000 ($88.00 per share). This security has been sold under rule 144A and has been determined to be illiquid under guidelines established by the Board of Directors. This security amounts to $1,296,214, or 0.9%, of the Series’ net assets as of June 30, 2010 (see Note 2 to the financial statements). |
| 7 | Rate shown is the current yield as of June 30, 2010. |
| | | | |
| 9 | | The accompanying notes are an integral part of the financial statements. | | |
Statement of Assets and Liabilities (unaudited)
June 30, 2010
| | | |
ASSETS: | | | |
| |
Investments, at value (identified cost $137,458,127) (Note 2) | | $ | 138,390,913 |
Interest receivable | | | 2,522,035 |
Receivable for fund shares sold | | | 136,029 |
Dividends receivable | | | 405 |
| | | |
| |
TOTAL ASSETS | | | 141,049,382 |
| | | |
| |
LIABILITIES: | | | |
| |
Accrued management fees (Note 3) | | | 114,642 |
Accrued transfer agent fees (Note 3) | | | 1,036 |
Accrued Chief Compliance Officer service fees (Note 3) | | | 773 |
Payable for fund shares repurchased | | | 507,921 |
Other payables and accrued expenses | | | 1,941 |
| | | |
| |
TOTAL LIABILITIES | | | 626,313 |
| | | |
| |
TOTAL NET ASSETS | | $ | 140,423,069 |
| | | |
| |
NET ASSETS CONSIST OF: | | | |
| |
Capital stock | | $ | 130,564 |
Additional paid-in-capital | | | 132,363,047 |
Undistributed net investment income | | | 5,080,941 |
Accumulated net realized gain on investments, foreign currency and translation of other assets and liabilities | | | 1,915,718 |
Net unrealized appreciation on investments, foreign currency and translation of other assets and liabilities | | | 932,799 |
| | | |
| |
TOTAL NET ASSETS | | $ | 140,423,069 |
| | | |
| |
NET ASSET VALUE, OFFERING PRICE AND REDEMPTION PRICE PER SHARE - Class A
($140,423,069/13,056,410 shares) | | $ | 10.76 |
| | | |
| | | | |
| | The accompanying notes are an integral part of the financial statements. | | 10 |
Statement of Operations (unaudited)
For the Six Months Ended June 30, 2010
| | | | |
INVESTMENT INCOME: | | | | |
| |
Interest | | $ | 5,154,879 | |
Dividends | | | 351,373 | |
| | | | |
| |
Total Investment Income | | | 5,506,252 | |
| | | | |
| |
EXPENSES: | | | | |
| |
Management fees (Note 3) | | | 675,877 | |
Fund accounting and administration fees (Note 3) | | | 24,093 | |
Directors’ fees (Note 3) | | | 6,373 | |
Transfer agent fees (Note 3) | | | 4,950 | |
Chief Compliance Officer service fees (Note 3) | | | 1,761 | |
Miscellaneous | | | 38,997 | |
| | | | |
| |
Total Expenses | | | 752,051 | |
Less reduction of expenses (Note 3) | | | (758 | ) |
| | | | |
| |
Net Expenses | | | 751,293 | |
| | | | |
| |
NET INVESTMENT INCOME | | | 4,754,959 | |
| | | | |
| |
REALIZED AND UNREALIZED GAIN (LOSS) ON INVESTMENTS AND FOREIGN CURRENCY: | | | | |
| |
Net realized gain (loss) on-
Investments | | | 1,595,616 | |
Foreign currency and translation of other assets and liabilities | | | (46,272 | ) |
| | | | |
| |
| | | 1,549,344 | |
| | | | |
Net change in unrealized appreciation (depreciation) on-
Investments | | | (1,401,751 | ) |
Foreign currency and translation of other assets and liabilities | | | 354 | |
| | | | |
| |
| | | (1,401,397 | ) |
| | | | |
| |
NET REALIZED AND UNREALIZED GAIN (LOSS) ON INVESTMENTS AND FOREIGN CURRENCY | | | 147,947 | |
| | | | |
| |
NET INCREASE IN NET ASSETS RESULTING FROM OPERATIONS | | $ | 4,902,906 | |
| | | | |
| | | | |
| 11 | | The accompanying notes are an integral part of the financial statements. | | |
Statements of Changes in Net Assets
| | | | | | | |
| | | For the Six
Months Ended
6/30/10
(unaudited) | | For the Period
9/14/091 to
12/31/09 | |
INCREASE (DECREASE) IN NET ASSETS: | | | | | | | |
| | |
OPERATIONS: | | | | | | | |
| | |
Net investment income | | $ | 4,754,959 | | $ | 1,590,736 | |
Net realized gain on investments and foreign currency | | | 1,549,344 | | | 450,110 | |
Net change in unrealized appreciation (depreciation) on investments and foreign currency | | | (1,401,397) | | | 2,334,196 | |
| | | | | | | |
| | |
Net increase from operations | | | 4,902,906 | | | 4,375,042 | |
| | | | | | | |
| | |
DISTRIBUTIONS TO SHAREHOLDERS (Note 8): | | | | | | | |
| | |
From net investment income | | | — | | | (1,259,565 | ) |
From net realized gain on investments | | | — | | | (88,925 | ) |
| | | | | | | |
| | |
Total distributions to shareholders | | | — | | | (1,348,490 | ) |
| | | | | | | |
| | |
CAPITAL STOCK ISSUED AND REPURCHASED: | | | | | | | |
| | |
Net increase from capital share transactions (Note 5) | | | 7,841,940 | | | 124,651,671 | |
| | | | | | | |
| | |
Net increase in net assets | | | 12,744,846 | | | 127,678,223 | |
| | |
NET ASSETS: | | | | | | | |
| | |
Beginning of period | | | 127,678,223 | | | — | |
| | | | | | | |
| | |
End of period (including undistributed net investment income of $5,080,941 and $325,982, respectively) | | $ | 140,423,069 | | $ | 127,678,223 | |
| | | | | | | |
1 Commencement of operations.
| | | | |
| | The accompanying notes are an integral part of the financial statements. | | 12 |
Financial Highlights
| | | | |
| | | For the
Six Months
Ended 6/30/10 | | For the Period
9/14/091 to
12/31/09 |
| | | (unaudited) | |
Per share data (for a share outstanding throughout each period): | | | | |
Net asset value - Beginning of period | | $10.37 | | $10.00 |
| | | | |
| | |
Income from investment operations: | | | | |
Net investment income2 | | 0.37 | | 0.20 |
Net realized and unrealized gain on investments | | 0.02 | | 0.28 |
| | | | |
Total from investment operations | | 0.39 | | 0.48 |
| | | | |
Less distributions to shareholders: | | | | |
From net investment income | | — | | (0.10) |
From net realized gain on investments | | — | | (0.01) |
| | | | |
Total distributions to shareholders | | — | | (0.11) |
| | | | |
Net asset value - End of period | | $10.76 | | $10.37 |
| | | | |
Net assets - End of period (000’s omitted) | | $140,423 | | $127,678 |
| | | | |
Total return3 | | 3.76% | | 4.82% |
Ratios (to average net assets)/ Supplemental Data: | | | | |
Expenses* | | 1.11%4 | | 1.20%4 |
Net investment income | | 7.03%4 | | 6.51%4 |
Portfolio turnover | | 31% | | 22% |
* The investment advisor did not impose all or a portion of its management fees, CCO fees, fund accounting and transfer agent fees and other fees in some periods and in some periods paid a portion of the Series’ expenses. If these expenses had been incurred by the Series, the expense ratio (to average net assets) would have been increased by the following amounts: |
| | 0.00% 4,5 | | 0.02%4 |
1Commencement of operations.
2Calculated based on average shares outstanding during the periods.
3Represents aggregate total return for the periods indicated, and assumes reinvestment of all distributions. Total return would have been lower had certain expenses not been waived or reimbursed during the periods. Periods less than one year are not annualized.
4 Annualized.
5 Less than 0.01%.
| | | | |
| 13 | | The accompanying notes are an integral part of the financial statements. | | |
Notes to Financial Statements (unaudited)
High Yield Bond Series (the “Series”) is a no-load non-diversified series of Manning & Napier Fund, Inc. (the “Fund”). The Fund is organized in Maryland and is registered under the Investment Company Act of 1940, as amended, as an open-end management investment company.
The Series’ investment objective is to provide a high level of long-term total return by investing principally in non-investment grade fixed income securities that are issued by government and corporate entities.
The Fund’s Advisor is Manning & Napier Advisors, Inc. (the “Advisor”). On September 14, 2009 the Series resumed sales of shares to advisory clients and employees of the Advisor and its affiliates and directly to investors. The total authorized capital stock of the Fund consists of 10.0 billion shares of common stock each having a par value of $0.01. As of June 30, 2010, 6.2 billion shares have been designated in total among 29 series, of which 125 million have been designated as High Yield Bond Series Class A common stock.
| 2. | SIGNIFICANT ACCOUNTING POLICIES |
Security Valuation
Portfolio securities, including domestic equities, foreign equities, warrants and options, listed on an exchange other than the NASDAQ National Market System are valued at the latest quoted sales price of the exchange on which the security is primarily traded. Securities not traded on valuation date or securities not listed on an exchange are valued at the latest quoted bid price provided by the Fund’s pricing service. Securities listed on the NASDAQ National Market System are valued in accordance with the NASDAQ Official Closing Price.
Debt securities, including government bonds, foreign bonds, asset-backed securities, structured notes, supranational obligations, sovereign bonds, corporate bonds and mortgage-backed securities will normally be valued on the basis of evaluated bid prices provided by an independent pricing service. Certain investments in securities held by the Series may be valued on a basis of a price provided by a principal market maker. These prices may differ from the value that would have been used had a broader market for securities existed.
Short-term investments that mature in sixty days or less are valued at amortized cost, which approximates market value. Investments in open-end investment companies are valued at their net asset value per share on valuation date.
Volume and level of activity in established markets for an asset or liability are evaluated to determine whether recent transactions and quoted prices are determinative of fair value. Where there have been significant decreases in volume and level of activity, further analysis and adjustment may be necessary to estimate fair value. The Series measures fair value in these instances by the use of inputs and valuation techniques which may be based upon current market prices of securities that are comparable in coupon, rating, maturity and industry and/or expectation of future cash flows. As a result of trading in relatively thin markets and/or markets that experience significant volatility, the prices used by the Series to value these securities may differ from the value that would be realized if these securities were sold, and the differences could be material.
Securities for which representative valuations or prices are not available from the Fund’s pricing service may be valued at fair value. Due to the inherent uncertainty of valuations of such securities, the fair value may differ significantly from the values that would have been used had a ready market for such securities existed. If trading or events occurring after the close of the principal market in which securities are traded are expected to materially affect the value of those securities, then they may be valued at their fair value, taking this trading or these events into account. Fair value is determined in good faith by the Advisor under procedures approved by and under the general supervision and responsibility of the Fund’s Board of Directors (the “Board”).
Notes to Financial Statements (unaudited)
| 2. | SIGNIFICANT ACCOUNTING POLICIES (continued) |
Security Valuation (continued)
Various inputs are used in determining the value of the Series’ assets or liabilities carried at market value. These inputs are summarized in three broad levels. Level 1 includes quoted prices in active markets for identical assets and liabilities. Level 2 includes other significant observable inputs (including quoted prices for similar securities, interest rates, prepayment speeds, credit risk, etc.). Level 3 includes significant unobservable inputs (including the Series’ own assumptions in determining the fair value of investments). The inputs or methodology used for valuing securities are not necessarily an indication of the risk associated with investing in those securities.
The following is a summary of the valuation levels used for major security types as of June 30, 2010 in valuing the Series’ assets or liabilities carried at market value:
| | | | | | | | | | | | |
| Description | | 6/30/10 | | Level 1 | | Level 2 | | Level 3 |
Equity securities* | | $ | — | | $ | — | | $ | — | | $ | — |
Preferred securities | | | 4,051,192 | | | — | | | 4,051,192 | | | — |
Debt securities: | | | | | | | | | | | | |
Corporate debt | | | 125,744,480 | | | — | | | 124,448,266 | | | 1,296,214 |
Convertible corporate debt | | | 481,275 | | | — | | | 481,275 | | | — |
Mutual funds | | | 8,113,966 | | | 8,113,966 | | | — | | | — |
Other financial instruments** | | | — | | | — | | | — | | | — |
| | | | | | | | | | | | |
Total | | $ | 138,390,913 | | $ | 8,113,966 | | $ | 128,980,733 | | $ | 1,296,214 |
| | | | | | | | | | | | |
The following table is a reconciliation of Level 3 investments for which significant unobservable inputs were used to determine fair value:
| | | | |
| Level 3 Reconciliation | | Corporate
Debt | |
Balance as of December 31, 2009 (market value) | | $ | 1,239,608 | |
Accrued discounts/premiums | | | 7,644 | |
Change in unrealized appreciation/depreciation*** | | | 64,529 | |
Realized gain | | | 2,223 | |
Net purchases/sales | | | (17,790 | ) |
| | | | |
Balance as of June 30, 2010 (market value) | | $ | 1,296,214 | |
| | | | |
*Includes common stock, warrants and rights. Please see the Investment Portfolio for industry classification.
**Other financial instruments are derivative instruments not reflected in the Investment Portfolio, such as futures, forwards and swap contracts, which are valued at the unrealized appreciation/depreciation on the instrument. As of June 30, 2010, the Series did not hold any derivative instruments.
***The change in unrealized appreciation (depreciation) on securities still held at June 30, 2010 was $64,529, which is included in the related net change in unrealized appreciation/depreciation on the Statement of Operations.
The Fund’s policy is to recognize transfers in and transfers out of the valuation levels as of the end of the reporting period. There were no significant transfers between Level 1 and Level 2 as of June 30, 2010.
15
Notes to Financial Statements (unaudited)
| 2. | SIGNIFICANT ACCOUNTING POLICIES (continued) |
Security Valuation (continued)
Additional disclosure surrounding the activity in Level 3 fair value measurement will also be effective for fiscal years beginning after December 15, 2010. Management has concluded that this will not have a material impact on the Series’ financial statements.
Security Transactions, Investment Income and Expenses
Security transactions are accounted for on trade date. Dividend income is recorded on the ex-dividend date, except that if the ex-dividend date has passed, certain dividends from foreign securities are recorded as soon as the Fund is informed of the ex-dividend date. Non-cash dividends, if any, are recorded at the fair market value of the securities received. Interest income, including amortization of premium and accretion of discounts using the effective interest method, is earned from settlement date and accrued daily.
Expenses are recorded on an accrual basis. Most expenses of the Fund can be attributed to a specific series. Expenses which cannot be directly attributed are apportioned among the series in the Fund in such a manner as deemed equitable by the Fund’s Board, taking into consideration, among other things, the nature and type of expense.
The Series uses the identified cost method for determining realized gain or loss on investments for both financial statement and federal income tax reporting purposes.
Foreign Currency Translation
The books and records of the Series are maintained in U.S. dollars. Foreign currencies, investments and other assets and liabilities are translated into U.S. dollars at the current exchange rates. Purchases and sales of investment securities and income and expenses are translated on the respective dates of such transactions. The Series do not isolate realized and unrealized gains and losses attributable to changes in the exchange rates from gains and losses that arise from changes in the market value of investments. Such fluctuations are included with net realized and unrealized gain or loss on investments. Net realized foreign currency gains and losses represent foreign currency gains and losses between trade date and settlement date on securities transactions, gains and losses on disposition of foreign currencies and the difference between the amount of income and foreign withholding taxes recorded on the books of the Series and the amounts actually received or paid.
Restricted Securities
Restricted securities are purchased in private placement transactions, are not registered under the Securities Act of 1933, as amended, and may have contractual restrictions on resale. Information regarding restricted securities is included at the end of the Series’ Investment Portfolio.
Illiquid Securities
A security may be considered illiquid if so deemed in good faith by the Advisor under procedures approved by and under the general supervision and responsibility of the Fund’s Board. Securities that are illiquid are marked with the applicable footnote on the Investment Portfolio. As of June 30, 2010, the aggregate value of securities deemed illiquid was $1,296,214, representing 0.9% of the Series’ net assets.
Federal Taxes
The Series’ policy is to comply with the provisions of the Internal Revenue Code applicable to regulated investment companies. The Series is not subject to federal income tax or excise tax to the extent that the Series distributes to shareholders each year its taxable income, including any net realized gains on investments, in accordance with requirements of the Internal Revenue Code. Accordingly, no provision for federal income tax or excise tax has been made in the financial statements.
16
Notes to Financial Statements (unaudited)
| 2. | SIGNIFICANT ACCOUNTING POLICIES (continued) |
Federal Taxes (continued)
Management evaluates its tax positions to determine if the tax positions taken meet the minimum recognition threshold in connection with accounting for uncertainties in income tax positions taken or expected to be taken for the purposes of measuring and recognizing tax liabilities in the financial statements. Recognition of tax benefits of an uncertain tax position is required only when the position is “more likely than not” to be sustained assuming examination by taxing authorities. At June 30, 2010, the Series has recorded no liability for net unrecognized tax benefits relating to uncertain income tax positions taken or expected to be taken in future tax returns.
The Series files income tax returns in the U.S. federal jurisdiction, various states and foreign jurisdictions, as required. No income tax returns are currently under investigation. The statute of limitations on the Series’ tax returns remains open for the year ended December 31, 2009. The Fund is not aware of any tax positions for which it is reasonably possible that the total amounts of unrecognized tax benefits will significantly change in the next twelve months.
Additionally, based on the Fund’s understanding of the tax rules and rates related to income, gains and transactions for foreign jurisdictions in which it invests, the Series will provide for foreign taxes, and where appropriate, deferred foreign tax.
Distributions of Income and Gains
Distributions to shareholders of net investment income and net realized gains are made annually. An additional distribution may be necessary to avoid taxation of the Series. Distributions are recorded on the ex-dividend date.
Indemnifications
The Fund’s organizational documents provide former and current directors and officers with a limited indemnification against liabilities arising in connection with the performance of their duties to the Fund. In the normal course of business, the Fund may also enter into contracts that provide general indemnifications. The Fund’s maximum exposure under these arrangements is unknown as this would be dependent on future claims that may be made against the Fund. The risk of material loss from such claims is considered remote.
Other
The preparation of financial statements in conformity with accounting principles generally accepted in the United States of America requires management to make estimates and assumptions that affect the reported amounts of assets and liabilities and the disclosure of contingent assets and liabilities at the date of the financial statements and the reported amounts of income and expenses during the reporting period. Actual results could differ from those estimates.
| 3. | TRANSACTIONS WITH AFFILIATES |
The Fund has an Investment Advisory Agreement (the “Agreement”) with the Advisor, for which the Series pays a fee, computed daily and payable monthly, at an annual rate of 1.00% of the Series’ average daily net assets.
Under the Agreement, personnel of the Advisor provide the Series with advice and assistance in the choice of investments and the execution of securities transactions, and otherwise maintain the Series’ organization. The Advisor also provides the Fund with necessary office space and fund administration and support services. The salaries of all officers of the Fund (except a percentage of the Fund’s Chief Compliance Officer’s salary, which is paid by the Fund), and of all Directors who are “affiliated persons” of the Fund, or of the Advisor, and all personnel of the Fund, or of the Advisor, performing services relating to research, statistical and investment activities, are paid by the Advisor. Each “non-affiliated” Director receives an annual stipend, which is allocated among all the active series of the Fund. In addition, these Directors also receive a fee per Board meeting attended for each active series of the Fund plus a fee for each committee meeting attended.
17
Notes to Financial Statements (unaudited)
| 3. | TRANSACTIONS WITH AFFILIATES (continued) |
The Advisor has contractually agreed, until at least April 30, 2011, to waive its fee and, if necessary, pay other operating expenses of the Series in order to maintain total direct annual fund operating expenses for the Series at no more than 1.20% of average daily net assets each year. For the six months ended June 30, 2010, the Advisor voluntarily waived fees of $758, which is included as a reduction of expenses on the Statement of Operations. The Advisor is not eligible to recoup any expenses that have been waived or reimbursed in prior years.
Manning & Napier Investor Services, Inc., a registered broker-dealer affiliate of the Advisor, acts as distributor for the Fund’s shares. The services of Manning & Napier Investor Services, Inc. are provided at no additional cost to the Series.
The Advisor has entered into agreements with PNC Global Investment Servicing (U.S.) Inc. (“PNCGIS”) under which PNCGIS serves as sub-accountant services agent and sub-transfer agent. The Fund pays the Advisor an annual fee of 0.0175% on the first $3 billion of average daily net assets (excluding Target Series); 0.015% on the next $3 billion of average daily net assets (excluding Target Series); and 0.01% of the average daily net assets in excess of $6 billion (excluding Target Series); plus a base fee of $25,500 per Series. Additionally, certain transaction-, account-, and cusip-based fees and out-of-pocket expenses, including charges for reporting relating to the Fund’s compliance program, are charged.
On July 1, 2010, The PNC Financial Services Group, Inc. sold the outstanding stock of PNC Global Investment Servicing Inc. to The Bank of New York Mellon Corporation. At the closing of the sale, PNCGIS changed its name to BNY Mellon Investment Servicing (US) Inc.
| 4. | PURCHASES AND SALES OF SECURITIES |
For the six months ended June 30, 2010, purchases and sales of securities, other than U.S. Government securities and short-term securities, were $52,590,494 and $40,761,863, respectively. There were no purchases or sales of U.S. Government securities.
| 5. | CAPITAL STOCK TRANSACTIONS |
Transactions in shares of High Yield Bond Series were:
| | | | | | | | | | | | | | |
| | | For the Six Months Ended 6/30/10 | | | For the period 9/14/09
(commencement of
operations) to 12/31/09 | |
| | | Shares | | | Amount | | | Shares | | | Amount | |
Sold | | 1,327,642 | | | $ | 14,103,798 | | | 12,442,729 | | | $ | 125,933,491 | |
Reinvested | | — | | | | — | | | 126,129 | | | | 1,296,610 | |
Repurchased | | (587,917 | ) | | | (6,261,858 | ) | | (252,173 | ) | | | (2,578,430 | ) |
| | | | | | | | | | | | | | |
Total | | 739,725 | | | $ | 7,841,940 | | | 12,316,685 | | | $ | 124,651,671 | |
| | | | | | | | | | | | | | |
Substantially all of the Series’ shares represent investments by fiduciary accounts over which the Advisor has sole investment discretion.
The Series may trade in instruments including written and purchased options, forward foreign currency exchange contracts and futures contracts and other derivatives in the normal course of investing activities to assist in managing exposure to various market risks. The Series may be subject to various elements of risk and may involve, to a
18
Notes to Financial Statements (unaudited)
| 6. | FINANCIAL INSTRUMENTS (continued) |
varying degree, elements of risk in excess of the amounts recognized for financial statement purposes. These risks include: the risk that changes in the value of a derivative may not correlate perfectly with the underlying asset, rate or index, counterparty credit risk related to over the counter derivatives counterparties’ failure to perform under contract terms, liquidity risk related to the lack of a liquid market for these contracts allowing the fund to close out its position(s) and documentation risk relating to disagreement over contract terms. No such investments were held by the Series during the six months ended June 30, 2010.
Investing in securities of foreign companies and foreign governments involves special risks and considerations not typically associated with investing in securities of domestic companies and the U.S. Government. These risks include revaluation of currencies and future adverse political and economic developments. Moreover, securities of foreign companies and foreign governments and their markets may be less liquid and their prices more volatile than those of comparable domestic companies and the U.S. Government.
| 8. | FEDERAL INCOME TAX INFORMATION |
The amount and characterization of certain income and capital gains to be distributed are determined in accordance with federal income tax regulations, which may differ from accounting principles generally accepted in the United States of America. The Series may periodically make reclassifications among its capital accounts to reflect income and gains available for distribution (or available capital loss carryovers) under income tax regulations without impacting the Series’ net asset value. Any such reclassifications are not reflected in the financial highlights.
The final determination of the tax character of current year distributions will be made at the conclusion of the fiscal year. The tax character of distributions paid for the period September 14, 2009 (commencement of operations) to December 31, 2009 were as follows:
| | | |
Ordinary income | | $ | 1,348,490 |
For the period ended December 31, 2009, the Series elected to defer $5,189 of currency losses attributable to Post-October losses.
At June 30, 2010, the identified cost of investments for federal income tax purposes, the resulting gross unrealized appreciation and depreciation, and the net unrealized appreciation were as follows:
| | | | |
Cost for federal income tax purposes | | $ | 137,458,127 | |
Unrealized appreciation | | $ | 2,506,003 | |
Unrealized depreciation | | | (1,573,217 | ) |
| | | | |
Net unrealized appreciation | | $ | 932,786 | |
| | | | |
There were no subsequent events that require recognition or disclosure. In preparing these financial statements, management of the Fund has evaluated events and transactions for potential recognition or disclosure through the date the financial statements were issued.
19
This Page Intentionally Left Blank
This Page Intentionally Left Blank
Literature Requests (unaudited)
Proxy Voting Policies and Procedures
A description of the policies and procedures that the Fund uses to determine how to vote proxies relating to portfolio securities is available, without charge, upon request:
| | |
By phone | | 1-800-466-3863 |
On the Securities and Exchange | | |
Commission’s (SEC) web site | | http://www.sec.gov |
Proxy Voting Record
Information regarding how the Fund voted proxies relating to portfolio securities during the most recent 12-month period ended June 30th is available, without charge, upon request:
| | |
By phone | | 1-800-466-3863 |
On the SEC’s web site | | http://www.sec.gov |
Quarterly Portfolio Holdings
The Series’ complete schedule of portfolio holdings for the 1st and 3rd quarters of each fiscal year are provided on
Form N-Q, and are available, without charge, upon request:
| | |
By phone | | 1-800-466-3863 |
On the SEC’s web site | | http://www.sec.gov |
The Series’ Form N-Q may be reviewed and copied at the SEC’s Public Reference Room in Washington, D.C. Information on the operation of the Public Reference Room may be obtained by calling 1-800-SEC-0330.
Prospectus and Statement of Additional Information (SAI)
The prospectus and SAI provide additional information about each Series, including charges, expenses and risks. These documents are available, without charge, upon request:
| | |
By phone | | 1-800-466-3863 |
On the SEC’s web site | | http://www.sec.gov |
On the Advisor’s web site | | http://www.manningnapieradvisors.com |
Additional information available at www.manningnapieradvisors.com
1. Fund Holdings - Month-End
2. Fund Holdings - Quarter-End
3. Shareholder Report - Annual
4. Shareholder Report - Semi-Annual
MNHYYLD-06/10-SAR
Not applicable for Semi-Annual Reports.
| ITEM 3: | AUDIT COMMITTEE FINANCIAL EXPERT |
Not applicable for Semi-Annual Reports.
| ITEM 4: | PRINCIPAL ACCOUNTANT FEES AND SERVICES |
Not applicable for Semi-Annual Reports.
| ITEM 5: | AUDIT COMMITTEE OF LISTED REGISTRANTS |
Not applicable.
| (a) | See Investment Portfolios under Item 1 on this Form N-CSR. |
| ITEM 7: | DISCLOSURE OF PROXY VOTING POLICIES AND PROCEDURES FOR CLOSED- END MANAGEMENT INVESTMENT COMPANIES |
Not applicable.
| ITEM 8: | PORTFOLIO MANAGERS OF CLOSED-END MANAGEMENT INVESTMENT COMPANIES |
Not applicable.
| ITEM 9: | PURCHASES OF EQUITY SECURITIES BY CLOSED-END MANAGEMENT INVESTMENT COMPANY AND AFFILIATED PURCHASERS |
Not applicable.
ITEM 10: SUBMISSION OF MATTERS TO A VOTE OF SECURITY HOLDERS
There have been no material changes to the procedure by which shareholders may recommend nominees to the registrant’s board of directors.
ITEM 11: CONTROLS AND PROCEDURES
(a) Based on their evaluation of the Funds’ disclosure controls and procedures, as of a date within 90 days of the filing date, the Funds’ Principal Executive Officer and Principal Financial Officer have concluded that the Funds’ disclosure controls and procedures are: (i) reasonably designed to ensure that information required to be disclosed in this report is appropriately communicated to the Funds’ officers to allow timely decisions regarding disclosures required in this report; (ii) reasonably designed to ensure that information required to be disclosed in this report is recorded, processed, summarized and reported in a timely manner; and (iii) are effective in achieving the goals described in (i) and (ii) above.
(b) During the second fiscal quarter of the period covered by this report, there have been no changes in the Funds’ internal control over financial reporting that the above officers believe to have materially affected, or to be reasonably likely to materially affect, the Funds’ internal control over financial reporting.
ITEM 12: EXHIBITS
| | |
| (a)(1) | | Not applicable for Semi-Annual Reports. |
| |
| (a)(2) | | Separate certifications for the Registrant’s principal executive officer and principal financial officer, as required by Section 302 of the Sarbanes-Oxley Act of 2002 and Rule 30a-2(a) under the Investment Company Act of 1940, are attached as EX-99.CERT. |
| |
| (a)(3) | | Not applicable. |
| |
| (b) | | A certification of the Registrant’s principal executive officer and principal financial officer, as required by 18 U.S.C Section 1350, as adopted pursuant to Section 906 of the Sarbanes-Oxley Act of 2002, and Rule 30a-2(b) under the Investment Company Act of 1940, is attached as EX- 99.906CERT. The certification furnished pursuant to this paragraph is not deemed to be “filed” for purposes of Section 18 of the Securities Exchange Act of 1934, or otherwise subject to the liability of that section. Such certification is not deemed to be incorporated by reference into any filing under the Securities Act of 1933 or the Securities Exchange Act of 1934, except to the extent that the Registrant specifically incorporates them by reference. |
SIGNATURES
Pursuant to the requirements of the Securities Exchange Act of 1934 and the Investment Company Act of 1940, the registrant has duly caused this report to be signed on its behalf by the undersigned, thereunto duly authorized.
|
| Manning & Napier Fund, Inc. |
|
/s/ B. Reuben Auspitz |
| B. Reuben Auspitz |
President & Principal Executive Officer of Manning & Napier Fund, Inc. |
| August 27, 2010 |
Pursuant to the requirements of the Securities Exchange Act of 1934 and the Investment Company Act of 1940, this report has been signed below by the following persons on behalf of the registrant and in the capacities and on the dates indicated.
|
/s/ B. Reuben Auspitz |
| B. Reuben Auspitz |
President & Principal Executive Officer of Manning & Napier Fund, Inc. |
| August 27, 2010 |
|
/s/ Christine Glavin |
| Christine Glavin |
| Chief Financial Officer & Principal Financial Officer of Manning & Napier Fund, Inc. |
| August 27, 2010 |