UNITED STATES
SECURITIES AND EXCHANGE COMMISSION
Washington, D.C. 20549
FORM N-CSR
CERTIFIED SHAREHOLDER REPORT OF REGISTERED MANAGEMENT INVESTMENT
COMPANIES
Investment Company Act file number 811-04087
Manning & Napier Fund, Inc.
(Exact name of registrant as specified in charter)
290 Woodcliff Drive, Fairport, NY 14450
(Address of principal executive offices)(Zip Code)
B. Reuben Auspitz 290 Woodcliff Drive, Fairport, NY 14450
(Name and address of agent for service)
Registrant’s telephone number, including area code: 585-325-6880
Date of fiscal year end: October 31, 2010
Date of reporting period: November 1, 2009 through April 30, 2010
Form N-CSR is to be used by management investment companies to file reports with the Commission not later than 10 days after the transmission to stockholders of any report that is required to be transmitted to stockholders under Rule 30e-1 under the Investment Company Act of 1940 (17 CFR 270.30e-1). The Commission may use the information provided on Form N-CSR in its regulatory, disclosure review, inspection, and policymaking roles.
A registrant is required to disclose the information specified by Form N-CSR, and the Commission will make this information public. A registrant is not required to respond to the collection of information contained in Form N-CSR unless the Form displays a currently valid Office of Management and Budget (“OMB”) control number. Please direct comments concerning the accuracy of the information collection burden estimate and any suggestions for reducing the burden to Secretary, Securities and Exchange Commission, 100 F Street, NE, Washington, DC 20549. The OMB has reviewed this collection of information under the clearance requirements of 44 U.S.C. § 3507.
ITEM 1: REPORTS TO STOCKHOLDERS.

Shareholder Expense Example (unaudited)
As a shareholder of the Series, you may incur two types of costs: (1) transaction costs, including potential wire charges on redemptions and (2) ongoing costs, including management fees and other Series expenses. This example is intended to help you understand your ongoing costs (in dollars) of investing in the Series and to compare these costs with the ongoing costs of investing in other mutual funds.
The example is based on an investment of $1,000 invested at the beginning of the period and held for the entire period (November 1, 2009 to April 30, 2010).
Actual Expenses
The first line of the table below provides information about actual account values and actual expenses. You may use the information in this line, together with the amount you invested, to estimate the expenses that you paid over the period. Simply divide your account value by $1,000 (for example, an $8,600 account value divided by $1,000 = 8.6), then multiply the result by the number in the first line under the heading entitled “Expenses Paid During Period” to estimate the expenses you paid on your account during this period.
Hypothetical Example for Comparison Purposes
The second line of the table below provides information about hypothetical account values and hypothetical expenses based on the Series’ actual expense ratio and an assumed rate of return of 5% per year before expenses, which is not the Series’ actual return. The hypothetical account values and expenses may not be used to estimate the actual ending account balance or expenses you paid during the period. You may use this information to compare the ongoing costs of investing in the Series and other funds. To do so, compare this 5% hypothetical example with the 5% hypothetical examples that appear in the shareholder reports of the other funds.
Please note that the expenses shown in the table are meant to highlight your ongoing costs only and do not reflect any transaction costs. Therefore, the second line of the table is useful in comparing ongoing costs only, and will not help you determine the relative total costs of owning different funds. In addition, if these transaction costs were included, your costs would have been higher.
| | | | | | |
| | | Beginning
Account Value
11/1/09 | | Ending
Account Value
4/30/10 | | Expenses Paid
During Period*
11/1/09-4/30/10 |
Actual | | $1,000.00 | | $1,172.80 | | $5.66 |
Hypothetical | | | | | | |
(5% return before expenses) | | $1,000.00 | | $1,019.59 | | $5.26 |
*Expenses are equal to the Series’ annualized expense ratio (for the six-month period) of 1.05%, multiplied by the average account value over the period, multiplied by 181/365 (to reflect the one-half year period). Expenses are based on the most recent fiscal half year. The Series’ total return would have been lower had certain expenses not been waived during the period.
Portfolio Composition as of April 30, 2010 (unaudited)
Investment Portfolio - April 30, 2010 (unaudited)
| | | | | |
| | |
| | | Shares | | Value (Note 2) |
| | |
COMMON STOCKS - 96.8% | | | | | |
| | |
Consumer Discretionary - 17.0% | | | | | |
Hotels, Restaurants & Leisure - 2.6% | | | | | |
Carnival Corp. | | 541,870 | | $ | 22,595,979 |
International Game Technology | | 584,980 | | | 12,331,378 |
| | | | | |
| | | | | 34,927,357 |
| | | | | |
Media - 7.7% | | | | | |
Discovery Communications, Inc. - Class A* | | 503,520 | | | 19,486,224 |
Time Warner, Inc. | | 656,070 | | | 21,702,796 |
The Walt Disney Co. | | 1,237,350 | | | 45,583,974 |
The Washington Post Co. - Class B | | 37,550 | | | 19,043,858 |
| | | | | |
| | | | | 105,816,852 |
| | | | | |
Multiline Retail - 2.3% | | | | | |
Kohl’s Corp.* | | 278,650 | | | 15,322,964 |
Nordstrom, Inc. | | 397,810 | | | 16,441,487 |
| | | | | |
| | | | | 31,764,451 |
| | | | | |
Specialty Retail - 4.4% | | | | | |
Dick’s Sporting Goods, Inc.* | | 659,510 | | | 19,198,336 |
The Home Depot, Inc. | | 320,210 | | | 11,287,403 |
Lowe’s Companies, Inc. | | 416,510 | | | 11,295,751 |
The Sherwin-Williams Co. | | 243,200 | | | 18,986,624 |
| | | | | |
| | | | | 60,768,114 |
| | | | | |
Total Consumer Discretionary | | | | | 233,276,774 |
| | | | | |
Consumer Staples - 6.1% | | | | | |
Food & Staples Retailing - 2.2% | | | | | |
The Kroger Co. | | 763,200 | | | 16,965,936 |
Safeway, Inc. | | 593,090 | | | 13,996,924 |
| | | | | |
| | | | | 30,962,860 |
| | | | | |
Food Products - 3.9% | | | | | |
Dean Foods Co.* | | 1,169,590 | | | 18,362,563 |
General Mills, Inc. | | 153,160 | | | 10,901,929 |
H.J. Heinz Co. | | 297,460 | | | 13,941,950 |
Kellogg Co. | | 183,600 | | | 10,086,984 |
| | | | | |
| | | | | 53,293,426 |
| | | | | |
Total Consumer Staples | | | | | 84,256,286 |
| | | | | |
Energy - 6.8% | | | | | |
Energy Equipment & Services - 4.3% | | | | | |
Baker Hughes, Inc. | | 554,640 | | | 27,598,886 |
Weatherford International Ltd. (Switzerland)* | | 1,710,960 | | | 30,985,486 |
| | | | | |
| | | | | 58,584,372 |
| | | | | |
| | | | |
3 | | The accompanying notes are an integral part of the financial statements. | | |
Investment Portfolio - April 30, 2010 (unaudited)
| | | | | |
| | |
| | | Shares | | Value (Note 2) |
| | |
COMMON STOCKS (continued) | | | | | |
| | |
Energy (continued) | | | | | |
Oil, Gas & Consumable Fuels - 2.5% | | | | | |
Hess Corp. | | 543,220 | | $ | 34,521,631 |
| | | | | |
Total Energy | | | | | 93,106,003 |
| | | | | |
Financials - 9.3% | | | | | |
Capital Markets - 5.5% | | | | | |
The Bank of New York Mellon Corp.1 | | 1,099,300 | | | 34,221,209 |
Federated Investors, Inc. - Class B | | 1,035,840 | | | 24,984,461 |
Northern Trust Corp. | | 304,130 | | | 16,721,067 |
| | | | | |
| | | | | 75,926,737 |
| | | | | |
Consumer Finance - 1.8% | | | | | |
American Express Co. | | 526,930 | | | 24,302,012 |
| | | | | |
Insurance - 2.0% | | | | | |
The Progressive Corp. | | 1,399,770 | | | 28,121,379 |
| | | | | |
Total Financials | | | | | 128,350,128 |
| | | | | |
Health Care - 18.2% | | | | | |
Biotechnology - 2.0% | | | | | |
Genzyme Corp.* | | 520,800 | | | 27,727,392 |
| | | | | |
Health Care Equipment & Supplies - 7.8% | | | | | |
Becton, Dickinson and Co. | | 421,599 | | | 32,197,516 |
Boston Scientific Corp.* | | 3,077,180 | | | 21,170,998 |
Gen-Probe, Inc.* | | 516,970 | | | 24,499,208 |
Inverness Medical Innovations, Inc.* | | 738,410 | | | 29,373,950 |
| | | | | |
| | | | | 107,241,672 |
| | | | | |
Health Care Providers & Services - 1.1% | | | | | |
Quest Diagnostics, Inc. | | 272,910 | | | 15,599,535 |
| | | | | |
Health Care Technology - 2.5% | | | | | |
Cerner Corp.* | | 179,190 | | | 15,215,023 |
Eclipsys Corp.* | | 944,650 | | | 19,535,362 |
| | | | | |
| | | | | 34,750,385 |
| | | | | |
Life Sciences Tools & Services - 2.4% | | | | | |
PerkinElmer, Inc. | | 431,820 | | | 10,817,091 |
Thermo Fisher Scientific, Inc.* | | 396,210 | | | 21,902,489 |
| | | | | |
| | | | | 32,719,580 |
| | | | | |
Pharmaceuticals - 2.4% | | | | | |
Johnson & Johnson | | 502,680 | | | 32,322,324 |
| | | | | |
Total Health Care | | | | | 250,360,888 |
| | | | | |
Industrials - 10.7% | | | | | |
Aerospace & Defense - 1.4% | | | | | |
The Boeing Co. | | 266,030 | | | 19,268,553 |
| | | | | |
| | | | |
| | The accompanying notes are an integral part of the financial statements. | | 4 |
Investment Portfolio - April 30, 2010 (unaudited)
| | | | | |
| | |
| | | Shares | | Value (Note 2) |
| | |
COMMON STOCKS (continued) | | | | | |
| | |
Industrials (continued) | | | | | |
Air Freight & Logistics - 3.6% | | | | | |
FedEx Corp. | | 187,020 | | $ | 16,833,670 |
United Parcel Service, Inc. - Class B | | 474,430 | | | 32,802,090 |
| | | | | |
| | | | | 49,635,760 |
| | | | | |
Airlines - 2.2% | | | | | |
Southwest Airlines Co. | | 2,285,640 | | | 30,124,735 |
| | | | | |
Commercial Services & Supplies - 1.2% | | | | | |
Waste Management, Inc. | | 477,030 | | | 16,543,401 |
| | | | | |
Machinery - 1.1% | | | | | |
Pall Corp. | | 405,040 | | | 15,792,510 |
| | | | | |
Road & Rail - 1.2% | | | | | |
Heartland Express, Inc. | | 362,670 | | | 5,998,562 |
J.B. Hunt Transport Services, Inc. | | 271,870 | | | 10,021,128 |
| | | | | |
| | | | | 16,019,690 |
| | | | | |
Total Industrials | | | | | 147,384,649 |
| | | | | |
Information Technology - 22.9% | | | | | |
Communications Equipment - 4.5% | | | | | |
Cisco Systems, Inc.* | | 1,558,130 | | | 41,944,860 |
Juniper Networks, Inc.* | | 343,760 | | | 9,766,222 |
QUALCOMM, Inc. | | 245,490 | | | 9,510,282 |
| | | | | |
| | | | | 61,221,364 |
| | | | | |
Computers & Peripherals - 2.5% | | | | | |
EMC Corp.* | | 1,818,400 | | | 34,567,784 |
| | | | | |
Internet Software & Services - 3.7% | | | | | |
Google, Inc. - Class A* | | 96,590 | | | 50,752,249 |
| | | | | |
IT Services - 4.8% | | | | | |
Automatic Data Processing, Inc. | | 462,370 | | | 20,048,363 |
Paychex, Inc. | | 583,400 | | | 17,852,040 |
The Western Union Co. | | 1,516,410 | | | 27,674,483 |
| | | | | |
| | | | | 65,574,886 |
| | | | | |
Semiconductors & Semiconductor Equipment - 0.6% | | | | | |
KLA-Tencor Corp. | | 247,460 | | | 8,428,487 |
| | | | | |
Software - 6.8% | | | | | |
Autodesk, Inc.* | | 1,119,160 | | | 38,062,632 |
Electronic Arts, Inc.* | | 1,427,470 | | | 27,650,094 |
Microsoft Corp. | | 915,430 | | | 27,957,232 |
| | | | | |
| | | | | 93,669,958 |
| | | | | |
Total Information Technology | | | | | 314,214,728 |
| | | | | |
| | | | |
5 | | The accompanying notes are an integral part of the financial statements. | | |
Investment Portfolio - April 30, 2010 (unaudited)
| | | | | | |
| | |
| | | Shares | | Value (Note 2) | |
| | |
COMMON STOCKS (continued) | | | | | | |
| | |
Materials - 3.0% | | | | | | |
Chemicals - 2.1% | | | | | | |
Monsanto Co. | | 456,060 | | $ | 28,759,143 | |
| | | | | | |
Construction Materials - 0.9% | | | | | | |
Martin Marietta Materials, Inc. | | 122,460 | | | 11,741,465 | |
| | | | | | |
Total Materials | | | | | 40,500,608 | |
| | | | | | |
Telecommunication Services - 2.8% | | | | | | |
Wireless Telecommunication Services - 2.8% | | | | | | |
American Tower Corp. - Class A* | | 318,750 | | | 13,008,188 | |
Crown Castle International Corp.* | | 655,620 | | | 24,815,217 | |
| | | | | | |
Total Telecommunication Services | | | | | 37,823,405 | |
| | | | | | |
TOTAL COMMON STOCKS | | | | | | |
(Identified Cost $1,106,502,679) | | | | | 1,329,273,469 | |
| | | | | | |
| | |
SHORT-TERM INVESTMENTS - 4.7% | | | | | | |
| | |
Dreyfus Cash Management, Inc. - Institutional Shares2 , 0.09% | | | | | | |
(Identified Cost $63,965,683) | | 63,965,683 | | | 63,965,683 | |
| | | | | | |
TOTAL INVESTMENTS - 101.5% | | | | | | |
(Identified Cost $1,170,468,362) | | | | | 1,393,239,152 | |
LIABILITIES, LESS OTHER ASSETS - (1.5%) | | | | | (20,288,249 | ) |
| | | | | | |
NET ASSETS - 100% | | | | $ | 1,372,950,903 | |
| | | | | | |
*Non-income producing security
1The Bank of New York Mellon Corp. is the Series’ custodian.
2Rate shown is the current yield as of April 30, 2010.
| | | | |
| | The accompanying notes are an integral part of the financial statements. | | 6 |
Statement of Assets and Liabilities (unaudited)
April 30, 2010
| | | | |
ASSETS: | | | | |
| |
Investments, at value (identified cost $1,170,468,362) (Note 2) | | $ | 1,393,239,152 | |
Receivable for fund shares sold | | | 3,120,814 | |
Dividends receivable | | | 595,821 | |
| | | | |
| |
TOTAL ASSETS | | | 1,396,955,787 | |
| | | | |
| |
LIABILITIES: | | | | |
| |
Accrued management fees (Note 3) | | | 1,092,388 | |
Accrued transfer agent fees (Note 3) | | | 60,507 | |
Accrued fund accounting and administration fees (Note 3) | | | 17,370 | |
Accrued Chief Compliance Officer service fees (Note 3) | | | 667 | |
Payable for securities purchased | | | 21,578,248 | |
Payable for fund shares repurchased | | | 1,236,430 | |
Other payables and accrued expenses | | | 19,274 | |
| | | | |
| |
TOTAL LIABILITIES | | | 24,004,884 | |
| | | | |
| |
TOTAL NET ASSETS | | $ | 1,372,950,903 | |
| | | | |
| |
NET ASSETS CONSIST OF: | | | | |
| |
Capital stock | | $ | 753,465 | |
Additional paid-in-capital | | | 1,221,139,205 | |
Undistributed net investment income | | | 993,659 | |
Accumulated net realized loss on investments | | | (72,706,216 | ) |
Net unrealized appreciation on investments | | | 222,770,790 | |
| | | | |
| |
TOTAL NET ASSETS | | $ | 1,372,950,903 | |
| | | | |
| |
NET ASSET VALUE, OFFERING PRICE AND REDEMPTION PRICE PER SHARE - Class A | | | | |
($1,372,950,903/75,346,464 shares) | | $ | 18.22 | |
| | | | |
| | | | |
7 | | The accompanying notes are an integral part of the financial statements. | | |
Statement of Operations (unaudited)
For the Six Months Ended April 30, 2010
| | | | |
INVESTMENT INCOME: | | | | |
| |
Dividends | | $ | 7,435,488 | |
Interest | | | 4,961 | |
| | | | |
| |
Total Investment Income | | | 7,440,449 | |
| | | | |
| |
EXPENSES: | | | | |
| |
Management fees (Note 3) | | | 5,885,046 | |
Transfer agent fees (Note 3) | | | 206,115 | |
Fund accounting and administration fees (Note 3) | | | 99,658 | |
Directors’ fees (Note 3) | | | 6,373 | |
Chief Compliance Officer service fees (Note 3) | | | 1,700 | |
Custodian fees | | | 24,974 | |
Miscellaneous | | | 80,034 | |
| | | | |
| |
Total Expenses | | | 6,303,900 | |
Less reduction of expenses (Note 3) | | | (124,602 | ) |
| | | | |
| |
Net Expenses | | | 6,179,298 | |
| | | | |
| |
NET INVESTMENT INCOME | | | 1,261,151 | |
| | | | |
| |
REALIZED AND UNREALIZED GAIN ON INVESTMENTS: | | | | |
| |
Net realized gain on investments | | | 24,844,665 | |
Net change in unrealized appreciation on investments | | | 158,205,645 | |
| | | | |
| |
NET REALIZED AND UNREALIZED GAIN ON INVESTMENTS | | | 183,050,310 | |
| | | | |
| |
NET INCREASE IN NET ASSETS RESULTING FROM OPERATIONS | | $ | 184,311,461 | |
| | | | |
| | | | |
| | The accompanying notes are an integral part of the financial statements. | | 8 |
Statements of Changes in Net Assets
| | | | | | | | |
| | | For the Six Months Ended
4/30/10
(unaudited) | | | For the Year Ended
10/31/09 | |
INCREASE (DECREASE) IN NET ASSETS: | | | | | | | | |
| | |
OPERATIONS: | | | | | | | | |
| | |
Net investment income | | $ | 1,261,151 | | | $ | 1,741,459 | |
Net realized gain (loss) on investments | | | 24,844,665 | | | | (59,388,937 | ) |
Net change in unrealized appreciation on investments | | | 158,205,645 | | | | 195,678,137 | |
| | | | | | | | |
| | |
Net increase from operations | | | 184,311,461 | | | | 138,030,659 | |
| | | | | | | | |
| | |
DISTRIBUTIONS TO SHAREHOLDERS (Note 8): | | | | | | | | |
| | |
From net investment income | | | (1,082,233 | ) | | | (2,526,440 | ) |
| | | | | | | | |
| | |
CAPITAL STOCK ISSUED AND REPURCHASED: | | | | | | | | |
| | |
Net increase from capital share transactions (Note 5) | | | 186,678,589 | | | | 365,955,855 | |
| | | | | | | | |
| | |
Net increase in net assets | | | 369,907,817 | | | | 501,460,074 | |
| | |
NET ASSETS: | | | | | | | | |
| | |
Beginning of period | | | 1,003,043,086 | | | | 501,583,012 | |
| | | | | | | | |
| | |
End of period (including undistributed net investment income of $993,659 and $814,741, respectively) | | $ | 1,372,950,903 | | | $ | 1,003,043,086 | |
| | | | | | | | |
| | | | |
9 | | The accompanying notes are an integral part of the financial statements. | | |
Financial Highlights
| | | | | | | | | | | | | | | |
| | | | |
| | | For the Six
Months Ended 4/30/10 | | | | | For the Years Ended | | |
| | | (unaudited) | | 10/31/09 | | | 10/31/08 | | | 10/31/07 | | | 10/31/06 | | 10/31/05 |
Per share data (for a share outstanding throughout each period): | | | | | | | | | | | | | | | |
Net asset value - Beginning of period | | $15.55 | | $13.34 | | | $21.43 | | | $19.19 | | | $17.24 | | $15.63 |
| | | | | | | | | | | | | | | |
Income (loss) from investment operations: | | | | | | | | | | | | | | | |
Net investment income (loss) | | 0.021 | | 0.04 | 1 | | 0.07 | | | 0.06 | | | 0.04 | | (0.01) |
Net realized and unrealized gain (loss) on investments | | 2.67 | | 2.24 | | | (7.35 | ) | | 2.65 | | | 3.25 | | 2.45 |
| | | | | | | | | | | | | | | |
Total from investment operations | | 2.69 | | 2.28 | | | (7.28 | ) | | 2.71 | | | 3.29 | | 2.44 |
| | | | | | | | | | | | | | | |
Less distributions to shareholders: | | | | | | | | | | | | | | | |
From net investment income | | (0.02) | | (0.07 | ) | | (0.07 | ) | | (0.05 | ) | | — | | — |
From net realized gain on investments | | — | | — | | | (0.74 | ) | | (0.42 | ) | | (1.34) | | (0.83) |
| | | | | | | | | | | | | | | |
Total distributions to shareholders | | (0.02) | | (0.07 | ) | | (0.81 | ) | | (0.47 | ) | | (1.34) | | (0.83) |
| | | | | | | | | | | | | | | |
Net asset value - End of period | | $18.22 | | $15.55 | | | $13.34 | | | $21.43 | | | $19.19 | | $17.24 |
| | | | | | | | | | | | | | | |
| | | | | | |
Net assets - End of period | | | | | | | | | | | | | | | |
(000’s omitted) | | $1,372,951 | | $1,003,043 | | | $501,583 | | | $191,026 | | | $8,310 | | $2,714 |
| | | | | | | | | | | | | | | |
| | | | | | |
Total return2 | | 17.28% | | 17.23% | | | (35.09% | ) | | 14.37% | | | 20.36% | | 16.05% |
Ratios (to average net assets)/ | | | | | | | | | | | | | | | |
Supplemental Data: | | | | | | | | | | | | | | | |
Expenses* | | 1.05%3 | | 1.05% | | | 1.05% | | | 1.05% | | | 1.05% | | 1.05% |
Net investment income (loss) | | 0.21%3 | | 0.26% | | | 0.56% | | | 0.45% | | | 0.35% | | (0.04%) |
Portfolio turnover | | 20% | | 50% | | | 63% | | | 44% | | | 55% | | 57% |
|
*The investment advisor did not impose all or a portion of its management fees, CCO fees, fund accounting and transfer agent fees, and other fees in some periods and in some periods paid a portion of the Series’ expenses. If these expenses had been incurred by the Series, the expense ratio (to average net assets) would have been increased by the following amount: |
| | | | | | |
| | 0.02%3 | | 0.06% | | | 0.06% | | | 0.11% | | | 1.24% | | 2.33% |
1Calculated based on average shares outstanding during the periods.
2Represents aggregate total return for the periods indicated, and assumes reinvestment of all distributions. Total return would have been lower had certain expenses not been waived or reimbursed during the periods. Periods less than one year are not annualized.
3Annualized.
| | | | |
| | The accompanying notes are an integral part of the financial statements. | | 10 |
Notes to Financial Statements (unaudited)
Equity Series (the “Series”) is a no-load diversified series of Manning & Napier Fund, Inc. (the “Fund”). The Fund is organized in Maryland and is registered under the Investment Company Act of 1940, as amended, as an open-end management investment company.
The Series’ investment objective is to provide long-term growth of capital, primarily through investments in U.S. common stocks.
The Fund’s Advisor is Manning & Napier Advisors, Inc. (the “Advisor”). Shares of the Series are offered to investors and employees of the Advisor and its affiliates. The total authorized capital stock of the Fund consists of 10.0 billion shares of common stock each having a par value of $0.01. As of April 30, 2010, 6.2 billion shares have been designated in total among 29 series, of which 200 million have been designated as Equity Series Class A common stock.
| 2. | SIGNIFICANT ACCOUNTING POLICIES |
Security Valuation
Portfolio securities, including domestic equities, listed on an exchange other than the NASDAQ National Market System are valued at the latest quoted sales price of the exchange on which the security is primarily traded. Securities not traded on valuation date or securities not listed on an exchange are valued at the latest quoted bid price provided by the Fund’s pricing service. Securities listed on the NASDAQ National Market System are valued in accordance with the NASDAQ Official Closing Price.
Short-term investments that mature in sixty days or less are valued at amortized cost, which approximates market value. Investments in open-end investment companies are valued at their net asset value per share on valuation date.
Volume and level of activity in established markets for an asset or liability are evaluated to determine whether recent transactions and quoted prices are determinative of fair value. Where there have been significant decreases in volume and level of activity, further analysis and adjustment may be necessary to estimate fair value. The Series measures fair value in these instances by the use of inputs and valuation techniques which may be based upon current market prices of securities that are comparable in coupon, rating, maturity and industry and/or expectation of future cash flows. As a result of trading in relatively thin markets and/or markets that experience significant volatility, the prices used by the Series to value these securities may differ from the value that would be realized if these securities were sold, and the differences could be material.
Securities for which representative valuations or prices are not available from the Fund’s pricing service may be valued at fair value. Due to the inherent uncertainty of valuations of such securities, the fair value may differ significantly from the values that would have been used had a ready market for such securities existed. If trading or events occurring after the close of the principal market in which securities are traded are expected to materially affect the value of those securities, then they may be valued at their fair value, taking this trading or these events into account. Fair value is determined in good faith by the Advisor under procedures approved by and under the general supervision and responsibility of the Fund’s Board of Directors (the “Board”).
Various inputs are used in determining the value of the Series’ assets or liabilities carried at market value. These inputs are summarized in three broad levels. Level 1 includes quoted prices in active markets for identical assets and liabilities. Level 2 includes other significant observable inputs (including quoted prices for similar securities, interest rates, prepayment speeds, credit risk, etc.). Level 3 includes significant unobservable inputs (including the Series’ own assumptions in determining the fair value of investments). The inputs or methodology used for valuing securities are not necessarily an indication of the risk associated with investing in those securities.
Notes to Financial Statements (unaudited)
| 2. | SIGNIFICANT ACCOUNTING POLICIES (continued) |
Security Valuation (continued)
The following is a summary of the valuation levels used for major security types as of April 30, 2010 in valuing the Series’ assets or liabilities carried at market value:
| | | | | | | | | | | | |
Description | | | 4/30/10 | | | Level 1 | | | Level 2 | | | Level 3 |
Equity securities* | | $ | 1,329,273,469 | | $ | 1,329,273,469 | | $ | — | | $ | — |
Preferred securities | | | — | | | — | | | — | | | — |
Debt securities | | | — | | | — | | | — | | | — |
Mutual funds | | | 63,965,683 | | | 63,965,683 | | | — | | | — |
Other financial instruments** | | | — | | | — | | | — | | | — |
| | | | | | | | | | | | |
Total | | $ | 1,393,239,152 | | $ | 1,393,239,152 | | $ | — | | $ | — |
| | | | | | | | | | | | |
*Includes common stock, warrants and rights. Please see the Investment Portfolio for industry classification.
**Other financial instruments are derivative instruments not reflected in the Investment Portfolio, such as futures, forwards and swap contracts, which are valued at the unrealized appreciation/ depreciation on the instrument. As of April 30, 2010, the Series did not hold any derivative instruments.
There were no Level 3 securities held by the Series as of October 31, 2009 or April 30, 2010.
The Fund’s policy is to recognize transfers in and transfers out of the valuation levels as of the end of the reporting period. There were no significant transfers between Level 1 and Level 2 as of April 30, 2010.
Additional disclosure surrounding the activity in Level 3 fair value measurement will also be effective for fiscal years beginning after December 15, 2010. Management has concluded that this will not have a material impact on the Series’ financial statements.
Security Transactions, Investment Income and Expenses
Security transactions are accounted for on trade date. Dividend income is recorded on the ex-dividend date, except that if the ex-dividend date has passed, certain dividends from foreign securities are recorded as soon as the Fund is informed of the ex-dividend date. Non-cash dividends, if any, are recorded at the fair market value of the securities received. Interest income, including amortization of premium and accretion of discounts using the effective interest method, is earned from settlement date and accrued daily.
Expenses are recorded on an accrual basis. Most expenses of the Fund can be attributed to a specific series. Expenses which cannot be directly attributed are apportioned among the series in the Fund in such a manner as deemed equitable by the Fund’s Board, taking into consideration, among other things, the nature and type of expense.
The Series uses the identified cost method for determining realized gain or loss on investments for both financial statement and federal income tax reporting purposes.
Federal Taxes
The Series’ policy is to comply with the provisions of the Internal Revenue Code applicable to regulated investment companies. The Series is not subject to federal income tax or excise tax to the extent that the Series distributes to shareholders each year its taxable income, including any net realized gains on investments, in accordance with requirements of the Internal Revenue Code. Accordingly, no provision for federal income tax or excise tax has been made in the financial statements.
Notes to Financial Statements (unaudited)
| 2. | SIGNIFICANT ACCOUNTING POLICIES (continued) |
Federal Taxes (continued)
Management evaluates its tax positions to determine if the tax positions taken meet the minimum recognition threshold in connection with accounting for uncertainties in income tax positions taken or expected to be taken for the purposes of measuring and recognizing tax liabilities in the financial statements. Recognition of tax benefits of an uncertain tax position is required only when the position is “more likely than not” to be sustained assuming examination by taxing authorities. At April 30, 2010, the Series has recorded no liability for net unrecognized tax benefits relating to uncertain income tax positions taken or expected to be taken in future tax returns.
The Series files income tax returns in the U.S. federal jurisdiction, various states and foreign jurisdictions, as required. No income tax returns are currently under investigation. The statute of limitations on the Series’ tax returns remains open for the years ended October 31, 2006 through October 31, 2009. The Fund is not aware of any tax positions for which it is reasonably possible that the total amounts of unrecognized tax benefits will significantly change in the next twelve months.
Additionally, based on the Fund’s understanding of the tax rules and rates related to income, gains and transactions for foreign jurisdictions in which it invests, the Series will provide for foreign taxes, and where appropriate, deferred foreign tax.
Distributions of Income and Gains
Distributions to shareholders of net investment income and net realized gains are made annually. An additional distribution may be necessary to avoid taxation of the Series. Distributions are recorded on the ex-dividend date.
Indemnifications
The Fund’s organizational documents provide former and current directors and officers with a limited indemnification against liabilities arising in connection with the performance of their duties to the Fund. In the normal course of business, the Fund may also enter into contracts that provide general indemnifications. The Fund’s maximum exposure under these arrangements is unknown as this would be dependent on future claims that may be made against the Fund. The risk of material loss from such claims is considered remote.
Other
The preparation of financial statements in conformity with accounting principles generally accepted in the United States of America requires management to make estimates and assumptions that affect the reported amounts of assets and liabilities and the disclosure of contingent assets and liabilities at the date of the financial statements and the reported amounts of income and expenses during the reporting period. Actual results could differ from those estimates.
| 3. | TRANSACTIONS WITH AFFILIATES |
The Fund has an Investment Advisory Agreement (the “Agreement”) with the Advisor, for which the Series pays a fee, computed daily and payable monthly, at an annual rate of 1.00% of the Series’ average daily net assets.
Under the Agreement, personnel of the Advisor provide the Series with advice and assistance in the choice of investments and the execution of securities transactions, and otherwise maintain the Series’ organization. The Advisor also provides the Fund with necessary office space and fund administration and support services. The salaries of all officers of the Fund (except a percentage of the Fund’s Chief Compliance Officer’s salary, which is paid by the Fund), and of all Directors who are “affiliated persons” of the Fund, or of the Advisor, and all personnel of the Fund, or of the Advisor, performing services relating to research, statistical and investment activities, are paid by the Advisor. Each “non-affiliated” Director receives an annual stipend, which is allocated among all the active series of the Fund. In addition, these Directors also receive a fee per Board meeting attended for each active series of the Fund plus a fee for each committee meeting attended.
Notes to Financial Statements (unaudited)
| 3. | TRANSACTIONS WITH AFFILIATES (continued) |
The Advisor has contractually agreed, until at least February 28, 2011, to waive its fee and, if necessary, pay other operating expenses of the Series in order to maintain total direct annual fund operating expenses for the Series at no more than 1.05% of average daily net assets each year. Accordingly, the Advisor waived fees of $123,843 for the six months ended April 30, 2010, which is included as a reduction of expenses on the Statement of Operations. The Advisor voluntarily waived additional fees of $759 for the six months ended April 30, 2010, which is also included as a reduction of expenses on the Statement of Operations. The Advisor is not eligible to recoup any expenses that have been waived or reimbursed in prior years.
Manning & Napier Investor Services, Inc., a registered broker-dealer affiliate of the Advisor, acts as distributor for the Fund’s shares. The services of Manning & Napier Investor Services, Inc. are provided at no additional cost to the Series.
For fund accounting and transfer agent services through November 7, 2009, the Fund paid the Advisor an annual fee of 0.055% of the Fund’s average daily net assets up to $4.5 billion, 0.03% of the Fund’s average daily net assets between $4.5 billion and $7.5 billion, and 0.02% of the Fund’s average daily net assets over $7.5 billion. Additionally, certain transaction and account-based fees and out-of-pocket expenses, including charges for reporting relating to the Fund’s compliance program, were charged. Expenses not directly attributable to a Series are allocated based on each Series’ relative net assets or number of accounts, depending on the expense. Prior to October 12, 2009 (for sub-accountant) and November 9, 2009 (for sub-transfer agent), the Advisor had and agreement with Citi Fund Services Ohio, Inc. (“Citi”) under which Citi served as sub-accountant and sub-transfer agent.
The Advisor has entered into agreements dated October 12, 2009 and November 9, 2009 with PNC Global Investment Servicing (“PNCGIS”) under which PNCGIS serves as sub-accountant services agent and sub-transfer agent, respectively. Effective November 7, 2009 under the amended master services agreement, the Fund pays the Advisor an annual fee of 0.0175% on the first $3 billion of average daily net assets (excluding Target Series); 0.015% on the next $3 billion of average daily net assets (excluding Target Series); and 0.01% of the average daily net assets in excess of $6 billion (excluding Target Series); plus a base fee of $25,500 per Series. Additionally, certain transaction-, account-, and cusip-based fees and out-of-pocket expenses, including charges for reporting relating to the Fund’s compliance program, are charged.
On February 2, 2010, The PNC Financial Services Group, Inc. (“PNC”), which serves as the Series’ sub-accountant services agent and sub-transfer agent, entered into a Stock Purchase Agreement (the “Stock Purchase Agreement”) with The Bank of New York Mellon Corporation (“BNY Mellon”), the Series’ custodian. Upon the terms and subject to the conditions set forth in the Stock Purchase Agreement, which has been approved by the board of directors of each company, PNC will sell to BNY Mellon (the “Stock Sale”) 100% of the issued and outstanding shares of PNC Global Investment Servicing Inc., an indirect, wholly-owned subsidiary of PNC. The Stock Sale is expected to close in the third quarter of 2010. Management has concluded that this will not have a material impact on the Series’ financial statements.
| 4. | PURCHASES AND SALES OF SECURITIES |
For the six months ended April 30, 2010, purchases and sales of securities, other than U.S. Government securities and short-term securities, were $417,336,551 and $227,707,632, respectively. There were no purchases or sales of U. S. Government securities.
Notes to Financial Statements (unaudited)
| 5. | CAPITAL STOCK TRANSACTIONS |
Transactions in shares of Equity Series were:
| | | | | | | | | | | | | | |
| | | For the Six Months | | | For the Year | |
| | | Ended 4/30/10 | | | Ended 10/31/09 | |
| | | Shares | | | Amount | | | Shares | | | Amount | |
Sold | | 18,697,959 | | | $ | 320,637,949 | | | 45,553,334 | | | $ | 605,942,070 | |
Reinvested | | 26,609 | | | | 443,305 | | | 81,554 | | | | 954,994 | |
Repurchased | | (7,863,278 | ) | | | (134,402,665 | ) | | (18,762,919 | ) | | | (240,941,209 | ) |
| | | | | | | | | | | | | | |
Total | | 10,861,290 | | | $ | 186,678,589 | | | 26,871,969 | | | $ | 365,955,855 | |
| | | | | | | | | | | | | | |
At April 30, 2010, the retirement plan of the Advisor and its affiliates owned 184,525 shares of the Series (0.2% of shares outstanding) valued at $3,362,041.
The Series may trade in instruments including written and purchased options, forward foreign currency exchange contracts and futures contracts and other derivatives in the normal course of investing activities to assist in managing exposure to various market risks. The Series may be subject to various elements of risk and may involve, to a varying degree, elements of risk in excess of the amounts recognized for financial statement purposes. These risks include: the risk that changes in the value of a derivative may not correlate perfectly with the underlying asset, rate or index, counterparty credit risk related to over the counter derivatives counterparties failure to perform under contract terms, liquidity risk related to the lack of a liquid market for these contracts allowing the fund to close out its position(s) and documentation risk relating to disagreement over contract terms. No such investments were held by the Series on April 30, 2010.
Investing in securities of foreign companies and foreign governments involves special risks and considerations not typically associated with investing in securities of domestic companies and the U.S. Government. These risks include revaluation of currencies and future adverse political and economic developments. Moreover, securities of foreign companies and foreign governments and their markets may be less liquid and their prices more volatile than those of comparable domestic companies and the U.S. Government.
| 8. | FEDERAL INCOME TAX INFORMATION |
The amount and characterization of certain income and capital gains to be distributed are determined in accordance with federal income tax regulations, which may differ from accounting principles generally accepted in the United States of America. These differences are primarily due to differing book and tax treatments in the timing of recognition of net investment income or gains and losses, including losses deferred due to wash sales. The Series may periodically make reclassifications among its capital accounts to reflect income and gains available for distribution (or available capital loss carryovers) under income tax regulations, without impacting the Series’ net asset value.Any such reclassifications are not reflected in the financial highlights.
The final determination of the tax character of current year distributions will be made at the conclusion of the fiscal year. The tax character of distributions paid for the year ended October 31, 2009 were as follows:
| | | | |
Ordinary income | | $2,526,440 | | |
Notes to Financial Statements (unaudited)
| 8. | FEDERAL INCOME TAX INFORMATION (continued) |
At October 31, 2009, the Series had a capital loss carryover of $79,507,620, available to the extent allowed by tax law to offset future net capital gain, if any, which will expire as follows:
| | | | | | |
| | Loss Carryover | | Expiration Date | | |
| | $36,496,456 | | October 31, 2016 | | |
| | $43,011,164 | | October 31, 2017 | | |
At April 30, 2010, the identified cost of investments for federal income tax purposes, the resulting gross unrealized appreciation and depreciation, and the net unrealized appreciation were as follows:
| | | | | | | |
Cost for federal income tax purposes | | | | $1,186,234,338 | | | |
Unrealized appreciation | | | | $ 237,909,376 | | | |
Unrealized depreciation | | | | (30,904,562 | ) | | |
| | | | | | | |
Net unrealized appreciation | | | | $ 207,004,814 | | | |
| | | | | | | |
There were no subsequent events that require recognition or disclosure. In preparing these financial statements, management of the Fund has evaluated events and transactions for potential recognition or disclosure through the date the financial statements were issued.
Renewal of Investment Advisory Agreement (unaudited)
At the Manning & Napier Fund, Inc. (the “Fund”) Board of Directors’ (the “Board”) meeting, held on December 7, 2009, the Investment Advisory Agreement (the “Agreement”) between the Fund and Manning & Napier Advisors, Inc. (the “Advisor”) was reviewed by the Board for renewal. In connection with the decision whether to renew the Agreement, a variety of material was prepared for and reviewed by the Board.
Representatives of the Advisor attended the meeting and presented additional oral and written information to the Board to assist the Board in its considerations. The discussion immediately below outlines the materials and information presented to the Board in connection with the Board’s 2009 Annual Review of the Agreement and the conclusions made by the Directors when determining to continue the Agreement.
| | • | | The Board considered the services provided by the Advisor under the Agreement including, among others: deciding what securities to purchase and sell for each Series; arranging for the purchase and sale of such securities by placing orders with broker-dealers; administering the affairs of the Fund (including the books and records of the Fund not maintained by third party service providers such as the custodian or sub-transfer agent); arranging for the insurance coverage for the Fund; and supervising the preparation of tax returns, SEC filings (including registration statements) and reports to shareholders for the Fund. The Board also considered the nature and quality of such services provided under the Agreement in light of the Advisor’s services provided to the Fund for 23 years. The Board discussed the quality of these services with representatives from the Advisor and concluded that the Advisor was performing its services to the Fund required under the Agreement in a reasonable manner. |
| | • | | The Board considered the investment performance of the various Series of the Fund. The investment performance for each Series was reviewed on a cumulative basis since inception and on a one year basis. In addition, annualized performance for the following time periods was considered: inception, three year, five year, ten year, and current market cycle. A market cycle includes periods of both rising and falling markets. Returns for established benchmark indices for each Series were provided for each time period. The Board noted that the various Series were competitive against their respective benchmarks and/or peer groups over various time periods, but in particular over the full market cycle periods relevant for the Series. In addition, the Board considered at the meeting (and considers on a quarterly basis) a peer group performance analysis consisting of Morningstar universes of mutual funds with similar investment objectives. The Board discussed the performance with representatives from the Advisor and concluded that the investment performance of each of the Fund’s Series was reasonable based on the Fund’s actual performance and comparative performance, especially performance over the current market cycle. |
| | • | | The Board considered the costs of the Advisor’s services and the profits of the Advisor as they relate to the Advisor’s services to the Fund under the Agreement. In reviewing the Advisor’s costs and profits, the Board discussed the Advisor’s revenues generated from the Fund (on both an actual and adjusted basis) and its expenses associated with providing the services under the Agreement. In addition, the Board reviewed the Advisor’s expenses associated with Fund activities outside of the Agreement (such as expense reimbursements pursuant to expense caps and payments made by the Advisor to third party platforms on which shares of the Fund are available for purchase). It was noted by representatives of the Advisor that 13 of the 26 active Series of the Fund are currently experiencing expenses above the capped expense ratios. After discussing the above costs and profits, the Board concluded that the Advisor’s profitability relating to its services provided under the Agreement was reasonable. |
| | • | | The Board considered the fees and expenses of the various Series of the Fund. The Advisor presented the advisory fees and total expenses for each Series, including the advisory fee adjusted for any expense waivers or reimbursements (either contractual or voluntary) paid by the Advisor. The advisory fees and expense ratios of each Series were compared to an average (on both a mean and median basis) of similar funds as disclosed on the Morningstar database. Representatives of the Advisor discussed with the Board the levels of its advisory |
Renewal of Investment Advisory Agreement (unaudited)
| | fee for each Series of the Fund and as compared to the median and mean advisory fees for similar funds as listed on Morningstar. Expense ratios for every Series, except the Global Fixed Income Series and the Target Series Class R and Class C, are currently below the median and mean for similar funds as listed on Morningstar. Based on their review of the information provided, the Board concluded that the fees and expenses of each Series of the Fund were reasonable on a comparative basis. |
| | • | | The Board also considered the other benefits the Advisor derives from its relationship with the Fund. Such other benefits include certain research products provided by soft dollars. Given the level of soft dollar transactions involving the Fund, the Board concluded that these additional benefits to the Advisor were reasonable. |
| | • | | In addition to the factors described above, the Board considered the Advisor’s personnel, investment strategies, policies and procedures relating to compliance with personal securities transactions, and reputation, expertise and resources in domestic and foreign financial markets. The Board concluded that these factors support the conclusion that the Advisor performs its services in a reasonable manner. |
| | • | | The Board did not consider economies of scale at this time because of the multiple uses of the Fund (for the Advisor’s discretionary investment account clients in addition to direct investors), the current profitability of the Advisor’s services to the Fund under the Agreement, and the overall size of the Fund complex. |
Based on the Board’s deliberations and their evaluation of the information described above, the Board, including a majority of Directors that are not “interested persons” as defined in the Investment Company Act of 1940, concluded that the compensation under the Agreement was fair and reasonable in light of the services and expenses and such other matters as the Directors considered to be relevant in the exercise of their reasonable judgment. Accordingly, the Board approved the renewal of the Agreement. In the course of their deliberations, the Directors did not identify any particular information that was all important or controlling.
Literature Requests (unaudited)
Proxy Voting Policies and Procedures
A description of the policies and procedures that the Fund uses to determine how to vote proxies relating to portfolio securities is available, without charge, upon request:
| | | | |
By phone | | 1-800-466-3863 | | |
On the Securities and Exchange | | | | |
Commission’s (SEC) web site | | http://www.sec.gov | | |
Proxy Voting Record
Information regarding how the Fund voted proxies relating to portfolio securities during the most recent 12-month period ended June 30th is available, without charge, upon request:
| | | | |
By phone | | 1-800-466-3863 | | |
On the SEC’s web site | | http://www.sec.gov | | |
Quarterly Portfolio Holdings
The Series’ complete schedule of portfolio holdings for the 1st and 3rd quarters of each fiscal year are provided on Form N-Q, and are available, without charge, upon request:
| | | | |
By phone | | 1-800-466-3863 | | |
On the SEC’s web site | | http://www.sec.gov | | |
The Series’ Form N-Q may be reviewed and copied at the SEC’s Public Reference Room in Washington, D.C. Information on the operation of the Public Reference Room may be obtained by calling 1-800-SEC-0330.
Prospectus and Statement of Additional Information (SAI)
The prospectus and SAI provide additional information about each Series, including charges, expenses and risks. These documents are available, without charge, upon request:
| | | | |
By phone | | 1-800-466-3863 | | |
On the SEC’s web site | | http://www.sec.gov | | |
On the Advisor’s web site | | http://www.manningnapieradvisors.com | | |
Additional information available at www.manningnapieradvisors.com
| 1. | Fund Holdings - Month-End |
| 2. | Fund Holdings - Quarter-End |
| 3. | Shareholder Report - Annual |
| 4. | Shareholder Report - Semi-Annual |

Shareholder Expense Example (unaudited)
As a shareholder of the Series, you may incur two types of costs: (1) transaction costs, including potential wire charges on redemptions and (2) ongoing costs, including management fees and other Series expenses. This example is intended to help you understand your ongoing costs (in dollars) of investing in the Series and to compare these costs with the ongoing costs of investing in other mutual funds.
The example is based on an investment of $1,000 invested at the beginning of the period and held for the entire period (November 1, 2009 to April 30, 2010).
Actual Expenses
The first line of the table below provides information about actual account values and actual expenses. You may use the information in this line, together with the amount you invested, to estimate the expenses that you paid over the period. Simply divide your account value by $1,000 (for example, an $8,600 account value divided by $1,000 = 8.6), then multiply the result by the number in the first line under the heading entitled “Expenses Paid During Period” to estimate the expenses you paid on your account during this period.
Hypothetical Example for Comparison Purposes
The second line of the table below provides information about hypothetical account values and hypothetical expenses based on the Series’ actual expense ratio and an assumed rate of return of 5% per year before expenses, which is not the Series’ actual return. The hypothetical account values and expenses may not be used to estimate the actual ending account balance or expenses you paid during the period. You may use this information to compare the ongoing costs of investing in the Series and other funds. To do so, compare this 5% hypothetical example with the 5% hypothetical examples that appear in the shareholder reports of the other funds.
Please note that the expenses shown in the table are meant to highlight your ongoing costs only and do not reflect any transaction costs. Therefore, the second line of the table is useful in comparing ongoing costs only, and will not help you determine the relative total costs of owning different funds. In addition, if these transaction costs were included, your costs would have been higher.
| | | | | | |
| | | Beginning
Account Value
11/1/09 | | Ending
Account Value
4/30/10 | | Expenses Paid
During Period*
11/1/09-4/30/10 |
Actual | | $1,000.00 | | $1,159.50 | | $6.43 |
Hypothetical
(5% return before expenses) | | $1,000.00 | | $1,018.84 | | $6.01 |
*Expenses are equal to the Series’ annualized expense ratio (for the six-month period) of 1.20%, multiplied by the average account value over the period, multiplied by 181/365 (to reflect the one-half year period). Expenses are based on the most recent fiscal half year. The Series’ total return would have been lower had certain expenses not been waived during the period.
Portfolio Composition as of April 30, 2010 (unaudited)
Investment Portfolio - April 30, 2010 (unaudited)
| | | | | | | |
| | | Shares | | Value (Note 2) | | |
| | | |
COMMON STOCKS - 94.0% | | | | | | | |
| | | |
Consumer Discretionary - 13.5% | | | | | | | |
Automobiles - 0.8% | | | | | | | |
Bayerische Motoren Werke AG (BMW) (Germany) | | 6,760 | | $ | 334,193 | | |
| | | | | | | |
Hotels, Restaurants & Leisure - 2.0% | | | | | | | |
Carnival Corp. | | 12,560 | | | 523,752 | | |
International Game Technology | | 13,560 | | | 285,845 | | |
| | | | | | | |
| | | | | 809,597 | | |
| | | | | | | |
Media - 7.6% | | | | | | | |
Discovery Communications, Inc. - Class A* | | 13,240 | | | 512,388 | | |
Reed Elsevier plc (United Kingdom) | | 52,560 | | | 413,760 | | |
Time Warner, Inc. | | 17,530 | | | 579,892 | | |
The Walt Disney Co. | | 29,030 | | | 1,069,465 | | |
The Washington Post Co. - Class B | | 1,010 | | | 512,232 | | |
| | | | | | | |
| | | | | 3,087,737 | | |
| | | | | | | |
Specialty Retail - 3.1% | | | | | | | |
Dick’s Sporting Goods, Inc.* | | 17,310 | | | 503,894 | | |
The Home Depot, Inc. | | 3,520 | | | 124,080 | | |
Lowe’s Companies, Inc. | | 5,430 | | | 147,262 | | |
The Sherwin-Williams Co. | | 6,150 | | | 480,130 | | |
| | | | | | | |
| | | | | 1,255,366 | | |
| | | | | | | |
Total Consumer Discretionary | | | | | 5,486,893 | | |
| | | | | | | |
Consumer Staples - 7.4% | | | | | | | |
Food & Staples Retailing - 1.9% | | | | | | | |
The Kroger Co. | | 19,240 | | | 427,705 | | |
Safeway, Inc. | | 15,300 | | | 361,080 | | |
| | | | | | | |
| | | | | 788,785 | | |
| | | | | | | |
Food Products - 5.5% | | | | | | | |
General Mills, Inc. | | 6,090 | | | 433,486 | | |
Kellogg Co. | | 8,150 | | | 447,761 | | |
Nestle S.A. (Switzerland) | | 15,860 | | | 778,889 | | |
Unilever plc - ADR (United Kingdom) | | 19,000 | | | 571,900 | | |
| | | | | | | |
| | | | | 2,232,036 | | |
| | | | | | | |
Total Consumer Staples | | | | | 3,020,821 | | |
| | | | | | | |
Energy - 8.0% | | | | | | | |
Energy Equipment & Services - 4.7% | | | | | | | |
Baker Hughes, Inc. | | 10,490 | | | 521,982 | | |
National Oilwell Varco, Inc. | | 2,752 | | | 121,171 | | |
Schlumberger Ltd. | | 9,060 | | | 647,065 | | |
Weatherford International Ltd. (Switzerland)* | | 34,540 | | | 625,519 | | |
| | | | | | | |
| | | | | 1,915,737 | | |
| | | | | | | |
| | | | |
| | The accompanying notes are an integral part of the financial statements. | | 3 |
Investment Portfolio - April 30, 2010 (unaudited)
| | | | | | | |
| | | Shares | | Value (Note 2) | | |
| | | |
COMMON STOCKS (continued) | | | | | | | |
| | | |
Energy (continued) | | | | | | | |
Oil, Gas & Consumable Fuels - 3.3% | | | | | | | |
Cameco Corp. (Canada) | | 12,760 | | $ | 314,024 | | |
Hess Corp. | | 14,680 | | | 932,914 | | |
Uranium One, Inc. (Canada)* | | 29,880 | | | 75,597 | | |
| | | | | | | |
| | | | | 1,322,535 | | |
| | | | | | | |
Total Energy | | | | | 3,238,272 | | |
| | | | | | | |
Financials - 10.4% | | | | | | | |
Capital Markets - 4.5% | | | | | | | |
The Bank of New York Mellon Corp.1 | | 29,770 | | | 926,740 | | |
Federated Investors, Inc. - Class B | | 17,430 | | | 420,411 | | |
Northern Trust Corp. | | 8,360 | | | 459,633 | | |
| | | | | | | |
| | | | | 1,806,784 | | |
| | | | | | | |
Commercial Banks - 1.1% | | | | | | | |
HSBC Holdings plc (United Kingdom) | | 44,630 | | | 456,154 | | |
| | | | | | | |
Consumer Finance - 2.1% | | | | | | | |
American Express Co. | | 18,390 | | | 848,147 | | |
| | | | | | | |
Diversified Financial Services - 1.1% | | | | | | | |
Deutsche Boerse AG (Germany) | | 5,620 | | | 438,041 | | |
| | | | | | | |
Insurance - 1.6% | | | | | | | |
The Progressive Corp. | | 33,300 | | | 668,997 | | |
| | | | | | | |
Total Financials | | | | | 4,218,123 | | |
| | | | | | | |
Health Care - 15.5% | | | | | | | |
Biotechnology - 1.8% | | | | | | | |
Genzyme Corp.* | | 10,520 | | | 560,085 | | |
Grifols S.A. (Spain) | | 15,090 | | | 191,875 | | |
| | | | | | | |
| | | | | 751,960 | | |
| | | | | | | |
Health Care Equipment & Supplies - 6.3% | | | | | | | |
Becton, Dickinson and Co. | | 11,020 | | | 841,597 | | |
Boston Scientific Corp.* | | 80,800 | | | 555,904 | | |
Gen-Probe, Inc.* | | 8,600 | | | 407,554 | | |
Inverness Medical Innovations, Inc.* | | 19,350 | | | 769,743 | | |
| | | | | | | |
| | | | | 2,574,798 | | |
| | | | | | | |
Health Care Providers & Services - 1.0% | | | | | | | |
Quest Diagnostics, Inc. | | 7,170 | | | 409,837 | | |
| | | | | | | |
Health Care Technology - 1.2% | | | | | | | |
Cerner Corp.* | | 5,570 | | | 472,949 | | |
| | | | | | | |
Life Sciences Tools & Services - 2.6% | | | | | | | |
Lonza Group AG (Switzerland) | | 2,430 | | | 190,805 | | |
PerkinElmer, Inc. | | 11,080 | | | 277,554 | | |
| | | | |
| 4 | | The accompanying notes are an integral part of the financial statements. | | |
Investment Portfolio - April 30, 2010 (unaudited)
| | | | | | | |
| | | Shares | | Value (Note 2) | | |
| | | |
COMMON STOCKS (continued) | | | | | | | |
| | | |
Health Care (continued) | | | | | | | |
Life Sciences Tools & Services (continued) | | | | | | | |
Thermo Fisher Scientific, Inc.* | | 10,570 | | $ | 584,310 | | |
| | | | | | | |
| | | | | 1,052,669 | | |
| | | | | | | |
Pharmaceuticals - 2.6% | | | | | | | |
Johnson & Johnson | | 12,700 | | | 816,610 | | |
Novartis AG - ADR (Switzerland) | | 4,430 | | | 225,265 | | |
| | | | | | | |
| | | | | 1,041,875 | | |
| | | | | | | |
Total Health Care | | | | | 6,304,088 | | |
| | | | | | | |
Industrials - 13.4% | | | | | | | |
Aerospace & Defense - 1.1% | | | | | | | |
The Boeing Co. | | 6,410 | | | 464,276 | | |
| | | | | | | |
Air Freight & Logistics - 2.9% | | | | | | | |
FedEx Corp. | | 4,690 | | | 422,147 | | |
United Parcel Service, Inc. - Class B | | 10,700 | | | 739,798 | | |
| | | | | | | |
| | | | | 1,161,945 | | |
| | | | | | | |
Airlines - 4.2% | | | | | | | |
Ryanair Holdings plc - ADR (Ireland)* | | 16,750 | | | 471,680 | | |
Southwest Airlines Co. | | 94,640 | | | 1,247,355 | | |
| | | | | | | |
| | | | | 1,719,035 | | |
| | | | | | | |
Commercial Services & Supplies - 1.1% | | | | | | | |
Waste Management, Inc. | | 12,640 | | | 438,355 | | |
| | | | | | | |
Machinery - 1.3% | | | | | | | |
Pall Corp. | | 13,630 | | | 531,434 | | |
| | | | | | | |
Professional Services - 1.8% | | | | | | | |
Adecco S.A. (Switzerland) | | 12,320 | | | 726,962 | | |
| | | | | | | |
Road & Rail - 1.0% | | | | | | | |
Heartland Express, Inc. | | 8,360 | | | 138,274 | | |
J.B. Hunt Transport Services, Inc. | | 3,030 | | | 111,686 | | |
Knight Transportation, Inc. | | 6,460 | | | 137,534 | | |
| | | | | | | |
| | | | | 387,494 | | |
| | | | | | | |
Total Industrials | | | | | 5,429,501 | | |
| | | | | | | |
Information Technology - 21.1% | | | | | | | |
Communications Equipment - 3.3% | | | | | | | |
Cisco Systems, Inc.* | | 31,750 | | | 854,710 | | |
Juniper Networks, Inc.* | | 8,360 | | | 237,507 | | |
QUALCOMM, Inc. | | 6,570 | | | 254,522 | | |
| | | | | | | |
| | | | | 1,346,739 | | |
| | | | | | | |
| | | | |
| | The accompanying notes are an integral part of the financial statements. | | 5 |
Investment Portfolio - April 30, 2010 (unaudited)
| | | | | | | |
| | | Shares | | Value (Note 2) | | |
| | | |
COMMON STOCKS (continued) | | | | | | | |
| | | |
Information Technology (continued) | | | | | | | |
Computers & Peripherals - 2.1% | | | | | | | |
EMC Corp.* | | 45,920 | | $ | 872,939 | | |
| | | | | | | |
Internet Software & Services - 3.2% | | | | | | | |
Google, Inc. - Class A* | | 2,440 | | | 1,282,074 | | |
| | | | | | | |
IT Services - 5.8% | | | | | | | |
Accenture plc - Class A (Ireland) | | 10,850 | | | 473,494 | | |
Automatic Data Processing, Inc. | | 12,350 | | | 535,496 | | |
Paychex, Inc. | | 19,500 | | | 596,700 | | |
The Western Union Co. | | 40,430 | | | 737,848 | | |
| | | | | | | |
| | | | | 2,343,538 | | |
| | | | | | | |
Semiconductors & Semiconductor Equipment - 1.9% | | | | | | | |
Advantest Corp. (Japan) | | 7,500 | | | 195,694 | | |
KLA-Tencor Corp. | | 6,690 | | | 227,861 | | |
Lam Research Corp.* | | 4,130 | | | 167,472 | | |
Tokyo Electron Ltd. (Japan) | | 2,800 | | | 185,107 | | |
| | | | | | | |
| | | | | 776,134 | | |
| | | | | | | |
Software - 4.8% | | | | | | | |
Autodesk, Inc.* | | 18,200 | | | 618,982 | | |
Microsoft Corp. | | 12,820 | | | 391,523 | | |
Salesforce.com, Inc.* | | 4,510 | | | 386,056 | | |
SAP AG - ADR (Germany) | | 11,510 | | | 546,149 | | |
| | | | | | | |
| | | | | 1,942,710 | | |
| | | | | | | |
Total Information Technology | | | | | 8,564,134 | | |
| | | | | | | |
Materials - 3.0% | | | | | | | |
Chemicals - 2.2% | | | | | | | |
Monsanto Co. | | 14,500 | | | 914,370 | | |
| | | | | | | |
Construction Materials - 0.8% | | | | | | | |
Martin Marietta Materials, Inc. | | 3,200 | | | 306,816 | | |
| | | | | | | |
Total Materials | | | | | 1,221,186 | | |
| | | | | | | |
Telecommunication Services - 1.7% | | | | | | | |
Wireless Telecommunication Services - 1.7% | | | | | | | |
American Tower Corp. - Class A* | | 5,120 | | | 208,947 | | |
Crown Castle International Corp.* | | 12,340 | | | 467,069 | | |
| | | | | | | |
Total Telecommunication Services | | | | | 676,016 | | |
| | | | | | | |
TOTAL COMMON STOCKS | | | | | | | |
(Identified Cost $31,199,939) | | | | | 38,159,034 | | |
| | | | | | | |
| | | | |
| 6 | | The accompanying notes are an integral part of the financial statements. | | |
Investment Portfolio - April 30, 2010 (unaudited)
| | | | | | | | |
| | | Shares | | Value (Note 2) | | | |
| | | |
SHORT-TERM INVESTMENTS - 6.5% | | | | | | | | |
| | | |
Dreyfus Cash Management, Inc. - Institutional Shares2, 0.09% | | | | | | | | |
(Identified Cost $2,639,452) | | 2,639,452 | | $ | 2,639,452 | | | |
| | | | | | | | |
TOTAL INVESTMENTS - 100.5% | | | | | | | | |
(Identified Cost $33,839,391) | | | | | 40,798,486 | | | |
LIABILITIES, LESS OTHER ASSETS - (0.5%) | | | | | (193,404 | ) | | |
| | | | | | | | |
NET ASSETS - 100% | | | | $ | 40,605,082 | | | |
| | | | | | | | |
ADR - American Depository Receipt
*Non-income producing security
1The Bank of New York Mellon Corp. is the Series’ custodian.
2Rate shown is the current yield as of April 30, 2010.
| | | | |
| | The accompanying notes are an integral part of the financial statements. | | 7 |
Statement of Assets and Liabilities (unaudited)
April 30, 2010
| | | | |
ASSETS: | | | | |
| |
Investments, at value (identified cost $33,839,391) (Note 2) | | $ | 40,798,486 | |
Cash | | | 120 | |
Receivable for fund shares sold | | | 394,104 | |
Receivable for securities sold | | | 246,334 | |
Dividends receivable | | | 35,649 | |
Foreign tax reclaims receivable | | | 16,495 | |
| | | | |
| |
TOTAL ASSETS | | | 41,491,188 | |
| | | | |
| |
LIABILITIES: | | | | |
| |
Accrued management fees (Note 3) | | | 26,733 | |
Accrued fund accounting and administration fees (Note 3) | | | 2,093 | |
Accrued Chief Compliance Officer service fees (Note 3) | | | 667 | |
Accrued transfer agent fees (Note 3) | | | 594 | |
Payable for securities purchased | | | 804,931 | |
Payable for fund shares repurchased | | | 35,807 | |
Other payables and accrued expenses | | | 15,281 | |
| | | | |
| |
TOTAL LIABILITIES | | | 886,106 | |
| | | | |
| |
TOTAL NET ASSETS | | $ | 40,605,082 | |
| | | | |
| |
NET ASSETS CONSIST OF: | | | | |
| |
Capital stock | | $ | 16,455 | |
Additional paid-in-capital | | | 37,588,646 | |
Undistributed net investment income | | | 44,223 | |
Accumulated net realized loss on investments, foreign currency and translation of other assets and liabilities | | | (4,003,674 | ) |
Net unrealized appreciation on investments, foreign currency and translation of other assets and liabilities | | | 6,959,432 | |
| | | | |
| |
TOTAL NET ASSETS | | $ | 40,605,082 | |
| | | | |
| |
NET ASSET VALUE, OFFERING PRICE AND REDEMPTION PRICE PER SHARE - CLASS A ($40,605,082/1,645,542 shares) | | $ | 24.68 | |
| | | | |
| | | | |
| 8 | | The accompanying notes are an integral part of the financial statements. | | |
Statement of Operations (unaudited)
For the Six Months Ended April 30, 2010
| | | | |
INVESTMENT INCOME: | | | | |
| |
Dividends (net of foreign taxes withheld, $7,488) | | $ | 245,971 | |
Interest | | | 25 | |
| | | | |
| |
Total Investment Income | | | 245,996 | |
| | | | |
| |
EXPENSES: | | | | |
| |
Management fees (Note 3) | | | 163,732 | |
Fund accounting and administration fees (Note 3) | | | 16,354 | |
Directors’ fees (Note 3) | | | 6,373 | |
Transfer agent fees (Note 3) | | | 3,878 | |
Chief Compliance Officer service fees (Note 3) | | | 1,700 | |
Audit fees | | | 15,359 | |
Registration and filing fees | | | 10,201 | |
Custodian fees | | | 1,861 | |
Miscellaneous | | | 4,058 | |
| | | | |
| |
Total Expenses | | | 223,516 | |
Less reduction of expenses (Note 3) | | | (27,038 | ) |
| | | | |
| |
Net Expenses | | | 196,478 | |
| | | | |
| |
NET INVESTMENT INCOME | | | 49,518 | |
| | | | |
| |
REALIZED AND UNREALIZED GAIN (LOSS) ON INVESTMENTS AND FOREIGN CURRENCY: | | | | |
| |
Net realized gain (loss) on- | | | | |
Investments | | | 674,595 | |
Foreign currency and translation of other assets and liabilities | | | (201 | ) |
| | | | |
| |
| | | 674,394 | |
| | | | |
Net change in unrealized appreciation (depreciation) on- | | | | |
Investments | | | 4,002,538 | |
Foreign currency and translation of other assets and liabilities | | | (566 | ) |
| | | | |
| |
| | | 4,001,972 | |
| | | | |
| |
NET REALIZED AND UNREALIZED GAIN (LOSS) ON INVESTMENTS AND FOREIGN CURRENCY | | | 4,676,366 | |
| | | | |
| |
NET INCREASE IN NET ASSETS RESULTING FROM OPERATIONS | | $ | 4,725,884 | |
| | | | |
| | | | |
| | The accompanying notes are an integral part of the financial statements. | | 9 |
Statements of Changes in Net Assets
| | | | | | | | |
| | | For the Six Months Ended
4/30/10
(unaudited) | | | For the Year Ended 10/31/09 | |
INCREASE (DECREASE) IN NET ASSETS: | | | | | | | | |
| | |
OPERATIONS: | | | | | | | | |
| | |
Net investment income | | $ | 49,518 | | | $ | 65,162 | |
Net realized gain (loss) on investments and foreign currency | | | 674,394 | | | | (1,837,316 | ) |
Net change in unrealized appreciation (depreciation) on investments and foreign currency | | | 4,001,972 | | | | 6,428,424 | |
| | | | | | | | |
| | |
Net increase from operations | | | 4,725,884 | | | | 4,656,270 | |
| | | | | | | | |
| | |
DISTRIBUTIONS TO SHAREHOLDERS (Note 8): | | | | | | | | |
| | |
From net investment income | | | (50,092 | ) | | | (99,078 | ) |
| | | | | | | | |
| | |
CAPITAL STOCK ISSUED AND REPURCHASED: | | | | | | | | |
| | |
Net increase from capital share transactions (Note 5) | | | 6,670,415 | | | | 9,171,810 | |
| | | | | | | | |
| | |
Net increase in net assets | | | 11,346,207 | | | | 13,729,002 | |
| | |
NET ASSETS: | | | | | | | | |
| | |
Beginning of period | | | 29,258,875 | | | | 15,529,873 | |
| | | | | | | | |
| | |
End of period (including undistributed net investment income of $44,223 and $44,797, respectively) | | $ | 40,605,082 | | | $ | 29,258,875 | |
| | | | | | | | |
| | | | |
| 10 | | The accompanying notes are an integral part of the financial statements. | | |
Financial Highlights
| | | | | | | | | | | | | |
| | | | | | |
| | | For the Six | | | | | | | | | | | |
| | | Months Ended | | | | | | | | | | | |
| | | 4/30/10 | | | | | For the Years Ended | | |
| | | (unaudited) | | 10/31/09 | | | 10/31/08 | | 10/31/07 | | 10/31/06 | | 10/31/05 |
Per share data (for a share outstanding throughout each period): | | | | | | | | | | | | | |
Net asset value - Beginning of period | | $21.32 | | $18.26 | | | $28.44 | | $27.01 | | $25.60 | | $23.51 |
| | | | | | | | | | | | | |
Income (loss) from investment operations: | | | | | | | | | | | | | |
Net investment income | | 0.041 | | 0.06 | 1 | | 0.12 | | 0.08 | | 0.13 | | 0.06 |
Net realized and unrealized gain (loss) on investments | | 3.36 | | 3.11 | | | (9.42) | | 3.44 | | 4.41 | | 3.36 |
| | | | | | | | | | | | | |
Total from investment operations | | 3.40 | | 3.17 | | | (9.30) | | 3.52 | | 4.54 | | 3.42 |
| | | | | | | | | | | | | |
Less distributions to shareholders: | | | | | | | | | | | | | |
From net investment income | | (0.04) | | (0.11) | | | (0.09) | | (0.14) | | (0.06) | | (0.02) |
From net realized gain on investments | | — | | — | | | (0.79) | | (1.95) | | (3.07) | | (1.31) |
| | | | | | | | | | | | | |
Total distributions to shareholders | | (0.04) | | (0.11) | | | (0.88) | | (2.09) | | (3.13) | | (1.33) |
| | | | | | | | | | | | | |
Net asset value - End of period | | $24.68 | | $21.32 | | | $18.26 | | $28.44 | | $27.01 | | $25.60 |
| | | | | | | | | | | | | |
Net assets - End of period | | | | | | | | | | | | | |
(000’s omitted) | | $40,605 | | $29,259 | | | $15,530 | | $25,695 | | $7,585 | | $6,886 |
| | | | | | | | | | | | | |
Total return2 | | 15.95% | | 17.57% | | | (33.62%) | | 13.65% | | 20.01% | | 14.96% |
Ratios (to average net assets)/ | | | | | | | | | | | | | |
Supplemental Data: | | | | | | | | | | | | | |
Expenses* | | 1.20%3 | | 1.20% | | | 1.20% | | 1.20% | | 1.20% | | 1.20% |
Net investment income | | 0.30%3 | | 0.31% | | | 0.44% | | 0.38% | | 0.54% | | 0.23% |
Portfolio turnover | | 22% | | 48% | | | 96% | | 65% | | 61% | | 68% |
|
* The investment advisor did not impose all of its management fees, CCO fees, fund accounting and transfer agent fees, and other fees in some periods and in some periods paid a portion of the Series’ expenses. If these expenses had been incurred by the Series, the expense ratio (to average net assets) would have been increased by the following amounts: |
| | | | | | |
| | 0.17%3 | | 0.24% | | | 0.20% | | 0.25% | | 0.78% | | 0.82% |
1Calculated based on average shares outstanding during the periods.
2Represents aggregate total return for the periods indicated, and assumes reinvestment of all distributions. Total return would have been lower had certain expenses not been waived or reimbursed during the periods. Periods less than one year are not annualized.
3Annualized.
| | | | |
| | The accompanying notes are an integral part of the financial statements. | | 11 |
Notes to Financial Statements (unaudited)
Tax Managed Series (the “Series”) is a no-load diversified series of Manning & Napier Fund, Inc. (the “Fund”). The Fund is organized in Maryland and is registered under the Investment Company Act of 1940, as amended, as an open-end management investment company.
The Series’ investment objective is to maximize long-term growth while attempting to minimize the impact of taxes on the total return earned by shareholders.
The Series is authorized to issue five classes of shares (Class A, B, D, E and Z). Currently, only Class A shares have been issued. Each class of shares is substantially the same, except that class specific distribution and shareholder servicing expenses are borne by the specific class of shares to which they relate.
The Fund’s Advisor is Manning & Napier Advisors, Inc. (the “Advisor”). Shares of the Series are offered to investors and employees of the Advisor and its affiliates. The total authorized capital stock of the Fund consists of 10.0 billion shares of common stock each having a par value of $0.01. As of April 30, 2010, 6.2 billion shares have been designated in total among 29 series, of which 87.5 million have been designated as Tax Managed Series Class A common stock.
| 2. | SIGNIFICANT ACCOUNTING POLICIES |
Security Valuation
Portfolio securities, including domestic equities, foreign equities, warrants and options, listed on an exchange other than the NASDAQ National Market System are valued at the latest quoted sales price of the exchange on which the security is primarily traded. Securities not traded on valuation date or securities not listed on an exchange are valued at the latest quoted bid price provided by the Fund’s pricing service. Securities listed on the NASDAQ National Market System are valued in accordance with the NASDAQ Official Closing Price.
Short-term investments that mature in sixty days or less are valued at amortized cost, which approximates market value. Investments in open-end investment companies are valued at their net asset value per share on valuation date.
Volume and level of activity in established markets for an asset or liability are evaluated to determine whether recent transactions and quoted prices are determinative of fair value. Where there have been significant decreases in volume and level of activity, further analysis and adjustment may be necessary to estimate fair value. The Series measures fair value in these instances by the use of inputs and valuation techniques which may be based upon current market prices of securities that are comparable in coupon, rating, maturity and industry and/or expectation of future cash flows. As a result of trading in relatively thin markets and/or markets that experience significant volatility, the prices used by the Series to value these securities may differ from the value that would be realized if these securities were sold, and the differences could be material.
Securities for which representative valuations or prices are not available from the Fund’s pricing service may be valued at fair value. Due to the inherent uncertainty of valuations of such securities, the fair value may differ significantly from the values that would have been used had a ready market for such securities existed. If trading or events occurring after the close of the principal market in which securities are traded are expected to materially affect the value of those securities, then they may be valued at their fair value, taking this trading or these events into account. Fair value is determined in good faith by the Advisor under procedures approved by and under the general supervision and responsibility of the Fund’s Board of Directors (the “Board”).
Various inputs are used in determining the value of the Series’ assets or liabilities carried at market value. These inputs are summarized in three broad levels. Level 1 includes quoted prices in active markets for identical assets and liabilities. Level 2 includes other significant observable inputs (including quoted prices for similar securities,
Notes to Financial Statements (unaudited)
| 2. | SIGNIFICANT ACCOUNTING POLICIES (continued) |
Security Valuation (continued)
interest rates, prepayment speeds, credit risk, etc.). Level 3 includes significant unobservable inputs (including the Series’ own assumptions in determining the fair value of investments). The inputs or methodology used for valuing securities are not necessarily an indication of the risk associated with investing in those securities.
The following is a summary of the valuation levels used for major security types as of April 30, 2010 in valuing the Series’ assets or liabilities carried at market value:
| | | | | | | | | | | | |
| Description | | 4/30/10 | | Level 1 | | Level 2 | | Level 3 |
Equity securities* | | $ | 38,159,034 | | $ | 38,159,034 | | $ | — | | $ | — |
Preferred securities | | | — | | | — | | | — | | | — |
Debt securities | | | — | | | — | | | — | | | — |
Mutual funds | | | 2,639,452 | | | 2,639,452 | | | — | | | — |
Other financial
instruments** | | | — | | | — | | | — | | | — |
| | | | | | | | | | | | |
Total | | $ | 40,798,486 | | $ | 40,798,486 | | $ | — | | $ | — |
| | | | | | | | | | | | |
*Includes common stock, warrants and rights. Please see the Investment Portfolio for industry classification.
**Other financial instruments are derivative instruments not reflected in the Investment Portfolio, such as futures, forwards and swap contracts, which are valued at the unrealized appreciation/ depreciation on the instrument. As of April 30, 2010, the Series did not hold any derivative instruments.
There were no Level 3 securities held by the Series as of October 31, 2009 or April 30, 2010.
The Fund’s policy is to recognize transfers in and transfers out of the valuation levels as of the end of the reporting period. There were no significant transfers between Level 1 and Level 2 as of April 30, 2010.
Additional disclosure surrounding the activity in Level 3 fair value measurement will also be effective for fiscal years beginning after December 15, 2010. Management has concluded that this will not have a material impact on the Series’ financial statements.
Security Transactions, Investment Income and Expenses
Security transactions are accounted for on trade date. Dividend income is recorded on the ex-dividend date, except that if the ex-dividend date has passed, certain dividends from foreign securities are recorded as soon as the Fund is informed of the ex-dividend date. Non-cash dividends, if any, are recorded at the fair market value of the securities received. Interest income, including amortization of premium and accretion of discounts using the effective interest method, is earned from settlement date and accrued daily.
Expenses are recorded on an accrual basis. Most expenses of the Fund can be attributed to a specific series. Expenses which cannot be directly attributed are apportioned among the series in the Fund in such a manner as deemed equitable by the Fund’s Board, taking into consideration, among other things, the nature and type of expense.
The Series uses the identified cost method for determining realized gain or loss on investments for both financial statement and federal income tax reporting purposes.
Foreign Currency Translation
The books and records of the Series are maintained in U.S. dollars. Foreign currencies, investments and other assets and liabilities are translated into U.S. dollars at the current exchange rates. Purchases and sales of investment securities and income and expenses are translated on the respective dates of such transactions. The Series does
Notes to Financial Statements (unaudited)
| 2. | SIGNIFICANT ACCOUNTING POLICIES (continued) |
Foreign Currency Translation (continued)
not isolate realized and unrealized gains and losses attributable to changes in the exchange rates from gains and losses that arise from changes in the market value of investments. Such fluctuations are included with net realized and unrealized gain or loss on investments. Net realized foreign currency gains and losses represent foreign currency gains and losses between trade date and settlement date on securities transactions, gains and losses on disposition of foreign currencies and the difference between the amount of income and foreign withholding taxes recorded on the books of the Series and the amounts actually received or paid.
Federal Taxes
The Series’ policy is to comply with the provisions of the Internal Revenue Code applicable to regulated investment companies. The Series is not subject to federal income tax or excise tax to the extent that the Series distributes to shareholders each year its taxable income, including any net realized gains on investments, in accordance with requirements of the Internal Revenue Code. Accordingly, no provision for federal income tax or excise tax has been made in the financial statements.
Management evaluates its tax positions to determine if the tax positions taken meet the minimum recognition threshold in connection with accounting for uncertainties in income tax positions taken or expected to be taken for the purposes of measuring and recognizing tax liabilities in the financial statements. Recognition of tax benefits of an uncertain tax position is required only when the position is “more likely than not” to be sustained assuming examination by taxing authorities. At April 30, 2010, the Series has recorded no liability for net unrecognized tax benefits relating to uncertain income tax positions taken or expected to be taken in future tax returns.
The Series files income tax returns in the U.S. federal jurisdiction, various states and foreign jurisdictions, as required. No income tax returns are currently under investigation. The statute of limitations on the Series’ tax returns remains open for the years ended October 31, 2006 through October 31, 2009. The Fund is not aware of any tax positions for which it is reasonably possible that the total amounts of unrecognized tax benefits will significantly change in the next twelve months.
Additionally, based on the Fund’s understanding of the tax rules and rates related to income, gains and transactions for foreign jurisdictions in which it invests, the Series will provide for foreign taxes, and where appropriate, deferred foreign tax.
Distributions of Income and Gains
Distributions to shareholders of net investment income and net realized gains are made annually. An additional distribution may be necessary to avoid taxation of the Series. Distributions are recorded on the ex-dividend date.
Indemnifications
The Fund’s organizational documents provide former and current directors and officers with a limited indemnification against liabilities arising in connection with the performance of their duties to the Fund. In the normal course of business, the Fund may also enter into contracts that provide general indemnifications. The Fund’s maximum exposure under these arrangements is unknown as this would be dependent on future claims that may be made against the Fund. The risk of material loss from such claims is considered remote.
Other
The preparation of financial statements in conformity with accounting principles generally accepted in the United States of America requires management to make estimates and assumptions that affect the reported amounts of assets and liabilities and the disclosure of contingent assets and liabilities at the date of the financial statements and the reported amounts of income and expenses during the reporting period. Actual results could differ from those estimates.
Notes to Financial Statements (unaudited)
| 3. | TRANSACTIONS WITH AFFILIATES |
The Fund has an Investment Advisory Agreement (the “Agreement”) with the Advisor, for which the Series pays a fee, computed daily and payable monthly, at an annual rate of 1.00% of the Series’ average daily net assets.
Under the Agreement, personnel of the Advisor provide the Series with advice and assistance in the choice of investments and the execution of securities transactions, and otherwise maintain the Series’ organization. The Advisor also provides the Fund with necessary office space and fund administration and support services. The salaries of all officers of the Fund (except a percentage of the Fund’s Chief Compliance Officer’s salary, which is paid by the Fund), and of all Directors who are “affiliated persons” of the Fund, or of the Advisor, and all personnel of the Fund, or of the Advisor, performing services relating to research, statistical and investment activities, are paid by the Advisor. Each “non-affiliated” Director receives an annual stipend, which is allocated among all the active series of the Fund. In addition, these Directors also receive a fee per Board meeting attended for each active series of the Fund plus a fee for each committee meeting attended.
The Advisor has contractually agreed, until at least February 28, 2011, to waive its fee and, if necessary, pay other operating expenses of the Series in order to maintain total direct annual fund operating expenses for the Class A Series at no more than 1.20% of average daily net assets each year. Accordingly, the Advisor waived fees of $26,280 for the six months ended April 30, 2010, which is included as a reduction of expenses on the Statement of Operations. The Advisor voluntarily waived additional fees of $758 for the six months ended April 30, 2010, which is also included as a reduction of expenses on the Statement of Operations. The Advisor is not eligible to recoup any expenses that have been waived or reimbursed in prior years.
Manning & Napier Investor Services, Inc., a registered broker-dealer affiliate of the Advisor, acts as distributor for the Fund’s shares. The services of Manning & Napier Investor Services, Inc. are provided at no additional cost to the Series.
For fund accounting and transfer agent services through November 7, 2009, the Fund paid the Advisor an annual fee of 0.055% of the Fund’s average daily net assets up to $4.5 billion, 0.03% of the Fund’s average daily net assets between $4.5 billion and $7.5 billion, and 0.02% of the Fund’s average daily net assets over $7.5 billion. Additionally, certain transaction and account-based fees and out-of-pocket expenses, including charges for reporting relating to the Fund’s compliance program, were charged. Expenses not directly attributable to a Series are allocated based on each Series’ relative net assets or number of accounts, depending on the expense. Prior to October 12, 2009 (for sub-accountant) and November 9, 2009 (for sub-transfer agent), the Advisor had an agreement with Citi Fund Services Ohio, Inc. (“Citi”) under which Citi served as the sub-accountant and sub-transfer agent.
The Advisor has entered into agreements dated October 12, 2009 and November 9, 2009 with PNC Global Investment Servicing U.S. Inc. (“PNCGIS”) under which PNCGIS serves as sub-accountant services agent and sub-transfer agent, respectively. Effective November 7, 2009 under the amended master services agreement, the Fund pays the Advisor an annual fee of 0.0175% on the first $3 billion of average daily net assets (excluding Target Series); 0.015% on the next $3 billion of average daily net assets (excluding Target Series); and 0.01% of the average daily net assets in excess of $6 billion (excluding Target Series); plus a base fee of $25,500 per Series. Additionally, certain transaction-, account-, and cusip-based fees and out-of-pocket expenses, including charges for reporting relating to the Fund’s compliance program, are charged.
On February 2, 2010, The PNC Financial Services Group, Inc. (“PNC”), which serves as the Series’ sub-accountant services agent and sub-transfer agent, entered into a Stock Purchase Agreement (the “Stock Purchase Agreement”) with The Bank of New York Mellon Corporation (“BNY Mellon”), the Series’ custodian. Upon the terms and subject to the conditions set forth in the Stock Purchase Agreement, which has been approved by the board of directors of each company, PNC will sell to BNY Mellon (the “Stock Sale”) 100% of the issued and outstanding shares of PNC Global Investment Servicing Inc., an indirect, wholly-owned subsidiary of PNC. The Stock Sale is expected to close in the third quarter of 2010. Management has concluded that this will not have a material impact on the Series’ financial statements.
Notes to Financial Statements (unaudited)
| 4. | PURCHASES AND SALES OF SECURITIES |
For the six months ended April 30, 2010, purchases and sales of securities, other than U.S. Government securities and short-term securities, were $12,042,090 and $7,061,019, respectively. There were no purchases or sales of U.S. Government securities.
| 5. | CAPITAL STOCK TRANSACTIONS |
Transactions in Class A shares of Tax Managed Series were:
| | | | | | | | | | | | | | |
| | | For the Six Months | | | For the Year | |
| | | Ended 4/30/10 | | | Ended 10/31/09 | |
| | | Shares | | | Amount | | | Shares | | | Amount | |
Sold | | 480,509 | | | $ | 11,498,562 | | | 691,302 | | | $ | 12,064,908 | |
Reinvested | | 692 | | | | 15,838 | | | 2,642 | | | | 43,004 | |
Repurchased | | (207,986 | ) | | | (4,843,985 | ) | | (172,173 | ) | | | (2,936,102 | ) |
| | | | | | | | | | | | | | |
Total | | 273,215 | | | $ | 6,670,415 | | | 521,771 | | | $ | 9,171,810 | |
| | | | | | | | | | | | | | |
At April 30, 2010, one omnibus account owned 1,028,955 shares of the Series (62.5% of shares outstanding) valued at $25,394,600. Investment activities of this shareholder may have a material effect on the Series.
The Series may trade in instruments including written and purchased options, forward foreign currency exchange contracts and futures contracts and other derivatives in the normal course of investing activities to assist in managing exposure to various market risks. The Series may be subject to various elements of risk and may involve, to a varying degree, elements of risk in excess of the amounts recognized for financial statement purposes. These risks include: the risk that changes in the value of a derivative may not correlate perfectly with the underlying asset, rate or index, counterparty credit risk related to over the counter derivatives counterparties failure to perform under contract terms, liquidity risk related to the lack of a liquid market for these contracts allowing the fund to close out its position(s) and documentation risk relating to disagreement over contract terms. No such investments were held by the Series on April 30, 2010.
Investing in securities of foreign companies and foreign governments involves special risks and considerations not typically associated with investing in securities of domestic companies and the U.S. Government. These risks include revaluation of currencies and future adverse political and economic developments. Moreover, securities of foreign companies and foreign governments and their markets may be less liquid and their prices more volatile than those of comparable domestic companies and the U.S. Government.
| 8. | FEDERAL INCOME TAX INFORMATION |
The amount and characterization of certain income and capital gains to be distributed are determined in accordance with federal income tax regulations, which may differ from accounting principles generally accepted in the United States of America. These differences are primarily due to differing book and tax treatments in the timing and recognition of net investment income or gains and losses, including losses deferred due to wash sales and foreign currency
Notes to Financial Statements (unaudited)
| 8. | FEDERAL INCOME TAX INFORMATION (continued) |
gains and losses. The Series may periodically make reclassifications among its capital accounts to reflect income and gains available for distribution (or available capital loss carryovers) under income tax regulations, without impacting the Series’ net asset value. Any such reclassifications are not reflected in the financial highlights.
The final determination of the tax character of current year distributions will be made at the conclusion of the fiscal year. The tax character of distributions paid for the year ended October 31, 2009 were as follows:
At October 31, 2009, the Series had a capital loss carryover of $4,350,362, available to the extent allowed by tax law to offset future net capital gain, if any, will expire as follows:
| | | | |
| | | Loss Carryover | | Expiration Date |
| | $2,580,370 | | October 31, 2016 |
| | $1,769,992 | | October 31, 2017 |
At April 30, 2010, the identified cost of investments for federal income tax purposes, the resulting gross unrealized appreciation and depreciation, and the net unrealized appreciation were as follows:
| | | | | | |
Cost for federal income tax purposes | | $ | 34,071,324 | | | |
Unrealized appreciation | | $ | 7,380,190 | | | |
Unrealized depreciation | | | (653,028 | ) | | |
| | | | | | |
Net unrealized appreciation | | $ | 6,727,162 | | | |
| | | | | | |
There were no other subsequent events that require recognition or disclosure. In preparing these financial statements, management of the Fund has evaluated events and transactions for potential recognition or disclosure through the date the financial statements were issued.
Renewal of Investment Advisory Agreement (unaudited)
At the Manning & Napier Fund, Inc. (the “Fund”) Board of Directors’ (the “Board”) meeting, held on December 7, 2009, the Investment Advisory Agreement (the “Agreement”) between the Fund and Manning & Napier Advisors, Inc. (the “Advisor”) was reviewed by the Board for renewal. In connection with the decision whether to renew the Agreement, a variety of material was prepared for and reviewed by the Board.
Representatives of the Advisor attended the meeting and presented additional oral and written information to the Board to assist the Board in its considerations. The discussion immediately below outlines the materials and information presented to the Board in connection with the Board’s 2009 Annual Review of the Agreement and the conclusions made by the Directors when determining to continue the Agreement.
| | • | | The Board considered the services provided by the Advisor under the Agreement including, among others: deciding what securities to purchase and sell for each Series; arranging for the purchase and sale of such securities by placing orders with broker-dealers; administering the affairs of the Fund (including the books and records of the Fund not maintained by third party service providers such as the custodian or sub-transfer agent); arranging for the insurance coverage for the Fund; and supervising the preparation of tax returns, SEC filings (including registration statements) and reports to shareholders for the Fund. The Board also considered the nature and quality of such services provided under the Agreement in light of the Advisor’s services provided to the Fund for 23 years. The Board discussed the quality of these services with representatives from the Advisor and concluded that the Advisor was performing its services to the Fund required under the Agreement in a reasonable manner. |
| | • | | The Board considered the investment performance of the various Series of the Fund. The investment performance for each Series was reviewed on a cumulative basis since inception and on a one year basis. In addition, annualized performance for the following time periods was considered: inception, three year, five year, ten year, and current market cycle. A market cycle includes periods of both rising and falling markets. Returns for established benchmark indices for each Series were provided for each time period. The Board noted that the various Series were competitive against their respective benchmarks and/or peer groups over various time periods, but in particular over the full market cycle periods relevant for the Series. In addition, the Board considered at the meeting (and considers on a quarterly basis) a peer group performance analysis consisting of Morningstar universes of mutual funds with similar investment objectives. The Board discussed the performance with representatives from the Advisor and concluded that the investment performance of each of the Fund’s Series was reasonable based on the Fund’s actual performance and comparative performance, especially performance over the current market cycle. |
| | • | | The Board considered the costs of the Advisor’s services and the profits of the Advisor as they relate to the Advisor’s services to the Fund under the Agreement. In reviewing the Advisor’s costs and profits, the Board discussed the Advisor’s revenues generated from the Fund (on both an actual and adjusted basis) and its expenses associated with providing the services under the Agreement. In addition, the Board reviewed the Advisor’s expenses associated with Fund activities outside of the Agreement (such as expense reimbursements pursuant to expense caps and payments made by the Advisor to third party platforms on which shares of the Fund are available for purchase). It was noted by representatives of the Advisor that 13 of the 26 active Series of the Fund are currently experiencing expenses above the capped expense ratios. After discussing the above costs and profits, the Board concluded that the Advisor’s profitability relating to its services provided under the Agreement was reasonable. |
| | • | | The Board considered the fees and expenses of the various Series of the Fund. The Advisor presented the advisory fees and total expenses for each Series, including the advisory fee adjusted for any expense waivers or reimbursements (either contractual or voluntary) paid by the Advisor. The advisory fees and expense ratios of each Series were compared to an average (on both a mean and median basis) of similar funds as disclosed on the Morningstar database. Representatives of the Advisor discussed with the Board the levels of its advisory |
Renewal of Investment Advisory Agreement (unaudited)
| | fee for each Series of the Fund and as compared to the median and mean advisory fees for similar funds as listed on Morningstar. Expense ratios for every Series, except the Global Fixed Income Series and the Target Series Class R and Class C, are currently below the median and mean for similar funds as listed on Morningstar. Based on their review of the information provided, the Board concluded that the fees and expenses of each Series of the Fund were reasonable on a comparative basis. |
| | • | | The Board also considered the other benefits the Advisor derives from its relationship with the Fund. Such other benefits include certain research products provided by soft dollars. Given the level of soft dollar transactions involving the Fund, the Board concluded that these additional benefits to the Advisor were reasonable. |
| | • | | In addition to the factors described above, the Board considered the Advisor’s personnel, investment strategies, policies and procedures relating to compliance with personal securities transactions, and reputation, expertise and resources in domestic and foreign financial markets. The Board concluded that these factors support the conclusion that the Advisor performs its services in a reasonable manner. |
| | • | | The Board did not consider economies of scale at this time because of the multiple uses of the Fund (for the Advisor’s discretionary investment account clients in addition to direct investors), the current profitability of the Advisor’s services to the Fund under the Agreement, and the overall size of the Fund complex. |
Based on the Board’s deliberations and their evaluation of the information described above, the Board, including a majority of Directors that are not “interested persons” as defined in the Investment Company Act of 1940, concluded that the compensation under the Agreement was fair and reasonable in light of the services and expenses and such other matters as the Directors considered to be relevant in the exercise of their reasonable judgment. Accordingly, the Board approved the renewal of the Agreement. In the course of their deliberations, the Directors did not identify any particular information that was all important or controlling.
This Page Intentionally Left Blank
This Page Intentionally Left Blank
Literature Requests (unaudited)
Proxy Voting Policies and Procedures
A description of the policies and procedures that the Fund uses to determine how to vote proxies relating to portfolio securities is available, without charge, upon request:
| | |
By phone | | 1-800-466-3863 |
On the Securities and Exchange | | |
Commission’s (SEC) web site | | http://www.sec.gov |
Proxy Voting Record
Information regarding how the Fund voted proxies relating to portfolio securities during the most recent 12-month period ended June 30th is available, without charge, upon request:
| | |
By phone | | 1-800-466-3863 |
On the SEC’s web site | | http://www.sec.gov |
Quarterly Portfolio Holdings
The Series’ complete schedule of portfolio holdings for the 1st and 3rd quarters of each fiscal year are provided on Form N-Q, and are available, without charge, upon request:
| | |
By phone | | 1-800-466-3863 |
On the SEC’s web site | | http://www.sec.gov |
The Series’ Form N-Q may be reviewed and copied at the SEC’s Public Reference Room in
Washington, D.C. Information on the operation of the Public Reference Room may be obtained by
calling 1-800-SEC-0330.
Prospectus and Statement of Additional Information (SAI)
The prospectus and SAI provide additional information about each Series, including charges, expenses and risks. These documents are available, without charge, upon request:
| | |
By phone | | 1-800-466-3863 |
On the SEC’s web site | | http://www.sec.gov |
On the Advisor’s web site | | http://manningnapieradvisors.com |
Additional information available at www.manningnapieradvisors.com
1. Fund Holdings - Month-End
2. Fund Holdings - Quarter-End
3. Shareholder Report - Annual
4. Shareholder Report - Semi-Annual
MNTAX-04/10-SAR
Shareholder Expense Example (unaudited)
As a shareholder of the Series, you may incur two types of costs: (1) transaction costs, including potential wire charges on redemptions and (2) ongoing costs, including management fees and other Series expenses. This example is intended to help you understand your ongoing costs (in dollars) of investing in the Series and to compare these costs with the ongoing costs of investing in other mutual funds.
The example is based on an investment of $1,000 invested at the beginning of the period and held for the six month period (November 1, 2009 to April 30, 2010).
Actual Expenses
The Actual lines of the following tables provide information about actual account values and actual expenses. You may use the information in these lines, together with the amount you invested, to estimate the expenses that you paid over the period. Simply divide your account value by $1,000 (for example, an $8,600 account value divided by $1,000 = 8.6), then multiply the result by the number in the Actual line for the Series and Class in which you have invested under the heading entitled “Expenses Paid During Period” to estimate the expenses you paid on your account during this period.
Hypothetical Example for Comparison Purposes
The Hypothetical lines of the following tables provide information about hypothetical account values and hypothetical expenses based on the Class’ actual expense ratio and an assumed rate of return of 5% per year before expenses, which is not the Class’ actual return. The hypothetical account values and expenses may not be used to estimate the actual ending account balance or expenses you paid during the period. You may use this information to compare the ongoing costs of investing in the Series and other funds. To do so, compare this 5% hypothetical example for the Series and Class in which you have invested with the 5% hypothetical examples that appear in the shareholder reports of the other funds.
Please note that the expenses shown in the tables are meant to highlight your ongoing costs only and do not reflect any transaction costs. Therefore, the Hypothetical lines of the tables are useful in comparing ongoing costs only, and will not help you determine the relative total costs of owning different funds. In addition, if these transaction costs were included, your costs would have been higher.
| | | | | | | | |
| | | Beginning
Account Value
11/1/09 | | Ending
Account Value
4/30/10 | | Expenses Paid
During Period
11/1/09-4/30/101 | | Annualized
Expense
Ratio2 |
Target Income | | | | | | | | |
Actual (Class K) | | $1,000.00 | | $1,055.90 | | $1.53 | | 0.30% |
Hypothetical3 | | $1,000.00 | | $1,023.31 | | $1.51 | | 0.30% |
| | | | |
Actual (Class R) | | $1,000.00 | | $1,054.90 | | $2.80 | | 0.55% |
Hypothetical3 | | $1,000.00 | | $1,022.07 | | $2.76 | | 0.55% |
| | | | |
Actual (Class C) | | $1,000.00 | | $1,051.90 | | $5.34 | | 1.05% |
Hypothetical3 | | $1,000.00 | | $1,019.59 | | $5.26 | | 1.05% |
| | | | |
Actual (Class I) | | $1,000.00 | | $1,056.90 | | $0.25 | | 0.05% |
Hypothetical3 | | $1,000.00 | | $1,024.55 | | $0.25 | | 0.05% |
Shareholder Expense Example (unaudited)
| | | | | | | | |
| | | Beginning Account Value 11/1/09 | | Ending Account Value 4/30/10 | | Expenses Paid During Period 11/1/09-4/30/10 1 | | Annualized Expense Ratio 2 |
Target 2010 | | | | | | | | |
Actual (Class K) | | $1,000.00 | | $1,082.40 | | $1.55 | | 0.30% |
Hypothetical3 | | $1,000.00 | | $1,023.31 | | $1.51 | | 0.30% |
| | | | |
Actual (Class R) | | $1,000.00 | | $1,081.70 | | $2.84 | | 0.55% |
Hypothetical3 | | $1,000.00 | | $1,022.07 | | $2.76 | | 0.55% |
| | | | |
Actual (Class C) | | $1,000.00 | | $1,078.60 | | $5.41 | | 1.05% |
Hypothetical3 | | $1,000.00 | | $1,019.59 | | $5.26 | | 1.05% |
| | | | |
Actual (Class I) | | $1,000.00 | | $1,083.80 | | $0.26 | | 0.05% |
Hypothetical3 | | $1,000.00 | | $1,024.55 | | $0.25 | | 0.05% |
| | | | | | | | |
| | | Beginning
Account Value
11/1/09 | | Ending
Account Value
4/30/10 | | Expenses Paid
During Period
11/1/09-4/30/101 | | Annualized
Expense
Ratio2 |
Target 2020 | | | | | | | | |
Actual (Class K) | | $1,000.00 | | $1,106.60 | | $1.57 | | 0.30% |
Hypothetical3 | | $1,000.00 | | $1,023.31 | | $1.51 | | 0.30% |
| | | | |
Actual (Class R) | | $1,000.00 | | $1,105.00 | | $2.87 | | 0.55% |
Hypothetical3 | | $1,000.00 | | $1,022.07 | | $2.76 | | 0.55% |
| | | | |
Actual (Class C) | | $1,000.00 | | $1,102.10 | | $5.47 | | 1.05% |
Hypothetical3 | | $1,000.00 | | $1,019.59 | | $5.26 | | 1.05% |
| | | | |
Actual (Class I) | | $1,000.00 | | $1,107.90 | | $0.26 | | 0.05% |
Hypothetical3 | | $1,000.00 | | $1,024.55 | | $0.25 | | 0.05% |
| | | | | | | | |
| | | Beginning
Account Value
11/1/09 | | Ending
Account Value
4/30/10 | | Expenses Paid
During Period
11/1/09-4/30/101 | | Annualized
Expense
Ratio2 |
Target 2030 | | | | | | | | |
Actual (Class K) | | $1,000.00 | | $1,129.70 | | $1.58 | | 0.30% |
Hypothetical3 | | $1,000.00 | | $1,023.31 | | $1.51 | | 0.30% |
| | | | |
Actual (Class R) | | $1,000.00 | | $1,128.50 | | $2.90 | | 0.55% |
Hypothetical3 | | $1,000.00 | | $1,022.07 | | $2.76 | | 0.55% |
| | | | |
Actual (Class C) | | $1,000.00 | | $1,125.10 | | $5.53 | | 1.05% |
Hypothetical3 | | $1,000.00 | | $1,019.59 | | $5.26 | | 1.05% |
| | | | |
Actual (Class I) | | $1,000.00 | | $1,131.70 | | $0.26 | | 0.05% |
Hypothetical3 | | $1,000.00 | | $1,024.55 | | $0.25 | | 0.05% |
Shareholder Expense Example (unaudited)
| | | | | | | | |
| | | Beginning
Account Value
11/1/09 | | Ending
Account Value
4/30/10 | | Expenses Paid
During Period
11/1/09-4/30/101 | | Annualized
Expense
Ratio2 |
| Target 2040 | | | | | | | | |
| Actual (Class K) | | $1,000.00 | | $1,150.10 | | $1.60 | | 0.30% |
| Hypothetical3 | | $1,000.00 | | $1,023.31 | | $1.51 | | 0.30% |
| | | | |
| Actual (Class R) | | $1,000.00 | | $1,149.10 | | $2.93 | | 0.55% |
| Hypothetical3 | | $1,000.00 | | $1,022.07 | | $2.76 | | 0.55% |
| | | | |
| Actual (Class C) | | $1,000.00 | | $1,147.00 | | $5.59 | | 1.05% |
| Hypothetical3 | | $1,000.00 | | $1,019.59 | | $5.26 | | 1.05% |
| | | | |
| Actual (Class I) | | $1,000.00 | | $1,152.10 | | $0.27 | | 0.05% |
| Hypothetical3 | | $1,000.00 | | $1,024.55 | | $0.25 | | 0.05% |
| | | | | | | | |
| | | Beginning
Account Value
11/1/09 | | Ending
Account Value
4/30/10 | | Expenses Paid
During Period
11/1/09-4/30/101 | | Annualized
Expense
Ratio2 |
| Target 2050 | | | | | | | | |
| Actual (Class K) | | $1,000.00 | | $1,150.70 | | $1.60 | | 0.30% |
| Hypothetical3 | | $1,000.00 | | $1,023.31 | | $1.51 | | 0.30% |
| | | | |
| Actual (Class R) | | $1,000.00 | | $1,150.20 | | $2.93 | | 0.55% |
| Hypothetical3 | | $1,000.00 | | $1,022.07 | | $2.76 | | 0.55% |
| | | | |
| Actual (Class C) | | $1,000.00 | | $1,146.10 | | $5.59 | | 1.05% |
| Hypothetical3 | | $1,000.00 | | $1,019.59 | | $5.26 | | 1.05% |
| | | | |
| Actual (Class I) | | $1,000.00 | | $1,152.00 | | $0.27 | | 0.05% |
| Hypothetical3 | | $1,000.00 | | $1,024.55 | | $0.25 | | 0.05% |
1 Expenses are equal to the Class’ annualized expense ratio (for the six-month period), multiplied by the average account value over the period, multiplied by 181/365 (to reflect the one-half year period). Expenses are based on the most recent fiscal half year. The Class’ total returns would have been lower had certain expenses not been reimbursed during the period.
2 Expense ratios of the Class do not include fees and expenses indirectly incurred by the underlying funds. If these expenses were included, the expense ratios would have been higher.
3 Assumes 5% annual return before expenses.
Portfolio Composition as of April 30, 2010 - Asset Allocation1 (unaudited)
1 As a percentage of net assets of the underlying investment(s) for each Series.
2 A U.S. Treasury Bond is a long-term obligation of the U.S. Treasury issued with a maturity period of more than ten years.
3 A U.S. Treasury Note is an intermediate-term obligation of the U.S. Treasury issued with a maturity period between one and ten years.
Statements of Assets and Liabilities (unaudited)
April 30, 2010
| | | | | | | | | | | | | | | | | | | | | | | | |
| | | Target
Income | | | Target 2010 | | | Target 2020 | | | Target 2030 | | | Target 2040 | | | Target 2050 | |
ASSETS: | | | | | | | | | | | | | | | | | | | | | | | | |
Manning & Napier Pro-Blend® Maximum Term Series - Class I (2,767,959 shares, 4,586,005 shares, and 1,440,830 shares, respectively) | | $ | — | | | $ | — | | | $ | — | | | $ | 27,596,549 | | | $ | 45,722,467 | | | $ | 14,365,079 | |
Manning & Napier Pro-Blend® Extended Term Series - Class I (5,960,087 shares and 4,145,240 shares, respectively) | | | — | | | | — | | | | 59,183,668 | | | | 41,162,231 | | | | — | | | | — | |
Manning & Napier Pro-Blend® Moderate Term Series - Class I (3,249,336 shares and 1,424,890 shares, respectively) | | | — | | | | 33,208,217 | | | | 14,562,379 | | | | — | | | | — | | | | — | |
Manning & Napier Pro-Blend® Conservative Term Series - Class I (4,405,710 shares) | | | 46,436,179 | | | | — | | | | — | | | | — | | | | — | | | | — | |
| | | | | | | | | | | | | | | | | | | | | | | | |
Total investments in securities: | | | | | | | | | | | | | | | | | | | | | | | | |
At value* | | | 46,436,179 | | | | 33,208,217 | | | | 73,746,047 | | | | 68,758,780 | | | | 45,722,467 | | | | 14,365,079 | |
Receivable for fund shares sold | | | 27,818 | | | | 9,882 | | | | 62,324 | | | | 43,889 | | | | 11,603 | | | | 18,599 | |
Receivable for securities sold | | | — | | | | — | | | | — | | | | — | | | | 16,862 | | | | — | |
Receivable from investment Advisor (Note 3) | | | 9,228 | | | | 19,105 | | | | 12,385 | | | | 15,098 | | | | 18,149 | | | | 23,606 | |
Prepaid transfer agent fees (Note 3) | | | 688 | | | | — | | | | — | | | | — | | | | — | | | | — | |
| | | | | | | | | | | | | | | | | | | | | | | | |
TOTAL ASSETS | | | 46,473,913 | | | | 33,237,204 | | | | 73,820,756 | | | | 68,817,767 | | | | 45,769,081 | | | | 14,407,284 | |
| | | | | | | | | | | | | | | | | | | | | | | | |
LIABILITIES: | | | | | | | | | | | | | | | | | | | | | | | | |
Accrued fund accounting and administration fees (Note 3) | | | 10,676 | | | | 11,881 | | | | 12,117 | | | | 12,070 | | | | 11,943 | | | | 11,756 | |
Accrued distribution and service (Rule 12b-1) fees (Note 3) | | | 9,850 | | | | 8,182 | | | | 17,369 | | | | 14,788 | | | | 10,370 | | | | 3,193 | |
Accrued Chief Compliance Officer service fees (Note 3) | | | 889 | | | | 889 | | | | 889 | | | | 889 | | | | 889 | | | | 889 | |
Audit fees payable | | | 12,884 | | | | 12,973 | | | | 12,912 | | | | 12,944 | | | | 12,987 | | | | 13,032 | |
Payable for securities purchased | | | 7,786 | | | | 9,862 | | | | 51,425 | | | | 41,412 | | | | — | | | | 18,480 | |
Payable for fund shares repurchased | | | 1,906 | | | | 19 | | | | 5,883 | | | | 10 | | | | 27,945 | | | | 41 | |
Other payables and accrued expenses | | | 231 | | | | 3,165 | | | | 3,414 | | | | 4,500 | | | | 3,447 | | | | 3,100 | |
| | | | | | | | | | | | | | | | | | | | | | | | |
TOTAL LIABILITIES | | | 44,222 | | | | 46,971 | | | | 104,009 | | | | 86,613 | | | | 67,581 | | | | 50,491 | |
| | | | | | | | | | | | | | | | | | | | | | | | |
TOTAL NET ASSETS | | $ | 46,429,691 | | | $ | 33,190,233 | | | $ | 73,716,747 | | | $ | 68,731,154 | | | $ | 45,701,500 | | | $ | 14,356,793 | |
| | | | | | | | | | | | | | | | | | | | | | | | |
NET ASSETS CONSIST OF: | | | | | | | | | | | | | | | | | | | | | | | | |
Capital stock | | | 44,232 | | | | 32,467 | | | | 74,068 | | | | 69,670 | | | | 45,576 | | | | 14,287 | |
Additional paid-in-capital | | | 40,477,196 | | | | 29,503,073 | | | | 65,222,092 | | | | 60,918,147 | | | | 40,687,823 | | | | 13,543,037 | |
Undistributed net investment loss | | | (38,544 | ) | | | (32,711 | ) | | | (67,458 | ) | | | (58,219 | ) | | | (42,697 | ) | | | (12,893 | ) |
Accumulated net realized gain on underlying series | | | 273,175 | | | | 181,224 | | | | 2,373,959 | | | | 1,976,333 | | | | 263,029 | | | | 21,043 | |
Net unrealized appreciation on underlying series | | | 5,673,632 | | | | 3,506,180 | | | | 6,114,086 | | | | 5,825,223 | | | | 4,747,769 | | | | 791,319 | |
| | | | | | | | | | | | | | | | | | | | | | | | |
TOTAL NET ASSETS | | $ | 46,429,691 | | | $ | 33,190,233 | | | $ | 73,716,747 | | | $ | 68,731,154 | | | $ | 45,701,500 | | | $ | 14,356,793 | |
| | | | | | | | | | | | | | | | | | | | | | | | |
| | | | |
| 5 | | The accompanying notes are an integral part of the financial statements. | | |
Statements of Assets and Liabilities (unaudited)
April 30, 2010
| | | | | | | | | | | | | | | | | | |
| | | Target
Income | | Target 2010 | | Target 2020 | | Target 2030 | | Target 2040 | | Target 2050 |
Class K | | | | | | | | | | | | | | | | | | |
Net Assets | | $ | 45,212,524 | | $ | 27,347,935 | | $ | 58,994,046 | | $ | 60,915,542 | | $ | 39,066,296 | | $ | 12,910,208 |
Shares Outstanding | | | 4,306,148 | | | 2,672,778 | | | 5,919,977 | | | 6,173,037 | | | 3,893,302 | | | 1,284,022 |
Net Asset Value, Offering Price, and Redemption Price per share | | $ | 10.50 | | $ | 10.23 | | $ | 9.97 | | $ | 9.87 | | $ | 10.03 | | $ | 10.05 |
Class R | | | | | | | | | | | | | | | | | | |
Net Assets | | $ | 211,581 | | $ | 2,404,138 | | $ | 7,842,244 | | $ | 3,271,364 | | $ | 4,826,047 | | $ | 995,755 |
Shares Outstanding | | | 20,291 | | | 236,446 | | | 793,482 | | | 332,933 | | | 483,482 | | | 99,521 |
Net Asset Value, Offering Price, and Redemption Price per share | | $ | 10.43 | | $ | 10.17 | | $ | 9.88 | | $ | 9.83 | | $ | 9.98 | | $ | 10.01 |
Class C | | | | | | | | | | | | | | | | | | |
Net Assets | | $ | 713,601 | | $ | 2,014,950 | | $ | 3,435,065 | | $ | 2,161,148 | | $ | 824,356 | | $ | 314,934 |
Shares Outstanding | | | 69,046 | | | 198,893 | | | 348,608 | | | 220,988 | | | 83,140 | | | 31,704 |
Net Asset Value, Offering Price, and Redemption Price per share | | $ | 10.34 | | $ | 10.13 | | $ | 9.85 | | $ | 9.78 | | $ | 9.92 | | $ | 9.93 |
Class I | | | | | | | | | | | | | | | | | | |
Net Assets | | $ | 291,985 | | $ | 1,423,210 | | $ | 3,445,392 | | $ | 2,383,100 | | $ | 984,801 | | $ | 135,896 |
Shares Outstanding | | | 27,734 | | | 138,589 | | | 344,688 | | | 240,033 | | | 97,669 | | | 13,442 |
Net Asset Value, Offering Price, and Redemption Price per share | | $ | 10.53 | | $ | 10.27 | | $ | 10.00 | | $ | 9.93 | | $ | 10.08 | | $ | 10.11 |
| | | | | | |
*At identified cost | | $ | 40,762,547 | | $ | 29,702,037 | | $ | 67,631,961 | | $ | 62,933,557 | | $ | 40,974,698 | | $ | 13,573,760 |
| | | | | | | | | | | | | | | | | | |
| | | | |
| | The accompanying notes are an integral part of the financial statements. | | 6 |
Statements of Operations (unaudited)
For the Six Months Ended April 30, 2010
| | | | | | | | | | | | | | | | | | | | | | | | |
| | | Target
Income | | | Target
2010 | | | Target
2020 | | | Target
2030 | | | Target
2040 | | | Target
2050 | |
INVESTMENT INCOME: | | | | | | | | | | | | | | | | | | | | | | | | |
Income distributions from underlying series | | $ | 598,122 | | | $ | 250,395 | | | $ | 621,223 | | | $ | 291,497 | | | $ | 102,094 | | | $ | 11,293 | |
| | | | | | | | | | | | | | | | | | | | | | | | |
EXPENSES: | | | | | | | | | | | | | | | | | | | | | | | | |
Distribution and services (Rule 12b-1) fees (Class K) (Note 3) | | | 54,458 | | | | 27,906 | | | | 58,398 | | | | 55,230 | | | | 34,824 | | | | 9,787 | |
Distribution and services (Rule 12b-1) fees (Class C) (Note 3) | | | 2,877 | | | | 9,200 | | | | 14,693 | | | | 7,847 | | | | 2,935 | | | | 891 | |
Distribution and services (Rule 12b-1) fees (Class R) (Note 3) | | | 164 | | | | 4,609 | | | | 10,896 | | | | 2,668 | | | | 7,584 | | | | 1,656 | |
Fund accounting and administration fees (Note 3) | | | 22,179 | | | | 23,268 | | | | 23,632 | | | | 23,536 | | | | 23,336 | | | | 23,048 | |
Directors’ fees (Note 3) | | | 6,373 | | | | 6,373 | | | | 6,373 | | | | 6,596 | | | | 6,373 | | | | 6,373 | |
Transfer agent fees (Note 3) | | | 2,460 | | | | 4,067 | | | | 4,544 | | | | 4,184 | | | | 4,142 | | | | 3,996 | |
Chief Compliance Officer service fees (Note 3) | | | 1,916 | | | | 1,916 | | | | 1,916 | | | | 1,916 | | | | 1,916 | | | | 1,916 | |
Registration and filing fees | | | 18,688 | | | | 21,759 | | | | 21,968 | | | | 22,221 | | | | 22,040 | | | | 21,860 | |
Audit fees | | | 9,632 | | | | 9,632 | | | | 9,632 | | | | 9,632 | | | | 9,632 | | | | 9,632 | |
Legal fees | | | 2,607 | | | | 2,607 | | | | 2,607 | | | | 2,607 | | | | 2,607 | | | | 2,607 | |
Nasdaq fees | | | 981 | | | | 981 | | | | 981 | | | | 981 | | | | 981 | | | | 981 | |
Custodian fees | | | 708 | | | | 744 | | | | 1,066 | | | | 1,611 | | | | 793 | | | | 744 | |
Miscellaneous | | | 548 | | | | 207 | | | | 235 | | | | 231 | | | | 169 | | | | 141 | |
| | | | | | | | | | | | | | | | | | | | | | | | |
Total Expenses | | | 123,591 | | | | 113,269 | | | | 156,941 | | | | 139,260 | | | | 117,332 | | | | 83,632 | |
Less reduction of expenses (Note 3) | | | (54,991 | ) | | | (64,826 | ) | | | (58,808 | ) | | | (61,355 | ) | | | (63,931 | ) | | | (69,103 | ) |
| | | | | | | | | | | | | | | | | | | | | | | | |
Net Expenses | | | 68,600 | | | | 48,443 | | | | 98,133 | | | | 77,905 | | | | 53,401 | | | | 14,529 | |
| | | | | | | | | | | | | | | | | | | | | | | | |
NET INVESTMENT INCOME (LOSS) | | | 529,522 | | | | 201,952 | | | | 523,090 | | | | 213,592 | | | | 48,693 | | | | (3,236 | ) |
| | | | | | | | | | | | | | | | | | | | | | | | |
REALIZED AND UNREALIZED GAIN ON UNDERLYING SERIES: | | | | | | | | | | | | | | | | | | | | | | | | |
Net realized gain on underlying series | | | 275,599 | | | | 185,523 | | | | 2,407,379 | | | | 1,990,132 | | | | 277,473 | | | | 24,766 | |
Net change in unrealized appreciation on underlying series | | | 1,601,360 | | | | 1,625,682 | | | | 2,397,849 | | | | 2,860,269 | | | | 3,292,180 | | | | 760,809 | |
| | | | | | | | | | | | | | | | | | | | | | | | |
NET REALIZED AND UNREALIZED GAIN ON UNDERLYING SERIES | | | 1,876,959 | | | | 1,811,205 | | | | 4,805,228 | | | | 4,850,401 | | | | 3,569,653 | | | | 785,575 | |
| | | | | | | | | | | | | | | | | | | | | | | | |
NET INCREASE IN NET ASSETS RESULTING FROM OPERATIONS | | $ | 2,406,481 | | | $ | 2,013,157 | | | $ | 5,328,318 | | | $ | 5,063,993 | | | $ | 3,618,346 | | | $ | 782,339 | |
| | | | | | | | | | | | | | | | | | | | | | | | |
| | | | |
| 7 | | The accompanying notes are an integral part of the financial statements. | | |
Statements of Changes in Net Assets
| | | | | | | | | | | | | | | | | | | | | | | | |
| | | Target Income | | | Target 2010 | | | Target 2020 | |
| | | For the Six
Months Ended
4/30/10
(unaudited) | | | For the Year Ended
10/31/09 | | | For the Six
Months Ended
4/30/10
(unaudited) | | | For the Year Ended
10/31/09 | | | For the Six
Months Ended
4/30/10
(unaudited) | | | For the Year Ended
10/31/09 | |
INCREASE (DECREASE) IN NET ASSETS: | | | | | | | | | | | | | | | | | | | | | | | | |
OPERATIONS: | | | | | | | | | | | | | | | | | | | | | | | | |
Net investment income | | $ | 529,522 | | | $ | 90,626 | | | $ | 201,952 | | | $ | 17,147 | | | $ | 523,090 | | | $ | 52,778 | |
Net realized gain on underlying series | | | 275,599 | | | | 146,214 | | | | 185,523 | | | | 38,159 | | | | 2,407,379 | | | | 51,411 | |
Net change in unrealized appreciation on underlying series | | | 1,601,360 | | | | 4,071,769 | | | | 1,625,682 | | | | 1,880,027 | | | | 2,397,849 | | | | 3,752,187 | |
| | | | | | | | | | | | | | | | | | | | | | | | |
| | | | | | |
Net increase from operations | | | 2,406,481 | | | | 4,308,609 | | | | 2,013,157 | | | | 1,935,333 | | | | 5,328,318 | | | | 3,856,376 | |
| | | | | | | | | | | | | | | | | | | | | | | | |
| | | | | | |
DISTRIBUTIONS TO SHAREHOLDERS (Note 8): | | | | | | | | | | | | | | | | | | | | | | | | |
From net investment income (Class K) | | | (645,975 | ) | | | (1,841 | ) | | | (197,130 | ) | | | (3,846 | ) | | | (480,062 | ) | | | (9,533 | ) |
From net investment income (Class R) | | | (872 | ) | | | (2 | ) | | | (25,363 | ) | | | (2 | ) | | | (70,933 | ) | | | (2 | ) |
From net investment income (Class C) | | | (6,848 | ) | | | (3 | ) | | | (12,835 | ) | | | (2,116 | ) | | | (32,396 | ) | | | (5,417 | ) |
From net investment income (Class I) | | | (3,098 | ) | | | (53 | ) | | | (9,377 | ) | | | (1,141 | ) | | | (38,136 | ) | | | (6,847 | ) |
From net realized gain on investments (Class K) | | | (146,108 | ) | | | — | | | | (33,958 | ) | | | — | | | | (62,557 | ) | | | — | |
From net realized gain on investments (Class R) | | | (189 | ) | | | — | | | | (4,014 | ) | | | — | | | | (8,716 | ) | | | — | |
From net realized gain on investments (Class C) | | | (1,727 | ) | | | — | | | | (3,071 | ) | | | — | | | | (5,355 | ) | | | — | |
From net realized gain on investments (Class I) | | | (614 | ) | | | — | | | | (1,415 | ) | | | — | | | | (4,520 | ) | | | — | |
| | | | | | | | | | | | | | | | | | | | | | | | |
| | | | | | |
Total distributions to shareholders | | | (805,431 | ) | | | (1,899 | ) | | | (287,163 | ) | | | (7,105 | ) | | | (702,675 | ) | | | (21,799 | ) |
| | | | | | | | | | | | | | | | | | | | | | | | |
| | | | | | |
CAPITAL STOCK ISSUED AND REPURCHASED: | | | | | | | | | | | | | | | | | | | | | | | | |
| | | | | | |
Net increase from capital share transactions (Note 6) | | | 2,271,297 | | | | 38,179,735 | | | | 13,457,984 | | | | 15,878,343 | | | | 34,389,597 | | | | 30,587,054 | |
| | | | | | | | | | | | | | | | | | | | | | | | |
Net increase in net assets | | | 3,872,347 | | | | 42,486,445 | | | | 15,183,978 | | | | 17,806,571 | | | | 39,015,240 | | | | 34,421,631 | |
| | | | | | |
NET ASSETS: | | | | | | | | | | | | | | | | | | | | | | | | |
| | | | | | |
Beginning of period | | | 42,557,344 | | | | 70,899 | | | | 18,006,255 | | | | 199,684 | | | | 34,701,507 | | | | 279,876 | |
| | | | | | | | | | | | | | | | | | | | | | | | |
| | | | | | |
End of period1 | | $ | 46,429,691 | | | $ | 42,557,344 | | | $ | 33,190,233 | | | $ | 18,006,255 | | | $ | 73,716,747 | | | $ | 34,701,507 | |
| | | | | | | | | | | | | | | | | | | | | | | | |
| | | | | | |
1Including undistributed net investment income (loss) of: | | | (38,544 | ) | | | 88,727 | | | | (32,711 | ) | | | 10,042 | | | | (67,458 | ) | | | 30,979 | |
| | | | |
| | The accompanying notes are an integral part of the financial statements. | | 8 |
Statements of Changes in Net Assets
| | | | | | | | | | | | | | | | | | | | | | | | |
| | | Target 2030 | | | Target 2040 | | | Target 2050 | |
| | | For the Six
Months Ended
4/30/10
(unaudited) | | | For the Year Ended
10/31/09 | | | For the Six
Months Ended
4/30/10
(unaudited) | | | For the Year Ended
10/31/09 | | | For the Six
Months Ended
4/30/10
(unaudited) | | | For the
Year Ended
10/31/09 | |
INCREASE (DECREASE) IN NET ASSETS: | | | | | | | | | | | | | | | | | | | | | | | | |
OPERATIONS: | | | | | | | | | | | | | | | | | | | | | | | | |
Net investment income (loss) | | $ | 213,592 | | | $ | 21,881 | | | $ | 48,693 | | | $ | 3,415 | | | $ | (3,236 | ) | | $ | 100 | |
Net realized gain on underlying series | | | 1,990,132 | | | | 76,189 | | | | 277,473 | | | | 41,791 | | | | 24,766 | | | | 14,093 | |
Net change in unrealized appreciation on underlying series | | | 2,860,269 | | | | 2,964,896 | | | | 3,292,180 | | | | 1,462,728 | | | | 760,809 | | | | 34,743 | |
| | | | | | | | | | | | | | | | | | | | | | | | |
| | | | | | |
Net increase from operations | | | 5,063,993 | | | | 3,062,966 | | | | 3,618,346 | | | | 1,507,934 | | | | 782,339 | | | | 48,936 | |
| | | | | | | | | | | | | | | | | | | | | | | | |
| | | | | | |
DISTRIBUTIONS TO SHAREHOLDERS (Note 8): | | | | | | | | | | | | | | | | | | | | | | | | |
From net investment income (Class K) | | | (249,591 | ) | | | (5 | ) | | | (68,975 | ) | | | (797 | ) | | | (5,977 | ) | | | (2 | ) |
From net investment income (Class R) | | | (10,413 | ) | | | (2 | ) | | | (18,022 | ) | | | (2 | ) | | | (3,025 | ) | | | (2 | ) |
From net investment income (Class C) | | | (7,995 | ) | | | (828 | ) | | | (1,400 | ) | | | (2 | ) | | | (169 | ) | | | (2 | ) |
From net investment income (Class I) | | | (18,962 | ) | | | (5,897 | ) | | | (4,341 | ) | | | (1,266 | ) | | | (486 | ) | | | (760 | ) |
From net realized gain on investments (Class K) | | | (78,169 | ) | | | — | | | | (42,807 | ) | | | — | | | | (10,313 | ) | | | — | |
From net realized gain on investments (Class R) | | | (3,056 | ) | | | — | | | | (9,808 | ) | | | — | | | | (5,129 | ) | | | — | |
From net realized gain on investments (Class C) | | | (3,577 | ) | | | — | | | | (1,490 | ) | | | — | | | | (1,001 | ) | | | — | |
From net realized gain on investments (Class I) | | | (5,186 | ) | | | — | | | | (2,126 | ) | | | — | | | | (704 | ) | | | — | |
| | | | | | | | | | | | | | | | | | | | | | | | |
| | | | | | |
Total distributions to shareholders | | | (376,949 | ) | | | (6,732 | ) | | | (148,969 | ) | | | (2,067 | ) | | | (26,804 | ) | | | (766 | ) |
| | | | | | | | | | | | | | | | | �� | | | | | | | |
| | | | | | |
CAPITAL STOCK ISSUED AND REPURCHASED: | | | | | | | | | | | | | | | | | | | | | | | | |
| | | | | | |
Net increase from capital share transactions (Note 6) | | | 37,768,430 | | | | 23,206,581 | | | | 27,979,307 | | | | 12,718,183 | | | | 11,775,875 | | | | 1,759,123 | |
| | | | | | | | | | | | | | | | | | | | | | | | |
Net increase in net assets | | | 42,455,474 | | | | 26,262,815 | | | | 31,448,684 | | | | 14,224,050 | | | | 12,531,410 | | | | 1,807,293 | |
| | | | | | |
NET ASSETS: | | | | | | | | | | | | | | | | | | | | | | | | |
| | | | | | |
Beginning of period | | | 26,275,680 | | | | 12,865 | | | | 14,252,816 | | | | 28,766 | | | | 1,825,383 | | | | 18,090 | |
| | | | | | | | | | | | | | | | | | | | | | | | |
| | | | | | |
End of period1 | | $ | 68,731,154 | | | $ | 26,275,680 | | | $ | 45,701,500 | | | $ | 14,252,816 | | | $ | 14,356,793 | | | $ | 1,825,383 | |
| | | | | | | | | | | | | | | | | | | | | | | | |
| | | | | | |
1Including undistributed net investment income (loss) of: | | | (58,219 | ) | | | 15,150 | | | | (42,697 | ) | | | 1,348 | | | | (12,893 | ) | | | — | |
| | | | |
| 9 | | The accompanying notes are an integral part of the financial statements. | | |
Financial Highlights
| | | | | | | | | |
| Target Income Series Class K | | | | | | | | | |
| | | For the Six
Months Ended
4/30/10
(unaudited) | | | For the Year
Ended
10/31/09 | | | For the Period
3/28/081 to
10/31/08 | |
Per share data (for a share outstanding throughout each period): | | | | | | | | | |
Net asset value - Beginning of period | | $10.13 | | | $9.30 | | | $10.00 | |
| | | | | | | | | |
Income (loss) from investment operations: | | | | | | | | | |
Net investment income (loss)2 | | 0.12 | | | 0.03 | | | (0.01 | ) |
Net realized and unrealized gain (loss) on underlying series | | 0.43 | | | 1.04 | | | (0.69 | ) |
| | | | | | | | | |
Total from investment operations | | 0.55 | | | 1.07 | | | (0.70 | ) |
| | | | | | | | | |
Less distributions to shareholders: | | | | | | | | | |
From net investment income | | (0.15 | ) | | (0.24 | ) | | — | |
From net realized gain on investments | | (0.03 | ) | | — | | | — | |
| | | | | | | | | |
Total distributions to shareholders | | (0.18 | ) | | (0.24 | ) | | — | |
| | | | | | | | | |
Net asset value - End of period | | $10.50 | | | $10.13 | | | $9.30 | |
| | | | | | | | | |
Net assets - End of period (000’s omitted) | | $45,213 | | | $42,116 | | | $70,620 | 3 |
| | | | | | | | | |
Total return4 | | 5.59% | | | 11.80% | | | (7.00% | ) |
Ratios (to average net assets)/Supplemental Data: | | | | | | | | | |
Expenses* | | 0.30% | 5,6 | | 0.30% | 7 | | 0.30% | 5,7 |
Net investment income (loss) | | 2.40% | 5 | | 0.31% | | | (0.27% | )5 |
Series portfolio turnover8 | | 6% | | | 13% | | | 0% | |
*The investment advisor paid a portion of the Series’ expenses. If these expenses had been incurred by the Series, the expense ratios (to average net assets) would have been increased by the following amounts: | |
| | 0.25% | 5,6 | | 0.41% | 7 | | 1,571% | 5,7,9 |
| Target Income Series Class R | | | | | | | | | |
| | | For the Six
Months Ended
4/30/10
(unaudited) | | | For the Year
Ended
10/31/09 | | | For the Period
3/28/081 to
10/31/08 | |
Per share data (for a share outstanding throughout each period): | | | | | | | | | |
Net asset value - Beginning of period | | $10.08 | | | $9.29 | | | $10.00 | |
| | | | | | | | | |
Income (loss) from investment operations: | | | | | | | | | |
Net investment income (loss)2 | | 0.09 | | | (0.05 | ) | | 0.02 | |
Net realized and unrealized gain (loss) on underlying series | | 0.45 | | | 1.09 | | | (0.73 | ) |
| | | | | | | | | |
Total from investment operations | | 0.54 | | | 1.04 | | | (0.71 | ) |
| | | | | | | | | |
Less distributions to shareholders: | | | | | | | | | |
From net investment income | | (0.16 | ) | | (0.25 | ) | | — | |
From net realized gain on investments | | (0.03 | ) | | — | | | — | |
| | | | | | | | | |
Total distributions to shareholders | | (0.19 | ) | | (0.25 | ) | | — | |
| | | | | | | | | |
Net asset value - End of period | | $10.43 | | | $10.08 | | | $9.29 | |
| | | | | | | | | |
Net assets - End of period (000’s omitted) | | $212 | | | $54 | | | $93 | 3 |
| | | | | | | | | |
Total return4 | | 5.49% | | | 11.44% | | | (7.10% | ) |
Ratios (to average net assets)/Supplemental Data: | | | | | | | | | |
Expenses* | | 0.55% | 5,6 | | 0.55% | 7 | | 0.55% | 5,7 |
Net investment income (loss) | | 1.76% | 5 | | (0.51% | ) | | 0.34% | 5 |
Series portfolio turnover8 | | 6% | | | 13% | | | 0% | |
*The investment advisor paid a portion of the Series’ expenses. If these expenses had been incurred by the Series, the expense ratios (to average net assets) would have been increased by the following amounts: | |
| | 0.86% | 5,6 | | 169.34% | 7 | | 43,127% | 5,7,9 |
1Commencement of operations.
2Calculated based on average shares outstanding during the period.
3Represents the whole number without rounding to the 000’s.
4Represents aggregate total return for the period indicated, and assumes reinvestment of all distributions. Total return would have been lower had certain expenses not been reimbursed during the period. Periods less than one year are not annualized.
5Annualized.
6Expense ratios do not include expenses of the underlying series in which the Series invests. The expense ratio of the underlying series was 0.67%.
7Expense ratios do not include expenses of the underlying series in which the Series invests. The expense ratio of the underlying series was 0.70%.
8Reflects activity of the Series and does not include the activity of the underlying series.
9The increase to the expense ratios (to average net assets) is largely due to the small net assets in each class.
| | | | |
| | The accompanying notes are an integral part of the financial statements. | | 10 |
Financial Highlights
| | | | | | | | | |
| Target Income Series Class C | | | | | | | | | |
| | | For the Six
Months Ended
4/30/10
(unaudited) | | | For the Year
Ended
10/31/09 | | | For the Period
3/28/081 to
10/31/08 | |
Per share data (for a share outstanding throughout each period): | | | | | | | | | |
Net asset value - Beginning of period | | $10.00 | | | $9.26 | | | $10.00 | |
| | | | | | | | | |
Income (loss) from investment operations: | | | | | | | | | |
Net investment income (loss)2 | | 0.07 | | | (0.03 | ) | | (0.01 | ) |
Net realized and unrealized gain (loss) on underlying series | | 0.44 | | | 1.02 | | | (0.73 | ) |
| | | | | | | | | |
Total from investment operations | | 0.51 | | | 0.99 | | | (0.74 | ) |
| | | | | | | | | |
Less distributions to shareholders: | | | | | | | | | |
From net investment income | | (0.14 | ) | | (0.25 | ) | | — | |
From net realized gain on investments | | (0.03 | ) | | — | | | — | |
| | | | | | | | | |
Total distributions to shareholders | | (0.17 | ) | | (0.25 | ) | | — | |
| | | | | | | | | |
Net asset value - End of period | | $10.34 | | | $10.00 | | | $9.26 | |
| | | | | | | | | |
Net assets - End of period (000’s omitted) | | $714 | | | $330 | | | $93 | 3 |
| | | | | | | | | |
Total return4 | | 5.19% | | | 10.91% | | | (7.40% | ) |
Ratios (to average net assets)/Supplemental Data: | | | | | | | | | |
Expenses* | | 1.05% | 5,6 | | 1.05% | 7 | | 1.05% | 5,7 |
Net investment income (loss) | | 1.33% | 5 | | (0.30% | ) | | (0.15% | )5 |
Series portfolio turnover8 | | 6% | | | 13% | | | 0% | |
*The investment advisor paid a portion of the Series’ expenses. If these expenses had been incurred by the Series, the expense ratios (to average net assets) would have been increased by the following amounts: | |
| | 0.31% | 5,6 | | 10.70% | 7 | | 43,147% | 5,7,9 |
| Target Income Series Class I | | | | | | | | | |
| | | For the Six
Months Ended
4/30/10
(unaudited) | | | For the Year
Ended
10/31/09 | | | For the Period
3/28/081 to
10/31/08 | |
Per share data (for a share outstanding throughout each period): | | | | | | | | | |
Net asset value - Beginning of period | | $10.17 | | | $9.32 | | | $10.00 | |
| | | | | | | | | |
Income (loss) from investment operations: | | | | | | | | | |
Net investment income2 | | 0.13 | | | 0.06 | | | 0.05 | |
Net realized and unrealized gain (loss) on underlying series | | 0.44 | | | 1.04 | | | (0.73 | ) |
| | | | | | | | | |
Total from investment operations | | 0.57 | | | 1.10 | | | (0.68 | ) |
| | | | | | | | | |
Less distributions to shareholders: | | | | | | | | | |
From net investment income | | (0.18 | ) | | (0.25 | ) | | — | |
From net realized gain on investments | | (0.03 | ) | | — | | | — | |
| | | | | | | | | |
Total distributions to shareholders | | (0.21 | ) | | (0.25 | ) | | — | |
| | | | | | | | | |
Net asset value - End of period | | $10.53 | | | $10.17 | | | $9.32 | |
| | | | | | | | | |
Net assets - End of period (000’s omitted) | | $292 | | | $58 | | | $93 | 3 |
| | | | | | | | | |
Total return4 | | 5.69% | | | 12.06% | | | (6.80% | ) |
Ratios (to average net assets)/Supplemental Data: | | | | | | | | | |
Expenses* | | 0.05% | 5,6 | | 0.05% | 7 | | 0.05% | 5,7 |
Net investment income | | 2.51% | 5 | | 0.66% | | | 0.85% | 5 |
Series portfolio turnover8 | | 6% | | | 13% | | | 0% | |
*The investment advisor paid a portion of the Series’ expenses. If these expenses had been incurred by the Series, the expense ratios (to average net assets) would have been increased by the following amounts: | |
| | 0.45% | 5,6 | | 54.69% | 7 | | 43,107% | 5,7,9 |
1Commencement of operations.
2Calculated based on average shares outstanding during the period.
3Represents the whole number without rounding to the 000’s.
4Represents aggregate total return for the period indicated, and assumes reinvestment of all distributions. Total return would have been lower had certain expenses not been reimbursed during the period. Periods less than one year are not annualized.
5Annualized.
6Expense ratios do not include expenses of the underlying series in which the Series invests. The expense ratio of the underlying series was 0.67%.
7Expense ratios do not include expenses of the underlying series in which the Series invests. The expense ratio of the underlying series was 0.70%.
8Reflects activity of the Series and does not include the activity of the underlying series.
9The increase to the expense ratios (to average net assets) is largely due to the small net assets in each class.
| | | | |
| 11 | | The accompanying notes are an integral part of the financial statements. | | |
Financial Highlights
| | | | | | | | | |
| Target 2010 Series Class K | | | | | | | | | |
| | | For the Six
Months Ended
4/30/10
(unaudited) | | | For the Year
Ended
10/31/09 | | | For the Period
3/28/081 to
10/31/08 | |
Per share data (for a share outstanding throughout each period): | | | | | | | | | |
Net asset value - Beginning of period | | $9.58 | | | $8.61 | | | $10.00 | |
| | | | | | | | | |
Income (loss) from investment operations: | | | | | | | | | |
Net investment income (loss)2 | | 0.07 | | | 0.02 | | | (0.01 | ) |
Net realized and unrealized gain (loss) on underlying series | | 0.71 | | | 1.15 | | | (1.38 | ) |
| | | | | | | | | |
Total from investment operations | | 0.78 | | | 1.17 | | | (1.39 | ) |
| | | | | | | | | |
Less distributions to shareholders: | | | | | | | | | |
From net investment income | | (0.11 | ) | | (0.20 | ) | | — | |
From net realized gain on investments | | (0.02 | ) | | — | | | — | |
| | | | | | | | | |
Total distributions to shareholders | | (0.13 | ) | | (0.20 | ) | | — | |
| | | | | | | | | |
Net asset value - End of period | | $10.23 | | | $9.58 | | | $8.61 | |
| | | | | | | | | |
Net assets - End of period (000’s omitted) | | $27,348 | | | $15,782 | | | $101,213 | 3 |
| | | | | | | | | |
Total return4 | | 8.24% | | | 13.97% | | | (13.90% | ) |
Ratios (to average net assets)/Supplemental Data: | | | | | | | | | |
Expenses* | | 0.30% | 5,6 | | 0.30% | 7 | | 0.30% | 5,7 |
Net investment income (loss) | | 1.50% | 5 | | 0.19% | | | (0.28% | )5 |
Series portfolio turnover8 | | 4% | | | 9% | | | 0% | |
*The investment advisor paid a portion of the Series’ expenses. If these expenses had been incurred by the Series, the expense ratios (to average net assets) would have been increased by the following amounts: | |
| | 0.48% | 5,6 | | 1.31% | 7 | | 1,071% | 5,7,9 |
| Target 2010 Series Class R | | | | | | | | | |
| | | For the Six
Months Ended
4/30/10
(unaudited) | | | For the Year
Ended
10/31/09 | | | For the Period
3/28/081 to
10/31/08 | |
Per share data (for a share outstanding throughout each period): | | | | | | | | | |
Net asset value - Beginning of period | | $9.54 | | | $8.61 | | | $10.00 | |
| | | | | | | | | |
Income (loss) from investment operations: | | | | | | | | | |
Net investment income (loss)2 | | 0.10 | | | (0.05 | ) | | 0.02 | |
Net realized and unrealized gain (loss) on underlying series | | 0.67 | | | 1.18 | | | (1.41 | ) |
| | | | | | | | | |
Total from investment operations | | 0.77 | | | 1.13 | | | (1.39 | ) |
| | | | | | | | | |
Less distributions to shareholders: | | | | | | | | | |
From net investment income | | (0.12 | ) | | (0.20 | ) | | — | |
From net realized gain on investments | | (0.02 | ) | | — | | | — | |
| | | | | | | | | |
Total distributions to shareholders | | (0.14 | ) | | (0.20 | ) | | — | |
| | | | | | | | | |
Net asset value - End of period | | $10.17 | | | $9.54 | | | $8.61 | |
| | | | | | | | | |
Net assets - End of period (000’s omitted) | | $2,404 | | | $284 | | | $86 | 3 |
| | | | | | | | | |
Total return4 | | 8.17% | | | 13.54% | | | (13.90% | ) |
Ratios (to average net assets)/Supplemental Data: | | | | | | | | | |
Expenses* | | 0.55% | 5,6 | | 0.55% | 7 | | 0.55% | 5,7 |
Net investment income (loss) | | 2.01% | 5 | | (0.55% | ) | | 0.36% | 5 |
Series portfolio turnover8 | | 4% | | | 9% | | | 0% | |
*The investment advisor paid a portion of the Series’ expenses. If these expenses had been incurred by the Series, the expense ratios (to average net assets) would have been increased by the following amounts: | |
| | 0.49% | 5,6 | | 25.36% | 7 | | 42,882% | 5,7,9 |
1Commencement of operations.
2Calculated based on average shares outstanding during the period.
3Represents the whole number without rounding to the 000’s.
4Represents aggregate total return for the period indicated, and assumes reinvestment of all distributions. Total return would have been lower had certain expenses not been reimbursed during the period. Periods less than one year are not annualized.
5Annualized.
6Expense ratios do not include expenses of the underlying series in which the Series invests. The expense ratio of the underlying series was 0.81%.
7Expense ratios do not include expenses of the underlying series in which the Series invests. The expense ratio of the underlying series was 0.85%.
8Reflects activity of the Series and does not include the activity of the underlying series.
9The increase to the expense ratios (to average net assets) is largely due to the small net assets in each class.
| | | | |
| | The accompanying notes are an integral part of the financial statements. | | 12 |
Financial Highlights
| | | | | | | | | |
| Target 2010 Series Class C | | | | | | | | | |
| | | For the Six
Months Ended
4/30/10
(unaudited) | | | For the Year
Ended
10/31/09 | | | For the Period
3/28/081 to
10/31/08 | |
Per share data (for a share outstanding throughout each period): | | | | | | | | | |
Net asset value - Beginning of period | | $9.49 | | | $8.58 | | | $10.00 | |
| | | | | | | | | |
Income (loss) from investment operations: | | | | | | | | | |
Net investment income (loss)2 | | 0.04 | | | (0.01 | ) | | (0.05 | ) |
Net realized and unrealized gain (loss) on underlying series | | 0.70 | | | 1.10 | | | (1.37 | ) |
| | | | | | | | | |
Total from investment operations | | 0.74 | | | 1.09 | | | (1.42 | ) |
| | | | | | | | | |
Less distributions to shareholders: | | | | | | | | | |
From net investment income | | (0.08 | ) | | (0.18 | ) | | — | |
From net realized gain on investments | | (0.02 | ) | | — | | | — | |
| | | | | | | | | |
Total distributions to shareholders | | (0.10 | ) | | (0.18 | ) | | — | |
| | | | | | | | | |
Net asset value - End of period | | $10.13 | | | $9.49 | | | $8.58 | |
| | | | | | | | | |
Net assets - End of period (000’s omitted) | | $2,015 | | | $1,471 | | | $98,226 | 3 |
| | | | | | | | | |
Total return4 | | 7.86% | | | 13.13% | | | (14.20% | ) |
Ratios (to average net assets)/Supplemental Data: | | | | | | | | | |
Expenses* | | 1.05% | 5,6 | | 1.05% | 7 | | 1.05% | 5,7 |
Net investment income (loss) | | 0.90% | 5 | | (0.12% | ) | | (1.03% | )5 |
Series portfolio turnover8 | | 4% | | | 9% | | | 0% | |
*The investment advisor paid a portion of the Series’ expenses. If these expenses had been incurred by the Series, the expense ratios (to average net assets) would have been increased by the following amounts: | |
| | 0.50% | 5,6 | | 5.01% | 7 | | 919% | 5,7,9 |
| Target 2010 Series Class I | | | | | | | | | |
| | | For the Six
Months Ended
4/30/10
(unaudited) | | | For the Year
Ended
10/31/09 | | | For the Period
3/28/081 to
10/31/08 | |
Per share data (for a share outstanding throughout each period): | | | | | | | | | |
Net asset value - Beginning of period | | $9.62 | | | $8.63 | | | $10.00 | |
| | | | | | | | | |
Income (loss) from investment operations: | | | | | | | | | |
Net investment income2 | | 0.09 | | | 0.07 | | | 0.05 | |
Net realized and unrealized gain (loss) on underlying series | | 0.71 | | | 1.12 | | | (1.42 | ) |
| | | | | | | | | |
Total from investment operations | | 0.80 | | | 1.19 | | | (1.37 | ) |
| | | | | | | | | |
Less distributions to shareholders: | | | | | | | | | |
From net investment income | | (0.13 | ) | | (0.20 | ) | | — | |
From net realized gain on investments | | (0.02 | ) | | — | | | — | |
| | | | | | | | | |
Total distributions to shareholders | | (0.15 | ) | | (0.20 | ) | | — | |
| | | | | | | | | |
Net asset value - End of period | | $10.27 | | | $9.62 | | | $8.63 | |
| | | | | | | | | |
Net assets - End of period (000’s omitted) | | $1,423 | | | $469 | | | $159 | 3 |
| | | | | | | | | |
Total return4 | | 8.38% | | | 14.23% | | | (13.70% | ) |
Ratios (to average net assets)/Supplemental Data: | | | | | | | | | |
Expenses* | | 0.05% | 5,6 | | 0.05% | 7 | | 0.05% | 5,7 |
Net investment income | | 1.81% | 5 | | 0.83% | | | 0.86% | 5 |
Series portfolio turnover8 | | 4% | | | 9% | | | 0% | |
*The investment advisor paid a portion of the Series’ expenses. If these expenses had been incurred by the Series, the expense ratios (to average net assets) would have been increased by the following amounts: | |
| | 0.52% | 5,6 | | 8.26% | 7 | | 42,439% | 5,7,9 |
1Commencement of operations.
2Calculated based on average shares outstanding during the period.
3Represents the whole number without rounding to the 000’s.
4Represents aggregate total return for the period indicated, and assumes reinvestment of all distributions. Total return would have been lower had certain expenses not been reimbursed during the period. Periods less than one year are not annualized.
5Annualized.
6Expense ratios do not include expenses of the underlying series in which the Series invests. The expense ratio of the underlying series was 0.81%.
7Expense ratios do not include expenses of the underlying series in which the Series invests. The expense ratio of the underlying series was 0.85%.
8Reflects activity of the Series and does not include the activity of the underlying series.
9The increase to the expense ratios (to average net assets) is largely due to the small net assets in each class.
| | | | |
| 13 | | The accompanying notes are an integral part of the financial statements. | | |
Financial Highlights
| | | | | | | | | |
| Target 2020 Series Class K | | | | | | | | | |
| | | For the Six
Months Ended
4/30/10
(unaudited) | | | For the Year
Ended
10/31/09 | | | For the Period
3/28/081 to
10/31/08 | |
Per share data (for a share outstanding throughout each period): | | | | | | | | | |
Net asset value - Beginning of period | | $9.16 | | | $8.14 | | | $10.00 | |
| | | | | | | | | |
Income (loss) from investment operations: | | | | | | | | | |
Net investment income2 | | 0.08 | | | 0.02 | | | 0.04 | |
Net realized and unrealized gain (loss) on underlying series | | 0.89 | | | 1.21 | | | (1.90 | ) |
| | | | | | | | | |
Total from investment operations | | 0.97 | | | 1.23 | | | (1.86 | ) |
| | | | | | | | | |
Less distributions to shareholders: | | | | | | | | | |
From net investment income | | (0.14 | ) | | (0.21 | ) | | — | |
From net realized gain on investments | | (0.02 | ) | | — | | | — | |
| | | | | | | | | |
Total distributions to shareholders | | (0.16 | ) | | (0.21 | ) | | — | |
| | | | | | | | | |
Net asset value - End of period | | $9.97 | | | $9.16 | | | $8.14 | |
| | | | | | | | | |
Net assets - End of period (000’s omitted) | | $58,994 | | | $30,089 | | | $157 | 3 |
| | | | | | | | | |
Total return4 | | 10.66% | | | 15.72% | | | (18.60% | ) |
Ratios (to average net assets)/Supplemental Data: | | | | | | | | | |
Expenses* | | 0.30% | 5,6 | | 0.30% | 7 | | 0.30% | 5,7 |
Net investment income | | 1.75% | 5 | | 0.28% | | | 0.74% | 5 |
Series portfolio turnover8 | | 19% | | | 9% | | | 31% | |
*The investment advisor paid a portion of the Series’ expenses. If these expenses had been incurred by the Series, the expense ratios (to average net assets) would have been increased by the following amounts: | |
| | 0.21% | 5,6 | | 0.72% | 7 | | 34,421% | 5,7,9 |
| Target 2020 Series Class R | | | | | | | | | |
| | | For the Six
Months Ended
4/30/10
(unaudited) | | | For the Year
Ended
10/31/09 | | | For the Period
3/28/081 to
10/31/08 | |
Per share data (for a share outstanding throughout each period): | | | | | | | | | |
Net asset value - Beginning of period | | $9.10 | | | $8.13 | | | $10.00 | |
| | | | | | | | | |
Income (loss) from investment operations: | | | | | | | | | |
Net investment income (loss)2 | | 0.12 | | | (0.05 | ) | | 0.04 | |
Net realized and unrealized gain (loss) on underlying series | | 0.83 | | | 1.23 | | | (1.91 | ) |
| | | | | | | | | |
Total from investment operations | | 0.95 | | | 1.18 | | | (1.87 | ) |
| | | | | | | | | |
Less distributions to shareholders: | | | | | | | | | |
From net investment income | | (0.15 | ) | | (0.21 | ) | | — | |
From net realized gain on investments | | (0.02 | ) | | — | | | — | |
| | | | | | | | | |
Total distributions to shareholders | | (0.17 | ) | | (0.21 | ) | | — | |
| | | | | | | | | |
Net asset value - End of period | | $9.88 | | | $9.10 | | | $8.13 | |
| | | | | | | | | |
Net assets - End of period (000’s omitted) | | $7,842 | | | $562 | | | $81 | 3 |
| | | | | | | | | |
Total return4 | | 10.50% | | | 15.13% | | | (18.70% | ) |
Ratios (to average net assets)/Supplemental Data: | | | | | | | | | |
Expenses* | | 0.55% | 5,6 | | 0.55% | 7 | | 0.55% | 5,7 |
Net investment income (loss) | | 2.50% | 5 | | (0.54% | ) | | 0.62% | 5 |
Series portfolio turnover8 | | 19% | | | 9% | | | 31% | |
*The investment advisor paid a portion of the Series’ expenses. If these expenses had been incurred by the Series, the expense ratios (to average net assets) would have been increased by the following amounts: | |
| | 0.21% | 5,6 | | 14.54% | 7 | | 38,136% | 5,7,9 |
1Commencement of operations.
2Calculated based on average shares outstanding during the period.
3Represents the whole number without rounding to the 000’s.
4Represents aggregate total return for the period indicated, and assumes reinvestment of all distributions. Total return would have been lower had certain expenses not been reimbursed during the period. Periods less than one year are not annualized.
5Annualized.
6Expense ratios do not include expenses of the underlying series in which the Series invests. The expense ratios of the underlying series were 0.81% for Manning & Napier Pro-Blend® Moderate Term Series - Class I and 0.82% for Manning & Napier Pro-Blend® Extended Term Series - Class I.
7Expense ratios do not include expenses of the underlying series in which the Series invests. The expense ratio of the underlying series was 0.85%.
8Reflects activity of the Series and does not include the activity of the underlying series.
9The increase to the expense ratios (to average net assets) is largely due to the small net assets in each class.
| | | | |
| | The accompanying notes are an integral part of the financial statements. | | 14 |
Financial Highlights
| | | | | | | | | |
| Target 2020 Series Class C | | | | | | | | | |
| | | For the Six
Months Ended
4/30/10
(unaudited) | | | For the Year
Ended
10/31/09 | | | For the Period
3/28/081 to
10/31/08 | |
Per share data (for a share outstanding throughout each period): | | | | | | | | | |
Net asset value - Beginning of period | | $9.06 | | | $8.10 | | | $10.00 | |
| | | | | | | | | |
Income (loss) from investment operations: | | | | | | | | | |
Net investment income (loss)2 | | 0.08 | | | 0.02 | | | (0.05 | ) |
Net realized and unrealized gain (loss) on underlying series | | 0.84 | | | 1.13 | | | (1.85 | ) |
| | | | | | | | | |
Total from investment operations | | 0.92 | | | 1.15 | | | (1.90 | ) |
| | | | | | | | | |
Less distributions to shareholders: | | | | | | | | | |
From net investment income | | (0.11 | ) | | (0.19 | ) | | — | |
From net realized gain on investments | | (0.02 | ) | | — | | | — | |
| | | | | | | | | |
Total distributions to shareholders | | (0.13 | ) | | (0.19 | ) | | — | |
| | | | | | | | | |
Net asset value - End of period | | $9.85 | | | $9.06 | | | $8.10 | |
| | | | | | | | | |
Net assets - End of period (000’s omitted) | | $3,435 | | | $2,123 | | | $228,171 | 3 |
| | | | | | | | | |
Total return4 | | 10.21% | | | 14.74% | | | (19.00% | ) |
Ratios (to average net assets)/Supplemental Data: | | | | | | | | | |
Expenses* | | 1.05% | 5,6 | | 1.05% | 7 | | 1.05% | 5,7 |
Net investment income (loss) | | 1.71% | 5 | | 0.25% | | | (1.05% | )5 |
Series portfolio turnover8 | | 19% | | | 9% | | | 31% | |
*The investment advisor paid a portion of the Series’ expenses. If these expenses had been incurred by the Series, the expense ratios (to average net assets) would have been increased by the following amounts: | |
| | 0.23% | 5,6 | | 3.08% | 7 | | 158% | 5,7,9 |
| Target 2020 Series Class I | | | | | | | | | |
| | | For the Six
Months Ended
4/30/10
(unaudited) | | | For the Year
Ended
10/31/09 | | | For the Period
3/28/081 to
10/31/08 | |
Per share data (for a share outstanding throughout each period): | | | | | | | | | |
Net asset value - Beginning of period | | $9.19 | | | $8.15 | | | $10.00 | |
| | | | | | | | | |
Income (loss) from investment operations: | | | | | | | | | |
Net investment income2 | | 0.13 | | | 0.10 | | | — | 10 |
Net realized and unrealized gain (loss) on underlying series | | 0.85 | | | 1.15 | | | (1.85 | ) |
| | | | | | | | | |
Total from investment operations | | 0.98 | | | 1.25 | | | (1.85 | ) |
| | | | | | | | | |
Less distributions to shareholders: | | | | | | | | | |
From net investment income | | (0.15 | ) | | (0.21 | ) | | — | |
From net realized gain on investments | | (0.02 | ) | | — | | | — | |
| | | | | | | | | |
Total distributions to shareholders | | (0.17 | ) | | (0.21 | ) | | — | |
| | | | | | | | | |
Net asset value - End of period | | $10.00 | | | $9.19 | | | $8.15 | |
| | | | | | | | | |
Net assets - End of period (000’s omitted) | | $3,445 | | | $1,927 | | | $51,467 | 3 |
| | | | | | | | | |
Total return4 | | 10.79% | | | 15.98% | | | (18.50% | ) |
Ratios (to average net assets)/Supplemental Data: | | | | | | | | | |
Expenses* | | 0.05% | 5,6 | | 0.05% | 7 | | 0.05% | 5,7 |
Net investment income (loss) | | 2.65% | 5 | | 1.22% | | | (0.02% | )5 |
Series portfolio turnover8 | | 19% | | | 9% | | | 31% | |
*The investment advisor paid a portion of the Series’ expenses. If these expenses had been incurred by the Series, the expense ratios (to average net assets) would have been increased by the following amounts: | |
| | 0.23% | 5,6 | | 2.90% | 7 | | 871% | 5,7,9 |
1Commencement of operations.
2Calculated based on average shares outstanding during the period.
3Represents the whole number without rounding to the 000’s.
4Represents aggregate total return for the period indicated, and assumes reinvestment of all distributions. Total return would have been lower had certain expenses not been reimbursed during the period. Periods less than one year are not annualized.
5Annualized.
6Expense ratios do not include expenses of the underlying series in which the Series invests. The expense ratios of the underlying series were 0.81% for Manning & Napier Pro-Blend® Moderate Term Series - Class I and 0.82% for Manning & Napier Pro-Blend® Extended Term Series - Class I.
7Expense ratios do not include expenses of the underlying series in which the Series invests. The expense ratio of the underlying series was 0.85%.
8Reflects activity of the Series and does not include the activity of the underlying series.
9The increase to the expense ratios (to average net assets) is largely due to the small net assets in each class.
10Less than $0.01.
| | | | |
| 15 | | The accompanying notes are an integral part of the financial statements. | | |
Financial Highlights
| | | | | | | | | |
| Target 2030 Series Class K | | | | | | | | | |
| | | For the Six
Months Ended
4/30/10
(unaudited) | | | For the Year
Ended
10/31/09 | | | For the Period
3/28/081 to
10/31/08 | |
Per share data (for a share outstanding throughout each period): | | | | | | | | | |
Net asset value - Beginning of period | | $8.85 | | | $7.81 | | | $10.00 | |
| | | | | | | | | |
Income (loss) from investment operations: | | | | | | | | | |
Net investment income2 | | 0.04 | | | 0.01 | | | 0.03 | |
Net realized and unrealized gain (loss) on underlying series | | 1.10 | | | 1.20 | | | (2.22 | ) |
| | | | | | | | | |
Total from investment operations | | 1.14 | | | 1.21 | | | (2.19 | ) |
| | | | | | | | | |
Less distributions to shareholders: | | | | | | | | | |
From net investment income | | (0.09 | ) | | (0.17 | ) | | — | |
From net realized gain on investments | | (0.03 | ) | | — | | | — | |
| | | | | | | | | |
Total distributions to shareholders | | (0.12 | ) | | (0.17 | ) | | — | |
| | | | | | | | | |
Net asset value - End of period | | $9.87 | | | $8.85 | | | $7.81 | |
| | | | | | | | | |
Net assets - End of period (000’s omitted) | | $60,916 | | | $23,597 | | | $118 | 3 |
| | | | | | | | | |
Total return4 | | 12.97% | | | 16.05% | | | (21.90% | ) |
Ratios (to average net assets)/Supplemental Data: | | | | | | | | | |
Expenses* | | 0.30% | 5,6 | | 0.30% | 7 | | 0.30% | 5,7 |
Net investment income | | 0.85% | 5 | | 0.14% | | | 0.54% | 5 |
Series portfolio turnover8 | | 15% | | | 9% | | | —% | 9 |
*The investment advisor paid a portion of the Series’ expenses. If these expenses had been incurred by the Series, the expense ratios (to average net assets) would have been increased by the following amounts: | |
| | 0.25% | 5,6 | | 0.97% | 7 | | 37,175% | 5,7,10 |
| Target 2030 Series Class R | | | | | | | | | |
| | | For the Six
Months Ended
4/30/10
(unaudited) | | | For the Year
Ended
10/31/09 | | | For the Period
3/28/081 to
10/31/08 | |
Per share data (for a share outstanding throughout each period): | | | | | | | | | |
Net asset value - Beginning of period | | $8.83 | | | $7.79 | | | $10.00 | |
| | | | | | | | | |
Income (loss) from investment operations: | | | | | | | | | |
Net investment income (loss)2 | | 0.06 | | | (0.05 | ) | | 0.02 | |
Net realized and unrealized gain (loss) on underlying series | | 1.07 | | | 1.26 | | | (2.23 | ) |
| | | | | | | | | |
Total from investment operations | | 1.13 | | | 1.21 | | | (2.21 | ) |
| | | | | | | | | |
Less distributions to shareholders: | | | | | | | | | |
From net investment income | | (0.10 | ) | | (0.17 | ) | | — | |
From net realized gain on investments | | (0.03 | ) | | — | | | — | |
| | | | | | | | | |
Total distributions to shareholders | | (0.13 | ) | | (0.17 | ) | | — | |
| | | | | | | | | |
Net asset value - End of period | | $9.83 | | | $8.83 | | | $7.79 | |
| | | | | | | | | |
Net assets - End of period (000’s omitted) | | $3,271 | | | $328 | | | $78 | 3 |
| | | | | | | | | |
Total return4 | | 12.85% | | | 16.09% | | | (22.10% | ) |
Ratios (to average net assets)/Supplemental Data: | | | | | | | | | |
Expenses* | | 0.55% | 5,6 | | 0.55% | 7 | | 0.55% | 5,7 |
Net investment income (loss) | | 1.30% | 5 | | (0.53% | ) | | 0.31% | 5 |
Series portfolio turnover8 | | 15% | | | 9% | | | —% | 9 |
*The investment advisor paid a portion of the Series’ expenses. If these expenses had been incurred by the Series, the expense ratios (to average net assets) would have been increased by the following amounts: | |
| | 0.30% | 5,6 | | 28.67% | 7 | | 38,768% | 5,7,10 |
1Commencement of operations.
2Calculated based on average shares outstanding during the period.
3Represents the whole number without rounding to the 000’s.
4Represents aggregate total return for the period indicated, and assumes reinvestment of all distributions. Total return would have been lower had certain expenses not been reimbursed during the period. Periods less than one year are not annualized.
5Annualized.
6Expense ratios do not include expenses of the underlying series in which the Series invests. The expense ratios of the underlying series were 0.82% for Manning & Napier Pro-Blend® Extended Term Series - Class I and 0.85% for Manning & Napier Pro-Blend® Maximum Term Series - Class I.
7Expense ratios do not include expenses of the underlying series in which the Series invests. The expense ratio of the underlying series was 0.85%.
8Reflects activity of the Series and does not include the activity of the underlying series.
9Less than 1%.
10The increase to the expense ratios (to average net assets) is largely due to the small net assets in each class.
| | | | |
| | The accompanying notes are an integral part of the financial statements. | | 16 |
Financial Highlights
| | | | | | | | | |
| Target 2030 Series Class C | | | | | | | | | |
| | | For the Six
Months Ended
4/30/10
(unaudited) | | | For the Year
Ended
10/31/09 | | | For the Period
3/28/081 to
10/31/08 | |
Per share data (for a share outstanding throughout each period): | | | | | | | | | |
Net asset value - Beginning of period | | $8.78 | | | $7.77 | | | $10.00 | |
| | | | | | | | | |
Income (loss) from investment operations: | | | | | | | | | |
Net investment income (loss)2 | | 0.02 | | | (0.02 | ) | | (0.01 | ) |
Net realized and unrealized gain (loss) on underlying series | | 1.07 | | | 1.19 | | | (2.22 | ) |
| | | | | | | | | |
Total from investment operations | | 1.09 | | | 1.17 | | | (2.23 | ) |
| | | | | | | | | |
Less distributions to shareholders: | | | | | | | | | |
From net investment income | | (0.06 | ) | | (0.16 | ) | | — | |
From net realized gain on investments | | (0.03 | ) | | — | | | — | |
| | | | | | | | | |
Total distributions to shareholders | | (0.09 | ) | | (0.16 | ) | | — | |
| | | | | | | | | |
Net asset value - End of period | | $9.78 | | | $8.78 | | | $7.77 | |
| | | | | | | | | |
Net assets - End of period (000’s omitted) | | $2,161 | | | $1,034 | | | $78 | 3 |
| | | | | | | | | |
Total return4 | | 12.51% | | | 15.57% | | | (22.30% | ) |
Ratios (to average net assets)/Supplemental Data: | | | | | | | | | |
Expenses* | | 1.05% | 5,6 | | 1.05% | 7 | | 1.05% | 5,7 |
Net investment income (loss) | | 0.41% | 5 | | (0.22% | ) | | (0.17% | )5 |
Series portfolio turnover8 | | 15% | | | 9% | | | —% | 9 |
*The investment advisor paid a portion of the Series’ expenses. If these expenses had been incurred by the Series, the expense ratios (to average net assets) would have been increased by the following amounts: | |
| | 0.28% | 5,6 | | 5.84% | 7 | | 38,789% | 5,7,10 |
| Target 2030 Series Class I | | | | | | | | | |
| | | For the Six
Months Ended
4/30/10
(unaudited) | | | For the Year
Ended
10/31/09 | | | For the Period
3/28/081 to
10/31/08 | |
Per share data (for a share outstanding throughout each period): | | | | | | | | | |
Net asset value - Beginning of period | | $8.90 | | | $7.82 | | | $10.00 | |
| | | | | | | | | |
Income (loss) from investment operations: | | | | | | | | | |
Net investment income2 | | 0.08 | | | 0.11 | | | 0.01 | |
Net realized and unrealized gain (loss) on underlying series | | 1.08 | | | 1.14 | | | (2.19 | ) |
| | | | | | | | | |
Total from investment operations | | 1.16 | | | 1.25 | | | (2.18 | ) |
| | | | | | | | | |
Less distributions to shareholders: | | | | | | | | | |
From net investment income | | (0.10 | ) | | (0.17 | ) | | — | |
From net realized gain on investments | | (0.03 | ) | | — | | | — | |
| | | | | | | | | |
Total distributions to shareholders | | (0.13 | ) | | (0.17 | ) | | — | |
| | | | | | | | | |
Net asset value - End of period | | $9.93 | | | $8.90 | | | $7.82 | |
| | | | | | | | | |
Net assets - End of period (000’s omitted) | | $2,383 | | | $1,316 | | | $12,591 | 3 |
| | | | | | | | | |
Total return4 | | 13.17% | | | 16.56% | | | (21.80% | ) |
Ratios (to average net assets)/Supplemental Data: | | | | | | | | | |
Expenses* | | 0.05% | 5,6 | | 0.05% | 7 | | 0.05% | 5,7 |
Net investment income | | 1.80% | 5 | | 1.37% | | | 0.16% | 5 |
Series portfolio turnover8 | | 15% | | | 9% | | | —% | 9 |
*The investment advisor paid a portion of the Series’ expenses. If these expenses had been incurred by the Series, the expense ratios (to average net assets) would have been increased by the following amounts: | |
| | 0.29% | 5,6 | | 6.18% | 7 | | 14,979% | 5,7,10 |
1Commencement of operations.
2Calculated based on average shares outstanding during the period.
3Represents the whole number without rounding to the 000’s.
4Represents aggregate total return for the period indicated, and assumes reinvestment of all distributions. Total return would have been lower had certain expenses not been reimbursed during the period. Periods less than one year are not annualized.
5Annualized.
6Expense ratios do not include expenses of the underlying series in which the Series invests. The expense ratios of the underlying series were 0.82% for Manning & Napier Pro-Blend® Extended Term Series - Class I and 0.85% for Manning & Napier Pro-Blend® Maximum Term Series - Class I.
7Expense ratios do not include expenses of the underlying series in which the Series invests. The expense ratio of the underlying series was 0.85%.
8Reflects activity of the Series and does not include the activity of the underlying series.
9Less than 1%.
10The increase to the expense ratios (to average net assets) is largely due to the small net assets in each class.
| | | | |
| 17 | | The accompanying notes are an integral part of the financial statements. | | |
Financial Highlights
| | | | | | | | | |
| Target 2040 Series Class K | | | | | | | | | |
| | | For the Six
Months Ended
4/30/10
(unaudited) | | | For the Year
Ended
10/31/09 | | | For the Period
3/28/081 to
10/31/08 | |
Per share data (for a share outstanding throughout each period): | | | | | | | | | |
Net asset value - Beginning of period | | $8.79 | | | $7.58 | | | $10.00 | |
| | | | | | | | | |
Income (loss) from investment operations: | | | | | | | | | |
Net investment income2 | | 0.01 | | | — | 3 | | 0.02 | |
Net realized and unrealized gain (loss) on underlying series | | 1.31 | | | 1.36 | | | (2.44 | ) |
| | | | | | | | | |
Total from investment operations | | 1.32 | | | 1.36 | | | (2.42 | ) |
| | | | | | | | | |
Less distributions to shareholders: | | | | | | | | | |
From net investment income | | (0.05 | ) | | (0.15 | ) | | — | |
From net realized gain on investments | | (0.03 | ) | | — | | | — | |
| | | | | | | | | |
Total distributions to shareholders | | (0.08 | ) | | (0.15 | ) | | — | |
| | | | | | | | | |
Net asset value - End of period | | $10.03 | | | $8.79 | | | $7.58 | |
| | | | | | | | | |
Net assets - End of period (000’s omitted) | | $39,066 | | | $12,880 | | | $76 | 4 |
| | | | | | | | | |
Total return5 | | 15.01% | | | 18.60% | | | (24.20% | ) |
Ratios (to average net assets)/Supplemental Data: | | | | | | | | | |
Expenses*6 | | 0.30% | 7 | | 0.30% | | | 0.30% | 7 |
Net investment income | | 0.26% | 7 | | 0.05% | | | 0.40% | 7 |
Series portfolio turnover8 | | 3% | | | 7% | | | —% | 9 |
*The investment advisor paid a portion of the Series’ expenses. If these expenses had been incurred by the Series, the expense ratios (to average net assets) would have been increased by the following amounts6 : | |
| | 0.39% | 7 | | 2.10% | | | 28,865% | 7,10 |
| Target 2040 Series Class R | | | | | | | | | |
| | | For the Six
Months Ended
4/30/10
(unaudited) | | | For the Year
Ended
10/31/09 | | | For the Period
3/28/081 to
10/31/08 | |
Per share data (for a share outstanding throughout each period): | | | | | | | | | |
Net asset value - Beginning of period | | $8.76 | | | $7.58 | | | $10.00 | |
| | | | | | | | | |
Income (loss) from investment operations: | | | | | | | | | |
Net investment income (loss)2 | | 0.03 | | | (0.02 | ) | | 0.01 | |
Net realized and unrealized gain (loss) on underlying series | | 1.27 | | | 1.35 | | | (2.43 | ) |
| | | | | | | | | |
Total from investment operations | | 1.30 | | | 1.33 | | | (2.42 | ) |
| | | | | | | | | |
Less distributions to shareholders: | | | | | | | | | |
From net investment income | | (0.05 | ) | | (0.15 | ) | | — | |
From net realized gain on investments | | (0.03 | ) | | — | | | — | |
| | | | | | | | | |
Total distributions to shareholders | | (0.08 | ) | | (0.15 | ) | | — | |
| | | | | | | | | |
Net asset value - End of period | | $9.98 | | | $8.76 | | | $7.58 | |
| | | | | | | | | |
Net assets - End of period (000’s omitted) | | $4,826 | | | $504 | | | $76 | 4 |
| | | | | | | | | |
Total return5 | | 14.91% | | | 18.21% | | | (24.20% | ) |
Ratios (to average net assets)/Supplemental Data: | | | | | | | | | |
Expenses*6 | | 0.55% | 7 | | 0.55% | | | 0.55% | 7 |
Net investment income (loss) | | 0.62% | 7 | | (0.21% | ) | | 0.14% | 7 |
Series portfolio turnover8 | | 3% | | | 7% | | | —% | 9 |
*The investment advisor paid a portion of the Series’ expenses. If these expenses had been incurred by the Series, the expense ratios (to average net assets) would have been increased by the following amounts6: | |
| | 0.42% | 7 | | 16.27% | | | 28,865% | 7,10 |
1Commencement of operations.
2Calculated based on average shares outstanding during the period.
3Less than $0.01.
4Represents the whole number without rounding to the 000’s.
5Represents aggregate total return for the period indicated, and assumes reinvestment of all distributions. Total return would have been lower had certain expenses not been reimbursed during the period. Periods less than one year are not annualized.
6Expense ratios do not include expenses of the underlying series in which the Series invests. The expense ratio of the underlying series was 0.85%.
7Annualized.
8Reflects activity of the Series and does not include the activity of the underlying series.
9Less than 1%.
10The increase to the expense ratios (to average net assets) is largely due to the small net assets in each class.
| | | | |
| | The accompanying notes are an integral part of the financial statements. | | 18 |
Financial Highlights
| | | | | | | | | |
| Target 2040 Series Class C | | | | | | | | | |
| | | For the Six
Months Ended
4/30/10
(unaudited) | | | For the Year
Ended
10/31/09 | | | For the Period
3/28/081 to
10/31/08 | |
Per share data (for a share outstanding throughout each period): | | | | | | | | | |
Net asset value - Beginning of period | | $8.70 | | | $7.55 | | | $10.00 | |
| | | | | | | | | |
Income (loss) from investment operations: | | | | | | | | | |
Net investment loss2 | | (0.01 | ) | | (0.06 | ) | | (0.02 | ) |
Net realized and unrealized gain (loss) on underlying series | | 1.29 | | | 1.36 | | | (2.43 | ) |
| | | | | | | | | |
Total from investment operations | | 1.28 | | | 1.30 | | | (2.45 | ) |
| | | | | | | | | |
Less distributions to shareholders: | | | | | | | | | |
From net investment income | | (0.03 | ) | | (0.15 | ) | | — | |
From net realized gain on investments | | (0.03 | ) | | — | | | — | |
| | | | | | | | | |
Total distributions to shareholders | | (0.06 | ) | | (0.15 | ) | | — | |
| | | | | | | | | |
Net asset value - End of period | | $9.92 | | | $8.70 | | | $7.55 | |
| | | | | | | | | |
Net assets - End of period (000’s omitted) | | $824 | | | $440 | | | $75 | 3 |
| | | | | | | | | |
Total return4 | | 14.70% | | | 17.88% | | | (24.50% | ) |
Ratios (to average net assets)/Supplemental Data: | | | | | | | | | |
Expenses*5 | | 1.05% | 6 | | 1.05% | | | 1.05% | 6 |
Net investment loss | | (0.14% | )6 | | (0.65% | ) | | (0.36% | )6 |
Series portfolio turnover7 | | 3% | | | 7% | | | —% | 8 |
*The investment advisor paid a portion of the Series’ expenses. If these expenses had been incurred by the Series, the expense ratios (to average net assets) would have been increased by the following amounts5 : | |
| | 0.50% | 6 | | 15.19% | | | 28,898% | 6,9 |
| Target 2040 Series Class I | | | | | | | | | |
| | | For the Six
Months Ended
4/30/10
(unaudited) | | | For the Year
Ended
10/31/09 | | | For the Period
3/28/081 to
10/31/08 | |
Per share data (for a share outstanding throughout each period): | | | | | | | | | |
Net asset value - Beginning of period | | $8.83 | | | $7.60 | | | $10.00 | |
| | | | | | | | | |
Income (loss) from investment operations: | | | | | | | | | |
Net investment income2 | | 0.05 | | | 0.07 | | | — | 10 |
Net realized and unrealized gain (loss) on underlying series | | 1.29 | | | 1.32 | | | (2.40 | ) |
| | | | | | | | | |
Total from investment operations | | 1.34 | | | 1.39 | | | (2.40 | ) |
| | | | | | | | | |
Less distributions to shareholders: | | | | | | | | | |
From net investment income | | (0.06 | ) | | (0.16 | ) | | — | |
From net realized gain on investments | | (0.03 | ) | | — | | | — | |
| | | | | | | | | |
Total distributions to shareholders | | (0.09 | ) | | (0.16 | ) | | — | |
| | | | | | | | | |
Net asset value - End of period | | $10.08 | | | $8.83 | | | $7.60 | |
| | | | | | | | | |
Net assets - End of period (000’s omitted) | | $985 | | | $428 | | | $28,539 | 3 |
| | | | | | | | | |
Total return4 | | 15.21% | | | 18.86% | | | (24.00% | ) |
Ratios (to average net assets)/Supplemental Data: | | | | | | | | | |
Expenses*5 | | 0.05% | 6 | | 0.05% | | | 0.05% | 6 |
Net investment income (loss) | | 0.97% | 6 | | 0.93% | | | (0.04% | )6 |
Series portfolio turnover7 | | 3% | | | 7% | | | —% | 8 |
*The investment advisor paid a portion of the Series’ expenses. If these expenses had been incurred by the Series, the expense ratios (to average net assets) would have been increased by the following amounts5: | |
| | 0.48% | 6 | | 18.65% | | | 767% | 6,9 |
1Commencement of operations.
2Calculated based on average shares outstanding during the period.
3Represents the whole number without rounding to the 000’s.
4Represents aggregate total return for the period indicated, and assumes reinvestment of all distributions. Total return would have been lower had certain expenses not been reimbursed during the period. Periods less than one year are not annualized.
5Expense ratios do not include expenses of the underlying series in which the Series invests. The expense ratio of the underlying series was 0.85%.
6Annualized.
7Reflects activity of the Series and does not include the activity of the underlying series.
8Less than 1%.
9The increase to the expense ratios (to average net assets) is largely due to the small net assets in each class.
10Less than $0.01.
| | | | |
| 19 | | The accompanying notes are an integral part of the financial statements. | | |
Financial Highlights
| | | | | | | | | |
| Target 2050 Series Class K | | | | | | | | | |
| | | For the Six
Months Ended
4/30/10
(unaudited) | | | For the Year
Ended
10/31/09 | | | For the Period
3/28/081 to
10/31/08 | |
Per share data (for a share outstanding throughout each period): | | | | | | | | | |
Net asset value - Beginning of period | | $8.85 | | | $7.58 | | | $10.00 | |
| | | | | | | | | |
Income (loss) from investment operations: | | | | | | | | | |
Net investment income (loss)2 | | (0.01 | ) | | (0.02 | ) | | 0.02 | |
Net realized and unrealized gain (loss) on underlying series | | 1.34 | | | 1.52 | | | (2.44 | ) |
| | | | | | | | | |
Total from investment operations | | 1.33 | | | 1.50 | | | (2.42 | ) |
| | | | | | | | | |
Less distributions to shareholders: | | | | | | | | | |
From net investment income | | (0.05 | ) | | (0.23 | ) | | — | |
From net realized gain on investments | | (0.08 | ) | | — | | | — | |
| | | | | | | | | |
Total distributions to shareholders | | (0.13 | ) | | (0.23 | ) | | — | |
| | | | | | | | | |
Net asset value - End of period | | $10.05 | | | $8.85 | | | $7.58 | |
| | | | | | | | | |
Net assets - End of period (000’s omitted) | | $12,910 | | | $1,047 | | | $76 | 3 |
| | | | | | | | | |
Total return4 | | 15.07% | | | 20.71% | | | (24.20% | ) |
Ratios (to average net assets)/Supplemental Data: | | | | | | | | | |
Expenses*5 | | 0.30% | 6 | | 0.30% | | | 0.30% | 6 |
Net investment income (loss) | | (0.13% | )6 | | (0.24% | ) | | 0.40% | 6 |
Series portfolio turnover7 | | 2% | | | 46% | | | 1% | |
*The investment advisor paid a portion of the Series’ expenses. If these expenses had been incurred by the Series, the expense ratios (to average net assets) would have been increased by the following amounts5 : | |
| | 1.41% | 6 | | 25.10% | | | 35,232% | 6,8 |
| Target 2050 Series Class R | | | | | | | | | |
| | | For the Six
Months Ended
4/30/10
(unaudited) | | | For the Year
Ended
10/31/09 | | | For the Period
3/28/081 to
10/31/08 | |
Per share data (for a share outstanding throughout each period): | | | | | | | | | |
Net asset value - Beginning of period | | $8.82 | | | $7.58 | | | $10.00 | |
| | | | | | | | | |
Income (loss) from investment operations: | | | | | | | | | |
Net investment income (loss)2 | | 0.02 | | | (0.05 | ) | | 0.01 | |
Net realized and unrealized gain (loss) on underlying series | | 1.30 | | | 1.52 | | | (2.43 | ) |
| | | | | | | | | |
Total from investment operations | | 1.32 | | | 1.47 | | | (2.42 | ) |
| | | | | | | | | |
Less distributions to shareholders: | | | | | | | | | |
From net investment income | | (0.05 | ) | | (0.23 | ) | | — | |
From net realized gain on investments | | (0.08 | ) | | — | | | — | |
| | | | | | | | | |
Total distributions to shareholders | | (0.13 | ) | | (0.23 | ) | | — | |
| | | | | | | | | |
Net asset value - End of period | | $10.01 | | | $8.82 | | | $7.58 | |
| | | | | | | | | |
Net assets - End of period (000’s omitted) | | $996 | | | $601 | | | $76 | 3 |
| | | | | | | | | |
Total return4 | | 15.02% | | | 20.31% | | | (24.20% | ) |
Ratios (to average net assets)/Supplemental Data: | | | | | | | | | |
Expenses*5 | | 0.55% | 6 | | 0.55% | | | 0.55% | 6 |
Net investment income (loss) | | 0.49% | 6 | | (0.50% | ) | | 0.14% | 6 |
Series portfolio turnover7 | | 2% | | | 46% | | | 1% | |
*The investment advisor paid a portion of the Series’ expenses. If these expenses had been incurred by the Series, the expense ratios (to average net assets) would have been increased by the following amounts5: | |
| | 2.96% | 6 | | 242.05% | | | 35,243% | 6,8 |
1Commencement of operations.
2Calculated based on average shares outstanding during the period.
3Represents the whole number without rounding to the 000’s.
4Represents aggregate total return for the period indicated, and assumes reinvestment of all distributions. Total return would have been lower had certain expenses not been reimbursed during the period. Periods less than one year are not annualized.
5Expense ratios do not include expenses of the underlying series in which the Series invests. The expense ratio of the underlying series was 0.85%.
6Annualized.
7Reflects activity of the Series and does not include the activity of the underlying series.
8The increase to the expense ratios (to average net assets) is largely due to the small net assets in each class.
| | | | |
| | The accompanying notes are an integral part of the financial statements. | | 20 |
Financial Highlights
| | | | | | | | | |
| Target 2050 Series Class C | | | | | | | | | |
| | | For the Six
Months Ended
4/30/10
(unaudited) | | | For the Year
Ended
10/31/09 | | | For the Period
3/28/081 to
10/31/08 | |
Per share data (for a share outstanding throughout each period): | | | | | | | | | |
Net asset value - Beginning of period | | $8.75 | | | $7.55 | | | $10.00 | |
| | | | | | | | | |
Income (loss) from investment operations: | | | | | | | | | |
Net investment loss2 | | (0.02 | ) | | (0.06 | ) | | (0.02 | ) |
Net realized and unrealized gain (loss) on underlying series | | 1.29 | | | 1.49 | | | (2.43 | ) |
| | | | | | | | | |
Total from investment operations | | 1.27 | | | 1.43 | | | (2.45 | ) |
| | | | | | | | | |
Less distributions to shareholders: | | | | | | | | | |
From net investment income | | (0.01 | ) | | (0.23 | ) | | — | |
From net realized gain on investments | | (0.08 | ) | | — | | | — | |
| | | | | | | | | |
Total distributions to shareholders | | (0.09 | ) | | (0.23 | ) | | — | |
| | | | | | | | | |
Net asset value - End of period | | $9.93 | | | $8.75 | | | $7.55 | |
| | | | | | | | | |
Net assets - End of period (000’s omitted) | | $315 | | | $99 | | | $75 | 3 |
| | | | | | | | | |
Total return4 | | 14.61% | | | 19.84% | | | (24.50% | ) |
Ratios (to average net assets)/Supplemental Data: | | | | | | | | | |
Expenses*5 | | 1.05% | 6 | | 1.05% | | | 1.05% | 6 |
Net investment loss | | (0.33% | )6 | | (0.71% | ) | | (0.36% | )6 |
Series portfolio turnover7 | | 2% | | | 46% | | | 1% | |
*The investment advisor paid a portion of the Series’ expenses. If these expenses had been incurred by the Series, the expense ratios (to average net assets) would have been increased by the following amounts5 : | |
| | 2.64% | 6 | | 73.45% | | | 35,267% | 6,8 |
| Target 2050 Series Class I | | | | | | | | | |
| | | For the Six
Months Ended
4/30/10
(unaudited) | | | For the Year
Ended
10/31/09 | | | For the Period
3/28/081 to
10/31/08 | |
Per share data (for a share outstanding throughout each period): | | | | | | | | | |
Net asset value - Beginning of period | | $8.90 | | | $7.60 | | | $10.00 | |
| | | | | | | | | |
Income (loss) from investment operations: | | | | | | | | | |
Net investment income2 | | 0.04 | | | 0.16 | | | — | 9 |
Net realized and unrealized gain (loss) on underlying series | | 1.30 | | | 1.37 | | | (2.40 | ) |
| | | | | | | | | |
Total from investment operations | | 1.34 | | | 1.53 | | | (2.40 | ) |
| | | | | | | | | |
Less distributions to shareholders: | | | | | | | | | |
From net investment income | | (0.05 | ) | | (0.23 | ) | | — | |
From net realized gain on investments | | (0.08 | ) | | — | | | — | |
| | | | | | | | | |
Total distributions to shareholders | | (0.13 | ) | | (0.23 | ) | | — | |
| | | | | | | | | |
Net asset value - End of period | | $10.11 | | | $8.90 | | | $7.60 | |
| | | | | | | | | |
Net assets - End of period (000’s omitted) | | $136 | | | $79 | | | $17,863 | 3 |
| | | | | | | | | |
Total return4 | | 15.20% | | | 21.07% | | �� | (24.00% | ) |
Ratios (to average net assets)/Supplemental Data: | | | | | | | | | |
Expenses*5 | | 0.05% | 6 | | 0.05% | | | 0.05% | 6 |
Net investment income (loss) | | 0.83% | 6 | | 2.07% | | | (0.03% | )6 |
Series portfolio turnover7 | | 2% | | | 46% | | | 1% | |
*The investment advisor paid a portion of the Series’ expenses. If these expenses had been incurred by the Series, the expense ratios (to average net assets) would have been increased by the following amounts5: | |
| | 3.08% | 6 | | 141.53% | | | 1,903% | 6,8 |
1Commencement of operations.
2Calculated based on average shares outstanding during the period.
3Represents the whole number without rounding to the 000’s.
4Represents aggregate total return for the period indicated, and assumes reinvestment of all distributions. Total return would have been lower had certain expenses not been reimbursed during the period. Periods less than one year are not annualized.
5Expense ratios do not include expenses of the underlying series in which the Series invests. The expense ratio of the underlying series was 0.85%.
6Annualized.
7Reflects activity of the Series and does not include the activity of the underlying series.
8The increase to the expense ratios (to average net assets) is largely due to the small net assets in each class.
9Less than $0.01.
| | | | |
| 21 | | The accompanying notes are an integral part of the financial statements. | | |
Notes to Financial Statements (unaudited)
Target Income Series, Target 2010 Series, Target 2020 Series, Target 2030 Series, Target 2040 Series and Target 2050 Series (each the “Series”) are no-load diversified series of Manning & Napier Fund, Inc. (the “Fund”). The Fund is organized in Maryland and is registered under the Investment Company Act of 1940 (the “1940 Act”), as amended, as an open-end management investment company.
Each Series seeks to achieve its investment objectives by investing in a combination of other Manning & Napier mutual funds (the “underlying series”) in order to meet its target asset allocations and investment style. The Series are designed to provide a single investment portfolio that adjusts over time to meet the changing risk and return objectives of investors over their expected investment horizon. As the target retirement date approaches, the Series’ portfolio becomes more conservative with a larger fixed-income investment component. The financial statements of the underlying series should be read in conjunction with the Series’ financial statements.
Each Series is authorized to issue four classes of shares (Class K, R, C and I). Each class of shares is substantially the same, except that class-specific distribution and shareholder servicing expenses are borne by the specific class of shares to which they relate.
The Fund’s Advisor is Manning & Napier Advisors, Inc. (the “Advisor”). Shares of each Series are offered to investors and employees of the Advisor and its affiliates. The total authorized capital stock of the Fund consists of 10.0 billion shares of common stock each having a par value of $0.01. As of April 30, 2010, 6.2 billion shares have been designated in total among 29 series, of which 10 million have been designated in each of the Series for Class C and I common stock and 40 million have been designated in each of the Series for Class K and R common stock.
| 2. | SIGNIFICANT ACCOUNTING POLICIES |
Security Valuation
Investments in the underlying series are valued at their net asset value per share on valuation date. In the absence of the availability of a net asset value per share on the underlying series, security valuations may be determined in good faith by the Advisor under procedures approved by and under the general supervision and responsibility of the Fund’s Board of Directors (the “Board”).
Volume and level of activity in established markets for an asset or liability are evaluated to determine whether recent transactions and quoted prices are determinative of fair value. Where there have been significant decreases in volume and level of activity, further analysis and adjustment may be necessary to estimate fair value. The Series measure fair value in these instances by the use of inputs and valuation techniques which may be based upon current market prices of securities that are comparable in coupon, rating, maturity and industry and/or expectation of future cash flows. As a result of trading in relatively thin markets and/or markets that experience significant volatility, the prices used by the Series to value these securities may differ from the value that would be realized if these securities were sold, and the differences could be material.
Securities for which representative valuations or prices are not available from the Fund’s pricing service may be valued at fair value. Due to the inherent uncertainty of valuations of such securities, the fair value may differ significantly from the values that would have been used had a ready market for such securities existed. If trading or events occurring after the close of the principal market in which securities are traded are expected to materially affect the value of those securities, then they may be valued at their fair value, taking this trading or these events into account. Fair value is determined in good faith by the Advisor under procedures approved by and under the general supervision and responsibility of the Board.
Various inputs are used in determining the value of the Series’ assets or liabilities carried at market value. These inputs are summarized in three broad levels. Level 1 includes quoted prices in active markets for identical assets and liabilities. Level 2 includes other significant observable inputs (including quoted prices for similar securities,
Notes to Financial Statements (unaudited)
| 2. | SIGNIFICANT ACCOUNTING POLICIES (continued) |
Security Valuation (continued)
interest rates, prepayment speeds, credit risk, etc.). Level 3 includes significant unobservable inputs (including the Series’ own assumptions in determining the fair value of investments). The inputs or methodology used for valuing securities are not necessarily an indication of the risk associated with investing in those securities.
The following is a summary of the valuation levels used for major security types as of April 30, 2010 in valuing the Series’ assets or liabilities carried at market value:
| | | | | | | | | | | | |
| | | | | Target Income Series | | |
| Description | | 4/30/10 | | Level 1 | | Level 2 | | Level 3 |
Mutual funds | | $ | 46,436,179 | | $ | 46,436,179 | | $ | — | | $ | — |
Other financial
instruments* | | | — | | | — | | | — | | | — |
| | | | | | | | | | | | |
Total | | $ | 46,436,179 | | $ | 46,436,179 | | $ | — | | $ | — |
| | | | | | | | | | | | |
| | | | | | | | | | | | |
| | | | | Target 2010 Series | | |
| Description | | 4/30/10 | | Level 1 | | Level 2 | | Level 3 |
Mutual funds | | $ | 33,208,217 | | $ | 33,208,217 | | $ | — | | $ | — |
Other financial
instruments* | | | — | | | — | | | — | | | — |
| | | | | | | | | | | | |
Total | | $ | 33,208,217 | | $ | 33,208,217 | | $ | — | | $ | — |
| | | | | | | | | | | | |
| | | | | | | | | | | | |
| | | | | Target 2020 Series | | |
| Description | | 4/30/10 | | Level 1 | | Level 2 | | Level 3 |
Mutual funds | | $ | 73,746,047 | | $ | 73,746,047 | | $ | — | | $ | — |
Other financial
instruments* | | | — | | | — | | | — | | | — |
| | | | | | | | | | | | |
Total | | $ | 73,746,047 | | $ | 73,746,047 | | $ | — | | $ | — |
| | | | | | | | | | | | |
| | | | | | | | | | | | |
| | | | | Target 2030 Series | | |
| Description | | 4/30/10 | | Level 1 | | Level 2 | | Level 3 |
Mutual funds | | $ | 68,758,780 | | $ | 68,758,780 | | $ | — | | $ | — |
Other financial
instruments* | | | — | | | — | | | — | | | — |
| | | | | | | | | | | | |
Total | | $ | 68,758,780 | | $ | 68,758,780 | | $ | — | | $ | — |
| | | | | | | | | | | | |
| | | | | | | | | | | | |
| | | | | Target 2040 Series | | |
| Description | | 4/30/10 | | Level 1 | | Level 2 | | Level 3 |
Mutual funds | | $ | 45,722,467 | | $ | 45,722,467 | | $ | — | | $ | — |
Other financial
instruments* | | | — | | | — | | | — | | | — |
| | | | | | | | | | | | |
Total | | $ | 45,722,467 | | $ | 45,722,467 | | $ | — | | $ | — |
| | | | | | | | | | | | |
Notes to Financial Statements (unaudited)
| 2. | SIGNIFICANT ACCOUNTING POLICIES (continued) |
Security Valuation (continued)
| | | | | | | | | | | | |
| | | | | Target 2050 Series | | |
| Description | | 4/30/10 | | Level 1 | | Level 2 | | Level 3 |
Mutual funds | | $ | 14,365,079 | | $ | 14,365,079 | | $ | — | | $ | — |
Other financial
instruments* | | | — | | | — | | | — | | | — |
| | | | | | | | | | | | |
Total | | $ | 14,365,079 | | $ | 14,365,079 | | $ | — | | $ | — |
| | | | | | | | | | | | |
*Other financial instruments are derivative instruments, such as futures, forwards and swap contracts, which are valued at the unrealized appreciation/depreciation on the instrument. As of April 30, 2010, the Series did not hold any derivative instruments.
There were no Level 3 securities held by any of the Series as of April 30, 2009 or April 30, 2010.
The Fund’s policy is to recognize transfers in and transfers out of valuation levels as of the end of the reporting period. There were no significant transfers between Level 1 and Level 2 as of April 30, 2010.
Additional disclosure surrounding the activity in Level 3 fair value measurement will also be effective for fiscal years beginning after December 15, 2010. Management has concluded that this will not have a material impact on the Series’ financial statements.
Security Transactions, Investment Income and Expenses
Security transactions are accounted for on trade date. Dividend income is recorded on the ex-dividend date. Non-cash dividends, if any, are recorded at the fair market value of the securities received.
Expenses are recorded on an accrual basis. Most expenses of the Fund can be attributed to a specific series. Expenses which cannot be directly attributed are apportioned among the series in the Fund in such a manner as deemed equitable by the Fund’s Board, taking into consideration, among other things, the nature and type of expense. Expenses included in the accompanying statements of operations do not include any expense of the underlying series.
Income, expenses (other than class specific expenses), and realized and unrealized gains and losses are prorated among the classes based on the relative net assets of each class. Class specific expenses are directly charged to that Class.
The Series use the identified cost method for determining realized gain or loss on investments for both financial statement and federal income tax reporting purposes.
Federal Taxes
Each Series’ policy is to comply with the provisions of the Internal Revenue Code applicable to regulated investment companies. The Series are not subject to federal income tax or excise tax to the extent that each Series distributes to shareholders each year its taxable income, including any net realized gains on investments, in accordance with requirements of the Internal Revenue Code. Accordingly, no provision for federal income tax or excise tax has been made in the financial statements.
Management evaluates its tax positions to determine if the tax positions taken meet the minimum recognition threshold in connection with accounting for uncertainties in income tax positions taken or expected to be taken for the purposes of measuring and recognizing tax liabilities in the financial statements. Recognition of tax benefits of an uncertain tax position is required only when the position is “more likely than not” to be sustained assuming examination by taxing authorities. At April 30, 2010, the Series have recorded no liability for net unrecognized tax benefits relating to uncertain income tax positions taken or expected to betaken in future tax returns.
Notes to Financial Statements (unaudited)
| 2. | SIGNIFICANT ACCOUNTING POLICIES (continued) |
Federal Taxes (continued)
The Series file income tax returns in the U.S. federal jurisdiction, various states and foreign jurisdictions, as required. No income tax returns are currently under investigation. The statute of limitations on the Series’ tax returns remains open for the years ended October 31, 2008 through October 31, 2009. The Fund is not aware of any tax positions for which it is reasonably possible that the total amounts of unrecognized tax benefits will significantly change in the next twelve months.
Additionally, based on the Series’ understanding of the tax rules and rates related to income, gains and transactions for foreign jurisdictions in which it invests, the Series will provide for foreign taxes, and where appropriate, deferred foreign tax.
Distributions of Income and Gains
Distributions to shareholders of net investment income are made semi-annually. Distributions of net realized gains are made annually. An additional distribution may be necessary to avoid taxation of a Series. Distributions are recorded on the ex-dividend date.
Indemnifications
The Fund’s organizational documents provide former and current directors and officers with a limited indemnification against liabilities arising in connection with the performance of their duties to the Fund. In the normal course of business, the Fund may also enter into contracts that provide general indemnifications. The Fund’s maximum exposure under these arrangements is unknown as this would be dependent on future claims that may be made against the Fund. The risk of material loss from such claims is considered remote.
Other
The preparation of financial statements in conformity with accounting principles generally accepted in the United States of America requires management to make estimates and assumptions that affect the reported amounts of assets and liabilities and the disclosure of contingent assets and liabilities at the date of the financial statements and the reported amounts of income and expenses during the reporting period. Actual results could differ from those estimates.
| 3. | TRANSACTIONS WITH AFFILIATES |
The Fund has an Investment Advisory Agreement (the “Agreement”) with the Advisor, for which the Advisor does not receive an advisory fee for the services it performs for the Series. However, the Advisor is entitled to receive an advisory fee from its investment in each of the underlying series.
Under the Agreement, personnel of the Advisor provide the Series with advice and assistance in the choice of investments and the execution of securities transactions, and otherwise maintain the Series’ organization. The Advisor also provides the Fund with necessary office space and fund administration and support services. The salaries of all officers of the Fund (except a percentage of the Fund’s Chief Compliance Officer’s salary, which is paid by the Fund), and of all Directors who are “affiliated persons” of the Fund, or of the Advisor, and all personnel of the Fund, or of the Advisor, performing services relating to research, statistical and investment activities, are paid by the Advisor. Each “non-affiliated” Director receives an annual stipend, which is allocated among all the active series of the Fund. In addition, these Directors also receive a fee per Board meeting attended for each active series of the Fund plus a fee for each committee meeting attended.
Notes to Financial Statements (unaudited)
| 3. | TRANSACTIONS WITH AFFILIATES (continued) |
The Advisor has contractually agreed, until at least February 28, 2020, to limit each class’ total direct annual fund operating expenses for the Series at no more than 0.05% for each class, exclusive of distribution and service fees, of average daily net assets each year. The Advisor’s agreement to limit each class’ operating expenses is limited to direct operating expenses and, therefore, does not apply to the indirect expenses incurred by the Series through their investments in the underlying series. For the six months ended April 30, 2010, the Advisor reimbursed expenses of $54,233 for Target Income Series, $64,068 for Target 2010 Series, $58,050 for Target 2020 Series, $60,597 for Target 2030 Series, $63,173 for Target 2040 Series and $68,345 for Target 2050 Series, which is included as a reduction of expenses on the Statements of Operations. For the six months ended April 30, 2010, the Advisor voluntarily waived additional fees of $758 for each Series, which is also included as a reduction of expenses on the Statements of Operations. The Advisor is not eligible to recoup any expenses that have been reimbursed in prior years.
Manning & Napier Investor Services, Inc., a registered broker-dealer affiliate of the Advisor, acts as distributor for the Fund’s shares. Each Series compensates the distributor for distributing and servicing the Series’ Class K, Class R and Class C shares pursuant to a distribution plan adopted under Rule 12b-1 of the 1940 Act, regardless of expenses actually incurred. Under the agreement, each Series pays distribution and services fees to the distributor at an annual rate of 0.25% of average daily net assets attributable to Class K shares, 0.50% of average daily net assets attributable to Class R shares, and 1.00% of average daily net assets attributable to Class C shares. There are no distribution and services fees on the Class I shares of each Series. The fees are accrued daily and paid monthly.
For fund accounting services through November 7, 2009, the Fund paid the Advisor an annual fee of $19,000 for each Target Series. For transfer agency services through November 7, 2009, the Fund pays the Advisor an annual fee of $12,000 per class for each Target Series. Additionally, certain transaction and account-based fees and out-of-pocket expenses, including charges for reporting relating to the Fund’s compliance program, are charged. Expenses not directly attributable to a Series are allocated based on each series’ relative net assets or number of accounts, depending on the expense. Prior to October 12, 2009 (for sub-accountant) and November 9, 2009 (for sub-transfer agent), the Advisor had an agreement with Citi Fund Services, Ohio, Inc. (“Citi”) under which Citi served as sub-accountant and sub-transfer agent.
The Advisor has entered into agreements dated October 12, 2009 and November 9, 2009 with PNC Global Investment Servicing (U.S.) Inc. (“PNCGIS”) under which PNCGIS serves as sub-accountant services agent and sub-transfer agent, respectively. Effective November 7, 2009 under the amended master services agreement, the fee rates for these Series are as follows: An annual fee of 0.025% of the average daily net assets with an annual base fee of $40,500 per Series. Additionally, certain account-based fees, cusip-based and out-of-pocket expenses are charged.
On February 2, 2010, The PNC Financial Services Group, Inc. (“PNC”), which serves as the Series’ sub-accountant services agent and sub-transfer agent, entered into a Stock Purchase Agreement (the “Stock Purchase Agreement”) with The Bank of New York Mellon Corporation (“BNY Mellon”), the Series’ custodian. Upon the terms and subject to the conditions set forth in the Stock Purchase Agreement, which has been approved by the board of directors of each company, PNC will sell to BNY Mellon (the “Stock Sale”) 100% of the issued and outstanding shares of PNC Global Investment Servicing Inc., an indirect, wholly-owned subsidiary of PNC. The Stock Sale is expected to close in the third quarter of 2010. Management has concluded that this will not have a material impact on the Series’ financial statements.
Notes to Financial Statements (unaudited)
| 4. | PURCHASES AND SALES OF SECURITIES |
For the six months ended April 30, 2010, purchases and sales of underlying series were as follows:
| | | | | | |
| Series | | Purchases | | Sales |
Target Income Series | | $ | 4,432,534 | | $ | 2,454,962 |
Target 2010 Series | | $ | 14,371,441 | | $ | 990,057 |
Target 2020 Series | | $ | 44,952,682 | | $ | 10,729,956 |
Target 2030 Series | | $ | 44,626,157 | | $ | 7,005,068 |
Target 2040 Series | | $ | 28,800,395 | | $ | 906,335 |
Target 2050 Series | | $ | 11,948,372 | | $ | 194,652 |
| 5. | INVESTMENTS IN AFFILIATED ISSUERS |
A summary of the Funds’ transactions in the shares of affiliated issuers during the six months ended April 30, 2010 is set forth below:
| | | | | | | | | | | | | | | | | |
| Target Income Series | | Shares Held at
10/31/09 | | Shares
Purchased | | Shares Sold | | Shares Held at
4/30/10 | | Value at 4/30/10 | | Dividend
Income
10/31/09
through
4/30/10 | | Net Realized
Gain 10/31/09 through 4/30/10 |
Manning & Napier
Pro-Blend®
Conservative Term
Series - Class I | | 4,211,835 | | 433,629 | | 239,754 | | 4,405,710 | | $ | 46,436,179 | | $ | 598,122 | | $ | 275,599 |
| | | | | | | | | | | | | | | | | |
| | 4,211,835 | | 433,629 | | 239,754 | | 4,405,710 | | $ | 46,436,179 | | $ | 598,122 | | $ | 275,599 |
| | | | | | | | | | | | | | | | | |
| | | | | | | | | | | | | | | | | |
| Target 2010 Series | | Shares Held at
10/31/09 | | Shares
Purchased | | Shares Sold | | Shares Held at
4/30/10 | | Value at 4/30/10 | | Dividend
Income
10/31/09
through
4/30/10 | | Net Realized Gain 10/31/09 through 4/30/10 |
Manning & Napier
Pro-Blend®
Moderate Term Series -
Class I | | 1,888,430 | | 1,461,097 | | 100,191 | | 3,249,336 | | $ | 33,208,217 | | $ | 250,395 | | $ | 185,523 |
| | | | | | | | | | | | | | | | | |
| | 1,888,430 | | 1,461,097 | | 100,191 | | 3,249,336 | | $ | 33,208,217 | | $ | 250,395 | | $ | 185,523 |
| | | | | | | | | | | | | | | | | |
| | | | | | | | | | | | | | | | | |
| Target 2020 Series | | Shares Held at
10/31/09 | | Shares
Purchased | | Shares Sold | | Shares Held at
4/30/10 | | Value at 4/30/10 | | Dividend
Income
10/31/09
through
4/30/10 | | Net Realized Gain 10/31/09 through 4/30/10 |
Manning & Napier
Pro-Blend®
Extended Term Series -
Class I | | 3,823,579 | | 3,223,880 | | 1,087,372 | | 5,960,087 | | $ | 59,183,668 | | $ | 621,223 | | $ | 2,401,751 |
Manning & Napier
Pro-Blend®
Moderate Term Series -
Class I | | — | | 1,460,697 | | 35,807 | | 1,424,890 | | | 14,562,379 | | | — | | | 5,628 |
| | | | | | | | | | | | | | | | | |
| | 3,823,579 | | 4,684,577 | | 1,123,179 | | 7,384,977 | | $ | 73,746,047 | | $ | 621,223 | | $ | 2,407,379 |
| | | | | | | | | | | | | | | | | |
Notes to Financial Statements (unaudited)
| 5. | INVESTMENTS IN AFFILIATED ISSUERS (continued) |
| | | | | | | | | | | | | | | | | |
| Target 2030 Series | | Shares Held at
10/31/09 | | Shares
Purchased | | Shares Sold | | Shares Held at
4/30/10 | | Value at 4/30/10 | | Dividend
Income
10/31/09
through
4/30/10 | | Net Realized Gain 10/31/09 through 4/30/10 |
Manning & Napier
Pro-Blend®
Maximum Term Series -
Class I | | 1,534,165 | | 1,756,748 | | 522,954 | | 2,767,959 | | $ | 27,596,549 | | $ | 82,872 | | $ | 1,535,391 |
Manning & Napier
Pro-Blend®
Extended Term Series -
Class I | | 1,425,116 | | 2,937,995 | | 217,871 | | 4,145,240 | | | 41,162,231 | | | 208,625 | | | 454,741 |
| | | | | | | | | | | | | | | | | |
| | 2,959,281 | | 4,694,743 | | 740,825 | | 6,913,199 | | $ | 68,758,780 | | $ | 291,497 | | $ | 1,990,132 |
| | | | | | | | | | | | | | | | | |
| | | | | | | | | | | | | | | | | |
| Target 2040 Series | | Shares Held at
10/31/09 | | Shares
Purchased | | Shares Sold | | Shares Held at
4/30/10 | | Value at 4/30/10 | | Dividend
Income
10/31/09
through
4/30/10 | | Net Realized Gain 10/31/09 through 4/30/10 |
Manning & Napier
Pro-Blend®
Maximum Term Series -
Class I | | 1,638,937 | | 3,043,224 | | 96,156 | | 4,586,005 | | $ | 45,722,467 | | $ | 102,094 | | $ | 277,473 |
| | | | | | | | | | | | | | | | | |
| | 1,638,937 | | 3,043,224 | | 96,156 | | 4,586,005 | | $ | 45,722,467 | | $ | 102,094 | | $ | 277,473 |
| | | | | | | | | | | | | | | | | |
| | | | | | | | | | | | | | | | | |
| Target 2050 Series | | Shares Held at
10/31/09 | | Shares
Purchased | | Shares Sold | | Shares Held at
4/30/10 | | Value at 4/30/10 | | Dividend
Income
10/31/09
through
4/30/10 | | Net Realized Gain 10/31/09 through 4/30/10 |
Manning & Napier
Pro-Blend®
Maximum Term Series -
Class I | | 209,860 | | 1,252,234 | | 21,264 | | 1,440,830 | | $ | 14,365,079 | | $ | 11,293 | | $ | 24,766 |
| | | | | | | | | | | | | | | | | |
| | 209,860 | | 1,252,234 | | 21,264 | | 1,440,830 | | $ | 14,365,079 | | $ | 11,293 | | $ | 24,766 |
| | | | | | | | | | | | | | | | | |
| 6. | CAPITAL STOCK TRANSACTIONS |
Transactions in Class K, Class R, Class C and Class I shares:
| | | | | | | | | | | | | | | | | | | | | | | | | | | | |
Target Income Series: | | For the Six Months Ended 4/30/10 Class K | | | For the Year Ended 10/31/09 Class K | | | For the Six Months Ended 4/30/10 Class R | | | For the Year Ended 10/31/09 Class R | |
| Sold | | 330,708 | | | $ | 3,371,474 | | | 4,514,355 | | | $ | 41,239,891 | | | 14,943 | | | $ | 155,166 | | | 5,379 | | | $ | 54,154 | |
| Reinvested | | 78,192 | | | | 792,084 | | | 201 | | | | 1,841 | | | 30 | | | | 308 | | | — | * | | | 2 | |
| Repurchased | | (258,477 | ) | | | (2,641,807 | ) | | (366,425 | ) | | | (3,488,850 | ) | | — | * | | | (2 | ) | | (71 | ) | | | (718 | ) |
| | | | | | | | | | | | | | | | | | | | | | | | | | | | |
| Total | | 150,423 | | | $ | 1,521,751 | | | 4,148,131 | | | $ | 37,752,882 | | | 14,973 | | | $ | 155,472 | | | 5,308 | | | $ | 53,438 | |
| | | | | | | | | | | | | | | | | | | | | | | | | | | | |
Notes to Financial Statements (unaudited)
| 6. | CAPITAL STOCK TRANSACTIONS (continued) |
| | | | | | | | | | | | | | | | | | | | | | | | | | | | |
Target Income Series: | | For the Six Months Ended 4/30/10 Class C | | | For the Year Ended 10/31/09 Class C | | | For the Six Months Ended 4/30/10 Class I | | | For the Year Ended 10/31/09 Class I | |
Sold | | 41,168 | | | $ | 416,889 | | | 38,623 | | | $ | 368,418 | | | 22,588 | | | $ | 233,912 | | | 10,821 | | | $ | 103,574 | |
Reinvested | | 497 | | | | 4,971 | | | — | * | | | 2 | | | 366 | | | | 3,713 | | | 6 | | | | 53 | |
Repurchased | | (5,589 | ) | | | (56,000 | ) | | (5,663 | ) | | | (49,236 | ) | | (921 | ) | | | (9,411 | ) | | (5,136 | ) | | | (49,396 | ) |
| | | | | | | | | | | | | | | | | | | | | | | | | | | | |
Total | | 36,076 | | | $ | 365,860 | | | 32,960 | | | $ | 319,184 | | | 22,033 | | | $ | 228,214 | | | 5,691 | | | $ | 54,231 | |
| | | | | | | | | | | | | | | | | | | | | | | | | | | | |
| | | | | | | | | | | | | | | | | | | | | | | | | | | | |
Target 2010 Series: | | For the Six Months Ended 4/30/10 Class K | | | For the Year Ended 10/31/09 Class K | | | For the Six Months Ended 4/30/10 Class R | | | For the Year Ended 10/31/09 Class R | |
Sold | | 1,073,312 | | | $ | 10,573,814 | | | 1,742,272 | | | $ | 14,833,594 | | | 218,678 | | | $ | 2,146,641 | | | 29,844 | | | $ | 281,376 | |
Reinvested | | 23,677 | | | | 231,088 | | | 472 | | | | 3,846 | | | 3,025 | | | | 29,377 | | | — | * | | | 2 | |
Repurchased | | (71,168 | ) | | | (712,580 | ) | | (107,542 | ) | | | (949,897 | ) | | (15,000 | ) | | | (147,292 | ) | | (111 | ) | | | (941 | ) |
| | | | | | | | | | | | | | | | | | | | | | | | | | | | |
Total | | 1,025,821 | | | $ | 10,092,322 | | | 1,635,202 | | | $ | 13,887,543 | | | 206,703 | | | $ | 2,028,726 | | | 29,733 | | | $ | 280,437 | |
| | | | | | | | | | | | | | | | | | | | | | | | | | | | |
| | | | | | | | | | | | | | | | | | | | | | | | | | | | |
Target 2010 Series: | | For the Six Months Ended 4/30/10 Class C | | | For the Year Ended 10/31/09 Class C | | | For the Six Months Ended 4/30/10 Class I | | | For the Year Ended 10/31/09 Class I | |
Sold | | 99,439 | | | $ | 979,533 | | | 143,296 | | | $ | 1,279,993 | | | 100,392 | | | $ | 1,003,537 | | | 51,725 | | | $ | 455,086 | |
Reinvested | | 1,572 | | | | 15,238 | | | 261 | | | | 2,116 | | | 1,102 | | | | 10,792 | | | 140 | | | | 1,141 | |
Repurchased | | (57,127 | ) | | | (555,610 | ) | | — | | | | — | | | (11,633 | ) | | | (116,554 | ) | | (3,155 | ) | | | (27,973 | ) |
| | | | | | | | | | | | | | | | | | | | | | | | | | | | |
Total | | 43,884 | | | $ | 439,161 | | | 143,557 | | | $ | 1,282,109 | | | 89,861 | | | $ | 897,775 | | | 48,710 | | | $ | 428,254 | |
| | | | | | | | | | | | | | | | | | | | | | | | | | | | |
| | | | | | | | | | | | | | | | | | | | | | | | | | | | |
Target 2020 Series: | | For the Six Months Ended 4/30/10 Class K | | | For the Year Ended 10/31/09 Class K | | | For the Six Months Ended 4/30/10 Class R | | | For the Year Ended 10/31/09 Class R | |
Sold | | 2,893,712 | | | $ | 27,546,884 | | | 3,443,211 | | | $ | 28,020,075 | | | 751,156 | | | $ | 7,181,808 | | | 61,784 | | | $ | 554,710 | |
Reinvested | | 57,725 | | | | 542,619 | | | 1,274 | | | | 9,533 | | | 8,537 | | | | 79,648 | | | — | * | | | 2 | |
Repurchased | | (317,655 | ) | | | (3,081,741 | ) | | (158,310 | ) | | | (1,363,931 | ) | | (27,954 | ) | | | (265,470 | ) | | (51 | ) | | | (379 | ) |
| | | | | | | | | | | | | | | | | | | | | | | | | | | | |
Total | | 2,633,782 | | | $ | 25,007,762 | | | 3,286,175 | | | $ | 26,665,677 | | | 731,739 | | | $ | 6,995,986 | | | 61,733 | | | $ | 554,333 | |
| | | | | | | | | | | | | | | | | | | | | | | | | | | | |
| | | | | | | | | | | | | | | | | | | | | | | | | | | | |
Target 2020 Series: | | For the Six Months Ended 4/30/10 Class C | | | For the Year Ended 10/31/09 Class C | | | For the Six Months Ended 4/30/10 Class I | | | For the Year Ended 10/31/09 Class I | |
Sold | | 124,724 | | | $ | 1,176,610 | | | 205,520 | | | $ | 1,694,895 | | | 152,300 | | | $ | 1,478,631 | | | 260,233 | | | $ | 2,131,142 | |
Reinvested | | 4,034 | | | | 37,601 | | | 727 | | | | 5,417 | | | 4,528 | | | | 42,657 | | | 913 | | | | 6,847 | |
Repurchased | | (14,436 | ) | | | (136,797 | ) | | (130 | ) | | | (1,200 | ) | | (21,883 | ) | | | (212,853 | ) | | (57,717 | ) | | | (470,057 | ) |
| | | | �� | | | | | | | | | | | | | | | | | | | | | | | | |
Total | | 114,322 | | | $ | 1,077,414 | | | 206,117 | | | $ | 1,699,112 | | | 134,945 | | | $ | 1,308,435 | | | 203,429 | | | $ | 1,667,932 | |
| | | | | | | | | | | | | | | | | | | | | | | | | | | | |
Notes to Financial Statements (unaudited)
| 6. | CAPITAL STOCK TRANSACTIONS (continued) |
| | | | | | | | | | | | | | | | | | | | | | | | | | | | |
Target 2030 Series: | | For the Six Months Ended 4/30/10 Class K | | | For the Year Ended 10/31/09 Class K | | | For the Six Months Ended 4/30/10 Class R | | | For the Year Ended 10/31/09 Class R | |
Sold | | 3,923,826 | | | $ | 36,953,573 | | | 2,794,177 | | | $ | 21,809,364 | | | 304,385 | | | $ | 2,946,903 | | | 37,951 | | | $ | 332,769 | |
Reinvested | | 35,510 | | | | 327,760 | | | 1 | | | | 5 | | | 1,440 | | | | 13,232 | | | — | * | | | 2 | |
Repurchased | | (452,821 | ) | | | (4,218,489 | ) | | (127,671 | ) | | | (1,047,780 | ) | | (10,046 | ) | | | (95,217 | ) | | (807 | ) | | | (5,692 | ) |
| | | | | | | | | | | | | | | | | | | | | | | | | | | | |
Total | | 3,506,515 | | | $ | 33,062,844 | | | 2,666,507 | | | $ | 20,761,589 | | | 295,779 | | | $ | 2,864,918 | | | 37,144 | | | $ | 327,079 | |
| | | | | | | | | | | | | | | | | | | | | | | | | | | | |
| | | | | | | | | | | | | | | | | | | | | | | | | | | | |
Target 2030 Series: | | For the Six Months Ended 4/30/10 Class C | | | For the Year Ended 10/31/09 Class C | | | For the Six Months Ended 4/30/10 Class I | | | For the Year Ended 10/31/09 Class I | |
Sold | | 110,565 | | | $ | 1,033,111 | | | 118,501 | | | $ | 958,524 | | | 106,692 | | | $ | 1,014,572 | | | 199,628 | | | $ | 1,570,440 | |
Reinvested | | 1,262 | | | | 11,572 | | | 119 | | | | 828 | | | 2,605 | | | | 24,148 | | | 838 | | | | 5,897 | |
Repurchased | | (8,672 | ) | | | (79,234 | ) | | (797 | ) | | | (7,212 | ) | | (17,077 | ) | | | (163,501 | ) | | (54,262 | ) | | | (410,564 | ) |
| | | | | | | | | | | | | | | | | | | | | | | | | | | | |
Total | | 103,155 | | | $ | 965,449 | | | 117,823 | | | $ | 952,140 | | | 92,220 | | | $ | 875,219 | | | 146,204 | | | $ | 1,165,773 | |
| | | | | | | | | | | | | | | | | | | | | | | | | | | | |
| | | | | | | | | | | | | | | | | | | | | | | | | | | | |
Target 2040 Series: | | For the Six Months Ended 4/30/10 Class K | | | For the Year Ended 10/31/09 Class K | | | For the Six Months Ended 4/30/10 Class R | | | For the Year Ended 10/31/09 Class R | |
Sold | | 2,569,739 | | | $ | 24,556,771 | | | 1,526,640 | | | $ | 11,952,261 | | | 457,760 | | | $ | 4,303,572 | | | 57,580 | | | $ | 486,565 | |
Reinvested | | 11,994 | | | | 111,782 | | | 118 | | | | 797 | | | 2,999 | | | | 27,830 | | | 1 | | | | 2 | |
Repurchased | | (154,033 | ) | | | (1,466,282 | ) | | (61,166 | ) | | | (497,219 | ) | | (34,785 | ) | | | (327,154 | ) | | (83 | ) | | | (698 | ) |
| | | | | | | | | | | | | | | | | | | | | | | | | | | | |
Total | | 2,427,700 | | | $ | 23,202,271 | | | 1,465,592 | | | $ | 11,455,839 | | | 425,974 | | | $ | 4,004,248 | | | 57,498 | | | $ | 485,869 | |
| | | | | | | | | | | | | | | | | | | | | | | | | | | | |
| | | | | | | | | | | | | | | | | | | | | | | | | | | | |
Target 2040 Series: | | For the Six Months Ended 4/30/10 Class C | | | For the Year Ended 10/31/09 Class C | | | For the Six Months Ended 4/30/10 Class I | | | For the Year Ended 10/31/09 Class I | |
Sold | | 32,245 | | | $ | 304,382 | | | 50,606 | | | $ | 434,520 | | | 52,872 | | | $ | 501,651 | | | 49,478 | | | $ | 378,200 | |
Reinvested | | 278 | | | | 2,567 | | | 1 | | | | 2 | | | 691 | | | | 6,467 | | | 186 | | | | 1,266 | |
Repurchased | | — | | | | — | | | — | | | | — | | | (4,393 | ) | | | (42,279 | ) | | (4,920 | ) | | | (37,513 | ) |
| | | | | | | | | | | | | | | | | | | | | | | | | | | | |
Total | | 32,523 | | | $ | 306,949 | | | 50,607 | | | $ | 434,522 | | | 49,170 | | | $ | 465,839 | | | 44,744 | | | $ | 341,953 | |
| | | | | | | | | | | | | | | | | | | | | | | | | | | | |
| | | | | | | | | | | | | | | | | | | | | | | | | | | | |
Target 2050 Series: | | For the Six Months Ended 4/30/10 Class K | | | For the Year Ended 10/31/09 Class K | | | For the Six Months Ended 4/30/10 Class R | | | For the Year Ended 10/31/09 Class R | |
Sold | | 1,178,105 | | | $ | 11,343,398 | | | 138,367 | | | $ | 1,163,926 | | | 49,587 | | | $ | 483,867 | | | 68,090 | | | $ | 614,158 | |
Reinvested | | 1,744 | | | | 16,291 | | | — | * | | | 2 | | | 877 | | | | 8,153 | | | — | * | | | 2 | |
Repurchased | | (14,134 | ) | | | (137,746 | ) | | (20,070 | ) | | | (155,126 | ) | | (19,042 | ) | | | (175,092 | ) | | (1 | ) | | | (4 | ) |
| | | | | | | | | | | | | | | | | | | | | | | | | | | | |
Total | | 1,165,715 | | | $ | 11,221,943 | | | 118,297 | | | $ | 1,008,802 | | | 31,422 | | | $ | 316,928 | | | 68,089 | | | $ | 614,156 | |
| | | | | | | | | | | | | | | | | | | | | | | | | | | | |
Notes to Financial Statements (unaudited)
| 6. | CAPITAL STOCK TRANSACTIONS (continued) |
| | | | | | | | | | | | | | | | | | | | | | | | | | | | |
Target 2050 Series: | | For the Six Months Ended 4/30/10 Class C | | | For the Year Ended 10/31/09 Class C | | | For the Six Months Ended 4/30/10 Class I | | | For the Year Ended 10/31/09 Class I | |
Sold | | 22,789 | | | $ | 214,747 | | | 11,569 | | | $ | 90,462 | | | 4,888 | | | $ | 46,230 | | | 7,680 | | | $ | 58,108 | |
Reinvested | | 123 | | | | 1,139 | | | — | * | | | 2 | | | 127 | | | | 1,189 | | | 113 | | | | 760 | |
Repurchased | | (2,479 | ) | | | (22,485 | ) | | (308 | ) | | | (2,800 | ) | | (393 | ) | | | (3,816 | ) | | (1,324 | ) | | | (10,367 | ) |
| | | | | | | | | | | | | | | | | | | | | | | | | | | | |
Total | | 20,433 | | | $ | 193,401 | | | 11,261 | | | $ | 87,664 | | | 4,622 | | | $ | 43,603 | | | 6,469 | | | $ | 48,501 | |
| | | | | | | | | | | | | | | | | | | | | | | | | | | | |
* Less than 1 share.
At April 30, 2010, one omnibus account owned the following in Target Income Series, and Target 2050 Series and two omnibus accounts owned the following in Target 2010 Series, Target 2020 Series, Target 2030 Series and Target 2040 Series:
| | | | | | |
| Series | | Shares Owned | | Percentage of Series Shares Outstanding | | Value |
Target Income Series | | 4,020,566 | | 90.9% | | $42,215,939 |
Target 2010 Series | | 2,418,430 | | 74.5% | | 24,740,544 |
Target 2020 Series | | 5,535,310 | | 74.7% | | 55,187,039 |
Target 2030 Series | | 5,805,756 | | 83.3% | | 57,302,810 |
Target 2040 Series | | 3,676,627 | | 80.7% | | 36,876,573 |
Target 2050 Series | | 1,112,975 | | 77.9% | | 11,185,394 |
The underlying Series may trade in instruments including written and purchased options, forward foreign currency exchange contracts and futures contracts and other derivatives in the normal course of investing activities to assist in managing exposure to various market risks. The underlying Series may be subject to various elements of risk and may involve, to a varying degree, elements of risk in excess of the amounts recognized for financial statement purposes. These risks include: the risk that changes in the value of a derivative may not correlate perfectly with the underlying asset, rate or index, counterparty credit risk related to over the counter derivatives counterparties failure to perform under contract terms, liquidity risk related to the lack of a liquid market for these contracts allowing the fund to close out its position(s) and documentation risk relating to disagreement over contract terms. No such investments were held by the underlying Series on April 30, 2010.
| 8. | FEDERAL INCOME TAX INFORMATION |
The amount and characterization of certain income and capital gains to be distributed are determined in accordance with federal income tax regulations, which may differ from accounting principles generally accepted in the United States of America. These differences are primarily due to differing book and tax treatments in the timing of the recognition of net investment income or gains and losses, including losses deferred due to wash sales. Each Series may periodically make reclassifications among its capital accounts to reflect income and gains available for distribution (or available capital loss carryovers) under income tax regulations, without impacting the Series’ net asset value. Any such reclassifications are not reflected in the financial highlights.
Notes to Financial Statements (unaudited)
| 8. | FEDERAL INCOME TAX INFORMATION (continued) |
The final determination of the tax character of current year distributions will be made at the conclusion of the fiscal year. The tax character of distributions for the year ended October 31, 2009 were as follows:
| | | | | | | | | | | | |
| | | Target Income Series | | Target 2010 Series | | Target 2020 Series | | Target 2030 Series | | Target 2040 Series | | Target 2050 Series |
Ordinary income | | $1,899 | | $7,105 | | $21,799 | | $6,732 | | $2,067 | | $766 |
At October 31, 2009, Target 2040 Series and Target 2050 Series had capital loss carryovers of $11,352 and $3,709 respectively, which are subject to limitations under Section 382-384 of The Internal Revenue Code, and is available to the extent allowed by tax law to offset future net capital gains, if any, which will expire on October 31, 2017.
At April 30, 2010, the tax basis of components of distributable earnings and the net unrealized appreciation based on the identified cost for federal income tax purposes were as follows:
| | | | | | | | | | | | | | | | | | | | | | | |
| | | Target Income Series | | | Target 2010 Series | | | Target 2020 Series | | | Target 2030 Series | | | Target 2040 Series | | | Target 2050 Series |
Cost for federal income tax purposes | | $ | 40,764,686 | | | $ | 29,705,841 | | | $ | 67,639,198 | | | $ | 62,947,167 | | | $ | 40,977,786 | | | $ | 13,573,760 |
Unrealized appreciation | | $ | 5,673,632 | | | $ | 3,506,180 | | | $ | 6,114,086 | | | $ | 5,825,223 | | | $ | 4,747,769 | | | $ | 791,319 |
Unrealized depreciation | | | (2,139 | ) | | | (3,804 | ) | | | (7,237 | ) | | | (13,610 | ) | | | (3,088 | ) | | | — |
| | | | | | | | | | | | | | | | | | | | | | | |
Net unrealized appreciation | | $ | 5,671,493 | | | $ | 3,502,376 | | | $ | 6,106,849 | | | $ | 5,811,613 | | | $ | 4,744,681 | | | $ | 791,319 |
| | | | | | | | | | | | | | | | | | | | | | | |
There were no subsequent events that require recognition or disclosure. In preparing these financial statements, management of the Fund has evaluated events and transactions for potential recognition or disclosure through the date the financial statements were issued.
Renewal of Investment Advisory Agreement (unaudited)
At the Manning & Napier Fund, Inc. (the “Fund”) Board of Directors’ (the “Board”) meeting, held on December 7, 2009, the Investment Advisory Agreement (the “Agreement”) between the Fund and Manning & Napier Advisors, Inc. (the “Advisor”) was reviewed by the Board for renewal. In connection with the decision whether to renew the Agreement, a variety of material was prepared for and reviewed by the Board.
Representatives of the Advisor attended the meeting and presented additional oral and written information to the Board to assist the Board in its considerations. The discussion immediately below outlines the materials and information presented to the Board in connection with the Board’s 2009 Annual Review of the Agreement and the conclusions made by the Directors when determining to continue the Agreement.
| | • | | The Board considered the services provided by the Advisor under the Agreement including, among others: deciding what securities to purchase and sell for each Series; arranging for the purchase and sale of such securities by placing orders with broker-dealers; administering the affairs of the Fund (including the books and records of the Fund not maintained by third party service providers such as the custodian or sub-transfer agent); arranging for the insurance coverage for the Fund; and supervising the preparation of tax returns, SEC filings (including registration statements) and reports to shareholders for the Fund. The Board also considered the nature and quality of such services provided under the Agreement in light of the Advisor’s services provided to the Fund for 23 years. The Board discussed the quality of these services with representatives from the Advisor and concluded that the Advisor was performing its services to the Fund required under the Agreement in a reasonable manner. |
| | • | | The Board considered the investment performance of the various Series of the Fund. The investment performance for each Series was reviewed on a cumulative basis since inception and on a one year basis. In addition, annualized performance for the following time periods was considered: inception, three year, five year, ten year, and current market cycle. A market cycle includes periods of both rising and falling markets. Returns for established benchmark indices for each Series were provided for each time period. The Board noted that the various Series were competitive against their respective benchmarks and/or peer groups over various time periods, but in particular over the full market cycle periods relevant for the Series. In addition, the Board considered at the meeting (and considers on a quarterly basis) a peer group performance analysis consisting of Morningstar universes of mutual funds with similar investment objectives. The Board discussed the performance with representatives from the Advisor and concluded that the investment performance of each of the Fund’s Series was reasonable based on the Fund’s actual performance and comparative performance, especially performance over the current market cycle. |
| | • | | The Board considered the costs of the Advisor’s services and the profits of the Advisor as they relate to the Advisor’s services to the Fund under the Agreement. In reviewing the Advisor’s costs and profits, the Board discussed the Advisor’s revenues generated from the Fund (on both an actual and adjusted basis) and its expenses associated with providing the services under the Agreement. In addition, the Board reviewed the Advisor’s expenses associated with Fund activities outside of the Agreement (such as expense reimbursements pursuant to expense caps and payments made by the Advisor to third party platforms on which shares of the Fund are available for purchase). It was noted by representatives of the Advisor that 13 of the 26 active Series of the Fund are currently experiencing expenses above the capped expense ratios. After discussing the above costs and profits, the Board concluded that the Advisor’s profitability relating to its services provided under the Agreement was reasonable. |
| | • | | The Board considered the fees and expenses of the various Series of the Fund. The Advisor presented the advisory fees and total expenses for each Series, including the advisory fee adjusted for any expense waivers or reimbursements (either contractual or voluntary) paid by the Advisor. The advisory fees and expense ratios of each Series were compared to an average (on both a mean and median basis) of similar funds as disclosed on the Morningstar database. Representatives of the Advisor discussed with the Board the levels of its advisory |
Renewal of Investment Advisory Agreement (unaudited)
| | fee for each Series of the Fund and as compared to the median and mean advisory fees for similar funds as listed on Morningstar. Expense ratios for every Series, except the Global Fixed Income Series and the Target Series Class R and Class C, are currently below the median and mean for similar funds as listed on Morningstar. Based on their review of the information provided, the Board concluded that the fees and expenses of each Series of the Fund were reasonable on a comparative basis. |
| | • | | The Board also considered the other benefits the Advisor derives from its relationship with the Fund. Such other benefits include certain research products provided by soft dollars. Given the level of soft dollar transactions involving the Fund, the Board concluded that these additional benefits to the Advisor were reasonable. |
| | • | | In addition to the factors described above, the Board considered the Advisor’s personnel, investment strategies, policies and procedures relating to compliance with personal securities transactions, and reputation, expertise and resources in domestic and foreign financial markets. The Board concluded that these factors support the conclusion that the Advisor performs its services in a reasonable manner. |
| | • | | The Board did not consider economies of scale at this time because of the multiple uses of the Fund (for the Advisor’s discretionary investment account clients in addition to direct investors), the current profitability of the Advisor’s services to the Fund under the Agreement, and the overall size of the Fund complex. |
Based on the Board’s deliberations and their evaluation of the information described above, the Board, including a majority of Directors that are not “interested persons” as defined in the Investment Company Act of 1940, concluded that the compensation under the Agreement was fair and reasonable in light of the services and expenses and such other matters as the Directors considered to be relevant in the exercise of their reasonable judgment. Accordingly, the Board approved the renewal of the Agreement. In the course of their deliberations, the Directors did not identify any particular information that was all important or controlling.
Literature Requests (unaudited)
Proxy Voting Policies and Procedures
A description of the policies and procedures that the Fund uses to determine how to vote proxies relating to portfolio securities is available, without charge, upon request:
| | |
By phone | | 1-800-466-3863 |
On the Securities and Exchange
Commission’s (SEC) web site | | http://www.sec.gov |
Proxy Voting Record
Information regarding how the Fund voted proxies relating to portfolio securities during the most recent 12-month period ended June 30th is available, without charge, upon request:
| | |
By phone | | 1-800-466-3863 |
On the SEC’s web site | | http://www.sec.gov |
Quarterly Portfolio Holdings
The Series’ complete schedule of portfolio holdings for the 1st and 3rd quarters of each fiscal year are provided on Form N-Q, and are available, without charge, upon request:
| | |
By phone | | 1-800-466-3863 |
On the SEC’s web site | | http://www.sec.gov |
The Series’ Form N-Q may be reviewed and copied at the SEC’s Public Reference Room in Washington, D.C. Information on the operation of the Public Reference Room may be obtained by calling 1-800-SEC-0330.
Prospectus and Statement of Additional Information (SAI)
The prospectus and SAI provide additional information about each Series, including charges, expenses and risks. These documents are available, without charge, upon request:
| | |
By phone | | 1-800-466-3863 |
On the SEC’s web | | site http://www.sec.gov |
On the Advisor’s web site | | http://www.manningnapieradvisors.com |
Additional information available at www.manningnapieradvisors.com
1. Fund Holdings - Month-End
2. Fund Holdings - Quarter-End
3. Shareholder Report - Annual
4. Shareholder Report - Semi-Annual
MNTGT-04/10-SAR

Shareholder Expense Example (unaudited)
As a shareholder of the Series, you may incur two types of costs: (1) transaction costs, including potential wire charges on redemptions and (2) ongoing costs, including management fees and other Series expenses. This example is intended to help you understand your ongoing costs (in dollars) of investing in the Series and to compare these costs with the ongoing costs of investing in other mutual funds.
The example is based on an investment of $1,000 invested at the beginning of the period and held for the entire period (November 1, 2009 to April 30, 2010).
Actual Expenses
The first line of the table below provides information about actual account values and actual expenses. You may use the information in this line, together with the amount you invested, to estimate the expenses that you paid over the period. Simply divide your account value by $1,000 (for example, an $8,600 account value divided by $1,000 = 8.6), then multiply the result by the number in the first line under the heading entitled “Expenses Paid During Period” to estimate the expenses you paid on your account during this period.
Hypothetical Example for Comparison Purposes
The second line of the table below provides information about hypothetical account values and hypothetical expenses based on the Series’ actual expense ratio and an assumed rate of return of 5% per year before expenses, which is not the Series’ actual return. The hypothetical account values and expenses may not be used to estimate the actual ending account balance or expenses you paid during the period. You may use this information to compare the ongoing costs of investing in the Series and other funds. To do so, compare this 5% hypothetical example with the 5% hypothetical examples that appear in the shareholder reports of the other funds.
Please note that the expenses shown in the table are meant to highlight your ongoing costs only and do not reflect any transaction costs. Therefore, the second line of the table is useful in comparing ongoing costs only, and will not help you determine the relative total costs of owning different funds. In addition, if these transaction costs were included, your costs would have been higher.
| | | | | | |
| | | Beginning
Account Value
11/1/09 | | Ending
Account Value
4/30/10 | | Expenses Paid
During Period*
11/1/09-4/30/10 |
Actual | | $1,000.00 | | $1,100.00 | | $3.12 |
Hypothetical
(5% return before expenses) | | $1,000.00 | | $1,021.82 | | $3.01 |
*Expenses are equal to the Series’ annualized expense ratio (for the six-month period) of 0.60%, multiplied by the average account value over the period, multiplied by 181/365 (to reflect the one-half year period). Expenses are based on the most recent fiscal half year. The Series’ total return would have been lower had certain expenses not been waived during the period.
Portfolio Composition as of April 30, 2010 (unaudited)
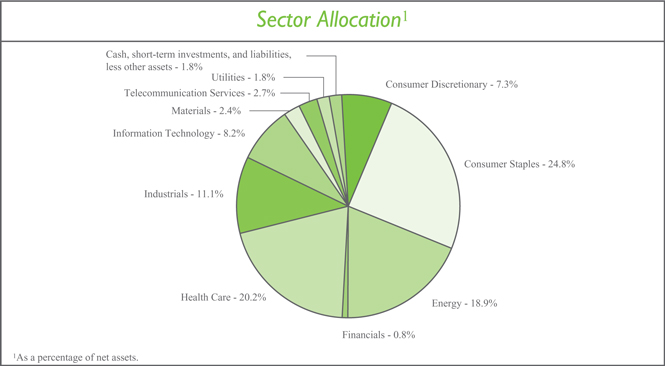
Investment Portfolio - April 30, 2010 (unaudited)
| | | | | | | |
| | | Shares | | Value (Note 2) | | |
| | | |
COMMON STOCKS - 98.2% | | | | | | | |
| | | |
Consumer Discretionary - 7.3% | | | | | | | |
Distributors - 0.2% | | | | | | | |
Genuine Parts Co. | | 90 | | $ | 3,852 | | |
| | | | | | | |
Hotels, Restaurants & Leisure - 2.5% | | | | | | | |
Darden Restaurants, Inc. | | 44 | | | 1,969 | | |
McDonald’s Corp. | | 593 | | | 41,860 | | |
Yum! Brands, Inc. | | 138 | | | 5,854 | | |
| | | | | | | |
| | | | | 49,683 | | |
| | | | | | | |
Household Durables - 0.5% | | | | | | | |
Garmin Ltd. | | 73 | | | 2,729 | | |
Leggett & Platt, Inc. | | 83 | | | 2,036 | | |
Tupperware Brands Corp. | | 22 | | | 1,123 | | |
Whirlpool Corp. | | 30 | | | 3,266 | | |
| | | | | | | |
| | | | | 9,154 | | |
| | | | | | | |
Leisure Equipment & Products - 0.3% | | | | | | | |
Hasbro, Inc. | | 42 | | | 1,611 | | |
Mattel, Inc. | | 204 | | | 4,702 | | |
| | | | | | | |
| | | | | 6,313 | | |
| | | | | | | |
Media - 1.5% | | | | | | | |
The McGraw-Hill Companies, Inc. | | 188 | | | 6,339 | | |
Omnicom Group, Inc. | | 93 | | | 3,968 | | |
Pearson plc - ADR (United Kingdom) | | 337 | | | 5,382 | | |
Thomson Reuters Corp. | | 410 | | | 14,711 | | |
| | | | | | | |
| | | | | 30,400 | | |
| | | | | | | |
Specialty Retail - 2.0% | | | | | | | |
The Home Depot, Inc. | | 914 | | | 32,219 | | |
Limited Brands, Inc. | | 173 | | | 4,636 | | |
The Sherwin-Williams Co. | | 33 | | | 2,576 | | |
| | | | | | | |
| | | | | 39,431 | | |
| | | | | | | |
| | | |
Textiles, Apparel & Luxury Goods - 0.3% | | | | | | | |
VF Corp. | | 61 | | | 5,272 | | |
| | | | | | | |
Total Consumer Discretionary | | | | | 144,105 | | |
| | | | | | | |
Consumer Staples - 24.8% | | | | | | | |
Beverages - 8.4% | | | | | | | |
Brown-Forman Corp. - Class B | | 51 | | | 2,967 | | |
The Coca-Cola Co. | | 1,343 | | | 71,783 | | |
Diageo plc - ADR (United Kingdom) | | 340 | | | 23,168 | | |
Embotelladora Andina S.A. - ADR - Class B (Chile) | | 40 | | | 875 | | |
Molson Coors Brewing Co. - Class B | | 60 | | | 2,662 | | |
| | | | |
| | The accompanying notes are an integral part of the financial statements. | | 3 |
Investment Portfolio - April 30, 2010 (unaudited)
| | | | | | | |
| | | Shares | | Value (Note 2) | | |
| | | |
COMMON STOCKS (continued) | | | | | | | |
| | | |
Consumer Staples (continued) | | | | | | | |
Beverages (continued) | | | | | | | |
PepsiCo, Inc. | | 965 | | $ | 62,937 | | |
| | | | | | | |
| | | | | 164,392 | | |
| | | | | | | |
Food & Staples Retailing - 3.5% | | | | | | | |
Delhaize Group S.A. - ADR (Belgium) | | 35 | | | 2,897 | | |
SYSCO Corp. | | 328 | | | 10,345 | | |
Wal-Mart Stores, Inc. | | 1,036 | | | 55,581 | | |
| | | | | | | |
| | | | | 68,823 | | |
| | | | | | | |
Food Products - 4.4% | | | | | | | |
Archer-Daniels-Midland Co. | | 211 | | | 5,896 | | |
Campbell Soup Co. | | 191 | | | 6,849 | | |
General Mills, Inc. | | 179 | | | 12,741 | | |
H.J. Heinz Co. | | 183 | | | 8,577 | | |
The Hershey Co. | | 126 | | | 5,923 | | |
Hormel Foods Corp. | | 48 | | | 1,957 | | |
The J.M. Smucker Co. | | 52 | | | 3,176 | | |
Kellogg Co. | | 215 | | | 11,812 | | |
Kraft Foods, Inc. - Class A | | 730 | | | 21,608 | | |
McCormick & Co., Inc. - NVS | | 69 | | | 2,730 | | |
Sara Lee Corp. | | 391 | | | 5,560 | | |
| | | | | | | |
| | | | | 86,829 | | |
| | | | | | | |
Household Products - 4.3% | | | | | | | |
Colgate-Palmolive Co. | | 163 | | | 13,708 | | |
Kimberly-Clark Corp. | | 245 | | | 15,009 | | |
The Procter & Gamble Co. | | 897 | | | 55,758 | | |
| | | | | | | |
| | | | | 84,475 | | |
| | | | | | | |
Personal Products - 0.3% | | | | | | | |
Avon Products, Inc. | | 178 | | | 5,755 | | |
| | | | | | | |
Tobacco - 3.9% | | | | | | | |
Altria Group, Inc. | | 1,170 | | | 24,792 | | |
Lorillard, Inc. | | 68 | | | 5,329 | | |
Philip Morris International, Inc. | | 842 | | | 41,325 | | |
Reynolds American, Inc. | | 94 | | | 5,022 | | |
| | | | | | | |
| | | | | 76,468 | | |
| | | | | | | |
Total Consumer Staples | | | | | 486,742 | | |
| | | | | | | |
Energy - 18.9% | | | | | | | |
Energy Equipment & Services - 0.6% | | | | | | | |
Tenaris S.A. - ADR (Luxembourg) | | 262 | | | 10,640 | | |
| | | | | | | |
| | | | |
| 4 | | The accompanying notes are an integral part of the financial statements. | | |
Investment Portfolio - April 30, 2010 (unaudited)
| | | | | | | |
| | | Shares | | Value (Note 2) | | |
| | | |
COMMON STOCKS (continued) | | | | | | | |
| | | |
Energy (continued) | | | | | | | |
Oil, Gas & Consumable Fuels - 18.3% | | | | | | | |
BP plc - ADR (United Kingdom) | | 1,414 | | $ | 73,740 | | |
Chevron Corp. | | 891 | | | 72,563 | | |
ConocoPhillips | | 775 | | | 45,872 | | |
Exxon Mobil Corp. | | 822 | | | 55,773 | | |
Repsol YPF, S.A. - ADR (Spain) | | 621 | | | 14,563 | | |
Sasol Ltd. - ADR (South Africa) | | 276 | | | 11,219 | | |
Statoil Asa - ADR (Norway) | | 966 | | | 23,348 | | |
Total S.A. - ADR (France) | | 1,163 | | | 63,244 | | |
| | | | | | | |
| | | | | 360,322 | | |
| | | | | | | |
Total Energy | | | | | 370,962 | | |
| | | | | | | |
Financials - 0.8% | | | | | | | |
Capital Markets - 0.2% | | | | | | | |
Eaton Vance Corp. | | 42 | | | 1,480 | | |
Federated Investors, Inc. - Class B | | 59 | | | 1,423 | | |
Waddell & Reed Financial, Inc. - Class A | | 42 | | | 1,559 | | |
| | | | | | | |
| | | | | 4,462 | | |
| | | | | | | |
Insurance - 0.4% | | | | | | | |
Marsh & McLennan Companies, Inc. | | 303 | | | 7,339 | | |
| | | | | | | |
Real Estate Investment Trusts (REITS) - 0.2% | | | | | | | |
Plum Creek Timber Co., Inc. | | 80 | | | 3,184 | | |
| | | | | | | |
Total Financials | | | | | 14,985 | | |
| | | | | | | |
Health Care - 20.2% | | | | | | | |
Health Care Equipment & Supplies - 0.8% | | | | | | | |
Baxter International, Inc. | | 196 | | | 9,255 | | |
Becton, Dickinson and Co. | | 77 | | | 5,881 | | |
Teleflex, Inc. | | 14 | | | 858 | | |
| | | | | | | |
| | | | | 15,994 | | |
| | | | | | | |
Health Care Providers & Services - 0.3% | | | | | | | |
Fresenius Medical Care AG & Co. KGAA - ADR (Germany) | | 97 | | | 5,232 | | |
| | | | | | | |
Life Sciences Tools & Services - 0.0%** | | | | | | | |
Pharmaceutical Product Development, Inc. | | 34 | | | 935 | | |
| | | | | | | |
Pharmaceuticals - 19.1% | | | | | | | |
Abbott Laboratories | | 834 | | | 42,668 | | |
AstraZeneca plc - ADR (United Kingdom) | | 819 | | | 36,225 | | |
Biovail Corp. (Canada) | | 67 | | | 1,139 | | |
Bristol-Myers Squibb Co. | | 1,045 | | | 26,428 | | |
Eli Lilly & Co. | | 658 | | | 23,010 | | |
GlaxoSmithKline plc - ADR (United Kingdom) | | 1,459 | | | 54,406 | | |
Johnson & Johnson | | 1,170 | | | 75,231 | | |
| | | | |
| | The accompanying notes are an integral part of the financial statements. | | 5 |
Investment Portfolio - April 30, 2010 (unaudited)
| | | | | | | |
| | | Shares | | Value (Note 2) | | |
| | | |
COMMON STOCKS (continued) | | | | | | | |
| | | |
Health Care (continued) | | | | | | | |
Pharmaceuticals (continued) | | | | | | | |
Merck & Co., Inc. | | 1,502 | | $ | 52,630 | | |
Pfizer, Inc. | | 3,835 | | | 64,121 | | |
| | | | | | | |
| | | | | 375,858 | | |
| | | | | | | |
Total Health Care | | | | | 398,019 | | |
| | | | | | | |
Industrials - 11.1% | | | | | | | |
Aerospace & Defense - 4.0% | | | | | | | |
Elbit Systems Ltd. - ADR (Israel) | | 15 | | | 925 | | |
General Dynamics Corp. | | 128 | | | 9,774 | | |
Honeywell International, Inc. | | 323 | | | 15,333 | | |
ITT Corp. | | 57 | | | 3,167 | | |
Lockheed Martin Corp. | | 122 | | | 10,356 | | |
Northrop Grumman Corp. | | 134 | | | 9,089 | | |
Raytheon Co. | | 122 | | | 7,113 | | |
United Technologies Corp. | | 307 | | | 23,010 | | |
| | | | | | | |
| | | | | 78,767 | | |
| | | | | | | |
Building Products - 0.1% | | | | | | | |
Masco Corp. | | 181 | | | 2,938 | | |
| | | | | | | |
Commercial Services & Supplies - 0.9% | | | | | | | |
Avery Dennison Corp. | | 61 | | | 2,381 | | |
Pitney Bowes, Inc. | | 117 | | | 2,972 | | |
RR Donnelley & Sons Co. | | 116 | | | 2,493 | | |
Waste Management, Inc. | | 274 | | | 9,502 | | |
| | | | | | | |
| | | | | 17,348 | | |
| | | | | | | |
Electrical Equipment - 2.1% | | | | | | | |
ABB Ltd. (Asea Brown Boveri) - ADR (Switzerland)* | | 734 | | | 14,063 | | |
Cooper Industries plc - Class A (Ireland) | | 90 | | | 4,419 | | |
Emerson Electric Co. | | 417 | | | 21,780 | | |
Hubbell, Inc. - Class B | | 34 | | | 1,580 | | |
| | | | | | | |
| | | | | 41,842 | | |
| | | | | | | |
Industrial Conglomerates - 2.8% | | | | | | | |
3M Co. | | 393 | | | 34,847 | | |
Koninklijke Philips Electronics N.V. - NY Shares (Netherlands) | | 388 | | | 12,936 | | |
Tomkins plc - ADR (United Kingdom) | | 67 | | | 1,023 | | |
Tyco International Ltd. (Switzerland) | | 187 | | | 7,254 | | |
| | | | | | | |
| | | | | 56,060 | | |
| | | | | | | |
Machinery - 1.1% | | | | | | | |
Dover Corp. | | 79 | | | 4,125 | | |
Illinois Tool Works, Inc. | | 267 | | | 13,644 | | |
Pentair, Inc. | | 45 | | | 1,627 | | |
| | | | |
| 6 | | The accompanying notes are an integral part of the financial statements. | | |
Investment Portfolio - April 30, 2010 (unaudited)
| | | | | | | |
| | | Shares | | Value (Note 2) | | |
| | | |
COMMON STOCKS (continued) | | | | | | | |
| | | |
Industrials (continued) | | | | | | | |
Machinery (continued) | | | | | | | |
Snap-On, Inc. | | 27 | | $ | 1,301 | | |
| | | | | | | |
| | | | | 20,697 | | |
| | | | | | | |
Professional Services - 0.1% | | | | | | | |
Dun & Bradstreet Corp. | | 18 | | | 1,386 | | |
| | | | | | | |
Total Industrials | | | | | 219,038 | | |
| | | | | | | |
Information Technology - 8.2% | | | | | | | |
Communications Equipment - 1.4% | | | | | | | |
Harris Corp. | | 41 | | | 2,111 | | |
Nokia Corp. - ADR (Finland) | | 1,242 | | | 15,102 | | |
Telefonaktiebolaget LM Ericsson - ADR (Sweden) | | 966 | | | 11,109 | | |
| | | | | | | |
| | | | | 28,322 | | |
| | | | | | | |
IT Services - 1.0% | | | | | | | |
Automatic Data Processing, Inc. | | 286 | | | 12,401 | | |
Broadridge Financial Solutions, Inc. | | 42 | | | 1,000 | | |
Paychex, Inc. | | 208 | | | 6,365 | | |
| | | | | | | |
| | | | | 19,766 | | |
| | | | | | | |
Semiconductors & Semiconductor Equipment - 5.8% | | | | | | | |
Intel Corp. | | 2,986 | | | 68,170 | | |
Linear Technology Corp. | | 116 | | | 3,487 | | |
National Semiconductor Corp. | | 74 | | | 1,094 | | |
Taiwan Semiconductor Manufacturing Co. Ltd. - ADR (Taiwan) | | 2,870 | | | 30,393 | | |
Texas Instruments, Inc. | | 386 | | | 10,040 | | |
| | | | | | | |
| | | | | 113,184 | | |
| | | | | | | |
Software - 0.0%** | | | | | | | |
Konami Corp. - ADR (Japan) | | 44 | | | 868 | | |
| | | | | | | |
Total Information Technology | | | | | 162,140 | | |
| | | | | | | |
Materials - 2.4% | | | | | | | |
Chemicals - 1.6% | | | | | | | |
E.I. du Pont de Nemours & Co. | | 505 | | | 20,119 | | |
International Flavors & Fragrances, Inc. | | 39 | | | 1,953 | | |
PPG Industries, Inc. | | 89 | | | 6,263 | | |
RPM International, Inc. | | 58 | | | 1,281 | | |
Valspar Corp. | | 35 | | | 1,096 | | |
| | | | | | | |
| | | | | 30,712 | | |
| | | | | | | |
Construction Materials - 0.4% | | | | | | | |
CRH plc - ADR (Ireland) | | 261 | | | 7,462 | | |
| | | | | | | |
Containers & Packaging - 0.3% | | | | | | | |
Bemis Co., Inc. | | 60 | | | 1,825 | | |
| | | | |
| | The accompanying notes are an integral part of the financial statements. | | 7 |
Investment Portfolio - April 30, 2010 (unaudited)
| | | | | | | |
| | | Shares | | Value (Note 2) | | |
| | | |
COMMON STOCKS (continued) | | | | | | | |
| | | |
Materials (continued) | | | | | | | |
Containers & Packaging (continued) | | | | | | | |
Greif, Inc. - Class A | | 21 | | $ | 1,243 | | |
Packaging Corp. of America | | 37 | | | 915 | | |
Sealed Air Corp. | | 49 | | | 1,053 | | |
Sonoco Products Co. | | 54 | | | 1,789 | | |
| | | | | | | |
| | | | | 6,825 | | |
| | | | | | | |
Metals & Mining - 0.0%** | | | | | | | |
Compass Minerals International, Inc. | | 12 | | | 904 | | |
| | | | | | | |
Paper & Forest Products - 0.1% | | | | | | | |
MeadWestvaco Corp. | | 53 | | | 1,440 | | |
| | | | | | | |
Total Materials | | | | | 47,343 | | |
| | | | | | | |
Telecommunication Services - 2.7% | | | | | | | |
Diversified Telecommunication Services - 0.9% | | | | | | | |
Chunghwa Telecom Co. Ltd. - ADR (Taiwan) | | 408 | | | 7,964 | | |
Magyar Telekom Telecommunications plc - ADR (Hungary) | | 121 | | | 2,147 | | |
Telecom Corp. of New Zealand Ltd. - ADR (New Zealand) | | 216 | | | 1,691 | | |
Telefonos de Mexico S.A.B. de C.V. (Telmex) - ADR - Class L (Mexico) | | 383 | | | 5,879 | | |
| | | | | | | |
| | | | | 17,681 | | |
| | | | | | | |
Wireless Telecommunication Services - 1.8% | | | | | | | |
Cellcom Israel Ltd. (Israel) | | 46 | | | 1,394 | | |
NTT DoCoMo, Inc. - ADR (Japan) | | 1,360 | | | 21,094 | | |
Partner Communications Co. Ltd. - ADR (Israel) | | 94 | | | 1,846 | | |
Philippine Long Distance Telephone Co. - ADR (Philippines) | | 83 | | | 4,668 | | |
Rogers Communications, Inc., Class B | | 192 | | | 6,837 | | |
| | | | | | | |
| | | | | 35,839 | | |
| | | | | | | |
Total Telecommunication Services | | | | | 53,520 | | |
| | | | | | | |
Utilities - 1.8% | | | | | | | |
Electric Utilities - 0.9% | | | | | | | |
Companhia Energetica de Minas Gerais (CEMIG) - ADR (Brazil) | | 161 | | | 2,594 | | |
DPL, Inc. | | 56 | | | 1,578 | | |
Enersis S.A. - ADR (Chile) | | 213 | | | 4,237 | | |
Exelon Corp. | | 216 | | | 9,415 | | |
| | | | | | | |
| | | | | 17,824 | | |
| | | | | | | |
Gas Utilities - 0.1% | | | | | | | |
UGI Corp. | | 38 | | | 1,044 | | |
| | | | | | | |
Independent Power Producers & Energy Traders - 0.2% | | | | | | | |
Empresa Nacional de Electricidad S.A. - ADR (Chile) | | 90 | | | 4,180 | | |
| | | | | | | |
Multi-Utilities - 0.5% | | | | | | | |
Public Service Enterprise Group, Inc. | | 282 | | | 9,061 | | |
| | | | | | | |
| | | | |
| 8 | | The accompanying notes are an integral part of the financial statements. | | |
Investment Portfolio - April 30, 2010 (unaudited)
| | | | | | | | |
| | | Shares | | Value (Note 2) | | | |
| | | |
COMMON STOCKS (continued) | | | | | | | | |
| | | |
Utilities (continued) | | | | | | | | |
Water Utilities - 0.1% | | | | | | | | |
Companhia de Saneamento Basico do Estado de Sao Paulo (SABESP) -
ADR (Brazil) | | 57 | | $ | 2,243 | | | |
| | | | | | | | |
Total Utilities | | | | | 34,352 | | | |
| | | | | | | | |
TOTAL COMMON STOCKS
(Identified Cost $1,776,943) | | | | | 1,931,206 | | | |
| | | | | | | | |
| | | |
SHORT-TERM INVESTMENTS - 2.2% | | | | | | | | |
| | | |
Dreyfus Cash Management, Inc. - Institutional Shares1 , 0.09% (Identified Cost $43,618) | | 43,618 | | | 43,618 | | | |
| | | | | | | | |
TOTAL INVESTMENTS - 100.4%
(Identified Cost $1,820,561) | | | | | 1,974,824 | | | |
LIABILITIES, LESS OTHER ASSETS - (0.4%) | | | | | (7,880 | ) | | |
| | | | | | | | |
NET ASSETS - 100% | | | | $ | 1,966,944 | | | |
| | | | | | | | |
ADR - American Depository Receipt
NVS - Non-Voting Shares
*Non-income producing security
**Less than 0.1%
1Rate shown is the current yield as of April 30, 2010.
| | | | |
| | The accompanying notes are an integral part of the financial statements. | | 9 |
Statement of Assets and Liabilities (unaudited)
April 30, 2010
| | | |
ASSETS: | | | |
| |
Investments, at value (identified cost $1,820,561) (Note 2) | | $ | 1,974,824 |
Receivable from investment advisor (Note 3) | | | 23,360 |
Dividends receivable | | | 3,081 |
Receivable for fund shares sold | | | 990 |
Foreign tax reclaims receivable | | | 428 |
| | | |
| |
TOTAL ASSETS | | | 2,002,683 |
| | | |
| |
LIABILITIES: | | | |
| |
Accrued fund accounting and administration (Note 3) | | | 7,069 |
Accrued Chief Compliance Officer service fees (Note 3) | | | 885 |
Audit fees payable | | | 19,564 |
Custodian fees payable | | | 3,077 |
Legal fees payable | | | 2,664 |
Registration and filing fees payable | | | 2,402 |
Other payables and accrued expenses | | | 78 |
| | | |
| |
TOTAL LIABILITIES | | | 35,739 |
| | | |
| |
TOTAL NET ASSETS | | $ | 1,966,944 |
| | | |
| |
NET ASSETS CONSIST OF: | | | |
| |
Capital stock | | $ | 1,599 |
Additional paid-in-capital | | | 1,541,120 |
Undistributed net investment income | | | 9,796 |
Accumulated net realized gain on investments | | | 260,166 |
Net unrealized appreciation on investments | | | 154,263 |
| | | |
| |
TOTAL NET ASSETS | | $ | 1,966,944 |
| | | |
| |
NET ASSET VALUE, OFFERING PRICE AND REDEMPTION PRICE PER SHARE - Class A
($1,966,944/159,868 shares) | | $ | 12.30 |
| | | |
| | | | |
| 10 | | The accompanying notes are an integral part of the financial statements. | | |
Statement of Operations (unaudited)
For the Six Months Ended April 30, 2010
| | | | |
INVESTMENT INCOME: | | | | |
| |
Dividends (net of foreign taxes withheld, $1,429) | | $ | 41,169 | |
| | | | |
| |
EXPENSES: | | | | |
| |
Fund accounting and administration fees (Note 3) | | | 14,771 | |
Directors’ fees (Note 3) | | | 6,373 | |
Management fees (Note 3) | | | 5,072 | |
Chief Compliance Officer service fees (Note 3) | | | 1,916 | |
Transfer agent fees (Note 3) | | | 1,000 | |
Audit fees | | | 15,507 | |
Custodian fees | | | 4,743 | |
Registration and filing fees | | | 2,976 | |
Legal fees | | | 2,607 | |
Miscellaneous | | | 501 | |
| | | | |
| |
Total Expenses | | | 55,466 | |
Less reduction of expenses (Note 3) | | | (48,704 | ) |
| | | | |
| |
Net Expenses | | | 6,762 | |
| | | | |
| |
NET INVESTMENT INCOME | | | 34,407 | |
| | | | |
| |
REALIZED AND UNREALIZED GAIN (LOSS) ON INVESTMENTS: | | | | |
| |
Net realized gain on investments | | | 273,627 | |
Net change in unrealized appreciation (depreciation) on investments | | | (106,974 | ) |
| | | | |
| |
NET REALIZED AND UNREALIZED GAIN (LOSS) ON INVESTMENTS | | | 166,653 | |
| | | | |
| |
NET INCREASE IN NET ASSETS RESULTING FROM OPERATIONS | | $ | 201,060 | |
| | | | |
| | | | |
| | The accompanying notes are an integral part of the financial statements. | | 11 |
Statement of Changes in Net Assets
| | | | | | | | | | | | | | |
| | | For the Six
Months Ended
4/30/10
(unaudited) | | | | | For the Period
11/7/081 to
10/31/09 | |
INCREASE (DECREASE) IN NET ASSETS: | | | | | | | | | | | | | | |
| | | | | |
OPERATIONS: | | | | | | | | | | | | | | |
| | | | | |
Net investment income | | | | $ | 34,407 | | | | | | | $ | 36,381 | |
Net realized gain (loss) on investments | | | | | 273,627 | | | | | | | | (12,704 | ) |
Net change in unrealized appreciation (depreciation) on investments | | | | | (106,974 | ) | | | | | | | 261,237 | |
| | | | | | | | | | | | | | |
| | | | | |
Net increase from operations | | | | | 201,060 | | | | | | | | 284,914 | |
| | | | | | | | | | | | | | |
| | | | | |
DISTRIBUTIONS TO SHAREHOLDERS (Note 8): | | | | | | | | | | | | | | |
| | | | | |
From net investment income | | | | | (39,344 | ) | | | | | | | (21,640 | ) |
From net realized gain on investments | | | | | (765 | ) | | | | | | | — | |
| | | | | | | | | | | | | | |
| | | | | |
Total distributions to shareholders | | | | | (40,109 | ) | | | | | | | (21,640 | ) |
| | | | | | | | | | | | | | |
| | | | | |
CAPITAL STOCK ISSUED AND REPURCHASED: | | | | | | | | | | | | | | |
| | | | | |
Net increase (decrease) from capital share transactions (Note 5) | | | | | (238,402 | ) | | | | | | | 1,781,121 | |
| | | | | | | | | | | | | | |
| | | | | |
Net increase (decrease) in net assets | | | | | (77,451 | ) | | | | | | | 2,044,395 | |
| | | | | |
NET ASSETS: | | | | | | | | | | | | | | |
| | | | | |
Beginning of period | | | | | 2,044,395 | | | | | | | | — | |
| | | | | | | | | | | | | | |
| | | | | |
End of period (including undistributed net investment income of $9,796
and $14,733, respectively) | | | | $ | 1,966,944 | | | | | | | $ | 2,044,395 | |
| | | | | | | | | | | | | | |
| | | | | | | | |
1 Commencement of operations.
| | | | |
| 12 | | The accompanying notes are an integral part of the financial statements. | | |
Financial Highlights
| | | | |
| | | For the Six
Months Ended
4/30/10
(unaudited) | | For the Period
11/7/081 to
10/31/09 |
Per share data (for a share outstanding throughout each period): | | | | |
Net asset value - Beginning of period | | $11.38 | | $10.00 |
| | | | |
Income from investment operations: | | | | |
Net investment income2 | | 0.18 | | 0.34 |
Net realized and unrealized gain on investments | | 0.95 | | 1.22 |
| | | | |
Total from investment operations | | 1.13 | | 1.56 |
| | | | |
Less distributions to shareholders: | | | | |
From net investment income | | (0.21) | | (0.18) |
From net realized gain on investments | | —3 | | — |
| | | | |
Total distributions to shareholders | | (0.21) | | (0.18) |
| | | | |
Net asset value - End of period | | $12.30 | | $11.38 |
| | | | |
Net assets - End of period (000’s omitted) | | $1,967 | | $2,044 |
| | | | |
Total return4 | | 10.00% | | 15.81% |
Ratios (to average net assets)/Supplemental Data: | | | | |
Expenses* | | 0.60%5 | | 0.60%5 |
Net investment income | | 3.05%5 | | 3.33%5 |
Portfolio turnover | | 49% | | 28% |
|
*The investment advisor did not impose all or a portion of its management fees, CCO fees, fund accounting and transfer agent fees, and other fees in some periods and in some periods paid a portion of the Series’ expenses. If these expenses had been incurred by the Series, the expense ratio (to average net assets) would have been increased by the following amount: |
| | 4.32%5 | | 6.21%5 |
1Commencement of operations.
2Calculated based on average shares outstanding during the periods.
3Less than $0.01 per share.
4Represents aggregate total return for the periods indicated, and assumes reinvestment of all distributions. Total return would have been lower had certain expenses not been waived during certain periods. Periods less than one year are not annualized.
5Annualized.
| | | | |
| | The accompanying notes are an integral part of the financial statements. | | 13 |
Notes to Financial Statements (unaudited)
Dividend Focus Series (the “Series”) is a no-load non-diversified series of Manning & Napier Fund, Inc. (the “Fund”). The Fund is organized in Maryland and is registered under the Investment Company Act of 1940, as amended, as an open-end management investment company.
The Series’ investment objective is to provide competitive returns consistent with the broad equity market while providing a level of capital protection during market downturns through a passive quantitative investment approach.
The Fund’s Advisor is Manning & Napier Advisors, Inc. (the “Advisor”). Shares of the Series are offered to investors and employees of the Advisor and its affiliates. The total authorized capital stock of the Fund consists of 10.0 billion shares of common stock each having a par value of $0.01. As of April 30, 2010, 6.2 billion shares have been designated in total among 29 series, of which 100 million have been designated as Dividend Focus Series Class A common stock.
2. | SIGNIFICANT ACCOUNTING POLICIES |
Security Valuation
Portfolio securities, including domestic equities, foreign equities, warrants and options, listed on an exchange other than the NASDAQ National Market System are valued at the latest quoted sales price of the exchange on which the security is primarily traded. Securities not traded on valuation date or securities not listed on an exchange are valued at the latest quoted bid price provided by the Fund’s pricing service. Securities listed on the NASDAQ National Market System are valued in accordance with the NASDAQ Official Closing Price.
Short-term investments that mature in sixty days or less are valued at amortized cost, which approximates market value. Investments in open-end investment companies are valued at their net asset value per share on valuation date.
Volume and level of activity in established markets for an asset or liability are evaluated to determine whether recent transactions and quoted prices are determinative of fair value. Where there have been significant decreases in volume and level of activity, further analysis and adjustment may be necessary to estimate fair value. The Series measures fair value in these instances by the use of inputs and valuation techniques which may be based upon current market prices of securities that are comparable in coupon, rating, maturity and industry and/or expectation of future cash flows. As a result of trading in relatively thin markets and/or markets that experience significant volatility, the prices used by the Series to value these securities may differ from the value that would be realized if these securities were sold, and the differences could be material.
Securities for which representative valuations or prices are not available from the Fund’s pricing service may be valued at fair value. Due to the inherent uncertainty of valuations of such securities, the fair value may differ significantly from the values that would have been used had a ready market for such securities existed. If trading or events occurring after the close of the principal market in which securities are traded are expected to materially affect the value of those securities, then they may be valued at their fair value, taking this trading or these events into account. Fair value is determined in good faith by the Advisor under procedures approved by and under the general supervision and responsibility of the Fund’s Board of Directors (the “Board”).
Various inputs are used in determining the value of the Series’ assets or liabilities carried at market value. These inputs are summarized in three broad levels. Level 1 includes quoted prices in active markets for identical assets and liabilities. Level 2 includes other significant observable inputs (including quoted prices for similar securities, interest rates, prepayment speeds, credit risk, etc.). Level 3 includes significant unobservable inputs (including the Series’ own assumptions in determining the fair value of investments). The inputs or methodology used for valuing securities are not necessarily an indication of the risk associated with investing in those securities.
Notes to Financial Statements (unaudited)
2. | SIGNIFICANT ACCOUNTING POLICIES (continued) |
Security Valuation (continued)
The following is a summary of the valuation levels used for major security types as of April 30, 2010 in valuing the Series’ assets or liabilities carried at market value:
| | | | | | | | | | | | |
Description | | 4/30/10 | | Level 1 | | Level 2 | | Level 3 |
Equity securities* | | $ | 1,931,206 | | $ | 1,931,206 | | $ | — | | $ | — |
Preferred securities | | | — | | | — | | | — | | | — |
Debt securities | | | — | | | — | | | — | | | — |
Mutual funds | | | 43,618 | | | 43,618 | | | — | | | — |
Other financial
instruments** | | | — | | | — | | | — | | | — |
| | | | | | | | | | | | |
Total | | $ | 1,974,824 | | $ | 1,974,824 | | $ | — | | $ | — |
| | | | | | | | | | | | |
* Includes common stock, warrants and rights. Please see the Investment Portfolio for industry classification.
**Other financial instruments are derivative instruments not reflected in the Investment Portfolio, such as futures, forwards and swap contracts, which are valued at the unrealized appreciation/ depreciation on the instrument. As of April 30, 2010, the Series did not hold any derivative instruments.
There were no Level 3 securities held by the Series as of October 31, 2009 or April 30, 2010.
The Fund’s policy is to recognize transfers in and transfers out of the valuation levels as of the end of the reporting period. There were no significant transfers between Level 1 and Level 2 as of April 30, 2010.
Additional disclosure surrounding the activity in Level 3 fair value measurement will also be effective for fiscal years beginning after December 15, 2010. Management has concluded that this will not have a material impact on the Series’ financial statements.
Security Transactions, Investment Income and Expenses
Security transactions are accounted for on trade date. Dividend income is recorded on the ex-dividend date, except that if the ex-dividend date has passed, certain dividends from foreign securities are recorded as soon as the Fund is informed of the ex-dividend date. Non-cash dividends, if any, are recorded at the fair market value of the securities received. Interest income, including amortization of premium and accretion of discounts using the effective interest method, is earned from settlement date and accrued daily.
Expenses are recorded on an accrual basis. Most expenses of the Fund can be attributed to a specific series. Expenses which cannot be directly attributed are apportioned among the series in the Fund in such a manner as deemed equitable by the Fund’s Board, taking into consideration, among other things, the nature and type of expense.
The Series uses the identified cost method for determining realized gain or loss on investments for both financial statement and federal income tax reporting purposes.
Foreign Currency Translation
The books and records of the Series are maintained in U.S. dollars. Foreign currencies, investments and other assets and liabilities are translated into U.S. dollars at the current exchange rates. Purchases and sales of investment securities and income and expenses are translated on the respective dates of such transactions. The Series does not isolate realized and unrealized gains and losses attributable to changes in the exchange rates from gains and losses that arise from changes in the market value of investments. Such fluctuations are included with net realized and unrealized gain or loss on investments. Net realized foreign currency gains and losses represent foreign currency
15
Notes to Financial Statements (unaudited)
2. | SIGNIFICANT ACCOUNTING POLICIES (continued) |
Foreign Currency Translation (continued)
gains and losses between trade date and settlement date on securities transactions, gains and losses on disposition of foreign currencies and the difference between the amount of income and foreign withholding taxes recorded on the books of the Series and the amounts actually received or paid.
Federal Taxes
The Series’ policy is to comply with the provisions of the Internal Revenue Code applicable to regulated investment companies. The Series is not subject to federal income or excise tax to the extent that the Series distributes to shareholders each year its taxable income, including any net realized gains on investments, in accordance with requirements of the Internal Revenue Code. Accordingly, no provision for federal income tax or excise tax has been made in the financial statements.
Management evaluates its tax positions to determine if the tax positions taken meet the minimum recognition threshold in connection with accounting for uncertainties in income tax positions taken or expected to be taken for the purposes of measuring and recognizing tax liabilities in the financial statements. Recognition of tax benefits of an uncertain tax position is required only when the position is “more likely than not” to be sustained assuming examination by taxing authorities. At April 30, 2010, the Series has recorded no liability for net unrecognized tax benefits relating to uncertain income tax positions taken or expected to be taken in future tax returns.
The Series files income tax returns in the U.S. federal jurisdiction, various states and foreign jurisdictions, as required. No income tax returns are currently under investigation. The statute of limitations on the Series’ tax returns remains open for the year ended October 31, 2009. The Fund is not aware of any tax positions for which it is reasonably possible that the total amounts of unrecognized tax benefits will significantly change in the next twelve months.
Additionally, based on the Fund’s understanding of the tax rules and rates related to income, gains and transactions for foreign jurisdictions in which it invests, the Series will provide for foreign taxes, and where appropriate, deferred foreign tax.
Distributions of Income and Gains
Distributions to shareholders of net investment income are made quarterly. Distributions of net realized gains are made annually. An additional distribution may be necessary to avoid taxation of the Series. Distributions are recorded on the ex-dividend date.
Indemnifications
The Fund’s organizational documents provide former and current directors and officers with a limited indemnification against liabilities arising in connection with the performance of their duties to the Fund. In the normal course of business, the Fund may also enter into contracts that provide general indemnifications. The Fund’s maximum exposure under these arrangements is unknown as this would be dependent on future claims that may be made against the Fund. The risk of material loss from such claims is considered remote.
Other
The preparation of financial statements in conformity with accounting principles generally accepted in the United States requires management to make estimates and assumptions that affect the reported amounts of assets and liabilities and the disclosure of contingent assets and liabilities at the date of the financial statements and the reported amounts of income and expenses during the reporting period. Actual results could differ from those estimates.
3. | TRANSACTIONS WITH AFFILIATES |
The Fund has an Investment Advisory Agreement (the “Agreement”) with the Advisor, for which the Series pays a fee, computed daily and payable monthly, at an annual rate of 0.45% of the Series’ average daily net assets.
16
Notes to Financial Statements (unaudited)
3. | TRANSACTIONS WITH AFFILIATES (continued) |
Under the Agreement, personnel of the Advisor provide the Series with advice and assistance in the choice of investments and the execution of securities transactions, and otherwise maintain the Series’ organization. The Advisor also provides the Fund with necessary office space and fund administration and support services. The salaries of all officers of the Fund (except a percentage of the Fund’s Chief Compliance Officer’s salary, which is paid by the Fund), and of all Directors who are “affiliated persons” of the Fund, or of the Advisor, and all personnel of the Fund, or of the Advisor, performing services relating to research, statistical and investment activities, are paid by the Advisor. Each “non-affiliated” Director receives an annual stipend, which is allocated among all the active series of the Fund. In addition, these Directors also receive a fee per Board meeting attended for each active series of the Fund plus a fee for each committee meeting attended.
The Advisor has contractually agreed, until at least February 28, 2011, to waive its fee and, if necessary, pay other operating expenses of the Series in order to maintain total direct annual fund operating expenses for the Series at no more than 0.60% of average daily net assets each year. Accordingly, the Advisor waived fees of $47,946 for the six months ended April 30, 2010, which is included as a reduction of expenses on the Statement of Operations. The Advisor voluntarily waived additional fees of $758 for the six months ended April 30, 2010, which is also included as a reduction of expenses on the Statement of Operations. The Advisor is not eligible to recoup any expenses that have been waived or reimbursed in prior period.
Manning & Napier Investor Services, Inc., a registered broker-dealer affiliate of the Advisor, acts as distributor for the Fund’s shares. The services of Manning & Napier Investor Services, Inc. are provided at no additional cost to the Series.
For fund accounting and transfer agent services through November 7, 2009, the Fund paid the Advisor an annual fee of 0.055% of the Fund’s average daily net assets up to $4.5 billion, 0.03% of the Fund’s average daily net assets between $4.5 billion and $7.5 billion, and 0.02% of the Fund’s average daily net assets over $7.5 billion. Additionally, certain transaction and account-based fees and out-of-pocket expenses, including charges for reporting relating to the Fund’s compliance program, are charged. Expenses not directly attributable to a Series are allocated based on each Series’ relative net assets or number of accounts, depending on the expense. Prior to October 12, 2009 (for sub-accountant) and November 9, 2009 (for sub-transfer agent), the Advisor had and agreement with Citi Fund Services Ohio, Inc. (“Citi”) under which Citi served as sub-accountant and sub-transfer agent.
The Advisor has entered into agreements dated October 12, 2009 and November 9, 2009 with PNC Global Investment Servicing (U.S.) Inc. (“PNCGIS”) under which PNCGIS serves as sub-accountant services agent and sub-transfer agent, respectively. Effective November 7, 2009 under the amended master services agreement, the Fund pays the Advisor an annual fee of 0.0175% on the first $3 billion of average daily net assets (excluding Target Series); 0.015% on the next $3 billion of average daily net assets (excluding Target Series); and 0.01% of the average daily net assets in excess of $6 billion (excluding Target Series); plus a base fee of $25,500 per Series. Additionally, certain transaction-, account-, and cusip-based fees and out-of-pocket expenses, including charges for reporting relating to the Fund’s compliance program, are charged.
On February 2, 2010, The PNC Financial Services Group, Inc. (“PNC”), which serves as the Series’ sub-accountant services agent and sub-transfer agent, entered into a Stock Purchase Agreement (the “Stock Purchase Agreement”) with The Bank of New York Mellon Corporation (“BNY Mellon”), the Series’ custodian. Upon the terms and subject to the conditions set forth in the Stock Purchase Agreement, which has been approved by the board of directors of each company, PNC will sell to BNY Mellon (the “Stock Sale”) 100% of the issued and outstanding shares of PNC Global Investment Servicing Inc., an indirect, wholly-owned subsidiary of PNC. The Stock Sale is expected to close in the third quarter of 2010. Management has concluded that this will not have a material impact on the Series’ financial statements.
17
Notes to Financial Statements (unaudited)
4. | PURCHASES AND SALES OF SECURITIES |
For the six months ended April 30, 2010, purchases and sales of securities, other than U.S. Government securities and short-term securities, were $1,125,302 and $1,332,534, respectively. There were no purchases or sales of U.S. Government securities.
5. | CAPITAL STOCK TRANSACTIONS |
Transactions in shares of Dividend Focus Series were:
| | | | | | | | | | | | | | |
| | | For the Six Months Ended 4/30/10 | | | For the period 11/7/08 (commencement of operations) to 10/31/09 | |
| | | Shares | | | Amount | | | Shares | | | Amount | |
Sold | | 53,548 | | | $ | 642,974 | | | 205,149 | | | $ | 2,029,521 | |
Reinvested | | 3,281 | | | | 39,546 | | | 2,031 | | | | 21,640 | |
Repurchased | | (76,664 | ) | | | (920,922 | ) | | (27,477 | ) | | | (270,040 | ) |
| | | | | | | | | | | | | | |
Total | | (19,835 | ) | | $ | (238,402 | ) | | 179,703 | | | $ | 1,781,121 | |
| | | | | | | | | | | | | | |
At April 30, 2010, one shareholder owned 27,009 shares of the Series (16.9% of shares outstanding) valued at $332,216. In addition, the Advisor owned 51,788 shares (32.4% of shares outstanding) valued at $636,992 and the retirement plan of the Advisor and its affiliates owned 41,275 shares of the Series (25.8% of shares outstanding) valued at $507,679. Investment activities of these shareholders may have a material effect on the Series.
The Series may trade in instruments including written and purchased options, forward foreign currency exchange contracts and futures contracts and other derivatives in the normal course of investing activities to assist in managing exposure to various market risks. The Series may be subject to various elements of risk and may involve, to a varying degree, elements of risk in excess of the amounts recognized for financial statement purposes. These risks include: the risk that changes in the value of a derivative may not correlate perfectly with the underlying asset, rate or index, counterparty credit risk related to over the counter derivatives counterparties failure to perform under contract terms, liquidity risk related to the lack of a liquid market for these contracts allowing the fund to close out its position(s) and documentation risk relating to disagreement over contract terms. No such investments were held by the Series on April 30, 2010.
Investing in securities of foreign companies and foreign governments involves special risks and considerations not typically associated with investing in securities of domestic companies and the U.S. Government. These risks include revaluation of currencies and future adverse political and economic developments. Moreover, securities of foreign companies and foreign governments and their markets may be less liquid and their prices more volatile than those of comparable domestic companies and the U.S. Government.
8. | FEDERAL INCOME TAX INFORMATION |
The amount and characterization of certain income and capital gains to be distributed are determined in accordance with federal income tax regulations, which may differ from accounting principles generally accepted in the United States of America. These differences are primarily due to differing book and tax treatments in the timing and recognition of net investment income or gains and losses including losses deferred due to wash sales and investments in Real Estate Investment Trusts. The Series may periodically make reclassifications among its capital accounts to reflect
18
Notes to Financial Statements (unaudited)
8. | FEDERAL INCOME TAX INFORMATION (continued) |
income and gains available for distribution (or available capital loss carryovers) under income tax regulations, without impacting the Series’ net asset value. Any such reclassifications are not reflected in the financial highlights.
The final determination of the tax character of current year distributions will be made at the conclusion of the fiscal year. The tax character of distributions paid for the period November 7, 2008 (commencement of operations) to October 31, 2009 were as follows:
| | | | | | |
Ordinary income | | $ | 21,640 | | | |
At April 30, 2010, the identified cost of investments for federal income tax purposes, the resulting gross unrealized appreciation and depreciation, and the net unrealized appreciation were as follows: |
Cost for federal income tax purposes | | $ | 1,832,067 | | | |
Unrealized appreciation | | $ | 172,041 | | | |
Unrealized depreciation | | | (29,284 | ) | | |
| | | | | | |
Net unrealized appreciation | | $ | 142,757 | | | |
| | | | | | |
There were no subsequent events that require recognition or disclosure. In preparing these financial statements, management of the Fund has evaluated events and transactions for potential recognition or disclosure through the date the financial statements were issued.
19
Renewal of Investment Advisory Agreement (unaudited)
At the Manning & Napier Fund, Inc. (the “Fund”) Board of Directors’ (the “Board”) meeting, held on December 7, 2009, the Investment Advisory Agreement (the “Agreement”) between the Fund and Manning & Napier Advisors, Inc. (the “Advisor”) was reviewed by the Board for renewal. In connection with the decision whether to renew the Agreement, a variety of material was prepared for and reviewed by the Board.
Representatives of the Advisor attended the meeting and presented additional oral and written information to the Board to assist the Board in its considerations. The discussion immediately below outlines the materials and information presented to the Board in connection with the Board’s 2009 Annual Review of the Agreement and the conclusions made by the Directors when determining to continue the Agreement.
| | • | | The Board considered the services provided by the Advisor under the Agreement including, among others: deciding what securities to purchase and sell for each Series; arranging for the purchase and sale of such securities by placing orders with broker-dealers; administering the affairs of the Fund (including the books and records of the Fund not maintained by third party service providers such as the custodian or sub-transfer agent); arranging for the insurance coverage for the Fund; and supervising the preparation of tax returns, SEC filings (including registration statements) and reports to shareholders for the Fund. The Board also considered the nature and quality of such services provided under the Agreement in light of the Advisor’s services provided to the Fund for 23 years. The Board discussed the quality of these services with representatives from the Advisor and concluded that the Advisor was performing its services to the Fund required under the Agreement in a reasonable manner. |
| | • | | The Board considered the investment performance of the various Series of the Fund. The investment performance for each Series was reviewed on a cumulative basis since inception and on a one year basis. In addition, annualized performance for the following time periods was considered: inception, three year, five year, ten year, and current market cycle. A market cycle includes periods of both rising and falling markets. Returns for established benchmark indices for each Series were provided for each time period. The Board noted that the various Series were competitive against their respective benchmarks and/or peer groups over various time periods, but in particular over the full market cycle periods relevant for the Series. In addition, the Board considered at the meeting (and considers on a quarterly basis) a peer group performance analysis consisting of Morningstar universes of mutual funds with similar investment objectives. The Board discussed the performance with representatives from the Advisor and concluded that the investment performance of each of the Fund’s Series was reasonable based on the Fund’s actual performance and comparative performance, especially performance over the current market cycle. |
| | • | | The Board considered the costs of the Advisor’s services and the profits of the Advisor as they relate to the Advisor’s services to the Fund under the Agreement. In reviewing the Advisor’s costs and profits, the Board discussed the Advisor’s revenues generated from the Fund (on both an actual and adjusted basis) and its expenses associated with providing the services under the Agreement. In addition, the Board reviewed the Advisor’s expenses associated with Fund activities outside of the Agreement (such as expense reimbursements pursuant to expense caps and payments made by the Advisor to third party platforms on which shares of the Fund are available for purchase). It was noted by representatives of the Advisor that 13 of the 26 active Series of the Fund are currently experiencing expenses above the capped expense ratios. After discussing the above costs and profits, the Board concluded that the Advisor’s profitability relating to its services provided under the Agreement was reasonable. |
| | • | | The Board considered the fees and expenses of the various Series of the Fund. The Advisor presented the advisory fees and total expenses for each Series, including the advisory fee adjusted for any expense waivers or reimbursements (either contractual or voluntary) paid by the Advisor. The advisory fees and expense ratios of each Series were compared to an average (on both a mean and median basis) of similar funds as disclosed on the Morningstar database. Representatives of the Advisor discussed with the Board the levels of its advisory |
Renewal of Investment Advisory Agreement (unaudited)
| | fee for each Series of the Fund and as compared to the median and mean advisory fees for similar funds as listed on Morningstar. Expense ratios for every Series, except the Global Fixed Income Series and the Target Series Class R and Class C, are currently below the median and mean for similar funds as listed on Morningstar. Based on their review of the information provided, the Board concluded that the fees and expenses of each Series of the Fund were reasonable on a comparative basis. |
| | • | | The Board also considered the other benefits the Advisor derives from its relationship with the Fund. Such other benefits include certain research products provided by soft dollars. Given the level of soft dollar transactions involving the Fund, the Board concluded that these additional benefits to the Advisor were reasonable. |
| | • | | In addition to the factors described above, the Board considered the Advisor’s personnel, investment strategies, policies and procedures relating to compliance with personal securities transactions, and reputation, expertise and resources in domestic and foreign financial markets. The Board concluded that these factors support the conclusion that the Advisor performs its services in a reasonable manner. |
| | • | | The Board did not consider economies of scale at this time because of the multiple uses of the Fund (for the Advisor’s discretionary investment account clients in addition to direct investors), the current profitability of the Advisor’s services to the Fund under the Agreement, and the overall size of the Fund complex. |
Based on the Board’s deliberations and their evaluation of the information described above, the Board, including a majority of Directors that are not “interested persons” as defined in the Investment Company Act of 1940, concluded that the compensation under the Agreement was fair and reasonable in light of the services and expenses and such other matters as the Directors considered to be relevant in the exercise of their reasonable judgment. Accordingly, the Board approved the renewal of the Agreement. In the course of their deliberations, the Directors did not identify any particular information that was all important or controlling.
21
Literature Requests (unaudited)
Proxy Voting Policies and Procedures
A description of the policies and procedures that the Fund uses to determine how to vote proxies relating to portfolio securities is available, without charge, upon request:
| | | | |
By phone | | 1-800-466-3863 | | |
On the Securities and Exchange | | | | |
Commission’s (SEC) web site | | http://www.sec.gov | | |
Proxy Voting Record
Information regarding how the Fund voted proxies relating to portfolio securities during the most recent 12-month period ended June 30th is available, without charge, upon request:
| | | | |
By phone | | 1-800-466-3863 | | |
On the SEC’s web site | | http://www.sec.gov | | |
Quarterly Portfolio Holdings
The Series’ complete schedule of portfolio holdings for the 1st and 3rd quarters of each fiscal year are provided on Form N-Q, and are available, without charge, upon request:
| | | | |
By phone | | 1-800-466-3863 | | |
On the SEC’s web site | | http://www.sec.gov | | |
The Series’ Form N-Q may be reviewed and copied at the SEC’s Public Reference Room in Washington, D.C. Information on the operation of the Public Reference Room may be obtained by calling 1-800-SEC-0330.
Prospectus and Statement of Additional Information (SAI)
The prospectus and SAI provide additional information about each Series, including charges, expenses and risks. These documents are available, without charge, upon request:
| | | | |
By phone | | 1-800-466-3863 | | |
On the SEC’s web site | | http://www.sec.gov | | |
On the Advisor’s web site | | http://manningnapieradvisors.com | | |
Additional information available at www.manningnapieradvisors.com
1. Fund Holdings - Month-End
2. Fund Holdings - Quarter-End
3. Shareholder Report - Annual
4. Shareholder Report - Semi-Annual
MNDIV-04/10-SAR

Shareholder Expense Example (unaudited)
As a shareholder of the Series, you may incur two types of costs: (1) transaction costs, including potential wire charges on redemptions and (2) ongoing costs, including management fees and other Series expenses. This example is intended to help you understand your ongoing costs (in dollars) of investing in the Series and to compare these costs with the ongoing costs of investing in other mutual funds.
The example is based on an investment of $1,000 invested at the beginning of the period and held for the entire period (November 1, 2009 to April 30, 2010).
Actual Expenses
The first line of the table below provides information about actual account values and actual expenses. You may use the information in this line, together with the amount you invested, to estimate the expenses that you paid over the period. Simply divide your account value by $1,000 (for example, an $8,600 account value divided by $1,000 = 8.6), then multiply the result by the number in the first line under the heading entitled “Expenses Paid During Period” to estimate the expenses you paid on your account during this period.
Hypothetical Example for Comparison Purposes
The second line of the table below provides information about hypothetical account values and hypothetical expenses based on the Series’ actual expense ratio and an assumed rate of return of 5% per year before expenses, which is not the Series’ actual return. The hypothetical account values and expenses may not be used to estimate the actual ending account balance or expenses you paid during the period. You may use this information to compare the ongoing costs of investing in the Series and other funds. To do so, compare this 5% hypothetical example with the 5% hypothetical examples that appear in the shareholder reports of the other funds.
Please note that the expenses shown in the table are meant to highlight your ongoing costs only and do not reflect any transaction costs. Therefore, the second line of the table is useful in comparing ongoing costs only, and will not help you determine the relative total costs of owning different funds. In addition, if these transaction costs were included, your costs would have been higher.
| | | | | | | | | | |
| | | Beginning
Account Value
11/1/09 | | | | Ending
Account Value
4/30/10 | | | | Expenses Paid During Period* 11/1/09-4/30/10 |
Actual | | $1,000.00 | | | | $1,093.30 | | | | $3.89 |
Hypothetical
(5% return before expenses) | | $1,000.00 | | | | $1,021.08 | | | | $3.76 |
*Expenses are equal to the Series’ annualized expense ratio (for the six-month period) of 0.75%, multiplied by the average account value over the period, multiplied by 181/365 (to reflect the one-half year period). Expenses are based on the most recent fiscal half year. The Series’ total return would have been lower had certain expenses not been waived during the period.
Portfolio Composition as of April 30, 2010 (unaudited)
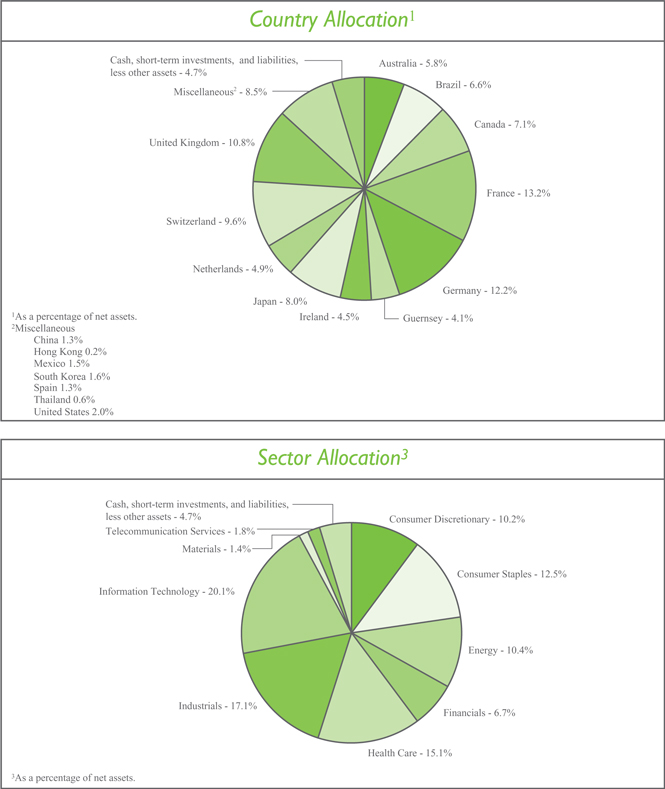
Investment Portfolio - April 30, 2010 (unaudited)
| | | | | | | | | |
| | | Shares | | | | Value (Note 2) | | |
| | | | |
COMMON STOCKS - 94.3% | | | | | | | | | |
| | | | |
Consumer Discretionary - 10.2% | | | | | | | | | |
Automobiles - 2.1% | | | | | | | | | |
Bayerische Motoren Werke AG (BMW) (Germany) | | 226,390 | | | | $ | 11,191,996 | | |
Suzuki Motor Corp. (Japan) | | 149,100 | | | | | 3,157,076 | | |
| | | | | | | | | |
| | | | | | | 14,349,072 | | |
| | | | | | | | | |
Hotels, Restaurants & Leisure - 0.4% | | | | | | | | | |
Club Mediterranee S.A. (France)* | | 143,168 | | | | | 2,408,500 | | |
| | | | | | | | | |
Leisure Equipment & Products - 0.4% | | | | | | | | | |
Sankyo Co. Ltd. (Japan) | | 66,200 | | | | | 3,069,154 | | |
| | | | | | | | | |
Media - 5.0% | | | | | | | | | |
Grupo Televisa S.A. - ADR (Mexico) | | 504,210 | | | | | 10,477,484 | | |
Reed Elsevier plc (United Kingdom) | | 888,740 | | | | | 6,996,293 | | |
Societe Television Francaise 1 (France) | | 930,630 | | | | | 17,353,438 | | |
| | | | | | | | | |
| | | | | | | 34,827,215 | | |
| | | | | | | | | |
Multiline Retail - 1.2% | | | | | | | | | |
Marks & Spencer Group plc (United Kingdom) | | 1,540,760 | | | | | 8,640,062 | | |
| | | | | | | | | |
Textiles, Apparel & Luxury Goods - 1.1% | | | | | | | | | |
Adidas AG (Germany) | | 131,530 | | | | | 7,733,556 | | |
| | | | | | | | | |
Total Consumer Discretionary | | | | | | | 71,027,559 | | |
| | | | | | | | | |
Consumer Staples - 11.5% | | | | | | | | | |
Beverages - 1.7% | | | | | | | | | |
Heineken N.V. (Netherlands) | | 259,570 | | | | | 12,158,380 | | |
| | | | | | | | | |
Food & Staples Retailing - 4.4% | | | | | | | | | |
Carrefour S.A. (France) | | 348,650 | | | | | 17,101,518 | | |
Tesco plc (United Kingdom) | | 2,065,890 | | | | | 13,754,793 | | |
| | | | | | | | | |
| | | | | | | 30,856,311 | | |
| | | | | | | | | |
Food Products - 5.4% | | | | | | | | | |
Danone S.A. (France) | | 174,020 | | | | | 10,282,810 | | |
Nestle S.A. (Switzerland) | | 264,960 | | | | | 13,012,253 | | |
Unilever plc - ADR (United Kingdom) | | 467,690 | | | | | 14,077,469 | | |
| | | | | | | | | |
| | | | | | | 37,372,532 | | |
| | | | | | | | | |
Total Consumer Staples | | | | | | | 80,387,223 | | |
| | | | | | | | | |
Energy - 10.4% | | | | | | | | | |
Energy Equipment & Services - 7.0% | | | | | | | | | |
Calfrac Well Services Ltd. (Canada) | | 394,050 | | | | | 8,382,969 | | |
Compagnie Generale de Geophysique - Veritas (CGG - Veritas) (France)* | | 548,620 | | | | | 16,570,507 | | |
Schlumberger Ltd. (United States) | | 191,070 | | | | | 13,646,219 | | |
Trican Well Service Ltd. (Canada) | | 791,200 | | | | | 10,047,726 | | |
| | | | | | | | | |
| | | | |
| | | | | | | 48,647,421 | | |
| | | | | | | | | |
| | | | |
| | The accompanying notes are an integral part of the financial statements. | | 3 |
Investment Portfolio - April 30, 2010 (unaudited)
| | | | | | | | | |
| | | Shares | | | | Value (Note 2) | | |
| | | | |
COMMON STOCKS (continued) | | | | | | | | | |
| | | | |
Energy (continued) | | | | | | | | | |
Oil, Gas & Consumable Fuels - 3.4% | | | | | | | | | |
Cameco Corp. (Canada) | | 207,280 | | | | $ | 5,101,161 | | |
Talisman Energy, Inc. (Canada) | | 797,810 | | | | | 13,579,578 | | |
Uranium One, Inc. (Canada)* | | 1,895,490 | | | | | 4,795,638 | | |
| | | | | | | | | |
| | | | | | | 23,476,377 | | |
| | | | | | | | | |
Total Energy | | | | | | | 72,123,798 | | |
| | | | | | | | | |
Financials - 6.7% | | | | | | | | | |
Commercial Banks - 1.0% | | | | | | | | | |
HSBC Holdings plc (United Kingdom) | | 679,840 | | | | | 6,948,500 | | |
| | | | | | | | | |
Diversified Financial Services - 2.7% | | | | | | | | | |
Deutsche Boerse AG (Germany) | | 196,410 | | | | | 15,308,819 | | |
Financiere Marc de Lacharriere S.A. (Fimalac) (France) | | 74,940 | | | | | 3,722,255 | | |
| | | | | | | | | |
| | | | | | | 19,031,074 | | |
| | | | | | | | | |
Insurance - 3.0% | | | | | | | | | |
Allianz SE (Germany) | | 104,900 | | | | | 12,084,185 | | |
Willis Group Holdings plc (United Kingdom) | | 255,790 | | | | | 8,811,965 | | |
| | | | | | | | | |
| | | | | | | 20,896,150 | | |
| | | | | | | | | |
Total Financials | | | | | | | 46,875,724 | | |
| | | | | | | | | |
Health Care - 15.1% | | | | | | | | | |
Biotechnology - 1.9% | | | | | | | | | |
CSL Ltd. (Australia) | | 287,910 | | | | | 8,628,797 | | |
Grifols S.A. (Spain) | | 339,890 | | | | | 4,321,825 | | |
| | | | | | | | | |
| | | | | | | 12,950,622 | | |
| | | | | | | | | |
Health Care Equipment & Supplies - 4.4% | | | | | | | | | |
Cochlear Ltd. (Australia) | | 118,730 | | | | | 8,140,690 | | |
Covidien plc (Ireland) | | 200,070 | | | | | 9,601,359 | | |
Nobel Biocare Holding AG (Switzerland) | | 262,240 | | | | | 5,814,288 | | |
Straumann Holding AG (Switzerland) | | 28,680 | | | | | 7,115,700 | | |
| | | | | | | | | |
| | | | | | | 30,672,037 | | |
| | | | | | | | | |
Health Care Providers & Services - 5.2% | | | | | | | | | |
BML, Inc. (Japan) | | 112,800 | | | | | 2,737,893 | | |
Bumrungrad Hospital Public Co. Ltd. - NVDR (Thailand) | | 4,477,000 | | | | | 4,151,136 | | |
Diagnosticos da America S.A. (Brazil)* | | 655,480 | | | | | 5,663,920 | | |
Sonic Healthcare Ltd. (Australia) | | 1,857,560 | | | | | 23,719,444 | | |
| | | | | | | | | |
| | | | | | | 36,272,393 | | |
| | | | | | | | | |
Life Sciences Tools & Services - 2.8% | | | | | | | | | |
Lonza Group AG (Switzerland) | | 251,170 | | | | | 19,722,032 | | |
| | | | | | | | | |
| | | | |
| 4 | | The accompanying notes are an integral part of the financial statements. | | |
Investment Portfolio - April 30, 2010 (unaudited)
| | | | | | | | | |
| | | Shares | | | | Value (Note 2) | | |
| | | | |
COMMON STOCKS (continued) | | | | | | | | | |
| | | | |
Health Care (continued) | | | | | | | | | |
Pharmaceuticals - 0.8% | | | | | | | | | |
Santen Pharmaceutical Co. Ltd. (Japan) | | 182,400 | | | | $ | 5,825,305 | | |
| | | | | | | | | |
Total Health Care | | | | | | | 105,442,389 | | |
| | | | | | | | | |
Industrials - 17.1% | | | | | | | | | |
Aerospace & Defense - 1.9% | | | | | | | | | |
Empresa Brasileira de Aeronautica S.A. (Embraer) - ADR (Brazil) | | 569,550 | | | | | 13,714,764 | | |
| | | | | | | | | |
Air Freight & Logistics - 3.1% | | | | | | | | | |
TNT N.V. (Netherlands) | | 712,610 | | | | | 21,898,435 | | |
| | | | | | | | | |
Airlines - 2.1% | | | | | | | | | |
Ryanair Holdings plc - ADR (Ireland)* | | 517,200 | | | | | 14,564,352 | | |
| | | | | | | | | |
Electrical Equipment - 4.5% | | | | | | | | | |
ABB Ltd. (Asea Brown Boveri) - ADR (Switzerland)* | | 819,060 | | | | | 15,693,190 | | |
Gamesa Corporacion Tecnologica S.A. (Spain) | | 409,200 | | | | | 5,067,464 | | |
Nexans S.A. (France) | | 86,160 | | | | | 6,840,626 | | |
Yingli Green Energy Holding Co. Ltd. - ADR (China)* | | 287,800 | | | | | 3,634,914 | | |
| | | | | | | | | |
| | | | | | | 31,236,194 | | |
| | | | | | | | | |
Industrial Conglomerates - 3.1% | | | | | | | | | |
Siemens AG (Germany) | | 216,950 | | | | | 21,473,735 | | |
| | | | | | | | | |
Professional Services - 0.8% | | | | | | | | | |
Adecco S.A. (Switzerland) | | 93,180 | | | | | 5,498,239 | | |
| | | | | | | | | |
Road & Rail - 1.6% | | | | | | | | | |
All America Latina Logistica S.A. (Brazil) | | 629,430 | | | | | 5,630,742 | | |
Canadian National Railway Co. (Canada) | | 88,550 | | | | | 5,294,404 | | |
| | | | | | | | | |
| | | | | | | 10,925,146 | | |
| | | | | | | | | |
Total Industrials | | | | | | | 119,310,865 | | |
| | | | | | | | | |
Information Technology - 20.1% | | | | | | | | | |
Communications Equipment - 1.6% | | | | | | | | | |
Alcatel-Lucent - ADR (France)* | | 3,549,620 | | | | | 11,252,295 | | |
| | | | | | | | | |
IT Services - 8.2% | | | | | | | | | |
Accenture plc - Class A (Ireland) | | 162,390 | | | | | 7,086,700 | | |
Amdocs Ltd. (Guernsey)* | | 894,010 | | | | | 28,554,679 | | |
Cielo S.A. (Brazil) | | 1,094,560 | | | | | 10,572,508 | | |
Redecard S.A. (Brazil) | | 637,700 | | | | | 10,587,673 | | |
| | | | | | | | | |
| | | | | | | 56,801,560 | | |
| | | | | | | | | |
Semiconductors & Semiconductor Equipment - 4.8% | | | | | | | | | |
Advantest Corp. (Japan) | | 561,400 | | | | | 14,648,336 | | |
Sumco Corp. (Japan)* | | 351,770 | | | | | 7,845,405 | | |
Tokyo Electron Ltd. (Japan) | | 168,400 | | | | | 11,132,847 | | |
| | | | | | | | | |
| | | | | | | 33,626,588 | | |
| | | | | | | | | |
| | | | |
| | The accompanying notes are an integral part of the financial statements. | | 5 |
Investment Portfolio - April 30, 2010 (unaudited)
| | | | | | | | | | |
| | | Shares | | | | Value (Note 2) | | | |
| | | | |
COMMON STOCKS (continued) | | | | | | | | | | |
| | | | |
Information Technology (continued) | | | | | | | | | | |
Software - 5.5% | | | | | | | | | | |
Misys plc (United Kingdom)* | | 2,404,720 | | | | $ | 8,613,385 | | | |
SAP AG - ADR (Germany) | | 221,020 | | | | | 10,487,399 | | | |
Shanda Interactive Entertainment Ltd. - ADR (China)* | | 124,850 | | | | | 5,660,699 | | | |
Square Enix Holdings Co. Ltd. (Japan) | | 337,500 | | | | | 7,135,519 | | | |
UbiSoft Entertainment S.A. (France)* | | 507,160 | | | | | 6,500,718 | | | |
| | | | | | | | | | |
| | | | | | | 38,397,720 | | | |
| | | | | | | | | | |
Total Information Technology | | | | | | | 140,078,163 | | | |
| | | | | | | | | | |
Materials - 1.4% | | | | | | | | | | |
Chemicals - 1.1% | | | | | | | | | | |
Johnson Matthey plc (United Kingdom) | | 284,920 | | | | | 7,598,506 | | | |
| | | | | | | | | | |
Paper & Forest Products - 0.3% | | | | | | | | | | |
Norbord, Inc. (Canada)* | | 111,782 | | | | | 2,188,762 | | | |
| | | | | | | | | | |
Total Materials | | | | | | | 9,787,268 | | | |
| | | | | | | | | | |
Telecommunication Services - 1.8% | | | | | | | | | | |
Wireless Telecommunication Services - 1.8% | | | | | | | | | | |
Hutchison Telecommunications International Ltd. (Hong Kong)* | | 6,307,000 | | | | | 1,762,741 | | | |
SK Telecom Co. Ltd. - ADR (South Korea) | | 596,270 | | | | | 11,036,958 | | | |
| | | | | | | | | | |
Total Telecommunication Services | | | | | | | 12,799,699 | | | |
| | | | | | | | | | |
TOTAL COMMON STOCKS
(Identified Cost $619,069,508) | | | | | | | 657,832,688 | | | |
| | | | | | | | | | |
| | | | |
PREFERRED STOCKS - 1.0% | | | | | | | | | | |
| | | | |
Consumer Staples - 1.0% | | | | | | | | | | |
Household Products - 1.0% | | | | | | | | | | |
Henkel AG & Co. KGaA (Germany) (Identified Cost $4,649,810) | | 133,570 | | | | | 7,153,694 | | | |
| | | | | | | | | | |
| | | | |
SHORT-TERM INVESTMENTS - 5.1% | | | | | | | | | | |
| | | | |
Dreyfus Cash Management, Inc. - Institutional Shares1 , 0.09% (Identified Cost $35,375,466) | | 35,375,466 | | | | | 35,375,466 | | | |
| | | | | | | | | | |
TOTAL INVESTMENTS - 100.4%
(Identified Cost $659,094,784) | | | | | | | 700,361,848 | | | |
LIABILITIES, LESS OTHER ASSETS - (0.4%) | | | | | | | (2,864,172 | ) | | |
| | | | | | | | | | |
NET ASSETS - 100% | | | | | | $ | 697,497,676 | | | |
| | | | | | | | | | |
| | | | |
| 6 | | The accompanying notes are an integral part of the financial statements. | | |
Investment Portfolio - April 30, 2010 (unaudited)
ADR - American Depository Receipt
NVDR - Non-Voting Depository Receipt
*Non-income producing security
1Rate shown is the current yield as of April 30, 2010.
The Series’ portfolio holds, as a percentage of net assets, greater than 10% in the following countries:
France - 13.2%; Germany - 12.2%; United Kingdom - 10.8%.
| | | | |
| | The accompanying notes are an integral part of the financial statements. | | 7 |
Statement of Assets & Liabilities (unaudited)
April 30, 2010
| | | | |
ASSETS: | | | | |
| |
Investments, at value (identified cost $659,094,784) (Note 2) | | $ | 700,361,848 | |
Cash | | | 4,888 | |
Dividends receivable | | | 2,422,532 | |
Foreign tax reclaims receivable | | | 586,774 | |
Receivable for fund shares sold | | | 7,135 | |
| | | | |
| |
TOTAL ASSETS | | | 703,383,177 | |
| | | | |
| |
LIABILITIES: | | | | |
| |
Accrued management fees (Note 3) | | | 394,904 | |
Accrued fund accounting and administration fees (Note 3) | | | 9,438 | |
Accrued Chief Compliance Officer service fees (Note 3) | | | 667 | |
Accrued transfer agent fees (Note 3) | | | 13 | |
Payable for securities purchased | | | 4,981,047 | |
Payable for fund shares repurchased | | | 482,191 | |
Other payables and accrued expenses | | | 17,241 | |
| | | | |
| |
TOTAL LIABILITIES | | | 5,885,501 | |
| | | | |
| |
TOTAL NET ASSETS | | $ | 697,497,676 | |
| | | | |
| |
NET ASSETS CONSIST OF: | | | | |
| |
Capital stock | | $ | 296,746 | |
Additional paid-in-capital | | | 662,844,160 | |
Undistributed net investment income | | | 3,973,002 | |
Accumulated net realized loss on investments, foreign currency and translation of other assets and liabilities | | | (10,885,383 | ) |
Net unrealized appreciation on investments, foreign currency and translation of other assets and liabilities | | | 41,269,151 | |
| | | | |
| |
TOTAL NET ASSETS | | $ | 697,497,676 | |
| | | | |
| |
NET ASSET VALUE, OFFERING PRICE AND REDEMPTION PRICE PER SHARE - Class A
($697,497,676/29,674,619 shares) | | $ | 23.50 | |
| | | | |
| | | | |
| 8 | | The accompanying notes are an integral part of the financial statements. | | |
Statement of Operations (unaudited)
For the Six Months Ended April 30, 2010
| | | | |
INVESTMENT INCOME: | | | | |
| |
Dividends (net of foreign taxes withheld, $635,950) | | $ | 6,161,432 | |
Interest | | | 552 | |
| | | | |
| |
Total Investment Income | | | 6,161,984 | |
| | | | |
| |
EXPENSES: | | | | |
| |
Management fees (Note 3) | | | 2,016,751 | |
Fund accounting and administration fees (Note 3) | | | 55,714 | |
Directors’ fees (Note 3) | | | 6,373 | |
Transfer agent fees (Note 3) | | | 1,815 | |
Chief Compliance Officer service fees (Note 3) | | | 1,700 | |
Custodian fees | | | 42,238 | |
Miscellaneous | | | 40,803 | |
| | | | |
| |
Total Expenses | | | 2,165,394 | |
Less reduction of expenses (Note 3) | | | (4,589 | ) |
| | | | |
| |
Net Expenses | | | 2,160,805 | |
| | | | |
| |
NET INVESTMENT INCOME | | | 4,001,179 | |
| | | | |
| |
REALIZED AND UNREALIZED GAIN (LOSS) ON INVESTMENTS AND FOREIGN CURRENCY: | | | | |
| |
Net realized loss on- | | | | |
Investments | | | (1,613,946 | ) |
Foreign currency and translation of other assets and liabilities | | | (3,093 | ) |
| | | | |
| |
| | | (1,617,039 | ) |
| | | | |
| |
Net change in unrealized appreciation (depreciation) on- | | | | |
Investments | | | 44,951,485 | |
Foreign currency and translation of other assets and liabilities | | | (26,247 | ) |
| | | | |
| |
| | | 44,925,238 | |
| | | | |
| |
NET REALIZED AND UNREALIZED GAIN (LOSS) ON INVESTMENTS AND FOREIGN CURRENCY | | | 43,308,199 | |
| | | | |
| |
NET INCREASE IN NET ASSETS RESULTING FROM OPERATIONS | | $ | 47,309,378 | |
| | | | |
| | | | |
| | The accompanying notes are an integral part of the financial statements. | | 9 |
Statements of Changes in Net Assets
| | | | | | | | | | |
| | | For the Six Months Ended 4/30/10 (unaudited) | | | | | For the Year Ended 10/31/09 | |
INCREASE (DECREASE) IN NET ASSETS: | | | | | | | | | | |
| | | |
OPERATIONS: | | | | | | | | | | |
| | | |
Net investment income | | $ | 4,001,179 | | | | | $ | 5,685,176 | |
Net realized loss on investments and foreign currency | | | (1,617,039 | ) | | | | | (9,203,449 | ) |
Net change in unrealized appreciation (depreciation) on investments and foreign currency | | | 44,925,238 | | | | | | 95,428,502 | |
| | | | | | | | | | |
| | | |
Net increase from operations | | | 47,309,378 | | | | | | 91,910,229 | |
| | | | | | | | | | |
| | | |
DISTRIBUTIONS TO SHAREHOLDERS (Note 8): | | | | | | | | | | |
| | | |
From net investment income | | | (4,177,043 | ) | | | | | (4,819,796 | ) |
From net realized gain on investments | | | — | | | | | | (4,482,170 | ) |
| | | | | | | | | | |
| | | |
Total distributions to shareholders | | | (4,177,043 | ) | | | | | (9,301,966 | ) |
| | | | | | | | | | |
| | | |
CAPITAL STOCK ISSUED AND REPURCHASED: | | | | | | | | | | |
| | | |
Net increase from capital share transactions (Note 5) | | | 205,924,122 | | | | | | 191,461,774 | |
| | | | | | | | | | |
| | | |
Net increase in net assets | | | 249,056,457 | | | | | | 274,070,037 | |
| | | |
NET ASSETS: | | | | | | | | | | |
| | | |
Beginning of period | | | 448,441,219 | | | | | | 174,371,182 | |
| | | | | | | | | | |
| | | |
End of period (including undistributed net investment income of $3,973,002 and $4,148,866, respectively) | | $ | 697,497,676 | | | | | $ | 448,441,219 | |
| | | | | | | | | | |
| | | | |
| 10 | | The accompanying notes are an integral part of the financial statements. | | |
Financial Highlights
| | | | | | | | | | | | |
| | | For the Six | | | | | | | | | | |
| | | Months Ended | | | | | | | | | | |
| | | 4/30/10 | | For the Years Ended |
| | | (unaudited) | | 10/31/09 | | 10/31/08 | | 10/31/07 | | 10/31/06 | | 10/31/05 |
| Per share data (for a share outstanding throughout each period): | | | | | | | | | | | | |
Net asset value - Beginning of period | | $21.68 | | $17.78 | | $33.55 | | $26.69 | | $21.56 | | $18.84 |
| | | | | | | | | | | | |
Income (loss) from investment operations: | | | | | | | | | | | | |
Net investment income | | 0.161 | | 0.361 | | 0.34 | | 0.401 | | 0.421 | | 0.21 |
Net realized and unrealized gain (loss) on investments | | 1.85 | | 4.35 | | (13.17) | | 7.16 | | 6.42 | | 2.85 |
| | | | | | | | | | | | |
Total from investment operations | | 2.01 | | 4.71 | | (12.83) | | 7.56 | | 6.84 | | 3.06 |
| | | | | | | | | | | | |
Less distributions to shareholders: | | | | | | | | | | | | |
From net investment income | | (0.19) | | (0.42) | | (0.29) | | (0.17) | | (0.21) | | (0.15) |
From net realized gain on investments | | — | | (0.39) | | (2.65) | | (0.53) | | (1.50) | | (0.19) |
| | | | | | | | | | | | |
Total distributions to shareholders | | (0.19) | | (0.81) | | (2.94) | | (0.70) | | (1.71) | | (0.34) |
| | | | | | | | | | | | |
Net asset value - End of period | | $23.50 | | $21.68 | | $17.78 | | $33.55 | | $26.69 | | $21.56 |
| | | | | | | | | | | | |
Net assets - End of period
(000’s omitted) | | $697,498 | | $448,441 | | $174,371 | | $216,637 | | $87,418 | | $1,617 |
| | | | | | | | | | | | |
Total return2 | | 9.33% | | 28.10% | | (41.58%) | | 28.88% | | 33.68% | | 16.34% |
Ratios (to average net assets)/ | | | | | | | | | | | | |
Supplemental Data: | | | | | | | | | | | | |
Expenses* | | 0.75%3 | | 0.75% | | 0.80% | | 0.84% | | 0.95% | | 1.05% |
Net investment income | | 1.39%3 | | 1.97% | | 1.48% | | 1.34% | | 1.69% | | 1.15% |
Portfolio turnover | | 16% | | 49% | | 43% | | 54% | | 54% | | 40% |
|
*The investment advisor did not impose all or a portion of its management fees, CCO fees, fund accounting and transfer agent fees, and other fees in some periods and in some periods paid a portion of the Series’ expenses. If these expenses had been incurred by the Series, the expense ratio (to average net assets) would have been increased by the following amount: |
| | | | | | |
| | 0.00%3,4 | | 0.05% | | 0.03% | | N/A | | 0.09% | | 4.16% |
1Calculated based on average shares outstanding during the periods.
2Represents aggregate total return for the periods indicated, and assumes reinvestment of all distributions. Total return would have been lower had certain expenses not been waived or reimbursed during certain periods. Periods less than one year are not annualized.
3Annualized.
4Less than 0.01%.
| | | | |
| | The accompanying notes are an integral part of the financial statements. | | 11 |
Notes to Financial Statements (unaudited)
Overseas Series (the “Series”) is a no-load diversified series of Manning & Napier Fund, Inc. (the “Fund”). The Fund is organized in Maryland and is registered under the Investment Company Act of 1940, as amended, as an open-end management investment company.
The Series’ investment objective is to provide long-term growth by investing primarily in common stocks of issuers from outside the United States.
The Fund’s Advisor is Manning & Napier Advisors, Inc. (the “Advisor”). Shares of the Series are offered to investors and employees of the Advisor and its affiliates. The total authorized capital stock of the Fund consists of 10.0 billion shares of common stock each having a par value of $0.01. As of April 30, 2010, 6.2 billion shares have been designated in total among 29 series, of which 100 million have been designated as Overseas Series Class A common stock.
| 2. | SIGNIFICANT ACCOUNTING POLICIES |
Security Valuation
Portfolio securities, including domestic equities, foreign equities, warrants and options, listed on an exchange other than the NASDAQ National Market System are valued at the latest quoted sales price of the exchange on which the security is primarily traded. Securities not traded on valuation date or securities not listed on an exchange are valued at the latest quoted bid price provided by the Fund’s pricing service. Securities listed on the NASDAQ National Market System are valued in accordance with the NASDAQ Official Closing Price.
Short-term investments that mature in sixty days or less are valued at amortized cost, which approximates market value. Investments in open-end investment companies are valued at their net asset value per share on valuation date.
Volume and level of activity in established markets for an asset or liability are evaluated to determine whether recent transactions and quoted prices are determinative of fair value. Where there have been significant decreases in volume and level of activity, further analysis and adjustment may be necessary to estimate fair value. The Series measures fair value in these instances by the use of inputs and valuation techniques which may be based upon current market prices of securities that are comparable in coupon, rating, maturity and industry and/or expectation of future cash flows. As a result of trading in relatively thin markets and/or markets that experience significant volatility, the prices used by the Series to value these securities may differ from the value that would be realized if these securities were sold, and the differences could be material.
Securities for which representative valuations or prices are not available from the Fund’s pricing service may be valued at fair value. Due to the inherent uncertainty of valuations of such securities, the fair value may differ significantly from the values that would have been used had a ready market for such securities existed. If trading or events occurring after the close of the principal market in which securities are traded are expected to materially affect the value of those securities, then they may be valued at their fair value, taking this trading or these events into account. Fair value is determined in good faith by the Advisor under procedures approved by and under the general supervision and responsibility of the Fund’s Board of Directors (the “Board”).
Various inputs are used in determining the value of the Series’ assets or liabilities carried at market value. These inputs are summarized in three broad levels. Level 1 includes quoted prices in active markets for identical assets and liabilities. Level 2 includes other significant observable inputs (including quoted prices for similar securities, interest rates, prepayment speeds, credit risk, etc.). Level 3 includes significant unobservable inputs (including the Series’ own assumptions in determining the fair value of investments). The inputs or methodology used for valuing securities are not necessarily an indication of the risk associated with investing in those securities.
Notes to Financial Statements (unaudited)
| 2. | SIGNIFICANT ACCOUNTING POLICIES (continued) |
Security Valuation (continued)
The following is a summary of the valuation levels used for major security types as of April 30, 2010 in valuing the Series’ assets or liabilities carried at market value:
| | | | | | | | | | | | |
| Description | | 4/30/10 | | Level 1 | | Level 2 | | Level 3 |
Equity securities* | | $ | 657,832,688 | | $ | 657,832,688 | | $ | — | | $ | — |
Preferred securities | | | 7,153,694 | | | 7,153,694 | | | — | | | — |
Debt securities | | | — | | | — | | | — | | | — |
Mutual funds | | | 35,375,466 | | | 35,375,466 | | | — | | | — |
Other financial instruments** | | | — | | | — | | | — | | | — |
| | | | | | | | | | | | |
Total | | $ | 700,361,848 | | $ | 700,361,848 | | $ | — | | $ | — |
| | | | | | | | | | | | |
* Includes common stock, warrants and rights. Please see the Investment Portfolio for industry classification.
** Other financial instruments are derivative instruments not reflected in the Investment Portfolio, such as futures, forwards and swap contracts, which are valued at the unrealized appreciation/depreciation on the instrument. As of April 30, 2010, the Series did not hold any derivative instruments.
There were no Level 3 securities held by the Series as of October 31, 2009 or April 30, 2010.
The Fund’s policy is to recognize transfers in and transfers out of the valuation levels as of the end of the reporting period. There were no significant transfers between Level 1 and Level 2 as of April 30, 2010.
Additional disclosure surrounding the activity in Level 3 fair value measurement will also be effective for fiscal years beginning after December 15, 2010. Management has concluded that this will not have a material impact on the Series’ financial statements.
Security Transactions, Investment Income and Expenses
Security transactions are accounted for on trade date. Dividend income is recorded on the ex-dividend date, except that if the ex-dividend date has passed, certain dividends from foreign securities are recorded as soon as the Fund is informed of the ex-dividend date. Non-cash dividends, if any, are recorded at the fair market value of the securities received. Interest income, including amortization of premium and accretion of discounts using the effective interest method, is earned from settlement date and accrued daily.
Expenses are recorded on an accrual basis. Most expenses of the Fund can be attributed to a specific series. Expenses which cannot be directly attributed are apportioned among the series in the Fund in such a manner as deemed equitable by the Fund’s Board, taking into consideration, among other things, the nature and type of expense.
The Series uses the identified cost method for determining realized gain or loss on investments for both financial statement and federal income tax reporting purposes.
Foreign Currency Translation
The books and records of the Series are maintained in U.S. dollars. Foreign currencies, investments and other assets and liabilities are translated into U.S. dollars at the current exchange rates. Purchases and sales of investment securities and income and expenses are translated on the respective dates of such transactions. The Series does not isolate realized and unrealized gains and losses attributable to changes in the exchange rates from gains and losses that arise from changes in the market value of investments. Such fluctuations are included with net realized and unrealized gain or loss on investments. Net realized foreign currency gains and losses represent foreign currency
13
Notes to Financial Statements (unaudited)
| 2. | SIGNIFICANT ACCOUNTING POLICIES (continued) |
Foreign Currency Translation (continued)
gains and losses between trade date and settlement date on securities transactions, gains and losses on disposition of foreign currencies and the difference between the amount of income and foreign withholding taxes recorded on the books of the Series and the amounts actually received or paid.
Federal Taxes
The Series’ policy is to comply with the provisions of the Internal Revenue Code applicable to regulated investment companies. The Series is not subject to federal income tax or excise tax to the extent that the Series distributes to shareholders each year its taxable income, including any net realized gains on investments, in accordance with requirements of the Internal Revenue Code. Accordingly, no provision for federal income tax or excise tax has been made in the financial statements.
Management evaluates its tax positions to determine if the tax positions taken meet the minimum recognition threshold in connection with accounting for uncertainties in income tax positions taken or expected to be taken for the purposes of measuring and recognizing tax liabilities in the financial statements. Recognition of tax benefits of an uncertain tax position is required only when the position is “more likely than not” to be sustained assuming examination by taxing authorities. At April 30, 2010, the Series has recorded no liability for net unrecognized tax benefits relating to uncertain income tax positions taken or expected to be taken in future tax returns.
The Series files income tax returns in the U.S. federal jurisdiction, various states and foreign jurisdictions, as required. No income tax returns are currently under investigation. The statute of limitations on the Series’ tax returns remains open for the years ended October 31, 2006 through October 31, 2009. The Fund is not aware of any tax positions for which it is reasonably possible that the total amounts of unrecognized tax benefits will significantly change in the next twelve months.
Additionally, based on the Fund’s understanding of the tax rules and rates related to income, gains and transactions for foreign jurisdictions in which it invests, the Series will provide for foreign taxes, and where appropriate, deferred foreign tax.
Distributions of Income and Gains
Distributions to shareholders of net investment income and net realized gains are made annually. An additional distribution may be necessary to avoid taxation of the Series. Distributions are recorded on the ex-dividend date.
Indemnifications
The Fund’s organizational documents provide former and current directors and officers with a limited indemnification against liabilities arising in connection with the performance of their duties to the Fund. In the normal course of business, the Fund may also enter into contracts that provide general indemnifications. The Fund’s maximum exposure under these arrangements is unknown as this would be dependent on future claims that may be made against the Fund. The risk of material loss from such claims is considered remote.
Other
The preparation of financial statements in conformity with accounting principles generally accepted in the United States of America requires management to make estimates and assumptions that affect the reported amounts of assets and liabilities and the disclosure of contingent assets and liabilities at the date of the financial statements and the reported amounts of income and expenses during the reporting period. Actual results could differ from those estimates.
14
Notes to Financial Statements (unaudited)
| 3. | TRANSACTIONS WITH AFFILIATES |
The Fund has an Investment Advisory Agreement (the “Agreement”) with the Advisor, for which the Series pays a fee, computed daily and payable monthly, at an annual rate of 0.70% of the Series’ average daily net assets.
Under the Agreement, personnel of the Advisor provide the Series with advice and assistance in the choice of investments and the execution of securities transactions, and otherwise maintain the Series’ organization. The Advisor also provides the Fund with necessary office space and fund administration and support services. The salaries of all officers of the Fund (except a percentage of the Fund’s Chief Compliance Officer’s salary, which is paid by the Fund), and of all Directors who are “affiliated persons” of the Fund, or of the Advisor, and all personnel of the Fund, or of the Advisor, performing services relating to research, statistical and investment activities, are paid by the Advisor. Each “non-affiliated” Director receives an annual stipend, which is allocated among all the active series of the Fund. In addition, these Directors also receive a fee per Board meeting attended for each active series of the Fund plus a fee for each committee meeting attended.
The Advisor has contractually agreed, until at least February 28, 2011, to waive its fee and, if necessary, pay other operating expenses of the Series in order to maintain total direct annual fund operating expenses for the Series at no more than 0.75% of average daily net assets each year. Accordingly, the Advisor waived fees of $3,831 for the six months ended April 30, 2010, which is included as a reduction of expenses on the Statement of Operations. The Advisor voluntarily waived additional fees of $758 for the six months ended April 30, 2010, which is also included as a reduction of expenses on the Statement of Operations. The Advisor is not eligible to recoup any expenses that have been waived or reimbursed in prior years.
Manning & Napier Investor Services, Inc., a registered broker-dealer affiliate of the Advisor, acts as distributor for the Fund’s shares. The services of Manning & Napier Investor Services, Inc. are provided at no additional cost to the Series.
For fund accounting and transfer agent services through November 7, 2009, the Fund paid the Advisor an annual fee of 0.055% of the Fund’s average daily net assets up to $4.5 billion, 0.03% of the Fund’s average daily net assets between $4.5 billion and $7.5 billion, and 0.02% of the Fund’s average daily net assets over $7.5 billion. Additionally, certain transaction and account-based fees and out-of-pocket expenses, including charges for reporting relating to the Fund’s compliance program, were charged. Expenses not directly attributable to a Series are allocated based on each Series’ relative net assets or number of accounts, depending on the expense. Prior to October 12, 2009 (for sub-accountant) and November 9, 2009 (for sub-transfer agent), the Advisor had an agreement with Citi Fund Services Ohio, Inc. (“Citi”) under which Citi served as sub-accountant and sub-transfer agent.
The Advisor has entered into agreements dated October 12, 2009 and November 9, 2009 with PNC Global Investment Servicing (U.S.) Inc. (“PNCGIS”) under which PNCGIS serves as sub-accountant services agent and sub-transfer agent, respectively. Effective November 7, 2009 under the amended master services agreement, the Fund pays the Advisor an annual fee of 0.0175% on the first $3 billion of average daily net assets (excluding Target Series); 0.015% on the next $3 billion of average daily net assets (excluding Target Series); and 0.01% of the average daily net assets in excess of $6 billion (excluding Target Series); plus a base fee of $25,500 per Series. Additionally, certain transaction, account-based, and cusip-based fees and out-of-pocket expenses, including charges for reporting relating to the Fund’s compliance program, are charged.
On February 2, 2010, The PNC Financial Services Group, Inc. (“PNC”), which serves as the Series’ sub-accountant services agent and sub-transfer agent, entered into a Stock Purchase Agreement (the “Stock Purchase Agreement”) with The Bank of New York Mellon Corporation (“BNY Mellon”), the Series’ custodian. Upon the terms and subject to the conditions set forth in the Stock Purchase Agreement, which has been approved by the board of directors of each company, PNC will sell to BNY Mellon (the “Stock Sale”) 100% of the issued and outstanding shares of PNC Global Investment Servicing Inc., an indirect, wholly-owned subsidiary of PNC. The Stock Sale is expected to close
15
Notes to Financial Statements (unaudited)
| 3. | TRANSACTIONS WITH AFFILIATES (continued) |
in the third quarter of 2010. Management has concluded that this will not have a material impact on the Series’ financial statements.
| 4. | PURCHASES AND SALES OF SECURITIES |
For the six months ended April 30, 2010, purchases and sales of securities, other than U.S. Government securities and short-term securities, were $290,175,949 and $87,548,681, respectively. There were no purchases or sales of U.S. Government securities.
| 5. | CAPITAL STOCK TRANSACTIONS |
Transactions in Class A shares of Overseas Series were:
| | | | | | | | | | | | | | |
| | | For the Six Months Ended 4/30/10 | | | For the Year Ended 10/31/09 | |
| | | Shares | | | Amount | | | Shares | | | Amount | |
Sold | | 10,995,606 | | | $ | 251,935,453 | | | 12,172,723 | | | $ | 214,883,533 | |
Reinvested | | 149,986 | | | | 3,353,687 | | | 474,684 | | | | 7,609,183 | |
Repurchased | | (2,150,903 | ) | | | (49,365,018 | ) | | (1,775,090 | ) | | | (31,030,942 | ) |
| | | | | | | | | | | | | | |
Total | | 8,994,689 | | | $ | 205,924,122 | | | 10,872,317 | | | $ | 191,461,774 | |
| | | | | | | | | | | | | | |
At April 30, 2010, the retirement plan of the Advisor and its affiliates owned 135,654 shares of the Series (0.5% of shares outstanding) valued at $3,187,860.
The Series may trade in instruments including written and purchased options, forward foreign currency exchange contracts and futures contracts and other derivatives in the normal course of investing activities to assist in managing exposure to various market risks. The Series may be subject to various elements of risk and may involve, to a varying degree, elements of risk in excess of the amounts recognized for financial statement purposes. These risks include: the risk that changes in the value of a derivative may not correlate perfectly with the underlying asset, rate or index, counterparty credit risk related to over the counter derivatives counterparties failure to perform under contract terms, liquidity risk related to the lack of a liquid market for these contracts allowing the fund to close out its position(s) and documentation risk relating to disagreement over contract terms. No such investments were held by the Series on April 30, 2010.
Investing in securities of foreign companies and foreign governments involves special risks and considerations not typically associated with investing in securities of domestic companies and the U.S. Government. These risks include revaluation of currencies and future adverse political and economic developments. Moreover, securities of foreign companies and foreign governments and their markets may be less liquid and their prices more volatile than those of comparable domestic companies and the U.S. Government.
| 8. | FEDERAL INCOME TAX INFORMATION |
The amount and characterization of certain income and capital gains to be distributed are determined in accordance with federal income tax regulations, which may differ from accounting principles generally accepted in the United States of America. These differences are primarily due to differing book and tax treatments in the timing of the recognition of net investment income or gains and losses, including differences in the cost basis of securities contributed
16
Notes to Financial Statements (unaudited)
| 8. | FEDERAL INCOME TAX INFORMATION (continued) |
in-kind, losses deferred due to wash sales and foreign currency gains and losses. The Series may periodically make reclassifications among its capital accounts to reflect income and gains available for distribution (or available capital loss carryovers) under income tax regulations, without impacting the Series’ net asset value. Any such reclassifications are not reflected in the financial highlights.
The final determination of the tax character of current year distributions will be made at the conclusion of the fiscal year. The tax character of distributions paid for the year ended October 31, 2009 were as follows:
| | | | | |
Ordinary income | | $ | 5,226,572 | | |
Long-term capital gains | | | 4,075,394 | | |
At October 31, 2009, the Series had a capital loss carryover of $5,298,243, available to the extent allowed by tax law to offset future net capital gain, if any, which will expire on October 31, 2017.
At April 30, 2010, the identified cost of investments for federal income tax purposes, the resulting gross unrealized appreciation and depreciation, and the net unrealized appreciation were as follows:
| | | | | | |
Cost for federal income tax purposes | | $ | 672,124,646 | | | |
Unrealized appreciation | | $ | 65,731,457 | | | |
Unrealized depreciation | | | (37,494,255 | ) | | |
| | | | | | |
Net unrealized appreciation | | $ | 28,237,202 | | | |
| | | | | | |
There were no subsequent events that require recognition or disclosure. In preparing these financial statements, management of the Fund has evaluated events and transactions for potential recognition or disclosure through the date the financial statements were issued.
17
Renewal of Investment Advisory Agreement (unaudited)
At the Manning & Napier Fund, Inc. (the “Fund”) Board of Directors’ (the “Board”) meeting, held on December 7, 2009, the Investment Advisory Agreement (the “Agreement”) between the Fund and Manning & Napier Advisors, Inc. (the “Advisor”) was reviewed by the Board for renewal. In connection with the decision whether to renew the Agreement, a variety of material was prepared for and reviewed by the Board.
Representatives of the Advisor attended the meeting and presented additional oral and written information to the Board to assist the Board in its considerations. The discussion immediately below outlines the materials and information presented to the Board in connection with the Board’s 2009 Annual Review of the Agreement and the conclusions made by the Directors when determining to continue the Agreement.
| | • | | The Board considered the services provided by the Advisor under the Agreement including, among others: deciding what securities to purchase and sell for each Series; arranging for the purchase and sale of such securities by placing orders with broker-dealers; administering the affairs of the Fund (including the books and records of the Fund not maintained by third party service providers such as the custodian or sub-transfer agent); arranging for the insurance coverage for the Fund; and supervising the preparation of tax returns, SEC filings (including registration statements) and reports to shareholders for the Fund. The Board also considered the nature and quality of such services provided under the Agreement in light of the Advisor’s services provided to the Fund for 23 years. The Board discussed the quality of these services with representatives from the Advisor and concluded that the Advisor was performing its services to the Fund required under the Agreement in a reasonable manner. |
| | • | | The Board considered the investment performance of the various Series of the Fund. The investment performance for each Series was reviewed on a cumulative basis since inception and on a one year basis. In addition, annualized performance for the following time periods was considered: inception, three year, five year, ten year, and current market cycle. A market cycle includes periods of both rising and falling markets. Returns for established benchmark indices for each Series were provided for each time period. The Board noted that the various Series were competitive against their respective benchmarks and/or peer groups over various time periods, but in particular over the full market cycle periods relevant for the Series. In addition, the Board considered at the meeting (and considers on a quarterly basis) a peer group performance analysis consisting of Morningstar universes of mutual funds with similar investment objectives. The Board discussed the performance with representatives from the Advisor and concluded that the investment performance of each of the Fund’s Series was reasonable based on the Fund’s actual performance and comparative performance, especially performance over the current market cycle. |
| | • | | The Board considered the costs of the Advisor’s services and the profits of the Advisor as they relate to the Advisor’s services to the Fund under the Agreement. In reviewing the Advisor’s costs and profits, the Board discussed the Advisor’s revenues generated from the Fund (on both an actual and adjusted basis) and its expenses associated with providing the services under the Agreement. In addition, the Board reviewed the Advisor’s expenses associated with Fund activities outside of the Agreement (such as expense reimbursements pursuant to expense caps and payments made by the Advisor to third party platforms on which shares of the Fund are available for purchase). It was noted by representatives of the Advisor that 13 of the 26 active Series of the Fund are currently experiencing expenses above the capped expense ratios. After discussing the above costs and profits, the Board concluded that the Advisor’s profitability relating to its services provided under the Agreement was reasonable. |
| | • | | The Board considered the fees and expenses of the various Series of the Fund. The Advisor presented the advisory fees and total expenses for each Series, including the advisory fee adjusted for any expense waivers or reimbursements (either contractual or voluntary) paid by the Advisor. The advisory fees and expense ratios of each Series were compared to an average (on both a mean and median basis) of similar funds as disclosed on the Morningstar database. Representatives of the Advisor discussed with the Board the levels of its advisory |
Renewal of Investment Advisory Agreement (unaudited)
| | fee for each Series of the Fund and as compared to the median and mean advisory fees for similar funds as listed on Morningstar. Expense ratios for every Series, except the Global Fixed Income Series and the Target Series Class R and Class C, are currently below the median and mean for similar funds as listed on Morningstar. Based on their review of the information provided, the Board concluded that the fees and expenses of each Series of the Fund were reasonable on a comparative basis. |
| | • | | The Board also considered the other benefits the Advisor derives from its relationship with the Fund. Such other benefits include certain research products provided by soft dollars. Given the level of soft dollar transactions involving the Fund, the Board concluded that these additional benefits to the Advisor were reasonable. |
| | • | | In addition to the factors described above, the Board considered the Advisor’s personnel, investment strategies, policies and procedures relating to compliance with personal securities transactions, and reputation, expertise and resources in domestic and foreign financial markets. The Board concluded that these factors support the conclusion that the Advisor performs its services in a reasonable manner. |
| | • | | The Board did not consider economies of scale at this time because of the multiple uses of the Fund (for the Advisor’s discretionary investment account clients in addition to direct investors), the current profitability of the Advisor’s services to the Fund under the Agreement, and the overall size of the Fund complex. |
Based on the Board’s deliberations and their evaluation of the information described above, the Board, including a majority of Directors that are not “interested persons” as defined in the Investment Company Act of 1940, concluded that the compensation under the Agreement was fair and reasonable in light of the services and expenses and such other matters as the Directors considered to be relevant in the exercise of their reasonable judgment. Accordingly, the Board approved the renewal of the Agreement. In the course of their deliberations, the Directors did not identify any particular information that was all important or controlling.
19
This Page Intentionally Left Blank
This Page Intentionally Left Blank
Literature Requests (unaudited)
Proxy Voting Policies and Procedures
A description of the policies and procedures that the Fund uses to determine how to vote proxies relating to portfolio securities is available, without charge, upon request:
| | | | |
By phone | | 1-800-466-3863 | | |
On the Securities and Exchange
Commission’s (SEC) web site | | http://www.sec.gov | | |
Proxy Voting Record
Information regarding how the Fund voted proxies relating to portfolio securities during the most recent 12-month period ended June 30th is available, without charge, upon request:
| | | | |
By phone | | 1-800-466-3863 | | |
On the SEC’s web site | | http://www.sec.gov | | |
Quarterly Portfolio Holdings
The Series’ complete schedule of portfolio holdings for the 1st and 3rd quarters of each fiscal year are provided on Form N-Q, and are available, without charge, upon request:
| | | | |
By phone | | 1-800-466-3863 | | |
On the SEC’s web site | | http://www.sec.gov | | |
The Series’ Form N-Q may be reviewed and copied at the SEC’s Public Reference Room in Washington, D.C. Information on the operation of the Public Reference Room may be obtained by calling 1-800-SEC-0330.
Prospectus and Statement of Additional Information (SAI)
The prospectus and SAI provide additional information about each Series, including charges, expenses and risks. These documents are available, without charge, upon request:
| | | | |
By phone | | 1-800-466-3863 | | |
On the SEC’s web site | | http://www.sec.gov | | |
On the Advisor’s web site | | http://manningnapieradvisors.com | | |
Additional information available at www.manningnapieradvisors.com
| 1. | Fund Holdings - Month-End |
| 2. | Fund Holdings - Quarter-End |
| 3. | Shareholder Report - Annual |
| 4. | Shareholder Report - Semi-Annual |
MNOVS-04/10-SAR

Shareholder Expense Example - Pro-Blend® Conservative Term Series (unaudited)
As a shareholder of the Series, you may incur two types of costs: (1) transaction costs, including potential wire charges on redemptions and (2) ongoing costs, including management fees and other Series expenses. This example is intended to help you understand your ongoing costs (in dollars) of investing in the Series and to compare these costs with the ongoing costs of investing in other mutual funds.
The example is based on an investment of $1,000 invested at the beginning of the period and held for the entire period (November 1, 2009 to April 30, 2010, except for Class C Actual, which is from January 4, 2010* to April 30, 2010).
Actual Expenses
The Actual lines of the table below provide information about actual account values and actual expenses. You may use the information in these lines, together with the amount you invested, to estimate the expenses that you paid over the period. Simply divide your account value by $1,000 (for example, an $8,600 account value divided by $1,000 = 8.6), then multiply the result by the number in the Actual line for the Class in which you have invested under the heading entitled “Expenses Paid During Period” to estimate the expenses you paid on your account during this period.
Hypothetical Example for Comparison Purposes
The Hypothetical lines of the table below provide information about hypothetical account values and hypothetical expenses based on the Class’ actual expense ratio and an assumed rate of return of 5% per year before expenses, which is not the Class’ actual return. The hypothetical account values and expenses may not be used to estimate the actual ending account balance or expenses you paid during the period. You may use this information to compare the ongoing costs of investing in the Series and other funds. To do so, compare this 5% hypothetical example for the Class in which you have invested with the 5% hypothetical examples that appear in the shareholder reports of the other funds.
Please note that the expenses shown in the table are meant to highlight your ongoing costs only and do not reflect any transaction costs. Therefore, the Hypothetical lines of the table are useful in comparing ongoing costs only, and will not help you determine the relative total costs of owning different funds. In addition, if these transaction costs were included, your costs would have been higher.
| | | | | | | | |
| | | Beginning
Account Value
11/1/09* | | Ending
Account Value
4/30/10 | | Expenses Paid
During Period
11/1/09-4/30/10** | | Annualized
Expense ratio |
Class S | | | | | | | | |
Actual | | $1,000.00 | | $1,055.60 | | $4.43 | | 0.87% |
Hypothetical
(5% return before expenses) | | $1,000.00 | | $1,020.48 | | $4.36 | | 0.87% |
Class I | | | | | | | | |
Actual | | $1,000.00 | | $1,056.90 | | $3.42 | | 0.67% |
Hypothetical
(5% return before expenses) | | $1,000.00 | | $1,021.47 | | $3.36 | | 0.67% |
Class C | | | | | | | | |
Actual | | $1,000.00 | | $1,030.00 | | $5.39 | | 1.67% |
Hypothetical
(5% return before expenses) | | $1,000.00 | | $1,010.58 | | $5.34 | | 1.67% |
*Class C inception date was January 4, 2010.
**Expenses are equal to the Class’ annualized expense ratio (for the six-month period), multiplied by the average account value over the period, multiplied by 181/365 to reflect the one-half year period (except for the Series’ Class C Actual return information, which reflects the 116 day period ended April 30, 2010 due to its inception date of January 4, 2010). The Class’ total return would have been lower had certain expenses not been waived during the period.
Portfolio Composition - Pro-Blend® Conservative Term Series (unaudited)
As of April 30, 2010
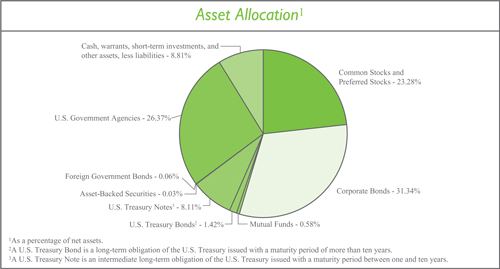
| | |
Sector Allocation4 |
Financials | | 16.38% |
Consumer Discretionary | | 7.43% |
Information Technology | | 7.06% |
Industrials | | 6.90% |
Health Care | | 5.36% |
Energy | | 4.62% |
Materials | | 2.86% |
Consumer Staples | | 2.76% |
Utilities | | 1.48% |
Telecommunication Services | | 0.50% |
| |
4Including common stocks, preferred stocks, warrants, and corporate bonds, as a percentage of total investments. |
| | |
Top Five Stock Holdings5 |
The Walt Disney Co. | | 1.05% |
Google, Inc. - Class A | | 0.98% |
Microsoft Corp. | | 0.64% |
Southwest Airlines Co. | | 0.63% |
Cisco Systems, Inc. | | 0.60% |
| | | |
| | | |
5As a percentage of total investments. | | |
Top Five Bond Holdings6 |
Freddie Mac, 3.75%, 3/27/2019 | | 3.24% |
Fannie Mae, 1.375%, 4/28/2011 | | 3.15% |
U.S. Treasury Note, 4.00%, 2/15/2015 | | 2.54% |
Freddie Mac, 2.875%, 2/9/2015 | | 2.06% |
Freddie Mac, 5.125%, 10/18/2016 | | 1.95% |
| |
| |
6As a percentage of total investments. |
Investment Portfolio - April 30, 2010 (unaudited)
| | | | | | | |
| Pro-Blend® Conservative Term Series | | Shares | | Value
(Note 2) | | |
| | | |
COMMON STOCKS - 23.08% | | | | | | | |
| | | |
Consumer Discretionary - 3.25% | | | | | | | |
Auto Components - 0.01% | | | | | | | |
Hankook Tire Co. Ltd. (South Korea) | | 3,850 | | $ | 86,667 | | |
| | | | | | | |
Automobiles - 0.02% | | | | | | | |
Bayerische Motoren Werke AG (BMW) (Germany) | | 1,790 | | | 88,492 | | |
Suzuki Motor Corp. (Japan) | | 500 | | | 10,587 | | |
| | | | | | | |
| | | | | 99,079 | | |
| | | | | | | |
Distributors - 0.01% | | | | | | | |
Inchcape plc (United Kingdom)* | | 90,000 | | | 47,371 | | |
| | | | | | | |
Hotels, Restaurants & Leisure - 0.77% | | | | | | | |
Carnival Corp | | 63,183 | | | 2,634,731 | | |
Choice Hotels International, Inc. | | 5,440 | | | 197,526 | | |
Club Mediterranee S.A. (France)* | | 305 | | | 5,131 | | |
Hyatt Hotels Corp. - Class A* | | 2,140 | | | 88,104 | | |
International Game Technology | | 77,750 | | | 1,638,970 | | |
Wendy’s - Arby’s Group, Inc. - Class A | | 8,000 | | | 42,480 | | |
| | | | | | | |
| | | | | 4,606,942 | | |
| | | | | | | |
Household Durables - 0.05% | | | | | | | |
Corporacion Geo S.A.B. de C.V. - Class B (Mexico)* | | 15,600 | | | 49,402 | | |
LG Electronics, Inc. (South Korea) | | 700 | | | 77,051 | | |
NVR, Inc.* | | 100 | | | 71,805 | | |
Rodobens Negocios Imobiliarios S.A. (Brazil) | | 14,800 | | | 106,344 | | |
| | | | | | | |
| | | | | 304,602 | | |
| | | | | | | |
Leisure Equipment & Products - 0.00%** | | | | | | | |
Sankyo Co. Ltd. (Japan) | | 300 | | | 13,908 | | |
| | | | | | | |
Media - 1.51% | | | | | | | |
Grupo Televisa S.A. - ADR (Mexico) | | 4,890 | | | 101,614 | | |
Mediacom Communications Corp. - Class A* | | 5,510 | | | 36,476 | | |
Reed Elsevier plc (United Kingdom) | | 6,050 | | | 47,627 | | |
Reed Elsevier plc - ADR (United Kingdom) | | 1,308 | | | 41,333 | | |
Societe Television Francaise 1 (France) | | 11,690 | | | 217,983 | | |
Time Warner, Inc. | | 72,800 | | | 2,408,224 | | |
The Walt Disney Co. | | 168,940 | | | 6,223,750 | | |
Wolters Kluwer N.V. (Netherlands) | | 2,040 | | | 41,883 | | |
| | | | | | | |
| | | | | 9,118,890 | | |
| | | | | | | |
Multiline Retail - 0.03% | | | | | | | |
Marks & Spencer Group plc (United Kingdom) | | 13,000 | | | 72,900 | | |
Nordstrom, Inc. | | 1,020 | | | 42,156 | | |
PPR (France) | | 595 | | | 80,370 | | |
| | | | | | | |
| | | | | 195,426 | | |
| | | | | | | |
| | | | |
| 3 | | The accompanying notes are an integral part of the financial statements. | | |
Investment Portfolio - April 30, 2010 (unaudited)
| | | | | | | |
| Pro-Blend® Conservative Term Series | | Shares | | Value (Note 2) | | |
| | | |
COMMON STOCKS (continued) | | | | | | | |
| | | |
Consumer Discretionary (continued) | | | | | | | |
Specialty Retail - 0.83% | | | | | | | |
Dick’s Sporting Goods, Inc.* | | 5,930 | | $ | 172,622 | | |
The Finish Line, Inc. - Class A | | 3,780 | | | 60,896 | | |
The Home Depot, Inc. | | 33,976 | | | 1,197,654 | | |
KOMERI Co. Ltd. (Japan) | | 1,500 | | | 38,117 | | |
Lowe’s Companies, Inc. | | 55,400 | | | 1,502,448 | | |
Lumber Liquidators Holdings, Inc.* | | 2,480 | | | 75,541 | | |
The Sherwin-Williams Co. | | 24,800 | | | 1,936,136 | | |
| | | | | | | |
| | | | | 4,983,414 | | |
| | | | | | | |
Textiles, Apparel & Luxury Goods - 0.02% | | | | | | | |
Adidas AG (Germany) | | 890 | | | 52,329 | | |
LVMH S.A. (Louis Vuitton Moet Hennessy) (France) | | 380 | | | 43,937 | | |
| | | | | | | |
| | | | | 96,266 | | |
| | | | | | | |
Total Consumer Discretionary | | | | | 19,552,565 | | |
| | | | | | | |
Consumer Staples - 2.29% | | | | | | | |
Beverages - 0.02% | | | | | | | |
Diageo plc (United Kingdom) | | 2,560 | | | 43,674 | | |
Heineken N.V. (Netherlands) | | 1,950 | | | 91,339 | | |
| | | | | | | |
| | | | | 135,013 | | |
| | | | | | | |
Food & Staples Retailing - 0.71% | | | | | | | |
BJ’s Wholesale Club, Inc.* | | 2,560 | | | 97,997 | | |
Carrefour S.A. (France) | | 7,080 | | | 347,279 | | |
Casino Guichard-Perrachon S.A. (France) | | 730 | | | 64,830 | | |
The Kroger Co. | | 74,840 | | | 1,663,693 | | |
Safeway, Inc. | | 77,910 | | | 1,838,676 | | |
SUPERVALU, Inc. | | 2,250 | | | 33,525 | | |
Tesco plc (United Kingdom) | | 34,695 | | | 231,001 | | |
| | | | | | | |
| | | | | 4,277,001 | | |
| | | | | | | |
Food Products - 1.53% | | | | | | | |
Danone S.A. (France) | | 2,700 | | | 159,542 | | |
Dean Foods Co.* | | 91,770 | | | 1,440,789 | | |
Flowers Foods, Inc. | | 3,030 | | | 79,871 | | |
General Mills, Inc. | | 14,400 | | | 1,024,992 | | |
Kellogg Co. | | 18,900 | | | 1,038,366 | | |
Nestle S.A. (Switzerland) | | 64,710 | | | 3,177,925 | | |
Suedzucker AG (Germany) | | 1,940 | | | 39,352 | | |
Unilever plc - ADR (United Kingdom) | | 75,410 | | | 2,269,841 | | |
| | | | | | | |
| | | | | 9,230,678 | | |
| | | | | | | |
Household Products - 0.02% | | | | | | | |
Reckitt Benckiser Group plc (United Kingdom) | | 1,565 | | | 81,486 | | |
| | | | | | | |
| | | | |
| | The accompanying notes are an integral part of the financial statements. | | 4 |
Investment Portfolio - April 30, 2010 (unaudited)
| | | | | | | |
| Pro-Blend® Conservative Term Series | | Shares | | Value (Note 2) | | |
| | | |
COMMON STOCKS (continued) | | | | | | | |
| | | |
Consumer Staples (continued) | | | | | | | |
Personal Products - 0.01% | | | | | | | |
Alberto-Culver Co. | | 2,010 | | $ | 57,888 | | |
| | | | | | | |
Total Consumer Staples | | | | | 13,782,066 | | |
| | | | | | | |
Energy - 1.97% | | | | | | | |
Energy Equipment & Services - 1.47% | | | | | | | |
Baker Hughes, Inc. | | 55,875 | | | 2,780,340 | | |
Calfrac Well Services Ltd. (Canada) | | 6,480 | | | 137,855 | | |
Compagnie Generale de Geophysique - Veritas (CGG - Veritas) (France)* | | 5,135 | | | 155,097 | | |
Dril-Quip, Inc.* | | 1,340 | | | 77,626 | | |
Schlumberger Ltd. | | 35,440 | | | 2,531,125 | | |
Trican Well Service Ltd. (Canada) | | 11,360 | | | 144,264 | | |
Weatherford International Ltd. (Switzerland)* | | 166,424 | | | 3,013,939 | | |
| | | | | | | |
| | | | | 8,840,246 | | |
| | | | | | | |
Oil, Gas & Consumable Fuels - 0.50% | | | | | | | |
BP plc (United Kingdom) | | 4,040 | | | 35,574 | | |
Cameco Corp. (Canada) | | 1,010 | | | 24,856 | | |
Forest Oil Corp.* | | 1,205 | | | 35,307 | | |
Hess Corp. | | 38,420 | | | 2,441,591 | | |
Mariner Energy, Inc.* | | 1,801 | | | 43,008 | | |
Royal Dutch Shell plc - Class B (Netherlands) | | 1,346 | | | 40,674 | | |
Royal Dutch Shell plc - Class B - ADR (Netherlands) | | 1,900 | | | 115,292 | | |
Talisman Energy, Inc. (Canada) | | 6,400 | | | 108,935 | | |
Total S.A. (France) | | 1,130 | | | 61,641 | | |
Uranium One, Inc. (Canada)* | | 44,600 | | | 112,839 | | |
| | | | | | | |
| | | | | 3,019,717 | | |
| | | | | | | |
Total Energy | | | | | 11,859,963 | | |
| | | | | | | |
Financials - 2.43% | | | | | | | |
Capital Markets - 0.52% | | | | | | | |
The Bank of New York Mellon Corp.1 | | 78,600 | | | 2,446,818 | | |
Credit Suisse Group AG - ADR (Switzerland) | | 830 | | | 37,931 | | |
Federated Investors, Inc. - Class B | | 8,810 | | | 212,497 | | |
GAM Holding Ltd. (Switzerland)* | | 6,980 | | | 87,368 | | |
The Goldman Sachs Group, Inc. | | 680 | | | 98,736 | | |
Legg Mason, Inc. | | 4,320 | | | 136,901 | | |
Northern Trust Corp. | | 1,690 | | | 92,916 | | |
State Street Corp. | | 490 | | | 21,315 | | |
| | | | | | | |
| | | | | 3,134,482 | | |
| | | | | | | |
Commercial Banks - 0.15% | | | | | | | |
Barclays plc - ADR (United Kingdom) | | 1,990 | | | 40,636 | | |
BNP Paribas (France) | | 560 | | | 38,869 | | |
| | | | |
| 5 | | The accompanying notes are an integral part of the financial statements. | | |
Investment Portfolio - April 30, 2010 (unaudited)
| | | | | | | |
| Pro-Blend® Conservative Term Series | | Shares | | Value (Note 2) | | |
| | | |
COMMON STOCKS (continued) | | | | | | | |
| | | |
Financials (continued) | | | | | | | |
Commercial Banks (continued) | | | | | | | |
Credit Agricole S.A. (France) | | 1,370 | | $ | 19,737 | | |
First Commonwealth Financial Corp. | | 34,530 | | | 226,171 | | |
The Hachijuni Bank Ltd. (Japan) | | 4,800 | | | 27,031 | | |
HSBC Holdings plc (United Kingdom) | | 5,500 | | | 56,214 | | |
HSBC Holdings plc - ADR (United Kingdom) | | 2,457 | | | 125,037 | | |
ICICI Bank Ltd. - ADR (India) | | 1,570 | | | 66,756 | | |
Societe Generale - ADR (France)2 | | 3,250 | | | 34,353 | | |
The Sumitomo Trust & Banking Co. Ltd. (Japan) | | 4,800 | | | 29,127 | | |
U.S. Bancorp | | 3,290 | | | 88,073 | | |
Wilmington Trust Corp. | | 7,350 | | | 127,376 | | |
| | | | | | | |
| | | | | 879,380 | | |
| | | | | | | |
Consumer Finance - 0.51% | | | | | | | |
American Express Co. | | 65,310 | | | 3,012,097 | | |
Discover Financial Services | | 2,070 | | | 32,002 | | |
| | | | | | | |
| | | | | 3,044,099 | | |
| | | | | | | |
Diversified Financial Services - 0.13% | | | | | | | |
Bank of America Corp. | | 2,980 | | | 53,133 | | |
Deutsche Boerse AG (Germany) | | 2,700 | | | 210,447 | | |
Financiere Marc de Lacharriere S.A. (Fimalac) (France) | | 2,125 | | | 105,548 | | |
ING Groep N.V. (Netherlands)* | | 185 | | | 1,660 | | |
JPMorgan Chase & Co. | | 5,190 | | | 220,990 | | |
Moody’s Corp. | | 9,040 | | | 223,469 | | |
| | | | | | | |
| | | | | 815,247 | | |
| | | | | | | |
Insurance - 0.26% | | | | | | | |
Allianz SE (Germany) | | 2,850 | | | 328,312 | | |
The Allstate Corp. | | 4,370 | | | 142,768 | | |
Amil Participacoes S.A. (Brazil) | | 12,540 | | | 102,802 | | |
AXA S.A. (France) | | 1,230 | | | 24,729 | | |
Brown & Brown, Inc. | | 7,020 | | | 141,383 | | |
Muenchener Rueckversicherungs AG (MunichRe) (Germany) | | 875 | | | 123,725 | | |
Principal Financial Group, Inc. | | 850 | | | 24,837 | | |
The Progressive Corp. | | 12,360 | | | 248,312 | | |
Willis Group Holdings plc (United Kingdom) | | 7,325 | | | 252,346 | | |
Zurich Financial Services AG (Switzerland) | | 910 | | | 203,115 | | |
| | | | | | | |
| | | | | 1,592,329 | | |
| | | | | | | |
Real Estate Investment Trusts (REITS) - 0.76% | | | | | | | |
Acadia Realty Trust | | 2,660 | | | 50,753 | | |
Alexandria Real Estate Equities, Inc. | | 860 | | | 60,897 | | |
Alstria Office REIT AG (Germany) | | 6,760 | | | 76,505 | | |
American Campus Communities, Inc. | | 6,370 | | | 179,443 | | |
| | | | |
| | The accompanying notes are an integral part of the financial statements. | | 6 |
Investment Portfolio - April 30, 2010 (unaudited)
| | | | | | | |
| Pro-Blend® Conservative Term Series | | Shares | | Value (Note 2) | | |
| | | |
COMMON STOCKS (continued) | | | | | | | |
| | | |
Financials (continued) | | | | | | | |
Real Estate Investment Trusts (REITS) (continued) | | | | | | | |
Apartment Investment & Management Co. - Class A | | 11,860 | | $ | 265,783 | | |
AvalonBay Communities, Inc. | | 1,340 | | | 139,414 | | |
BioMed Realty Trust, Inc. | | 13,810 | | | 255,623 | | |
Boston Properties, Inc. | | 1,950 | | | 153,777 | | |
Camden Property Trust | | 2,660 | | | 128,824 | | |
Corporate Office Properties Trust | | 9,830 | | | 397,623 | | |
DiamondRock Hospitality Co.* | | 5,110 | | | 56,159 | | |
Digital Realty Trust, Inc. | | 2,320 | | | 136,184 | | |
Douglas Emmett, Inc. | | 7,380 | | | 123,541 | | |
DuPont Fabros Technology, Inc. | | 6,220 | | | 137,897 | | |
Equity Lifestyle Properties, Inc. | | 2,080 | | | 115,461 | | |
Equity One, Inc. | | 4,910 | | | 95,303 | | |
Equity Residential | | 2,110 | | | 95,520 | | |
HCP, Inc. | | 6,740 | | | 216,489 | | |
Health Care REIT, Inc. | | 3,060 | | | 137,486 | | |
Healthcare Realty Trust, Inc. | | 6,290 | | | 151,841 | | |
Home Properties, Inc. | | 3,880 | | | 192,797 | | |
Host Hotels & Resorts, Inc. | | 9,877 | | | 160,600 | | |
LaSalle Hotel Properties | | 3,270 | | | 86,164 | | |
Lexington Realty Trust | | 8,540 | | | 60,463 | | |
Mack-Cali Realty Corp. | | 2,170 | | | 74,561 | | |
Mid-America Apartment Communities, Inc. | | 1,090 | | | 60,244 | | |
National Health Investors, Inc. | | 1,390 | | | 56,462 | | |
National Retail Properties, Inc. | | 5,010 | | | 117,885 | | |
Omega Healthcare Investors, Inc. | | 3,590 | | | 71,872 | | |
Pebblebrook Hotel Trust* | | 4,150 | | | 81,755 | | |
Realty Income Corp. | | 3,820 | | | 125,258 | | |
Simon Property Group, Inc. | | 2,224 | | | 197,980 | | |
Tanger Factory Outlet Centers | | 2,670 | | | 111,072 | | |
UDR, Inc. | | 6,790 | | | 137,905 | | |
Westfield Group (Australia) | | 4,740 | | | 56,666 | | |
| | | | | | | |
| | | | | 4,566,207 | | |
| | | | | | | |
Real Estate Management & Development - 0.01% | | | | | | | |
CB Richard Ellis Group, Inc. - Class A* | | 3,590 | | | 62,179 | | |
| | | | | | | |
Thrifts & Mortgage Finance - 0.09% | | | | | | | |
Aareal Bank AG (Germany)* | | 2,455 | | | 53,999 | | |
First Niagara Financial Group, Inc. | | 17,660 | | | 245,474 | | |
NewAlliance Bancshares, Inc. | | 10,450 | | | 136,163 | | |
| | | | |
| 7 | | The accompanying notes are an integral part of the financial statements. | | |
Investment Portfolio - April 30, 2010 (unaudited)
| | | | | | | |
| Pro-Blend® Conservative Term Series | | Shares | | Value (Note 2) | | |
| | | |
COMMON STOCKS (continued) | | | | | | | |
| | | |
Financials (continued) | | | | | | | |
Thrifts & Mortgage Finance (continued) | | | | | | | |
People’s United Financial, Inc. | | 8,160 | | $ | 126,725 | | |
| | | | | | | |
| | | | | 562,361 | | |
| | | | | | | |
Total Financials | | | | | 14,656,284 | | |
| | | | | | | |
Health Care - 4.86% | | | | | | | |
Biotechnology - 0.54% | | | | | | | |
Amgen, Inc.* | | 4,380 | | | 251,237 | | |
Basilea Pharmaceutica AG (Switzerland)* | | 1,870 | | | 137,711 | | |
Celera Corp.* | | 58,620 | | | 437,891 | | |
CSL Ltd. (Australia) | | 2,140 | | | 64,137 | | |
Genzyme Corp.* | | 41,280 | | | 2,197,747 | | |
Grifols S.A. (Spain) | | 2,510 | | | 31,915 | | |
Sinovac Biotech Ltd. (China)* | | 27,610 | | | 159,862 | | |
| | | | | | | |
| | | | | 3,280,500 | | |
| | | | | | | |
Health Care Equipment & Supplies - 1.83% | | | | | | | |
Ansell, Ltd. (Australia) | | 33,900 | | | 402,447 | | |
Becton, Dickinson and Co. | | 45,750 | | | 3,493,928 | | |
Boston Scientific Corp.* | | 332,410 | | | 2,286,981 | | |
Cochlear Ltd. (Australia) | | 5,300 | | | 363,393 | | |
Covidien plc (Ireland) | | 10,150 | | | 487,098 | | |
DENTSPLY International, Inc. | | 9,380 | | | 343,683 | | |
DexCom, Inc.* | | 18,240 | | | 199,728 | | |
Gen-Probe, Inc.* | | 7,510 | | | 355,899 | | |
Hologic, Inc.* | | 8,350 | | | 149,214 | | |
Inverness Medical Innovations, Inc.* | | 14,560 | | | 579,197 | | |
Mindray Medical International Ltd. - ADR (China) | | 7,500 | | | 286,500 | | |
Nobel Biocare Holding AG (Switzerland) | | 9,350 | | | 207,305 | | |
OraSure Technologies, Inc.* | | 44,835 | | | 284,254 | | |
Shandong Weigao Group Medical Polymer Co. Ltd. - Class H (China) | | 53,000 | | | 248,817 | | |
Sirona Dental Systems, Inc.* | | 6,820 | | | 284,326 | | |
Straumann Holding AG (Switzerland) | | 1,445 | | | 358,514 | | |
Teleflex, Inc. | | 4,050 | | | 248,346 | | |
Zoll Medical Corp.* | | 14,960 | | | 457,028 | | |
| | | | | | | |
| | | | | 11,036,658 | | |
| | | | | | | |
Health Care Providers & Services - 0.70% | | | | | | | |
Aetna, Inc. | | 4,490 | | | 132,680 | | |
AMN Healthcare Services, Inc.* | | 20,850 | | | 190,569 | | |
Bio-Reference Laboratories, Inc.* | | 8,900 | | | 208,260 | | |
Bumrungrad Hospital Public Co. Ltd. - NVDR (Thailand) | | 12,000 | | | 11,127 | | |
CIGNA Corp. | | 3,830 | | | 122,790 | | |
Diagnosticos da America S.A. (Brazil)* | | 46,040 | | | 397,826 | | |
| | | | |
| | The accompanying notes are an integral part of the financial statements. | | 8 |
Investment Portfolio - April 30, 2010 (unaudited)
| | | | | | | |
| Pro-Blend® Conservative Term Series | | Shares | | Value (Note 2) | | |
| | | |
COMMON STOCKS (continued) | | | | | | | |
| | | |
Health Care (continued) | | | | | | | |
Health Care Providers & Services (continued) | | | | | | | |
OdontoPrev S.A. (Brazil) | | 3,360 | | $ | 110,276 | | |
Quest Diagnostics, Inc. | | 30,520 | | | 1,744,523 | | |
Sonic Healthcare Ltd. (Australia) | | 46,160 | | | 589,423 | | |
UnitedHealth Group, Inc. | | 4,250 | | | 128,818 | | |
VCA Antech, Inc.* | | 14,290 | | | 406,693 | | |
WellPoint, Inc.* | | 2,940 | | | 158,172 | | |
| | | | | | | |
| | | | | 4,201,157 | | |
| | | | | | | |
Health Care Technology - 0.37% | | | | | | | |
Allscripts - Misys Healthcare Solutions, Inc.* | | 7,330 | | | 147,846 | | |
Cerner Corp.* | | 17,280 | | | 1,467,245 | | |
Eclipsys Corp.* | | 29,530 | | | 610,680 | | |
| | | | | | | |
| | | | | 2,225,771 | | |
| | | | | | | |
Life Sciences Tools & Services - 0.72% | | | | | | | |
Caliper Life Sciences, Inc.* | | 78,867 | | | 316,257 | | |
ICON plc - ADR (Ireland)* | | 8,840 | | | 257,863 | | |
PerkinElmer, Inc. | | 48,233 | | | 1,208,236 | | |
Thermo Fisher Scientific, Inc.* | | 46,260 | | | 2,557,253 | | |
| | | | | | | |
| | | | | 4,339,609 | | |
| | | | | | | |
Pharmaceuticals - 0.70% | | | | | | | |
AstraZeneca plc (United Kingdom) | | 615 | | | 27,185 | | |
AstraZeneca plc - ADR (United Kingdom) | | 910 | | | 40,249 | | |
Bayer AG (Germany) | | 2,810 | | | 179,867 | | |
GlaxoSmithKline plc (United Kingdom) | | 3,725 | | | 69,021 | | |
Johnson & Johnson | | 55,190 | | | 3,548,717 | | |
Sanofi - Aventis S.A. (France) | | 531 | | | 36,524 | | |
Shire plc (Ireland) | | 4,235 | | | 93,503 | | |
UCB S.A. (Belgium) | | 5,690 | | | 220,839 | | |
| | | | | | | |
| | | | | 4,215,905 | | |
| | | | | | | |
Total Health Care | | | | | 29,299,600 | | |
| | | | | | | |
Industrials - 1.47% | | | | | | | |
Aerospace & Defense - 0.02% | | | | | | | |
Empresa Brasileira de Aeronautica S.A. (Embraer) - ADR (Brazil) | | 5,255 | | | 126,540 | | |
Hexcel Corp.* | | 910 | | | 14,742 | | |
| | | | | | | |
| | | | | 141,282 | | |
| | | | | | | |
Air Freight & Logistics - 0.48% | | | | | | | |
TNT N.V. (Netherlands) | | 6,636 | | | 203,924 | | |
United Parcel Service, Inc. - Class B | | 38,772 | | | 2,680,696 | | |
| | | | | | | |
| | | | | 2,884,620 | | |
| | | | | | | |
| | | | |
| 9 | | The accompanying notes are an integral part of the financial statements. | | |
Investment Portfolio - April 30, 2010 (unaudited)
| | | | | | | |
| Pro-Blend® Conservative Term Series | | Shares | | Value (Note 2) | | |
| | | |
COMMON STOCKS (continued) | | | | | | | |
| | | |
Industrials (continued) | | | | | | | |
Airlines - 0.69% | | | | | | | |
AirTran Holdings, Inc.* | | 24,660 | | $ | 130,205 | | |
Copa Holdings S.A. - Class A (Panama) | | 1,080 | | | 61,214 | | |
Deutsche Lufthansa AG (Germany)* | | 4,430 | | | 74,024 | | |
Ryanair Holdings plc - ADR (Ireland)* | | 3,970 | | | 111,795 | | |
Singapore Airlines Ltd. (Singapore) | | 4,280 | | | 47,476 | | |
Southwest Airlines Co. | | 283,925 | | | 3,742,132 | | |
| | | | | | | |
| | | | | 4,166,846 | | |
| | | | | | | |
Commercial Services & Supplies - 0.05% | | | | | | | |
Tomra Systems ASA (Norway) | | 55,550 | | | 268,380 | | |
| | | | | | | |
Electrical Equipment - 0.06% | | | | | | | |
ABB Ltd. (Asea Brown Boveri) - ADR (Switzerland)* | | 7,680 | | | 147,149 | | |
Alstom S.A. (France) | | 810 | | | 47,970 | | |
Gamesa Corporacion Tecnologica S.A. (Spain) | | 3,130 | | | 38,761 | | |
Nexans S.A. (France) | | 740 | | | 58,752 | | |
Schneider Electric S.A. (France) | | 570 | | | 65,215 | | |
Yingli Green Energy Holding Co. Ltd. - ADR (China)* | | 2,290 | | | 28,923 | | |
| | | | | | | |
| | | | | 386,770 | | |
| | | | | | | |
Industrial Conglomerates - 0.07% | | | | | | | |
Siemens AG (Germany) | | 4,420 | | | 437,492 | | |
| | | | | | | |
Machinery - 0.03% | | | | | | | |
Lindsay Corp. | | 970 | | | 36,889 | | |
SmartHeat, Inc. (China)* | | 2,410 | | | 20,220 | | |
Titan International, Inc. | | 3,560 | | | 44,180 | | |
Wabtec Corp. | | 1,590 | | | 75,652 | | |
| | | | | | | |
| | | | | 176,941 | | |
| | | | | | | |
Professional Services - 0.03% | | | | | | | |
Adecco S.A. (Switzerland) | | 680 | | | 40,125 | | |
Equifax, Inc. | | 3,150 | | | 105,840 | | |
| | | | | | | |
| | | | | 145,965 | | |
| | | | | | | |
Road & Rail - 0.04% | | | | | | | |
All America Latina Logistica S.A. (Brazil) | | 17,980 | | | 160,845 | | |
Kansas City Southern* | | 970 | | | 39,333 | | |
RailAmerica, Inc.* | | 3,840 | | | 49,498 | | |
| | | | | | | |
| | | | | 249,676 | | |
| | | | | | | |
Total Industrials | | | | | 8,857,972 | | |
| | | | | | | |
Information Technology - 6.03% | | | | | | | |
Communications Equipment - 1.22% | | | | | | | |
Alcatel-Lucent - ADR (France)* | | 56,870 | | | 180,278 | | |
| | | | |
| | The accompanying notes are an integral part of the financial statements. | | 10 |
Investment Portfolio - April 30, 2010 (unaudited)
| | | | | | | |
| Pro-Blend® Conservative Term Series | | Shares | | Value (Note 2) | | |
| | | |
COMMON STOCKS (continued) | | | | | | | |
| | | |
Information Technology (continued) | | | | | | | |
Communications Equipment (continued) | | | | | | | |
Blue Coat Systems, Inc.* | | 10,120 | | $ | 329,203 | | |
Cisco Systems, Inc.* | | 133,478 | | | 3,593,228 | | |
Infinera Corp.* | | 29,430 | | | 269,284 | | |
Juniper Networks, Inc.* | | 54,826 | | | 1,557,607 | | |
QUALCOMM, Inc. | | 30,980 | | | 1,200,165 | | |
Riverbed Technology, Inc.* | | 7,640 | | | 236,764 | | |
| | | | | | | |
| | | | | 7,366,529 | | |
| | | | | | | |
Computers & Peripherals - 0.41% | | | | | | | |
Compellent Technologies, Inc.* | | 11,600 | | | 145,812 | | |
EMC Corp.* | | 121,020 | | | 2,300,590 | | |
| | | | | | | |
| | | | | 2,446,402 | | |
| | | | | | | |
Electronic Equipment, Instruments & Components - 0.02% | | | | | | | |
LoJack Corp.* | | 28,340 | | | 118,461 | | |
| | | | | | | |
Internet Software & Services - 1.02% | | | | | | | |
comScore, Inc.* | | 8,100 | | | 147,015 | | |
Google, Inc. - Class A* | | 11,045 | | | 5,803,485 | | |
NetEase.com, Inc. - ADR (China)* | | 1,380 | | | 48,121 | | |
Vocus, Inc.* | | 7,230 | | | 123,271 | | |
| | | | | | | |
| | | | | 6,121,892 | | |
| | | | | | | |
IT Services - 1.06% | | | | | | | |
Accenture plc - Class A (Ireland) | | 4,490 | | | 195,944 | | |
Amdocs Ltd. (Guernsey)* | | 13,860 | | | 442,689 | | |
Automatic Data Processing, Inc. | | 57,078 | | | 2,474,902 | | |
Cap Gemini S.A. (France) | | 4,130 | | | 209,810 | | |
Cielo S.A. (Brazil) | | 21,920 | | | 211,728 | | |
Paychex, Inc. | | 5,800 | | | 177,480 | | |
Redecard S.A. (Brazil) | | 13,370 | | | 221,981 | | |
The Western Union Co. | | 135,300 | | | 2,469,225 | | |
| | | | | | | |
| | | | | 6,403,759 | | |
| | | | | | | |
Semiconductors & Semiconductor Equipment - 0.14% | | | | | | | |
Advantest Corp. (Japan) | | 11,600 | | | 302,673 | | |
Hynix Semiconductor, Inc. (South Korea)* | | 1,730 | | | 44,329 | | |
KLA-Tencor Corp. | | 2,700 | | | 91,962 | | |
Sumco Corp. (Japan)* | | 4,000 | | | 89,211 | | |
Taiwan Semiconductor Manufacturing Co. Ltd. - ADR (Taiwan) | | 5,461 | | | 57,832 | | |
Tokyo Electron Ltd. (Japan) | | 3,900 | | | 257,827 | | |
| | | | | | | |
| | | | | 843,834 | | |
| | | | | | | |
Software - 2.16% | | | | | | | |
Autodesk, Inc.* | | 95,040 | | | 3,232,310 | | |
| | | | |
| 11 | | The accompanying notes are an integral part of the financial statements. | | |
Investment Portfolio - April 30, 2010 (unaudited)
| | | | | | | |
| Pro-Blend® Conservative Term Series | | Shares | | Value (Note 2) | | |
| | | |
COMMON STOCKS (continued) | | | | | | | |
| | | |
Information Technology (continued) | | | | | | | |
Software (continued) | | | | | | | |
Electronic Arts, Inc.* | | 128,830 | | $ | 2,495,437 | | |
Microsoft Corp. | | 124,940 | | | 3,815,668 | | |
Misys plc (United Kingdom)* | | 21,155 | | | 75,774 | | |
Net 1 UEPS Technologies, Inc. (South Africa)* | | 10,000 | | | 164,000 | | |
SAP AG (Germany) | | 1,550 | | | 74,759 | | |
SAP AG - ADR (Germany) | | 56,230 | | | 2,668,114 | | |
Shanda Interactive Entertainment Ltd. - ADR (China)* | | 4,170 | | | 189,068 | | |
Sonic Solutions, Inc.* | | 8,830 | | | 110,816 | | |
Square Enix Holdings Co. Ltd. (Japan) | | 2,600 | | | 54,970 | | |
UbiSoft Entertainment S.A. (France)* | | 9,500 | | | 121,770 | | |
| | | | | | | |
| | | | | 13,002,686 | | |
| | | | | | | |
Total Information Technology | | | | | 36,303,563 | | |
| | | | | | | |
Materials - 0.56% | | | | | | | |
Chemicals - 0.56% | | | | | | | |
Arkema S.A. (France) | | 2 | | | 84 | | |
Calgon Carbon Corp.* | | 7,130 | | | 110,515 | | |
Johnson Matthey plc (United Kingdom) | | 2,300 | | | 61,338 | | |
Monsanto Co. | | 50,280 | | | 3,170,657 | | |
The Scotts Miracle-Gro Co. - Class A | | 700 | | | 33,915 | | |
| | | | | | | |
| | | | | 3,376,509 | | |
| | | | | | | |
Paper & Forest Products - 0.00%** | | | | | | | |
Norbord, Inc. (Canada)* | | 577 | | | 11,298 | | |
| | | | | | | |
Total Materials | | | | | 3,387,807 | | |
| | | | | | | |
Telecommunication Services - 0.17% | | | | | | | |
Diversified Telecommunication Services - 0.02% | | | | | | | |
France Telecom S.A. (France) | | 3,130 | | | 68,534 | | |
Swisscom AG - ADR (Switzerland)2 | | 2,120 | | | 71,486 | | |
| | | | | | | |
| | | | | 140,020 | | |
| | | | | | | |
Wireless Telecommunication Services - 0.15% | | | | | | | |
American Tower Corp. - Class A* | | 3,890 | | | 158,751 | | |
Crown Castle International Corp.* | | 7,250 | | | 274,412 | | |
Hutchison Telecommunications International Ltd. (Hong Kong)* | | 6,550 | | | 1,831 | | |
SBA Communications Corp. - Class A* | | 8,440 | | | 298,523 | | |
SK Telecom Co. Ltd. - ADR (South Korea) | | 7,440 | | | 137,714 | | |
| | | | | | | |
| | | | | 871,231 | | |
| | | | | | | |
Total Telecommunication Services | | | | | 1,011,251 | | |
| | | | | | | |
Utilities - 0.05% | | | | | | | |
Electric Utilities - 0.02% | | | | | | | |
E.ON AG (Germany) | | 3,515 | | | 129,918 | | |
| | | | | | | |
| | | | |
| | The accompanying notes are an integral part of the financial statements. | | 12 |
Investment Portfolio - April 30, 2010 (unaudited)
| | | | | | | |
| Pro-Blend® Conservative Term Series | | Shares | | Value (Note 2) | | |
| | | |
COMMON STOCKS (continued) | | | | | | | |
| | | |
Utilities (continued) | | | | | | | |
Independent Power Producers & Energy Traders - 0.01% | | | | | | | |
Mirant Corp.* | | 2,430 | | $ | 28,334 | | |
RRI Energy, Inc.* | | 7,380 | | | 30,037 | | |
| | | | | | | |
| | | | | 58,371 | | |
| | | | | | | |
Multi-Utilities - 0.01% | | | | | | | |
National Grid plc (United Kingdom) | | 4,460 | | | 42,923 | | |
| | | | | | | |
Water Utilities - 0.01% | | | | | | | |
Cia de Saneamento de Minas Gerais - Copasa MG (Brazil) | | 3,500 | | | 50,741 | | |
| | | | | | | |
Total Utilities | | | | | 281,953 | | |
| | | | | | | |
TOTAL COMMON STOCKS | | | | | | | |
(Identified Cost $121,738,873) | | | | | 138,993,024 | | |
| | | | | | | |
| | | |
PREFERRED STOCKS - 0.20% | | | | | | | |
| | | |
Consumer Staples - 0.01% | | | | | | | |
Household Products - 0.01% | | | | | | | |
Henkel AG & Co. KGaA (Germany) | | 930 | | | 49,808 | | |
| | | | | | | |
Financials - 0.19% | | | | | | | |
Commercial Banks - 0.09% | | | | | | | |
PNC Financial Services Group, Inc., Series K3 | | 180,000 | | | 191,054 | | |
Wells Fargo & Co., Series K | | 300,000 | | | 316,500 | | |
| | | | | | | |
| | | | | 507,554 | | |
| | | | | | | |
Diversified Financial Services - 0.10% | | | | | | | |
Bank of America Corp., Series K | | 320,000 | | | 322,135 | | |
JPMorgan Chase & Co., Series 1 | | 285,000 | | | 299,321 | | |
| | | | | | | |
| | | | | 621,456 | | |
| | | | | | | |
Total Financials | | | | | 1,129,010 | | |
| | | | | | | |
TOTAL PREFERRED STOCKS | | | | | | | |
(Identified Cost $1,074,383) | | | | | 1,178,818 | | |
| | | | | | | |
| | | |
WARRANTS - 0.00%** | | | | | | | |
| | | |
Health Care - 0.00%** | | | | | | | |
Life Sciences Tools & Services - 0.00%** | | | | | | | |
Caliper Life Sciences, Inc., 8/10/2011* | | | | | | | |
(Identified Cost $215) | | 348 | | | 89 | | |
| | | | | | | |
| | | | |
| 13 | | The accompanying notes are an integral part of the financial statements. | | |
Investment Portfolio - April 30, 2010 (unaudited)
| | | | | | | | |
| Pro-Blend® Conservative Term Series | | Principal Amount | | Value (Note 2) | | |
| | | |
CORPORATE BONDS - 31.34% | | | | | | | | |
| | | |
Convertible Corporate Bonds - 0.11% | | | | | | | | |
Consumer Discretionary - 0.01% | | | | | | | | |
Hotels, Restaurants & Leisure - 0.01% | | | | | | | | |
Carnival Corp., 2.00%, 4/15/2021 | | $ | 55,000 | | $ | 62,012 | | |
| | | | | | | | |
Energy - 0.04% | | | | | | | | |
Energy Equipment & Services - 0.04% | | | | | | | | |
Schlumberger Ltd., Series B, 2.125%, 6/1/2023 | | | 130,000 | | | 234,000 | | |
| | | | | | | | |
Health Care - 0.02% | | | | | | | | |
Biotechnology - 0.02% | | | | | | | | |
Amgen, Inc., 0.375%, 2/1/2013 | | | 110,000 | | | 110,688 | | |
| | | | | | | | |
Industrials - 0.01% | | | | | | | | |
Airlines - 0.01% | | | | | | | | |
AirTran Holdings, Inc., 5.25%, 11/1/2016 | | | 45,000 | | | 50,288 | | |
| | | | | | | | |
Information Technology - 0.03% | | | | | | | | |
Computers & Peripherals - 0.01% | | | | | | | | |
EMC Corp., 1.75%, 12/1/2013 | | | 40,000 | | | 52,100 | | |
| | | | | | | | |
Semiconductors & Semiconductor Equipment - 0.02% | | | | | | | | |
Advanced Micro Devices, Inc., 6.00%, 5/1/2015 | | | 175,000 | | | 168,656 | | |
| | | | | | | | |
Total Information Technology | | | | | | 220,756 | | |
| | | | | | | | |
Total Convertible Corporate Bonds | | | | | | | | |
(Identified Cost $612,986) | | | | | | 677,744 | | |
| | | | | | | | |
Non-Convertible Corporate Bonds - 31.23% | | | | | | | | |
Consumer Discretionary - 4.08% | | | | | | | | |
Diversified Consumer Services - 0.03% | | | | | | | | |
Affinion Group, Inc., 11.50%, 10/15/2015 | | | 180,000 | | | 189,900 | | |
| | | | | | | | |
Hotels, Restaurants & Leisure - 1.31% | | | | | | | | |
International Game Technology, 7.50%, 6/15/2019 | | | 4,000,000 | | | 4,657,444 | | |
McDonald’s Corp., 5.80%, 10/15/2017 | | | 1,920,000 | | | 2,172,906 | | |
McDonald’s Corp., 6.30%, 10/15/2037 | | | 190,000 | | | 212,851 | | |
Scientific Games Corp.4 , 7.875%, 6/15/2016 | | | 110,000 | | | 111,237 | | |
Scientific Games International, Inc.4 , 9.25%, 6/15/2019 | | | 140,000 | | | 150,850 | | |
Wendy’s - Arby’s Restaurants LLC, 10.00%, 7/15/2016 | | | 225,000 | | | 241,875 | | |
Wyndham Worldwide Corp., 9.875%, 5/1/2014 | | | 90,000 | | | 102,585 | | |
Wyndham Worldwide Corp., 6.00%, 12/1/2016 | | | 165,000 | | | 164,311 | | |
Yonkers Racing Corp.4 , 11.375%, 7/15/2016 | | | 90,000 | | | 98,550 | | |
| | | | | | | | |
| | | | | | 7,912,609 | | |
| | | | | | | | |
Household Durables - 0.38% | | | | | | | | |
Fortune Brands, Inc., 4.875%, 12/1/2013 | | | 1,800,000 | | | 1,883,527 | | |
Fortune Brands, Inc., 5.375%, 1/15/2016 | | | 355,000 | | | 373,859 | | |
| | | | | | | | |
| | | | | | 2,257,386 | | |
| | | | | | | | |
| | | | |
| | The accompanying notes are an integral part of the financial statements. | | 14 |
Investment Portfolio - April 30, 2010 (unaudited)
| | | | | | | | |
| Pro-Blend® Conservative Term Series | | Principal Amount | | Value (Note 2) | | |
| | | |
CORPORATE BONDS (continued) | | | | | | | | |
| | | |
Non-Convertible Corporate Bonds (continued) | | | | | | | | |
Consumer Discretionary (continued) | | | | | | | | |
Media - 1.78% | | | | | | | | |
Cablevision Systems Corp.4 , 8.625%, 9/15/2017 | | $ | 285,000 | | $ | 300,675 | | |
Columbus International, Inc. (Barbados)4 , 11.50%, 11/20/2014 | | | 130,000 | | | 142,844 | | |
Comcast Cable Communications Holdings, Inc., 8.375%, 3/15/2013 | | | 657,000 | | | 763,125 | | |
Comcast Corp., 5.70%, 7/1/2019 | | | 2,800,000 | | | 2,982,386 | | |
Comcast Corp., 5.15%, 3/1/2020 | | | 2,000,000 | | | 2,041,444 | | |
Comcast Corp., 6.50%, 11/15/2035 | | | 55,000 | | | 57,982 | | |
Comcast Corp., 6.95%, 8/15/2037 | | | 490,000 | | | 545,732 | | |
DIRECTV Holdings LLC4 , 5.20%, 3/15/2020 | | | 310,000 | | | 312,574 | | |
MDC Partners, Inc. (Canada)4 , 11.00%, 11/1/2016 | | | 50,000 | | | 54,750 | | |
Sirius XM Radio, Inc.4 , 9.75%, 9/1/2015 | | | 95,000 | | | 103,788 | | |
Time Warner, Inc., 7.625%, 4/15/2031 | | | 320,000 | | | 371,852 | | |
Unitymedia Hessen GmbH & Co. KG (Germany)4 , 8.125%, 12/1/2017 | | | 100,000 | | | 102,000 | | |
Unitymedia Hessen GmbH & Co. KG (Germany)4 , 8.125%, 12/1/2017 | | | 90,000 | | | 123,426 | | |
UPC Holding B.V. (Netherlands)4 , 9.875%, 4/15/2018 | | | 160,000 | | | 168,800 | | |
Virgin Media Finance plc (United Kingdom), 8.375%, 10/15/2019 | | | 120,000 | | | 125,700 | | |
Virgin Media Finance plc, Series 1 (United Kingdom), 9.50%, 8/15/2016 | | | 50,000 | | | 54,875 | | |
The Walt Disney Co., Series B, 7.00%, 3/1/2032 | | | 145,000 | | | 175,857 | | |
The Walt Disney Co., Series C, 5.625%, 9/15/2016 | | | 1,800,000 | | | 2,052,268 | | |
WMG Acquisition Corp.4 , 9.50%, 6/15/2016 | | | 140,000 | | | 151,200 | | |
XM Satellite Radio, Inc.4 , 11.25%, 6/15/2013 | | | 75,000 | | | 82,312 | | |
| | | | | | | | |
| | | | | | 10,713,590 | | |
| | | | | | | | |
Multiline Retail - 0.06% | | | | | | | | |
Target Corp., 6.00%, 1/15/2018 | | | 320,000 | | | 366,291 | | |
| | | | | | | | |
Specialty Retail - 0.45% | | | | | | | | |
The Home Depot, Inc., 5.40%, 3/1/2016 | | | 340,000 | | | 372,932 | | |
Lowe’s Companies, Inc., 6.10%, 9/15/2017 | | | 1,800,000 | | | 2,061,479 | | |
Toys R Us Property Co. LLC4 , 8.50%, 12/1/2017 | | | 230,000 | | | 243,225 | | |
| | | | | | | | |
| | | | | | 2,677,636 | | |
| | | | | | | | |
Textiles, Apparel & Luxury Goods - 0.07% | | | | | | | | |
Levi Strauss & Co., 8.625%, 4/1/2013 | | | 50,000 | | | 67,904 | | |
VF Corp., 5.95%, 11/1/2017 | | | 330,000 | | | 366,136 | | |
| | | | | | | | |
| | | | | | 434,040 | | |
| | | | | | | | |
Total Consumer Discretionary | | | | | | 24,551,452 | | |
| | | | | | | | |
Consumer Staples - 0.43% | | | | | | | | |
Beverages - 0.19% | | | | | | | | |
CEDC Finance Corp. International, Inc.4 , 9.125%, 12/1/2016 | | | 235,000 | | | 249,100 | | |
The Coca-Cola Co., 5.35%, 11/15/2017 | | | 160,000 | | | 178,226 | | |
Constellation Brands, Inc., 8.375%, 12/15/2014 | | | 230,000 | | | 246,675 | | |
PepsiCo, Inc., 5.00%, 6/1/2018 | | | 110,000 | | | 117,862 | | |
| | | | |
| 15 | | The accompanying notes are an integral part of the financial statements. | | |
Investment Portfolio - April 30, 2010 (unaudited)
| | | | | | | | | |
| Pro-Blend® Conservative Term Series | | Principal Amount | | Value (Note 2) | | | |
| | | |
CORPORATE BONDS (continued) | | | | | | | | | |
| | | |
Non-Convertible Corporate Bonds (continued) | | | | | | | | | |
Consumer Staples (continued) | | | | | | | | | |
Beverages (continued) | | | | | | | | | |
PepsiCo, Inc., 7.90%, 11/1/2018 | | $ | 285,000 | | $ | 359,499 | | | |
| | | | | | | | | |
| | | | | | 1,151,362 | | | |
| | | | | | | | | |
Food & Staples Retailing - 0.06% | | | | | | | | | |
Ingles Markets, Inc., 8.875%, 5/15/2017 | | | 85,000 | | | 89,888 | | | |
The Kroger Co., 6.75%, 4/15/2012 | | | 240,000 | | | 261,972 | | | |
| | | | | | | | | |
| | | | | | 351,860 | | | |
| | | | | | | | | |
Food Products - 0.12% | | | | | | | | | |
General Mills, Inc., 5.65%, 2/15/2019 | | | 330,000 | | | 360,749 | | | |
Kraft Foods, Inc., 6.125%, 2/1/2018 | | | 335,000 | | | 370,052 | | | |
| | | | | | | | | |
| | | | | | 730,801 | | | |
| | | | | | | | | |
Personal Products - 0.06% | | | | | | | | | |
Revlon Consumer Products Corp.4, 9.75%, 11/15/2015 | | | 335,000 | | | 344,212 | | | |
| | | | | | | | | |
Total Consumer Staples | | | | | | 2,578,235 | | | |
| | | | | | | | | |
Energy - 2.55% | | | | | | | | | |
Energy Equipment & Services - 1.31% | | | | | | | | | |
Baker Hughes, Inc., 7.50%, 11/15/2018 | | | 295,000 | | | 359,202 | | | |
Cie Generale de Geophysique - Veritas (France), 7.75%, 5/15/2017 | | | 275,000 | | | 277,750 | | | |
Complete Production Services, Inc., 8.00%, 12/15/2016 | | | 160,000 | | | 163,600 | | | |
Hornbeck Offshore Services, Inc., 8.00%, 9/1/2017 | | | 70,000 | | | 71,050 | | | |
Hornbeck Offshore Services, Inc., Series B, 6.125%, 12/1/2014 | | | 180,000 | | | 178,875 | | | |
Key Energy Services, Inc., 8.375%, 12/1/2014 | | | 160,000 | | | 163,200 | | | |
Thermon Industries, Inc.4, 9.50%, 5/1/2017 | | | 185,000 | | | 188,700 | | | |
Weatherford International Ltd. (Switzerland), 9.625%, 3/1/2019 | | | 5,000,000 | | | 6,466,470 | | | |
| | | | | | | | | |
| | | | | | 7,868,847 | | | |
| | | | | | | | | |
Oil, Gas & Consumable Fuels - 1.24% | | | | | | | | | |
Alon Refining Krotz Springs, Inc., 13.50%, 10/15/2014 | | | 90,000 | | | 88,200 | | | |
Anadarko Petroleum Corp., 5.95%, 9/15/2016 | | | 95,000 | | | 105,456 | | | |
Anadarko Petroleum Corp., 8.70%, 3/15/2019 | | | 1,220,000 | | | 1,533,849 | | | |
Anadarko Petroleum Corp., 6.95%, 6/15/2019 | | | 3,000,000 | | | 3,473,709 | | | |
Apache Corp., 6.90%, 9/15/2018 | | | 155,000 | | | 184,723 | | | |
Aquilex Holdings LLC - Aquilex Finance Corp.4, 11.125%, 12/15/2016 | | | 115,000 | | | 124,775 | | | |
Arch Coal, Inc.4, 8.75%, 8/1/2016 | | | 55,000 | | | 58,575 | | | |
Arch Western Finance LLC, 6.75%, 7/1/2013 | | | 180,000 | | | 181,350 | | | |
Chesapeake Energy Corp., 9.50%, 2/15/2015 | | | 120,000 | | | 131,550 | | | |
Chesapeake Energy Corp., 6.875%, 1/15/2016 | | | 105,000 | | | 104,737 | | | |
Coffeyville Resources LLC - Coffeyville Finance, Inc.4, 9.00%, 4/1/2015 | | | 90,000 | | | 91,800 | | | |
Coffeyville Resources LLC - Coffeyville Finance, Inc.4, 10.875%, 4/1/2017 | | | 85,000 | | | 86,700 | | | |
Crosstex Energy - Crosstex Energy Finance Corp.4, 8.875%, 2/15/2018 | | | 165,000 | | | 171,600 | | | |
| | | | |
| | The accompanying notes are an integral part of the financial statements. | | 16 |
Investment Portfolio - April 30, 2010 (unaudited)
| | | | | | | | |
| Pro-Blend® Conservative Term Series | | Principal Amount | | Value (Note 2) | | |
| | | |
CORPORATE BONDS (continued) | | | | | | | | |
| | | |
Non-Convertible Corporate Bonds (continued) | | | | | | | | |
Energy (continued) | | | | | | | | |
Oil, Gas & Consumable Fuels (continued) | | | | | | | | |
Gibson Energy ULC - GEP Midstream Finance Corp. (Canada)4, 11.75%, 5/27/2014 | | $ | 105,000 | | $ | 116,550 | | |
Gibson Energy ULC - GEP Midstream Finance Corp. (Canada)4, 10.00%, 1/15/2018 | | | 45,000 | | | 45,000 | | |
Martin Midstream Partners LP - Martin Midstream Finance Corp.4, 8.875%, 4/1/2018 | | | 180,000 | | | 182,700 | | |
Niska Gas Storage US LLC - Niska Gas Storage Canada ULC4, 8.875%, 3/15/2018 | | | 125,000 | | | 130,625 | | |
Plains Exploration & Production Co., 8.625%, 10/15/2019 | | | 190,000 | | | 200,925 | | |
Targa Resources Partners LP - Targa Resources Partners Finance Corp., 8.25%, 7/1/2016 | | | 175,000 | | | 178,500 | | |
Tesoro Corp., 9.75%, 6/1/2019 | | | 255,000 | | | 274,125 | | |
Whiting Petroleum Corp., 7.00%, 2/1/2014 | | | 35,000 | | | 36,138 | | |
| | | | | | | | |
| | | | | | 7,501,587 | | |
| | | | | | | | |
Total Energy | | | | | | 15,370,434 | | |
| | | | | | | | |
Financials - 13.54% | | | | | | | | |
Capital Markets - 1.14% | | | | | | | | |
Goldman Sachs Capital I, 6.345%, 2/15/2034 | | | 380,000 | | | 340,056 | | |
Goldman Sachs Capital II5, 5.793%, 12/29/2049 | | | 380,000 | | | 300,675 | | |
The Goldman Sachs Group, Inc.6, 3.25%, 6/15/2012 | | | 3,266,000 | | | 3,409,074 | | |
The Goldman Sachs Group, Inc., 6.15%, 4/1/2018 | | | 335,000 | | | 347,027 | | |
The Goldman Sachs Group, Inc., 5.375%, 3/15/2020 | | | 2,000,000 | | | 1,942,662 | | |
Merrill Lynch & Co., Inc., 6.11%, 1/29/2037 | | | 190,000 | | | 175,731 | | |
Morgan Stanley, 5.55%, 4/27/2017 | | | 355,000 | | | 356,708 | | |
| | | | | | | | |
| | | | | | 6,871,933 | | |
| | | | | | | | |
Commercial Banks - 2.54% | | | | | | | | |
Household Finance Co., 6.375%, 11/27/2012 | | | 165,000 | | | 181,203 | | |
HSBC Finance Corp., 7.00%, 5/15/2012 | | | 250,000 | | | 273,354 | | |
KeyBank National Association6, 3.20%, 6/15/2012 | | | 3,476,000 | | | 3,624,658 | | |
KeyBank National Association, 5.45%, 3/3/2016 | | | 410,000 | | | 417,576 | | |
Manufacturers & Traders Trust Co., 6.625%, 12/4/2017 | | | 315,000 | | | 342,642 | | |
National City Corp., 6.875%, 5/15/2019 | | | 6,000,000 | | | 6,710,790 | | |
PNC Bank National Association3, 5.25%, 1/15/2017 | | | 195,000 | | | 201,948 | | |
PNC Funding Corp.3,6, 2.30%, 6/22/2012 | | | 2,246,000 | | | 2,301,079 | | |
U.S. Bank National Association, 6.375%, 8/1/2011 | | | 30,000 | | | 31,886 | | |
U.S. Bank National Association, 6.30%, 2/4/2014 | | | 100,000 | | | 112,464 | | |
USB Capital XIII Trust, 6.625%, 12/15/2039 | | | 210,000 | | | 220,838 | | |
Wachovia Corp., 5.25%, 8/1/2014 | | | 345,000 | | | 366,006 | | |
| | | | |
| 17 | | The accompanying notes are an integral part of the financial statements. | | |
Investment Portfolio - April 30, 2010 (unaudited)
| | | | | | | | |
| Pro-Blend® Conservative Term Series | | Principal Amount | | Value (Note 2) | | |
| | | |
CORPORATE BONDS (continued) | | | | | | | | |
| | | |
Non-Convertible Corporate Bonds (continued) | | | | | | | | |
Financials (continued) | | | | | | | | |
Commercial Banks (continued) | | | | | | | | |
Wells Fargo & Co.6, 3.00%, 12/9/2011 | | $ | 515,000 | | $ | 532,437 | | |
| | | | | | | | |
| | | | | | 15,316,881 | | |
| | | | | | | | |
Consumer Finance - 1.15% | | | | | | | | |
American Express Co., 8.125%, 5/20/2019 | | | 5,000,000 | | | 6,123,955 | | |
American Express Co.5, 6.80%, 9/1/2066 | | | 330,000 | | | 325,050 | | |
American Express Credit Corp., Series B5, 0.39863%, 10/4/2010 | | | 280,000 | | | 280,011 | | |
Credit Acceptance Corp.4, 9.125%, 2/1/2017 | | | 150,000 | | | 156,750 | | |
| | | | | | | | |
| | | | | | 6,885,766 | | |
| | | | | | | | |
Diversified Financial Services - 5.29% | | | | | | | | |
Bank of America Corp.6, 3.125%, 6/15/2012 | | | 5,518,000 | | | 5,735,972 | | |
Bank of America Corp., 4.875%, 1/15/2013 | | | 1,800,000 | | | 1,886,562 | | |
Bank of America Corp., 5.75%, 8/15/2016 | | | 205,000 | | | 210,344 | | |
Bank of America Corp., 7.625%, 6/1/2019 | | | 3,200,000 | | | 3,652,858 | | |
Citigroup Funding, Inc.6, 1.875%, 10/22/2012 | | | 1,520,000 | | | 1,536,249 | | |
Citigroup, Inc.6, 2.875%, 12/9/2011 | | | 5,788,000 | | | 5,970,669 | | |
Citigroup, Inc., 8.50%, 5/22/2019 | | | 4,000,000 | | | 4,722,112 | | |
JPMorgan Chase & Co.6, 3.125%, 12/1/2011 | | | 3,600,000 | | | 3,726,720 | | |
JPMorgan Chase & Co., 6.30%, 4/23/2019 | | | 4,000,000 | | | 4,439,108 | | |
| | | | | | | | |
| | | | | | 31,880,594 | | |
| | | | | | | | |
Insurance - 0.07% | | | | | | | | |
American International Group, Inc., 4.25%, 5/15/2013 | | | 30,000 | | | 29,300 | | |
Fidelity National Financial, Inc., 6.60%, 5/15/2017 | | | 210,000 | | | 210,036 | | |
Hartford Financial Services Group, Inc.5, 8.125%, 6/15/2038 | | | 190,000 | | | 195,700 | | |
| | | | | | | | |
| | | | | | 435,036 | | |
| | | | | | | | |
Real Estate Investment Trusts (REITS) - 3.35% | | | | | | | | |
AvalonBay Communities, Inc., 6.10%, 3/15/2020 | | | 2,145,000 | | | 2,324,592 | | |
Boston Properties LP, 5.875%, 10/15/2019 | | | 5,150,000 | | | 5,461,348 | | |
Camden Property Trust, 5.70%, 5/15/2017 | | | 2,270,000 | | | 2,259,578 | | |
DuPont Fabros Technology LP4, 8.50%, 12/15/2017 | | | 305,000 | | | 316,438 | | |
Felcor Lodging LP, 10.00%, 10/1/2014 | | | 175,000 | | | 182,875 | | |
HCP, Inc., 6.70%, 1/30/2018 | | | 4,155,000 | | | 4,341,651 | | |
Health Care REIT, Inc., 6.20%, 6/1/2016 | | | 200,000 | | | 214,886 | | |
Host Hotels & Resorts LP, 6.875%, 11/1/2014 | | | 105,000 | | | 106,706 | | |
Omega Healthcare Investors, Inc.4, 7.50%, 2/15/2020 | | | 165,000 | | | 169,538 | | |
Simon Property Group LP, 10.35%, 4/1/2019 | | | 3,680,000 | | | 4,768,658 | | |
| | | | | | | | |
| | | | | | 20,146,270 | | |
| | | | | | | | |
Total Financials | | | | | | 81,536,480 | | |
| | | | | | | | |
| | | | |
| | The accompanying notes are an integral part of the financial statements. | | 18 |
Investment Portfolio - April 30, 2010 (unaudited)
| | | | | | | | |
| Pro-Blend® Conservative Term Series | | Principal Amount | | Value (Note 2) | | |
| | | |
CORPORATE BONDS (continued) | | | | | | | | |
| | | |
Non-Convertible Corporate Bonds (continued) | | | | | | | | |
Health Care - 0.41% | | | | | | | | |
Biotechnology - 0.01% | | | | | | | | |
Talecris Biotherapeutics Holdings Corp.4, 7.75%, 11/15/2016 | | $ | 85,000 | | $ | 85,850 | | |
| | | | | | | | |
Health Care Equipment & Supplies - 0.15% | | | | | | | | |
Becton, Dickinson and Co., 6.00%, 5/15/2039 | | | 330,000 | | | 358,852 | | |
Fresenius Medical Care Capital Trust IV, 7.875%, 6/15/2011 | | | 75,000 | | | 78,750 | | |
Fresenius US Finance II, Inc.4, 9.00%, 7/15/2015 | | | 75,000 | | | 84,375 | | |
Inverness Medical Innovations, Inc., 7.875%, 2/1/2016 | | | 85,000 | | | 83,725 | | |
Inverness Medical Innovations, Inc., 9.00%, 5/15/2016 | | | 267,000 | | | 272,340 | | |
| | | | | | | | |
| | | | | | 878,042 | | |
| | | | | | | | |
Health Care Providers & Services - 0.10% | | | | | | | | |
BioScrip, Inc.4, 10.25%, 10/1/2015 | | | 165,000 | | | 169,125 | | |
HCA, Inc.4, 7.875%, 2/15/2020 | | | 165,000 | | | 177,581 | | |
Health Management Associates, Inc., 6.125%, 4/15/2016 | | | 255,000 | | | 246,394 | | |
| | | | | | | | |
| | | | | | 593,100 | | |
| | | | | | | | |
Life Sciences Tools & Services - 0.03% | | | | | | | | |
PharmaNet Development Group, Inc.4, 10.875%, 4/15/2017 | | | 180,000 | | | 184,275 | | |
| | | | | | | | |
Pharmaceuticals - 0.12% | | | | | | | | |
Abbott Laboratories, 5.60%, 11/30/2017 | | | 160,000 | | | 179,915 | | |
Johnson & Johnson, 5.95%, 8/15/2037 | | | 160,000 | | | 178,126 | | |
Valeant Pharmaceuticals International4, 7.625%, 3/15/2020 | | | 185,000 | | | 188,237 | | |
Wyeth, 6.50%, 2/1/2034 | | | 155,000 | | | 177,191 | | |
| | | | | | | | |
| | | | | | 723,469 | | |
| | | | | | | | |
Total Health Care | | | | | | 2,464,736 | | |
| | | | | | | | |
Industrials - 5.33% | | | | | | | | |
Aerospace & Defense - 0.10% | | | | | | | | |
The Boeing Co., 6.00%, 3/15/2019 | | | 325,000 | | | 365,079 | | |
GeoEye, Inc.4, 9.625%, 10/1/2015 | | | 75,000 | | | 78,094 | | |
Honeywell International, Inc., 5.30%, 3/1/2018 | | | 170,000 | | | 183,805 | | |
| | | | | | | | |
| | | | | | 626,978 | | |
| | | | | | | | |
Air Freight & Logistics - 0.70% | | | | | | | | |
FedEx Corp., 8.00%, 1/15/2019 | | | 3,200,000 | | | 3,995,603 | | |
United Parcel Service, Inc., 6.20%, 1/15/2038 | | | 180,000 | | | 202,518 | | |
| | | | | | | | |
| | | | | | 4,198,121 | | |
| | | | | | | | |
Airlines - 0.33% | | | | | | | | |
AirTran Airways, Inc.7,8, 10.41%, 4/1/2017 | | | 129,153 | | | 124,955 | | |
Delta Air Lines, Inc.4, 9.50%, 9/15/2014 | | | 385,000 | | | 407,619 | | |
Southwest Airlines Co., 5.25%, 10/1/2014 | | | 355,000 | | | 370,706 | | |
| | | | |
| 19 | | The accompanying notes are an integral part of the financial statements. | | |
Investment Portfolio - April 30, 2010 (unaudited)
| | | | | | | | |
| Pro-Blend® Conservative Term Series | | Principal Amount | | Value (Note 2) | | |
| | | |
CORPORATE BONDS (continued) | | | | | | | | |
| | | |
Non-Convertible Corporate Bonds (continued) | | | | | | | | |
Industrials (continued) | | | | | | | | |
Airlines (continued) | | | | | | | | |
Southwest Airlines Co., 5.75%, 12/15/2016 | | $ | 1,070,000 | | $ | 1,105,891 | | |
| | | | | | | | |
| | | | | | 2,009,171 | | |
| | | | | | | | |
Building Products - 0.07% | | | | | | | | |
Building Materials Corp. of America4, 7.50%, 3/15/2020 | | | 85,000 | | | 84,788 | | |
Owens Corning, 9.00%, 6/15/2019 | | | 150,000 | | | 181,099 | | |
USG Corp.4, 9.75%, 8/1/2014 | | | 120,000 | | | 129,600 | | |
| | | | | | | | |
| | | | | | 395,487 | | |
| | | | | | | | |
Commercial Services & Supplies - 0.89% | | | | | | | | |
ACCO Brands Corp.4, 10.625%, 3/15/2015 | | | 80,000 | | | 88,600 | | |
Clean Harbors, Inc., 7.625%, 8/15/2016 | | | 165,000 | | | 171,806 | | |
Corrections Corp. of America, 6.25%, 3/15/2013 | | | 75,000 | | | 76,125 | | |
Corrections Corp. of America, 7.75%, 6/1/2017 | | | 75,000 | | | 79,500 | | |
Garda World Security Corp. (Canada)4, 9.75%, 3/15/2017 | | | 165,000 | | | 170,982 | | |
Waste Management, Inc., 7.375%, 3/11/2019 | | | 4,000,000 | | | 4,747,952 | | |
| | | | | | | | |
| | | | | | 5,334,965 | | |
| | | | | | | | |
Industrial Conglomerates - 1.52% | | | | | | | | |
General Electric Capital Corp.6, 3.00%, 12/9/2011 | | | 5,798,000 | | | 5,992,430 | | |
General Electric Capital Corp., 5.625%, 5/1/2018 | | | 1,800,000 | | | 1,907,280 | | |
General Electric Capital Corp.5, 6.375%, 11/15/2067 | | | 340,000 | | | 325,550 | | |
General Electric Capital Corp., Series A, 6.75%, 3/15/2032 | | | 345,000 | | | 376,248 | | |
General Electric Co., 5.25%, 12/6/2017 | | | 180,000 | | | 191,448 | | |
Textron, Inc., 7.25%, 10/1/2019 | | | 350,000 | | | 384,853 | | |
| | | | | | | | |
| | | | | | 9,177,809 | | |
| | | | | | | | |
Machinery - 0.44% | | | | | | | | |
Caterpillar Financial Services Corp., 7.05%, 10/1/2018 | | | 305,000 | | | 358,852 | | |
John Deere Capital Corp., 5.50%, 4/13/2017 | | | 20,000 | | | 22,051 | | |
John Deere Capital Corp., 5.75%, 9/10/2018 | | | 2,060,000 | | | 2,300,903 | | |
| | | | | | | | |
| | | | | | 2,681,806 | | |
| | | | | | | | |
Marine - 0.04% | | | | | | | | |
Navios Maritime Holdings, Inc. - Navios Maritime Finance US, Inc. (Marshall Island)4, 8.875%, 11/1/2017 | | | 90,000 | | | 94,050 | | |
United Maritime Group LLC - United Maritime Group Finance Corp.4, 11.75%, 6/15/2015 | | | 115,000 | | | | | |
| | | | | | 119,600 | | |
| | | | | | | | |
| | | | | | 213,650 | | |
| | | | | | | | |
Road & Rail - 1.24% | | | | | | | | |
CSX Corp., 6.25%, 4/1/2015 | | | 1,800,000 | | | 2,033,395 | | |
CSX Corp., 7.375%, 2/1/2019 | | | 4,000,000 | | | 4,787,772 | | |
| | | | |
| | The accompanying notes are an integral part of the financial statements. | | 20 |
Investment Portfolio - April 30, 2010 (unaudited)
| | | | | | | | |
| Pro-Blend® Conservative Term Series | | Principal Amount | | Value (Note 2) | | |
| | | |
CORPORATE BONDS (continued) | | | | | | | | |
| | | |
Non-Convertible Corporate Bonds (continued) | | | | | | | | |
Industrials (continued) | | | | | | | | |
Road & Rail (continued) | | | | | | | | |
CSX Corp., 6.00%, 10/1/2036 | | $ | 355,000 | | $ | 363,542 | | |
RailAmerica, Inc., 9.25%, 7/1/2017 | | | 67,000 | | | 72,193 | | |
Union Pacific Corp., 5.65%, 5/1/2017 | | | 175,000 | | | 189,331 | | |
| | | | | | | | |
| | | | | | 7,446,233 | | |
| | | | | | | | |
Total Industrials | | | | | | 32,084,220 | | |
| | | | | | | | |
Information Technology - 0.90% | | | | | | | | |
Communications Equipment - 0.17% | | | | | | | | |
Alcatel-Lucent USA, Inc., 6.45%, 3/15/2029 | | | 205,000 | | | 150,163 | | |
Cisco Systems, Inc., 5.90%, 2/15/2039 | | | 345,000 | | | 361,709 | | |
Hughes Network Systems LLC - HNS Finance Corp., 9.50%, 4/15/2014 | | | 290,000 | | | 298,700 | | |
Nokia Corp. (Finland), 5.375%, 5/15/2019 | | | 175,000 | | | 185,589 | | |
| | | | | | | | |
| | | | | | 996,161 | | |
| | | | | | | | |
Computers & Peripherals - 0.03% | | | | | | | | |
International Business Machines Corp., 5.60%, 11/30/2039 | | | 170,000 | | | 176,786 | | |
| | | | | | | | |
Electronic Equipment, Instruments & Components - 0.64% | | | | | | | | |
Corning, Inc., 6.20%, 3/15/2016 | | | 215,000 | | | 237,135 | | |
Corning, Inc., 6.625%, 5/15/2019 | | | 3,200,000 | | | 3,646,378 | | |
| | | | | | | | |
| | | | | | 3,883,513 | | |
| | | | | | | | |
Semiconductors & Semiconductor Equipment - 0.03% | | | | | | | | |
MagnaChip Semiconductor S.A. - MagnaChip Semiconductor Finance Co.4, 10.50%, 4/15/2018 | | | 180,000 | | | 189,900 | | |
| | | | | | | | |
Software - 0.03% | | | | | | | | |
Microsoft Corp., 5.20%, 6/1/2039 | | | 190,000 | | | 194,019 | | |
| | | | | | | | |
Total Information Technology | | | | | | 5,440,379 | | |
| | | | | | | | |
Materials - 2.26% | | | | | | | | |
Chemicals - 0.41% | | | | | | | | |
E.I. du Pont de Nemours & Co., 5.875%, 1/15/2014 | | | 1,800,000 | | | 2,017,838 | | |
E.I. du Pont de Nemours & Co., 6.00%, 7/15/2018 | | | 320,000 | | | 360,509 | | |
Solutia, Inc., 7.875%, 3/15/2020 | | | 85,000 | | | 87,762 | | |
| | | | | | | | |
| | | | | | 2,466,109 | | |
| | | | | | | | |
Containers & Packaging - 0.08% | | | | | | | | |
Ball Corp., 6.625%, 3/15/2018 | | | 75,000 | | | 76,313 | | |
BWAY Corp., 10.00%, 4/15/2014 | | | 225,000 | | | 246,375 | | |
Reynolds Group Issuer, Inc. - Reynolds Group Issuer LLC4, 8.50%, 5/15/2018 | | | 190,000 | | | 191,425 | | |
| | | | | | | | |
| | | | | | 514,113 | | |
| | | | | | | | |
| | | | |
| 21 | | The accompanying notes are an integral part of the financial statements. | | |
Investment Portfolio - April 30, 2010 (unaudited)
| | | | | | | | |
| Pro-Blend® Conservative Term Series | | Principal Amount | | Value (Note 2) | | |
| | | |
CORPORATE BONDS (continued) | | | | | | | | |
| | | |
Non-Convertible Corporate Bonds (continued) | | | | | | | | |
Materials (continued) | | | | | | | | |
Metals & Mining - 0.60% | | | | | | | | |
Alcoa, Inc., 5.72%, 2/23/2019 | | $ | 2,032,000 | | $ | 2,005,598 | | |
Alcoa, Inc., 5.87%, 2/23/2022 | | | 295,000 | | | 283,569 | | |
BHP Billiton Finance (USA) Ltd. (Australia), 6.50%, 4/1/2019 | | | 925,000 | | | 1,071,532 | | |
Essar Steel Algoma, Inc. (Canada)4, 9.375%, 3/15/2015 | | | 90,000 | | | 92,250 | | |
Steel Dynamics, Inc., 7.75%, 4/15/2016 | | | 165,000 | | | 172,219 | | |
| | | | | | | | |
| | | | | | 3,625,168 | | |
| | | | | | | | |
Paper & Forest Products - 1.17% | | | | | | | | |
Georgia-Pacific LLC4, 8.25%, 5/1/2016 | | | 145,000 | | | 158,775 | | |
Georgia-Pacific LLC4, 7.125%, 1/15/2017 | | | 110,000 | | | 116,050 | | |
International Paper Co., 9.375%, 5/15/2019 | | | 5,000,000 | | | 6,359,960 | | |
International Paper Co., 7.50%, 8/15/2021 | | | 330,000 | | | 387,621 | | |
| | | | | | | | |
| | | | | | 7,022,406 | | |
| | | | | | | | |
Total Materials | | | | | | 13,627,796 | | |
| | | | | | | | |
Telecommunication Services - 0.32% | | | | | | | | |
Diversified Telecommunication Services - 0.11% | | | | | | | | |
Clearwire Communications LLC - Clearwire Finance, Inc.4, 12.00%, 12/1/2015 | | | 60,000 | | | 62,550 | | |
Clearwire Communications LLC - Clearwire Finance, Inc.4, 12.00%, 12/1/2015 | | | 115,000 | | | 119,313 | | |
Intelsat Subsidiary Holding Co. Ltd. (Bermuda)4, 8.875%, 1/15/2015 | | | 245,000 | | | 253,575 | | |
Wind Acquisition Finance S.A. (Luxembourg)4, 11.75%, 7/15/2017 | | | 230,000 | | | 255,875 | | |
| | | | | | | | |
| | | | | | 691,313 | | |
| | | | | | | | |
Wireless Telecommunication Services - 0.21% | | | | | | | | |
CC Holdings GS V LLC - Crown Castle GS III Corp.4, 7.75%, 5/1/2017 | | | 185,000 | | | 201,187 | | |
Crown Castle Towers LLC4, 6.113%, 1/15/2020 | | | 390,000 | | | 414,577 | | |
NII Capital Corp.4, 8.875%, 12/15/2019 | | | 230,000 | | | 243,800 | | |
SBA Telecommunications, Inc.4, 8.00%, 8/15/2016 | | | 170,000 | | | 179,350 | | |
SBA Tower Trust4, 5.101%, 4/15/2017 | | | 200,000 | | | 206,001 | | |
| | | | | | | | |
| | | | | | 1,244,915 | | |
| | | | | | | | |
Total Telecommunication Services | | | | | | 1,936,228 | | |
| | | | | | | | |
Utilities - 1.41% | | | | | | | | |
Electric Utilities - 1.36% | | | | | | | | |
Allegheny Energy Supply Co. LLC4, 5.75%, 10/15/2019 | | | 365,000 | | | 362,078 | | |
Columbus Southern Power Co., Series C, 5.50%, 3/1/2013 | | | 1,800,000 | | | 1,954,455 | | |
Exelon Generation Co. LLC, 5.35%, 1/15/2014 | | | 340,000 | | | 369,081 | | |
Exelon Generation Co. LLC, 5.20%, 10/1/2019 | | | 5,000,000 | | | 5,164,635 | | |
Southwestern Electric Power Co., 6.45%, 1/15/2019 | | | 330,000 | | | 367,288 | | |
| | | | | | | | |
| | | | | | 8,217,537 | | |
| | | | | | | | |
| | | | |
| | The accompanying notes are an integral part of the financial statements. | | 22 |
Investment Portfolio - April 30, 2010 (unaudited)
| | | | | | | | |
| Pro-Blend® Conservative Term Series | | Principal Amount/ Shares | | Value (Note 2) | | |
| | | |
CORPORATE BONDS (continued) | | | | | | | | |
| | | |
Non-Convertible Corporate Bonds (continued) | | | | | | | | |
Utilities (continued) | | | | | | | | |
Independent Power Producers & Energy Traders - 0.03% | | | | | | | | |
Mirant Americas Generation LLC, 9.125%, 5/1/2031 | | $ | 110,000 | | $ | 103,400 | | |
North American Energy Alliance LLC - North American Energy Alliance Finance Corp.4, 10.875%, 6/1/2016 | | | 75,000 | | | 79,875 | | |
| | | | | | | | |
| | | | | | 183,275 | | |
| | | | | | | | |
Multi-Utilities - 0.02% | | | | | | | | |
CenterPoint Energy Resources Corp., Series B, 7.875%, 4/1/2013 | | | 85,000 | | | 97,495 | | |
| | | | | | | | |
Total Utilities | | | | | | 8,498,307 | | |
| | | | | | | | |
Total Non-Convertible Corporate Bonds | | | | | | | | |
(Identified Cost $181,229,036) | | | | | | 188,088,267 | | |
| | | | | | | | |
TOTAL CORPORATE BONDS | | | | | | | | |
(Identified Cost $181,842,022) | | | | | | 188,766,011 | | |
| | | | | | | | |
MUTUAL FUNDS - 0.58% | | | | | | | | |
| | | |
iShares Dow Jones US Real Estate Index Fund | | | 3,890 | | | 205,976 | | |
iShares iBoxx High Yield Corporate Bond Fund | | | 16,750 | | | 1,497,450 | | |
iShares iBoxx Investment Grade Corporate Bond Fund | | | 16,940 | | | 1,817,831 | | |
| | | | | | | | |
| | | |
TOTAL MUTUAL FUNDS | | | | | | | | |
(Identified Cost $3,257,068) | | | | | | 3,521,257 | | |
| | | | | | | | |
| | | |
U.S. TREASURY SECURITIES - 9.53% | | | | | | | | |
U.S. Treasury Bonds - 1.42% | | | | | | | | |
U.S. Treasury Bond, 5.50%, 8/15/2028 | | $ | 1,410,000 | | | 1,617,314 | | |
U.S. Treasury Bond, 5.25%, 2/15/2029 | | | 4,400,000 | | | 4,906,000 | | |
U.S. Treasury Bond, 4.50%, 2/15/2036 | | | 2,000,000 | | | 2,010,624 | | |
| | | | | | | | |
| | | |
Total U.S. Treasury Bonds | | | | | | | | |
(Identified Cost $8,509,851) | | | | | | 8,533,938 | | |
| | | | | | | | |
U.S. Treasury Notes - 8.11% | | | | | | | | |
U.S. Treasury Note, 5.00%, 2/15/2011 | | | 1,000,000 | | | 1,036,211 | | |
U.S. Treasury Note, 4.00%, 11/15/2012 | | | 9,000,000 | | | 9,630,702 | | |
U.S. Treasury Note, 3.625%, 5/15/2013 | | | 5,525,000 | | | 5,875,058 | | |
U.S. Treasury Note, 2.25%, 5/31/2014 | | | 1,300,000 | | | 1,310,563 | | |
U.S. Treasury Note, 2.625%, 6/30/2014 | | | 6,490,000 | | | 6,629,937 | | |
U.S. Treasury Note, 2.375%, 9/30/2014 | | | 2,490,000 | | | 2,507,898 | | |
U.S. Treasury Note, 4.00%, 2/15/2015 | | | 14,000,000 | | | 15,071,868 | | |
U.S. Treasury Note, 3.50%, 2/15/2018 | | | 3,700,000 | | | 3,758,101 | | |
| | | | |
| 23 | | The accompanying notes are an integral part of the financial statements. | | |
Investment Portfolio - April 30, 2010 (unaudited)
| | | | | | | | |
| Pro-Blend® Conservative Term Series | | Principal Amount | | Value (Note 2) | | |
| | | |
U.S. TREASURY SECURITIES (continued) | | | | | | | | |
| | | |
U.S. Treasury Notes (continued) | | | | | | | | |
U.S. Treasury Note, 3.75%, 11/15/2018 | | $ | 3,000,000 | | $ | 3,064,452 | | |
| | | | | | | | |
Total U.S. Treasury Notes | | | | | | | | |
(Identified Cost $47,011,662) | | | | | | 48,884,790 | | |
| | | | | | | | |
| | | |
TOTAL U.S. TREASURY SECURITIES | | | | | | | | |
(Identified Cost $55,521,513) | | | | | | 57,418,728 | | |
| | | | | | | | |
| | | |
ASSET-BACKED SECURITIES - 0.03% | | | | | | | | |
Hertz Vehicle Financing LLC, Series 2009-2A, Class A24, 5.29%, 3/25/2016 (Identified Cost $169,991) | | | 170,000 | | | 179,928 | | |
| | | | | | | | |
| | | |
FOREIGN GOVERNMENT BONDS - 0.06% | | | | | | | | |
Hellenic Republic Government Bond (Greece), 6.00%, 7/19/2019 (Identified Cost $491,886) | | | 380,000 | | | 385,783 | | |
| | | | | | | | |
| | | |
U.S. GOVERNMENT AGENCIES - 26.37% | | | | | | | | |
Mortgage-Backed Securities - 6.40% | | | | | | | | |
Fannie Mae, Pool #805347, 5.50%, 1/1/2020 | | | 13,291 | | | 14,300 | | |
Fannie Mae, Pool #816064, 4.50%, 4/1/2020 | | | 117,640 | | | 123,686 | | |
Fannie Mae, Pool #863151, 4.50%, 11/1/2020 | | | 65,175 | | | 68,524 | | |
Fannie Mae, Pool #851149, 5.00%, 4/1/2021 | | | 188,145 | | | 199,396 | | |
Fannie Mae, Pool #899023, 4.50%, 1/1/2022 | | | 67,935 | | | 70,875 | | |
Fannie Mae, Pool #899287, 5.00%, 2/1/2022 | | | 67,954 | | | 71,826 | | |
Fannie Mae, Pool #888815, 4.50%, 11/1/2022 | | | 595,194 | | | 620,948 | | |
Fannie Mae, Pool #AA1563, 4.50%, 2/1/2024 | | | 1,526,250 | | | 1,588,476 | | |
Fannie Mae, Pool #AA4537, 4.50%, 4/1/2024 | | | 150,979 | | | 157,135 | | |
Fannie Mae, Pool #AC0495, 4.50%, 9/1/2024 | | | 734,086 | | | 764,015 | | |
Fannie Mae, Pool #AC1557, 4.50%, 9/1/2024 | | | 1,161,792 | | | 1,209,159 | | |
Fannie Mae, Pool #AC5902, 4.50%, 10/1/2024 | | | 1,332,386 | | | 1,386,708 | | |
Fannie Mae, Pool #357319, 6.00%, 12/1/2032 | | | 111,273 | | | 120,601 | | |
Fannie Mae, Pool #790393, 6.50%, 9/1/2034 | | | 2,591 | | | 2,835 | | |
Fannie Mae, Pool #745147, 4.50%, 12/1/2035 | | | 442,115 | | | 449,857 | | |
Fannie Mae, Pool #900130, 6.00%, 9/1/2036 | | | 338,041 | | | 360,884 | | |
Fannie Mae, Pool #886904, 6.50%, 9/1/2036 | | | 897,166 | | | 972,219 | | |
Fannie Mae, Pool #901895, 6.50%, 9/1/2036 | | | 65,904 | | | 71,417 | | |
Fannie Mae, Pool #899393, 6.00%, 4/1/2037 | | | 171,470 | | | 182,628 | | |
Fannie Mae, Pool #939487, 5.00%, 6/1/2037 | | | 58,714 | | | 60,905 | | |
Fannie Mae, Pool #945845, 6.00%, 8/1/2037 | | | 130,809 | | | 139,321 | | |
Fannie Mae, Pool #949709, 6.50%, 9/1/2037 | | | 1,363 | | | 1,475 | | |
Fannie Mae, Pool #946148, 6.00%, 10/1/2037 | | | 675,212 | | | 719,150 | | |
Fannie Mae, Pool #950248, 6.00%, 10/1/2037 | | | 156,462 | | | 166,644 | | |
| | | | |
| | The accompanying notes are an integral part of the financial statements. | | 24 |
Investment Portfolio - April 30, 2010 (unaudited)
| | | | | | | | |
| Pro-Blend® Conservative Term Series | | Principal Amount | | Value (Note 2) | | |
| | | |
U.S. GOVERNMENT AGENCIES (continued) | | | | | | | | |
Mortgage-Backed Securities (continued) | | | | | | | | |
Fannie Mae, Pool #960196, 5.00%, 11/1/2037 | | $ | 42,109 | | $ | 43,680 | | |
Fannie Mae, Pool #933521, 5.00%, 1/1/2038 | | | 656,427 | | | 680,510 | | |
Fannie Mae, Pool #929084, 5.00%, 2/1/2038 | | | 244,177 | | | 253,287 | | |
Fannie Mae, Pool #969756, 5.00%, 2/1/2038 | | | 569,972 | | | 590,883 | | |
Fannie Mae, Pool #972107, 5.00%, 2/1/2038 | | | 754,096 | | | 781,762 | | |
Fannie Mae, Pool #961950, 5.00%, 3/1/2038 | | | 38,375 | | | 39,783 | | |
Fannie Mae, Pool #973091, 5.00%, 3/1/2038 | | | 25,883 | | | 26,832 | | |
Fannie Mae, Pool #889260, 5.00%, 4/1/2038 | | | 444,307 | | | 460,886 | | |
Fannie Mae, Pool #912948, 5.00%, 5/1/2038 | | | 1,186,346 | | | 1,230,611 | | |
Fannie Mae, Pool #975840, 5.00%, 5/1/2038 | | | 794,765 | | | 823,923 | | |
Fannie Mae, Pool #976516, 5.00%, 5/1/2038 | | | 26,234 | | | 27,197 | | |
Fannie Mae, Pool #984379, 6.00%, 5/1/2038 | | | 681,933 | | | 725,882 | | |
Fannie Mae, Pool #981636, 5.00%, 6/1/2038 | | | 25,266 | | | 26,192 | | |
Fannie Mae, Pool #981650, 5.00%, 6/1/2038 | | | 380,761 | | | 394,730 | | |
Fannie Mae, Pool #985554, 5.00%, 6/1/2038 | | | 79,380 | | | 82,293 | | |
Fannie Mae, Pool #982317, 6.00%, 6/1/2038 | | | 90,181 | | | 95,993 | | |
Fannie Mae, Pool #934329, 5.00%, 7/1/2038 | | | 362,626 | | | 375,930 | | |
Fannie Mae, Pool #986458, 6.00%, 8/1/2038 | | | 365,071 | | | 388,598 | | |
Fannie Mae, Pool #987831, 6.00%, 9/1/2038 | | | 1,182,631 | | | 1,258,849 | | |
Fannie Mae, Pool #988990, 6.00%, 9/1/2038 | | | 31,720 | | | 33,764 | | |
Fannie Mae, Pool #990503, 6.00%, 9/1/2038 | | | 131,920 | | | 140,422 | | |
Fannie Mae, Pool #990897, 6.00%, 9/1/2038 | | | 1,658,089 | | | 1,764,949 | | |
Fannie Mae, Pool #986889, 6.00%, 10/1/2038 | | | 754,424 | | | 803,045 | | |
Fannie Mae, Pool #983839, 5.00%, 11/1/2038 | | | 29,652 | | | 30,740 | | |
Fannie Mae, Pool #993920, 6.00%, 11/1/2038 | | | 531,359 | | | 565,604 | | |
Fannie Mae, Pool #257497, 6.00%, 12/1/2038 | | | 481,433 | | | 512,460 | | |
Fannie Mae, Pool #AA0675, 6.00%, 12/1/2038 | | | 308,876 | | | 328,782 | | |
Fannie Mae, Pool #971022, 5.00%, 1/1/2039 | | | 944,396 | | | 979,043 | | |
Fannie Mae, Pool #992293, 5.00%, 1/1/2039 | | | 322,293 | | | 334,117 | | |
Fannie Mae, Pool #994216, 5.00%, 1/1/2039 | | | 47,603 | | | 49,350 | | |
Fannie Mae, Pool #AA1717, 5.00%, 1/1/2039 | | | 629,785 | | | 652,890 | | |
Fannie Mae, Pool #AA1810, 5.00%, 1/1/2039 | | | 739,708 | | | 766,615 | | |
Fannie Mae, Pool #988811, 6.00%, 1/1/2039 | | | 354,286 | | | 377,119 | | |
Fannie Mae, Pool #983686, 5.00%, 2/1/2039 | | | 753,479 | | | 780,886 | | |
Fannie Mae, Pool #AA1686, 5.00%, 3/1/2039 | | | 243,632 | | | 252,494 | | |
Fannie Mae, Pool #AA4461, 5.00%, 3/1/2039 | | | 49,742 | | | 51,551 | | |
Fannie Mae, Pool #AA3636, 6.00%, 3/1/2039 | | | 497,549 | | | 529,615 | | |
Fannie Mae, Pool #AA5087, 5.00%, 4/1/2039 | | | 70,276 | | | 72,832 | | |
Fannie Mae, Pool #AA6788, 6.00%, 8/1/2039 | | | 932,207 | | | 992,286 | | |
Fannie Mae, Pool #AC2881, 6.00%, 8/1/2039 | | | 297,518 | | | 316,692 | | |
Fannie Mae, Pool #AC1901, 5.00%, 9/1/2039 | | | 218,571 | | | 226,521 | | |
Fannie Mae, Pool #AC0463, 5.00%, 11/1/2039 | | | 545,757 | | | 565,609 | | |
Fannie Mae, Pool #AC5111, 5.00%, 11/1/2039 | | | 1,274,978 | | | 1,321,356 | | |
| | | | |
| 25 | | The accompanying notes are an integral part of the financial statements. | | |
Investment Portfolio - April 30, 2010 (unaudited)
| | | | | | | | |
| Pro-Blend® Conservative Term Series | | Principal Amount | | Value (Note 2) | | |
| | | |
U.S. GOVERNMENT AGENCIES (continued) | | | | | | | | |
Mortgage-Backed Securities (continued) | | | | | | | | |
Fannie Mae, Pool #MA0259, 5.00%, 12/1/2039 | | $ | 428,827 | | $ | 444,426 | | |
Fannie Mae, Pool #AC8573, 5.00%, 1/1/2040 | | | 927,676 | | | 961,420 | | |
Fannie Mae, Pool #AC8791, 5.00%, 1/1/2040 | | | 38,924 | | | 40,340 | | |
Freddie Mac, Pool #B16835, 5.50%, 10/1/2019 | | | 9,142 | | | 9,860 | | |
Freddie Mac, Pool #G11912, 5.50%, 3/1/2021 | | | 225,944 | | | 243,265 | �� | |
Freddie Mac, Pool #J06512, 5.00%, 12/1/2022 | | | 113,651 | | | 120,341 | | |
Freddie Mac, Pool #G12966, 5.50%, 1/1/2023 | | | 54,988 | | | 58,903 | | |
Freddie Mac, Pool #G13136, 4.50%, 5/1/2023 | | | 95,254 | | | 99,271 | | |
Freddie Mac, Pool #G01736, 6.50%, 9/1/2034 | | | 7,338 | | | 8,056 | | |
GNMA, Pool #365225, 9.00%, 11/15/2024 | | | 1,963 | | | 2,268 | | |
GNMA, Pool #398655, 6.50%, 5/15/2026 | | | 897 | | | 982 | | |
GNMA, Pool #452826, 9.00%, 1/15/2028 | | | 2,057 | | | 2,392 | | |
GNMA, Pool #460820, 6.00%, 6/15/2028 | | | 14,728 | | | 16,040 | | |
GNMA, Pool #458983, 6.00%, 1/15/2029 | | | 25,787 | | | 28,083 | | |
GNMA, Pool #530481, 8.00%, 8/15/2030 | | | 16,602 | | | 19,116 | | |
GNMA, Pool #577796, 6.00%, 1/15/2032 | | | 23,834 | | | 25,956 | | |
GNMA, Pool #003808, 6.00%, 1/20/2036 | | | 338,529 | | | 365,266 | | |
GNMA, Pool #651235, 6.50%, 2/15/2036 | | | 225,812 | | | 245,133 | | |
GNMA, Pool #003830, 5.50%, 3/20/2036 | | | 796,607 | | | 848,297 | | |
GNMA, Pool #671304, 5.50%, 6/15/2037 | | | 121,999 | | | 129,837 | | |
GNMA, Pool #671531, 5.50%, 9/15/2037 | | | 79,024 | | | 84,101 | | |
GNMA, Pool #671161, 5.50%, 11/15/2037 | | | 361,405 | | | 384,626 | | |
GNMA, Pool #672715, 5.50%, 5/15/2038 | | | 269,407 | | | 286,548 | | |
GNMA, Pool #782639, 5.50%, 12/15/2038 | | | 772,901 | | | 823,704 | | |
GNMA, Pool #707098, 5.50%, 1/15/2039 | | | 950,973 | | | 1,011,479 | | |
GNMA, Pool #703481, 5.50%, 2/15/2039 | | | 1,870,613 | | | 1,989,630 | | |
| | | | | | | | |
Total Mortgage-Backed Securities | | | | | | | | |
(Identified Cost $37,750,775) | | | | | | 38,528,887 | | |
| | | | | | | | |
Other Agencies - 19.97% | | | | | | | | |
Fannie Mae, 1.375%, 4/28/2011 | | | 18,600,000 | | | 18,745,192 | | |
Fannie Mae, 4.875%, 5/18/2012 | | | 1,135,000 | | | 1,219,745 | | |
Fannie Mae, 5.25%, 9/15/2016 | | | 9,500,000 | | | 10,566,916 | | |
Fannie Mae, 6.25%, 5/15/2029 | | | 2,429,000 | | | 2,843,453 | | |
Fannie Mae, 7.25%, 5/15/2030 | | | 2,910,000 | | | 3,785,229 | | |
Fannie Mae, 6.625%, 11/15/2030 | | | 2,339,000 | | | 2,864,545 | | |
Federal Farm Credit Bank, 5.125%, 8/25/2016 | | | 3,640,000 | | | 4,036,036 | | |
Federal Home Loan Bank, 4.625%, 10/10/2012 | | | 3,600,000 | | | 3,881,804 | | |
Federal Home Loan Bank, 4.50%, 11/15/2012 | | | 10,000 | | | 10,753 | | |
Federal Home Loan Bank, 3.375%, 2/27/2013 | | | 10,000 | | | 10,487 | | |
Federal Home Loan Bank, 5.25%, 6/18/2014 | | | 4,950,000 | | | 5,539,679 | | |
Federal Home Loan Bank, 5.00%, 11/17/2017 | | | 7,985,000 | | | 8,741,682 | | |
Freddie Mac, 1.75%, 6/15/2012 | | | 430,000 | | | 434,351 | | |
| | | | |
| | The accompanying notes are an integral part of the financial statements. | | 26 |
Investment Portfolio - April 30, 2010 (unaudited)
| | | | | | | | |
| Pro-Blend® Conservative Term Series | | Principal Amount/ Shares | | Value (Note 2) | | |
| | | |
U.S. GOVERNMENT AGENCIES (continued) | | | | | | | | |
Other Agencies (continued) | | | | | | | | |
Freddie Mac, 5.50%, 8/20/2012 | | $ | 390,000 | | $ | 426,307 | | |
Freddie Mac, 3.00%, 7/28/2014 | | | 3,400,000 | | | 3,487,472 | | |
Freddie Mac, 2.875%, 2/9/2015 | | | 12,110,000 | | | 12,235,690 | | |
Freddie Mac, 5.50%, 7/18/2016 | | | 2,600,000 | | | 2,934,412 | | |
Freddie Mac, 5.125%, 10/18/2016 | | | 10,495,000 | | | 11,601,351 | | |
Freddie Mac, 5.125%, 11/17/2017 | | | 2,255,000 | | | 2,481,147 | | |
Freddie Mac, 3.75%, 3/27/2019 | | | 19,465,000 | | | 19,240,802 | | |
Freddie Mac, 6.75%, 3/15/2031 | | | 1,693,000 | | | 2,107,287 | | |
Freddie Mac, 6.25%, 7/15/2032 | | | 2,625,000 | | | 3,109,013 | | |
| | | | | | | | |
Total Other Agencies | | | | | | | | |
(Identified Cost $120,107,749) | | | | | | 120,303,353 | | |
| | | | | | | | |
TOTAL U.S. GOVERNMENT AGENCIES | | | | | | | | |
(Identified Cost $157,858,524) | | | | | | 158,832,240 | | |
| | | | | | | | |
SHORT-TERM INVESTMENTS - 7.47% | | | | | | | | |
Dreyfus Cash Management, Inc. - Institutional Shares9, 0.09%, | | | 23,282,035 | | | 23,282,035 | | |
Fannie Mae Discount Notes10, 0.38%, 2/17/2011 | | $ | 8,750,000 | | | 8,723,217 | | |
Federal Home Loan Bank Discount Notes10, 0.35%, 10/8/2010 | | | 3,000,000 | | | 2,996,973 | | |
Freddie Mac Discount Notes10, 0.38%, 1/10/2011 | | | 10,000,000 | | | 9,976,900 | | |
| | | | | | | | |
TOTAL SHORT-TERM INVESTMENTS | | | | | | | | |
(Identified Cost $44,973,588) | | | | | | 44,979,125 | | |
| | | | | | | | |
TOTAL INVESTMENTS - - 98.66% | | | | | | | | |
(Identified Cost $566,928,063) | | | | | | 594,255,003 | | |
OTHER ASSETS, LESS LIABILITIES - 1.34% | | | | | | 8,074,812 | | |
| | | | | | | | |
NET ASSETS - 100% | | | | | $ | 602,329,815 | | |
| | | | | | | | |
| | | | | | | | |
| FORWARD FOREIGN CURRENCY EXCHANGE CONTRACTS OPEN AT APRIL 30, 2010: |
Settlement Date | | Contracts to Deliver | | In Exchange
For | | Contracts
At Value | | Unrealized
Appreciation |
5/26/2010 | | EUR380,000 | | $515,451 | | $506,001 | | $9,450 |
ADR - American Depository Receipt
EUR - Euro currency
NVDR - Non-Voting Depository Receipt
| | | | |
| 27 | | The accompanying notes are an integral part of the financial statements. | | |
Investment Portfolio - April 30, 2010 (unaudited)
| * | Non-income producing security |
| 1 | The Bank of New York Mellon Corp. is the Series’ custodian. |
| 2 | Latest quoted sales price is not available and the latest quoted bid price was used to value the security. |
| 3 | PNC Global Investment Servicing (U.S.) Inc. serves as sub-accountant and sub-transfer agent to the Series. |
| 4 | Restricted securities - Investment in securities that are restricted as to public resale under the Securities Act of 1933, as amended. These securities have been sold under rule 144A and have been determined to be liquid. These securities amount to $9,948,579, or 1.65%, of the Series’ net assets as of April 30, 2010 (see Note 2 to the financial statements). |
| 5 | The coupon rate is floating and is the stated rate as of April 30, 2010. |
| 6 | Security insured under the Federal Deposit Insurance Corporation Temporary Liquidity Guarantee Program. |
| 7 | Security has been valued at fair value. |
| 8 | Restricted securities - Investment in securities that are restricted as to public resale under the Securities Act of 1933, as amended. This security has been sold under rule 144A and has been determined to be illiquid. This security amounts to $124,955, or 0.02%, of the Series’ net assets as of April 30, 2010 (see Note 2 to the financial statements). |
| 9 | Rate shown is the current yield as of April 30, 2010. |
| 10 | Rate shown reflects the annualized yield at time of purchase. |
| | | | |
| | The accompanying notes are an integral part of the financial statements. | | 28 |
Statement of Assets and Liabilities - Pro-Blend® Conservative Term Series (unaudited)
April 30, 2010
| | | |
ASSETS: | | | |
| |
Investments, at value (identified cost $566,928,063) (Note 2) | | $ | 594,255,003 |
Interest receivable | | | 4,796,887 |
Receivable for fund shares sold | | | 3,586,318 |
Receivable for securities sold | | | 1,081,337 |
Dividends receivable | | | 100,148 |
Foreign tax reclaims receivable | | | 50,492 |
Unrealized appreciation on foreign forward currency contracts (Note 2) | | | 9,450 |
Prepaid and other expenses | | | 10,970 |
| | | |
| |
TOTAL ASSETS | | | 603,890,605 |
| | | |
| |
LIABILITIES: | | | |
| |
Accrued management fees (Note 3) | | | 284,686 |
Accrued shareholder services fees (Class S) (Note 3) | | | 76,993 |
Accrued transfer agent fees (Note 3) | | | 3,759 |
Accrued distribution and service (Rule 12b-1) fees (Class C) (Note 3) | | | 2,980 |
Accrued Chief Compliance Officer service fees (Note 3) | | | 667 |
Accrued directors’ fees (Note 3) | | | 130 |
Payable for securities purchased | | | 1,051,961 |
Payable for fund shares repurchased | | | 139,614 |
| | | |
| |
TOTAL LIABILITIES | | | 1,560,790 |
| | | |
| |
TOTAL NET ASSETS | | $ | 602,329,815 |
| | | |
| |
NET ASSETS CONSIST OF: | | | |
| |
Capital stock | | $ | 490,774 |
Additional paid-in-capital | | | 563,628,255 |
Undistributed net investment income | | | 4,242,361 |
Accumulated net realized gain on investments, foreign currency and translation of other assets and liabilities | | | 6,632,493 |
Net unrealized appreciation on investments, foreign currency and translation of other assets and liabilities | | | 27,335,932 |
| | | |
TOTAL NET ASSETS | | $ | 602,329,815 |
| | | |
| |
NET ASSET VALUE, OFFERING PRICE AND REDEMPTION PRICE PER SHARE - Class S ($489,377,561/38,347,728 shares) | | $ | 12.76 |
| | | |
| |
NET ASSET VALUE, OFFERING PRICE AND REDEMPTION PRICE PER SHARE - Class I ($108,224,341/10,270,489 shares) | | $ | 10.54 |
| | | |
| |
NET ASSET VALUE, OFFERING PRICE AND REDEMPTION PRICE PER SHARE - Class C ($4,727,913/459,162 shares) | | $ | 10.30 |
| | | |
| | | | |
| 29 | | The accompanying notes are an integral part of the financial statements. | | |
Statement of Operations - Pro-Blend® Conservative Term Series (unaudited)
For the Six Months Ended April 30, 2010
| | | | |
INVESTMENT INCOME: | | | | |
| |
Interest | | $ | 6,920,288 | |
Dividends (net of foreign taxes withheld, $28,517) | | | 997,710 | |
| | | | |
| |
Total Investment Income | | | 7,917,998 | |
| | | | |
| |
EXPENSES: | | | | |
| |
Management fees (Note 3) | | | 1,498,042 | |
Shareholder services fees (Class S) (Note 3) | | | 397,287 | |
Fund accounting and administration fees (Note 3) | | | 56,219 | |
Transfer agent fees (Note 3) | | | 27,691 | |
Directors’ fees (Note 3) | | | 6,373 | |
Distribution and service (Rule 12b-1) fees (Class C) (Note 3) | | | 5,612 | |
Chief Compliance Officer service fees (Note 3) | | | 1,700 | |
Custodian fees | | | 18,059 | |
Miscellaneous | | | 61,744 | |
| | | | |
Total Expenses | | | 2,072,727 | |
Less reduction of expenses (Note 3) | | | (772 | ) |
| | | | |
Net Expenses | | | 2,071,955 | |
| | | | |
NET INVESTMENT INCOME | | | 5,846,043 | |
| | | | |
| |
REALIZED AND UNREALIZED GAIN (LOSS) ON INVESTMENTS AND FOREIGN CURRENCY: | | | | |
| |
Net realized gain (loss) on-
Investments | | | 8,915,231 | |
Foreign currency and translation of other assets and liabilities | | | (6,470 | ) |
| | | | |
| | | 8,908,761 | |
| | | | |
| |
Net change in unrealized appreciation on-
Investments | | | 12,751,237 | |
Foreign currency and translation of other assets and liabilities | | | 7,128 | |
| | | | |
| |
| | | 12,758,365 | |
| | | | |
| |
NET REALIZED AND UNREALIZED GAIN (LOSS) ON INVESTMENTS AND FOREIGN CURRENCY | | | 21,667,126 | |
| | | | |
| |
NET INCREASE IN NET ASSETS RESULTING FROM OPERATIONS | | $ | 27,513,169 | |
| | | | |
| | | | |
| | The accompanying notes are an integral part of the financial statements. | | 30 |
Statements of Changes in Net Assets - Pro-Blend® Conservative Term Series
| | | | | | | | |
| | | For the Six
Months Ended
4/30/10
(unaudited) | | | For the Year Ended 10/31/09 | |
INCREASE (DECREASE) IN NET ASSETS: | | | | | | | | |
| | |
OPERATIONS: | | | | | | | | |
| | |
Net investment income | | $ | 5,846,043 | | �� | $ | 4,685,975 | |
Net realized gain (loss) on investments and foreign currency | | | 8,908,761 | | | | 244,460 | |
Net change in unrealized appreciation on investments and foreign currency | | | 12,758,365 | | | | 22,248,877 | |
| | | | | | | | |
| | |
Net increase from operations | | | 27,513,169 | | | | 27,179,312 | |
| | | | | | | | |
| | |
DISTRIBUTIONS TO SHAREHOLDERS (Note 8): | | | | | | | | |
| | |
From net investment income (Class S) | | | (3,631,922 | ) | | | (2,955,314 | ) |
From net investment income (Class I) | | | (1,344,321 | ) | | | (235,623 | ) |
| | | | | | | | |
| | |
Total distributions to shareholders | | | (4,976,243 | ) | | | (3,190,937 | ) |
| | | | | | | | |
| | |
CAPITAL STOCK ISSUED AND REPURCHASED: | | | | | | | | |
| | |
Net increase from capital share transactions (Note 5) | | | 155,712,466 | | | | 260,840,800 | |
| | | | | | | | |
| | |
Net increase in net assets | | | 178,249,392 | | | | 284,829,175 | |
| | |
NET ASSETS: | | | | | | | | |
| | |
Beginning of period | | | 424,080,423 | | | | 139,251,248 | |
| | | | | | | | |
| | |
End of period (including undistributed net investment income of $4,242,361 and $3,372,561, respectively) | | $ | 602,329,815 | | | $ | 424,080,423 | |
| | | | | | | | |
| | | | |
| 31 | | The accompanying notes are an integral part of the financial statements. | | |
|
| Financial Highlights - Pro-Blend® Conservative Term Series - Class S |
| | | | | | | | | | | | |
| | | For the Six
Months Ended
4/30/10 | | For the Years Ended |
| | | (unaudited) | | 10/31/09 | | 10/31/08 | | 10/31/07 | | 10/31/06 | | 10/31/05 |
Per share data (for a share outstanding throughout each period): | | | | | | | | | | | | |
Net asset value - Beginning of period | | $12.21 | | $11.13 | | $12.74 | | $12.35 | | $11.90 | | $11.54 |
| | | | | | | | | | | | |
| | | | | | |
Income (loss) from investment operations: | | | | | | | | | | | | |
Net investment income | | 0.141 | | 0.231 | | 0.24 | | 0.30 | | 0.28 | | 0.17 |
Net realized and unrealized gain (loss) on investments | | 0.53 | | 1.07 | | (1.15) | | 0.65 | | 0.69 | | 0.46 |
| | | | | | | | | | | | |
Total from investment operations | | 0.67 | | 1.30 | | (0.91) | | 0.95 | | 0.97 | | 0.63 |
| | | | | | | | | | | | |
Less distributions to shareholders: | | | | | | | | | | | | |
From net investment income | | (0.12) | | (0.22) | | (0.27) | | (0.31) | | (0.20) | | (0.18) |
From net realized gain on investments | | — | | — | | (0.43) | | (0.25) | | (0.32) | | (0.09) |
| | | | | | | | | | | | |
Total distributions to shareholders | | (0.12) | | (0.22) | | (0.70) | | (0.56) | | (0.52) | | (0.27) |
| | | | | | | | | | | | |
Net asset value - End of period | | $12.76 | | $12.21 | | $11.13 | | $12.74 | | $12.35 | | $11.90 |
| | | | | | | | | | | | |
Net assets - End of period | | | | | | | | | | | | |
(000’s omitted) | | $489,378 | | $328,201 | | $139,174 | | $110,567 | | $71,790 | | $45,899 |
| | | | | | | | | | | | |
Total return2 | | 5.56% | | 11.83% | | (7.52%) | | 7.95% | | 8.49% | | 5.49% |
Ratios (to average net assets)/ Supplemental Data: | | | | | | | | | | | | |
Expenses* | | 0.87%3 | | 0.90% | | 0.92% | | 0.99% | | 1.00% | | 1.00% |
Net investment income | | 2.30%3 | | 1.97% | | 2.33% | | 2.73% | | 2.65% | | 1.81% |
Series portfolio turnover | | 9% | | 47% | | 45% | | 49% | | 48% | | 60% |
|
*The investment advisor did not impose all or a portion of its management fees, CCO fees, fund accounting and transfer agent fees and other fees in some periods and in some periods paid a portion of the Series’ expenses. If these expenses had been incurred by the Class, the expense ratio (to average net assets) would have been increased by the following amount: |
| | 0.00%3,4 | | 0.03% | | 0.05% | | N/A | | 0.07% | | 0.21% |
1Calculated based on average shares outstanding during the period.
2Represents aggregate total return for the periods indicated, and assumes reinvestment of all distributions. Total return would have been lower had certain expenses not been waived or reimbursed during certain periods. Periods less than one year are not annualized.
3Annualized.
4Less than 0.01%.
| | | | |
| | The accompanying notes are an integral part of the financial statements. | | 32 |
|
| Financial Highlights - Pro-Blend® Conservative Term Series - Class I |
| | | | | | | | |
| | | For the Six
Month Ended
4/30/10
(unaudited) | | For the Year Ended 10/31/09 | | | For the Period 3/28/08 1 to 10/31/08 | |
Per share data (for a share outstanding throughout each period): | | | | | | | | |
Net asset value - Beginning of period | | $10.11 | | $9.27 | | | $10.00 | |
| | | | | | | | |
| | | |
Income (loss) from investment operations: | | | | | | | | |
Net investment income | | 0.132 | | 0.21 | 2 | | 0.06 | |
Net realized and unrealized gain (loss) on investments | | 0.44 | | 0.87 | | | (0.74) | |
| | | | | | | | |
Total from investment operations | | 0.57 | | 1.08 | | | (0.68) | |
| | | | | | | | |
Less distributions to shareholders: | | | | | | | | |
From net investment income | | (0.14) | | (0.24) | | | (0.05) | |
| | | | | | | | |
Net asset value - End of period | | $10.54 | | $10.11 | | | $9.27 | |
| | | | | | | | |
Net assets - End of period (000’s omitted) | | $108,224 | | $95,879 | | | $77 | |
| | | | | | | | |
Total return3 | | 5.69% | | 11.94% | | | (6.81%) | |
Ratios (to average net assets)/Supplemental Data: | | | | | | | | |
Expenses* | | 0.67%4 | | 0.70% | | | 0.70%4 | |
Net investment income | | 2.50%4 | | 2.17% | | | 1.81%4 | |
Series portfolio turnover | | 9% | | 47% | | | 45% | |
|
*The investment advisor did not impose all or a portion of its management fees, CCO fees, fund accounting and transfer agent fees and other fees in some periods and in some periods paid a portion of the Series’ expenses. If these expenses had been incurred by the Class, the expense ratio (to average net assets) would have been increased by the following amount: | |
| | 0.00%4,5 | | 0.03% | | | 0.15% | 4 |
1Commencement of operations.
2Calculated based on average shares outstanding during the period.
3Represents aggregate total return for the periods indicated, and assumes reinvestment of all distributions. Total return would have been lower had certain expenses not been waived during the periods. Periods less than one year are not annualized.
4Annualized.
5Less than 0.01%.
| | | | |
| 33 | | The accompanying notes are an integral part of the financial statements. | | |
|
| Financial Highlights - Pro-Blend® Conservative Term Series - Class C |
| | |
| | | For the Period
1/4/101 to 4/30/10 (unaudited) |
Per share data (for a share outstanding throughout the period): | | |
Net asset value - Beginning of period | | $10.00 |
| | |
Income from investment operations: | | |
Net investment income | | 0.052 |
Net realized and unrealized gain on investments | | 0.25 |
| | |
Total from investment operations | | 0.30 |
| | |
Net asset value - End of period | | $10.30 |
| | |
Net assets - End of period (000’s omitted) | | $4,728 |
| | |
Total return3 | | 3.00% |
Ratios (to average net assets)/Supplemental Data: | | |
Expenses* | | 1.67%4 |
Net investment income | | 1.45%4 |
Series portfolio turnover | | 9% |
|
*The investment advisor did not impose all or a portion of its management fees and other fees during the period and paid a portion of the Series’ expenses. If these expenses had been incurred by the Class, the expense ratio (to average net assets) would have been increased by the following amount: |
| | 0.01%4 |
1Commencement of operations.
2Calculated based on average shares outstanding during the period.
3Represents aggregate total return for the period indicated, and assumes reinvestment of all distributions. Total return would have been lower had certain expenses not been waived or reimbursed during the period. Periods less than one year are not annualized.
4Annualized.
| | | | |
| | The accompanying notes are an integral part of the financial statements. | | 34 |
Shareholder Expense Example - Pro-Blend® Moderate Term Series (unaudited)
As a shareholder of the Series, you may incur two types of costs: (1) transaction costs, including potential wire charges on redemptions and (2) ongoing costs, including management fees and other Series expenses. This example is intended to help you understand your ongoing costs (in dollars) of investing in the Series and to compare these costs with the ongoing costs of investing in other mutual funds.
The example is based on an investment of $1,000 invested at the beginning of the period and held for the entire period (November 1, 2009 to April 30, 2010, except for Class C Actual, which is from January 4, 2010* to April 30, 2010).
Actual Expenses
The Actual lines of the table below provide information about actual account values and actual expenses. You may use the information in these lines, together with the amount you invested, to estimate the expenses that you paid over the period. Simply divide your account value by $1,000 (for example, an $8,600 account value divided by $1,000 = 8.6), then multiply the result by the number in the Actual line for the Class in which you have invested under the heading entitled “Expenses Paid During Period” to estimate the expenses you paid on your account during this period.
Hypothetical Example for Comparison Purposes
The Hypothetical lines of the table below provide information about hypothetical account values and hypothetical expenses based on the Class’ actual expense ratio and an assumed rate of return of 5% per year before expenses, which is not the Class’ actual return. The hypothetical account values and expenses may not be used to estimate the actual ending account balance or expenses you paid during the period. You may use this information to compare the ongoing costs of investing in the Series and other funds. To do so, compare this 5% hypothetical example for the Class in which you have invested with the 5% hypothetical examples that appear in the shareholder reports of the other funds.
Please note that the expenses shown in the table are meant to highlight your ongoing costs only and do not reflect any transaction costs. Therefore, the Hypothetical lines of the table are useful in comparing ongoing costs only, and will not help you determine the relative total costs of owning different funds. In addition, if these transaction costs were included, your costs would have been higher.
| | | | | | | | |
| | | Beginning
Account Value
11/1/09* | | Ending
Account Value
4/30/10 | | Expenses Paid
During Period
11/1/09-4/30/10** | | Annualized
Expense ratio |
Class S | | | | | | | | |
Actual | | $1,000.00 | | $1,082.60 | | $5.47 | | 1.06% |
Hypothetical
(5% return before expenses) | | $1,000.00 | | $1,019.54 | | $5.31 | | 1.06% |
Class I | | | | | | | | |
Actual | | $1,000.00 | | $1,083.90 | | $4.19 | | 0.81% |
Hypothetical
(5% return before expenses) | | $1,000.00 | | $1,020.78 | | $4.06 | | 0.81% |
Class C | | | | | | | | |
Actual | | $1,000.00 | | $1,035.00 | | $5.89 | | 1.82% |
Hypothetical
(5% return before expenses) | | $1,000.00 | | $1,010.11 | | $5.81 | | 1.82% |
*Class C inception date was January 4, 2010.
**Expenses are equal to the Class’ annualized expense ratio (for the six-month period), multiplied by the average account value over the period, multiplied by 181/365 to reflect the one-half year period (except for the Series’ Class C Actual return information, which reflects the 116 day period ended April 30, 2010 due to its inception date of January 4, 2010). The Class’ total return would have been lower had certain expenses not been waived during the period.
Portfolio Composition - Pro-Blend® Moderate Term Series (unaudited)
As of April 30, 2010
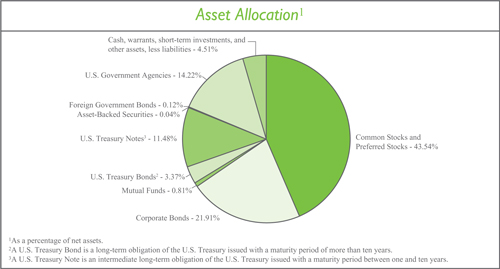
| | |
Sector Allocation4 |
Financials | | 13.56% |
Information Technology | | 12.74% |
Health Care | | 10.45% |
Consumer Discretionary | | 7.69% |
Industrials | | 6.76% |
Energy | | 5.52% |
Consumer Staples | | 5.28% |
Materials | | 2.33% |
Telecommunication Services | | 0.97% |
Utilities | | 0.53% |
4Including common stocks, preferred stocks, warrants and corporate bonds, as a percentage of total investments. |
| | |
Top Ten Stock Holdings5 |
The Walt Disney Co. | | 1.83% |
Google, Inc. - Class A | | 1.79% |
Cisco Systems, Inc. | | 1.67% |
Microsoft Corp. | | 1.16% |
Southwest Airlines Co. | | 1.15% |
Becton, Dickinson and Co. | | 1.09% |
Johnson & Johnson | | 1.08% |
Autodesk, Inc. | | 1.08% |
Monsanto Co. | | 1.00% |
Nestle S.A. (Switzerland) | | 0.96% |
5As a percentage of total investments. |
Investment Portfolio - April 30, 2010 (unaudited)
| | | | | | | |
| Pro-Blend® Moderate Term Series | | Shares | | Value (Note 2) | | |
| | | |
COMMON STOCKS - 43.24% | | | | | | | |
| | | |
Consumer Discretionary - 5.26% | | | | | | | |
Auto Components - 0.03% | | | | | | | |
Hankook Tire Co. Ltd. (South Korea) | | 11,060 | | $ | 248,971 | | |
| | | | | | | |
Automobiles - 0.05% | | | | | | | |
Bayerische Motoren Werke AG (BMW) (Germany) | | 5,960 | | | 294,643 | | |
Suzuki Motor Corp. (Japan) | | 3,900 | | | 82,580 | | |
| | | | | | | |
| | | | | 377,223 | | |
| | | | | | | |
Distributors - 0.02% | | | | | | | |
Inchcape plc (United Kingdom)* | | 284,460 | | | 149,722 | | |
| | | | | | | |
Hotels, Restaurants & Leisure - 1.40% | | | | | | | |
Carnival Corp. | | 160,495 | | | 6,692,641 | | |
Choice Hotels International, Inc. | | 9,860 | | | 358,017 | | |
Club Mediterranee S.A. (France)* | | 2,590 | | | 43,571 | | |
Hyatt Hotels Corp. - Class A* | | 3,270 | | | 134,626 | | |
International Game Technology | | 195,460 | | | 4,120,297 | | |
Wendy’s - Arby’s Group, Inc. - Class A | | 20,000 | | | 106,200 | | |
| | | | | | | |
| | | | | 11,455,352 | | |
| | | | | | | |
Household Durables - 0.11% | | | | | | | |
Corporacion Geo S.A.B. de C.V. - Class B (Mexico)* | | 55,360 | | | 175,312 | | |
LG Electronics, Inc. (South Korea) | | 2,100 | | | 231,154 | | |
NVR, Inc.* | | 290 | | | 208,235 | | |
Rodobens Negocios Imobiliarios S.A. (Brazil) | | 43,460 | | | 312,277 | | |
| | | | | | | |
| | | | | 926,978 | | |
| | | | | | | |
Leisure Equipment & Products - 0.01% | | | | | | | |
Sankyo Co. Ltd. (Japan) | | 1,600 | | | 74,179 | | |
| | | | | | | |
Media - 2.01% | | | | | | | |
Grupo Televisa S.A. - ADR (Mexico) | | 15,190 | | | 315,648 | | |
Mediacom Communications Corp. - Class A* | | 23,720 | | | 157,026 | | |
Reed Elsevier plc (United Kingdom) | | 23,260 | | | 183,106 | | |
Reed Elsevier plc - ADR (United Kingdom) | | 4,124 | | | 130,319 | | |
Societe Television Francaise 1 (France) | | 32,100 | | | 598,568 | | |
The Walt Disney Co. | | 402,120 | | | 14,814,101 | | |
Wolters Kluwer N.V. (Netherlands) | | 7,345 | | | 150,800 | | |
| | | | | | | |
| | | | | 16,349,568 | | |
| | | | | | | |
Multiline Retail - 0.06% | | | | | | | |
Marks & Spencer Group plc (United Kingdom) | | 32,000 | | | 179,445 | | |
Nordstrom, Inc. | | 2,580 | | | 106,632 | | |
PPR (France) | | 1,625 | | | 219,498 | | |
| | | | | | | |
| | | | | 505,575 | | |
| | | | | | | |
| | | | |
| 37 | | The accompanying notes are an integral part of the financial statements. | | |
Investment Portfolio - April 30, 2010 (unaudited)
| | | | | | | |
| Pro-Blend® Moderate Term Series | | Shares | | Value (Note 2) | | |
| | | |
COMMON STOCKS (continued) | | | | | | | |
| | | |
Consumer Discretionary (continued) | | | | | | | |
Specialty Retail - 1.53% | | | | | | | |
Dick’s Sporting Goods, Inc.* | | 15,070 | | $ | 438,688 | | |
The Finish Line, Inc. - Class A | | 9,450 | | | 152,240 | | |
The Home Depot, Inc. | | 68,530 | | | 2,415,682 | | |
KOMERI Co. Ltd. (Japan) | | 4,300 | | | 109,268 | | |
Lowe’s Companies, Inc. | | 135,860 | | | 3,684,523 | | |
Lumber Liquidators Holdings, Inc.* | | 7,410 | | | 225,709 | | |
The Sherwin-Williams Co. | | 69,550 | | | 5,429,768 | | |
| | | | | | | |
| | | | | 12,455,878 | | |
| | | | | | | |
Textiles, Apparel & Luxury Goods - 0.04% | | | | | | | |
Adidas AG (Germany) | | 3,270 | | | 192,266 | | |
LVMH S.A. (Louis Vuitton Moet Hennessy) (France) | | 1,210 | | | 139,904 | | |
| | | | | | | |
| | | | | 332,170 | | |
| | | | | | | |
Total Consumer Discretionary | | | | | 42,875,616 | | |
| | | | | | | |
Consumer Staples - 4.40% | | | | | | | |
Beverages - 0.09% | | | | | | | |
Diageo plc (United Kingdom) | | 11,520 | | | 196,533 | | |
Heineken N.V. (Netherlands) | | 6,260 | | | 293,221 | | |
Kirin Holdings Co. Ltd. (Japan) | | 15,200 | | | 218,287 | | |
| | | | | | | |
| | | | | 708,041 | | |
| | | | | | | |
Food & Staples Retailing - 1.37% | | | | | | | |
BJ’s Wholesale Club, Inc.* | | 7,170 | | | 274,468 | | |
Carrefour S.A. (France) | | 20,680 | | | 1,014,368 | | |
Casino Guichard-Perrachon S.A. (France) | | 2,420 | | | 214,915 | | |
The Kroger Co. | | 194,260 | | | 4,318,400 | | |
Safeway, Inc. | | 194,190 | | | 4,582,884 | | |
SUPERVALU, Inc. | | 8,350 | | | 124,415 | | |
Tesco plc (United Kingdom) | | 101,525 | | | 675,958 | | |
| | | | | | | |
| | | | | 11,205,408 | | |
| | | | | | | |
Food Products - 2.88% | | | | | | | |
Danone S.A. (France) | | 7,020 | | | 414,811 | | |
Dean Foods Co.* | | 235,770 | | | 3,701,589 | | |
Flowers Foods, Inc. | | 9,020 | | | 237,767 | | |
General Mills, Inc. | | 37,100 | | | 2,640,778 | | |
Kellogg Co. | | 48,700 | | | 2,675,578 | | |
Nestle S.A. (Switzerland) | | 158,620 | | | 7,789,869 | | |
Suedzucker AG (Germany) | | 5,520 | | | 111,971 | | |
Unilever plc - ADR (United Kingdom) | | 194,864 | | | 5,865,406 | | |
| | | | | | | |
| | | | | 23,437,769 | | |
| | | | | | | |
| | | | |
| | The accompanying notes are an integral part of the financial statements. | | 38 |
Investment Portfolio - April 30, 2010 (unaudited)
| | | | | | | |
| Pro-Blend® Moderate Term Series | | Shares | | Value (Note 2) | | |
| | | |
COMMON STOCKS (continued) | | | | | | | |
| | | |
Consumer Staples (continued) | | | | | | | |
Household Products - 0.04% | | | | | | | |
Kao Corp. (Japan) | | 3,300 | | $ | 80,801 | | |
Reckitt Benckiser Group plc (United Kingdom) | | 5,530 | | | 287,935 | | |
| | | | | | | |
| | | | | 368,736 | | |
| | | | | | | |
Personal Products - 0.02% | | | | | | | |
Alberto-Culver Co. | | 5,410 | | | 155,808 | | |
| | | | | | | |
Total Consumer Staples | | | | | 35,875,762 | | |
| | | | | | | |
Energy - 3.77% | | | | | | | |
Energy Equipment & Services - 2.72% | | | | | | | |
Baker Hughes, Inc. | | 140,985 | | | 7,015,414 | | |
Calfrac Well Services Ltd. (Canada) | | 18,400 | | | 391,439 | | |
Compagnie Generale de Geophysique - Veritas (CGG - Veritas) (France)* | | 14,660 | | | 442,790 | | |
Dril-Quip, Inc.* | | 3,960 | | | 229,403 | | |
Schlumberger Ltd. | | 90,660 | | | 6,474,937 | | |
Trican Well Service Ltd. (Canada) | | 33,750 | | | 428,603 | | |
Weatherford International Ltd. (Switzerland)* | | 398,540 | | | 7,217,560 | | |
| | | | | | | |
| | | | | 22,200,146 | | |
| | | | | | | |
Oil, Gas & Consumable Fuels - 1.05% | | | | | | | |
BP plc (United Kingdom) | | 18,090 | | | 159,291 | | |
Cameco Corp. (Canada) | | 4,460 | | | 109,761 | | |
Forest Oil Corp.* | | 3,540 | | | 103,722 | | |
Hess Corp. | | 103,670 | | | 6,588,229 | | |
Mariner Energy, Inc.* | | 5,381 | | | 128,498 | | |
Royal Dutch Shell plc - Class B (Netherlands) | | 6,202 | | | 187,416 | | |
Royal Dutch Shell plc - Class B - ADR (Netherlands) | | 6,190 | | | 375,609 | | |
Talisman Energy, Inc. (Canada) | | 21,070 | | | 358,634 | | |
Total S.A. (France) | | 3,960 | | | 216,016 | | |
Uranium One, Inc. (Canada)* | | 115,980 | | | 293,432 | | |
| | | | | | | |
| | | | | 8,520,608 | | |
| | | | | | | |
Total Energy | | | | | 30,720,754 | | |
| | | | | | | |
Financials - 4.18% | | | | | | | |
Capital Markets - 1.06% | | | | | | | |
The Bank of New York Mellon Corp.1 | | 214,350 | | | 6,672,716 | | |
Credit Suisse Group AG - ADR (Switzerland) | | 2,140 | | | 97,798 | | |
Daiwa Securities Group, Inc. (Japan) | | 7,000 | | | 36,515 | | |
Federated Investors, Inc. - Class B | | 22,900 | | | 552,348 | | |
GAM Holding Ltd. (Switzerland)* | | 27,690 | | | 346,591 | | |
The Goldman Sachs Group, Inc. | | 1,740 | | | 252,648 | | |
Legg Mason, Inc. | | 10,970 | | | 347,639 | | |
Northern Trust Corp. | | 4,850 | | | 266,653 | | |
| | | | |
| 39 | | The accompanying notes are an integral part of the financial statements. | | |
Investment Portfolio - April 30, 2010 (unaudited)
| | | | | | | |
| Pro-Blend® Moderate Term Series | | Shares | | Value (Note 2) | | |
| | | |
COMMON STOCKS (continued) | | | | | | | |
| | | |
Financials (continued) | | | | | | | |
Capital Markets (continued) | | | | | | | |
State Street Corp. | | 2,340 | | $ | 101,790 | | |
| | | | | | | |
| | | | | 8,674,698 | | |
| | | | | | | |
Commercial Banks - 0.31% | | | | | | | |
Barclays plc - ADR (United Kingdom) | | 4,940 | | | 100,875 | | |
BNP Paribas (France) | | 1,740 | | | 120,771 | | |
The Chugoku Bank Ltd. (Japan) | | 8,800 | | | 113,168 | | |
Credit Agricole S.A. (France) | | 4,505 | | | 64,900 | | |
First Commonwealth Financial Corp. | | 90,920 | | | 595,526 | | |
The Hachijuni Bank Ltd. (Japan) | | 16,800 | | | 94,610 | | |
HSBC Holdings plc (United Kingdom) | | 14,000 | | | 143,091 | | |
HSBC Holdings plc - ADR (United Kingdom) | | 6,362 | | | 323,762 | | |
ICICI Bank Ltd. - ADR (India) | | 3,990 | | | 169,655 | | |
Mitsubishi UFJ Financial Group, Inc. (Japan) | | 11,200 | | | 58,900 | | |
Societe Generale - ADR (France)2 | | 8,880 | | | 93,861 | | |
The Sumitomo Trust & Banking Co. Ltd. (Japan) | | 16,800 | | | 101,943 | | |
U.S. Bancorp | | 8,360 | | | 223,797 | | |
Wilmington Trust Corp. | | 18,820 | | | 326,151 | | |
| | | | | | | |
| | | | | 2,531,010 | | |
| | | | | | | |
Consumer Finance - 0.92% | | | | | | | |
American Express Co. | | 161,020 | | | 7,426,243 | | |
Discover Financial Services | | 6,770 | | | 104,664 | | |
| | | | | | | |
| | | | | 7,530,907 | | |
| | | | | | | |
Diversified Financial Services - 0.25% | | | | | | | |
Bank of America Corp. | | 5,910 | | | 105,375 | | |
Deutsche Boerse AG (Germany) | | 7,420 | | | 578,339 | | |
Financiere Marc de Lacharriere S.A. (Fimalac) (France) | | 5,145 | | | 255,551 | | |
ING Groep N.V. (Netherlands)* | | 4,775 | | | 42,845 | | |
JPMorgan Chase & Co. | | 11,140 | | | 474,341 | | |
Moody’s Corp. | | 23,060 | | | 570,043 | | |
| | | | | | | |
| | | | | 2,026,494 | | |
| | | | | | | |
Insurance - 0.51% | | | | | | | |
Allianz SE (Germany) | | 7,970 | | | 918,122 | | |
The Allstate Corp. | | 9,280 | | | 303,178 | | |
Amil Participacoes S.A. (Brazil) | | 34,230 | | | 280,614 | | |
AXA S.A. (France) | | 3,530 | | | 70,970 | | |
Brown & Brown, Inc. | | 17,580 | | | 354,061 | | |
Muenchener Rueckversicherungs AG (MunichRe) (Germany) | | 2,765 | | | 390,971 | | |
Principal Financial Group, Inc. | | 3,770 | | | 110,159 | | |
The Progressive Corp. | | 29,010 | | | 582,811 | | |
Willis Group Holdings plc (United Kingdom) | | 18,215 | | | 627,507 | | |
| | | | |
| | The accompanying notes are an integral part of the financial statements. | | 40 |
Investment Portfolio - April 30, 2010 (unaudited)
| | | | | | | |
| Pro-Blend® Moderate Term Series | | Shares | | Value (Note 2) | | |
| | | |
COMMON STOCKS (continued) | | | | | | | |
| | | |
Financials (continued) | | | | | | | |
Insurance (continued) | | | | | | | |
Zurich Financial Services AG (Switzerland) | | 2,280 | | $ | 508,903 | | |
| | | | | | | |
| | | | | 4,147,296 | | |
| | | | | | | |
Real Estate Investment Trusts (REITS) - 0.94% | | | | | | | |
Acadia Realty Trust | | 6,390 | | | 121,921 | | |
Alexandria Real Estate Equities, Inc. | | 1,510 | | | 106,923 | | |
Alstria Office REIT AG (Germany) | | 22,190 | | | 251,132 | | |
American Campus Communities, Inc. | | 11,670 | | | 328,744 | | |
Apartment Investment & Management Co. - Class A | | 14,110 | | | 316,205 | | |
AvalonBay Communities, Inc. | | 2,370 | | | 246,575 | | |
BioMed Realty Trust, Inc. | | 22,070 | | | 408,516 | | |
Boston Properties, Inc. | | 3,170 | | | 249,986 | | |
Camden Property Trust | | 4,650 | | | 225,200 | | |
Corporate Office Properties Trust | | 20,910 | | | 845,809 | | |
DiamondRock Hospitality Co.* | | 8,050 | | | 88,469 | | |
Digital Realty Trust, Inc. | | 4,350 | | | 255,345 | | |
Douglas Emmett, Inc. | | 11,240 | | | 188,158 | | |
DuPont Fabros Technology, Inc. | | 10,840 | | | 240,323 | | |
Equity Lifestyle Properties, Inc. | | 3,650 | | | 202,612 | | |
Equity One, Inc. | | 6,860 | | | 133,153 | | |
Equity Residential | | 2,970 | | | 134,452 | | |
HCP, Inc. | | 11,160 | | | 358,459 | | |
Health Care REIT, Inc. | | 4,210 | | | 189,155 | | |
Healthcare Realty Trust, Inc. | | 9,030 | | | 217,984 | | |
Home Properties, Inc. | | 6,980 | | | 346,836 | | |
Host Hotels & Resorts, Inc. | | 18,394 | | | 299,086 | | |
LaSalle Hotel Properties | | 5,520 | | | 145,452 | | |
Lexington Realty Trust | | 12,000 | | | 84,960 | | |
Mack-Cali Realty Corp. | | 2,970 | | | 102,049 | | |
National Health Investors, Inc. | | 1,950 | | | 79,209 | | |
National Retail Properties, Inc. | | 8,750 | | | 205,888 | | |
Omega Healthcare Investors, Inc. | | 6,050 | | | 121,121 | | |
Pebblebrook Hotel Trust* | | 7,590 | | | 149,523 | | |
Realty Income Corp. | | 6,860 | | | 224,939 | | |
Simon Property Group, Inc. | | 3,238 | | | 288,247 | | |
Tanger Factory Outlet Centers | | 4,670 | | | 194,272 | | |
UDR, Inc. | | 11,910 | | | 241,892 | | |
Westfield Group (Australia) | | 8,410 | | | 100,540 | | |
| | | | | | | |
| | | | | 7,693,135 | | |
| | | | | | | |
Real Estate Management & Development - 0.01% | | | | | | | |
CB Richard Ellis Group, Inc. - Class A* | | 4,030 | | | 69,800 | | |
| | | | | | | |
| | | | |
| 41 | | The accompanying notes are an integral part of the financial statements. | | |
Investment Portfolio - April 30, 2010 (unaudited)
| | | | | | | |
| Pro-Blend® Moderate Term Series | | Shares | | Value (Note 2) | | |
| | | |
COMMON STOCKS (continued) | | | | | | | |
| | | |
Financials (continued) | | | | | | | |
Thrifts & Mortgage Finance - 0.18% | | | | | | | |
Aareal Bank AG (Germany)* | | 7,450 | | $ | 163,867 | | |
First Niagara Financial Group, Inc. | | 42,410 | | | 589,499 | | |
NewAlliance Bancshares, Inc. | | 27,070 | | | 352,722 | | |
People’s United Financial, Inc. | | 20,770 | | | 322,558 | | |
| | | | | | | |
| | | | | 1,428,646 | | |
| | | | | | | |
Total Financials | | | | | 34,101,986 | | |
| | | | | | | |
Health Care - 9.33% | | | | | | | |
Biotechnology - 1.09% | | | | | | | |
Amgen, Inc.* | | 12,180 | | | 698,645 | | |
Basilea Pharmaceutica AG (Switzerland)* | | 4,810 | | | 354,219 | | |
Celera Corp.* | | 161,950 | | | 1,209,766 | | |
CSL Ltd. (Australia) | | 7,080 | | | 212,191 | | |
Genzyme Corp.* | | 109,690 | | | 5,839,896 | | |
Grifols S.A. (Spain) | | 9,000 | | | 114,438 | | |
Sinovac Biotech Ltd. (China)* | | 76,590 | | | 443,456 | | |
| | | | | | | |
| | | | | 8,872,611 | | |
| | | | | | | |
Health Care Equipment & Supplies - 3.50% | | | | | | | |
Ansell, Ltd. (Australia) | | 88,150 | | | 1,046,482 | | |
Becton, Dickinson and Co. | | 115,880 | | | 8,849,756 | | |
Boston Scientific Corp.* | | 854,440 | | | 5,878,547 | | |
Cochlear Ltd. (Australia) | | 14,650 | | | 1,004,473 | | |
Covidien plc (Ireland) | | 21,040 | | | 1,009,710 | | |
DENTSPLY International, Inc. | | 25,190 | | | 922,962 | | |
DexCom, Inc.* | | 47,900 | | | 524,505 | | |
Gen-Probe, Inc.* | | 20,100 | | | 952,539 | | |
Hologic, Inc.* | | 25,120 | | | 448,894 | | |
Inverness Medical Innovations, Inc.* | | 37,580 | | | 1,494,932 | | |
Mindray Medical International Ltd. - ADR (China) | | 18,620 | | | 711,284 | | |
Nobel Biocare Holding AG (Switzerland) | | 26,740 | | | 592,869 | | |
OraSure Technologies, Inc.* | | 116,460 | | | 738,356 | | |
Shandong Weigao Group Medical Polymer Co. Ltd. - Class H (China) | | 142,000 | | | 666,641 | | |
Sirona Dental Systems, Inc.* | | 18,570 | | | 774,183 | | |
Straumann Holding AG (Switzerland) | | 4,070 | | | 1,009,794 | | |
Teleflex, Inc. | | 10,660 | | | 653,671 | | |
Zoll Medical Corp.* | | 40,970 | | | 1,251,634 | | |
| | | | | | | |
| | | | | 28,531,232 | | |
| | | | | | | |
Health Care Providers & Services - 1.34% | | | | | | | |
Aetna, Inc. | | 11,340 | | | 335,097 | | |
AMN Healthcare Services, Inc.* | | 54,210 | | | 495,479 | | |
Bio-Reference Laboratories, Inc.* | | 22,700 | | | 531,180 | | |
| | | | |
| | The accompanying notes are an integral part of the financial statements. | | 42 |
Investment Portfolio - April 30, 2010 (unaudited)
| | | | | | | |
| Pro-Blend® Moderate Term Series | | Shares | | Value (Note 2) | | |
| | | |
COMMON STOCKS (continued) | | | | | | | |
| | | |
Health Care (continued) | | | | | | | |
Health Care Providers & Services (continued) | | | | | | | |
Bumrungrad Hospital Public Co. Ltd. - NVDR (Thailand) | | 108,540 | | $ | 100,640 | | |
CIGNA Corp. | | 10,920 | | | 350,095 | | |
Diagnosticos da America S.A. (Brazil)* | | 123,740 | | | 1,069,222 | | |
OdontoPrev S.A. (Brazil) | | 8,830 | | | 289,804 | | |
Quest Diagnostics, Inc. | | 76,210 | | | 4,356,163 | | |
Sonic Healthcare Ltd. (Australia) | | 123,500 | | | 1,576,989 | | |
UnitedHealth Group, Inc. | | 11,300 | | | 342,503 | | |
VCA Antech, Inc.* | | 39,230 | | | 1,116,486 | | |
WellPoint, Inc.* | | 6,120 | | | 329,256 | | |
| | | | | | | |
| | | | | 10,892,914 | | |
| | | | | | | |
Health Care Technology - 0.69% | | | | | | | |
Allscripts - Misys Healthcare Solutions, Inc.* | | 22,580 | | | 455,439 | | |
Cerner Corp.* | | 42,149 | | | 3,578,871 | | |
Eclipsys Corp.* | | 76,363 | | | 1,579,187 | | |
| | | | | | | |
| | | | | 5,613,497 | | |
| | | | | | | |
Life Sciences Tools & Services - 1.38% | | | | | | | |
Caliper Life Sciences, Inc.* | | 214,397 | | | 859,732 | | |
ICON plc - ADR (Ireland)* | | 23,180 | | | 676,161 | | |
PerkinElmer, Inc. | | 123,079 | | | 3,083,129 | | |
Thermo Fisher Scientific, Inc.* | | 119,980 | | | 6,632,494 | | |
| | | | | | | |
| | | | | 11,251,516 | | |
| | | | | | | |
Pharmaceuticals - 1.33% | | | | | | | |
AstraZeneca plc (United Kingdom) | | 1,890 | | | 83,544 | | |
AstraZeneca plc - ADR (United Kingdom) | | 2,870 | | | 126,940 | | |
Bayer AG (Germany) | | 7,575 | | | 484,872 | | |
GlaxoSmithKline plc (United Kingdom) | | 12,270 | | | 227,351 | | |
Johnson & Johnson | | 136,680 | | | 8,788,524 | | |
Sanofi - Aventis S.A. (France) | | 1,630 | | | 112,116 | | |
Shire plc (Ireland) | | 13,665 | | | 301,706 | | |
Takeda Pharmaceutical Co. Ltd. (Japan) | | 2,400 | | | 103,476 | | |
UCB S.A. (Belgium) | | 15,790 | | | 612,839 | | |
| | | | | | | |
| | | | | 10,841,368 | | |
| | | | | | | |
Total Health Care | | | | | 76,003,138 | | |
| | | | | | | |
Industrials - 2.87% | | | | | | | |
Aerospace & Defense - 0.05% | | | | | | | |
Empresa Brasileira de Aeronautica S.A. (Embraer) - ADR (Brazil) | | 15,100 | | | 363,608 | | |
Hexcel Corp.* | | 3,500 | | | 56,700 | | |
| | | | | | | |
| | | | | 420,308 | | |
| | | | | | | |
| | | | |
| 43 | | The accompanying notes are an integral part of the financial statements. | | |
Investment Portfolio - April 30, 2010 (unaudited)
| | | | | | | |
| Pro-Blend® Moderate Term Series | | Shares | | Value (Note 2) | | |
| | | |
COMMON STOCKS (continued) | | | | | | | |
| | | |
Industrials (continued) | | | | | | | |
Air Freight & Logistics - 0.94% | | | | | | | |
TNT N.V. (Netherlands) | | 18,999 | | $ | 583,837 | | |
United Parcel Service, Inc. - Class B | | 101,750 | | | 7,034,995 | | |
| | | | | | | |
| | | | | 7,618,832 | | |
| | | | | | | |
Airlines - 1.29% | | | | | | | |
AirTran Holdings, Inc.* | | 61,530 | | | 324,878 | | |
Copa Holdings S.A. - Class A (Panama) | | 2,750 | | | 155,870 | | |
Deutsche Lufthansa AG (Germany)* | | 14,475 | | | 241,873 | | |
Ryanair Holdings plc - ADR (Ireland)* | | 13,340 | | | 375,654 | | |
Singapore Airlines Ltd. (Singapore) | | 12,220 | | | 135,550 | | |
Southwest Airlines Co. | | 704,880 | | | 9,290,319 | | |
| | | | | | | |
| | | | | 10,524,144 | | |
| | | | | | | |
Commercial Services & Supplies - 0.09% | | | | | | | |
Tomra Systems ASA (Norway) | | 151,170 | | | 730,352 | | |
| | | | | | | |
Electrical Equipment - 0.14% | | | | | | | |
ABB Ltd. (Asea Brown Boveri) - ADR (Switzerland)* | | 21,900 | | | 419,604 | | |
Alstom S.A. (France) | | 2,380 | | | 140,951 | | |
Gamesa Corporacion Tecnologica S.A. (Spain) | | 10,820 | | | 133,993 | | |
Nexans S.A. (France) | | 2,330 | | | 184,989 | | |
Schneider Electric S.A. (France) | | 1,880 | | | 215,094 | | |
Yingli Green Energy Holding Co. Ltd. - ADR (China)* | | 5,870 | | | 74,138 | | |
| | | | | | | |
| | | | | 1,168,769 | | |
| | | | | | | |
Industrial Conglomerates - 0.15% | | | | | | | |
Siemens AG (Germany) | | 12,090 | | | 1,196,669 | | |
| | | | | | | |
Machinery - 0.08% | | | | | | | |
FANUC Ltd. (Japan) | | 1,300 | | | 154,586 | | |
Lindsay Corp. | | 2,990 | | | 113,710 | | |
SmartHeat, Inc. (China)* | | 6,120 | | | 51,347 | | |
Titan International, Inc. | | 9,810 | | | 121,742 | | |
Wabtec Corp. | | 4,720 | | | 224,577 | | |
| | | | | | | |
| | | | | 665,962 | | |
| | | | | | | |
Professional Services - 0.05% | | | | | | | |
Adecco S.A. (Switzerland) | | 2,720 | | | 160,498 | | |
Equifax, Inc. | | 6,930 | | | 232,848 | | |
| | | | | | | |
| | | | | 393,346 | | |
| | | | | | | |
Road & Rail - 0.08% | | | | | | | |
All America Latina Logistica S.A. (Brazil) | | 49,200 | | | 440,132 | | |
Kansas City Southern* | | 2,260 | | | 91,643 | | |
| | | | |
| | The accompanying notes are an integral part of the financial statements. | | 44 |
Investment Portfolio - April 30, 2010 (unaudited)
| | | | | | | |
| Pro-Blend® Moderate Term Series | | Shares | | Value (Note 2) | | |
| | | |
COMMON STOCKS (continued) | | | | | | | |
| | | |
Industrials (continued) | | | | | | | |
Road & Rail (continued) | | | | | | | |
RailAmerica, Inc.* | | 9,750 | | $ | 125,678 | | |
| | | | | | | |
| | | | | 657,453 | | |
| | | | | | | |
Total Industrials | | | | | 23,375,835 | | |
| | | | | | | |
Information Technology - 11.89% | | | | | | | |
Communications Equipment - 2.81% | | | | | | | |
Alcatel-Lucent - ADR (France)* | | 146,390 | | | 464,056 | | |
Blue Coat Systems, Inc.* | | 27,000 | | | 878,310 | | |
Cisco Systems, Inc.* | | 502,254 | | | 13,520,678 | | |
Infinera Corp.* | | 75,550 | | | 691,282 | | |
Juniper Networks, Inc.* | | 130,097 | | | 3,696,056 | | |
QUALCOMM, Inc. | | 78,840 | | | 3,054,262 | | |
Riverbed Technology, Inc.* | | 18,370 | | | 569,286 | | |
| | | | | | | |
| | | | | 22,873,930 | | |
| | | | | | | |
Computers & Peripherals - 0.76% | | | | | | | |
Compellent Technologies, Inc.* | | 31,840 | | | 400,229 | | |
EMC Corp.* | | 303,550 | | | 5,770,485 | | |
| | | | | | | |
| | | | | 6,170,714 | | |
| | | | | | | |
Electronic Equipment, Instruments & Components - 0.13% | | | | | | | |
Cogent, Inc.* | | 53,790 | | | 556,727 | | |
Keyence Corp. (Japan) | | 521 | | | 124,738 | | |
LoJack Corp.* | | 86,205 | | | 360,337 | | |
| | | | | | | |
| | | | | 1,041,802 | | |
| | | | | | | |
Internet Software & Services - 1.89% | | | | | | | |
comScore, Inc.* | | 24,250 | | | 440,137 | | |
Google, Inc. - Class A* | | 27,606 | | | 14,505,297 | | |
NetEase.com, Inc. - ADR (China)* | | 3,530 | | | 123,091 | | |
Vocus, Inc.* | | 20,760 | | | 353,958 | | |
| | | | | | | |
| | | | | 15,422,483 | | |
| | | | | | | |
IT Services - 2.07% | | | | | | | |
Accenture plc - Class A (Ireland) | | 13,340 | | | 582,158 | | |
Amdocs Ltd. (Guernsey)* | | 37,300 | | | 1,191,362 | | |
Automatic Data Processing, Inc. | | 144,278 | | | 6,255,894 | | |
Cap Gemini S.A. (France) | | 11,320 | | | 575,073 | | |
Cielo S.A. (Brazil) | | 65,080 | | | 628,617 | | |
Paychex, Inc. | | 13,320 | | | 407,592 | | |
Redecard S.A. (Brazil) | | 37,150 | | | 616,798 | | |
The Western Union Co. | | 362,450 | | | 6,614,712 | | |
| | | | | | | |
| | | | | 16,872,206 | | |
| | | | | | | |
| | | | |
| 45 | | The accompanying notes are an integral part of the financial statements. | | |
Investment Portfolio - April 30, 2010 (unaudited)
| | | | | | | |
| Pro-Blend® Moderate Term Series | | Shares | | Value (Note 2) | | |
| | | |
COMMON STOCKS (continued) | | | | | | | |
| | | |
Information Technology (continued) | | | | | | | |
Semiconductors & Semiconductor Equipment - 0.28% | | | | | | | |
Advantest Corp. (Japan) | | 31,100 | | $ | 811,477 | | |
Hynix Semiconductor, Inc. (South Korea)* | | 5,670 | | | 145,286 | | |
KLA-Tencor Corp. | | 8,440 | | | 287,467 | | |
Sumco Corp. (Japan)* | | 10,000 | | | 223,027 | | |
Taiwan Semiconductor Manufacturing Co. Ltd. - ADR (Taiwan) | | 17,546 | | | 185,812 | | |
Tokyo Electron Ltd. (Japan) | | 9,860 | | | 651,840 | | |
| | | | | | | |
| | | | | 2,304,909 | | |
| | | | | | | |
Software - 3.95% | | | | | | | |
Autodesk, Inc.* | | 258,050 | | | 8,776,280 | | |
Electronic Arts, Inc.* | | 270,090 | | | 5,231,643 | | |
Microsoft Corp. | | 307,690 | | | 9,396,853 | | |
Misys plc (United Kingdom)* | | 59,170 | | | 211,939 | | |
Net 1 UEPS Technologies, Inc. (South Africa)* | | 25,250 | | | 414,100 | | |
SAP AG (Germany) | | 5,410 | | | 260,934 | | |
SAP AG - ADR (Germany) | | 139,530 | | | 6,620,699 | | |
Shanda Interactive Entertainment Ltd. - ADR (China)* | | 11,070 | | | 501,914 | | |
Sonic Solutions, Inc.* | | 22,850 | | | 286,768 | | |
Square Enix Holdings Co. Ltd. (Japan) | | 8,800 | | | 186,052 | | |
UbiSoft Entertainment S.A. (France)* | | 23,960 | | | 307,116 | | |
| | | | | | | |
| | | | | 32,194,298 | | |
| | | | | | | |
Total Information Technology | | | | | 96,880,342 | | |
| | | | | | | |
Materials - 1.07% | | | | | | | |
Chemicals - 1.06% | | | | | | | |
Arkema S.A. (France) | | 20 | | | 843 | | |
Calgon Carbon Corp.* | | 17,755 | | | 275,202 | | |
Johnson Matthey plc (United Kingdom) | | 6,570 | | | 175,215 | | |
Monsanto Co. | | 128,530 | | | 8,105,102 | | |
The Scotts Miracle-Gro Co. - Class A | | 2,470 | | | 119,671 | | |
| | | | | | | |
| | | | | 8,676,033 | | |
| | | | | | | |
Paper & Forest Products - 0.01% | | | | | | | |
Norbord, Inc. (Canada)* | | 2,580 | | | 50,518 | | |
| | | | | | | |
Total Materials | | | | | 8,726,551 | | |
| | | | | | | |
Telecommunication Services - 0.34% | | | | | | | |
Diversified Telecommunication Services - 0.06% | | | | | | | |
France Telecom S.A. (France) | | 10,940 | | | 239,539 | | |
Swisscom AG - ADR (Switzerland)2 | | 7,515 | | | 253,406 | | |
| | | | | | | |
| | | | | 492,945 | | |
| | | | | | | |
Wireless Telecommunication Services - 0.28% | | | | | | | |
American Tower Corp. - Class A* | | 9,700 | | | 395,857 | | |
| | | | |
| | The accompanying notes are an integral part of the financial statements. | | 46 |
Investment Portfolio - April 30, 2010 (unaudited)
| | | | | | | |
| Pro-Blend® Moderate Term Series | | Shares | | Value (Note 2) | | |
| | | |
COMMON STOCKS (continued) | | | | | | | |
| | | |
Telecommunication Services (continued) | | | | | | | |
Wireless Telecommunication Services (continued) | | | | | | | |
Crown Castle International Corp.* | | 19,240 | | $ | 728,234 | | |
Hutchison Telecommunications International Ltd. (Hong Kong)* | | 176,520 | | | 49,336 | | |
SBA Communications Corp. - Class A* | | 19,900 | | | 703,863 | | |
SK Telecom Co. Ltd. - ADR (South Korea) | | 23,810 | | | 440,723 | | |
| | | | | | | |
| | | | | 2,318,013 | | |
| | | | | | | |
Total Telecommunication Services | | | | | 2,810,958 | | |
| | | | | | | |
Utilities - 0.13% | | | | | | | |
Electric Utilities - 0.05% | | | | | | | |
E.ON AG (Germany) | | 11,440 | | | 422,835 | | |
| | | | | | | |
Independent Power Producers & Energy Traders - 0.02% | | | | | | | |
Mirant Corp.* | | 6,460 | | | 75,324 | | |
RRI Energy, Inc.* | | 18,690 | | | 76,068 | | |
| | | | | | | |
| | | | | 151,392 | | |
| | | | | | | |
Multi-Utilities - 0.04% | | | | | | | |
GDF Suez (France) | | 3,185 | | | 113,629 | | |
National Grid plc (United Kingdom) | | 18,220 | | | 175,350 | | |
| | | | | | | |
| | | | | 288,979 | | |
| | | | | | | |
Water Utilities - 0.02% | | | | | | | |
Cia de Saneamento de Minas Gerais - Copasa MG (Brazil) | | 11,730 | | | 170,054 | | |
| | | | | | | |
Total Utilities | | | | | 1,033,260 | | |
| | | | | | | |
TOTAL COMMON STOCKS
(Identified Cost $316,677,941) | | | | | 352,404,202 | | |
| | | | | | | |
| | | |
PREFERRED STOCKS - 0.30% | | | | | | | |
| | | |
Consumer Staples - 0.02% | | | | | | | |
Household Products - 0.02% | | | | | | | |
Henkel AG & Co. KGaA (Germany) | | 3,040 | | | 162,815 | | |
| | | | | | | |
Financials - 0.28% | | | | | | | |
Commercial Banks - 0.12% | | | | | | | |
PNC Financial Services Group, Inc., Series K3 | | 350,000 | | | 371,494 | | |
Wells Fargo & Co., Series K | | 610,000 | | | 643,550 | | |
| | | | | | | |
| | | | | 1,015,044 | | |
| | | | | | | |
Diversified Financial Services - 0.16% | | | | | | | |
Bank of America Corp., Series K | | 650,000 | | | 654,336 | | |
| | | | |
| 47 | | The accompanying notes are an integral part of the financial statements. | | |
Investment Portfolio - April 30, 2010 (unaudited)
| | | | | | | |
| Pro-Blend® Moderate Term Series | | Shares/ Principal Amount | | Value (Note 2) | | |
| | | |
PREFERRED STOCKS (continued) | | | | | | | |
| | | |
Financials (continued) | | | | | | | |
Diversified Financial Services (continued) | | | | | | | |
JPMorgan Chase & Co., Series 1 | | 580,000 | | $ | 609,145 | | |
| | | | | | | |
| | | | | 1,263,481 | | |
| | | | | | | |
Total Financials | | | | | 2,278,525 | | |
| | | | | | | |
TOTAL PREFERRED STOCKS
(Identified Cost $2,219,961) | | | | | 2,441,340 | | |
| | | | | | | |
| | | |
WARRANTS - 0.00%** | | | | | | | |
| | | |
Health Care - 0.00%** | | | | | | | |
Life Sciences Tools & Services - 0.00%** | | | | | | | |
Caliper Life Sciences, Inc., 8/10/2011* | | | | | | | |
(Identified Cost $5,086) | | 10,455 | | | 2,667 | | |
| | | | | | | |
| | | |
CORPORATE BONDS - 21.91% | | | | | | | |
| | | |
Convertible Corporate Bonds - 0.26% | | | | | | | |
Consumer Discretionary - 0.03% | | | | | | | |
Hotels, Restaurants & Leisure - 0.03% | | | | | | | |
Carnival Corp., 2.00%, 4/15/2021 | | $ 175,000 | | | 197,312 | | |
| | | | | | | |
Energy - 0.07% | | | | | | | |
Energy Equipment & Services - 0.07% | | | | | | | |
Schlumberger Ltd., Series B, 2.125%, 6/1/2023 | | 325,000 | | | 585,000 | | |
| | | | | | | |
Health Care - 0.06% | | | | | | | |
Biotechnology - 0.05% | | | | | | | |
Amgen, Inc., 0.375%, 2/1/2013 | | 400,000 | | | 402,500 | | |
| | | | | | | |
Health Care Equipment & Supplies - 0.01% | | | | | | | |
Medtronic, Inc., 1.625%, 4/15/2013 | | 90,000 | | | 95,288 | | |
| | | | | | | |
Total Health Care | | | | | 497,788 | | |
| | | | | | | |
Industrials - 0.01% | | | | | | | |
Airlines - 0.01% | | | | | | | |
AirTran Holdings, Inc., 5.25%, 11/1/2016 | | 85,000 | | | 94,988 | | |
| | | | | | | |
Information Technology - 0.09% | | | | | | | |
Computers & Peripherals - 0.03% | | | | | | | |
EMC Corp., 1.75%, 12/1/2013 | | 215,000 | | | 280,037 | | |
| | | | | | | |
Semiconductors & Semiconductor Equipment - 0.06% | | | | | | | |
Advanced Micro Devices, Inc., 6.00%, 5/1/2015 | | 465,000 | | | 448,144 | | |
| | | | | | | |
Total Information Technology | | | | | 728,181 | | |
| | | | | | | |
Total Convertible Corporate Bonds
(Identified Cost $1,959,107) | | | | | 2,103,269 | | |
| | | | | | | |
| | | | |
| | The accompanying notes are an integral part of the financial statements. | | 48 |
Investment Portfolio - April 30, 2010 (unaudited)
| | | | | | | |
| Pro-Blend® Moderate Term Series | | Principal Amount | | Value (Note 2) | | |
| | | |
CORPORATE BONDS (continued) | | | | | | | |
| | | |
Non-Convertible Corporate Bonds - 21.65% | | | | | | | |
Consumer Discretionary - 2.36% | | | | | | | |
Diversified Consumer Services - 0.06% | | | | | | | |
Affinion Group, Inc., 11.50%, 10/15/2015 | | $ 480,000 | | $ | 506,400 | | |
| | | | | | | |
Hotels, Restaurants & Leisure - 0.66% | | | | | | | |
International Game Technology, 7.50%, 6/15/2019 | | 1,715,000 | | | 1,996,879 | | |
McDonald’s Corp., 5.80%, 10/15/2017 | | 325,000 | | | 367,810 | | |
McDonald’s Corp., 6.30%, 10/15/2037 | | 445,000 | | | 498,518 | | |
Scientific Games Corp.4 , 7.875%, 6/15/2016 | | 250,000 | | | 252,812 | | |
Scientific Games International, Inc.4 , 9.25%, 6/15/2019 | | 650,000 | | | 700,375 | | |
Wendy’s - Arby’s Restaurants LLC, 10.00%, 7/15/2016 | | 590,000 | | | 634,250 | | |
Wyndham Worldwide Corp., 9.875%, 5/1/2014 | | 230,000 | | | 262,161 | | |
Wyndham Worldwide Corp., 6.00%, 12/1/2016 | | 420,000 | | | 418,246 | | |
Yonkers Racing Corp.4 , 11.375%, 7/15/2016 | | 215,000 | | | 235,425 | | |
| | | | | | | |
| | | | | 5,366,476 | | |
| | | | | | | |
Household Durables - 0.21% | | | | | | | |
Fortune Brands, Inc., 6.375%, 6/15/2014 | | 465,000 | | | 513,132 | | |
Fortune Brands, Inc., 5.375%, 1/15/2016 | | 1,100,000 | | | 1,158,435 | | |
| | | | | | | |
| | | | | 1,671,567 | | |
| | | | | | | |
Media - 0.93% | | | | | | | |
Cablevision Systems Corp.4 , 8.625%, 9/15/2017 | | 545,000 | | | 574,975 | | |
Columbus International, Inc. (Barbados)4 , 11.50%, 11/20/2014 | | 210,000 | | | 230,748 | | |
Comcast Corp., 6.50%, 11/15/2035 | | 820,000 | | | 864,455 | | |
Comcast Corp., 6.95%, 8/15/2037 | | 950,000 | | | 1,058,052 | | |
DIRECTV Holdings LLC4 , 5.20%, 3/15/2020 | | 1,125,000 | | | 1,134,342 | | |
MDC Partners, Inc. (Canada)4 , 11.00%, 11/1/2016 | | 95,000 | | | 104,025 | | |
Sirius XM Radio, Inc.4 , 9.75%, 9/1/2015 | | 110,000 | | | 120,175 | | |
Time Warner, Inc., 7.625%, 4/15/2031 | | 730,000 | | | 848,288 | | |
Unitymedia Hessen GmbH & Co. KG (Germany)4 , 8.125%, 12/1/2017 | | 260,000 | | | 265,200 | | |
Unitymedia Hessen GmbH & Co. KG (Germany)4 , 8.125%, 12/1/2017 | | 140,000 | | | 191,995 | | |
UPC Holding B.V. (Netherlands)4 , 9.875%, 4/15/2018 | | 400,000 | | | 422,000 | | |
Virgin Media Finance plc (United Kingdom), 8.375%, 10/15/2019 | | 115,000 | | | 120,462 | | |
Virgin Media Finance plc, Series 1 (United Kingdom), 9.50%, 8/15/2016 | | 320,000 | | | 351,200 | | |
The Walt Disney Co., Series B, 7.00%, 3/1/2032 | | 615,000 | | | 745,876 | | |
WMG Acquisition Corp.4 , 9.50%, 6/15/2016 | | 370,000 | | | 399,600 | | |
XM Satellite Radio, Inc.4 , 11.25%, 6/15/2013 | | 165,000 | | | 181,088 | | |
| | | | | | | |
| | | | | 7,612,481 | | |
| | | | | | | |
Multiline Retail - 0.09% | | | | | | | |
Target Corp., 6.00%, 1/15/2018 | | 615,000 | | | 703,966 | | |
| | | | | | | |
Specialty Retail - 0.31% | | | | | | | |
The Home Depot, Inc., 5.40%, 3/1/2016 | | 1,070,000 | | | 1,173,639 | | |
Lowe’s Companies, Inc., 6.10%, 9/15/2017 | | 620,000 | | | 710,065 | | |
| | | | |
| 49 | | The accompanying notes are an integral part of the financial statements. | | |
Investment Portfolio - April 30, 2010 (unaudited)
| | | | | | | |
| Pro-Blend® Moderate Term Series | | Principal Amount | | Value (Note 2) | | |
| | | |
CORPORATE BONDS (continued) | | | | | | | |
| | | |
Non-Convertible Corporate Bonds (continued) | | | | | | | |
Consumer Discretionary (continued) | | | | | | | |
Specialty Retail (continued) | | | | | | | |
Toys R Us Property Co. LLC4 , 8.50%, 12/1/2017 | | $ 595,000 | | $ | 629,213 | | |
| | | | | | | |
| | | | | 2,512,917 | | |
| | | | | | | |
Textiles, Apparel & Luxury Goods - 0.10% | | | | | | | |
Levi Strauss & Co., 8.625%, 4/1/2013 | | 100,000 | | | 135,808 | | |
VF Corp., 5.95%, 11/1/2017 | | 640,000 | | | 710,083 | | |
| | | | | | | |
| | | | | 845,891 | | |
| | | | | | | |
Total Consumer Discretionary | | | | | 19,219,698 | | |
| | | | | | | |
Consumer Staples - 0.83% | | | | | | | |
Beverages - 0.38% | | | | | | | |
CEDC Finance Corp. International, Inc.4 , 9.125%, 12/1/2016 | | 605,000 | | | 641,300 | | |
The Coca-Cola Co., 5.35%, 11/15/2017 | | 330,000 | | | 367,592 | | |
Constellation Brands, Inc., 8.375%, 12/15/2014 | | 610,000 | | | 654,225 | | |
PepsiCo, Inc., 5.00%, 6/1/2018 | | 315,000 | | | 337,512 | | |
PepsiCo, Inc., 7.90%, 11/1/2018 | | 870,000 | | | 1,097,417 | | |
| | | | | | | |
| | | | | 3,098,046 | | |
| | | | | | | |
Food & Staples Retailing - 0.07% | | | | | | | |
Ingles Markets, Inc., 8.875%, 5/15/2017 | | 215,000 | | | 227,363 | | |
The Kroger Co., 6.75%, 4/15/2012 | | 315,000 | | | 343,838 | | |
| | | | | | | |
| | | | | 571,201 | | |
| | | | | | | |
Food Products - 0.25% | | | | | | | |
General Mills, Inc., 5.65%, 2/15/2019 | | 860,000 | | | 940,133 | | |
Kraft Foods, Inc., 6.125%, 2/1/2018 | | 950,000 | | | 1,049,402 | | |
| | | | | | | |
| | | | | 1,989,535 | | |
| | | | | | | |
Personal Products - 0.13% | | | | | | | |
Revlon Consumer Products Corp.4 , 9.75%, 11/15/2015 | | 1,035,000 | | | 1,063,463 | | |
| | | | | | | |
Total Consumer Staples | | | | | 6,722,245 | | |
| | | | | | | |
Energy - 1.64% | | | | | | | |
Energy Equipment & Services - 0.71% | | | | | | | |
Baker Hughes, Inc., 7.50%, 11/15/2018 | | 610,000 | | | 742,758 | | |
Cie Generale de Geophysique - Veritas (France), 7.75%, 5/15/2017 | | 665,000 | | | 671,650 | | |
Complete Production Services, Inc., 8.00%, 12/15/2016 | | 430,000 | | | 439,675 | | |
Hornbeck Offshore Services, Inc., Series B, 6.125%, 12/1/2014 | | 710,000 | | | 705,563 | | |
Key Energy Services, Inc., 8.375%, 12/1/2014 | | 410,000 | | | 418,200 | | |
Thermon Industries, Inc.4 , 9.50%, 5/1/2017 | | 465,000 | | | 474,300 | | |
Weatherford International Ltd. (Switzerland), 9.625%, 3/1/2019 | | 1,800,000 | | | 2,327,929 | | |
| | | | | | | |
| | | | | 5,780,075 | | |
| | | | | | | |
| | | | |
| | The accompanying notes are an integral part of the financial statements. | | 50 |
Investment Portfolio - April 30, 2010 (unaudited)
| | | | | | | |
| Pro-Blend® Moderate Term Series | | Principal Amount | | Value (Note 2) | | |
| | | |
CORPORATE BONDS (continued) | | | | | | | |
| | | |
Non-Convertible Corporate Bonds (continued) | | | | | | | |
Energy (continued) | | | | | | | |
Oil, Gas & Consumable Fuels - 0.93% | | | | | | | |
Alon Refining Krotz Springs, Inc., 13.50%, 10/15/2014 | | $ 175,000 | | $ | 171,500 | | |
Anadarko Petroleum Corp., 5.95%, 9/15/2016 | | 720,000 | | | 799,246 | | |
Anadarko Petroleum Corp., 8.70%, 3/15/2019 | | 425,000 | | | 534,333 | | |
Apache Corp., 6.90%, 9/15/2018 | | 625,000 | | | 744,852 | | |
Aquilex Holdings LLC - Aquilex Finance Corp.4 , 11.125%, 12/15/2016 | | 190,000 | | | 206,150 | | |
Arch Coal, Inc.4 , 8.75%, 8/1/2016 | | 125,000 | | | 133,125 | | |
Arch Western Finance LLC, 6.75%, 7/1/2013 | | 545,000 | | | 549,088 | | |
Chesapeake Energy Corp., 9.50%, 2/15/2015 | | 160,000 | | | 175,400 | | |
Chesapeake Energy Corp., 6.875%, 1/15/2016 | | 435,000 | | | 433,912 | | |
Coffeyville Resources LLC - Coffeyville Finance, Inc.4 , 9.00%, 4/1/2015 | | 230,000 | | | 234,600 | | |
Coffeyville Resources LLC - Coffeyville Finance, Inc.4 , 10.875%, 4/1/2017 | | 215,000 | | | 219,300 | | |
Crosstex Energy - Crosstex Energy Finance Corp.4 , 8.875%, 2/15/2018 | | 425,000 | | | 442,000 | | |
Gibson Energy ULC - GEP Midstream Finance Corp. (Canada)4 , 11.75%, 5/27/2014 | | 105,000 | | | 116,550 | | |
Gibson Energy ULC - GEP Midstream Finance Corp. (Canada)4 , 10.00%, 1/15/2018 | | 310,000 | | | 310,000 | | |
Martin Midstream Partners LP - Martin Midstream Finance Corp.4 , 8.875%, 4/1/2018 | | 460,000 | | | 466,900 | | |
Niska Gas Storage US LLC - Niska Gas Storage Canada ULC4 , 8.875%, 3/15/2018 | | 320,000 | | | 334,400 | | |
Plains Exploration & Production Co., 8.625%, 10/15/2019 | | 460,000 | | | 486,450 | | |
Targa Resources Partners LP - Targa Resources Partners Finance Corp., 8.25%, 7/1/2016 | | 465,000 | | | 474,300 | | |
Tesoro Corp., 9.75%, 6/1/2019 | | 655,000 | | | 704,125 | | |
Whiting Petroleum Corp., 7.00%, 2/1/2014 | | 85,000 | | | 87,762 | | |
| | | | | | | |
| | | | | 7,623,993 | | |
| | | | | | | |
Total Energy | | | | | 13,404,068 | | |
| | | | | | | |
Financials - 9.02% | | | | | | | |
Capital Markets - 1.61% | | | | | | | |
Goldman Sachs Capital I, 6.345%, 2/15/2034 | | 740,000 | | | 662,213 | | |
Goldman Sachs Capital II5 , 5.793%, 12/29/2049 | | 770,000 | | | 609,263 | | |
The Goldman Sachs Group, Inc.6 , 3.25%, 6/15/2012 | | 8,228,000 | | | 8,588,444 | | |
The Goldman Sachs Group, Inc., 6.15%, 4/1/2018 | | 890,000 | | | 921,954 | | |
Merrill Lynch & Co., Inc., 6.875%, 4/25/2018 | | 1,250,000 | | | 1,346,202 | | |
Merrill Lynch & Co., Inc., 6.11%, 1/29/2037 | | 370,000 | | | 342,212 | | |
Morgan Stanley, 5.55%, 4/27/2017 | | 687,000 | | | 690,306 | | |
| | | | | | | |
| | | | | 13,160,594 | | |
| | | | | | | |
Commercial Banks - 2.34% | | | | | | | |
Household Finance Co., 6.375%, 11/27/2012 | | 585,000 | | | 642,447 | | |
| | | | |
| 51 | | The accompanying notes are an integral part of the financial statements. | | |
Investment Portfolio - April 30, 2010 (unaudited)
| | | | | | | |
| Pro-Blend® Moderate Term Series | | Principal Amount | | Value (Note 2) | | |
| | | |
CORPORATE BONDS (continued) | | | | | | | |
| | | |
Non-Convertible Corporate Bonds (continued) | | | | | | | |
Financials (continued) | | | | | | | |
Commercial Banks (continued) | | | | | | | |
HSBC Finance Corp., 7.00%, 5/15/2012 | | $ 575,000 | | $ | 628,715 | | |
KeyBank National Association6 , 3.20%, 6/15/2012 | | 3,506,000 | | | 3,655,941 | | |
KeyBank National Association, 5.45%, 3/3/2016 | | 1,090,000 | | | 1,110,140 | | |
Manufacturers & Traders Trust Co., 6.625%, 12/4/2017 | | 1,900,000 | | | 2,066,729 | | |
National City Corp., 6.875%, 5/15/2019 | | 820,000 | | | 917,141 | | |
PNC Bank National Association3 , 5.25%, 1/15/2017 | | 545,000 | | | 564,418 | | |
PNC Funding Corp.3,6 , 2.30%, 6/22/2012 | | 3,600,000 | | | 3,688,283 | | |
U.S. Bank National Association, 6.375%, 8/1/2011 | | 315,000 | | | 334,809 | | |
U.S. Bank National Association, 6.30%, 2/4/2014 | | 285,000 | | | 320,522 | | |
USB Capital XIII Trust, 6.625%, 12/15/2039 | | 535,000 | | | 562,611 | | |
Wachovia Corp., 5.25%, 8/1/2014 | | 920,000 | | | 976,016 | | |
Wells Fargo & Co.6 , 3.00%, 12/9/2011 | | 3,458,000 | | | 3,575,081 | | |
| | | | | | | |
| | | | | 19,042,853 | | |
| | | | | | | |
Consumer Finance - 0.46% | | | | | | | |
American Express Co., 8.125%, 5/20/2019 | | 2,165,000 | | | 2,651,672 | | |
American Express Co.5 , 6.80%, 9/1/2066 | | 670,000 | | | 659,950 | | |
Credit Acceptance Corp.4 , 9.125%, 2/1/2017 | | 395,000 | | | 412,775 | | |
| | | | | | | |
| | | | | 3,724,397 | | |
| | | | | | | |
Diversified Financial Services - 3.58% | | | | | | | |
Bank of America Corp.6 , 3.125%, 6/15/2012 | | 6,028,000 | | | 6,266,118 | | |
Bank of America Corp., 5.75%, 8/15/2016 | | 980,000 | | | 1,005,548 | | |
Bank of America Corp., 7.625%, 6/1/2019 | | 870,000 | | | 993,121 | | |
Citigroup Funding, Inc.6 , 1.875%, 10/22/2012 | | 11,088,000 | | | 11,206,531 | | |
Citigroup, Inc.6 , 2.875%, 12/9/2011 | | 3,506,000 | | | 3,616,649 | | |
Citigroup, Inc., 8.50%, 5/22/2019 | | 1,050,000 | | | 1,239,554 | | |
JPMorgan Chase & Co.6 , 3.125%, 12/1/2011 | | 3,510,000 | | | 3,633,552 | | |
JPMorgan Chase & Co., 6.30%, 4/23/2019 | | 1,130,000 | | | 1,254,048 | | |
| | | | | | | |
| | | | | 29,215,121 | | |
| | | | | | | |
Insurance - 0.14% | | | | | | | |
American International Group, Inc., 4.25%, 5/15/2013 | | 125,000 | | | 122,083 | | |
Fidelity National Financial, Inc., 6.60%, 5/15/2017 | | 525,000 | | | 525,089 | | |
Hartford Financial Services Group, Inc.5 , 8.125%, 6/15/2038 | | 475,000 | | | 489,250 | | |
| | | | | | | |
| | | | | 1,136,422 | | |
| | | | | | | |
Real Estate Investment Trusts (REITS) - 0.89% | | | | | | | |
AvalonBay Communities, Inc., 6.10%, 3/15/2020 | | 670,000 | | | 726,096 | | |
Boston Properties LP, 5.875%, 10/15/2019 | | 1,030,000 | | | 1,092,270 | | |
Camden Property Trust, 5.70%, 5/15/2017 | | 705,000 | | | 701,763 | | |
DuPont Fabros Technology LP4 , 8.50%, 12/15/2017 | | 790,000 | | | 819,625 | | |
Felcor Lodging LP, 10.00%, 10/1/2014 | | 450,000 | | | 470,250 | | |
| | | | |
| | The accompanying notes are an integral part of the financial statements. | | 52 |
Investment Portfolio - April 30, 2010 (unaudited)
| | | | | | | |
| Pro-Blend® Moderate Term Series | | Principal Amount | | Value (Note 2) | | |
| | | |
CORPORATE BONDS (continued) | | | | | | | |
| | | |
Non-Convertible Corporate Bonds (continued) | | | | | | | |
Financials (continued) | | | | | | | |
Real Estate Investment Trusts (REITS) (continued) | | | | | | | |
HCP, Inc., 6.70%, 1/30/2018 | | $ 1,010,000 | | $ | 1,055,371 | | |
Health Care REIT, Inc., 6.20%, 6/1/2016 | | 510,000 | | | 547,960 | | |
Host Hotels & Resorts LP, 6.875%, 11/1/2014 | | 325,000 | | | 330,281 | | |
Omega Healthcare Investors, Inc.4 , 7.50%, 2/15/2020 | | 425,000 | | | 436,688 | | |
Simon Property Group LP, 10.35%, 4/1/2019 | | 820,000 | | | 1,062,582 | | |
| | | | | | | |
| | | | | 7,242,886 | | |
| | | | | | | |
Total Financials | | | | | 73,522,273 | | |
| | | | | | | |
Health Care - 1.01% | | | | | | | |
Biotechnology - 0.03% | | | | | | | |
Talecris Biotherapeutics Holdings Corp.4 , 7.75%, 11/15/2016 | | 210,000 | | | 212,100 | | |
| | | | | | | |
Health Care Equipment & Supplies - 0.28% | | | | | | | |
Becton, Dickinson and Co., 6.00%, 5/15/2039 | | 880,000 | | | 956,938 | | |
Fresenius Medical Care Capital Trust IV, 7.875%, 6/15/2011 | | 165,000 | | | 173,250 | | |
Fresenius US Finance II, Inc.4 , 9.00%, 7/15/2015 | | 235,000 | | | 264,375 | | |
Inverness Medical Innovations, Inc., 7.875%, 2/1/2016 | | 560,000 | | | 551,600 | | |
Inverness Medical Innovations, Inc., 9.00%, 5/15/2016 | | 355,000 | | | 362,100 | | |
| | | | | | | |
| | | | | 2,308,263 | | |
| | | | | | | |
Health Care Providers & Services - 0.19% | | | | | | | |
BioScrip, Inc.4 , 10.25%, 10/1/2015 | | 425,000 | | | 435,625 | | |
HCA, Inc.4 , 7.875%, 2/15/2020 | | 420,000 | | | 452,025 | | |
Health Management Associates, Inc., 6.125%, 4/15/2016 | | 690,000 | | | 666,713 | | |
| | | | | | | |
| | | | | 1,554,363 | | |
| | | | | | | |
Life Sciences Tools & Services - 0.06% | | | | | | | |
PharmaNet Development Group, Inc.4 , 10.875%, 4/15/2017 | | 455,000 | | | 465,806 | | |
| | | | | | | |
Pharmaceuticals - 0.45% | | | | | | | |
Abbott Laboratories, 5.125%, 4/1/2019 | | 980,000 | | | 1,055,034 | | |
Johnson & Johnson, 5.95%, 8/15/2037 | | 440,000 | | | 489,846 | | |
Novartis Securities Investment Ltd. (Bermuda), 5.125%, 2/10/2019 | | 1,140,000 | | | 1,225,142 | | |
Valeant Pharmaceuticals International4 , 7.625%, 3/15/2020 | | 470,000 | | | 478,225 | | |
Wyeth, 6.50%, 2/1/2034 | | 365,000 | | | 417,256 | | |
| | | | | | | |
| | | | | 3,665,503 | | |
| | | | | | | |
Total Health Care | | | | | 8,206,035 | | |
| | | | | | | |
Industrials - 3.84% | | | | | | | |
Aerospace & Defense - 0.22% | | | | | | | |
The Boeing Co., 6.00%, 3/15/2019 | | 810,000 | | | 909,891 | | |
GeoEye, Inc.4 , 9.625%, 10/1/2015 | | 170,000 | | | 177,012 | | |
| | | | |
| 53 | | The accompanying notes are an integral part of the financial statements. | | |
Investment Portfolio - April 30, 2010 (unaudited)
| | | | | | | | |
| Pro-Blend® Moderate Term Series | | Principal Amount | | Value (Note 2) | | |
| | | |
CORPORATE BONDS (continued) | | | | | | | | |
| | | |
Non-Convertible Corporate Bonds (continued) | | | | | | | | |
Industrials (continued) | | | | | | | | |
Aerospace & Defense (continued) | | | | | | | | |
Honeywell International, Inc., 5.30%, 3/1/2018 | | $ | 680,000 | | $ | 735,219 | | |
| | | | | | | | |
| | | | | | 1,822,122 | | |
| | | | | | | | |
| | | |
Air Freight & Logistics - 0.18% | | | | | | | | |
FedEx Corp., 8.00%, 1/15/2019 | | | 570,000 | | | 711,717 | | |
United Parcel Service, Inc., 6.20%, 1/15/2038 | | | 660,000 | | | 742,566 | | |
| | | | | | | | |
| | | | | | 1,454,283 | | |
| | | | | | | | |
| | | |
Airlines - 0.38% | | | | | | | | |
AirTran Airways, Inc.7,8 , 10.41%, 4/1/2017 | | | 307,979 | | | 297,970 | | |
Delta Air Lines, Inc.4 , 9.50%, 9/15/2014 | | | 550,000 | | | 582,313 | | |
Southwest Airlines Co., 5.25%, 10/1/2014 | | | 1,030,000 | | | 1,075,571 | | |
Southwest Airlines Co., 5.75%, 12/15/2016 | | | 1,120,000 | | | 1,157,568 | | |
| | | | | | | | |
| | | | | | 3,113,422 | | |
| | | | | | | | |
| | | |
Building Products - 0.08% | | | | | | | | |
Building Materials Corp. of America4 , 7.50%, 3/15/2020 | | | 215,000 | | | 214,463 | | |
Owens Corning, 9.00%, 6/15/2019 | | | 240,000 | | | 289,758 | | |
USG Corp.4 , 9.75%, 8/1/2014 | | | 125,000 | | | 135,000 | | |
| | | | | | | | |
| | | | | | 639,221 | | |
| | | | | | | | |
Commercial Services & Supplies - 0.43% | | | | | | | | |
ACCO Brands Corp.4 , 10.625%, 3/15/2015 | | | 180,000 | | | 199,350 | | |
Clean Harbors, Inc., 7.625%, 8/15/2016 | | | 475,000 | | | 494,594 | | |
Corrections Corp. of America, 6.25%, 3/15/2013 | | | 165,000 | | | 167,475 | | |
Corrections Corp. of America, 7.75%, 6/1/2017 | | | 230,000 | | | 243,800 | | |
Garda World Security Corp. (Canada)4 , 9.75%, 3/15/2017 | | | 430,000 | | | 445,587 | | |
Waste Management, Inc., 7.375%, 3/11/2019 | | | 1,665,000 | | | 1,976,335 | | |
| | | | | | | | |
| | | | | | 3,527,141 | | |
| | | | | | | | |
| | | |
Industrial Conglomerates - 1.91% | | | | | | | | |
General Electric Capital Corp.6 , 3.00%, 12/9/2011 | | | 3,518,000 | | | 3,635,973 | | |
General Electric Capital Corp.6 , 2.125%, 12/21/2012 | | | 8,000,000 | | | 8,140,480 | | |
General Electric Capital Corp., 5.625%, 5/1/2018 | | | 335,000 | | | 354,966 | | |
General Electric Capital Corp.5 , 6.375%, 11/15/2067 | | | 690,000 | | | 660,675 | | |
General Electric Capital Corp., Series A, 6.75%, 3/15/2032 | | | 970,000 | | | 1,057,856 | | |
General Electric Co., 5.25%, 12/6/2017 | | | 550,000 | | | 584,980 | | |
Textron, Inc., 7.25%, 10/1/2019 | | | 1,000,000 | | | 1,099,581 | | |
| | | | | | | | |
| | | | | | 15,534,511 | | |
| | | | | | | | |
| | | |
Machinery - 0.28% | | | | | | | | |
Caterpillar Financial Services Corp., 7.05%, 10/1/2018 | | | 595,000 | | | 700,056 | | |
Caterpillar Financial Services Corp., 7.15%, 2/15/2019 | | | 295,000 | | | 352,441 | | |
| | | | |
| | The accompanying notes are an integral part of the financial statements. | | 54 |
Investment Portfolio - April 30, 2010 (unaudited)
| | | | | | | | |
| Pro-Blend® Moderate Term Series | | Principal Amount | | Value (Note 2) | | |
| | | |
CORPORATE BONDS (continued) | | | | | | | | |
| | | |
Non-Convertible Corporate Bonds (continued) | | | | | | | | |
Industrials (continued) | | | | | | | | |
Machinery (continued) | | | | | | | | |
John Deere Capital | | $ | 120,000 | | $ | 132,307 | | |
John Deere Capital Corp., 5.75%, 9/10/2018 | | | 1,000,000 | | | 1,116,943 | | |
| | | | | | | | |
| | | | | | 2,301,747 | | |
| | | | | | | | |
| | | |
Marine - 0.04% | | | | | | | | |
Navios Maritime Holdings, Inc. - Navios Maritime Finance US, Inc. (Marshall Island)4 , 8.875%, 11/1/2017 | | | 140,000 | | | 146,300 | | |
United Maritime Group LLC - United Maritime Group Finance Corp.4 , 11.75%, 6/15/2015 | | | 190,000 | | | 197,600 | | |
| | | | | | | | |
| | | | | | 343,900 | | |
| | | | | | | | |
| | | |
Road & Rail - 0.32% | | | | | | | | |
CSX Corp., 6.00%, 10/1/2036 | | | 1,190,000 | | | 1,218,635 | | |
RailAmerica, Inc., 9.25%, 7/1/2017 | | | 349,000 | | | 376,048 | | |
Union Pacific Corp., 5.65%, 5/1/2017 | | | 365,000 | | | 394,889 | | |
Union Pacific Corp., 7.875%, 1/15/2019 | | | 495,000 | | | 605,652 | | |
| | | | | | | | |
| | | | | | 2,595,224 | | |
| | | | | | | | |
Total Industrials | | | | | | 31,331,571 | | |
| | | | | | | | |
Information Technology - 0.69% | | | | | | | | |
Communications Equipment - 0.32% | | | | | | | | |
Alcatel-Lucent USA, Inc., 6.45%, 3/15/2029 | | | 530,000 | | | 388,225 | | |
Cisco Systems, Inc., 5.90%, 2/15/2039 | | | 960,000 | | | 1,006,496 | | |
Hughes Network Systems LLC - HNS Finance Corp., 9.50%, 4/15/2014 | | | 445,000 | | | 458,350 | | |
Nokia Corp. (Finland), 5.375%, 5/15/2019 | | | 705,000 | | | 747,658 | | |
| | | | | | | | |
| | | | | | 2,600,729 | | |
| | | | | | | | |
| | | |
Computers & Peripherals - 0.10% | | | | | | | | |
International Business Machines Corp., 5.60%, 11/30/2039 | | | 797,000 | | | 828,815 | | |
| | | | | | | | |
Electronic Equipment, Instruments & Components - 0.12% | | | | | | | | |
Corning, Inc., 6.20%, 3/15/2016 | | | 375,000 | | | 413,607 | | |
Corning, Inc., 6.625%, 5/15/2019 | | | 460,000 | | | 524,167 | | |
| | | | | | | | |
| | | | | | 937,774 | | |
| | | | | | | | |
| | | |
Semiconductors & Semiconductor Equipment - 0.06% | | | | | | | | |
MagnaChip Semiconductor S.A. - MagnaChip Semiconductor Finance Co.4 , 10.50%, 4/15/2018 | | | 465,000 | | | 490,575 | | |
| | | | | | | | |
Software - 0.09% | | | | | | | | |
Microsoft Corp., 5.20%, 6/1/2039 | | | 735,000 | | | 750,549 | | |
| | | | | | | | |
Total Information Technology | | | | | | 5,608,442 | | |
| | | | | | | | |
| | | | |
| 55 | | The accompanying notes are an integral part of the financial statements. | | |
Investment Portfolio - April 30, 2010 (unaudited)
| | | | | | | | |
| Pro-Blend® Moderate Term Series | | Principal Amount | | Value (Note 2) | | |
| | | |
CORPORATE BONDS (continued) | | | | | | | | |
| | | |
Non-Convertible Corporate Bonds (continued) | | | | | | | | |
Materials - 1.24% | | | | | | | | |
Chemicals - 0.15% | | | | | | | | |
E.I. du Pont de Nemours & Co., 6.00%, 7/15/2018 | | $ | 910,000 | | $ | 1,025,198 | | |
Solutia, Inc., 7.875%, 3/15/2020 | | | 210,000 | | | 216,825 | | |
| | | | | | | | |
| | | | | | 1,242,023 | | |
| | | | | | | | |
Containers & Packaging - 0.16% | | | | | | | | |
Ball Corp., 6.625%, 3/15/2018 | | | 165,000 | | | 167,888 | | |
BWAY Corp., 10.00%, 4/15/2014 | | | 600,000 | | | 657,000 | | |
Reynolds Group Issuer, Inc. - Reynolds Group Issuer LLC4, 8.50%, 5/15/2018 | | | 480,000 | | | 483,600 | | |
| | | | | | | | |
| | | | | | 1,308,488 | | |
| | | | | | | | |
| | | |
Metals & Mining - 0.49% | | | | | | | | |
Alcoa, Inc., 5.72%, 2/23/2019 | | | 2,166,000 | | | 2,137,857 | | |
Alcoa, Inc., 5.87%, 2/23/2022 | | | 210,000 | | | 201,863 | | |
BHP Billiton Finance (USA) Ltd. (Australia), 6.50%, 4/1/2019 | | | 850,000 | | | 984,651 | | |
Essar Steel Algoma, Inc. (Canada)4 , 9.375%, 3/15/2015 | | | 235,000 | | | 240,875 | | |
Steel Dynamics, Inc., 7.75%, 4/15/2016 | | | 420,000 | | | 438,375 | | |
| | | | | | | | |
| | | | | | 4,003,621 | | |
| | | | | | | | |
Paper & Forest Products - 0.44% | | | | | | | | |
Georgia-Pacific LLC4 , 8.25%, 5/1/2016 | | | 295,000 | | | 323,025 | | |
Georgia-Pacific LLC4 , 7.125%, 1/15/2017 | | | 250,000 | | | 263,750 | | |
International Paper Co., 9.375%, 5/15/2019 | | | 1,777,000 | | | 2,260,330 | | |
International Paper Co., 7.50%, 8/15/2021 | | | 630,000 | | | 740,003 | | |
| | | | | | | | |
| | | | | | 3,587,108 | | |
| | | | | | | | |
Total Materials | | | | | | 10,141,240 | | |
| | | | | | | | |
Telecommunication Services - 0.62% | | | | | | | | |
Diversified Telecommunication Services - 0.22% | | | | | | | | |
Clearwire Communications LLC - Clearwire Finance, Inc.4, 12.00%, 12/1/2015 | | | 110,000 | | | 114,675 | | |
Clearwire Communications LLC - Clearwire Finance, Inc.4, 12.00%, 12/1/2015 | | | 325,000 | | | 337,187 | | |
Intelsat Subsidiary Holding Co. Ltd. (Bermuda)4 , 8.875%, 1/15/2015 | | | 630,000 | | | 652,050 | | |
Wind Acquisition Finance S.A. (Luxembourg)4 , 11.75%, 7/15/2017 | | | 580,000 | | | 645,250 | | |
| | | | | | | | |
| | | | | | 1,749,162 | | |
| | | | | | | | |
| | | |
Wireless Telecommunication Services - 0.40% | | | | | | | | |
CC Holdings GS V LLC - Crown Castle GS III Corp.4 , 7.75%, 5/1/2017 | | | 450,000 | | | 489,375 | | |
Crown Castle Towers LLC4 , 6.113%, 1/15/2020 | | | 1,040,000 | | | 1,105,538 | | |
NII Capital Corp.4 , 8.875%, 12/15/2019 | | | 585,000 | | | 620,100 | | |
SBA Telecommunications, Inc.4 , 8.00%, 8/15/2016 | | | 440,000 | | | 464,200 | | |
| | | | |
| | The accompanying notes are an integral part of the financial statements. | | 56 |
Investment Portfolio - April 30, 2010 (unaudited)
| | | | | | | | |
| Pro-Blend® Moderate Term Series | | Principal Amount/
Shares | | Value (Note 2) | | |
| | | |
CORPORATE BONDS (continued) | | | | | | | | |
| | | |
Non-Convertible Corporate Bonds (continued) | | | | | | | | |
Telecommunication Services (continued) | | | | | | | | |
Wireless Telecommunication Services (continued) | | | | | | | | |
SBA Tower Trust4 , 5.101%, 4/15/2017 | | $ | 575,000 | | $ | 592,253 | | |
| | | | | | | | |
| | | | | | 3,271,466 | | |
| | | | | | | | |
Total Telecommunication Services | | | | | | 5,020,628 | | |
| | | | | | | | |
Utilities - 0.40% | | | | | | | | |
Electric Utilities - 0.32% | | | | | | | | |
Allegheny Energy Supply Co. LLC4 , 5.75%, 10/15/2019 | | | 705,000 | | | 699,357 | | |
Exelon Generation Co. LLC, 5.35%, 1/15/2014 | | | 710,000 | | | 770,728 | | |
Exelon Generation Co. LLC, 5.20%, 10/1/2019 | | | 175,000 | | | 180,762 | | |
Southwestern Electric Power Co., 6.45%, 1/15/2019 | | | 850,000 | | | 946,046 | | |
| | | | | | | | |
| | | | | | 2,596,893 | | |
| | | | | | | | |
| | | |
Independent Power Producers & Energy Traders - 0.08% | | | | | | | | |
Mirant Americas Generation LLC, 9.125%, 5/1/2031 | | | 250,000 | | | 235,000 | | |
Mirant Mid Atlantic Pass Through Trust, Series C, 10.06%, 12/30/2028 | | | 194,859 | | | 211,909 | | |
North American Energy Alliance LLC - North American Energy Alliance Finance Corp.4 , 10.875%, 6/1/2016 | | | 170,000 | | | 181,050 | | |
| | | | | | | | |
| | | | | | 627,959 | | |
| | | | | | | | |
| | | |
Multi-Utilities - 0.00%** | | | | | | | | |
CenterPoint Energy Resources Corp., Series B, 7.875%, 4/1/2013 | | | 50,000 | | | 57,350 | | |
| | | | | | | | |
Total Utilities | | | | | | 3,282,202 | | |
| | | | | | | | |
Total Non-Convertible Corporate Bonds | | | | | | | | |
(Identified Cost $170,118,137) | | | | | | 176,458,402 | | |
| | | | | | | | |
TOTAL CORPORATE BONDS | | | | | | | | |
(Identified Cost $172,077,244) | | | | | | 178,561,671 | | |
| | | | | | | | |
| | | |
MUTUAL FUNDS - 0.81% | | | | | | | | |
| | | |
iShares Dow Jones US Real Estate Index Fund | | | 3,390 | | | 179,501 | | |
iShares iBoxx High Yield Corporate Bond Fund | | | 32,330 | | | 2,890,302 | | |
iShares iBoxx Investment Grade Corporate Bond Fund | | | 32,710 | | | 3,510,110 | | |
| | | | | | | | |
TOTAL MUTUAL FUNDS | | | | | | | | |
(Identified Cost $5,991,117) | | | | | | 6,579,913 | | |
| | | | | | | | |
| | | |
U.S. TREASURY SECURITIES - 14.85% | | | | | | | | |
| | | |
U.S. Treasury Bonds - 3.37% | | | | | | | | |
U.S. Treasury Bond, 6.875%, 8/15/2025 | | $ | 5,000,000 | | | 6,513,280 | | |
U.S. Treasury Bond, 5.50%, 8/15/2028 | | | 4,485,000 | | | 5,144,434 | | |
U.S. Treasury Bond, 5.25%, 2/15/2029 | | | 3,525,000 | | | 3,930,375 | | |
U.S. Treasury Bond, 5.375%, 2/15/2031 | | | 7,598,000 | | | 8,626,101 | | |
| | | | |
| 57 | | The accompanying notes are an integral part of the financial statements. | | |
Investment Portfolio - April 30, 2010 (unaudited)
| | | | | | | | |
| Pro-Blend® Moderate Term Series | | Principal Amount | | Value (Note 2) | | |
| | | |
U.S. TREASURY SECURITIES (continued) | | | | | | | | |
| | | |
U.S. Treasury Bonds (continued) | | | | | | | | |
U.S. Treasury Bond, 4.50%, 2/15/2036 | | $ | 3,250,000 | | $ | 3,267,264 | | |
| | | | | | | | |
Total U.S. Treasury Bonds | | | | | | | | |
(Identified Cost $27,698,559) | | | | | | 27,481,454 | | |
| | | | | | | | |
U.S. Treasury Notes - 11.48% | | | | | | | | |
U.S. Treasury Note, 1.75%, 8/15/2012 | | | 4,160,000 | | | 4,221,427 | | |
U.S. Treasury Note, 4.25%, 9/30/2012 | | | 3,500,000 | | | 3,758,125 | | |
U.S. Treasury Note, 1.50%, 12/31/2013 | | | 4,300,000 | | | 4,247,592 | | |
U.S. Treasury Note, 1.875%, 2/28/2014 | | | 1,800,000 | | | 1,796,062 | | |
U.S. Treasury Note, 2.25%, 5/31/2014 | | | 5,500,000 | | | 5,544,687 | | |
U.S. Treasury Note, 2.625%, 6/30/2014 | | | 3,890,000 | | | 3,973,876 | | |
U.S. Treasury Note, 2.625%, 7/31/2014 | | | 8,805,000 | | | 8,983,847 | | |
U.S. Treasury Note, 2.375%, 2/28/2015 | | | 32,070,000 | | | 32,090,204 | | |
U.S. Treasury Note, 2.50%, 3/31/2015 | | | 10,000,000 | | | 10,050,000 | | |
U.S. Treasury Note, 4.50%, 11/15/2015 | | | 8,825,000 | | | 9,715,778 | | |
U.S. Treasury Note, 4.00%, 8/15/2018 | | | 6,540,000 | | | 6,824,084 | | |
U.S. Treasury Note, 2.75%, 2/15/2019 | | | 2,500,000 | | | 2,355,272 | | |
| | | | | | | | |
Total U.S. Treasury Notes | | | | | | | | |
(Identified Cost $93,001,068) | | | | | | 93,560,954 | | |
| | | | | | | | |
TOTAL U.S. TREASURY SECURITIES | | | | | | | | |
(Identified Cost $120,699,627) | | | | | | 121,042,408 | | |
| | | | | | | | |
| | | |
ASSET-BACKED SECURITIES - 0.04% | | | | | | | | |
| | | |
Hertz Vehicle Financing LLC, Series 2009-2A, Class A24 , 5.29%, 3/25/2016 (Identified Cost $334,982) | | | 335,000 | | | 354,563 | | |
| | | | | | | | |
| | | |
FOREIGN GOVERNMENT BONDS - 0.12% | | | | | | | | |
| | | |
Hellenic Republic Government Bond (Greece), 6.00%, 7/19/2019 (Identified Cost $1,268,547) | | | 980,000 | | | 994,914 | | |
| | | | | | | | |
| | | |
U.S. GOVERNMENT AGENCIES - 14.22% | | | | | | | | |
| | | |
Mortgage-Backed Securities - 0.80% | | | | | | | | |
Fannie Mae, Pool #545883, 5.50%, 9/1/2017 | | | 69,969 | | | 75,213 | | |
Fannie Mae, Pool #813938, 4.50%, 12/1/2020 | | | 180,090 | | | 189,345 | | |
Fannie Mae, Pool #911750, 4.50%, 12/1/2021 | | | 311,581 | | | 325,063 | | |
Fannie Mae, Pool #908642, 5.00%, 1/1/2022 | | | 15,902 | | | 16,853 | | |
Fannie Mae, Pool #912771, 5.00%, 3/1/2022 | | | 459,818 | | | 487,316 | | |
Fannie Mae, Pool #745147, 4.50%, 12/1/2035 | | | 2,966,257 | | | 3,018,197 | | |
Fannie Mae, Pool #906666, 6.50%, 12/1/2036 | | | 371,730 | | | 402,827 | | |
Fannie Mae, Pool #899393, 6.00%, 4/1/2037 | | | 1,035,534 | | | 1,102,920 | | |
Freddie Mac, Pool #B16835, 5.50%, 10/1/2019 | | | 60,947 | | | 65,733 | | |
Freddie Mac, Pool #G12966, 5.50%, 1/1/2023 | | | 328,198 | | | 351,563 | | |
| | | | |
| | The accompanying notes are an integral part of the financial statements. | | 58 |
Investment Portfolio - April 30, 2010 (unaudited)
| | | | | | | | |
| Pro-Blend® Moderate Term Series | | Principal Amount/
Shares | | Value (Note 2) | | |
| | | |
U.S. GOVERNMENT AGENCIES (continued) | | | | | | | | |
| | | |
Mortgage-Backed Securities (continued) | | | | | | | | |
Freddie Mac, Pool #G13136, 4.50%, 5/1/2023 | | $ | 346,511 | | $ | 361,125 | | |
Freddie Mac, Pool #G01736, 6.50%, 9/1/2034 | | | 48,922 | | | 53,709 | | |
GNMA, Pool #286310, 9.00%, 2/15/2020 | | | 1,562 | | | 1,760 | | |
GNMA, Pool #288873, 9.50%, 8/15/2020 | | | 26 | | | 30 | | |
GNMA, Pool #550290, 6.50%, 8/15/2031 | | | 30,293 | | | 33,471 | | |
| | | | | | | | |
Total Mortgage-Backed Securities | | | | | | | | |
(Identified Cost $6,048,306) | | | | | | 6,485,125 | | |
| | | | | | | | |
Other Agencies - 13.42% | | | | | | | | |
Fannie Mae, 4.875%, 5/18/2012 | | | 8,980,000 | | | 9,650,492 | | |
Fannie Mae, 1.75%, 8/10/2012 | | | 1,700,000 | | | 1,716,461 | | |
Fannie Mae, 2.625%, 11/20/2014 | | | 3,500,000 | | | 3,528,990 | | |
Fannie Mae, 6.25%, 5/15/2029 | | | 4,368,000 | | | 5,113,299 | | |
Fannie Mae, 7.25%, 5/15/2030 | | | 3,994,000 | | | 5,195,259 | | |
Fannie Mae, 6.625%, 11/15/2030 | | | 4,195,000 | | | 5,137,566 | | |
Federal Farm Credit Bank, 5.125%, 8/25/2016 | | | 2,275,000 | | | 2,522,522 | | |
Federal Home Loan Bank, 1.625%, 11/21/2012 | | | 3,300,000 | | | 3,318,523 | | |
Federal Home Loan Bank, 1.50%, 1/16/2013 | | | 20,175,000 | | | 20,215,471 | | |
Freddie Mac, 1.375%, 1/9/2013 | | | 8,410,000 | | | 8,367,740 | | |
Freddie Mac, 3.00%, 7/28/2014 | | | 1,960,000 | | | 2,010,425 | | |
Freddie Mac, 2.875%, 2/9/2015 | | | 20,000,000 | | | 20,207,580 | | |
Freddie Mac, 3.75%, 3/27/2019 | | | 12,290,000 | | | 12,148,444 | | |
Freddie Mac, 6.75%, 3/15/2031 | | | 4,145,000 | | | 5,159,306 | | |
Freddie Mac, 6.25%, 7/15/2032 | | | 4,315,000 | | | 5,110,626 | | |
| | | | | | | | |
Total Other Agencies | | | | | | | | |
(Identified Cost $108,733,945) | | | | | | 109,402,704 | | |
| | | | | | | | |
TOTAL U.S. GOVERNMENT AGENCIES | | | | | | | | |
(Identified Cost $114,782,251) | | | | | | 115,887,829 | | |
| | | | | | | | |
| | | |
SHORT-TERM INVESTMENTS - 3.94% | | | | | | | | |
| | | |
Dreyfus Cash Management, Inc. - Institutional Shares9 , 0.09%, | | | 30,076,425 | | | 30,076,425 | | |
U.S. Treasury Bill10 , 0.10%, 7/1/2010 | | $ | 2,000,000 | | | 1,999,502 | | |
| | | | | | | | |
TOTAL SHORT-TERM INVESTMENTS | | | | | | | | |
(Identified Cost $32,076,103) | | | | | | 32,075,927 | | |
| | | | | | | | |
TOTAL INVESTMENTS - 99.43% | | | | | | | | |
(Identified Cost $766,132,859) | | | | | | 810,345,434 | | |
OTHER ASSETS, LESS LIABILITIES - 0.57% | | | | | | 4,644,833 | | |
| | | | | | | | |
NET ASSETS - 100% | | | | | $ | 814,990,267 | | |
| | | | | | | | |
| | | | |
| 59 | | The accompanying notes are an integral part of the financial statements. | | |
Investment Portfolio - April 30, 2010 (unaudited)
| | | | | | | | |
| FORWARD FOREIGN CURRENCY EXCHANGE CONTRACTS OPEN AT APRIL 30, 2010: |
| Settlement Date | | Contracts to Deliver | | In Exchange For | | Contracts At Value | | Unrealized Appreciation |
5/26/2010 | | EUR980,000 | | $1,329,321 | | $1,304,949 | | $24,372 |
ADR - American Depository Receipt
EUR- Euro Currency
NVDR - Non-Voting Depository Receipt
*Non-income producing security
**Less than 0.01%
1 The Bank of New York Mellon Corp. is the Series’ custodian.
2 Latest quoted sales price is not available and the latest quoted bid price was used to value the security.
3 PNC Global Investment Servicing (U.S.) Inc. serves as sub-accountant and sub-transfer agent to the Series.
4 Restricted securities - Investment in securities that are restricted as to public resale under the Securities Act of 1933, as amended.
These securities have been sold under rule 144A and have been determined to be liquid. These securities amounts to $24,216,353, or 2.97%, of the Series’ net assets as of April 30, 2010 (see Note 2 to the financial statements).
5 The coupon rate is floating and is the stated rate as of April 30, 2010.
6 Security insured under the Federal Deposit Insurance Corporation Temporary Liquidity Guarantee Program.
7 Restricted securities - Investment in securities that are restricted as to public resale under the Securities Act of 1933, as amended. This security has
been sold under rule 144A and has been determined to be illiquid. This security amounts to $297,970, or 0.04%, of the Series’ net assets as of April 30, 2010 (see Note 2 to the financial statements).
8 Security has been valued at fair value.
9 Rate shown is the current yield as of April 30, 2010.
10 Rate shown reflects the annualized yield at time of purchase.
| | | | |
| | The accompanying notes are an integral part of the financial statements. | | 60 |
Statement of Assets and Liabilities - Pro-Blend® Moderate Term Series (unaudited)
April 30, 2010
| | | | |
ASSETS: | | | | |
| |
Investments, at value (identified cost $766,132,859) (Note 2) | | $ | 810,345,434 | |
Interest receivable | | | 4,783,134 | |
Receivable for fund shares sold | | | 2,103,545 | |
Receivable for securities sold | | | 1,074,012 | |
Dividends receivable | | | 262,475 | |
Foreign tax reclaims receivable | | | 118,641 | |
Unrealized appreciation on foreign forward currency contracts (Note 2) | | | 24,372 | |
Prepaid and other expenses | | | 12,201 | |
| | | | |
| |
TOTAL ASSETS | | | 818,723,814 | |
| | | | |
| |
LIABILITIES: | | | | |
| |
Accrued management fees (Note 3) | | | 494,459 | |
Accrued shareholder services fees (Class S) (Note 3) | | | 112,889 | |
Accrued transfer agent fees (Note 3) | | | 7,176 | |
Accrued distribution and service (Rule 12b-1) fees (Class C) (Note 3) | | | 6,768 | |
Accrued fund accounting and administration fees (Note 3) | | | 1,413 | |
Accrued Chief Compliance Officer service fees (Note 3) | | | 667 | |
Payable for securities purchased | | | 2,402,392 | |
Payable for fund shares repurchased | | | 707,783 | |
| | | | |
| |
TOTAL LIABILITIES | | | 3,733,547 | |
| | | | |
| |
TOTAL NET ASSETS | | $ | 814,990,267 | |
| | | | |
| |
NET ASSETS CONSIST OF: | | | | |
| |
Capital stock | | $ | 698,315 | |
Additional paid-in-capital | | | 771,703,947 | |
Undistributed net investment income | | | 4,111,800 | |
Accumulated net realized loss on investments, foreign currency and translation of other assets and liabilities | | | (5,758,732 | ) |
Net unrealized appreciation on investments, foreign currency and translation of other assets and liabilities | | | 44,234,937 | |
| | | | |
| |
TOTAL NET ASSETS | | $ | 814,990,267 | |
| | | | |
| |
NET ASSET VALUE, OFFERING PRICE AND REDEMPTION PRICE PER SHARE - Class S
($559,620,291/44,861,863 shares) | | $ | 12.47 | |
| | | | |
NET ASSET VALUE, OFFERING PRICE AND REDEMPTION PRICE PER SHARE - Class I
($244,674,155/23,935,845 shares) | | $ | 10.22 | |
| | | | |
NET ASSET VALUE, OFFERING PRICE AND REDEMPTION PRICE PER SHARE - Class C
($10,695,821/1,033,832 shares) | | $ | 10.35 | |
| | | | |
| | | | |
| 61 | | The accompanying notes are an integral part of the financial statements. | | |
Statement of Operations - Pro-Blend® Moderate Term Series (unaudited)
For the Six Months Ended April 30, 2010
| | | | |
INVESTMENT INCOME: | | | | |
| |
Interest | | $ | 6,318,233 | |
Dividends (net of foreign taxes withheld, $75,466) | | | 2,285,031 | |
| | | | |
| |
Total Investment Income | | | 8,603,264 | |
| | | | |
| |
EXPENSES: | | | | |
| |
Management fees (Note 3) | | | 2,461,619 | |
Shareholder services fees (Class S) (Note 3) | | | 603,985 | |
Fund accounting and administration fees (Note 3) | | | 64,391 | |
Transfer agent fees (Note 3) | | | 33,895 | |
Distribution and service (Rule 12b-1) fees (Class C) (Note 3) | | | 11,920 | |
Directors’ fees (Note 3) | | | 6,373 | |
Chief Compliance Officer service fees (Note 3) | | | 1,700 | |
Custodian fees | | | 21,930 | |
Miscellaneous | | | 74,091 | |
| | | | |
| |
Total Expenses | | | 3,279,904 | |
Less reduction of expenses (Note 3) | | | (758 | ) |
| | | | |
| |
Net Expenses | | | 3,279,146 | |
| | | | |
| |
NET INVESTMENT INCOME | | | 5,324,118 | |
| | | | |
| |
REALIZED AND UNREALIZED GAIN (LOSS) ON INVESTMENTS AND FOREIGN CURRENCY: | | | | |
| |
Net realized gain (loss) on- | | | | |
Investments | | | 16,129,467 | |
Foreign currency and translation of other assets and liabilities | | | (12,391 | ) |
| | | | |
| |
| | | 16,117,076 | |
| | | | |
Net change in unrealized appreciation on- | | | | |
Investments | | | 27,738,738 | |
Foreign currency and translation of other assets and liabilities | | | 14,706 | |
| | | | |
| |
| | | 27,753,444 | |
| | | | |
| |
NET REALIZED AND UNREALIZED GAIN (LOSS) ON INVESTMENTS AND FOREIGN CURRENCY | | | 43,870,520 | |
| | | | |
| |
NET INCREASE IN NET ASSETS RESULTING FROM OPERATIONS | | $ | 49,194,638 | |
| | | | |
| | | | |
| | The accompanying notes are an integral part of the financial statements. | | 62 |
Statements of Changes in Net Assets - Pro-Blend® Moderate Term Series
| | | | | | | | |
| | | For the Six
Months Ended
4/30/10
(unaudited) | | | For the Year Ended
10/31/09 | |
INCREASE (DECREASE) IN NET ASSETS: | | | | | | | | |
| | |
OPERATIONS: | | | | | | | | |
| | |
Net investment income | | $ | 5,324,118 | | | $ | 4,446,941 | |
Net realized gain (loss) on investments and foreign currency | | | 16,117,076 | | | | (13,731,805 | ) |
Net change in unrealized appreciation on investments and foreign currency | | | 27,753,444 | | | | 50,979,855 | |
| | | | | | | | |
| | |
Net increase from operations | | | 49,194,638 | | | | 41,694,991 | |
| | | | | | | | |
| | |
DISTRIBUTIONS TO SHAREHOLDERS (Note 8): | | | | | | | | |
| | |
From net investment income (Class S) | | | (3,674,958 | ) | | | (4,470,282 | ) |
From net investment income (Class I) | | | (574,663 | ) | | | (85,830 | ) |
| | | | | | | | |
| | |
Total distributions to shareholders | | | (4,249,621 | ) | | | (4,556,112 | ) |
| | | | | | | | |
| | |
CAPITAL STOCK ISSUED AND REPURCHASED: | | | | | | | | |
| | |
Net increase from capital share transactions (Note 5) | | | 328,984,212 | | | | 184,793,523 | |
| | | | | | | | |
| | |
Net increase in net assets | | | 373,929,229 | | | | 221,932,402 | |
| | |
NET ASSETS: | | | | | | | | |
| | |
Beginning of period | | | 441,061,038 | | | | 219,128,636 | |
| | | | | | | | |
| | |
End of period (including undistributed net investment income of $4,111,800 and $3,037,303, respectively) | | $ | 814,990,267 | | | $ | 441,061,038 | |
| | | | | | | | |
| | | | |
| 63 | | The accompanying notes are an integral part of the financial statements. | | |
Financial Highlights - Pro-Blend® Moderate Term Series - Class S
| | | | | | | | | | | | |
| | | For the Six
Months Ended
4/30/10 | | | | For the Years Ended | | |
| | | (unaudited) | | 10/31/09 | | 10/31/08 | | 10/31/07 | | 10/31/06 | | 10/31/05 |
Per share data (for a share outstanding throughout each period): | | | | | | | | | | | | |
Net asset value - Beginning of period | | $11.61 | | $10.41 | | $14.18 | | $13.55 | | $12.75 | | $11.81 |
| | | | | | | | | | | | |
Income (loss) from investment operations: | | | | | | | | | | | | |
Net investment income | | 0.091 | | 0.161 | | 0.23 | | 0.24 | | 0.20 | | 0.11 |
Net realized and unrealized gain (loss) on investments | | 0.86 | | 1.23 | | (2.75) | | 1.19 | | 1.36 | | 1.16 |
| | | | | | | | | | | | |
Total from investment operations | | 0.95 | | 1.39 | | (2.52) | | 1.43 | | 1.56 | | 1.27 |
| | | | | | | | | | | | |
Less distributions to shareholders: | | | | | | | | | | | | |
From net investment income | | (0.09) | | (0.19) | | (0.23) | | (0.23) | | (0.14) | | (0.11) |
From net realized gain on investments | | — | | — | | (1.02) | | (0.57) | | (0.62) | | (0.22) |
| | | | | | | | | | | | |
Total distributions to shareholders | | (0.09) | | (0.19) | | (1.25) | | (0.80) | | (0.76) | | (0.33) |
| | | | | | | | | | | | |
Net asset value - End of period | | $12.47 | | $11.61 | | $10.41 | | $14.18 | | $13.55 | | $12.75 |
| | | | | | | | | | | | |
Net assets - End of period
(000’s omitted) | | $559,620 | | $396,927 | | $218,807 | | $379,385 | | $297,096 | | $191,022 |
| | | | | | | | | | | | |
Total return2 | | 8.26% | | 13.65% | | (19.28%) | | 10.91% | | 12.88% | | 10.94% |
Ratios (to average net assets)/Supplemental Data: | | | | | | | | | | | | |
Expenses* | | 1.06%3 | | 1.10% | | 1.10% | | 1.11% | | 1.16% | | 1.20% |
Net investment income | | 1.56%3 | | 1.49% | | 1.74% | | 1.86% | | 1.75% | | 1.09% |
Series portfolio turnover | | 16% | | 58% | | 75% | | 78% | | 72% | | 77% |
*The investment advisor did not impose all or a portion of its management fees, CCO fees, fund accounting and transfer agent fees and other fees in some periods and in some periods paid a portion of the Series’ expenses. If these expenses had been incurred by the Class, the expense ratio (to average net assets) would have been increased by the following amount: |
| | 0.00%3,4 | | 0.02% | | 0.02% | | N/A | | N/A | | 0.01% |
1Calculated based on average shares outstanding during the period.
2Represents aggregate total return for the periods indicated, and assumes reinvestment of all distributions. Total return would have been lower had certain expenses not been waived or reimbursed during certain periods. Periods less than one year are not annualized.
3Annualized.
4Less than 0.01%.
| | | | |
| | The accompanying notes are an integral part of the financial statements. | | 64 |
Financial Highlights - Pro-Blend® Moderate Term Series - Class I
| | | | | | |
| | | For the Six
Months Ended
4/30/10
(unaudited) | | For the
Year Ended
10/31/09 | | For the Period
3/28/081 to
10/31/08 |
Per share data (for a share outstanding throughout each period): | | | | | | |
Net asset value - Beginning of period | | $9.54 | | $8.59 | | $10.00 |
| | | | | | |
| | | |
Income (loss) from investment operations: | | | | | | |
Net investment income | | 0.092 | | 0.152 | | 0.06 |
Net realized and unrealized gain (loss) on investments | | 0.70 | | 1.02 | | (1.42) |
| | | | | | |
Total from investment operations | | 0.79 | | 1.17 | | (1.36) |
| | | | | | |
| | | |
Less distributions to shareholders: | | | | | | |
From net investment income | | (0.11) | | (0.22) | | (0.05) |
| | | | | | |
Net asset value - End of period | | $10.22 | | $9.54 | | $8.59 |
| | | | | | |
Net assets - End of period (000’s omitted) | | $244,674 | | $44,134 | | $322 |
| | | | | | |
Total return3 | | 8.39% | | 14.11% | | (13.64%) |
Ratios (to average net assets)/Supplemental Data: | | | | | | |
Expenses* | | 0.81%4 | | 0.85% | | 0.85%4 |
Net investment income | | 1.81%4 | | 1.67% | | 1.47%4 |
Series portfolio turnover | | 16% | | 58% | | 75% |
*The investment advisor did not impose all or a portion of its management fees, CCO fees, fund accounting and transfer agent fees and other fees in some periods and in some periods paid a portion of the Series’ expenses. If these expenses had been incurred by the Class, the expense ratio (to average net assets) would have been increased by the following amount: |
| | 0.00%4,5 | | 0.02% | | 0.10%4 |
1 Commencement of operations.
2 Calculated based on average shares outstanding during the period.
3 Represents aggregate total return for the periods indicated, and assumes reinvestment of all distributions. Total return would have been lower had certain expenses not been waived or reimbursed during the periods. Periods less than one year are not annualized.
4 Annualized.
5 Less than 0.01%.
| | | | |
| 65 | | The accompanying notes are an integral part of the financial statements. | | |
Financial Highlights - Pro-Blend® Moderate Term Series - Class C
| | |
| | | For the Period
1/4/101 to 4/30/10 (unaudited) |
Per share data (for a share outstanding throughout the period): | | |
Net asset value - Beginning of period | | $10.00 |
| | |
Income from investment operations: | | |
Net investment income | | 0.032 |
Net realized and unrealized gain on investments | | 0.32 |
| | |
Total from investment operations | | 0.35 |
| | |
Net asset value - End of period | | $10.35 |
| | |
Net assets - End of period (000’s omitted) | | $10,696 |
| | |
Total return3 | | 3.50% |
Ratios (to average net assets)/Supplemental Data: | | |
Expenses* | | 1.82%4 |
Net investment income | | 0.90%4 |
Series portfolio turnover | | 16% |
*The investment advisor did not impose all or a portion of its management fees and other fees during the period and paid a portion of the Series’ expenses. If these expenses had been incurred by the Class, the expense ratio (to average net assets) would have been increased by the following amount: |
| | 0.00%4,5 |
1 Commencement of operations.
2 Calculated based on average shares outstanding during the period.
3 Represents aggregate total return for the period indicated, and assumes reinvestment of all distributions. Total return would have been lower had certain expenses not been waived during the period. Periods less than one year are not annualized.
4 Annualized.
5 Less than 0.01%.
| | | | |
| | The accompanying notes are an integral part of the financial statements. | | 66 |
Shareholder Expense Example - Pro-Blend® Extended Term Series (unaudited)
As a shareholder of the Series, you may incur two types of costs: (1) transaction costs, including potential wire charges on redemptions and (2) ongoing costs, including management fees and other Series expenses. This example is intended to help you understand your ongoing costs (in dollars) of investing in the Series and to compare these costs with the ongoing costs of investing in other mutual funds.
The example is based on an investment of $1,000 invested at the beginning of the period and held for the entire period (November 1, 2009 to April 30, 2010, except for Class C Actual, which is from January 4, 2010* to April 30, 2010).
Actual Expenses
The Actual lines of the table below provide information about actual account values and actual expenses. You may use the information in these lines, together with the amount you invested, to estimate the expenses that you paid over the period. Simply divide your account value by $1,000 (for example, an $8,600 account value divided by $1,000 = 8.6), then multiply the result by the number in the Actual line for the Class in which you have invested under the heading entitled “Expenses Paid During Period” to estimate the expenses you paid on your account during this period.
Hypothetical Example for Comparison Purposes
The Hypothetical lines of the table below provide information about hypothetical account values and hypothetical expenses based on the Class’ actual expense ratio and an assumed rate of return of 5% per year before expenses, which is not the Class’ actual return. The hypothetical account values and expenses may not be used to estimate the actual ending account balance or expenses you paid during the period. You may use this information to compare the ongoing costs of investing in the Series and other funds. To do so, compare this 5% hypothetical example for the Class in which you have invested with the 5% hypothetical examples that appear in the shareholder reports of the other funds.
Please note that the expenses shown in the table are meant to highlight your ongoing costs only and do not reflect any transaction costs. Therefore, the Hypothetical lines of the table are useful in comparing ongoing costs only, and will not help you determine the relative total costs of owning different funds. In addition, if these transaction costs were included, your costs would have been higher.
| | | | | | | | |
| | | Beginning
Account Value
11/1/09* | | Ending
Account Value
4/30/10 | | Expenses Paid
During Period
11/1/09-4/30/10** | | Annualized
Expense ratio |
Class S | | | | | | | | |
Actual | | $1,000.00 | | $1,107.90 | | $5.59 | | 1.07% |
Hypothetical | | | | | | | | |
(5% return before expenses) | | $1,000.00 | | $1,019.49 | | $5.36 | | 1.07% |
Class I | | | | | | | | |
Actual | | $1,000.00 | | $1,109.70 | | $4.29 | | 0.82% |
Hypothetical | | | | | | | | |
(5% return before expenses) | | $1,000.00 | | $1,020.73 | | $4.11 | | 0.82% |
Class C | | | | | | | | |
Actual | | $1,000.00 | | $1,042.00 | | $5.91 | | 1.82% |
Hypothetical | | | | | | | | |
(5% return before expenses) | | $1,000.00 | | $1,010.11 | | $5.81 | | 1.82% |
*Class C inception date was January 4, 2010.
**Expenses are equal to the Class’ annualized expense ratio (for the six-month period), multiplied by the average account value over the period, multiplied by 181/365 to reflect the one-half year period (except for the Series’ Class C Actual return information, which reflects the 116 day period ended April 30, 2010 due to its inception date of January 4, 2010). The Class’ total return would have been lower had certain expenses not been waived during the period.
Portfolio Composition - Pro-Blend® Extended Term Series (unaudited)
As of April 30, 2010
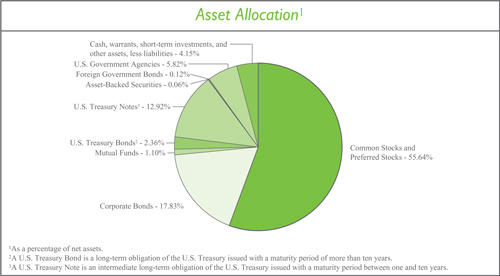
| | |
Sector Allocation4 |
Information Technology | | 15.78% |
Health Care | | 12.94% |
Financials | | 11.72% |
Consumer Discretionary | | 9.15% |
Consumer Staples | | 6.72% |
Industrials | | 6.64% |
Energy | | 6.38% |
Materials | | 2.98% |
Telecommunication Services | | 1.01% |
Utilities | | 0.60% |
4 Including common stocks, preferred stocks, warrants and corporate bonds, as a percentage of total investments. |
| | |
Top Ten Stock Holdings5 |
Google, Inc. - Class A | | 2.33% |
The Walt Disney Co. | | 2.29% |
Microsoft Corp. | | 1.51% |
Southwest Airlines Co. | | 1.50% |
Cisco Systems, Inc. | | 1.48% |
Becton, Dickinson and Co. | | 1.45% |
Johnson & Johnson | | 1.42% |
Autodesk, Inc. | | 1.38% |
Monsanto Co. | | 1.33% |
Nestle S.A. (Switzerland) | | 1.29% |
5 As a percentage of total investments. |
Investment Portfolio - April 30, 2010 (unaudited)
| | | | | | | |
| Pro-Blend® Extended Term Series | | Shares | | Value (Note 2) | | |
| | | |
COMMON STOCKS - 55.25% | | | | | | | |
| | | |
Consumer Discretionary - 6.72% | | | | | | | |
Auto Components - 0.04% | | | | | | | |
Hankook Tire Co. Ltd. (South Korea) | | 15,560 | | $ | 350,270 | | |
| | | | | | | |
Automobiles - 0.05% | | | | | | | |
Bayerische Motoren Werke AG (BMW) (Germany) | | 6,410 | | | 316,890 | | |
Suzuki Motor Corp. (Japan) | | 2,500 | | | 52,935 | | |
| | | | | | | |
| | | | | 369,825 | | |
| | | | | | | |
Distributors - 0.02% | | | | | | | |
Inchcape plc (United Kingdom)* | | 322,000 | | | 169,481 | | |
| | | | | | | |
Hotels, Restaurants & Leisure - 1.80% | | | | | | | |
Carnival Corp. | | 210,105 | | | 8,761,378 | | |
Choice Hotels International, Inc. | | 9,670 | | | 351,118 | | |
Club Mediterranee S.A. (France)* | | 5,750 | | | 96,732 | | |
Hyatt Hotels Corp. - Class A* | | 2,610 | | | 107,454 | | |
International Game Technology | | 249,750 | | | 5,264,730 | | |
Wendy’s - Arby’s Group, Inc. - Class A | | 25,000 | | | 132,750 | | |
| | | | | | | |
| | | | | 14,714,162 | | |
| | | | | | | |
Household Durables - 0.14% | | | | | | | |
Corporacion Geo S.A.B. de C.V. - Class B (Mexico)* | | 63,860 | | | 202,230 | | |
LG Electronics, Inc. (South Korea) | | 2,710 | | | 298,299 | | |
NVR, Inc.* | | 340 | | | 244,137 | | |
Rodobens Negocios Imobiliarios S.A. (Brazil) | | 55,370 | | | 397,855 | | |
| | | | | | | |
| | | | | 1,142,521 | | |
| | | | | | | |
Leisure Equipment & Products - 0.01% | | | | | | | |
Sankyo Co. Ltd. (Japan) | | 1,400 | | | 64,907 | | |
| | | | | | | |
Media - 2.50% | | | | | | | |
Grupo Televisa S.A. - ADR (Mexico) | | 17,800 | | | 369,884 | | |
Mediacom Communications Corp. - Class A* | | 26,740 | | | 177,019 | | |
Reed Elsevier plc (United Kingdom) | | 21,260 | | | 167,362 | | |
Reed Elsevier plc - ADR (United Kingdom) | | 7,379 | | | 233,176 | | |
Societe Television Francaise 1 (France) | | 37,900 | | | 706,721 | | |
The Walt Disney Co. | | 506,080 | | | 18,643,987 | | |
Wolters Kluwer N.V. (Netherlands) | | 9,795 | | | 201,101 | | |
| | | | | | | |
| | | | | 20,499,250 | | |
| | | | | | | |
Multiline Retail - 0.07% | | | | | | | |
Marks & Spencer Group plc (United Kingdom) | | 40,000 | | | 224,306 | | |
Nordstrom, Inc. | | 3,210 | | | 132,669 | | |
PPR (France) | | 1,790 | | | 241,786 | | |
| | | | | | | |
| | | | | 598,761 | | |
| | | | | | | |
| | | | |
| 69 | | The accompanying notes are an integral part of the financial statements. | | |
Investment Portfolio - April 30, 2010 (unaudited)
| | | | | | | |
| Pro-Blend® Extended Term Series | | Shares | | Value (Note 2) | | |
| | | |
COMMON STOCKS (continued) | | | | | | | |
| | | |
Consumer Discretionary (continued) | | | | | | | |
Specialty Retail - 2.04% | | | | | | | |
Dick’s Sporting Goods, Inc.* | | 16,440 | | $ | 478,568 | | |
The Finish Line, Inc. - Class A | | 12,670 | | | 204,114 | | |
The Home Depot, Inc. | | 109,940 | | | 3,875,385 | | |
KOMERI Co. Ltd. (Japan) | | 3,900 | | | 99,104 | | |
Lowe’s Companies, Inc. | | 175,240 | | | 4,752,509 | | |
Lumber Liquidators Holdings, Inc.* | | 8,770 | | | 267,134 | | |
The Sherwin-Williams Co. | | 89,900 | | | 7,018,493 | | |
| | | | | | | |
| | | | | 16,695,307 | | |
| | | | | | | |
Textiles, Apparel & Luxury Goods - 0.05% | | | | | | | |
Adidas AG (Germany) | | 3,760 | | | 221,076 | | |
LVMH S.A. (Louis Vuitton Moet Hennessy) (France) | | 1,575 | | | 182,107 | | |
| | | | | | | |
| | | | | 403,183 | | |
| | | | | | | |
Total Consumer Discretionary | | | | | 55,007,667 | | |
| | | | | | | |
Consumer Staples - 5.75% | | | | | | | |
Beverages - 0.10% | | | | | | | |
Diageo plc (United Kingdom) | | 13,175 | | | 224,767 | | |
Heineken N.V. (Netherlands) | | 7,330 | | | 343,341 | | |
Kirin Holdings Co. Ltd. (Japan) | | 17,000 | | | 244,137 | | |
| | | | | | | |
| | | | | 812,245 | | |
| | | | | | | |
Food & Staples Retailing - 1.76% | | | | | | | |
BJ’s Wholesale Club, Inc.* | | 9,010 | | | 344,903 | | |
Carrefour S.A. (France) | | 24,790 | | | 1,215,966 | | |
Casino Guichard-Perrachon S.A. (France) | | 2,670 | | | 237,117 | | |
The Kroger Co. | | 255,660 | | | 5,683,322 | | |
Safeway, Inc. | | 255,190 | | | 6,022,484 | | |
SUPERVALU, Inc. | | 8,570 | | | 127,693 | | |
Tesco plc (United Kingdom) | | 120,000 | | | 798,965 | | |
| | | | | | | |
| | | | | 14,430,450 | | |
| | | | | | | |
Food Products - 3.81% | | | | | | | |
Danone S.A. (France) | | 8,530 | | | 504,036 | | |
Dean Foods Co.* | | 312,950 | | | 4,913,315 | | |
Flowers Foods, Inc. | | 10,470 | | | 275,989 | | |
General Mills, Inc. | | 49,580 | | | 3,529,104 | | |
Kellogg Co. | | 64,010 | | | 3,516,709 | | |
Nestle S.A. (Switzerland) | | 214,220 | | | 10,520,399 | | |
Suedzucker AG (Germany) | | 7,300 | | | 148,078 | | |
Unilever plc - ADR (United Kingdom) | | 258,075 | | | 7,768,058 | | |
| | | | | | | |
| | | | | 31,175,688 | | |
| | | | | | | |
| | | | |
| | The accompanying notes are an integral part of the financial statements. | | 70 |
Investment Portfolio - April 30, 2010 (unaudited)
| | | | | | | |
| Pro-Blend® Extended Term Series | | Shares | | Value (Note 2) | | |
| | | |
COMMON STOCKS (continued) | | | | | | | |
| | | |
Consumer Staples (continued) | | | | | | | |
Household Products - 0.05% | | | | | | | |
Kao Corp. (Japan) | | 3,000 | | $ | 73,455 | | |
Reckitt Benckiser Group plc (United Kingdom) | | 6,105 | | | 317,875 | | |
| | | | | | | |
| | | | | 391,330 | | |
| | | | | | | |
Personal Products - 0.03% | | | | | | | |
Alberto-Culver Co. | | 7,290 | | | 209,952 | | |
| | | | | | | |
Total Consumer Staples | | | | | 47,019,665 | | |
| | | | | | | |
Energy - 4.82% | | | | | | | |
Energy Equipment & Services - 3.50% | | | | | | | |
Baker Hughes, Inc. | | 185,290 | | | 9,220,031 | | |
Calfrac Well Services Ltd. (Canada) | | 22,540 | | | 479,513 | | |
Compagnie Generale de Geophysique - Veritas (CGG - Veritas) (France)* | | 17,565 | | | 530,533 | | |
Dril-Quip, Inc.* | | 4,260 | | | 246,782 | | |
Schlumberger Ltd. | | 118,800 | | | 8,484,696 | | |
Trican Well Service Ltd. (Canada) | | 41,290 | | | 524,356 | | |
Weatherford International Ltd. (Switzerland)* | | 508,020 | | | 9,200,242 | | |
| | | | | | | |
| | | | | 28,686,153 | | |
| | | | | | | |
Oil, Gas & Consumable Fuels - 1.32% | | | | | | | |
BP plc (United Kingdom) | | 20,885 | | | 183,903 | | |
Cameco Corp. (Canada) | | 5,710 | | | 140,523 | | |
Forest Oil Corp.* | | 4,110 | | | 120,423 | | |
Hess Corp. | | 134,750 | | | 8,563,362 | | |
Mariner Energy, Inc.* | | 6,409 | | | 153,047 | | |
Royal Dutch Shell plc - Class B (Netherlands) | | 7,169 | | | 216,637 | | |
Royal Dutch Shell plc - Class B - ADR (Netherlands) | | 6,830 | | | 414,444 | | |
Talisman Energy, Inc. (Canada) | | 24,520 | | | 417,357 | | |
Total S.A. (France) | | 4,390 | | | 239,473 | | |
Uranium One, Inc. (Canada)* | | 124,370 | | | 314,659 | | |
| | | | | | | |
| | | | | 10,763,828 | | |
| | | | | | | |
Total Energy | | | | | 39,449,981 | | |
| | | | | | | |
Financials - 5.31% | | | | | | | |
Capital Markets - 1.38% | | | | | | | |
The Bank of New York Mellon Corp.1 | | 284,500 | | | 8,856,485 | | |
Credit Suisse Group AG - ADR (Switzerland) | | 3,190 | | | 145,783 | | |
Daiwa Securities Group, Inc. (Japan) | | 6,000 | | | 31,298 | | |
Federated Investors, Inc. - Class B | | 31,450 | | | 758,574 | | |
GAM Holding Ltd. (Switzerland)* | | 28,530 | | | 357,106 | | |
The Goldman Sachs Group, Inc. | | 2,310 | | | 335,412 | | |
Legg Mason, Inc. | | 13,630 | | | 431,935 | | |
Northern Trust Corp. | | 4,930 | | | 271,051 | | |
| | | | |
| 71 | | The accompanying notes are an integral part of the financial statements. | | |
Investment Portfolio - April 30, 2010 (unaudited)
| | | | | | | |
| Pro-Blend® Extended Term Series | | Shares | | Value (Note 2) | | |
| | | |
COMMON STOCKS (continued) | | | | | | | |
| | | |
Financials (continued) | | | | | | | |
Capital Markets (continued) | | | | | | | |
State Street Corp. | | 2,290 | | $ | 99,615 | | |
| | | | | | | |
| | | | | 11,287,259 | | |
| | | | | | | |
Commercial Banks - 0.38% | | | | | | | |
Barclays plc - ADR (United Kingdom) | | 6,940 | | | 141,715 | | |
BNP Paribas (France) | | 2,320 | | | 161,028 | | |
The Chugoku Bank Ltd. (Japan) | | 10,000 | | | 128,600 | | |
Credit Agricole S.A. (France) | | 3,800 | | | 54,744 | | |
First Commonwealth Financial Corp. | | 110,670 | | | 724,888 | | |
The Hachijuni Bank Ltd. (Japan) | | 18,000 | | | 101,368 | | |
HSBC Holdings plc (United Kingdom) | | 17,000 | | | 173,753 | | |
HSBC Holdings plc - ADR (United Kingdom) | | 7,702 | | | 391,955 | | |
ICICI Bank Ltd. - ADR (India) | | 4,960 | | | 210,899 | | |
Mitsubishi UFJ Financial Group, Inc. (Japan) | | 12,000 | | | 63,107 | | |
Societe Generale - ADR (France)2 | | 12,410 | | | 131,174 | | |
The Sumitomo Trust & Banking Co. Ltd. (Japan) | | 18,000 | | | 109,224 | | |
U.S. Bancorp | | 10,390 | | | 278,140 | | |
Wilmington Trust Corp. | | 22,890 | | | 396,684 | | |
| | | | | | | |
| | | | | 3,067,279 | | |
| | | | | | | |
Consumer Finance - 1.22% | | | | | | | |
American Express Co. | | 213,090 | | | 9,827,711 | | |
Discover Financial Services | | 9,720 | | | 150,271 | | |
| | | | | | | |
| | | | | 9,977,982 | | |
| | | | | | | |
Diversified Financial Services - 0.32% | | | | | | | |
Bank of America Corp. | | 11,390 | | | 203,084 | | |
Deutsche Boerse AG (Germany) | | 9,140 | | | 712,401 | | |
Financiere Marc de Lacharriere S.A. (Fimalac) (France) | | 6,420 | | | 318,880 | | |
ING Groep N.V. (Netherlands)* | | 4,650 | | | 41,723 | | |
JPMorgan Chase & Co. | | 15,485 | | | 659,351 | | |
Moody’s Corp. | | 28,320 | | | 700,070 | | |
| | | | | | | |
| | | | | 2,635,509 | | |
| | | | | | | |
Insurance - 0.65% | | | | | | | |
Allianz SE (Germany) | | 9,190 | | | 1,058,662 | | |
The Allstate Corp. | | 16,100 | | | 525,987 | | |
Amil Participacoes S.A. (Brazil) | | 40,950 | | | 335,704 | | |
AXA S.A. (France) | | 4,550 | | | 91,477 | | |
Brown & Brown, Inc. | | 21,570 | | | 434,420 | | |
Muenchener Rueckversicherungs AG (MunichRe) (Germany) | | 3,495 | | | 494,194 | | |
Principal Financial Group, Inc. | | 5,770 | | | 168,599 | | |
The Progressive Corp. | | 41,500 | | | 833,735 | | |
Willis Group Holdings plc (United Kingdom) | | 21,475 | | | 739,814 | | |
| | | | |
| | The accompanying notes are an integral part of the financial statements. | | 72 |
Investment Portfolio - April 30, 2010 (unaudited)
| | | | | | | |
| Pro-Blend® Extended Term Series | | Shares | | Value (Note 2) | | |
| | | |
COMMON STOCKS (continued) | | | | | | | |
| | | |
Financials (continued) | | | | | | | |
Insurance (continued) | | | | | | | |
Zurich Financial Services AG (Switzerland) | | 2,910 | | $ | 649,521 | | |
| | | | | | | |
| | | | | 5,332,113 | | |
| | | | | | | |
Real Estate Investment Trusts (REITS) - 1.14% | | | | | | | |
Acadia Realty Trust | | 8,710 | | | 166,187 | | |
Alexandria Real Estate Equities, Inc. | | 1,750 | | | 123,918 | | |
Alstria Office REIT AG (Germany) | | 24,590 | | | 278,293 | | |
American Campus Communities, Inc. | | 11,320 | | | 318,884 | | |
Apartment Investment & Management Co. - Class A | | 14,030 | | | 314,412 | | |
AvalonBay Communities, Inc. | | 2,810 | | | 292,352 | | |
BioMed Realty Trust, Inc. | | 22,040 | | | 407,961 | | |
Boston Properties, Inc. | | 5,250 | | | 414,015 | | |
Camden Property Trust | | 5,380 | | | 260,553 | | |
Corporate Office Properties Trust | | 24,680 | | | 998,306 | | |
DiamondRock Hospitality Co.* | | 7,400 | | | 81,326 | | |
Digital Realty Trust, Inc. | | 4,280 | | | 251,236 | | |
Douglas Emmett, Inc. | | 25,620 | | | 428,879 | | |
DuPont Fabros Technology, Inc. | | 12,810 | | | 283,998 | | |
Equity Lifestyle Properties, Inc. | | 4,240 | | | 235,363 | | |
Equity One, Inc. | | 7,040 | | | 136,646 | | |
Equity Residential | | 2,770 | | | 125,398 | | |
HCP, Inc. | | 10,450 | | | 335,654 | | |
Health Care REIT, Inc. | | 4,350 | | | 195,446 | | |
Healthcare Realty Trust, Inc. | | 9,360 | | | 225,950 | | |
Home Properties, Inc. | | 7,950 | | | 395,036 | | |
Host Hotels & Resorts, Inc. | | 19,494 | | | 316,973 | | |
LaSalle Hotel Properties | | 11,380 | | | 299,863 | | |
Lexington Realty Trust | | 11,180 | | | 79,154 | | |
Mack-Cali Realty Corp. | | 3,020 | | | 103,767 | | |
Mid-America Apartment Communities, Inc. | | 5,493 | | | 303,598 | | |
National Health Investors, Inc. | | 1,960 | | | 79,615 | | |
National Retail Properties, Inc. | | 10,000 | | | 235,300 | | |
Omega Healthcare Investors, Inc. | | 12,490 | | | 250,050 | | |
Pebblebrook Hotel Trust* | | 8,210 | | | 161,737 | | |
Realty Income Corp. | | 13,800 | | | 452,502 | | |
Simon Property Group, Inc. | | 2,866 | | | 255,131 | | |
Tanger Factory Outlet Centers | | 4,170 | | | 173,472 | | |
UDR, Inc. | | 12,910 | | | 262,202 | | |
Westfield Group (Australia) | | 9,550 | | | 114,169 | | |
| | | | | | | |
| | | | | 9,357,346 | | |
| | | | | | | |
Real Estate Management & Development - 0.01% | | | | | | | |
CB Richard Ellis Group, Inc. - Class A* | | 5,210 | | | 90,237 | | |
| | | | | | | |
| | | | |
| 73 | | The accompanying notes are an integral part of the financial statements. | | |
Investment Portfolio - April 30, 2010 (unaudited)
| | | | | | | |
| Pro-Blend® Extended Term Series | | Shares | | Value (Note 2) | | |
| | | |
COMMON STOCKS (continued) | | | | | | | |
| | | |
Financials (continued) | | | | | | | |
Thrifts & Mortgage Finance - 0.21% | | | | | | | |
Aareal Bank AG (Germany)* | | 8,265 | | $ | 181,793 | | |
First Niagara Financial Group, Inc. | | 52,140 | | | 724,746 | | |
NewAlliance Bancshares, Inc. | | 29,500 | | | 384,385 | | |
People’s United Financial, Inc. | | 25,820 | | | 400,985 | | |
| | | | | | | |
| | | | | 1,691,909 | | |
| | | | | | | |
Total Financials | | | | | 43,439,634 | | |
| | | | | | | |
Health Care - 11.98% | | | | | | | |
Biotechnology - 1.38% | | | | | | | |
Amgen, Inc.* | | 14,070 | | | 807,055 | | |
Basilea Pharmaceutica AG (Switzerland)* | | 6,460 | | | 475,728 | | |
Celera Corp.* | | 187,760 | | | 1,402,567 | | |
CSL Ltd. (Australia) | | 7,650 | | | 229,274 | | |
Genzyme Corp.* | | 146,399 | | | 7,794,283 | | |
Grifols S.A. (Spain) | | 8,650 | | | 109,988 | | |
Sinovac Biotech Ltd. (China)* | | 86,800 | | | 502,572 | | |
| | | | | | | |
| | | | | 11,321,467 | | |
| | | | | | | |
Health Care Equipment & Supplies - 4.54% | | | | | | | |
Ansell, Ltd. (Australia) | | 103,110 | | | 1,224,080 | | |
Becton, Dickinson and Co. | | 154,910 | | | 11,830,477 | | |
Boston Scientific Corp.* | | 1,139,970 | | | 7,842,994 | | |
Cochlear Ltd. (Australia) | | 16,840 | | | 1,154,630 | | |
Covidien plc (Ireland) | | 34,780 | | | 1,669,092 | | |
DENTSPLY International, Inc. | | 29,650 | | | 1,086,376 | | |
DexCom, Inc.* | | 66,455 | | | 727,682 | | |
Gen-Probe, Inc.* | | 24,410 | | | 1,156,790 | | |
Hologic, Inc.* | | 29,370 | | | 524,842 | | |
Insulet Corp.* | | 32,800 | | | 452,640 | | |
Inverness Medical Innovations, Inc.* | | 45,300 | | | 1,802,034 | | |
Mindray Medical International Ltd. - ADR (China) | | 22,250 | | | 849,950 | | |
Nobel Biocare Holding AG (Switzerland) | | 31,730 | | | 703,506 | | |
OraSure Technologies, Inc.* | | 154,150 | | | 977,311 | | |
Shandong Weigao Group Medical Polymer Co. Ltd. - Class H (China) | | 170,000 | | | 798,091 | | |
Sirona Dental Systems, Inc.* | | 22,290 | | | 929,270 | | |
Straumann Holding AG (Switzerland) | | 4,855 | | | 1,204,558 | | |
Teleflex, Inc. | | 12,410 | | | 760,981 | | |
Zoll Medical Corp.* | | 48,940 | | | 1,495,117 | | |
| | | | | | | |
| | | | | 37,190,421 | | |
| | | | | | | |
Health Care Providers & Services - 1.67% | | | | | | | |
Aetna, Inc. | | 14,010 | | | 413,996 | | |
AMN Healthcare Services, Inc.* | | 65,050 | | | 594,557 | | |
| | | | |
| | The accompanying notes are an integral part of the financial statements. | | 74 |
Investment Portfolio - April 30, 2010 (unaudited)
| | | | | | | |
| Pro-Blend® Extended Term Series | | Shares | | Value (Note 2) | | |
| | | |
COMMON STOCKS (continued) | | | | | | | |
| | | |
Health Care (continued) | | | | | | | |
Health Care Providers & Services (continued) | | | | | | | |
Bio-Reference Laboratories, Inc.* | | 26,640 | | $ | 623,376 | | |
Bumrungrad Hospital Public Co. Ltd. - NVDR (Thailand) | | 125,000 | | | 115,902 | | |
CIGNA Corp. | | 13,000 | | | 416,780 | | |
Diagnosticos da America S.A. (Brazil)* | | 148,020 | | | 1,279,022 | | |
OdontoPrev S.A. (Brazil) | | 12,020 | | | 394,501 | | |
Quest Diagnostics, Inc. | | 101,640 | | | 5,809,742 | | |
Sonic Healthcare Ltd. (Australia) | | 146,260 | | | 1,867,614 | | |
UnitedHealth Group, Inc. | | 13,270 | | | 402,214 | | |
VCA Antech, Inc.* | | 45,550 | | | 1,296,353 | | |
WellPoint, Inc.* | | 7,910 | | | 425,558 | | |
| | | | | | | |
| | | | | 13,639,615 | | |
| | | | | | | |
Health Care Technology - 0.85% | | | | | | | |
Allscripts - Misys Healthcare Solutions, Inc.* | | 26,850 | | | 541,565 | | |
Cerner Corp.* | | 53,823 | | | 4,570,111 | | |
Eclipsys Corp.* | | 90,990 | | | 1,881,673 | | |
| | | | | | | |
| | | | | 6,993,349 | | |
| | | | | | | |
Life Sciences Tools & Services - 1.83% | | | | | | | |
Caliper Life Sciences, Inc.* | | 258,184 | | | 1,035,318 | | |
ICON plc - ADR (Ireland)* | | 28,690 | | | 836,887 | | |
Lonza Group AG (Switzerland) | | 8,790 | | | 690,196 | | |
PerkinElmer, Inc. | | 162,045 | | | 4,059,227 | | |
Thermo Fisher Scientific, Inc.* | | 150,520 | | | 8,320,746 | | |
| | | | | | | |
| | | | | 14,942,374 | | |
| | | | | | | |
Pharmaceuticals - 1.71% | | | | | | | |
AstraZeneca plc (United Kingdom) | | 1,450 | | | 64,095 | | |
AstraZeneca plc - ADR (United Kingdom) | | 3,795 | | | 167,853 | | |
Bayer AG (Germany) | | 9,185 | | | 587,927 | | |
GlaxoSmithKline plc (United Kingdom) | | 13,455 | | | 249,308 | | |
Johnson & Johnson | | 180,090 | | | 11,579,787 | | |
Sanofi - Aventis S.A. (France) | | 2,170 | | | 149,259 | | |
Shire plc (Ireland) | | 15,285 | | | 337,473 | | |
Takeda Pharmaceutical Co. Ltd. (Japan) | | 3,000 | | | 129,345 | | |
UCB S.A. (Belgium) | | 18,190 | | | 705,987 | | |
| | | | | | | |
| | | | | 13,971,034 | | |
| | | | | | | |
Total Health Care | | | | | 98,058,260 | | |
| | | | | | | |
Industrials - 3.78% | | | | | | | |
Aerospace & Defense - 0.05% | | | | | | | |
Empresa Brasileira de Aeronautica S.A. (Embraer) - ADR (Brazil) | | 17,140 | | | 412,731 | | |
| | | | | | | |
| | | | |
| 75 | | The accompanying notes are an integral part of the financial statements. | | |
Investment Portfolio - April 30, 2010 (unaudited)
| | | | | | | |
| Pro-Blend® Extended Term Series | | Shares | | Value (Note 2) | | |
| | | |
COMMON STOCKS (continued) | | | | | | | |
| | | |
Industrials (continued) | | | | | | | |
Air Freight & Logistics - 1.19% | | | | | | | |
TNT N.V. (Netherlands) | | 22,154 | | $ | 680,790 | | |
United Parcel Service, Inc. - Class B | | 131,525 | | | 9,093,639 | | |
| | | | | | | |
| | | | | 9,774,429 | | |
| | | | | | | |
Airlines - 1.66% | | | | | | | |
AirTran Holdings, Inc.* | | 66,430 | | | 350,750 | | |
Copa Holdings S.A. - Class A (Panama) | | 3,420 | | | 193,846 | | |
Deutsche Lufthansa AG (Germany)* | | 16,205 | | | 270,781 | | |
Ryanair Holdings plc - ADR (Ireland)* | | 15,930 | | | 448,589 | | |
Singapore Airlines Ltd. (Singapore) | | 11,000 | | | 122,017 | | |
Southwest Airlines Co. | | 926,690 | | | 12,213,774 | | |
| | | | | | | |
| | | | | 13,599,757 | | |
| | | | | | | |
Commercial Services & Supplies - 0.11% | | | | | | | |
Tomra Systems ASA (Norway) | | 183,370 | | | 885,920 | | |
| | | | | | | |
Electrical Equipment - 0.17% | | | | | | | |
ABB Ltd. (Asea Brown Boveri) - ADR (Switzerland)* | | 25,630 | | | 491,071 | | |
Alstom S.A. (France) | | 3,070 | | | 181,815 | | |
Gamesa Corporacion Tecnologica S.A. (Spain) | | 10,800 | | | 133,745 | | |
Nexans S.A. (France) | | 2,900 | | | 230,244 | | |
Schneider Electric S.A. (France) | | 2,140 | | | 244,841 | | |
Yingli Green Energy Holding Co. Ltd. - ADR (China)* | | 7,270 | | | 91,820 | | |
| | | | | | | |
| | | | | 1,373,536 | | |
| | | | | | | |
Industrial Conglomerates - 0.18% | | | | | | | |
Siemens AG (Germany) | | 14,630 | | | 1,448,079 | | |
| | | | | | | |
Machinery - 0.18% | | | | | | | |
FANUC Ltd. (Japan) | | 7,000 | | | 832,384 | | |
Lindsay Corp. | | 3,690 | | | 140,331 | | |
SmartHeat, Inc. (China)* | | 8,230 | | | 69,050 | | |
Titan International, Inc. | | 11,060 | | | 137,254 | | |
Wabtec Corp. | | 5,710 | | | 271,682 | | |
| | | | | | | |
| | | | | 1,450,701 | | |
| | | | | | | |
Professional Services - 0.05% | | | | | | | |
Adecco S.A. (Switzerland) | | 2,420 | | | 142,796 | | |
Equifax, Inc. | | 8,980 | | | 301,728 | | |
| | | | | | | |
| | | | | 444,524 | | |
| | | | | | | |
Road & Rail - 0.16% | | | | | | | |
All America Latina Logistica S.A. (Brazil) | | 61,910 | | | 553,833 | | |
Canadian National Railway Co. (Canada) | | 2,600 | | | 155,454 | | |
Kansas City Southern* | | 4,620 | | | 187,341 | | |
Knight Transportation, Inc. | | 10,480 | | | 223,119 | | |
| | | | |
| | The accompanying notes are an integral part of the financial statements. | | 76 |
Investment Portfolio - April 30, 2010 (unaudited)
| | | | | | | |
| Pro-Blend® Extended Term Series | | Shares | | Value (Note 2) | | |
| | | |
COMMON STOCKS (continued) | | | | | | | |
| | | |
Industrials (continued) | | | | | | | |
Road & Rail (continued) | | | | | | | |
RailAmerica, Inc.* | | 12,120 | | $ | 156,227 | | |
| | | | | | | |
| | | | | 1,275,974 | | |
| | | | | | | |
Transportation Infrastructure - 0.03% | | | | | | | |
Malaysia Airports Holdings Berhad (Malaysia) | | 169,470 | | | 263,425 | | |
| | | | | | | |
Total Industrials | | | | | 30,929,076 | | |
| | | | | | | |
Information Technology - 14.95% | | | | | | | |
Communications Equipment - 2.93% | | | | | | | |
Alcatel-Lucent - ADR (France)* | | 189,230 | | | 599,859 | | |
Blue Coat Systems, Inc.* | | 33,530 | | | 1,090,731 | | |
Cisco Systems, Inc.* | | 446,380 | | | 12,016,549 | | |
Infinera Corp.* | | 94,440 | | | 864,126 | | |
Juniper Networks, Inc.* | | 166,320 | | | 4,725,151 | | |
QUALCOMM, Inc. | | 103,050 | | | 3,992,157 | | |
Riverbed Technology, Inc.* | | 21,740 | | | 673,723 | | |
| | | | | | | |
| | | | | 23,962,296 | | |
| | | | | | | |
Computers & Peripherals - 1.01% | | | | | | | |
Compellent Technologies, Inc.* | | 36,500 | | | 458,805 | | |
EMC Corp.* | | 409,690 | | | 7,788,207 | | |
| | | | | | | |
| | | | | 8,247,012 | | |
| | | | | | | |
Electronic Equipment, Instruments & Components - 0.15% | | | | | | | |
Cogent, Inc.* | | 65,610 | | | 679,064 | | |
Keyence Corp. (Japan) | | 563 | | | 134,794 | | |
LoJack Corp.* | | 104,135 | | | 435,284 | | |
| | | | | | | |
| | | | | 1,249,142 | | |
| | | | | | | |
Internet Software & Services - 2.47% | | | | | | | |
comScore, Inc.* | | 38,000 | | | 689,700 | | |
Google, Inc. - Class A* | | 36,050 | | | 18,942,112 | | |
NetEase.com, Inc. - ADR (China)* | | 4,390 | | | 153,079 | | |
Vocus, Inc.* | | 24,460 | | | 417,043 | | |
| | | | | | | |
| | | | | 20,201,934 | | |
| | | | | | | |
IT Services - 2.68% | | | | | | | |
Accenture plc - Class A (Ireland) | | 15,610 | | | 681,220 | | |
Amdocs Ltd. (Guernsey)* | | 44,470 | | | 1,420,372 | | |
Automatic Data Processing, Inc. | | 191,604 | | | 8,307,950 | | |
Cap Gemini S.A. (France) | | 13,920 | | | 707,157 | | |
Cielo S.A. (Brazil) | | 76,090 | | | 734,964 | | |
Paychex, Inc. | | 13,885 | | | 424,881 | | |
Redecard S.A. (Brazil) | | 44,820 | | | 744,142 | | |
| | | | |
| 77 | | The accompanying notes are an integral part of the financial statements. | | |
Investment Portfolio - April 30, 2010 (unaudited)
| | | | | | | |
| Pro-Blend® Extended Term Series | | Shares | | Value (Note 2) | | |
| | | |
COMMON STOCKS (continued) | | | | | | | |
| | | |
Information Technology (continued) | | | | | | | |
IT Services (continued) | | | | | | | |
The Western Union Co. | | 490,750 | | $ | 8,956,188 | | |
| | | | | | | |
| | | | | 21,976,874 | | |
| | | | | | | |
Semiconductors & Semiconductor Equipment - 0.34% | | | | | | | |
Advantest Corp. (Japan) | | 37,300 | | | 973,251 | | |
Hynix Semiconductor, Inc. (South Korea)* | | 7,010 | | | 179,622 | | |
KLA-Tencor Corp. | | 9,640 | | | 328,338 | | |
Sumco Corp. (Japan)* | | 12,000 | | | 267,632 | | |
Taiwan Semiconductor Manufacturing Co. Ltd. - ADR (Taiwan) | | 21,672 | | | 229,506 | | |
Tokyo Electron Ltd. (Japan) | | 12,000 | | | 793,315 | | |
| | | | | | | |
| | | | | 2,771,664 | | |
| | | | | | | |
Software - 5.37% | | | | | | | |
Autodesk, Inc.* | | 329,865 | | | 11,218,709 | | |
Electronic Arts, Inc.* | | 466,880 | | | 9,043,466 | | |
Microsoft Corp. | | 403,330 | | | 12,317,698 | | |
Misys plc (United Kingdom)* | | 55,900 | | | 200,226 | | |
Net 1 UEPS Technologies, Inc. (South Africa)* | | 31,000 | | | 508,400 | | |
SAP AG (Germany) | | 6,340 | | | 305,790 | | |
SAP AG - ADR (Germany) | | 185,050 | | | 8,780,622 | | |
Shanda Interactive Entertainment Ltd. - ADR (China)* | | 13,480 | | | 611,183 | | |
Sonic Solutions, Inc.* | | 29,330 | | | 368,091 | | |
Square Enix Holdings Co. Ltd. (Japan) | | 9,000 | | | 190,281 | | |
UbiSoft Entertainment S.A. (France)* | | 30,560 | | | 391,715 | | |
| | | | | | | |
| | | | | 43,936,181 | | |
| | | | | | | |
Total Information Technology | | | | | 122,345,103 | | |
| | | | | | | |
Materials - 1.41% | | | | | | | |
Chemicals - 1.40% | | | | | | | |
Arkema S.A. (France) | | 67 | | | 2,823 | | |
Calgon Carbon Corp.* | | 22,965 | | | 355,957 | | |
Johnson Matthey plc (United Kingdom) | | 6,390 | | | 170,414 | | |
Monsanto Co. | | 171,380 | | | 10,807,223 | | |
The Scotts Miracle-Gro Co. - Class A | | 2,670 | | | 129,362 | | |
| | | | | | | |
| | | | | 11,465,779 | | |
| | | | | | | |
Paper & Forest Products - 0.01% | | | | | | | |
Norbord, Inc. (Canada)* | | 4,854 | | | 95,044 | | |
| | | | | | | |
Total Materials | | | | | 11,560,823 | | |
| | | | | | | |
Telecommunication Services - 0.38% | | | | | | | |
Diversified Telecommunication Services - 0.07% | | | | | | | |
France Telecom S.A. (France) | | 12,170 | | | 266,471 | | |
| | | | |
| | The accompanying notes are an integral part of the financial statements. | | 78 |
Investment Portfolio - April 30, 2010 (unaudited)
| | | | | | | |
| Pro-Blend® Extended Term Series | | Shares | | Value (Note 2) | | |
| | | |
COMMON STOCKS (continued) | | | | | | | |
| | | |
Telecommunication Services (continued) | | | | | | | |
Diversified Telecommunication Services (continued) | | | | | | | |
Swisscom AG - ADR (Switzerland)2 | | 8,280 | | $ | 279,202 | | |
| | | | | | | |
| | | | | 545,673 | | |
| | | | | | | |
Wireless Telecommunication Services - 0.31% | | | | | | | |
American Tower Corp. - Class A* | | 10,780 | | | 439,932 | | |
Crown Castle International Corp.* | | 20,720 | | | 784,252 | | |
Hutchison Telecommunications International Ltd. (Hong Kong)* | | 105,000 | | | 29,346 | | |
SBA Communications Corp. - Class A* | | 22,550 | | | 797,593 | | |
SK Telecom Co. Ltd. - ADR (South Korea) | | 28,080 | | | 519,761 | | |
| | | | | | | |
| | | | | 2,570,884 | | |
| | | | | | | |
Total Telecommunication Services | | | | | 3,116,557 | | |
| | | | | | | |
Utilities - 0.15% | | | | | | | |
Electric Utilities - 0.06% | | | | | | | |
E.ON AG (Germany) | | 12,820 | | | 473,841 | | |
| | | | | | | |
Independent Power Producers & Energy Traders - 0.02% | | | | | | | |
Mirant Corp.* | | 6,150 | | | 71,709 | | |
RRI Energy, Inc.* | | 18,780 | | | 76,435 | | |
| | | | | | | |
| | | | | 148,144 | | |
| | | | | | | |
Multi-Utilities - 0.04% | | | | | | | |
GDF Suez (France) | | 4,147 | | | 147,950 | | |
National Grid plc (United Kingdom) | | 22,535 | | | 216,878 | | |
| | | | | | | |
| | | | | 364,828 | | |
| | | | | | | |
Water Utilities - 0.03% | | | | | | | |
Cia de Saneamento de Minas Gerais - Copasa MG (Brazil) | | 15,040 | | | 218,040 | | |
| | | | | | | |
Total Utilities | | | | | 1,204,853 | | |
| | | | | | | |
TOTAL COMMON STOCKS | | | | | | | |
(Identified Cost $397,189,511) | | | | | 452,131,619 | | |
| | | | | | | |
| | | |
PREFERRED STOCKS - 0.39% | | | | | | | |
| | | |
Consumer Staples - 0.02% | | | | | | | |
Household Products - 0.02% | | | | | | | |
Henkel AG & Co. KGaA (Germany) | | 3,800 | | | 203,519 | | |
| | | | | | | |
Financials - 0.37% | | | | | | | |
Commercial Banks - 0.17% | | | | | | | |
PNC Financial Services Group, Inc., Series K3 | | 480,000 | | | 509,477 | | |
Wells Fargo & Co., Series K | | 795,000 | | | 838,725 | | |
| | | | | | | |
| | | | | 1,348,202 | | |
| | | | | | | |
Diversified Financial Services - 0.20% | | | | | | | |
Bank of America Corp., Series K | | 845,000 | | | 850,636 | | |
| | | | |
| 79 | | The accompanying notes are an integral part of the financial statements. | | |
Investment Portfolio - April 30, 2010 (unaudited)
| | | | | | | |
| Pro-Blend® Extended Term Series | | Shares/
Principal Amount | | Value (Note 2) | | |
| | | |
PREFERRED STOCKS (continued) | | | | | | | |
| | | |
Financials (continued) | | | | | | | |
Diversified Financial Services (continued) | | | | | | | |
JPMorgan Chase & Co., Series 1 | | 755,000 | | $ | 792,939 | | |
| | | | | | | |
| | | | | 1,643,575 | | |
| | | | | | | |
Total Financials | | | | | 2,991,777 | | |
| | | | | | | |
TOTAL PREFERRED STOCKS | | | | | | | |
(Identified Cost $2,884,251) | | | | | 3,195,296 | | |
| | | | | | | |
| | | |
WARRANTS - 0.00%** | | | | | | | |
| | | |
Health Care - 0.00%** | | | | | | | |
Life Sciences Tools & Services - 0.00%** | | | | | | | |
Caliper Life Sciences, Inc., 8/10/2011* | | | | | | | |
(Identified Cost $5,289) | | 8,377 | | | 2,137 | | |
| | | | | | | |
| | | |
CORPORATE BONDS - 17.83% | | | | | | | |
| | | |
Convertible Corporate Bonds - 0.34% | | | | | | | |
Consumer Discretionary - 0.04% | | | | | | | |
Hotels, Restaurants & Leisure - 0.04% | | | | | | | |
Carnival Corp., 2.00%, 4/15/2021 | | $ 315,000 | | | 355,162 | | |
| | | | | | | |
Energy - 0.07% | | | | | | | |
Energy Equipment & Services - 0.07% | | | | | | | |
Schlumberger Ltd., Series B, 2.125%, 6/1/2023 | | 330,000 | | | 594,000 | | |
| | | | | | | |
Health Care - 0.10% | | | | | | | |
Biotechnology - 0.08% | | | | | | | |
Amgen, Inc., 0.375%, 2/1/2013 | | 635,000 | | | 638,969 | | |
| | | | | | | |
Health Care Equipment & Supplies - 0.02% | | | | | | | |
Medtronic, Inc., 1.625%, 4/15/2013 | | 140,000 | | | 148,225 | | |
| | | | | | | |
Total Health Care | | | | | 787,194 | | |
| | | | | | | |
Industrials - 0.02% | | | | | | | |
Airlines - 0.02% | | | | | | | |
AirTran Holdings, Inc., 5.25%, 11/1/2016 | | 125,000 | | | 139,688 | | |
| | | | | | | |
Information Technology - 0.11% | | | | | | | |
Computers & Peripherals - 0.05% | | | | | | | |
EMC Corp., 1.75%, 12/1/2013 | | 335,000 | | | 436,337 | | |
| | | | | | | |
Semiconductors & Semiconductor Equipment - 0.06% | | | | | | | |
Advanced Micro Devices, Inc., 6.00%, 5/1/2015 | | 465,000 | | | 448,144 | | |
| | | | | | | |
Total Information Technology | | | | | 884,481 | | |
| | | | | | | |
Total Convertible Corporate Bonds | | | | | | | |
(Identified Cost $2,595,793) | | | | | 2,760,525 | | |
| | | | | | | |
| | | | |
| | The accompanying notes are an integral part of the financial statements. | | 80 |
Investment Portfolio - April 30, 2010 (unaudited)
| | | | | | | |
| Pro-Blend® Extended Term Series | | Principal Amount | | Value (Note 2) | | |
| | | |
CORPORATE BONDS (continued) | | | | | | | |
| | | |
Non-Convertible Corporate Bonds - 17.49% | | | | | | | |
Consumer Discretionary - 2.33% | | | | | | | |
Diversified Consumer Services - 0.06% | | | | | | | |
Affinion Group, Inc., 11.50%, 10/15/2015 | | $ 470,000 | | $ | 495,850 | | |
| | | | | | | |
Hotels, Restaurants & Leisure - 0.59% | | | | | | | |
International Game Technology, 7.50%, 6/15/2019 | | 860,000 | | | 1,001,350 | | |
McDonald’s Corp., 5.80%, 10/15/2017 | | 620,000 | | | 701,668 | | |
McDonald’s Corp., 6.30%, 10/15/2037 | | 690,000 | | | 772,984 | | |
Scientific Games Corp.4 , 7.875%, 6/15/2016 | | 370,000 | | | 374,162 | | |
Scientific Games International, Inc.4 , 9.25%, 6/15/2019 | | 410,000 | | | 441,775 | | |
Wendy’s - Arby’s Restaurants LLC, 10.00%, 7/15/2016 | | 560,000 | | | 602,000 | | |
Wyndham Worldwide Corp., 9.875%, 5/1/2014 | | 230,000 | | | 262,161 | | |
Wyndham Worldwide Corp., 6.00%, 12/1/2016 | | 425,000 | | | 423,225 | | |
Yonkers Racing Corp.4 , 11.375%, 7/15/2016 | | 230,000 | | | 251,850 | | |
| | | | | | | |
| | | | | 4,831,175 | | |
| | | | | | | |
Household Durables - 0.12% | | | | | | | |
Fortune Brands, Inc., 5.375%, 1/15/2016 | | 940,000 | | | 989,936 | | |
| | | | | | | |
Media - 0.99% | | | | | | | |
Cablevision Systems Corp.4 , 8.625%, 9/15/2017 | | 690,000 | | | 727,950 | | |
Columbus International, Inc. (Barbados)4 , 11.50%, 11/20/2014 | | 295,000 | | | 324,146 | | |
Comcast Corp., 6.50%, 11/15/2035 | | 670,000 | | | 706,323 | | |
Comcast Corp., 6.95%, 8/15/2037 | | 1,310,000 | | | 1,458,998 | | |
DIRECTV Holdings LLC4 , 5.20%, 3/15/2020 | | 1,140,000 | | | 1,149,467 | | |
MDC Partners, Inc. (Canada)4 , 11.00%, 11/1/2016 | | 135,000 | | | 147,825 | | |
Sirius XM Radio, Inc.4 , 9.75%, 9/1/2015 | | 115,000 | | | 125,638 | | |
Time Warner, Inc., 7.625%, 4/15/2031 | | 845,000 | | | 981,922 | | |
Unitymedia Hessen GmbH & Co. KG (Germany)4 , 8.125%, 12/1/2017 | | 175,000 | | | 178,500 | | |
Unitymedia Hessen GmbH & Co. KG (Germany)4 , 8.125%, 12/1/2017 | | 195,000 | | | 267,422 | | |
UPC Holding B.V. (Netherlands)4 , 9.875%, 4/15/2018 | | 400,000 | | | 422,000 | | |
Virgin Media Finance plc (United Kingdom), 8.375%, 10/15/2019 | | 105,000 | | | 109,987 | | |
Virgin Media Finance plc, Series 1 (United Kingdom), 9.50%, 8/15/2016 | | 325,000 | | | 356,687 | | |
The Walt Disney Co., Series B, 7.00%, 3/1/2032 | | 380,000 | | | 460,866 | | |
WMG Acquisition Corp.4 , 9.50%, 6/15/2016 | | 365,000 | | | 394,200 | | |
XM Satellite Radio, Inc.4 , 11.25%, 6/15/2013 | | 245,000 | | | 268,888 | | |
| | | | | | | |
| | | | | 8,080,819 | | |
| | | | | | | |
Multiline Retail - 0.12% | | | | | | | |
Target Corp., 6.00%, 1/15/2018 | | 845,000 | | | 967,238 | | |
| | | | | | | |
Specialty Retail - 0.32% | | | | | | | |
The Home Depot, Inc., 5.40%, 3/1/2016 | | 900,000 | | | 987,173 | | |
Lowe’s Companies, Inc., 6.10%, 9/15/2017 | | 850,000 | | | 973,476 | | |
Toys R Us Property Co. LLC4 , 8.50%, 12/1/2017 | | 595,000 | | | 629,213 | | |
| | | | | | | |
| | | | | 2,589,862 | | |
| | | | | | | |
| | | | |
| 81 | | The accompanying notes are an integral part of the financial statements. | | |
Investment Portfolio - April 30, 2010 (unaudited)
| | | | | | | |
| Pro-Blend® Extended Term Series | | Principal Amount | | Value (Note 2) | | |
| | | |
CORPORATE BONDS (continued) | | | | | | | |
| | | |
Non-Convertible Corporate Bonds (continued) | | | | | | | |
Consumer Discretionary (continued) | | | | | | | |
Textiles, Apparel & Luxury Goods - 0.13% | | | | | | | |
Levi Strauss & Co., 8.625%, 4/1/2013 | | $ 100,000 | | $ | 135,808 | | |
VF Corp., 5.95%, 11/1/2017 | | 880,000 | | | 976,363 | | |
| | | | | | | |
| | | | | 1,112,171 | | |
| | | | | | | |
Total Consumer Discretionary | | | | | 19,067,051 | | |
| | | | | | | |
Consumer Staples - 0.90% | | | | | | | |
Beverages - 0.44% | | | | | | | |
CEDC Finance Corp. International, Inc.4 , 9.125%, 12/1/2016 | | 600,000 | | | 636,000 | | |
The Coca-Cola Co., 5.35%, 11/15/2017 | | 630,000 | | | 701,767 | | |
Constellation Brands, Inc., 8.375%, 12/15/2014 | | 590,000 | | | 632,775 | | |
PepsiCo, Inc., 5.00%, 6/1/2018 | | 620,000 | | | 664,310 | | |
PepsiCo, Inc., 7.90%, 11/1/2018 | | 760,000 | | | 958,663 | | |
| | | | | | | |
| | | | | 3,593,515 | | |
| | | | | | | |
Food & Staples Retailing - 0.11% | | | | | | | |
Ingles Markets, Inc., 8.875%, 5/15/2017 | | 215,000 | | | 227,362 | | |
The Kroger Co., 6.75%, 4/15/2012 | | 605,000 | | | 660,388 | | |
| | | | | | | |
| | | | | 887,750 | | |
| | | | | | | |
Food Products - 0.24% | | | | | | | |
General Mills, Inc., 5.65%, 2/15/2019 | | 880,000 | | | 961,997 | | |
Kraft Foods, Inc., 6.125%, 2/1/2018 | | 895,000 | | | 988,647 | | |
| | | | | | | |
| | | | | 1,950,644 | | |
| | | | | | | |
Personal Products - 0.11% | | | | | | | |
Revlon Consumer Products Corp.4 , 9.75%, 11/15/2015 | | 940,000 | | | 965,850 | | |
| | | | | | | |
Total Consumer Staples | | | | | 7,397,759 | | |
| | | | | | | |
Energy - 1.45% | | | | | | | |
Energy Equipment & Services - 0.53% | | | | | | | |
Baker Hughes, Inc., 7.50%, 11/15/2018 | | 580,000 | | | 706,229 | | |
Cie Generale de Geophysique - Veritas (France), 7.75%, 5/15/2017 | | 655,000 | | | 661,550 | | |
Complete Production Services, Inc., 8.00%, 12/15/2016 | | 430,000 | | | 439,675 | | |
Hornbeck Offshore Services, Inc., 8.00%, 9/1/2017 | | 90,000 | | | 91,350 | | |
Hornbeck Offshore Services, Inc., Series B, 6.125%, 12/1/2014 | | 575,000 | | | 571,406 | | |
Key Energy Services, Inc., 8.375%, 12/1/2014 | | 410,000 | | | 418,200 | | |
Thermon Industries, Inc.4 , 9.50%, 5/1/2017 | | 465,000 | | | 474,300 | | |
Weatherford International Ltd. (Switzerland), 9.625%, 3/1/2019 | | 770,000 | | | 995,837 | | |
| | | | | | | |
| | | | | 4,358,547 | | |
| | | | | | | |
Oil, Gas & Consumable Fuels - 0.92% | | | | | | | |
Alon Refining Krotz Springs, Inc., 13.50%, 10/15/2014 | | 250,000 | | | 245,000 | | |
Anadarko Petroleum Corp., 5.95%, 9/15/2016 | | 345,000 | | | 382,972 | | |
| | | | |
| | The accompanying notes are an integral part of the financial statements. | | 82 |
Investment Portfolio - April 30, 2010 (unaudited)
| | | | | | | |
| Pro-Blend® Extended Term Series | | Principal Amount | | Value (Note 2) | | |
| | | |
CORPORATE BONDS (continued) | | | | | | | |
| | | |
Non-Convertible Corporate Bonds (continued) | | | | | | | |
Energy (continued) | | | | | | | |
Oil, Gas & Consumable Fuels (continued) | | | | | | | |
Anadarko Petroleum Corp., 8.70%, 3/15/2019 | | $ 580,000 | | $ | 729,207 | | |
Apache Corp., 6.90%, 9/15/2018 | | 600,000 | | | 715,058 | | |
Aquilex Holdings LLC - Aquilex Finance Corp.4 , 11.125%, 12/15/2016 | | 245,000 | | | 265,825 | | |
Arch Coal, Inc.4 , 8.75%, 8/1/2016 | | 185,000 | | | 197,025 | | |
Arch Western Finance LLC, 6.75%, 7/1/2013 | | 440,000 | | | 443,300 | | |
Chesapeake Energy Corp., 9.50%, 2/15/2015 | | 190,000 | | | 208,288 | | |
Chesapeake Energy Corp., 6.875%, 1/15/2016 | | 410,000 | | | 408,975 | | |
Coffeyville Resources LLC - Coffeyville Finance, Inc.4 , 9.00%, 4/1/2015 | | 225,000 | | | 229,500 | | |
Coffeyville Resources LLC - Coffeyville Finance, Inc.4 , 10.875%, 4/1/2017 | | 215,000 | | | 219,300 | | |
Crosstex Energy - Crosstex Energy Finance Corp.4 , 8.875%, 2/15/2018 | | 425,000 | | | 442,000 | | |
Gibson Energy ULC - GEP Midstream Finance Corp. (Canada)4 , 11.75%, 5/27/2014 | | 185,000 | | | 205,350 | | |
Gibson Energy ULC - GEP Midstream Finance Corp. (Canada)4 , 10.00%, 1/15/2018 | | 220,000 | | | 220,000 | | |
Martin Midstream Partners LP - Martin Midstream Finance Corp.4 , 8.875%, 4/1/2018 | | 460,000 | | | 466,900 | | |
Niska Gas Storage US LLC - Niska Gas Storage Canada ULC4 , 8.875%, 3/15/2018 | | 320,000 | | | 334,400 | | |
Plains Exploration & Production Co., 8.625%, 10/15/2019 | | 465,000 | | | 491,737 | | |
Targa Resources Partners LP - Targa Resources Partners Finance Corp., 8.25%, 7/1/2016 | | 465,000 | | | 474,300 | | |
Tesoro Corp., 9.75%, 6/1/2019 | | 650,000 | | | 698,750 | | |
Whiting Petroleum Corp., 7.00%, 2/1/2014 | | 125,000 | | | 129,062 | | |
| | | | | | | |
| | | | | 7,506,949 | | |
| | | | | | | |
Total Energy | | | | | 11,865,496 | | |
| | | | | | | |
Financials - 5.98% | | | | | | | |
Capital Markets - 1.66% | | | | | | | |
Goldman Sachs Capital I, 6.345%, 2/15/2034 | | 1,020,000 | | | 912,781 | | |
Goldman Sachs Capital II5 , 5.793%, 12/29/2049 | | 1,000,000 | | | 791,250 | | |
The Goldman Sachs Group, Inc.6 , 3.25%, 6/15/2012 | | 9,123,000 | | | 9,522,651 | | |
The Goldman Sachs Group, Inc., 6.15%, 4/1/2018 | | 885,000 | | | 916,774 | | |
Merrill Lynch & Co., Inc., 6.11%, 1/29/2037 | | 510,000 | | | 471,698 | | |
Morgan Stanley, 5.55%, 4/27/2017 | | 945,000 | | | 949,547 | | |
| | | | | | | |
| | | | | 13,564,701 | | |
| | | | | | | |
Commercial Banks - 1.17% | | | | | | | |
Household Finance Co., 6.375%, 11/27/2012 | | 435,000 | | | 477,717 | | |
HSBC Finance Corp., 7.00%, 5/15/2012 | | 700,000 | | | 765,393 | | |
KeyBank National Association, 5.45%, 3/3/2016 | | 1,110,000 | | | 1,130,509 | | |
Manufacturers & Traders Trust Co., 6.625%, 12/4/2017 | | 1,165,000 | | | 1,267,231 | | |
| | | | |
| 83 | | The accompanying notes are an integral part of the financial statements. | | |
Investment Portfolio - April 30, 2010 (unaudited)
| | | | | | | |
| Pro-Blend® Extended Term Series | | Principal Amount | | Value (Note 2) | | |
| | | |
CORPORATE BONDS (continued) | | | | | | | |
| | | |
Non-Convertible Corporate Bonds (continued) | | | | | | | |
Financials (continued) | | | | | | | |
Commercial Banks (continued) | | | | | | | |
PNC Bank National Association3 , 5.25%, 1/15/2017 | | $ 1,035,000 | | $ | 1,071,877 | | |
U.S. Bank National Association, 6.375%, 8/1/2011 | | 575,000 | | | 611,158 | | |
U.S. Bank National Association, 6.30%, 2/4/2014 | | 555,000 | | | 624,174 | | |
USB Capital XIII Trust, 6.625%, 12/15/2039 | | 540,000 | | | 567,869 | | |
Wachovia Corp., 5.25%, 8/1/2014 | | 915,000 | | | 970,712 | | |
Wells Fargo & Co.6 , 3.00%, 12/9/2011 | | 2,010,000 | | | 2,078,055 | | |
| | | | | | | |
| | | | | 9,564,695 | | |
| | | | | | | |
Consumer Finance - 0.27% | | | | | | | |
American Express Co., 8.125%, 5/20/2019 | | 800,000 | | | 979,833 | | |
American Express Co.5 , 6.80%, 9/1/2066 | | 870,000 | | | 856,950 | | |
Credit Acceptance Corp.4 , 9.125%, 2/1/2017 | | 395,000 | | | 412,775 | | |
| | | | | | | |
| | | | | 2,249,558 | | |
| | | | | | | |
Diversified Financial Services - 1.72% | | | | | | | |
Bank of America Corp.6 , 3.125%, 6/15/2012 | | 6,102,000 | | | 6,343,041 | | |
Bank of America Corp., 5.75%, 8/15/2016 | | 685,000 | | | 702,857 | | |
Bank of America Corp., 7.625%, 6/1/2019 | | 825,000 | | | 941,752 | | |
Citigroup Funding, Inc.6 , 1.875%, 10/22/2012 | | 3,892,000 | | | 3,933,606 | | |
JPMorgan Chase & Co.6 , 3.125%, 12/1/2011 | | 1,195,000 | | | 1,237,064 | | |
JPMorgan Chase & Co., 6.30%, 4/23/2019 | | 860,000 | | | 954,408 | | |
| | | | | | | |
| | | | | 14,112,728 | | |
| | | | | | | |
Insurance - 0.17% | | | | | | | |
American International Group, Inc., 4.25%, 5/15/2013 | | 345,000 | | | 336,950 | | |
Fidelity National Financial, Inc., 6.60%, 5/15/2017 | | 530,000 | | | 530,090 | | |
Hartford Financial Services Group, Inc.5 , 8.125%, 6/15/2038 | | 475,000 | | | 489,250 | | |
| | | | | | | |
| | | | | 1,356,290 | | |
| | | | | | | |
Real Estate Investment Trusts (REITS) - 0.99% | | | | | | | |
AvalonBay Communities, Inc., 6.10%, 3/15/2020 | | 920,000 | | | 997,028 | | |
Boston Properties LP, 5.875%, 10/15/2019 | | 945,000 | | | 1,002,131 | | |
Camden Property Trust, 5.70%, 5/15/2017 | | 980,000 | | | 975,501 | | |
DuPont Fabros Technology LP4 , 8.50%, 12/15/2017 | | 785,000 | | | 814,437 | | |
Felcor Lodging LP, 10.00%, 10/1/2014 | | 455,000 | | | 475,475 | | |
HCP, Inc., 6.70%, 1/30/2018 | | 935,000 | | | 977,002 | | |
Health Care REIT, Inc., 6.20%, 6/1/2016 | | 510,000 | | | 547,960 | | |
Host Hotels & Resorts LP, 6.875%, 11/1/2014 | | 295,000 | | | 299,794 | | |
Mack-Cali Realty LP, 7.75%, 8/15/2019 | | 485,000 | | | 568,810 | | |
Omega Healthcare Investors, Inc.4 , 7.50%, 2/15/2020 | | 425,000 | | | 436,687 | | |
| | | | |
| | The accompanying notes are an integral part of the financial statements. | | 84 |
Investment Portfolio - April 30, 2010 (unaudited)
| | | | | | | |
| Pro-Blend® Extended Term Series | | Principal Amount | | Value (Note 2) | | |
| | | |
CORPORATE BONDS (continued) | | | | | | | |
| | | |
Non-Convertible Corporate Bonds (continued) | | | | | | | |
Financials (continued) | | | | | | | |
Real Estate Investment Trusts (REITS) (continued) | | | | | | | |
Simon Property Group LP, 10.35%, 4/1/2019 | | $ 750,000 | | $ | 971,873 | | |
| | | | | | | |
| | | | | 8,066,698 | | |
| | | | | | | |
Total Financials | | | | | 48,914,670 | | |
| | | | | | | |
Health Care - 0.78% | | | | | | | |
Biotechnology - 0.02% | | | | | | | |
Talecris Biotherapeutics Holdings Corp.4 , 7.75%, 11/15/2016 | | 215,000 | | | 217,150 | | |
| | | | | | | |
Health Care Equipment & Supplies - 0.28% | | | | | | | |
Becton, Dickinson and Co., 6.00%, 5/15/2039 | | 885,000 | | | 962,375 | | |
Fresenius Medical Care Capital Trust IV, 7.875%, 6/15/2011 | | 245,000 | | | 257,250 | | |
Fresenius US Finance II, Inc.4 , 9.00%, 7/15/2015 | | 145,000 | | | 163,125 | | |
Inverness Medical Innovations, Inc., 7.875%, 2/1/2016 | | 395,000 | | | 389,075 | | |
Inverness Medical Innovations, Inc., 9.00%, 5/15/2016 | | 504,000 | | | 514,080 | | |
| | | | | | | |
| | | | | 2,285,905 | | |
| | | | | | | |
Health Care Providers & Services - 0.19% | | | | | | | |
BioScrip, Inc.4 , 10.25%, 10/1/2015 | | 430,000 | | | 440,750 | | |
HCA, Inc.4 , 7.875%, 2/15/2020 | | 415,000 | | | 446,644 | | |
Health Management Associates, Inc., 6.125%, 4/15/2016 | | 670,000 | | | 647,387 | | |
| | | | | | | |
| | | | | 1,534,781 | | |
| | | | | | | |
Life Sciences Tools & Services - 0.06% | | | | | | | |
PharmaNet Development Group, Inc.4 , 10.875%, 4/15/2017 | | 455,000 | | | 465,806 | | |
| | | | | | | |
Pharmaceuticals - 0.23% | | | | | | | |
Johnson & Johnson, 5.95%, 8/15/2037 | | 565,000 | | | 629,007 | | |
Valeant Pharmaceuticals International4 , 7.625%, 3/15/2020 | | 465,000 | | | 473,137 | | |
Wyeth, 6.50%, 2/1/2034 | | 700,000 | | | 800,218 | | |
| | | | | | | |
| | | | | 1,902,362 | | |
| | | | | | | |
Total Health Care | | | | | 6,406,004 | | |
| | | | | | | |
Industrials - 2.81% | | | | | | | |
Aerospace & Defense - 0.24% | | | | | | | |
The Boeing Co., 6.00%, 3/15/2019 | | 860,000 | | | 966,057 | | |
GeoEye, Inc.4 , 9.625%, 10/1/2015 | | 250,000 | | | 260,312 | | |
Honeywell International, Inc., 5.30%, 3/1/2018 | | 660,000 | | | 713,595 | | |
| | | | | | | |
| | | | | 1,939,964 | | |
| | | | | | | |
Air Freight & Logistics - 0.21% | | | | | | | |
FedEx Corp., 8.00%, 1/15/2019 | | 785,000 | | | 980,172 | | |
United Parcel Service, Inc., 6.20%, 1/15/2038 | | 645,000 | | | 725,690 | | |
| | | | | | | |
| | | | | 1,705,862 | | |
| | | | | | | |
| | | | |
| 85 | | The accompanying notes are an integral part of the financial statements. | | |
Investment Portfolio - April 30, 2010 (unaudited)
| | | | | | | |
| Pro-Blend® Extended Term Series | | Principal Amount | | Value (Note 2) | | |
| | | |
CORPORATE BONDS (continued) | | | | | | | |
| | | |
Non-Convertible Corporate Bonds (continued) | | | | | | | |
Industrials (continued) | | | | | | | |
Airlines - 0.46% | | | | | | | |
AirTran Airways, Inc.7,8 , 10.41%, 4/1/2017 | | $ 331,160 | | $ | 320,397 | | |
Delta Air Lines, Inc.4 , 9.50%, 9/15/2014 | | 795,000 | | | 841,706 | | |
Southwest Airlines Co., 5.25%, 10/1/2014 | | 945,000 | | | 986,811 | | |
Southwest Airlines Co., 5.75%, 12/15/2016 | | 1,580,000 | | | 1,632,998 | | |
| | | | | | | |
| | | | | 3,781,912 | | |
| | | | | | | |
Building Products - 0.10% | | | | | | | |
Building Materials Corp. of America4 , 7.50%, 3/15/2020 | | 215,000 | | | 214,462 | | |
Owens Corning, 9.00%, 6/15/2019 | | 335,000 | | | 404,455 | | |
USG Corp.4 , 9.75%, 8/1/2014 | | 185,000 | | | 199,800 | | |
| | | | | | | |
| | | | | 818,717 | | |
| | | | | | | |
Commercial Services & Supplies - 0.31% | | | | | | | |
ACCO Brands Corp.4 , 10.625%, 3/15/2015 | | 250,000 | | | 276,875 | | |
Clean Harbors, Inc., 7.625%, 8/15/2016 | | 460,000 | | | 478,975 | | |
Corrections Corp. of America, 6.25%, 3/15/2013 | | 245,000 | | | 248,675 | | |
Corrections Corp. of America, 7.75%, 6/1/2017 | | 145,000 | | | 153,700 | | |
Garda World Security Corp. (Canada)4 , 9.75%, 3/15/2017 | | 425,000 | | | 440,406 | | |
Waste Management, Inc., 7.375%, 3/11/2019 | | 815,000 | | | 967,395 | | |
| | | | | | | |
| | | | | 2,566,026 | | |
| | | | | | | |
Industrial Conglomerates - 0.85% | | | | | | | |
General Electric Capital Corp.6 , 3.00%, 12/9/2011 | | 2,630,000 | | | 2,718,194 | | |
General Electric Capital Corp., 5.625%, 5/1/2018 | | 460,000 | | | 487,416 | | |
General Electric Capital Corp.5 , 6.375%, 11/15/2067 | | 895,000 | | | 856,963 | | |
General Electric Capital Corp., Series A, 6.75%, 3/15/2032 | | 915,000 | | | 997,874 | | |
General Electric Co., 5.25%, 12/6/2017 | | 765,000 | | | 813,655 | | |
Textron, Inc., 7.25%, 10/1/2019 | | 940,000 | | | 1,033,606 | | |
| | | | | | | |
| | | | | 6,907,708 | | |
| | | | | | | |
Machinery - 0.33% | | | | | | | |
Caterpillar Financial Services Corp., 7.05%, 10/1/2018 | | 815,000 | | | 958,900 | | |
John Deere Capital Corp., 5.50%, 4/13/2017 | | 275,000 | | | 303,204 | | |
John Deere Capital Corp., 5.75%, 9/10/2018 | | 1,295,000 | | | 1,446,441 | | |
| | | | | | | |
| | | | | 2,708,545 | | |
| | | | | | | |
Marine - 0.06% | | | | | | | |
Navios Maritime Holdings, Inc. - Navios Maritime Finance US, Inc. (Marshall Island)4 , 8.875%, 11/1/2017 | | 195,000 | | | 203,775 | | |
United Maritime Group LLC - United Maritime Group Finance Corp.4 , 11.75%, 6/15/2015 | | 245,000 | | | 254,800 | | |
| | | | | | | |
| | | | | 458,575 | | |
| | | | | | | |
| | | | |
| | The accompanying notes are an integral part of the financial statements. | | 86 |
Investment Portfolio - April 30, 2010 (unaudited)
| | | | | | | |
| Pro-Blend® Extended Term Series | | Principal Amount | | Value (Note 2) | | |
| | | |
CORPORATE BONDS (continued) | | | | | | | |
| | | |
Non-Convertible Corporate Bonds (continued) | | | | | | | |
Industrials (continued) | | | | | | | |
Road & Rail - 0.25% | | | | | | | |
CSX Corp., 6.00%, 10/1/2036 | | $ 950,000 | | $ | 972,860 | | |
RailAmerica, Inc., 9.25%, 7/1/2017 | | 321,000 | | | 345,878 | | |
Union Pacific Corp., 5.65%, 5/1/2017 | | 700,000 | | | 757,322 | | |
| | | | | | | |
| | | | | 2,076,060 | | |
| | | | | | | |
Total Industrials | | | | | 22,963,369 | | |
| | | | | | | |
Information Technology - 0.63% | | | | | | | |
Communications Equipment - 0.31% | | | | | | | |
Alcatel-Lucent USA, Inc., 6.45%, 3/15/2029 | | 540,000 | | | 395,550 | | |
Cisco Systems, Inc., 5.90%, 2/15/2039 | | 925,000 | | | 969,800 | | |
Hughes Network Systems LLC - HNS Finance Corp., 9.50%, 4/15/2014 | | 650,000 | | | 669,500 | | |
Nokia Corp. (Finland), 5.375%, 5/15/2019 | | 460,000 | | | 487,834 | | |
| | | | | | | |
| | | | | 2,522,684 | | |
| | | | | | | |
Computers & Peripherals - 0.08% | | | | | | | |
International Business Machines Corp., 5.60%, 11/30/2039 | | 616,000 | | | 640,590 | | |
| | | | | | | |
Electronic Equipment, Instruments & Components - 0.10% | | | | | | | |
Corning, Inc., 6.20%, 3/15/2016 | | 720,000 | | | 794,126 | | |
| | | | | | | |
Semiconductors & Semiconductor Equipment - 0.06% | | | | | | | |
MagnaChip Semiconductor S.A. - MagnaChip Semiconductor Finance Co.4 , 10.50%, 4/15/2018 | | 455,000 | | | 480,025 | | |
| | | | | | | |
Software - 0.08% | | | | | | | |
Microsoft Corp., 5.20%, 6/1/2039 | | 690,000 | | | 704,597 | | |
| | | | | | | |
Total Information Technology | | | | | 5,142,022 | | |
| | | | | | | |
Materials - 1.54% | | | | | | | |
Chemicals - 0.14% | | | | | | | |
E.I. du Pont de Nemours & Co., 6.00%, 7/15/2018 | | 855,000 | | | 963,235 | | |
Solutia, Inc., 7.875%, 3/15/2020 | | 215,000 | | | 221,988 | | |
| | | | | | | |
| | | | | 1,185,223 | | |
| | | | | | | |
Containers & Packaging - 0.17% | | | | | | | |
Ball Corp., 6.625%, 3/15/2018 | | 245,000 | | | 249,288 | | |
BWAY Corp., 10.00%, 4/15/2014 | | 585,000 | | | 640,575 | | |
Reynolds Group Issuer, Inc. - Reynolds Group Issuer LLC4 , 8.50%, 5/15/2018 | | 480,000 | | | 483,600 | | |
| | | | | | | |
| | | | | 1,373,463 | | |
| | | | | | | |
Metals & Mining - 0.62% | | | | | | | |
Alcoa, Inc., 5.72%, 2/23/2019 | | 3,122,000 | | | 3,081,436 | | |
Alcoa, Inc., 5.87%, 2/23/2022 | | 405,000 | | | 389,306 | | |
BHP Billiton Finance (USA) Ltd. (Australia), 6.50%, 4/1/2019 | | 830,000 | | | 961,483 | | |
| | | | |
| 87 | | The accompanying notes are an integral part of the financial statements. | | |
Investment Portfolio - April 30, 2010 (unaudited)
| | | | | | | |
| Pro-Blend® Extended Term Series | | Principal Amount | | Value (Note 2) | | |
| | | |
CORPORATE BONDS (continued) | | | | | | | |
| | | |
Non-Convertible Corporate Bonds (continued) | | | | | | | |
Materials (continued) | | | | | | | |
Metals & Mining (continued) | | | | | | | |
Essar Steel Algoma, Inc. (Canada)4 , 9.375%, 3/15/2015 | | $ 225,000 | | $ | 230,625 | | |
Steel Dynamics, Inc., 7.75%, 4/15/2016 | | 425,000 | | | 443,594 | | |
| | | | | | | |
| | | | | 5,106,444 | | |
| | | | | | | |
Paper & Forest Products - 0.61% | | | | | | | |
Georgia-Pacific LLC4 , 8.25%, 5/1/2016 | | 290,000 | | | 317,550 | | |
Georgia-Pacific LLC4 , 7.125%, 1/15/2017 | | 370,000 | | | 390,350 | | |
International Paper Co., 9.375%, 5/15/2019 | | 2,562,000 | | | 3,258,843 | | |
International Paper Co., 7.50%, 8/15/2021 | | 865,000 | | | 1,016,037 | | |
| | | | | | | |
| | | | | 4,982,780 | | |
| | | | | | | |
Total Materials | | | | | 12,647,910 | | |
| | | | | | | |
Telecommunication Services - 0.62% | | | | | | | |
Diversified Telecommunication Services - 0.22% | | | | | | | |
Clearwire Communications LLC - Clearwire Finance, Inc.4 , 12.00%, 12/1/2015 | | 130,000 | | | 135,525 | | |
Clearwire Communications LLC - Clearwire Finance, Inc.4 , 12.00%, 12/1/2015 | | 310,000 | | | 321,625 | | |
Intelsat Subsidiary Holding Co. Ltd. (Bermuda)4 , 8.875%, 1/15/2015 | | 635,000 | | | 657,225 | | |
Wind Acquisition Finance S.A. (Luxembourg)4 , 11.75%, 7/15/2017 | | 585,000 | | | 650,813 | | |
| | | | | | | |
| | | | | 1,765,188 | | |
| | | | | | | |
Wireless Telecommunication Services - 0.40% | | | | | | | |
CC Holdings GS V LLC - Crown Castle GS III Corp.4 , 7.75%, 5/1/2017 | | 465,000 | | | 505,687 | | |
Crown Castle Towers LLC4 , 6.113%, 1/15/2020 | | 1,045,000 | | | 1,110,853 | | |
NII Capital Corp.4 , 8.875%, 12/15/2019 | | 590,000 | | | 625,400 | | |
SBA Telecommunications, Inc.4 , 8.00%, 8/15/2016 | | 435,000 | | | 458,925 | | |
SBA Tower Trust4 , 5.101%, 4/15/2017 | | 575,000 | | | 592,253 | | |
| | | | | | | |
| | | | | 3,293,118 | | |
| | | | | | | |
Total Telecommunication Services | | | | | 5,058,306 | | |
| | | | | | | |
Utilities - 0.45% | | | | | | | |
Electric Utilities - 0.36% | | | | | | | |
Allegheny Energy Supply Co. LLC4 , 5.75%, 10/15/2019 | | 970,000 | | | 962,235 | | |
Exelon Generation Co. LLC, 5.35%, 1/15/2014 | | 895,000 | | | 971,552 | | |
Southwestern Electric Power Co., 6.45%, 1/15/2019 | | 880,000 | | | 979,436 | | |
| | | | | | | |
| | | | | 2,913,223 | | |
| | | | | | | |
Independent Power Producers & Energy Traders - 0.07% | | | | | | | |
Mirant Americas Generation LLC, 9.125%, 5/1/2031 | | 370,000 | | | 347,800 | | |
| | | | |
| | The accompanying notes are an integral part of the financial statements. | | 88 |
Investment Portfolio - April 30, 2010 (unaudited)
| | | | | | | |
| Pro-Blend® Extended Term Series | | Principal Amount/
Shares | | Value (Note 2) | | |
| | | |
CORPORATE BONDS (continued) | | | | | | | |
| | | |
Non-Convertible Corporate Bonds (continued) | | | | | | | |
Utilities (continued) | | | | | | | |
Independent Power Producers & Energy Traders (continued) | | | | | | | |
North American Energy Alliance LLC - North American Energy Alliance Finance Corp.4 , 10.875%, 6/1/2016 | | $ 250,000 | | $ | 266,250 | | |
| | | | | | | |
| | | | | 614,050 | | |
| | | | | | | |
Multi-Utilities - 0.02% | | | | | | | |
CenterPoint Energy Resources Corp., Series B, 7.875%, 4/1/2013 | | 135,000 | | | 154,845 | | |
| | | | | | | |
Total Utilities | | | | | 3,682,118 | | |
| | | | | | | |
Total Non-Convertible Corporate Bonds | | | | | | | |
(Identified Cost $136,187,277) | | | | | 143,144,705 | | |
| | | | | | | |
TOTAL CORPORATE BONDS | | | | | | | |
(Identified Cost $138,783,070) | | | | | 145,905,230 | | |
| | | | | | | |
| | | |
MUTUAL FUNDS - 1.10% | | | | | | | |
| | | |
iShares Dow Jones US Real Estate Index Fund | | 4,380 | | | 231,921 | | |
iShares iBoxx High Yield Corporate Bond Fund | | 44,421 | | | 3,971,238 | | |
iShares iBoxx Investment Grade Corporate Bond Fund | | 44,943 | | | 4,822,833 | | |
| | | | | | | |
TOTAL MUTUAL FUNDS | | | | | | | |
(Identified Cost $8,293,978) | | | | | 9,025,992 | | |
| | | | | | | |
| | | |
U.S. TREASURY SECURITIES - 15.28% | | | | | | | |
| | | |
U.S. Treasury Bonds - 2.36% | | | | | | | |
U.S. Treasury Bond, 5.50%, 8/15/2028 | | $ 8,050,000 | | | 9,233,600 | | |
U.S. Treasury Bond, 5.375%, 2/15/2031 | | 8,924,000 | | | 10,131,524 | | |
| | | | | | | |
Total U.S. Treasury Bonds | | | | | | | |
(Identified Cost $19,430,238) | | | | | 19,365,124 | | |
| | | | | | | |
U.S. Treasury Notes - 12.92% | | | | | | | |
U.S. Treasury Note, 1.875%, 2/28/2014 | | 7,450,000 | | | 7,433,699 | | |
U.S. Treasury Note, 2.625%, 6/30/2014 | | 21,680,000 | | | 22,147,464 | | |
U.S. Treasury Note, 2.375%, 8/31/2014 | | 12,500,000 | | | 12,615,237 | | |
U.S. Treasury Note, 2.375%, 2/28/2015 | | 8,985,000 | | | 8,990,661 | | |
U.S. Treasury Note, 2.50%, 3/31/2015 | | 15,000,000 | | | 15,075,000 | | |
U.S. Treasury Note, 2.50%, 4/30/2015 | | 25,000,000 | | | 25,091,750 | | |
U.S. Treasury Note, 4.00%, 8/15/2018 | | 10,150,000 | | | 10,590,896 | | |
U.S. Treasury Note, 2.75%, 2/15/2019 | | 4,000,000 | | | 3,768,436 | | |
| | | | | | | |
Total U.S. Treasury Notes | | | | | | | |
(Identified Cost $105,051,196) | | | | | 105,713,143 | | |
| | | | | | | |
TOTAL U.S. TREASURY SECURITIES | | | | | | | |
(Identified Cost $124,481,434) | | | | | 125,078,267 | | |
| | | | | | | |
| | | | |
| 89 | | The accompanying notes are an integral part of the financial statements. | | |
Investment Portfolio - April 30, 2010 (unaudited)
| | | | | | | |
| Pro-Blend® Extended Term Series | | Principal Amount | | Value (Note 2) | | |
| | | |
ASSET-BACKED SECURITIES - 0.06% | | | | | | | |
| | | |
Hertz Vehicle Financing LLC, Series 2009-2A, Class A24 , 5.29%, 3/25/2016 | | | | | | | |
(Identified Cost $469,975) | | $ 470,000 | | $ | 497,447 | | |
| | | | | | | |
| | | |
FOREIGN GOVERNMENT BONDS - 0.12% | | | | | | | |
Hellenic Republic Government Bond (Greece), 6.00%, 7/19/2019 | | | | | | | |
(Identified Cost $1,262,075) | | 975,000 | | | 989,838 | | |
| | | | | | | |
| | | |
U.S. GOVERNMENT AGENCIES - 5.82% | | | | | | | |
| | | |
Mortgage-Backed Securities - 1.28% | | | | | | | |
Fannie Mae, Pool #621881, 5.50%, 1/1/2017 | | 959 | | | 1,031 | | |
Fannie Mae, Pool #252210, 6.50%, 2/1/2019 | | 7,708 | | | 8,334 | | |
Fannie Mae, Pool #725793, 5.50%, 9/1/2019 | | 211,369 | | | 227,672 | | |
Fannie Mae, Pool #844917, 4.50%, 11/1/2020 | | 236,850 | | | 249,023 | | |
Fannie Mae, Pool #813938, 4.50%, 12/1/2020 | | 193,722 | | | 203,678 | | |
Fannie Mae, Pool #813954, 4.50%, 12/1/2020 | | 176,835 | | | 185,924 | | |
Fannie Mae, Pool #864435, 4.50%, 12/1/2020 | | 101,411 | | | 106,623 | | |
Fannie Mae, Pool #837190, 5.00%, 12/1/2020 | | 53,044 | | | 56,481 | | |
Fannie Mae, Pool #909732, 5.00%, 2/1/2022 | | 63,342 | | | 66,952 | | |
Fannie Mae, Pool #912520, 5.00%, 2/1/2022 | | 753,038 | | | 798,070 | | |
Fannie Mae, Pool #745147, 4.50%, 12/1/2035 | | 4,741,196 | | | 4,824,217 | | |
Fannie Mae, Pool #901895, 6.50%, 9/1/2036 | | 355,838 | | | 385,606 | | |
Fannie Mae, Pool #899393, 6.00%, 4/1/2037 | | 1,610,357 | | | 1,715,147 | | |
Freddie Mac, Pool #B16835, 5.50%, 10/1/2019 | | 167,603 | | | 180,765 | | |
Freddie Mac, Pool #G12966, 5.50%, 1/1/2023 | | 509,184 | | | 545,433 | | |
Freddie Mac, Pool #G13136, 4.50%, 5/1/2023 | | 707,271 | | | 737,101 | | |
Freddie Mac, Pool #A22067, 6.50%, 5/1/2034 | | 156,125 | | | 171,014 | | |
| | | | | | | |
Total Mortgage-Backed Securities | | | | | | | |
(Identified Cost $9,751,746) | | | | | 10,463,071 | | |
| | | | | | | |
Other Agencies - 4.54% | | | | | | | |
Fannie Mae, 6.25%, 5/15/2029 | | 4,456,000 | | | 5,216,314 | | |
Fannie Mae, 7.25%, 5/15/2030 | | 4,005,000 | | | 5,209,568 | | |
Fannie Mae, 6.625%, 11/15/2030 | | 4,252,000 | | | 5,207,373 | | |
Federal Home Loan Bank, 4.50%, 11/15/2012 | | 50,000 | | | 53,764 | | |
Federal Home Loan Bank, 3.375%, 2/27/2013 | | 50,000 | | | 52,436 | | |
Freddie Mac, 1.75%, 6/15/2012 | | 4,560,000 | | | 4,606,138 | | |
Freddie Mac, 5.50%, 8/20/2012 | | 4,150,000 | | | 4,536,340 | | |
Freddie Mac, 3.75%, 3/27/2019 | | 7,840,000 | | | 7,749,699 | | |
Freddie Mac, 6.75%, 3/15/2031 | | 1,825,000 | | | 2,271,589 | | |
| | | | |
| | The accompanying notes are an integral part of the financial statements. | | 90 |
Investment Portfolio - April 30, 2010 (unaudited)
| | | | | | | |
Pro-Blend® Extended Term Series | | Principal Amount/
Shares | | Value (Note 2) | | |
| | | |
U.S. GOVERNMENT AGENCIES (continued) | | | | | | | |
| | | |
Other Agencies (continued) | | | | | | | |
Freddie Mac, 6.25%, 7/15/2032 | | $ 1,915,000 | | $ | 2,268,099 | | |
| | | | | | | |
Total Other Agencies | | | | | | | |
(Identified Cost $37,300,078) | | | | | 37,171,320 | | |
| | | | | | | |
TOTAL U.S. GOVERNMENT AGENCIES | | | | | | | |
(Identified Cost $47,051,824) | | | | | 47,634,391 | | |
| | | | | | | |
| | | |
SHORT-TERM INVESTMENTS - 3.53% | | | | | | | |
| | | |
Dreyfus Cash Management, Inc. - Institutional Shares9 , 0.09%, | | 22,685,285 | | | 22,685,285 | | |
U.S. Treasury Bill10 , 0.24%, 8/26/2010 | | $ 6,200,000 | | | 6,196,298 | | |
| | | | | | | |
TOTAL SHORT-TERM INVESTMENTS | | | | | | | |
(Identified Cost $28,880,448) | | | | | 28,881,583 | | |
| | | | | | | |
TOTAL INVESTMENTS - - 99.38% | | | | | | | |
(Identified Cost $749,301,855) | | | | | 813,341,800 | | |
OTHER ASSETS, LESS LIABILITIES - 0.62% | | | | | 5,097,290 | | |
| | | | | | | |
NET ASSETS - 100% | | | | $ | 818,439,090 | | |
| | | | | | | |
| | | | | | | | |
| FORWARD FOREIGN CURRENCY EXCHANGE CONTRACTS OPEN AT APRIL 30, 2010: |
| Settlement Date | | Contracts to Deliver | | In Exchange
For | | Contracts
At Value | | Unrealized
Appreciation |
| 5/26/2010 | | EUR975,000 | | $1,322,538 | | $1,298,291 | | $24,247 |
ADR - American Depository Receipt
EUR - Euro currency
NVDR - Non-Voting Depository Receipt
*Non-income producing security
**Less than 0.01%
| 1 | The Bank of New York Mellon Corp. is the Series’ custodian. |
| 2 | Latest quoted sales price is not available and the latest quoted bid price was used to value the security. |
| 3 | PNC Global Investment Servicing (U.S.) Inc. serves as sub-accountant and sub-transfer agent to the Series. |
| 4 | Restricted securities - Investment in securities that are restricted as to public resale under the Securities Act of 1933, as amended. These securities have been sold under rule 144A and have been determined to be liquid. These securities amount to $25,608,521, or 3.13%, of the Series’ net assets as of April 30, 2010 (see Note 2 to the financial statements). |
| 5 | The coupon rate is floating and is the stated rate as of April 30, 2010. |
| 6 | Security insured under the Federal Deposit Insurance Corporation Temporary Liquidity Guarantee Program. |
| 7 | Restricted securities - Investment in securities that are restricted as to public resale under the Securities Act of 1933, as amended. This security has been sold under rule 144A and has been determined to be illiquid. This security amounts to $320,397, or 0.04%, of the Series’ net assets as of April 30, 2010 (see Note 2 to the financial statements). |
| 8 | Security has been valued at fair value. |
| 9 | Rate shown is the current yield as of April 30, 2010. |
| 10 | Rate shown reflects the annualized yield at time of purchase. |
| | | | |
| 91 | | The accompanying notes are an integral part of the financial statements. | | |
Statement of Assets and Liabilities - Pro-Blend® Extended Term Series (unaudited)
April 30, 2010
| | | | |
ASSETS: | | | | |
| |
Investments, at value (identified cost $749,301,855) (Note 2) | | $ | 813,341,800 | |
Interest receivable | | | 3,614,709 | |
Receivable for securities sold | | | 3,494,079 | |
Receivable for fund shares sold | | | 1,549,487 | |
Dividends receivable | | | 330,062 | |
Foreign tax reclaims receivable | | | 185,184 | |
Unrealized appreciation on foreign forward currency contracts (Note 2) | | | 24,247 | |
| | | | |
| |
TOTAL ASSETS | | | 822,539,568 | |
| | | | |
| |
LIABILITIES: | | | | |
| |
Accrued management fees (Note 3) | | | 494,488 | |
Accrued shareholder services fees (Class S) (Note 3) | | | 129,547 | |
Accrued transfer agent (Note 3) | | | 15,689 | |
Accrued distribution and services (Rule 12b-1) fees (Class C) (Note 3) | | | 6,239 | |
Accrued fund accounting and administration fees (Note 3) | | | 2,753 | |
Accrued Chief Compliance Officer service fees (Note 3) | | | 667 | |
Payable for securities purchased | | | 3,160,484 | |
Payable for fund shares repurchased | | | 272,615 | |
Other payables and accrued expenses | | | 17,996 | |
| | | | |
| |
TOTAL LIABILITIES | | | 4,100,478 | |
| | | | |
| |
TOTAL NET ASSETS | | $ | 818,439,090 | |
| | | | |
| |
NET ASSETS CONSIST OF: | | | | |
| |
Capital stock | | $ | 616,384 | |
Additional paid-in-capital | | | 787,598,294 | |
Undistributed net investment income | | | 3,866,334 | |
Accumulated net realized loss on investments, foreign currency and translation of other assets and liabilities | | | (37,699,489 | ) |
Net unrealized appreciation on investments, foreign currency and translation of other assets and liabilities | | | 64,057,567 | |
| | | | |
| |
TOTAL NET ASSETS | | $ | 818,439,090 | |
| | | | |
| |
NET ASSET VALUE, OFFERING PRICE AND REDEMPTION PRICE PER SHARE - Class S | | | | |
($639,784,094/43,686,397 shares) | | $ | 14.64 | |
| | | | |
| |
NET ASSET VALUE, OFFERING PRICE AND REDEMPTION PRICE PER SHARE - Class I | | | | |
($168,732,016/16,999,388 shares) | | $ | 9.93 | |
| | | | |
| |
NET ASSET VALUE, OFFERING PRICE AND REDEMPTION PRICE PER SHARE - Class C | | | | |
($9,922,980/952,633 shares) | | $ | 10.42 | |
| | | | |
| | | | |
| | The accompanying notes are an integral part of the financial statements. | | 92 |
Statement of Operations - Pro-Blend® Extended Term Series (unaudited)
For the Six Months Ended April 30, 2010
| | | | |
INVESTMENT INCOME: | | | | |
| |
Interest | | $ | 5,788,115 | |
Dividends (net of foreign taxes withheld, $99,558) | | | 3,250,056 | |
| | | | |
| |
Total Investment Income | | | 9,038,171 | |
| | | | |
| |
EXPENSES: | | | | |
| |
Management fees (Note 3) | | | 2,658,881 | |
Shareholder services fees (Class S) (Note 3) | | | 717,218 | |
Fund accounting and administration fees (Note 3) | | | 69,260 | |
Transfer agent fees (Note 3) | | | 58,761 | |
Distribution and service (Rule 12b-1) fees (Class C) (Note 3) | | | 11,204 | |
Directors’ fees (Note 3) | | | 6,373 | |
Chief Compliance Officer service fees (Note 3) | | | 1,700 | |
Custodian fees | | | 26,006 | |
Miscellaneous | | | 71,438 | |
| | | | |
| |
Total Expenses | | | 3,620,841 | |
Less reduction of expenses (Note 3) | | | (758 | ) |
| | | | |
| |
Net Expenses | | | 3,620,083 | |
| | | | |
| |
NET INVESTMENT INCOME | | | 5,418,088 | |
| | | | |
| |
REALIZED AND UNREALIZED GAIN (LOSS) ON INVESTMENTS AND FOREIGN CURRENCY: | | | | |
| |
Net realized gain (loss) on- | | | | |
Investments | | | 17,138,776 | |
Foreign currency and translation of other assets and liabilities | | | (1,212 | ) |
| | | | |
| |
| | | 17,137,564 | |
| | | | |
Net change in unrealized appreciation (depreciation) on- | | | | |
Investments | | | 49,525,217 | |
Foreign currency and translation of other assets and liabilities | | | (158 | ) |
| | | | |
| |
| | | 49,525,059 | |
| | | | |
| |
NET REALIZED AND UNREALIZED GAIN (LOSS) ON INVESTMENTS AND FOREIGN CURRENCY | | | 66,662,623 | |
| | | | |
| |
NET INCREASE IN NET ASSETS RESULTING FROM OPERATIONS | | $ | 72,080,711 | |
| | | | |
| | | | |
| 93 | | The accompanying notes are an integral part of the financial statements. | | |
Statements of Changes in Net Assets - Pro-Blend® Extended Term Series
| | | | | | | | |
| | | For the Six Months Ended
4/30/10
(unaudited) | | | For the Year Ended
10/31/09 | |
INCREASE (DECREASE) IN NET ASSETS: | | | | | | | | |
| | |
OPERATIONS: | | | | | | | | |
| | |
Net investment income | | $ | 5,418,088 | | | $ | 6,906,566 | |
Net realized gain (loss) on investments and foreign currency | | | 17,137,564 | | | | (47,544,092 | ) |
Net change in unrealized appreciation (depreciation) on investments and foreign currency | | | 49,525,059 | | | | 109,759,591 | |
| | | | | | | | |
| | |
Net increase from operations | | | 72,080,711 | | | | 69,122,065 | |
| | | | | | | | |
| | |
DISTRIBUTIONS TO SHAREHOLDERS (Note 8): | | | | | | | | |
| | |
From net investment income (Class S) | | | (4,396,857 | ) | | | (7,399,150 | ) |
From net investment income (Class I) | | | (1,604,509 | ) | | | (270,130 | ) |
| | | | | | | | |
| | |
Total distributions to shareholders | | | (6,001,366 | ) | | | (7,669,280 | ) |
| | | | | | | | |
| | |
CAPITAL STOCK ISSUED AND REPURCHASED: | | | | | | | | |
| | |
Net increase from capital share transactions (Note 5) | | | 142,644,744 | | | | 122,302,231 | |
| | | | | | | | |
| | |
Net increase in net assets | | | 208,724,089 | | | | 183,755,016 | |
| | |
NET ASSETS: | | | | | | | | |
| | |
Beginning of period | | | 609,715,001 | | | | 425,959,985 | |
| | | | | | | | |
| | |
End of period (including undistributed net investment income of $3,866,334 and $4,449,612, respectively) | | $ | 818,439,090 | | | $ | 609,715,001 | |
| | | | | | | | |
| | | | |
| | The accompanying notes are an integral part of the financial statements. | | 94 |
Financial Highlights - Pro-Blend® Extended Term Series - Class S
| | | | | | | | | | | | | | | | | |
| | | For the Six
Months Ended
4/30/10
(unaudited) | | For the Years Ended | |
| | | | 10/31/09 | | | 10/31/08 | | | 10/31/07 | | | 10/31/06 | | | 10/31/05 | |
| Per share data (for a share outstanding throughout each period): | | | | | | | | | | | | | | | | | |
| Net asset value - Beginning of period | | $13.32 | | $11.75 | | | $17.82 | | | $17.12 | | | $15.82 | | | $14.45 | |
| | | | | | | | | | | | | | | | | |
| | | | | | |
Income (loss) from investment operations: | | | | | | | | | | | | | | | | | |
Net investment income | | 0.101 | | 0.17 | 1 | | 0.22 | | | 0.22 | | | 0.21 | | | 0.13 | |
Net realized and unrealized gain (loss) on investments | | 1.33 | | 1.60 | | | (4.36 | ) | | 1.88 | | | 2.18 | | | 1.71 | |
| | | | | | | | | | | | | | | | | |
Total from investment operations | | 1.43 | | 1.77 | | | (4.14 | ) | | 2.10 | | | 2.39 | | | 1.84 | |
| | | | | | | | | | | | | | | | | |
Less distributions to shareholders: | | | | | | | | | | | | | | | | | |
From net investment income | | (0.11) | | (0.20 | ) | | (0.21 | ) | | (0.25 | ) | | (0.14 | ) | | (0.11 | ) |
From net realized gain on investments | | — | | — | | | (1.72 | ) | | (1.15 | ) | | (0.95 | ) | | (0.36 | ) |
| | | | | | | | | | | | | | | | | |
Total distributions to shareholders | | (0.11) | | (0.20 | ) | | (1.93 | ) | | (1.40 | ) | | (1.09 | ) | | (0.47 | ) |
| | | | | | | | | | | | | | | | | |
Net asset value - End of period | | $14.64 | | $13.32 | | | $11.75 | | | $17.82 | | | $17.12 | | | $15.82 | |
| | | | | | | | | | | | | | | | | |
Net assets - End of period | | | | | | | | | | | | | | | | | |
(000’s omitted) | | $639,784 | | $511,700 | | | $424,876 | | | $596,991 | | | $484,003 | | | $365,726 | |
| | | | | | | | | | | | | | | | | |
Total return2 | | 10.79% | | 15.47% | | | (25.70% | ) | | 12.95% | | | 16.03% | | | 12.92% | |
Ratios (to average net assets)/ Supplemental Data: | |
Expenses* | | 1.07%3 | | 1.10% | | | 1.10% | | | 1.11% | | | 1.14% | | | 1.17% | |
Net investment income | | 1.48%3 | | 1.48% | | | 1.50% | | | 1.37% | | | 1.42% | | | 0.89% | |
Series portfolio turnover | | 22% | | 62% | | | 76% | | | 82% | | | 82% | | | 71% | |
|
*The investment advisor did not impose all or a portion of its management fees, CCO fees, fund accounting and transfer agent fees and other fees in some periods and in some periods paid a portion of the Series’ expenses. If these expenses had been incurred by the Class, the expense ratio (to average net assets) would have been increased by the following amount: | |
| | 0.00%3,4 | | 0.01% | | | 0.00% | 4 | | N/A | | | N/A | | | 0.01% | |
1Calculated based on average shares outstanding during the period.
2Represents aggregate total return for the periods indicated, and assumes reinvestment of all distributions. Total return would have been lower had certain expenses not been waived or reimbursed during certain periods. Periods less than one year are not annualized.
3Annualized.
4Less than 0.01%.
| | | | |
| 95 | | The accompanying notes are an integral part of the financial statements. | | |
Financial Highlights - Pro-Blend® Extended Term Series - Class I
| | | | | | |
| | | For the Six
Months Ended
4/30/10
(unaudited) | | For the
Year Ended
10/31/09 | | For the Period
3/28/081 to 10/31/08 |
Per share data (for a share outstanding throughout each period): |
Net asset value - Beginning of period | | $9.08 | | $8.10 | | $10.00 |
| | | | | | |
Income (loss) from investment operations: | | | | | | |
Net investment income | | 0.082 | | 0.132 | | 0.08 |
Net realized and unrealized gain (loss) on investments | | 0.91 | | 1.10 | | (1.91) |
| | | | | | |
Total from investment operations | | 0.99 | | 1.23 | | (1.83) |
| | | | | | |
Less distributions to shareholders: | | | | | | |
From net investment income | | (0.14) | | (0.25) | | (0.07) |
| | | | | | |
Net asset value - End of period | | $9.93 | | $9.08 | | $8.10 |
| | | | | | |
Net assets - End of period (000’s omitted) | | $168,732 | | $98,015 | | $1,084 |
| | | | | | |
Total return3 | | 10.97% | | 15.82% | | (18.46%) |
Ratios (to average net assets)/Supplemental Data: |
Expenses* | | 0.82%4 | | 0.85% | | 0.85%4 |
Net investment income | | 1.74%4 | | 1.59% | | 1.62%4 |
Series portfolio turnover | | 22% | | 62% | | 76% |
|
*The investment advisor did not impose all or a portion of its management fees, CCO fees, fund accounting and transfer agent fees and other fees in some periods and in some periods paid a portion of the Series’ expenses. If these expenses had been incurred by the Class, the expense ratio (to average net assets) would have been increased by the following amount: |
| | 0.00%4,5 | | 0.00%5 | | 0.02%4 |
1Commencement of operations.
2Calculated based on average shares outstanding during the period.
3Represents aggregate total return for the periods indicated, and assumes reinvestment of all distributions. Total return would have been lower had certain expenses not been waived or reimbursed during the periods. Periods less than one year are not annualized.
4Annualized.
5Less than 0.01%.
| | | | |
| | The accompanying notes are an integral part of the financial statements. | | 96 |
Financial Highlights - Pro-Blend® Extended Term Series - Class C
| | |
| | | For the Period
1/4/101 to 4/30/10 (unaudited) |
Per share data (for a share outstanding throughout the period): | | |
Net asset value - Beginning of period | | $10.00 |
| | |
Income from investment operations: | | |
Net investment income | | 0.032 |
Net realized and unrealized gain on investments | | 0.39 |
| | |
Total from investment operations | | 0.42 |
| | |
Net asset value - End of period | | $10.42 |
| | |
Net assets - End of period (000’s omitted) | | $9,923 |
| | |
Total return3 | | 4.20% |
Ratios (to average net assets)/Supplemental Data: |
Expenses* | | 1.82%4 |
Net investment income | | 0.86%4 |
Series portfolio turnover | | 22% |
|
*The investment advisor did not impose all or a portion of its management fees and other fees during the period and paid a portion of the Series’ expenses. If these expenses had been incurred by the Class, the expense ratio (to average net assets) would have been increased by the following amount: |
| | 0.00%4,5 |
1Commencement of operations.
2Calculated based on average shares outstanding during the period.
3Represents aggregate total return for the period indicated, and assumes reinvestment of all distributions. Total return would have been lower had certain expenses not been waived during the period. Periods less than one year are not annualized.
4Annualized.
5Less than 0.01%.
| | | | |
| 97 | | The accompanying notes are an integral part of the financial statements. | | |
Shareholder Expense Example - Pro-Blend® Maximum Term Series (unaudited)
As a shareholder of the Series, you may incur two types of costs: (1) transaction costs, including potential wire charges on redemptions and (2) ongoing costs, including management fees and other Series expenses. This example is intended to help you understand your ongoing costs (in dollars) of investing in the Series and to compare these costs with the ongoing costs of investing in other mutual funds.
The example is based on an investment of $1,000 invested at the beginning of the period and held for the entire period (November 1, 2009 to April 30, 2010, except for Class C Actual, which is from January 4, 2010* to April 30, 2010).
Actual Expenses
The Actual lines of the table below provide information about actual account values and actual expenses. You may use the information in these lines, together with the amount you invested, to estimate the expenses that you paid over the period. Simply divide your account value by $1,000 (for example, an $8,600 account value divided by $1,000 = 8.6), then multiply the result by the number in the Actual line for the Class in which you have invested under the heading entitled “Expenses Paid During Period” to estimate the expenses you paid on your account during this period.
Hypothetical Example for Comparison Purposes
The Hypothetical lines of the table below provide information about hypothetical account values and hypothetical expenses based on the Class’ actual expense ratio and an assumed rate of return of 5% per year before expenses, which is not the Class’ actual return. The hypothetical account values and expenses may not be used to estimate the actual ending account balance or expenses you paid during the period. You may use this information to compare the ongoing costs of investing in the Series and other funds. To do so, compare this 5% hypothetical example for the Class in which you have invested with the 5% hypothetical examples that appear in the shareholder reports of the other funds.
Please note that the expenses shown in the table are meant to highlight your ongoing costs only and do not reflect any transaction costs. Therefore, the Hypothetical lines of the table are useful in comparing ongoing costs only, and will not help you determine the relative total costs of owning different funds. In addition, if these transaction costs were included, your costs would have been higher.
| | | | | | | | |
| | | Beginning
Account Value
11/1/09* | | Ending
Account Value
4/30/10 | | Expenses Paid
During Period
11/1/09-4/30/10** | | Annualized
Expense ratio |
Class S | | | | | | | | |
Actual | | $1,000.00 | | $1,150.10 | | $5.81 | | 1.09% |
Hypothetical | | | | | | | | |
(5% return before expenses) | | $1,000.00 | | $1,019.39 | | $5.46 | | 1.09% |
Class I | | | | | | | | |
Actual | | $1,000.00 | | $1,152.30 | | $4.54 | | 0.85% |
Hypothetical | | | | | | | | |
(5% return before expenses) | | $1,000.00 | | $1,020.58 | | $4.26 | | 0.85% |
Class C | | | | | | | | |
Actual | | $1,000.00 | | $1,043.00 | | $5.94 | | 1.83% |
Hypothetical | | | | | | | | |
(5% return before expenses) | | $1,000.00 | | $1,010.07 | | $5.85 | | 1.83% |
*Class C inception date was January 4, 2010.
**Expenses are equal to the Class’ annualized expense ratio (for the six-month period), multiplied by the average account value over the period, multiplied by 181/365 to reflect the one-half year period (except for the Series’ Class C Actual return information, which reflects the 116 day period ended April 30, 2010 due to its inception date of January 4, 2010). The Class’ total return would have been lower had certain expenses not been waived during the period.
Portfolio Composition - Pro-Blend® Maximum Term Series (unaudited)
As of April 30, 2010
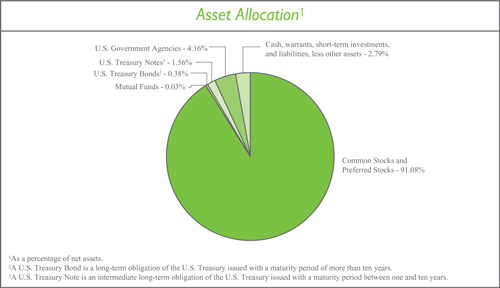
| | |
Sector Allocation4 |
Information Technology | | 18.55% |
Health Care | | 17.23% |
Consumer Discretionary | | 12.64% |
Financials | | 11.98% |
Industrials | | 11.11% |
Energy | | 7.27% |
Consumer Staples | | 6.85% |
Materials | | 2.61% |
Telecommunication Services | | 2.13% |
Utilities | | 0.17% |
| |
4Including common stocks, preferred stocks and warrants, as a percentage of total investments. |
| | |
Top Ten Stock Holdings5 |
The Walt Disney Co. | | 2.73% |
Google, Inc. - Class A | | 2.61% |
Cisco Systems, Inc. | | 2.51% |
Hess Corp. | | 2.06% |
The Bank of New York Mellon Corp. | | 1.96% |
United Parcel Service, Inc. - Class B | | 1.90% |
EMC Corp. | | 1.89% |
Monsanto Co. | | 1.87% |
Nestle S.A. (Switzerland) | | 1.68% |
Southwest Airlines Co. | | 1.67% |
| |
5As a percentage of total investments. |
Investment Portfolio - April 30, 2010 (unaudited)
| | | | | | | |
| Pro-Blend® Maximum Term Series | | Shares | | Value (Note 2) | | |
| | | |
COMMON STOCKS - 91.05% | | | | | | | |
| | | |
Consumer Discretionary - 12.72% | | | | | | | |
Auto Components - 0.04% | | | | | | | |
Hankook Tire Co. Ltd. (South Korea) | | 12,990 | | $ | 292,417 | | |
| | | | | | | |
Automobiles - 0.81% | | | | | | | |
Bayerische Motoren Werke AG (BMW) (Germany) | | 109,960 | | | 5,436,070 | | |
Suzuki Motor Corp. (Japan) | | 2,500 | | | 52,936 | | |
| | | | | | | |
| | | | | 5,489,006 | | |
| | | | | | | |
Distributors - 0.03% | | | | | | | |
Inchcape plc (United Kingdom)* | | 327,000 | | | 172,113 | | |
| | | | | | | |
Hotels, Restaurants & Leisure - 2.17% | | | | | | | |
Carnival Corp. | | 206,611 | | | 8,615,679 | | |
Choice Hotels International, Inc. | | 10,450 | | | 379,440 | | |
Club Mediterranee S.A. (France)* | | 6,455 | | | 108,592 | | |
Hyatt Hotels Corp. - Class A* | | 2,720 | | | 111,982 | | |
International Game Technology | | 254,455 | | | 5,363,911 | | |
Wendy’s - Arby’s Group, Inc. - Class A | | 27,000 | | | 143,370 | | |
| | | | | | | |
| | | | | 14,722,974 | | |
| | | | | | | |
Household Durables - 0.16% | | | | | | | |
Corporacion Geo S.A.B. de C.V. - Class B (Mexico)* | | 58,520 | | | 185,319 | | |
LG Electronics, Inc. (South Korea) | | 2,450 | | | 269,680 | | |
NVR, Inc.* | | 330 | | | 236,956 | | |
Rodobens Negocios Imobiliarios S.A. (Brazil) | | 50,530 | | | 363,078 | | |
| | | | | | | |
| | | | | 1,055,033 | | |
| | | | | | | |
Leisure Equipment & Products - 0.01% | | | | | | | |
Sankyo Co. Ltd. (Japan) | | 2,100 | | | 97,360 | | |
| | | | | | | |
Media - 7.10% | | | | | | | |
Discovery Communications, Inc. - Class A* | | 176,750 | | | 6,840,225 | | |
Grupo Televisa S.A. - ADR (Mexico) | | 17,470 | | | 363,027 | | |
Mediacom Communications Corp. - Class A* | | 26,420 | | | 174,900 | | |
Reed Elsevier plc (United Kingdom) | | 780,900 | | | 6,147,361 | | |
Reed Elsevier plc - ADR (United Kingdom) | | 3,895 | | | 123,082 | | |
Societe Television Francaise 1 (France) | | 35,940 | | | 670,172 | | |
Time Warner, Inc. | | 242,270 | | | 8,014,292 | | |
The Walt Disney Co. | | 506,750 | | | 18,668,670 | | |
The Washington Post Co. - Class B | | 13,790 | | | 6,993,736 | | |
Wolters Kluwer N.V. (Netherlands) | | 8,720 | | | 179,030 | | |
| | | | | | | |
| | | | | 48,174,495 | | |
| | | | | | | |
Multiline Retail - 0.07% | | | | | | | |
Marks & Spencer Group plc (United Kingdom) | | 42,000 | | | 235,522 | | |
PPR (France) | | 1,745 | | | 235,707 | | |
| | | | | | | |
| | | | | 471,229 | | |
| | | | | | | |
| | | | |
| | The accompanying notes are an integral part of the financial statements. | | 100 |
Investment Portfolio - April 30, 2010 (unaudited)
| | | | | | | |
| Pro-Blend® Maximum Term Series | | Shares | | Value (Note 2) | | |
| | | |
COMMON STOCKS (continued) | | | | | | | |
| | | |
Consumer Discretionary (continued) | | | | | | | |
Specialty Retail - 2.28% | | | | | | | |
Dick’s Sporting Goods, Inc.* | | 290,270 | | $ | 8,449,760 | | |
The Finish Line, Inc. - Class A | | 12,710 | | | 204,758 | | |
KOMERI Co. Ltd. (Japan) | | 5,400 | | | 137,220 | | |
Lumber Liquidators Holdings, Inc.* | | 8,650 | | | 263,479 | | |
The Sherwin-Williams Co. | | 82,260 | | | 6,422,038 | | |
| | | | | | | |
| | | | | 15,477,255 | | |
| | | | | | | |
Textiles, Apparel & Luxury Goods - 0.05% | | | | | | | |
Adidas AG (Germany) | | 3,430 | | | 201,673 | | |
LVMH S.A. (Louis Vuitton Moet Hennessy) (France) | | 1,480 | | | 171,123 | | |
| | | | | | | |
| | | | | 372,796 | | |
| | | | | | | |
Total Consumer Discretionary | | | | | 86,324,678 | | |
| | | | | | | |
Consumer Staples - 6.86% | | | | | | | |
Beverages - 0.11% | | | | | | | |
Diageo plc (United Kingdom) | | 12,210 | | | 208,305 | | |
Heineken N.V. (Netherlands) | | 7,100 | | | 332,567 | | |
Kirin Holdings Co. Ltd. (Japan) | | 16,000 | | | 229,776 | | |
| | | | | | | |
| | | | | 770,648 | | |
| | | | | | | |
Food & Staples Retailing - 2.02% | | | | | | | |
BJ’s Wholesale Club, Inc.* | | 9,090 | | | 347,965 | | |
Carrefour S.A. (France) | | 23,310 | | | 1,143,371 | | |
Casino Guichard-Perrachon S.A. (France) | | 2,550 | | | 226,460 | | |
The Kroger Co. | | 246,210 | | | 5,473,248 | | |
Safeway, Inc. | | 236,070 | | | 5,571,252 | | |
SUPERVALU, Inc. | | 11,320 | | | 168,668 | | |
Tesco plc (United Kingdom) | | 114,000 | | | 759,018 | | |
| | | | | | | |
| | | | | 13,689,982 | | |
| | | | | | | |
Food Products - 4.64% | | | | | | | |
Danone S.A. (France) | | 8,770 | | | 518,218 | | |
Dean Foods Co.* | | 299,560 | | | 4,703,092 | | |
Flowers Foods, Inc. | | 10,230 | | | 269,663 | | |
General Mills, Inc. | | 49,280 | | | 3,507,750 | | |
Kellogg Co. | | 64,810 | | | 3,560,662 | | |
Nestle S.A. (Switzerland) | | 233,590 | | | 11,471,664 | | |
Suedzucker AG (Germany) | | 6,820 | | | 138,342 | | |
Unilever plc - ADR (United Kingdom) | | 243,804 | | | 7,338,500 | | |
| | | | | | | |
| | | | | 31,507,891 | | |
| | | | | | | |
Household Products - 0.06% | | | | | | | |
Kao Corp. (Japan) | | 3,900 | | | 95,491 | | |
| | | | |
| 101 | | The accompanying notes are an integral part of the financial statements. | | |
Investment Portfolio - April 30, 2010 (unaudited)
| | | | | | | |
| Pro-Blend® Maximum Term Series | | Shares | | Value (Note 2) | | |
| | | |
COMMON STOCKS (continued) | | | | | | | |
| | | |
Consumer Staples (continued) | | | | | | | |
Household Products (continued) | | | | | | | |
Reckitt Benckiser Group plc (United Kingdom) | | 5,920 | | $ | 308,242 | | |
| | | | | | | |
| | | | | 403,733 | | |
| | | | | | | |
Personal Products - 0.03% | | | | | | | |
Alberto-Culver Co. | | 7,110 | | | 204,768 | | |
| | | | | | | |
Total Consumer Staples | | | | | 46,577,022 | | |
| | | | | | | |
Energy - 7.31% | | | | | | | |
Energy Equipment & Services - 3.93% | | | | | | | |
Baker Hughes, Inc. | | 170,037 | | | 8,461,041 | | |
Calfrac Well Services Ltd. (Canada) | | 24,560 | | | 522,486 | | |
Compagnie Generale de Geophysique - Veritas (CGG - Veritas) (France)* | | 16,850 | | | 508,937 | | |
Dril-Quip, Inc.* | | 4,390 | | | 254,313 | | |
Schlumberger Ltd. | | 117,500 | | | 8,391,850 | | |
Trican Well Service Ltd. (Canada) | | 40,380 | | | 512,800 | | |
Weatherford International Ltd. (Switzerland)* | | 441,446 | | | 7,994,587 | | |
| | | | | | | |
| | | | | 26,646,014 | | |
| | | | | | | |
Oil, Gas & Consumable Fuels - 3.38% | | | | | | | |
BP plc (United Kingdom) | | 19,290 | | | 169,858 | | |
Cameco Corp. (Canada) | | 172,590 | | | 4,247,440 | | |
Forest Oil Corp.* | | 3,920 | | | 114,856 | | |
Hess Corp. | | 220,900 | | | 14,038,195 | | |
Mariner Energy, Inc.* | | 6,035 | | | 144,116 | | |
Royal Dutch Shell plc - Class B (Netherlands) | | 6,724 | | | 203,190 | | |
Royal Dutch Shell plc - Class B - ADR (Netherlands) | | 6,600 | | | 400,488 | | |
Talisman Energy, Inc. (Canada) | | 21,100 | | | 359,144 | | |
Total S.A. (France) | | 4,240 | | | 231,290 | | |
Uranium One, Inc. (Canada)* | | 1,212,430 | | | 3,067,479 | | |
| | | | | | | |
| | | | | 22,976,056 | | |
| | | | | | | |
Total Energy | | | | | 49,622,070 | | |
| | | | | | | |
Financials - 12.05% | | | | | | | |
Capital Markets - 4.02% | | | | | | | |
The Bank of New York Mellon Corp.1 | | 429,860 | | | 13,381,542 | | |
Credit Suisse Group AG - ADR (Switzerland) | | 3,250 | | | 148,525 | | |
Daiwa Securities Group, Inc. (Japan) | | 4,000 | | | 20,865 | | |
Federated Investors, Inc. - Class B | | 263,630 | | | 6,358,755 | | |
GAM Holding Ltd. (Switzerland)* | | 32,470 | | | 406,422 | | |
The Goldman Sachs Group, Inc. | | 2,050 | | | 297,660 | | |
Legg Mason, Inc. | | 13,720 | | | 434,787 | | |
Nomura Holdings, Inc. (Japan) | | 2,300 | | | 16,038 | | |
Northern Trust Corp. | | 110,920 | | | 6,098,382 | | |
| | | | |
| | The accompanying notes are an integral part of the financial statements. | | 102 |
Investment Portfolio - April 30, 2010 (unaudited)
| | | | | | | |
| Pro-Blend® Maximum Term Series | | Shares | | Value (Note 2) | | |
| | | |
COMMON STOCKS (continued) | | | | | | | |
| | | |
Financials (continued) | | | | | | | |
Capital Markets (continued) | | | | | | | |
State Street Corp. | | 3,370 | | $ | 146,595 | | |
| | | | | | | |
| | | | | 27,309,571 | | |
| | | | | | | |
Commercial Banks - 1.38% | | | | | | | |
Barclays plc - ADR (United Kingdom) | | 6,310 | | | 128,850 | | |
BNP Paribas (France) | | 2,163 | | | 150,131 | | |
The Chugoku Bank Ltd. (Japan) | | 11,100 | | | 142,746 | | |
Credit Agricole S.A. (France) | | 2,840 | | | 40,914 | | |
First Commonwealth Financial Corp. | | 108,630 | | | 711,527 | | |
The Hachijuni Bank Ltd. (Japan) | | 13,400 | | | 75,463 | | |
Hong Leong Financial Group Berhad (Malaysia) | | 60,820 | | | 165,777 | | |
HSBC Holdings plc (United Kingdom) | | 619,740 | | | 6,334,231 | | |
HSBC Holdings plc - ADR (United Kingdom) | | 8,225 | | | 418,570 | | |
ICICI Bank Ltd. - ADR (India) | | 4,990 | | | 212,175 | | |
Mitsubishi UFJ Financial Group, Inc. (Japan) | | 14,000 | | | 73,625 | | |
Societe Generale - ADR (France)2 | | 12,660 | | | 133,816 | | |
The Sumitomo Trust & Banking Co. Ltd. (Japan) | | 19,000 | | | 115,292 | | |
U.S. Bancorp | | 10,460 | | | 280,014 | | |
Wilmington Trust Corp. | | 23,680 | | | 410,374 | | |
| | | | | | | |
| | | | | 9,393,505 | | |
| | | | | | | |
Consumer Finance - 1.43% | | | | | | | |
American Express Co. | | 206,370 | | | 9,517,784 | | |
Discover Financial Services | | 14,140 | | | 218,605 | | |
| | | | | | | |
| | | | | 9,736,389 | | |
| | | | | | | |
Diversified Financial Services - 1.41% | | | | | | | |
Bank of America Corp. | | 11,620 | | | 207,185 | | |
Deutsche Boerse AG (Germany) | | 95,820 | | | 7,468,515 | | |
Financiere Marc de Lacharriere S.A. (Fimalac) (France) | | 6,420 | | | 318,880 | | |
ING Groep N.V. (Netherlands)* | | 3,225 | | | 28,937 | | |
JPMorgan Chase & Co. | | 18,951 | | | 806,933 | | |
Moody’s Corp. | | 29,080 | | | 718,857 | | |
| | | | | | | |
| | | | | 9,549,307 | | |
| | | | | | | |
Insurance - 2.32% | | | | | | | |
Allianz SE (Germany) | | 9,378 | | | 1,080,319 | | |
The Allstate Corp. | | 16,340 | | | 533,828 | | |
Amil Participacoes S.A. (Brazil) | | 39,510 | | | 323,899 | | |
AXA S.A. (France) | | 4,615 | | | 92,784 | | |
Brown & Brown, Inc. | | 21,890 | | | 440,865 | | |
Muenchener Rueckversicherungs AG (MunichRe) (Germany) | | 3,343 | | | 472,701 | | |
Principal Financial Group, Inc. | | 5,430 | | | 158,665 | | |
The Progressive Corp. | | 556,370 | | | 11,177,473 | | |
| | | | |
| 103 | | The accompanying notes are an integral part of the financial statements. | | |
Investment Portfolio - April 30, 2010 (unaudited)
| | | | | | | |
| Pro-Blend® Maximum Term Series | | Shares | | Value (Note 2) | | |
| | | |
COMMON STOCKS (continued) | | | | | | | |
| | | |
Financials (continued) | | | | | | | |
Insurance (continued) | | | | | | | |
Willis Group Holdings plc (United Kingdom) | | 22,805 | | $ | 785,632 | | |
Zurich Financial Services AG (Switzerland) | | 2,910 | | | 649,521 | | |
| | | | | | | |
| | | | | 15,715,687 | | |
| | | | | | | |
Real Estate Investment Trusts (REITS) - 1.23% | | | | | | | |
Alexandria Real Estate Equities, Inc. | | 1,450 | | | 102,674 | | |
Alstria Office REIT AG (Germany) | | 23,400 | | | 264,826 | | |
American Campus Communities, Inc. | | 12,320 | | | 347,054 | | |
Apartment Investment & Management Co. - Class A | | 14,700 | | | 329,427 | | |
AvalonBay Communities, Inc. | | 2,540 | | | 264,262 | | |
BioMed Realty Trust, Inc. | | 20,400 | | | 377,604 | | |
Boston Properties, Inc. | | 4,870 | | | 384,048 | | |
Camden Property Trust | | 4,850 | | | 234,885 | | |
Corporate Office Properties Trust | | 24,290 | | | 982,530 | | |
DiamondRock Hospitality Co.* | | 6,740 | | | 74,073 | | |
Digital Realty Trust, Inc. | | 3,850 | | | 225,995 | | |
Douglas Emmett, Inc. | | 15,740 | | | 263,488 | | |
DuPont Fabros Technology, Inc. | | 11,550 | | | 256,064 | | |
Equity Lifestyle Properties, Inc. | | 3,820 | | | 212,048 | | |
Equity One, Inc. | | 6,450 | | | 125,194 | | |
Equity Residential | | 2,790 | | | 126,303 | | |
HCP, Inc. | | 11,130 | | | 357,496 | | |
Health Care REIT, Inc. | | 3,960 | | | 177,923 | | |
Healthcare Realty Trust, Inc. | | 8,410 | | | 203,017 | | |
Home Properties, Inc. | | 7,540 | | | 374,663 | | |
Host Hotels & Resorts, Inc. | | 17,543 | | | 285,249 | | |
LaSalle Hotel Properties | | 10,310 | | | 271,668 | | |
Lexington Realty Trust | | 11,260 | | | 79,721 | | |
Mack-Cali Realty Corp. | | 2,940 | | | 101,018 | | |
National Health Investors, Inc. | | 1,830 | | | 74,335 | | |
National Retail Properties, Inc. | | 8,990 | | | 211,535 | | |
Omega Healthcare Investors, Inc. | | 11,300 | | | 226,226 | | |
Pebblebrook Hotel Trust* | | 7,270 | | | 143,219 | | |
Realty Income Corp. | | 12,820 | | | 420,368 | | |
Simon Property Group, Inc. | | 3,136 | | | 279,167 | | |
Tanger Factory Outlet Centers | | 4,900 | | | 203,840 | | |
UDR, Inc. | | 11,690 | | | 237,424 | | |
Westfield Group (Australia) | | 7,930 | | | 94,802 | | |
| | | | | | | |
| | | | | 8,312,146 | | |
| | | | | | | |
Real Estate Management & Development - 0.01% | | | | | | | |
CB Richard Ellis Group, Inc. - Class A* | | 4,740 | | | 82,097 | | |
| | | | | | | |
| | | | |
| | The accompanying notes are an integral part of the financial statements. | | 104 |
Investment Portfolio - April 30, 2010 (unaudited)
| | | | | | | |
| Pro-Blend® Maximum Term Series | | Shares | | Value (Note 2) | | |
| | | |
COMMON STOCKS (continued) | | | | | | | |
| | | |
Financials (continued) | | | | | | | |
Thrifts & Mortgage Finance - 0.25% | | | �� | | | | |
Aareal Bank AG (Germany)* | | 7,827 | | $ | 172,160 | | |
First Niagara Financial Group, Inc. | | 53,690 | | | 746,291 | | |
NewAlliance Bancshares, Inc. | | 30,910 | | | 402,757 | | |
People’s United Financial, Inc. | | 25,930 | | | 402,693 | | |
| | | | | | | |
| | | | | 1,723,901 | | |
| | | | | | | |
Total Financials | | | | | 81,822,603 | | |
| | | | | | | |
Health Care - 17.34% | | | | | | | |
Biotechnology - 1.99% | | | | | | | |
Amgen, Inc.* | | 13,580 | | | 778,949 | | |
Basilea Pharmaceutica AG (Switzerland)* | | 6,350 | | | 467,628 | | |
Celera Corp.* | | 188,660 | | | 1,409,290 | | |
CSL Ltd. (Australia) | | 7,760 | | | 232,571 | | |
Genzyme Corp.* | | 140,243 | | | 7,466,537 | | |
Grifols S.A. (Spain) | | 207,880 | | | 2,643,270 | | |
Sinovac Biotech Ltd. (China)* | | 85,050 | | | 492,439 | | |
| | | | | | | |
| | | | | 13,490,684 | | |
| | | | | | | |
Health Care Equipment & Supplies - 7.49% | | | | | | | |
Ansell, Ltd. (Australia) | | 101,410 | | | 1,203,899 | | |
Becton, Dickinson and Co. | | 148,490 | | | 11,340,181 | | |
Boston Scientific Corp.* | | 1,100,640 | | | 7,572,403 | | |
Cochlear Ltd. (Australia) | | 16,530 | | | 1,133,375 | | |
Covidien plc (Ireland) | | 34,620 | | | 1,661,414 | | |
DENTSPLY International, Inc. | | 29,400 | | | 1,077,216 | | |
DexCom, Inc.* | | 60,884 | | | 666,680 | | |
Gen-Probe, Inc.* | | 159,170 | | | 7,543,066 | | |
Hologic, Inc.* | | 29,880 | | | 533,956 | | |
Insulet Corp.* | | 12,200 | | | 168,360 | | |
Inverness Medical Innovations, Inc.* | | 260,859 | | | 10,376,971 | | |
Mindray Medical International Ltd. - ADR (China) | | 23,630 | | | 902,666 | | |
Nobel Biocare Holding AG (Switzerland) | | 30,060 | | | 666,479 | | |
OraSure Technologies, Inc.* | | 145,636 | | | 923,332 | | |
Shandong Weigao Group Medical Polymer Co. Ltd. - Class H (China) | | 162,000 | | | 760,534 | | |
Sirona Dental Systems, Inc.* | | 21,680 | | | 903,839 | | |
Straumann Holding AG (Switzerland) | | 4,664 | | | 1,157,170 | | |
Teleflex, Inc. | | 12,450 | | | 763,434 | | |
Zoll Medical Corp.* | | 47,820 | | | 1,460,901 | | |
| | | | | | | |
| | | | | 50,815,876 | | |
| | | | | | | |
Health Care Providers & Services - 2.01% | | | | | | | |
Aetna, Inc. | | 15,780 | | | 466,299 | | |
AMN Healthcare Services, Inc.* | | 63,380 | | | 579,293 | | |
| | | | |
| 105 | | The accompanying notes are an integral part of the financial statements. | | |
Investment Portfolio - April 30, 2010 (unaudited)
| | | | | | | |
| Pro-Blend® Maximum Term Series | | Shares | | Value (Note 2) | | |
| | | |
COMMON STOCKS (continued) | | | | | | | |
| | | |
Health Care (continued) | | | | | | | |
Health Care Providers & Services (continued) | | | | | | | |
Bio-Reference Laboratories, Inc.* | | 26,140 | | $ | 611,676 | | |
Bumrungrad Hospital Public Co. Ltd. - NVDR (Thailand) | | 124,000 | | | 114,975 | | |
CIGNA Corp. | | 14,870 | | | 476,732 | | |
Diagnosticos da America S.A. (Brazil)* | | 171,960 | | | 1,485,885 | | |
OdontoPrev S.A. (Brazil) | | 11,580 | | | 380,060 | | |
Quest Diagnostics, Inc. | | 98,530 | | | 5,631,975 | | |
Sonic Healthcare Ltd. (Australia) | | 139,880 | | | 1,786,147 | | |
UnitedHealth Group, Inc. | | 13,990 | | | 424,037 | | |
VCA Antech, Inc.* | | 45,120 | | | 1,284,115 | | |
WellPoint, Inc.* | | 7,770 | | | 418,026 | | |
| | | | | | | |
| | | | | 13,659,220 | | |
| | | | | | | |
Health Care Technology - 1.42% | | | | | | | |
Allscripts - Misys Healthcare Solutions, Inc.* | | 26,720 | | | 538,942 | | |
Cerner Corp.* | | 85,453 | | | 7,255,814 | | |
Eclipsys Corp.* | | 89,230 | | | 1,845,277 | | |
| | | | | | | |
| | | | | 9,640,033 | | |
| | | | | | | |
Life Sciences Tools & Services - 2.51% | | | | | | | |
Caliper Life Sciences, Inc.* | | 247,890 | | | 994,039 | | |
ICON plc - ADR (Ireland)* | | 28,000 | | | 816,760 | | |
Lonza Group AG (Switzerland) | | 43,270 | | | 3,397,589 | | |
PerkinElmer, Inc. | | 152,811 | | | 3,827,915 | | |
Thermo Fisher Scientific, Inc.* | | 144,420 | | | 7,983,537 | | |
| | | | | | | |
| | | | | 17,019,840 | | |
| | | | | | | |
Pharmaceuticals - 1.92% | | | | | | | |
AstraZeneca plc (United Kingdom) | | 2,175 | | | 96,142 | | |
AstraZeneca plc - ADR (United Kingdom) | | 3,430 | | | 151,709 | | |
Bayer AG (Germany) | | 8,706 | | | 557,267 | | |
GlaxoSmithKline plc (United Kingdom) | | 12,995 | | | 240,784 | | |
Johnson & Johnson | | 167,260 | | | 10,754,818 | | |
Sanofi - Aventis S.A. (France) | | 1,987 | | | 136,672 | | |
Shire plc (Ireland) | | 14,690 | | | 324,337 | | |
Takeda Pharmaceutical Co. Ltd. (Japan) | | 2,700 | | | 116,410 | | |
UCB S.A. (Belgium) | | 17,630 | | | 684,252 | | |
| | | | | | | |
| | | | | 13,062,391 | | |
| | | | | | | |
Total Health Care | | | | | 117,688,044 | | |
| | | | | | | |
Industrials - 11.18% | | | | | | | |
Aerospace & Defense - 1.17% | | | | | | | |
The Boeing Co. | | 101,650 | | | 7,362,510 | | |
Empresa Brasileira de Aeronautica S.A. (Embraer) - ADR (Brazil) | | 16,440 | | | 395,875 | | |
| | | | |
| | The accompanying notes are an integral part of the financial statements. | | 106 |
Investment Portfolio - April 30, 2010 (unaudited)
| | | | | | | |
| Pro-Blend® Maximum Term Series | | Shares | | Value (Note 2) | | |
| | | |
COMMON STOCKS (continued) | | | | | | | |
| | | |
Industrials (continued) | | | | | | | |
Aerospace & Defense (continued) | | | | | | | |
Hexcel Corp.* | | 10,360 | | $ | 167,832 | | |
| | | | | | | |
| | | | | 7,926,217 | | |
| | | | | | | |
Air Freight & Logistics - 2.90% | | | | | | | |
FedEx Corp. | | 67,560 | | | 6,081,076 | | |
TNT N.V. (Netherlands) | | 20,934 | | | 643,300 | | |
United Parcel Service, Inc. - Class B | | 187,173 | | | 12,941,141 | | |
| | | | | | | |
| | | | | 19,665,517 | | |
| | | | | | | |
Airlines - 2.82% | | | | | | | |
AirTran Holdings, Inc.* | | 70,320 | | | 371,290 | | |
Copa Holdings S.A. - Class A (Panama) | | 3,630 | | | 205,748 | | |
Deutsche Lufthansa AG (Germany)* | | 15,400 | | | 257,330 | | |
Ryanair Holdings plc - ADR (Ireland)* | | 240,020 | | | 6,758,963 | | |
Singapore Airlines Ltd. (Singapore) | | 11,000 | | | 122,017 | | |
Southwest Airlines Co. | | 867,617 | | | 11,435,192 | | |
| | | | | | | |
| | | | | 19,150,540 | | |
| | | | | | | |
Commercial Services & Supplies - 1.09% | | | | | | | |
Tomra Systems ASA (Norway) | | 176,230 | | | 851,425 | | |
Waste Management, Inc. | | 188,700 | | | 6,544,116 | | |
| | | | | | | |
| | | | | 7,395,541 | | |
| | | | | | | |
Electrical Equipment - 0.20% | | | | | | | |
ABB Ltd. (Asea Brown Boveri) - ADR (Switzerland)* | | 25,370 | | | 486,089 | | |
Alstom S.A. (France) | | 3,050 | | | 180,630 | | |
Gamesa Corporacion Tecnologica S.A. (Spain) | | 10,480 | | | 129,783 | | |
Nexans S.A. (France) | | 2,650 | | | 210,395 | | |
Schneider Electric S.A. (France) | | 2,050 | | | 234,544 | | |
Yingli Green Energy Holding Co. Ltd. - ADR (China)* | | 7,700 | | | 97,251 | | |
| | | | | | | |
| | | | | 1,338,692 | | |
| | | | | | | |
Industrial Conglomerates - 0.20% | | | | | | | |
Siemens AG (Germany) | | 13,850 | | | 1,370,874 | | |
| | | | | | | |
Machinery - 0.97% | | | | | | | |
FANUC Ltd. (Japan) | | 1,500 | | | 178,368 | | |
Lindsay Corp. | | 3,770 | | | 143,373 | | |
Pall Corp. | | 148,130 | | | 5,775,589 | | |
SmartHeat, Inc. (China)* | | 8,080 | | | 67,791 | | |
Titan International, Inc. | | 12,360 | | | 153,388 | | |
Wabtec Corp. | | 5,590 | | | 265,972 | | |
| | | | | | | |
| | | | | 6,584,481 | | |
| | | | | | | |
| | | | |
| 107 | | The accompanying notes are an integral part of the financial statements. | | |
Investment Portfolio - April 30, 2010 (unaudited)
| | | | | | | |
| Pro-Blend® Maximum Term Series | | Shares | | Value (Note 2) | | |
| | | |
COMMON STOCKS (continued) | | | | | | | |
| | | |
Industrials (continued) | | | | | | | |
Professional Services - 0.77% | | | | | | | |
Adecco S.A. (Switzerland) | | 83,740 | | $ | 4,941,216 | | |
Equifax, Inc. | | 8,340 | | | 280,224 | | |
| | | | | | | |
| | | | | 5,221,440 | | |
| | | | | | | |
Road & Rail - 1.03% | | | | | | | |
All America Latina Logistica S.A. (Brazil) | | 55,960 | | | 500,605 | | |
Heartland Express, Inc. | | 142,920 | | | 2,363,897 | | |
J.B. Hunt Transport Services, Inc. | | 106,750 | | | 3,934,805 | | |
Kansas City Southern* | | 4,700 | | | 190,585 | | |
| | | | | | | |
| | | | | 6,989,892 | | |
| | | | | | | |
Transportation Infrastructure - 0.03% | | | | | | | |
Malaysia Airports Holdings Berhad (Malaysia) | | 160,830 | | | 249,995 | | |
| | | | | | | |
Total Industrials | | | | | 75,893,189 | | |
| | | | | | | |
Information Technology - 18.66% | | | | | | | |
Communications Equipment - 4.24% | | | | | | | |
Alcatel-Lucent - ADR (France)* | | 191,140 | | | 605,914 | | |
Blue Coat Systems, Inc.* | | 33,960 | | | 1,104,719 | | |
Cisco Systems, Inc.* | | 636,980 | | | 17,147,502 | | |
Infinera Corp.* | | 93,740 | | | 857,721 | | |
Juniper Networks, Inc.* | | 155,138 | | | 4,407,470 | | |
QUALCOMM, Inc. | | 100,500 | | | 3,893,370 | | |
Riverbed Technology, Inc.* | | 23,480 | | | 727,645 | | |
| | | | | | | |
| | | | | 28,744,341 | | |
| | | | | | | |
Computers & Peripherals - 1.97% | | | | | | | |
Compellent Technologies, Inc.* | | 37,000 | | | 465,090 | | |
EMC Corp.* | | 679,300 | | | 12,913,493 | | |
| | | | | | | |
| | | | | 13,378,583 | | |
| | | | | | | |
Electronic Equipment, Instruments & Components - 0.18% | | | | | | | |
Cogent, Inc.* | | 65,910 | | | 682,168 | | |
Keyence Corp. (Japan) | | 542 | | | 129,766 | | |
LoJack Corp.* | | 100,326 | | | 419,363 | | |
| | | | | | | |
| | | | | 1,231,297 | | |
| | | | | | | |
Internet Software & Services - 2.81% | | | | | | | |
comScore, Inc.* | | 38,000 | | | 689,700 | | |
Google, Inc. - Class A* | | 33,909 | | | 17,817,145 | | |
NetEase.com, Inc. - ADR (China)* | | 4,420 | | | 154,125 | | |
Vocus, Inc.* | | 24,690 | | | 420,965 | | |
| | | | | | | |
| | | | | 19,081,935 | | |
| | | | | | | |
| | | | |
| | The accompanying notes are an integral part of the financial statements. | | 108 |
Investment Portfolio - April 30, 2010 (unaudited)
| | | | | | | |
| Pro-Blend® Maximum Term Series | | Shares | | Value (Note 2) | | |
| | | |
COMMON STOCKS (continued) | | | | | | | |
| | | |
Information Technology (continued) | | | | | | | |
IT Services - 5.23% | | | | | | | |
Accenture plc - Class A (Ireland) | | 164,930 | | $ | 7,197,545 | | |
Amdocs Ltd. (Guernsey)* | | 43,060 | | | 1,375,336 | | |
Automatic Data Processing, Inc. | | 187,819 | | | 8,143,832 | | |
Cap Gemini S.A. (France) | | 13,690 | | | 695,473 | | |
Cielo S.A. (Brazil) | | 77,190 | | | 745,589 | | |
Paychex, Inc. | | 204,575 | | | 6,259,995 | | |
Redecard S.A. (Brazil) | | 44,990 | | | 746,965 | | |
The Western Union Co. | | 564,570 | | | 10,303,403 | | |
| | | | | | | |
| | | | | 35,468,138 | | |
| | | | | | | |
Semiconductors & Semiconductor Equipment - 1.13% | | | | | | | |
Advantest Corp. (Japan) | | 139,800 | | | 3,647,733 | | |
Hynix Semiconductor, Inc. (South Korea)* | | 6,160 | | | 157,842 | | |
KLA-Tencor Corp. | | 99,440 | | | 3,386,926 | | |
Sumco Corp. (Japan)* | | 12,000 | | | 267,632 | | |
Taiwan Semiconductor Manufacturing Co. Ltd. - ADR (Taiwan) | | 20,793 | | | 220,198 | | |
| | | | | | | |
| | | | | 7,680,331 | | |
| | | | | | | |
Software - 3.10% | | | | | | | |
Autodesk, Inc.* | | 304,510 | | | 10,356,385 | | |
Misys plc (United Kingdom)* | | 54,230 | | | 194,245 | | |
Net 1 UEPS Technologies, Inc. (South Africa)* | | 31,160 | | | 511,024 | | |
SAP AG (Germany) | | 5,780 | | | 278,780 | | |
SAP AG - ADR (Germany) | | 173,250 | | | 8,220,712 | | |
Shanda Interactive Entertainment Ltd. - ADR (China)* | | 13,270 | | | 601,662 | | |
Sonic Solutions, Inc.* | | 28,920 | | | 362,946 | | |
Square Enix Holdings Co. Ltd. (Japan) | | 8,700 | �� | | 183,938 | | |
UbiSoft Entertainment S.A. (France)* | | 28,054 | | | 359,593 | | |
| | | | | | | |
| | | | | 21,069,285 | | |
| | | | | | | |
Total Information Technology | | | | | 126,653,910 | | |
| | | | | | | |
Materials - 2.62% | | | | | | | |
Chemicals - 1.98% | | | | | | | |
Arkema S.A. (France) | | 40 | | | 1,685 | | |
Calgon Carbon Corp.* | | 22,488 | | | 348,564 | | |
Johnson Matthey plc (United Kingdom) | | 6,510 | | | 173,615 | | |
Monsanto Co. | | 202,000 | | | 12,738,120 | | |
The Scotts Miracle-Gro Co. - Class A | | 4,070 | | | 197,191 | | |
| | | | | | | |
| | | | | 13,459,175 | | |
| | | | | | | |
Construction Materials - 0.62% | | | | | | | |
Martin Marietta Materials, Inc. | | 43,820 | | | 4,201,462 | | |
| | | | | | | |
| | | | |
| 109 | | The accompanying notes are an integral part of the financial statements. | | |
Investment Portfolio - April 30, 2010 (unaudited)
| | | | | | | |
| Pro-Blend® Maximum Term Series | | Shares | | Value (Note 2) | | |
| | | |
COMMON STOCKS (continued) | | | | | | | |
| | | |
Materials (continued) | | | | | | | |
Paper & Forest Products - 0.02% | | | | | | | |
Norbord, Inc. (Canada)* | | 7,002 | | $ | 137,104 | | |
| | | | | | | |
Total Materials | | | | | 17,797,741 | | |
| | | | | | | |
Telecommunication Services - 2.14% | | | | | | | |
Diversified Telecommunication Services - 0.12% | | | | | | | |
France Telecom S.A. (France) | | 11,810 | | | 258,588 | | |
Swisscom AG - ADR (Switzerland)2 | | 7,966 | | | 268,614 | | |
Telefonica S.A. - ADR (Spain) | | 1,700 | | | 115,226 | | |
Telenor ASA - ADR (Norway)*2 | | 3,430 | | | 146,495 | | |
| | | | | | | |
| | | | | 788,923 | | |
| | | | | | | |
| | | |
Wireless Telecommunication Services - 2.02% | | | | | | | |
American Tower Corp. - Class A* | | 92,630 | | | 3,780,230 | | |
Crown Castle International Corp.* | | 228,450 | | | 8,646,833 | | |
Hutchison Telecommunications International Ltd. (Hong Kong)* | | 95,000 | | | 26,552 | | |
SBA Communications Corp. - Class A* | | 23,290 | | | 823,767 | | |
SK Telecom Co. Ltd. - ADR (South Korea) | | 25,150 | | | 465,526 | | |
| | | | | | | |
| | | | | 13,742,908 | | |
| | | | | | | |
| | | |
Total Telecommunication Services | | | | | 14,531,831 | | |
| | | | | | | |
Utilities - 0.17% | | | | | | | |
Electric Utilities - 0.07% | | | | | | | |
E.ON AG (Germany) | | 13,630 | | | 503,780 | | |
| | | | | | | |
Independent Power Producers & Energy Traders - 0.02% | | | | | | | |
Mirant Corp.* | | 6,060 | | | 70,660 | | |
RRI Energy, Inc.* | | 18,490 | | | 75,254 | | |
| | | | | | | |
| | | | | 145,914 | | |
| | | | | | | |
| | | |
Multi-Utilities - 0.05% | | | | | | | |
GDF Suez (France) | | 3,854 | | | 137,496 | | |
National Grid plc (United Kingdom) | | 21,480 | | | 206,725 | | |
| | | | | | | |
| | | | | 344,221 | | |
| | | | | | | |
| | | |
Water Utilities - 0.03% | | | | | | | |
Cia de Saneamento de Minas Gerais - Copasa MG (Brazil) | | 13,720 | | | 198,903 | | |
| | | | | | | |
Total Utilities | | | | | 1,192,818 | | |
| | | | | | | |
TOTAL COMMON STOCKS
(Identified Cost $548,982,141) | | | | | 618,103,906 | | |
| | | | | | | |
| | | | |
| | The accompanying notes are an integral part of the financial statements. | | 110 |
Investment Portfolio - April 30, 2010 (unaudited)
| | | | | | | |
| Pro-Blend® Maximum Term Series | | Shares/
Principal Amount | | Value (Note 2) | | |
| | | |
PREFERRED STOCKS - 0.03% | | | | | | | |
| | | |
Consumer Staples - 0.03% | | | | | | | |
Household Products - 0.03% | | | | | | | |
Henkel AG & Co. KGaA (Germany) | | | | | | | |
(Identified Cost $134,525) | | 3,790 | | $ | 202,984 | | |
| | | | | | | |
| | | |
WARRANTS - 0.00%** | | | | | | | |
| | | |
Health Care - 0.00%** | | | | | | | |
Life Sciences Tools & Services - 0.00%** | | | | | | | |
Caliper Life Sciences, Inc., 8/10/2011* | | | | | | | |
(Identified Cost $2,672) | | 4,132 | | | 1,054 | | |
| | | | | | | |
| | | |
MUTUAL FUNDS - 0.03% | | | | | | | |
| | | |
iShares Dow Jones US Real Estate Index Fund | | | | | | | |
(Identified Cost $172,592) | | 3,990 | | | 211,271 | | |
| | | | | | | |
| | | |
U.S. TREASURY SECURITIES - 1.94% | | | | | | | |
| | | |
U.S. Treasury Bonds - 0.38% | | | | | | | |
U.S. Treasury Bond, 5.375%, 2/15/2031 | | | | | | | |
(Identified Cost $2,617,734) | | $ 2,300,000 | | | 2,611,218 | | |
| | | | | | | |
U.S. Treasury Notes - 1.56% | | | | | | | |
U.S. Treasury Note, 4.875%, 4/30/2011 | | 6,500,000 | | | 6,783,361 | | |
U.S. Treasury Note, 2.625%, 6/30/2014 | | 750,000 | | | 766,171 | | |
U.S. Treasury Note, 2.625%, 12/31/2014 | | 3,000,000 | | | 3,044,064 | | |
| | | | | | | |
Total U.S. Treasury Notes
(Identified Cost $10,520,503) | | | | | 10,593,596 | | |
| | | | | | | |
TOTAL U.S. TREASURY SECURITIES
(Identified Cost $13,138,237) | | | | | 13,204,814 | | |
| | | | | | | |
| | | |
U.S. GOVERNMENT AGENCIES - 4.16% | | | | | | | |
| | | |
Other Agencies - 4.16% | | | | | | | |
Fannie Mae, 6.25%, 5/15/2029 | | 4,825,000 | | | 5,648,275 | | |
Fannie Mae, 7.25%, 5/15/2030 | | 4,330,000 | | | 5,632,317 | | |
Fannie Mae, 6.625%, 11/15/2030 | | 4,610,000 | | | 5,645,812 | | |
Freddie Mac, 6.75%, 3/15/2031 | | 4,540,000 | | | 5,650,965 | | |
Freddie Mac, 6.25%, 7/15/2032 | | 4,760,000 | | | 5,637,677 | | |
| | | | | | | |
TOTAL U.S. GOVERNMENT AGENCIES
(Identified Cost $27,970,366) | | | | | 28,215,046 | | |
| | | | | | | |
| | | | |
| 111 | | The accompanying notes are an integral part of the financial statements. | | |
Investment Portfolio - April 30, 2010 (unaudited)
| | | | | | | | |
| Pro-Blend® Maximum Term Series | | Shares/
Principal Amount | | Value (Note 2) | | | |
| | | |
SHORT-TERM INVESTMENTS - 3.38% | | | | | | | | |
| | | |
Dreyfus Cash Management, Inc. - Institutional Shares3 , 0.09%, | | 10,625,540 | | $ | 10,625,540 | | | |
U.S. Treasury Bill4, 0.42%, 7/1/2010 | | $12,300,000 | | | 12,296,937 | | | |
| | | | | | | | |
TOTAL SHORT-TERM INVESTMENTS
(Identified Cost $22,916,838) | | | | | 22,922,477 | | | |
| | | | | | | | |
TOTAL INVESTMENTS - 100.59%
(Identified Cost $613,317,371) | | | | | 682,861,552 | | | |
LIABILITIES, LESS OTHER ASSETS - (0.59%) | | | | | (4,003,430 | ) | | |
| | | | | | | | |
NET ASSETS - 100% | | | | $ | 678,858,122 | | | |
| | | | | | | | |
ADR - American Depository Receipt
NVDR - Non-Voting Depository Receipt
*Non-income producing security
**Less than 0.01%
1The Bank of New York Mellon Corp. is the Series’ custodian.
2Latest quoted sales price is not available and the latest quoted bid price was used to value the security.
3Rate shown is the current yield as of April 30, 2010.
4Rate shown reflects the annualized yield at time of purchase.
| | | | |
| | The accompanying notes are an integral part of the financial statements. | | 112 |
Statement of Assets and Liabilities - Pro-Blend® Maximum Term Series (unaudited)
April 30, 2010
| | | | |
ASSETS: | | | | |
| |
Investments, at value (identified cost $613,317,371) (Note 2) | | $ | 682,861,552 | |
Receivable for fund shares sold | | | 2,230,527 | |
Receivable for securities sold | | | 783,393 | |
Dividends receivable | | | 643,210 | |
Interest receivable | | | 609,652 | |
Foreign tax reclaims receivable | | | 263,092 | |
| | | | |
| |
TOTAL ASSETS | | | 687,391,426 | |
| | | | |
| |
LIABILITIES: | | | | |
| |
Accrued management fees (Note 3) | | | 412,815 | |
Accrued shareholder services fees (Class S) (Note 3) | | | 111,193 | |
Accrued transfer agent fees (Note 3) | | | 35,042 | |
Accrued fund accounting and administration fees (Note 3) | | | 9,063 | |
Accrued distribution and service (Rule 12b-1) fees (Class C) (Note 3) | | | 1,497 | |
Accrued Chief Compliance Officer service fees (Note 3) | | | 667 | |
Payable for securities purchased | | | 7,805,204 | |
Payable for fund shares repurchased | | | 119,653 | |
Other payables and accrued expenses | | | 38,170 | |
| | | | |
| |
TOTAL LIABILITIES | | | 8,533,304 | |
| | | | |
| |
TOTAL NET ASSETS | | $ | 678,858,122 | |
| | | | |
| |
NET ASSETS CONSIST OF: | | | | |
| |
Capital stock | | $ | 489,304 | |
Additional paid-in-capital | | | 688,810,540 | |
Undistributed net investment income | | | 1,292,334 | |
Accumulated net realized loss on investments, foreign currency and translation of other assets and liabilities | | | (81,287,955 | ) |
Net unrealized appreciation on investments, foreign currency and translation of other assets and liabilities | | | 69,553,899 | |
| | | | |
| |
TOTAL NET ASSETS | | $ | 678,858,122 | |
| | | | |
| |
NET ASSET VALUE, OFFERING PRICE AND REDEMPTION PRICE PER SHARE - Class S
($545,910,316/35,602,843 shares) | | $ | 15.33 | |
| | | | |
| |
NET ASSET VALUE, OFFERING PRICE AND REDEMPTION PRICE PER SHARE - Class I
($130,529,202/13,095,638 shares) | | $ | 9.97 | |
| | | | |
| |
NET ASSET VALUE, OFFERING PRICE AND REDEMPTION PRICE PER SHARE - Class C
($2,418,604/231,922 shares) | | $ | 10.43 | |
| | | | |
| | | | |
| 113 | | The accompanying notes are an integral part of the financial statements. | | |
Statement of Operations - Pro-Blend® Maximum Term Series (unaudited)
For the Six Months Ended April 30, 2010
| | | | |
INVESTMENT INCOME: | | | | |
| |
Dividends (net of foreign taxes withheld, $117,223) | | $ | 4,059,591 | |
Interest | | | 448,643 | |
| | | | |
| |
Total Investment Income | | | 4,508,234 | |
| | | | |
| |
EXPENSES: | | | | |
| |
Management fees (Note 3) | | | 2,194,895 | |
Shareholder services fees (Class S) (Note 3) | | | 618,023 | |
Transfer agent fees (Note 3) | | | 106,893 | |
Fund accounting and administration fees (Note 3) | | | 57,870 | |
Directors’ fees (Note 3) | | | 6,373 | |
Distribution and service (Rule 12b-1) fees (Class C) (Note 3) | | | 2,573 | |
Chief Compliance Officer service fees (Note 3) | | | 1,700 | |
Custodian fees | | | 22,765 | |
Miscellaneous | | | 79,629 | |
| | | | |
| |
Total Expenses | | | 3,090,721 | |
Less reduction of expenses (Note 3) | | | (813 | ) |
| | | | |
| |
Net Expenses | | | 3,089,908 | |
| | | | |
| |
NET INVESTMENT INCOME | | | 1,418,326 | |
| | | | |
| |
REALIZED AND UNREALIZED GAIN (LOSS) ON INVESTMENTS AND FOREIGN CURRENCY: | | | | |
| |
Net realized gain (loss) on- | | | | |
Investments | | | 15,022,575 | |
Foreign currency and translation of other assets and liabilities | | | (3,936 | ) |
| | | | |
| |
| | | 15,018,639 | |
| | | | |
| |
Net change in unrealized appreciation (depreciation) on- | | | | |
Investments | | | 62,065,656 | |
Foreign currency and translation of other assets and liabilities | | | (9,862 | ) |
| | | | |
| |
| | | 62,055,794 | |
| | | | |
| |
NET REALIZED AND UNREALIZED GAIN (LOSS) ON INVESTMENTS AND FOREIGN
CURRENCY | | | 77,074,433 | |
| | | | |
| |
NET INCREASE IN NET ASSETS RESULTING FROM OPERATIONS | | $ | 78,492,759 | |
| | | | |
| | | | |
| | The accompanying notes are an integral part of the financial statements. | | 114 |
Statements of Changes in Net Assets - Pro-Blend® Maximum Term Series
| | | | | | | | | |
| | | For the Six
Months Ended
4/30/10
(unaudited) | | | | | For the Year Ended
10/31/09 | |
INCREASE (DECREASE) IN NET ASSETS: | | | | | | | | | |
| | | |
OPERATIONS: | | | | | | | | | |
| | | |
Net investment income | | $ 1,418,326 | | | | | $ | 2,127,052 | |
Net realized gain (loss) on investments and foreign currency | | 15,018,639 | | | | | | (50,764,850 | ) |
Net change in unrealized appreciation (depreciation) on investments and foreign currency | | 62,055,794 | | | | | | 114,794,411 | |
| | | | | | | | | |
| | | |
Net increase from operations | | 78,492,759 | | | | | | 66,156,613 | |
| | | | | | | | | |
| | | |
DISTRIBUTIONS TO SHAREHOLDERS (Note 8): | | | | | | | | | |
| | | |
From net investment income (Class S) | | (756,859 | ) | | | | | (3,331,521 | ) |
From net investment income (Class I) | | (333,929 | ) | | | | | (155,094 | ) |
| | | | | | | | | |
| | | |
Total distributions to shareholders | | (1,090,788 | ) | | | | | (3,486,615 | ) |
| | | | | | | | | |
| | | |
CAPITAL STOCK ISSUED AND REPURCHASED: | | | | | | | | | |
| | | |
Net increase from capital share transactions (Note 5) | | 105,414,965 | | | | | | 88,758,897 | |
| | | | | | | | | |
| | | |
Net increase in net assets | | 182,816,936 | | | | | | 151,428,895 | |
| | | |
NET ASSETS: | | | | | | | | | |
| | | |
Beginning of period | | 496,041,186 | | | | | | 344,612,291 | |
| | | | | | | | | |
| | | |
End of period (including undistributed net investment income of $1,292,334 and $964,796, respectively) | | $678,858,122 | | | | | $ | 496,041,186 | |
| | | | | | | | | |
| | | | |
| 115 | | The accompanying notes are an integral part of the financial statements. | | |
Financial Highlights - Pro-Blend® Maximum Term Series - Class S
| | | | | | | | | | | | | | | | | |
| | | For the Six
Months Ended
4/30/10
(unaudited) | | For the Years Ended | |
| | | | 10/31/09 | | | 10/31/08 | | | 10/31/07 | | | 10/31/06 | | | 10/31/05 | |
| Per share data (for a share outstanding throughout each period): | | | | | | | | | | | | | | | | | |
| Net asset value - Beginning of period | | $13.35 | | $11.50 | | | $19.57 | | | $18.35 | | | $16.79 | | | $15.00 | |
| | | | | | | | | | | | | | | | | |
Income (loss) from investment operations: | | | | | | | | | | | | | | | | | |
Net investment income | | 0.031 | | 0.06 | 1 | | 0.12 | | | 0.11 | | | 0.14 | | | 0.08 | |
Net realized and unrealized gain (loss) on investments | | 1.97 | | 1.90 | | | (6.22 | ) | | 2.41 | | | 2.80 | | | 2.11 | |
| | | | | | | | | | | | | | | | | |
Total from investment operations | | 2.00 | | 1.96 | | | (6.10 | ) | | 2.52 | | | 2.94 | | | 2.19 | |
| | | | | | | | | | | | | | | | | |
Less distributions to shareholders: | | | | | | | | | | | | | | | | | |
From net investment income | | (0.02) | | (0.11 | ) | | (0.10 | ) | | (0.15 | ) | | (0.08 | ) | | (0.05 | ) |
From net realized gain on investments | | — | | — | | | (1.87 | ) | | (1.15 | ) | | (1.30 | ) | | (0.35 | ) |
| | | | | | | | | | | | | | | | | |
Total distributions to shareholders | | (0.02) | | (0.11 | ) | | (1.97 | ) | | (1.30 | ) | | (1.38 | ) | | (0.40 | ) |
| | | | | | | | | | | | | | | | | |
Net asset value - End of period | | $15.33 | | $13.35 | | | $11.50 | | | $19.57 | | | $18.35 | | | $16.79 | |
| | | | | | | | | | | | | | | | | |
Net assets - End of period
(000’s omitted) | | $545,910 | | $443,770 | | | $342,015 | | | $517,766 | | | $285,714 | | | $186,547 | |
| | | | | | | | | | | | | | | | | |
Total return2 | | 15.01% | | 17.34% | | | (34.19% | ) | | 14.37% | | | 18.87% | | | 14.84% | |
Ratios (to average net assets)/ Supplemental Data: | |
Expenses* | | 1.09%3 | | 1.10% | | | 1.10% | | | 1.12% | | | 1.16% | | | 1.20% | |
Net investment income | | 0.44%3 | | 0.55% | | | 0.77% | | | 0.67% | | | 0.94% | | | 0.51% | |
Series portfolio turnover | | 30% | | 67% | | | 82% | | | 61% | | | 56% | | | 61% | |
|
* The investment advisor did not impose all or a portion of its management fees, CCO fees, fund accounting and transfer agent fees and other fees in some periods and in some periods paid a portion of the Series’ expenses. If these expenses had been incurred by the Class, the expense ratio (to average net assets) would have been increased by the following amount: | |
| | 0.00%3,4 | | 0.03% | | | 0.04% | | | N/A | | | N/A | | | 0.02% | |
1Calculated based on average shares outstanding during the period.
2Represents aggregate total return for the periods indicated, and assumes reinvestment of all distributions. Total return would have been lower had certain expenses not been waived or reimbursed during certain periods. Periods less than one year are not annualized.
3Annualized.
4Less than 0.01%.
| | | | |
| | The accompanying notes are an integral part of the financial statements. | | 116 |
Financial Highlights - Pro-Blend® Maximum Term Series - Class I
| | | | | | |
| | | For the Six
Months Ended
4/30/10
(unaudited) | | For the
Year Ended
10/31/09 | | For the Period
3/28/081 to 10/31/08 |
Per share data (for a share outstanding throughout each period): |
Net asset value - Beginning of period | | $8.70 | | $7.57 | | $10.00 |
| | | | | | |
Income (loss) from investment operations: | | | | | | |
Net investment income | | 0.042 | | 0.052 | | 0.05 |
Net realized and unrealized gain (loss) on investments | | 1.28 | | 1.24 | | (2.44) |
| | | | | | |
Total from investment operations | | 1.32 | | 1.29 | | (2.39) |
| | | | | | |
Less distributions to shareholders: | | | | | | |
From net investment income | | (0.05) | | (0.16) | | (0.04) |
| | | | | | |
Net asset value - End of period | | $9.97 | | $8.70 | | $7.57 |
| | | | | | |
Net assets - End of period (000’s omitted) | | $130,529 | | $52,271 | | $2,597 |
| | | | | | |
Total return3 | | 15.23% | | 17.58% | | (24.01%) |
Ratios (to average net assets)/Supplemental Data: | | | | | | |
Expenses* | | 0.85%4 | | 0.85% | | 0.85%4 |
Net investment income | | 0.76%4 | | 0.68% | | 0.88%4 |
Series portfolio turnover | | 30% | | 67% | | 82% |
|
* The investment advisor did not impose all or a portion of its management fees, CCO fees, fund accounting and transfer agent fees and other fees in some periods and in some periods paid a portion of the Series’ expenses. If these expenses had been incurred by the Class, the expense ratio (to average net assets) would have been increased by the following amount: |
| | 0.00%4,5 | | 0.02% | | 0.08%4 |
1Commencement of operations.
2Calculated based on average shares outstanding during the period.
3Represents aggregate total return for the periods indicated, and assumes reinvestment of all distributions. Total return would have been lower had certain expenses not been waived or reimbursed during the periods. Periods less than one year are not annualized.
4Annualized.
5Less than 0.01%.
| | | | |
| 117 | | The accompanying notes are an integral part of the financial statements. | | |
Financial Highlights - Pro-Blend® Maximum Term Series - Class C
| | |
| | | For the Period
1/4/101 to 4/30/10 (unaudited) |
Per share data (for a share outstanding throughout the period): | | |
Net asset value - Beginning of period | | $10.00 |
| | |
Income from investment operations: | | |
Net investment income | | 0.012 |
Net realized and unrealized gain on investments | | 0.42 |
| | |
Total from investment operations | | 0.43 |
| | |
Net asset value - End of period | | $10.43 |
| | |
Net assets - End of period (000’s omitted) | | $2,419 |
| | |
Total return3 | | 4.30% |
Ratios (to average net assets)/Supplemental Data: | | |
Expenses* | | 1.83%4 |
Net investment income | | 0.17%4 |
Series portfolio turnover | | 30% |
|
* The investment advisor did not impose all or a portion of its management fees and other fees during the period and paid a portion of the Series’ expenses. If these expenses had been incurred by the Class, the expense ratio (to average net assets) would have been increased by the following amount: |
| | 0.02%4 |
1Commencement of operations.
2Calculated based on average shares outstanding during the period.
3Represents aggregate total return for the period indicated, and assumes reinvestment of all distributions. Total return would have been lower had certain expenses not been waived or reimbursed during the period. Periods less than one year are not annualized.
4Annualized.
| | | | |
| | The accompanying notes are an integral part of the financial statements. | | 118 |
Notes to Financial Statements (unaudited)
Pro-Blend® Conservative Term Series, Pro-Blend® Moderate Term Series, Pro-Blend® Extended Term Series and Pro-Blend® Maximum Term Series (each the “Series”) are no-load diversified series of Manning & Napier Fund, Inc. (the “Fund”). The Fund is organized in Maryland and is registered under the Investment Company Act of 1940 (the “1940 Act”), as amended, as an open-end management investment company.
The Series are asset allocation funds. Each invests in a combination of stocks, bonds and cash and is managed according to specific goals. The goals are as follows: Pro-Blend® Conservative Term Series - primary goal is preservation of capital; secondary goal is long-term growth of capital. Pro-Blend® Moderate Term Series - equal emphasis on long-term growth of capital and preservation of capital. Pro-Blend® Extended Term Series - primary goal is long-term growth of capital; secondary goal is preservation of capital. Pro-Blend® Maximum Term Series - primary goal is long-term growth of capital.
Each Series is authorized to issue six classes of shares (Class C (formerly Class B), D, E, I, S and Z). Currently, only Class S, I and C shares have been issued. Each class of shares is substantially the same, except that class-specific transfer agency distribution and shareholder servicing expenses are borne by the specific class of shares to which they relate.
The Fund’s Advisor is Manning & Napier Advisors, Inc. (the “Advisor”). Shares of each Series are offered to investors and employees of the Advisor and its affiliates. The total authorized capital stock of the Fund consists of 10.0 billion shares of common stock each having a par value of $0.01. As of April 30, 2010, 6.2 billion shares have been designated in total among 29 series, of which 87.5 million have been designated as Pro-Blend® Conservative Term Series Class S common stock, 75 million have been designated as Pro-Blend® Conservative Term Series Class I common stock, 125 million each have been designated as Class S common stock and Class I common stock for Pro-Blend® Moderate Term Series, 125 million each have been designated as Class S common stock for Pro-Blend® Extended Term Series and Pro-Blend® Maximum Term Series, 200 million each have been designated as Class I common stock for Pro-Blend® Extended Term Series and Pro-Blend® Maximum Term Series and 25 million each have been designed as Class C common stock for Pro-Blend® Conservative Term Series, Pro-Blend® Moderate Term Series, Pro-Blend® Extended Term Series and Pro-Blend® Maximum Term Series.
| 2. | SIGNIFICANT ACCOUNTING POLICIES |
Security Valuation
Portfolio securities, including domestic equities, foreign equities, warrants and options, listed on an exchange other than the NASDAQ National Market System are valued at the latest quoted sales price of the exchange on which the security is primarily traded. Securities not traded on valuation date or securities not listed on an exchange are valued at the latest quoted bid price provided by the Fund’s pricing service. Securities listed on the NASDAQ National Market System are valued in accordance with the NASDAQ Official Closing Price.
Debt securities, including government bonds, foreign bonds, asset-backed securities, structured notes, supranational obligations, sovereign bonds, corporate bonds and mortgage-backed securities will normally be valued on the basis of evaluated bid prices provided by an independent pricing service. Certain investments in securities held by the Series may be valued on a basis of a price provided by a principal market maker. These prices may differ from the value that would have been used had a broader market for securities existed.
Short-term investments that mature in sixty days or less are valued at amortized cost, which approximates market value. Investments in open-end investment companies are valued at their net asset value per share on valuation date.
Volume and level of activity in established markets for an asset or liability are evaluated to determine whether recent transactions and quoted prices are determinative of fair value. Where there have been significant decreases in volume and level of activity, further analysis and adjustment may be necessary to estimate fair value. The Series
Notes to Financial Statements (unaudited)
| 2. | SIGNIFICANT ACCOUNTING POLICIES (continued) |
Security Valuation (continued)
measure fair value in these instances by the use of inputs and valuation techniques which may be based upon current market prices of securities that are comparable in coupon, rating, maturity and industry and/or expectation of future cash flows. As a result of trading in relatively thin markets and/or markets that experience significant volatility, the prices used by the Series to value these securities may differ from the value that would be realized if these securities were sold, and the differences could be material.
Securities for which representative valuations or prices are not available from the Fund’s pricing service may be valued at fair value. Due to the inherent uncertainty of valuations of such securities, the fair value may differ significantly from the values that would have been used had a ready market for such securities existed. If trading or events occurring after the close of the principal market in which securities are traded are expected to materially affect the value of those securities, then they may be valued at their fair value, taking this trading or these events into account. Fair value is determined in good faith by the Advisor under procedures approved by and under the general supervision and responsibility of the Fund’s Board of Directors (the “Board”).
Various inputs are used in determining the value of the Series’ assets or liabilities carried at market value. These inputs are summarized in three broad levels. Level 1 includes quoted prices in active markets for identical assets and liabilities. Level 2 includes other significant observable inputs (including quoted prices for similar securities, interest rates, prepayment speeds, credit risk, etc.). Level 3 includes significant unobservable inputs (including the Series’ own assumptions in determining the fair value of investments). The inputs or methodology used for valuing securities are not necessarily an indication of the risk associated with investing in those securities.
The following is a summary of the valuation levels used for major security types as of April 30, 2010 in valuing the Series’ assets or liabilities carried at market value:
| | | | | | | | | | | | |
| | | Pro-Blend ® Conservative Term Series |
| Description | | 4/30/10 | | Level 1 | | Level 2 | | Level 3 |
Equity securities* | | $ | 138,993,113 | | $ | 138,887,274 | | $ | 105,839 | | $ | — |
Preferred securities | | | 1,178,818 | | | 49,808 | | | 1,129,010 | | | — |
Debt Securities: | | | | | | | | | | | | |
U.S. Treasury and other U.S. Government agencies | | | 237,948,058 | | | — | | | 237,948,058 | | | — |
Foreign government bonds | | | 385,783 | | | — | | | 385,783 | | | — |
Corporate debt | | | 188,088,267 | | | — | | | 187,963,312 | | | 124,955 |
Convertible corporate debt | | | 677,744 | | | — | | | 677,744 | | | — |
Asset backed securities | | | 179,928 | | | — | | | 179,928 | | | — |
Mutual funds | | | 26,803,292 | | | 26,803,292 | | | — | | | — |
Other financial instruments** | | | — | | | — | | | — | | | — |
| | | | | | | | | | | | |
Total | | $ | 594,255,003 | | $ | 165,740,374 | | $ | 428,389,674 | | $ | 124,955 |
| | | | | | | | | | | | |
120
Notes to Financial Statements (unaudited)
| 2. | SIGNIFICANT ACCOUNTING POLICIES (continued) |
Security Valuation (continued)
The following table is a reconciliation of Level 3 investments for which significant unobservable inputs were used to determine fair value:
| | | | | | | | | | | | |
| Level 3 Reconciliation | | | | | | | | Corporate
Debt |
Balance as of October 31, 2009 (market value) | | | | | | | | | | | $ | 51,925 |
Accrued discounts/premiums | | | | | | | | | | | | 390 |
Realized gain/loss | | | | | | | | | | | | 208 |
Change in unrealized appreciation/depreciation *** | | | | | | | | | | | | 7,356 |
Net purchases/sales | | | | | | | | | | | | 65,076 |
| | | | | | | | | | | | |
Balance as of April 30, 2010 (market value) | | | | | | | | | | | $ | 124,955 |
| | | | | | | | | | | | |
| | | | | | | | | | | | |
| | | Pro-Blend ® Moderate Term Series |
| Description | | 4/30/10 | | Level 1 | | Level 2 | | Level 3 |
Equity securities* | | $ | 352,406,869 | | $ | 352,059,602 | | $ | 347,267 | | $ | — |
Preferred securities | | | 2,441,340 | | | 162,815 | | | 2,278,525 | | | — |
Debt Securities: | | | | | | | | | | | | |
U.S. Treasury and other U.S. Government agencies | | | 238,929,739 | | | — | | | 238,929,739 | | | — |
Foreign government bonds | | | 994,914 | | | — | | | 994,914 | | | — |
Corporate debt | | | 176,458,402 | | | — | | | 176,160,432 | | | 297,970 |
Convertible corporate debt | | | 2,103,269 | | | — | | | 2,103,269 | | | — |
Asset backed securities | | | 354,563 | | | — | | | 354,563 | | | — |
Mutual funds | | | 36,656,338 | | | 36,656,338 | | | — | | | — |
Other financial instruments** | | | — | | | — | | | — | | | — |
| | | | | | | | | | | | |
Total | | $ | 810,345,434 | | $ | 388,878,755 | | $ | 421,168,709 | | $ | 297,970 |
| | | | | | | | | | | | |
The following table is a reconciliation of Level 3 investments for which significant unobservable inputs were used to determine fair value: |
| Level 3 Reconciliation | | | | | | | | Corporate
Debt |
Balance as of October 31, 2009 (market value) | | | | | | | | | | | $ | 100,965 |
Accrued discounts/premiums | | | | | | | | | | | | 806 |
Realized gain/loss | | | | | | | | | | | | 497 |
Change in unrealized appreciation/depreciation *** | | | | | | | | | | | | 15,338 |
Net purchases/sales | | | | | | | | | | | | 180,364 |
| | | | | | | | | | | | |
Balance as of April 30, 2010 (market value) | | | | | | | | | | | $ | 297,970 |
| | | | | | | | | | | | |
121
Notes to Financial Statements (unaudited)
| 2. | SIGNIFICANT ACCOUNTING POLICIES (continued) |
Security Valuation (continued)
| | | | | | | | | | | | |
| | | Pro-Blend ® Extended Term Series |
| Description | | 4/30/10 | | Level 1 | | Level 2 | | Level 3 |
Equity securities* | | $ | 452,133,756 | | $ | 451,723,380 | | $ | 410,376 | | $ | — |
Preferred securities | | | 3,195,296 | | | 203,519 | | | 2,991,777 | | | — |
Debt Securities: | | | | | | | | | | | | |
U.S. Treasury and other U.S. Government agencies | | | 178,908,956 | | | — | | | 178,908,956 | | | — |
Foreign government bonds | | | 989,838 | | | — | | | 989,838 | | | — |
Corporate debt | | | 143,144,705 | | | — | | | 142,824,308 | | | 320,397 |
Convertible corporate debt | | | 2,760,525 | | | — | | | 2,760,525 | | | — |
Asset backed securities | | | 497,447 | | | — | | | 497,447 | | | — |
Mutual funds | | | 31,711,277 | | | 31,711,277 | | | — | | | — |
Other financial instruments** | | | — | | | — | | | — | | | — |
| | | | | | | | | | | | |
Total | | $ | 813,341,800 | | $ | 483,638,176 | | $ | 329,383,227 | | $ | 320,397 |
| | | | | | | | | | | | |
The following table is a reconciliation of Level 3 investments for which significant unobservable inputs were used to determine fair value: |
| Level 3 Reconciliation | | | | | | | | Corporate
Debt |
Balance as of October 31, 2009 (market value) | | | | | | | | | | | $ | 144,236 |
Accrued discounts/premiums | | | | | | | | | | | | 1,059 |
Realized gain/loss | | | | | | | | | | | | 534 |
Change in unrealized appreciation/depreciation *** | | | | | | | | | | | | 19,929 |
Net purchases/sales | | | | | | | | | | | | 154,639 |
| | | | | | | | | | | | |
Balance as of April 30, 2010 (market value) | | | | | | | | | | | $ | 320,397 |
| | | | | | | | | | | | |
| | | | | | | | | | | | |
| | | Pro-Blend ® Maximum Term Series |
| Description | | 4/30/10 | | Level 1 | | Level 2 | | Level 3 |
Equity securities* | | $ | 618,104,960 | | $ | 617,556,035 | | $ | 548,925 | | $ | — |
Preferred securities | | | 202,984 | | | 202,984 | | | — | | | — |
Debt Securities: | | | | | | | | | | | | |
U.S. Treasury and other U.S. Government agencies | | | 53,716,797 | | | — | | | 53,716,797 | | | — |
Mutual funds | | | 10,836,811 | | | 10,836,811 | | | — | | | — |
Other financial instruments** | | | — | | | — | | | — | | | — |
| | | | | | | | | | | | |
Total | | $ | 682,861,552 | | $ | 628,595,830 | | $ | 54,265,722 | | $ | — |
| | | | | | | | | | | | |
122
Notes to Financial Statements (unaudited)
| 2. | SIGNIFICANT ACCOUNTING POLICIES (continued) |
Security Valuation (continued)
There were no Level 3 securities held by Pro-Blend® Maximum Term Series as of October 31, 2009 or April 30, 2010.
*Includes common stock, warrants and rights. Please see the Investment Portfolio for each Series for industry classification and for securities where a latest quoted sales price is not available and the latest quoted bid price was used to value the security. Such securities are included in Level 2 in the table above.
**Other financial instruments are derivative instruments not reflected in the Investment Portfolio, such as futures, forwards and swap contracts, which are valued at the unrealized appreciation/depreciation on the instrument. As of April 30, 2010, Pro-Blend® Maximum Term Series did not hold any derivative instruments.
***The change in unrealized appreciation (depreciation) on securities still held at April 30, 2010 for the Pro-Blend® Conservative Term Series, Pro-Blend® Moderate Term Series and Pro-Blend® Extended Term Series was $7,356, $15,338 and $19,929, respectively, which is included in the related net change in unrealized appreciation/depreciation on the Statements of Operations.
The Fund’s policy is to recognize transfers in and transfers out of the valuation levels as of the end of the reporting period. There were no significant transfers between Level 1 and Level 2 as of April 30, 2010.
Additional disclosure surrounding the activity in Level 3 fair value measurement will also be effective for fiscal years beginning after December 15, 2010. Management has concluded that this will not have a material impact on the Series’ financial statements.
Security Transactions, Investment Income and Expenses
Security transactions are accounted for on trade date. Dividend income is recorded on the ex-dividend date, except that if the ex-dividend date has passed, certain dividends from foreign securities are recorded as soon as the Fund is informed of the ex-dividend date. Non-cash dividends, if any, are recorded at the fair market value of the securities received. Interest income, including amortization of premium and accretion of discounts using the effective interest method, is earned from settlement date and accrued daily.
Expenses are recorded on an accrual basis. Most expenses of the Fund can be attributed to a specific series. Expenses which cannot be directly attributed are apportioned among the series in the Fund in such a manner as deemed equitable by the Fund’s Board, taking into consideration, among other things, the nature and type of expense.
Income, expenses (other than class specific expenses), and realized and unrealized gains and losses are prorated among the classes based on the relative net assets of each class. Class specific expenses are directly charged to that Class.
The Series use the identified cost method for determining realized gain or loss on investments for both financial statement and federal income tax reporting purposes.
Foreign Currency Translation
The books and records of the Series are maintained in U.S. dollars. Foreign currencies, investments and other assets and liabilities are translated into U.S. dollars at the current exchange rates. Purchases and sales of investment securities and income and expenses are translated on the respective dates of such transactions. The Series do not isolate realized and unrealized gains and losses attributable to changes in the exchange rates from gains and losses that arise from changes in the market value of investments. Such fluctuations are included with net realized and unrealized gain or loss on investments. Net realized foreign currency gains and losses represent foreign currency gains and losses between trade date and settlement date on securities transactions, gains and losses on disposition of foreign currencies and the difference between the amount of income and foreign withholding taxes recorded on the books of the Series and the amounts actually received or paid.
123
Notes to Financial Statements (unaudited)
| 2. | SIGNIFICANT ACCOUNTING POLICIES (continued) |
Forward Foreign Currency Exchange Contracts
The Series may purchase or sell forward foreign currency exchange contracts in order to hedge a portfolio position or specific transaction. Risks may arise if the counterparties to a contract are unable to meet the terms of the contract or if the value of the foreign currency moves unfavorably.
All forward foreign currency exchange contracts are adjusted daily by the exchange rate of the underlying currency and, for financial statement purposes, any gain or loss is recorded as unrealized gain or loss until a contract has been closed. Realized and unrealized gain or loss arising from a transaction is included in net realized and unrealized gain (loss) on investments.
Each Series may regularly trade forward foreign currency exchange contracts with off-balance sheet risk in the normal course of its investing activities to assist in managing exposure to changes in foreign currency exchange rates.
The notional or contractual amount of these instruments represents the investment the Series have in forward foreign currency exchange contracts and does not necessarily represent the amounts potentially at risk. The measurement of the risks associated with forward foreign currency exchange contracts is meaningful only when all related and offsetting transactions are considered. Investments in forward foreign currency exchange contacts held by each Series, if any, on April 30, 2010 are shown at the end of each Investment Portfolio, which is indicative of volume of derivative activity during the period.
Securities Purchased on a When-Issued Basis or Forward Commitment
Each Series may purchase securities on a when-issued basis or forward commitment. These transactions involve a commitment by the Series to purchase securities for a predetermined price with payment and delivery taking place beyond the customary settlement period. When such purchases are outstanding, the Series will designate liquid assets in an amount sufficient to meet the purchase price. When purchasing a security on a delayed delivery basis, the Series assumes the rights and risks of ownership of the security, including the risk of price and yield fluctuations, and takes such fluctuations into account when determining its net asset value. The Series may sell the when-issued securities before they are delivered, which may result in a capital gain or loss.
In connection with its ability to purchase or sell securities on a forward commitment basis, the Series may enter into forward roll transactions principally using To Be Announced (TBA) securities. Forward roll transactions require the sale of securities for delivery in the current month, and a simultaneous agreement to repurchase substantially similar (same type, coupon and maturity) securities on a specified future date. Risks of entering into forward roll transactions include the potential inability of the counterparty to meet the terms of the agreement; the potential of the Series to receive inferior securities at redelivery as compared to the securities sold to the counterparty; counterparty credit risk; and the potential pay down speed variance between the mortgage-backed pools. During the roll period, the Series forgoes principal and interest paid on the securities. The Series account for such dollar rolls as purchases and sales. Information regarding securities purchased on a when-issued basis is included in each applicable Series’ Investment Portfolio. None of the Series had TBA dollar rolls outstanding as of April 30, 2010.
Restricted Securities
Restricted securities are purchased in private placement transactions, are not registered under the Securities Act of 1933, as amended, and may have contractual restrictions on resale. Information regarding restricted securities is included at the end of each applicable Series’ Investment Portfolio.
124
Notes to Financial Statements (unaudited)
| 2. | SIGNIFICANT ACCOUNTING POLICIES (continued) |
Federal Taxes
Each Series’ policy is to comply with the provisions of the Internal Revenue Code applicable to regulated investment companies. The Series are not subject to federal income tax or excise tax to the extent that each Series distributes to shareholders each year its taxable income, including any net realized gains on investments, in accordance with requirements of the Internal Revenue Code. Accordingly, no provision for federal income tax or excise tax has been made in the financial statements.
Management evaluates its tax positions to determine if the tax positions taken meet the minimum recognition threshold in connection with accounting for uncertainties in income tax positions taken or expected to be taken for the purposes of measuring and recognizing tax liabilities in the financial statements. Recognition of tax benefits of an uncertain tax position is required only when the position is “more likely than not” to be sustained assuming examination by taxing authorities. At April 30, 2010, the Series has recorded no liability for net unrecognized tax benefits relating to uncertain income tax positions taken or expected to be taken in future tax returns.
The Series files income tax returns in the U.S. federal jurisdiction, various states and foreign jurisdictions, as required. No income tax returns are currently under investigation. The statute of limitations on the Series’ tax returns remains open for the years ended October 31, 2006 through October 31, 2009. The Fund is not aware of any tax positions for which it is reasonably possible that the total amounts of unrecognized tax benefits will significantly change in the next twelve months.
Additionally, based on the Fund’s understanding of the tax rules and rates related to income, gains and transactions for foreign jurisdictions in which it invests, the Series will provide for foreign taxes, and where appropriate, deferred foreign tax.
Distributions of Income and Gains
Distributions to shareholders of net investment income are made semi-annually. Distributions of net realized gains are made annually. An additional distribution may be necessary to avoid taxation of a Series. Distributions are recorded on the ex-dividend date.
Indemnifications
The Fund’s organizational documents provide former and current directors and officers with a limited indemnification against liabilities arising in connection with the performance of their duties to the Fund. In the normal course of business, the Fund may also enter into contracts that provide general indemnifications. The Fund’s maximum exposure under these arrangements is unknown as this would be dependent on future claims that may be made against the Fund. The risk of material loss from such claims is considered remote.
Other
The preparation of financial statements in conformity with accounting principles generally accepted in the United States of America requires management to make estimates and assumptions that affect the reported amounts of assets and liabilities and the disclosure of contingent assets and liabilities at the date of the financial statements and the reported amounts of income and expenses during the reporting period. Actual results could differ from those estimates.
| 3. | TRANSACTIONS WITH AFFILIATES |
The Fund has an Investment Advisory Agreement (the “Agreement”) with the Advisor, for which each Series pays a fee, computed daily and payable monthly, at an annual rate of 0.60% for Pro-Blend® Conservative Term Series and 0.75% for Pro-Blend® Moderate Term Series, Pro-Blend® Extended Term Series and Pro-Blend® Maximum Term Series, of the Series’ average daily net assets.
125
Notes to Financial Statements (unaudited)
| 3. | TRANSACTIONS WITH AFFILIATES (continued) |
Under the Agreement, personnel of the Advisor provide the Series with advice and assistance in the choice of investments and the execution of securities transactions, and otherwise maintain the Series’ organization. The Advisor also provides the Fund with necessary office space and fund administration and support services. The salaries of all officers of the Fund (except a percentage of the Fund’s Chief Compliance Officer’s salary, which is paid by the Fund), and of all Directors who are “affiliated persons” of the Fund, or of the Advisor, and all personnel of the Fund, or of the Advisor, performing services relating to research, statistical and investment activities, are paid by the Advisor. Each “non-affiliated” Director receives an annual stipend, which is allocated among all the active series of the Fund. In addition, these Directors also receive a fee per Board meeting attended for each active series of the Fund plus a fee for each committee meeting attended.
Class S shares of each Series are subject to a shareholder services fee in accordance with a shareholder services plan adopted by the Fund’s Board. The shareholder services fee is intended to compensate financial intermediaries, including affiliates of the Fund, in connection with the provision of direct client service, personal services, maintenance of shareholder accounts and reporting services. For these services, Class S of each Series pays a fee, computed daily and payable monthly, at an annual rate of 0.20% for Pro-Blend® Conservative Term Series Class S and 0.25% for Pro-Blend® Moderate Term Series Class S, Pro-Blend® Extended Term Series Class S and Pro-Blend® Maximum Term Series Class S, of the Class’ average daily net assets. The Fund has a Shareholder Services Agreement with the Advisor, for which the Advisor receives the shareholder services fee as stated above.
The Advisor has contractually agreed, until at least February 28, 2011, to waive its fee and, if necessary, pay other operating expenses of the Series in order to maintain total direct annual fund operating expenses for the Series at no more than the following amounts, exclusive of shareholder services fees, of average daily net assets each year:
| | |
| Series/Class | | Expense Limit |
Pro-Blend® Conservative Term Series Class S | | 0.80% |
Pro-Blend® Conservative Term Series Class I | | 0.70% |
Pro-Blend® Conservative Term Series Class C | | 0.80% |
Pro-Blend® Moderate Term Series Class S | | 0.95% |
Pro-Blend® Moderate Term Series Class I | | 0.85% |
Pro-Blend® Moderate Term Series Class C | | 0.95% |
Pro-Blend® Extended Term Series Class S | | 0.95% |
Pro-Blend® Extended Term Series Class I | | 0.85% |
Pro-Blend® Extended Term Series Class C | | 0.95% |
Pro-Blend® Maximum Term Series Class S | | 0.95% |
Pro-Blend® Maximum Term Series Class I | | 0.85% |
Pro-Blend® Maximum Term Series Class C | | 0.95% |
In addition, the Advisor has voluntarily agreed to waive fees and reimburse expenses during the current fiscal year in order to keep total direct annual fund operating expenses from exceeding 0.90% for Pro-Blend® Conservative Term Series Class S, 1.70% for Pro-Blend® Conservative Term Series Class C, 1.10% for Pro-Blend® Moderate Term Series Class S, Pro-Blend® Extended Term Series Class S and Pro-Blend® Maximum Term Series Class S and 1.85% for Pro-Blend® Moderate Term Series Class C, Pro-Blend® Extended Term Series Class C and Pro-Blend® Maximum Term Series Class C, of the Class’ average daily net assets. The Advisor may change or eliminate all or part of its voluntary waiver at any time. For the six months ended April 30, 2010, the Advisor waived the following amounts which are included as a reduction of expenses on the Statements of Operations:
126
Notes to Financial Statements (unaudited)
| 3. | TRANSACTIONS WITH AFFILIATES (continued) |
| | |
| Series/Class | | Waiver Amount |
Pro-Blend® Conservative Term Series Class S | | $616 |
Pro-Blend® Conservative Term Series Class I | | 137 |
Pro-Blend® Conservative Term Series Class C | | 19 |
Pro-Blend® Moderate Term Series Class S | | 520 |
Pro-Blend® Moderate Term Series Class I | | 228 |
Pro-Blend® Moderate Term Series Class C | | 10 |
Pro-Blend® Extended Term Series Class S | | 593 |
Pro-Blend® Extended Term Series Class I | | 156 |
Pro-Blend® Extended Term Series Class C | | 9 |
Pro-Blend® Maximum Term Series Class S | | 610 |
Pro-Blend® Maximum Term Series Class I | | 146 |
Pro-Blend® Maximum Term Series Class C | | 57 |
The Advisor is not eligible to recoup any expenses that have been waived or reimbursed in prior years.
Manning & Napier Investor Services, Inc., a registered broker-dealer affiliate of the Advisor, acts as distributor for the Fund’s shares. Each Series compensates the distributor for distributing and servicing the Series’ Class C shares pursuant to a distribution plan adopted under Rule 12b-1 of the 1940 Act, regardless of expenses actually incurred. Under the agreement, each Series pays distribution and services fees to the distributor at an annual rate of 1.00% of average daily net assets attributable to Class C shares. There are no distribution and services fees on the Class S or Class I shares of each Series. The fees are accrued daily and paid monthly.
For fund accounting and transfer agent services through November 7, 2009, the Fund paid the Advisor an annual fee of 0.055% of the Fund’s average daily net assets up to $4.5 billion, 0.03% of the Fund’s average daily net assets between $4.5 billion and $7.5 billion, and 0.02% of the Fund’s average daily net assets over $7.5 billion. Additionally, certain transaction and account-based fees and out-of-pocket expenses, including charges for reporting relating to the Fund’s compliance program, were charged. Expenses not directly attributable to a Series are allocated based on each Series’ relative net assets or number of accounts, depending on the expense. Prior to October 12, 2009 (sub-accountant) and November 9, 2009 (for sub-transfer agent), the Advisor had an agreement with Citi Fund Services Ohio, Inc. (“Citi”) under which Citi served as the sub-accountant and sub-transfer agent.
The Advisor has entered into agreements dated October 12, 2009 and November 9, 2009 with PNC Global Investment Servicing (U.S.) Inc. (“PNCGIS”) under which PNCGIS serves as sub-accountant services agent and sub-transfer agent, respectively. Effective November 7, 2009 under the amended master services agreement, the Fund pays the Advisor an annual fee of 0.0175% on the first $3 billion of average daily net assets (excluding Target Series); 0.015% on the next $3 billion of average daily net assets (excluding Target Series); and 0.01% of the average daily net assets in excess of $6 billion (excluding Target Series); plus a base fee of $25,500 per Series. Additionally, certain transaction-, account-, and cusip-based fees and out-of-pocket expenses, including charges for reporting relating to the Fund’s compliance program, are charged.
On February 2, 2010, The PNC Financial Services Group, Inc. (“PNC”), which serves as the Series’ sub-accountant services agent and sub-transfer agent, entered into a Stock Purchase Agreement (the “Stock Purchase Agreement”) with The Bank of New York Mellon Corporation (“BNY Mellon”), the Series’ custodian. Upon the terms and subject to the conditions set forth in the Stock Purchase Agreement, which has been approved by the board of directors of each company, PNC will sell to BNY Mellon (the “Stock Sale”) 100% of the issued and outstanding shares of PNC Global Investment Servicing Inc., an indirect, wholly-owned subsidiary of PNC. The Stock Sale is expected to close in the third quarter of 2010. Management has concluded that this will not have a material impact on the Series’ financial statements.
127
Notes to Financial Statements (unaudited)
| 4. | PURCHASES AND SALES OF SECURITIES |
For the six months ended April 30, 2010, purchases and sales of securities, other than short-term securities, were as follows:
| | | | | | | | | | | | |
| | | Purchases | | Sales |
| Series | | Other Issuers | | Government | | Other Issuers | | Government |
Pro-Blend® Conservative Term Series | | $ | 128,911,227 | | $ | 61,455,871 | | $ | 41,719,076 | | $ | 840,357 |
Pro-Blend® Moderate Term Series | | | 274,339,590 | | | 137,170,586 | | | 93,916,635 | | | 5,663,852 |
Pro-Blend® Extended Term Series | | | 209,692,002 | | | 69,382,520 | | | 143,906,818 | | | 9,207,848 |
Pro-Blend® Maximum Term Series | | | 248,107,897 | | | 31,020,278 | | | 168,021,879 | | | - |
| 5. | CAPITAL STOCK TRANSACTIONS |
Transactions in Class S, Class I and Class C shares:
| | | | | | | | | | | | | | |
Pro-Blend® Conservative Term Series Class S: | | For the Six Months Ended 4/30/10 | | | For the Year Ended 10/31/09 | |
| | | Shares | | | Amount | | | Shares | | | Amount | |
Sold | | 15,661,412 | | | $ | 195,453,789 | | | 21,638,922 | | | $ | 253,078,774 | |
Reinvested | | 287,977 | | | | 3,544,999 | | | 255,888 | | | | 2,852,616 | |
Repurchased | | (4,485,104 | ) | | | (55,943,257 | ) | | (7,514,628 | ) | | | (85,449,982 | ) |
| | | | | | | | | | | | | | |
Total | | 11,464,285 | | | $ | 143,055,531 | | | 14,380,182 | | | $ | 170,481,408 | |
| | | | | | | | | | | | | | |
| | | | | | | |
Pro-Blend® Conservative Term Series Class I: | | For the Six Months Ended 4/30/10 | | | For the Year Ended 10/31/09 | |
| | | Shares | | | Amount | | | Shares | | | Amount | |
Sold | | 1,311,958 | | | $ | 13,426,958 | | | 12,753,291 | | | $ | 123,336,525 | |
Reinvested | | 73,445 | | | | 746,199 | | | 5,873 | | | | 55,829 | |
Repurchased | | (601,349 | ) | | | (6,173,770 | ) | | (3,281,035 | ) | | | (33,032,962 | ) |
| | | | | | | | | | | | | | |
Total | | 784,054 | | | | 7,999,387 | | | 9,478,129 | | | $ | 90,359,392 | |
| | | | | | | | | | | | | | |
| | | | | | | | | | |
Pro-Blend® Conservative Term Series Class C: | | For the Period 1/4/10
(commencement of operations) to 4/30/10 | | | | | | | |
| | | Shares | | | Amount | | | | | | | |
Sold | | 468,864 | | | $ | 4,757,175 | | | | | | | | |
Reinvested | | - | | | | - | | | | | | | | |
Repurchased | | (9,702 | ) | | | (99,627 | ) | | | | | | | |
| | | | | | | | | | | | | | |
Total | | 459,162 | | | $ | 4,657,548 | | | | | | | | |
| | | | | | | | | | | | | | |
128
Notes to Financial Statements (unaudited)
| 5. | CAPITAL STOCK TRANSACTIONS (continued) |
| | | | | | | | | | | | | | |
Pro-Blend® Moderate Term Series Class S: | | For the Six Months Ended 4/30/10 | | | For the Year Ended 10/31/09 | |
| | | Shares | | | Amount | | | Shares | | | Amount | |
Sold | | 16,133,641 | | | $ | 194,728,116 | | | 21,461,762 | | | $ | 231,679,727 | |
Reinvested | | 303,835 | | | | 3,615,638 | | | 441,147 | | | | 4,403,673 | |
Repurchased | | (5,758,893 | ) | | | (69,641,470 | ) | | (8,747,293 | ) | | | (91,994,252 | ) |
| | | | | | | | | | | | | | |
Total | | 10,678,583 | | | $ | 128,702,284 | | | 13,155,616 | | | $ | 144,089,148 | |
| | | | | | | | | | | | | | |
| | | | | | | | | | | | | | |
Pro-Blend® ModerateTerm Series Class I: | | For the Six Months Ended 4/30/10 | | | For the Year Ended 10/31/09 | |
| | | Shares | | | Amount | | | Shares | | | Amount | |
Sold | | 20,567,838 | | | $ | 202,306,636 | | | 5,930,221 | | | $ | 53,443,816 | |
Reinvested | | 33,293 | | | | 324,267 | | | 4,353 | | | | 37,717 | |
Repurchased | | (1,293,642 | ) | | | (12,846,428 | ) | | (1,343,646 | ) | | | (12,777,158 | ) |
| | | | | | | | | | | | | | |
Total | | 19,307,489 | | | $ | 189,784,475 | | | 4,590,928 | | | $ | 40,704,375 | |
| | | | | | | | | | | | | | |
| | | | | | | | | | | | | | |
Pro-Blend® Moderate Term Series Class C: | | For the Period 1/4/10
(commencement of operations) to
4/30/10 | | | | | | | |
| | | Shares | | | Amount | | | | | | | |
Sold | | 1,034,908 | | | $ | 10,508,489 | | | | | | | | |
Reinvested | | - | | | | - | | | | | | | | |
Repurchased | | (1,076 | ) | | | (11,036 | ) | | | | | | | |
| | | | | | | | | | | | | | |
Total | | 1,033,832 | | | $ | 10,497,453 | | | | | | | | |
| | | | | | | | | | | | | | |
| | | | | | | | | | | | | | |
Pro-Blend® Extended Term Series Class S: | | For the Six Months Ended 4/30/10 | | | For the Year Ended 10/31/09 | |
| | | Shares | | | Amount | | | Shares | | | Amount | |
Sold | | 9,082,043 | | | $ | 127,714,687 | | | 13,079,024 | | | $ | 157,628,794 | |
Reinvested | | 311,359 | | | | 4,293,646 | | | 659,575 | | | | 7,271,279 | |
Repurchased | | (4,119,918 | ) | | | (58,035,996 | ) | | (11,496,524 | ) | | | (131,007,040 | ) |
| | | | | | | | | | | | | | |
Total | | 5,273,484 | | | $ | 73,972,337 | | | 2,242,075 | | | $ | 33,893,033 | |
| | | | | | | | | | | | | | |
| | | | | | | | | | | | | | |
Pro-Blend® Extended Term Series Class I: | | For the Six Months Ended 4/30/10 | | | For the Year Ended 10/31/09 | |
| | | Shares | | | Amount | | | Shares | | | Amount | |
Sold | | 7,897,883 | | | $ | 75,179,410 | | | 13,533,251 | | | $ | 113,607,736 | |
Reinvested | | 82,911 | | | | 774,388 | | | 16,605 | | | | 133,670 | |
Repurchased | | (1,778,783 | ) | | | (16,967,747 | ) | | (2,886,283 | ) | | | (25,332,208 | ) |
| | | | | | | | | | | | | | |
Total | | 6,202,011 | | | $ | 58,986,051 | | | 10,663,573 | | | $ | 88,409,198 | |
| | | | | | | | | | | | | | |
129
Notes to Financial Statements (unaudited)
| 5. | CAPITAL STOCK TRANSACTIONS (continued) |
| | | | | | | | | | | | | | |
Pro-Blend® Extended Term Series Class C: | | For the Period 1/4/10
(commencement of operations) to 4/30/10 | | | | | | | |
| | | Shares | | | Amount | | | | | | | |
Sold | | 954,464 | | | $ | 9,705,037 | | | | | | | | |
Reinvested | | - | | | | - | | | | | | | | |
Repurchased | | (1,830 | ) | | | (18,681 | ) | | | | | | | |
| | | | | | | | | | | | | | |
Total | | 952,634 | | | | 9,686,356 | | | | | | | | |
| | | | | | | | | | | | | | |
| | | | | | | | | | | | | | |
Pro-Blend® Maximum Term Series Class S: | | For the Six Months Ended 4/30/10 | | | For the Year Ended 10/31/09 | |
| | | Shares | | | Amount | | | Shares | | | Amount | |
Sold | | 7,041,992 | | | $ | 103,462,471 | | | 12,286,406 | | | $ | 144,482,110 | |
Reinvested | | 51,392 | | | | 731,825 | | | 314,130 | | | | 3,280,777 | |
Repurchased | | (4,737,407 | ) | | | (68,784,017 | ) | | (9,095,502 | ) | | | (101,912,603 | ) |
| | | | | | | | | | | | | | |
Total | | 2,355,977 | | | $ | 35,410,279 | | | 3,505,034 | | | $ | 45,850,284 | |
| | | | | | | | | | | | | | |
| | | | | | | | | | | | | | |
Pro-Blend® Maximum Term Series Class I: | | For the Six Months Ended 4/30/10 | | | For the Year Ended 10/31/09 | |
| | | Shares | | | Amount | | | Shares | | | Amount | |
Sold | | 7,935,257 | | | $ | 75,675,243 | | | 6,367,312 | | | $ | 47,837,218 | |
Reinvested | | 14,883 | | | | 137,670 | | | 14,888 | | | | 108,194 | |
Repurchased | | (862,509 | ) | | | (8,172,807 | ) | | (717,412 | ) | | | (5,036,799 | ) |
| | | | | | | | | | | | | | |
Total | | 7,087,631 | | | $ | 67,640,106 | | | 5,664,788 | | | $ | 42,908,613 | |
| | | | | | | | | | | | | | |
| | | | | | | | | | | | | | |
Pro-Blend® Maximum Term Series Class C: | | For the Period 1/4/10
(commencement of operations) to 4/30/10 | | | | | | | |
| | | Shares | | | Amount | | | | | | | |
Sold | | 232,692 | | | $ | 2,372,578 | | | | | | | | |
Reinvested | | - | | | | - | | | | | | | | |
Repurchased | | (770 | ) | | | (7,998 | ) | | | | | | | |
| | | | | | | | | | | | | | |
Total | | 231,922 | | | $ | 2,364,580 | | | | | | | | |
| | | | | | | | | | | | | | |
At April 30, 2010, the retirement plan of the Advisor and its affiliates owned the following:
| | | | | | | |
| Series | | Shares
Owned | | Percentage
of Series
Shares
Outstanding | | Value |
Pro-Blend® Conservative Term Series | | 82,881 | | 0.2% | | $ | 873,565 |
Pro-Blend® Moderate Term Series | | 218,012 | | 0.3% | | | 2,228,079 |
Pro-Blend® Extended Term Series | | 1,344,745 | | 2.2% | | | 13,353,315 |
Pro-Blend® Maximum Term Series | | 1,394,893 | | 2.9% | | | 13,907,081 |
130
Notes to Financial Statements (unaudited)
| 5. | CAPITAL STOCK TRANSACTIONS (continued) |
In addition, one shareholder owned 16,566,172 shares of Pro-Blend® Moderate Term Series (23.72% of shares outstanding) valued at $169,306,278. Investment activities of this shareholder my have a material effect on the Series.
The Series may trade in instruments including written and purchased options, forward foreign currency exchange contracts and futures contracts and other derivatives in the normal course of investing activities to assist in managing exposure to various market risks. The Series may be subject to various elements of risk and may involve, to a varying degree, elements of risk in excess of the amounts recognized for financial statement purposes. These risks include: the risk that changes in the value of a derivative may not correlate perfectly with the underlying asset, rate or index, counterparty credit risk related to over the counter derivatives counterparties failure to perform under contract terms, liquidity risk related to the lack of a liquid market for these contracts allowing the fund to close out its position(s) and documentation risk relating to disagreement over contract terms. No such investments were held by the Series on April 30, 2010, except forward foreign currency exchange contracts, held by Pro-Blend® Conservative Term Series, Pro-Blend® Moderate Term Series and Pro-Blend® Extended Term Series, as shown at the end of each Investment Portfolio.
Investing in securities of foreign companies and foreign governments involves special risks and considerations not typically associated with investing in securities of domestic companies and the U.S. Government. These risks include revaluation of currencies and future adverse political and economic developments. Moreover, securities of foreign companies and foreign governments and their markets may be less liquid and their prices more volatile than those of comparable domestic companies and the U.S. Government.
| 8. | FEDERAL INCOME TAX INFORMATION |
The amount and characterization of certain income and capital gains to be distributed are determined in accordance with federal income tax regulations, which may differ from accounting principles generally accepted in the United States of America. Each Series may periodically make reclassifications among its capital accounts to reflect income and gains available for distribution (or available capital loss carryovers) under income tax regulations, without impacting the Series’ net asset value. Any such reclassifications are not reflected in the financial highlights.
The final determination of the tax character of current year distributions will be made at the conclusion of the fiscal year. The tax character of distributions paid for the year ended October 31, 2009 were as follows:
| | | | | | | | | | | | |
| | | Pro-Blend ®
Conservative
Term Series | | Pro-Blend ®
Moderate
Term Series | | Pro-Blend ®
Extended
Term Series | | Pro-Blend ®
Maximum
Term Series |
Ordinary income | | $ | 3,190,937 | | $ | 4,556,112 | | $ | 7,669,280 | | $ | 3,486,615 |
131
Notes to Financial Statements (unaudited)
| 8. | FEDERAL INCOME TAX INFORMATION (continued) |
At October 31, 2009, each Series had a capital loss carryover, disclosed below, available to the extent allowed by tax law to offset future net capital gain, if any, which will expire as follows:
| | | | | | | | |
| | | Pro-Blend ® Conservative Term Series | | Pro-Blend ® Moderate Term Series |
| | | Loss Carryover | | Expiration Date | | Loss Carryover | | Expiration Date |
| | $1,398,033 | | October 31, 2016 | | $ 6,948,431 | | October 31, 2016 |
| | | | | | $11,787,195 | | October 31, 2017 |
| | | | | | | | |
| | | Pro-Blend ® Extended Term Series | | Pro-Blend ® Maximum Term Series |
| | | Loss Carryover | | Expiration Date | | Loss Carryover | | Expiration Date |
| | $ 6,778,639 | | October 31, 2016 | | $44,378,890 | | October 31, 2016 |
| | $43,012,144 | | October 31, 2017 | | $44,219,711 | | October 31, 2017 |
|
At April 30, 2010, the identified cost of investments for federal income tax purposes, the resulting gross unrealized appreciation and depreciation, and the net unrealized appreciation were as follows:
| | | | | | | | | | | | | | | | |
| | | Pro-Blend ®
Conservative
Term Series | | | Pro-Blend ®
Moderate
Term Series | | | Pro-Blend ®
Extended
Term Series | | | Pro-Blend ®
Maximum
Term Series | |
Cost for federal income tax purposes | | $ | 567,259,308 | | | $ | 768,619,117 | | | $ | 753,941,827 | | | $ | 620,982,433 | |
Unrealized appreciation | | $ | 30,687,800 | | | $ | 53,577,565 | | | $ | 81,327,903 | | | $ | 83,394,849 | |
Unrealized depreciation | | | (3,692,105 | ) | | | (11,851,248 | ) | | | (21,927,930 | ) | | | (21,515,730 | ) |
| | | | | | | | | | | | | | | | |
Net unrealized appreciation | | $ | 26,995,695 | | | $ | 41,726,317 | | | $ | 59,399,973 | | | $ | 61,879,119 | |
There were no subsequent events that require recognition or disclosure. In preparing these financial statements, management of the Fund has evaluated events and transactions for potential recognition or disclosure through the date the financial statements were issued.
132
Renewal of Investment Advisory Agreement (unaudited)
At the Manning & Napier Fund, Inc. (the “Fund”) Board of Directors’ (the “Board”) meeting, held on December 7, 2009, the Investment Advisory Agreement (the “Agreement”) between the Fund and Manning & Napier Advisors, Inc. (the “Advisor”) was reviewed by the Board for renewal. In connection with the decision whether to renew the Agreement, a variety of material was prepared for and reviewed by the Board.
Representatives of the Advisor attended the meeting and presented additional oral and written information to the Board to assist the Board in its considerations. The discussion immediately below outlines the materials and information presented to the Board in connection with the Board’s 2009 Annual Review of the Agreement and the conclusions made by the Directors when determining to continue the Agreement.
| | • | | The Board considered the services provided by the Advisor under the Agreement including, among others: deciding what securities to purchase and sell for each Series; arranging for the purchase and sale of such securities by placing orders with broker-dealers; administering the affairs of the Fund (including the books and records of the Fund not maintained by third party service providers such as the custodian or sub-transfer agent); arranging for the insurance coverage for the Fund; and supervising the preparation of tax returns, SEC filings (including registration statements) and reports to shareholders for the Fund. The Board also considered the nature and quality of such services provided under the Agreement in light of the Advisor’s services provided to the Fund for 23 years. The Board discussed the quality of these services with representatives from the Advisor and concluded that the Advisor was performing its services to the Fund required under the Agreement in a reasonable manner. |
| | • | | The Board considered the investment performance of the various Series of the Fund. The investment performance for each Series was reviewed on a cumulative basis since inception and on a one year basis. In addition, annualized performance for the following time periods was considered: inception, three year, five year, ten year, and current market cycle. A market cycle includes periods of both rising and falling markets. Returns for established benchmark indices for each Series were provided for each time period. The Board noted that the various Series were competitive against their respective benchmarks and/or peer groups over various time periods, but in particular over the full market cycle periods relevant for the Series. In addition, the Board considered at the meeting (and considers on a quarterly basis) a peer group performance analysis consisting of Morningstar universes of mutual funds with similar investment objectives. The Board discussed the performance with representatives from the Advisor and concluded that the investment performance of each of the Fund’s Series was reasonable based on the Fund’s actual performance and comparative performance, especially performance over the current market cycle. |
| | • | | The Board considered the costs of the Advisor’s services and the profits of the Advisor as they relate to the Advisor’s services to the Fund under the Agreement. In reviewing the Advisor’s costs and profits, the Board discussed the Advisor’s revenues generated from the Fund (on both an actual and adjusted basis) and its expenses associated with providing the services under the Agreement. In addition, the Board reviewed the Advisor’s expenses associated with Fund activities outside of the Agreement (such as expense reimbursements pursuant to expense caps and payments made by the Advisor to third party platforms on which shares of the Fund are available for purchase). It was noted by representatives of the Advisor that 13 of the 26 active Series of the Fund are currently experiencing expenses above the capped expense ratios. After discussing the above costs and profits, the Board concluded that the Advisor’s profitability relating to its services provided under the Agreement was reasonable. |
| | • | | The Board considered the fees and expenses of the various Series of the Fund. The Advisor presented the advisory fees and total expenses for each Series, including the advisory fee adjusted for any expense waivers or reimbursements (either contractual or voluntary) paid by the Advisor. The advisory fees and expense ratios of each Series were compared to an average (on both a mean and median basis) of similar funds as disclosed on the Morningstar database. Representatives of the Advisor discussed with the Board the levels of its advisory |
133
Renewal of Investment Advisory Agreement (unaudited)
| | fee for each Series of the Fund and as compared to the median and mean advisory fees for similar funds as listed on Morningstar. Expense ratios for every Series, except the Global Fixed Income Series and the Target Series Class R and Class C, are currently below the median and mean for similar funds as listed on Morningstar. Based on their review of the information provided, the Board concluded that the fees and expenses of each Series of the Fund were reasonable on a comparative basis. |
| | • | | The Board also considered the other benefits the Advisor derives from its relationship with the Fund. Such other benefits include certain research products provided by soft dollars. Given the level of soft dollar transactions involving the Fund, the Board concluded that these additional benefits to the Advisor were reasonable. |
| | • | | In addition to the factors described above, the Board considered the Advisor’s personnel, investment strategies, policies and procedures relating to compliance with personal securities transactions, and reputation, expertise and resources in domestic and foreign financial markets. The Board concluded that these factors support the conclusion that the Advisor performs its services in a reasonable manner. |
| | • | | The Board did not consider economies of scale at this time because of the multiple uses of the Fund (for the Advisor’s discretionary investment account clients in addition to direct investors), the current profitability of the Advisor’s services to the Fund under the Agreement, and the overall size of the Fund complex. |
Based on the Board’s deliberations and their evaluation of the information described above, the Board, including a majority of Directors that are not “interested persons” as defined in the Investment Company Act of 1940, concluded that the compensation under the Agreement was fair and reasonable in light of the services and expenses and such other matters as the Directors considered to be relevant in the exercise of their reasonable judgment. Accordingly, the Board approved the renewal of the Agreement. In the course of their deliberations, the Directors did not identify any particular information that was all important or controlling.
134
Literature Requests (unaudited)
Proxy Voting Policies and Procedures
A description of the policies and procedures that the Fund uses to determine how to vote proxies relating to portfolio securities is available, without charge, upon request:
| | |
By phone | | 1-800-466-3863 |
On the Securities and Exchange | | |
Commission’s (SEC) web site | | http://www.sec.gov |
Proxy Voting Record
Information regarding how the Fund voted proxies relating to portfolio securities during the most recent 12-month period ended June 30th is available, without charge, upon request:
| | |
By phone | | 1-800-466-3863 |
On the SEC’s web site | | http://www.sec.gov |
Quarterly Portfolio Holdings
The Series’ complete schedule of portfolio holdings for the 1st and 3rd quarters of each fiscal year are provided on Form N-Q, and are available, without charge, upon request:
| | |
By phone | | 1-800-466-3863 |
On the SEC’s web site | | http://www.sec.gov |
The Series’ Form N-Q may be reviewed and copied at the SEC’s Public Reference Room in Washington, D.C. Information on the operation of the Public Reference Room may be obtained by calling 1-800-SEC-0330.
Prospectus and Statement of Additional Information (SAI)
The prospectus and SAI provide additional information about each Series, including charges, expenses and risks. These documents are available, without charge, upon request:
| | |
By phone | | 1-800-466-3863 |
On the SEC’s web site | | http://www.sec.gov |
On the Advisor’s web site | | http://www.manningnapieradvisors.com |
Additional information available at www.manningnapieradvisors.com
1. Fund Holdings - Month-End
2. Fund Holdings - Quarter-End
3. Shareholder Report - Annual
4. Shareholder Report - Semi-Annual
MNPRO-04/10-SAR
ITEM 2: CODE OF ETHICS
Not applicable for Semi-Annual Reports.
ITEM 3: AUDIT COMMITTEE FINANCIAL EXPERT
Not applicable for Semi-Annual Reports.
ITEM 4: PRINCIPAL ACCOUNTANT FEES AND SERVICES
Not applicable for Semi-Annual Reports.
ITEM 5: AUDIT COMMITTEE OF LISTED REGISTRANTS
Not applicable.
ITEM 6: INVESTMENTS
(a) | See Investment Portfolios under Item 1 on this Form N-CSR. |
| | |
ITEM 7: | | DISCLOSURE OF PROXY VOTING POLICIES AND PROCEDURES FOR CLOSED-END MANAGEMENT INVESTMENT COMPANIES |
Not applicable.
|
ITEM 8: PORTFOLIO MANAGERS OF CLOSED-END MANAGEMENT INVESTMENT COMPANIES |
Not applicable.
| | |
ITEM 9: | | PURCHASES OF EQUITY SECURITIES BY CLOSED-END MANAGEMENT INVESTMENT COMPANY AND AFFILIATED PURCHASERS |
Not applicable.
ITEM 10: SUBMISSION OF MATTERS TO A VOTE OF SECURITY HOLDERS
There have been no material changes to the procedure by which shareholders may recommend nominees to the registrant’s board of directors.
ITEM 11: CONTROLS AND PROCEDURES
(a) Based on their evaluation of the Funds’ disclosure controls and procedures, as of a date within 90 days of the filing date, the Funds’ Principal Executive Officer and Principal Financial Officer have concluded that the Funds’ disclosure controls and procedures are: (i) reasonably designed to ensure that information required to be disclosed in this report is appropriately communicated to the Funds’ officers to allow timely decisions regarding disclosures required in this report; (ii) reasonably designed to ensure that information required to be disclosed in this report is recorded, processed, summarized and reported in a timely manner; and (iii) are effective in achieving the goals described in (i) and (ii) above.
(b) During the second fiscal quarter of the period covered by this report, there have been no changes in the Funds’ internal control over financial reporting that the above officers believe to have materially affected, or to be reasonably likely to materially affect, the Funds’ internal control over financial reporting.
ITEM 12: EXHIBITS
(a)(1) | Not applicable for Semi-Annual Reports. |
(a)(2) | Separate certifications for the Registrant’s principal executive officer and principal financial officer, as required by Section 302 of the Sarbanes-Oxley Act of 2002 and Rule 30a-2(a) under the Investment Company Act of 1940, are attached as EX-99.CERT. |
(b) | A certification of the Registrant’s principal executive officer and principal financial officer, as required by 18 U.S.C Section 1350, as adopted pursuant to Section 906 of the Sarbanes-Oxley Act of 2002, and Rule 30a-2(b) under the Investment Company Act of 1940, is attached as EX- 99.906CERT. The certification furnished pursuant to this paragraph is not deemed to be “filed” for purposes of Section 18 of the Securities Exchange Act of 1934, or otherwise subject to the liability of that section. Such certification is not deemed to be incorporated by reference into any filing under the Securities Act of 1933 or the Securities Exchange Act of 1934, except to the extent that the Registrant specifically incorporates them by reference. |
SIGNATURES
Pursuant to the requirements of the Securities Exchange Act of 1934 and the Investment Company Act of 1940, the registrant has duly caused this report to be signed on its behalf by the undersigned, thereunto duly authorized.
|
Manning & Napier Fund, Inc. |
|
/s/ B. Reuben Auspitz |
B. Reuben Auspitz |
President & Principal Executive Officer of Manning & Napier Fund, Inc.
June 29, 2010
Pursuant to the requirements of the Securities Exchange Act of 1934 and the Investment Company Act of 1940, this report has been signed below by the following persons on behalf of the registrant and in the capacities and on the dates indicated.
|
/s/ B. Reuben Auspitz |
B. Reuben Auspitz |
President & Principal Executive Officer of Manning & Napier Fund, Inc.
June 29, 2010
|
/s/ Christine Glavin |
Christine Glavin |
Chief Financial Officer & Principal Financial Officer of Manning & Napier Fund, Inc.
June 29, 2010