UNITED STATES
SECURITIES AND EXCHANGE COMMISSION
Washington, D.C. 20549
FORM N-CSR
CERTIFIED SHAREHOLDER REPORT OF REGISTERED
MANAGEMENT INVESTMENT COMPANIES
Investment Company Act file number 811-04087
Manning & Napier Fund, Inc.
(Exact name of registrant as specified in charter)
290 Woodcliff Drive, Fairport, NY 14450
(Address of principal executive offices)(Zip Code)
B. Reuben Auspitz 290 Woodcliff Drive, Fairport, NY 14450
(Name and address of agent for service)
Registrant’s telephone number, including area code: 585-325-6880
Date of fiscal year end: December 31, 2011
Date of reporting period: January 1, 2011 through June 30, 2011
Form N-CSR is to be used by management investment companies to file reports with the Commission not later than 10 days after the transmission to stockholders of any report that is required to be transmitted to stockholders under Rule 30e-1 under the Investment Company Act of 1940 (17 CFR 270.30e-1). The Commission may use the information provided on Form N-CSR in its regulatory, disclosure review, inspection, and policymaking roles.
A registrant is required to disclose the information specified by Form N-CSR, and the Commission will make this information public. A registrant is not required to respond to the collection of information contained in Form N-CSR unless the Form displays a currently valid Office of Management and Budget (“OMB”) control number. Please direct comments concerning the accuracy of the information collection burden estimate and any suggestions for reducing the burden to Secretary, Securities and Exchange Commission, 100 F Street, NE, Washington, DC 20549. The OMB has reviewed this collection of information under the clearance requirements of 44 U.S.C. § 3507.
| ITEM 1: | REPORTS TO STOCKHOLDERS. |


LIFE SCIENCES SERIES
Shareholder Expense Example (unaudited)
As a shareholder of the Series, you may incur two types of costs: (1) transaction costs and (2) ongoing costs, including management fees and other Series expenses. This example is intended to help you understand your ongoing costs (in dollars) of investing in the Series and to compare these costs with the ongoing costs of investing in other mutual funds.
The example is based on an investment of $1,000 invested at the beginning of the period and held for the entire period
(January 1, 2011 to June 30, 2011).
Actual Expenses
The first line of the table below provides information about actual account values and actual expenses. You may use the information in this line, together with the amount you invested, to estimate the expenses that you paid over the period. Simply divide your account value by $1,000 (for example, an $8,600 account value divided by $1,000 = 8.6), then multiply the result by the number in the first line under the heading entitled “Expenses Paid During Period” to estimate the expenses you paid on your account during this period.
Hypothetical Example for Comparison Purposes
The second line of the table below provides information about hypothetical account values and hypothetical expenses based on the Series’ actual expense ratio and an assumed rate of return of 5% per year before expenses, which is not the Series’ actual return. The hypothetical account values and expenses may not be used to estimate the actual ending account balance or expenses you paid during the period.You may use this information to compare the ongoing costs of investing in the Series and other funds. To do so, compare this 5% hypothetical example with the 5% hypothetical examples that appear in the shareholder reports of the other funds.
Please note that the expenses shown in the table are meant to highlight your ongoing costs only and do not reflect any transaction costs. Therefore, the second line of the table is useful in comparing ongoing costs only, and will not help you determine the relative total costs of owning different funds. In addition, if these transaction costs were included, your costs would have been higher.
| | | | | | | | | | | | | | | |
| | | Beginning
Account Value
1/1/11 | | Ending
Account Value
6/30/11 | | Expenses Paid
During Period*
1/1/11-6/30/11 |
| | | |
Actual | | | $ | 1,000.00 | | | | $ | 1,080.50 | | | | $ | 5.57 | |
Hypothetical
(5% return before expenses) | | | $ | 1,000.00 | | | | $ | 1,019.44 | | | | $ | 5.41 | |
| | | |
| * | Expenses are equal to the Series’ annualized expense ratio (for the six-month period) of 1.08%, multiplied by the average account value over the period, multiplied by 181/365 (to reflect the one-half year period). Expenses are based on the most recent fiscal half year. |
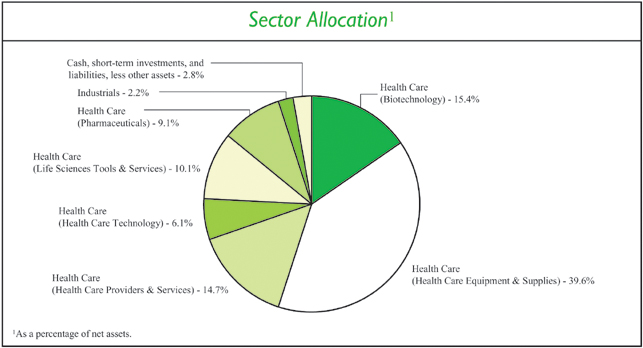
Portfolio Composition as of June 30, 2011 (unaudited)
Top Ten Stock Holdings2
| | | | | |
BioMerieux (France) | | | | 5.8 | % |
Insulet Corp. | | | | 4.6 | % |
Cerner Corp. | | | | 4.1 | % |
Brookdale Senior Living, Inc. | | | | 3.9 | % |
DexCom, Inc. | | | | 3.9 | % |
2 As a percentage of total investments. | | | | | |
| | | | | |
| UCB S.A. (Belgium) | | | | 3.4 | % |
| Alere, Inc. | | | | 3.3 | % |
| Gen-Probe, Inc. | | | | 3.0 | % |
| Sonic Healthcare Ltd. (Australia) | | | | 2.8 | % |
| Quidel Corp. | | | | 2.7 | % |
| | | | | |
Investment Portfolio - June 30, 2011 (unaudited)
| | | | | | | | | | |
| | | Shares | | Value
(Note 2) |
| | |
| | |
COMMON STOCKS - 97.2% | | | | | | | | | | |
| | |
Health Care - 95.0% | | | | | | | | | | |
Biotechnology - 15.4% | | | | | | | | | | |
Cangene Corp. (Canada)* | | | | 475,000 | | | | $ | 763,388 | |
Dendreon Corp.* | | | | 146,000 | | | | | 5,758,240 | |
Exact Sciences Corp.* | | | | 717,752 | | | | | 6,172,667 | |
Intercell AG (Austria)*1 | | | | 780,000 | | | | | 3,216,398 | |
InterMune, Inc.* | | | | 159,000 | | | | | 5,700,150 | |
Momenta Pharmaceuticals, Inc.* | | | | 312,230 | | | | | 6,075,996 | |
Myriad Genetics, Inc.* | | | | 292,250 | | | | | 6,636,998 | |
Swedish Orphan Biovitrum AB (Sweden)*1 | | | | 740,501 | | | | | 2,930,804 | |
United Therapeutics Corp.* | | | | 151,000 | | | | | 8,320,100 | |
| | | | | | | | | | |
| | | | | | | | | 45,574,741 | |
| | | | | | | | | | |
Health Care Equipment & Supplies - 39.6% | | | | | | | | | | |
Abaxis, Inc.* | | | | 232,500 | | | | | 6,335,625 | |
Alere, Inc.* | | | | 273,000 | | | | | 9,997,260 | |
Alere, Inc.*2,3 | | | | 122,000 | | | | | 4,467,640 | |
BioMerieux (France)1 | | | | 152,777 | | | | | 17,723,676 | |
Cochlear Ltd. (Australia)1 | | | | 71,230 | | | | | 5,513,015 | |
DexCom, Inc.* | | | | 815,000 | | | | | 11,809,350 | |
Endologix, Inc.* | | | | 638,600 | | | | | 5,938,980 | |
Gen-Probe, Inc.* | | | | 135,040 | | | | | 9,338,016 | |
HeartWare International, Inc.* | | | | 61,200 | | | | | 4,533,696 | |
Insulet Corp.* | | | | 633,970 | | | | | 14,055,115 | |
Quidel Corp.* | | | | 550,000 | | | | | 8,332,500 | |
Sirona Dental Systems, Inc.* | | | | 128,100 | | | | | 6,802,110 | |
Straumann Holding AG (Switzerland)1 | | | | 32,717 | | | | | 7,889,897 | |
Thoratec Corp.* | | | | 148,000 | | | | | 4,857,360 | |
| | | | | | | | | | |
| | | | | | | | | 117,594,240 | |
| | | | | | | | | | |
Health Care Providers & Services - 14.7% | | | | | | | | | | |
Assisted Living Concepts, Inc. - Class A | | | | 212,070 | | | | | 3,558,535 | |
Bio-Reference Laboratories, Inc.* | | | | 280,000 | | | | | 5,852,000 | |
Brookdale Senior Living, Inc.* | | | | 494,000 | | | | | 11,979,500 | |
Capital Senior Living Corp.* | | | | 470,000 | | | | | 4,366,300 | |
China Cord Blood Corp. (Hong Kong)* | | | | 894,000 | | | | | 2,905,500 | |
Sonic Healthcare Ltd. (Australia)1 | | | | 614,000 | | | | | 8,496,816 | |
Sunrise Senior Living, Inc.* | | | | 671,000 | | | | | 6,394,630 | |
| | | | | | | | | | |
| | | | | | | | | 43,553,281 | |
| | | | | | | | | | |
Health Care Technology - 6.1% | | | | | | | | | | |
Allscripts Healthcare Solutions, Inc.* | | | | 277,000 | | | | | 5,379,340 | |
Cerner Corp.* | | | | 208,000 | | | | | 12,710,880 | |
| | | | | | | | | | |
| | | | | | | | | 18,090,220 | |
| | | | | | | | | | |
| | | | | | |
| | The accompanying notes are an integral part of the financial statements. | | | 3 | |
Investment Portfolio - June 30, 2011 (unaudited)
| | | | | | | | | | |
| | | Shares | | Value
(Note 2) |
| | |
COMMON STOCKS (continued) | | | | | | | | | | |
| | |
Health Care (continued) | | | | | | | | | | |
Life Sciences Tools & Services - 10.1% | | | | | | | | | | |
Luminex Corp.* | | | | 146,938 | | | | $ | 3,071,004 | |
Oxford Nanopore Technologies Ltd. (United Kingdom)*4,5 | | | | 40,905 | | | | | 5,999,820 | |
QIAGEN N.V. (Netherlands)* | | | | 273,000 | | | | | 5,192,460 | |
Sequenom, Inc.* | | | | 1,085,000 | | | | | 8,191,750 | |
WuXi PharmaTech (Cayman), Inc. - ADR (China)* | | | | 423,880 | | | | | 7,443,333 | |
| | | | | | | | | 29,898,367 | |
Pharmaceuticals - 9.1% | | | | | | | | | | |
Green Cross Corp. (South Korea)1 | | | | 43,000 | | | | | 6,519,901 | |
Kalbe Farma Tbk PT (Indonesia)1 | | | | 88,000 | | | | | 34,724 | |
Optimer Pharmaceuticals, Inc.* | | | | 546,000 | | | | | 6,491,940 | |
Strides Arcolab Ltd. (India)1 | | | | 497,450 | | | | | 3,757,913 | |
UCB S.A. (Belgium)1 | | | | 228,939 | | | | | 10,287,437 | |
| | | | | | | | | 27,091,915 | |
| | |
Total Health Care | | | | | | | | | 281,802,764 | |
| | |
Industrials - 2.2% | | | | | | | | | | |
Research & Consulting Services - 2.2% | | | | | | | | | | |
Qualicorp S.A. (Brazil)* | | | | 665,000 | | | | | 6,340,435 | |
| | |
TOTAL COMMON STOCKS | | | | | | | | | | |
(Identified Cost $246,282,505) | | | | | | | | | 288,143,199 | |
| | |
SHORT-TERM INVESTMENTS - 6.1% | | | | | | | | | | |
Dreyfus Cash Management, Inc. - Institutional Shares6, 0.10%,
(Identified Cost $18,304,401) | | | | 18,304,401 | | | | | 18,304,401 | |
| | |
TOTAL INVESTMENTS - 103.3% | | | | | | | | | | |
(Identified Cost $264,586,906) | | | | | | | | | 306,447,600 | |
LIABILITIES, LESS OTHER ASSETS - (3.3%) | | | | | | | | | (9,921,919) | |
NET ASSETS - 100% | | | | | | | | $ | 296,525,681 | |
| ADR— | American Depository Receipt |
| * | Non-income producing security |
| 1 | Values were adjusted following the close of local trading using a factor from a third party vendor. |
| 2 | Restricted security - Investment in security that is restricted as to public resale under the Securities Act of 1933, as amended. This security amounts to $4,467,640, or 1.5% of the Series’ net assets as of June 30, 2011 (see Note 2 to the financial statements). |
| 3 | This security was acquired on February 3, 2006 at a cost of $2,978,020 ($24.41 per share) and has been determined to be liquid under guidelines established by the Board of Directors (see Note 2 to the financial statements). |
| 4 | Security has been valued at fair value (see Note 2 to the financial statements). |
| 5 | This security was acquired on April 26, 2011 at a cost of $6,149,543 ($150.34 per share) and has been determined to be illiquid under guidelines established by the Board of Directors (see Note 2 to the financial statements). |
| 6 | Rate shown is the current yield as of June 30, 2011. |
| | | | |
| 4 | | The accompanying notes are an integral part of the financial statements. | | |
Statement of Assets and Liabilities (unaudited)
June 30, 2011
| | | | | |
| |
ASSETS: | | | | | |
Investments, at value (identified cost $264,586,906) (Note 2) | | | $ | 306,447,600 | |
Foreign currency, at value (cost $38,822) | | | | 39,106 | |
Cash | | | | 124,778 | |
Receivable for fund shares sold | | | | 211,871 | |
Foreign tax reclaims receivable | | | | 192,149 | |
Dividends receivable | | | | 1,708 | |
| | | | | |
| |
TOTAL ASSETS | | | | 307,017,212 | |
| | | | | |
| |
LIABILITIES: | | | | | |
| |
Accrued management fees (Note 3) | | | | 240,738 | |
Accrued fund accounting and administration fees (Note 3) | | | | 13,156 | |
Accrued transfer agent fees (Note 3) | | | | 4,051 | |
Accrued Chief Compliance Officer service fees (Note 3) | | | | 466 | |
Payable for securities purchased | | | | 9,919,082 | |
Payable for fund shares repurchased | | | | 279,799 | |
Other payables and accrued expenses | | | | 34,239 | |
| | | | | |
| |
TOTAL LIABILITIES | | | | 10,491,531 | |
| | | | | |
| |
TOTAL NET ASSETS | | | $ | 296,525,681 | |
| | | | | |
| |
NET ASSETS CONSIST OF: | | | | | |
| |
Capital stock | | | $ | 225,320 | |
Additional paid-in-capital | | | | 246,877,321 | |
Undistributed net investment loss | | | | (562,136 | ) |
Accumulated net realized gain on investments, foreign currency and translation of other assets and liabilities | | | | 8,095,282 | |
Net unrealized appreciation on investments, foreign currency and translation of other assets and liabilities | | | | 41,889,894 | |
| | | | | |
| |
TOTAL NET ASSETS | | | $ | 296,525,681 | |
| | | | | |
| |
NET ASSET VALUE, OFFERING PRICE AND REDEMPTION PRICE PER SHARE -
CLASS A ($296,525,681/22,531,961 shares) | | | $ | 13.16 | |
| | | | | |
| | | | | | |
| | The accompanying notes are an integral part of the financial statements. | | | 5 | |
Statement of Operations (unaudited)
For the Six Months Ended June 30, 2011
| | | | | |
| |
INVESTMENT INCOME: | | | | | |
| |
Dividends (net of foreign taxes withheld, $109,245) | | | $ | 989,594 | |
| | | | | |
| |
EXPENSES: | | | | | |
Management fees (Note 3) | | | | 1,413,029 | |
Fund accounting and administration fees (Note 3) | | | | 32,301 | |
Transfer agent fees (Note 3) | | | | 9,429 | |
Directors’ fees (Note 3) | | | | 3,367 | |
Chief Compliance Officer service fees (Note 3) | | | | 1,314 | |
Custodian fees | | | | 24,865 | |
Miscellaneous | | | | 46,483 | |
| | | | | |
| |
Total Expenses | | | | 1,530,788 | |
| | | | | |
| |
NET INVESTMENT LOSS | | | | (541,194) | |
| | | | | |
| |
REALIZED AND UNREALIZED GAIN (LOSS) ON INVESTMENTS AND FOREIGN
CURRENCY: | | | | | |
| |
Net realized gain (loss) on- | | | | | |
Investments | | | | 29,239,451 | |
Foreign currency and translation of other assets and liabilities | | | | (231,420) | |
| | | | | |
| | | | 29,008,031 | |
| | | | | |
Net change in unrealized appreciation (depreciation) on- | | | | | |
Investments | | | | (6,838,350 | ) |
Foreign currency and translation of other assets and liabilities | | | | 12,888 | |
| | | | (6,825,462) | |
| | | | | |
NET REALIZED AND UNREALIZED GAIN ON INVESTMENTS AND FOREIGN CURRENCY | | | | 22,182,569 | |
| | | | | |
| |
NET INCREASE IN NET ASSETS RESULTING FROM OPERATIONS | | | $ | 21,641,375 | |
| | | | | |
| | | | |
| 6 | | The accompanying notes are an integral part of the financial statements. | | |
Statements of Changes in Net Assets
| | | | | | | | | | |
| | | For the Six
Months Ended
6/30/11
(unaudited) | | For the
Year Ended
12/31/10 |
INCREASE (DECREASE) IN NET ASSETS: | | | | | | | | | | |
OPERATIONS: | | | | | | | | | | |
Net investment loss | | | $ | (541,194 | ) | | | $ | (1,088,986 | ) |
Net realized gain on investments and foreign currency | | | | 29,008,031 | | | | | 18,233,679 | |
Net change in unrealized appreciation (depreciation) on investments and foreign currency | | | | (6,825,462 | ) | | | | 17,294,176 | |
| | | | | | | | | | |
| | |
Net increase from operations | | | | 21,641,375 | | | | | 34,438,869 | |
| | | | | | | | | | |
| | |
CAPITAL STOCK ISSUED AND REPURCHASED: | | | | | | | | | | |
| | |
Net increase (decrease) from capital share transactions (Note 5) | | | | 27,320,396 | | | | | (59,818,922 | ) |
| | | | | | | | | | |
| | |
Net increase (decrease) in net assets | | | | 48,961,771 | | | | | (25,380,053 | ) |
| | |
NET ASSETS: | | | | | | | | | | |
| | |
Beginning of period | | | | 247,563,910 | | | | | 272,943,963 | |
| | | | | | | | | | |
| | |
End of period (including undistributed net investment loss of
$562,136 and $20,942, respectively) | | | $ | 296,525,681 | | | | $ | 247,563,910 | |
| | | | | | | | | | |
The accompanying notes are an integral part of the financial statements.
Financial Highlights
| | | | | | | | | | | | | | | | | | | | | | | | | | | | | | |
| | | For the Six
Months Ended
6/30/11
(unaudited) | | For the Years Ended |
| | | | 12/31/10 | | 12/31/09 | | 12/31/08 | | 12/31/07 | | 12/31/06 |
Per share data (for a share outstanding throughout each period): | | | | | | | | | | | | | | | | | | | | | | | | | | | | | | |
Net asset value - Beginning of period | | | $ | 12.18 | | | | $ | 10.61 | | | | $ | 6.99 | | | | $ | 11.54 | | | | $ | 11.41 | | | | $ | 12.10 | |
| | | | | | | | | | | | | | | | | | | | | | | | | | | | | | |
Income (loss) from investment operations: | | | | | | | | | | | | | | | | | | | | | | | | | | | | | | |
Net investment loss | | | | (0.02 | )1 | | | | (0.04 | )1 | | | | (0.05 | )1 | | | | (0.06 | ) | | | | (0.08 | ) | | | | (0.05 | ) |
Net realized and unrealized gain (loss) on investments | | | | 1.00 | | | | | 1.61 | | | | | 3.67 | | | | | (4.38 | ) | | | | 1.25 | | | | | 1.56 | |
| | | | | | | | | | | | | | | | | | | | | | | | | | | | | | |
Total from investment operations | | | | 0.98 | | | | | 1.57 | | | | | 3.62 | | | | | (4.44 | ) | | | | 1.17 | | | | | 1.51 | |
| | | | | | | | | | | | | | | | | | | | | | | | | | | | | | |
Less distributions to shareholders: | | | | | | | | | | | | | | | | | | | | | | | | | | | | | | |
From net realized gain on investments | | | | — | | | | | — | | | | | — | | | | | (0.11 | ) | | | | (1.04 | ) | | | | (2.20 | ) |
| | | | | | | | | | | | | | | | | | | | | | | | | | | | | | |
Net asset value - End of period | | | $ | 13.16 | | | | $ | 12.18 | | | | $ | 10.61 | | | | $ | 6.99 | | | | $ | 11.54 | | | | $ | 11.41 | |
| | | | | | | | | | | | | | | | | | | | | | | | | | | | | | |
Net assets - End of period
(000’s omitted) | | | $ | 296,526 | | | | $ | 247,564 | | | | $ | 272,944 | | | | $ | 182,704 | | | | $ | 299,669 | | | | $ | 233,072 | |
| | | | | | | | | | | | | | | | | | | | | | | | | | | | | | |
Total return2 | | | | 8.05 | % | | | | 14.80 | % | | | | 51.79 | % | | | | (38.77 | %) | | | | 10.62 | % | | | | 12.52 | % |
Ratios (to average net assets)/
Supplemental Data: | | | | | | | | | | | | | | | | | | | | | | | | | | | | | | |
Expenses* | | | | 1.08 | %3 | | | | 1.09 | % | | | | 1.11 | % | | | | 1.12 | % | | | | 1.12 | % | | | | 1.14 | % |
Net investment loss | | | | (0.38 | %)3 | | | | (0.41 | %) | | | | (0.55 | %) | | | | (0.65 | %) | | | | (0.75 | %) | | | | (0.51 | %) |
Portfolio turnover | | | | 42 | % | | | | 67 | % | | | | 95 | % | | | | 94 | % | | | | 95 | % | | | | 93 | % |
|
* The investment advisor did not impose all or a portion of its management fees, CCO fees, fund accounting and transfer agent fees, and other fees in some periods and in some periods paid a portion of the Series’ expenses. If these expenses had been incurred by the Series, the expense ratio (to average net assets) would have been increased by the following amount: | |
| | | | | | |
| | | | N/A | | | | | 0.00 | %4 | | | | 0.01 | % | | | | N/A | | | | | N/A | | | | | N/A | |
| 1 | Calculated based on average shares outstanding during the periods. |
| 2 | Represents aggregate total return for the periods indicated, and assumes reinvestment of all distributions. Total return would have been lower had certain expenses not been waived or reimbursed during certain periods. Periods less than one year are not annualized. |
The accompanying notes are an integral part of the financial statements.
Notes to Financial Statements (unaudited)
Life Sciences Series (the “Series”) is a no-load diversified series of Manning & Napier Fund, Inc. (the “Fund”). The Fund is organized in Maryland and is registered under the Investment Company Act of 1940 (the “1940 Act”), as amended, as an open-end management investment company.
The Series’ investment objective is to provide long-term growth by investing principally in the common stocks of companies in the life sciences industry.
The Fund’s Advisor is Manning & Napier Advisors, Inc. (the “Advisor”). On November 5, 1999, the Series resumed sales of shares to advisory clients and employees of the Advisor and its affiliates. On May 1, 2001, the Series began offering shares directly to investors. Previously, the Series was available from time to time to advisory clients and employees of the Advisor. The total authorized capital stock of the Fund consists of 10.0 billion shares of common stock each having a par value of $0.01. As of June 30, 2011, 6.4 billion shares have been designated in total among 31 series, of which 100 million have been designated as Life Sciences Series Class A common stock.
| 2. | SIGNIFICANT ACCOUNTING POLICIES |
Security Valuation
Portfolio securities, including domestic equities, foreign equities, warrants and options, listed on an exchange other than the NASDAQ National Market System are valued at the latest quoted sales price of the exchange on which the security is primarily traded. Securities not traded on valuation date or securities not listed on an exchange are valued at the latest quoted bid price provided by the Fund’s pricing service. Securities listed on the NASDAQ National Market System are valued in accordance with the NASDAQ Official Closing Price.
Short-term investments that mature in sixty days or less are valued at amortized cost, which approximates market value. Investments in open-end investment companies are valued at their net asset value per share on valuation date.
Volume and level of activity in established markets for an asset or liability are evaluated to determine whether recent transactions and quoted prices are determinative of fair value. Where there have been significant decreases in volume and level of activity, further analysis and adjustment may be necessary to estimate fair value. The Series measures fair value in these instances by the use of inputs and valuation techniques which may be based upon current market prices of securities that are comparable in coupon, rating, maturity and industry and/or expectation of future cash flows. As a result of trading in relatively thin markets and/or markets that experience significant volatility, the prices used by the Series to value these securities may differ from the value that would be realized if these securities were sold, and the differences could be material.
Securities for which representative valuations or prices are not available from the Fund’s pricing service may be valued at fair value. Due to the inherent uncertainty of valuations of such securities, the fair value may differ significantly from the values that would have been used had a ready market for such securities existed. If trading or events occurring after the close of the principal market in which securities are traded are expected to materially affect the value of those securities, then they may be valued at their fair value, taking this trading or these events into account. Fair value is determined in good faith by the Advisor under procedures approved by and under the general supervision and responsibility of the Fund’s Board of Directors (the “Board”). In accordance with the procedures approved by the Board, certain securities trading outside the U.S. whose values were adjusted following the close of local trading use a factor from a third party vendor to the extent available. The value of securities used for net asset value calculation under these procedures may differ from published prices for the same securities. It is the Fund’s policy to classify each foreign equity security where a factor from a third party vendor is provided as a Level 2 security.
Various inputs are used in determining the value of the Series’ assets or liabilities carried at market value. These inputs are summarized in three broad levels. Level 1 includes quoted prices in active markets for identical assets
Notes to Financial Statements (unaudited)
| 2. | SIGNIFICANT ACCOUNTING POLICIES (continued) |
Security Valuation (continued)
and liabilities. Level 2 includes other significant observable inputs (including quoted prices for similar securities, interest rates, prepayment speeds, credit risk, etc.). Level 3 includes significant unobservable inputs (including the Series’ own assumptions in determining the fair value of investments). The inputs or methodology used for valuing securities are not necessarily an indication of the risk associated with investing in those securities.
The following is a summary of the valuation levels used for major security types as of June 30, 2011 in valuing the Series’ assets or liabilities carried at market value:
| | | | | | | | | | | | | | | | | | | | |
Description | | Total | | Level 1 | | Level 2 | | Level 3 |
Assets: | | | | | | | | | | | | | | | | | | | | |
Equity securities*: | | | | | | | | | | | | | | | | | | | | |
Health Care | | | $ | 281,802,764 | | | | $ | 209,432,363 | | | | $ | 66,370,581 | | | | $ | 5,999,820 | |
Industrials | | | | 6,340,435 | | | | | 6,340,435 | | | | | — | | | | | — | |
Preferred securities | | | | — | | | | | — | | | | | — | | | | | — | |
Debt securities | | | | — | | | | | — | | | | | — | | | | | — | |
Mutual funds | | | | 18,304,401 | | | | | 18,304,401 | | | | | — | | | | | — | |
Other financial instruments** | | | | — | | | | | — | | | | | — | | | | | — | |
| | | | | | | | | | | | | | | | | | | | |
Total assets | | | | 306,447,600 | | | | | 234,077,199 | | | | | 66,370,581 | | | | | 5,999,820 | |
| | | | | | | | | | | | | | | | | | | | |
Liabilities: | | | | | | | | | | | | | | | | | | | | |
Other financial instruments** | | | | — | | | | | — | | | | | — | | | | | — | |
| | | | | | | | | | | | | | | | | | | | |
Total liabilities | | | | — | | | | | — | | | | | — | | | | | — | |
| | | | | | | | | | | | | | | | | | | | |
Total | | | $ | 306,447,600 | | | | $ | 234,077,199 | | | | $ | 66,370,581 | | | | $ | 5,999,820 | |
| | | | | | | | | | | | | | | | | | | | |
The following table is a reconciliation of Level 3 investments for which significant unobservable inputs were used to determine fair value:
| | | | | | | | | | |
Level 3 Reconciliation | | Equity
Securities | | Preferred
Securities |
Balance as of December 31, 2010 (market value) | | | $ | — | | | | $ | — | |
Net realized gain (loss) | | | | (95,898 | ) | | | | (2,312,500 | ) |
Change in unrealized appreciation (depreciation)*** | | | | (53,825 | ) | | | | 2,312,500 | |
Purchases | | | | 6,149,543 | | | | | — | |
Sales | | | | — | | | | | — | |
Transfers in | | | | — | | | | | — | |
Transfers out | | | | — | | | | | — | |
| | | | | | | | | | |
Balance as of June 30, 2011 (market value) | | | $ | 5,999,820 | | | | $ | — | |
| | | | | | | | | | |
| * | Includes common stock, warrants and rights. Please see the Investment Portfolio for foreign securities where values were adjusted following the close of local trading using a factor from a third party vendor. Such securities are included in Level 2 in the table above. |
| ** | Other financial instruments are derivative instruments not reflected in the Investment Portfolio, such as futures, forwards and swap contracts, which are valued at the unrealized appreciation/depreciation on the instrument. As of June 30, 2011, the Series did not hold any derivative instruments. |
| *** | The change in unrealized appreciation (depreciation) on securities still held at June 30, 2011 was ($149,723). |
Notes to Financial Statements (unaudited)
| 2. | SIGNIFICANT ACCOUNTING POLICIES (continued) |
Security Valuation (continued)
The Fund’s policy is to recognize transfers in and transfers out of the valuation levels as of the beginning of the reporting period. There were no significant transfers between Level 1 and Level 2 during the six months ended June 30, 2011.
Recent Accounting Standard
In May 2011, the Financial Accounting Standards Board issued amended guidance to improve disclosure about fair value measurements which will require the following disclosures for fair value measurements categorized as Level 3: quantitative information about the unobservable inputs and assumptions used in the fair value measurement, a description of the valuation policies and procedures and a narrative description of the sensitivity of the fair value measurement to changes in unobservable inputs and the interrelationships between those unobservable inputs. In addition, the amounts and reasons for all transfers in and out of Level 1 and Level 2 will be required to be disclosed. The amended guidance is effective for financial statements for fiscal years beginning after December 15, 2011, and interim periods within those fiscal years. Management is evaluating the impact of this guidance on the Series’ financial statements and disclosures.
Security Transactions, Investment Income and Expenses
Security transactions are accounted for on trade date. Dividend income is recorded on the ex-dividend date, except that if the ex-dividend date has passed, certain dividends from foreign securities are recorded as soon as the Fund is informed of the ex-dividend date. Non-cash dividends, if any, are recorded at the fair market value of the securities received. Interest income, including amortization of premium and accretion of discounts using the effective interest method, is earned from settlement date and accrued daily.
Expenses are recorded on an accrual basis. Most expenses of the Fund can be attributed to a specific series. Expenses which cannot be directly attributed are apportioned among the series in the Fund in such a manner as deemed equitable by the Fund’s Board, taking into consideration, among other things, the nature and type of expense.
The Series uses the identified cost method for determining realized gain or loss on investments for both financial statement and federal income tax reporting purposes.
Foreign Currency Translation
The books and records of the Series are maintained in U.S. dollars. Foreign currencies, investments and other assets and liabilities are translated into U.S. dollars at the current exchange rates. Purchases and sales of investment securities and income and expenses are translated on the respective dates of such transactions. The Series does not isolate realized and unrealized gains and losses attributable to changes in the exchange rates from gains and losses that arise from changes in the market value of investments. Such fluctuations are included with net realized and unrealized gain or loss on investments. Net realized foreign currency gains and losses represent foreign currency gains and losses between trade date and settlement date on securities transactions, gains and losses on disposition of foreign currencies and the difference between the amount of income and foreign withholding taxes recorded on the books of the Series and the amounts actually received or paid.
Restricted securities
Restricted securities are purchased in private placement transactions, are not registered under the Securities Act of 1933, as amended, and may have contractual restrictions on resale. Information regarding restricted securities is included at the end of the Series’ Investment Portfolio.
Notes to Financial Statements (unaudited)
| 2. | SIGNIFICANT ACCOUNTING POLICIES (continued) |
Illiquid Securities
A security may be considered illiquid if so deemed in good faith by the Advisor under procedures approved by and under the general supervision and responsibility of the Fund’s Board. Securities that are illiquid are marked with the applicable footnote on the Investment Portfolio.
Affiliated Companies
The 1940 Act defines “affiliated companies” to include securities in which a series owns 5% or more of the outstanding voting securities of the issuer. The following transactions were effected for the period ended June 30, 2011:
| | | | | | | | | | | | | | | | | | | | | | | | | | | | | | | | | | | |
Name of Issuer | | Value at
12/31/10 | | Purchase
Cost | | Sales
Proceeds | | Value
at
6/30/11 | | Shares Held at
6/30/11 | | Dividend
Income
12/31/10
through
6/30/11 | | Net Realized
Gain (Loss)
12/31/10
through
6/30/11 |
Avalon | | | | | | | | | | | | | | | | | | | | | | | | | | | | | | | | | | | |
HealthCare | | | | | | | | | | | | | | | | | | | | | | | | | | | | | | | | | | | |
Holdings, Inc. - | | | | | | | | | | | | | | | | | | | | | | | | | | | | | | | | | | | |
Series D | | | $ | — | | | | $ | — | | | | $ | — | | | | $ | — | | | | | — | | | | $ | — | | | | $ | (2,312,500 | ) |
Avalon | | | | | | | | | | | | | | | | | | | | | | | | | | | | | | | | | | | |
HealthCare | | | | | | | | | | | | | | | | | | | | | | | | | | | | | | | | | | | |
Holdings, Inc. | | | | — | | | | | — | | | | | — | | | | | — | | | | | — | | | | | — | | | | | (76,718 | ) |
Avalon | | | | | | | | | | | | | | | | | | | | | | | | | | | | | | | | | | | |
HealthCare | | | | | | | | | | | | | | | | | | | | | | | | | | | | | | | | | | | |
Holdings, Inc. - | | | | | | | | | | | | | | | | | | | | | | | | | | | | | | | | | | | |
Warrants
2/27/2014 | | | | — | | | | | — | | | | | — | | | | | — | | | | | — | | | | | — | | | | | (19,180 | ) |
| | | | | | | | | | | | | | | | | | | | | | | | | | | | | | | | | | | |
| | | $ | — | | | | $ | — | | | | $ | — | | | | $ | — | | | | | — | | | | $ | — | | | | $ | (2,408,398 | ) |
| | | | | | | | | | | | | | | | | | | | | | | | | | | | | | | | | | | |
Federal Taxes
The Series’ policy is to comply with the provisions of the Internal Revenue Code applicable to regulated investment companies. The Series is not subject to federal income tax or excise tax to the extent that the Series distributes to shareholders each year its taxable income, including any net realized gains on investments, in accordance with requirements of the Internal Revenue Code. Accordingly, no provision for federal income tax or excise tax has been made in the financial statements.
Management evaluates its tax positions to determine if the tax positions taken meet the minimum recognition threshold in connection with accounting for uncertainties in income tax positions taken or expected to be taken for the purposes of measuring and recognizing tax liabilities in the financial statements. Recognition of tax benefits of an uncertain tax position is required only when the position is “more likely than not” to be sustained assuming examination by taxing authorities. At June 30, 2011, the Series has recorded no liability for net unrecognized tax benefits relating to uncertain income tax positions taken or expected to be taken in future tax returns.
The Series files income tax returns in the U.S. federal jurisdiction, various states and foreign jurisdictions, as required. No income tax returns are currently under investigation. The statute of limitations on the Series’ tax returns remains open for the years ended December 31, 2007 through December 31, 2010. The Fund is not aware of any tax positions for which it is reasonably possible that the total amounts of unrecognized tax benefits will significantly change in the next twelve months.
Additionally, based on the Fund’s understanding of the tax rules and rates related to income, gains and transactions for foreign jurisdictions in which it invests, the Series will provide for foreign taxes, and where appropriate, deferred foreign tax.
Distributions of Income and Gains
Distributions to shareholders of net investment income and net realized gains are made annually. An additional distribution may be necessary to avoid taxation of the Series. Distributions are recorded on the ex-dividend date.
Notes to Financial Statements (unaudited)
| 2. | SIGNIFICANT ACCOUNTING POLICIES (continued) |
Indemnifications
The Fund’s organizational documents provide former and current directors and officers with a limited indemnification against liabilities arising in connection with the performance of their duties to the Fund. In the normal course of business, the Fund may also enter into contracts that provide general indemnifications. The Fund’s maximum exposure under these arrangements is unknown as this would be dependent on future claims that may be made against the Fund. The risk of material loss from such claims is considered remote.
Other
The preparation of financial statements in conformity with accounting principles generally accepted in the United States of America requires management to make estimates and assumptions that affect the reported amounts of assets and liabilities and the disclosure of contingent assets and liabilities at the date of the financial statements and the reported amounts of income and expenses during the reporting period. Actual results could differ from those estimates.
| 3. | TRANSACTIONS WITH AFFILIATES |
The Fund has an Investment Advisory Agreement (the “Agreement”) with the Advisor, for which the Series pays a fee, computed daily and payable monthly, at an annual rate of 1.00% of the Series’ average daily net assets.
Under the Agreement, personnel of the Advisor provide the Series with advice and assistance in the choice of investments and the execution of securities transactions, and otherwise maintain the Series’ organization. The Advisor also provides the Fund with necessary office space and fund administration and support services. The salaries of all officers of the Fund (except a percentage of the Fund’s Chief Compliance Officer’s salary, which is paid by the Fund), and of all Directors who are “affiliated persons” of the Fund, or of the Advisor, and all personnel of the Fund, or of the Advisor, performing services relating to research, statistical and investment activities, are paid by the Advisor. Each “non-affiliated” Director receives an annual stipend, which is allocated among all the active series of the Fund. In addition, these Directors also receive a fee per Board meeting attended plus a fee for each committee meeting attended.
Manning & Napier Investor Services, Inc., a registered broker-dealer affiliate of the Advisor, acts as distributor for the Fund’s shares. The services of Manning & Napier Investor Services, Inc. are provided at no additional cost to the Series.
The Advisor did not waive any fees for the six months ended June 30, 2011. The Advisor is not eligible to recoup any expenses that have been waived or reimbursed in prior years.
The Advisor has agreements with BNY Mellon Investment Servicing (U.S.) Inc. (“BNY”) under which BNY serves as sub-accountant services agent and sub-transfer agent. The Fund pays the Advisor an annual fee related to fund accounting and administration of 0.0175% on the first $3 billion of average daily net assets (excluding Target Series); 0.015% on the next $3 billion of average daily net assets (excluding Target Series); and 0.01% of the average daily net assets in excess of $6 billion (excluding Target Series); plus a base fee of $25,500 per Series. Transfer Agent fees are charged to the Fund on a per account basis. Additionally, certain transaction- and cusip-based fees and out-of-pocket expenses, including charges for reporting relating to the Fund’s compliance program, are charged.
Expenses not directly attributable to a Series are allocated based on each Series’ relative net assets or number of accounts, depending on the expense.
| 4. | PURCHASES AND SALES OF SECURITIES |
For the six months ended June 30, 2011, purchases and sales of securities, other than U.S. Government securities and short-term securities, were $140,699,493 and $113,856,492, respectively. There were no purchases or sales of U.S. Government securities.
Notes to Financial Statements (unaudited)
| 5. | CAPITAL STOCK TRANSACTIONS |
Transactions in shares of Life Sciences Series were:
| | | | | | | | | | | | | | | | | | | | |
| | | For the Six Months
Ended 6/30/11 | | For the Year
Ended 12/31/10 |
| | | Shares | | Amount | | Shares | | Amount |
Sold | | | | 3,188,826 | | | | $ | 40,064,399 | | | | | 2,426,114 | | | | $ | 26,545,889 | |
Reinvested | | | | — | | | | | — | | | | | — | | | | | — | |
Repurchased | | | | (987,037 | ) | | | | (12,744,003 | ) | | | | (7,813,236 | ) | | | | (86,364,811 | ) |
| | | | | | | | | | | | | | | | | | | | |
Total | | | | 2,201,789 | | | | $ | 27,320,396 | | | | | (5,387,122 | ) | | | $ | (59,818,922 | ) |
| | | | | | | | | | | | | | | | | | | | |
Substantially all of the Series’ shares represent investments by fiduciary accounts over which the Advisor has sole investment discretion.
The Series may trade in instruments including written and purchased options, forward foreign currency exchange contracts and futures contracts and other derivatives in the normal course of investing activities to assist in managing exposure to various market risks. The Series may be subject to various elements of risk, which may involve, to a varying degree, elements of risk in excess of the amounts recognized for financial statement purposes. These risks include: the risk that changes in the value of a derivative may not correlate perfectly with the underlying asset, rate or index, counterparty credit risk related to over the counter derivatives’ counterparties failure to perform under contract terms, liquidity risk related to the lack of a liquid market for these contracts allowing the fund to close out its position(s) and documentation risk relating to disagreement over contract terms. No such investments were held by the Series during the six months ended June 30, 2011.
Investing in securities of foreign companies and foreign governments involves special risks and considerations not typically associated with investing in securities of domestic companies and the U.S. Government. These risks include revaluation of currencies and future adverse political and economic developments. Moreover, securities of foreign companies and foreign governments and their markets may be less liquid and their prices more volatile than those of comparable domestic companies and the U.S. Government.
| 8. | LIFE SCIENCES SECURITIES |
The Series may focus its investments in certain related life sciences industries; hence, the Series may subject itself to a greater degree of risk than a series that is more diversified.
| 9. | FEDERAL INCOME TAX INFORMATION |
The amount and characterization of certain income and capital gains to be distributed are determined in accordance with federal income tax regulations, which may differ from accounting principles generally accepted in the United States of America. The Series may periodically make reclassifications among its capital accounts to reflect income and gains available for distribution (or available capital loss carryovers) under income tax regulations, without impacting the Series’ net asset value. Any such reclassifications are not reflected in the financial highlights.
There were no distributions to shareholders for the year ended December 31, 2010 or the six months ended June 30, 2011.
Notes to Financial Statements (unaudited)
| 9. | FEDERAL INCOME TAX INFORMATION (continued) |
At June 30, 2011, the Series had a capital loss carryover of $20,419,145, available to the extent allowed by tax law to offset future net capital gain, if any, which will expire as follows:
| | | | | |
Loss Carryover | | Expiration Date |
$15,858,502 | | | | December 31, 2016 | |
$ 4,560,643 | | | | December 31, 2017 | |
Under the recently enacted Regulated Investment Company Modernization Act of 2010, capital losses incurred by the Funds after December 31, 2010 will not be subject to expiration. In addition, such losses must be used prior to the losses incurred in the years preceding enactment.
At June 30, 2011, the identified cost of investments for federal income tax purposes, the resulting gross unrealized appreciation and depreciation, and the net unrealized appreciation were as follows:
| | | | | |
Cost for federal income tax purposes | | | $ | 264,784,205 | |
Unrealized appreciation | | | $ | 51,259,711 | |
Unrealized depreciation | | | | (9,596,316 | ) |
| | | | | |
Net unrealized appreciation | | | $ | 41,663,395 | |
| | | | | |
This Page Intentionally Left Blank
This Page Intentionally Left Blank
Literature Requests (unaudited)
Proxy Voting Policies and Procedures
A description of the policies and procedures that the Fund uses to determine how to vote proxies relating to portfolio securities is available, without charge, upon request:
| | |
| By phone | | 1-800-466-3863 |
On the Securities and Exchange
Commission’s (SEC) web site | | http://www.sec.gov |
Proxy Voting Record
Information regarding how the Fund voted proxies relating to portfolio securities during the most recent 12-month period ended June 30th is available, without charge, upon request:
| | |
| By phone | | 1-800-466-3863 |
| On the SEC’s web site | | http://www.sec.gov |
Quarterly Portfolio Holdings
The Series’ complete schedule of portfolio holdings for the 1st and 3rd quarters of each fiscal year are provided on Form N-Q, and are available, without charge, upon request:
| | |
| By phone | | 1-800-466-3863 |
| On the SEC’s web site | | http://www.sec.gov |
The Series’ Form N-Q may be reviewed and copied at the SEC’s Public Reference Room in Washington, D.C. Information on the operation of the Public Reference Room may be obtained by calling 1-800-SEC-0330.
Prospectus and Statement of Additional Information (SAI)
The prospectus and SAI provide additional information about each Series, including charges, expenses and risks. These documents are available, without charge, upon request:
| | |
| By phone | | 1-800-466-3863 |
| On the SEC’s web site | | http://www.sec.gov |
| On our web site | | http://www.manning-napier.com |
Additional information available at www.manning-napier.com
1. Fund Holdings -Month-End
2. Fund Holdings - Quarter-End
3. Shareholder Report -Annual
4. Shareholder Report -Semi-Annual
The Fund also offers electronic notification or “e-delivery” when certain documents are available on-line to be downloaded or reviewed. Direct shareholders can elect to receive electronic notification when shareholder reports, prospectus updates, and / or quarterly statements are available. If you do not currently have on-line access to your account, you can establish access by going to www.manning-napier.com, click on “Login” in the top corner of the page, and follow the prompts to self-enroll. Once enrolled, you can set your electronic notification preferences by clicking on the Account Options tab located within the green toolbar and then select E-Delivery Option. Should you have any questions on either how to establish on-line access or how to update your account settings, please do not hesitate to contact Investor Services at 1-800-466-3863.
MNLFS-6/11-SAR


Shareholder Expense Example (unaudited)
As a shareholder of the Series, you may incur two types of costs: (1) transaction costs and (2) ongoing costs, including management fees and other Series expenses. This example is intended to help you understand your ongoing costs (in dollars) of investing in the Series and to compare these costs with the ongoing costs of investing in other mutual funds.
The example is based on an investment of $1,000 invested at the beginning of the period and held for the entire period (January 1, 2011 to June 30, 2011).
Actual Expenses
The first line of the table below provides information about actual account values and actual expenses. You may use the information in this line, together with the amount you invested, to estimate the expenses that you paid over the period. Simply divide your account value by $1,000 (for example, an $8,600 account value divided by $1,000 = 8.6), then multiply the result by the number in the first line under the heading entitled “Expenses Paid During Period” to estimate the expenses you paid on your account during this period.
Hypothetical Example for Comparison Purposes
The second line of the table below provides information about hypothetical account values and hypothetical expenses based on the Series’ actual expense ratio and an assumed rate of return of 5% per year before expenses, which is not the Series’ actual return. The hypothetical account values and expenses may not be used to estimate the actual ending account balance or expenses you paid during the period. You may use this information to compare the ongoing costs of investing in the Series and other funds. To do so, compare this 5% hypothetical example with the 5% hypothetical examples that appear in the shareholder reports of the other funds.
Please note that the expenses shown in the table are meant to highlight your ongoing costs only and do not reflect any transaction costs. Therefore, the second line of the table is useful in comparing ongoing costs only, and will not help you determine the relative total costs of owning different funds. In addition, if these transaction costs were included, your costs would have been higher.
| | | | | | | | | | | | | | | |
| | | Beginning
Account Value
1/1/11 | | Ending
Account Value
6/30/11 | | Expenses Paid
During Period*
1/1/11-6/30/11 |
Actual | | | $ | 1,000.00 | | | | $ | 1,070.00 | | | | $ | 5.59 | |
Hypothetical
(5% return before expenses) | | | $ | 1,000.00 | | | | $ | 1,019.39 | | | | $ | 5.46 | |
| * | Expenses are equal to the Series’ annualized expense ratio (for the six-month period) of 1.09%, multiplied by the average account value over the period, multiplied by 181/365 (to reflect the one-half year period). Expenses are based on the most recent fiscal half year. |
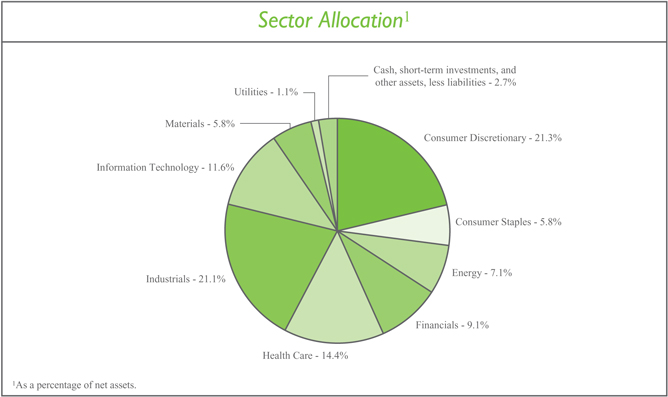
Portfolio Composition as of June 30, 2011 (unaudited)
Market Capitalization
| | | | | |
Average | | | $ | 18,597.24 Million | |
Median | | | | 964.80 Million | |
Weighted Average | | | | 30,215.15 Million | |
Top Ten Stock Holdings2
| | | | | |
Imax Corp. (Canada) | | | | 3.2 | % |
RailAmerica, Inc. | | | | 2.6 | % |
Westport Innovations, Inc. (Canada) | | | | 2.2 | % |
Eagle Materials, Inc. | | | | 2.1 | % |
US Airways Group, Inc. | | | | 2.1 | % |
Wabash National Corp. | | | | 1.9 | % |
Calgon Carbon Corp. | | | | 1.9 | % |
Sequenom, Inc. | | | | 1.9 | % |
Green Cross Corp. (South Korea) | | | | 1.9 | % |
Tomra Systems ASA (Norway) | | | | 1.8 | % |
| 2 | As a percentage of total investments. |
Investment Portfolio - June 30, 2011 (unaudited)
| | | | | | | | | | |
| | | Shares | | Value
(Note 2) |
| | |
COMMON STOCKS - 97.3% | | | | | | | | | | |
| | |
Consumer Discretionary - 21.3% | | | | | | | | | | |
Auto Components - 1.2% | | | | | | | | | | |
Cooper Tire & Rubber Co. | | | | 131,190 | | | | $ | 2,596,250 | |
| | | | | | | | | | |
Distributors - 1.7% | | | | | | | | | | |
Inchcape plc (United Kingdom)1 | | | | 533,031 | | | | | 3,579,379 | |
| | | | | | | | | | |
Diversified Consumer Services - 2.1% | | | | | | | | | | |
Capella Education Co.* | | | | 21,480 | | | | | 898,938 | |
Grand Canyon Education, Inc.* | | | | 113,580 | | | | | 1,610,564 | |
Strayer Education, Inc. | | | | 16,890 | | | | | 2,134,727 | |
| | | | | | | | | | |
| | | | | | | | | 4,644,229 | |
| | | | | | | | | | |
Household Durables - 0.8% | | | | | | | | | | |
Lennar Corp. - Class A | | | | 89,340 | | | | | 1,621,521 | |
| | | | | | | | | | |
Internet & Catalog Retail - 0.8% | | | | | | | | | | |
Ocado Group plc (United Kingdom)*,1 | | | | 611,870 | | | | | 1,790,230 | |
| | | | | | | | | | |
Media - 4.4% | | | | | | | | | | |
Imax Corp. (Canada)* | | | | 211,620 | | | | | 6,862,837 | |
Zon Multimedia Servicos de Telecomunicacoes e Multimedia SGPS S.A. (Portugal)1 | | | | 601,410 | | | | | 2,791,719 | |
| | | | | | | | | | |
| | | | | | | | | 9,654,556 | |
| | | | | | | | | | |
Specialty Retail - 10.3% | | | | | | | | | | |
Chico’s FAS, Inc. | | | | 183,690 | | | | | 2,797,599 | |
Dick’s Sporting Goods, Inc.* | | | | 96,700 | | | | | 3,718,115 | |
The Finish Line, Inc. -Class A | | | | 137,030 | | | | | 2,932,442 | |
Group 1 Automotive, Inc. | | | | 56,040 | | | | | 2,307,727 | |
Lumber Liquidators Holdings, Inc.* | | | | 132,110 | | | | | 3,355,594 | |
Penske Automotive Group, Inc. | | | | 111,000 | | | | | 2,524,140 | |
Select Comfort Corp.* | | | | 138,762 | | | | | 2,494,941 | |
Sonic Automotive, Inc. - Class A | | | | 163,780 | | | | | 2,399,377 | |
| | | | | | | | | | |
| | | | | | | | | 22,529,935 | |
| | | | | | | | | | |
Total Consumer Discretionary | | | | | | | | | 46,416,100 | |
| | | | | | | | | | |
Consumer Staples - 5.8% | | | | | | | | | | |
Beverages - 3.0% | | | | | | | | | | |
Boston Beer Co., Inc. - Class A* | | | | 26,830 | | | | | 2,403,968 | |
C&C Group plc (Ireland)1 | | | | 497,040 | | | | | 2,586,182 | |
Central European Distribution Corp.* | | | | 145,240 | | | | | 1,626,688 | |
| | | | | | | | | | |
| | | | | | | | | 6,616,838 | |
| | | | | | | | | | |
Food & Staples Retailing - 1.1% | | | | | | | | | | |
SUPERVALU, Inc. | | | | 251,100 | | | | | 2,362,851 | |
| | | | | | | | | | |
Food Products - 1.7% | | | | | | | | | | |
Flowers Foods, Inc. | | | | 107,145 | | | | | 2,361,476 | |
| | | | | | |
| | The accompanying notes are an integral part of the financial statements. | | | 3 | |
Investment Portfolio - June 30, 2011 (unaudited)
| | | | | | | | | | |
| | | Shares | | Value
(Note 2) |
| | |
COMMON STOCKS (continued) | | | | | | | | | | |
| | |
Consumer Staples (continued) | | | | | | | | | | |
Food Products (continued) | | | | | | | | | | |
Tootsie Roll Industries, Inc. | | | | 44,254 | | | | $ | 1,294,872 | |
| | | | | | | | | | |
| | | | | | | | | 3,656,348 | |
| | | | | | | | | | |
Total Consumer Staples | | | | | | | | | 12,636,037 | |
| | | | | | | | | | |
Energy - 7.1% | | | | | | | | | | |
Energy Equipment & Services - 6.1% | | | | | | | | | | |
Calfrac Well Services Ltd. (Canada) | | | | 60,840 | | | | | 2,004,134 | |
Global Geophysical Services, Inc.* | | | | 153,680 | | | | | 2,735,504 | |
ION Geophysical Corp.* | | | | 249,310 | | | | | 2,358,473 | |
Key Energy Services, Inc.* | | | | 63,500 | | | | | 1,143,000 | |
Petroleum Geo-Services ASA (Norway)*,1 | | | | 144,580 | | | | | 2,065,437 | |
Trican Well Service Ltd. (Canada) | | | | 131,340 | | | | | 3,085,867 | |
| | | | | | | | | | |
| | | | | | | | | 13,392,415 | |
| | | | | | | | | | |
Oil, Gas & Consumable Fuels - 1.0% | | | | | | | | | | |
Paladin Energy Ltd. (Australia)* | | | | 793,210 | | | | | 2,154,814 | |
| | | | | | | | | | |
Total Energy | | | | | | | | | 15,547,229 | |
| | | | | | | | | | |
Financials - 9.1% | | | | | | | | | | |
Commercial Banks - 2.0% | | | | | | | | | | |
First Commonwealth Financial Corp. | | | | 322,230 | | | | | 1,849,600 | |
First Financial Bancorp | | | | 153,160 | | | | | 2,556,240 | |
| | | | | | | | | | |
| | | | | | | | | 4,405,840 | |
| | | | | | | | | | |
Real Estate Investment Trusts (REITS) - 6.0% | | | | | | | | | | |
American Campus Communities, Inc. | | | | 32,600 | | | | | 1,157,952 | |
BioMed Realty Trust, Inc. | | | | 57,890 | | | | | 1,113,804 | |
Corporate Office Properties Trust | | | | 85,740 | | | | | 2,667,371 | |
DiamondRock Hospitality Co. | | | | 152,090 | | | | | 1,631,926 | |
DuPont Fabros Technology, Inc. | | | | 65,620 | | | | | 1,653,624 | |
Education Realty Trust, Inc. | | | | 140,020 | | | | | 1,199,971 | |
Home Properties, Inc. | | | | 29,280 | | | | | 1,782,566 | |
Sunstone Hotel Investors, Inc.* | | | | 204,170 | | | | | 1,892,656 | |
| | | | | | | | | | |
| | | | | | | | | 13,099,870 | |
| | | | | | | | | | |
Thrifts & Mortgage Finance - 1.1% | | | | | | | | | | |
First Niagara Financial Group, Inc. | | | | 183,630 | | | | | 2,423,916 | |
| | | | | | | | | | |
Total Financials | | | | | | | | | 19,929,626 | |
| | | | | | | | | | |
Health Care - 14.4% | | | | | | | | | | |
Health Care Equipment & Supplies - 5.8% | | | | | | | | | | |
Abaxis, Inc.* | | | | 72,450 | | | | | 1,974,263 | |
Alere, Inc.* | | | | 41,876 | | | | | 1,533,499 | |
DexCom, Inc.* | | | | 79,760 | | | | | 1,155,722 | |
| | | | |
| 4 | | The accompanying notes are an integral part of the financial statements. | | |
Investment Portfolio - June 30, 2011 (unaudited)
| | | | | | | | | | |
| | | Shares | | Value
(Note 2) |
| | |
COMMON STOCKS (continued) | | | | | | | | | | |
| | |
Health Care (continued) | | | | | | | | | | |
Health Care Equipment & Supplies (continued) | | | | | | | | | | |
HeartWare International, Inc.* | | | | 28,550 | | | | $ | 2,114,984 | |
Insulet Corp.* | | | | 105,990 | | | | | 2,349,798 | |
Quidel Corp.* | | | | 152,500 | | | | | 2,310,375 | |
Thoratec Corp.* | | | | 34,100 | | | | | 1,119,162 | |
| | | | | | | | | | |
| | | | | | | | | 12,557,803 | |
| | | | | | | | | | |
Health Care Providers & Services - 3.2% | | | | | | | | | | |
Assisted Living Concepts, Inc. - Class A | | | | 66,900 | | | | | 1,122,582 | |
Brookdale Senior Living, Inc.* | | | | 136,630 | | | | | 3,313,277 | |
Capital Senior Living Corp.* | | | | 156,300 | | | | | 1,452,027 | |
Sunrise Senior Living, Inc.* | | | | 120,740 | | | | | 1,150,652 | |
| | | | | | | | | | |
| | | | | | | | | 7,038,538 | |
| | | | | | | | | | |
Life Sciences Tools & Services - 3.6% | | | | | | | | | | |
Sequenom, Inc.* | | | | 543,940 | | | | | 4,106,747 | |
WuXi PharmaTech (Cayman), Inc. - ADR (China)* | | | | 209,520 | | | | | 3,679,171 | |
| | | | | | | | | | |
| | | | | | | | | 7,785,918 | |
| | | | | | | | | | |
Pharmaceuticals - 1.8% | | | | | | | | | | |
Green Cross Corp. (South Korea)1 | | | | 26,610 | | | | | 4,034,757 | |
| | | | | | | | | | |
Total Health Care | | | | | | | | | 31,417,016 | |
| | | | | | | | | | |
Industrials - 21.1% | | | | | | | | | | |
Air Freight & Logistics - 0.8% | | | | | | | | | | |
Atlas Air Worldwide Holdings, Inc.* | | | | 31,400 | | | | | 1,868,614 | |
| | | | | | | | | | |
Airlines - 3.5% | | | | | | | | | | |
Copa Holdings S.A. - Class A (Panama) | | | | 49,220 | | | | | 3,284,943 | |
US Airways Group, Inc.* | | | | 501,030 | | | | | 4,464,177 | |
| | | | | | | | | | |
| | | | | | | | | 7,749,120 | |
| | | | | | | | | | |
Commercial Services & Supplies - 2.4% | | | | | | | | | | |
Interface, Inc. - Class A | | | | 61,360 | | | | | 1,188,543 | |
Tomra Systems ASA (Norway)1 | | | | 456,510 | | | | | 3,973,298 | |
| | | | | | | | | | |
| | | | | | | | | 5,161,841 | |
| | | | | | | | | | |
Construction & Engineering - 0.7% | | | | | | | | | | |
MYR Group, Inc.* | | | | 66,440 | | | | | 1,554,696 | |
| | | | | | | | | | |
Machinery - 7.7% | | | | | | | | | | |
Astec Industries, Inc.* | | | | 47,370 | | | | | 1,751,743 | |
Graham Corp. | | | | 50,850 | | | | | 1,037,340 | |
Meritor, Inc.* | | | | 106,240 | | | | | 1,704,090 | |
Okano Valve Manufacturing Co. (Japan)1 | | | | 167,900 | | | | | 791,958 | |
Titan International, Inc. | | | | 107,480 | | | | | 2,607,465 | |
Wabash National Corp.* | | | | 447,610 | | | | | 4,194,106 | |
| | | | | | |
| | The accompanying notes are an integral part of the financial statements. | | | 5 | |
Investment Portfolio - June 30, 2011 (unaudited)
| | | | | | | | | | |
| | | Shares | | Value
(Note 2) |
| | |
COMMON STOCKS (continued) | | | | | | | | | | |
| | |
Industrials (continued) | | | | | | | | | | |
Machinery (continued) | | | | | | | | | | |
Westport Innovations, Inc. (Canada)* | | | | 194,610 | | | | $ | 4,674,532 | |
| | | | | | | | | | |
| | | | | | | | | 16,761,234 | |
| | | | | | | | | | |
Marine - 1.5% | | | | | | | | | | |
Baltic Trading Ltd. | | | | 138,290 | | | | | 793,785 | |
D/S Norden (Denmark)1 | | | | 73,680 | | | | | 2,538,410 | |
| | | | | | | | | | |
| | | | | | | | | 3,332,195 | |
| | | | | | | | | | |
Road & Rail - 4.5% | | | | | | | | | | |
Heartland Express, Inc. | | | | 133,310 | | | | | 2,207,614 | |
Knight Transportation, Inc. | | | | 114,840 | | | | | 1,951,132 | |
RailAmerica, Inc.* | | | | 373,540 | | | | | 5,603,100 | |
| | | | | | | | | | |
| | | | | | | | | 9,761,846 | |
| | | | | | | | | | |
Total Industrials | | | | | | | | | 46,189,546 | |
| | | | | | | | | | |
Information Technology - 11.6% | | | | | | | | | | |
Communications Equipment - 2.3% | | | | | | | | | | |
Infinera Corp.* | | | | 507,180 | | | | | 3,504,614 | |
Meru Networks, Inc.* | | | | 132,800 | | | | | 1,594,928 | |
| | | | | | | | | | |
| | | | | | | | | 5,099,542 | |
| | | | | | | | | | |
Computers & Peripherals - 0.7% | | | | | | | | | | |
Immersion Corp.* | | | | 173,210 | | | | | 1,477,481 | |
| | | | | | | | | | |
Internet Software & Services - 2.5% | | | | | | | | | | |
comScore, Inc.* | | | | 42,650 | | | | | 1,104,635 | |
Liquidity Services, Inc.* | | | | 137,450 | | | | | 3,245,195 | |
VistaPrint N.V. (Netherlands)* | | | | 20,630 | | | | | 987,145 | |
| | | | | | | | | | |
| | | | | | | | | 5,336,975 | |
| | | | | | | | | | |
Software - 6.1% | | | | | | | | | | |
CommVault Systems, Inc.* | | | | 31,930 | | | | | 1,419,289 | |
DemandTec, Inc.* | | | | 165,350 | | | | | 1,504,685 | |
Fortinet, Inc.* | | | | 40,210 | | | | | 1,097,331 | |
QLIK Technologies, Inc.* | | | | 65,340 | | | | | 2,225,480 | |
RealPage, Inc.* | | | | 42,870 | | | | | 1,134,769 | |
SolarWinds, Inc.* | | | | 136,400 | | | | | 3,565,496 | |
Taleo Corp. - Class A* | | | | 66,020 | | | | | 2,444,721 | |
| | | | | | | | | | |
| | | | | | | | | 13,391,771 | |
| | | | | | | | | | |
Total Information Technology | | | | | | | | | 25,305,769 | |
| | | | | | | | | | |
Materials - 5.8% | | | | | | | | | | |
Chemicals - 3.7% | | | | | | | | | | |
Calgon Carbon Corp.* | | | | 244,600 | | | | | 4,158,200 | |
Flotek Industries, Inc.* | | | | 253,510 | | | | | 2,159,905 | |
| | | | |
| 6 | | The accompanying notes are an integral part of the financial statements. | | |
Investment Portfolio - June 30, 2011 (unaudited)
| | | | | | | | | | |
| | | Shares | | Value
(Note 2) |
| | |
COMMON STOCKS (continued) | | | | | | | | | | |
| | |
Materials (continued) | | | | | | | | | | |
Chemicals (continued) | | | | | | | | | | |
The Scotts Miracle-Gro Co. - Class A | | | | 35,400 | | | | $ | 1,816,374 | |
| | | | | | | | | | |
| | | | | | | | | 8,134,479 | |
| | | | | | | | | | |
Construction Materials - 2.1% | | | | | | | | | | |
Eagle Materials, Inc. | | | | 160,990 | | | | | 4,486,791 | |
| | | | | | | | | | |
Total Materials | | | | | | | | | 12,621,270 | |
| | | | | | | | | | |
Utilities - 1.1% | | | | | | | | | | |
Independent Power Producers & Energy Traders - 1.1% | | | | | | | | | | |
GenOn Energy, Inc.* | | | | 607,963 | | | | | 2,346,737 | |
| | | | | | | | | | |
TOTAL COMMON STOCKS
(Identified Cost $184,208,735) | | | | | | | | | 212,409,330 | |
| | | | | | | | | | |
| | |
SHORT-TERM INVESTMENTS - 2.1% | | | | | | | | | | |
Dreyfus Cash Management, Inc. - Institutional Shares2, 0.10%
(Identified Cost $4,483,582) | | | | 4,483,582 | | | | | 4,483,582 | |
| | | | | | | | | | |
TOTAL INVESTMENTS - 99.4%
(Identified Cost $188,692,317) | | | | | | | | | 216,892,912 | |
| | | | | | | | | | |
OTHER ASSETS, LESS LIABILITIES - 0.6% | | | | | | | | | 1,330,535 | |
| | | | | | | | | | |
NET ASSETS - 100% | | | | | | | | $ | 218,223,447 | |
| | | | | | | | | | |
ADR - American Depository Receipt
| * | Non-income producing security |
| 1 | Values were adjusted following the close of local trading using a factor from a third party vendor. |
| 2 | Rate shown is the current yield as of June 30, 2011. |
| | | | | | |
| | The accompanying notes are an integral part of the financial statements. | | | 7 | |
Statement of Assets and Liabilities (unaudited)
June 30, 2011
| | | | | |
ASSETS: | | | | | |
Investments, at value (identified cost $188,692,317) (Note 2) | | | $ | 216,892,912 | |
Foreign currency, at value (cost $27,018) | | | | 27,214 | |
Receivable for securities sold | | | | 1,542,249 | |
Dividends receivable | | | | 142,848 | |
Receivable for fund shares sold | | | | 109,918 | |
Foreign tax reclaims receivable | | | | 23,963 | |
| | | | | |
| |
TOTAL ASSETS | | | | 218,739,104 | |
| | | | | |
| |
LIABILITIES: | | | | | |
| |
Accrued management fees (Note 3) | | | | 174,249 | |
Accrued fund accounting and administration fees (Note 3) | | | | 9,787 | |
Accrued transfer agent fees (Note 3) | | | | 3,906 | |
Accrued Chief Compliance Officer service fees (Note 3) | | | | 466 | |
Accrued directors’ fees (Note 3) | | | | 4 | |
Payable for fund shares repurchased | | | | 287,914 | |
Other payables and accrued expenses | | | | 39,331 | |
| | | | | |
| |
TOTAL LIABILITIES | | | | 515,657 | |
| | | | | |
| |
TOTAL NET ASSETS | | | $ | 218,223,447 | |
| | | | | |
| |
NET ASSETS CONSIST OF: | | | | | |
| |
Capital stock | | | $ | 219,562 | |
Additional paid-in-capital | | | | 226,381,368 | |
Undistributed net investment loss | | | | (68,296 | ) |
Accumulated net realized loss on investments, foreign currency and translation of other assets and liabilities | | | | (36,510,683 | ) |
Net unrealized appreciation on investments, foreign currency and translation of other assets and liabilities | | | | 28,201,496 | |
| | | | | |
| |
TOTAL NET ASSETS | | | $ | 218,223,447 | |
| | | | | |
| |
NET ASSET VALUE, OFFERING PRICE AND REDEMPTION PRICE PER SHARE - Class A
($218,223,447/21,956,240 shares) | | | $ | 9.94 | |
| | | | | |
| | | | |
| 8 | | The accompanying notes are an integral part of the financial statements. | | |
Statement of Operations (unaudited)
For the Six Months Ended June 30, 2011
| | | | | |
INVESTMENT INCOME: | | | | | |
| |
Dividends (net of foreign taxes withheld, $48,807) | | | $ | 1,105,084 | |
| | | | | |
| |
EXPENSES: | | | | | |
| |
Management fees (Note 3) | | | | 1,072,882 | |
Fund accounting and administration fees (Note 3) | | | | 26,799 | |
Transfer agent fees (Note 3) | | | | 9,744 | |
Directors’ fees (Note 3) | | | | 2,699 | |
Chief Compliance Officer service fees (Note 3) | | | | 1,314 | |
Custodian fees | | | | 11,849 | |
Miscellaneous | | | | 48,093 | |
| | | | | |
| |
Total Expenses | | | | 1,173,380 | |
| | | | | |
| |
NET INVESTMENT LOSS | | | | (68,296 | ) |
| | | | | |
| |
REALIZED AND UNREALIZED GAIN (LOSS) ON INVESTMENTS AND FOREIGN CURRENCY: | | | | | |
| |
Net realized gain (loss) on- | | | | | |
Investments | | | | 28,451,717 | |
Foreign currency and translation of other assets and liabilities | | | | (7,478 | ) |
| | | | | |
| |
| | | | 28,444,239 | |
| | | | | |
| |
Net change in unrealized appreciation (depreciation) on- | | | | | |
Investments | | | | (13,911,997 | ) |
Foreign currency and translation of other assets and liabilities | | | | 463 | |
| | | | | |
| |
| | | | (13,911,534 | ) |
| | | | | |
| |
NET REALIZED AND UNREALIZED GAIN ON INVESTMENTS AND FOREIGN CURRENCY | | | | 14,532,705 | |
| | | | | |
| |
NET INCREASE IN NET ASSETS RESULTING FROM OPERATIONS | | | $ | 14,464,409 | |
| | | | | |
| | | | | | |
| | The accompanying notes are an integral part of the financial statements. | | | 9 | |
Statements of Changes in Net Assets
| | | | | | | | | | |
| | | For the Six
Months Ended
6/30/11
(unaudited) | | For the
Year Ended
12/31/10 |
INCREASE IN NET ASSETS: | | | | | | | | | | |
| | |
OPERATIONS: | | | | | | | | | | |
| | |
Net investment loss | | | $ | (68,296 | ) | | | $ | (234,132 | ) |
Net realized gain on investments and foreign currency | | | | 28,444,239 | | | | | 28,494,683 | |
Net change in unrealized appreciation (depreciation) on investments and foreign currency | | | | (13,911,534 | ) | | | | 14,571,480 | |
| | | | | | | | | | |
| | |
Net increase from operations | | | | 14,464,409 | | | | | 42,832,031 | |
| | | | | | | | | | |
| | |
CAPITAL STOCK ISSUED AND REPURCHASED: | | | | | | | | | | |
| | |
Net decrease from capital share transactions (Note 5) | | | | (4,638,070 | ) | | | | (6,344,912 | ) |
| | | | | | | | | | |
| | |
Net increase in net assets | | | | 9,826,339 | | | | | 36,487,119 | |
| | |
NET ASSETS: | | | | | | | | | | |
| | |
Beginning of period | | | | 208,397,108 | | | | | 171,909,989 | |
| | | | | | | | | | |
| | |
End of period (including undistributed net investment loss and undistributed net investment income of $(68,296) and $0, respectively) | | | $ | 218,223,447 | | | | $ | 208,397,108 | |
| | | | | | | | | | |
| | | | |
| 10 | | The accompanying notes are an integral part of the financial statements. | | |
Financial Highlights
| | | | | | | | | | | | | | | | | | | | | | | | | | | | | | |
| | | For the Six
Months Ended
6/30/11
(unaudited) | | | | | | | | | | |
| | | | | | | | | | | | |
| | | | For the Years Ended |
| | | 12/31/10 | | 12/31/09 | | 12/31/08 | | 12/31/07 | | 12/31/06 |
Per share data (for a share outstanding throughout each period): | | | | | | | | | | | | | | | | | | | | | | | | | | | | | | |
Net asset value - Beginning of period | | | $ | 9.29 | | | | $ | 7.39 | | | | $ | 4.98 | | | | $ | 10.21 | | | | $ | 13.08 | | | | $ | 13.66 | |
| | | | | | | | | | | | | | | | | | | | | | | | | | | | | | |
Income (loss) from investment operations: | | | | | | | | | | | | | | | | | | | | | | | | | | | | | | |
Net investment loss | | | | (0.00) | 1,2 | | | | (0.01) | 1 | | | | (0.02) | 1 | | | | (0.02) | | | | | (0.01) | | | | | (0.05) | |
Net realized and unrealized gain (loss) on investments | | | | 0.65 | | | | | 1.91 | | | | | 2.43 | | | | | (5.12) | | | | | (1.25) | | | | | 2.55 | |
| | | | | | | | | | | | | | | | | | | | | | | | | | | | | | |
Total from investment operations | | | | 0.65 | | | | | 1.90 | | | | | 2.41 | | | | | (5.14) | | | | | (1.26) | | | | | 2.50 | |
| | | | | | | | | | | | | | | | | | | | | | | | | | | | | | |
Less distributions to shareholders: | | | | | | | | | | | | | | | | | | | | | | | | | | | | | | |
From net realized gain on investments | | | | — | | | | | — | | | | | — | | | | | (0.09) | | | | | (1.61) | | | | | (3.08) | |
| | | | | | | | | | | | | | | | | | | | | | | | | | | | | | |
Net asset value - End of period | | | $ | 9.94 | | | | $ | 9.29 | | | | $ | 7.39 | | | | $ | 4.98 | | | | $ | 10.21 | | | | $ | 13.08 | |
| | | | | | | | | | | | | | | | | | | | | | | | | | | | | | |
Net assets - End of period (000’s omitted) | | | $ | 218,223 | | | | $ | 208,397 | | | | $ | 171,910 | | | | $ | 120,162 | | | | $ | 184,998 | | | | $ | 175,491 | |
| | | | | | | | | | | | | | | | | | | | | | | | | | | | | | |
Total return3 | | | | 7.00 | % | | | | 25.71 | % | | | | 48.39 | % | | | | (50.68 | %) | | | | (9.32 | %) | | | | 18.06 | % |
Ratios (to average net assets)/ Supplemental Data: | | | | | | | | | | | | | | | | | | | | | | | | | | | | | | |
Expenses* | | | | 1.09 | %4 | | | | 1.12 | % | | | | 1.15 | % | | | | 1.15 | % | | | | 1.14 | % | | | | 1.16 | % |
Net investment loss | | | | (0.06 | %)4 | | | | (0.13 | %) | | | | (0.34 | %) | | | | (0.39 | %) | | | | (0.08 | %) | | | | (0.40 | %) |
Portfolio turnover | | | | 42 | % | | | | 75 | % | | | | 76 | % | | | | 68 | % | | | | 64 | % | | | | 85 | % |
|
* The investment advisor did not impose all or a portion of its management fees, CCO fees, fund accounting and transfer agent fees, and other fees in some periods and in some periods paid a portion of the Series’ expenses. If these expenses had been incurred by the Series, the expense ratio (to average net assets) would have been increased by the following amount: | |
| | | | N/A | | | | | 0.00 | %5 | | | | 0.00 | %5 | | | | N/A | | | | | N/A | | | | | N/A | |
| 1 | Calculated based on average shares outstanding during the period. |
| 2 | Less than $(0.01) per share. |
| 3 | Represents aggregate total return for the periods indicated, and assumes reinvestment of all distributions. Total return would have been lower had certain expenses not been waived during certain periods. Periods less than one year are not annualized. |
| | | | | | |
| | The accompanying notes are an integral part of the financial statements. | | | 11 | |
Notes to Financial Statements (unaudited)
Small Cap Series (the “Series”) is a no-load diversified series of Manning & Napier Fund, Inc. (the “Fund”). The Fund is organized in Maryland and is registered under the Investment Company Act of 1940, as amended, as an open-end management investment company.
The Series’ investment objective is to provide long-term growth by investing principally in the common stocks of companies with small market capitalizations.
The Series is authorized to issue five classes of shares (Class A, B, D, E and Z). Currently, only Class A shares have been issued. Each class of shares is substantially the same, except that class-specific distribution and shareholder servicing expenses are borne by the specific class of shares to which they relate.
The Fund’s Advisor is Manning & Napier Advisors, Inc. (the “Advisor”). Shares of the Series are offered to investors, clients and employees of the Advisor and its affiliates. The total authorized capital stock of the Fund consists of 10.0 billion shares of common stock each having a par value of $0.01. As of June 30, 2011, 6.4 billion shares have been designated in total among 31 series, of which 87.5 million have been designated as Small Cap Series Class A common stock.
| 2. | SIGNIFICANT ACCOUNTING POLICIES |
Security Valuation
Portfolio securities, including domestic equities, foreign equities, warrants and options, listed on an exchange other than the NASDAQ National Market System are valued at the latest quoted sales price of the exchange on which the security is primarily traded. Securities not traded on valuation date or securities not listed on an exchange are valued at the latest quoted bid price provided by the Fund’s pricing service. Securities listed on the NASDAQ National Market System are valued in accordance with the NASDAQ Official Closing Price.
Short-term investments that mature in sixty days or less are valued at amortized cost, which approximates market value. Investments in open-end investment companies are valued at their net asset value per share on valuation date.
Volume and level of activity in established markets for an asset or liability are evaluated to determine whether recent transactions and quoted prices are determinative of fair value. Where there have been significant decreases in volume and level of activity, further analysis and adjustment may be necessary to estimate fair value. The Series measures fair value in these instances by the use of inputs and valuation techniques which may be based upon current market prices of securities that are comparable in coupon, rating, maturity and industry and/or expectation of future cash flows. As a result of trading in relatively thin markets and/or markets that experience significant volatility, the prices used by the Series to value these securities may differ from the value that would be realized if these securities were sold, and the differences could be material.
Securities for which representative valuations or prices are not available from the Fund’s pricing service may be valued at fair value. Due to the inherent uncertainty of valuations of such securities, the fair value may differ significantly from the values that would have been used had a ready market for such securities existed. If trading or events occurring after the close of the principal market in which securities are traded are expected to materially affect the value of those securities, then they may be valued at their fair value, taking this trading or these events into account. Fair value is determined in good faith by the Advisor under procedures approved by and under the general supervision and responsibility of the Fund’s Board of Directors (the “Board”). In accordance with the procedures approved by the Board, certain securities trading outside the U.S. whose values were adjusted following the close of local trading use a factor from a third party vendor to the extent available. The value of securities used for net asset value calculation under these procedures may differ from published prices for the same securities. It is the Fund’s policy to classify each foreign equity security where a factor from a third party vendor is provided as a Level 2 security.
Notes to Financial Statements (unaudited)
| 2. | SIGNIFICANT ACCOUNTING POLICIES (continued) |
Security Valuation (continued)
Various inputs are used in determining the value of the Series’ assets or liabilities carried at market value. These inputs are summarized in three broad levels. Level 1 includes quoted prices in active markets for identical assets and liabilities. Level 2 includes other significant observable inputs (including quoted prices for similar securities, interest rates, prepayment speeds, credit risk, etc.). Level 3 includes significant unobservable inputs (including the Series’ own assumptions in determining the fair value of investments). The inputs or methodology used for valuing securities are not necessarily an indication of the risk associated with investing in those securities.
The following is a summary of the valuation levels used for major security types as of June 30, 2011 in valuing the Series’ assets or liabilities carried at market value:
| | | | | | | | | | | | | | | | | | | | |
Description | | Total | | Level 1 | | Level 2 | | Level 3 |
Assets: | | | | | | | | | | | | | | | | | | | | |
Equity securities*: | | | | | | | | | | | | | | | | | | | | |
Consumer Discretionary | | | $ | 46,416,100 | | | | $ | 38,254,772 | | | | $ | 8,161,328 | | | | $ | — | |
Consumer Staples | | | | 12,636,037 | | | | | 10,049,855 | | | | | 2,586,182 | | | | | — | |
Energy | | | | 15,547,229 | | | | | 13,481,792 | | | | | 2,065,437 | | | | | — | |
Financials | | | | 19,929,626 | | | | | 19,929,626 | | | | | — | | | | | — | |
Health Care | | | | 31,417,016 | | | | | 27,382,259 | | | | | 4,034,757 | | | | | — | |
Industrials | | | | 46,189,546 | | | | | 38,885,880 | | | | | 7,303,666 | | | | | — | |
Information Technology | | | | 25,305,769 | | | | | 25,305,769 | | | | | — | | | | | — | |
Materials | | | | 12,621,270 | | | | | 12,621,270 | | | | | — | | | | | — | |
Utilities | | | | 2,346,737 | | | | | 2,346,737 | | | | | — | | | | | — | |
Preferred securities | | | | — | | | | | — | | | | | — | | | | | — | |
Debt securities | | | | — | | | | | — | | | | | — | | | | | — | |
Mutual funds | | | | 4,483,582 | | | | | 4,483,582 | | | | | — | | | | | — | |
Other financial instruments** | | | | — | | | | | — | | | | | — | | | | | — | |
| | | | | | | | | | | | | | | | | | | | |
Total assets | | | | 216,892,912 | | | | | 192,741,542 | | | | | 24,151,370 | | | | | — | |
| | | | | | | | | | | | | | | | | | | | |
Liabilities: | | | | | | | | | | | | | | | | | | | | |
Other financial instruments** | | | | — | | | | | — | | | | | — | | | | | — | |
| | | | | | | | | | | | | | | | | | | | |
Total liabilities | | | | — | | | | | — | | | | | — | | | | | — | |
| | | | | | | | | | | | | | | | | | | | |
Total | | | $ | 216,892,912 | | | | $ | 192,741,542 | | | | $ | 24,151,370 | | | | $ | — | |
| | | | | | | | | | | | | | | | | | | | |
| * | Includes common stock, warrants and rights. Please see the Investment Portfolio for foreign securities where values were adjusted following the close of local trading using a factor from a third party vendor. Such securities are included in Level 2 in the table above. |
| ** | Other financial instruments are derivative instruments not reflected in the Investment Portfolio, such as futures, forwards and swap contracts, which are valued at the unrealized appreciation/depreciation on the instrument. As of June 30, 2011, the Series did not hold any derivative instruments. |
There were no Level 3 securities held by the Series as of December 31, 2010 or June 30, 2011.
The Fund’s policy is to recognize transfers in and transfers out of the valuation levels as of the beginning of the reporting period. There were no significant transfers between Level 1 and Level 2 during the six months ended June 30, 2011.
Notes to Financial Statements (unaudited)
Recent Accounting Standard
In May 2011, the Financial Accounting Standards Board issued amended guidance to improve disclosure about fair value measurements which will require the following disclosures for fair value measurements categorized as Level 3: quantitative information about the unobservable inputs and assumptions used in the fair value measurement, a description of the valuation policies and procedures and a narrative description of the sensitivity of the fair value measurement to changes in unobservable inputs and the interrelationships between those unobservable inputs. In addition, the amounts and reasons for all transfers in and out of Level 1 and Level 2 will be required to be disclosed. The amended guidance is effective for financial statements for fiscal years beginning after December 15, 2011, and interim periods within those fiscal years. Management is evaluating the impact of this guidance on the Series’ financial statements and disclosures.
Security Transactions, Investment Income and Expenses
Security transactions are accounted for on trade date. Dividend income is recorded on the ex-dividend date, except that if the ex-dividend date has passed, certain dividends from foreign securities are recorded as soon as the Fund is informed of the ex-dividend date. Non-cash dividends, if any, are recorded at the fair market value of the securities received. Interest income, including amortization of premium and accretion of discounts using the effective interest method, is earned from settlement date and accrued daily.
Expenses are recorded on an accrual basis. Most expenses of the Fund can be attributed to a specific series. Expenses which cannot be directly attributed are apportioned among the series in the Fund in such a manner as deemed equitable by the Fund’s Board, taking into consideration, among other things, the nature and type of expense.
The Series uses the identified cost method for determining realized gain or loss on investments for both financial statement and federal income tax reporting purposes.
Foreign Currency Translation
The books and records of the Series are maintained in U.S. dollars. Foreign currencies, investments and other assets and liabilities are translated into U.S. dollars at the current exchange rates. Purchases and sales of investment securities and income and expenses are translated on the respective dates of such transactions. The Series does not isolate realized and unrealized gains and losses attributable to changes in the exchange rates from gains and losses that arise from changes in the market value of investments. Such fluctuations are included with net realized and unrealized gain or loss on investments. Net realized foreign currency gains and losses represent foreign currency gains and losses between trade date and settlement date on securities transactions, gains and losses on disposition of foreign currencies and the difference between the amount of income and foreign withholding taxes recorded on the books of the Series and the amounts actually received or paid.
Federal Taxes
The Series’ policy is to comply with the provisions of the Internal Revenue Code applicable to regulated investment companies. The Series is not subject to federal income tax or excise tax to the extent that the Series distributes to shareholders each year its taxable income, including any net realized gains on investments, in accordance with requirements of the Internal Revenue Code. Accordingly, no provision for federal income tax or excise tax has been made in the financial statements.
Management evaluates its tax positions to determine if the tax positions taken meet the minimum recognition threshold in connection with accounting for uncertainties in income tax positions taken or expected to be taken for the purposes of measuring and recognizing tax liabilities in the financial statements. Recognition of tax benefits of an uncertain tax position is required only when the position is “more likely than not” to be sustained assuming examination by taxing authorities. At June 30, 2011, the Series has recorded no liability for net unrecognized tax benefits relating to uncertain income tax positions taken or expected to be taken in future tax returns.
Notes to Financial Statements (unaudited)
The Series files income tax returns in the U.S. federal jurisdiction, various states and foreign jurisdictions, as required. No income tax returns are currently under investigation. The statute of limitations on the Series’ tax returns remains open for the years ended December 31, 2007 through December 31, 2010. The Fund is not aware of any tax positions for which it is reasonably possible that the total amounts of unrecognized tax benefits will significantly change in the next twelve months.
Additionally, based on the Fund’s understanding of the tax rules and rates related to income, gains and transactions for foreign jurisdictions in which it invests, the Series will provide for foreign taxes, and where appropriate, deferred foreign tax.
Distributions of Income and Gains
Distributions to shareholders of net investment income and net realized gains are made annually. An additional distribution may be necessary to avoid taxation of the Series. Distributions are recorded on the ex-dividend date.
Indemnifications
The Fund’s organizational documents provide former and current directors and officers with a limited indemnification against liabilities arising in connection with the performance of their duties to the Fund. In the normal course of business, the Fund may also enter into contracts that provide general indemnifications. The Fund’s maximum exposure under these arrangements is unknown as this would be dependent on future claims that may be made against the Fund. The risk of material loss from such claims is considered remote.
Other
The preparation of financial statements in conformity with accounting principles generally accepted in the United States of America requires management to make estimates and assumptions that affect the reported amounts of assets and liabilities and the disclosure of contingent assets and liabilities at the date of the financial statements and the reported amounts of income and expenses during the reporting period. Actual results could differ from those estimates.
| 3. | TRANSACTIONS WITH AFFILIATES |
The Fund has an Investment Advisory Agreement (the “Agreement”) with the Advisor, for which the Series pays a fee, computed daily and payable monthly, at an annual rate of 1.00% of the Series’ average daily net assets.
Under the Agreement, personnel of the Advisor provide the Series with advice and assistance in the choice of investments and the execution of securities transactions, and otherwise maintain the Series’ organization. The Advisor also provides the Fund with necessary office space and fund administration and support services. The salaries of all officers of the Fund (except a percentage of the Fund’s Chief Compliance Officer’s salary, which is paid by the Fund), and of all Directors who are “affiliated persons” of the Fund, or of the Advisor, and all personnel of the Fund, or of the Advisor, performing services relating to research, statistical and investment activities, are paid by the Advisor. Each “non-affiliated” Director receives an annual stipend, which is allocated among all the active series of the Fund. In addition, these Directors also receive a fee per Board meeting attended plus a fee for each committee meeting attended.
Manning & Napier Investor Services, Inc., a registered broker-dealer affiliate of the Advisor, acts as distributor for the Fund’s shares. The services of Manning & Napier Investor Services, Inc. are provided at no additional cost to the Series.
The Advisor did not waive any fees for the six months ended June 30, 2011. The Advisor is not eligible to recoup any expenses that have been waived or reimbursed in prior years.
The Advisor has agreements with BNY Mellon Investment Servicing (U.S.) Inc. (“BNY”) under which BNY serves as sub-accountant services agent and sub-transfer agent. The Fund pays the Advisor an annual fee related to fund
Notes to Financial Statements (unaudited)
| 3. | TRANSACTIONS WITH AFFILIATES (continued) |
accounting and administration of 0.0175% on the first $3 billion of average daily net assets (excluding Target Series); 0.015% on the next $3 billion of average daily net assets (excluding Target Series); and 0.01% of the average daily net assets in excess of $6 billion (excluding Target Series); plus a base fee of $25,500 per Series. Transfer Agent fees are charged to the Fund on a per account basis. Additionally, certain transaction- and cusip-based fees and out-of-pocket expenses, including charges for reporting relating to the Fund’s compliance program, are charged.
Expenses not directly attributable to a Series are allocated based on each Series’ relative net assets or number of accounts, depending on the expense.
| 4. | PURCHASES AND SALES OF SECURITIES |
For the six months ended June 30, 2011, purchases and sales of securities, other than U.S. Government securities and short-term securities, were $89,232,417 and $89,458,996, respectively. There were no purchases or sales of U.S. Government securities.
| 5. | CAPITAL STOCK TRANSACTIONS |
Transactions in Class A shares of Small Cap Series were:
| | | | | | | | | | | | | | | | | | | | |
| | | For the Six Months
Ended 6/30/11 | | For the Year
Ended 12/31/10 |
| | Shares | | Amount | | Shares | | Amount |
Sold | | | | 951,196 | | | | $ | 9,078,842 | | | | | 2,171,584 | | | | $ | 16,811,321 | |
Reinvested | | | | — | | | | | — | | | | | — | | | | | — | |
Repurchased | | | | (1,417,481 | ) | | | | (13,716,912 | ) | | | | (3,002,811 | ) | | | | (23,156,233 | ) |
| | | | | | | | | | | | | | | | | | | | |
Total | | | | (466,285 | ) | | | $ | (4,638,070 | ) | | | | (831,227 | ) | | | $ | (6,344,912 | ) |
| | | | | | | | | | | | | | | | | | | | |
Approximately 90% of the Series’ shares represent investments by fiduciary accounts over which the Advisor has sole investment discretion. At June 30, 2011, the retirement plan of the Advisor and its affiliates owned 42,305 shares (0.19% of shares outstanding) valued at $420,513.
The Series may trade in instruments including written and purchased options, forward foreign currency exchange contracts and futures contracts and other derivatives in the normal course of investing activities to assist in managing exposure to various market risks. The Series may be subject to various elements of risk, which may involve, to a varying degree, elements of risk in excess of the amounts recognized for financial statement purposes. These risks include: the risk that changes in the value of a derivative may not correlate perfectly with the underlying asset, rate or index, counterparty credit risk related to over the counter derivatives’ counterparties failure to perform under contract terms, liquidity risk related to the lack of a liquid market for these contracts allowing the fund to close out its position(s) and documentation risk relating to disagreement over contract terms. No such investments were held by the Series on June 30, 2011.
Investing in securities of foreign companies and foreign governments involves special risks and considerations not typically associated with investing in securities of domestic companies and the U.S. Government. These risks include revaluation of currencies and future adverse political and economic developments. Moreover, securities of foreign companies and foreign governments and their markets may be less liquid and their prices more volatile than those of comparable domestic companies and the U.S. Government.
Notes to Financial Statements (unaudited)
| 8. | FEDERAL INCOME TAX INFORMATION |
The amount and characterization of certain income and capital gains to be distributed are determined in accordance with federal income tax regulations, which may differ from accounting principles generally accepted in the United States of America. The Series may periodically make reclassifications among its capital accounts to reflect income and gains available for distribution (or available capital loss carryovers) under income tax regulations, without impacting the Series’ net asset value. Any such reclassifications are not reflected in the financial highlights.
There were no distributions to shareholders for the year ended December 31, 2010 or the six months ended June 30, 2011.
At December 31, 2010, the Series had a capital loss carryover of $64,954,922, available to the extent allowed by tax law to offset future net capital gain, if any, which will expire as follows:
| | | | |
Loss Carryover | | | Expiration Date |
| $ | 12,581,033 | | | December 31, 2016 |
| $ | 52,373,889 | | | December 31, 2017 |
Under the recently enacted Regulated Investment Company Modernization Act of 2010, capital losses incurred by the Funds after December 31, 2010 will not be subject to expiration. In addition, such losses must be used prior to the losses incurred in the years preceding enactment.
At June 30, 2011, the identified cost of investments for federal income tax purposes, the resulting gross unrealized appreciation and depreciation, and the net unrealized appreciation were as follows:
| | | | | |
Cost for federal income tax purposes | | | $ | 188,692,317 | |
Unrealized appreciation | | | $ | 35,241,904 | |
Unrealized depreciation | | | | (7,041,309 | ) |
| | | | | |
Net unrealized appreciation | | | $ | 28,200,595 | |
| | | | | |
Literature Requests (unaudited)
Proxy Voting Policies and Procedures
A description of the policies and procedures that the Fund uses to determine how to vote proxies relating to portfolio securities is available, without charge, upon request:
| | |
| By phone | | 1-800-466-3863 |
| On the Securities and Exchange Commission’s | | |
| (SEC) web site | | http://www.sec.gov |
Proxy Voting Record
Information regarding how the Fund voted proxies relating to portfolio securities during the most recent 12-month period ended June 30th is available, without charge, upon request:
| | |
| By phone | | 1-800-466-3863 |
| On the SEC’s web site | | http://www.sec.gov |
Quarterly Portfolio Holdings
The Series’ complete schedule of portfolio holdings for the 1st and 3rd quarters of each fiscal year are provided on Form N-Q, and are available, without charge, upon request:
| | |
| By phone | | 1-800-466-3863 |
| On the SEC’s web site | | http://www.sec.gov |
The Series’ Form N-Q may be reviewed and copied at the SEC’s Public Reference Room in Washington, D.C. Information on the operation of the Public Reference Room may be obtained by calling 1-800-SEC-0330.
Prospectus and Statement of Additional Information (SAI)
The prospectus and SAI provide additional information about each Series, including charges, expenses and risks. These documents are available, without charge, upon request:
| | |
| By phone | | 1-800-466-3863 |
| On the SEC’s web site | | http://www.sec.gov |
| On our web site | | http://www.manning-napier.com |
Additional information available at www.manning-napier.com
1. Fund Holdings - Month-End
2. Fund Holdings - Quarter-End
3. Shareholder Report - Annual
4. Shareholder Report - Semi-Annual
The Fund also offers electronic notification or “e-delivery” when certain documents are available on-line to be downloaded or reviewed. Direct shareholders can elect to receive electronic notification when shareholder reports, prospectus updates, and / or quarterly statements are available. If you do not currently have on-line access to your account, you can establish access by going to www.manning-napier.com, click on “Login” in the top corner of the page, and follow the prompts to self-enroll. Once enrolled, you can set your electronic notification preferences by clicking on the Account Options tab located within the green toolbar and then select E-Delivery Option. Should you have any questions on either how to establish on-line access or how to update your account settings, please do not hesitate to contact Investor Services at 1-800-466-3863.
MNSCS-6/11-SAR


TECHNOLOGY SERIES
Shareholder Expense Example (unaudited)
As a shareholder of the Series, you may incur two types of costs: (1) transaction costs and (2) ongoing costs, including management fees and other Series expenses. This example is intended to help you understand your ongoing costs (in dollars) of investing in the Series and to compare these costs with the ongoing costs of investing in other mutual funds.
The example is based on an investment of $1,000 invested at the beginning of the period and held for the entire period (January 1, 2011 to June 30, 2011).
Actual Expenses
The first line of the table below provides information about actual account values and actual expenses. You may use the information in this line, together with the amount you invested, to estimate the expenses that you paid over the period. Simply divide your account value by $1,000 (for example, an $8,600 account value divided by $1,000 = 8.6), then multiply the result by the number in the first line under the heading entitled “Expenses Paid During Period” to estimate the expenses you paid on your account during this period.
Hypothetical Example for Comparison Purposes
The second line of the table below provides information about hypothetical account values and hypothetical expenses based on the Series’ actual expense ratio and an assumed rate of return of 5% per year before expenses, which is not the Series’ actual return. The hypothetical account values and expenses may not be used to estimate the actual ending account balance or expenses you paid during the period. You may use this information to compare the ongoing costs of investing in the Series and other funds. To do so, compare this 5% hypothetical example with the 5% hypothetical examples that appear in the shareholder reports of the other funds.
Please note that the expenses shown in the table are meant to highlight your ongoing costs only and do not reflect any transaction costs. Therefore, the second line of the table is useful in comparing ongoing costs only, and will not help you determine the relative total costs of owning different funds. In addition, if these transaction costs were included, your costs would have been higher.
| | | | | | | | | | | | | | | |
| | | Beginning
Account Value
1/1/11 | | Ending
Account Value
6/30/11 | | Expenses Paid
During Period*
1/1/11-6/30/11 |
Actual | | | $ | 1,000.00 | | | | $ | 1,093.70 | | | | $ | 5.76 | |
Hypothetical (5% return before expenses) | | | $ | 1,000.00 | | | | $ | 1,019.29 | | | | $ | 5.56 | |
| * | Expenses are equal to the Series’ annualized expense ratio (for the six-month period) of 1.11%, multiplied by the average account value over the period, multiplied by 181/365 (to reflect the one-half year period). Expenses are based on the most recent fiscal half year. |
Portfolio Composition as of June 30, 2011 (unaudited)
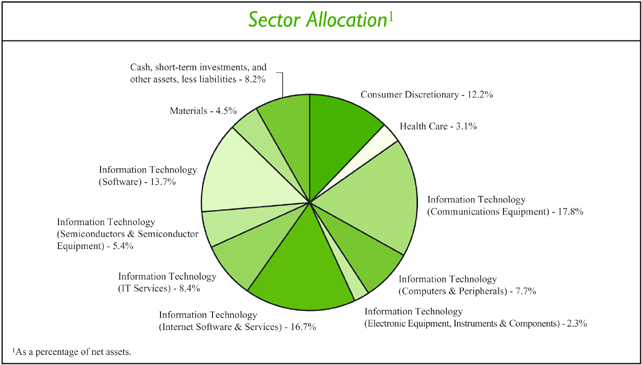
Top Ten Stock Holdings2
| | | | | |
Liberty Global, Inc. - Class A | | | | 4.4 | % |
Qualcomm, Inc. | | | | 4.3 | % |
Google, Inc. - Class A | | | | 3.7 | % |
Autodesk, Inc. | | | | 3.6 | % |
Telefonaktiebolaget LM Ericsson - ADR (Sweden) | | | | 3.5 | % |
| | | | | |
Alcatel-Lucent - ADR (France) | | | | 3.4 | % |
Sumco Corp. (Japan) | | | | 3.3 | % |
EMC Corp. | | | | 3.3 | % |
Indra Sistemas S.A. (Spain) | | | | 3.2 | % |
Liquidity Services, Inc. | | | | 3.2 | % |
| 2 | As a percentage of total investments. |
Investment Portfolio - June 30, 2011 (unaudited)
| | | | | | | | | | |
| | | Shares | | Value
(Note 2) |
| | |
COMMON STOCKS - 91.8% | | | | | | | | | | |
| | |
Consumer Discretionary - 12.2% | | | | | | | | | | |
Hotels, Restaurants & Leisure - 3.0% | | | | | | | | | | |
Ctrip.com International Ltd. - ADR (China)* | | | | 117,630 | | | | $ | 5,067,500 | |
| | | | | | | | | | |
Internet & Catalog Retail - 3.1% | | | | | | | | | | |
Amazon.com, Inc.* | | | | 25,500 | | | | | 5,214,495 | |
| | | | | | | | | | |
Media - 6.1% | | | | | | | | | | |
Liberty Global, Inc. - Class A* | | | | 165,000 | | | | | 7,431,600 | |
Zon Multimedia Servicos de Telecomunicacoes e Multimedia SGPS S.A. (Portugal)1 | | | | 650,800 | | | | | 3,020,985 | |
| | | | | | | | | | |
| | | | | | | | | 10,452,585 | |
| | | | | | | | | | |
| | |
Total Consumer Discretionary | | | | | | | | | 20,734,580 | |
| | | | | | | | | | |
| | |
Health Care - 3.1% | | | | | | | | | | |
Health Care Technology - 3.1% | | | | | | | | | | |
Cerner Corp.* | | | | 85,160 | | | | | 5,204,128 | |
| | | | | | | | | | |
| | |
Information Technology - 72.0% | | | | | | | | | | |
Communications Equipment - 17.8% | | | | | | | | | | |
Alcatel-Lucent - ADR (France)* | | | | 980,600 | | | | | 5,658,062 | |
Cisco Systems, Inc | | | | 290,000 | | | | | 4,526,900 | |
Infinera Corp.* | | | | 638,430 | | | | | 4,411,551 | |
Meru Networks, Inc.* | | | | 213,000 | | | | | 2,558,130 | |
Qualcomm, Inc | | | | 128,000 | | | | | 7,269,120 | |
Telefonaktiebolaget LM Ericsson - ADR (Sweden) | | | | 405,000 | | | | | 5,823,900 | |
| | | | | | | | | | |
| | | | | | | | | 30,247,663 | |
| | | | | | | | | | |
Computers & Peripherals - 7.7% | | | | | | | | | | |
Apple, Inc.* | | | | 12,400 | | | | | 4,162,308 | |
EMC Corp.* | | | | 198,000 | | | | | 5,454,900 | |
Immersion Corp.* | | | | 410,000 | | | | | 3,497,300 | |
| | | | | | | | | | |
| | | | | | | | | 13,114,508 | |
| | | | | | | | | | |
Electronic Equipment, Instruments & Components - 2.3% | | | | | | | | | | |
Amphenol Corp. - Class A | | | | 73,000 | | | | | 3,941,270 | |
| | | | | | | | | | |
Internet Software & Services - 16.7% | | | | | | | | | | |
comScore, Inc.* | | | | 128,840 | | | | | 3,336,956 | |
Google, Inc. - Class A* | | | | 12,230 | | | | | 6,193,027 | |
Liquidity Services, Inc.* | | | | 225,700 | | | | | 5,328,777 | |
VistaPrint N.V. (Netherlands)* | | | | 93,000 | | | | | 4,450,050 | |
Yandex N.V. - Class A (Netherlands)* | | | | 103,300 | | | | | 3,668,183 | |
Youku.com, Inc. - ADR (China)* | | | | 153,000 | | | | | 5,255,550 | |
| | | | | | | | | | |
| | | | | | | | | 28,232,543 | |
| | | | | | | | | | |
IT Services - 8.4% | | | | | | | | | | |
Amadeus IT Holding S.A. - Class A (Spain)*1 | | | | 176,000 | | | | | 3,658,320 | |
| | | | |
| 3 | | The accompanying notes are an integral part of the financial statements. | | |
Investment Portfolio - June 30, 2011 (unaudited)
| | | | | | | | | | |
| | | Shares | | Value
(Note 2) |
| | |
COMMON STOCKS (continued) | | | | | | | | | | |
| | |
Information Technology (continued) | | | | | | | | | | |
IT Services (continued) | | | | | | | | | | |
Amdocs Ltd. (Guernsey)* | | | | 170,000 | | | | $ | 5,166,300 | |
Indra Sistemas S.A. (Spain)1 | | | | 260,000 | | | | | 5,363,295 | |
| | | | | | | | | | |
| | | | | | | | | 14,187,915 | |
| | | | | | | | | | |
Semiconductors & Semiconductor Equipment - 5.4% | | | | | | | | | | |
Advantest Corp. (Japan)1 | | | | 196,000 | | | | | 3,608,247 | |
Sumco Corp. (Japan)*1 | | | | 330,500 | | | | | 5,595,495 | |
| | | | | | | | | | |
| | | | | | | | | 9,203,742 | |
| | | | | | | | | | |
Software - 13.7% | | | | | | | | | | |
Autodesk, Inc.* | | | | 158,000 | | | | | 6,098,800 | |
DemandTec, Inc.* | | | | 240,000 | | | | | 2,184,000 | |
Fortinet, Inc.* | | | | 64,080 | | | | | 1,748,743 | |
RealPage, Inc.* | | | | 86,000 | | | | | 2,276,420 | |
SolarWinds, Inc.* | | | | 152,000 | | | | | 3,973,280 | |
SuccessFactors, Inc.* | | | | 100,200 | | | | | 2,945,880 | |
Taleo Corp. - Class A* | | | | 106,000 | | | | | 3,925,180 | |
| | | | | | | | | | |
| | | | | | | | | 23,152,303 | |
| | | | | | | | | | |
| | |
Total Information Technology | | | | | | | | | 122,079,944 | |
| | | | | | | | | | |
| | |
Materials - 4.5% | | | | | | | | | | |
Chemicals - 4.5% | | | | | | | | | | |
Monsanto Co. | | | | 57,790 | | | | | 4,192,087 | |
Shin-Etsu Chemical Co. Ltd. (Japan)1 | | | | 65,000 | | | | | 3,484,115 | |
| | | | | | | | | | |
Total Materials | | | | | | | | | 7,676,202 | |
| | | | | | | | | | |
TOTAL COMMON STOCKS (Identified Cost $135,705,882) | | | | | | | | | 155,694,854 | |
SHORT-TERM INVESTMENTS - 6.8% | | | | | | | | | | |
Dreyfus Cash Management, Inc. - Institutional Shares2, 0.10% (Identified Cost $11,527,947) | | | | 11,527,947 | | | | | 11,527,947 | |
| | | | | | | | | | |
TOTAL INVESTMENTS - 98.6%
(Identified Cost $147,233,829) | | | | | | | | | 167,222,801 | |
OTHER ASSETS, LESS LIABILITIES - 1.4% | | | | | | | | | 2,324,153 | |
| | | | | | | | | | |
NET ASSETS - 100% | | | | | | | | $ | 169,546,954 | |
| | | | | | | | | | |
| ADR | - American Depository Receipt |
| * | Non-income producing security |
| 1 | Values were adjusted following the close of local trading using a factor from a third party vendor. |
| 2 | Rate shown is the current yield as of June 30, 2011. |
| | | | | | |
| | The accompanying notes are an integral part of the financial statements. | | | 4 | |
Statement of Assets and Liabilities (unaudited)
June 30, 2011
| | | | | |
ASSETS: | | | | | |
Investments, at value (identified cost $147,233,829) (Note 2) | | | $ | 167,222,801 | |
Receivable for securities sold | | | | 2,495,595 | |
Receivable for fund shares sold | | | | 140,808 | |
Foreign tax reclaims receivable | | | | 18,640 | |
Dividends receivable | | | | 2,040 | |
| | | | | |
| |
TOTAL ASSETS | | | | 169,879,884 | |
| | | | | |
| |
LIABILITIES: | | | | | |
| |
Accrued management fees (Note 3) | | | | 134,673 | |
Accrued fund accounting and administration fees (Note 3) | | | | 8,403 | |
Accrued transfer agent fees (Note 3) | | | | 3,448 | |
Accrued directors’ fees (Note 3) | | | | 513 | |
Accrued Chief Compliance Officer service fees (Note 3) | | | | 466 | |
Payable for fund shares repurchased | | | | 155,350 | |
Other payables and accrued expenses | | | | 30,077 | |
| | | | | |
| |
TOTAL LIABILITIES | | | | 332,930 | |
| | | | | |
| |
TOTAL NET ASSETS | | | $ | 169,546,954 | |
| | | | | |
| |
NET ASSETS CONSIST OF: | | | | | |
| |
Capital stock | | | $ | 133,266 | |
Additional paid-in-capital | | | | 137,774,217 | |
Undistributed net investment loss | | | | (304,256 | ) |
Accumulated net realized gain on investments, foreign currency and translation of other assets and liabilities | | | | 11,954,116 | |
Net unrealized appreciation on investments, foreign currency and translation of other assets and liabilities | | | | 19,989,611 | |
| | | | | |
| |
TOTAL NET ASSETS | | | $ | 169,546,954 | |
| | | | | |
| |
NET ASSET VALUE, OFFERING PRICE AND REDEMPTION PRICE PER SHARE - CLASS A ($169,546,954/13,326,623 shares) | | | $ | 12.72 | |
| | | | | |
| | | | |
| 5 | | The accompanying notes are an integral part of the financial statements. | | |
Statement of Operations (unaudited)
For the Six Months Ended June 30, 2011
| | | | | |
| |
INVESTMENT INCOME: | | | | | |
| |
Dividends (net of foreign taxes withheld, $71,545) | | | $ | 619,890 | |
Interest | | | | 3,582 | |
| | | | | |
| |
Total Investment Income | | | | 623,472 | |
| | | | | |
| |
EXPENSES: | | | | | |
| |
Management fees (Note 3) | | | | 834,225 | |
Fund accounting and administration fees (Note 3) | | | | 23,862 | |
Transfer agent fees (Note 3) | | | | 8,246 | |
Directors’ fees (Note 3) | | | | 2,574 | |
Chief Compliance Officer service fees (Note 3) | | | | 1,314 | |
Custodian fees | | | | 8,796 | |
Miscellaneous | | | | 48,542 | |
| | | | | |
| |
Total Expenses | | | | 927,559 | |
| | | | | |
| |
NET INVESTMENT LOSS | | | | (304,087 | ) |
| | | | | |
| |
REALIZED AND UNREALIZED GAIN (LOSS) ON INVESTMENTS AND FOREIGN
CURRENCY: | | | | | |
| |
Net realized gain (loss) on- | | | | | |
Investments | | | | 26,600,108 | |
Foreign currency and translation of other assets and liabilities | | | | (2,122 | ) |
| | | | | |
| |
| | | | 26,597,986 | |
| | | | | |
| |
Net change in unrealized appreciation (depreciation) on- | | | | | |
Investments | | | | (11,457,718 | ) |
Foreign currency and translation of other assets and liabilities | | | | 639 | |
| | | | | |
| |
| | | | (11,457,079 | ) |
| | | | | |
| |
NET REALIZED AND UNREALIZED GAIN ON INVESTMENTS AND FOREIGN CURRENCY | | | | 15,140,907 | |
| | | | | |
| |
NET INCREA\SE IN NET ASSETS RESULTING FROM OPERATIONS | | | $ | 14,836,820 | |
| | | | | |
| | | | | | |
| | The accompanying notes are an integral part of the financial statements. | | | 6 | |
Statements of Changes in Net Assets
| | | | | | | | | | |
| | | For the Six
Months Ended
6/30/11
(unaudited) | | For the
Year Ended
12/31/10 |
INCREASE IN NET ASSETS: | | | | | | | | | | |
| | |
OPERATIONS: | | | | | | | | | | |
| | |
Net investment loss | | | $ | (304,087 | ) | | | $ | (935,982 | ) |
Net realized gain on investments and foreign currency | | | | 26,597,986 | | | | | 16,822,648 | |
Net change in unrealized appreciation (depreciation) on investments and foreign currency | | | | (11,457,079 | ) | | | | 14,923,959 | |
| | | | | | | | | | |
| | |
Net increase from operations | | | | 14,836,820 | | | | | 30,810,625 | |
| | | | | | | | | | |
| | |
CAPITAL STOCK ISSUED AND REPURCHASED: | | | | | | | | | | |
| | |
Net decrease from capital share transactions (Note 5) | | | | (12,689,711 | ) | | | | (21,141,317 | ) |
| | | | | | | | | | |
| | |
Net increase in net assets | | | | 2,147,109 | | | | | 9,669,308 | |
| | |
NET ASSETS: | | | | | | | | | | |
| | |
Beginning of period | | | | 167,399,845 | | | | | 157,730,537 | |
| | | | | | | | | | |
| | |
End of year (including undistributed net investment loss of $304,256 and $169, respectively) | | | $ | 169,546,954 | | | | $ | 167,399,845 | |
| | | | | | | | | | |
The accompanying notes are an integral part of the financial statements.
Financial Highlights
| | | | | | | | | | | | | | | | | | | | | | | | | | | | | | |
| | | | | For the Years Ended |
| | | For the Six
Months Ended
6/30/11
(unaudited) | | 12/31/10 | | 12/31/09 | | 12/31/08 | | 12/31/07 | | 12/31/06 |
Per share data (for a share outstanding throughout each period): | | | | | | | | | | | | | | | | | | | | | | | | | | | | | | |
Net asset value - Beginning of period | | | $ | 11.63 | | | | $ | 9.73 | | | | $ | 6.01 | | | | $ | 11.29 | | | | $ | 10.41 | | | | $ | 8.37 | |
| | | | | | | | | | | | | | | | | | | | | | | | | | | | | | |
Income (loss) from investmentoperations: | | | | | | | | | | | | | | | | | | | | | | | | | | | | | | |
Net investment loss | | | | (0.02 | )1 | | | | (0.06 | )1 | | | | (0.05 | )1 | | | | (0.05 | ) | | | | (0.05 | ) | | | | (0.01 | ) |
Net realized and unrealized gain (loss)on investments | | | | 1.11 | | | | | 1.96 | | | | | 3.77 | | | | | (5.09 | ) | | | | 2.34 | | | | | 2.05 | |
| | | | | | | | | | | | | | | | | | | | | | | | | | | | | | |
Total from investment operations | | | | 1.09 | | | | | 1.90 | | | | | 3.72 | | | | | (5.14 | ) | | | | 2.29 | | | | | 2.04 | |
| | | | | | | | | | | | | | | | | | | | | | | | | | | | | | |
Less distributions to shareholders: | | | | | | | | | | | | | | | | | | | | | | | | | | | | | | |
From net realized gain on investments | | | | — | | | | | — | | | | | — | | | | | (0.14 | ) | | | | (1.41 | ) | | | | — | |
| | | | | | | | | | | | | | | | | | | | | | | | | | | | | | |
Net asset value - End of period | | | $ | 12.72 | | | | $ | 11.63 | | | | $ | 9.73 | | | | $ | 6.01 | | | | $ | 11.29 | | | | $ | 10.41 | |
| | | | | | | | | | | | | | | | | | | | | | | | | | | | | | |
Net assets - End of period (000’s omitted) | | | $ | 169,547 | | | | $ | 167,400 | | | | $ | 157,731 | | | | $ | 123,112 | | | | $ | 227,679 | | | | $ | 167,252 | |
| | | | | | | | | | | | | | | | | | | | | | | | | | | | | | |
Total return2 | | | | 9.37 | % | | | | 19.53 | % | | | | 61.90 | % | | | | (45.86 | %) | | | | 22.55 | % | | | | 24.37 | % |
Ratios (to average net assets)/ Supplemental Data: | | | | | | | | | | | | | | | | | | | | | | | | | | | | | | |
Expenses* | | | | 1.11 | %3 | | | | 1.12 | % | | | | 1.13 | % | | | | 1.13 | % | | | | 1.13 | % | | | | 1.16 | % |
Net investment loss | | | | (0.36 | %)3 | | | | (0.58 | %) | | | | (0.68 | %) | | | | (0.53 | %) | | | | (0.53 | %) | | | | (0.14 | %) |
Portfolio turnover | | | | 33 | % | | | | 70 | % | | | | 55 | % | | | | 65 | % | | | | 79 | % | | | | 83 | % |
|
* The investment advisor did not impose all or a portion of its management fees, CCO fees, fund accounting and transfer agent fees, and other fees in some periods and in some periods paid a portion of the Series’ expenses. If these expenses had been incurred by the Series, the expense ratio (to average net assets) would have been increased by the following amount: | |
| | | | | | |
| | | | N/A | | | | | 0.00 | %4 | | | | 0.00 | %4 | | | | N/A | | | | | N/A | | | | | N/A | |
| 1 | Calculated based on average shares outstanding during the periods. |
| 2 | Represents aggregate total return for the periods indicated, and assumes reinvestment of all distributions. Total return would have been lower had certain expenses not been waived or reimbursed during certain periods. Periods less than one year are not annualized. |
The accompanying notes are an integral part of the financial statements.
Notes to Financial Statements (unaudited)
Technology Series (the “Series”) is a no-load diversified series of Manning & Napier Fund, Inc. (the “Fund”). The Fund is organized in Maryland and is registered under the Investment Company Act of 1940, as amended, as an open-end management investment company.
The Series’ investment objective is to provide long-term growth by investing principally in the common stocks of companies in technology-based industries.
The Fund’s Advisor is Manning & Napier Advisors, Inc. (the “Advisor”). On August 8, 2000, the Series resumed sales of shares to advisory clients and employees of the Advisor and its affiliates. The Series resumed offering shares directly to investors on May 18, 2004, as it had done previously from time to time. The total authorized capital stock of the Fund consists of 10.0 billion shares of common stock each having a par value of $0.01. As of June 30, 2011, 6.4 billion shares have been designated in total among 31 series, of which 100 million have been designated as Technology Series Class A common stock.
| 2. | SIGNIFICANT ACCOUNTING POLICIES |
Security Valuation
Portfolio securities, including domestic equities, foreign equities, warrants and options, listed on an exchange other than the NASDAQ National Market System are valued at the latest quoted sales price of the exchange on which the security is primarily traded. Securities not traded on valuation date or securities not listed on an exchange are valued at the latest quoted bid price provided by the Fund’s pricing service. Securities listed on the NASDAQ National Market System are valued in accordance with the NASDAQ Official Closing Price.
Debt securities, including corporate bonds, will normally be valued on the basis of evaluated bid prices provided by an independent pricing service. Certain investments in securities held by the Series may be valued on a basis of a price provided directly by a principal market maker. These prices may differ from the value that would have been used had a broader market for securities existed.
Short-term investments that mature in sixty days or less are valued at amortized cost, which approximates market value. Investments in open-end investment companies are valued at their net asset value per share on valuation date.
Volume and level of activity in established markets for an asset or liability are evaluated to determine whether recent transactions and quoted prices are determinative of fair value. Where there have been significant decreases in volume and level of activity, further analysis and adjustment may be necessary to estimate fair value. The Series measures fair value in these instances by the use of inputs and valuation techniques which may be based upon current market prices of securities that are comparable in coupon, rating, maturity and industry and/or expectation of future cash flows. As a result of trading in relatively thin markets and/or markets that experience significant volatility, the prices used by the Series to value these securities may differ from the value that would be realized if these securities were sold, and the differences could be material.
Securities for which representative valuations or prices are not available from the Fund’s pricing service may be valued at fair value. Due to the inherent uncertainty of valuations of such securities, the fair value may differ significantly from the values that would have been used had a ready market for such securities existed. If trading or events occurring after the close of the principal market in which securities are traded are expected to materially affect the value of those securities, then they may be valued at their fair value, taking this trading or these events into account. Fair value is determined in good faith by the Advisor under procedures approved by and under the general supervision and responsibility of the Fund’s Board of Directors (the “Board”). In accordance with the procedures approved by the Board, certain securities trading outside the U.S. whose values were adjusted following the close of local trading use a factor from a third party vendor to the extent available. The value of securities used for net asset value calculation
Notes to Financial Statements (unaudited)
| 2. | SIGNIFICANT ACCOUNTING POLICIES (continued) |
Security Valuation (continued)
under these procedures may differ from published prices for the same securities. It is the Fund’s policy to classify each foreign equity security where a factor from a third party vendor is provided as a Level 2 security.
Various inputs are used in determining the value of the Series’ assets or liabilities carried at market value. These inputs are summarized in three broad levels. Level 1 includes quoted prices in active markets for identical assets and liabilities. Level 2 includes other significant observable inputs (including quoted prices for similar securities, interest rates, prepayment speeds, credit risk, etc.). Level 3 includes significant unobservable inputs (including the Series’ own assumptions in determining the fair value of investments). The inputs or methodology used for valuing securities are not necessarily an indication of the risk associated with investing in those securities.
The following is a summary of the valuation levels used for major security types as of June 30, 2011 in valuing the Series’ assets or liabilities carried at market value:
| | | | | | | | | | | | | | | | | | | | |
Description | | Total | | Level 1 | | Level 2 | | Level 3 |
Assets: | | | | | | | | | | | | | | | | | | | | |
Equity securities*: | | | | | | | | | | | | | | | | | | | | |
Consumer Discretionary | | | $ | 20,734,580 | | | | $ | 17,713,595 | | | | $ | 3,020,985 | | | | $ | — | |
Health Care | | | | 5,204,128 | | | | | 5,204,128 | | | | | — | | | | | — | |
Information Technology | | | | 122,079,944 | | | | | 103,854,587 | | | | | 18,225,357 | | | | | — | |
Materials | | | | 7,676,202 | | | | | 4,192,087 | | | | | 3,484,115 | | | | | — | |
Preferred securities | | | | — | | | | | — | | | | | — | | | | | — | |
Debt securities | | | | — | | | | | — | | | | | — | | | | | — | |
Mutual funds | | | | 11,527,947 | | | | | 11,527,947 | | | | | — | | | | | — | |
Other financial instruments** | | | | — | | | | | — | | | | | — | | | | | — | |
| | | | | | | | | | | | | | | | | | | | |
Total assets | | | | 167,222,801 | | | | | 142,492,344 | | | | | 24,730,457 | | | | | — | |
| | | | | | | | | | | | | | | | | | | | |
Liabilities: | | | | | | | | | | | | | | | | | | | | |
Other financial instruments** | | | | — | | | | | — | | | | | — | | | | | — | |
| | | | | | | | | | | | | | | | | | | | |
Total liabilities | | | | — | | | | | — | | | | | — | | | | | — | |
| | | | | | | | | | | | | | | | | | | | |
Total | | | $ | 167,222,801 | | | | $ | 142,492,344 | | | | $ | 24,730,457 | | | | $ | — | |
| | | | | | | | | | | | | | | | | | | | |
| * | Includes common stock, warrants and rights. Please see the Investment Portfolio for foreign securities where values were adjusted following the close of local trading using a factor from a third party vendor. Such securities are included in Level 2 in the table above. |
| ** | Other financial instruments are derivative instruments not reflected in the Investment Portfolio, such as futures, forwards and swap contracts, which are valued at the unrealized appreciation/depreciation on the instrument. As of June 30, 2011, the Series did not hold any derivative instruments. |
There were no Level 3 securities held by the Series as of December 31, 2010 or June 30, 2011.
The Fund’s policy is to recognize transfers in and transfers out of the valuation levels as of the beginning of the reporting period. There we no significant transfers between Level 1 and Level 2 during the six months ended June 30, 2011.
Recent Accounting Standard
In May 2011, the Financial Accounting Standards Board issued amended guidance to improve disclosure about fair value measurements which will require the following disclosures for fair value measurements categorized as Level
Notes to Financial Statements (unaudited)
| 2. | SIGNIFICANT ACCOUNTING POLICIES (continued) |
Recent Accounting Standard (continued)
3: quantitative information about the unobservable inputs and assumptions used in the fair value measurement, a description of the valuation policies and procedures and a narrative description of the sensitivity of the fair value measurement to changes in unobservable inputs and the interrelationships between those unobservable inputs. In addition, the amounts and reasons for all transfers in and out of Level 1 and Level 2 will be required to be disclosed. The amended guidance is effective for financial statements for fiscal years beginning after December 15, 2011, and interim periods within those fiscal years. Management is evaluating the impact of this guidance on the Series’ financial statements and disclosures.
Security Transactions, Investment Income and Expenses
Security transactions are accounted for on trade date. Dividend income is recorded on the ex-dividend date, except that if the ex-dividend date has passed, certain dividends from foreign securities are recorded as soon as the Fund is informed of the ex-dividend date. Non-cash dividends, if any, are recorded at the fair market value of the securities received. Interest income, including amortization of premium and accretion of discounts using the effective interest method, is earned from settlement date and accrued daily.
Expenses are recorded on an accrual basis. Most expenses of the Fund can be attributed to a specific series. Expenses which cannot be directly attributed are apportioned among the series in the Fund in such a manner as deemed equitable by the Fund’s Board, taking into consideration, among other things, the nature and type of expense.
The Series uses the identified cost method for determining realized gain or loss on investments for both financial statement and federal income tax reporting purposes.
Foreign Currency Translation
The books and records of the Series are maintained in U.S. dollars. Foreign currencies, investments and other assets and liabilities are translated into U.S. dollars at the current exchange rates. Purchases and sales of investment securities and income and expenses are translated on the respective dates of such transactions. The Series does not isolate realized and unrealized gains and losses attributable to changes in the exchange rates from gains and losses that arise from changes in the market value of investments. Such fluctuations are included with net realized and unrealized gain or loss on investments. Net realized foreign currency gains and losses represent foreign currency gains and losses between trade date and settlement date on securities transactions, gains and losses on disposition of foreign currencies and the difference between the amount of income and foreign withholding taxes recorded on the books of the Series and the amounts actually received or paid.
Federal Taxes
The Series’ policy is to comply with the provisions of the Internal Revenue Code applicable to regulated investment companies. The Series is not subject to federal income tax or excise tax to the extent that the Series distributes to shareholders each year its taxable income, including any net realized gains on investments, in accordance with requirements of the Internal Revenue Code. Accordingly, no provision for federal income tax or excise tax has been made in the financial statements.
Management evaluates its tax positions to determine if the tax positions taken meet the minimum recognition threshold in connection with accounting for uncertainties in income tax positions taken or expected to be taken for the purposes of measuring and recognizing tax liabilities in the financial statements. Recognition of tax benefits of an uncertain tax position is required only when the position is “more likely than not” to be sustained assuming examination by taxing authorities. At June 30, 2011, the Series has recorded no liability for net unrecognized tax benefits relating to uncertain income tax positions taken or expected to be taken in future tax returns.
The Series files income tax returns in the U.S. federal jurisdiction, various states and foreign jurisdictions, as required. No income tax returns are currently under investigation. The statute of limitations on the Series’ tax returns remains open for the years ended December 31, 2007 through December 31, 2010. The Fund is not aware of any tax
Notes to Financial Statements (unaudited)
| 2. | SIGNIFICANT ACCOUNTING POLICIES (continued) |
Federal Taxes (continued)
positions for which it is reasonably possible that the total amounts of unrecognized tax benefits will significantly change in the next twelve months.
Additionally, based on the Fund’s understanding of the tax rules and rates related to income, gains and transactions for foreign jurisdictions in which it invests, the Series will provide for foreign taxes, and where appropriate, deferred foreign tax.
Distributions of Income and Gains
Distributions to shareholders of net investment income and net realized gains are made annually. An additional distribution may be necessary to avoid taxation of the Series. Distributions are recorded on the ex-dividend date.
Indemnifications
The Fund’s organizational documents provide former and current directors and officers with a limited indemnification against liabilities arising in connection with the performance of their duties to the Fund. In the normal course of business, the Fund may also enter into contracts that provide general indemnifications. The Fund’s maximum exposure under these arrangements is unknown as this would be dependent on future claims that may be made against the Fund. The risk of material loss from such claims is considered remote.
Other
The preparation of financial statements in conformity with accounting principles generally accepted in the United States of America requires management to make estimates and assumptions that affect the reported amounts of assets and liabilities and the disclosure of contingent assets and liabilities at the date of the financial statements and the reported amounts of income and expenses during the reporting period. Actual results could differ from those estimates.
| 3. | TRANSACTIONS WITH AFFILIATES |
The Fund has an Investment Advisory Agreement (the “Agreement”) with the Advisor, for which the Series pays a fee, computed daily and payable monthly, at an annual rate of 1.00% of the Series’ average daily net assets.
Under the Agreement, personnel of the Advisor provide the Series with advice and assistance in the choice of investments and the execution of securities transactions, and otherwise maintain the Series’ organization. The Advisor also provides the Fund with necessary office space and fund administration and support services. The salaries of all officers of the Fund (except a percentage of the Fund’s Chief Compliance Officer’s salary, which is paid by the Fund), and of all Directors who are “affiliated persons” of the Fund, or of the Advisor, and all personnel of the Fund, or of the Advisor, performing services relating to research, statistical and investment activities, are paid by the Advisor. Each “non-affiliated” Director receives an annual stipend, which is allocated among all the active series of the Fund. In addition, these Directors also receive a fee per Board meeting attended plus a fee for each committee meeting attended.
The Advisor has contractually agreed, until at least April 30, 2012, to waive its fee and, if necessary, pay other operating expenses of the Series in order to maintain total direct annual fund operating expenses for the Series at no more than 1.20% of average daily net assets each year. The Advisor did not waive any fees for the six months ended June 30, 2011. The Advisor is not eligible to recoup any expenses that have been waived or reimbursed in prior years.
Manning & Napier Investor Services, Inc., a registered broker-dealer affiliate of the Advisor, acts as distributor for the Fund’s shares. The services of Manning & Napier Investor Services, Inc. are provided at no additional cost to the Series.
The Advisor has agreements with BNY Mellon Investment Servicing (U.S.) Inc. (“BNY”) under which BNY serves as sub-accountant services agent and sub-transfer agent. The Fund pays the Advisor an annual fee related to fund
Notes to Financial Statements (unaudited)
| 3. | TRANSACTIONS WITH AFFILIATES (continued) |
accounting and administration of 0.0175% on the first $3 billion of average daily net assets (excluding Target Series); 0.015% on the next $3 billion of average daily net assets (excluding Target Series); and 0.01% of the average daily net assets in excess of $6 billion (excluding Target Series); plus a base fee of $25,500 per Series. Transfer Agent fees are charged to the Fund on a per account basis. Additionally, certain transaction- and cusip-based fees and out-of-pocket expenses, including charges for reporting relating to the Fund’s compliance program, are charged.
Expenses not directly attributable to a Series are allocated based on each Series’ relative net assets or number of accounts, depending on the expense.
| 4. | PURCHASES AND SALES OF SECURITIES |
For the six months ended June 30, 2011, purchases and sales of securities, other than U.S. Government securities and short-term securities, were $54,296,918 and $79,684,431, respectively. There were no purchases or sales of U.S. Government securities.
| 5. | CAPITAL STOCK TRANSACTIONS |
Transactions in shares of Technology Series were:
| | | | | | | | | | | | | | | | | | | | |
| | | For the Six Months
Ended 6/30/11 | | For the Year
Ended 12/31/10 |
| | | Shares | | Amount | | Shares | | Amount |
Sold | | | | 689,335 | | | | $ | 8,548,416 | | | | | 1,704,514 | | | | $ | 17,060,290 | |
Reinvested | | | | — | | | | | — | | | | | — | | | | | — | |
Repurchased | | | | (1,755,390 | ) | | | | (21,238,127 | ) | | | | (3,526,619 | ) | | | | (38,201,607 | ) |
| | | | | | | | | | | | | | | | | | | | |
Total | | | | (1,066,055 | ) | | | $ | (12,689,711 | ) | | | | (1,822,105 | ) | | | $ | (21,141,317 | ) |
| | | | | | | | | | | | | | | | | | | | |
Substantially all of the Series’ shares represent investments by fiduciary accounts over which the Advisor has sole investment discretion.
The Series may trade in instruments including written and purchased options, forward foreign currency exchange contracts and futures contracts and other derivatives in the normal course of investing activities to assist in managing exposure to various market risks. The Series may be subject to various elements of risk, which may involve, to a varying degree, elements of risk in excess of the amounts recognized for financial statement purposes. These risks include: the risk that changes in the value of a derivative may not correlate perfectly with the underlying asset, rate or index, counterparty credit risk related to over the counter derivatives’ counterparties failure to perform under contract terms, liquidity risk related to the lack of a liquid market for these contracts allowing the fund to close out its position(s) and documentation risk relating to disagreement over contract terms. No such investments were held by the Series during the six months ended June 30, 2011.
Investing in securities of foreign companies and foreign governments involves special risks and considerations not typically associated with investing in securities of domestic companies and the U.S. Government. These risks include revaluation of currencies and future adverse political and economic developments. Moreover, securities of foreign companies and foreign governments and their markets may be less liquid and their prices more volatile than those of comparable domestic companies and the U.S. Government.
Notes to Financial Statements (unaudited)
The Series may focus its investments in certain related technology industries; hence, the Series may subject itself to a greater degree of risk than a series that is more diversified.
| 9. | FEDERAL INCOME TAX INFORMATION |
The amount and characterization of certain income and capital gains to be distributed are determined in accordance with federal income tax regulations, which may differ from accounting principles generally accepted in the United States of America. The Series may periodically make reclassifications among its capital accounts to reflect income and gains available for distribution (or available capital loss carryovers) under income tax regulations, without impacting the Series’ net asset value. Any such reclassifications are not reflected in the financial highlights.
There were no distributions to shareholders for the year ended December 31, 2010 or the six months ended June 30, 2011.
At December 31, 2010, the Series had a capital loss carryover of $14,531,914 available to the extent allowed by tax law to offset future net capital gain, if any, which will expire as follows:
| | | | | |
Loss Carryover | | Expiration Date |
$ 3,181,311 | | | | December 31, 2016 | |
$11,350,603 | | | | December 31, 2017 | |
Under the recently enacted Regulated Investment Company Modernization Act of 2010, capital losses incurred by the Funds after December 31, 2010 will not be subject to expiration. In addition, such losses must be used prior to the losses incurred in the years preceding enactment.
At June 30, 2011, the identified cost of investments for federal income tax purposes, the resulting gross unrealized appreciation and depreciation, and the net unrealized appreciation were as follows:
| | | | | |
Cost for federal income tax purposes | | | $ | 147,345,785 | |
Unrealized appreciation | | | $ | 26,264,026 | |
Unrealized depreciation | | | | (6,387,010 | ) |
| | | | | |
Net unrealized appreciation | | | $ | 19,877,016 | |
| | | | | |
Literature Requests (unaudited)
Proxy Voting Policies and Procedures
A description of the policies and procedures that the Fund uses to determine how to vote proxies relating to portfolio securities is available, without charge, upon request:
| | |
| By phone | | 1-800-466-3863 |
On the Securities and Exchange Commission’s (SEC) web site | | http://www.sec.gov |
Proxy Voting Record
Information regarding how the Fund voted proxies relating to portfolio securities during the most recent 12-month period ended June 30th is available, without charge, upon request:
| | |
| By phone | | 1-800-466-3863 |
| On the SEC’s web site | | http://www.sec.gov |
Quarterly Portfolio Holdings
The Series’ complete schedule of portfolio holdings for the 1st and 3rd quarters of each fiscal year are provided on Form N-Q, and are available, without charge, upon request:
| | |
| By phone | | 1-800-466-3863 |
| On the SEC’s web site | | http://www.sec.gov |
The Series’ Form N-Q may be reviewed and copied at the SEC’s Public Reference Room in Washington, D.C. Information on the operation of the Public Reference Room may be obtained by calling 1-800-SEC-0330.
Prospectus and Statement of Additional Information (SAI)
The prospectus and SAI provide additional information about each Series, including charges, expenses and risks. These documents are available, without charge, upon request:
| | |
| By phone | | 1-800-466-3863 |
| On the SEC’s web site | | http://www.sec.gov |
| On our web site | | http://www.manning-napier.com |
Additional information available at www.manning-napier.com
1. Fund Holdings - Month-End
2. Fund Holdings - Quarter-End
3. Shareholder Report - Annual
4. Shareholder Report - Semi-Annual
The Fund also offers electronic notification or “e-delivery” when certain documents are available on-line to be downloaded or reviewed. Direct shareholders can elect to receive electronic notification when shareholder reports, prospectus updates, and / or quarterly statements are available. If you do not currently have on-line access to your account, you can establish access by going to www.manning-napier.com, click on “Login” in the top corner of the page, and follow the prompts to self-enroll. Once enrolled, you can set your electronic notification preferences by clicking on the Account Options tab located within the green toolbar and then select E-Delivery Option. Should you have any questions on either how to establish on-line access or how to update your account settings, please do not hesitate to contact Investor Services at 1-800-466-3863.
MNTEC-6/11-SAR


| | | | |
| | FINANCIAL SERVICES SERIES | | |
Shareholder Expense Example (unaudited)
As a shareholder of the Series, you may incur two types of costs: (1) transaction costs and (2) ongoing costs, including management fees and other Series expenses. This example is intended to help you understand your ongoing costs (in dollars) of investing in the Series and to compare these costs with the ongoing costs of investing in other mutual funds.
The example is based on an investment of $1,000 invested at the beginning of the period and held for the entire period (January 1, 2011 to June 30, 2011).
Actual Expenses
The first line of the table below provides information about actual account values and actual expenses. You may use the information in this line, together with the amount you invested, to estimate the expenses that you paid over the period. Simply divide your account value by $1,000 (for example, an $8,600 account value divided by $1,000 = 8.6), then multiply the result by the number in the first line under the heading entitled “Expenses Paid During Period” to estimate the expenses you paid on your account during this period.
Hypothetical Example for Comparison Purposes
The second line of the table below provides information about hypothetical account values and hypothetical expenses based on the Series’ actual expense ratio and an assumed rate of return of 5% per year before expenses, which is not the Series’ actual return. The hypothetical account values and expenses may not be used to estimate the actual ending account balance or expenses you paid during the period. You may use this information to compare the ongoing costs of investing in the Series and other funds. To do so, compare this 5% hypothetical example with the 5% hypothetical examples that appear in the shareholder reports of the other funds.
Please note that the expenses shown in the table are meant to highlight your ongoing costs only and do not reflect any transaction costs. Therefore, the second line of the table is useful in comparing ongoing costs only, and will not help you determine the relative total costs of owning different funds. In addition, if these transaction costs were included, your costs would have been higher.
| | | | | | | | | | | | | | | |
| | | Beginning
Account Value
1/1/11 | | Ending
Account Value
6/30/11 | | Expenses Paid
During Period*
1/1/11-6/30/11 |
Actual | | | $ | 1,000.00 | | | | $ | 1,049.70 | | | | $ | 5.69 | |
Hypothetical
(5% return before expenses) | | | $ | 1,000.00 | | | | $ | 1,019.24 | | | | $ | 5.61 | |
| * | Expenses are equal to the Series’ annualized expense ratio (for the six-month period) of 1.12%, multiplied by the average account value over the period, multiplied by 181/365 (to reflect the one-half year period). Expenses are based on the most recent fiscal half year. |
Portfolio Composition (unaudited)
As of June 30, 2011
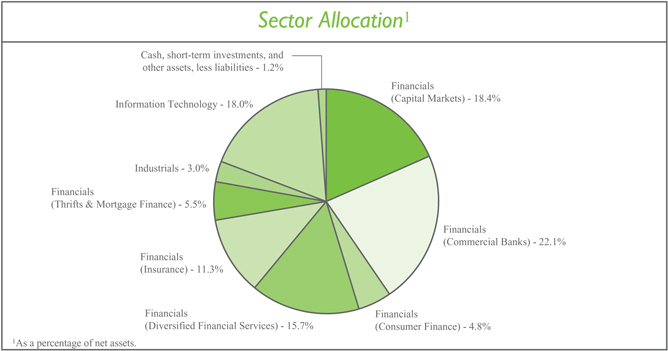
Top Ten Stock Holdings2
| | | | | |
MasterCard, Inc. - Class A | | | | 4.8 | % |
Visa, Inc. - Class A | | | | 4.6 | % |
JPMorgan Chase & Co. | | | | 4.2 | % |
CME Group, Inc. | | | | 4.1 | % |
The Western Union Co. | | | | 3.9 | % |
| 2 | As a percentage of total investments. |
| | | | | |
State Street Corp. | | | | 3.9 | % |
The Bank of New York Mellon Corp. | | | | 3.6 | % |
Allianz SE (Germany) | | | | 3.3 | % |
Edenred (France) | | | | 3.0 | % |
People’s United Financial, Inc. | | | | 3.0 | % |
Investment Portfolio - June 30, 2011 (unaudited)
| | | | | | | | | | |
| | | Shares | | Value
(Note 2) |
| | |
COMMON STOCKS - 98.8% | | | | | | | | | | |
| | |
Financials - 77.8% | | | | | | | | | | |
Capital Markets - 18.4% | | | | | | | | | | |
The Bank of New York Mellon Corp.1 | | | | 221,000 | | | | $ | 5,662,020 | |
The Charles Schwab Corp | | | | 264,000 | | | | | 4,342,800 | |
Evercore Partners, Inc. - Class A | | | | 56,000 | | | | | 1,865,920 | |
GAM Holding AG (Switzerland)2 | | | | 247,110 | | | | | 4,065,799 | |
Greenhill & Co., Inc | | | | 38,000 | | | | | 2,045,160 | |
Lazard Ltd. - Class A (Bermuda) | | | | 53,000 | | | | | 1,966,300 | |
Northern Trust Corp. | | | | 54,000 | | | | | 2,481,840 | |
State Street Corp. | | | | 135,000 | | | | | 6,087,150 | |
| | | | | | | | | | |
| | | | | | | | | 28,516,989 | |
| | | | | | | | | | |
Commercial Banks - 22.1% | | | | | | | | | | |
Banco Bilbao Vizcaya Argentaria S.A. - ADR (Spain) | | | | 241,000 | | | | | 2,829,340 | |
Banco Santander S.A. - ADR (Spain) | | | | 385,000 | | | | | 4,431,350 | |
Barclays plc - ADR (United Kingdom) | | | | 66,000 | | | | | 1,084,380 | |
CIT Group, Inc.* | | | | 73,000 | | | | | 3,230,980 | |
First Commonwealth Financial Corp. | | | | 423,000 | | | | | 2,428,020 | |
First Financial Bancorp | | | | 80,000 | | | | | 1,335,200 | |
HSBC Holdings plc - ADR (United Kingdom) | | | | 83,540 | | | | | 4,145,255 | |
ICICI Bank Ltd. - ADR (India) | | | | 65,260 | | | | | 3,217,318 | |
Societe Generale - ADR (France)3 | | | | 137,050 | | | | | 1,628,839 | |
Standard Chartered plc (United Kingdom)2 | | | | 116,000 | | | | | 3,047,060 | |
U.S. Bancorp | | | | 169,670 | | | | | 4,328,282 | |
Wells Fargo & Co. | | | | 92,000 | | | | | 2,581,520 | |
| | | | | | | | | | |
| | | | | | | | | 34,287,544 | |
| | | | | | | | | | |
Consumer Finance - 4.8% | | | | | | | | | | |
American Express Co. | | | | 71,400 | | | | | 3,691,380 | |
Discover Financial Services | | | | 142,000 | | | | | 3,798,500 | |
| | | | | | | | | | |
| | | | | | | | | 7,489,880 | |
| | | | | | | | | | |
Diversified Financial Services - 15.7% | | | | | | | | | | |
Bank of America Corp. | | | | 205,000 | | | | | 2,246,800 | |
Bolsas y Mercados Espanoles S.A. (Spain)2 | | | | 93,000 | | | | | 2,765,742 | |
CME Group, Inc. | | | | 21,700 | | | | | 6,327,503 | |
Deutsche Boerse AG (Germany)2 | | | | 37,000 | | | | | 2,809,409 | |
JPMorgan Chase & Co. | | | | 161,000 | | | | | 6,591,340 | |
MarketAxess Holdings, Inc. | | | | 145,000 | | | | | 3,633,700 | |
| | | | | | | | | | |
| | | | | | | | | 24,374,494 | |
| | | | | | | | | | |
Insurance - 11.3% | | | | | | �� | | | | |
Allianz SE (Germany)2 | | | | 37,000 | | | | | 5,159,562 | |
The Allstate Corp. | | | | 124,000 | | | | | 3,785,720 | |
Brasil Insurance Participacoes e Administracao S.A. (Brazil) | | | | 1,300 | | | | | 1,624,323 | |
Mapfre S.A. (Spain)2 | | | | 766,000 | | | | | 2,842,048 | |
| | | | | | |
| | The accompanying notes are an integral part of the financial statements. | | | 3 | |
Investment Portfolio - June 30, 2011 (unaudited)
| | | | | | | | | | |
| | | Shares | | Value
(Note 2) |
| | |
COMMON STOCKS (continued) | | | | | | | | | | |
| | |
Financials (continued) | | | | | | | | | | |
Insurance (continued) | | | | | | | | | | |
Zurich Financial Services AG (Switzerland)2 | | | | 16,500 | | | | $ | 4,175,155 | |
| | | | | | | | | | |
| | | | | | | | | 17,586,808 | |
| | | | | | | | | | |
Thrifts & Mortgage Finance - 5.5% | | | | | | | | | | |
First Niagara Financial Group, Inc. | | | | 296,000 | | | | | 3,907,200 | |
People’s United Financial, Inc. | | | | 345,000 | | | | | 4,636,800 | |
| | | | | | | | | | |
| | | | | | | | | 8,544,000 | |
| | | | | | | | | | |
Total Financials | | | | | | | | | 120,799,715 | |
| | | | | | | | | | |
Industrials - 3.0% | | | | | | | | | | |
Commercial Services & Supplies - 3.0% | | | | | | | | | | |
Edenred (France)2 | | | | 155,000 | | | | | 4,729,255 | |
| | | | | | | | | | |
Information Technology - 18.0% | | | | | | | | | | |
IT Services - 18.0% | | | | | | | | | | |
Cielo S.A. (Brazil) | | | | 148,000 | | | | | 3,670,009 | |
MasterCard, Inc. - Class A | | | | 24,700 | | | | | 7,443,098 | |
Redecard S.A. (Brazil) | | | | 240,000 | | | | | 3,598,501 | |
Visa, Inc. - Class A | | | | 85,100 | | | | | 7,170,526 | |
The Western Union Co. | | | | 305,000 | | | | | 6,109,150 | |
| | | | | | | | | | |
Total Information Technology | | | | | | | | | 27,991,284 | |
| | | | | | | | | | |
TOTAL COMMON STOCKS
(Identified Cost $147,471,729) | | | | | | | | | 153,520,254 | |
| | | | | | | | | | |
| | |
SHORT-TERM INVESTMENTS - 1.0% | | | | | | | | | | |
Dreyfus Cash Management, Inc. - Institutional Shares4, 0.10%
(Identified Cost $1,582,784) | | | | 1,582,784 | | | | | 1,582,784 | |
| | | | | | | | | | |
TOTAL INVESTMENTS - 99.8%
(Identified Cost $149,054,513) | | | | | | | | | 155,103,038 | |
OTHER ASSETS, LESS LIABILITIES - 0.2% | | | | | | | | | 269,895 | |
| | | | | | | | | | |
NET ASSETS - 100% | | | | | | | | $ | 155,372,933 | |
| | | | | | | | | | |
ADR - American Depository Receipt
| * | Non-income producing security |
| 1 | The Bank of New York Mellon Corp. is the Series’ custodian and serves as sub-accountant and sub-transfer agent to the Series. |
| 2 | Values were adjusted following the close of local trading using a factor from a third party vendor. |
| 3 | Latest quoted sales price is not available and the latest quoted bid price was used to value the security. |
| 4 | Rate shown is the current yield as of June 30, 2011. |
| | | | |
| 4 | | The accompanying notes are an integral part of the financial statements. | | |
Statement of Assets and Liabilities (unaudited)
June 30, 2011
| | | | | |
ASSETS: | | | | | |
Investments, at value (identified cost $149,054,513) (Note 2) | | | $ | 155,103,038 | |
Foreign currency, at value (cost $2,866) | | | | 2,907 | |
Cash | | | | 2,784,151 | |
Dividends receivable | | | | 249,092 | |
Foreign tax reclaims receivable | | | | 140,297 | |
Receivable for fund shares sold | | | | 137,769 | |
| | | | | |
| |
TOTAL ASSETS | | | | 158,417,254 | |
| | | | | |
| |
LIABILITIES: | | | | | |
| |
Accrued management fees (Note 3) | | | | 123,329 | |
Accrued fund accounting and administration fees (Note 3) | | | | 7,932 | |
Accrued transfer agent fees (Note 3) | | | | 3,424 | |
Accrued Chief Compliance Officer service fees (Note 3) | | | | 465 | |
Accrued directors’ fees (Note 3) | | | | 54 | |
Payable for securities purchased | | | | 2,784,152 | |
Payable for fund shares repurchased | | | | 79,463 | |
Other payables and accrued expenses | | | | 45,502 | |
| | | | | |
| |
TOTAL LIABILITIES | | | | 3,044,321 | |
| | | | | |
| |
TOTAL NET ASSETS | | | $ | 155,372,933 | |
| | | | | |
| |
NET ASSETS CONSIST OF: | | | | | |
| |
Capital stock | | | $ | 253,316 | |
Additional paid-in-capital | | | | 249,660,944 | |
Undistributed net investment income | | | | 1,687,032 | |
Accumulated net realized loss on investments, foreign currency and translation of other assets and liabilities | | | | (102,290,971 | ) |
Net unrealized appreciation on investments, foreign currency and translation of other assets and liabilities | | | | 6,062,612 | |
| | | | | |
| |
TOTAL NET ASSETS | | | $ | 155,372,933 | |
| | | | | |
NET ASSET VALUE, OFFERING PRICE AND REDEMPTION PRICE PER SHARE - Class A
($155,372,933/25,331,623 shares) | | | $ | 6.13 | |
| | | | | |
| | | | | | |
| | The accompanying notes are an integral part of the financial statements. | | | 5 | |
Statement of Operations (unaudited)
For the Six Months Ended June 30, 2011
| | | | | |
INVESTMENT INCOME: | | | | | |
| |
Dividends (net of foreign taxes withheld, $125,662) | | | $ | 2,491,464 | |
| | | | | |
| |
EXPENSES: | | | | | |
| |
Management fees (Note 3) | | | | 763,382 | |
Fund accounting and administration fees (Note 3) | | | | 22,964 | |
Transfer agent fees (Note 3) | | | | 8,227 | |
Directors’ fees (Note 3) | | | | 1,995 | |
Chief Compliance Officer service fees (Note 3) | | | | 1,314 | |
Custodian fees | | | | 9,866 | |
Miscellaneous | | | | 44,666 | |
| | | | | |
| |
Total Expenses | | | | 852,414 | |
| | | | | |
| |
NET INVESTMENT INCOME | | | | 1,639,050 | |
| | | | | |
| |
REALIZED AND UNREALIZED GAIN (LOSS) ON INVESTMENTS AND FOREIGN CURRENCY: | | | | | |
| |
Net realized gain (loss) on- | | | | | |
Investments | | | | 5,538,950 | |
Foreign currency and translation of other assets and liabilities | | | | (52,584 | ) |
| | | | | |
| |
| | | | 5,486,366 | |
| | | | | |
| |
Net change in unrealized appreciation on- | | | | | |
Investments | | | | 177,372 | |
Foreign currency and translation of other assets and liabilities | | | | 7,358 | |
| | | | | |
| |
| | | | 184,730 | |
| | | | | |
| |
NET REALIZED AND UNREALIZED GAIN ON INVESTMENTS AND FOREIGN CURRENCY | | | | 5,671,096 | |
| | | | | |
| |
NET INCREASE IN NET ASSETS RESULTING FROM OPERATIONS | | | $ | 7,310,146 | |
| | | | | |
| | | | |
| 6 | | The accompanying notes are an integral part of the financial statements. | | |
Statements of Changes in Net Assets
| | | | | | | | | | |
| | | For the Six
Months Ended
6/30/11
(unaudited) | | For the
Year Ended
12/31/10 |
INCREASE IN NET ASSETS: | | | | | | | | | | |
| | |
OPERATIONS: | | | | | | | | | | |
| | |
Net investment income | | | $ | 1,639,050 | | | | $ | 1,754,914 | |
Net realized gain on investments and foreign currency | | | | 5,486,366 | | | | | 2,647,027 | |
Net change in unrealized appreciation on investments and foreign currency | | | | 184,730 | | | | | 4,476,137 | |
| | | | | | | | | | |
| | |
Net increase from operations | | | | 7,310,146 | | | | | 8,878,078 | |
| | | | | | | | | | |
| | |
DISTRIBUTIONS TO SHAREHOLDERS (Note 9): | | | | | | | | | | |
| | |
From net investment income | | | | — | | | | | (1,786,293 | ) |
| | | | | | | | | | |
| | |
CAPITAL STOCK ISSUED AND REPURCHASED: | | | | | | | | | | |
| | |
Net increase from capital share transactions (Note 5) | | | | 3,883,335 | | | | | 6,672,693 | |
| | | | | | | | | | |
| | |
Net increase in net assets | | | | 11,193,481 | | | | | 13,764,478 | |
| | |
NET ASSETS: | | | | | | | | | | |
| | |
Beginning of period | | | | 144,179,452 | | | | | 130,414,974 | |
| | | | | | | | | | |
| | |
End of period (including undistributed net investment income of $1,687,032 and $47,982, respectively) | | | $ | 155,372,933 | | | | $ | 144,179,452 | |
| | | | | | | | | | |
| | | | | | |
| | The accompanying notes are an integral part of the financial statements. | | | 7 | |
Financial Highlights
| | | | | | | | | | | | | | | | | | | | | | | | | | | | | | |
| | | For the Six
Months Ended
6/30/11
(unaudited) | | | | | | | | | | |
| | | | | | | | | | | | |
| | | | For the Years Ended |
| | | | 12/31/10 | | 12/31/09 | | 12/31/08 | | 12/31/07 | | 12/31/06 |
Per share data (for a share outstanding throughout each period): | | | | | | | | | | | | | | | | | | | | | | | | | | | | | | |
Net asset value - Beginning of period.. | | | $ | 5.84 | | | | $ | 5.55 | | | | $ | 5.14 | | | | $ | 9.34 | | | | $ | 12.51 | | | | $ | 10.70 | |
| | | | | | | | | | | | | | | | | | | | | | | | | | | | | | |
Income (loss) from investment operations: | | | | | | | | | | | | | | | | | | | | | | | | | | | | | | |
Net investment income | | | | 0.06 | 1 | | | | 0.07 | 1 | | | | 0.10 | 1 | | | | 0.17 | | | | | 0.19 | | | | | 0.10 | |
Net realized and unrealized gain (loss) on investments | | | | 0.23 | | | | | 0.29 | | | | | 0.44 | | | | | (4.19 | ) | | | | (2.36 | ) | | | | 2.00 | |
| | | | | | | | | | | | | | | | | | | | | | | | | | | | | | |
Total from investment operations | | | | 0.29 | | | | | 0.36 | | | | | 0.54 | | | | | (4.02 | ) | | | | (2.17 | ) | | | | 2.10 | |
| | | | | | | | | | | | | | | | | | | | | | | | | | | | | | |
Less distributions to shareholders: | | | | | | | | | | | | | | | | | | | | | | | | | | | | | | |
From net investment income | | | | — | | | | | (0.07 | ) | | | | (0.13 | ) | | | | (0.18 | ) | | | | (0.18 | ) | | | | (0.11 | ) |
From net realized gain on investments | | | | — | | | | | — | | | | | — | | | | | — | | | | | (0.82 | ) | | | | (0.18 | ) |
| | | | | | | | | | | | | | | | | | | | | | | | | | | | | | |
Total distributions to shareholders | | | | — | | | | | (0.07 | ) | | | | (0.13 | ) | | | | (0.18 | ) | | | | (1.00 | ) | | | | (0.29 | ) |
| | | | | | | | | | | | | | | | | | | | | | | | | | | | | | |
Net asset value - End of period | | | $ | 6.13 | | | | $ | 5.84 | | | | $ | 5.55 | | | | $ | 5.14 | | | | $ | 9.34 | | | | $ | 12.51 | |
| | | | | | | | | | | | | | | | | | | | | | | | | | | | | | |
Net assets - End of period (000’s omitted) | | | $ | 155,373 | | | | $ | 144,179 | | | | $ | 130,415 | | | | $ | 129,369 | | | | $ | 220,097 | | | | $ | 132,855 | |
| | | | | | | | | | | | | | | | | | | | | | | | | | | | | | |
Total return2 | | | | 4.97 | % | | | | 6.56 | % | | | | 10.54 | % | | | | (42.98 | %) | | | | (17.46 | %) | | | | 19.62 | % |
Ratios (to average net assets)/ Supplemental Data: | | | | | | | | | | | | | | | | | | | | | | | | | | | | | | |
Expenses* | | | | 1.12 | %3 | | | | 1.14 | % | | | | 1.14 | % | | | | 1.12 | % | | | | 1.15 | % | | | | 1.18 | % |
Net investment income | | | | 2.15 | %3 | | | | 1.31 | % | | | | 2.01 | % | | | | 2.34 | % | | | | 1.72 | % | | | | 1.14 | % |
Portfolio turnover | | | | 28 | % | | | | 49 | % | | | | 98 | % | | | | 41 | % | | | | 38 | % | | | | 30 | % |
|
* The investment advisor did not impose all or a portion of its management fees, CCO fees and fund accounting and transfer agent fees, and other fees in some periods and in some periods paid a portion of the Series’ expenses. If these expenses had been incurred by the Series, the expense ratio (to average net assets) would have been increased by the following amount: | |
| | | | N/A | | | | | 0.00 | %4 | | | | 0.00 | %4 | | | | N/A | | | | | N/A | | | | | N/A | |
| 1 | Calculated based on average shares outstanding during the periods. |
| 2 | Represents aggregate total return for the periods indicated, and assumes reinvestment of all distributions. Total return would have been lower had certain expenses not been waived or reimbursed during certain periods. Periods less than one year are not annualized. |
| | | | |
| 8 | | The accompanying notes are an integral part of the financial statements. | | |
Notes to Financial Statements (unaudited)
Financial Services Series (the “Series”) is a no-load diversified series of Manning & Napier Fund, Inc. (the “Fund”).
The Fund is organized in Maryland and is registered under the Investment Company Act of 1940, as amended, as an open-end management investment company.
The Series’ investment objective is to provide long-term growth by investing principally in the common stocks of companies in the financial services industry.
The Fund’s Advisor is Manning & Napier Advisors, Inc. (the “Advisor”). Shares of the Series are offered to investors, clients and employees of the Advisor and its affiliates. The total authorized capital stock of the Fund consists of 10.0 billion shares of common stock each having a par value of $0.01. As of June 30, 2011, 6.4 billion shares have been designated in total among 31 series, of which 100 million have been designated as Financial Services Series Class A common stock.
| 2. | SIGNIFICANT ACCOUNTING POLICIES |
Security Valuation
Portfolio securities, including domestic equities, foreign equities, warrants and options, listed on an exchange other than the NASDAQ National Market System are valued at the latest quoted sales price of the exchange on which the security is primarily traded. Securities not traded on valuation date or securities not listed on an exchange are valued at the latest quoted bid price provided by the Fund’s pricing service. Securities listed on the NASDAQ National Market System are valued in accordance with the NASDAQ Official Closing Price.
Short-term investments that mature in sixty days or less are valued at amortized cost, which approximates market value. Investments in open-end investment companies are valued at their net asset value per share on valuation date.
Volume and level of activity in established markets for an asset or liability are evaluated to determine whether recent transactions and quoted prices are determinative of fair value. Where there have been significant decreases in volume and level of activity, further analysis and adjustment may be necessary to estimate fair value. The Series measures fair value in these instances by the use of inputs and valuation techniques which may be based upon current market prices of securities that are comparable in coupon, rating, maturity and industry and/or expectation of future cash flows. As a result of trading in relatively thin markets and/or markets that experience significant volatility, the prices used by the Series to value these securities may differ from the value that would be realized if these securities were sold, and the differences could be material.
Securities for which representative valuations or prices are not available from the Fund’s pricing service may be valued at fair value. Due to the inherent uncertainty of valuations of such securities, the fair value may differ significantly from the values that would have been used had a ready market for such securities existed. If trading or events occurring after the close of the principal market in which securities are traded are expected to materially affect the value of those securities, then they may be valued at their fair value, taking this trading or these events into account. Fair value is determined in good faith by the Advisor under procedures approved by and under the general supervision and responsibility of the Fund’s Board of Directors (the “Board”). In accordance with the procedures approved by the Board, certain securities trading outside the U.S. whose values were adjusted following the close of local trading use a factor from a third party vendor to the extent available. The value of securities used for net asset value calculation under these procedures may differ from published prices for the same securities. It is the Fund’s policy to classify each foreign equity security where a factor from a third party vendor is provided as a Level 2 security.
Various inputs are used in determining the value of the Series’ assets or liabilities carried at market value. These inputs are summarized in three broad levels. Level 1 includes quoted prices in active markets for identical assets and liabilities. Level 2 includes other significant observable inputs (including quoted prices for similar securities,
Notes to Financial Statements (unaudited)
| 2. | SIGNIFICANT ACCOUNTING POLICIES (continued) |
Security Valuation (continued)
interest rates, prepayment speeds, credit risk, etc.). Level 3 includes significant unobservable inputs (including the Series’ own assumptions in determining the fair value of investments). The inputs or methodology used for valuing securities are not necessarily an indication of the risk associated with investing in those securities.
The following is a summary of the valuation levels used for major security types as of June 30, 2011 in valuing the Series’ assets or liabilities carried at market value:
| | | | | | | | | | | | | | | | | | | | |
Description | | Total | | Level 1 | | Level 2 | | Level 3 |
Assets: | | | | | | | | | | | | | | | | | | | | |
Equity securities*: | | | | | | | | | | | | | | | | | | | | |
Financials | | | $ | 120,799,715 | | | | $ | 94,306,101 | | | | $ | 26,493,614 | | | | $ | — | |
Industrials | | | | 4,729,255 | | | | | — | | | | | 4,729,255 | | | | | — | |
Information Technology | | | | 27,991,284 | | | | | 27,991,284 | | | | | — | | | | | — | |
Preferred securities | | | | — | | | | | — | | | | | — | | | | | — | |
Debt securities | | | | — | | | | | — | | | | | — | | | | | — | |
Mutual funds | | | | 1,582,784 | | | | | 1,582,784 | | | | | — | | | | | — | |
Other financial instruments** | | | | — | | | | | — | | | | | — | | | | | — | |
| | | | | | | | | | | | | | | | | | | | |
Total assets | | | | 155,103,038 | | | | | 123,880,169 | | | | | 31,222,869 | | | | | — | |
| | | | | | | | | | | | | | | | | | | | |
Liabilities: | | | | | | | | | | | | | | | | | | | | |
Other financial instruments** | | | | — | | | | | — | | | | | — | | | | | — | |
| | | | | | | | | | | | | | | | | | | | |
Total liabilities | | | | — | | | | | — | | | | | — | | | | | — | |
| | | | | | | | | | | | | | | | | | | | |
Total | | | $ | 155,103,038 | | | | $ | 123,880,169 | | | | $ | 31,222,869 | | | | $ | — | |
| | | | | | | | | | | | | | | | | | | | |
| * | Includes common stock, warrants and rights. Please see the Investment Portfolio for securities where a latest quoted sales price is not available and the latest quoted bid price was used to value the security or foreign securities where values were adjusted following the close of local trading using a factor from a third party vendor. Such securities are included in Level 2 in the table above. |
| ** | Other financial instruments are derivative instruments not reflected in the Investment Portfolio, such as futures, forwards and swap contracts, which are valued at the unrealized appreciation/depreciation on the instrument. As of June 30, 2011, the Series did not hold any derivative instruments. |
| | There were no Level 3 securities held by the Series as of December 31, 2010 or June 30, 2011. |
| | The Fund’s policy is to recognize transfers in and transfers out of the valuation levels as of the beginning of the reporting period. There were no significant transfers between Level 1 and Level 2 during the six months ended June 30, 2011. |
Recent Accounting Standard
In May 2011, the Financial Accounting Standards Board issued amended guidance to improve disclosure about fair value measurements which will require the following disclosures for fair value measurements categorized as Level 3: quantitative information about the unobservable inputs and assumptions used in the fair value measurement, a description of the valuation policies and procedures and a narrative description of the sensitivity of the fair value measurement to changes in unobservable inputs and the interrelationships between those unobservable inputs. In addition, the amounts and reasons for all transfers in and out of Level 1 and Level 2 will be required to be disclosed. The amended guidance is effective for financial statements for fiscal years beginning after December 15, 2011, and
Notes to Financial Statements (unaudited)
| 2. | SIGNIFICANT ACCOUNTING POLICIES (continued) |
Recent Accounting Standard (continued)
interim periods within those fiscal years. Management is evaluating the impact of this guidance on the Series’ financial statements and disclosures.
Security Transactions, Investment Income and Expenses
Security transactions are accounted for on trade date. Dividend income is recorded on the ex-dividend date, except that if the ex-dividend date has passed, certain dividends from foreign securities are recorded as soon as the Fund is informed of the ex-dividend date. Non-cash dividends, if any, are recorded at the fair market value of the securities received. Interest income, including amortization of premium and accretion of discounts using the effective interest method, is earned from settlement date and accrued daily.
Expenses are recorded on an accrual basis. Most expenses of the Fund can be attributed to a specific series. Expenses which cannot be directly attributed are apportioned among the series in the Fund in such a manner as deemed equitable by the Fund’s Board, taking into consideration, among other things, the nature and type of expense.
The Series uses the identified cost method for determining realized gain or loss on investments for both financial statement and federal income tax reporting purposes.
Foreign Currency Translation
The books and records of the Series are maintained in U.S. dollars. Foreign currencies, investments and other assets and liabilities are translated into U.S. dollars at the current exchange rates. Purchases and sales of investment securities and income and expenses are translated on the respective dates of such transactions. The Series does not isolate realized and unrealized gains and losses attributable to changes in the exchange rates from gains and losses that arise from changes in the market value of investments. Such fluctuations are included with net realized and unrealized gain or loss on investments. Net realized foreign currency gains and losses represent foreign currency gains and losses between trade date and settlement date on securities transactions, gains and losses on disposition of foreign currencies and the difference between the amount of income and foreign withholding taxes recorded on the books of the Series and the amounts actually received or paid.
Federal Taxes
The Series’ policy is to comply with the provisions of the Internal Revenue Code applicable to regulated investment companies. The Series is not subject to federal income tax or excise tax to the extent that the Series distributes to shareholders each year its taxable income, including any net realized gains on investments, in accordance with requirements of the Internal Revenue Code. Accordingly, no provision for federal income tax or excise tax has been made in the financial statements.
Management evaluates its tax positions to determine if the tax positions taken meet the minimum recognition threshold in connection with accounting for uncertainties in income tax positions taken or expected to be taken for the purposes of measuring and recognizing tax liabilities in the financial statements. Recognition of tax benefits of an uncertain tax position is required only when the position is “more likely than not” to be sustained assuming examination by taxing authorities. At June 30, 2011, the Series has recorded no liability for net unrecognized tax benefits relating to uncertain income tax positions taken or expected to be taken in future tax returns.
The Series files income tax returns in the U.S. federal jurisdiction, various states and foreign jurisdictions, as required. No income tax returns are currently under investigation. The statute of limitations on the Series’ tax returns remains open for the years ended December 31, 2007 through December 31, 2010. The Fund is not aware of any tax positions for which it is reasonably possible that the total amounts of unrecognized tax benefits will significantly change in the next twelve months.
Notes to Financial Statements (unaudited)
| 2. | SIGNIFICANT ACCOUNTING POLICIES (continued) |
Federal Taxes (continued)
Additionally, based on the Fund’s understanding of the tax rules and rates related to income, gains and transactions for foreign jurisdictions in which it invests, the Series will provide for foreign taxes, and where appropriate, deferred foreign tax.
Distributions of Income and Gains
Distributions to shareholders of net investment income and net realized gains are made annually. An additional distribution may be necessary to avoid taxation of the Series. Distributions are recorded on the ex-dividend date.
Indemnifications
The Fund’s organizational documents provide former and current directors and officers with a limited indemnification against liabilities arising in connection with the performance of their duties to the Fund. In the normal course of business, the Fund may also enter into contracts that provide general indemnifications. The Fund’s maximum exposure under these arrangements is unknown as this would be dependent on future claims that may be made against the Fund. The risk of material loss from such claims is considered remote.
Other
The preparation of financial statements in conformity with accounting principles generally accepted in the United States of America requires management to make estimates and assumptions that affect the reported amounts of assets and liabilities and the disclosure of contingent assets and liabilities at the date of the financial statements and the reported amounts of income and expenses during the reporting period. Actual results could differ from those estimates.
| 3. | TRANSACTIONS WITH AFFILIATES |
The Fund has an Investment Advisory Agreement (the “Agreement”) with the Advisor, for which the Series pays a fee, computed daily and payable monthly, at an annual rate of 1.00% of the Series’ average daily net assets.
Under the Agreement, personnel of the Advisor provide the Series with advice and assistance in the choice of investments and the execution of securities transactions, and otherwise maintain the Series’ organization. The Advisor also provides the Fund with necessary office space and fund administration and support services. The salaries of all officers of the Fund (except a percentage of the Fund’s Chief Compliance Officer’s salary, which is paid by the Fund), and of all Directors who are “affiliated persons” of the Fund, or of the Advisor, and all personnel of the Fund, or of the Advisor, performing services relating to research, statistical and investment activities, are paid by the Advisor. Each “non-affiliated” Director receives an annual stipend, which is allocated among all the active series of the Fund. In addition, these Directors also receive a fee per Board meeting attended plus a fee for each committee meeting attended.
The Advisor has contractually agreed, until at least April 30, 2012, to waive its fee and, if necessary, pay other operating expenses of the Series in order to maintain total direct annual fund operating expenses for the Series at no more than 1.20% of average daily net assets each year. The Advisor did not waive any fees for the six months ended June 30, 2011. The Advisor is not eligible to recoup any expenses that have been waived or reimbursed in prior years.
Manning & Napier Investor Services, Inc., a registered broker-dealer affiliate of the Advisor, acts as distributor for the Fund’s shares. The services of Manning & Napier Investor Services, Inc. are provided at no additional cost to the Series.
The Advisor has agreements with BNY Mellon Investment Servicing (U.S.) Inc. (“BNY”) under which BNY serves as sub-accountant services agent and sub-transfer agent. The Fund pays the Advisor an annual fee related to fund
Notes to Financial Statements (unaudited)
| 3. | TRANSACTIONS WITH AFFILIATES (continued) |
accounting and administration of 0.0175% on the first $3 billion of average daily net assets (excluding Target Series); 0.015% on the next $3 billion of average daily net assets (excluding Target Series); and 0.01% of the average daily net assets in excess of $6 billion (excluding Target Series); plus a base fee of $25,500 per Series. Transfer Agent fees are charged to the Fund on a per account basis. Additionally, certain transaction- and cusip-based fees and out-of-pocket expenses, including charges for reporting relating to the Fund’s compliance program, are charged.
Expenses not directly attributable to a Series are allocated based on each Series’ relative net assets or number of accounts, depending on the expense.
| 4. | PURCHASES AND SALES OF SECURITIES |
For the six months ended June 30, 2011, purchases and sales of securities, other than U.S. Government securities and short-term securities, were $53,077,002 and $41,442,301, respectively. There were no purchases or sales of U.S. Government securities.
| 5. | CAPITAL STOCK TRANSACTIONS |
Transactions in shares of Financial Services Series were:
| | | | | | | | | | | | | | | | | | | | |
| | | For the Six Months
Ended 6/30/11 | | For the Year
Ended 12/31/10 |
| | Shares | | Amount | | Shares | | Amount |
Sold | | | | 1,586,333 | | | | $ | 9,667,270 | | | | | 3,059,077 | | | | $ | 17,083,766 | |
Reinvested | | | | — | | | | | — | | | | | 298,746 | | | | | 1,727,732 | |
Repurchased | | | | (949,023 | ) | | | | (5,783,935 | ) | | | | (2,175,056 | ) | | | | (12,138,805 | ) |
| | | | | | | | | | | | | | | | | | | | |
Total | | | | 637,310 | | | | $ | 3,883,335 | | | | | 1,182,767 | | | | $ | 6,672,693 | |
| | | | | | | | | | | | | | | | | | | | |
Substantially all of the Series’ shares represent investments by fiduciary accounts over which the Advisor has sole investment discretion.
The Series may trade in instruments including written and purchased options, forward foreign currency exchange contracts and futures contracts and other derivatives in the normal course of investing activities to assist in managing exposure to various market risks. The Series may be subject to various elements of risk, which may involve, to a varying degree, elements of risk in excess of the amounts recognized for financial statement purposes. These risks include: the risk that changes in the value of a derivative may not correlate perfectly with the underlying asset, rate or index, counterparty credit risk related to over the counter derivatives’ counterparties failure to perform under contract terms, liquidity risk related to the lack of a liquid market for these contracts allowing the fund to close out its position(s) and documentation risk relating to disagreement over contract terms. No such investments were held by the Series during the six months ended June 30, 2011.
Investing in securities of foreign companies and foreign governments involves special risks and considerations not typically associated with investing in securities of domestic companies and the U.S. Government. These risks include revaluation of currencies and future adverse political and economic developments. Moreover, securities of foreign companies and foreign governments and their markets may be less liquid and their prices more volatile than those of comparable domestic companies and the U.S. Government.
Notes to Financial Statements (unaudited)
| 8. | FINANCIAL SERVICES SECURITIES |
The Series may focus its investments in certain related financial services industries; hence, the Series may subject itself to a greater degree of risk than a series that is more diversified.
| 9. | FEDERAL INCOME TAX INFORMATION |
The amount and characterization of certain income and capital gains to be distributed are determined in accordance with federal income tax regulations, which may differ from accounting principles generally accepted in the United States of America. The Series may periodically make reclassifications among its capital accounts to reflect income and gains available for distribution (or available capital loss carryovers) under income tax regulations, without impacting the Series’ net asset value. Any such reclassifications are not reflected in the financial highlights.
The final determination of the tax character of current year distributions will be made at the conclusion of the fiscal year. The tax character of distributions paid for the year ended December 31, 2010 was as follows:
| | | | | |
Ordinary income | | | $ | 1,786,293 | |
At December 31, 2010, the Series had a capital loss carryover of $107,605,337, available to the extent allowed by tax law to offset future net capital gain, if any, which will expire as follows:
| | | | |
Loss Carryover | | | Expiration Date |
| $ | 50,750,210 | | | December 31, 2016 |
| $ | 51,187,679 | | | December 31, 2017 |
| $ | 5,667,448 | | | December 31, 2018 |
Under the recently enacted Regulated Investment Company Modernization Act of 2010, capital losses incurred by the Funds after December 31, 2010 will not be subject to expiration. In addition, such losses must be used prior to the losses incurred in the years preceding enactment.
At June 30, 2011, the identified cost of investments for federal income tax purposes, the resulting gross unrealized appreciation and depreciation, and the net unrealized appreciation were as follows:
| | | | | |
Cost for federal income tax purposes | | | $ | 149,159,923 | |
Unrealized appreciation | | | $ | 12,057,548 | |
Unrealized depreciation | | | | (6,114,433 | ) |
| | | | | |
Net unrealized appreciation | | | $ | 5,943,115 | |
| | | | | |
Literature Requests (unaudited)
Proxy Voting Policies and Procedures
A description of the policies and procedures that the Fund uses to determine how to vote proxies relating to portfolio securities is available, without charge, upon request:
| | |
| By phone | | 1-800-466-3863 |
| On the Securities and Exchange Commission’s | | |
| (SEC) web site | | http://www.sec.gov |
Proxy Voting Record
Information regarding how the Fund voted proxies relating to portfolio securities during the most recent 12-month period ended June 30th is available, without charge, upon request:
| | |
| By phone | | 1-800-466-3863 |
| On the SEC’s web site | | http://www.sec.gov |
Quarterly Portfolio Holdings
The Series’ complete schedule of portfolio holdings for the 1st and 3rd quarters of each fiscal year are provided on Form N-Q, and are available, without charge, upon request:
| | |
| By phone | | 1-800-466-3863 |
| On the SEC’s web site | | http://www.sec.gov |
The Series’ Form N-Q may be reviewed and copied at the SEC’s Public Reference Room in Washington, D.C. Information on the operation of the Public Reference Room may be obtained by calling 1-800-SEC-0330.
Prospectus and Statement of Additional Information (SAI)
The prospectus and SAI provide additional information about each Series, including charges, expenses and risks. These documents are available, without charge, upon request:
| | |
| By phone | | 1-800-466-3863 |
| On the SEC’s web site | | http://www.sec.gov |
| On our web site | | http://www.manning-napier.com |
Additional information available at www.manning-napier.com
1. Fund Holdings - Month-End
2. Fund Holdings - Quarter-End
3. Shareholder Report - Annual
4. Shareholder Report - Semi-Annual
The Fund also offers electronic notification or “e-delivery” when certain documents are available on-line to be downloaded or reviewed. Direct shareholders can elect to receive electronic notification when shareholder reports, prospectus updates, and / or quarterly statements are available. If you do not currently have on-line access to your account, you can establish access by going to www.manning-napier.com, click on “Login” in the top corner of the page, and follow the prompts to self-enroll. Once enrolled, you can set your electronic notification preferences by clicking on the Account Options tab located within the green toolbar and then select E-Delivery Option. Should you have any questions on either how to establish on-line access or how to update your account settings, please do not hesitate to contact Investor Services at 1-800-466-3863.
MNFNS-6/11-SAR


Shareholder Expense Example (unaudited)
As a shareholder of the Series, you may incur two types of costs: (1) transaction costs and (2) ongoing costs, including management fees and other Series expenses. This example is intended to help you understand your ongoing costs (in dollars) of investing in the Series and to compare these costs with the ongoing costs of investing in other mutual funds.
The example is based on an investment of $1,000 invested at the beginning of the period and held for the entire period (January 1, 2011 to June 30, 2011).
Actual Expenses
The first line of the table below provides information about actual account values and actual expenses. You may use the information in this line, together with the amount you invested, to estimate the expenses that you paid over the period. Simply divide your account value by $1,000 (for example, an $8,600 account value divided by $1,000 = 8.6), then multiply the result by the number in the first line under the heading entitled “Expenses Paid During Period” to estimate the expenses you paid on your account during this period.
Hypothetical Example for Comparison Purposes
The second line of the table below provides information about hypothetical account values and hypothetical expenses based on the Series’ actual expense ratio and an assumed rate of return of 5% per year before expenses, which is not the Series’ actual return. The hypothetical account values and expenses may not be used to estimate the actual ending account balance or expenses you paid during the period. You may use this information to compare the ongoing costs of investing in the Series and other funds. To do so, compare this 5% hypothetical example with the 5% hypothetical examples that appear in the shareholder reports of the other funds.
Please note that the expenses shown in the table are meant to highlight your ongoing costs only and do not reflect any transaction costs. Therefore, the second line of the table is useful in comparing ongoing costs only, and will not help you determine the relative total costs of owning different funds. In addition, if these transaction costs were included, your costs would have been higher.
| | | | | | | | | | | | | | | |
| | | Beginning
Account Value
1/1/11 | | Ending
Account Value
6/30/11 | | Expenses Paid
During Period*
1/1/11-6/30/11 |
Actual | | | $ | 1,000.00 | | | | $ | 1,079.50 | | | | $ | 6.08 | |
Hypothetical
(5% return before expenses) | | | $ | 1,000.00 | | | | $ | 1,018.94 | | | | $ | 5.91 | |
| * | Expenses are equal to the Series’ annualized expense ratio (for the six-month period) of 1.18%, multiplied by the average account value over the period, multiplied by 181/365 (to reflect the one-half year period). Expenses are based on the most recent fiscal half year. |
Portfolio Composition
As of June 30, 2011 (unaudited)
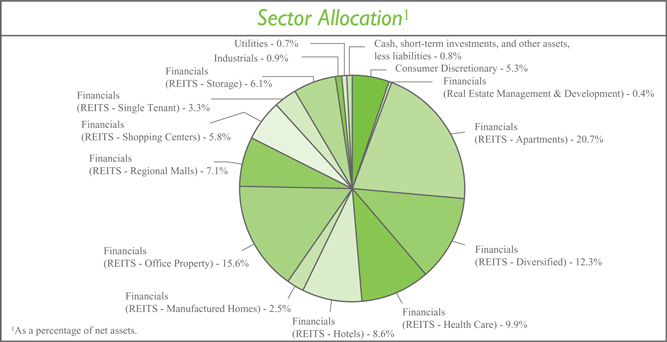
Top Ten Stock Holdings2
| | | | | |
Simon Property Group, Inc. | | | | 5.1 | % |
BioMed Realty Trust, Inc. | | | | 5.0 | % |
Digital Realty Trust, Inc. | | | | 5.0 | % |
Boston Properties, Inc. | | | | 3.5 | % |
DuPont Fabros Technology, Inc. | | | | 3.2 | % |
| 2 | As a percentage of total investments. |
| | | | | |
Host Hotels & Resorts, Inc. | | | | 3.2 | % |
Health Care REIT, Inc. | | | | 3.1 | % |
Corporate Office Properties Trust | | | | 3.1 | % |
Sovran Self Storage, Inc. | | | | 3.0 | % |
Alexandria Real Estate Equities, Inc. | | | | 2.9 | % |
Investment Portfolio - June 30, 2011 (unaudited)
| | | | | | | | | | |
| | | Shares | | Value
(Note 2) |
| | |
COMMON STOCKS - 99.2% | | | | | | | | | | |
| | |
Consumer Discretionary - 5.3% | | | | | | | | | | |
Hotels, Restaurants & Leisure - 3.3% | | | | | | | | | | |
7 Days Group Holdings Ltd. - ADR (Cayman Islands)* | | | | 23,600 | | | | $ | 456,188 | |
Accor S.A. (France)1 | | | | 23,000 | | | | | 1,028,969 | |
Hyatt Hotels Corp. - Class A* | | | | 19,840 | | | | | 809,869 | |
Intercontinental Hotels Group plc (United Kingdom)1 | | | | 45,900 | | | | | 939,613 | |
| | | | | | | | | | |
| | | | | | | | | 3,234,639 | |
| | | | | | | | | | |
Household Durables - 2.0% | | | | | | | | | | |
DR Horton, Inc. | | | | 36,500 | | | | | 420,480 | |
Lennar Corp. - Class A | | | | 30,000 | | | | | 544,500 | |
NVR, Inc.* | | | | 666 | | | | | 483,170 | |
Toll Brothers, Inc.* | | | | 22,800 | | | | | 472,872 | |
| | | | | | | | | | |
| | | | | | | | | 1,921,022 | |
| | | | | | | | | | |
Total Consumer Discretionary | | | | | | | | | 5,155,661 | |
| | | | | | | | | | |
Financials - 92.3% | | | | | | | | | | |
Real Estate Management & Development - 0.4% | | | | | | | | | | |
Thomas Properties Group, Inc.* | | | | 122,000 | | | | | 391,620 | |
| | | | | | | | | | |
REITS - Apartments - 20.7% | | | | | | | | | | |
American Campus Communities, Inc. | | | | 73,210 | | | | | 2,600,419 | |
Apartment Investment & Management Co. - Class A | | | | 98,000 | | | | | 2,501,940 | |
Associated Estates Realty Corp. | | | | 57,000 | | | | | 926,250 | |
AvalonBay Communities, Inc. | | | | 19,100 | | | | | 2,452,440 | |
Camden Property Trust | | | | 38,710 | | | | | 2,462,730 | |
Education Realty Trust, Inc. | | | | 60,000 | | | | | 514,200 | |
Equity Residential | | | | 41,000 | | | | | 2,460,000 | |
Home Properties, Inc. | | | | 41,440 | | | | | 2,522,867 | |
Mid-America Apartment Communities, Inc. | | | | 20,430 | | | | | 1,378,412 | |
UDR, Inc. | | | | 100,000 | | | | | 2,455,000 | |
| | | | | | | | | | |
| | | | | | | | | 20,274,258 | |
| | | | | | | | | | |
REITS - Diversified - 12.3% | | | | | | | | | | |
British Land Co. plc (United Kingdom)1 | | | | 108,000 | | | | | 1,055,927 | |
Coresite Realty Corp. | | | | 63,000 | | | | | 1,033,200 | |
Digital Realty Trust, Inc. | | | | 79,200 | | | | | 4,892,976 | |
DuPont Fabros Technology, Inc. | | | | 123,000 | | | | | 3,099,600 | |
Land Securities Group plc (United Kingdom)1 | | | | 77,000 | | | | | 1,053,367 | |
Morguard Real Estate Investment Trust (Canada) | | | | 58,690 | | | | | 941,401 | |
| | | | | | | | | | |
| | | | | | | | | 12,076,471 | |
| | | | | | | | | | |
REITS - Health Care - 9.9% | | | | | | | | | | |
Cogdell Spencer, Inc. | | | | 332,520 | | | | | 1,991,795 | |
HCP, Inc. | | | | 70,790 | | | | | 2,597,285 | |
Health Care REIT, Inc. | | | | 57,680 | | | | | 3,024,162 | |
| | | | | | |
| | The accompanying notes are an integral part of the financial statements. | | | 3 | |
Investment Portfolio - June 30, 2011 (unaudited)
| | | | | | | | | | |
| | | Shares | | Value
(Note 2) |
| | |
COMMON STOCKS (continued) | | | | | | | | | | |
| | |
Financials (continued) | | | | | | | | | | |
REITS - Health Care (continued) | | | | | | | | | | |
Healthcare Realty Trust, Inc. | | | | 55,580 | | | | $ | 1,146,616 | |
LTC Properties, Inc. | | | | 33,600 | | | | | 934,752 | |
| | | | | | | | | | |
| | | | | | | | | 9,694,610 | |
| | | | | | | | | | |
REITS - Hotels - 8.6% | | | | | | | | | | |
DiamondRock Hospitality Co. | | | | 79,410 | | | | | 852,069 | |
Host Hotels & Resorts, Inc. | | | | 182,030 | | | | | 3,085,410 | |
LaSalle Hotel Properties | | | | 33,890 | | | | | 892,663 | |
Pebblebrook Hotel Trust | | | | 138,000 | | | | | 2,786,220 | |
Sunstone Hotel Investors, Inc.* | | | | 86,800 | | | | | 804,636 | |
| | | | | | | | | | |
| | | | | | | | | 8,420,998 | |
| | | | | | | | | | |
REITS - Manufactured Homes - 2.5% | | | | | | | | | | |
Equity Lifestyle Properties, Inc. | | | | 39,030 | | | | | 2,437,033 | |
| | | | | | | | | | |
REITS - Office Property - 15.6% | | | | | | | | | | |
Alexandria Real Estate Equities, Inc. | | | | 36,420 | | | | | 2,819,636 | |
BioMed Realty Trust, Inc. | | | | 255,740 | | | | | 4,920,438 | |
Boston Properties, Inc. | | | | 32,120 | | | | | 3,409,859 | |
Corporate Office Properties Trust | | | | 96,740 | | | | | 3,009,581 | |
Mack-Cali Realty Corp. | | | | 33,400 | | | | | 1,100,196 | |
| | | | | | | | | | |
| | | | | | | | | 15,259,710 | |
| | | | | | | | | | |
REITS - Regional Malls - 7.1% | | | | | | | | | | |
General Growth Properties, Inc. | | | | 120,370 | | | | | 2,008,975 | |
Simon Property Group, Inc. | | | | 43,000 | | | | | 4,997,890 | |
| | | | | | | | | | |
| | | | | | | | | 7,006,865 | |
| | | | | | | | | | |
REITS - Shopping Centers - 5.8% | | | | | | | | | | |
Cedar Shopping Centers, Inc. | | | | 362,700 | | | | | 1,867,905 | |
Equity One, Inc. | | | | 43,000 | | | | | 801,520 | |
Kimco Realty Corp. | | | | 107,610 | | | | | 2,005,850 | |
Tanger Factory Outlet Centers | | | | 37,170 | | | | | 995,041 | |
| | | | | | | | | | |
| | | | | | | | | 5,670,316 | |
| | | | | | | | | | |
REITS - Single Tenant - 3.3% | | | | | | | | | | |
National Retail Properties, Inc. | | | | 65,070 | | | | | 1,594,866 | |
Realty Income Corp. | | | | 50,630 | | | | | 1,695,599 | |
| | | | | | | | | | |
| | | | | | | | | 3,290,465 | |
| | | | | | | | | | |
REITS - Storage - 6.1% | | | | | | | | | | |
Public Storage | | | | 24,700 | | | | | 2,816,047 | |
Sovran Self Storage, Inc. | | | | 70,800 | | | | | 2,902,800 | |
| | | | |
| 4 | | The accompanying notes are an integral part of the financial statements. | | |
Investment Portfolio - June 30, 2011 (unaudited)
| | | | | | | | | | |
| | | Shares | | Value
(Note 2) |
| | |
COMMON STOCKS (continued) | | | | | | | | | | |
| | |
Financials (continued) | | | | | | | | | | |
REITS - Storage (continued) | | | | | | | | | | |
U-Store-It Trust | | | | 21,300 | | | | $ | 224,076 | |
| | | | | | | | | | |
| | | | | | | | | 5,942,923 | |
| | | | | | | | | | |
Total Financials | | | | | | | | | 90,465,269 | |
| | | | | | | | | | |
Industrials - 0.9% | | | | | | | | | | |
Transportation Infrastructure - 0.9% | | | | | | | | | | |
Groupe Eurotunnel S.A. (France)1 | | | | 83,000 | | | | | 928,768 | |
| | | | | | | | | | |
Utilities - 0.7% | | | | | | | | | | |
Electric Utilities - 0.7% | | | | | | | | | | |
AET&D Holdings No. 1 Ltd. (Australia)2 | | | | 125,000 | | | | | — | |
Brookfield Infrastructure Partners LP - ADR (Bermuda) | | | | 28,700 | | | | | 718,935 | |
| | | | | | | | | | |
Total Utilities | | | | | | | | | 718,935 | |
| | | | | | | | | | |
TOTAL COMMON STOCKS
(Identified Cost $78,941,412) | | | | | | | | | 97,268,633 | |
| | | | | | | | | | |
| | |
SHORT-TERM INVESTMENTS - 0.4% | | | | | | | | | | |
Dreyfus Cash Management, Inc. - Institutional Shares3 , 0.10%
(Identified Cost $404,946) | | | | 404,946 | | | | | 404,946 | |
| | | | | | | | | | |
| | |
TOTAL INVESTMENTS - 99.6%
(Identified Cost $79,346,358) | | | | | | | | | 97,673,579 | |
OTHER ASSETS, LESS LIABILITIES - 0.4% | | | | | | | | | 351,566 | |
| | | | | | | | | | |
NET ASSETS - 100% | | | | | | | | $ | 98,025,145 | |
| | | | | | | | | | |
No. - Number
REITS - Real Estate Investment Trusts
| * | Non-income producing security |
| 1 | Values were adjusted following the close of local trading using a factor from a third party vendor. |
| 2 | Security has been valued at fair value (see Note 2 to the financial statements). |
| 3 | Rate shown is the current yield as of June 30, 2011. |
| | | | | | |
| | The accompanying notes are an integral part of the financial statements. | | | 5 | |
Statement of Assets and Liabilities (unaudited)
June 30, 2011
| | | | | |
ASSETS: | | | | | |
Investments, at value (identified cost $79,346,358) (Note 2) | | | $ | 97,673,579 | |
Foreign currency, at value (cost $493) | | | | 482 | |
Receivable for securities sold | | | | 424,708 | |
Dividends receivable | | | | 287,831 | |
Receivable for fund shares sold | | | | 72,316 | |
Foreign tax reclaims receivable | | | | 2,005 | |
| | | | | |
| |
TOTAL ASSETS | | | | 98,460,921 | |
| | | | | |
| |
LIABILITIES: | | | | | |
| |
Accrued management fees (Note 3) | | | | 79,570 | |
Accrued fund accounting and administration fees (Note 3) | | | | 6,044 | |
Accrued transfer agent fees (Note 3) | | | | 2,821 | |
Accrued Chief Compliance Officer service fees (Note 3) | | | | 464 | |
Payable for securities purchased | | | | 224,823 | |
Payable for fund shares repurchased | | | | 77,839 | |
Audit fees payable | | | | 24,133 | |
Other payables and accrued expenses | | | | 20,082 | |
| | | | | |
| |
TOTAL LIABILITIES | | | | 435,776 | |
| | | | | |
| |
TOTAL NET ASSETS | | | $ | 98,025,145 | |
| | | | | |
| |
NET ASSETS CONSIST OF: | | | | | |
| |
Capital stock | | | $ | 72,191 | |
Additional paid-in-capital | | | | 73,580,599 | |
Undistributed net investment income | | | | 1,020,697 | |
Accumulated net realized gain on investments, foreign currency and translation of other assets and liabilities | | | | 5,024,397 | |
Net unrealized appreciation on investments, foreign currency and translation of other assets and liabilities | | | | 18,327,261 | |
| | | | | |
| |
TOTAL NET ASSETS | | | $ | 98,025,145 | |
| | | | | |
| |
NET ASSET VALUE, OFFERING PRICE AND REDEMPTION PRICE PER SHARE - Class A ($98,025,145/7,219,107 shares) | | | $ | 13.58 | |
| | | | | |
| | | | |
| 6 | | The accompanying notes are an integral part of the financial statements. | | |
Statement of Operations (unaudited)
For the Six Months Ended June 30, 2011
| | | | | |
INVESTMENT INCOME: | | | | | |
| |
Dividends (net of foreign taxes withheld, $13,855) | | | $ | 1,585,575 | |
| | | | | |
| |
EXPENSES: | | | | | |
| |
Management fees (Note 3) | | | | 471,648 | |
Fund accounting and administration fees (Note 3) | | | | 19,383 | |
Transfer agent fees (Note 3) | | | | 7,229 | |
Directors’ fees (Note 3) | | | | 3,821 | |
Chief Compliance Officer service fees (Note 3) | | | | 1,316 | |
Custodian fees | | | | 3,610 | |
Miscellaneous | | | | 51,193 | |
| | | | | |
| |
Total Expenses | | | | 558,200 | |
| | | | | |
| |
NET INVESTMENT INCOME | | | | 1,027,375 | |
| | | | | |
| |
REALIZED AND UNREALIZED GAIN (LOSS) ON INVESTMENTS AND FOREIGN CURRENCY: | | | | | |
| |
Net realized gain on- | | | | | |
Investments | | | | 3,654,280 | |
Foreign currency and translation of other assets and liabilities | | | | 512 | |
| | | | | |
| |
| | | | 3,654,792 | |
| | | | | |
| |
Net change in unrealized appreciation (depreciation) on- | | | | | |
Investments | | | | 2,558,433 | |
Foreign currency and translation of other assets and liabilities | | | | (63 | ) |
| | | | | |
| |
| | | | 2,558,370 | |
| | | | | |
| |
NET REALIZED AND UNREALIZED GAIN ON INVESTMENTS AND FOREIGN CURRENCY | | | | 6,213,162 | |
| | | | | |
| |
NET INCREASE IN NET ASSETS RESULTING FROM OPERATIONS | | | $ | 7,240,537 | |
| | | | | |
| | | | | | |
| | The accompanying notes are an integral part of the financial statements. | | | 7 | |
Statements of Changes in Net Assets
| | | | | | | | | | |
| | | For the Six
Months Ended
6/30/11
(unaudited) | | For the
Year Ended
12/31/10 |
INCREASE (DECREASE) IN NET ASSETS: | | | | | | | | | | |
| | |
OPERATIONS: | | | | | | | | | | |
| | |
Net investment income | | | $ | 1,027,375 | | | | $ | 813,285 | |
Net realized gain on investments and foreign currency | | | | 3,654,792 | | | | | 4,455,514 | |
Net change in unrealized appreciation on investments and foreign currency | | | | 2,558,370 | | | | | 12,074,302 | |
| | | | | | | | | | |
| | |
Net increase from operations | | | | 7,240,537 | | | | | 17,343,101 | |
| | | | | | | | | | |
| | |
DISTRIBUTIONS TO SHAREHOLDERS (Note 9): | | | | | | | | | | |
| | |
From net investment income | | | | — | | | | | (842,827 | ) |
From net realized gain on investments | | | | — | | | | | (3,149,000 | ) |
| | | | | | | | | | |
| | |
Total distributions to shareholders | | | | — | | | | | (3,991,827 | ) |
| | | | | | | | | | |
| | |
CAPITAL STOCK ISSUED AND REPURCHASED: | | | | | | | | | | |
| | |
Net increase from capital share transactions (Note 5) | | | | 1,648,633 | | | | | 6,606,115 | |
| | | | | | | | | | |
| | |
Net increase in net assets | | | | 8,889,170 | | | | | 19,957,389 | |
| | |
NET ASSETS: | | | | | | | | | | |
| | |
Beginning of period | | | | 89,135,975 | | | | | 69,178,586 | |
| | | | | | | | | | |
| | |
End of period (including undistributed net investment income of $1,020,697 and distributions in excess of net investment income of $6,678, respectively) | | | $ | 98,025,145 | | | | $ | 89,135,975 | |
| | | | | | | | | | |
| | | | |
| 8 | | The accompanying notes are an integral part of the financial statements. | | |
Financial Highlights
| | | | | | | | | | | | | | | |
| | | For the Six
Months Ended
6/30/11
(unaudited) | | For the
Year Ended
12/31/10 | | For the Period
11/10/091 to
12/31/09 |
Per share data (for a share outstanding throughout each period): | | | | | | | | | | | | | | | |
Net asset value - Beginning of period | | | $ | 12.58 | | | | $ | 10.61 | | | | $ | 10.00 | |
| | | | | | | | | | | | | | | |
Income from investment operations: | | | | | | | | | | | | | | | |
Net investment income2 | | | | 0.14 | | | | | 0.12 | | | | | 0.02 | |
Net realized and unrealized gain on investments | | | | 0.86 | | | | | 2.44 | | | | | 0.62 | |
| | | | | | | | | | | | | | | |
Total from investment operations | | | | 1.00 | | | | | 2.56 | | | | | 0.64 | |
| | | | | | | | | | | | | | | |
Less distributions to shareholders: | | | | | | | | | | | | | | | |
From net investment income | | | | — | | | | | (0.12 | ) | | | | (0.02 | ) |
From net realized gain on investments | | | | — | | | | | (0.47 | ) | | | | (0.01 | ) |
| | | | | | | | | | | | | | | |
Total distributions to shareholders | | | | — | | | | | (0.59 | ) | | | | (0.03 | ) |
| | | | | | | | | | | | | | | |
Net asset value - End of period | | | $ | 13.58 | | | | $ | 12.58 | | | | $ | 10.61 | |
| | | | | | | | | | | | | | | |
Net assets - End of period (000’s omitted) | | | $ | 98,025 | | | | $ | 89,136 | | | | $ | 69,179 | |
| | | | | | | | | | | | | | | |
Total return3 | | | | 7.95 | % | | | | 24.40 | % | | | | 6.36 | % |
Ratios (to average net assets)/Supplemental Data: | | | | | | | | | | | | | | | |
Expenses* | | | | 1.18 | %4 | | | | 1.20 | % | | | | 1.20 | %4 |
Net investment income | | | | 2.18 | %4 | | | | 1.02 | % | | | | 1.43 | %4 |
Portfolio turnover | | | | 13 | % | | | | 34 | % | | | | 3 | % |
|
* The investment advisor did not impose all or a portion of its management fees, and other fees in some periods and in some periods paid a portion of the Series’ expenses. If these expenses had been incurred by the Series, the expense ratio (to average net assets) would have been increased by the following amount: | |
| | | | N/A | | | | | 0.01 | % | | | | 0.38 | %4 |
| 1 | Commencement of operations. |
| 2 | Calculated based on average shares outstanding during the periods. |
| 3 | Represents aggregate total return for the periods indicated, and assumes reinvestment of all distributions. Total return would have been lower had certain expenses not been waived or reimbursed during certain periods. Periods less than one year are not annualized. |
| | | | | | |
| | The accompanying notes are an integral part of the financial statements. | | | 9 | |
Notes to Financial Statements (unaudited)
Real Estate Series (the “Series”) is a no-load non-diversified series of Manning & Napier Fund, Inc. (the “Fund”). The Fund is organized in Maryland and is registered under the Investment Company Act of 1940, as amended, as an open-end management investment company.
The Series’ investment objective is to provide long-term growth by investing principally in the common stocks of companies in real estate-based industries.
The Fund’s Advisor is Manning & Napier Advisors, Inc. (the “Advisor”). Shares of the Series are offered to investors, clients and employees of the Advisor and its affiliates. The total authorized capital stock of the Fund consists of 10.0 billion shares of common stock each having a par value of $0.01. As of June 30, 2011, 6.4 billion shares have been designated in total among 31 series, of which 100 million have been designated as Real Estate Series Class A common stock.
| 2. | SIGNIFICANT ACCOUNTING POLICIES |
Security Valuation
Portfolio securities, including domestic equities, foreign equities, warrants and options, listed on an exchange other than the NASDAQ National Market System are valued at the latest quoted sales price of the exchange on which the security is primarily traded. Securities not traded on valuation date or securities not listed on an exchange are valued at the latest quoted bid price provided by the Fund’s pricing service. Securities listed on the NASDAQ National Market System are valued in accordance with the NASDAQ Official Closing Price.
Short-term investments that mature in sixty days or less are valued at amortized cost, which approximates market value. Investments in open-end investment companies are valued at their net asset value per share on valuation date.
Volume and level of activity in established markets for an asset or liability are evaluated to determine whether recent transactions and quoted prices are determinative of fair value. Where there have been significant decreases in volume and level of activity, further analysis and adjustment may be necessary to estimate fair value. The Series measures fair value in these instances by the use of inputs and valuation techniques which may be based upon current market prices of securities that are comparable in coupon, rating, maturity and industry and/or expectation of future cash flows. As a result of trading in relatively thin markets and/or markets that experience significant volatility, the prices used by the Series to value these securities may differ from the value that would be realized if these securities were sold, and the differences could be material.
Securities for which representative valuations or prices are not available from the Fund’s pricing service may be valued at fair value. Due to the inherent uncertainty of valuations of such securities, the fair value may differ significantly from the values that would have been used had a ready market for such securities existed. If trading or events occurring after the close of the principal market in which securities are traded are expected to materially affect the value of those securities, then they may be valued at their fair value, taking this trading or these events into account. Fair value is determined in good faith by the Advisor under procedures approved by and under the general supervision and responsibility of the Fund’s Board of Directors (the “Board”). In accordance with the procedures approved by the Board, certain securities trading outside the U.S. whose values were adjusted following the close of local trading use a factor from a third party vendor to the extent available. The value of securities used for net asset value calculation under these procedures may differ from published prices for the same securities. It is the Fund’s policy to classify each foreign equity security where a factor from a third party vendor is provided as a Level 2 security.
Various inputs are used in determining the value of the Series’ assets or liabilities carried at market value. These inputs are summarized in three broad levels. Level 1 includes quoted prices in active markets for identical assets and liabilities. Level 2 includes other significant observable inputs (including quoted prices for similar securities,
Notes to Financial Statements (unaudited)
| | 2. | SIGNIFICANT ACCOUNTING POLICIES (continued) |
Security Valuation (continued)
interest rates, prepayment speeds, credit risk, etc.). Level 3 includes significant unobservable inputs (including the Series’ own assumptions in determining the fair value of investments). The inputs or methodology used for valuing securities are not necessarily an indication of the risk associated with investing in those securities.
The following is a summary of the valuation levels used for major security types as of June 30, 2011 in valuing the Series’ assets or liabilities carried at market value:
| | | | | | | | | | | | | | | | | | | | |
Description | | Total | | Level 1 | | Level 2 | | Level 3 |
Assets: | | | | | | | | | | | | | | | | | | | | |
Equity securities*: | | | | | | | | | | | | | | | | | | | | |
Consumer Discretionary | | | $ | 5,155,661 | | | | $ | 3,187,079 | | | | $ | 1,968,582 | | | | $ | — | |
Financials | | | | 90,465,269 | | | | | 88,355,975 | | | | | 2,109,294 | | | | | — | |
Industrials | | | | 928,768 | | | | | — | | | | | 928,768 | | | | | — | |
Utilities | | | | 718,935 | | | | | 718,935 | | | | | — | | | | | — | *** |
Preferred securities | | | | — | | | | | — | | | | | — | | | | | — | |
Debt securities | | | | — | | | | | — | | | | | — | | | | | — | |
Mutual funds | | | | 404,946 | | | | | 404,946 | | | | | — | | | | | — | |
Other financial instruments** | | | | — | | | | | — | | | | | — | | | | | — | |
| | | | | | | | | | | | | | | | | | | | |
Total assets | | | | 97,673,579 | | | | | 92,666,935 | | | | | 5,006,644 | | | | | — | |
| | | | | | | | | | | | | | | | | | | | |
Liabilities: | | | | | | | | | | | | | | | | | | | | |
Other financial instruments** | | | | — | | | | | — | | | | | — | | | | | — | |
| | | | | | | | | | | | | | | | | | | | |
Total liabilities | | | | — | | | | | — | | | | | — | | | | | — | |
| | | | | | | | | | | | | | | | | | | | |
Total | | | $ | 97,673,579 | | | | $ | 92,666,935 | | | | $ | 5,006,644 | | | | $ | — | |
| | | | | | | | | | | | | | | | | | | | |
| * | Includes common stock, warrants and rights. Please see the Investment Portfolio for foreign securities where values were adjusted following the close of local trading using a factor from a third party vendor. Such securities are included in Level 2 in the table above. |
| ** | Other financial instruments are derivative instruments not reflected in the Investment Portfolio, such as futures, forwards and swap contracts, which are valued at the unrealized appreciation/depreciation on the instrument. As of June 30, 2011, the Series did not hold any derivative instruments. |
| *** | AET&D Holdings No.1 Ltd. is a Level 3 security as of June 30, 2011. However, there is no cost or market value for this security reported in the financial statements. |
The Fund’s policy is to recognize transfers in and transfers out of the valuation levels as of the beginning of the reporting period. There were no transfers between Level 1 and Level 2 during the six months ended June 30, 2011.
Recent Accounting Standard
In May 2011, the Financial Accounting Standards Board issued amended guidance to improve disclosure about fair value measurements which will require the following disclosures for fair value measurements categorized as Level 3: quantitative information about the unobservable inputs and assumptions used in the fair value measurement, a description of the valuation policies and procedures and a narrative description of the sensitivity of the fair value measurement to changes in unobservable inputs and the interrelationships between those unobservable inputs. In addition, the amounts and reasons for all transfers in and out of Level 1 and Level 2 will be required to be disclosed. The amended guidance is effective for financial statements for fiscal years beginning after December 15, 2011, and
Notes to Financial Statements (unaudited)
| 2. | SIGNIFICANT ACCOUNTING POLICIES (continued) |
Recent Accounting Standard (continued)
interim periods within those fiscal years. Management is evaluating the impact of this guidance on the Series’ financial statements and disclosures.
Security Transactions, Investment Income and Expenses
Security transactions are accounted for on trade date. Dividend income is recorded on the ex-dividend date, except that if the ex-dividend date has passed, certain dividends from foreign securities are recorded as soon as the Fund is informed of the ex-dividend date. Non-cash dividends, if any, are recorded at the fair market value of the securities received. Interest income, including amortization of premium and accretion of discounts using the effective interest method, is earned from settlement date and accrued daily.
Expenses are recorded on an accrual basis. Most expenses of the Fund can be attributed to a specific series. Expenses which cannot be directly attributed are apportioned among the series in the Fund in such a manner as deemed equitable by the Fund’s Board, taking into consideration, among other things, the nature and type of expense.
The Fund records distributions received in excess of income from underlying investments as a reduction of cost of investments and/or realized gain. Such amounts are based on estimates if actual amounts are not available and actual amounts of income, realized gain and return of capital may differ from the estimated amounts. The Fund adjusts the estimated amounts of components of distributions (and consequently its net investment income) as necessary once the issuers provide information about the actual composition of the distributions.
The Series uses the identified cost method for determining realized gain or loss on investments for both financial statement and federal income tax reporting purposes.
Foreign Currency Translation
The books and records of the Series are maintained in U.S. dollars. Foreign currencies, investments and other assets and liabilities are translated into U.S. dollars at the current exchange rates. Purchases and sales of investment securities and income and expenses are translated on the respective dates of such transactions. The Series does not isolate realized and unrealized gains and losses attributable to changes in the exchange rates from gains and losses that arise from changes in the market value of investments. Such fluctuations are included with net realized and unrealized gain or loss on investments. Net realized foreign currency gains and losses represent foreign currency gains and losses between trade date and settlement date on securities transactions, gains and losses on disposition of foreign currencies and the difference between the amount of income and foreign withholding taxes recorded on the books of the Series and the amounts actually received or paid.
Federal Taxes
The Series’ policy is to comply with the provisions of the Internal Revenue Code applicable to regulated investment companies. The Series is not subject to federal income tax or excise tax to the extent that the Series distributes to shareholders each year its taxable income, including any net realized gains on investments, in accordance with requirements of the Internal Revenue Code. Accordingly, no provision for federal income tax or excise tax has been made in the financial statements.
Management evaluates its tax positions to determine if the tax positions taken meet the minimum recognition threshold in connection with accounting for uncertainties in income tax positions taken or expected to be taken for the purposes of measuring and recognizing tax liabilities in the financial statements. Recognition of tax benefits of an uncertain tax position is required only when the position is “more likely than not” to be sustained assuming examination by taxing authorities. At June 30, 2011, the Series has recorded no liability for net unrecognized tax benefits relating to uncertain income tax positions taken or expected to be taken in future tax returns.
Notes to Financial Statements (unaudited)
| 2. | SIGNIFICANT ACCOUNTING POLICIES (continued) |
Federal Taxes (continued)
The Series files income tax returns in the U.S. federal jurisdiction, various states and foreign jurisdictions, as required. No income tax returns are currently under investigation. The statute of limitations on the Series’ tax returns remains open for the period ended December 31, 2009 and the year ended December 31, 2010. The Fund is not aware of any tax positions for which it is reasonably possible that the total amounts of unrecognized tax benefits will significantly change in the next twelve months.
Additionally, based on the Fund’s understanding of the tax rules and rates related to income, gains and transactions for foreign jurisdictions in which it invests, the Series will provide for foreign taxes, and where appropriate, deferred foreign tax.
Distributions of Income and Gains
Distributions to shareholders of net investment income and net realized gains are made annually. An additional distribution may be necessary to avoid taxation of the Series. Distributions are recorded on the ex-dividend date.
Indemnifications
The Fund’s organizational documents provide former and current directors and officers with a limited indemnification against liabilities arising in connection with the performance of their duties to the Fund. In the normal course of business, the Fund may also enter into contracts that provide general indemnifications. The Fund’s maximum exposure under these arrangements is unknown as this would be dependent on future claims that may be made against the Fund. The risk of material loss from such claims is considered remote.
Other
The preparation of financial statements in conformity with accounting principles generally accepted in the United States of America requires management to make estimates and assumptions that affect the reported amounts of assets and liabilities and the disclosure of contingent assets and liabilities at the date of the financial statements and the reported amounts of income and expenses during the reporting period. Actual results could differ from those estimates.
| 3. | TRANSACTIONS WITH AFFILIATES |
The Fund has an Investment Advisory Agreement (the “Agreement”) with the Advisor, for which the Series pays a fee, computed daily and payable monthly, at an annual rate of 1.00% of the Series’ average daily net assets.
Under the Agreement, personnel of the Advisor provide the Series with advice and assistance in the choice of investments and the execution of securities transactions, and otherwise maintain the Series’ organization. The Advisor also provides the Fund with necessary office space and fund administration and support services. The salaries of all officers of the Fund (except a percentage of the Fund’s Chief Compliance Officer’s salary, which is paid by the Fund), and of all Directors who are “affiliated persons” of the Fund, or of the Advisor, and all personnel of the Fund, or of the Advisor, performing services relating to research, statistical and investment activities, are paid by the Advisor. Each “non-affiliated” Director receives an annual stipend, which is allocated among all the active series of the Fund. In addition, these Directors also receive a fee per Board meeting attended plus a fee for each committee meeting attended.
The Advisor has contractually agreed, until at least April 30, 2012, to waive its fee and, if necessary, pay other operating expenses of the Series in order to maintain total direct annual fund operating expenses for the Series at no more than 1.20% of average daily net assets each year. The Advisor did not waive any fees for the six months ended June 30, 2011. The Advisor is not eligible to recoup any expenses that have been waived or reimbursed in prior years.
Notes to Financial Statements (unaudited)
| 3. | TRANSACTIONS WITH AFFILIATES (continued) |
Manning & Napier Investor Services, Inc., a registered broker-dealer affiliate of the Advisor, acts as distributor for the Fund’s shares. The services of Manning & Napier Investor Services, Inc. are provided at no additional cost to the Series.
The Advisor has agreements with BNY Mellon Investment Servicing (U.S.) Inc. (“BNY”) under which BNY serves as sub-accountant services agent and sub-transfer agent. The Fund pays the Advisor an annual fee related to fund accounting and administration of 0.0175% on the first $3 billion of average daily net assets (excluding Target Series); 0.015% on the next $3 billion of average daily net assets (excluding Target Series); and 0.01% of the average daily net assets in excess of $6 billion (excluding Target Series); plus a base fee of $25,500 per Series. Transfer Agent fees are charged to the Fund on a per account basis. Additionally, certain transaction- and cusip-based fees and out-of-pocket expenses, including charges for reporting relating to the Fund’s compliance program, are charged.
Expenses not directly attributable to a Series are allocated based on each Series’ relative net assets or number of accounts, depending on the expense.
| 4. | PURCHASES AND SALES OF SECURITIES |
For the six months ended June 30, 2011, purchases and sales of securities, other than U.S. Government securities and short-term securities, were $15,997,311 and $12,851,383, respectively. There were no purchases or sales of U.S. Government securities.
| 5. | CAPITAL STOCK TRANSACTIONS |
Transactions in shares of Real Estate Series were:
| | | | | | | | | | | | | | | | | | | | |
| | | For the Six Months
Ended 6/30/11 | | For the Year
Ended 12/31/10 |
| | | Shares | | Amount | | Shares | | Amount |
Sold | | | | 390,729 | | | | $ | 5,084,839 | | | | | 938,366 | | | | $ | 11,015,288 | |
Reinvested | | | | — | | | | | — | | | | | 326,194 | | | | | 3,931,823 | |
Repurchased | | | | (259,961 | ) | | | | (3,436,206 | ) | | | | (694,124 | ) | | | | (8,340,996 | ) |
| | | | | | | | | | | | | | | | | | | | |
Total | | | | 130,768 | | | | $ | 1,648,633 | | | | | 570,436 | | | | $ | 6,606,115 | |
| | | | | | | | | | | | | | | | | | | | |
Substantially all of the Series’ shares represent investments by fiduciary accounts over which the Advisor has sole investment discretion.
The Series may trade in instruments including written and purchased options, forward foreign currency exchange contracts and futures contracts and other derivatives in the normal course of investing activities to assist in managing exposure to various market risks. The Series may be subject to various elements of risk, which may involve, to a varying degree, elements of risk in excess of the amounts recognized for financial statement purposes. These risks include: the risk that changes in the value of a derivative may not correlate perfectly with the underlying asset, rate or index, counterparty credit risk related to over the counter derivatives’ counterparties failure to perform under contract terms, liquidity risk related to the lack of a liquid market for these contracts allowing the fund to close out its position(s) and documentation risk relating to disagreement over contract terms. No such investments were held by the Series on June 30, 2011.
Notes to Financial Statements (unaudited)
Investing in securities of foreign companies and foreign governments involves special risks and considerations not typically associated with investing in securities of domestic companies and the U.S. Government. These risks include revaluation of currencies and future adverse political and economic developments. Moreover, securities of foreign companies and foreign governments and their markets may be less liquid and their prices more volatile than those of comparable domestic companies and the U.S. Government.
The Series may focus its investments in certain real estate related industries; hence, the Series may subject itself to a greater degree of risk than a series that is more diversified.
| 9. | FEDERAL INCOME TAX INFORMATION |
The amount and characterization of certain income and capital gains to be distributed are determined in accordance with federal income tax regulations, which may differ from accounting principles generally accepted in the United States of America. The Series may periodically make reclassifications among its capital accounts to reflect income and gains available for distribution (or available capital loss carryovers) under income tax regulations, without impacting the Series’ net asset value. Any such reclassifications are not reflected in the financial highlights.
The final determination of the tax character of current year distributions will be made at the conclusion of the fiscal year. The tax character of distributions paid for the year ended December 31, 2010 were as follows:
| | | | | |
Ordinary income | | | $ | 3,765,261 | |
Long-term capital gains | | | | 226,566 | |
At June 30, 2011, the identified cost of investments for federal income tax purposes, the resulting gross unrealized appreciation and depreciation, and the net unrealized appreciation were as follows:
| | | | | |
Cost for federal income tax purposes | | | $ | 79,350,521 | |
Unrealized appreciation | | | $ | 19,251,971 | |
Unrealized depreciation | | | | (928,913 | ) |
| | | | | |
Net unrealized appreciation | | | $ | 18,323,058 | |
| | | | | |
Literature Requests (unaudited)
Proxy Voting Policies and Procedures
A description of the policies and procedures that the Fund uses to determine how to vote proxies relating to portfolio securities is available, without charge, upon request:
| | |
| By phone | | 1-800-466-3863 |
| On the Securities and Exchange Commission’s (SEC) web site | | http://www.sec.gov |
Proxy Voting Record
Information regarding how the Fund voted proxies relating to portfolio securities during the most recent 12-month period ended June 30th is available, without charge, upon request:
| | |
| By phone | | 1-800-466-3863 |
| On the SEC’s web site | | http://www.sec.gov |
Quarterly Portfolio Holdings
The Series’ complete schedule of portfolio holdings for the 1st and 3rd quarters of each fiscal year are provided on Form N-Q, and are available, without charge, upon request:
| | |
| By phone | | 1-800-466-3863 |
| On the SEC’s web site | | http://www.sec.gov |
The Series’ Form N-Q may be reviewed and copied at the SEC’s Public Reference Room in Washington, D.C. Information on the operation of the Public Reference Room may be obtained by calling 1-800-SEC-0330.
Prospectus and Statement of Additional Information (SAI)
The prospectus and SAI provide additional information about each Series, including charges, expenses and risks. These documents are available, without charge, upon request:
| | |
| By phone | | 1-800-466-3863 |
| On the SEC’s web site | | http://www.sec.gov |
| On our web site | | http://www.manning-napier.com |
Additional information available at www.manning-napier.com
1. Fund Holdings - Month-End
2. Fund Holdings - Quarter-End
3. Shareholder Report - Annual
4. Shareholder Report - Semi-Annual
The Fund also offers electronic notification or “e-delivery” when certain documents are available on-line to be downloaded or reviewed. Direct shareholders can elect to receive electronic notification when shareholder reports, prospectus updates, and / or quarterly statements are available. If you do not currently have on-line access to your account, you can establish access by going to www.manning-napier.com, click on “Login” in the top corner of the page, and follow the prompts to self-enroll. Once enrolled, you can set your electronic notification preferences by clicking on the Account Options tab located within the green toolbar and then select E-Delivery Option. Should you have any questions on either how to establish on-line access or how to update your account settings, please do not hesitate to contact Investor Services at 1-800-466-3863.
MNRE-6/11-SAR


Shareholder Expense Example (unaudited)
As a shareholder of the Series, you may incur two types of costs: (1) transaction costs and (2) ongoing costs, including management fees and other Series expenses. This example is intended to help you understand your ongoing costs (in dollars) of investing in the Series and to compare these costs with the ongoing costs of investing in other mutual funds.
The example is based on an investment of $1,000 invested at the beginning of the period and held for the entire period (January 1, 2011 to June 30, 2011).
Actual Expenses
The first line of the table below provides information about actual account values and actual expenses. You may use the information in this line, together with the amount you invested, to estimate the expenses that you paid over the period. Simply divide your account value by $1,000 (for example, an $8,600 account value divided by $1,000 = 8.6), then multiply the result by the number in the first line under the heading entitled “Expenses Paid During Period” to estimate the expenses you paid on your account during this period.
Hypothetical Example for Comparison Purposes
The second line of the table below provides information about hypothetical account values and hypothetical expenses based on the Series’ actual expense ratio and an assumed rate of return of 5% per year before expenses, which is not the Series’ actual return. The hypothetical account values and expenses may not be used to estimate the actual ending account balance or expenses you paid during the period. You may use this information to compare the ongoing costs of investing in the Series and other funds. To do so, compare this 5% hypothetical example with the 5% hypothetical examples that appear in the shareholder reports of the other funds.
Please note that the expenses shown in the table are meant to highlight your ongoing costs only and do not reflect any transaction costs. Therefore, the second line of the table is useful in comparing ongoing costs only, and will not help you determine the relative total costs of owning different funds. In addition, if these transaction costs were included, your costs would have been higher.
| | | | | | | | | | | | | | | |
| | | Beginning
Account Value
1/1/11 | | Ending
Account Value
6/30/11 | | Expenses Paid
During Period*
1/1/11-6/30/11 |
Actual | | | $ | 1,000.00 | | | | $ | 1,088.10 | | | | $ | 5.75 | |
Hypothetical
(5% return before expenses) | | | $ | 1,000.00 | | | | $ | 1,019.29 | | | | $ | 5.56 | |
| * | Expenses are equal to the Series’ annualized expense ratio (for the six-month period) of 1.11%, multiplied by the average account value over the period, multiplied by 181/365 (to reflect the one-half year period). Expenses are based on the most recent fiscal half year. |
Portfolio Composition as of June 30, 2011 (unaudited)
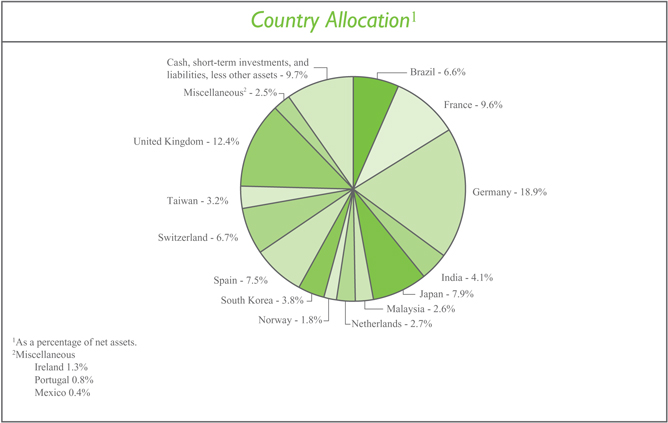
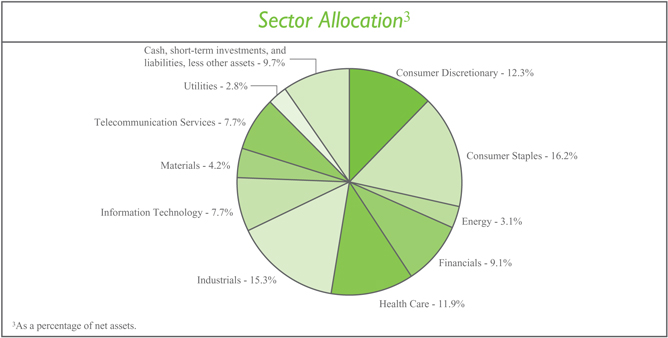
Investment Portfolio - June 30, 2011 (unaudited)
| | | | | | | | | | |
| | | Shares | | Value
(Note 2) |
| | |
COMMON STOCKS - 90.3% | | | | | | | | | | |
| | |
Consumer Discretionary - 12.3% | | | | | | | | | | |
Auto Components - 1.6% | | | | | | | | | | |
Hankook Tire Co. Ltd. (South Korea)1 | | | | 178,870 | | | | $ | 7,652,437 | |
| | | | | | | | | | |
Automobiles - 1.9% | | | | | | | | | | |
Hero Honda Motors Ltd. (India)1 | | | | 42,450 | | | | | 1,784,977 | |
Maruti Suzuki India Ltd. (India)1 | | | | 44,940 | | | | | 1,169,611 | |
Yamaha Motor Co. Ltd. (Japan)*1 | | | | 330,000 | | | | | 6,061,332 | |
| | | | | | | | | | |
| | | | | | | | | 9,015,920 | |
| | | | | | | | | | |
Hotels, Restaurants & Leisure - 1.0% | | | | | | | | | | |
Indian Hotels Co. Ltd. (India)1 | | | | 1,469,000 | | | | | 2,550,460 | |
Thomas Cook Group plc (United Kingdom)1 | | | | 1,067,000 | | | | | 2,280,209 | |
| | | | | | | | | | |
| | | | | | | | | 4,830,669 | |
| | | | | | | | | | |
Household Durables - 1.7% | | | | | | | | | | |
Corporacion Geo S.A.B. de C.V. - Class B (Mexico)* | | | | 783,010 | | | | | 1,805,634 | |
LG Electronics, Inc. (South Korea)1 | | | | 32,640 | | | | | 2,544,973 | |
PDG Realty S.A. Empreendimentos e Participacoes (Brazil) | | | | 87,074 | | | | | 490,424 | |
Rodobens Negocios Imobiliarios S.A. (Brazil) | | | | 367,000 | | | | | 3,245,186 | |
| | | | | | | | | | |
| | | | | | | | | 8,086,217 | |
| | | | | | | | | | |
Media - 4.4% | | | | | | | | | | |
Mediaset Espana Comunicacion S.A. (Spain)1 | | | | 1,120,600 | | | | | 9,743,683 | |
Reed Elsevier plc - ADR (United Kingdom) | | | | 60,311 | | | | | 2,200,145 | |
Societe Television Francaise 1 (France)1 | | | | 108,530 | | | | | 1,979,782 | |
Wolters Kluwer N.V. (Netherlands)1 | | | | 114,447 | | | | | 2,537,373 | |
Zon Multimedia Servicos de Telecomunicacoes e Multimedia SGPS S.A. (Portugal)1 | | | | 850,000 | | | | | 3,945,663 | |
| | | | | | | | | | |
| | | | | | | | | 20,406,646 | |
| | | | | | | | | | |
Multiline Retail - 0.9% | | | | | | | | | | |
PPR (France)1 | | | | 22,930 | | | | | 4,083,975 | |
| | | | | | | | | | |
Specialty Retail - 0.8% | | | | | | | | | | |
Inditex S.A. (Spain)1 | | | | 23,000 | | | | | 2,095,629 | |
Komeri Co. Ltd. (Japan)1 | | | | 67,000 | | | | | 1,826,845 | |
| | | | | | | | | | |
| | | | | | | | | 3,922,474 | |
| | | | | | | | | | |
Total Consumer Discretionary | | | | | | | | | 57,998,338 | |
| | | | | | | | | | |
Consumer Staples - 16.2% | | | | | | | | | | |
Beverages - 2.8% | | | | | | | | | | |
Diageo plc (United Kingdom)1 | | | | 322,810 | | | | | 6,604,373 | |
Kirin Holdings Co. Ltd. (Japan)1 | | | | 215,000 | | | | | 2,997,299 | |
United Spirits Ltd. (India)1 | | | | 155,400 | | | | | 3,415,466 | |
| | | | | | | | | | |
| | | | | | | | | 13,017,138 | |
| | | | | | | | | | |
| | | | | | |
| | The accompanying notes are an integral part of the financial statements. | | | 3 | |
Investment Portfolio - June 30, 2011 (unaudited)
| | | | | | | | | | |
| | | Shares | | Value
(Note 2) |
| | |
COMMON STOCKS (continued) | | | | | | | | | | |
| | |
Consumer Staples (continued) | | | | | | | | | | |
Food & Staples Retailing - 4.2% | | | | | | | | | | |
Carrefour S.A. (France)1 | | | | 165,082 | | | | $ | 6,786,484 | |
Casino Guichard-Perrachon S.A. (France)1 | | | | 34,170 | | | | | 3,220,546 | |
President Chain Store Corp. (Taiwan)1 | | | | 352,320 | | | | | 2,041,238 | |
Tesco plc (United Kingdom)1 | | | | 1,217,410 | | | | | 7,865,689 | |
| | | | | | | | | | |
| | | | | | | | | 19,913,957 | |
| | | | | | | | | | |
Food Products - 6.6% | | | | | | | | | | |
Barry Callebaut AG (Switzerland)*1 | | | | 4,400 | | | | | 4,363,532 | |
Danone S.A. (France)1 | | | | 40,012 | | | | | 2,987,039 | |
Nestle S.A. (Switzerland)1 | | | | 105,220 | | | | | 6,547,687 | |
Suedzucker AG (Germany)1 | | | | 90,690 | | | | | 3,229,223 | |
Unilever plc - ADR (United Kingdom) | | | | 420,230 | | | | | 13,611,250 | |
| | | | | | | | | | |
| | | | | | | | | 30,738,731 | |
| | | | | | | | | | |
Household Products - 2.3% | | | | | | | | | | |
Hindustan Unilever Ltd. (India)1 | | | | 250,540 | | | | | 1,928,699 | |
Reckitt Benckiser Group plc (United Kingdom)1 | | | | 164,270 | | | | | 9,073,005 | |
| | | | | | | | | | |
| | | | | | | | | 11,001,704 | |
| | | | | | | | | | |
Personal Products - 0.3% | | | | | | | | | | |
Kao Corp. (Japan)1 | | | | 47,000 | | | | | 1,235,827 | |
| | | | | | | | | | |
Total Consumer Staples | | | | | | | | | 75,907,357 | |
| | | | | | | | | | |
Energy - 3.1% | | | | | | | | | | |
Oil, Gas & Consumable Fuels - 3.1% | | | | | | | | | | |
Repsol YPF S.A. (Spain)1 | | | | 56,900 | | | | | 1,973,615 | |
Royal Dutch Shell plc - Class B - ADR (Netherlands) | | | | 87,780 | | | | | 6,298,215 | |
Royal Dutch Shell plc - Class B (Netherlands)1 | | | | 88,430 | | | | | 3,155,720 | |
Total S.A. (France)1 | | | | 56,580 | | | | | 3,271,105 | |
| | | | | | | | | | |
Total Energy | | | | | | | | | 14,698,655 | |
| | | | | | | | | | |
Financials - 9.1% | | | | | | | | | | |
Capital Markets - 0.4% | | | | | | | | | | |
Daiwa Securities Group, Inc. (Japan)1 | | | | 98,000 | | | | | 431,778 | |
Nomura Holdings, Inc. (Japan)1 | | | | 78,900 | | | | | 389,347 | |
OSK Holdings Berhad (Malaysia)1 | | | | 2,089,500 | | | | | 1,060,498 | |
| | | | | | | | | | |
| | | | | | | | | 1,881,623 | |
| | | | | | | | | | |
Commercial Banks - 1.6% | | | | | | | | | | |
BNP Paribas S.A. (France)1 | | | | 28,330 | | | | | 2,184,510 | |
Credit Agricole S.A. (France)1 | | | | 63,090 | | | | | 947,829 | |
Hong Leong Financial Group Berhad (Malaysia)1 | | | | 816,800 | | | | | 3,569,923 | |
Societe Generale S.A. (France)1 | | | | 15,410 | | | | | 912,679 | |
| | | | | | | | | | |
| | | | | | | | | 7,614,941 | |
| | | | | | | | | | |
| | | | |
| 4 | | The accompanying notes are an integral part of the financial statements. | | |
Investment Portfolio - June 30, 2011 (unaudited)
| | | | | | | | | | |
| | | Shares | | Value
(Note 2) |
| | |
COMMON STOCKS (continued) | | | | | | | | | | |
| | |
Financials (continued) | | | | | | | | | | |
Diversified Financial Services - 0.2% | | | | | | | | | | |
ING Groep N.V. (Netherlands)*1 | | | | 65,395 | | | | $ | 805,900 | |
| | | | | | | | | | |
Insurance - 4.9% | | | | | | | | | | |
Allianz SE (Germany)1 | | | | 40,870 | | | | | 5,699,224 | |
AXA S.A. (France)1 | | | | 56,372 | | | | | 1,279,661 | |
Mapfre S.A. (Spain)1 | | | | 1,877,000 | | | | | 6,964,131 | |
Mapfre S.A. (Spain) - Rights*2 | | | | 885,000 | | | | | 12,834 | |
Muenchener Rueckversicherungs AG (MunichRe) (Germany)1 | | | | 40,610 | | | | | 6,199,359 | |
Zurich Financial Services AG (Switzerland)1 | | | | 10,500 | | | | | 2,656,917 | |
| | | | | | | | | | |
| | | | | | | | | 22,812,126 | |
| | | | | | | | | | |
Real Estate Investment Trusts (REITS) - 1.2% | | | | | | | | | | |
Alstria Office REIT AG (Germany)1 | | | | 389,547 | | | | | 5,875,009 | |
| | | | | | | | | | |
Thrifts & Mortgage Finance - 0.8% | | | | | | | | | | |
Aareal Bank AG (Germany)*1 | | | | 115,790 | | | | | 3,962,938 | |
| | | | | | | | | | |
Total Financials | | | | | | | | | 42,952,537 | |
| | | | | | | | | | |
Health Care - 11.9% | | | | | | | | | | |
Health Care Equipment & Supplies - 1.3% | | | | | | | | | | |
Straumann Holding AG (Switzerland)1 | | | | 25,776 | | | | | 6,216,034 | |
| | | | | | | | | | |
Health Care Providers & Services - 3.2% | | | | | | | | | | |
Amil Participacoes S.A. (Brazil) | | | | 350,000 | | | | | 4,063,691 | |
Fresenius Medical Care AG & Co. KGaA - ADR (Germany) | | | | 37,442 | | | | | 2,796,917 | |
Odontoprev S.A. (Brazil) | | | | 492,000 | | | | | 8,291,161 | |
| | | | | | | | | | |
| | | | | | | | | 15,151,769 | |
| | | | | | | | | | |
Pharmaceuticals - 7.4% | | | | | | | | | | |
AstraZeneca plc (United Kingdom)1 | | | | 27,960 | | | | | 1,397,481 | |
AstraZeneca plc - ADR (United Kingdom) | | | | 171,350 | | | | | 8,579,496 | |
Bayer AG (Germany)1 | | | | 100,000 | | | | | 8,031,704 | |
GlaxoSmithKline plc (United Kingdom)1 | | | | 172,980 | | | | | 3,707,710 | |
Novartis AG - ADR (Switzerland) | | | | 49,000 | | | | | 2,994,390 | |
Sanofi (France)1 | | | | 26,423 | | | | | 2,125,495 | |
Shire plc (Ireland)1 | | | | 195,160 | | | | | 6,102,026 | |
Takeda Pharmaceutical Co. Ltd. (Japan)1 | | | | 34,900 | | | | | 1,612,971 | |
| | | | | | | | | | |
| | | | | | | | | 34,551,273 | |
| | | | | | | | | | |
Total Health Care | | | | | | | | | 55,919,076 | |
| | | | | | | | | | |
Industrials - 15.3% | | | | | | | | | | |
Airlines - 1.0% | | | | | | | | | | |
Deutsche Lufthansa AG (Germany)1 | | | | 206,580 | | | | | 4,499,577 | |
| | | | | | | | | | |
Commercial Services & Supplies - 1.6% | | | | | | | | | | |
Taiwan Secom Co. Ltd. (Taiwan)1 | | | | 777,210 | | | | | 1,506,044 | |
| | | | | | |
| | The accompanying notes are an integral part of the financial statements. | | | 5 | |
Investment Portfolio - June 30, 2011 (unaudited)
| | | | | | | | | | |
| | | Shares | | Value
(Note 2) |
| | |
COMMON STOCKS (continued) | | | | | | | | | | |
| | |
Industrials (continued) | | | | | | | | | | |
Commercial Services & Supplies (continued) | | | | | | | | | | |
Tomra Systems ASA (Norway)1 | | | | 689,080 | | | | $ | 5,997,503 | |
| | | | | | | | | | |
| | | | | | | | | 7,503,547 | |
| | | | | | | | | | |
Construction & Engineering - 0.7% | | | | | | | | | | |
Larsen & Toubro Ltd. (India)1 | | | | 85,270 | | | | | 3,487,776 | |
| | | | | | | | | | |
Electrical Equipment - 3.0% | | | | | | | | | | |
ABB Ltd. (Asea Brown Boveri) - ADR (Switzerland)* | | | | 138,000 | | | | | 3,581,100 | |
Alstom S.A. (France)1 | | | | 97,560 | | | | | 6,009,212 | |
Bharat Heavy Electricals Ltd. (India)1 | | | | 30,080 | | | | | 1,382,774 | |
Teco Electric and Machinery Co. Ltd. (Taiwan)1 | | | | 4,084,000 | | | | | 2,951,018 | |
| | | | | | | | | | |
| | | | | | | | | 13,924,104 | |
| | | | | | | | | | |
Industrial Conglomerates - 2.9% | | | | | | | | | | |
Siemens AG (Germany)1 | | | | 100,600 | | | | | 13,824,619 | |
| | | | | | | | | | |
Machinery - 2.7% | | | | | | | | | | |
FANUC Corp. (Japan)1 | | | | 55,000 | | | | | 9,197,268 | |
Jain Irrigation Systems Ltd. (India)1 | | | | 897,440 | | | | | 3,430,376 | |
| | | | | | | | | | |
| | | | | | | | | 12,627,644 | |
| | | | | | | | | | |
Road & Rail - 2.4% | | | | | | | | | | |
All America Latina Logistica S.A. (Brazil) | | | | 1,343,000 | | | | | 11,333,297 | |
| | | | | | | | | | |
Transportation Infrastructure - 1.0% | | | | | | | | | | |
Malaysia Airports Holdings Berhad (Malaysia)1 | | | | 2,148,700 | | | | | 4,604,103 | |
| | | | | | | | | | |
Total Industrials | | | | | | | | | 71,804,667 | |
| | | | | | | | | | |
Information Technology - 7.7% | | | | | | | | | | |
Communications Equipment - 0.2% | | | | | | | | | | |
D-Link Corp. (Taiwan)1 | | | | 1,120,606 | | | | | 1,028,036 | |
| | | | | | | | | | |
Electronic Equipment, Instruments & Components - 3.2% | | | | | | | | | | |
Hitachi Ltd. (Japan)1 | | | | 1,531,000 | | | | | 9,086,490 | |
Keyence Corp. (Japan)1 | | | | 15,645 | | | | | 4,442,096 | |
Yageo Corp. (Taiwan)1 | | | | 2,931,000 | | | | | 1,336,177 | |
| | | | | | | | | | |
| | | | | | | | | 14,864,763 | |
| | | | | | | | | | |
IT Services - 0.7% | | | | | | | | | | |
Cap Gemini S.A. (France)1 | | | | 56,320 | | | | | 3,297,989 | |
| | | | | | | | | | |
Semiconductors & Semiconductor Equipment - 2.6% | | | | | | | | | | |
Infineon Technologies AG (Germany)1 | | | | 770,000 | | | | | 8,652,040 | |
Taiwan Semiconductor Manufacturing Co. Ltd. - ADR (Taiwan) | | | | 275,315 | | | | | 3,471,722 | |
| | | | | | | | | | |
| | | | | | | | | 12,123,762 | |
| | | | | | | | | | |
| | | | |
| 6 | | The accompanying notes are an integral part of the financial statements. | | |
Investment Portfolio - June 30, 2011 (unaudited)
| | | | | | | | | | |
| | | Shares | | Value
(Note 2) |
| | |
COMMON STOCKS (continued) | | | | | | | | | | |
| | |
Information Technology (continued) | | | | | | | | | | |
Software - 1.0% | | | | | | | | | | |
SAP AG (Germany)1 | | | | 76,970 | | | | $ | 4,666,588 | |
| | | | | | | | | | |
Total Information Technology | | | | | | | | | 35,981,138 | |
| | | | | | | | | | |
Materials - 4.2% | | | | | | | | | | |
Chemicals - 3.6% | | | | | | | | | | |
Arkema S.A. (France)1 | | | | 1,229 | | | | | 126,406 | |
BASF SE (Germany)1 | | | | 96,000 | | | | | 9,410,107 | |
Linde AG (Germany)1 | | | | 41,500 | | | | | 7,281,066 | |
| | | | | | | | | | |
| | | | | | | | | 16,817,579 | |
| | | | | | | | | | |
Construction Materials - 0.6% | | | | | | | | | | |
Taiwan Cement Corp. (Taiwan)1 | | | | 1,899,827 | | | | | 2,838,046 | |
| | | | | | | | | | |
Total Materials | | | | | | | | | 19,655,625 | |
| | | | | | | | | | |
Telecommunication Services - 7.7% | | | | | | | | | | |
Diversified Telecommunication Services - 5.4% | | | | | | | | | | |
France Telecom S.A. (France)1 | | | | 155,920 | | | | | 3,315,423 | |
France Telecom S.A. - ADR (France) | | | | 38,800 | | | | | 826,052 | |
Swisscom AG - ADR (Switzerland)3 | | | | 106,400 | | | | | 4,868,864 | |
Telefonica S.A. - ADR (Spain) | | | | 579,000 | | | | | 14,179,710 | |
Telenor ASA - ADR (Norway)3 | | | | 47,980 | | | | | 2,365,414 | |
| | | | | | | | | | |
| | | | | | | | | 25,555,463 | |
| | | | | | | | | | |
Wireless Telecommunication Services - 2.3% | | | | | | | | | | |
DiGi.com Berhad (Malaysia)1 | | | | 284,200 | | | | | 2,734,501 | |
SK Telecom Co. Ltd. - ADR (South Korea) | | | | 419,689 | | | | | 7,848,184 | |
| | | | | | | | | | |
| | | | | | | | | 10,582,685 | |
| | | | | | | | | | |
Total Telecommunication Services | | | | | | | | | 36,138,148 | |
| | | | | | | | | | |
Utilities - 2.8% | | | | | | | | | | |
Electric Utilities - 1.0% | | | | | | | | | | |
E.ON AG (Germany)1 | | | | 164,441 | | | | | 4,674,163 | |
| | | | | | | | | | |
Multi-Utilities - 1.0% | | | | | | | | | | |
GDF Suez (France)1 | | | | 51,850 | | | | | 1,895,004 | |
National Grid plc (United Kingdom)1 | | | | 286,530 | | | | | 2,820,668 | |
| | | | | | | | | | |
| | | | | | | | | 4,715,672 | |
| | | | | | | | | | |
Water Utilities - 0.8% | | | | | | | | | | |
Cia de Saneamento de Minas Gerais - Copasa MG (Brazil) | | | | 182,000 | | | | | 3,650,146 | |
| | | | | | | | | | |
Total Utilities | | | | | | | | | 13,039,981 | |
| | | | | | | | | | |
TOTAL COMMON STOCKS
(Identified Cost $351,340,712) | | | | | | | | | 424,095,522 | |
| | | | | | | | | | |
| | | | | | |
| | The accompanying notes are an integral part of the financial statements. | | | 7 | |
Investment Portfolio - June 30, 2011 (unaudited)
| | | | | | | | | | |
| | | | | Value |
SHORT-TERM INVESTMENTS - 12.3% | | | | | | | | | | |
Dreyfus Cash Management, Inc. - Institutional Shares4 , 0.10%,
(Identified Cost $58,053,969) | | | | 58,053,969 | | | | $ | 58,053,969 | |
| | | | | | | | | | |
| | |
TOTAL INVESTMENTS - 102.6%
(Identified Cost $409,394,681) | | | | | | | | | 482,149,491 | |
| | |
LIABILITIES, LESS OTHER ASSETS - (2.6%) | | | | | | | | | (12,359,915 | ) |
| | | | | | | | | | |
NET ASSETS - 100% | | | | | | | | $ | 469,789,576 | |
| | | | | | | | | | |
FORWARD FOREIGN CURRENCY EXCHANGE CONTRACTS OPEN AT JUNE 30, 20115 :
| | | | | | | | | | | | | | | | | | | | |
Settlement Date | | Contracts to Deliver | | In Exchange
For | | Contracts
At Value | | Unrealized
Appreciation |
7/11/2011 | | | | JPY 1,156,700,000 | | | | $ | 14,418,378 | | | | $ | 14,368,840 | | | | $ | 49,538 | |
ADR - American Depository Receipt
JPY - Japanese Yen
*Non-income producing security
| 1 | Values were adjusted following the close of local trading using a factor from a third party vendor. |
| 2 | Security has been valued at fair value (see Note 2 to the financial statements). |
| 3 | Latest quoted sales price is not available and the latest quoted bid price was used to value the security. |
| 4 | Rate shown is the current yield as of June 30, 2011. |
| 5 | The counterparty for all forward foreign currency exchange contracts is the Bank of New York Mellon Corp. |
The Series’ portfolio holds, as a percentage of net assets, greater than 10% in the following countries: Germany - 18.9%; United Kingdom - 12.4%.
| | | | |
| 8 | | The accompanying notes are an integral part of the financial statements. | | |
Statement of Assets & Liabilities (unaudited)
June 30, 2011
| | | | | |
ASSETS: | | | | | |
Investments, at value (identified cost $409,394,681) (Note 2) | | | $ | 482,149,491 | |
Cash | | | | 4,989,128 | |
Foreign currency, at value (cost $14,475) | | | | 15,045 | |
Receivable for fund shares sold | | | | 5,416,750 | |
Foreign tax reclaims receivable | | | | 710,985 | |
Dividends receivable | | | | 693,612 | |
Unrealized appreciation on foreign forward currency contracts (Note 2) | | | | 49,538 | |
| | | | | |
| |
TOTAL ASSETS | | | | 494,024,549 | |
| | | | | |
| |
LIABILITIES: | | | | | |
| |
Accrued management fees (Note 3) | | | | 357,060 | |
Accrued fund accounting and administration fees (Note 3) | | | | 15,251 | |
Accrued transfer agent fees (Note 3) | | | | 1,951 | |
Accrued Chief Compliance Officer service fees (Note 3) | | | | 466 | |
Accrued directors’ fees (Note 3) | | | | 55 | |
Payable for securities purchased | | | | 23,345,403 | |
Payable for fund shares repurchased | | | | 405,351 | |
Accrued capital gains tax payable (Note 2) | | | | 57,840 | |
Other payables and accrued expenses | | | | 51,596 | |
| | | | | |
| |
TOTAL LIABILITIES | | | | 24,234,973 | |
| | | | | |
| |
TOTAL NET ASSETS | | | $ | 469,789,576 | |
| | | | | |
| |
NET ASSETS CONSIST OF: | | | | | |
| |
Capital stock | | | $ | 487,590 | |
Additional paid-in-capital | | | | 393,946,181 | |
Undistributed net investment income | | | | 2,532,160 | |
Accumulated net realized gain on investments, foreign currency and translation of other assets and liabilities | | | | 25,222 | |
Net unrealized appreciation on investments (net of accrued capital gains tax of $57,840), foreign currency and translation of other assets and liabilities | | | | 72,798,423 | |
| | | | | |
| |
TOTAL NET ASSETS | | | $ | 469,789,576 | |
| | | | | |
| |
NET ASSET VALUE, OFFERING PRICE AND REDEMPTION PRICE PER SHARE - Class A ($469,789,576/48,759,022 shares) | | | $ | 9.63 | |
| | | | | |
| | | | | | |
| | The accompanying notes are an integral part of the financial statements. | | | 9 | |
Statement of Operations (unaudited)
For the Six Months Ended June 30, 2011
| | | | | |
INVESTMENT INCOME: | | | | | |
| |
Dividends (net of foreign taxes withheld, $878,739) | | | $ | 7,135,593 | |
| | | | | |
| |
EXPENSES: | | | | | |
| |
Management fees (Note 3) | | | | 1,839,397 | |
Fund accounting and administration fees (Note 3) | | | | 38,990 | |
Transfer agent fees (Note 3) | | | | 8,783 | |
Directors’ fees (Note 3) | | | | 4,490 | |
Chief Compliance Officer service fees (Note 3) | | | | 1,314 | |
Custodian fees | | | | 87,003 | |
Miscellaneous | | | | 59,143 | |
| | | | | |
| |
Total Expenses | | | | 2,039,120 | |
| | | | | |
| |
NET INVESTMENT INCOME | | | | 5,096,473 | |
| | | | | |
| |
REALIZED AND UNREALIZED GAIN (LOSS) ON INVESTMENTS AND FOREIGN CURRENCY: | | | | | |
| |
Net realized gain (loss) on- | | | | | |
Investments | | | | 367,156 | |
Foreign currency, and translation of other assets and liabilities | | | | (169,298 | ) |
Forward foreign currency exchange contracts | | | | (619,613 | ) |
| | | | | |
| |
| | | | (421,755 | ) |
| | | | | |
| |
Net change in unrealized appreciation (depreciation) on- | | | | | |
Investments (net of change in accrued capital gains tax of $(57,629)) | | | | 26,706,320 | |
Foreign currency, and translation of other assets and liabilities | | | | 31,650 | |
Forward foreign currency exchange contracts | | | | 49,538 | |
| | | | | |
| |
| | | | 26,787,508 | |
| | | | | |
| |
NET REALIZED AND UNREALIZED GAIN ON INVESTMENTS AND FOREIGN CURRENCY | | | | 26,365,753 | |
| | | | | |
| |
NET INCREASE IN NET ASSETS RESULTING FROM OPERATIONS | | | $ | 31,462,226 | |
| | | | | |
| | | | |
| 10 | | The accompanying notes are an integral part of the financial statements. | | |
Statements of Changes in Net Assets
| | | | | | | | | | |
| | | For the Six
Months Ended
6/30/11
(unaudited) | | For the
Year Ended
12/31/10 |
INCREASE (DECREASE) IN NET ASSETS: | | | | | | | | | | |
| | |
OPERATIONS: | | | | | | | | | | |
| | |
Net investment income | | | $ | 5,096,473 | | | | $ | 4,612,429 | |
Net realized gain (loss) on investments and foreign currency | | | | (421,755 | ) | | | | 10,786,362 | |
Net change in unrealized appreciation (depreciation) on investments (net of change in accrued capital gains tax of $(57,629) and $(34, 045), respectively) and foreign currency | | | | 26,787,508 | | | | | 18,861,257 | |
| | | | | | | | | | |
| | |
Net increase from operations | | | | 31,462,226 | | | | | 34,260,048 | |
| | | | | | | | | | |
| | |
DISTRIBUTIONS TO SHAREHOLDERS (Note 8): | | | | | | | | | | |
| | |
From net investment income | | | | — | | | | | (6,327,558 | ) |
From net realized gain on investments | | | | — | | | | | (11,801,674 | ) |
| | | | | | | | | | |
| | |
Total distributions to shareholders | | | | — | | | | | (18,129,232 | ) |
| | | | | | | | | | |
| | |
CAPITAL STOCK ISSUED AND REPURCHASED: | | | | | | | | | | |
| | |
Net increase from capital share transactions (Note 5) | | | | 121,128,848 | | | | | 33,967,286 | |
| | | | | | | | | | |
| | |
Net increase in net assets | | | | 152,591,074 | | | | | 50,098,102 | |
| | |
NET ASSETS: | | | | | | | | | | |
| | |
Beginning of period | | | | 317,198,502 | | | | | 267,100,400 | |
| | | | | | | | | | |
| | |
End of period (including undistributed net investment income of $2,532,160 and distributions in excess of net investment income of $2,564,313, respectively) | | | $ | 469,789,576 | | | | $ | 317,198,502 | |
| | | | | | | | | | |
| | | | | | |
| | The accompanying notes are an integral part of the financial statements. | | | 11 | |
Financial Highlights
| | | | | | | | | | | | | | | | | | | | | | | | | | | | | | |
| | | For the Six Months Ended 6/30/11 | | For the Years Ended |
| | | (unaudited) | | 12/31/10 | | 12/31/09 | | 12/31/08 | | 12/31/07 | | 12/31/06 |
Per share data (for a share outstanding throughout each period): | | | | | | | | | | | | | | | | | | | | | | | | | | | | | | |
Net asset value - Beginning of period | | | $ | 8.85 | | | | $ | 8.39 | | | | $ | 6.57 | | | | $ | 10.87 | | | | $ | 9.84 | | | | $ | 9.90 | |
| | | | | | | | | | | | | | | | | | | | | | | | | | | | | | |
Income (loss) from investment operations: | | | | | | | | | | | | | | | | | | | | | | | | | | | | | | |
Net investment income | | | | 0.13 | 1 | | | | 0.14 | 1 | | | | 0.14 | 1 | | | | 0.22 | | | | | 0.15 | | | | | 0.15 | |
Net realized and unrealized gain (loss) on investments | | | | 0.65 | | | | | 0.86 | | | | | 2.10 | | | | | (3.82 | ) | | | | 1.12 | | | | | 2.01 | |
| | | | | | | | | | | | | | | | | | | | | | | | | | | | | | |
Total from investment operations | | | | 0.78 | | | | | 1.00 | | | | | 2.24 | | | | | (3.60 | ) | | | | 1.27 | | | | | 2.16 | |
| | | | | | | | | | | | | | | | | | | | | | | | | | | | | | |
Less distributions to shareholders: | | | | | | | | | | | | | | | | | | | | | | | | | | | | | | |
From net investment income | | | | — | | | | | (0.19 | ) | | | | (0.16 | ) | | | | (0.21 | ) | | | | (0.14 | ) | | | | (0.15 | ) |
From net realized gain on investments | | | | — | | | | | (0.35 | ) | | | | (0.26 | ) | | | | (0.49 | ) | | | | (0.10 | ) | | | | (2.07 | ) |
| | | | | | | | | | | | | | | | | | | | | | | | | | | | | | |
Total distributions to shareholders | | | | — | | | | | (0.54 | ) | | | | (0.42 | ) | | | | (0.70 | ) | | | | (0.24 | ) | | | | (2.22 | ) |
| | | | | | | | | | | | | | | | | | | | | | | | | | | | | | |
Net asset value - End of period | | | $ | 9.63 | | | | $ | 8.85 | | | | $ | 8.39 | | | | $ | 6.57 | | | | $ | 10.87 | | | | $ | 9.84 | |
| | | | | | | | | | | | | | | | | | | | | | | | | | | | | | |
Net assets - End of period (000’somitted) | | | $ | 469,790 | | | | $ | 317,199 | | | | $ | 267,100 | | | | $ | 182,273 | | | | $ | 270,080 | | | | $ | 215,981 | |
| | | | | | | | | | | | | | | | | | | | | | | | | | | | | | |
Total return2 | | | | 8.81 | % | | | | 12.04 | % | | | | 34.23 | % | | | | (33.25 | %) | | | | 13.01 | % | | | | 21.96 | % |
Ratios (to average net assets)/ Supplemental Data: | | | | | | | | | | | | | | | | | | | | | | | | | | | | | | |
Expenses* | | | | 1.11 | %3 | | | | 1.15 | % | | | | 1.15 | % | | | | 1.15 | % | | | | 1.16 | % | | | | 1.18 | % |
Net investment income | | | | 2.77 | %3 | | | | 1.68 | % | | | | 1.90 | % | | | | 2.49 | % | | | | 1.47 | % | | | | 1.39 | % |
Portfolio turnover | | | | 5 | % | | | | 13 | % | | | | 17 | % | | | | 9 | % | | | | 20 | % | | | | 30 | % |
|
* The investment advisor did not impose all of its management fees, CCO fees and fund accounting and transfer agent fees, and other fees in some periods and in some periods paid a portion of the Series’ expenses. If these expenses had been incurred by the Series, the expense ratio (to average net assets) would have been increased by the following amount: | |
| | | | N/A | | | | | 0.00 | %4 | | | | 0.00 | %4 | | | | N/A | | | | | N/A | | | | | N/A | |
| 1 | Calculated based on average shares outstanding during the period. |
| 2 | Represents aggregate total return for the period indicated, and assumes reinvestment of all distributions. Total return would have been lower had certain expenses not been waived during certain periods. Periods less than one year are not annualized. |
| | | | |
| 12 | | The accompanying notes are an integral part of the financial statements. | | |
Notes to Financial Statements (unaudited)
International Series (the “Series”) is a no-load diversified series of Manning & Napier Fund, Inc. (the “Fund”). The Fund is organized in Maryland and is registered under the Investment Company Act of 1940, as amended, as an open-end management investment company.
The Series’ investment objective is to provide long-term growth by investing principally in the common stocks of companies located outside the United States.
The Fund’s Advisor is Manning & Napier Advisors, Inc. (the “Advisor”). Shares of the Series are offered to investors, clients and employees of the Advisor and its affiliates. The Series resumed offering shares directly to investors on May 18, 2004, as it had done previously from time to time. The total authorized capital stock of the Fund consists of 10.0 billion shares of common stock each having a par value of $0.01. As of June 30, 2011, 6.4 billion shares have been designated in total among 31 series, of which 100 million have been designated as International Series Class A common stock.
| 2. | SIGNIFICANT ACCOUNTING POLICIES |
Security Valuation
Portfolio securities, including domestic equities, foreign equities, warrants and options, listed on an exchange other than the NASDAQ National Market System are valued at the latest quoted sales price of the exchange on which the security is primarily traded. Securities not traded on valuation date or securities not listed on an exchange are valued at the latest quoted bid price provided by the Fund’s pricing service. Securities listed on the NASDAQ National Market System are valued in accordance with the NASDAQ Official Closing Price.
Short-term investments that mature in sixty days or less are valued at amortized cost, which approximates market value. Investments in open-end investment companies are valued at their net asset value per share on valuation date.
Volume and level of activity in established markets for an asset or liability are evaluated to determine whether recent transactions and quoted prices are determinative of fair value. Where there have been significant decreases in volume and level of activity, further analysis and adjustment may be necessary to estimate fair value. The Series measures fair value in these instances by the use of inputs and valuation techniques which may be based upon current market prices of securities that are comparable in coupon, rating, maturity and industry and/or expectation of future cash flows. As a result of trading in relatively thin markets and/or markets that experience significant volatility, the prices used by the Series to value these securities may differ from the value that would be realized if these securities were sold, and the differences could be material.
Securities for which representative valuations or prices are not available from the Fund’s pricing service may be valued at fair value. Due to the inherent uncertainty of valuations of such securities, the fair value may differ significantly from the values that would have been used had a ready market for such securities existed. If trading or events occurring after the close of the principal market in which securities are traded are expected to materially affect the value of those securities, then they may be valued at their fair value, taking this trading or these events into account. Fair value is determined in good faith by the Advisor under procedures approved by and under the general supervision and responsibility of the Fund’s Board of Directors (the “Board”). In accordance with the procedures approved by the Board, certain securities trading outside the U.S. whose values were adjusted following the close of local trading use a factor from a third party vendor to the extent available. The value of securities used for net asset value calculation under these procedures may differ from published prices for the same securities. It is the Fund’s policy to classify each foreign equity security where a factor from a third party vendor is provided as a Level 2 security.
Various inputs are used in determining the value of the Series’ assets or liabilities carried at market value. These inputs are summarized in three broad levels. Level 1 includes quoted prices in active markets for identical assets
Notes to Financial Statements (unaudited)
| 2. | SIGNIFICANT ACCOUNTING POLICIES (continued) |
Security Valuation (continued)
and liabilities. Level 2 includes other significant observable inputs (including quoted prices for similar securities, interest rates, prepayment speeds, credit risk, etc.). Level 3 includes significant unobservable inputs (including the Series’ own assumptions in determining the fair value of investments). The inputs or methodology used for valuing securities are not necessarily an indication of the risk associated with investing in those securities.
The following is a summary of the valuation levels used for major security types as of June 30, 2011 in valuing the Series’ assets or liabilities carried at market value:
| | | | | | | | | | | | | | | | | | | | |
Description | | Total | | Level 1 | | Level 2 | | Level 3 |
Assets: | | | | | | | | | | | | | | | | | | | | |
Equity securities*: | | | | | | | | | | | | | | | | | | | | |
Consumer Discretionary | | | $ | 57,998,338 | | | | $ | 7,741,389 | | | | $ | 50,256,949 | | | | $ | — | |
Consumer Staples | | | | 75,907,357 | | | | | 13,611,250 | | | | | 62,296,107 | | | | | — | |
Energy | | | | 14,698,655 | | | | | 6,298,215 | | | | | 8,400,440 | | | | | — | |
Financials | | | | 42,952,537 | | | | | — | | | | | 42,939,703 | | | | | 12,834 | |
Health Care | | | | 55,919,076 | | | | | 26,725,655 | | | | | 29,193,421 | | | | | — | |
Industrials | | | | 71,804,667 | | | | | 14,914,397 | | | | | 56,890,270 | | | | | — | |
Information Technology | | | | 35,981,138 | | | | | 3,471,722 | | | | | 32,509,416 | | | | | — | |
Materials | | | | 19,655,625 | | | | | — | | | | | 19,655,625 | | | | | — | |
Telecommunication Services | | | | 36,138,148 | | | | | 22,853,946 | | | | | 13,284,202 | | | | | — | |
Utilities | | | | 13,039,981 | | | | | 3,650,146 | | | | | 9,389,835 | | | | | — | |
Preferred securities | | | | — | | | | | — | | | | | — | | | | | — | |
Debt securities | | | | — | | | | | — | | | | | — | | | | | — | |
Mutual funds | | | | 58,053,969 | | | | | 58,053,969 | | | | | — | | | | | — | |
Other financial instruments** | | | | 49,538 | | | | | — | | | | | 49,538 | | | | | — | |
| | | | | | | | | | | | | | | | | | | | |
Total assets | | | | 482,199,029 | | | | | 157,320,689 | | | | | 324,865,506 | | | | | 12,834 | |
| | | | | | | | | | | | | | | | | | | | |
Liabilities: | | | | | | | | | | | | | | | | | | | | |
Other financial instruments** | | | | — | | | | | — | | | | | — | | | | | — | |
| | | | | | | | | | | | | | | | | | | | |
Total liabilities | | | | — | | | | | — | | | | | — | | | | | — | |
| | | | | | | | | | | | | | | | | | | | |
Total | | | $ | 482,199,029 | | | | $ | 157,320,689 | | | | $ | 324,865,506 | | | | $ | 12,834 | |
| | | | | | | | | | | | | | | | | | | | |
The following table is a reconciliation of Level 3 investments for which significant unobservable inputs were used to determine fair value:
| | | | | |
Level 3 Reconciliation | | Equity
Securities |
Balance as of December 31, 2010 (market value) | | | $ | 36,734 | |
Accrued discounts/premiums | | | | — | |
Realized gain (loss) | | | | — | |
Change in unrealized appreciation/depreciation *** | | | | (43,391 | ) |
Purchases | | | | 19,491 | |
Sales | | | | — | |
Transfers In | | | | — | |
Transfers Out | | | | — | |
| | | | | |
Balance as of June 30, 2011 (market value) | | | $ | 12,834 | |
| | | | | |
Notes to Financial Statements (unaudited)
| 2. | SIGNIFICANT ACCOUNTING POLICIES (continued) |
Security Valuation (continued)
| * | Includes common stock, warrants and rights. Please see the Investment Portfolio for securities where a latest quoted sales price is not available and the latest quoted bid price was used to value the security or foreign securities where values were adjusted following the close of local trading using a factor from a third party vendor. Such securities are included in Level 2 in the table above. |
| ** | Other financial instruments are derivative instruments not reflected in the Investment Portfolio, such as futures, forwards and swap contracts, which are valued at the unrealized appreciation/depreciation on the instrument. |
| *** | The change in unrealized appreciation (depreciation) on securities still held at June 30, 2011 was $(6,657). |
The Fund’s policy is to recognize transfers in and transfers out of the valuation levels as of the beginning of the reporting period. there were no significant transfers between Level 1 and Level 2 during the six months ended June 30, 2011.
Recent Accounting Standard
In May 2011, the Financial Accounting Standards Board issued amended guidance to improve disclosure about fair value measurements which will require the following disclosures for fair value measurements categorized as Level 3: quantitative information about the unobservable inputs and assumptions used in the fair value measurement, a description of the valuation policies and procedures and a narrative description of the sensitivity of the fair value measurement to changes in unobservable inputs and the interrelationships between those unobservable inputs. In addition, the amounts and reasons for all transfers in and out of Level 1 and Level 2 will be required to be disclosed. The amended guidance is effective for financial statements for fiscal years beginning after December 15, 2011, and interim periods within those fiscal years. Management is evaluating the impact of this guidance on the Series’ financial statements and disclosures.
Security Transactions, Investment Income and Expenses
Security transactions are accounted for on trade date. Dividend income is recorded on the ex-dividend date, except that if the ex-dividend date has passed, certain dividends from foreign securities are recorded as soon as the Fund is informed of the ex-dividend date. Non-cash dividends, if any, are recorded at the fair market value of the securities received. Interest income, including amortization of premium and accretion of discounts using the effective interest method, is earned from settlement date and accrued daily.
Expenses are recorded on an accrual basis. Most expenses of the Fund can be attributed to a specific series. Expenses which cannot be directly attributed are apportioned among the series in the Fund in such a manner as deemed equitable by the Fund’s Board, taking into consideration, among other things, the nature and type of expense.
The Series uses the identified cost method for determining realized gain or loss on investments for both financial statement and federal income tax reporting purposes.
Foreign Currency Translation
The books and records of the Series are maintained in U.S. dollars. Foreign currencies, investments and other assets and liabilities are translated into U.S. dollars at the current exchange rates. Purchases and sales of investment securities and income and expenses are translated on the respective dates of such transactions. The Series does not isolate realized and unrealized gains and losses attributable to changes in the exchange rates from gains and losses that arise from changes in the market value of investments. Such fluctuations are included with net realized and unrealized gain or loss on investments. Net realized foreign currency gains and losses represent foreign currency gains and losses between trade date and settlement date on securities transactions, gains and losses on disposition
Notes to Financial Statements (unaudited)
| 2. | SIGNIFICANT ACCOUNTING POLICIES (continued) |
Foreign Currency Translation (continued)
of foreign currencies and the difference between the amount of income and foreign withholding taxes recorded on the books of the Series and the amounts actually received or paid.
Forward Foreign Currency Exchange Contracts
The Series may purchase or sell forward foreign currency exchange contracts in order to hedge a portfolio position or specific transaction. Risks may arise if the counterparties to a contract are unable to meet the terms of the contract or if the value of the foreign currency moves unfavorably.
All forward foreign currency exchange contracts are adjusted daily by the exchange rate of the underlying currency and, for financial statement purposes, any gain or loss is recorded as unrealized gain or loss until a contract has been closed. Realized and unrealized gain or loss arising from a transaction is included in net realized and unrealized gain (loss) on investments.
The Series may regularly trade forward foreign currency exchange contracts with off-balance sheet risk in the normal course of its investing activities to assist in managing exposure to changes in foreign currency exchange rates.
The notional or contractual amount of these instruments represents the investment the Series has in forward foreign currency exchange contracts and does not necessarily represent the amounts potentially at risk. The measurement of the risks associated with forward foreign currency exchange contracts is meaningful only when all related and offsetting transactions are considered. Investments in forward foreign currency exchange contacts held by the Series on June 30, 2011 are shown at the end of the Investment Portfolio, which is indicative of volume of derivative activity during the period.
Federal Taxes
The Series’ policy is to comply with the provisions of the Internal Revenue Code applicable to regulated investment companies. The Series is not subject to federal income tax or excise tax to the extent that the Series distributes to shareholders each year its taxable income, including any net realized gains on investments, in accordance with requirements of the Internal Revenue Code. Accordingly, no provision for federal income tax or excise tax has been made in the financial statements.
Management evaluates its tax positions to determine if the tax positions taken meet the minimum recognition threshold in connection with accounting for uncertainties in income tax positions taken or expected to be taken for the purposes of measuring and recognizing tax liabilities in the financial statements. Recognition of tax benefits of an uncertain tax position is required only when the position is “more likely than not” to be sustained assuming examination by taxing authorities. At June 30, 2011, the Series has recorded no liability for net unrecognized tax benefits relating to uncertain income tax positions taken or expected to be taken in future tax returns.
The Series files income tax returns in the U.S. federal jurisdiction, various states and foreign jurisdictions, as required. No income tax returns are currently under investigation. The statute of limitations on the Series’ tax returns remains open for the years ended December 31, 2007 through December 31, 2010. The Fund is not aware of any tax positions for which it is reasonably possible that the total amounts of unrecognized tax benefits will significantly change in the next twelve months.
Additionally, based on the Fund’s understanding of the tax rules and rates related to income, gains and transactions for foreign jurisdictions in which it invests, the Series will provide for foreign taxes, and where appropriate, deferred foreign tax.
Notes to Financial Statements (unaudited)
| 2. | SIGNIFICANT ACCOUNTING POLICIES (continued) |
Distributions of Income and Gains
Distributions to shareholders of net investment income and net realized gains are made annually. An additional distribution may be necessary to avoid taxation of the Series. Distributions are recorded on the ex-dividend date.
Indemnifications
The Fund’s organizational documents provide former and current directors and officers with a limited indemnification against liabilities arising in connection with the performance of their duties to the Fund. In the normal course of business, the Fund may also enter into contracts that provide general indemnifications. The Fund’s maximum exposure under these arrangements is unknown as this would be dependent on future claims that may be made against the Fund. The risk of material loss from such claims is considered remote.
Other
The preparation of financial statements in conformity with accounting principles generally accepted in the United States of America requires management to make estimates and assumptions that affect the reported amounts of assets and liabilities and the disclosure of contingent assets and liabilities at the date of the financial statements and the reported amounts of income and expenses during the reporting period. Actual results could differ from those estimates.
| 3. | TRANSACTIONS WITH AFFILIATES |
The Fund has an Investment Advisory Agreement (the “Agreement”) with the Advisor, for which the Series pays a fee, computed daily and payable monthly, at an annual rate of 1.00% of the Series’ average daily net assets.
Under the Agreement, personnel of the Advisor provide the Series with advice and assistance in the choice of investments and the execution of securities transactions, and otherwise maintain the Series’ organization. The Advisor also provides the Fund with necessary office space and fund administration and support services. The salaries of all officers of the Fund (except a percentage of the Fund’s Chief Compliance Officer’s salary, which is paid by the Fund), and of all Directors who are “affiliated persons” of the Fund, or of the Advisor, and all personnel of the Fund, or of the Advisor, performing services relating to research, statistical and investment activities, are paid by the Advisor. Each “non-affiliated” Director receives an annual stipend, which is allocated among all the active series of the Fund. In addition, these Directors also receive a fee per Board meeting attended plus a fee for each committee meeting attended.
The Advisor did not waive any fees for the six months ended June 30, 2011. The Advisor is not eligible to recoup any expenses that have been waived or reimbursed in prior years.
Manning & Napier Investor Services, Inc., a registered broker-dealer affiliate of the Advisor, acts as distributor for the Fund’s shares. The services of Manning & Napier Investor Services, Inc. are provided at no additional cost to the Series.
The Advisor has agreements with BNY Mellon Investment Servicing (U.S.) Inc. (“BNY”) under which BNY serves as sub-accountant services agent and sub-transfer agent. The Fund pays the Advisor an annual fee related to fund accounting and administration of 0.0175% on the first $3 billion of average daily net assets (excluding Target Series); 0.015% on the next $3 billion of average daily net assets (excluding Target Series); and 0.01% of the average daily net assets in excess of $6 billion (excluding Target Series); plus a base fee of $25,500 per Series. Transfer Agent fees are charged to the Fund on a per account basis. Additionally, certain transaction- and cusip-based fees and out-of-pocket expenses, including charges for reporting relating to the Fund’s compliance program, are charged.
Expenses not directly attributable to a Series are allocated based on each Series’ relative net assets or number of accounts, depending on the expense.
Notes to Financial Statements (unaudited)
| 4. | PURCHASES AND SALES OF SECURITIES |
For the six months ended June 30, 2011, purchases and sales of securities, other than U.S. Government securities and short-term securities, were $112,002,622 and $16,603,840, respectively. There were no purchases or sales of U.S. Government securities.
| 5. | CAPITAL STOCK TRANSACTIONS |
Transactions in shares of International Series were:
| | | | | | | | | | | | | | | | | | | | |
| | | For the Six Months
Ended 6/30/11 | | For the Year
Ended 12/31/10 |
| | | Shares | | Amount | | Shares | | Amount |
Sold | | | | 14,563,972 | | | | $ | 136,394,330 | | | | | 4,885,983 | | | | $ | 40,773,050 | |
Reinvested | | | | — | | | | | — | | | | | 2,043,894 | | | | | 17,734,979 | |
Repurchased | | | | (1,646,708 | ) | | | | (15,265,482 | ) | | | | (2,930,271 | ) | | | | (24,540,743 | ) |
| | | | | | | | | | | | | | | | | | | | |
Total | | | | 12,917,264 | | | | $ | 121,128,848 | | | | | 3,999,606 | | | | $ | 33,967,286 | |
| | | | | | | | | | | | | | | | | | | | |
Substantially all of the Series’ shares represent investments by fiduciary accounts over which the Advisor has sole investment discretion.
The Series may trade in instruments including written and purchased options, forward foreign currency exchange contracts and futures contracts and other derivatives in the normal course of investing activities to assist in managing exposure to various market risks. The Series may be subject to various elements of risk, which may involve, to a varying degree, elements of risk in excess of the amounts recognized for financial statement purposes. These risks include: the risk that changes in the value of a derivative may not correlate perfectly with the underlying asset, rate or index, counterparty credit risk related to over the counter derivatives’ counterparties failure to perform under contract terms, liquidity risk related to the lack of a liquid market for these contracts allowing the fund to close out its position(s) and documentation risk relating to disagreement over contract terms. No such investments were held by the Series on June 30, 2011.
Investing in securities of foreign companies and foreign governments involves special risks and considerations not typically associated with investing in securities of domestic companies and the U.S. Government. These risks include revaluation of currencies and future adverse political and economic developments. Moreover, securities of foreign companies and foreign governments and their markets may be less liquid and their prices more volatile than those of comparable domestic companies and the U.S. Government.
| 8. | FEDERAL INCOME TAX INFORMATION |
The amount and characterization of certain income and capital gains to be distributed are determined in accordance with federal income tax regulations, which may differ from accounting principles generally accepted in the United States of America. The Series may periodically make reclassifications among its capital accounts to reflect income and gains available for distribution (or available capital loss carryovers) under income tax regulations, without impacting the Series’ net asset value. Any such reclassifications are not reflected in the financial highlights.
The final determination of the tax character of current year distributions will be made at the conclusion of the fiscal year. The tax character of distributions paid for the year ended December 31, 2010 were as follows:
Notes to Financial Statements (unaudited)
| 8. | FEDERAL INCOME TAX INFORMATION (continued) |
| | | | | |
Ordinary income | | | $ | 12,805,548 | |
Long-term capital gains | | | | 5,323,684 | |
At June 30, 2011, the identified cost of investments for federal income tax purposes, the resulting gross unrealized appreciation and depreciation, and the net unrealized appreciation were as follows:
| | | | | |
Cost for federal income tax purposes | | | $ | 409,394,681 | |
Unrealized appreciation | | | $ | 86,857,921 | |
Unrealized depreciation | | | | (14,103,111 | ) |
| | | | | |
Net unrealized appreciation | | | $ | 72,754,810 | |
| | | | | |
Literature Requests (unaudited)
Proxy Voting Policies and Procedures
A description of the policies and procedures that the Fund uses to determine how to vote proxies relating to portfolio securities is available, without charge, upon request:
| | |
| By phone | | 1-800-466-3863 |
| On the Securities and Exchange Commission’s (SEC) web site | | http://www.sec.gov |
Proxy Voting Record
Information regarding how the Fund voted proxies relating to portfolio securities during the most recent 12-month period ended June 30th is available, without charge, upon request:
| | |
| By phone | | 1-800-466-3863 |
| On the SEC’s web site | | http://www.sec.gov |
Quarterly Portfolio Holdings
The Series’ complete schedule of portfolio holdings for the 1st and 3rd quarters of each fiscal year are provided on Form N-Q, and are available, without charge, upon request:
| | |
| By phone | | 1-800-466-3863 |
| On the SEC’s web site | | http://www.sec.gov |
The Series’ Form N-Q may be reviewed and copied at the SEC’s Public Reference Room in Washington, D.C. Information on the operation of the Public Reference Room may be obtained by calling 1-800-SEC-0330.
Prospectus and Statement of Additional Information (SAI)
The prospectus and SAI provide additional information about each Series, including charges, expenses and risks. These documents are available, without charge, upon request:
| | |
| By phone | | 1-800-466-3863 |
| On the SEC’s web site | | http://www.sec.gov |
| On our web site | | http://www.manning-napier.com |
Additional information available at www.manning-napier.com
1. Fund Holdings - Month-End
2. Fund Holdings - Quarter-End
3. Shareholder Report - Annual
4. Shareholder Report - Semi-Annual
The Fund also offers electronic notification or “e-delivery” when certain documents are available on-line to be downloaded or reviewed. Direct shareholders can elect to receive electronic notification when shareholder reports, prospectus updates, and / or quarterly statements are available. If you do not currently have on-line access to your account, you can establish access by going to www.manning-napier.com, click on “Login” in the top corner of the page, and follow the prompts to self-enroll. Once enrolled, you can set your electronic notification preferences by clicking on the Account Options tab located within the green toolbar and then select E-Delivery Option. Should you have any questions on either how to establish on-line access or how to update your account settings, please do not hesitate to contact Investor Services at 1-800-466-3863.
MNINT-6/11-SAR


| | | | |
| | WORLD OPPORTUNITIES SERIES | | |
Shareholder Expense Example (unaudited)
As a shareholder of the Series, you may incur two types of costs: (1) transaction costs and (2) ongoing costs, including management fees and other Series expenses. This example is intended to help you understand your ongoing costs (in dollars) of investing in the Series and to compare these costs with the ongoing costs of investing in other mutual funds.
The example is based on an investment of $1,000 invested at the beginning of the period and held for the entire period (January 1, 2011 to June 30, 2011).
Actual Expenses
The first line of the table below provides information about actual account values and actual expenses. You may use the information in this line, together with the amount you invested, to estimate the expenses that you paid over the period. Simply divide your account value by $1,000 (for example, an $8,600 account value divided by $1,000 = 8.6), then multiply the result by the number in the first line under the heading entitled “Expenses Paid During Period” to estimate the expenses you paid on your account during this period.
Hypothetical Example for Comparison Purposes
The second line of the table below provides information about hypothetical account values and hypothetical expenses based on the Series’ actual expense ratio and an assumed rate of return of 5% per year before expenses, which is not the Series’ actual return. The hypothetical account values and expenses may not be used to estimate the actual ending account balance or expenses you paid during the period. You may use this information to compare the ongoing costs of investing in the Series and other funds. To do so, compare this 5% hypothetical example with the 5% hypothetical examples that appear in the shareholder reports of the other funds.
Please note that the expenses shown in the table are meant to highlight your ongoing costs only and do not reflect any transaction costs. Therefore, the second line of the table is useful in comparing ongoing costs only, and will not help you determine the relative total costs of owning different funds. In addition, if these transaction costs were included, your costs would have been higher.
| | | | | | | | | | | | | | | |
| | | Beginning
Account Value
1/1/11 | | Ending
Account Value
6/30/11 | | Expenses Paid
During Period*
1/1/11-6/30/11 |
Actual | | | $ | 1,000.00 | | | | $ | 1,067.40 | | | | $ | 5.54 | |
Hypothetical
(5% return before expenses) | | | $ | 1,000.00 | | | | $ | 1,019.44 | | | | $ | 5.41 | |
| * | Expenses are equal to the Series’ annualized expense ratio (for the six-month period) of 1.08%, multiplied by the average account value over the period, multiplied by 181/365 (to reflect the one-half year period). Expenses are based on the most recent fiscal half year. |
Portfolio Composition
As of June 30, 2011 (unaudited)
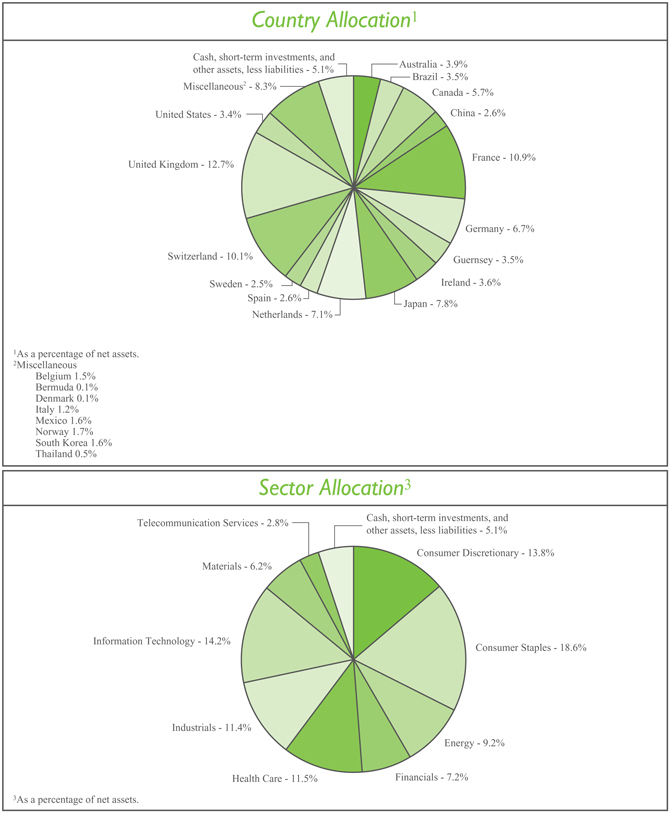
Investment Portfolio - June 30, 2011 (unaudited)
| | | | | | | | | | |
| | | Shares | | Value
(Note 2) |
| | |
COMMON STOCKS - 93.8% | | | | | | | | | | |
| | |
Consumer Discretionary - 13.8% | | | | | | | | | | |
Automobiles - 2.1% | | | | | | | | | | |
Suzuki Motor Corp. (Japan)1 | | | | 3,878,800 | | | | $ | 87,434,137 | |
Toyota Motor Corp. (Japan)1 | | | | 2,031,800 | | | | | 83,667,873 | |
| | | | | | | | | | |
| | | | | | | | | 171,102,010 | |
| | | | | | | | | | |
Hotels, Restaurants & Leisure - 1.8% | | | | | | | | | | |
Accor S.A. (France)1 | | | | 1,921,280 | | | | | 85,953,837 | |
Ctrip.com International Ltd. - ADR (China)* | | | | 1,421,070 | | | | | 61,219,696 | |
| | | | | | | | | | |
| | | | | | | | | 147,173,533 | |
| | | | | | | | | | |
Internet & Catalog Retail - 0.2% | | | | | | | | | | |
Ocado Group plc (United Kingdom)*1 | | | | 5,773,950 | | | | | 16,893,624 | |
| | | | | | | | | | |
Media - 7.0% | | | | | | | | | | |
Grupo Televisa S.A. - ADR (Mexico) | | | | 5,365,000 | | | | | 131,979,000 | |
Imax Corp. (Canada)* | | | | 2,051,970 | | | | | 66,545,387 | |
Liberty Global, Inc. - Class A (United States)* | | | | 1,929,970 | | | | | 86,925,849 | |
Mediaset S.p.A. (Italy)1 | | | | 7,821,480 | | | | | 36,769,315 | |
Reed Elsevier plc (United Kingdom)1 | | | | 4,508,970 | | | | | 41,051,301 | |
Societe Television Francaise 1 (France)1 | | | | 9,851,286 | | | | | 179,705,140 | |
Virgin Media, Inc. (United Kingdom) | | | | 1,430,730 | | | | | 42,821,749 | |
| | | | | | | | | | |
| | | | | | | | | 585,797,741 | |
| | | | | | | | | | |
Multiline Retail - 1.2% | | | | | | | | | | |
Marks & Spencer Group plc (United Kingdom)1 | | | | 17,352,180 | | | | | 100,590,225 | |
| | | | | | | | | | |
Textiles, Apparel & Luxury Goods - 1.5% | | | | | | | | | | |
Adidas AG (Germany)1 | | | | 1,528,300 | | | | | 121,166,888 | |
| | | | | | | | | | |
Total Consumer Discretionary | | | | | | | | | 1,142,724,021 | |
| | | | | | | | | | |
Consumer Staples - 17.5% | | | | | | | | | | |
Beverages - 2.8% | | | | | | | | | | |
Anheuser-Busch InBev N.V. (Belgium)1 | | | | 2,093,130 | | | | | 121,480,532 | |
Heineken N.V. (Netherlands)1 | | | | 1,811,710 | | | | | 109,041,882 | |
| | | | | | | | | | |
| | | | | | | | | 230,522,414 | |
| | | | | | | | | | |
Food & Staples Retailing - 5.8% | | | | | | | | | | |
Carrefour S.A. (France)1 | | | | 4,214,880 | | | | | 173,272,771 | |
Koninklijke Ahold N.V. (Netherlands)1 | | | | 7,575,460 | | | | | 101,854,739 | |
Tesco plc (United Kingdom)1 | | | | 31,996,760 | | | | | 206,731,142 | |
| | | | | | | | | | |
| | | | | | | | | 481,858,652 | |
| | | | | | | | | | |
Food Products - 6.4% | | | | | | | | | | |
Danone S.A. (France)1 | | | | 2,329,010 | | | | | 173,868,912 | |
Nestle S.A. (Switzerland)1 | | | | 2,705,910 | | | | | 168,384,832 | |
Unilever plc - ADR (United Kingdom) | | | | 5,869,200 | | | | | 190,103,388 | |
| | | | | | | | | | |
| | | | | | | | | 532,357,132 | |
| | | | | | | | | | |
| | | | | | |
| | The accompanying notes are an integral part of the financial statements. | | | 3 | |
Investment Portfolio - June 30, 2011 (unaudited)
| | | | | | | | | | |
| | | Shares | | Value
(Note 2) |
| | |
COMMON STOCKS (continued) | | | | | | | | | | |
| | |
Consumer Staples (continued) | | | | | | | | | | |
Household Products - 1.0% | | | | | | | | | | |
Reckitt Benckiser Group plc (United Kingdom)1 | | | | 1,508,840 | | | | $ | 83,336,661 | |
| | | | | | | | | | |
Personal Products - 1.5% | | | | | | | | | | |
Beiersdorf AG (Germany)1 | | | | 1,326,870 | | | | | 86,209,319 | |
Natura Cosmeticos S.A. (Brazil) | | | | 1,498,540 | | | | | 37,563,121 | |
| | | | | | | | | | |
| | | | | | | | | 123,772,440 | |
| | | | | | | | | | |
Total Consumer Staples | | | | | | | | | 1,451,847,299 | |
| | | | | | | | | | |
Energy - 9.2% | | | | | | | | | | |
Energy Equipment & Services - 5.8% | | | | | | | | | | |
Compagnie Generale de Geophysique - Veritas (CGG - Veritas) (France)*1 | | | | 4,377,680 | | | | | 160,439,522 | |
Petroleum Geo-Services ASA (Norway)*1 | | | | 2,833,800 | | | | | 40,483,027 | |
Schlumberger Ltd. (United States) | | | | 2,256,010 | | | | | 194,919,264 | |
Trican Well Service Ltd. (Canada) | | | | 3,494,970 | | | | | 82,115,216 | |
| | | | | | | | | | |
| | | | | | | | | 477,957,029 | |
| | | | | | | | | | |
Oil, Gas & Consumable Fuels - 3.4% | | | | | | | | | | |
Cameco Corp. (Canada) | | | | 5,034,060 | | | | | 132,647,481 | |
Talisman Energy, Inc. (Canada) | | | | 7,376,480 | | | | | 151,514,406 | |
| | | | | | | | | | |
| | | | | | | | | 284,161,887 | |
| | | | | | | | | | |
Total Energy | | | | | | | | | 762,118,916 | |
| | | | | | | | | | |
Financials - 7.2% | | | | | | | | | | |
Commercial Banks - 3.0% | | | | | | | | | | |
Banco Santander S.A. (Spain)1 | | | | 11,281,280 | | | | | 129,962,675 | |
HSBC Holdings plc (United Kingdom)1 | | | | 12,185,970 | | | | | 120,821,067 | |
| | | | | | | | | | |
| | | | | | | | | 250,783,742 | |
| | | | | | | | | | |
Diversified Financial Services - 2.0% | | | | | | | | | | |
Deutsche Boerse AG (Germany)1 | | | | 2,151,130 | | | | | 163,335,234 | |
| | | | | | | | | | |
Insurance - 1.2% | | | | | | | | | | |
Allianz SE (Germany)1 | | | | 716,950 | | | | | 99,976,967 | |
| | | | | | | | | | |
Real Estate Investment Trusts (REITS) - 1.0% | | | | | | | | | | |
British Land Co. plc (United Kingdom)1 | | | | 4,391,830 | | | | | 42,939,375 | |
Land Securities Group plc (United Kingdom)1 | | | | 3,310,830 | | | | | 45,292,456 | |
| | | | | | | | | | |
| | | | | | | | | 88,231,831 | |
| | | | | | | | | | |
Total Financials | | | | | | | | | 602,327,774 | |
| | | | | | | | | | |
Health Care - 11.5% | | | | | | | | | | |
Health Care Equipment & Supplies - 4.4% | | | | | | | | | | |
Cochlear Ltd. (Australia)1 | | | | 1,308,290 | | | | | 101,258,203 | |
Getinge AB - Class B (Sweden)1 | | | | 2,249,260 | | | | | 60,485,895 | |
Mindray Medical International Ltd. - ADR (China)2 | | | | 4,578,950 | | | | | 128,439,547 | |
| | | | |
| 4 | | The accompanying notes are an integral part of the financial statements. | | |
Investment Portfolio - June 30, 2011 (unaudited)
| | | | | | | | | | |
| | | Shares | | Value
(Note 2) |
| | |
COMMON STOCKS (continued) | | | | | | | | | | |
| | |
Health Care (continued) | | | | | | | | | | |
Health Care Equipment & Supplies (continued) | | | | | | | | | | |
Straumann Holding AG (Switzerland)1 | | | | 312,000 | | | | $ | 75,240,636 | |
| | | | | | | | | | |
| | | | | | | | | 365,424,281 | |
| | | | | | | | | | |
Health Care Providers & Services - 3.3% | | | | | | | | | | |
BML, Inc. (Japan)1 | | | | 554,500 | | | | | 14,029,458 | |
Bumrungrad Hospital Public Co. Ltd. - NVDR (Thailand)1 | | | | 32,763,900 | | | | | 38,998,683 | |
Sonic Healthcare Ltd. (Australia)1 | | | | 16,077,890 | | | | | 222,493,279 | |
| | | | | | | | | | |
| | | | | | | | | 275,521,420 | |
| | | | | | | | | | |
Life Sciences Tools & Services - 3.8% | | | | | | | | | | |
Lonza Group AG (Switzerland)1,2 | | | | 3,314,460 | | | | | 259,665,034 | |
QIAGEN N.V. (Netherlands)*1 | | | | 1,580,880 | | | | | 30,307,192 | |
WuXi PharmaTech (Cayman), Inc. - ADR (China)* | | | | 1,550,750 | | | | | 27,231,170 | |
| | | | | | | | | | |
| | | | | | | | | 317,203,396 | |
| | | | | | | | | | |
Total Health Care | | | | | | | | | 958,149,097 | |
| | | | | | | | | | |
Industrials - 11.4% | | | | | | | | | | |
Aerospace & Defense - 0.9% | | | | | | | | | | |
European Aeronautic Defence and Space Co. N.V. (Netherlands)1 | | | | 2,260,830 | | | | | 75,664,985 | |
| | | | | | | | | | |
Air Freight & Logistics - 2.1% | | | | | | | | | | |
PostNL N.V. (Netherlands)1 | | | | 9,087,160 | | | | | 77,003,791 | |
TNT Express N.V. (Netherlands)*1 | | | | 9,087,160 | | | | | 94,247,757 | |
| | | | | | | | | | |
| | | | | | | | | 171,251,548 | |
| | | | | | | | | | |
Airlines - 2.6% | | | | | | | | | | |
Ryanair Holdings plc - ADR (Ireland) | | | | 7,237,000 | | | | | 212,333,580 | |
| | | | | | | | | | |
Commercial Services & Supplies - 0.0%** | | | | | | | | | | |
Edenred (France)1 | | | | 73,250 | | | | | 2,234,955 | |
| | | | | | | | | | |
Electrical Equipment - 2.3% | | | | | | | | | | |
ABB Ltd. (Asea Brown Boveri) - ADR (Switzerland) | | | | 3,194,460 | | | | | 82,896,237 | |
Nexans S.A. (France)1 | | | | 449,270 | | | | | 42,293,847 | |
Prysmian S.p.A. (Italy)1 | | | | 3,077,330 | | | | | 61,947,646 | |
| | | | | | | | | | |
| | | | | | | | | 187,137,730 | |
| | | | | | | | | | |
Machinery - 0.5% | | | | | | | | | | |
Westport Innovations, Inc. (Canada)* | | | | 1,738,780 | | | | | 41,765,496 | |
| | | | | | | | | | |
Marine - 0.2% | | | | | | | | | | |
D/S Norden (Denmark)1 | | | | 359,770 | | | | | 12,394,730 | |
Pacific Basin Shipping Ltd. (Bermuda)1 | | | | 13,466,600 | | | | | 7,714,430 | |
| | | | | | | | | | |
| | | | | | | | | 20,109,160 | |
| | | | | | | | | | |
Professional Services - 1.5% | | | | | | | | | | |
Adecco S.A. (Switzerland)1 | | | | 979,930 | | | | | 62,897,132 | |
| | | | | | |
| | The accompanying notes are an integral part of the financial statements. | | | 5 | |
Investment Portfolio - June 30, 2011 (unaudited)
| | | | | | | | | | |
| | | Shares | | Value
(Note 2) |
| | |
COMMON STOCKS (continued) | | | | | | | | | | |
| | |
Industrials (continued) | | | | | | | | | | |
Professional Services (continued) | | | | | | | | | | |
Randstad Holding N.V. (Netherlands)1 | | | | 1,317,130 | | | | $ | 60,901,642 | |
| | | | | | | | | | |
| | | | | | | | | 123,798,774 | |
| | | | | | | | | | |
Road & Rail - 1.3% | | | | | | | | | | |
All America Latina Logistica S.A. (Brazil) | | | | 13,215,120 | | | | | 111,519,643 | |
| | | | | | | | | | |
Total Industrials | | | | | | | | | 945,815,871 | |
| | | | | | | | | | |
Information Technology - 14.2% | | | | | | | | | | |
Communications Equipment - 2.8% | | | | | | | | | | |
Alcatel-Lucent - ADR (France)* | | | | 15,178,510 | | | | | 87,580,003 | |
Telefonaktiebolaget LM Ericsson - Class B (Sweden)1 | | | | 10,002,070 | | | | | 143,984,844 | |
| | | | | | | | | | |
| | | | | | | | | 231,564,847 | |
| | | | | | | | | | |
Internet Software & Services - 0.4% | | | | | | | | | | |
VistaPrint N.V. (Netherlands)* | | | | 795,080 | | | | | 38,044,578 | |
| | | | | | | | | | |
IT Services - 6.3% | | | | | | | | | | |
Amadeus IT Holding S.A. - Class A (Spain)*1 | | | | 2,111,960 | | | | | 43,899,005 | |
Amdocs Ltd. (Guernsey)* | | | | 9,601,570 | | | | | 291,791,712 | |
Cielo S.A. (Brazil) | | | | 3,141,392 | | | | | 77,898,228 | |
Indra Sistemas S.A. (Spain)1 | | | | 1,980,480 | | | | | 40,853,453 | |
Redecard S.A. (Brazil) | | | | 4,423,940 | | | | | 66,331,462 | |
| | | | | | | | | | |
| | | | | | | | | 520,773,860 | |
| | | | | | | | | | |
Semiconductors & Semiconductor Equipment - 4.2% | | | | | | | | | | |
Advantest Corp. (Japan)1 | | | | 9,015,600 | | | | | 165,972,002 | |
Sumco Corp. (Japan)*1 | | | | 6,014,420 | | | | | 101,826,499 | |
Tokyo Electron Ltd. (Japan)1 | | | | 1,547,280 | | | | | 84,609,712 | |
| | | | | | | | | | |
| | | | | | | | | 352,408,213 | |
| | | | | | | | | | |
Software - 0.5% | | | | | | | | | | |
Misys plc (United Kingdom)*1 | | | | 5,705,472 | | | | | 38,493,661 | |
| | | | | | | | | | |
Total Information Technology | | | | | | | | | 1,181,285,159 | |
| | | | | | | | | | |
Materials - 6.2% | | | | | | | | | | |
Chemicals - 4.1% | | | | | | | | | | |
Johnson Matthey plc (United Kingdom)1 | | | | 3,962,240 | | | | | 125,123,941 | |
Shin-Etsu Chemical Co. Ltd. (Japan)1 | | | | 2,094,600 | | | | | 112,274,258 | |
Syngenta AG (Switzerland)1 | | | | 312,420 | | | | | 105,582,503 | |
| | | | | | | | | | |
| | | | | | | | | 342,980,702 | |
| | | | | | | | | | |
Construction Materials - 2.1% | | | | | | | | | | |
CRH plc (Ireland)1 | | | | 3,883,340 | | | | | 86,567,639 | |
| | | | |
| 6 | | The accompanying notes are an integral part of the financial statements. | | |
Investment Portfolio - June 30, 2011 (unaudited)
| | | | | | | | | | |
| | | Shares | | Value
(Note 2) |
| | |
COMMON STOCKS (continued) | | | | | | | | | | |
| | |
Materials (continued) | | | | | | | | | | |
Construction Materials (continued) | | | | | | | | | | |
Holcim Ltd. (Switzerland)1 | | | | 1,107,310 | | | | $ | 83,740,373 | |
| | | | | | | | | | |
| | | | | | | | | 170,308,012 | |
| | | | | | | | | | |
Total Materials | | | | | | | | | 513,288,714 | |
| | | | | | | | | | |
Telecommunication Services - 2.8% | | | | | | | | | | |
Diversified Telecommunication Services - 1.2% | | | | | | | | | | |
Telenor ASA (Norway)1 | | | | 6,207,830 | | | | | 101,592,964 | |
| | | | | | | | | | |
Wireless Telecommunication Services - 1.6% | | | | | | | | | | |
SK Telecom Co. Ltd. - ADR (South Korea) | | | | 6,939,610 | | | | | 129,770,707 | |
| | | | | | | | | | |
Total Telecommunication Services | | | | | | | | | 231,363,671 | |
| | | | | | | | | | |
TOTAL COMMON STOCKS
(Identified Cost $7,269,520,669) | | | | | | | | | 7,788,920,522 | |
| | | | | | | | | | |
PREFERRED STOCKS - 1.1% | | | | | | | | | | |
Consumer Staples - 1.1% | | | | | | | | | | |
Household Products - 1.1% | | | | | | | | | | |
Henkel AG & Co. KGaA (Germany)1
(Identified Cost $51,452,504) | | | | 1,284,670 | | | | | 89,334,090 | |
| | | | | | | | | | |
| | |
SHORT-TERM INVESTMENTS - 3.8% | | | | | | | | | | |
Dreyfus Cash Management, Inc. - Institutional Shares3, 0.10%
(Identified Cost $315,251,808) | | | | 315,251,808 | | | | | 315,251,808 | |
| | | | | | | | | | |
TOTAL INVESTMENTS - 98.7%
(Identified Cost $7,636,224,981) | | | | | | | | | 8,193,506,420 | |
OTHER ASSETS, LESS LIABILITIES - 1.3% | | | | | | | | | 106,871,185 | |
| | | | | | | | | | |
NET ASSETS - 100% | | | | | | | | $ | 8,300,377,605 | |
| | | | | | | | | | |
ADR - American Depository Receipt
NVDR - Non-Voting Depository Receipt
| * | Non-income producing security |
| 1 | Values were adjusted following the close of local trading using a factor from a third party vendor. |
| 2 | Affiliated company as defined by the Investment Company Act of 1940. |
| 3 | Rate shown is the current yield as of June 30, 2011. |
The Series’ portfolio holds, as a percentage of net assets, greater than 10% in the following countries: United Kingdom 12.7%; France 10.9%; Switzerland 10.1%.
| | | | | | |
| | The accompanying notes are an integral part of the financial statements. | | | 7 | |
Statement of Assets and Liabilities (unaudited)
June 30, 2011
| | | | | |
ASSETS: | | | | | |
Investments, at value (identified cost $7,636,224,981) (Note 2) | | | $ | 8,193,506,420 | |
Cash | | | | 22,879,497 | |
Receivable for securities sold | | | | 89,045,712 | |
Receivable for fund shares sold | | | | 20,660,742 | |
Dividends receivable | | | | 13,887,727 | |
Foreign tax reclaims receivable | | | | 10,250,458 | |
| | | | | |
| |
TOTAL ASSETS | | | | 8,350,230,556 | |
| | | | | |
| |
LIABILITIES: | | | | | |
| |
Accrued management fees (Note 3) | | | | 6,640,250 | |
Accrued transfer agent fees (Note 3) | | | | 686,387 | |
Accrued fund accounting and administration fees (Note 3) | | | | 228,854 | |
Accrued Chief Compliance Officer service fees (Note 3) | | | | 466 | |
Accrued directors’ fees (Note 3) | | | | 241 | |
Payable for securities purchased | | | | 36,614,785 | |
Payable for fund shares repurchased | | | | 5,034,967 | |
Other payables and accrued expenses | | | | 647,001 | |
| | | | | |
| |
TOTAL LIABILITIES | | | | 49,852,951 | |
| | | | | |
| |
TOTAL NET ASSETS | | | $ | 8,300,377,605 | |
| | | | | |
| |
NET ASSETS CONSIST OF: | | | | | |
| |
Capital stock | | | $ | 9,035,006 | |
Additional paid-in-capital | | | | 7,181,001,706 | |
Undistributed net investment income | | | | 200,809,043 | |
Accumulated net realized gain on investments, foreign currency and translation of other assets and liabilities | | | | 351,141,786 | |
Net unrealized appreciation on investments, foreign currency and translation of other assets and liabilities | | | | 558,390,064 | |
| | | | | |
| |
TOTAL NET ASSETS | | | $ | 8,300,377,605 | |
| | | | | |
| |
NET ASSET VALUE, OFFERING PRICE AND REDEMPTION PRICE PER SHARE - Class A
($8,300,377,605/903,500,639 shares) | | | $ | 9.19 | |
| | | | | |
| | | | |
| 8 | | The accompanying notes are an integral part of the financial statements. | | |
Statement of Operations (unaudited)
For the Six Months Ended June 30, 2011
| | | | | |
INVESTMENT INCOME: | | | | | |
| |
Dividends (net of foreign taxes withheld, $12,985,069) | | | $ | 241,581,629 | |
| | | | | |
| |
EXPENSES: | | | | | |
| |
Management fees (Note 3) | | | | 37,277,872 | |
Transfer agent fees (Note 3) | | | | 1,154,011 | |
Fund accounting and administration fees (Note 3) | | | | 469,624 | |
Directors’ fees (Note 3) | | | | 88,750 | |
Chief Compliance Officer service fees (Note 3) | | | | 1,314 | |
Custodian fees | | | | 578,801 | |
Miscellaneous | | | | 709,214 | |
| | | | | |
| |
Total Expenses | | | | 40,279,586 | |
| | | | | |
| |
NET INVESTMENT INCOME | | | | 201,302,043 | |
| | | | | |
| |
REALIZED AND UNREALIZED GAIN (LOSS) ON INVESTMENTS AND FOREIGN CURRENCY: | | | | | |
| |
Net realized gain (loss) on- | | | | | |
Investments | | | | 345,963,313 | |
Foreign currency and translation of other assets and liabilities | | | | (2,111,139 | ) |
| | | | | |
| |
| | | | 343,852,174 | |
| | | | | |
| |
Net change in unrealized appreciation (depreciation) on- | | | | | |
Investments | | | | (86,553,164 | ) |
Foreign currency and translation of other assets and liabilities | | | | 623,620 | |
| | | | | |
| |
| | | | (85,929,544) | |
| | | | | |
| |
NET REALIZED AND UNREALIZED GAIN ON INVESTMENTS AND FOREIGN CURRENCY | | | | 257,922,630 | |
| | | | | |
| |
NET INCREASE IN NET ASSETS RESULTING FROM OPERATIONS | | | $ | 459,224,673 | |
| | | | | |
| | | | | | |
| | The accompanying notes are an integral part of the financial statements. | | | 9 | |
Statement of Changes in Net Assets
| | | | | | | | | | |
| | | For the Six
Months Ended
6/30/11
(unaudited) | | For the
Year Ended
12/31/10 |
| | |
INCREASE (DECREASE) IN NET ASSETS: | | | | | | | | | | |
| | |
OPERATIONS: | | | | | | | | | | |
| | |
Net investment income | | | $ | 201,302,043 | | | | $ | 50,986,375 | |
Net realized gain on investments and foreign currency | | | | 343,852,174 | | | | | 142,638,736 | |
Net change in unrealized appreciation (depreciation) on investments and foreign currency | | | | (85,929,544 | ) | | | | 299,834,418 | |
| | | | | | | | | | |
| | |
Net increase from operations | | | | 459,224,673 | | | | | 493,459,529 | |
| | | | | | | | | | |
| | |
DISTRIBUTIONS TO SHAREHOLDERS (Note 9): | | | | | | | | | | |
| | |
From net investment income | | | | — | | | | | (51,336,546 | ) |
From net realized gain on investments | | | | — | | | | | (128,844,230 | ) |
| | | | | | | | | | |
| | |
Total distributions to shareholders | | | | — | | | | | (180,180,776 | ) |
| | | | | | | | | | |
| | |
CAPITAL STOCK ISSUED AND REPURCHASED: | | | | | | | | | | |
| | |
Net increase from capital share transactions (Note 5) | | | | 1,385,726,798 | | | | | 1,224,687,957 | |
| | | | | | | | | | |
| | |
Net increase in net assets | | | | 1,844,951,471 | | | | | 1,537,966,710 | |
| | |
NET ASSETS: | | | | | | | | | | |
| | |
Beginning of period | | | | 6,455,426,134 | | | | | 4,917,459,424 | |
| | | | | | | | | | |
| | |
End of period (including undistributed net investment income of $200,809,043 and distributions in excess of net investment income of $493,000, respectively) | | | $ | 8,300,377,605 | | | | $ | 6,455,426,134 | |
| | | | | | | | | | |
| | | | |
| 10 | | The accompanying notes are an integral part of the financial statements. | | |
Financial Highlights
| | | | | | | | | | | | | | | | | | | | | | | | | | | | | | |
| | | For the Six Months Ended 6/30/11 | | For the Years Ended |
| | | (unaudited) | | 12/31/10 | | 12/31/09 | | 12/31/08 | | 12/31/07 | | 12/31/06 |
Per share data (for a share outstanding throughout each period): | | | | | | | | | | | | | | | | | | | | | | | | | | | | | | |
Net asset value - Beginning of period | | | $ | 8.61 | | | | $ | 8.12 | | | | $ | 5.88 | | | | $ | 10.07 | | | | $ | 9.58 | | | | $ | 8.46 | |
| | | | | | | | | | | | | | | | | | | | | | | | | | | | | | |
Income (loss) from investment operations: | | | | | | | | | | | | | | | | | | | | | | | | | | | | | | |
Net investment income | | | | 0.24 | 1 | | | | 0.07 | 1 | | | | 0.04 | 1 | | | | 0.10 | | | | | 0.05 | | | | | 0.12 | |
Net realized and unrealized gain (loss) on investments | | | | 0.34 | | | | | 0.67 | | | | | 2.26 | | | | | (4.08 | ) | | | | 1.36 | | | | | 2.71 | |
| | | | | | | | | | | | | | | | | | | | | | | | | | | | | | |
Total from investment operations | | | | 0.58 | | | | | 0.74 | | | | | 2.30 | | | | | (3.98 | ) | | | | 1.41 | | | | | 2.83 | |
| | | | | | | | | | | | | | | | | | | | | | | | | | | | | | |
Less distributions to shareholders: | | | | | | | | | | | | | | | | | | | | | | | | | | | | | | |
From net investment income | | | | — | | | | | (0.07 | ) | | | | (0.06 | ) | | | | (0.03 | ) | | | | (0.05 | ) | | | | (0.14 | ) |
From net realized gain on investments | | | | — | | | | | (0.18 | ) | | | | — | | | | | (0.18 | ) | | | | (0.87 | ) | | | | (1.57 | ) |
| | | | | | | | | | | | | | | | | | | | | | | | | | | | | | |
Total distributions to shareholders | | | | — | | | | | (0.25 | ) | | | | (0.06 | ) | | | | (0.21 | ) | | | | (0.92 | ) | | | | (1.71 | ) |
| | | | | | | | | | | | | | | | | | | | | | | | | | | | | | |
Net asset value - End of period | | | $ | 9.19 | | | | $ | 8.61 | | | | $ | 8.12 | | | | $ | 5.88 | | | | $ | 10.07 | | | | $ | 9.58 | |
| | | | | | | | | | | | | | | | | | | | | | | | | | | | | | |
Net assets - End of period (000’s omitted) | | | $ | 8,300,378 | | | | $ | 6,455,426 | | | | $ | 4,917,459 | | | | $ | 1,340,057 | | | | $ | 841,864 | | | | $ | 317,121 | |
| | | | | | | | | | | | | | | | | | | | | | | | | | | | | | |
Total return2 | | | | 6.74 | % | | | | 9.23 | % | | | | 39.12 | % | | | | (40.07 | %) | | | | 15.13 | % | | | | 33.88 | % |
Ratios (to average net assets)/ Supplemental Data: | | | | | | | | | | | | | | | | | | | | | | | | | | | | | | |
Expenses* | | | | 1.08 | %3 | | | | 1.11 | % | | | | 1.17 | % | | | | 1.16 | % | | | | 1.14 | % | | | | 1.16 | % |
Net investment income | | | | 5.40 | %3 | | | | 0.92 | % | | | | 0.60 | % | | | | 2.17 | % | | | | 0.75 | % | | | | 1.35 | % |
Portfolio turnover | | | | 22 | % | | | | 39 | % | | | | 42 | % | | | | 34 | % | | | | 49 | % | | | | 64 | % |
|
* The investment advisor did not impose all of its management fees, CCO fees and fund accounting and transfer agent fees, and other fees in some periods and in some periods paid a portion of the series’ expenses. If these expenses had been incurred by the Series, the expense ratio (to average net assets) would have been increased by the following amount: | |
| | | | N/A | | | | | 0.00 | %4 | | | | 0.00 | %4 | | | | N/A | | | | | N/A | | | | | N/A | |
| 1 | Calculated based on average shares outstanding during the period. |
| 2 | Represents aggregate total return for the period indicated, and assumes reinvestment of all distributions. Total return would have been lower had certain expenses not been waived during certain periods. Periods less than one year are not annualized. |
| | | | | | |
| | The accompanying notes are an integral part of the financial statements. | | | 11 | |
Notes to Financial Statements (unaudited)
World Opportunities Series (the “Series”) is a no-load diversified series of Manning & Napier Fund, Inc. (the “Fund”). The Fund is organized in Maryland and is registered under the Investment Company Act of 1940, as amended, as an open-end management investment company.
The Series’ investment objective is to provide long-term growth by investing principally in the common stocks of companies from outside the United States.
The Series is authorized to issue five classes of shares (Class A, B, D, E and Z). Currently, only Class A shares have been issued. Each class of shares is substantially the same, except that class-specific distribution and shareholder servicing expenses are borne by the specific class of shares to which they relate.
The Fund’s Advisor is Manning & Napier Advisors, Inc. (the “Advisor”). Shares of the Series are offered to investors, clients and employees of the Advisor and its affiliates. The total authorized capital stock of the Fund consists of 10.0 billion shares of common stock each having a par value of $0.01. As of June 30, 2011, 6.4 billion shares have been designated in total among 31 series, of which 2.5 billion have been designated as World Opportunities Series Class A common stock.
| 2. | SIGNIFICANT ACCOUNTING POLICIES |
Security Valuation
Portfolio securities, including domestic equities, foreign equities, warrants and options, listed on an exchange other than the NASDAQ National Market System are valued at the latest quoted sales price of the exchange on which the security is primarily traded. Securities not traded on valuation date or securities not listed on an exchange are valued at the latest quoted bid price provided by the Fund’s pricing service. Securities listed on the NASDAQ National Market System are valued in accordance with the NASDAQ Official Closing Price.
Short-term investments that mature in sixty days or less are valued at amortized cost, which approximates market value. Investments in open-end investment companies are valued at their net asset value per share on valuation date.
Volume and level of activity in established markets for an asset or liability are evaluated to determine whether recent transactions and quoted prices are determinative of fair value. Where there have been significant decreases in volume and level of activity, further analysis and adjustment may be necessary to estimate fair value. The Series measures fair value in these instances by the use of inputs and valuation techniques which may be based upon current market prices of securities that are comparable in coupon, rating, maturity and industry and/or expectation of future cash flows. As a result of trading in relatively thin markets and/or markets that experience significant volatility, the prices used by the Series to value these securities may differ from the value that would be realized if these securities were sold, and the differences could be material.
Securities for which representative valuations or prices are not available from the Fund’s pricing service may be valued at fair value. Due to the inherent uncertainty of valuations of such securities, the fair value may differ significantly from the values that would have been used had a ready market for such securities existed. If trading or events occurring after the close of the principal market in which securities are traded are expected to materially affect the value of those securities, then they may be valued at their fair value, taking this trading or these events into account. Fair value is determined in good faith by the Advisor under procedures approved by and under the general supervision and responsibility of the Fund’s Board of Directors (the “Board”). In accordance with the procedures approved by the Board, certain securities trading outside the U.S. whose values were adjusted following the close of local trading use a factor from a third party vendor to the extent available. The value of securities used for net asset value calculation under these procedures may differ from published prices for the same securities. It is the Fund’s policy to classify each foreign equity security where a factor from a third party vendor is provided as a Level 2 security.
Notes to Financial Statements (unaudited)
| 2. | SIGNIFICANT ACCOUNTING POLICIES (continued) |
Security Valuation (continued)
Various inputs are used in determining the value of the Series’ assets or liabilities carried at market value. These inputs are summarized in three broad levels. Level 1 includes quoted prices in active markets for identical assets and liabilities. Level 2 includes other significant observable inputs (including quoted prices for similar securities, interest rates, prepayment speeds, credit risk, etc.). Level 3 includes significant unobservable inputs (including the Series’ own assumptions in determining the fair value of investments). The inputs or methodology used for valuing securities are not necessarily an indication of the risk associated with investing in those securities.
The following is a summary of the valuation levels used for major security types as of June 30, 2011 in valuing the Series’ assets or liabilities carried at market value:
| | | | | | | | | | | | | | | | | | | | |
Description | | Total | | Level 1 | | Level 2 | | Level 3 |
Assets: | | | | | | | | | | | | | | | | | | | | |
Equity securities*: | | | | | | | | | | | | | | | | | | | | |
Consumer Discretionary | | | $ | 1,142,724,021 | | | | $ | 389,491,681 | | | | $ | 753,232,340 | | | | $ | — | |
Consumer Staples | | | | 1,451,847,299 | | | | | 227,666,509 | | | | | 1,224,180,790 | | | | | — | |
Energy | | | | 762,118,916 | | | | | 561,196,367 | | | | | 200,922,549 | | | | | — | |
Financials | | | | 602,327,774 | | | | | — | | | | | 602,327,774 | | | | | — | |
Health Care | | | | 958,149,097 | | | | | 155,670,717 | | | | | 802,478,380 | | | | | — | |
Industrials | | | | 945,815,871 | | | | | 448,514,956 | | | | | 497,300,915 | | | | | — | |
Information Technology | | | | 1,181,285,159 | | | | | 561,645,983 | | | | | 619,639,176 | | | | | — | |
Materials | | | | 513,288,714 | | | | | — | | | | | 513,288,714 | | | | | — | |
Telecommunication Services | | | | 231,363,671 | | | | | 129,770,707 | | | | | 101,592,964 | | | | | — | |
Preferred securities: | | | | | | | | | | | | | | | | | | | | |
Consumer Staples | | | | 89,334,090 | | | | | — | | | | | 89,334,090 | | | | | — | |
Debt securities | | | | — | | | | | — | | | | | — | | | | | — | |
Mutual funds | | | | 315,251,808 | | | | | 315,251,808 | | | | | — | | | | | — | |
Other financial instruments** | | | | — | | | | | — | | | | | — | | | | | — | |
| | | | | | | | | | | | | | | | | | | | |
Total assets | | | | 8,193,506,420 | | | | | 2,789,208,728 | | | | | 5,404,297,692 | | | | | — | |
| | | | | | | | | | | | | | | | | | | | |
Liabilities: | | | | | | | | | | | | | | | | | | | | |
Other financial instruments** | | | | — | | | | | — | | | | | — | | | | | — | |
| | | | | | | | | | | | | | | | | | | | |
Total liabilities | | | | — | | | | | — | | | | | — | | | | | — | |
| | | | | | | | | | | | | | | | | | | | |
Total | | | $ | 8,193,506,420 | | | | $ | 2,789,208,728 | | | | $ | 5,404,297,692 | | | | $ | — | |
| | | | | | | | | | | | | | | | | | | | |
| * | Includes common stock, warrants and rights. Please see the Investment Portfolio for foreign securities where values were adjusted following the close of local trading using a factor from a third party vendor. Such securities are included in Level 2 in the table above. |
| ** | Other financial instruments are derivative instruments not reflected in the Investment Portfolio, such as futures, forwards and swap contracts, which are valued at the unrealized appreciation/depreciation on the instrument. As of June 30, 2011, the Series did not hold any derivative instruments. |
| | There were no Level 3 securities held by the Series as of December 31, 2010 or June 30, 2011. |
| | The Fund’s policy is to recognize transfers in and transfers out of the valuation levels as of the beginning of the reporting period. There were no significant transfers between Level 1 and Level 2 during the six months ended June 30, 2011. |
Notes to Financial Statements (unaudited)
| 2. | SIGNIFICANT ACCOUNTING POLICIES (continued) |
Recent Accounting Standard
In May 2011, the Financial Accounting Standards Board issued amended guidance to improve disclosure about fair value measurements which will require the following disclosures for fair value measurements categorized as Level 3: quantitative information about the unobservable inputs and assumptions used in the fair value measurement, a description of the valuation policies and procedures and a narrative description of the sensitivity of the fair value measurement to changes in unobservable inputs and the interrelationships between those unobservable inputs. In addition, the amounts and reasons for all transfers in and out of Level 1 and Level 2 will be required to be disclosed. The amended guidance is effective for financial statements for fiscal years beginning after December 15, 2011, and interim periods within those fiscal years. Management is evaluating the impact of this guidance on the Series’ financial statements and disclosures.
Security Transactions, Investment Income and Expenses
Security transactions are accounted for on trade date. Dividend income is recorded on the ex-dividend date, except that if the ex-dividend date has passed, certain dividends from foreign securities are recorded as soon as the Fund is informed of the ex-dividend date. Non-cash dividends, if any, are recorded at the fair market value of the securities received. Interest income, including amortization of premium and accretion of discounts using the effective interest method, is earned from settlement date and accrued daily.
Expenses are recorded on an accrual basis. Most expenses of the Fund can be attributed to a specific series. Expenses which cannot be directly attributed are apportioned among the series in the Fund in such a manner as deemed equitable by the Fund’s Board, taking into consideration, among other things, the nature and type of expense.
The Series uses the identified cost method for determining realized gain or loss on investments for both financial statement and federal income tax reporting purposes.
Foreign Currency Translation
The books and records of the Series are maintained in U.S. dollars. Foreign currencies, investments and other assets and liabilities are translated into U.S. dollars at the current exchange rates. Purchases and sales of investment securities and income and expenses are translated on the respective dates of such transactions. The Series does not isolate realized and unrealized gains and losses attributable to changes in the exchange rates from gains and losses that arise from changes in the market value of investments. Such fluctuations are included with net realized and unrealized gain or loss on investments. Net realized foreign currency gains and losses represent foreign currency gains and losses between trade date and settlement date on securities transactions, gains and losses on disposition of foreign currencies and the difference between the amount of income and foreign withholding taxes recorded on the books of the Series and the amounts actually received or paid.
Affiliated Companies
The 1940 Act defines “affiliated companies” to include securities in which a series owns 5% or more of the outstanding voting securities of the issuer. The following transactions were effected in shares of Lonza Group AG (Switzerland) and Mindray Medical International Ltd. - ADR (China) for the six months ended June 30, 2011:
| | | | | | | | | | | | | | | | | | | | | | | | | | | | | | | | | | | |
Name of Issuer | | Value at
12/31/10 | | Purchase
Cost | | Sales
Proceeds | | Value at
6/30/11 | | Shares Held at
6/30/11 | | Dividend
Income
12/31/10
through
6/30/11 | | Net Realized
Gain
12/31/10
through
6/30/11 |
Lonza Group AG (Switzerland)* | | | $ | 196,804,090 | | | | $ | 70,340,930 | | | | $ | — | | | | $ | 259,665,034 | | | | | 3,314,460 | | | | $ | 7,227,759 | | | | $ | — | |
Notes to Financial Statements (unaudited)
| 2. | SIGNIFICANT ACCOUNTING POLICIES (continued) |
Affiliated Companies (continued)
| | | | | | | | | | | | | | | | | | | | | | | | | | | | | | | | | | | |
Name of Issuer | | Value at
12/31/10 | | Purchase
Cost | | Sales
Proceeds | | Value at
6/30/11 | | Shares Held at
6/30/11 | | Dividend
Income
12/31/10
through
6/30/11 | | Net Realized
Gain
12/31/10
through
6/30/11 |
Mindray Medical International Ltd. - ADR (China)** | | | $ | 23,525,040 | | | | $ | 101,117,516 | | | | $ | — | | | | $ | 128,439,547 | | | | | 4,578,950 | | | | $ | 869,247 | | | | $ | — | |
| * | Security was an affiliated company for the period January 28, 2011 - June 30, 2011. |
| ** | Security was an affiliated company for the period June 27, 2011 - June 30, 2011. |
Federal Taxes
The Series’ policy is to comply with the provisions of the Internal Revenue Code applicable to regulated investment companies. The Series is not subject to federal income tax or excise tax to the extent that the Series distributes to shareholders each year its taxable income, including any net realized gains on investments, in accordance with requirements of the Internal Revenue Code. Accordingly, no provision for federal income tax or excise tax has been made in the financial statements.
Management evaluates its tax positions to determine if the tax positions taken meet the minimum recognition threshold in connection with accounting for uncertainties in income tax positions taken or expected to be taken for the purposes of measuring and recognizing tax liabilities in the financial statements. Recognition of tax benefits of an uncertain tax position is required only when the position is “more likely than not” to be sustained assuming examination by taxing authorities. At June 30, 2011, the Series has recorded no liability for net unrecognized tax benefits relating to uncertain income tax positions taken or expected to be taken in future tax returns.
The Series files income tax returns in the U.S. federal jurisdiction, various states and foreign jurisdictions, as required. No income tax returns are currently under investigation. The statute of limitations on the Series’ tax returns remains open for the years ended December 31, 2007 through December 31, 2010. The Fund is not aware of any tax positions for which it is reasonably possible that the total amounts of unrecognized tax benefits will significantly change in the next twelve months.
Additionally, based on the Fund’s understanding of the tax rules and rates related to income, gains and transactions for foreign jurisdictions in which it invests, the Series will provide for foreign taxes, and where appropriate, deferred foreign tax.
Distributions of Income and Gains
Distributions to shareholders of net investment income and net realized gains are made annually. An additional distribution may be necessary to avoid taxation of the Series. Distributions are recorded on the ex-dividend date.
Indemnifications
The Fund’s organizational documents provide former and current directors and officers with a limited indemnification against liabilities arising in connection with the performance of their duties to the Fund. In the normal course of business, the Fund may also enter into contracts that provide general indemnifications. The Fund’s maximum exposure under these arrangements is unknown as this would be dependent on future claims that may be made against the Fund. The risk of material loss from such claims is considered remote.
Notes to Financial Statements (unaudited)
| 2. | SIGNIFICANT ACCOUNTING POLICIES (continued) |
Other
The preparation of financial statements in conformity with accounting principles generally accepted in the United States of America requires management to make estimates and assumptions that affect the reported amounts of assets and liabilities and the disclosure of contingent assets and liabilities at the date of the financial statements and the reported amounts of income and expenses during the reporting period. Actual results could differ from those estimates.
| 3. | TRANSACTIONS WITH AFFILIATES |
The Fund has an Investment Advisory Agreement (the “Agreement”) with the Advisor, for which the Series pays a fee, computed daily and payable monthly, at an annual rate of 1.00% of the Series’ average daily net assets.
Under the Agreement, personnel of the Advisor provide the Series with advice and assistance in the choice of investments and the execution of securities transactions, and otherwise maintain the Series’ organization. The Advisor also provides the Fund with necessary office space and fund administration and support services. The salaries of all officers of the Fund (except a percentage of the Fund’s Chief Compliance Officer’s salary, which is paid by the Fund), and of all Directors who are “affiliated persons” of the Fund, or of the Advisor, and all personnel of the Fund, or of the Advisor, performing services relating to research, statistical and investment activities, are paid by the Advisor. Each “non-affiliated” Director receives an annual stipend, which is allocated among all the active series of the Fund. In addition, these Directors also receive a fee per Board meeting attended plus a fee for each committee meeting attended.
The Advisor did not waive any fees for the six months ended June 30, 2011. The Advisor is not eligible to recoup any expenses that have been waived or reimbursed in prior years.
Manning & Napier Investor Services, Inc., a registered broker-dealer affiliate of the Advisor, acts as distributor for the Fund’s shares. The services of Manning & Napier Investor Services, Inc. are provided at no additional cost to the Series.
The Advisor has agreements with BNY Mellon Investment Servicing (U.S.) Inc. (“BNY”) under which BNY serves as sub-accountant services agent and sub-transfer agent. The Fund pays the Advisor an annual fee related to fund accounting and administration of 0.0175% on the first $3 billion of average daily net assets (excluding Target Series); 0.015% on the next $3 billion of average daily net assets (excluding Target Series); and 0.01% of the average daily net assets in excess of $6 billion (excluding Target Series); plus a base fee of $25,500 per Series. Transfer Agent fees are charged to the Fund on a per account basis. Additionally, certain transaction- and cusip-based fees and out-of-pocket expenses, including charges for reporting relating to the Fund’s compliance program, are charged.
Expenses not directly attributable to a Series are allocated based on each Series’ relative net assets or number of accounts, depending on the expense.
| 4. | PURCHASES AND SALES OF SECURITIES |
For the six months ended June 30, 2011, purchases and sales of securities, other than U.S. Government securities and short-term securities, were $3,009,253,184 and $1,593,089,702, respectively. There were no purchases or sales of U.S. Government securities.
Notes to Financial Statements (unaudited)
| 5. | CAPITAL STOCK TRANSACTIONS |
Transactions in Class A shares of World Opportunities Series were:
| | | | | | | | | | | | | | | | | | | | |
| | | For the Six Months
Ended 6/30/11 | | For the Year
Ended 12/31/10 |
| | Shares | | Amount | | Shares | | Amount |
Sold | | | | 213,073,758 | | | | $ | 1,922,545,108 | | | | | 380,543,895 | | | | $ | 3,072,871,491 | |
Reinvested | | | | — | | | | | — | | | | | 17,838,209 | | | | | 148,727,024 | |
Repurchased | | | | (59,629,641 | ) | | | | (536,818,310 | ) | | | | (253,809,235 | ) | | | | (1,996,910,558 | ) |
| | | | | | | | | | | | | | | | | | | | |
Total | | | | 153,444,117 | | | | $ | 1,385,726,798 | | | | | 144,572,869 | | | | $ | 1,224,687,957 | |
| | | | | | | | | | | | | | | | | | | | |
Approximately 3% of the Series’ shares represent investments by fiduciary accounts over which the Advisor has sole investment discretion. In addition, one shareholder owned 93,317,892 shares (10.34% of shares outstanding) valued at $848,401,428. Investment activities of this shareholder may have a material effect on the Series.
The Series entered into a $50 million credit facility (the “line of credit”) with Bank of New York Mellon on June 9, 2011. The Series may borrow under the line of credit for temporary or emergency purposes, including funding shareholder redemptions and other short-term liquidity purposes. The Series pays an annual commitment fee on the unused portion of the line of credit which amounted to $18,667 for the period June 9, 2011 to June 30, 2011, which is included in other expenses in the Statement of Operations. Interest on the used portion is charged to the Series based on rates determined pursuant to the terms of the agreeemnt at the time of borrowing. During the period June 9, 2011 to June 30, 2011, the Series did not borrow under the line of credit.
The Series may trade in instruments including written and purchased options, forward foreign currency exchange contracts and futures contracts and other derivatives in the normal course of investing activities to assist in managing exposure to various market risks. The Series may be subject to various elements of risk, which may involve, to a varying degree, elements of risk in excess of the amounts recognized for financial statement purposes. These risks include: the risk that changes in the value of a derivative may not correlate perfectly with the underlying asset, rate or index, counterparty credit risk related to over the counter derivatives’ counterparties failure to perform under contract terms, liquidity risk related to the lack of a liquid market for these contracts allowing the fund to close out its position(s) and documentation risk relating to disagreement over contract terms. No such investments were held by the Series on June 30, 2011.
Investing in securities of foreign companies and foreign governments involves special risks and considerations not typically associated with investing in securities of domestic companies and the U.S. Government. These risks include revaluation of currencies and future adverse political and economic developments. Moreover, securities of foreign companies and foreign governments and their markets may be less liquid and their prices more volatile than those of comparable domestic companies and the U.S. Government.
Notes to Financial Statements (unaudited)
| 9. | FEDERAL INCOME TAX INFORMATION |
The amount and characterization of certain income and capital gains to be distributed are determined in accordance with federal income tax regulations, which may differ from accounting principles generally accepted in the United States of America. The Series may periodically make reclassifications among its capital accounts to reflect income and gains available for distribution (or available capital loss carryovers) under income tax regulations, without impacting the Series’ net asset value. Any such reclassifications are not reflected in the financial highlights.
The final determination of the tax character of current year distributions will be made at the conclusion of the fiscal year. The tax character of distributions paid for the year ended December 31, 2010 were as follows:
| | | | | |
Ordinary income | | | $ | 115,460,480 | |
Long-term capital gains | | | | 64,720,296 | |
At June 30, 2011, the identified cost of investments for federal income tax purposes, the resulting gross unrealized appreciation and depreciation, and the net unrealized appreciation were as follows:
| | | | | |
Cost for federal income tax purposes | | | $ | 7,659,631,376 | |
Unrealized appreciation | | | $ | 898,835,800 | |
Unrealized depreciation | | | | (364,960,756 | ) |
| | | | | |
Net unrealized appreciation | | | $ | 533,875,044 | |
| | | | | |
Literature Requests (unaudited)
Proxy Voting Policies and Procedures
A description of the policies and procedures that the Fund uses to determine how to vote proxies relating to portfolio securities is available, without charge, upon request:
| | |
| By phone | | 1-800-466-3863 |
On the Securities and Exchange Commission’s (SEC) web site | | http://www.sec.gov |
Proxy Voting Record
Information regarding how the Fund voted proxies relating to portfolio securities during the most recent 12-month period ended June 30th is available, without charge, upon request:
| | |
| By phone | | 1-800-466-3863 |
| On the SEC’s web site | | http://www.sec.gov |
Quarterly Portfolio Holdings
The Series’ complete schedule of portfolio holdings for the 1st and 3rd quarters of each fiscal year are provided on Form N-Q, and are available, without charge, upon request:
| | |
| By phone | | 1-800-466-3863 |
| On the SEC’s web site | | http://www.sec.gov |
The Series’ Form N-Q may be reviewed and copied at the SEC’s Public Reference Room in Washington, D.C. Information on the operation of the Public Reference Room may be obtained by calling 1-800-SEC-0330.
Prospectus and Statement of Additional Information (SAI)
The prospectus and SAI provide additional information about each Series, including charges, expenses and risks. These documents are available, without charge, upon request:
| | |
| By phone | | 1-800-466-3863 |
| On the SEC’s web site | | http://www.sec.gov |
| On our web site | | http://www.manning-napier.com |
Additional information available at www.manning-napier.com
1. Fund Holdings - Month-End
2. Fund Holdings - Quarter-End
3. Shareholder Report - Annual
4. Shareholder Report - Semi-Annual
The Fund also offers electronic notification or “e-delivery” when certain documents are available on-line to be downloaded or reviewed. Direct shareholders can elect to receive electronic notification when shareholder reports, prospectus updates, and / or quarterly statements are available. If you do not currently have on-line access to your account, you can establish access by going to www.manning-napier.com, click on “Login” in the top corner of the page, and follow the prompts to self-enroll. Once enrolled, you can set your electronic notification preferences by clicking on the Account Options tab located within the green toolbar and then select E-Delivery Option. Should you have any questions on either how to establish on-line access or how to update your account settings, please do not hesitate to contact Investor Services at 1-800-466-3863.
MNWO-6/11-SAR


Shareholder Expense Example (unaudited)
As a shareholder of the Series, you may incur two types of costs: (1) transaction costs and (2) ongoing costs, including management fees and other Series expenses. This example is intended to help you understand your ongoing costs (in dollars) of investing in the Series and to compare these costs with the ongoing costs of investing in other mutual funds.
The example is based on an investment of $1,000 invested at the beginning of the period and held for the entire period (January 1, 2011 to June 30, 2011).
Actual Expenses
The first line of the table below provides information about actual account values and actual expenses. You may use the information in this line, together with the amount you invested, to estimate the expenses that you paid over the period. Simply divide your account value by $1,000 (for example, an $8,600 account value divided by $1,000 = 8.6), then multiply the result by the number in the first line under the heading entitled “Expenses Paid During Period” to estimate the expenses you paid on your account during this period.
Hypothetical Example for Comparison Purposes
The second line of the table below provides information about hypothetical account values and hypothetical expenses based on the Series’ actual expense ratio and an assumed rate of return of 5% per year before expenses, which is not the Series’ actual return. The hypothetical account values and expenses may not be used to estimate the actual ending account balance or expenses you paid during the period. You may use this information to compare the ongoing costs of investing in the Series and other funds. To do so, compare this 5% hypothetical example with the 5% hypothetical examples that appear in the shareholder reports of the other funds.
Please note that the expenses shown in the table are meant to highlight your ongoing costs only and do not reflect any transaction costs. Therefore, the second line of the table is useful in comparing ongoing costs only, and will not help you determine the relative total costs of owning different funds. In addition, if these transaction costs were included, your costs would have been higher.
| | | | | | | | | | | | | | | |
| | | Beginning
Account Value
1/1/11 | | Ending
Account Value
6/30/11 | | Expenses Paid
During Period*
1/1/11-6/30/11 |
Actual | | | $ | 1,000.00 | | | | $ | 1,049.70 | | | | $ | 3.91 | |
Hypothetical
(5% return before expenses) | | | $ | 1,000.00 | | | | $ | 1,020.98 | | | | $ | 3.86 | |
| * | Expenses are equal to the Series’ annualized expense ratio (for the six-month period) of 0.77%, multiplied by the average account value over the period, multiplied by 181/365 (to reflect the one-half year period). Expenses are based on the most recent fiscal half year. |
Portfolio Composition as of June 30, 2011 (unaudited)
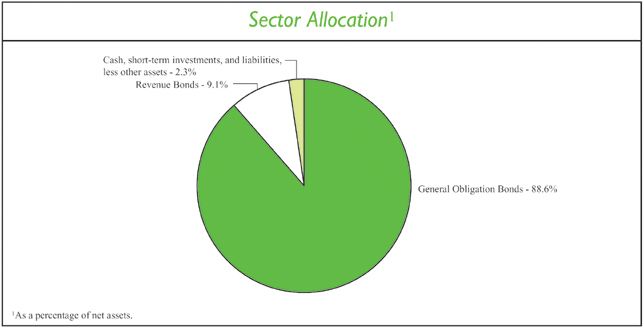
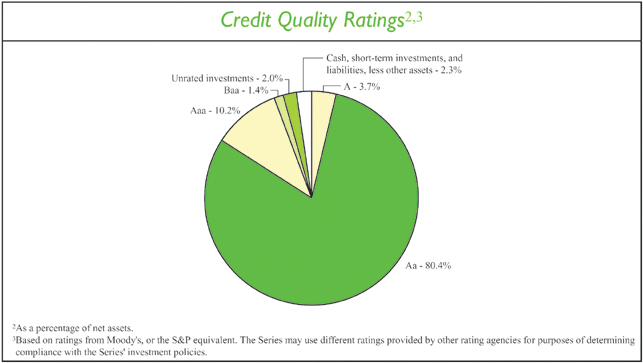
Investment Portfolio - June 30, 2011 (unaudited)
| | | | | | | | | | | | | | | | | | | | | | | | | |
| | | Coupon
Rate | | Maturity
Date | | Credit
Rating1 | | Principal
Amount | | Value
(Note 2) |
OHIO MUNICIPAL SECURITIES - 97.7% | | | | | | | | | | | | | | | | | | | | | | | | | |
Akron, Various Purposes Impt., G.O. Bond | | | | 4.250 | % | | | | 12/1/2028 | | | | | AA | 2 | | | $ | 200,000 | | | | $ | 192,364 | |
Akron, Various Purposes Impt., Series B, G.O. Bond | | | | 5.000 | % | | | | 12/1/2031 | | | | | AA | 2 | | | | 300,000 | | | | | 305,979 | |
Allen East Local School District, Prerefunded Balance, G.O. Bond, AMBAC | | | | 4.300 | % | | | | 12/1/2017 | | | | | WR | 3 | | | | 285,000 | | | | | 320,049 | |
Avon, Public Impt., Series B, G.O. Bond | | | | 5.000 | % | | | | 12/1/2027 | | | | | Aa1 | | | | | 200,000 | | | | | 212,724 | |
Batavia Local School District, G.O. Bond,
NATL | | | | 5.625 | % | | | | 12/1/2022 | | | | | A1 | | | | | 200,000 | | | | | 227,960 | |
Bedford Heights, Series A, G.O. Bond, AMBAC. | | | | 5.650 | % | | | | 12/1/2014 | | | | | Aa3 | | | | | 20,000 | | | | | 21,592 | |
Big Walnut Local School District, Delaware
County, School Facilities Construction &
Impt., G.O. Bond, AGM | | | | 4.500 | % | | | | 12/1/2029 | | | | | Aa2 | | | | | 200,000 | | | | | 200,558 | |
Brunswick, Limited Tax, Capital Impt., G.O.
Bond | | | | 4.000 | % | | | | 12/1/2025 | | | | | Aa2 | | | | | 100,000 | | | | | 101,427 | |
Butler County, G.O. Bond, AMBAC | | | | 5.000 | % | | | | 12/1/2016 | | | | | Aa1 | | | | | 110,000 | | | | | 128,350 | |
Butler County, Water & Sewer, G.O. Bond | | | | 2.500 | % | | | | 12/1/2014 | | | | | Aa1 | | | | | 100,000 | | | | | 104,565 | |
Canal Winchester Local School District, G.O.
Bond, AGM | | | | 4.250 | % | | | | 12/1/2027 | | | | | Aa3 | | | | | 500,000 | | | | | 490,705 | |
Canal Winchester Local School District,
Prerefunded Balance, Series B, G.O. Bond, NATL | | | | 5.000 | % | | | | 12/1/2025 | | | | | A1 | | | | | 355,000 | | | | | 405,250 | |
Cincinnati City School District, Construction & Impt., G.O. Bond, FGRNA | | | | 5.250 | % | | | | 12/1/2025 | | | | | Aa2 | | | | | 600,000 | | | | | 677,406 | |
Cincinnati City School District, G.O. Bond | | | | 4.500 | % | | | | 6/1/2018 | | | | | Aa2 | | | | | 100,000 | | | | | 112,411 | |
Cincinnati City School District, G.O. Bond | | | | 5.000 | % | | | | 6/1/2031 | | | | | Aa2 | | | | | 265,000 | | | | | 273,260 | |
Cincinnati City School District, Prerefunded Balance, G.O. Bond, AGM | | | | 5.250 | % | | | | 6/1/2016 | | | | | Aa2 | | | | | 200,000 | | | | | 213,864 | |
Cincinnati City School District, Prerefunded
Balance, G.O. Bond, AGM | | | | 5.000 | % | | | | 12/1/2031 | | | | | Aa2 | | | | | 170,000 | | | | | 188,312 | |
Cincinnati, Series B, G.O. Bond | | | | 1.500 | % | | | | 12/1/2014 | | | | | Aa1 | | | | | 360,000 | | | | | 366,095 | |
Cincinnati, Various Purposes Impt., Series A,
G.O. Bond | | | | 5.000 | % | | | | 12/1/2021 | | | | | Aa1 | | | | | 220,000 | | | | | 246,968 | |
Cincinnati, Various Purposes Impt., Series B,
G.O. Bond | | | | 4.250 | % | | | | 12/1/2026 | | | | | Aa1 | | | | | 170,000 | | | | | 175,537 | |
Cleveland Heights & University Heights City
School District, G.O. Bond | | | | 5.125 | % | | | | 12/1/2026 | | | | | Aa2 | | | | | 200,000 | | | | | 204,708 | |
Cleveland, Water Utility Impt., Series O,
Revenue Bond, NATL | | | | 5.000 | % | | | | 1/1/2037 | | | | | Aa1 | | | | | 380,000 | | | | | 382,907 | |
Columbus City School District, Facilities Construction & Impt., G.O. Bond | | | | 4.500 | % | | | | 12/1/2029 | | | | | Aa2 | | | | | 500,000 | | | | | 501,970 | |
Columbus City School District, Facilities Construction & Impt., G.O. Bond, AGM | | | | 4.250 | % | | | | 12/1/2032 | | | | | Aa2 | | | | | 500,000 | | | | | 475,650 | |
The accompanying notes are an integral part of the financial statements.
Investment Portfolio - June 30, 2011 (unaudited)
| | | | | | | | | | | | | | | | | | | | | | | | | |
| | | Coupon
Rate | | Maturity
Date | | Credit
Rating1 | | Principal
Amount | | Value
(Note 2) |
OHIO MUNICIPAL SECURITIES (continued) | | | | | | | | | | | | | | | | | | | | | | | | | |
Columbus City School District, Facilities
Construction & Impt., Prerefunded Balance,
G.O. Bond, AGM | | | | 5.000 | % | | | | 12/1/2032 | | | | | Aa2 | | | | $ | 300,000 | | | | $ | 342,666 | |
Columbus City School District, Facilities Construction & Impt., Prerefunded Balance, G.O. Bond, AGM | | | | 5.250 | % | | | | 12/1/2026 | | | | | Aa2 | | | | | 250,000 | | | | | 287,660 | |
Columbus, Limited Tax, Series 2, G.O. Bond | | | | 5.000 | % | | | | 7/1/2017 | | | | | Aaa | | | | | 250,000 | | | | | 278,180 | |
Columbus, Public Impt., Series A, G.O. Bond | | | | 4.000 | % | | | | 6/1/2013 | | | | | Aaa | | | | | 500,000 | | | | | 534,015 | |
Columbus, Public Impt., Series D, G.O. Bond | | | | 5.000 | % | | | | 12/15/2013 | | | | | Aaa | | | | | 100,000 | | | | | 110,851 | |
Columbus, Series A, G.O. Bond | | | | 5.000 | % | | | | 6/15/2013 | | | | | Aaa | | | | | 200,000 | | | | | 217,752 | |
Columbus, Sewer Impt., Series A, Revenue
Bond | | | | 4.250 | % | | | | 6/1/2030 | | | | | Aa1 | | | | | 250,000 | | | | | 245,525 | |
Cuyahoga Falls, G.O. Bond, NATL | | | | 5.000 | % | | | | 12/1/2021 | | | | | Aa2 | | | | | 750,000 | | | | | 815,715 | |
Delaware County, Series B, G.O. Bond | | | | 4.000 | % | | | | 12/1/2015 | | | | | Aa1 | | | | | 200,000 | | | | | 224,134 | |
Dublin City School District, Prerefunded
Balance, G.O. Bond | | | | 5.375 | % | | | | 12/1/2017 | | | | | Aaa | | | | | 100,000 | | | | | 107,138 | |
Eaton Community City Schools, G.O. Bond,
FGRNA | | | | 4.125 | % | | | | 12/1/2026 | | | | | Aa2 | | | | | 500,000 | | | | | 486,075 | |
Elyria City School District, G.O. Bond, XLCA | | | | 4.750 | % | | | | 12/1/2027 | | | | | A1 | | | | | 100,000 | | | | | 101,960 | |
Fairbanks Local School District, School
Facilities Construction & Impt., G.O. Bond,
AGM | | | | 4.500 | % | | | | 12/1/2028 | | | | | Aa3 | | | | | 400,000 | | | | | 400,512 | |
Fairborn School District, G.O. Bond,
AGM | | | | 5.000 | % | | | | 12/1/2021 | | | | | Aa3 | | | | | 400,000 | | | | | 433,032 | |
Fairfield County, Building Impt., Prerefunded
Balance, G.O. Bond | | | | 5.000 | % | | | | 12/1/2018 | | | | | Aa2 | | | | | 250,000 | | | | | 255,033 | |
Fairview Park City School District, G.O. Bond,
NATL | | | | 5.000 | % | | | | 12/1/2029 | | | | | Aa3 | | | | | 315,000 | | | | | 322,636 | |
Franklin County, Various Purposes Impt., G.O.
Bond | | | | 5.000 | % | | | | 12/1/2027 | | | | | Aaa | | | | | 500,000 | | | | | 533,880 | |
Gahanna, Public Impt., G.O. Bond, NATL | | | | 4.250 | % | | | | 12/1/2014 | | | | | Aa1 | | | | | 100,000 | | | | | 110,489 | |
Geneva Area City School District, G.O. Bond,
NATL | | | | 4.500 | % | | | | 12/1/2030 | | | | | Aa3 | | | | | 120,000 | | | | | 120,679 | |
Granville Exempt Village School District, G.O.
Bond, AGM | | | | 4.375 | % | | | | 12/1/2031 | | | | | Aa1 | | | | | 500,000 | | | | | 489,730 | |
Green, G.O. Bond | | | | 2.000 | % | | | | 12/1/2014 | | | | | AA | 2 | | | | 285,000 | | | | | 293,439 | |
Greene County, Limited Tax, G.O. Bond | | | | 4.500 | % | | | | 12/1/2035 | | | | | Aa2 | | | | | 415,000 | | | | | 402,417 | |
Greene County, Revenue Bond | | | | 3.500 | % | | | | 12/1/2026 | | | | | Aa2 | | | | | 300,000 | | | | | 277,428 | |
Hamilton City School District, G.O.
Bond, AGM . | | | | 4.250 | % | | | | 12/1/2030 | | | | | Aa3 | | | | | 500,000 | | | | | 472,510 | |
Hamilton County, Sewer Impt., Series A,
Revenue Bond | | | | 3.750 | % | | | | 12/1/2015 | | | | | Aa2 | | | | | 200,000 | | | | | 220,352 | |
Hamilton County, Sewer Impt., Series A,
Revenue Bond | | | | 5.000 | % | | | | 12/1/2032 | | | | | Aa2 | | | | | 100,000 | | | | | 102,870 | |
Hamilton Electric System, Series A, Revenue
Bond, AGC | | | | 4.125 | % | | | | 10/1/2024 | | | | | Aa3 | | | | | 300,000 | | | | | 300,504 | |
The accompanying notes are an integral part of the financial statements.
Investment Portfolio - June 30, 2011 (unaudited)
| | | | | | | | | | | | | | | | | | | | | | | | | |
| | | Coupon
Rate | | Maturity
Date | | Credit
Rating1 | | Principal
Amount | | Value
(Note 2) |
OHIO MUNICIPAL SECURITIES (continued) | | | | | | | | | | | | | | | | | | | | | | | | | |
Hamilton Waterworks System, Series A,
Revenue Bond, AGC | | | | 4.625 | % | | | | 10/15/2029 | | | | | Aa3 | | | | $ | 100,000 | | | | $ | 100,028 | |
Hamilton, Series A, Revenue Bond, AGC | | | | 4.125 | % | | | | 10/15/2023 | | | | | Aa3 | | | | | 120,000 | | | | | 121,832 | |
Hancock County, Various Purposes Impt., G.O.
Bond, NATL | | | | 4.000 | % | | | | 12/1/2016 | | | | | Aa2 | | | | | 200,000 | | | | | 220,770 | |
Harrison, Various Purposes Impt., G.O. Bond,
AGM | | | | 5.250 | % | | | | 12/1/2038 | | | | | Aa3 | | | | | 275,000 | | | | | 290,694 | |
Huber Heights City School District, School
Impt., G.O. Bond | | | | 5.000 | % | | | | 12/1/2036 | | | | | Aa2 | | | | | 450,000 | | | | | 456,777 | |
Ironton City School District, G.O. Bond, NATL | | | | 4.250 | % | | | | 12/1/2028 | | | | | Baa1 | | | | | 500,000 | | | | | 456,710 | |
Kettering City School District, G.O. Bond, AGM . | | | | 4.250 | % | | | | 12/1/2025 | | | | | Aa2 | | | | | 750,000 | | | | | 748,455 | |
Lakewood City School District, Prerefunded
Balance, G.O. Bond, AGM | | | | 5.250 | % | | | | 12/1/2015 | | | | | Aa2 | | | | | 225,000 | | | | | 259,886 | |
Lakewood City School District, Prerefunded
Balance, G.O. Bond, AGM | | | | 5.250 | % | | | | 12/1/2019 | | | | | Aa2 | | | | | 705,000 | | | | | 814,310 | |
Lakewood, Water System, Revenue Bond,
AMBAC | | | | 4.500 | % | | | | 7/1/2028 | | | | | WR | 3 | | | | 500,000 | | | | | 469,955 | |
Lakota Local School District, Series
A, G.O. Bond, FGRNA | | | | 5.250 | % | | | | 12/1/2024 | | | | | Aaa | | | | | 210,000 | | | | | 244,009 | |
Licking Heights Local School District,
Prerefunded Balance, G.O. Bond, FGIC | | | | 5.250 | % | | | | 12/1/2023 | | | | | Aa2 | | | | | 1,140,000 | | | | | 1,293,604 | |
Licking Heights Local School District, School
Facilities Construction & Impt., Series A, G.O.
Bond, NATL | | | | 5.000 | % | | | | 12/1/2022 | | | | | Aa2 | | | | | 250,000 | | | | | 269,873 | |
Lima, Revenue Bond, AGM | | | | 3.750 | % | | | | 12/1/2023 | | | | | Aa3 | | | | | 225,000 | | | | | 228,616 | |
Lima, Revenue Bond, AGM | | | | 4.300 | % | | | | 12/1/2029 | | | | | Aa3 | | | | | 200,000 | | | | | 204,398 | |
Lorain City School District, Unrefunded
Balance, G.O. Bond, NATL | | | | 4.750 | % | | | | 12/1/2025 | | | | | Aa2 | | | | | 335,000 | | | | | 342,206 | |
Lorain County, Sewer System Impt., G.O.
Bond | | | | 5.000 | % | | | | 12/1/2039 | | | | | Aa2 | | | | | 200,000 | | | | | 205,806 | |
Loveland City School District, G.O. Bond, AGM. | | | | 5.000 | % | | | | 12/1/2015 | | | | | Aa2 | | | | | 300,000 | | | | | 345,720 | |
Lucas County, Sewer & Water District Impt.,
G.O. Bond | | | | 4.100 | % | | | | 12/1/2027 | | | | | AA | 2 | | | | 100,000 | | | | | 102,504 | |
Lucas County, Various Purposes Impt., G.O.
Bond | | | | 4.500 | % | | | | 10/1/2035 | | | | | Aa2 | | | | | 300,000 | | | | | 283,059 | |
Mahoning County, Various Purposes Impt.,
Revenue Bond | | | | 4.375 | % | | | | 12/1/2035 | | | | | Aa3 | | | | | 230,000 | | | | | 231,336 | |
Mahoning County, Various Purposes Impt.,
Series B, G.O. Bond, AGC | | | | 4.375 | % | | | | 12/1/2035 | | | | | Aa3 | | | | | 300,000 | | | | | 301,743 | |
Marion, Limited Tax, Various Purposes Impt.,
Series A, G.O. Bond, AGM | | | | 4.300 | % | | | | 12/1/2030 | | | | | Aa3 | | | | | 100,000 | | | | | 101,484 | |
Marysville, Sewer & Wastewater, Revenue
Bond, AGC, XLCA | | | | 4.750 | % | | | | 12/1/2046 | | | | | Aa3 | | | | | 180,000 | | | | | 167,767 | |
The accompanying notes are an integral part of the financial statements.
Investment Portfolio - June 30, 2011 (unaudited)
| | | | | | | | | | | | | | | | | | | | | | | | | |
| | | Coupon
Rate | | Maturity
Date | | Credit
Rating1 | | Principal
Amount | | Value
(Note 2) |
OHIO MUNICIPAL SECURITIES (continued) | | | | | | | | | | | | | | | | | | | | | | | | | |
Mason, Limited Tax, Various Purposes Impt.,
G.O. Bond | | | | 4.250 | % | | | | 12/1/2027 | | | | | Aaa | | | | $ | 925,000 | | | | $ | 937,155 | |
Massillon City School District, Various Purposes | | | | | | | | | | | | | | | | | | | | | | | | | |
Impt., Prerefunded Balance, G.O. Bond,
NATL | | | | 4.000 | % | | | | 12/1/2014 | | | | | Baa1 | | | | | 100,000 | | | | | 105,046 | |
Maumee City School District, G.O. Bond, AGM | | | | 4.600 | % | | | | 12/1/2031 | | | | | Aa3 | | | | | 260,000 | | | | | 260,226 | |
Maumee, Public Impt., G.O. Bond, NATL | | | | 4.125 | % | | | | 12/1/2018 | | | | | Aa2 | | | | | 375,000 | | | | | 403,369 | |
Miami County, Various Purposes Impt., G.O. Bond | | | | 2.000 | % | | | | 12/1/2013 | | | | | Aa2 | | | | | 300,000 | | | | | 307,443 | |
Miamisburg City School District, G.O. Bond | | | | 5.000 | % | | | | 12/1/2033 | | | | | Aa2 | | | | | 250,000 | | | | | 255,270 | |
Middletown, Public Impt., G.O. Bond, AGM | | | | 5.000 | % | | | | 12/1/2021 | | | | | Aa2 | | | | | 230,000 | | | | | 258,959 | |
Middletown, Various Purposes Impt., G.O. Bond, AGM | | | | 4.500 | % | | | | 12/1/2018 | | | | | Aa2 | | | | | 100,000 | | | | | 114,245 | |
Monroe Local School District, G.O. Bond, AMBAC | | | | 5.500 | % | | | | 12/1/2024 | | | | | Aa3 | | | | | 500,000 | | | | | 571,400 | |
Montgomery County, Various Purposes Impt., G.O. Bond | | | | 3.000 | % | | | | 12/1/2019 | | | | | Aa1 | | | | | 250,000 | | | | | 258,550 | |
Mount Healthy City School District, G.O. Bond, AGM | | | | 5.000 | % | | | | 12/1/2031 | | | | | Aa3 | | | | | 200,000 | | | | | 205,762 | |
Muskingum County, Limited Tax, Various Purposes Impt., G.O. Bond, AGC | | | | 4.300 | % | | | | 12/1/2028 | | | | | Aa2 | | | | | 145,000 | | | | | 148,600 | |
New Albany Plain Local School District, Prerefunded Balance, G.O. Bond, FGIC | | | | 5.000 | % | | | | 12/1/2025 | | | | | Aa1 | | | | | 45,000 | | | | | 46,960 | |
New Albany Plain Local School District, Prerefunded Balance, G.O. Bond, FGIC | | | | 5.000 | % | | | | 12/1/2025 | | | | | Aa1 | | | | | 85,000 | | | | | 88,703 | |
New Albany Plain Local School District, Prerefunded Balance, G.O. Bond, FGIC | | | | 5.000 | % | | | | 12/1/2029 | | | | | Aa1 | | | | | 95,000 | | | | | 99,138 | |
New Albany Plain Local School District, Unrefunded Balance, G.O. Bond, FGIC | | | | 5.000 | % | | | | 12/1/2025 | | | | | Aa1 | | | | | 185,000 | | | | | 185,770 | |
North Royalton, Various Purposes Impt., G.O. Bond | | | | 5.250 | % | | | | 12/1/2028 | | | | | Aa2 | | | | | 1,025,000 | | | | | 1,093,634 | |
Ohio State Water Development Authority, Fresh Water, Prerefunded Balance, Revenue Bond | | | | 5.250 | % | | | | 12/1/2017 | | | | | AAA | 2 | | | | 270,000 | | | | | 306,380 | |
Ohio State Water Development Authority, Pollution Control, Revenue Bond | | | | 5.250 | % | | | | 12/1/2015 | | | | | Aaa | | | | | 200,000 | | | | | 234,394 | |
Ohio State Water Development Authority, Pure Water, Series I, Revenue Bond, AMBAC | | | | 6.000 | % | | | | 12/1/2016 | | | | | Aaa | | | | | 25,000 | | | | | 28,081 | |
Ohio State, Conservation Project, Series A,
G.O. Bond | | | | 5.000 | % | | | | 9/1/2013 | | | | | Aa1 | | | | | 350,000 | | | | | 383,086 | |
Ohio State, Public Impt., Series A, G.O. Bond | | | | 5.000 | % | | | | 2/1/2014 | | | | | Aa1 | | | | | 250,000 | | | | | 275,937 | |
Ohio State, School Impt., Prerefunded Balance, Series A, G.O. Bond | | | | 5.000 | % | | | | 6/15/2015 | | | | | Aa1 | | | | | 300,000 | | | | | 338,751 | |
Ohio State, Series C, G.O. Bond | | | | 5.500 | % | | | | 11/1/2012 | | | | | Aa1 | | | | | 1,000,000 | | | | | 1,068,070 | |
The accompanying notes are an integral part of the financial statements.
Investment Portfolio - June 30, 2011 (unaudited)
| | | | | | | | | | | | | | | | | | | | | | | | | |
| | | Coupon
Rate | | Maturity
Date | | Credit
Rating1 | | Principal
Amount | | Value
(Note 2) |
OHIO MUNICIPAL SECURITIES (continued) | | | | | | | | | | | | | | | | | | | | | | | | | |
Olentangy Local School District, Series A, G.O.
Bond, AGM | | | | 4.500 | % | | | | 12/1/2032 | | | | | Aa1 | | | | $ | 800,000 | | | | $ | 802,264 | |
Otsego Local School District, Prerefunded
Balance, G.O. Bond, AGM | | | | 4.300 | % | | | | 12/1/2016 | | | | | Aa3 | | | | | 100,000 | | | | | 112,298 | |
Pickerington Local School District, G.O. Bond,
NATL | | | | 4.250 | % | | | | 12/1/2034 | | | | | Aa2 | | | | | 230,000 | | | | | 206,637 | |
Portage County, Sewer Impt., G.O. Bond, AGM. | | | | 4.100 | % | | | | 12/1/2024 | | | | | Aa2 | | | | | 200,000 | | | | | 205,174 | |
Portsmouth City School District, Prerefunded
Balance, G.O. Bond, AGM | | | | 5.000 | % | | | | 12/1/2023 | | | | | Aa2 | | | | | 440,000 | | | | | 469,203 | |
Princeton City School District, Prerefunded
Balance, G.O. Bond, NATL | | | | 5.000 | % | | | | 12/1/2030 | | | | | AAA | 2 | | | | 200,000 | | | | | 221,698 | |
South Range Local School District, G.O. Bond,
XLCA | | | | 4.500 | % | | | | 12/1/2035 | | | | | A | 2 | | | | 225,000 | | | | | 211,343 | |
South-Western City School District, Franklin &
Pickway County, G.O. Bond, AGM | | | | 4.250 | % | | | | 12/1/2026 | | | | | Aa2 | | | | | 600,000 | | | | | 602,580 | |
Springboro Community City School District,
G.O. Bond, AGM | | | | 5.250 | % | | | | 12/1/2032 | | | | | Aa3 | | | | | 150,000 | | | | | 160,847 | |
Springboro, Public Impt., G.O. Bond | | | | 3.250 | % | | | | 12/1/2014 | | | | | Aa2 | | | | | 100,000 | | | | | 107,143 | |
Sugarcreek Local School District, G.O. Bond,
AGM | | | | 4.250 | % | | | | 12/1/2031 | | | | | Aa2 | | | | | 750,000 | | | | | 690,967 | |
Summit County, Series R, G.O. Bond, FGRNA | | | | 5.500 | % | | | | 12/1/2018 | | | | | Aa1 | | | | | 260,000 | | | | | 311,854 | |
Summit County, Various Purposes Impt., Series
R, G.O. Bond, FGRNA | | | | 5.500 | % | | | | 12/1/2019 | | | | | Aa1 | | | | | 100,000 | | | | | 119,512 | |
Sylvania City School District, G.O. Bond, AGC | | | | 5.000 | % | | | | 12/1/2025 | | | | | Aa2 | | | | | 270,000 | | | | | 282,374 | |
Sylvania, Public Impt., G.O. Bond | | | | 2.000 | % | | | | 12/1/2014 | | | | | AA | 2 | | | | 300,000 | | | | | 309,843 | |
Symmes Township, Limited Tax, Parkland
Acquisition & Impt., G.O. Bond | | | | 5.250 | % | | | | 12/1/2037 | | | | | Aa1 | | | | | 100,000 | | | | | 106,097 | |
Tallmadge City School District, G.O. Bond,
AGM | | | | 5.000 | % | | | | 12/1/2031 | | | | | Aaa | | | | | 200,000 | | | | | 204,558 | |
Tallmadge, G.O. Bond | | | | 4.250 | % | | | | 12/1/2030 | | | | | Aa2 | | | | | 180,000 | | | | | 182,668 | |
Twinsburg City School District, G.O. Bond,
FGRNA | | | | 5.000 | % | | | | 12/1/2018 | | | | | Aa2 | | | | | 100,000 | | | | | 110,215 | |
Twinsburg, Series A, G.O. Bond | | | | 2.000 | % | | | | 12/1/2012 | | | | | Aa2 | | | | | 155,000 | | | | | 158,653 | |
Van Buren Local School District, Prerefunded
Balance, G.O. Bond, AGM | | | | 5.250 | % | | | | 12/1/2016 | | | | | Aa3 | | | | | 300,000 | | | | | 306,288 | |
Vandalia Butler City School District, G.O. Bond . | | | | 5.000 | % | | | | 12/1/2038 | | | | | Aa2 | | | | | 500,000 | | | | | 508,985 | |
Vandalia, G.O. Bond, AMBAC | | | | 5.000 | % | | | | 12/1/2015 | | | | | Aa2 | | | | | 235,000 | | | | | 258,512 | |
Wadsworth City School District, G.O. Bond,
AGC | | | | 5.000 | % | | | | 12/1/2037 | | | | | AA | 2 | | | | 180,000 | | | | | 182,657 | |
Warren County, Highway Impt., G.O. Bond | | | | 4.000 | % | | | | 12/1/2022 | | | | | Aa1 | | | | | 100,000 | | | | | 105,917 | |
Washington Court House City School District,
G.O. Bond, FGRNA | | | | 5.000 | % | | | | 12/1/2029 | | | | | A1 | | | | | 500,000 | | | | | 509,100 | |
West Chester Township, Various Purposes
Impt., Series A, G.O. Bond | | | | 5.000 | % | | | | 12/1/2020 | | | | | Aaa | | | | | 100,000 | | | | | 112,479 | |
The accompanying notes are an integral part of the financial statements.
Investment Portfolio - June 30, 2011 (unaudited)
| | | | | | | | | | | | | | | | | | | | | | | | | |
| | | Coupon
Rate | | Maturity
Date | | Credit
Rating1 | | Principal
Amount/
Shares | | Value
(Note 2) |
OHIO MUNICIPAL SECURITIES (continued) | | | | | | | | | | | | | | | | | | | | | | | | | |
Wood County, G.O. Bond | | | | 5.400 | % | | | | 12/1/2013 | | | | | Aa2 | | | | $ | 15,000 | | | | $ | 15,050 | |
| | | | | | | | | | | | | | | | | | | | | | | | | |
TOTAL MUNICIPAL BONDS | | | | | | | | | | | | | | | | | | | | | | | | | |
(Identified Cost $38,470,310) | | | | | | | | | | | | | | | | | | | | | | | | 38,829,180 | |
| | | | | | | | | | | | | | | | | | | | | | | | | |
SHORT-TERM INVESTMENTS - 2.7% | | | | | | | | | | | | | | | | | | | | | | | | | |
Dreyfus Cash Management, Inc. - Institutional Shares4 (Identified Cost $1,078,745) | | | | | | | | | | | | | | | | | | | 1,078,745 | | | | | 1,078,745 | |
| | | | | | | | | | | | | | | | | | | | | | | | | |
TOTAL INVESTMENTS - 100.4% | | | | | | | | | | | | | | | | | | | | | | | | | |
(Identified Cost $39,549,055) | | | | | | | | | | | | | | | | | | | | | | | | 39,907,925 | |
LIABILITIES, LESS OTHER ASSETS - (0.4%) | | | | | | | | | | | | | | | | | | | | | | | | (153,000 | ) |
| | | | | | | | | | | | | | | | | | | | | | | | | |
NET ASSETS - 100% | | | | | | | | | | | | | | | | | | | | | | | $ | 39,754,925 | |
| | | | | | | | | | | | | | | | | | | | | | | | | |
KEY:
G.O. Bond - General Obligation Bond
Impt. - Improvement
Scheduled principal and interest payments are guaranteed by:
AGC (Assured Guaranty Corp.)
AGM (Assurance Guaranty Municipal Corp.) (formerly known as FSA (Financial Security Assurance, Inc.))
AMBAC (AMBAC Assurance Corp.)
FGIC (Financial Guaranty Insurance Co.)
FGRNA (FGIC reinsured by NATL)
NATL (National Public Finance Guarantee Corp.)
XLCA (XL Capital Assurance)
The insurance does not guarantee the market value of the municipal bonds.
| 1 | Credit ratings from Moody’s (unaudited). |
| 2 | Credit ratings from S&P (unaudited). |
| 3 | Credit rating has been withdrawn. As of June 30, 2011, there is no rating available. |
| 4 | Rate shown is the current yield as of June 30, 2011. |
The Series’ portfolio holds, as a percentage of net assets, greater than 10% in bonds insured by the following companies:
NATL - 28.6%; AGM - 17.8%.
The accompanying notes are an integral part of the financial statements.
Statement of Assets and Liabilities (unaudited)
June 30, 2011
| | | | | |
ASSETS: | | | | | |
Investments, at value (identified cost $39,549,055) (Note 2) | | | $ | 39,907,925 | |
Interest receivable | | | | 179,857 | |
Receivable for fund shares sold | | | | 26,383 | |
| | | | | |
| |
TOTAL ASSETS | | | | 40,114,165 | |
| | | | | |
| |
LIABILITIES: | | | | | |
| |
Accrued management fees (Note 3) | | | | 16,377 | |
Accrued fund accounting and administration fees (Note 3) | | | | 7,329 | |
Accrued transfer agent fees (Note 3) | | | | 678 | |
Accrued Chief Compliance Officer service fees (Note 3) | | | | 466 | |
Payable for securities purchased | | | | 310,002 | |
Audit fees payable | | | | 18,521 | |
Other payables and accrued expenses | | | | 5,867 | |
| | | | | |
| |
TOTAL LIABILITIES | | | | 359,240 | |
| | | | | |
| |
TOTAL NET ASSETS | | | $ | 39,754,925 | |
| | | | | |
| |
NET ASSETS CONSIST OF: | | | | | |
| |
Capital stock | | | $ | 37,241 | |
Additional paid-in-capital | | | | 39,105,838 | |
Undistributed net investment income | | | | 112,622 | |
Accumulated net realized gain on investments | | | | 140,354 | |
Net unrealized appreciation on investments | | | | 358,870 | |
| | | | | |
| |
TOTAL NET ASSETS | | | $ | 39,754,925 | |
| | | | | |
| |
NET ASSET VALUE, OFFERING PRICE AND REDEMPTION PRICE PER SHARE - Class A
($39,754,925/3,724,149 shares) | | | $ | 10.67 | |
| | | | | |
| | | | |
| 9 | | The accompanying notes are an integral part of the financial statements. | | |
Statement of Operations (unaudited)
For the Six Months Ended June 30, 2011
| | | | | |
INVESTMENT INCOME: | | | | | |
| |
Interest | | | $ | 719,440 | |
| | | | | |
| |
EXPENSES: | | | | | |
| |
Management fees (Note 3) | | | | 91,828 | |
Fund accounting and administration fees (Note 3) | | | | 24,211 | |
Transfer agent fees (Note 3) | | | | 1,325 | |
Chief Compliance Officer service fees (Note 3) | | | | 1,314 | |
Directors’ fees (Note 3) | | | | 489 | |
Audit fees | | | | 14,265 | |
Custodian fees | | | | 943 | |
Miscellaneous | | | | 7,006 | |
| | | | | |
| |
Total Expenses | | | | 141,381 | |
| | | | | |
| |
NET INVESTMENT INCOME | | | | 578,059 | |
| | | | | |
| |
REALIZED AND UNREALIZED GAIN ON INVESTMENTS: | | | | | |
| |
Net realized gain on investments | | | | 140,002 | |
Net change in unrealized appreciation (depreciation) on investments | | | | 1,126,399 | |
| | | | | |
| |
NET REALIZED AND UNREALIZED GAIN ON INVESTMENTS | | | | 1,266,401 | |
| | | | | |
| |
NET INCREASE IN NET ASSETS RESULTING FROM OPERATIONS | | | $ | 1,844,460 | |
| | | | | |
| | | | | | |
| | The accompanying notes are an integral part of the financial statements. | | | 10 | |
Statements of Changes in Net Assets
| | | | | | | | | | |
| | | For the Six
Months Ended
6/30/11
(unaudited) | | For the
Year Ended
12/31/10 |
INCREASE (DECREASE) IN NET ASSETS: | | | | | | | | | | |
| | |
OPERATIONS: | | | | | | | | | | |
| | |
Net investment income | | | $ | 578,059 | | | | $ | 979,572 | |
Net realized gain on investments | | | | 140,002 | | | | | 286 | |
Net change in unrealized appreciation (depreciation) on investments | | | | 1,126,399 | | | | | (1,217,584 | ) |
| | | | | | | | | | |
| | |
Net increase (decrease) from operations | | | | 1,844,460 | | | | | (237,726 | ) |
| | | | | | | | | | |
| | |
DISTRIBUTIONS TO SHAREHOLDERS (Note 8): | | | | | | | | | | |
| | |
From net investment income | | | | (501,615 | ) | | | | (996,467 | ) |
| | | | | | | | | | |
| | |
CAPITAL STOCK ISSUED AND REPURCHASED: | | | | | | | | | | |
| | |
Net increase from capital share transactions (Note 5) | | | | 4,042,325 | | | | | 10,728,881 | |
| | | | | | | | | | |
| | |
Net increase in net assets | | | | 5,385,170 | | | | | 9,494,688 | |
| | |
NET ASSETS: | | | | | | | | | | |
| | |
Beginning of period | | | | 34,369,755 | | | | | 24,875,067 | |
| | | | | | | | | | |
| | |
End of period (including undistributed net investment income of $112,622
and $36,178, respectively) | | | $ | 39,754,925 | | | | $ | 34,369,755 | |
| | | | | | | | | | |
| | | | |
| 11 | | The accompanying notes are an integral part of the financial statements. | | |
Financial Highlights
| | | | | | | | | | | | | | | | | | | | | | | | | | | | | | |
| | | For the Six
Months Ended | | | | | | | | | | |
| | | 6/30/11 | | For the Years Ended |
| | | (unaudited) | | 12/31/10 | | 12/31/09 | | 12/31/08 | | 12/31/07 | | 12/31/06 |
Per share data (for a share outstanding throughout each period): | | | | | | | | | | | | | | | | | | | | | | | | | | | | | | |
Net asset value - Beginning of period | | | $ | 10.30 | | | | $ | 10.62 | | | | $ | 9.82 | | | | $ | 10.43 | | | | $ | 10.46 | | | | $ | 10.52 | |
| | | | | | | | | | | | | | | | | | | | | | | | | | | | | | |
Income (loss) from investment operations: | | | | | | | | | | | | | | | | | | | | | | | | | | | | | | |
Net investment income | | | | 0.16 | 1 | | | | 0.35 | 1 | | | | 0.36 | 1 | | | | 0.38 | | | | | 0.34 | | | | | 0.38 | |
Net realized and unrealized gain (loss) on investments | | | | 0.35 | | | | | (0.33 | ) | | | | 0.91 | | | | | (0.57 | ) | | | | — | 2 | | | | (0.05 | ) |
| | | | | | | | | | | | | | | | | | | | | | | | | | | | | | |
Total from investment operations | | | | 0.51 | | | | | 0.02 | | | | | 1.27 | | | | | (0.19 | ) | | | | 0.34 | | | | | 0.33 | |
| | | | | | | | | | | | | | | | | | | | | | | | | | | | | | |
Less distributions to shareholders: | | | | | | | | | | | | | | | | | | | | | | | | | | | | | | |
From net investment income | | | | (0.14 | ) | | | | (0.34 | ) | | | | (0.37 | ) | | | | (0.36 | ) | | | | (0.37 | ) | | | | (0.38 | ) |
From net realized gain on investments | | | | — | | | | | — | | | | | (0.10 | ) | | | | (0.06 | ) | | | | — | | | | | (0.01 | ) |
| | | | | | | | | | | | | | | | | | | | | | | | | | | | | | |
Total distributions to shareholders | | | | (0.14 | ) | | | | (0.34 | ) | | | | (0.47 | ) | | | | (0.42 | ) | | | | (0.37 | ) | | | | (0.39 | ) |
| | | | | | | | | | | | | | | | | | | | | | | | | | | | | | |
Net asset value - End of period | | | $ | 10.67 | | | | $ | 10.30 | | | | $ | 10.62 | | | | $ | 9.82 | | | | $ | 10.43 | | | | $ | 10.46 | |
| | | | | | | | | | | | | | | | | | | | | | | | | | | | | | |
Net assets - End of period (000’s omitted) | | | $ | 39,755 | | | | $ | 34,370 | | | | $ | 24,875 | | | | $ | 20,844 | | | | $ | 26,432 | | | | $ | 20,612 | |
| | | | | | | | | | | | | | | | | | | | | | | | | | | | | | |
Total return3 | | | | 4.97 | % | | | | 0.14 | % | | | | 13.09 | % | | | | (1.74 | %) | | | | 3.28 | % | | | | 3.19 | % |
Ratios (to average net assets)/Supplemental Data: | | | | | | | | | | | | | | | | | | | | | | | | | | | | | | |
Expenses* | | | | 0.77 | %4 | | | | 0.85 | % | | | | 0.85 | % | | | | 0.85 | % | | | | 0.85 | % | | | | 0.85 | % |
Net investment income | | | | 3.15 | %4 | | | | 3.25 | % | | | | 3.39 | % | | | | 3.58 | % | | | | 3.47 | % | | | | 3.81 | % |
Portfolio turnover | | | | 21 | % | | | | 0 | %5 | | | | 11 | % | | | | 15 | % | | | | 3 | % | | | | 9 | % |
|
* The investment advisor did not impose all or a portion of its management fees, CCO fees, fund accounting and transfer agent fees, and other fees in some periods and in some periods paid a portion of the Series’ expenses. If these expenses had been incurred by the Series, the expense ratio (to average net assets) would have been increased by the following amount: | |
| | | | | | |
| | | | N/A | | | | | 0.00 | %6 | | | | 0.03 | % | | | | 0.01 | % | | | | 0.00 | %6 | | | | 0.07 | % |
| 1 | Calculated based on average shares outstanding during the period. |
| 2 | Less than $0.01 per share. |
| 3 | Represents aggregate total return for the periods indicated, and assumes reinvestment of all distributions. Total return would have been lower had certain expenses not been waived or reimbursed during certain periods. Periods less than one year are not annualized. |
| | | | | | |
| | The accompanying notes are an integral part of the financial statements. | | | 12 | |
Notes to Financial Statements (unaudited)
Ohio Tax Exempt Series (the “Series”) is a no-load diversified series of Manning & Napier Fund, Inc. (the “Fund”). The Fund is organized in Maryland and is registered under the Investment Company Act of 1940, as amended, as an open-end management investment company.
The Series’ investment objective is to provide as high a level of current income exempt from federal income tax and Ohio State personal income tax as the Advisor believes is consistent with the preservation of capital.
The Fund’s Advisor is Manning & Napier Advisors, Inc. (the “Advisor”). Shares of the Series are offered to investors, clients and employees of the Advisor and its affiliates. The total authorized capital stock of the Fund consists of 10.0 billion shares of common stock each having a par value of $0.01. As of June 30, 2011, 6.4 billion shares have been designated in total among 31 series, of which 100 million have been designated as Ohio Tax Exempt Series Class A common stock.
| 2. | SIGNIFICANT ACCOUNTING POLICIES |
Security Valuation
Municipal securities will normally be valued on the basis of market valuations provided by an independent pricing service (the “Service”). The Service utilizes the latest price quotations and a matrix system (which considers such factors as security prices of similar securities, yields, maturities and ratings). The Service has been approved by the Fund’s Board of Directors (the “Board”).
Short-term investments that mature in sixty days or less are valued at amortized cost, which approximates market value. Investments in open-end investment companies are valued at their net asset value per share on valuation date.
Volume and level of activity in established markets for an asset or liability are evaluated to determine whether recent transactions and quoted prices are determinative of fair value. Where there have been significant decreases in volume and level of activity, further analysis and adjustment may be necessary to estimate fair value. The Series measures fair value in these instances by the use of inputs and valuation techniques which may be based upon current market prices of securities that are comparable in coupon, rating, maturity and industry and/or expectation of future cash flows. As a result of trading in relatively thin markets and/or markets that experience significant volatility, the prices used by the Series to value these securities may differ from the value that would be realized if these securities were sold, and the differences could be material.
Securities for which representative valuations or prices are not available from the Fund’s pricing service may be valued at fair value. Due to the inherent uncertainty of valuations of such securities, the fair value may differ significantly from the values that would have been used had a ready market for such securities existed. If trading or events occurring after the close of the principal market in which securities are traded are expected to materially affect the value of those securities, then they may be valued at their fair value, taking this trading or these events into account. Fair value is determined in good faith by the Advisor under procedures approved by and under the general supervision and responsibility of the Board.
Various inputs are used in determining the value of the Series’ assets or liabilities carried at market value. These inputs are summarized in three broad levels. Level 1 includes quoted prices in active markets for identical assets and liabilities. Level 2 includes other significant observable inputs (including quoted prices for similar securities, interest rates, prepayment speeds, credit risk, etc.). Level 3 includes significant unobservable inputs (including the Series’ own assumptions in determining the fair value of investments). The inputs or methodology used for valuing securities are not necessarily an indication of the risk associated with investing in those securities.
Notes to Financial Statements (unaudited)
| 2. | SIGNIFICANT ACCOUNTING POLICIES (continued) |
Security Valuation (continued)
The following is a summary of the valuation levels used for major security types as of June 30, 2011 in valuing the Series’ assets or liabilities carried at market value:
| | | | | | | | | | | | | | | | | | | | |
Description | | Total | | Level 1 | | Level 2 | | Level 3 |
Assets: | | | | | | | | | | | | | | | | | | | | |
Equity securities* | | | $ | — | | | | $ | — | | | | $ | — | | | | $ | — | |
Preferred securities | | | | — | | | | | — | | | | | — | | | | | — | |
Debt securities: | | | | | | | | | | | | | | | | | | | | |
States and political subdivisions (municipals) | | | | 38,829,180 | | | | | — | | | | | 38,829,180 | | | | | — | |
Mutual funds | | | | 1,078,745 | | | | | 1,078,745 | | | | | — | | | | | — | |
Other financial instruments** | | | | — | | | | | — | | | | | — | | | | | — | |
| | | | | | | | | | | | | | | | | | | | |
Total assets | | | | 39,907,925 | | | | | 1,078,745 | | | | | 38,829,180 | | | | | — | |
| | | | | | | | | | | | | | | | | | | | |
Liabilities: | | | | | | | | | | | | | | | | | | | | |
Other financial instruments** | | | | — | | | | | — | | | | | — | | | | | — | |
| | | | | | | | | | | | | | | | | | | | |
Total liabilities | | | | — | | | | | — | | | | | — | | | | | — | |
| | | | | | | | | | | | | | | | | | | | |
Total | | | $ | 39,907,925 | | | | $ | 1,078,745 | | | | $ | 38,829,180 | | | | $ | — | |
| | | | | | | | | | | | | | | | | | | | |
| * | Includes common stock, warrants and rights. |
| ** | Other financial instruments are derivative instruments not reflected in the Investment Portfolio, such as futures, forwards and swap contracts, which are valued at the unrealized appreciation/depreciation on the instrument. As of June 30, 2011, the Series did not hold any derivative instruments. |
There were no Level 3 securities held by the Series as of December 31, 2010 or June 30, 2011.
The Fund’s policy is to recognize transfers in and transfers out of the valuation levels as of the beginning of the reporting period. There were no significant transfers between Level 1 and Level 2 during the six months ended June 30, 2011.
Recent Accounting Standard
In May 2011, the Financial Accounting Standards Board issued amended guidance to improve disclosure about fair value measurements which will require the following disclosures for fair value measurements categorized as Level 3: quantitative information about the unobservable inputs and assumptions used in the fair value measurement, a description of the valuation policies and procedures and a narrative description of the sensitivity of the fair value measurement to changes in unobservable inputs and the interrelationships between those unobservable inputs. In addition, the amounts and reasons for all transfers in and out of Level 1 and Level 2 will be required to be disclosed. The amended guidance is effective for financial statements for fiscal years beginning after December 15, 2011, and interim periods within those fiscal years. Management is evaluating the impact of this guidance on the Series’ financial statements and disclosures.
Security Transactions, Investment Income and Expenses
Security transactions are accounted for on trade date. Dividend income is recorded on the ex-dividend date, except that if the ex-dividend date has passed, certain dividends from foreign securities are recorded as soon as the Fund is informed of the ex-dividend date. Non-cash dividends, if any, are recorded at the fair market value of the securities received. Interest income, including amortization of premium and accretion of discounts using the effective interest method, is earned from settlement date and accrued daily.
Notes to Financial Statements (unaudited)
| 2. | SIGNIFICANT ACCOUNTING POLICIES (continued) |
Security Transactions, Investment Income and Expenses (continued)
Expenses are recorded on an accrual basis. Most expenses of the Fund can be attributed to a specific series. Expenses which cannot be directly attributed are apportioned among the series in the Fund in such a manner as deemed equitable by the Fund’s Board, taking into consideration, among other things, the nature and type of expense.
The Series uses the identified cost method for determining realized gain or loss on investments for both financial statement and federal income tax reporting purposes.
Federal Taxes
The Series’ policy is to comply with the provisions of the Internal Revenue Code applicable to regulated investment companies. The Series is not subject to federal income tax or excise tax to the extent that the Series distributes to shareholders each year its taxable income, including any net realized gains on investments, in accordance with requirements of the Internal Revenue Code. Accordingly, no provision for federal income tax or excise tax has been made in the financial statements.
Management evaluates its tax positions to determine if the tax positions taken meet the minimum recognition threshold in connection with accounting for uncertainties in income tax positions taken or expected to be taken for the purposes of measuring and recognizing tax liabilities in the financial statements. Recognition of tax benefits of an uncertain tax position is required only when the position is “more likely than not” to be sustained assuming examination by taxing authorities. At June 30, 2011, the Series has recorded no liability for net unrecognized tax benefits relating to uncertain income tax positions taken or expected to be taken in future tax returns.
The Series files income tax returns in the U.S. federal jurisdiction and various states, as required. No income tax returns are currently under investigation. The statute of limitations on the Series’ tax returns remains open for the years ended December 31, 2007 through December 31, 2010. The Fund is not aware of any tax positions for which it is reasonably possible that the total amounts of unrecognized tax benefits will significantly change in the next twelve months.
Distributions of Income and Gains
Distributions to shareholders of net investment income are made quarterly. Distributions of net realized gains are made annually. An additional distribution may be necessary to avoid taxation of the Series. Distributions are recorded on the ex-dividend date.
Indemnifications
The Fund’s organizational documents provide former and current directors and officers with a limited indemnification against liabilities arising in connection with the performance of their duties to the Fund. In the normal course of business, the Fund may also enter into contracts that provide general indemnifications. The Fund’s maximum exposure under these arrangements is unknown as this would be dependent on future claims that may be made against the Fund. The risk of material loss from such claims is considered remote.
Other
The preparation of financial statements in conformity with accounting principles generally accepted in the United States of America requires management to make estimates and assumptions that affect the reported amounts of assets and liabilities and the disclosure of contingent assets and liabilities at the date of the financial statements and the reported amounts of income and expenses during the reporting period. Actual results could differ from those estimates.
Notes to Financial Statements (unaudited)
| 3. | TRANSACTIONS WITH AFFILIATES |
The Fund has an Investment Advisory Agreement (the “Agreement”) with the Advisor, for which the Series pays a fee, computed daily and payable monthly, at an annual rate of 0.50% of the Series’ average daily net assets.
Under the Agreement, personnel of the Advisor provide the Series with advice and assistance in the choice of investments and the execution of securities transactions, and otherwise maintain the Series’ organization. The Advisor also provides the Fund with necessary office space and fund administration and support services. The salaries of all officers of the Fund (except a percentage of the Fund’s Chief Compliance Officer’s salary, which is paid by the Fund), and of all Directors who are “affiliated persons” of the Fund, or of the Advisor, and all personnel of the Fund, or of the Advisor, performing services relating to research, statistical and investment activities, are paid by the Advisor. Each “non-affiliated” Director receives an annual stipend, which is allocated among all the active series of the Fund. In addition, these Directors also receive a fee per Board meeting attended plus a fee for each committee meeting attended.
The Advisor has contractually agreed, until at least April 30, 2012, to waive its fee and, if necessary, pay other operating expenses of the Series in order to maintain total direct annual fund operating expenses for the Series at no more than 0.85% of average daily net assets each year. The Advisor did not waive any fees for the six months ended June 30, 2011. The Advisor is not eligible to recoup any expenses that have been waived or reimbursed in prior years.
Manning & Napier Investor Services, Inc., a registered broker-dealer affiliate of the Advisor, acts as distributor for the Fund’s shares. The services of Manning & Napier Investor Services, Inc. are provided at no additional cost to the Series.
The Advisor has agreements with BNY Mellon Investment Servicing (U.S.) Inc. (“BNY��) under which BNY serves as sub-accountant services agent and sub-transfer agent. The Fund pays the Advisor an annual fee related to fund accounting and administration of 0.0175% on the first $3 billion of average daily net assets (excluding Target Series); 0.015% on the next $3 billion of average daily net assets (excluding Target Series); and 0.01% of the average daily net assets in excess of $6 billion (excluding Target Series); plus a base fee of $25,500 per Series. Transfer Agent fees are charged to the Fund on a per account basis. Additionally, certain transaction- and cusip-based fees and out-of-pocket expenses, including charges for reporting relating to the Fund’s compliance program, are charged.
Expenses not directly attributable to a Series are allocated based on each Series’ relative net assets or number of accounts, depending on the expense.
| 4. | PURCHASES AND SALES OF SECURITIES |
For the six months ended June 30, 2011, purchases and sales of securities, other than U.S. Government securities and short-term securities, were $11,617,032 and $7,217,466, respectively. There were no purchases or sales of U.S. Government securities.
Notes to Financial Statements (unaudited)
| 5. | CAPITAL STOCK TRANSACTIONS |
Transactions in shares of Ohio Tax Exempt Series were:
| | | | | | | | | | | | | | | | | | | | |
| | | For the Six Months Ended
6/30/11 | | For the Year
Ended 12/31/10 |
| | | Shares | | Amount | | Shares | | Amount |
Sold | | | | 426,422 | | | | $ | 4,419,598 | | | | | 1,165,715 | | | | $ | 12,625,181 | |
Reinvested | | | | 45,412 | | | | | 480,367 | | | | | 89,722 | | | | | 946,551 | |
Repurchased | | | | (83,507 | ) | | | | (857,640 | ) | | | | (262,403 | ) | | | | (2,842,851 | ) |
| | | | | | | | | | | | | | | | | | | | |
Total | | | | 388,327 | | | | $ | 4,042,325 | | | | | 993,034 | | | | $ | 10,728,881 | |
| | | | | | | | | | | | | | | | | | | | |
Substantially all of the Series’ shares represent investments by fiduciary accounts over which the Advisor has sole investment discretion.
The Series may trade in instruments including written and purchased options, forward foreign currency exchange contracts and futures contracts and other derivatives in the normal course of investing activities to assist in managing exposure to various market risks. The Series may be subject to various elements of risk, which may involve, to a varying degree, elements of risk in excess of the amounts recognized for financial statement purposes. These risks include: the risk that changes in the value of a derivative may not correlate perfectly with the underlying asset, rate or index, counterparty credit risk related to over the counter derivatives’ counterparties failure to perform under contract terms, liquidity risk related to the lack of a liquid market for these contracts allowing the fund to close out its position(s) and documentation risk relating to disagreement over contract terms. No such investments were held by the Series on June 30, 2011.
| 7. | CONCENTRATION OF CREDIT |
The Series primarily invests in debt obligations issued by the State of Ohio and its political subdivisions, agencies and public authorities to obtain funds for various public purposes. The Series is more susceptible to factors adversely affecting issues of Ohio municipal securities than is a municipal bond fund that is not concentrated in these issues to the same extent.
| 8. | FEDERAL INCOME TAX INFORMATION |
The amount and characterization of certain income and capital gains to be distributed are determined in accordance with federal income tax regulations, which may differ from accounting principles generally accepted in the United States of America. The Series may periodically make reclassifications among its capital accounts to reflect income and gains available for distribution (or available capital loss carryovers) under income tax regulations, without impacting the Series’ net asset value. Any such reclassifications are not reflected in the financial highlights.
The final determination of the tax character of current year distributions will be made at the conclusion of the fiscal year. The tax character of distributions paid for the year ended December 31, 2010 was as follows:
| | | | | |
Tax exempt income | | | $ | 996,467 | |
Notes to Financial Statements (unaudited)
| 8. | FEDERAL INCOME TAX INFORMATION (continued) |
At June 30, 2011, the identified cost of investments for federal income tax purposes, the resulting gross unrealized appreciation and depreciation, and the net unrealized appreciation were as follows:
| | | | | |
Cost for federal income tax purposes | | | $ | 39,549,055 | |
Unrealized appreciation | | | $ | 615,082 | |
Unrealized depreciation | | | | (256,212 | ) |
| | | | | |
Net unrealized appreciation | | | $ | 358,870 | |
| | | | | |
Literature Requests (unaudited)
Proxy Voting Policies and Procedures
A description of the policies and procedures that the Fund uses to determine how to vote proxies relating to portfolio securities is available, without charge, upon request:
| | |
| By phone | | 1-800-466-3863 |
| On the Securities and Exchange Commission’s | | |
| (SEC) web site | | http://www.sec.gov |
Proxy Voting Record
Information regarding how the Fund voted proxies relating to portfolio securities during the most recent 12-month period ended June 30th is available, without charge, upon request:
| | |
| By phone | | 1-800-466-3863 |
| On the SEC’s web site | | http://www.sec.gov |
Quarterly Portfolio Holdings
The Series’ complete schedule of portfolio holdings for the 1st and 3rd quarters of each fiscal year are provided on Form N-Q, and are available, without charge, upon request:
| | |
| By phone | | 1-800-466-3863 |
| On the SEC’s web site | | http://www.sec.gov |
The Series’ Form N-Q may be reviewed and copied at the SEC’s Public Reference Room in Washington, D.C. Information on the operation of the Public Reference Room may be obtained by calling 1-800-SEC-0330.
Prospectus and Statement of Additional Information (SAI)
The prospectus and SAI provide additional information about each Series, including charges, expenses and risks. These documents are available, without charge, upon request:
| | |
| By phone | | 1-800-466-3863 |
| On the SEC’s web site | | http://www.sec.gov |
| On our web site | | http://www.manning-napier.com |
Additional information available at www.manning-napier.com
1. Fund Holdings - Month-End
2. Fund Holdings - Quarter-End
3. Shareholder Report - Annual
4. Shareholder Report - Semi-Annual
The Fund also offers electronic notification or “e-delivery” when certain documents are available on-line to be downloaded or reviewed. Direct shareholders can elect to receive electronic notification when shareholder reports, prospectus updates, and / or quarterly statements are available. If you do not currently have on-line access to your account, you can establish access by going to www.manning-napier.com, click on “Login” in the top corner of the page, and follow the prompts to self-enroll. Once enrolled, you can set your electronic notification preferences by clicking on the Account Options tab located within the green toolbar and then select E-Delivery Option. Should you have any questions on either how to establish on-line access or how to update your account settings, please do not hesitate to contact Investor Services at 1-800-466-3863.
MNOHTES-6/11-SAR


| | | | |
| | DIVERSIFIED TAX EXEMPT SERIES | | |
Shareholder Expense Example (unaudited)
As a shareholder of the Series, you may incur two types of costs: (1) transaction costs and (2) ongoing costs, including management fees and other Series expenses. This example is intended to help you understand your ongoing costs (in dollars) of investing in the Series and to compare these costs with the ongoing costs of investing in other mutual funds.
The example is based on an investment of $1,000 invested at the beginning of the period and held for the entire period (January 1, 2011 to June 30, 2011).
Actual Expenses
The first line of the table below provides information about actual account values and actual expenses. You may use the information in this line, together with the amount you invested, to estimate the expenses that you paid over the period. Simply divide your account value by $1,000 (for example, an $8,600 account value divided by $1,000 = 8.6), then multiply the result by the number in the first line under the heading entitled “Expenses Paid During Period” to estimate the expenses you paid on your account during this period.
Hypothetical Example for Comparison Purposes
The second line of the table below provides information about hypothetical account values and hypothetical expenses based on the Series’ actual expense ratio and an assumed rate of return of 5% per year before expenses, which is not the Series’ actual return. The hypothetical account values and expenses may not be used to estimate the actual ending account balance or expenses you paid during the period. You may use this information to compare the ongoing costs of investing in the Series and other funds. To do so, compare this 5% hypothetical example with the 5% hypothetical examples that appear in the shareholder reports of the other funds.
Please note that the expenses shown in the table are meant to highlight your ongoing costs only and do not reflect any transaction costs. Therefore, the second line of the table is useful in comparing ongoing costs only, and will not help you determine the relative total costs of owning different funds. In addition, if these transaction costs were included, your costs would have been higher.
| | | | | | | | | | | | | | | | | |
| | | Beginning
Account Value
1/1/11 | | Ending
Account Value
6/30/11 | | Expenses Paid
During Period*
1/1/11-6/30/11 | | |
Actual | | | $ | 1,000.00 | | | | $ | 1,047.60 | | | | $ | 2.89 | | | |
Hypothetical
(5% return before expenses) | | | $ | 1,000.00 | | | | $ | 1,021.97 | | | | $ | 2.86 | | | |
| * | Expenses are equal to the Series’ annualized expense ratio (for the six-month period) of 0.57%, multiplied by the average account value over the period, multiplied by 181/365 (to reflect the one-half year period). Expenses are based on the most recent fiscal half year. |
Portfolio Composition (unaudited)
As of June 30, 2011
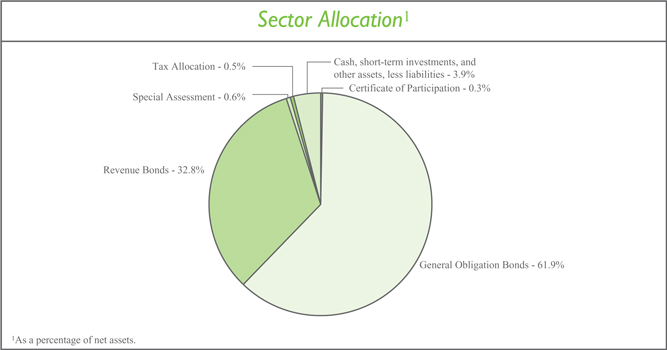
Credit Quality Ratings2,3
| | | | | |
Aaa | | | | 29.8 | % |
Aa | | | | 53.3 | % |
A | | | | 8.4 | % |
Baa | | | | 4.1 | % |
Unrated investments | | | | 0.5 | % |
Cash, short-term investments, and other assets, less liabilities | | | | 3.9 | % |
| 2 | As a percentage of net assets. |
| 3 | Based on ratings from Moody’s, or the S&P equivalent. The Series may use different ratings provided by other rating agencies for purposes of determining compliance with the Series’ investment policies. |
TopTen States4
| | | | | |
Massachusetts | | | | 5.9 | % |
Texas | | | | 5.2 | % |
Virginia | | | | 5.0 | % |
South Carolina | | | | 4.4 | % |
Maryland | | | | 4.4 | % |
Georgia | | | | 4.2 | % |
Florida | | | | 3.9 | % |
Washington | | | | 3.7 | % |
New York | | | | 3.7 | % |
North Carolina | | | | 3.5 | % |
4 As a percentage of total investments. | | | | | |
Investment Portfolio - June 30, 2011 (unaudited)
| | | | | | | | | | | | | | | | | | | | | | | | | |
| | | Coupon
Rate | | Maturity
Date | | Credit
Rating1 | | Principal
Amount | | Value
(Note 2) |
| | | | | |
MUNICIPAL BONDS - 96.1% | | | | | | | | | | | | | | | | | | | | | | | | | |
| | | | | |
ALABAMA - 0.4% | | | | | | | | | | | | | | | | | | | | | | | | | |
Fort Payne Waterworks Board, Revenue Bond, AMBAC | | | | 3.500 | % | | | | 7/1/2015 | | | | | WR | 2 | | | $ | 665,000 | | | | $ | 685,416 | |
Odenville Utilities Board, Water, Revenue Bond, NATL | | | | 4.300 | % | | | | 8/1/2028 | | | | | Baa1 | | | | | 500,000 | | | | | 430,565 | |
| | | | | | | | | | | | | | | | | | | | | | | | | |
| | | | | | | | | | | | | | | | | | | | | | | | 1,115,981 | |
| | | | | | | | | | | | | | | | | | | | | | | | | |
| | | | | |
ALASKA - 0.2% | | | | | | | | | | | | | | | | | | | | | | | | | |
Alaska Municipal Bond Bank Authority, Series 1, Revenue Bond, NATL | | | | 4.100 | % | | | | 6/1/2017 | | | | | Aa2 | | | | | 455,000 | | | | | 481,909 | |
| | | | | | | | | | | | | | | | | | | | | | | | | |
| | | | | |
ARIZONA - 1.7% | | | | | | | | | | | | | | | | | | | | | | | | | |
Mesa, G.O. Bond, FGRNA | | | | 4.125 | % | | | | 7/1/2027 | | | | | Aa2 | | | | | 2,215,000 | | | | | 2,220,250 | |
Salt River Project Agricultural Impt. & Power District, Series A, Revenue Bond | | | | 5.000 | % | | | | 1/1/2035 | | | | | Aa1 | | | | | 1,700,000 | | | | | 1,725,993 | |
Yuma County Library District, Series A, G.O. Bond, AMBAC | | | | 4.500 | % | | | | 7/1/2035 | | | | | Aa3 | | | | | 1,200,000 | | | | | 1,113,504 | |
| | | | | | | | | | | | | | | | | | | | | | | | | |
| | | | | | | | | | | | | | | | | | | | | | | | 5,059,747 | |
| | | | | | | | | | | | | | | | | | | | | | | | | |
| | | | | |
ARKANSAS - 1.6% | | | | | | | | | | | | | | | | | | | | | | | | | |
Arkansas State, G.O. Bond | | | | 4.000 | % | | | | 8/1/2014 | | | | | Aa1 | | | | | 2,340,000 | | | | | 2,568,922 | |
Arkansas State, Water Utility Impt., Series A, G.O. Bond | | | | 4.500 | % | | | | 7/1/2044 | | | | | Aa1 | | | | | 1,000,000 | | | | | 989,810 | |
Bentonville School District No. 6, Series A, G.O. Bond | | | | 4.500 | % | | | | 6/1/2040 | | | | | Aa2 | | | | | 1,000,000 | | | | | 1,000,480 | |
Hot Springs, Public Impt., Revenue Bond, AGC. | | | | 4.625 | % | | | | 12/1/2037 | | | | | AA | 3 | | | | 500,000 | | | | | 492,110 | |
| | | | | | | | | | | | | | | | | | | | | | | | | |
| | | | | | | | | | | | | | | | | | | | | | | | 5,051,322 | |
| | | | | | | | | | | | | | | | | | | | | | | | | |
| | | | | |
CALIFORNIA - 2.0% | | | | | | | | | | | | | | | | | | | | | | | | | |
Campbell Union School District, G.O. Bond, AGM | | | | 4.375 | % | | | | 8/1/2027 | | | | | Aa2 | | | | | 1,810,000 | | | | | 1,784,226 | |
Chula Vista Elementary School District, Series F, G.O. Bond, NATL | | | | 4.800 | % | | | | 8/1/2024 | | | | | Baa1 | | | | | 435,000 | | | | | 441,273 | |
Chula Vista Elementary School District, Series F, G.O. Bond, NATL | | | | 4.875 | % | | | | 8/1/2025 | | | | | Baa1 | | | | | 425,000 | | | | | 430,385 | |
Los Angeles Unified School District, Series B, G.O. Bond, AMBAC | | | | 4.500 | % | | | | 7/1/2027 | | | | | Aa2 | | | | | 840,000 | | | | | 809,348 | |
Oak Valley Hospital District, G.O. Bond, FGRNA | | | | 4.500 | % | | | | 7/1/2025 | | | | | A1 | | | | | 1,395,000 | | | | | 1,313,951 | |
| | | | | | |
| | The accompanying notes are an integral part of the financial statements. | | | 3 | |
Investment Portfolio - June 30, 2011 (unaudited)
| | | | | | | | | | | | | | | | | | | | | | | | | |
| | | Coupon
Rate | | Maturity
Date | | Credit
Rating1 | | Principal
Amount | | Value
(Note 2) |
| | | | | |
MUNICIPAL BONDS (continued) | | | | | | | | | | | | | | | | | | | | | | | | | |
| | | | | |
CALIFORNIA (continued) | | | | | | | | | | | | | | | | | | | | | | | | | |
Richmond Joint Powers Financing Authority, Series A, Tax Allocation, NATL | | | | 5.250 | % | | | | 9/1/2025 | | | | | Baa1 | | | | $ | 1,570,000 | | | | $ | 1,471,357 | |
| | | | | | | | | | | | | | | | | | | | | | | | | |
| | | | | | | | | | | | | | | | | | | | | | | | 6,250,540 | |
| | | | | | | | | | | | | | | | | | | | | | | | | |
| | | | | |
COLORADO - 0.7% | | | | | | | | | | | | | | | | | | | | | | | | | |
Colorado Water Resources & Power | | | | | | | | | | | | | | | | | | | | | | | | | |
Development Authority, Water Resource, Series D, Revenue Bond, AGM | | | | 4.375 | % | | | | 8/1/2035 | | | | | Aa2 | | | | | 1,420,000 | | | | | 1,328,552 | |
Commerce City, Certificate of Participation, AMBAC | | | | 4.750 | % | | | | 12/15/2032 | | | | | Aaa | | | | | 1,000,000 | | | | | 939,740 | |
| | | | | | | | | | | | | | | | | | | | | | | | | |
| | | | | | | | | | | | | | | | | | | | | | | | 2,268,292 | |
| | | | | | | | | | | | | | | | | | | | | | | | | |
| | | | | |
DELAWARE - 1.9% | | | | | | | | | | | | | | | | | | | | | | | | | |
Delaware State, Public Impt., G.O. Bond | | | | 5.000 | % | | | | 3/1/2014 | | | | | Aaa | | | | | 1,000,000 | | | | | 1,115,120 | |
Delaware State, Public Impt., Series B, G.O. Bond | | | | 5.000 | % | | | | 2/1/2013 | | | | | Aaa | | | | | 1,800,000 | | | | | 1,933,344 | |
New Castle County, Public Impt., Series A, G.O. Bond | | | | 4.250 | % | | | | 7/15/2025 | | | | | Aaa | | | | | 1,500,000 | | | | | 1,538,340 | |
New Castle County, Public Impt., Series A, G.O. Bond | | | | 4.250 | % | | | | 7/15/2026 | | | | | Aaa | | | | | 1,265,000 | | | | | 1,292,792 | |
| | | | | | | | | | | | | | | | | | | | | | | | | |
| | | | | | | | | | | | | | | | | | | | | | | | 5,879,596 | |
| | | | | | | | | | | | | | | | | | | | | | | | | |
| | | | | |
DISTRICT OF COLUMBIA - 1.9% | | | | | | | | | | | | | | | | | | | | | | | | | |
District of Columbia Water & Sewer Authority, | | | | | | | | | | | | | | | | | | | | | | | | | |
Water Utility Impt., Revenue Bond, AGM | | | | 6.000 | % | | | | 10/1/2014 | | | | | Aa2 | | | | | 1,500,000 | | | | | 1,731,840 | |
District of Columbia Water & Sewer Authority, | | | | | | | | | | | | | | | | | | | | | | | | | |
Water Utility Impt., Series A, Revenue Bond | | | | 5.250 | % | | | | 10/1/2029 | | | | | Aa2 | | | | | 1,000,000 | | | | | 1,068,870 | |
District of Columbia, Public Impt., Prerefunded | | | | | | | | | | | | | | | | | | | | | | | | | |
Balance, Series A, G.O. Bond, AMBAC | | | | 5.000 | % | | | | 6/1/2022 | | | | | Aa2 | | | | | 500,000 | | | | | 543,800 | |
District of Columbia, Series A, G.O. Bond, FGRNA | | | | 4.750 | % | | | | 6/1/2033 | | | | | Aa2 | | | | | 2,500,000 | | | | | 2,436,750 | |
| | | | | | | | | | | | | | | | | | | | | | | | | |
| | | | | | | | | | | | | | | | | | | | | | | | 5,781,260 | |
| | | | | | | | | | | | | | | | | | | | | | | | | |
| | | | | |
FLORIDA - 3.9% | | | | | | | | | | | | | | | | | | | | | | | | | |
Cape Coral, Water Utility Impt., Special Assessment, NATL | | | | 4.500 | % | | | | 7/1/2021 | | | | | A2 | | | | | 1,845,000 | | | | | 1,882,435 | |
Florida State Board of Education, Capital Outlay, Public Education, Series D, G.O. Bond | | | | 5.000 | % | | | | 6/1/2016 | | | | | Aa1 | | | | | 2,000,000 | | | | | 2,288,200 | |
| | | | |
| 4 | | The accompanying notes are an integral part of the financial statements. | | |
Investment Portfolio - June 30, 2011 (unaudited)
| | | | | | | | | | | | | | | | | | | | | | | | | |
| | | Coupon
Rate | | Maturity
Date | | Credit
Rating1 | | Principal
Amount | | Value
(Note 2) |
| | | | | |
MUNICIPAL BONDS (continued) | | | | | | | | | | | | | | | | | | | | | | | | | |
| | | | | |
FLORIDA (continued) | | | | | | | | | | | | | | | | | | | | | | | | | |
Florida State Department of Transportation, G.O. Bond | | | | 5.000 | % | | | | 7/1/2027 | | | | | Aa1 | | | | $ | 1,000,000 | | | | $ | 1,037,300 | |
Fort Lauderdale, Water Utility Impt., Revenue Bond | | | | 4.500 | % | | | | 9/1/2038 | | | | | Aa1 | | | | | 1,000,000 | | | | | 933,110 | |
Miami-Dade County, Water & Sewer Systems, Revenue Bond, AGM | | | | 5.000 | % | | | | 10/1/2039 | | | | | Aa2 | | | | | 1,500,000 | | | | | 1,506,510 | |
Palm Beach County, FPL Reclaimed Water Project, Revenue Bond | | | | 5.000 | % | | | | 10/1/2040 | | | | | Aaa | | | | | 1,020,000 | | | | | 1,046,979 | |
Panama City Beach, Water Utility Impt., Revenue Bond, AGC | | | | 5.000 | % | | | | 6/1/2039 | | | | | AA | 3 | | | | 1,000,000 | | | | | 1,003,200 | |
Tampa Bay Water Utility System, Revenue Bond | | | | 5.000 | % | | | | 10/1/2038 | | | | | Aa2 | | | | | 1,000,000 | | | | | 1,013,280 | |
Winter Park, Electric Impt., Series A, Revenue Bond, AGM | | | | 5.000 | % | | | | 10/1/2029 | | | | | Aa3 | | | | | 1,000,000 | | | | | 1,037,570 | |
Winter Park, Impt., Revenue Bond | | | | 5.000 | % | | | | 12/1/2034 | | | | | Aa2 | | | | | 250,000 | | | | | 251,870 | |
| | | | | | | | | | | | | | | | | | | | | | | | | |
| | | | | | | | | | | | | | | | | | | | | | | | 12,000,454 | |
| | | | | | | | | | | | | | | | | | | | | | | | | |
| | | | | |
GEORGIA - 4.2% | | | | | | | | | | | | | | | | | | | | | | | | | |
Atlanta, Prerefunded Balance, G.O. Bond | | | | 5.600 | % | | | | 12/1/2018 | | | | | Aa2 | | | | | 350,000 | | | | | 355,009 | |
Atlanta, Water & Wastewater, Revenue Bond, AGM | | | | 5.000 | % | | | | 11/1/2043 | | | | | Aa3 | | | | | 1,500,000 | | | | | 1,471,590 | |
Cobb County, Water Utility Impt., Revenue Bond | | | | 4.250 | % | | | | 7/1/2028 | | | | | Aaa | | | | | 1,000,000 | | | | | 1,021,100 | |
Dekalb County, Special Transportation Parks & Greenspace, G.O. Bond | | | | 4.375 | % | | | | 12/1/2030 | | | | | Aa3 | | | | | 1,000,000 | | | | | 891,980 | |
Dekalb County, Water & Sewer, Series A, Revenue Bond | | | | 5.000 | % | | | | 10/1/2035 | | | | | Aa1 | | | | | 1,000,000 | | | | | 972,530 | |
Forsyth County, Public Impt., Series B, G.O. Bond | | | | 5.000 | % | | | | 3/1/2013 | | | | | Aaa | | | | | 670,000 | | | | | 721,590 | |
Fulton County, Water Utility Impt., Revenue Bond, FGRNA | | | | 5.000 | % | | | | 1/1/2035 | | | | | Aa3 | | | | | 1,000,000 | | | | | 1,001,630 | |
Georgia State, Prerefunded Balance, Series B, G.O. Bond | | | | 5.650 | % | | | | 3/1/2012 | | | | | Aaa | | | | | 5,000 | | | | | 5,182 | |
Georgia State, School Impt., Prerefunded Balance, Series F, G.O. Bond | | | | 5.000 | % | | | | 11/1/2015 | | | | | Aaa | | | | | 500,000 | | | | | 531,240 | |
Georgia State, School Impt., Series C-1, G.O. Bond | | | | 5.000 | % | | | | 10/1/2014 | | | | | Aaa | | | | | 1,415,000 | | | | | 1,607,624 | |
Georgia State, Series B, G.O. Bond | | | | 5.000 | % | | | | 7/1/2015 | | | | | Aaa | | | | | 2,000,000 | | | | | 2,308,880 | |
Georgia State, Unrefunded Balance, Series B, G.O. Bond | | | | 5.650 | % | | | | 3/1/2012 | | | | | Aaa | | | | | 195,000 | | | | | 202,082 | |
| | | | | | |
| | The accompanying notes are an integral part of the financial statements. | | | 5 | |
Investment Portfolio - June 30, 2011 (unaudited)
| | | | | | | | | | | | | | | | | | | | | | | | | |
| | | Coupon
Rate | | Maturity
Date | | Credit
Rating1 | | Principal
Amount | | Value
(Note 2) |
| | | | | |
MUNICIPAL BONDS (continued) | | | | | | | | | | | | | | | | | | | | | | | | | |
| | | | | |
GEORGIA (continued) | | | | | | | | | | | | | | | | | | | | | | | | | |
Gwinnett County Water & Sewerage Authority, | | | | | | | | | | | | | | | | | | | | | | | | | |
Water Utility Impt., Series A, Revenue Bond | | | | 4.000 | % | | | | 8/1/2028 | | | | | Aaa | | | | $ | 1,000,000 | | | | $ | 1,006,160 | |
Madison, Water & Sewer, Revenue Bond, AMBAC | | | | 4.625 | % | | | | 7/1/2030 | | | | | WR | 2 | | | | 1,000,000 | | | | | 940,310 | |
| | | | | | | | | | | | | | | | | | | | | | | | | |
| | | | | | | | | | | | | | | | | | | | | | | | 13,036,907 | |
| | | | | | | | | | | | | | | | | | | | | | | | | |
| | | | | |
HAWAII - 1.2% | | | | | | | | | | | | | | | | | | | | | | | | | |
Hawaii State, Series DB, G.O. Bond, NATL | | | | 5.250 | % | | | | 9/1/2013 | | | | | Aa2 | | | | | 875,000 | | | | | 962,421 | |
Hawaii State, Series DG, G.O. Bond, AMBAC | | | | 5.000 | % | | | | 7/1/2014 | | | | | Aa2 | | | | | 500,000 | | | | | 561,075 | |
Hawaii State, Series DT, G.O. Bond | | | | 5.000 | % | | | | 11/1/2014 | | | | | Aa2 | | | | | 550,000 | | | | | 622,001 | |
Honolulu County, Public Impt., Series B, G.O. Bond | | | | 4.750 | % | | | | 12/1/2035 | | | | | Aa1 | | | | | 1,000,000 | | | | | 1,007,520 | |
Honolulu County, Sewer Impt., Series A, | | | | | | | | | | | | | | | | | | | | | | | | | |
Revenue Bond, FGRNA | | | | 5.000 | % | | | | 7/1/2035 | | | | | Aa2 | | | | | 500,000 | | | | | 506,325 | |
| | | | | | | | | | | | | | | | | | | | | | | | | |
| | | | | | | | | | | | | | | | | | | | | | | | 3,659,342 | |
| | | | | | | | | | | | | | | | | | | | | | | | | |
| | | | | |
ILLINOIS - 0.8% | | | | | | | | | | | | | | | | | | | | | | | | | |
Chicago, Unrefunded Balance, Series A, G.O. Bond, NATL | | | | 5.000 | % | | | | 1/1/2034 | | | | | Aa3 | | | | | 520,000 | | | | | 503,620 | |
Springfield Metropolitan Sanitation District, Series A, G.O. Bond | | | | 4.750 | % | | | | 1/1/2034 | | | | | AA | 3 | | | | 1,115,000 | | | | | 1,108,901 | |
Springfield, Electric Power & Light, Revenue Bond, NATL | | | | 5.000 | % | | | | 3/1/2035 | | | | | A1 | | | | | 1,000,000 | | | | | 980,890 | |
| | | | | | | | | | | | | | | | | | | | | | | | | |
| | | | | | | | | | | | | | | | | | | | | | | | 2,593,411 | |
| | | | | | | | | | | | | | | | | | | | | | | | | |
| | | | | |
INDIANA - 3.4% | | | | | | | | | | | | | | | | | | | | | | | | | |
Avon Community School Building Corp., Revenue Bond, AMBAC | | | | 4.250 | % | | | | 7/15/2018 | | | | | A | 3 | | | | 1,450,000 | | | | | 1,551,442 | |
Avon Community School Building Corp., Revenue Bond, AMBAC | | | | 4.750 | % | | | | 1/15/2032 | | | | | A | 3 | | | | 1,015,000 | | | | | 983,900 | |
Frankfort High School Elementary School Building Corp., Revenue Bond, AGM | | | | 4.750 | % | | | | 7/15/2025 | | | | | Aa3 | | | | | 1,500,000 | | | | | 1,549,155 | |
Indiana Municipal Power Agency, Series A, Revenue Bond, NATL | | | | 5.000 | % | | | | 1/1/2042 | | | | | A1 | | | | | 1,000,000 | | | | | 971,060 | |
Indianapolis Local Public Impt. Bond Bank, Waterworks Project, Series A, Revenue Bond, AGC | | | | 5.500 | % | | | | 1/1/2038 | | | | | Aa3 | | | | | 1,000,000 | | | | | 1,040,470 | |
North Lawrence Community Schools Building Corp., Revenue Bond, AGM | | | | 5.000 | % | | | | 7/15/2020 | | | | | Aa3 | | | | | 450,000 | | | | | 471,240 | |
Plainfield, Series A, Revenue Bond | | | | 4.650 | % | | | | 1/1/2027 | | | | | A | 3 | | | | 645,000 | | | | | 652,740 | |
| | | | |
| 6 | | The accompanying notes are an integral part of the financial statements. | | |
Investment Portfolio - June 30, 2011 (unaudited)
| | | | | | | | | | | | | | | | | | | | | | | | | |
| | | Coupon
Rate | | Maturity
Date | | Credit
Rating1 | | Principal
Amount | | Value
(Note 2) |
| | | | | |
MUNICIPAL BONDS (continued) | | | | | | | | | | | | | | | | | | | | | | | | | |
| | | | | |
INDIANA (continued) | | | | | | | | | | | | | | | | | | | | | | | | | |
Shelbyville Central Renovation School Building Corp., Revenue Bond, NATL | | | | 5.000 | % | | | | 7/15/2018 | | | | | Baa1 | | | | $ | 3,000,000 | | | | $ | 3,290,580 | |
| | | | | | | | | | | | | | | | | | | | | | | | | |
| | | | | | | | | | | | | | | | | | | | | | | | 10,510,587 | |
| | | | | | | | | | | | | | | | | | | | | | | | | |
| | | | | |
IOWA - 2.8% | | | | | | | | | | | | | | | | | | | | | | | | | |
Ankeny, Series B, G.O. Bond | | | | 4.000 | % | | | | 6/1/2013 | | | | | Aa2 | | | | | 1,550,000 | | | | | 1,653,339 | |
Cedar Rapids, Public Impt., Series A, G.O. Bond | | | | 4.000 | % | | | | 6/1/2030 | | | | | Aaa | | | | | 440,000 | | | | | 428,019 | |
Cedar Rapids, Series E, G.O. Bond | | | | 3.000 | % | | | | 6/1/2014 | | | | | Aaa | | | | | 1,000,000 | | | | | 1,063,710 | |
Des Moines, Public Impt., Series A, G.O. Bond . | | | | 2.000 | % | | | | 6/1/2013 | | | | | Aa1 | | | | | 1,000,000 | | | | | 1,029,260 | |
Dubuque Iowa, Series D, Revenue Bond | | | | 4.000 | % | | | | 6/1/2030 | | | | | Aa2 | | | | | 470,000 | | | | | 444,855 | |
Indianola Community School District, G.O. Bond, FGRNA | | | | 5.200 | % | | | | 6/1/2021 | | | | | A1 | | | | | 425,000 | | | | | 451,380 | |
Iowa City Community School District, G.O. Bond, AGM | | | | 4.000 | % | | | | 6/1/2018 | | | | | Aaa | | | | | 425,000 | | | | | 437,975 | |
Linn-Mar Community School District, Revenue Bond | | | | 4.625 | % | | | | 7/1/2029 | | | | | A2 | | | | | 1,000,000 | | | | | 1,013,350 | |
Polk County, Series C, G.O. Bond | | | | 4.000 | % | | | | 6/1/2017 | | | | | Aaa | | | | | 995,000 | | | | | 1,055,715 | |
Sioux City, Public Impt., Series A, G.O. Bond | | | | 2.000 | % | | | | 6/1/2014 | | | | | Aa1 | | | | | 940,000 | | | | | 971,988 | |
| | | | | | | | | | | | | | | | | | | | | | | | | |
| | | | | | | | | | | | | | | | | | | | | | | | 8,549,591 | |
| | | | | | | | | | | | | | | | | | | | | | | | | |
| | | | | |
KANSAS - 1.7% | | | | | | | | | | | | | | | | | | | | | | | | | |
Johnson County Water District No. 1, Revenue Bond | | | | 3.250 | % | | | | 12/1/2030 | | | | | Aaa | | | | | 1,000,000 | | | | | 862,670 | |
Miami County Unified School District No. 416 Louisburg, G.O Bond, NATL | | | | 5.000 | % | | | | 9/1/2018 | | | | | Baa1 | | | | | 2,000,000 | | | | | 2,217,560 | |
Scott County, G.O. Bond | | | | 4.750 | % | | | | 4/1/2040 | | | | | A | 3 | | | | 1,000,000 | | | | | 1,010,640 | |
Seward County, G.O. Bond, AGM | | | | 5.000 | % | | | | 8/1/2040 | | | | | Aa3 | | | | | 1,000,000 | | | | | 1,038,430 | |
| | | | | | | | | | | | | | | | | | | | | | | | | |
| | | | | | | | | | | | | | | | | | | | | | | | 5,129,300 | |
| | | | | | | | | | | | | | | | | | | | | | | | | |
| | | | | |
KENTUCKY - 0.9% | | | | | | | | | | | | | | | | | | | | | | | | | |
Lexington-Fayette Urban County Government Public Facilities Corp., Revenue Bond, NATL. | | | | 4.000 | % | | | | 10/1/2018 | | | | | Aa3 | | | | | 1,655,000 | | | | | 1,762,989 | |
Louisville & Jefferson County Metropolitan Sewer District, Series A, Revenue Bond, AGC | | | | 4.250 | % | | | | 5/15/2038 | | | | | Aa3 | | | | | 1,000,000 | | | | | 906,190 | |
| | | | | | | | | | | | | | | | | | | | | | | | | |
| | | | | | | | | | | | | | | | | | | | | | | | 2,669,179 | |
| | | | | | | | | | | | | | | | | | | | | | | | | |
| | | | | | |
| | The accompanying notes are an integral part of the financial statements. | | | 7 | |
Investment Portfolio - June 30, 2011 (unaudited)
| | | | | | | | | | | | | | | | | | | | | | | | | |
| | | Coupon
Rate | | Maturity
Date | | Credit
Rating1 | | Principal
Amount | | Value
(Note 2) |
MUNICIPAL BONDS (continued) | | | | | | | | | | | | | | | | | | | | | | | | | |
| | | | | |
LOUISIANA - 0.7% | | | | | | | | | | | | | | | | | | | | | | | | | |
Caddo Parish Parishwide School District, G.O. Bond, NATL | | | | 4.350 | % | | | | 3/1/2026 | | | | | Aa2 | | | | $ | 660,000 | | | | $ | 669,220 | |
Caddo Parish Parishwide School District, G.O. Bond, NATL | | | | 4.375 | % | | | | 3/1/2027 | | | | | Aa2 | | | | | 1,090,000 | | | | | 1,103,396 | |
New Orleans, Sewage Service, Revenue Bond, FGIC | | | | 5.250 | % | | | | 6/1/2012 | | | | | A3 | | | | | 300,000 | | | | | 300,807 | |
| | | | | | | | | | | | | | | | | | | | | | | | | |
| | | | | | | | | | | | | | | | | | | | | | | | 2,073,423 | |
| | | | | | | | | | | | | | | | | | | | | | | | | |
| | | | | |
MAINE - 0.6% | | | | | | | | | | | | | | | | | | | | | | | | | |
Falmouth, School Impt., G.O. Bond | | | | 2.000 | % | | | | 11/15/2014 | | | | | Aa1 | | | | | 1,000,000 | | | | | 1,034,220 | |
Maine Municipal Bond Bank, Series D, Revenue Bond | | | | 4.000 | % | | | | 11/1/2033 | | | | | AAA | 3 | | | | 1,000,000 | | | | | 925,970 | |
| | | | | | | | | | | | | | | | | | | | | | | | | |
| | | | | | | | | | | | | | | | | | | | | | | | 1,960,190 | |
| | | | | | | | | | | | | | | | | | | | | | | | | |
| | | | | |
MARYLAND - 4.4% | | | | | | | | | | | | | | | | | | | | | | | | | |
Anne Arundel County, Water & Sewer, G.O. Bond | | | | 4.200 | % | | | | 3/1/2025 | | | | | Aa1 | | | | | 1,770,000 | | | | | 1,816,569 | |
Baltimore County, Metropolitan District, G.O. Bond | | | | 4.250 | % | | | | 9/1/2029 | | | | | Aaa | | | | | 1,000,000 | | | | | 1,011,520 | |
Baltimore County, Public Impt., G.O. Bond | | | | 5.000 | % | | | | 2/1/2014 | | | | | Aaa | | | | | 2,250,000 | | | | | 2,500,470 | |
Frederick County, Series C, G.O. Bond | | | | 4.000 | % | | | | 12/1/2014 | | | | | Aa1 | | | | | 1,410,000 | | | | | 1,560,123 | |
Howard County, Public Impt., Series A, G.O. Bond | | | | 4.500 | % | | | | 2/15/2030 | | | | | Aaa | | | | | 1,000,000 | | | | | 1,028,560 | |
Maryland State, Public Impt., First Series, G.O. Bond | | | | 5.000 | % | | | | 3/15/2013 | | | | | Aaa | | | | | 1,000,000 | | | | | 1,079,090 | |
Maryland State, Public Impt., Prerefunded Balance, Second Series, G.O. Bond | | | | 5.000 | % | | | | 8/1/2015 | | | | | Aaa | | | | | 1,000,000 | | | | | 1,095,400 | |
Maryland State, Public Impt., Second Series, G.O. Bond | | | | 5.000 | % | | | | 7/15/2014 | | | | | Aaa | | | | | 1,000,000 | | | | | 1,128,630 | |
Maryland State, Public Impt., Series A, G.O. Bond | | | | 4.000 | % | | | | 8/1/2015 | | | | | Aaa | | | | | 500,000 | | | | | 558,800 | |
Prince George’s County, Public Impt., Series A, G.O. Bond | | | | 4.000 | % | | | | 9/15/2014 | | | | | Aaa | | | | | 550,000 | | | | | 606,611 | |
Prince George’s County, School Impt., G.O. Bond | | | | 5.500 | % | | | | 10/1/2013 | | | | | Aaa | | | | | 400,000 | | | | | 445,176 | |
Prince George’s County, Series D, G.O. Bond | | | | 5.000 | % | | | | 12/1/2012 | | | | | Aaa | | | | | 735,000 | | | | | 784,296 | |
| | | | | | | | | | | | | | | | | | | | | | | | | |
| | | | | | | | | | | | | | | | | | | | | | | | 13,615,245 | |
| | | | | | | | | | | | | | | | | | | | | | | | | |
| | | | | |
MASSACHUSETTS - 5.9% | | | | | | | | | | | | | | | | | | | | | | | | | |
Barnstable, G.O. Bond | | | | 3.000 | % | | | | 6/15/2013 | | | | | AAA | 3 | | | | 670,000 | | | | | 703,634 | |
| | | | |
| 8 | | The accompanying notes are an integral part of the financial statements. | | |
Investment Portfolio - June 30, 2011 (unaudited)
| | | | | | | | | | | | | | | | | | | | | | | | | |
| | | Coupon
Rate | | Maturity
Date | | Credit
Rating1 | | Principal
Amount | | Value
(Note 2) |
MUNICIPAL BONDS (continued) | | | | | | | | | | | | | | | | | | | | | | | | | |
| | | | | |
MASSACHUSETTS (continued) | | | | | | | | | | | | | | | | | | | | | | | | | |
Beverly, Municipal Purpose Loan, G.O. Bond | | | | 4.500 | % | | | | 1/15/2035 | | | | | AA | 3 | | | $ | 695,000 | | | | $ | 674,359 | |
Boston Water & Sewer Commission, Series A, Revenue Bond | | | | 5.000 | % | | | | 11/1/2028 | | | | | Aa1 | | | | | 510,000 | | | | | 555,635 | |
Boston Water & Sewer Commission, Series A, Revenue Bond | | | | 5.000 | % | | | | 11/1/2031 | | | | | Aa1 | | | | | 1,000,000 | | | | | 1,070,970 | |
Boston, Public Impt., Series A, G.O. Bond | | | | 5.000 | % | | | | 1/1/2015 | | | | | Aaa | | | | | 500,000 | | | | | 567,750 | |
Boston, Series A, G.O. Bond, NATL | | | | 4.125 | % | | | | 1/1/2021 | | | | | Aaa | | | | | 1,000,000 | | | | | 1,031,570 | |
Boston, Series A, G.O. Bond, NATL | | | | 4.125 | % | | | | 1/1/2022 | | | | | Aaa | | | | | 410,000 | | | | | 420,742 | |
Cambridge, Series A, G.O. Bond | | | | 4.000 | % | | | | 2/1/2026 | | | | | Aaa | | | | | 850,000 | | | | | 864,892 | |
Cambridge, Series A, G.O. Bond | | | | 4.000 | % | | | | 2/1/2027 | | | | | Aaa | | | | | 850,000 | | | | | 859,741 | |
Commonwealth of Massachusetts, Prerefunded Balance, Series D, G.O. Bond, AGM | | | | 5.000 | % | | | | 12/1/2023 | | | | | Aa1 | | | | | 1,000,000 | | | | | 1,140,180 | |
Commonwealth of Massachusetts, Public Impt., Series C, G.O. Bond | | | | 5.000 | % | | | | 9/1/2013 | | | | | Aa1 | | | | | 1,790,000 | | | | | 1,962,467 | |
Commonwealth of Massachusetts, Public Impt., Series D, G.O. Bond, NATL | | | | 6.000 | % | | | | 11/1/2013 | | | | | Aa1 | | | | | 520,000 | | | | | 584,854 | |
Commonwealth of Massachusetts, Series A, G.O. Bond | | | | 4.750 | % | | | | 8/1/2038 | | | | | Aa1 | | | | | 500,000 | | | | | 503,270 | |
Commonwealth of Massachusetts, Series B, G.O. Bond | | | | 3.000 | % | | | | 7/1/2013 | | | | | Aa1 | | | | | 500,000 | | | | | 524,980 | |
Commonwealth of Massachusetts, Series B, G.O. Bond | | | | 4.000 | % | | | | 7/1/2013 | | | | | Aa1 | | | | | 590,000 | | | | | 631,223 | |
Commonwealth of Massachusetts, Series C, G.O. Bond, AMBAC | | | | 5.500 | % | | | | 12/1/2023 | | | | | Aa1 | | | | | 1,000,000 | | | | | 1,210,360 | |
Commonwealth of Massachusetts, Series D, G.O. Bond | | | | 5.250 | % | | | | 10/1/2014 | | | | | Aa1 | | | | | 1,000,000 | | | | | 1,138,600 | |
Lowell, State Qualified, Prerefunded Balance, G.O. Bond, AMBAC | | | | 5.000 | % | | | | 2/1/2020 | | | | | Aa2 | | | | | 500,000 | | | | | 519,085 | |
Massachusetts Water Resources Authority, Series A, Revenue Bond, AGM | | | | 4.375 | % | | | | 8/1/2032 | | | | | Aa1 | | | | | 2,000,000 | | | | | 1,971,480 | |
Natick, School Impt., G.O. Bond | | | | 3.000 | % | | | | 6/15/2013 | | | | | AAA | 3 | | | | 1,000,000 | | | | | 1,049,800 | |
| | | | | | | | | | | | | | | | | | | | | | | | | |
| | | | | | | | | | | | | | | | | | | | | | | | 17,985,592 | |
| | | | | | | | | | | | | | | | | | | | | | | | | |
| | | | | |
MICHIGAN - 2.1% | | | | | | | | | | | | | | | | | | | | | | | | | |
Bendle Public School District, G.O. Bond, FGRNA | | | | 4.500 | % | | | | 5/1/2028 | | | | | Aa2 | | | | | 640,000 | | | | | 631,046 | |
Detroit City School District, Series B, G.O. Bond, FGIC | | | | 5.000 | % | | | | 5/1/2033 | | | | | Aa2 | | | | | 750,000 | | | | | 701,708 | |
Detroit Sewer Disposal System, Series B, Revenue Bond, FGRNA | | | | 4.625 | % | | | | 7/1/2034 | | | | | A2 | | | | | 1,500,000 | | | | | 1,343,370 | |
Muskegon Public Schools, G.O. Bond, AGM | | | | 5.000 | % | | | | 5/1/2020 | | | | | Aa2 | | | | | 1,000,000 | | | | | 1,062,820 | |
| | | | | | |
| | The accompanying notes are an integral part of the financial statements. | | | 9 | |
Investment Portfolio - June 30, 2011 (unaudited)
| | | | | | | | | | | | | | | | | | | | | | | | | |
| | | Coupon
Rate | | Maturity
Date | | Credit
Rating1 | | Principal
Amount | | Value
(Note 2) |
MUNICIPAL BONDS (continued) | | | | | | | | | | | | | | | | | | | | | | | | | |
| | | | | |
MICHIGAN (continued) | | | | | | | | | | | | | | | | | | | | | | | | | |
Saginaw City School District, G.O. Bond, AGM | | | | 4.500 | % | | | | 5/1/2031 | | | | | Aa2 | | | | $ | 1,695,000 | | | | $ | 1,624,030 | |
Warren Woods Public Schools, School Building & Site, G.O. Bond, AGM | | | | 4.500 | % | | | | 5/1/2026 | | | | | Aa2 | | | | | 1,015,000 | | | | | 1,013,853 | |
| | | | | | | | | | | | | | | | | | | | | | | | | |
| | | | | | | | | | | | | | | | | | | | | | | | 6,376,827 | |
| | | | | | | | | | | | | | | | | | | | | | | | | |
| | | | | |
MINNESOTA - 2.1% | | | | | | | | | | | | | | | | | | | | | | | | | |
Brooklyn Center Independent School District No. 286, Series A, G.O. Bond, NATL | | | | 4.375 | % | | | | 2/1/2026 | | | | | Aa2 | | | | | 1,105,000 | | | | | 1,126,813 | |
Hennepin County, Series B, G.O. Bond | | | | 4.000 | % | | | | 12/1/2014 | | | | | Aaa | | | | | 1,000,000 | | | | | 1,107,540 | |
Minnesota State, Public Impt., G.O. Bond | | | | 5.000 | % | | | | 8/1/2013 | | | | | Aa1 | | | | | 2,000,000 | | | | | 2,185,520 | |
Minnesota State, Series C, G.O. Bond | | | | 5.000 | % | | | | 8/1/2014 | | | | | Aa1 | | | | | 1,000,000 | | | | | 1,128,590 | |
Pine County, Series A, G.O. Bond, FGRNA | | | | 4.400 | % | | | | 2/1/2028 | | | | | AAA | 3 | | | | 555,000 | | | | | 562,992 | |
Western Minnesota Municipal Power Agency, Revenue Bond | | | | 6.625 | % | | | | 1/1/2016 | | | | | Aaa | | | | | 150,000 | | | | | 170,489 | |
| | | | | | | | | | | | | | | | | | | | | | | | | |
| | | | | | | | | | | | | | | | | | | | | | | | 6,281,944 | |
| | | | | | | | | | | | | | | | | | | | | | | | | |
| | | | | |
MISSOURI - 2.2% | | | | | | | | | | | | | | | | | | | | | | | | | |
Columbia, Electric Light & Power Impt., Series A, Revenue Bond | | | | 5.000 | % | | | | 10/1/2013 | | | | | AA | 3 | | | | 1,000,000 | | | | | 1,096,050 | |
Columbia, Water Utility Impt., Series A, Revenue Bond | | | | 4.125 | % | | | | 10/1/2033 | | | | | AA | 3 | | | | 995,000 | | | | | 995,985 | |
Missouri State, Series A, G.O. Bond | | | | 5.000 | % | | | | 10/1/2014 | | | | | Aaa | | | | | 830,000 | | | | | 942,988 | |
Missouri State, Water Pollution Control, Prerefunded Balance, Series A, G.O. Bond | | | | 4.500 | % | | | | 12/1/2030 | | | | | Aaa | | | | | 2,375,000 | | | | | 2,823,566 | |
Springfield, Electric Light & Power Impt., Revenue Bond, FGRNA | | | | 4.750 | % | | | | 8/1/2031 | | | | | Aa3 | | | | | 1,015,000 | | | | | 1,025,921 | |
| | | | | | | | | | | | | | | | | | | | | | | | | |
| | | | | | | | | | | | | | | | | | | | | | | | 6,884,510 | |
| | | | | | | | | | | | | | | | | | | | | | | | | |
| | | | | |
NEBRASKA - 1.7% | | | | | | | | | | | | | | | | | | | | | | | | | |
Nebraska Public Power District, Series C, Revenue Bond | | | | 5.000 | % | | | | 1/1/2026 | | | | | A1 | | | | | 840,000 | | | | | 894,239 | |
Omaha Metropolitan Utilities District, Series A, Revenue Bond, AGM | | | | 4.375 | % | | | | 12/1/2031 | | | | | Aa3 | | | | | 2,640,000 | | | | | 2,551,613 | |
Omaha Public Power District, Series AA, Revenue Bond, FGRNA | | | | 4.500 | % | | | | 2/1/2034 | | | | | Aa2 | | | | | 1,950,000 | | | | | 1,856,888 | |
| | | | | | | | | | | | | | | | | | | | | | | | | |
| | | | | | | | | | | | | | | | | | | | | | | | 5,302,740 | |
| | | | | | | | | | | | | | | | | | | | | | | | | |
| | | | | |
NEVADA - 1.5% | | | | | | | | | | | | | | | | | | | | | | | | | |
Clark County, G.O. Bond, AGM | | | | 4.750 | % | | | | 6/1/2027 | | | | | Aa1 | | | | | 3,000,000 | | | | | 3,033,990 | |
| | | | |
| 10 | | The accompanying notes are an integral part of the financial statements. | | |
Investment Portfolio - June 30, 2011 (unaudited)
| | | | | | | | | | | | | | | | | | | | | | | | | |
| | | Coupon
Rate | | Maturity
Date | | Credit
Rating1 | | Principal
Amount | | Value
(Note 2) |
| | | | | |
MUNICIPAL BONDS (continued) | | | | | | | | | | | | | | | | | | | | | | | | | |
| | | | | |
NEVADA (continued) | | | | | | | | | | | | | | | | | | | | | | | | | |
Las Vegas Valley Water District, Water Impt., Series A, G.O. Bond, AGM | | | | 4.750 | % | | | | 6/1/2033 | | | | | Aa2 | | | | $ | 1,500,000 | | | | $ | 1,493,865 | |
Nevada State, Project Nos. 66 & 67, Unrefunded Balance, Series A, G.O. Bond, FGRNA | | | | 5.000 | % | | | | 5/15/2028 | | | | | Aa2 | | | | | 125,000 | | | | | 125,047 | |
| | | | | | | | | | | | | | | | | | | | | | | | | |
| | | | | | | | | | | | | | | | | | | | | | | | 4,652,902 | |
| | | | | | | | | | | | | | | | | | | | | | | | | |
| | | | | |
NEW HAMPSHIRE - 1.0% | | | | | | | | | | | | | | | | | | | | | | | | | |
Manchester, Series F, G.O. Bond | | | | 3.750 | % | | | | 12/1/2025 | | | | | Aa1 | | | | | 1,005,000 | | | | | 1,008,226 | |
New Hampshire Municipal Bond Bank, Series D, Revenue Bond | �� | | | 4.625 | % | | | | 7/15/2039 | | | | | Aa3 | | | | | 835,000 | | | | | 849,295 | |
New Hampshire State, Series A, G.O. Bond, NATL | | | | 5.000 | % | | | | 10/15/2012 | | | | | Aa1 | | | | | 1,000,000 | | | | | 1,061,280 | |
| | | | | | | | | | | | | | | | | | | | | | | | | |
| | | | | | | | | | | | | | | | | | | | | | | | 2,918,801 | |
| | | | | | | | | | | | | | | | | | | | | | | | | |
| | | | | |
NEW JERSEY - 1.1% | | | | | | | | | | | | | | | | | | | | | | | | | |
East Brunswick Township Board of Education, G.O. Bond, AGM | | | | 4.500 | % | | | | 11/1/2028 | | | | | Aa2 | | | | | 835,000 | | | | | 847,108 | |
East Brunswick Township Board of Education, G.O. Bond, AGM | | | | 4.500 | % | | | | 11/1/2029 | | | | | Aa2 | | | | | 1,000,000 | | | | | 1,011,730 | |
Morris County Impt. Authority, School District, Morris Hills Regional District, Revenue Bond . | | | | 3.700 | % | | | | 10/1/2018 | | | | | Aaa | | | | | 540,000 | | | | | 563,085 | |
Sparta Township Board of Education, G.O. Bond, AGM | | | | 4.300 | % | | | | 2/15/2030 | | | | | Aa2 | | | | | 1,000,000 | | | | | 990,600 | |
| | | | | | | | | | | | | | | | | | | | | | | | | |
| | | | | | | | | | | | | | | | | | | | | | | | 3,412,523 | |
| | | | | | | | | | | | | | | | | | | | | | | | | |
| | | | | |
NEW MEXICO - 0.4% | | | | | | | | | | | | | | | | | | | | | | | | | |
New Mexico Finance Authority, Public Project Revolving Fund, Series A-1, Revenue Bond, NATL | | | | 3.250 | % | | | | 6/1/2013 | | | | | Aa1 | | | | | 380,000 | | | | | 399,524 | |
Santa Fe County, Public Impt., G.O. Bond | | | | 2.500 | % | | | | 7/1/2013 | | | | | Aaa | | | | | 915,000 | | | | | 952,542 | |
| | | | | | | | | | | | | | | | | | | | | | | | | |
| | | | | | | | | | | | | | | | | | | | | | | | 1,352,066 | |
| | | | | | | | | | | | | | | | | | | | | | | | | |
| | | | | |
NEW YORK - 3.7% | | | | | | | | | | | | | | | | | | | | | | | | | |
Hampton Bays Union Free School District, G.O. Bond, AGM | | | | 4.375 | % | | | | 9/15/2029 | | | | | Aa3 | | | | | 2,225,000 | | | | | 2,191,914 | |
New York City Municipal Water Finance Authority, Unrefunded Balance, Revenue Bond, FGRNA | | | | 5.000 | % | | | | 6/15/2026 | | | | | Aa1 | | | | | 520,000 | | | | | 521,721 | |
| | | | | | |
| | The accompanying notes are an integral part of the financial statements. | | | 11 | |
Investment Portfolio - June 30, 2011 (unaudited)
| | | | | | | | | | | | | | | | | | | | | | | | | |
| | | Coupon
Rate | | Maturity
Date | | Credit
Rating1 | | Principal
Amount | | Value
(Note 2) |
| | | | | |
MUNICIPAL BONDS (continued) | | | | | | | | | | | | | | | | | | | | | | | | | |
| | | | | |
NEW YORK (continued) | | | | | | | | | | | | | | | | | | | | | | | | | |
New York City Municipal Water Finance Authority, Water & Sewer Systems, Series A, Revenue Bond | | | | 5.750 | % | | | | 6/15/2040 | | | | | Aa1 | | | | $ | 2,590,000 | | | | $ | 2,843,095 | |
New York State Power Authority, Series A, Revenue Bond, NATL | | | | 4.500 | % | | | | 11/15/2047 | | | | | Aa2 | | | | | 1,000,000 | | | | | 958,030 | |
New York State Urban Development Corp., Series B, Revenue Bond, NATL | | | | 5.000 | % | | | | 1/1/2019 | | | | | AA | 3 | | | | 1,000,000 | | | | | 1,093,350 | |
Port Authority of New York & New Jersey, Revenue Bond | | | | 4.500 | % | | | | 10/15/2037 | | | | | Aa2 | | | | | 1,000,000 | | | | | 974,350 | |
Sachem Central School District of Holbrook, G.O. Bond, FGRNA | | | | 4.375 | % | | | | 10/15/2030 | | | | | AA | 3 | | | | 2,000,000 | | | | | 2,015,400 | |
Saratoga County, Sewer Impt., Series B, G.O. Bond | | | | 4.375 | % | | | | 7/15/2040 | | | | | AA | 3 | | | | 855,000 | | | | | 821,681 | |
| | | | | | | | | | | | | | | | | | | | | | | | | |
| | | | | | | | | | | | | | | | | | | | | | | | 11,419,541 | |
| | | | | | | | | | | | | | | | | | | | | | | | | |
| | | | | |
NORTH CAROLINA - 3.5% | | | | | | | | | | | | | | | | | | | | | | | | | |
Charlotte, Series B, G.O. Bond | | | | 5.000 | % | | | | 6/1/2015 | | | | | Aaa | | | | | 1,010,000 | | | | | 1,163,964 | |
Charlotte, Series B, Revenue Bond | | | | 4.625 | % | | | | 7/1/2039 | | | | | Aaa | | | | | 1,000,000 | | | | | 1,011,380 | |
Charlotte, Water & Sewer, Revenue Bond | | | | 5.000 | % | | | | 7/1/2038 | | | | | Aaa | | | | | 1,000,000 | | | | | 1,038,270 | |
North Carolina Municipal Power Agency No. 1 Catawba, Series A, Revenue Bond | | | | 5.000 | % | | | | 1/1/2030 | | | | | A2 | | | | | 1,000,000 | | | | | 1,023,860 | |
North Carolina State, Highway Impt., Revenue Bond, NATL | | | | 4.000 | % | | | | 3/1/2018 | | | | | Aa2 | | | | | 1,355,000 | | | | | 1,494,104 | |
North Carolina State, Series B, G.O. Bond | | | | 5.000 | % | | | | 6/1/2014 | | | | | Aaa | | | | | 1,390,000 | | | | | 1,562,499 | |
North Carolina State, Series B, G.O. Bond | | | | 5.000 | % | | | | 6/1/2015 | | | | | Aaa | | | | | 2,000,000 | | | | | 2,304,880 | |
Wake County, Series C, G.O. Bond | | | | 5.000 | % | | | | 3/1/2014 | | | | | Aaa | | | | | 940,000 | | | | | 1,047,686 | |
| | | | | | | | | | | | | | | | | | | | | | | | | |
| | | | | | | | | | | | | | | | | | | | | | | | 10,646,643 | |
| | | | | | | | | | | | | | | | | | | | | | | | | |
| | | | | |
NORTH DAKOTA - 0.6% | | | | | | | | | | | | | | | | | | | | | | | | | |
Fargo, Public Impt., Series A, G.O. Bond, NATL | | | | 4.700 | % | | | | 5/1/2030 | | | | | Aa1 | | | | | 1,840,000 | | | | | 1,870,360 | |
| | | | | | | | | | | | | | | | | | | | | | | | | |
| | | | | |
OHIO - 1.5% | | | | | | | | | | | | | | | | | | | | | | | | | |
Brookville Local School District, G.O. Bond, AGM | | | | 4.125 | % | | | | 12/1/2026 | | | | | Aa3 | | | | | 660,000 | | | | | 643,421 | |
Columbus City School District, G.O. Bond, AGM | | | | 4.375 | % | | | | 12/1/2032 | | | | | Aa2 | | | | | 1,000,000 | | | | | 961,610 | |
Columbus, Limited Tax, Series 2, G.O. Bond | | | | 5.000 | % | | | | 7/1/2017 | | | | | Aaa | | | | | 1,000,000 | | | | | 1,112,720 | |
Newark City School District, G.O. Bond, FGRNA | | | | 4.250 | % | | | | 12/1/2027 | | | | | A1 | | | | | 500,000 | | | | | 483,330 | |
| | | | |
| 12 | | The accompanying notes are an integral part of the financial statements. | | |
Investment Portfolio - June 30, 2011 (unaudited)
| | | | | | | | | | | | | | | | | | | | | | | | | |
| | | Coupon
Rate | | Maturity
Date | | Credit
Rating1 | | Principal
Amount | | Value
(Note 2) |
| | | | | |
MUNICIPAL BONDS (continued) | | | | | | | | | | | | | | | | | | | | | | | | | |
| | | | | |
OHIO (continued) | | | | | | | | | | | | | | | | | | | | | | | | | |
Ohio State, Conservation Project, Prerefunded Balance, Series A, G.O. Bond | | | | 5.000 | % | | | | 3/1/2015 | | | | | Aa1 | | | | $ | 1,000,000 | | | | $ | 1,116,820 | |
Springfield City School District, Prerefunded Balance, G.O. Bond, FGIC | | | | 5.200 | % | | | | 12/1/2023 | | | | | A1 | | | | | 325,000 | | | | | 338,120 | |
| | | | | | | | | | | | | | | | | | | | | | | | | |
| | | | | | | | | | | | | | | | | | | | | | | | 4,656,021 | |
| | | | | | | | | | | | | | | | | | | | | | | | | |
| | | | | |
OKLAHOMA - 1.1% | | | | | | | | | | | | | | | | | | | | | | | | | |
Oklahoma City Water Utilities Trust, Series A, Revenue Bond | | | | 4.125 | % | | | | 7/1/2039 | | | | | Aa1 | | | | | 1,000,000 | | | | | 928,610 | |
Oklahoma City Water Utilities Trust, Series B, Revenue Bond | | | | 3.000 | % | | | | 7/1/2013 | | | | | Aa1 | | | | | 500,000 | | | | | 525,085 | |
Tulsa, Public Impt., G.O. Bond | | | | 4.000 | % | | | | 12/1/2013 | | | | | Aa1 | | | | | 1,700,000 | | | | | 1,841,100 | |
| | | | | | | | | | | | | | | | | | | | | | | | | |
| | | | | | | | | | | | | | | | | | | | | | | | 3,294,795 | |
| | | | | | | | | | | | | | | | | | | | | | | | | |
| | | | | |
OREGON - 1.2% | | | | | | | | | | | | | | | | | | | | | | | | | |
Clackamas County School District No. 12 North Clackamas, Series A, G.O. Bond, AGM | | | | 4.750 | % | | | | 6/15/2031 | | | | | Aa1 | | | | | 870,000 | | | | | 890,828 | |
Portland, Water Utility Impt., Series A, Revenue Bond | | | | 5.000 | % | | | | 5/1/2034 | | | | | Aaa | | | | | 1,000,000 | | | | | 1,058,080 | |
Portland, Water Utility Impt., Series A, Revenue Bond, NATL | | | | 4.500 | % | | | | 10/1/2031 | | | | | Aa1 | | | | | 550,000 | | | | | 555,087 | |
Salem, Water & Sewer, Revenue Bond, AGM | | | | 5.000 | % | | | | 5/1/2014 | | | | | Aa3 | | | | | 1,120,000 | | | | | 1,246,280 | |
| | | | | | | | | | | | | | | | | | | | | | | | | |
| | | | | | | | | | | | | | | | | | | | | | | | 3,750,275 | |
| | | | | | | | | | | | | | | | | | | | | | | | | |
| | | | | |
PENNSYLVANIA - 2.9% | | | | | | | | | | | | | | | | | | | | | | | | | |
Allegheny County, Series C-62B, G.O. Bond | | | | 5.000 | % | | | | 11/1/2029 | | | | | A1 | | | | | 750,000 | | | | | 761,700 | |
Commonwealth of Pennsylvania, Second Series, G.O. Bond, CIFG | | | | 4.250 | % | | | | 3/1/2025 | | | | | Aa1 | | | | | 2,000,000 | | | | | 2,046,140 | |
Erie Water Authority, Series 2006, Revenue Bond, AGM | | | | 5.000 | % | | | | 12/1/2036 | | | | | AA | 3 | | | | 1,000,000 | | | | | 1,013,680 | |
Jenkintown School District, Series A, G.O. Bond, FGRNA | | | | 4.500 | % | | | | 5/15/2032 | | | | | A | 3 | | | | 1,000,000 | | | | | 970,940 | |
Lancaster School District, G.O. Bond, AGM | | | | 5.000 | % | | | | 6/1/2019 | | | | | Aa3 | | | | | 1,200,000 | | | | | 1,345,212 | |
Pennsylvania Turnpike Commission, Prerefunded Balance, Revenue Bond, AMBAC | | | | 5.375 | % | | | | 7/15/2019 | | | | | Aa3 | | | | | 530,000 | | | | | 536,445 | |
Philadelphia, Water & Wastewater, Prerefunded Balance, Revenue Bond, NATL | | | | 5.600 | % | | | | 8/1/2018 | | | | | BBB | 3 | | | | 20,000 | | | | | 23,871 | |
Plum Boro School District, Series A, G.O. Bond, FGRNA | | | | 4.500 | % | | | | 9/15/2030 | | | | | A | 3 | | | | 855,000 | | | | | 849,511 | |
| | | | | | |
| | The accompanying notes are an integral part of the financial statements. | | | 13 | |
Investment Portfolio - June 30, 2011 (unaudited)
| | | | | | | | | | | | | | | | | | | |
| | | Coupon
Rate | | Maturity
Date | | Credit
Rating1 | | Principal
Amount | | Value
(Note 2) |
| | | | | |
MUNICIPAL BONDS (continued) | | | | | | | | | | | | | | | | | | | |
| | | | | |
PENNSYLVANIA (continued) | | | | | | | | | | | | | | | | | | | |
Uniontown Area School District, G.O. Bond, AGM | | | | 4.350 | % | | 10/1/2034 | | Aa3 | | | $ | 1,500,000 | | | | $ | 1,374,465 | |
| | | | | | | | | | | | | | | | | | | |
| | | | | | | | | | | | | | | | | | 8,921,964 | |
| | | | | | | | | | | | | | | | | | | |
| | | | | |
RHODE ISLAND - 0.6% | | | | | | | | | | | | | | | | | | | |
Narragansett Bay Commission, Series A, Revenue Bond, NATL | | | | 5.000 | % | | 8/1/2035 | | Baa1 | | | | 1,000,000 | | | | | 988,910 | |
Rhode Island Clean Water Finance Agency, Series A, Revenue Bond, NATL | | | | 5.000 | % | | 10/1/2035 | | Baa1 | | | | 1,000,000 | | | | | 927,090 | |
| | | | | | | | | | | | | | | | | | | |
| | | | | | | | | | | | | | | | | | 1,916,000 | |
| | | | | | | | | | | | | | | | | | | |
| | | | | |
SOUTH CAROLINA - 4.4% | | | | | | | | | | | | | | | | | | | |
Beaufort County School District, Series B, G.O. Bond, SCSDE | | | | 5.000 | % | | 3/1/2017 | | Aa1 | | | | 1,000,000 | | | | | 1,172,770 | |
Charleston County, Transportation Sales Tax, G.O. Bond | | | | 5.000 | % | | 11/1/2017 | | Aaa | | | | 1,000,000 | | | | | 1,150,290 | |
Columbia, Water Utility Impt., Revenue Bond | | | | 5.000 | % | | 2/1/2027 | | Aa1 | | | | 1,750,000 | | | | | 1,898,558 | |
Lexington, Waterworks & Sewer System, Revenue Bond, AGC | | | | 5.000 | % | | 1/15/2039 | | Aa3 | | | | 1,565,000 | | | | | 1,589,977 | |
Richland County School District No. 1, Series B, G.O. Bond, SCSDE | | | | 4.450 | % | | 3/1/2026 | | Aa1 | | | | 1,005,000 | | | | | 1,031,793 | |
South Carolina Transportation Infrastructure Bank, Series B, Revenue Bond, AMBAC | | | | 4.250 | % | | 10/1/2027 | | A1 | | | | 2,000,000 | | | | | 1,927,020 | |
South Carolina, State Institutional - South Carolina State University, Series B, G.O. Bond | | | | 5.250 | % | | 4/1/2014 | | Aaa | | | | 1,000,000 | | | | | 1,124,560 | |
South Carolina, State Institutional - South Carolina State University, Series D, G.O. Bond | | | | 4.250 | % | | 10/1/2026 | | Aaa | | | | 1,250,000 | | | | | 1,280,688 | |
Spartanburg Sanitation Sewer District, Series B, Revenue Bond, NATL | | | | 5.000 | % | | 3/1/2032 | | A1 | | | | 1,500,000 | | | | | 1,509,945 | |
Sumter, Water Utility Impt., Revenue Bond, XLCA | | | | 4.500 | % | | 12/1/2032 | | A1 | | | | 1,000,000 | | | | | 958,800 | |
| | | | | | | | | | | | | | | | | | | |
| | | | | | | | | | | | | | | | | | 13,644,401 | |
| | | | | | | | | | | | | | | | | | | |
| | | | | |
SOUTH DAKOTA - 0.2% | | | | | | | | | | | | | | | | | | | |
Rapid City, Water Utility Impt., Revenue Bond | | | | 5.250 | % | | 11/1/2039 | | Aa3 | | | | 450,000 | | | | | 465,935 | |
| | | | | | | | | | | | | | | | | | | |
| | | | |
| 14 | | The accompanying notes are an integral part of the financial statements. | | |
Investment Portfolio - June 30, 2011 (unaudited)
| | | | | | | | | | | | | | | | | | | | | | | | | |
| | | Coupon
Rate | | Maturity
Date | | Credit
Rating1 | | Principal
Amount | | Value
(Note 2) |
| | | | | |
MUNICIPAL BONDS (continued) | | | | | | | | | | | | | | | | | | | | | | | | | |
| | | | | |
TENNESSEE - 2.6% | | | | | | | | | | | | | | | | | | | | | | | | | |
Chattanooga, Series B, G.O. Bond | | | | 2.000 | % | | | | 2/1/2013 | | | | | AA | 3 | | | $ | 425,000 | | | | $ | 435,910 | |
Claiborne County, Public Impt., Series A, G.O. Bond | | | | 4.125 | % | | | | 4/1/2030 | | | | | A | 3 | | | | 750,000 | | | | | 720,563 | |
Hamilton County, Public Impt., G.O. Bond | | | | 3.000 | % | | | | 3/1/2014 | | | | | Aaa | | | | | 1,135,000 | | | | | 1,203,202 | |
Maryville, Series B, G.O. Bond | | | | 3.500 | % | | | | 6/1/2030 | | | | | Aa3 | | | | | 1,280,000 | | | | | 1,238,579 | |
Metropolitan Government of Nashville & Davidson County, Series B, G.O. Bond | | | | 5.000 | % | | | | 1/1/2014 | | | | | Aa1 | | | | | 1,000,000 | | | | | 1,107,020 | |
Rutherford County, School Impt., G.O. Bond | | | | 3.000 | % | | | | 4/1/2013 | | | | | Aa1 | | | | | 1,000,000 | | | | | 1,044,380 | |
Tennessee State, Series A, G.O. Bond | | | | 4.000 | % | | | | 5/1/2013 | | | | | Aaa | | | | | 425,000 | | | | | 452,935 | |
Tennessee State, Series C, G.O. Bond | | | | 5.250 | % | | | | 9/1/2013 | | | | | Aaa | | | | | 1,500,000 | | | | | 1,654,665 | |
| | | | | | | | | | | | | | | | | | | | | | | | | |
| | | | | | | | | | | | | | | | | | | | | | | | 7,857,254 | |
| | | | | | | | | | | | | | | | | | | | | | | | | |
| | | | | |
TEXAS - 5.2% | | | | | | | | | | | | | | | | | | | | | | | | | |
Clear Creek Independent School District, G.O. Bond, AGM | | | | 4.000 | % | | | | 2/15/2029 | | | | | Aa2 | | | | | 2,340,000 | | | | | 2,290,603 | |
Collin County, Public Impt., G.O. Bond | | | | 2.000 | % | | | | 2/15/2014 | | | | | Aaa | | | | | 545,000 | | | | | 563,149 | |
Dallas, Public Impt., G.O. Bond | | | | 5.000 | % | | | | 2/15/2013 | | | | | Aa1 | | | | | 1,315,000 | | | | | 1,412,389 | |
Fort Bend County, Public Impt., G.O. Bond, NATL | | | | 4.750 | % | | | | 3/1/2031 | | | | | Aa1 | | | | | 1,000,000 | | | | | 1,012,330 | |
Fort Worth, Water Utility Impt., Series C, Revenue Bond | | | | 5.000 | % | | | | 2/15/2014 | | | | | Aa1 | | | | | 1,595,000 | | | | | 1,769,668 | |
Harris County, Series A, G.O. Bond | | | | 5.000 | % | | | | 10/1/2024 | | | | | AAA | 3 | | | | 500,000 | | | | | 561,760 | |
Harris County, Series B, G.O. Bond | | | | 4.000 | % | | | | 10/1/2013 | | | | | AAA | 3 | | | | 1,000,000 | | | | | 1,078,420 | |
Huntsville Independent School District, G.O. Bond | | | | 4.500 | % | | | | 2/15/2029 | | | | | Aaa | | | | | 1,220,000 | | | | | 1,233,359 | |
North East Independent School District, School Impt., Prerefunded Balance, G.O. Bond | | | | 5.000 | % | | | | 8/1/2022 | | | | | AAA | 3 | | | | 550,000 | | | | | 622,077 | |
San Antonio, Water, Revenue Bond, FGRNA | | | | 4.375 | % | | | | 5/15/2029 | | | | | Aa1 | | | | | 1,400,000 | | | | | 1,401,736 | |
San Marcos Consolidated Independent School District, School Impt., Prerefunded Balance, G.O. Bond | | | | 5.625 | % | | | | 8/1/2026 | | | | | Aaa | | | | | 475,000 | | | | | 546,293 | |
Tarrant Regional Water District, Water Utility Impt., Revenue Bond, FGRNA | | | | 4.750 | % | | | | 3/1/2029 | | | | | Aa1 | | | | | 1,000,000 | | | | | 1,028,170 | |
Texas State, Public Impt., G.O. Bond | | | | 5.000 | % | | | | 10/1/2014 | | | | | Aaa | | | | | 500,000 | | | | | 567,895 | |
Texas State, Series A, G.O. Bond | | | | 5.000 | % | | | | 8/1/2014 | | | | | Aaa | | | | | 700,000 | | | | | 790,930 | |
University of Texas, Financing System, Series F, Revenue Bond | | | | 4.750 | % | | | | 8/15/2028 | | | | | Aaa | | | | | 1,000,000 | | | | | 1,027,250 | |
| | | | | | | | | | | | | | | | | | | | | | | | | |
| | | | | | | | | | | | | | | | | | | | | | | | 15,906,029 | |
| | | | | | | | | | | | | | | | | | | | | | | | | |
| | | | | | |
| | The accompanying notes are an integral part of the financial statements. | | | 15 | |
Investment Portfolio - June 30, 2011 (unaudited)
| | | | | | | | | | | | | | | | | | | | | | | | | |
| | | Coupon
Rate | | Maturity
Date | | Credit
Rating1 | | Principal
Amount | | Value
(Note 2) |
| | | | | |
MUNICIPAL BONDS (continued) | | | | | | | | | | | | | | | | | | | | | | | | | |
| | | | | |
UTAH - 3.1% | | | | | | | | | | | | | | | | | | | | | | | | | |
Mountain Regional Water Special Service District, Revenue Bond, NATL | | | | 5.000 | % | | | | 12/15/2030 | | | | | Baa1 | | | | $ | 1,240,000 | | | | $ | 1,240,260 | |
Ogden City School District, G.O. Bond | | | | 4.250 | % | | | | 6/15/2025 | | | | | Aaa | | | | | 1,500,000 | | | | | 1,533,045 | |
Ogden, Water Utility Impt., Revenue Bond, AGM | | | | 4.500 | % | | | | 6/15/2038 | | | | | Aa3 | | | | | 750,000 | | | | | 693,540 | |
Provo City School District, Series B, G.O. Bond | | | | 4.000 | % | | | | 6/15/2014 | | | | | Aaa | | | | | 1,100,000 | | | | | 1,201,893 | |
Salt Lake County, Public Impt., Series A, G.O. Bond | | | | 4.000 | % | | | | 12/15/2014 | | | | | Aaa | | | | | 400,000 | | | | | 443,980 | |
Salt Lake County, Public Impt., Series A, G.O. Bond | | | | 4.000 | % | | | | 12/15/2030 | | | | | Aaa | | | | | 680,000 | | | | | 675,444 | |
St. George, Parks and Recreation, G.O. Bond, AMBAC | | | | 4.000 | % | | | | 8/1/2019 | | | | | Aa2 | | | | | 795,000 | | | | | 824,502 | |
Utah State, Highway Impt., Series A, G.O. Bond | | | | 5.000 | % | | | | 7/1/2014 | | | | | Aaa | | | | | 460,000 | | | | | 518,820 | |
Utah State, Highway Impt., Series A, G.O. Bond | | | | 5.000 | % | | | | 7/1/2014 | | | | | Aaa | | | | | 1,000,000 | | | | | 1,127,870 | |
Utah State, Public Impt., Series B, G.O. Bond | | | | 4.000 | % | | | | 7/1/2013 | | | | | Aaa | | | | | 450,000 | | | | | 482,283 | |
Utah State, Public Impt., Series B, G.O. Bond | | | | 4.000 | % | | | | 7/1/2015 | | | | | Aaa | | | | | 595,000 | | | | | 664,121 | |
| | | | | | | | | | | | | | | | | | | | | | | | | |
| | | | | | | | | | | | | | | | | | | | | | | | 9,405,758 | |
| | | | | | | | | | | | | | | | | | | | | | | | | |
| | | | | |
VERMONT - 0.3% | | | | | | | | | | | | | | | | | | | | | | | | | |
Vermont State, Public Impt., Series D, G.O. Bond | | | | 4.500 | % | | | | 7/15/2025 | | | | | Aaa | | | | | 1,000,000 | | | | | 1,052,630 | |
| | | | | | | | | | | | | | | | | | | | | | | | | |
| | | | | |
VIRGINIA - 5.0% | | | | | | | | | | | | | | | | | | | | | | | | | |
Arlington County, Public Impt., Series B, G.O. Bond | | | | 4.000 | % | | | | 8/15/2014 | | | | | Aaa | | | | | 1,000,000 | | | | | 1,101,100 | |
Chesterfield County, Public Impt., G.O. Bond | | | | 3.500 | % | | | | 1/1/2015 | | | | | Aaa | | | | | 1,000,000 | | | | | 1,086,920 | |
Commonwealth of Virginia, School Impt., Series A, G.O. Bond | | | | 5.000 | % | | | | 6/1/2014 | | | | | Aaa | | | | | 2,450,000 | | | | | 2,754,805 | |
Commonwealth of Virginia, Series B, G.O. Bond | | | | 5.000 | % | | | | 6/1/2013 | | | | | Aaa | | | | | 1,410,000 | | | | | 1,534,545 | |
Fairfax County Water Authority, Series B, Revenue Bond | | | | 4.000 | % | | | | 4/1/2032 | | | | | Aaa | | | | | 1,000,000 | | | | | 967,040 | |
Fairfax County, Public Impt., Series A, G.O. Bond | | | | 5.000 | % | | | | 4/1/2014 | | | | | Aaa | | | | | 400,000 | | | | | 447,216 | |
Fairfax County, Public Impt., Series A, G.O. Bond | | | | 4.000 | % | | | | 4/1/2017 | | | | | Aaa | | | | | 2,000,000 | | | | | 2,171,900 | |
Fairfax County, Public Impt., Series A, G.O. Bond | | | | 4.250 | % | | | | 4/1/2027 | | | | | Aaa | | | | | 1,500,000 | | | | | 1,524,375 | |
| | | | |
| 16 | | The accompanying notes are an integral part of the financial statements. | | |
Investment Portfolio - June 30, 2011 (unaudited)
| | | | | | | | | | | | | | | | | | | | | | | | | |
| | | Coupon
Rate | | Maturity
Date | | Credit
Rating1 | | Principal
Amount | | Value
(Note 2) |
| | | | | |
MUNICIPAL BONDS (continued) | | | | | | | | | | | | | | | | | | | | | | | | | |
| | | | | |
VIRGINIA (continued) | | | | | | | | | | | | | | | | | | | | | | | | | |
Norfolk, Water Utility Impt., Revenue Bond | | | | 3.750 | % | | | | 11/1/2040 | | | | | Aa2 | | | | $ | 1,000,000 | | | | $ | 851,390 | |
Prince William County, Public Impt., Series A, G.O. Bond | | | | 3.000 | % | | | | 8/1/2014 | | | | | Aaa | | | | | 1,060,000 | | | | | 1,133,797 | |
Richmond, Public Impt., Series B, G.O. Bond, AGM | | | | 5.000 | % | | | | 7/15/2014 | | | | | Aa2 | | | | | 670,000 | | | | | 755,968 | |
Richmond, Series B, G.O. Bond, AGM | | | | 4.750 | % | | | | 7/15/2023 | | | | | Aa2 | | | | | 400,000 | | | | | 412,100 | |
Upper Occoquan Sewage Authority, Series B, Revenue Bond | | | | 4.500 | % | | | | 7/1/2038 | | | | | Aa1 | | | | | 470,000 | | | | | 468,543 | |
| | | | | | | | | | | | | | | | | | | | | | | | | |
| | | | | | | | | | | | | | | | | | | | | | | | 15,209,699 | |
| | | | | | | | | | | | | | | | | | | | | | | | | |
| | | | | |
WASHINGTON - 3.7% | | | | | | | | | | | | | | | | | | | | | | | | | |
Franklin County, Public Impt., G.O. Bond, FGRNA | | | | 5.125 | % | | | | 12/1/2022 | | | | | BBB | 3 | | | | 1,000,000 | | | | | 1,036,490 | |
Grant County Public Utility District No. 2 Priest Rapids, Series A, Revenue Bond, NATL | | | | 5.000 | % | | | | 1/1/2043 | | | | | Aa3 | | | | | 1,000,000 | | | | | 990,600 | |
King County School District No. 411 Issaquah, Series A, G.O. Bond, AGM | | | | 5.250 | % | | | | 12/1/2018 | | | | | Aaa | | | | | 2,420,000 | | | | | 2,723,613 | |
King County, Sewer Impt., G.O. Bond, FGRNA . | | | | 5.000 | % | | | | 1/1/2035 | | | | | Aa1 | | | | | 1,255,000 | | | | | 1,275,933 | |
King County, Sewer Impt., Series A, Revenue Bond, NATL | | | | 4.500 | % | | | | 1/1/2032 | | | | | Aa2 | | | | | 1,070,000 | | | | | 1,046,160 | |
Seattle, Drain & Wastewater, Revenue Bond, NATL | | | | 4.375 | % | | | | 2/1/2026 | | | | | Aa1 | | | | | 2,000,000 | | | | | 2,038,160 | |
Tacoma, Sewer Impt., Revenue Bond, FGRNA | | | | 5.125 | % | | | | 12/1/2036 | | | | | Aa2 | | | | | 1,275,000 | | | | | 1,301,227 | |
Washington State, Public Impt., Series A, G.O. Bond | | | | 5.000 | % | | | | 7/1/2031 | | | | | Aa1 | | | | | 1,000,000 | | | | | 1,044,220 | |
| | | | | | | | | | | | | | | | | | | | | | | | | |
| | | | | | | | | | | | | | | | | | | | | | | | 11,456,403 | |
| | | | | | | | | | | | | | | | | | | | | | | | | |
| | | | | |
WISCONSIN - 3.3% | | | | | | | | | | | | | | | | | | | | | | | | | |
Central Brown County Water Authority, Water Systems, Revenue Bond, AMBAC | | | | 5.000 | % | | | | 12/1/2035 | | | | | A | 3 | | | | 1,500,000 | | | | | 1,477,065 | |
Dane County, Series A, G.O. Bond | | | | 3.000 | % | | | | 6/1/2012 | | | | | Aa1 | | | | | 1,475,000 | | | | | 1,509,928 | |
Eau Claire, Series B, G.O. Bond, NATL | | | | 4.000 | % | | | | 4/1/2015 | | | | | Aa1 | | | | | 1,195,000 | | | | | 1,322,040 | |
Madison, Water Utility Impt., Series A, Revenue Bond | | | | 4.250 | % | | | | 1/1/2030 | | | | | Aa1 | | | | | 1,000,000 | | | | | 983,630 | |
Milwaukee County Metropolitan Sewer District, Series F, G.O. Bond | | | | 5.000 | % | | | | 10/1/2018 | | | | | Aaa | | | | | 1,050,000 | | | | | 1,245,825 | |
Oshkosh, Corporate Purposes, Prerefunded Balance, Series A, G.O. Bond, FGRNA | | | | 5.050 | % | | | | 12/1/2021 | | | | | Aa2 | | | | | 450,000 | | | | | 459,153 | |
Wisconsin Public Power, Inc., Series A, Revenue Bond, AMBAC | | | | 5.000 | % | | | | 7/1/2035 | | | | | A1 | | | | | 870,000 | | | | | 853,313 | |
| | | | | | |
| | The accompanying notes are an integral part of the financial statements. | | | 17 | |
Investment Portfolio - June 30, 2011 (unaudited)
| | | | | | | | | | | | | | | | | | | | | | | | | |
| | | Coupon
Rate | | Maturity
Date | | Credit
Rating1 | | Principal Amount/
Shares | | Value
(Note 2) |
MUNICIPAL BONDS (continued) | | | | | | | | | | | | | | | | | | | | | | | | | |
| | | | | |
WISCONSIN (continued) | | | | | | | | | | | | | | | | | | | | | | | | | |
Wisconsin State, Public Impt., Prerefunded Balance, Series E, G.O. Bond, FGIC | | | | 5.000 | % | | | | 5/1/2019 | | | | | Aa2 | | | | $ | 1,000,000 | | | | $ | 1,148,650 | |
Wisconsin State, Public Impt., Series C, G.O. Bond | | | | 5.000 | % | | | | 5/1/2026 | | | | | Aa2 | | | | | 1,150,000 | | | | | 1,235,917 | |
| | | | | | | | | | | | | | | | | | | | | | | | | |
| | | | | | | | | | | | | | | | | | | | | | | | 10,235,521 | |
| | | | | | | | | | | | | | | | | | | | | | | | | |
| | | | | |
WYOMING - 0.2% | | | | | | | | | | | | | | | | | | | | | | | | | |
Wyoming Municipal Power Agency, Series A, Revenue Bond | | | | 5.375 | % | | | | 1/1/2042 | | | | | A2 | | | | | 710,000 | | | | | 721,083 | |
| | | | | | | | | | | | | | | | | | | | | | | | | |
TOTAL MUNICIPAL BONDS
(Identified Cost $291,496,276) | | | | | | | | | | | | | | | | | | | | | | | | 295,284,493 | |
| | | | | | | | | | | | | | | | | | | | | | | | | |
SHORT-TERM INVESTMENTS - 3.5% | | | | | | | | | | | | | | | | | | | | | | | | | |
Dreyfus AMT - Free Municipal Reserves - Class R
(Identified Cost $10,714,656) | | | | | | | | | | | | | | | | | | | 10,714,656 | | | | | 10,714,656 | |
| | | | | | | | | | | | | | | | | | | | | | | | | |
TOTAL INVESTMENTS - 99.6%
(Identified Cost $302,210,932) | | | | | | | | | | | | | | | | | | | | | | | | 305,999,149 | |
OTHER ASSETS, LESS LIABILITIES - 0.4% | | | | | | | | | | | | | | | | | | | | | | | | 1,280,842 | |
| | | | | | | | | | | | | | | | | | | | | | | | | |
NET ASSETS - 100% | | | | | | | | | | | | | | | | | | | | | | | $ | 307,279,991 | |
| | | | | | | | | | | | | | | | | | | | | | | | | |
KEY:
G.O. Bond - General Obligation Bond
Impt. - Improvement
No. - Number
SCSDE - South Carolina School District Enhanced
Scheduled principal and interest payments are guaranteed by:
AGC (Assurance Guaranty Corp.)
AGM (Assurance Guaranty Municipal Corp.)
AMBAC (AMBAC Assurance Corp.)
AMRAG (AMBAC reinsured by AGC)
CIFG (CIFG North America, Inc.)
FGIC (Financial Guaranty Insurance Co.)
FGRNA (FGIC reinsured by NATL)
NATL (National Public Finance Guarantee Corp.)
XLCA (XL Capital Assurance)
The insurance does not guarantee the market value of the municipal bonds.
| 1 | Credit ratings from Moody’s (unaudited). |
| 2 | Credit rating has been withdrawn. As of June 30, 2011, there is no rating available. |
| 3 | Credit ratings from S&P (unaudited). |
The Series’ portfolio holds, as a percentage of net assets, greater than 10% in bonds insured by the following companies:
NATL - 20.9%; AGM - 14.9%.
| | | | |
| 18 | | The accompanying notes are an integral part of the financial statements. | | |
Statement of Assets and Liabilities (unaudited)
June 30, 2011
| | | | | |
ASSETS: | | | | | |
Investments, at value (identified cost $302,210,932) (Note 2) | | | $ | 305,999,149 | |
Interest receivable | | | | 3,694,650 | |
Receivable for fund shares sold | | | | 742,369 | |
| | | | | |
| |
TOTAL ASSETS | | | | 310,436,168 | |
| | | | | |
| |
LIABILITIES: | | | | | |
| |
Cash overdraft | | | | 1,513,561 | |
Accrued management fees (Note 3) | | | | 126,281 | |
Accrued fund accounting and administration fees (Note 3) | | | | 23,061 | |
Accrued transfer agent fees (Note 3) | | | | 1,071 | |
Accrued directors fees (Note 3) | | | | 624 | |
Accrued Chief Compliance Officer service fees (Note 3) | | | | 466 | |
Payable for securities purchased | | | | 1,125,890 | |
Payable for fund shares repurchased | | | | 341,870 | |
Other payables and accrued expenses | | | | 23,353 | |
| | | | | |
| |
TOTAL LIABILITIES | | | | 3,156,177 | |
| | | | | |
| |
TOTAL NET ASSETS | | | $ | 307,279,991 | |
| | | | | |
| |
NET ASSETS CONSIST OF: | | | | | |
| |
Capital stock | | | $ | 276,139 | |
Additional paid-in-capital | | | | 301,945,100 | |
Undistributed net investment income | | | | 1,046,749 | |
Accumulated net realized gain on investments | | | | 223,786 | |
Net unrealized appreciation on investments | | | | 3,788,217 | |
| | | | | |
| |
TOTAL NET ASSETS | | | $ | 307,279,991 | |
| | | | | |
NET ASSET VALUE, OFFERING PRICE AND REDEMPTION PRICE PER SHARE - Class A
($307,279,991/27,613,929 shares) | | | $ | 11.13 | |
| | | | | |
| | | | | | |
| | The accompanying notes are an integral part of the financial statements. | | | 19 | |
Statement of Operations (unaudited)
For the Six Months Ended June 30, 2011
| | | | | |
INVESTMENT INCOME: | | | | | |
| |
Interest | | | $ | 5,612,177 | |
| | | | | |
| |
EXPENSES: | | | | | |
| |
Management fees (Note 3) | | | | 714,955 | |
Fund accounting and administration fees (Note 3) | | | | 52,486 | |
Directors’ fees (Note 3) | | | | 4,025 | |
Transfer agent fees (Note 3) | | | | 2,299 | |
Chief Compliance Officer service fees (Note 3) | | | | 1,314 | |
Custodian fees | | | | 7,123 | |
Miscellaneous | | | | 39,807 | |
| | | | | |
| |
Total Expenses | | | | 822,009 | |
| | | | | |
| |
NET INVESTMENT INCOME | | | | 4,790,168 | |
| | | | | |
| |
REALIZED AND UNREALIZED GAIN ON INVESTMENTS: | | | | | |
| |
Net realized gain on investments | | | | 223,786 | |
| |
Net change in unrealized appreciation on investments | | | | 8,497,999 | |
| | | | | |
| |
NET REALIZED AND UNREALIZED GAIN ON INVESTMENTS | | | | 8,721,785 | |
| | | | | |
| |
NET INCREASE IN NET ASSETS RESULTING FROM OPERATIONS | | | $ | 13,511,953 | |
| | | | | |
| | | | |
| 20 | | The accompanying notes are an integral part of the financial statements. | | |
Statement of Changes in Net Assets
| | | | | | | | | | |
| | | For the Six
Months Ended
6/30/11
(unaudited) | | For the
Year Ended
12/31/10 |
| | |
INCREASE (DECREASE) IN NET ASSETS: | | | | | | | | | | |
| | |
OPERATIONS: | | | | | | | | | | |
| | |
Net investment income | | | $ | 4,790,168 | | | | $ | 9,289,523 | |
Net realized gain on investments | | | | 223,786 | | | | | 44,160 | |
Net change in unrealized appreciation (depreciation) on investments | | | | 8,497,999 | | | | | (9,181,739 | ) |
| | | | | | | | | | |
| | |
Net increase from operations | | | | 13,511,953 | | | | | 151,944 | |
| | | | | | | | | | |
| | |
DISTRIBUTIONS TO SHAREHOLDERS (Note 7): | | | | | | | | | | |
| | |
From net investment income | | | | (4,014,926 | ) | | | | (10,674,465 | ) |
From net realized gain on investments | | | | — | | | | | (50,263 | ) |
| | | | | | | | | | |
| | |
Total distributions to shareholders | | | | (4,014,926 | ) | | | | (10,724,728 | ) |
| | | | | | | | | | |
| | |
CAPITAL STOCK ISSUED AND REPURCHASED: | | | | | | | | | | |
| | |
Net increase from capital share transactions (Note 5) | | | | 20,813,128 | | | | | 53,056,589 | |
| | | | | | | | | | |
| | |
Net increase in net assets | | | | 30,310,155 | | | | | 42,483,805 | |
| | |
NET ASSETS: | | | | | | | | | | |
| | |
Beginning of period | | | | 276,969,836 | | | | | 234,486,031 | |
| | | | | | | | | | |
| | |
End of period (including undistributed net investment income of $1,046,749 and $271,507, respectively) | | | $ | 307,279,991 | | | | $ | 276,969,836 | |
| | | | | | | | | | |
| | | | | | |
| | The accompanying notes are an integral part of the financial statements. | | | 21 | |
Financial Highlights
| | | | | | | | | | | | | | | | | | | | | | | | | | | | | | |
| | | For the Six
Months Ended
6/30/11 | | For the Years Ended |
| | | (unaudited) | | 12/31/10 | | 12/31/09 | | 12/31/08 | | 12/31/07 | | 12/31/06 |
Per share data (for a share outstanding throughout each period): | | | | | | | | | | | | | | | | | | | | | | | | | | | | | | |
Net asset value - Beginning of period | | | $ | 10.77 | | | | $ | 11.17 | | | | $ | 10.34 | | | | $ | 10.92 | | | | $ | 10.95 | | | | $ | 10.90 | |
| | | | | | | | | | | | | | | | | | | | | | | | | | | | | | |
Income (loss) from investment operations: | | | | | | | | | | | | | | | | | | | | | | | | | | | | | | |
Net investment income | | | | 0.18 | 1 | | | | 0.40 | 1 | | | | 0.40 | 1 | | | | 0.42 | | | | | 0.36 | | | | | 0.37 | |
Net realized and unrealized gain (loss) on investments | | | | 0.33 | | | | | (0.35 | ) | | | | 0.90 | | | | | (0.62 | ) | | | | (0.02 | ) | | | | 0.05 | |
| | | | | | | | | | | | | | | | | | | | | | | | | | | | | | |
Total from investment operations | | | | 0.51 | | | | | 0.05 | | | | | 1.30 | | | | | (0.20 | ) | | | | 0.34 | | | | | 0.42 | |
| | | | | | | | | | | | | | | | | | | | | | | | | | | | | | |
Less distributions to shareholders: | | | | | | | | | | | | | | | | | | | | | | | | | | | | | | |
From net investment income | | | | (0.15 | ) | | | | (0.45 | ) | | | | (0.44 | ) | | | | (0.36 | ) | | | | (0.37 | ) | | | | (0.36 | ) |
From net realized gain on investments | | | | — | | | | | — | 2 | | | | (0.03 | ) | | | | (0.02 | ) | | | | — | 2 | | | | (0.01 | ) |
| | | | | | | | | | | | | | | | | | | | | | | | | | | | | | |
Total distributions to shareholders | | | | (0.15 | ) | | | | (0.45 | ) | | | | (0.47 | ) | | | | (0.38 | ) | | | | (0.37 | ) | | | | (0.37 | ) |
| | | | | | | | | | | | | | | | | | | | | | | | | | | | | | |
Net asset value - End of period | | | $ | 11.13 | | | | $ | 10.77 | | | | $ | 11.17 | | | | $ | 10.34 | | | | $ | 10.92 | | | | $ | 10.95 | |
| | | | | | | | | | | | | | | | | | | | | | | | | | | | | | |
Net assets - End of period (000’s omitted) | | | $ | 307,280 | | | | $ | 276,970 | | | | $ | 234,486 | | | | $ | 197,736 | | | | $ | 235,709 | | | | $ | 167,689 | |
| | | | | | | | | | | | | | | | | | | | | | | | | | | | | | |
Total return3 | | | | 4.76 | % | | | | 0.41 | % | | | | 12.75 | % | | | | (1.79 | %) | | | | 3.20 | % | | | | 3.94 | % |
Ratios (to average net assets)/ Supplemental Data: | | | | | | | | | | | | | | | | | | | | | | | | | | | | | | |
Expenses* | | | | 0.57 | %4 | | | | 0.58 | % | | | | 0.60 | % | | | | 0.61 | % | | | | 0.62 | % | | | | 0.66 | % |
Net investment income | | | | 3.35 | %4 | | | | 3.51 | % | | | | 3.65 | % | | | | 3.75 | % | | | | 3.65 | % | | | | 3.71 | % |
Portfolio turnover | | | | 26 | % | | | | 3 | % | | | | 8 | % | | | | 7 | % | | | | 3 | % | | | | 5 | % |
| * | The investment advisor did not impose all or a portion of its management fees, CCO fees, fund accounting and transfer agent fees, and other fees in some periods and in some periods paid a portion of the Series’ expenses. If these expenses had been incurred by the Series, the expense ratio (to average net assets) would have been increased by the following amount: |
| | | | | | | | | | | | | | | | | | | | | | | | | | | | | | |
| | | | N/A | | | | | 0.00 | %5 | | | | 0.01 | % | | | | N/A | | | | | N/A | | | | | N/A | |
| 1 | Calculated based on average shares outstanding during the period. |
| 2 | Less than $0.01 per share. |
| 3 | Represents aggregate total return for the periods indicated, and assumes reinvestment of all distributions. Total return would have been lower had certain expenses not been waived or reimbursed during certain periods. Periods less than one year are not annualized. |
| | | | |
| 22 | | The accompanying notes are an integral part of the financial statements. | | |
Notes to Financial Statements (unaudited)
Diversified Tax Exempt Series (the “Series”) is a no-load diversified series of Manning & Napier Fund, Inc. (the “Fund”). The Fund is organized in Maryland and is registered under the Investment Company Act of 1940, as amended, as an open-end management investment company.
The Series’ investment objective is to provide as high a level of current income exempt from federal income tax as the Advisor believes is consistent with the preservation of capital.
The Fund’s Advisor is Manning & Napier Advisors, Inc. (the “Advisor”). Shares of the Series are offered to investors, clients and employees of the Advisor and its affiliates. The total authorized capital stock of the Fund consists of 10.0 billion shares of common stock each having a par value of $0.01. As of June 30, 2011, 6.4 billion shares have been designated in total among 31 series, of which 100 million have been designated as Diversified Tax Exempt Series Class A common stock.
| 2. | SIGNIFICANT ACCOUNTING POLICIES |
Security Valuation
Municipal securities will normally be valued on the basis of market valuations provided by an independent pricing service (the “Service”). The Service utilizes the latest price quotations and a matrix system (which considers such factors as security prices of similar securities, yields, maturities and ratings). The Service has been approved by the Fund’s Board of Directors (the “Board”).
Short-term investments that mature in sixty days or less are valued at amortized cost, which approximates market value. Investments in open-end investment companies are valued at their net asset value per share on valuation date.
Volume and level of activity in established markets for an asset or liability are evaluated to determine whether recent transactions and quoted prices are determinative of fair value. Where there have been significant decreases in volume and level of activity, further analysis and adjustment may be necessary to estimate fair value. The Series measures fair value in these instances by the use of inputs and valuation techniques which may be based upon current market prices of securities that are comparable in coupon, rating, maturity and industry and/or expectation of future cash flows. As a result of trading in relatively thin markets and/or markets that experience significant volatility, the prices used by the Series to value these securities may differ from the value that would be realized if these securities were sold, and the differences could be material.
Securities for which representative valuations or prices are not available from the Fund’s pricing service may be valued at fair value. Due to the inherent uncertainty of valuations of such securities, the fair value may differ significantly from the values that would have been used had a ready market for such securities existed. If trading or events occurring after the close of the principal market in which securities are traded are expected to materially affect the value of those securities, then they may be valued at their fair value, taking this trading or these events into account. Fair value is determined in good faith by the Advisor under procedures approved by and under the general supervision and responsibility of the Board.
Various inputs are used in determining the value of the Series’ assets or liabilities carried at market value. These inputs are summarized in three broad levels. Level 1 includes quoted prices in active markets for identical assets and liabilities. Level 2 includes other significant observable inputs (including quoted prices for similar securities, interest rates, prepayment speeds, credit risk, etc.). Level 3 includes significant unobservable inputs (including the Series’ own assumptions in determining the fair value of investments). The inputs or methodology used for valuing securities are not necessarily an indication of the risk associated with investing in those securities.
The following is a summary of the valuation levels used for major security types as of June 30, 2011 in valuing the Series’ assets or liabilities carried at market value:
Notes to Financial Statements (unaudited)
| 2. | SIGNIFICANT ACCOUNTING POLICIES (continued) |
Security Valuation (continued)
| | | | | | | | | | | | | | | | | | | | |
Description | | Total | | Level 1 | | Level 2 | | Level 3 |
Assets: | | | | | | | | | | | | | | | | | | | | |
Equity securities* | | | $ | — | | | | $ | — | | | | $ | — | | | | $ | — | |
Preferred securities | | | | — | | | | | — | | | | | — | | | | | — | |
Debt securities: | | | | | | | | | | | | | | | | | | | | |
States and political subdivisions (municipals) | | | | 295,284,493 | | | | | — | | | | | 295,284,493 | | | | | — | |
Mutual funds | | | | 10,714,656 | | | | | 10,714,656 | | | | | — | | | | | — | |
Other financial instruments** | | | | — | | | | | — | | | | | — | | | | | — | |
| | | | | | | | | | | | | | | | | | | | |
Total assets | | | | 305,999,149 | | | | | 10,714,656 | | | | | 295,284,493 | | | | | — | |
| | | | | | | | | | | | | | | | | | | | |
Liabilities: | | | | | | | | | | | | | | | | | | | | |
Other financial instruments** | | | | — | | | | | — | | | | | — | | | | | — | |
| | | | | | | | | | | | | | | | | | | | |
Total liabilities | | | | — | | | | | — | | | | | — | | | | | — | |
| | | | | | | | | | | | | | | | | | | | |
Total | | | $ | 305,999,149 | | | | $ | 10,714,656 | | | | $ | 295,284,493 | | | | $ | — | |
| | | | | | | | | | | | | | | | | | | | |
| * | Includes common stock, warrants and rights. |
| ** | Other financial instruments are derivative instruments not reflected in the Investment Portfolio, such as futures, forwards and swap contracts, which are valued at the unrealized appreciation/depreciation on the instrument. As of June 30, 2011, the Series did not hold any derivative instruments. |
There were no Level 3 securities held by the Series as of December 31, 2010 or June 30, 2011.
The Fund’s policy is to recognize transfers in and transfers out of the valuation levels as of the beginning of the reporting period. There were no significant transfers between Level 1 and Level 2 during the six months ended June 30, 2011.
Recent Accounting Standard
In May 2011, the Financial Accounting Standards Board issued amended guidance to improve disclosure about fair value measurements which will require the following disclosures for fair value measurements categorized as Level 3: quantitative information about the unobservable inputs and assumptions used in the fair value measurement, a description of the valuation policies and procedures and a narrative description of the sensitivity of the fair value measurement to changes in unobservable inputs and the interrelationships between those unobservable inputs. In addition, the amounts and reasons for all transfers in and out of Level 1 and Level 2 will be required to be disclosed. The amended guidance is effective for financial statements for fiscal years beginning after December 15, 2011, and interim periods within those fiscal years. Management is evaluating the impact of this guidance on the Series’ financial statements and disclosures.
Security Transactions, Investment Income and Expenses
Security transactions are accounted for on trade date. Dividend income is recorded on the ex-dividend date, except that if the ex-dividend date has passed, certain dividends from foreign securities are recorded as soon as the Fund is informed of the ex-dividend date. Non-cash dividends, if any, are recorded at the fair market value of the securities received. Interest income, including amortization of premium and accretion of discounts using the effective interest method, is earned from settlement date and accrued daily.
Notes to Financial Statements (unaudited)
| 2. | SIGNIFICANT ACCOUNTING POLICIES (continued) |
Security Transactions, Investment Income and Expenses (continued)
Expenses are recorded on an accrual basis. Most expenses of the Fund can be attributed to a specific series. Expenses which cannot be directly attributed are apportioned among the series in the Fund in such a manner as deemed equitable by the Fund’s Board, taking into consideration, among other things, the nature and type of expense.
The Series uses the identified cost method for determining realized gain or loss on investments for both financial statement and federal income tax reporting purposes.
Federal Taxes
The Series’ policy is to comply with the provisions of the Internal Revenue Code applicable to regulated investment companies. The Series is not subject to federal income tax or excise tax to the extent that the Series distributes to shareholders each year its taxable income, including any net realized gains on investments, in accordance with requirements of the Internal Revenue Code. Accordingly, no provision for federal income tax or excise tax has been made in the financial statements.
Management evaluates its tax positions to determine if the tax positions taken meet the minimum recognition threshold in connection with accounting for uncertainties in income tax positions taken or expected to be taken for the purposes of measuring and recognizing tax liabilities in the financial statements. Recognition of tax benefits of an uncertain tax position is required only when the position is “more likely than not” to be sustained assuming examination by taxing authorities. At June 30, 2011, the Series has recorded no liability for net unrecognized tax benefits relating to uncertain income tax positions taken or expected to be taken in future tax returns.
The Series files income tax returns in the U.S. federal jurisdiction and various states, as required. No income tax returns are currently under investigation. The statute of limitations on the Series’ tax returns remains open for the years ended December 31, 2007 through December 31, 2010. The Fund is not aware of any tax positions for which it is reasonably possible that the total amounts of unrecognized tax benefits will significantly change in the next twelve months.
Distributions of Income and Gains
Distributions to shareholders of net investment income are made quarterly. Distributions of net realized gains are made annually. An additional distribution may be necessary to avoid taxation of the Series. Distributions are recorded on the ex-dividend date.
Indemnifications
The Fund’s organizational documents provide former and current directors and officers with a limited indemnification against liabilities arising in connection with the performance of their duties to the Fund. In the normal course of business, the Fund may also enter into contracts that provide general indemnifications. The Fund’s maximum exposure under these arrangements is unknown as this would be dependent on future claims that may be made against the Fund. The risk of material loss from such claims is considered remote.
Other
The preparation of financial statements in conformity with accounting principles generally accepted in the United States of America requires management to make estimates and assumptions that affect the reported amounts of assets and liabilities and the disclosure of contingent assets and liabilities at the date of the financial statements and the reported amounts of income and expenses during the reporting period. Actual results could differ from those estimates.
Notes to Financial Statements (unaudited)
| 3. | TRANSACTIONS WITH AFFILIATES |
The Fund has an Investment Advisory Agreement (the “Agreement”) with the Advisor, for which the Series pays a fee, computed daily and payable monthly, at an annual rate of 0.50% of the Series’ average daily net assets.
Under the Agreement, personnel of the Advisor provide the Series with advice and assistance in the choice of investments and the execution of securities transactions, and otherwise maintain the Series’ organization. The Advisor also provides the Fund with necessary office space and fund administration and support services. The salaries of all officers of the Fund (except a percentage of the Fund’s Chief Compliance Officer’s salary, which is paid by the Fund), and of all Directors who are “affiliated persons” of the Fund, or of the Advisor, and all personnel of the Fund, or of the Advisor, performing services relating to research, statistical and investment activities, are paid by the Advisor. Each “non-affiliated” Director receives an annual stipend, which is allocated among all the active series of the Fund. In addition, these Directors also receive a fee per Board meeting attended plus a fee for each committee meeting attended.
The Advisor has contractually agreed, until at least April 30, 2012, to waive its fee and, if necessary, pay other operating expenses of the Series in order to maintain total direct annual fund operating expenses for the Series at no more than 0.85% of average daily net assets each year. The Advisor did not waive any fees for the six months ended June 30, 2011. The Advisor is not eligible to recoup any expenses that have been waived or reimbursed in prior years.
Manning & Napier Investor Services, Inc., a registered broker-dealer affiliate of the Advisor, acts as distributor for the Fund’s shares. The services of Manning & Napier Investor Services, Inc. are provided at no additional cost to the Series.
The Advisor has agreements with BNY Mellon Investment Servicing (U.S.) Inc. (“BNY”) under which BNY serves as sub-accountant services agent and sub-transfer agent.The Fund pays the Advisor an annual fee related to fund accounting and administration of 0.0175% on the first $3 billion of average daily net assets (excluding Target Series); 0.015% on the next $3 billion of average daily net assets (excluding Target Series); and 0.01% of the average daily net assets in excess of $6 billion (excluding Target Series); plus a base fee of $25,500 per Series. Transfer Agent fees are charged to the Fund on a per account basis. Additionally, certain transaction- and cusip-based fees and out-of-pocket expenses, including charges for reporting relating to the Fund’s compliance program, are charged.
Expenses not directly attributable to a Series are allocated based on each Series’ relative net assets or number of accounts, depending on the expense.
| 4. | PURCHASES AND SALES OF SECURITIES |
For the six months ended June 30, 2011, purchases and sales of securities, other than U.S. Government securities and short-term securities, were $95,439,546 and $72,174,452, respectively. There were no purchases or sales of U.S. Government securities.
Notes to Financial Statements (unaudited)
| 5. | CAPITAL STOCK TRANSACTIONS |
Transactions in shares of Diversified Tax Exempt Series were:
| | | | | | | | | | | | | | | | | | | | |
| | | For the Six Months
Ended 6/30/11 | | For the Year
Ended 12/31/10 |
| | | Shares | | Amount | | Shares | | Amount |
Sold | | | | 2,774,208 | | | | $ | 30,359,164 | | | | | 7,011,303 | | | | $ | 79,206,449 | |
Reinvested | | | | 339,321 | | | | | 3,733,268 | | | | | 903,576 | | | | | 10,015,744 | |
Repurchased | | | | (1,215,517 | ) | | | | (13,279,304 | ) | | | | (3,196,428 | ) | | | | (36,165,604 | ) |
| | | | | | | | | | | | | | | | | | | | |
Total | | | | 1,898,012 | | | | $ | 20,813,128 | | | | | 4,718,451 | | | | $ | 53,056,589 | |
| | | | | | | | | | | | | | | | | | | | |
Substantially all of the Series’ shares represent investments by fiduciary accounts over which the Advisor has sole investment discretion.
The Series may trade in instruments including written and purchased options, forward foreign currency exchange contracts and futures contracts and other derivatives in the normal course of investing activities to assist in managing exposure to various market risks. The Series may be subject to various elements of risk, which may involve, to a varying degree, elements of risk in excess of the amounts recognized for financial statement purposes. These risks include: the risk that changes in the value of a derivative may not correlate perfectly with the underlying asset, rate or index, counterparty credit risk related to over the counter derivatives’ counterparties failure to perform under contract terms, liquidity risk related to the lack of a liquid market for these contracts allowing the fund to close out its position(s) and documentation risk relating to disagreement over contract terms. No such investments were held by the Series on June 30, 2011.
| 7. | FEDERAL INCOME TAX INFORMATION |
The amount and characterization of certain income and capital gains to be distributed are determined in accordance with federal income tax regulations, which may differ from accounting principles generally accepted in the United States of America. The Series may periodically make reclassifications among its capital accounts to reflect income and gains available for distribution (or available capital loss carryovers) under income tax regulations, without impacting the Series’ net asset value. Any such reclassifications are not reflected in the financial highlights.
The final determination of the tax character of current year distributions will be made at the conclusion of the fiscal year. The tax character of distributions paid for the year ended December 31, 2010 were as follows:
| | | | | |
Tax exempt income | | | $ | 10,676,650 | |
Long-term capital gains | | | | 48,078 | |
At June 30, 2011, the identified cost of investments for federal income tax purposes, the resulting gross unrealized appreciation and depreciation, and the net unrealized appreciation was as follows:
| | | | | |
Cost for federal income tax purposes | | | $ | 302,210,932 | |
Unrealized appreciation | | | $ | 6,210,190 | |
Unrealized depreciation | | | | (2,421,973 | ) |
| | | | | |
Net unrealized appreciation | | | $ | 3,788,217 | |
| | | | | |
Literature Requests (unaudited)
Proxy Voting Policies and Procedures
A description of the policies and procedures that the Fund uses to determine how to vote proxies relating to portfolio securities is available, without charge, upon request:
| | |
| By phone | | 1-800-466-3863 |
On the Securities and Exchange Commission’s (SEC) web site | | http://www.sec.gov |
Proxy Voting Record
Information regarding how the Fund voted proxies relating to portfolio securities during the most recent 12-month period ended June 30th is available, without charge, upon request:
| | |
| By phone | | 1-800-466-3863 |
| On the SEC’s web site | | http://www.sec.gov |
Quarterly Portfolio Holdings
The Series’ complete schedule of portfolio holdings for the 1st and 3rd quarters of each fiscal year are provided on Form N-Q, and are available, without charge, upon request:
| | |
| By phone | | 1-800-466-3863 |
| On the SEC’s web site | | http://www.sec.gov |
The Series’ Form N-Q may be reviewed and copied at the SEC’s Public Reference Room in Washington, D.C. Information on the operation of the Public Reference Room may be obtained by calling 1-800-SEC-0330.
Prospectus and Statement of Additional Information (SAI)
The prospectus and SAI provide additional information about each Series, including charges, expenses and risks. These documents are available, without charge, upon request:
| | |
| By phone | | 1-800-466-3863 |
| On the SEC’s web site | | http://www.sec.gov |
| On our web site | | http://www.manning-napier.com |
Additional information available at www.manning-napier.com
1. Fund Holdings - Month-End
2. Fund Holdings - Quarter-End
3. Shareholder Report - Annual
4. Shareholder Report - Semi-Annual
The Fund also offers electronic notification or “e-delivery” when certain documents are available on-line to be downloaded or reviewed. Direct shareholders can elect to receive electronic notification when shareholder reports, prospectus updates, and / or quarterly statements are available. If you do not currently have on-line access to your account, you can establish access by going to www.manning-napier.com, click on “Login” in the top corner of the page, and follow the prompts to self-enroll. Once enrolled, you can set your electronic notification preferences by clicking on the Account Options tab located within the green toolbar and then select E-Delivery Option. Should you have any questions on either how to establish on-line access or how to update your account settings, please do not hesitate to contact Investor Services at 1-800-466-3863.
MNDTES-6/11-SAR


| | | | |
| | NEW YORK TAX EXEMPT SERIES | | |
Shareholder Expense Example (unaudited)
As a shareholder of the Series, you may incur two types of costs: (1) transaction costs and (2) ongoing costs, including management fees and other Series expenses. This example is intended to help you understand your ongoing costs (in dollars) of investing in the Series and to compare these costs with the ongoing costs of investing in other mutual funds.
The example is based on an investment of $1,000 invested at the beginning of the period and held for the entire period (January 1, 2011 to June 30, 2011).
Actual Expenses
The first line of the table below provides information about actual account values and actual expenses. You may use the information in this line, together with the amount you invested, to estimate the expenses that you paid over the period. Simply divide your account value by $1,000 (for example, an $8,600 account value divided by $1,000 = 8.6), then multiply the result by the number in the first line under the heading entitled “Expenses Paid During Period” to estimate the expenses you paid on your account during this period.
Hypothetical Example for Comparison Purposes
The second line of the table below provides information about hypothetical account values and hypothetical expenses based on the Series’ actual expense ratio and an assumed rate of return of 5% per year before expenses, which is not the Series’ actual return. The hypothetical account values and expenses may not be used to estimate the actual ending account balance or expenses you paid during the period. You may use this information to compare the ongoing costs of investing in the Series and other funds. To do so, compare this 5% hypothetical example with the 5% hypothetical examples that appear in the shareholder reports of the other funds.
Please note that the expenses shown in the table are meant to highlight your ongoing costs only and do not reflect any transaction costs. Therefore, the second line of the table is useful in comparing ongoing costs only, and will not help you determine the relative total costs of owning different funds. In addition, if these transaction costs were included, your costs would have been higher.
| | | | | | | | | | | | | | | |
| | | Beginning
Account Value
1/1/11 | | Ending
Account Value
6/30/11 | | Expenses Paid
During Period*
1/1/11-6/30/11 |
Actual | | | $ | 1,000.00 | | | | $ | 1,046.30 | | | | $ | 3.04 | |
Hypothetical
(5% return before expenses) | | | $ | 1,000.00 | | | | $ | 1,021.82 | | | | $ | 3.01 | |
| * | Expenses are equal to the Series’ annualized expense ratio (for the six-month period) of 0.60%, multiplied by the average account value over the period, multiplied by 181/365 (to reflect the one-half year period). Expenses are based on the most recent fiscal half year. |
Portfolio Composition as of June 30, 2011 (unaudited)
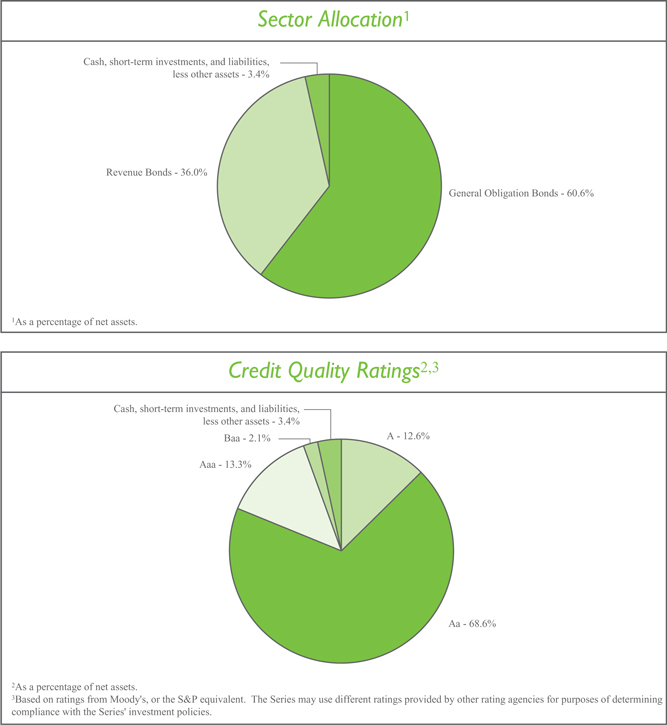
Investment Portfolio - June 30, 2011 (unaudited)
| | | | | | | | | | | | | | | | | | | | | | | | | |
| | | Coupon
Rate | | Maturity
Date | | Credit
Rating1 | | Principal
Amount | | Value
(Note 2) |
| | | | | |
NEW YORK MUNICIPAL BONDS - 96.6% | | | | | | | | | | | | | | | | | | | | | | | | | |
Albany County, Public Impt., G.O. Bond | | | | 4.000 | % | | | | 6/1/2026 | | | | | Aa2 | | | | $ | 500,000 | | | | $ | 504,200 | |
Arlington Central School District, G.O. Bond, NATL | | | | 4.625 | % | | | | 12/15/2024 | | | | | Aa2 | | | | | 845,000 | | | | | 861,815 | |
Arlington Central School District, G.O. Bond, NATL | | | | 4.625 | % | | | | 12/15/2025 | | | | | Aa2 | | | | | 365,000 | | | | | 371,139 | |
Beacon, Series A, G.O. Bond | | | | 4.000 | % | | | | 8/15/2014 | | | | | Aa3 | | | | | 400,000 | | | | | 438,020 | |
Bethlehem, Public Impt., G.O. Bond | | | | 4.500 | % | | | | 12/1/2033 | | | | | AA | 2 | | | | 335,000 | | | | | 345,653 | |
Bethlehem, Public Impt., G.O. Bond | | | | 4.500 | % | | | | 12/1/2035 | | | | | AA | 2 | | | | 425,000 | | | | | 435,221 | |
Briarcliff Manor, Public Impt., Series A, G.O. Bond, AMBAC | | | | 4.000 | % | | | | 10/1/2025 | | | | | Aa2 | | | | | 280,000 | | | | | 286,381 | |
Brookhaven, G.O. Bond, AMBAC | | | | 5.000 | % | | | | 6/1/2014 | | | | | Aa2 | | | | | 200,000 | | | | | 223,524 | |
Brookhaven, Public Impt., G.O. Bond | | | | 3.000 | % | | | | 3/15/2013 | | | | | Aa2 | | | | | 1,050,000 | | | | | 1,095,696 | |
Buffalo Fiscal Stability Authority, Sales Tax & State Aid, Series B, Revenue Bond, NATL | | | | 5.000 | % | | | | 9/1/2016 | | | | | Aa1 | | | | | 525,000 | | | | | 590,898 | |
Cayuga County, Public Impt., G.O. Bond, AGM . | | | | 3.250 | % | | | | 4/1/2026 | | | | | Aa3 | | | | | 670,000 | | | | | 645,552 | |
Chappaqua Central School District, G.O. Bond | | | | 3.000 | % | | | | 1/15/2013 | | | | | Aaa | | | | | 300,000 | | | | | 311,382 | |
Chautauqua County, Public Impt., G.O. Bond | | | | 4.250 | % | | | | 1/15/2027 | | | | | A | 2 | | | | 665,000 | | | | | 681,379 | |
Chautauqua County, Public Impt., Series B, G.O. Bond, NATL | | | | 4.500 | % | | | | 12/15/2018 | | | | | Aa3 | | | | | 485,000 | | | | | 523,373 | |
Clarkstown, Series B, G.O. Bond | | | | 4.000 | % | | | | 10/15/2012 | | | | | AAA | 2 | | | | 315,000 | | | | | 329,616 | |
Cleveland Hill Union Free School District, G.O. Bond, AGM | | | | 3.750 | % | | | | 6/15/2025 | | | | | Aa3 | | | | | 475,000 | | | | | 481,498 | |
Clifton Park Water Authority, Revenue Bond | | | | 4.250 | % | | | | 10/1/2029 | | | | | AA | 2 | | | | 250,000 | | | | | 255,403 | |
Connetquot Central School District of Islip, G.O. Bond | | | | 4.000 | % | | | | 7/15/2014 | | | | | Aa2 | | | | | 390,000 | | | | | 427,167 | |
Dutchess County, Public Impt., Prerefunded Balance, G.O. Bond, NATL | | | | 4.000 | % | | | | 12/15/2016 | | | | | Aa1 | | | | | 315,000 | | | | | 350,809 | |
Dutchess County, Public Impt., Unrefunded Balance, G.O. Bond, NATL | | | | 4.000 | % | | | | 12/15/2016 | | | | | Aa1 | | | | | 360,000 | | | | | 388,915 | |
East Islip Union Free School District, Series A, G.O. Bond | | | | 4.000 | % | | | | 6/15/2015 | | | | | AA | 2 | | | | 345,000 | | | | | 381,639 | |
East Rochester Union Free School District, G.O. Bond | | | | 3.500 | % | | | | 3/15/2023 | | | | | AA | 2 | | | | 380,000 | | | | | 386,783 | |
Erie County Water Authority, Revenue Bond | | | | 5.000 | % | | | | 12/1/2013 | | | | | Aa2 | | | | | 400,000 | | | | | 441,548 | |
Erie County Water Authority, Revenue Bond, NATL | | | | 5.000 | % | | | | 12/1/2037 | | | | | Aa2 | | | | | 625,000 | | | | | 636,994 | |
Fairport Village, Public Impt., G.O. Bond | | | | 2.625 | % | | | | 5/15/2013 | | | | | AA | 2 | | | | 265,000 | | | | | 273,559 | |
Gates Chili Central School District, G.O. Bond | | | | 2.500 | % | | | | 6/15/2016 | | | | | Aa3 | | | | | 555,000 | | | | | 579,958 | |
Gates Chili Central School District, G.O. Bond | | | | 3.000 | % | | | | 6/15/2017 | | | | | Aa3 | | | | | 590,000 | | | | | 626,497 | |
Geneva City, Public Impt., G.O. Bond, AGM | | | | 3.250 | % | | | | 5/15/2018 | | | | | Aa3 | | | | | 590,000 | | | | | 623,825 | |
Greece Central School District, G.O. Bond, AGM | | | | 4.000 | % | | | | 6/15/2019 | | | | | Aa3 | | | | | 2,675,000 | | | | | 2,882,152 | |
Greene County, Public Impt., G.O. Bond | | | | 1.500 | % | | | | 3/15/2014 | | | | | Aa3 | | | | | 505,000 | | | | | 509,939 | |
Greene County, Public Impt., G.O. Bond | | | | 3.000 | % | | | | 12/15/2014 | | | | | Aa3 | | | | | 595,000 | | | | | 632,318 | |
| | | | | | |
| | The accompanying notes are an integral part of the financial statements. | | | 3 | |
Investment Portfolio - June 30, 2011 (unaudited)
| | | | | | | | | | | | | | | | | | | | | | | | | |
| | | Coupon
Rate | | Maturity
Date | | Credit
Rating1 | | Principal
Amount | | Value
(Note 2) |
| | | | | |
NEW YORK MUNICIPAL BONDS (continued) | | | | | | | | | | | | | | | | | | | | | | | | | |
Guilderland Central School District, G.O. Bond | | | | 3.000 | % | | | | 12/15/2020 | | | | | Aa3 | | | | $ | 345,000 | | | | $ | 346,915 | |
Hampton Bays Union Free School District, G.O. Bond, AGM | | | | 4.250 | % | | | | 9/15/2026 | | | | | Aa3 | | | | | 1,140,000 | | | | | 1,142,576 | |
Haverstraw-Stony Point Central School District, G.O. Bond, AGM | | | | 4.500 | % | | | | 10/15/2032 | | | | | Aa2 | | | | | 2,000,000 | | | | | 2,007,500 | |
Homer Central School District, School Impt., G.O. Bond, AGC | | | | 3.500 | % | | | | 6/15/2018 | | | | | Aa3 | | | | | 500,000 | | | | | 534,620 | |
Huntington, G.O. Bond, AMBAC | | | | 5.500 | % | | | | 4/15/2014 | | | | | Aaa | | | | | 415,000 | | | | | 468,859 | |
Huntington, Public Impt., G.O. Bond | | | | 2.000 | % | | | | 6/15/2014 | | | | | Aaa | | | | | 570,000 | | | | | 590,127 | |
Hyde Park Central School District, G.O. Bond, AGC | | | | 3.500 | % | | | | 6/15/2018 | | | | | AA | 2 | | | | 360,000 | | | | | 386,118 | |
Ithaca City School District, G.O. Bond | | | | 3.000 | % | | | | 7/1/2014 | | | | | AA | 2 | | | | 675,000 | | | | | 715,453 | |
Johnson City Central School District, G.O. Bond, FGRNA | | | | 4.375 | % | | | | 6/15/2028 | | | | | A | 2 | | | | 1,000,000 | | | | | 986,430 | |
Johnson City Central School District, G.O. Bond, FGRNA | | | | 4.375 | % | | | | 6/15/2030 | | | | | A | 2 | | | | 985,000 | | | | | 951,096 | |
Katonah-Lewisboro Union Free School District, Series C, G.O. Bond, FGRNA | | | | 5.000 | % | | | | 11/1/2014 | | | | | Aa2 | | | | | 300,000 | | | | | 340,959 | |
Lake George Central School District, G.O. Bond | | | | 3.750 | % | | | | 7/15/2025 | | | | | AA | 2 | | | | 335,000 | | | | | 337,342 | |
Long Beach City School District, G.O. Bond | | | | 3.000 | % | | | | 5/1/2014 | | | | | Aa2 | | | | | 500,000 | | | | | 524,360 | |
Long Island Power Authority, Electric Systems, Prerefunded Balance, Series C, Revenue Bond, CIFG | | | | 5.000 | % | | | | 9/1/2015 | | | | | Aaa | | | | | 250,000 | | | | | 274,603 | |
Long Island Power Authority, Electric Systems, Series A, Revenue Bond | | | | 5.750 | % | | | | 4/1/2039 | | | | | A3 | | | | | 675,000 | | | | | 721,453 | |
Long Island Power Authority, Electric Systems, Series A, Revenue Bond, FGRNA | | | | 5.000 | % | | | | 12/1/2019 | | | | | A3 | | | | | 1,000,000 | | | | | 1,089,500 | |
Long Island Power Authority, Electric Systems, Series A, Revenue Bond, FGRNA | | | | 5.000 | % | | | | 12/1/2025 | | | | | A3 | | | | | 1,690,000 | | | | | 1,754,034 | |
Long Island Power Authority, Electric Systems, Series F, Revenue Bond, NATL | | | | 4.500 | % | | | | 5/1/2028 | | | | | A3 | | | | | 1,880,000 | | | | | 1,825,837 | |
Maine-Endwell Central School District, G.O. Bond, AGC | | | | 4.000 | % | | | | 6/15/2025 | | | | | AA | 2 | | | | 1,000,000 | | | | | 991,530 | |
Mamaroneck Union Free School District, G.O. Bond | | | | 3.500 | % | | | | 6/15/2025 | | | | | Aaa | | | | | 1,000,000 | | | | | 1,015,990 | |
Marlboro Central School District, G.O. Bond, AGC | | | | 4.000 | % | | | | 12/15/2026 | | | | | AA | 2 | | | | 500,000 | | | | | 512,265 | |
Metropolitan Transportation Authority, Dedicated | | | | | | | | | | | | | | | | | | | | | | | | | |
Tax Fund, Series B, Revenue Bond | | | | 5.000 | % | | | | 11/15/2034 | | | | | AA | 2 | | | | 1,000,000 | | | | | 1,015,670 | |
Metropolitan Transportation Authority, Series B, Revenue Bond, AGM | | | | 4.500 | % | | | | 11/15/2032 | | | | | Aa3 | | | | | 500,000 | | | | | 483,305 | |
Metropolitan Transportation Authority, Series F, Revenue Bond | | | | 5.000 | % | | | | 11/15/2030 | | | | | A2 | | | | | 640,000 | | | | | 640,960 | |
| | | | |
| 4 | | The accompanying notes are an integral part of the financial statements. | | |
Investment Portfolio - June 30, 2011 (unaudited)
| | | | | | | | | | | | | | | | | | | | | | | | | |
| | | Coupon
Rate | | Maturity
Date | | Credit
Rating1 | | Principal
Amount | | Value
(Note 2) |
| | | | | |
NEW YORK MUNICIPAL BONDS (continued) | | | | | | | | | | | | | | | | | | | | | | | | | |
Miller Place Union Free School District, G.O. Bond | | | | 4.000 | % | | | | 2/15/2027 | | | | | Aa2 | | | | $ | 265,000 | | | | $ | 265,755 | |
Minisink Valley Central School District, G.O. Bond | | | | 2.500 | % | | | | 4/15/2014 | | | | | AA | 2 | | | | 225,000 | | | | | 235,085 | |
Minisink Valley Central School District, G.O. Bond | | | | 2.500 | % | | | | 4/15/2015 | | | | | AA | 2 | | | | 200,000 | | | | | 208,246 | |
Minisink Valley Central School District, G.O. Bond | | | | 3.500 | % | | | | 4/15/2025 | | | | | AA | 2 | | | | 900,000 | | | | | 893,151 | |
Monroe County Water Authority, Revenue Bond | | | | 4.250 | % | | | | 8/1/2030 | | | | | Aa2 | | | | | 405,000 | | | | | 405,016 | |
Monroe County Water Authority, Revenue Bond | | | | 4.500 | % | | | | 8/1/2035 | | | | | Aa2 | | | | | 275,000 | | | | | 272,594 | |
Nanuet Union Free School District, G.O. Bond, AGM | | | | 4.300 | % | | | | 6/15/2029 | | | | | Aa2 | | | | | 505,000 | | | | | 510,545 | |
Nassau County Interim Finance Authority, Sales Tax Secured, Series A, Revenue Bond, AMBAC | | | | 4.750 | % | | | | 11/15/2023 | | | | | Aa1 | | | | | 1,000,000 | | | | | 1,031,740 | |
Nassau County, Public Impt., Series C, G.O. Bond | | | | 4.000 | % | | | | 10/1/2026 | | | | | A1 | | | | | 1,000,000 | | | | | 929,490 | |
Nassau County, Public Impt., Series C, G.O. Bond, AGC | | | | 5.000 | % | | | | 10/1/2028 | | | | | Aa3 | | | | | 1,000,000 | | | | | 1,032,690 | |
New Hyde Park & Garden City Park, Union Free School District, G.O. Bond, AGM | | | | 4.125 | % | | | | 6/15/2023 | | | | | Aa2 | | | | | 200,000 | | | | | 204,560 | |
New York City Municipal Water Finance Authority, Unrefunded Balance, Revenue Bond, FGRNA | | | | 5.000 | % | | | | 6/15/2026 | | | | | Aa1 | | | | | 520,000 | | | | | 521,721 | |
New York City Municipal Water Finance Authority, Water & Sewer Systems, Series A, Revenue Bond | | | | 4.250 | % | | | | 6/15/2033 | | | | | Aa1 | | | | | 1,250,000 | | | | | 1,207,513 | |
New York City Municipal Water Finance Authority, Water & Sewer Systems, Series A, Revenue Bond | | | | 4.500 | % | | | | 6/15/2037 | | | | | Aa1 | | | | | 1,000,000 | | | | | 964,350 | |
New York City Municipal Water Finance Authority, Water & Sewer Systems, Series A, Revenue Bond | | | | 5.750 | % | | | | 6/15/2040 | | | | | Aa1 | | | | | 1,000,000 | | | | | 1,097,720 | |
New York City Municipal Water Finance Authority, Water & Sewer Systems, Series A, Revenue Bond, AMBAC | | | | 5.000 | % | | | | 6/15/2035 | | | | | Aa1 | | | | | 750,000 | | | | | 756,517 | |
New York City Municipal Water Finance Authority, Water & Sewer Systems, Series D, Revenue Bond, AMBAC | | | | 4.500 | % | | | | 6/15/2036 | | | | | Aa1 | | | | | 500,000 | | | | | 484,315 | |
New York City Transitional Finance Authority, Public Impt., Prerefunded Balance, Future Tax Secured, Revenue Bond, NATL | | | | 5.250 | % | | | | 2/1/2021 | | | | | Aaa | | | | | 1,000,000 | | | | | 1,077,800 | |
| | | | | | |
| | The accompanying notes are an integral part of the financial statements. | | | 5 | |
Investment Portfolio - June 30, 2011 (unaudited)
| | | | | | | | | | | | | | | | | | | | | | | | | |
| | | Coupon
Rate | | Maturity
Date | | Credit
Rating1 | | Principal
Amount | | Value
(Note 2) |
| | | | | |
NEW YORK MUNICIPAL BONDS (continued) | | | | | | | | | | | | | | | | | | | | | | | | | |
New York City, G.O. Bond, XLCA | | | | 5.000 | % | | | | 9/1/2019 | | | | | Aa2 | | | | $ | 500,000 | | | | $ | 557,530 | |
New York City, Prerefunded Balance, Series G, G.O. Bond | | | | 5.000 | % | | | | 8/1/2017 | | | | | Aa2 | | | | | 310,000 | | | | | 325,925 | |
New York City, Public Impt., Prerefunded Balance, Series D, G.O. Bond | | | | 5.250 | % | | | | 10/15/2017 | | | | | Aa2 | | | | | 1,950,000 | | | | | 2,163,096 | |
New York City, Public Impt., Prerefunded Balance, Series J, G.O. Bond | | | | 5.250 | % | | | | 6/1/2028 | | | | | Aa2 | | | | | 1,600,000 | | | | | 1,748,448 | |
New York City, Public Impt., Series A, G.O. Bond | | | | 5.000 | % | | | | 8/1/2013 | | | | | Aa2 | | | | | 1,000,000 | | | | | 1,088,520 | |
New York City, Public Impt., Series F, G.O. Bond | | | | 3.750 | % | | | | 12/15/2012 | | | | | Aa2 | | | | | 500,000 | | | | | 523,290 | |
New York City, Series D, G.O. Bond | | | | 5.250 | % | | | | 8/1/2014 | | | | | Aa2 | | | | | 1,390,000 | | | | | 1,566,447 | |
New York City, Series O, G.O. Bond | | | | 5.000 | % | | | | 6/1/2033 | | | | | Aa2 | | | | | 1,050,000 | | | | | 1,063,745 | |
New York State Dormitory Authority, Columbia University, Revenue Bond | | | | 5.000 | % | | | | 7/1/2038 | | | | | Aaa | | | | | 900,000 | | | | | 937,197 | |
New York State Dormitory Authority, Columbia University, Series A, Revenue Bond | | | | 5.000 | % | | | | 7/1/2025 | | | | | Aaa | | | | | 500,000 | | | | | 506,460 | |
New York State Dormitory Authority, Cornell University, Series C, Revenue Bond | | | | 5.000 | % | | | | 7/1/2037 | | | | | Aa1 | | | | | 1,000,000 | | | | | 1,040,430 | |
New York State Dormitory Authority, Education, Series F, Revenue Bond | | | | 5.000 | % | | | | 3/15/2023 | | | | | Aa3 | | | | | 1,475,000 | | | | | 1,594,519 | |
New York State Dormitory Authority, New York University, Series A, Revenue Bond | | | | 5.000 | % | | | | 7/1/2039 | | | | | Aa3 | | | | | 1,000,000 | | | | | 1,015,820 | |
New York State Dormitory Authority, Series A, Revenue Bond, AGM | | | | 5.000 | % | | | | 10/1/2018 | | | | | Aa3 | | | | | 250,000 | | | | | 282,187 | |
New York State Dormitory Authority, Series A, Revenue Bond, AGM | | | | 5.000 | % | | | | 10/1/2021 | | | | | Aa3 | | | | | 250,000 | | | | | 278,300 | |
New York State Dormitory Authority, Series A, Revenue Bond, AGM | | | | 4.000 | % | | | | 10/1/2025 | | | | | Aa3 | | | | | 1,500,000 | | | | | 1,449,225 | |
New York State Dormitory Authority, Series A, Revenue Bond, AGM | | | | 4.375 | % | | | | 10/1/2030 | | | | | Aa3 | | | | | 1,500,000 | | | | | 1,455,240 | |
New York State Dormitory Authority, Series B, Revenue Bond, AGM | | | | 4.400 | % | | | | 10/1/2030 | | | | | Aa3 | | | | | 140,000 | | | | | 136,301 | |
New York State Dormitory Authority, Series B, Revenue Bond, AGM | | | | 4.750 | % | | | | 10/1/2040 | | | | | Aa3 | | | | | 1,360,000 | | | | | 1,291,918 | |
New York State Dormitory Authority, University of Rochester, Series A, Revenue Bond | | | | 5.125 | % | | | | 7/1/2039 | | | | | Aa3 | | | | | 1,000,000 | | | | | 1,014,090 | |
New York State Environmental Facilities Corp., Clean Water & Drinking, Revenue Bond | | | | 4.500 | % | | | | 6/15/2022 | | | | | Aaa | | | | | 300,000 | | | | | 309,342 | |
New York State Environmental Facilities Corp., Clean Water & Drinking, Revenue Bond, NATL | | | | 5.000 | % | | | | 6/15/2021 | | | | | Aaa | | | | | 600,000 | | | | | 621,864 | |
| | | | |
| 6 | | The accompanying notes are an integral part of the financial statements. | | |
Investment Portfolio - June 30, 2011 (unaudited)
| | | | | | | | | | | | | | | | | | | | | | | | | |
| | | Coupon
Rate | | Maturity
Date | | Credit
Rating1 | | Principal
Amount | | Value
(Note 2) |
| | | | | |
NEW YORK MUNICIPAL BONDS (continued) | | | | | | | | | | | | | | | | | | | | | | | | | |
New York State Environmental Facilities Corp., Clean Water & Drinking, Series A, Revenue Bond | | | | 4.500 | % | | | | 6/15/2036 | | | | | Aaa | | | | $ | 1,000,000 | | | | $ | 990,360 | |
New York State Environmental Facilities Corp., Clean Water & Drinking, Series B, Revenue Bond | | | | 5.000 | % | | | | 6/15/2027 | | | | | Aaa | | | | | 1,000,000 | | | | | 1,028,660 | |
New York State Environmental Facilities Corp., Clean Water & Drinking, Series B, Revenue Bond | | | | 4.500 | % | | | | 6/15/2036 | | | | | Aa1 | | | | | 1,500,000 | | | | | 1,459,380 | |
New York State Environmental Facilities Corp., Personal Income Tax, Series A, Revenue Bond | | | | 5.000 | % | | | | 12/15/2019 | | | | | AAA | 2 | | | | 750,000 | | | | | 831,173 | |
New York State Environmental Facilities Corp., Pollution Control, Unrefunded Balance, Series B, Revenue Bond | | | | 5.200 | % | | | | 5/15/2014 | | | | | Aaa | | | | | 365,000 | | | | | 384,104 | |
New York State Municipal Bond Bank Agency, Series A1, Revenue Bond, AGM | | | | 5.000 | % | | | | 5/15/2017 | | | | | Aa3 | | | | | 215,000 | | | | | 241,084 | |
New York State Municipal Bond Bank Agency, Series B1, Revenue Bond | | | | 4.125 | % | | | | 12/15/2029 | | | | | A | 2 | | | | 420,000 | | | | | 399,626 | |
New York State Municipal Bond Bank Agency, Series B1, Revenue Bond | | | | 4.500 | % | | | | 12/15/2034 | | | | | A | 2 | | | | 215,000 | | | | | 203,945 | |
New York State Municipal Bond Bank Agency, Series B1, Revenue Bond, AGM | | | | 5.000 | % | | | | 4/15/2018 | | | | | Aa3 | | | | | 1,000,000 | | | | | 1,117,070 | |
New York State Power Authority, Series A, Revenue Bond, NATL | | | | 4.500 | % | | | | 11/15/2047 | | | | | Aa2 | | | | | 2,000,000 | | | | | 1,916,060 | |
New York State Thruway Authority, Highway & Bridge, Prerefunded Balance, Series A, Revenue Bond, NATL | | | | 5.250 | % | | | | 4/1/2015 | | | | | AA | 2 | | | | 300,000 | | | | | 325,443 | |
New York State Thruway Authority, Highway & Bridge, Prerefunded Balance, Series B, Revenue Bond, NATL | | | | 5.250 | % | | | | 4/1/2016 | | | | | AAA | 2 | | | | 300,000 | | | | | 303,834 | |
New York State Thruway Authority, Highway & Bridge, Series C, Revenue Bond, AMBAC | | | | 5.000 | % | | | | 4/1/2020 | | | | | Aa2 | | | | | 750,000 | | | | | 763,177 | |
New York State Thruway Authority, Personal Income Tax, Prerefunded Balance, Series A, Revenue Bond, AGM | | | | 5.000 | % | | | | 3/15/2014 | | | | | Aa3 | | | | | 500,000 | | | | | 539,240 | |
New York State Thruway Authority, Personal Income Tax, Prerefunded Balance, Series A, Revenue Bond, NATL | | | | 5.000 | % | | | | 3/15/2016 | | | | | AAA | 2 | | | | 825,000 | | | | | 889,746 | |
New York State Urban Development Corp., Correctional Capital Facilities, Series A, Revenue Bond, AGM | | | | 5.250 | % | | | | 1/1/2014 | | | | | Aa3 | | | | | 500,000 | | | | | 531,185 | |
| | | | | | |
| | The accompanying notes are an integral part of the financial statements. | | | 7 | |
Investment Portfolio - June 30, 2011 (unaudited)
| | | | | | | | | | | | | | | | | | | | | | | | | |
| | | Coupon
Rate | | Maturity
Date | | Credit
Rating1 | | Principal
Amount | | Value
(Note 2) |
| | | | | |
NEW YORK MUNICIPAL BONDS (continued) | | | | | | | | | | | | | | | | | | | | | | | | | |
New York State Urban Development Corp., Personal Income Tax, Series C, Revenue Bond, NATL | | | | 4.250 | % | | | | 3/15/2024 | | | | | Baa1 | | | | $ | 1,000,000 | | | | $ | 1,041,170 | |
New York State Urban Development Corp., Service Contract, Series B, Revenue Bond | | | | 5.250 | % | | | | 1/1/2022 | | | | | AA | 2 | | | | 2,350,000 | | | | | 2,597,314 | |
New York State, Pollution Control, Series A, G.O. Bond | | | | 5.000 | % | | | | 2/15/2039 | | | | | Aa2 | | | | | 1,500,000 | | | | | 1,554,735 | |
New York State, Series C, G.O. Bond | | | | 5.000 | % | | | | 4/15/2014 | | | | | Aa2 | | | | | 400,000 | | | | | 445,812 | |
New York State, Series C, G.O. Bond | | | | 5.000 | % | | | | 9/1/2014 | | | | | Aa2 | | | | | 1,000,000 | | | | | 1,127,110 | |
New York State, Series C, G.O. Bond | | | | 4.000 | % | | | | 2/1/2027 | | | | | Aa2 | | | | | 600,000 | | | | | 595,170 | |
New York State, Series C, G.O. Bond, AGM | | | | 5.000 | % | | | | 4/15/2012 | | | | | Aa2 | | | | | 700,000 | | | | | 726,950 | |
New York State, Transit Impt., Series A, G.O. Bond | | | | 4.500 | % | | | | 3/1/2040 | | | | | Aa2 | | | | | 1,500,000 | | | | | 1,469,130 | |
New York State, Water Utility Impt., Series A, G.O. Bond | | | | 2.000 | % | | | | 3/1/2013 | | | | | Aa2 | | | | | 350,000 | | | | | 358,109 | |
New York State, Water Utility Impt., Series A, G.O. Bond | | | | 4.500 | % | | | | 3/15/2019 | | | | | AA | 2 | | | | 500,000 | | | | | 529,795 | |
Niagara Falls City School District, G.O. Bond, AGM | | | | 4.375 | % | | | | 9/15/2029 | | | | | Aaa | | | | | 885,000 | | | | | 871,840 | |
Niagara-Wheatfield Central School District, G.O. Bond, FGRNA | | | | 4.125 | % | | | | 2/15/2019 | | | | | Aa3 | | | | | 610,000 | | | | | 658,172 | |
Niagara-Wheatfield Central School District, G.O. Bond, FGRNA | | | | 4.125 | % | | | | 2/15/2020 | | | | | Aa3 | | | | | 850,000 | | | | | 907,256 | |
Niskayuna Central School District, G.O Bond, AGC | | | | 4.000 | % | | | | 4/15/2022 | | | | | Aa2 | | | | | 400,000 | | | | | 420,280 | |
North Hempstead, G.O. Bond, FGRNA | | | | 3.125 | % | | | | 2/15/2012 | | | | | Aa1 | | | | | 250,000 | | | | | 254,533 | |
Onondaga County, Public Impt., Series A, G.O. Bond | | | | 5.000 | % | | | | 3/15/2013 | | | | | Aa1 | | | | | 290,000 | | | | | 312,759 | |
Onondaga County, Public Impt., Series A, G.O. Bond | | | | 3.000 | % | | | | 3/1/2015 | | | | | Aa1 | | | | | 1,000,000 | | | | | 1,065,200 | |
Onondaga County, Public Impt., Series A, G.O. Bond | | | | 4.500 | % | | | | 3/1/2028 | | | | | Aa1 | | | | | 365,000 | | | | | 379,377 | |
Orange County, Public Impt., Series A, G.O. Bond | | | | 2.000 | % | | | | 3/1/2013 | | | | | Aaa | | | | | 1,460,000 | | | | | 1,500,165 | |
Orange County, Public Impt., Series A, G.O. Bond | | | | 3.500 | % | | | | 3/1/2024 | | | | | Aaa | | | | | 1,000,000 | | | | | 1,009,570 | |
Orange County, Series A, G.O. Bond | | | | 5.000 | % | | | | 7/15/2012 | | | | | Aaa | | | | | 1,500,000 | | | | | 1,573,845 | |
Orangetown, Public Impt., G.O. Bond | | | | 3.000 | % | | | | 9/15/2026 | | | | | Aa2 | | | | | 580,000 | | | | | 549,167 | |
Otsego County, G.O. Bond | | | | 4.000 | % | | | | 11/15/2027 | | | | | Aa3 | | | | | 790,000 | | | | | 811,757 | |
Palmyra Macedon Central School District, G.O. Bond | | | | 3.750 | % | | | | 6/15/2024 | | | | | Aa3 | | | | | 500,000 | | | | | 509,670 | |
Pembroke Central School District, G.O. Bond | | | | 4.000 | % | | | | 6/15/2023 | | | | | AA | 2 | | | | 500,000 | | | | | 525,205 | |
Penfield Central School District, G.O. Bond | | | | 4.000 | % | | | | 6/15/2024 | | | | | Aa2 | | | | | 1,025,000 | | | | | 1,061,398 | |
Perinton, Public Impt., G.O. Bond | | | | 4.250 | % | | | | 12/15/2031 | | | | | AA | 2 | | | | 175,000 | | | | | 178,867 | |
| | | | |
| 8 | | The accompanying notes are an integral part of the financial statements. | | |
Investment Portfolio - June 30, 2011 (unaudited)
| | | | | | | | | | | | | | | | | | | | | | | | | |
| | | Coupon
Rate | | Maturity
Date | | Credit
Rating1 | | Principal
Amount | | Value
(Note 2) |
| | | | | |
NEW YORK MUNICIPAL BONDS (continued) | | | | | | | | | | | | | | | | | | | | | | | | | |
Phelps-Clifton Springs Central School District, Series B, G.O. Bond, NATL | | | | 5.000 | % | | | | 6/15/2021 | | | | | A1 | | | | $ | 850,000 | | | | $ | 881,595 | |
Phelps-Clifton Springs Central School District, Series B, G.O. Bond, NATL | | | | 5.000 | % | | | | 6/15/2022 | | | | | A1 | | | | | 450,000 | | | | | 465,453 | |
Pleasantville Union Free School District, G.O. Bond | | | | 4.250 | % | | | | 5/1/2038 | | | | | Aa2 | | | | | 500,000 | | | | | 460,920 | |
Pleasantville Union Free School District, G.O. Bond | | | | 4.375 | % | | | | 5/1/2039 | | | | | Aa2 | | | | | 500,000 | | | | | 469,275 | |
Port Authority of New York & New Jersey, Revenue Bond | | | | 4.750 | % | | | | 7/15/2030 | | | | | Aa2 | | | | | 495,000 | | | | | 509,009 | |
Port Authority of New York & New Jersey, Revenue Bond | | | | 5.000 | % | | | | 10/1/2030 | | | | | Aa2 | | | | | 1,000,000 | | | | | 1,035,860 | |
Port Authority of New York & New Jersey, Revenue Bond | | | | 4.500 | % | | | | 10/15/2037 | | | | | Aa2 | | | | | 400,000 | | | | | 389,740 | |
Port Washington Union Free School District, G.O. Bond | | | | 3.000 | % | | | | 12/1/2014 | | | | | Aa1 | | | | | 500,000 | | | | | 533,620 | |
Port Washington Union Free School District, G.O. Bond | | | | 4.000 | % | | | | 12/1/2019 | | | | | Aa1 | | | | | 250,000 | | | | | 262,955 | |
Pulaski Central School District, Series A, G.O. Bond, FGRNA | | | | 4.500 | % | | | | 6/15/2026 | | | | | A | 2 | | | | 425,000 | | | | | 430,648 | |
Ramapo Central School District, G.O. Bond | | | | 4.000 | % | | | | 10/1/2021 | | | | | Aa2 | | | | | 500,000 | | | | | 542,220 | |
Ramapo, Public Impt., Series B, G.O. Bond, NATL | | | | 4.375 | % | | | | 5/1/2031 | | | | | Aa2 | | | | | 435,000 | | | | | 437,445 | |
Ramapo, Public Impt., Series B, G.O. Bond, NATL | | | | 4.375 | % | | | | 5/1/2032 | | | | | Aa2 | | | | | 510,000 | | | | | 511,561 | |
Ramapo, Public Impt., Series B, G.O. Bond, NATL | | | | 4.500 | % | | | | 5/1/2033 | | | | | Aa2 | | | | | 410,000 | | | | | 412,989 | |
Ravena Coeymans Selkirk Central School District, G.O. Bond, AGM | | | | 4.250 | % | | | | 6/15/2014 | | | | | Aa3 | | | | | 1,180,000 | | | | | 1,269,739 | |
Rochester City, Series A, G.O. Bond, AMBAC | | | | 5.000 | % | | | | 8/15/2020 | | | | | Aa3 | | | | | 250,000 | | | | | 284,487 | |
Rochester City, Series A, G.O. Bond, AMBAC | | | | 5.000 | % | | | | 8/15/2022 | | | | | Aa3 | | | | | 95,000 | | | | | 107,100 | |
Sachem Central School District of Holbrook, G.O. Bond, FGRNA | | | | 4.250 | % | | | | 10/15/2028 | | | | | AA | 2 | | | | 330,000 | | | | | 334,828 | |
Sachem Central School District of Holbrook, G.O. Bond, FGRNA | | | | 4.375 | % | | | | 10/15/2030 | | | | | AA | 2 | | | | 1,000,000 | | | | | 1,007,700 | |
Sachem Central School District of Holbrook, Series B, G.O. Bond, FGRNA | | | | 4.250 | % | | | | 10/15/2026 | | | | | AA | 2 | | | | 1,200,000 | | | | | 1,227,336 | |
Saratoga County Water Authority, Water Utility Impt., Revenue Bond | | | | 5.000 | % | | | | 9/1/2038 | | | | | AA | 2 | | | | 950,000 | | | | | 969,437 | |
Saratoga County, Public Impt., Series A, G.O. Bond | | | | 4.750 | % | | | | 7/15/2036 | | | | | Aa1 | | | | | 820,000 | | | | | 832,735 | |
Saratoga County, Sewer Impt., Series B, G.O. Bond | | | | 4.200 | % | | | | 7/15/2032 | | | | | AA | 2 | | | | 425,000 | | | | | 415,004 | |
| | | | | | |
| | The accompanying notes are an integral part of the financial statements. | | | 9 | |
Investment Portfolio - June 30, 2011 (unaudited)
| | | | | | | | | | | | | | | | | | | | | | | | | |
| | | Coupon
Rate | | Maturity
Date | | Credit
Rating1 | | Principal
Amount | | Value
(Note 2) |
| | | | | |
NEW YORK MUNICIPAL BONDS (continued) | | | | | | | | | | | | | | | | | | | | | | | | | |
Saratoga County, Sewer Impt., Series B, G.O. Bond | | | | 4.250 | % | | | | 7/15/2035 | | | | | AA | 2 | | | $ | 700,000 | | | | $ | 672,448 | |
Saratoga Springs City School District, G.O. Bond | | | | 5.000 | % | | | | 6/15/2019 | | | | | AA | 2 | | | | 245,000 | | | | | 287,811 | |
Saratoga Springs City School District, G.O. Bond, AGM | | | | 5.000 | % | | | | 6/15/2020 | | | | | Aa2 | | | | | 200,000 | | | | | 217,904 | |
Schroon Lake Central School District, G.O. Bond, AGM | | | | 4.000 | % | | | | 6/15/2027 | | | | | Aa3 | | | | | 490,000 | | | | | 503,000 | |
Schuylerville Central School District, G.O. Bond, AGM | | | | 4.000 | % | | | | 6/15/2025 | | | | | AA | 2 | | | | 500,000 | | | | | 518,295 | |
Shenendehowa Central School District, G.O. Bond | | | | 2.500 | % | | | | 6/15/2014 | | | | | AA | 2 | | | | 280,000 | | | | | 291,460 | |
South Country Central School District at Brookhaven, G.O. Bond, AGM | | | | 4.000 | % | | | | 7/15/2027 | | | | | AA | 2 | | | | 750,000 | | | | | 725,797 | |
South Glens Falls Central School District, Unrefunded Balance, G.O. Bond, FGRNA | | | | 5.375 | % | | | | 6/15/2018 | | | | | A1 | | | | | 95,000 | | | | | 96,840 | |
Southold, Public Impt., G.O. Bond | | | | 2.000 | % | | | | 8/15/2013 | | | | | Aa2 | | | | | 580,000 | | | | | 596,971 | |
Spencerport Fire District, G.O. Bond, AGC | | | | 4.500 | % | | | | 11/15/2031 | | | | | AA | 2 | | | | 290,000 | | | | | 299,805 | |
Spencerport Fire District, G.O. Bond, AGC | | | | 4.500 | % | | | | 11/15/2032 | | | | | AA | 2 | | | | 250,000 | | | | | 257,017 | |
St. Lawrence County, Public Impt., G.O. Bond, FGRNA | | | | 4.500 | % | | | | 5/15/2031 | | | | | A | 2 | | | | 1,185,000 | | | | | 1,150,078 | |
St. Lawrence County, Public Impt., G.O. Bond, FGRNA | | | | 4.500 | % | | | | 5/15/2032 | | | | | A | 2 | | | | 1,000,000 | | | | | 959,400 | |
Suffolk County Water Authority, Revenue Bond, NATL | | | | 4.500 | % | | | | 6/1/2027 | | | | | Baa1 | | | | | 1,160,000 | | | | | 1,166,589 | |
Suffolk County Water Authority, Series A, Revenue Bond | | | | 4.500 | % | | | | 6/1/2030 | | | | | AA | 2 | | | | 640,000 | | | | | 648,922 | |
Suffolk County Water Authority, Series A, Revenue Bond, NATL | | | | 4.500 | % | | | | 6/1/2032 | | | | | Baa1 | | | | | 1,000,000 | | | | | 983,980 | |
Suffolk County, Public Impt., Series B, G.O. Bond | | | | 3.000 | % | | | | 10/15/2014 | | | | | Aa2 | | | | | 2,000,000 | | | | | 2,127,380 | |
Syracuse, Public Impt., Series A, G.O. Bond, FGRNA | | | | 4.250 | % | | | | 12/1/2028 | | | | | A1 | | | | | 600,000 | | | | | 582,000 | |
Syracuse, Public Impt., Series A, G.O. Bond, FGRNA | | | | 4.250 | % | | | | 12/1/2029 | | | | | A1 | | | | | 600,000 | | | | | 575,526 | |
Syracuse, Public Impt., Series A, G.O. Bond, NATL | | | | 4.250 | % | | | | 6/15/2023 | | | | | A1 | | | | | 690,000 | | | | | 690,110 | |
Syracuse, Public Impt., Series A, G.O. Bond, NATL | | | | 4.375 | % | | | | 6/15/2025 | | | | | A1 | | | | | 990,000 | | | | | 978,467 | |
Tarrytowns Union Free School District, G.O. Bond, AMBAC | | | | 4.250 | % | | | | 1/15/2030 | | | | | Aa2 | | | | | 215,000 | | | | | 215,357 | |
Tarrytowns Union Free School District, G.O. Bond, AMBAC | | | | 4.375 | % | | | | 1/15/2032 | | | | | Aa2 | | | | | 1,090,000 | | | | | 1,081,945 | |
Tompkins County, Public Impt., G.O. Bond | | | | 4.250 | % | | | | 12/15/2032 | | | | | Aa1 | | | | | 300,000 | | | | | 303,168 | |
| | | | |
| 10 | | The accompanying notes are an integral part of the financial statements. | | |
Investment Portfolio - June 30, 2011 (unaudited)
| | | | | | | | | | | | | | | | | | | | | | | | | |
| | | Coupon
Rate | | Maturity
Date | | Credit
Rating1 | | Principal
Amount | | Value
(Note 2) |
| | | | | |
NEW YORK MUNICIPAL BONDS (continued) | | | | | | | | | | | | | | | | | | | | | | | | | |
Tompkins County, Series A, G.O. Bond, NATL | | | | 5.250 | % | | | | 2/15/2015 | | | | | Aa1 | | | | $ | 315,000 | | | | $ | 349,577 | |
Triborough Bridge & Tunnel Authority, General Purposes, Prerefunded Balance, Series A, Revenue Bond | | | | 5.000 | % | | | | 1/1/2032 | | | | | Aa2 | | | | | 250,000 | | | | | 255,963 | |
Triborough Bridge & Tunnel Authority, General Purposes, Prerefunded Balance, Series A, Revenue Bond, NATL | | | | 4.750 | % | | | | 1/1/2019 | | | | | AAA | 2 | | | | 300,000 | | | | | 346,545 | |
Triborough Bridge & Tunnel Authority, General Purposes, Prerefunded Balance, Series A, Revenue Bond, NATL | | | | 5.000 | % | | | | 1/1/2032 | | | | | AAA | 2 | | | | 1,695,000 | | | | | 1,735,426 | |
Triborough Bridge & Tunnel Authority, General | | | | | | | | | | | | | | | | | | | | | | | | | |
Purposes, Series B, Revenue Bond | | | | 5.000 | % | | | | 11/15/2020 | | | | | Aa2 | | | | | 750,000 | | | | | 792,607 | |
Triborough Bridge & Tunnel Authority, General Purposes, Unrefunded Balance, Series A, Revenue Bond, NATL | | | | 5.000 | % | | | | 1/1/2032 | | | | | Aa2 | | | | | 305,000 | | | | | 306,080 | |
Triborough Bridge & Tunnel Authority, Series C, Revenue Bond | | | | 5.000 | % | | | | 11/15/2038 | | | | | Aa2 | | | | | 900,000 | | | | | 921,123 | |
Triborough Bridge & Tunnel Authority, Subordinate Bonds, Revenue Bond, FGRNA . | | | | 5.000 | % | | | | 11/15/2032 | | | | | Aa3 | | | | | 1,000,000 | | | | | 1,010,420 | |
Ulster County, Public Impt., G.O. Bond, XLCA | | | | 4.500 | % | | | | 11/15/2026 | | | | | AA | 2 | | | | 560,000 | | | | | 573,177 | |
Ulster County, Public Impt., Series A, G.O. Bond, FGRNA | | | | 4.250 | % | | | | 11/15/2021 | | | | | AA | 2 | | | | 200,000 | | | | | 208,118 | |
Union Endicott Central School District, G.O. Bond, FGRNA | | | | 4.125 | % | | | | 6/15/2014 | | | | | A | 2 | | | | 605,000 | | | | | 653,545 | |
Union Endicott Central School District, G.O. Bond, FGRNA | | | | 4.125 | % | | | | 6/15/2015 | | | | | A | 2 | | | | 865,000 | | | | | 946,561 | |
Victor Central School District, G.O. Bond, AGM. | | | | 3.500 | % | | | | 6/15/2012 | | | | | Aa2 | | | | | 200,000 | | | | | 206,362 | |
Village of Fayetteville, Public Impt., Series A, G.O. Bond, AGM | | | | 4.000 | % | | | | 6/15/2025 | | | | | Aa3 | | | | | 555,000 | | | | | 567,698 | |
Wayne County, Public Impt., G.O. Bond, NATL | | | | 4.125 | % | | | | 6/1/2024 | | | | | Aa2 | | | | | 500,000 | | | | | 510,345 | |
Westchester County, Public Impt., Series A, G.O. Bond | | | | 3.750 | % | | | | 11/15/2011 | | | | | Aaa | | | | | 1,000,000 | | | | | 1,013,340 | |
Westchester County, Public Impt., Series A, G.O. Bond | | | | 3.000 | % | | | | 1/15/2015 | | | | | Aaa | | | | | 500,000 | | | | | 535,000 | |
Westchester County, Public Impt., Series B, G.O. Bond | | | | 4.300 | % | | | | 12/15/2011 | | | | | Aaa | | | | | 15,000 | | | | | 15,283 | |
Westchester County, Public Impt., Series B, G.O. Bond | | | | 3.700 | % | | | | 12/15/2015 | | | | | Aaa | | | | | 1,000,000 | | | | | 1,063,040 | |
Westchester County, Series C, G.O. Bond | | | | 5.000 | % | | | | 11/1/2013 | | | | | Aaa | | | | | 200,000 | | | | | 221,004 | |
Westhampton Beach Union Free School District, G.O. Bond, NATL | | | | 4.000 | % | | | | 7/15/2018 | | | | | Aa2 | | | | | 726,000 | | | | | 774,932 | |
White Plains City School District, Series B, G.O. Bond | | | | 4.650 | % | | | | 5/15/2031 | | | | | Aa2 | | | | | 685,000 | | | | | 723,387 | |
| | | | | | |
| | The accompanying notes are an integral part of the financial statements. | | | 11 | |
Investment Portfolio - June 30, 2011 (unaudited)
| | | | | | | | | | | | | | | | | | | | | | | | | |
| | | Coupon
Rate | | Maturity
Date | | Credit
Rating1 | | Principal
Amount/
Shares | | Value
(Note 2) |
| | | | | |
NEW YORK MUNICIPAL BONDS (continued) | | | | | | | | | | | | | | | | | | | | | | | | | |
Williamsville Central School District, School Impt., G.O. Bond | | | | 3.000 | % | | | | 6/15/2019 | | | | | Aa1 | | | | $ | 325,000 | | | | $ | 335,592 | |
Yonkers City, Series B, G.O. Bond, NATL | | | | 5.000 | % | | | | 8/1/2030 | | | | | A2 | | | | | 1,095,000 | | | | | 1,079,068 | |
Yorktown Central School District, G.O. Bond | | | | 4.000 | % | | | | 3/1/2025 | | | | | AA | 2 | | | | 370,000 | | | | | 378,580 | |
| | | | | | | | | | | | | | | | | | | | | | | | | |
TOTAL MUNICIPAL BONDS
(Identified Cost $148,475,507) | | | | | | | | | | | | | | | | | | | | | | | | 150,452,199 | |
| | | | | | | | | | | | | | | | | | | | | | | | | |
| | | | | |
SHORT-TERM INVESTMENTS - 3.5% | | | | | | | | | | | | | | | | | | | | | | | | | |
Dreyfus BASIC New York Municipal Money Market Fund
(Identified Cost $5,511,341) | | | | | | | | | | | | | | | | | | | 5,511,341 | | | | | 5,511,341 | |
| | | | | | | | | | | | | | | | | | | | | | | | | |
TOTAL INVESTMENTS - 100.1%
(Identified Cost $153,986,848) | | | | | | | | | | | | | | | | | | | | | | | | 155,963,540 | |
LIABILITIES, LESS OTHER ASSETS - (0.1%) | | | | | | | | | | | | | | | | | | | | | | | | (149,199 | ) |
| | | | | | | | | | | | | | | | | | | | | | | | | |
NET ASSETS - 100% | | | | | | | | | | | | | | | | | | | | | | | $ | 155,814,341 | |
| | | | | | | | | | | | | | | | | | | | | | | | | |
KEY:
G.O. Bond - General Obligation Bond
Impt. - Improvement
Scheduled principal and interest payments are guaranteed by:
AGC (Assured Guaranty Corp.)
AGM (Assurance Guaranty Municipal Corp.)
AMBAC (AMBAC Assurance Corp.)
CIFG (CIFG North America, Inc.)
FGIC (Financial Guaranty Insurance Co.)
FGRNA (FGIC reinsured by NATL)
NATL (National Public Finance Guarantee Corp.)
XLCA (XL Capital Assurance)
The insurance does not guarantee the market value of the municipal bonds.
1Credit ratings from Moody’s (unaudited).
2Credit ratings from S&P (unaudited).
The Series’ portfolio holds, as a percentage of net assets, greater than 10% in bonds insured bby the following companies:
NATL - 25.7%; AGM - 14.1%.
| | | | |
| 12 | | The accompanying notes are an integral part of the financial statements. | | |
Statement of Assets and Liabilities (unaudited)
June 30, 2011
| | | | | |
ASSETS: | | | | | |
Investments, at value (identified cost $153,986,848) (Note 2) | | | $ | 155,963,540 | |
Interest receivable | | | | 1,392,521 | |
Receivable for fund shares sold | | | | 439,580 | |
| | | | | |
| |
TOTAL ASSETS | | | | 157,795,641 | |
| | | | | |
| |
LIABILITIES: | | | | | |
| |
Accrued management fees (Note 3) | | | | 63,856 | |
Accrued fund accounting and administration fees (Note 3) | | | | 13,872 | |
Accrued transfer agent fees (Note 3) | | | | 1,052 | |
Accrued Chief Compliance Officer service fees (Note 3) | | | | 466 | |
Accrued directors’ fees (Note 3) | | | | 281 | |
Payable for securities purchased | | | | 1,249,280 | |
Payable for fund shares repurchased | | | | 628,618 | |
Other payables and accrued expenses | | | | 23,875 | |
| | | | | |
| |
TOTAL LIABILITIES | | | | 1,981,300 | |
| | | | | |
| |
TOTAL NET ASSETS | | | $ | 155,814,341 | |
| | | | | |
| |
NET ASSETS CONSIST OF: | | | | | |
| |
Capital stock | | | $ | 148,180 | |
Additional paid-in-capital | | | | 152,862,379 | |
Undistributed net investment income | | | | 554,562 | |
Accumulated net realized gain on investments | | | | 272,528 | |
Net unrealized appreciation on investments | | | | 1,976,692 | |
| | | | | |
| |
TOTAL NET ASSETS | | | $ | 155,814,341 | |
| | | | | |
NET ASSET VALUE, OFFERING PRICE AND REDEMPTION PRICE PER SHARE - Class A
($155,814,341/14,817,956 shares) | | | $ | 10.52 | |
| | | | | |
| | | | | | |
| | The accompanying notes are an integral part of the financial statements. | | | 13 | |
Statement of Operations (unaudited)
For the Six Months Ended June 30, 2011
| | | | | |
INVESTMENT INCOME: | | | | | |
| |
Interest | | | $ | 2,835,506 | |
Dividends | | | | 124 | |
| | | | | |
| |
Total Investment Income | | | | 2,835,630 | |
| | | | | |
| |
EXPENSES: | | | | | |
| |
Management fees (Note 3) | | | | 361,949 | |
Fund accounting and administration fees (Note 3) | | | | 36,990 | |
Transfer agent fees (Note 3) | | | | 2,368 | |
Directors’ fees (Note 3) | | | | 2,103 | |
Chief Compliance Officer service fees (Note 3) | | | | 1,314 | |
Custodian fees | | | | 3,559 | |
Miscellaneous | | | | 23,857 | |
| | | | | |
| |
Total Expenses | | | | 432,140 | |
| | | | | |
| |
NET INVESTMENT INCOME | | | | 2,403,490 | |
| | | | | |
| |
REALIZED AND UNREALIZED GAIN ON INVESTMENTS: | | | | | |
| |
Net realized gain on investments | | | | 272,979 | |
Net change in unrealized appreciation on investments | | | | 4,067,725 | |
| | | | | |
| |
NET REALIZED AND UNREALIZED GAIN ON INVESTMENTS | | | | 4,340,704 | |
| | | | | |
| |
NET INCREASE IN NET ASSETS RESULTING FROM OPERATIONS | | | $ | 6,744,194 | |
| | | | | |
| | | | |
| 14 | | The accompanying notes are an integral part of the financial statements. | | |
Statement of Changes in Net Assets
| | | | | | | | | | |
| | | For the Six
Months Ended
6/30/11
(unaudited) | | For the
Year Ended
12/31/10 |
INCREASE (DECREASE) IN NET ASSETS: | | | | | | | | | | |
| | |
OPERATIONS: | | | | | | | | | | |
| | |
Net investment income | | | $ | 2,403,490 | | | | $ | 4,446,788 | |
Net realized gain on investments | | | | 272,979 | | | | | 46,036 | |
Net change in unrealized appreciation (depreciation) on investments | | | | 4,067,725 | | | | | (4,689,742 | ) |
| | | | | | | | | | |
| | |
Net increase (decrease) from operations | | | | 6,744,194 | | | | | (196,918 | ) |
| | | | | | | | | | |
| | |
DISTRIBUTIONS TO SHAREHOLDERS (Note 8): | | | | | | | | | | |
| | |
From net investment income | | | | (2,008,705 | ) | | | | (4,857,125 | ) |
From net realized gain on investments | | | | — | | | | | (113,664 | ) |
| | | | | | | | | | |
| | |
Total distributions to shareholders | | | | (2,008,705 | ) | | | | (4,970,789 | ) |
| | | | | | | | | | |
| | |
CAPITAL STOCK ISSUED AND REPURCHASED: | | | | | | | | | | |
| | |
Net increase from capital share transactions (Note 5) | | | | 14,853,482 | | | | | 30,861,062 | |
| | | | | | | | | | |
| | |
Net increase in net assets | | | | 19,588,971 | | | | | 25,693,355 | |
| | |
NET ASSETS: | | | | | | | | | | |
| | |
Beginning of period | | | | 136,225,370 | | | | | 110,532,015 | |
| | | | | | | | | | |
| | |
End of period (including undistributed net investment income of $554,562 and $159,777, respectively) | | | $ | 155,814,341 | | | | $ | 136,225,370 | |
| | | | | | | | | | |
| | | | | | |
| | The accompanying notes are an integral part of the financial statements. | | | 15 | |
Financial Highlights
| | | | | | | | | | | | | | | | | | | | | | | | | | | | | | |
| | | For the Six
Months Ended
6/30/11
(unaudited) | | |
| | | For the Years Ended |
| | | 12/30/10 | | 12/31/09 | | 12/31/08 | | 12/31/07 | | 12/31/06 |
Per share data (for a share outstanding throughout each period): | | | | | | | | | | | | | | | | | | | | | | | | | | | | | | |
Net asset value - Beginning of period | | | $ | 10.19 | | | | $ | 10.55 | | | | $ | 9.79 | | | | $ | 10.41 | | | | $ | 10.44 | | | | $ | 10.45 | |
| | | | | | | | | | | | | | | | | | | | | | | | | | | | | | |
Income (loss) from investment operations: | | | | | | | | | | | | | | | | | | | | | | | | | | | | | | |
Net investment income | | | | 0.17 | 1 | | | | 0.36 | 1 | | | | 0.38 | 1 | | | | 0.38 | | | | | 0.37 | | | | | 0.38 | |
Net realized and unrealized gain (loss) on investments | | | | 0.30 | | | | | (0.32 | ) | | | | 0.82 | | | | | (0.63 | ) | | | | (0.01 | ) | | | | (0.02 | ) |
| | | | | | | | | | | | | | | | | | | | | | | | | | | | | | |
Total from investment operations | | | | 0.47 | | | | | 0.04 | | | | | 1.20 | | | | | (0.25 | ) | | | | 0.36 | | | | | 0.36 | |
| | | | | | | | | | | | | | | | | | | | | | | | | | | | | | |
Less distributions to shareholders: | | | | | | | | | | | | | | | | | | | | | | | | | | | | | | |
From net investment income | | | | (0.14 | ) | | | | (0.39 | ) | | | | (0.41 | ) | | | | (0.36 | ) | | | | (0.37 | ) | | | | (0.36 | ) |
From net realized gain on investments | | | | — | | | | | (0.01 | ) | | | | (0.03 | ) | | | | (0.01 | ) | | | | (0.02 | ) | | | | (0.01 | ) |
| | | | | | | | | | | | | | | | | | | | | | | | | | | | | | |
Total distributions to shareholders | | | | (0.14 | ) | | | | (0.40 | ) | | | | (0.44 | ) | | | | (0.37 | ) | | | | (0.39 | ) | | | | (0.37 | ) |
| | | | | | | | | | | | | | | | | | | | | | | | | | | | | | |
Net asset value - End of period | | | $ | 10.52 | | | | $ | 10.19 | | | | $ | 10.55 | | | | $ | 9.79 | | | | $ | 10.41 | | | | $ | 10.44 | |
| | | | | | | | | | | | | | | | | | | | | | | | | | | | | | |
Net assets - End of period (000’s omitted) | | | $ | 155,814 | | | | $ | 136,225 | | | | $ | 110,532 | | | | $ | 97,202 | | | | $ | 111,704 | | | | $ | 92,910 | |
| | | | | | | | | | | | | | | | | | | | | | | | | | | | | | |
Total return2 | | | | 4.63 | % | | | | 0.32 | % | | | | 12.46 | % | | | | (2.37 | %) | | | | 3.44 | % | | | | 3.48 | % |
Ratios (to average net assets)/ Supplemental Data: | | | | | | | | | | | | | | | | | | | | | | | | | | | | | | |
Expenses* | | | | 0.60 | %3 | | | | 0.61 | % | | | | 0.64 | % | | | | 0.64 | % | | | | 0.65 | % | | | | 0.68 | % |
Net investment income | | | | 3.32 | %3 | | | | 3.41 | % | | | | 3.64 | % | | | | 3.71 | % | | | | 3.66 | % | | | | 3.68 | % |
Portfolio turnover | | | | 17 | % | | | | 7 | % | | | | 10 | % | | | | 11 | % | | | | 7 | % | | | | 8 | % |
|
* The investment advisor did not impose all or a portion of its management fees, CCO fees, fund accounting and transfer agent fees, and other fees in some periods and in some periods paid a portion of the Series’ expenses. If these expenses had been incurred by the Series, the expense ratio (to average net assets) would have been increased by the following amount: | |
| | | | N/A | | | | | 0.00 | %4 | | | | 0.00 | %4 | | | | N/A | | | | | N/A | | | | | N/A | |
| 1 | Calculated based on average shares outstanding during the period. |
| 2 | Represents aggregate total return for the periods indicated, and assumes reinvestment of all distributions. Total return would have been lower had certain expenses not been waived or reimbursed during certain periods. Periods less than one year are not annualized. |
| | | | |
| 16 | | The accompanying notes are an integral part of the financial statements. | | |
Notes to Financial Statements (unaudited)
New York Tax Exempt Series (the “Series”) is a no-load diversified series of Manning & Napier Fund, Inc. (the “Fund”). The Fund is organized in Maryland and is registered under the Investment Company Act of 1940, as amended, as an open-end management investment company.
The Series’ investment objective is to provide as high a level of current income exempt from federal income tax and New York State personal income tax as the Advisor believes is consistent with the preservation of capital.
The Fund’s Advisor is Manning & Napier Advisors, Inc. (the “Advisor”). Shares of the Series are offered to investors, clients and employees of the Advisor and its affiliates. The total authorized capital stock of the Fund consists of 10.0 billion shares of common stock each having a par value of $0.01. As of June 30, 2011, 6.4 billion shares have been designated in total among 31 series, of which 100 million have been designated as New York Tax Exempt Series Class A common stock.
| 2. | SIGNIFICANT ACCOUNTING POLICIES |
Security Valuation
Municipal securities will normally be valued on the basis of market valuations provided by an independent pricing service (the “Service”). The Service utilizes the latest price quotations and a matrix system (which considers such factors as security prices of similar securities, yields, maturities and ratings). The Service has been approved by the Fund’s Board of Directors (the “Board”).
Short-term investments that mature in sixty days or less are valued at amortized cost, which approximates market value. Investments in open-end investment companies are valued at their net asset value per share on valuation date.
Volume and level of activity in established markets for an asset or liability are evaluated to determine whether recent transactions and quoted prices are determinative of fair value. Where there have been significant decreases in volume and level of activity, further analysis and adjustment may be necessary to estimate fair value. The Series measures fair value in these instances by the use of inputs and valuation techniques which may be based upon current market prices of securities that are comparable in coupon, rating, maturity and industry and/or expectation of future cash flows. As a result of trading in relatively thin markets and/or markets that experience significant volatility, the prices used by the Series to value these securities may differ from the value that would be realized if these securities were sold, and the differences could be material.
Securities for which representative valuations or prices are not available from the Fund’s pricing service may be valued at fair value. Due to the inherent uncertainty of valuations of such securities, the fair value may differ significantly from the values that would have been used had a ready market for such securities existed. If trading or events occurring after the close of the principal market in which securities are traded are expected to materially affect the value of those securities, then they may be valued at their fair value, taking this trading or these events into account. Fair value is determined in good faith by the Advisor under procedures approved by and under the general supervision and responsibility of the Board.
Various inputs are used in determining the value of the Series’ assets or liabilities carried at market value. These inputs are summarized in three broad levels. Level 1 includes quoted prices in active markets for identical assets and liabilities. Level 2 includes other significant observable inputs (including quoted prices for similar securities, interest rates, prepayment speeds, credit risk, etc.). Level 3 includes significant unobservable inputs (including the Series’ own assumptions in determining the fair value of investments). The inputs or methodology used for valuing securities are not necessarily an indication of the risk associated with investing in those securities.
Notes to Financial Statements (unaudited)
| 2. | SIGNIFICANT ACCOUNTING POLICIES (continued) |
Security Valuation (continued)
The following is a summary of the valuation levels used for major security types as of June 30, 2011 in valuing the Series’ assets or liabilities carried at market value:
| | | | | | | | | | | | | | | | | | | | |
Description | | Total | | Level 1 | | Level 2 | | Level 3 |
Assets: | | | | | | | | | | | | | | | | | | | | |
Equity securities* | | | $ | — | | | | $ | — | | | | $ | — | | | | $ | — | |
Preferred securities | | | | — | | | | | — | | | | | — | | | | | — | |
Debt securities: | | | | | | | | | | | | | | | | | | | | |
States and political subdivisions (municipals) | | | | 150,452,199 | | | | | — | | | | | 150,452,199 | | | | | — | |
Mutual funds | | | | 5,511,341 | | | | | 5,511,341 | | | | | — | | | | | — | |
Other financial instruments** | | | | — | | | | | — | | | | | — | | | | | — | |
| | | | | | | | | | | | | | | | | | | | |
Total assets | | | | 155,963,540 | | | | | 5,511,341 | | | | | 150,452,199 | | | | | — | |
| | | | | | | | | | | | | | | | | | | | |
Liabilities: | | | | | | | | | | | | | | | | | | | | |
Other financial instruments** | | | | — | | | | | — | | | | | — | | | | | — | |
| | | | | | | | | | | | | | | | | | | | |
Total liabilities | | | | — | | | | | — | | | | | — | | | | | — | |
| | | | | | | | | | | | | | | | | | | | |
Total | | | $ | 155,963,540 | | | | $ | 5,511,341 | | | | $ | 150,452,199 | | | | $ | — | |
| | | | | | | | | | | | | | | | | | | | |
| * | Includes common stock, warrants and rights. |
| ** | Other financial instruments are derivative instruments not reflected in the Investment Portfolio, such as futures, forwards and swap contracts, which are valued at the unrealized appreciation/depreciation on the instrument. As of June 30, 2011, the Series did not hold any derivative instruments. |
| | There were no Level 3 securities held by the Series as of December 31, 2010 or June 30, 2011. |
| | The Fund’s policy is to recognize transfers in and transfers out of the valuation levels as of the beginning of the reporting period. There were no significant transfers between Level 1 and Level 2 during the six months ended June 30, 2011. |
Recent Accounting Standard
In May 2011, the Financial Accounting Standards Board issued amended guidance to improve disclosure about fair value measurements which will require the following disclosures for fair value measurements categorized as Level 3: quantitative information about the unobservable inputs and assumptions used in the fair value measurement, a description of the valuation policies and procedures and a narrative description of the sensitivity of the fair value measurement to changes in unobservable inputs and the interrelationships between those unobservable inputs. In addition, the amounts and reasons for all transfers in and out of Level 1 and Level 2 will be required to be disclosed. The amended guidance is effective for financial statements for fiscal years beginning after December 15, 2011, and interim periods within those fiscal years. Management is evaluating the impact of this guidance on the Series’ financial statements and disclosures.
Security Transactions, Investment Income and Expenses
Security transactions are accounted for on trade date. Dividend income is recorded on the ex-dividend date, except that if the ex-dividend date has passed, certain dividends from foreign securities are recorded as soon as the Fund is informed of the ex-dividend date. Non-cash dividends, if any, are recorded at the fair market value of the securities received. Interest income, including amortization of premium and accretion of discounts using the effective interest method, is earned from settlement date and accrued daily.
Notes to Financial Statements (unaudited)
| 2. | SIGNIFICANT ACCOUNTING POLICIES (continued) |
Security Transactions, Investment Income and Expenses (continued)
Expenses are recorded on an accrual basis. Most expenses of the Fund can be attributed to a specific series. Expenses which cannot be directly attributed are apportioned among the series in the Fund in such a manner as deemed equitable by the Fund’s Board, taking into consideration, among other things, the nature and type of expense.
The Series uses the identified cost method for determining realized gain or loss on investments for both financial statement and federal income tax reporting purposes.
Federal Taxes
The Series’ policy is to comply with the provisions of the Internal Revenue Code applicable to regulated investment companies. The Series is not subject to federal income tax or excise tax to the extent that the Series distributes to shareholders each year its taxable income, including any net realized gains on investments, in accordance with requirements of the Internal Revenue Code. Accordingly, no provision for federal income tax or excise tax has been made in the financial statements.
Management evaluates its tax positions to determine if the tax positions taken meet the minimum recognition threshold in connection with accounting for uncertainties in income tax positions taken or expected to be taken for the purposes of measuring and recognizing tax liabilities in the financial statements. Recognition of tax benefits of an uncertain tax position is required only when the position is “more likely than not” to be sustained assuming examination by taxing authorities. At June 30, 2011, the Series has recorded no liability for net unrecognized tax benefits relating to uncertain income tax positions taken or expected to be taken in future tax returns.
The Series files income tax returns in the U.S. federal jurisdiction and various states, as required. No income tax returns are currently under investigation. The statute of limitations on the Series’ tax returns remains open for the years ended December 31, 2007 through December 31, 2010. The Fund is not aware of any tax positions for which it is reasonably possible that the total amounts of unrecognized tax benefits will significantly change in the next twelve months.
Distributions of Income and Gains
Distributions to shareholders of net investment income are made quarterly. Distributions of net realized gains are made annually. An additional distribution may be necessary to avoid taxation of the Series. Distributions are recorded on the ex-dividend date.
Indemnifications
The Fund’s organizational documents provide former and current directors and officers with a limited indemnification against liabilities arising in connection with the performance of their duties to the Fund. In the normal course of business, the Fund may also enter into contracts that provide general indemnifications. The Fund’s maximum exposure under these arrangements is unknown as this would be dependent on future claims that may be made against the Fund. The risk of material loss from such claims is considered remote.
Other
The preparation of financial statements in conformity with accounting principles generally accepted in the United States of America requires management to make estimates and assumptions that affect the reported amounts of assets and liabilities and the disclosure of contingent assets and liabilities at the date of the financial statements and the reported amounts of income and expenses during the reporting period. Actual results could differ from those estimates.
Notes to Financial Statements (unaudited)
| 3. | TRANSACTIONS WITH AFFILIATES |
The Fund has an Investment Advisory Agreement (the “Agreement”) with the Advisor, for which the Series pays a fee, computed daily and payable monthly, at an annual rate of 0.50% of the Series’ average daily net assets.
Under the Agreement, personnel of the Advisor provide the Series with advice and assistance in the choice of investments and the execution of securities transactions, and otherwise maintain the Series’ organization. The Advisor also provides the Fund with necessary office space and fund administration and support services. The salaries of all officers of the Fund (except a percentage of the Fund’s Chief Compliance Officer’s salary, which is paid by the Fund), and of all Directors who are “affiliated persons” of the Fund, or of the Advisor, and all personnel of the Fund, or of the Advisor, performing services relating to research, statistical and investment activities, are paid by the Advisor. Each “non-affiliated” Director receives an annual stipend, which is allocated among all the active series of the Fund. In addition, these Directors also receive a fee per Board meeting attended plus a fee for each committee meeting attended.
The Advisor has contractually agreed, until at least April 30, 2012, to waive its fee and, if necessary, pay other operating expenses of the Series in order to maintain total direct annual fund operating expenses for the Series at no more than 0.85% of average daily net assets each year. The Advisor did not waive any fees for the six months ended June 30, 2011. The Advisor is not eligible to recoup any expenses that have been waived or reimbursed in prior years.
Manning & Napier Investor Services, Inc., a registered broker-dealer affiliate of the Advisor, acts as distributor for the Fund’s shares. The services of Manning & Napier Investor Services, Inc. are provided at no additional cost to the Series.
The Advisor has agreements with BNY Mellon Investment Servicing (U.S.) Inc. (“BNY”) under which BNY serves as sub-accountant services agent and sub-transfer agent. The Fund pays the Advisor an annual fee related to fund accounting and administration of 0.0175% on the first $3 billion of average daily net assets (excluding Target Series);
0.015% on the next $3 billion of average daily net assets (excluding Target Series); and 0.01% of the average daily net assets in excess of $6 billion (excluding Target Series); plus a base fee of $25,500 per Series. Transfer Agent fees are charged to the Fund on a per account basis. Additionally, certain transaction- and cusip-based fees and out-of-pocket expenses, including charges for reporting relating to the Fund’s compliance program, are charged.
Expenses not directly attributable to a Series are allocated based on each Series’ relative net assets or number of accounts, depending on the expense.
| 4. | PURCHASES AND SALES OF SECURITIES |
For the six months ended June 30, 2011, purchases and sales of securities, other than U.S. Government securities and short-term securities, were $35,565,142 and $23,282,923, respectively. There were no purchases or sales of U.S. Government securities.
Notes to Financial Statements (unaudited)
| 5. | CAPITAL STOCK TRANSACTIONS |
Transactions in shares of New York Tax Exempt Series were:
| | | | | | | | | | | | | | | | | | | | |
| | | For the Six Months
Ended 6/30/11 | | For the Year
Ended 12/31/10 |
| | | Shares | | Amount | | Shares | | Amount |
Sold | | | | 1,645,301 | | | | $ | 16,816,034 | | | | | 3,733,646 | | | | $ | 39,811,439 | |
Reinvested | | | | 182,469 | | | | | 1,896,830 | | | | | 448,246 | | | | | 4,689,832 | |
Repurchased | | | | (374,598 | ) | | | | (3,859,382 | ) | | | | (1,293,178 | ) | | | | (13,640,209 | ) |
| | | | | | | | | | | | | | | | | | | | |
Total | | | | 1,453,172 | | | | $ | 14,853,482 | | | | | 2,888,714 | | | | $ | 30,861,062 | |
| | | | | | | | | | | | | | | | | | | | |
Substantially all of the Series’ shares represent investments by fiduciary accounts over which the Advisor has sole investment discretion.
The Series may trade in instruments including written and purchased options, forward foreign currency exchange contracts and futures contracts and other derivatives in the normal course of investing activities to assist in managing exposure to various market risks. The Series may be subject to various elements of risk, which may involve, to a varying degree, elements of risk in excess of the amounts recognized for financial statement purposes. These risks include: the risk that changes in the value of a derivative may not correlate perfectly with the underlying asset, rate or index, counterparty credit risk related to over the counter derivatives’ counterparties failure to perform under contract terms, liquidity risk related to the lack of a liquid market for these contracts allowing the fund to close out its position(s) and documentation risk relating to disagreement over contract terms. No such investments were held by the Series on June 30, 2011.
| 7. | CONCENTRATION OF CREDIT |
The Series primarily invests in debt obligations issued by the State of New York and its political subdivisions, agencies and public authorities to obtain funds for various public purposes. The Series is more susceptible to factors adversely affecting issues of New York municipal securities than is a municipal bond fund that is not concentrated in these issues to the same extent.
| 8. | FEDERAL INCOME TAX INFORMATION |
The amount and characterization of certain income and capital gains to be distributed are determined in accordance with federal income tax regulations, which may differ from accounting principles generally accepted in the United States of America. The Series may periodically make reclassifications among its capital accounts to reflect income and gains available for distribution (or available capital loss carryovers) under income tax regulations, without impacting the Series’ net asset value. Any such reclassifications are not reflected in the financial highlights.
The final determination of the tax character of current year distributions will be made at the conclusion of the fiscal year. The tax character of distributions paid for the year ended December 31, 2010 were as follows:
| | | | | |
Tax exempt income | | | $ | 4,858,448 | |
Long-term capital gains | | | | 112,341 | |
Notes to Financial Statements (unaudited)
| 8. | FEDERAL INCOME TAX INFORMATION (continued) |
At June 30, 2011, the identified cost of investments for federal income tax purposes, the resulting gross unrealized appreciation and depreciation, and the net unrealized appreciation were as follows:
| | | | | |
Cost for federal income tax purposes | | | $ | 153,986,848 | |
Unrealized appreciation | | | $ | 2,839,556 | |
Unrealized depreciation | | | | (862,864 | ) |
| | | | | |
Net unrealized appreciation | | | $ | 1,976,692 | |
| | | | | |
Literature Requests (unaudited)
Proxy Voting Policies and Procedures
A description of the policies and procedures that the Fund uses to determine how to vote proxies relating to portfolio securities is available, without charge, upon request:
| | |
| By phone | | 1-800-466-3863 |
| On the Securities and Exchange Commission’s | | |
| (SEC) web site | | http://www.sec.gov |
Proxy Voting Record
Information regarding how the Fund voted proxies relating to portfolio securities during the most recent 12-month period ended June 30th is available, without charge, upon request:
| | |
| By phone | | 1-800-466-3863 |
| On the SEC’s web site | | http://www.sec.gov |
Quarterly Portfolio Holdings
The Series’ complete schedule of portfolio holdings for the 1st and 3rd quarters of each fiscal year are provided on Form N-Q, and are available, without charge, upon request:
| | |
| By phone | | 1-800-466-3863 |
| On the SEC’s web site | | http://www.sec.gov |
The Series’ Form N-Q may be reviewed and copied at the SEC’s Public Reference Room in Washington, D.C. Information on the operation of the Public Reference Room may be obtained by calling 1-800-SEC-0330.
Prospectus and Statement of Additional Information (SAI)
The prospectus and SAI provide additional information about each Series, including charges, expenses and risks. These documents are available, without charge, upon request:
| | |
| By phone | | 1-800-466-3863 |
| On the SEC’s web site | | http://www.sec.gov |
| On our web site | | http://www.manning-napier.com |
Additional information available at www.manning-napier.com
1. Fund Holdings - Month-End
2. Fund Holdings - Quarter-End
3. Shareholder Report - Annual
4. Shareholder Report - Semi-Annual
The Fund also offers electronic notification or “e-delivery” when certain documents are available on-line to be downloaded or reviewed. Direct shareholders can elect to receive electronic notification when shareholder reports, prospectus updates, and / or quarterly statements are available. If you do not currently have on-line access to your account, you can establish access by going to www.manning-napier.com, click on “Login” in the top corner of the page, and follow the prompts to self-enroll. Once enrolled, you can set your electronic notification preferences by clicking on the Account Options tab located within the green toolbar and then select E-Delivery Option. Should you have any questions on either how to establish on-line access or how to update your account settings, please do not hesitate to contact Investor Services at 1-800-466-3863.
MNNYTES-6/11-SAR


Shareholder Expense Example (unaudited)
As a shareholder of the Series, you may incur two types of costs: (1) transaction costs and (2) ongoing costs, including management fees and other Series expenses. This example is intended to help you understand your ongoing costs (in dollars) of investing in the Series and to compare these costs with the ongoing costs of investing in other mutual funds.
The example is based on an investment of $1,000 invested at the beginning of the period and held for the entire period (January 1, 2011 to June 30, 2011).
Actual Expenses
The first line of the table below provides information about actual account values and actual expenses. You may use the information in this line, together with the amount you invested, to estimate the expenses that you paid over the period. Simply divide your account value by $1,000 (for example, an $8,600 account value divided by $1,000 = 8.6), then multiply the result by the number in the first line under the heading entitled “Expenses Paid During Period” to estimate the expenses you paid on your account during this period.
Hypothetical Example for Comparison Purposes
The second line of the table below provides information about hypothetical account values and hypothetical expenses based on the Series’ actual expense ratio and an assumed rate of return of 5% per year before expenses, which is not the Series’ actual return. The hypothetical account values and expenses may not be used to estimate the actual ending account balance or expenses you paid during the period. You may use this information to compare the ongoing costs of investing in the Series and other funds. To do so, compare this 5% hypothetical example with the 5% hypothetical examples that appear in the shareholder reports of the other funds.
Please note that the expenses shown in the table are meant to highlight your ongoing costs only and do not reflect any transaction costs. Therefore, the second line of the table is useful in comparing ongoing costs only, and will not help you determine the relative total costs of owning different funds. In addition, if these transaction costs were included, your costs would have been higher.
| | | | | | | | | | | | | | | |
| | | Beginning
Account Value
1/1/11 | | Ending
Account Value
6/30/11 | | Expenses Paid
During Period*
1/1/11-6/30/11 |
Actual | | | $ | 1,000.00 | | | | $ | 1,031.10 | | | | $ | 3.53 | |
Hypothetical
(5% return before expenses) | | | $ | 1,000.00 | | | | $ | 1,021.32 | | | | $ | 3.51 | |
| * | Expenses are equal to the Series’ annualized expense ratio (for the six-month period) of 0.70%, multiplied by the average account value over the period, multiplied by 181/365 (to reflect the one-half year period). Expenses are based on the most recent fiscal half year. |
Portfolio Composition
As of June 30, 2011 (unaudited)
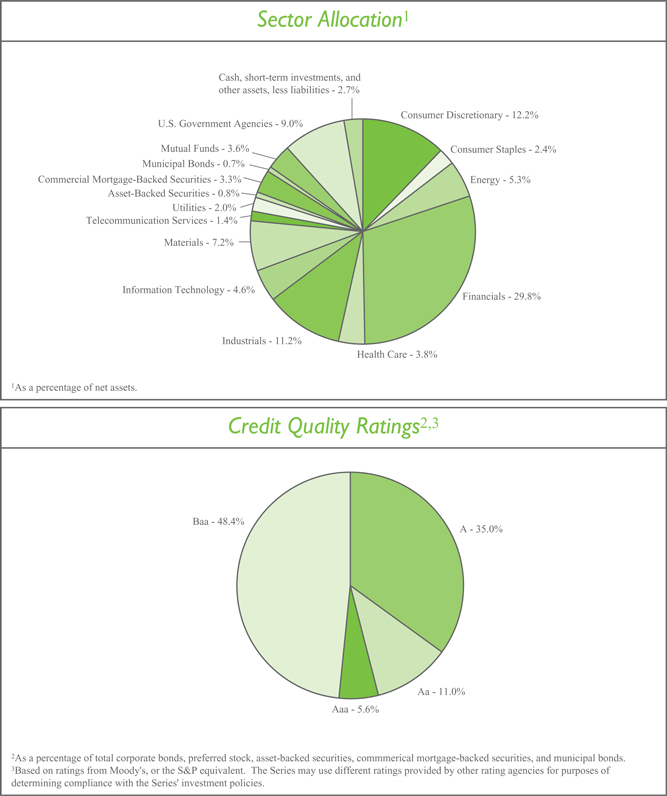
Investment Portfolio - June 30, 2011 (unaudited)
| | | | | | | | | | | | | | | |
| | | Credit
Rating1 | | Principal Amount | | Value
(Note 2) |
CORPORATE BONDS - 77.9% | | | | | | | | | | | | | | | |
| | | |
Convertible Corporate Bonds - 1.4% | | | | | | | | | | | | | | | |
Health Care - 0.4% | | | | | | | | | | | | | | | |
Biotechnology - 0.3% | | | | | | | | | | | | | | | |
Amgen, Inc., 0.375%, 2/1/2013 | | | | A3 | | | | $ | 530,000 | | | | $ | 531,987 | |
| | | | | | | | | | | | | | | |
Health Care Equipment & Supplies - 0.1% | | | | | | | | | | | | | | | |
Medtronic, Inc., 1.625%, 4/15/2013 | | | | A1 | | | | | 120,000 | | | | | 122,700 | |
| | | | | | | | | | | | | | | |
Total Health Care | | | | | | | | | | | | | | 654,687 | |
| | | | | | | | | | | | | | | |
Information Technology - 1.0% | | | | | | | | | | | | | | | |
Computers & Peripherals - 1.0% | | | | | | | | | | | | | | | |
EMC Corp., 1.75%, 12/1/2013 | | | | A | 2 | | | | 870,000 | | | | | 1,524,675 | |
| | | | | | | | | | | | | | | |
Total Convertible Corporate Bonds
(Identified Cost $1,966,025) | | | | | | | | | | | | | | 2,179,362 | |
| | | | | | | | | | | | | | | |
Non-Convertible Corporate Bonds - 76.5% | | | | | | | | | | | | | | | |
Consumer Discretionary - 12.2% | | | | | | | | | | | | | | | |
Hotels, Restaurants & Leisure - 2.1% | | | | | | | | | | | | | | | |
International Game Technology, 7.50%, 6/15/2019 | | | | Baa2 | | | | | 1,750,000 | | | | | 2,000,752 | |
Yum! Brands, Inc., 3.875%, 11/1/2020 | | | | Baa3 | | | | | 1,250,000 | | | | | 1,213,335 | |
| | | | | | | | | | | | | | | |
| | | | | | | | | | | | | | 3,214,087 | |
| | | | | | | | | | | | | | | |
Household Durables - 2.1% | | | | | | | | | | | | | | | |
Newell Rubbermaid, Inc., 4.70%, 8/15/2020 | | | | Baa3 | | | | | 1,345,000 | | | | | 1,354,258 | |
Tupperware Brands Corp.3 , 4.75%, 6/1/2021 | | | | Baa3 | | | | | 2,000,000 | | | | | 1,972,128 | |
| | | | | | | | | | | | | | | |
| | | | | | | | | | | | | | 3,326,386 | |
| | | | | | | | | | | | | | | |
Media - 3.8% | | | | | | | | | | | | | | | |
DIRECTV Holdings LLC - DIRECTV Financing Co., Inc., 5.20%, 3/15/2020 | | | | Baa2 | | | | | 1,280,000 | | | | | 1,354,353 | |
Discovery Communications LLC, 5.05%, 6/1/2020 | | | | Baa2 | | | | | 1,275,000 | | | | | 1,350,094 | |
NBC Universal Media LLC3 , 5.15%, 4/30/2020 | | | | Baa2 | | | | | 1,540,000 | | | | | 1,626,089 | |
Time Warner, Inc., 4.75%, 3/29/2021 | | | | Baa2 | | | | | 1,110,000 | | | | | 1,129,150 | |
The Walt Disney Co., 5.50%, 3/15/2019 | | | | A2 | | | | | 500,000 | | | | | 573,137 | |
| | | | | | | | | | | | | | | |
| | | | | | | | | | | | | | 6,032,823 | |
| | | | | | | | | | | | | | | |
Multiline Retail - 0.7% | | | | | | | | | | | | | | | |
Target Corp., 6.00%, 1/15/2018 | | | | A2 | | | | | 670,000 | | | | | 774,241 | |
Target Corp., 3.875%, 7/15/2020 | | | | A2 | | | | | 335,000 | | | | | 334,138 | |
| | | | | | | | | | | | | | | |
| | | | | | | | | | | | | | 1,108,379 | |
| | | | | | | | | | | | | | | |
Specialty Retail - 3.1% | | | | | | | | | | | | | | | |
AutoZone, Inc., 4.00%, 11/15/2020 | | | | Baa2 | | | | | 1,415,000 | | | | | 1,352,102 | |
Best Buy Co., Inc., 5.50%, 3/15/2021 | | | | Baa2 | | | | | 1,000,000 | | | | | 984,582 | |
The Home Depot, Inc., 5.40%, 3/1/2016 | | | | Baa1 | | | | | 1,065,000 | | | | | 1,190,046 | |
Lowe’s Companies, Inc., 6.10%, 9/15/2017 | | | | A1 | | | | | 745,000 | | | | | 876,098 | |
| | | | | | |
| | The accompanying notes are an integral part of the financial statements. | | | 3 | |
Investment Portfolio - June 30, 2011 (unaudited)
| | | | | | | | | | | | | | | |
| | | Credit
Rating1 | | Principal Amount | | Value
(Note 2) |
CORPORATE BONDS (continued) | | | | | | | | | | | | | | | |
| | | |
Non-Convertible Corporate Bonds (continued) | | | | | | | | | | | | | | | |
Consumer Discretionary (continued) | | | | | | | | | | | | | | | |
Specialty Retail (continued) | | | | | | | | | | | | | | | |
O’Reilly Automotive, Inc., 4.875%, 1/14/2021 | | | | Baa3 | | | | $ | 500,000 | | | | $ | 502,424 | |
| | | | | | | | | | | | | | | |
| | | | | | | | | | | | | | 4,905,252 | |
| | | | | | | | | | | | | | | |
Textiles, Apparel & Luxury Goods - 0.4% | | | | | | | | | | | | | | | |
VF Corp., 5.95%, 11/1/2017 | | | | A3 | | | | | 485,000 | | | | | 560,228 | |
| | | | | | | | | | | | | | | |
Total Consumer Discretionary | | | | | | | | | | | | | | 19,147,155 | |
| | | | | | | | | | | | | | | |
Consumer Staples - 2.4% | | | | | | | | | | | | | | | |
Beverages - 0.6% | | | | | | | | | | | | | | | |
PepsiCo, Inc., 7.90%, 11/1/2018 | | | | Aa3 | | | | | 775,000 | | | | | 998,782 | |
| | | | | | | | | | | | | | | |
Food Products - 1.8% | | | | | | | | | | | | | | | |
General Mills, Inc., 5.65%, 2/15/2019 | | | | Baa1 | | | | | 765,000 | | | | | 863,753 | |
Grupo Bimbo SAB de CV (Mexico)3 , 4.875%, 6/30/2020 | | | | Baa2 | | | | | 500,000 | | | | | 501,692 | |
Kraft Foods, Inc., 6.125%, 2/1/2018 | | | | Baa2 | | | | | 565,000 | | | | | 649,996 | |
Kraft Foods, Inc., 5.375%, 2/10/2020 | | | | Baa2 | | | | | 680,000 | | | | | 743,375 | |
| | | | | | | | | | | | | | | |
| | | | | | | | | | | | | | 2,758,816 | |
| | | | | | | | | | | | | | | |
Total Consumer Staples | | | | | | | | | | | | | | 3,757,598 | |
| | | | | | | | | | | | | | | |
Energy - 5.3% | | | | | | | | | | | | | | | |
Energy Equipment & Services - 3.3% | | | | | | | | | | | | | | | |
Baker Hughes, Inc., 7.50%, 11/15/2018 | | | | A2 | | | | | 620,000 | | | | | 781,673 | |
Schlumberger Oilfield plc (United Kingdom)3 , 4.20%, 1/15/2021 | | | | A1 | | | | | 1,465,000 | | | | | 1,481,283 | |
Weatherford International Ltd. (Switzerland), 9.625%, 3/1/2019 | | | | Baa2 | | | | | 2,295,000 | | | | | 2,963,859 | |
| | | | | | | | | | | | | | | |
| | | | | | | | | | | | | | 5,226,815 | |
| | | | | | | | | | | | | | | |
Oil, Gas & Consumable Fuels - 2.0% | | | | | | | | | | | | | | | |
Apache Corp., 6.90%, 9/15/2018 | | | | A3 | | | | | 630,000 | | | | | 763,912 | |
Hess Corp., 5.60%, 2/15/2041 | | | | Baa2 | | | | | 1,375,000 | | | | | 1,344,013 | |
Shell International Finance B.V. (Netherlands), 4.30%, 9/22/2019 | | | | Aa1 | | | | | 1,000,000 | | | | | 1,050,205 | |
| | | | | | | | | | | | | | | |
| | | | | | | | | | | | | | 3,158,130 | |
| | | | | | | | | | | | | | | |
Total Energy | | | | | | | | | | | | | | 8,384,945 | |
| | | | | | | | | | | | | | | |
Financials - 27.8% | | | | | | | | | | | | | | | |
Capital Markets - 7.1% | | | | | | | | | | | | | | | |
The Charles Schwab Corp., 4.45%, 7/22/2020 | | | | A2 | | | | | 1,320,000 | | | | | 1,350,786 | |
Credit Suisse AG (Switzerland)3 , 2.60%, 5/27/2016 | | | | Aaa | | | | | 1,205,000 | | | | | 1,202,132 | |
Goldman Sachs Capital I, 6.345%, 2/15/2034 | | | | A3 | | | | | 1,050,000 | | | | | 992,945 | |
Goldman Sachs Capital II4 , 5.793%, 12/29/2049 | | | | Baa2 | | | | | 1,565,000 | | | | | 1,252,000 | |
The Goldman Sachs Group, Inc., 6.15%, 4/1/2018 | | | | A1 | | | | | 690,000 | | | | | 750,957 | |
The Goldman Sachs Group, Inc., 5.375%, 3/15/2020 | | | | A1 | | | | | 935,000 | | | | | 965,523 | |
Jefferies Group, Inc., 8.50%, 7/15/2019 | | | | Baa2 | | | | | 1,110,000 | | | | | 1,312,781 | |
Morgan Stanley, 5.55%, 4/27/2017 | | | | A2 | | | | | 1,727,000 | | | | | 1,830,698 | |
| | | | |
| 4 | | The accompanying notes are an integral part of the financial statements. | | |
Investment Portfolio - June 30, 2011 (unaudited)
| | | | | | | | | | | | | | | |
| | | Credit
Rating1 | | Principal Amount | | Value
(Note 2) |
CORPORATE BONDS (continued) | | | | | | | | | | | | | | | |
| | | |
Non-Convertible Corporate Bonds (continued) | | | | | | | | | | | | | | | |
Financials (continued) | | | | | | | | | | | | | | | |
Capital Markets (continued) | | | | | | | | | | | | | | | |
Morgan Stanley, 5.75%, 1/25/2021 | | | | A2 | | | | $ | 1,500,000 | | | | $ | 1,517,743 | |
| | | | | | | | | | | | | | | |
| | | | | | | | | | | | | | 11,175,565 | |
| | | | | | | | | | | | | | | |
Commercial Banks - 8.4% | | | | | | | | | | | | | | | |
Household Finance Co., 6.375%, 11/27/2012 | | | | A3 | | | | | 785,000 | | | | | 839,810 | |
HSBC Finance Corp., 7.00%, 5/15/2012 | | | | A3 | | | | | 1,025,000 | | | | | 1,079,559 | |
Intesa Sanpaolo S.p.A. (Italy)3 , 6.50%, 2/24/2021 | | | | Aa3 | | | | | 1,545,000 | | | | | 1,611,319 | |
KeyBank National Association, 5.45%, 3/3/2016 | | | | Baa1 | | | | | 1,050,000 | | | | | 1,139,151 | |
Manufacturers & Traders Trust Co., 6.625%, 12/4/2017 | | | | A3 | | | | | 1,480,000 | | | | | 1,699,796 | |
National City Corp., 6.875%, 5/15/2019 | | | | Baa1 | | | | | 500,000 | | | | | 576,197 | |
PNC Bank National Association, 5.25%, 1/15/2017 | | | | A3 | | | | | 880,000 | | | | | 955,348 | |
Santander Holdings USA, Inc., 4.625%, 4/19/2016 | | | | Baa1 | | | | | 750,000 | | | | | 753,724 | |
Santander Issuances S.A. Unipersonal (Spain)3 , 5.911%, 6/20/2016 | | | | Aa3 | | | | | 1,500,000 | | | | | 1,526,573 | |
Societe Generale S.A. (France)3 , 5.75%, 4/20/2016 | | | | Aa3 | | | | | 1,540,000 | | | | | 1,538,765 | |
Wachovia Bank National Association, 5.60%, 3/15/2016 | | | | Aa3 | | | | | 450,000 | | | | | 487,154 | |
Wachovia Corp., 5.25%, 8/1/2014 | | | | A2 | | | | | 945,000 | | | | | 1,012,912 | |
| | | | | | | | | | | | | | | |
| | | | | | | | | | | | | | 13,220,308 | |
| | | | | | | | | | | | | | | |
Consumer Finance - 0.9% | | | | | | | | | | | | | | | |
American Express Co., 8.125%, 5/20/2019 | | | | A3 | | | | | 1,090,000 | | | | | 1,381,888 | |
| | | | | | | | | | | | | | | |
Diversified Financial Services - 3.5% | | | | | | | | | | | | | | | |
Bank of America Corp., 7.625%, 6/1/2019 | | | | A2 | | | | | 1,150,000 | | | | | 1,332,151 | |
Bank of America Corp.5 , 5.13%, 2/24/2026 | | | | A2 | | | | | 1,415,000 | | | | | 1,379,765 | |
Citigroup, Inc., 8.50%, 5/22/2019 | | | | A3 | | | | | 1,190,000 | | | | | 1,475,189 | |
JPMorgan Chase & Co., 6.30%, 4/23/2019 | | | | Aa3 | | | | | 1,180,000 | | | | | 1,330,020 | |
| | | | | | | | | | | | | | | |
| | | | | | | | | | | | | | 5,517,125 | |
| | | | | | | | | | | | | | | |
Insurance - 1.3% | | | | | | | | | | | | | | | |
American International Group, Inc., 4.25%, 5/15/2013 | | | | Baa1 | | | | | 660,000 | | | | | 678,462 | |
Fidelity National Financial, Inc., 6.60%, 5/15/2017 | | | | Baa3 | | | | | 1,260,000 | | | | | 1,329,987 | |
| | | | | | | | | | | | | | | |
| | | | | | | | | | | | | | 2,008,449 | |
| | | | | | | | | | | | | | | |
Real Estate Investment Trusts (REITS) - 6.6% | | | | | | | | | | | | | | | |
BioMed Realty LP, 3.85%, 4/15/2016 | | | | Baa3 | | | | | 740,000 | | | | | 745,839 | |
Boston Properties LP, 5.875%, 10/15/2019 | | | | Baa2 | | | | | 935,000 | | | | | 1,024,422 | |
Boston Properties LP, 5.625%, 11/15/2020 | | | | Baa2 | | | | | 300,000 | | | | | 320,468 | |
Camden Property Trust, 5.70%, 5/15/2017 | | | | Baa1 | | | | | 780,000 | | | | | 859,160 | |
Digital Realty Trust LP, 5.875%, 2/1/2020 | | | | Baa2 | | | | | 1,305,000 | | | | | 1,368,174 | |
Digital Realty Trust LP, 5.25%, 3/15/2021 | | | | Baa2 | | | | | 45,000 | | | | | 44,766 | |
HCP, Inc., 6.70%, 1/30/2018 | | | | Baa2 | | | | | 1,315,000 | | | | | 1,470,091 | |
Health Care REIT, Inc., 6.20%, 6/1/2016 | | | | Baa2 | | | | | 375,000 | | | | | 416,367 | |
| | | | | | |
| | The accompanying notes are an integral part of the financial statements. | | | 5 | |
Investment Portfolio - June 30, 2011 (unaudited)
| | | | | | | | | | | | | | | |
| | | Credit
Rating1 | | Principal Amount | | Value
(Note 2) |
CORPORATE BONDS (continued) | | | | | | | | | | | | | | | |
| | | |
Non-Convertible Corporate Bonds (continued) | | | | | | | | | | | | | | | |
Financials (continued) | | | | | | | | | | | | | | | |
Real Estate Investment Trusts (REITS) (continued) | | | | | | | | | | | | | | | |
Health Care REIT, Inc., 4.95%, 1/15/2021 | | | | Baa2 | | | | $ | 990,000 | | | | $ | 964,579 | |
Mack-Cali Realty LP, 7.75%, 8/15/2019 | | | | Baa2 | | | | | 735,000 | | | | | 884,208 | |
National Retail Properties, Inc., 6.875%, 10/15/2017 | | | | Baa2 | | | | | 890,000 | | | | | 992,678 | |
Simon Property Group LP, 10.35%, 4/1/2019 | | | | A3 | | | | | 990,000 | | | | | 1,370,369 | |
| | | | | | | | | | | | | | | |
| | | | | | | | | | | | | | 10,461,121 | |
| | | | | | | | | | | | | | | |
Total Financials | | | | | | | | | | | | | | 43,764,456 | |
| | | | | | | | | | | | | | | |
Health Care - 3.4% | | | | | | | | | | | | | | | |
Biotechnology - 0.6% | | | | | | | | | | | | | | | |
Amgen, Inc., 5.85%, 6/1/2017 | | | | A3 | | | | | 500,000 | | | | | 578,979 | |
Amgen, Inc., 3.45%, 10/1/2020 | | | | A3 | | | | | 370,000 | | | | | 352,799 | |
| | | | | | | | | | | | | | | |
| | | | | | | | | | | | | | 931,778 | |
| | | | | | | | | | | | | | | |
Health Care Equipment & Supplies - 0.4% | | | | | | | | | | | | | | | |
CR Bard, Inc., 4.40%, 1/15/2021 | | | | A3 | | | | | 655,000 | | | | | 674,597 | |
| | | | | | | | | | | | | | | |
Health Care Providers & Services - 0.7% | | | | | | | | | | | | | | | |
UnitedHealth Group, Inc., 4.70%, 2/15/2021 | | | | Baa1 | | | | | 1,000,000 | | | | | 1,042,533 | |
| | | | | | | | | | | | | | | |
Life Sciences Tools & Services - 0.4% | | | | | | | | | | | | | | | |
Thermo Fisher Scientific, Inc., 4.50%, 3/1/2021 | | | | A3 | | | | | 600,000 | | | | | 618,554 | |
| | | | | | | | | | | | | | | |
Pharmaceuticals - 1.3% | | | | | | | | | | | | | | | |
Abbott Laboratories, 5.60%, 11/30/2017 | | | | A1 | | | | | 675,000 | | | | | 782,260 | |
Novartis Securities Investment Ltd. (Bermuda), 5.125%, 2/10/2019 | | | | Aa2 | | | | | 1,215,000 | | | | | 1,349,226 | |
| | | | | | | | | | | | | | | |
| | | | | | | | | | | | | | 2,131,486 | |
| | | | | | | | | | | | | | | |
Total Health Care | | | | | | | | | | | | | | 5,398,948 | |
| | | | | | | | | | | | | | | |
Industrials - 11.2% | | | | | | | | | | | | | | | |
Aerospace & Defense - 1.1% | | | | | | | | | | | | | | | |
The Boeing Co., 6.00%, 3/15/2019 | | | | A2 | | | | | 870,000 | | | | | 1,009,906 | |
Honeywell International, Inc., 5.30%, 3/1/2018 | | | | A2 | | | | | 690,000 | | | | | 775,268 | |
| | | | | | | | | | | | | | | |
| | | | | | | | | | | | | | 1,785,174 | |
| | | | | | | | | | | | | | | |
Air Freight & Logistics - 0.6% | | | | | | | | | | | | | | | |
FedEx Corp., 8.00%, 1/15/2019 | | | | Baa2 | | | | | 790,000 | | | | | 992,778 | |
| | | | | | | | | | | | | | | |
Airlines - 1.5% | | | | | | | | | | | | | | | |
Continental Airlines Pass-Through Trust, Series 1997-4, Class A, 6.90%, 1/2/2018 | | | | Baa2 | | | | | 281,729 | | | | | 298,266 | |
Delta Air Lines Pass-Through Trust, Series 2001-1, Class A-2, 7.111%, 9/18/2011 | | | | BBB | 2 | | | | 295,000 | | | | | 298,304 | |
Delta Air Lines Pass-Through Trust, Series 2007-1, Class A, 6.821%, 8/10/2022 | | | | Baa1 | | | | | 160,904 | | | | | 167,340 | |
| | | | |
| 6 | | The accompanying notes are an integral part of the financial statements. | | |
Investment Portfolio - June 30, 2011 (unaudited)
| | | | | | | | | | | | | | | |
| | | Credit
Rating1 | | Principal Amount | | Value
(Note 2) |
CORPORATE BONDS (continued) | | | | | | | | | | | | | | | |
| | | |
Non-Convertible Corporate Bonds (continued) | | | | | | | | | | | | | | | |
Industrials (continued) | | | | | | | | | | | | | | | |
Airlines (continued) | | | | | | | | | | | | | | | |
Delta Air Lines Pass-Through Trust, Series 2010-1, Class A, 6.20%, 7/2/2018 | | | | Baa2 | | | | $ | 494,146 | | | | $ | 515,147 | |
Southwest Airlines Co., 5.25%, 10/1/2014 | | | | Baa3 | | | | | 910,000 | | | | | 984,674 | |
| | | | | | �� | | | | | | | | | |
| | | | | | | | | | | | | | 2,263,731 | |
| | | | | | | | | | | | | | | |
Commercial Services & Supplies - 0.7% | | | | | | | | | | | | | | | |
Waste Management, Inc., 7.375%, 3/11/2019 | | | | Baa3 | | | | | 830,000 | | | | | 1,008,217 | |
| | | | | | | | | | | | | | | |
Industrial Conglomerates - 3.9% | | | | | | | | | | | | | | | |
GE Capital Trust I4 , 6.375%, 11/15/2067 | | | | Aa3 | | | | | 1,145,000 | | | | | 1,172,194 | |
General Electric Capital Corp., 5.625%, 5/1/2018 | | | | Aa2 | | | | | 350,000 | | | | | 382,801 | |
General Electric Capital Corp., 5.50%, 1/8/2020 | | | | Aa2 | | | | | 320,000 | | | | | 342,687 | |
General Electric Capital Corp., Series A, 6.75%, 3/15/2032 | | | | Aa2 | | | | | 1,220,000 | | | | | 1,355,483 | |
General Electric Co., 5.25%, 12/6/2017 | | | | Aa2 | | | | | 370,000 | | | | | 409,895 | |
Textron, Inc., 7.25%, 10/1/2019 | | | | Baa3 | | | | | 1,245,000 | | | | | 1,463,713 | |
Tyco Electronics Group S.A. (Luxembourg), 4.875%, 1/15/2021 | | | | Baa2 | | | | | 975,000 | | | | | 1,010,859 | |
| | | | | | | | | | | | | | | |
| | | | | | | | | | | | | | 6,137,632 | |
| | | | | | | | | | | | | | | |
Machinery - 1.9% | | | | | | | | | | | | | | | |
Caterpillar Financial Services Corp., 7.05%, 10/1/2018 | | | | A2 | | | | | 1,095,000 | | | | | 1,336,975 | |
John Deere Capital Corp., 5.50%, 4/13/2017 | | | | A2 | | | | | 225,000 | | | | | 258,219 | |
John Deere Capital Corp., 5.75%, 9/10/2018 | | | | A2 | | | | | 1,245,000 | | | | | 1,429,209 | |
| | | | | | | | | | | | | | | |
| | | | | | | | | | | | | | 3,024,403 | |
| | | | | | | | | | | | | | | |
Road & Rail - 1.5% | | | | | | | | | | | | | | | |
JB Hunt Transport Services, Inc., 3.375%, 9/15/2015 | | | | Baa3 | | | | | 1,595,000 | | | | | 1,610,944 | |
Union Pacific Corp., 5.65%, 5/1/2017 | | | | Baa2 | | | | | 705,000 | | | | | 798,134 | |
| | | | | | | | | | | | | | | |
| | | | | | | | | | | | | | 2,409,078 | |
| | | | | | | | | | | | | | | |
Total Industrials | | | | | | | | | | | | | | 17,621,013 | |
| | | | | | | | | | | | | | | |
Information Technology - 3.6% | | | | | | | | | | | | | | | |
Computers & Peripherals - 1.3% | | | | | | | | | | | | | | | |
Dell, Inc., 5.875%, 6/15/2019 | | | | A2 | | | | | 1,055,000 | | | | | 1,183,932 | |
Hewlett-Packard Co., 5.50%, 3/1/2018 | | | | A2 | | | | | 680,000 | | | | | 760,451 | |
| | | | | | | | | | | | | | | |
| | | | | | | | | | | | | | 1,944,383 | |
| | | | | | | | | | | | | | | |
Electronic Equipment, Instruments & Components - 0.8% | | | | | | | | | | | | | | | |
Corning, Inc., 6.625%, 5/15/2019 | | | | Baa1 | | | | | 650,000 | | | | | 757,020 | |
Corning, Inc., 4.25%, 8/15/2020 | | | | Baa1 | | | | | 500,000 | | | | | 501,933 | |
| | | | | | | | | | | | | | | |
| | | | | | | | | | | | | | 1,258,953 | |
| | | | | | | | | | | | | | | |
IT Services - 0.6% | | | | | | | | | | | | | | | |
The Western Union Co., 5.253%, 4/1/2020 | | | | A3 | | | | | 945,000 | | | | | 995,234 | |
| | | | | | | | | | | | | | | |
| | | | | | |
| | The accompanying notes are an integral part of the financial statements. | | | 7 | |
Investment Portfolio - June 30, 2011 (unaudited)
| | | | | | | | | | | | | | | |
| | | Credit
Rating1 | | Principal Amount | | Value
(Note 2) |
CORPORATE BONDS (continued) | | | | | | | | | | | | | | | |
| | | |
Non-Convertible Corporate Bonds (continued) | | | | | | | | | | | | | | | |
Information Technology (continued) | | | | | | | | | | | | | | | |
Software - 0.9% | | | | | | | | | | | | | | | |
Oracle Corp., 5.00%, 7/8/2019 | | | | A1 | | | | $ | 700,000 | | | | $ | 764,176 | |
Oracle Corp.3 , 3.875%, 7/15/2020 | | | | A1 | | | | | 675,000 | | | | | 670,724 | |
| | | | | | | | | | | | | | | |
| | | | | | | | | | | | | | 1,434,900 | |
| | | | | | | | | | | | | | | |
Total Information Technology | | | | | | | | | | | | | | 5,633,470 | |
| | | | | | | | | | | | | | | |
Materials - 7.2% | | | | | | | | | | | | | | | |
Chemicals - 0.6% | | | | | | | | | | | | | | | |
E.I. du Pont de Nemours & Co., 6.00%, 7/15/2018 | | | | A2 | | | | | 885,000 | | | | | 1,021,255 | |
| | | | | | | | | | | | | | | |
Metals & Mining - 5.2% | | | | | | | | | | | | | | | |
Alcoa, Inc., 5.87%, 2/23/2022 | | | | Baa3 | | | | | 1,635,000 | | | | | 1,675,409 | |
Allegheny Technologies, Inc., 5.95%, 1/15/2021 | | | | Baa3 | | | | | 1,625,000 | | | | | 1,729,676 | |
ArcelorMittal (Luxembourg), 5.50%, 3/1/2021 | | | | Baa3 | | | | | 2,225,000 | | | | | 2,228,473 | |
BHP Billiton Finance (USA) Ltd. (Australia), 6.50%, 4/1/2019 | | | | A1 | | | | | 810,000 | | | | | 969,262 | |
Cliffs Natural Resources, Inc., 4.80%, 10/1/2020 | | | | Baa3 | | | | | 1,505,000 | | | | | 1,512,928 | |
| | | | | | | | | | | | | | | |
| | | | | | | | | | | | | | 8,115,748 | |
| | | | | | | | | | | | | | | |
Paper & Forest Products - 1.4% | | | | | | | | | | | | | | | |
International Paper Co., 7.50%, 8/15/2021 | | | | Baa3 | | | | | 1,885,000 | | | | | 2,203,271 | |
| | | | | | | | | | | | | | | |
Total Materials | | | | | | | | | | | | | | 11,340,274 | |
| | | | | | | | | | | | | | | |
Telecommunication Services - 1.4% | | | | | | | | | | | | | | | |
Diversified Telecommunication Services - 0.5% | | | | | | | | | | | | | | | |
Verizon Communications, Inc., 3.00%, 4/1/2016 | | | | A3 | | | | | 745,000 | | | | | 760,953 | |
| | | | | | | | | | | | | | | |
Wireless Telecommunication Services - 0.9% | | | | | | | | | | | | | | | |
Crown Castle Towers LLC3 , 6.113%, 1/15/2020 | | | | A2 | | | | | 745,000 | | | | | 812,884 | |
Crown Castle Towers LLC3 , 4.883%, 8/15/2020 | | | | A2 | | | | | 250,000 | | | | | 251,381 | |
SBA Tower Trust3 , 5.101%, 4/15/2017 | | | | A2 | | | | | 375,000 | | | | | 390,937 | |
| | | | | | | | | | | | | | | |
| | | | | | | | | | | | | | 1,455,202 | |
| | | | | | | | | | | | | | | |
Total Telecommunication Services | | | | | | | | | | | | | | 2,216,155 | |
| | | | | | | | | | | | | | | |
Utilities - 2.0% | | | | | | | | | | | | | | | |
Electric Utilities - 1.8% | | | | | | | | | | | | | | | |
Exelon Generation Co. LLC, 5.35%, 1/15/2014 | | | | A3 | | | | | 580,000 | | | | | 627,757 | |
Exelon Generation Co. LLC, 6.20%, 10/1/2017 | | | | A3 | | | | | 350,000 | | | | | 394,838 | |
Exelon Generation Co. LLC, 4.00%, 10/1/2020 | | | | A3 | | | | | 865,000 | | | | | 816,403 | |
Southwestern Electric Power Co., 6.45%, 1/15/2019 | | | | Baa3 | | | | | 855,000 | | | | | 968,700 | |
| | | | | | | | | | | | | | | |
| | | | | | | | | | | | | | 2,807,698 | |
| | | | | | | | | | | | | | | |
| | | | |
| 8 | | The accompanying notes are an integral part of the financial statements. | | |
Investment Portfolio - June 30, 2011 (unaudited)
| | | | | | | | | | | | | | | |
| | | Credit
Rating1 | | Principal Amount/
Shares | | Value
(Note 2) |
CORPORATE BONDS (continued) | | | | | | | | | | | | | | | |
| | | |
Non-Convertible Corporate Bonds (continued) | | | | | | | | | | | | | | | |
Utilities (continued) | | | | | | | | | | | | | | | |
Multi-Utilities - 0.2% | | | | | | | | | | | | | | | |
CenterPoint Energy Resources Corp., Series B, 7.875%, 4/1/2013 | | | | Baa2 | | | | $ | 335,000 | | | | $ | 372,405 | |
| | | | | | | | | | | | | | | |
Total Utilities | | | | | | | | | | | | | | 3,180,103 | |
| | | | | | | | | | | | | | | |
Total Non-Convertible Corporate Bonds
(Identified Cost $114,271,285) | | | | | | | | | | | | | | 120,444,117 | |
| | | | | | | | | | | | | | | |
TOTAL CORPORATE BONDS
(Identified Cost $116,237,310) | | | | | | | | | | | | | | 122,623,479 | |
| | | | | | | | | | | | | | | |
| | | |
PREFERRED STOCKS - 2.0% | | | | | | | | | | | | | | | |
| | | |
Financials - 2.0% | | | | | | | | | | | | | | | |
Commercial Banks - 0.9% | | | | | | | | | | | | | | | |
PNC Financial Services Group, Inc., Series K6 , 8.25% | | | | Baa3 | | | | | 290,000 | | | | | 306,744 | |
Wells Fargo & Co., Series K6 , 7.98% | | | | Baa3 | | | | | 1,000,000 | | | | | 1,080,000 | |
| | | | | | | | | | | | | | | |
| | | | | | | | | | | | | | 1,386,744 | |
| | | | | | | | | | | | | | | |
Diversified Financial Services - 0.6% | | | | | | | | | | | | | | | |
JPMorgan Chase & Co., Series 16 , 7.90% | | | | Baa1 | | | | | 965,000 | | | | | 1,036,497 | |
| | | | | | | | | | | | | | | |
Real Estate Investment Trusts (REITS) - 0.5% | | | | | | | | | | | | | | | |
Public Storage, Series Q, 6.50% | | | | Baa1 | | | | | 29,910 | | | | | 766,294 | |
| | | | | | | | | | | | | | | |
TOTAL PREFERRED STOCKS
(Identified Cost $3,057,235) | | | | | | | | | | | | | | 3,189,535 | |
| | | | | | | | | | | | | | | |
| | | |
ASSET-BACKED SECURITIES - 0.8% | | | | | | | | | | | | | | | |
Capital Auto Receivables Asset Trust, Series 2007-1, Class A4A, 5.01%, 4/16/2012 | | | | Aaa | | | | $ | 4,533 | | | | | 4,549 | |
Capital Auto Receivables Asset Trust, Series 2007-3, Class A4, 5.21%, 3/17/2014 | | | | Aaa | | | | | 14,992 | | | | | 15,201 | |
Ford Credit Auto Owner Trust, Series 2008-C, Class A4B4 , 1.937%, 4/15/2013 | | | | Aaa | | | | | 50,000 | | | | | 50,371 | |
GMAC Mortgage Servicer Advance Funding Co. Ltd., Series 2011-1A, Class A3 , 3.72%, 3/15/2023 | | | | Aaa | | | | | 100,000 | | | | | 100,750 | |
Hertz Vehicle Financing LLC, Series 2009-2A, Class A23 , 5.29%, 3/25/2016 | | | | Aaa | | | | | 370,000 | | | | | 405,737 | |
Hertz Vehicle Financing LLC, Series 2010-1A, Class A23 , 3.74%, 2/25/2017 | | | | Aaa | | | | | 595,000 | | | | | 614,216 | |
| | | | | | | | | | | | | | | |
TOTAL ASSET-BACKED SECURITIES
(Identified Cost $1,130,465) | | | | | | | | | | | | | | 1,190,824 | |
| | | | | | | | | | | | | | | |
| | | | | | |
| | The accompanying notes are an integral part of the financial statements. | | | 9 | |
Investment Portfolio - June 30, 2011 (unaudited)
| | | | | | | | | | | | | | | |
| | | Credit
Rating1 | | Principal Amount | | Value
(Note 2) |
COMMERCIAL MORTGAGE-BACKED SECURITIES - 3.3% | | | | | | | | | | | | | | | |
American Tower Trust, Series 2007-1A, Class AFX3 , 5.42%, 4/15/2037 | | | | Aaa | | | | $ | 400,000 | | | | $ | 430,477 | |
Americold LLC Trust, Series 2010-ARTA, Class A13 , 3.847%, 1/14/2029 | | | | AAA | 2 | | | | 96,746 | | | | | 98,686 | |
Banc of America Commercial Mortgage, Inc., Series 2006-2, Class A44 , 5.731%, 5/10/2045 | | | | AAA | 2 | | | | 200,000 | | | | | 221,335 | |
Banc of America Commercial Mortgage, Inc., Series 2006-4, Class A4, 5.634%, 7/10/2046 | | | | Aaa | | | | | 100,000 | | | | | 109,417 | |
Bear Stearns Commercial Mortgage Securities, Series 2005-PWR9, Class A4A, 4.871%, 9/11/2042 | | | | Aaa | | | | | 160,000 | | | | | 171,720 | |
Bear Stearns Commercial Mortgage Securities, Series 2006-PW12, Class A44 , 5.72%, 9/11/2038 | | | | Aaa | | | | | 200,000 | | | | | 220,248 | |
CFCRE Commercial Mortgage Trust, Series 2011-C1, Class A23 , 3.759%, 4/15/2044 | | | | Aaa | | | | | 60,000 | | | | | 60,908 | |
Citigroup Commercial Mortgage Trust, Series 2006-C4, Class A34 , 5.729%, 3/15/2049 | | | | Aaa | | | | | 110,000 | | | | | 121,197 | |
Commercial Mortgage Pass-Through Certificates, Series 2006-C7, Class A44 , 5.751%, 6/10/2046 | | | | AAA | 2 | | | | 155,000 | | | | | 171,701 | |
Commercial Mortgage Pass-Through Certificates, Series 2010-C1, Class A13 , 3.156%, 7/10/2046 | | | | Aaa | | | | | 261,700 | | | | | 263,567 | |
FREMF Mortgage Trust, Series 2011-K701, Class B3,4 , 4.437%, 7/25/2048 | | | | A | 2 | | | | 160,000 | | | | | 156,318 | |
Greenwich Capital Commercial Funding Corp., Series 2006-GG7, Class A44 , 5.881%, 7/10/2038 | | | | Aaa | | | | | 415,000 | | | | | 460,750 | |
JP Morgan Chase Commercial Mortgage Securities Corp., Series 2005-CB13, Class A44 , 5.278%, 1/12/2043 | | | | Aaa | | | | | 150,000 | | | | | 162,194 | |
JP Morgan Chase Commercial Mortgage Securities Corp., Series 2005-LDP5, Class A44 , 5.205%, 12/15/2044 | | | | Aaa | | | | | 325,000 | | | | | 354,663 | |
JP Morgan Chase Commercial Mortgage Securities Corp., Series 2006-LDP7, Class A44 , 5.88%, 4/15/2045 | | | | Aaa | | | | | 150,000 | | | | | 166,478 | |
JP Morgan Chase Commercial Mortgage Securities Corp., Series 2010-C2, Class A33 , 4.07%, 11/15/2043 | | | | AAA | 2 | | | | 200,000 | | | | | 193,341 | |
LB-UBS Commercial Mortgage Trust, Series 2006-C4, Class A44 , 5.87%, 6/15/2038 | | | | Aaa | | | | | 275,000 | | | | | 303,820 | |
LSTAR Commercial Mortgage Trust, Series 2011-1, Class A3 , 3.913%, 6/25/2043 | | | | Aaa | | | | | 100,000 | | | | | 99,543 | |
Merrill Lynch - Countrywide Commercial Mortgage Trust, Series 2006-3, Class A44 , 5.414%, 7/12/2046 | | | | Aaa | | | | | 125,000 | | | | | 134,684 | |
Morgan Stanley Capital I, Series 2005-HQ7, Class A44 , 5.202%, 11/14/2042 | | | | Aaa | | | | | 100,000 | | | | | 108,621 | |
OBP Depositor LLC Trust, Series 2010-OBP, Class A3 , 4.646%, 7/15/2045 | | | | AAA | 2 | | | | 100,000 | | | | | 103,786 | |
Vornado DP LLC, Series 2010-VNO, Class A2FX3 , 4.004%, 9/13/2028 | | | | AAA | 2 | | | | 245,000 | | | | | 238,619 | |
| | | | |
| 10 | | The accompanying notes are an integral part of the financial statements. | | |
Investment Portfolio - June 30, 2011 (unaudited)
| | | | | | | | | | | | | | | |
| | | Credit
Rating1 | | Principal Amount/
Shares | | Value
(Note 2) |
| | | |
| | | |
COMMERCIAL MORTGAGE-BACKED SECURITIES (continued) | | | | | | | | | | | | | | | |
Wachovia Bank Commercial Mortgage Trust, Series 2005-C21, Class A44 , 5.206%, 10/15/2044 | | | | Aaa | | | | $ | 150,000 | | | | $ | 163,562 | |
Wachovia Bank Commercial Mortgage Trust, Series 2006-C25, Class A44 , 5.737%, 5/15/2043 | | | | Aaa | | | | | 115,000 | | | | | 126,916 | |
Wachovia Bank Commercial Mortgage Trust, Series 2006-C26, Class A34 , 6.011%, 6/15/2045 | | | | Aaa | | | | | 280,000 | | | | | 310,860 | |
Wells Fargo Commercial Mortgage Trust, Series 2010-C1, Class A23 , 4.393%, 11/15/2043 | | | | Aaa | | | | | 275,000 | | | | | 273,926 | |
| | | | | | | | | | | | | | | |
TOTAL COMMERCIAL MORTGAGE-BACKED SECURITIES
(Identified Cost $5,137,270) | | | | | | | | | | | | | | 5,227,337 | |
| | | | | | | | | | | | | | | |
| | | |
MUNICIPAL BONDS - 0.7% | | | | | | | | | | | | | | | |
Monroe County Water Authority, Water Utility Impt., Revenue Bond, 6.339%, 8/1/2035 | | | | Aa2 | | | | | 500,000 | | | | | 552,035 | |
New York City, Public Impt., G.O. Bond, 6.646%, 12/1/2031 | | | | Aa2 | | | | | 500,000 | | | | | 539,750 | |
| | | | | | | | | | | | | | | |
TOTAL MUNICIPAL BONDS
(Identified Cost $1,000,000) | | | | | | | | | | | | | | 1,091,785 | |
| | | | | | | | | | | | | | | |
| | | |
MUTUAL FUNDS - 3.6% | | | | | | | | | | | | | | | |
iShares iBoxx Investment Grade Corporate Bond Fund
(Identified Cost $5,173,851) | | | | | | | | | 52,150 | | | | | 5,743,280 | |
| | | | | | | | | | | | | | | |
U.S. GOVERNMENT AGENCIES - 9.0% | | | | | | | | | | | | | | | |
| | | |
Mortgage-Backed Securities - 9.0% | | | | | | | | | | | | | | | |
Fannie Mae, Pool #888468, 5.50%, 9/1/2021 | | | | | | | | $ | 1,699,763 | | | | | 1,848,122 | |
Fannie Mae, Pool #995233, 5.50%, 10/1/2021 | | | | | | | | | 116,436 | | | | | 126,672 | |
Fannie Mae, Pool #888017, 6.00%, 11/1/2021 | | | | | | | | | 134,025 | | | | | 146,875 | |
Fannie Mae, Pool #995329, 5.50%, 12/1/2021 | | | | | | | | | 1,013,362 | | | | | 1,101,811 | |
Fannie Mae, Pool #888136, 6.00%, 12/1/2021 | | | | | | | | | 176,805 | | | | | 193,756 | |
Fannie Mae, Pool #888810, 5.50%, 11/1/2022 | | | | | | | | | 1,831,462 | | | | | 1,991,316 | |
Fannie Mae, Pool #AD0462, 5.50%, 10/1/2024 | | | | | | | | | 106,160 | | | | | 115,138 | |
Fannie Mae, Pool #995876, 6.00%, 11/1/2038 | | | | | | | | | 2,474,366 | | | | | 2,722,351 | |
Fannie Mae, Pool #AE0061, 6.00%, 2/1/2040 | | | | | | | | | 1,914,451 | | | | | 2,105,165 | |
Freddie Mac, Pool #G11850, 5.50%, 7/1/2020 | | | | | | | | | 567,752 | | | | | 616,140 | |
Freddie Mac, Pool #G12610, 6.00%, 3/1/2022 | | | | | | | | | 173,196 | | | | | 189,693 | |
Freddie Mac, Pool #G12655, 6.00%, 5/1/2022 | | | | | | | | | 119,468 | | | | | 130,848 | |
Freddie Mac, Pool #G12988, 6.00%, 1/1/2023 | | | | | | | | | 99,065 | | | | | 108,316 | |
Freddie Mac, Pool #G13078, 6.00%, 3/1/2023 | | | | | | | | | 173,555 | | | | | 190,086 | |
Freddie Mac, Pool #G03332, 6.00%, 10/1/2037 | | | | | | | | | 314,360 | | | | | 346,013 | |
Freddie Mac, Pool #G03696, 5.50%, 1/1/2038 | | | | | | | | | 91,635 | | | | | 99,212 | |
Freddie Mac, Pool #G05671, 5.50%, 8/1/2038 | | | | | | | | | 173,621 | | | | | 188,249 | |
Freddie Mac, Pool #G05900, 6.00%, 3/1/2040 | | | | | | | | | 1,037,006 | | | | | 1,141,423 | |
| | | | | | |
| | The accompanying notes are an integral part of the financial statements. | | | 11 | |
Investment Portfolio - June 30, 2011 (unaudited)
| | | | | | | | | | |
| | | Principal Amount/
Shares | | Value
(Note 2) |
| | |
| | |
U.S. GOVERNMENT AGENCIES (continued) | | | | | | | | | | |
| | |
Mortgage-Backed Securities (continued) | | | | | | | | | | |
Freddie Mac, Pool #G05906, 6.00%, 4/1/2040 | | | $ | 679,054 | | | | $ | 747,428 | |
| | | | | | | | | | |
TOTAL U.S. GOVERNMENT AGENCIES
(Identified Cost $13,957,225) | | | | | | | | | 14,108,614 | |
| | | | | | | | | | |
| | |
SHORT-TERM INVESTMENTS - 1.2% | | | | | | | | | | |
Dreyfus Cash Management, Inc. - Institutional Shares7 , 0.10%,
(Identified Cost $1,904,446) | | | | 1,904,446 | | | | | 1,904,446 | |
| | | | | | | | | | |
| | |
TOTAL INVESTMENTS - 98.5%
(Identified Cost $147,597,802) | | | | | | | | | 155,079,300 | |
OTHER ASSETS, LESS LIABILITIES - 1.5% | | | | | | | | | 2,301,426 | |
| | | | | | | | | | |
NET ASSETS - 100% | | | | | | | | $ | 157,380,726 | |
| | | | | | | | | | |
G.O. Bond - General Obligation Bond
Impt. - Improvement
| 1 | Credit ratings from Moody’s (unaudited). |
| 2 | Credit ratings from S&P (unaudited). |
| 3 | Restricted securities - Investment in securities that are restricted as to public resale under the Securities Act of 1933, as amended. These securities have been sold under rule 144A and have been determined to be liquid under guidelines established by the Board of Directors. These securities amount to $16,625,781, or 10.6%, of the Series’ net assets as of June 30, 2011. |
| 4 | The coupon rate is floating and is the stated rate as of June 30, 2011. |
| 5 | Represents a step-up bond that pays initial coupon rate for the first period and then a higher coupon rate for the following periods. Rate shown reflects the current coupon as of June 30, 2011. |
| 6 | The rate shown is a fixed rate as of June 30, 2011; the rate becomes floating in 2049. |
| 7 | Rate shown is the current yield as of June 30, 2011. |
| | | | |
| 12 | | The accompanying notes are an integral part of the financial statements. | | |
Statement of Assets and Liabilities (unaudited)
June 30, 2011
| | | | | |
ASSETS: | | | | | |
Investments, at value (identified cost $147,597,802) (Note 2) | | | $ | 155,079,300 | |
Interest receivable | | | | 1,893,839 | |
Receivable for fund shares sold | | | | 529,155 | |
Dividends receivable | | | | 176 | |
| | | | | |
| |
TOTAL ASSETS | | | | 157,502,470 | |
| | | | | |
| |
LIABILITIES: | | | | | |
| |
Accrued management fees (Note 3) | | | | 78,260 | |
Accrued fund accounting and administration fees (Note 3) | | | | 12,229 | |
Accrued transfer agent fees (Note 3) | | | | 471 | |
Accrued Chief Compliance Officer service fees (Note 3) | | | | 465 | |
Audit fees payable | | | | 19,383 | |
Payable for securities purchased | | | | 17 | |
Other payables and accrued expenses | | | | 10,919 | |
| | | | | |
| |
TOTAL LIABILITIES | | | | 121,744 | |
| | | | | |
| |
TOTAL NET ASSETS | | | $ | 157,380,726 | |
| | | | | |
| |
NET ASSETS CONSIST OF: | | | | | |
| |
Capital stock | | | $ | 139,496 | |
Additional paid-in-capital | | | | 146,485,972 | |
Undistributed net investment income | | | | 3,084,829 | |
Accumulated net realized gain on investments | | | | 188,931 | |
Net unrealized appreciation on investments | | | | 7,481,498 | |
| | | | | |
| |
TOTAL NET ASSETS | | | $ | 157,380,726 | |
| | | | | |
| |
NET ASSET VALUE, OFFERING PRICE AND REDEMPTION PRICE PER SHARE - Class A ($157,380,726/13,949,637 shares) | | | $ | 11.28 | |
| | | | | |
| | | | | | |
| | The accompanying notes are an integral part of the financial statements. | | | 13 | |
Statement of Operations (unaudited)
For the Six Months Ended June 30, 2011
| | | | | |
INVESTMENT INCOME: | | | | | |
| |
Interest | | | $ | 3,173,132 | |
Dividends | | | | 210,863 | |
| | | | | |
| |
Total Investment Income | | | | 3,383,995 | |
| | | | | |
| |
EXPENSES: | | | | | |
| |
Management fees (Note 3) | | | | 436,299 | |
Fund accounting and administration fees (Note 3) | | | | 32,227 | |
Directors’ fees (Note 3) | | | | 1,785 | |
Transfer agent fees (Note 3) | | | | 1,426 | |
Chief Compliance Officer service fees (Note 3) | | | | 1,315 | |
Custodian fees | | | | 3,712 | |
Miscellaneous | | | | 33,769 | |
| | | | | |
| |
Total Expenses | | | | 510,533 | |
| | | | | |
| |
NET INVESTMENT INCOME | | | | 2,873,462 | |
| | | | | |
| |
REALIZED AND UNREALIZED GAIN ON INVESTMENTS: | | | | | |
| |
Net realized gain on investments | | | | 559,890 | |
Net change in unrealized appreciation on investments | | | | 1,036,815 | |
| | | | | |
| |
NET REALIZED AND UNREALIZED GAIN ON INVESTMENTS | | | | 1,596,705 | |
| | | | | |
| |
NET INCREASE IN NET ASSETS RESULTING FROM OPERATIONS | | | $ | 4,470,167 | |
| | | | | |
| | | | |
| 14 | | The accompanying notes are an integral part of the financial statements. | | |
Statement of Changes in Net Assets
| | | | | | | | | | |
| | | For the Six
Months Ended
6/30/11
(unaudited) | | For the
Year Ended
12/31/10 |
| | |
| | |
| | |
INCREASE (DECREASE) IN NET ASSETS: | | | | | | | | | | |
| | |
OPERATIONS: | | | | | | | | | | |
| | |
Net investment income | | | $ | 2,873,462 | | | | $ | 3,883,268 | |
Net realized gain on investments | | | | 559,890 | | | | | 499,316 | |
Net change in unrealized appreciation on investments | | | | 1,036,815 | | | | | 3,349,635 | |
| | | | | | | | | | |
| | |
Net increase from operations | | | | 4,470,167 | | | | | 7,732,219 | |
| | | | | | | | | | |
| | |
DISTRIBUTIONS TO SHAREHOLDERS (Note 8): | | | | | | | | | | |
| | |
From net investment income | | | | — | | | | | (3,683,326 | ) |
| | | | | | | | | | |
| | |
CAPITAL STOCK ISSUED AND REPURCHASED: | | | | | | | | | | |
| | |
Net increase from capital share transactions (Note 5) | | | | 38,852,545 | | | | | 33,408,300 | |
| | | | | | | | | | |
| | |
Net increase in net assets | | | | 43,322,712 | | | | | 37,457,193 | |
| | |
NET ASSETS: | | | | | | | | | | |
| | |
Beginning of period | | | | 114,058,014 | | | | | 76,600,821 | |
| | | | | | | | | | |
| | |
End of period (including undistributed net investment income of $3,084,829 and $211,367, respectively) | | | $ | 157,380,726 | | | | $ | 114,058,014 | |
| | | | | | | | | | |
| | | | | | |
| | The accompanying notes are an integral part of the financial statements. | | | 15 | |
Financial Highlights
| | | | | | | | | | | | | | | | | | | | | | | | | | | | | | |
| | | For the Six
Months Ended
6/30/11 | | For the Years Ended |
| | | (unaudited) | | 12/31/10 | | 12/31/09 | | 12/31/08 | | 12/31/07 | | 12/31/06 |
Per share data (for a share outstanding throughout each period): | | | | | | | | | | | | | | | | | | | | | | | | | | | | | | |
Net asset value - Beginning of period | | | $ | 10.94 | | | | $ | 10.38 | | | | $ | 9.69 | | | | $ | 10.05 | | | | $ | 9.98 | | | | $ | 9.89 | |
| | | | | | | | | | | | | | | | | | | | | | | | | | | | | | |
Income (loss) from investment operations: | | | | | | | | | | | | | | | | | | | | | | | | | | | | | | |
Net investment income | | | | 0.22 | 1 | | | | 0.45 | 1 | | | | 0.49 | 1 | | | | 0.45 | | | | | 0.42 | | | | | 0.36 | |
Net realized and unrealized gain (loss) on investments | | | | 0.12 | | | | | 0.48 | | | | | 0.62 | | | | | (0.30 | ) | | | | 0.13 | | | | | 0.09 | |
| | | | | | | | | | | | | | | | | | | | | | | | | | | | | | |
Total from investment operations | | | | 0.34 | | | | | 0.93 | | | | | 1.11 | | | | | 0.15 | | | | | 0.55 | | | | | 0.45 | |
| | | | | | | | | | | | | | | | | | | | | | | | | | | | | | |
Less distributions to shareholders: | | | | | | | | | | | | | | | | | | | | | | | | | | | | | | |
From net investment income | | | | — | | | | | (0.37 | ) | | | | (0.42 | ) | | | | (0.46 | ) | | | | (0.42 | ) | | | | (0.36 | ) |
From net realized gain on investments | | | | — | | | | | — | | | | | — | | | | | (0.05 | ) | | | | (0.06 | ) | | | | — | |
| | | | | | | | | | | | | | | | | | | | | | | | | | | | | | |
Total distributions to shareholders | | | | — | | | | | (0.37 | ) | | | | (0.42 | ) | | | | (0.51 | ) | | | | (0.48 | ) | | | | (0.36 | ) |
Net asset value - End of period | | | $ | 11.28 | | | | $ | 10.94 | | | | $ | 10.38 | | | | $ | 9.69 | | | | $ | 10.05 | | | | $ | 9.98 | |
| | | | | | | | | | | | | | | | | | | | | | | | | | | | | | |
Net assets - End of period (000’s omitted) | | | $ | 157,381 | | | | $ | 114,058 | | | | $ | 76,601 | | | | $ | 53,071 | | | | $ | 49,909 | | | | $ | 45,696 | |
| | | | | | | | | | | | | | | | | | | | | | | | | | | | | | |
Total return2 | | | | 3.11 | % | | | | 8.97 | % | | | | 11.46 | % | | | | 1.66 | % | | | | 5.58 | % | | | | 4.51 | % |
Ratios (to average net assets)/ Supplemental Data: | | | | | | | | | | | | | | | | | | | | | | | | | | | | | | |
Expenses* | | | | 0.70 | %3 | | | | 0.76 | % | | | | 0.79 | % | | | | 0.80 | % | | | | 0.80 | % | | | | 0.80 | % |
Net investment income | | | | 3.95 | %3 | | | | 4.10 | % | | | | 4.84 | % | | | | 4.73 | % | | | | 4.21 | % | | | | 3.87 | % |
Portfolio turnover | | | | 11 | % | | | | 23 | % | | | | 67 | % | | | | 53 | % | | | | 346 | % | | | | 313 | % |
| |
* The investment advisor did not impose all or a portion of its management fees, CCO fees, fund accounting and transfer agent fees, and other fees in some periods and in some periods paid a portion of the Series’ expenses. If these expenses had been incurred by the Series, the expense ratio (to average net assets) would have been increased by the following amount: | | | | | | |
| | | | NA | | | | | 0.00 | %4 | | | | 0.00 | %4 | | | | 0.03 | % | | | | 0.04 | % | | | | 0.08 | % |
| 1 | Calculated based on average shares outstanding during the period. |
| 2 | Represents aggregate total return for the periods indicated, and assumes reinvestment of all distributions. Total return would |
have been lower had certain expenses not been waived or reimbursed during certain periods. Periods less than one year are not
annualized.
| | | | |
| 16 | | The accompanying notes are an integral part of the financial statements. | | |
Notes to Financial Statements (unaudited)
Core Bond Series (the “Series”) is a no-load diversified series of Manning & Napier Fund, Inc. (the “Fund”). The Fund is organized in Maryland and is registered under the Investment Company Act of 1940, as amended, as an open-end management investment company.
The Series’ investment objective is to provide long-term total return by investing primarily in fixed income securities.
The Fund’s Advisor is Manning & Napier Advisors, Inc. (the “Advisor”). Shares of the Series are offered to investors, clients and employees of the Advisor and its affiliates. The total authorized capital stock of the Fund consists of 10.0 billion shares of common stock each having a par value of $0.01. As of June 30, 2011, 6.4 billion shares have been designated in total among 31 series, of which 125 million have been designated as Core Bond Series Class A common stock.
| 2. | SIGNIFICANT ACCOUNTING POLICIES |
Security Valuation
Portfolio securities, including domestic equities, foreign equities, warrants and options, listed on an exchange other than the NASDAQ National Market System are valued at the latest quoted sales price of the exchange on which the security is primarily traded. Securities not traded on valuation date or securities not listed on an exchange are valued at the latest quoted bid price provided by the Fund’s pricing service. Securities listed on the NASDAQ National Market System are valued in accordance with the NASDAQ Official Closing Price.
Debt securities, including government bonds, foreign bonds, asset-backed securities, structured notes, supranational obligations, sovereign bonds, corporate bonds and mortgage-backed securities will normally be valued on the basis of evaluated bid prices provided directly by an independent pricing service. The pricing services use multiple valuation techniques to determine fair value. In instances where sufficient market activity exists, the pricing services may utilize a market-based approach through which quotes from market makers are used to determine fair value. In instances where sufficient market activity may not exist or is limited, the pricing services also utilize proprietary valuation models which may consider market characteristics such as benchmark yield curves, option-adjusted spreads, credit spreads, estimated default rates, coupon rates, anticipated timing of principal repayments, underlying collateral, and other unique security features in order to estimate the relevant cash flows, which are then discounted to calculate the fair value. Certain investments in securities held by the Series may be valued on a basis of a price provided directly by a principal market maker. These prices may differ from the value that would have been used had a broader market for securities existed.
Municipal securities will normally be valued on the basis of market valuations provided by an independent pricing service that utilizes the latest price quotations and a matrix system (which considers such factors as security prices of similar securities, yields, maturities and ratings).
Short-term investments that mature in sixty days or less are valued at amortized cost, which approximates market value. Investments in open-end investment companies are valued at their net asset value per share on valuation date.
Volume and level of activity in established markets for an asset or liability are evaluated to determine whether recent transactions and quoted prices are determinative of fair value. Where there have been significant decreases in volume and level of activity, further analysis and adjustment may be necessary to estimate fair value. The Series measures fair value in these instances by the use of inputs and valuation techniques which may be based upon current market prices of securities that are comparable in coupon, rating, maturity and industry and/or expectation of future cash flows. As a result of trading in relatively thin markets and/or markets that experience significant volatility, the prices used by the Series to value these securities may differ from the value that would be realized if these securities were sold, and the differences could be material.
Notes to Financial Statements (unaudited)
| 2. | SIGNIFICANT ACCOUNTING POLICIES (continued) |
Security Valuation (continued)
Securities for which representative valuations or prices are not available from the Fund’s pricing service may be valued at fair value. Due to the inherent uncertainty of valuations of such securities, the fair value may differ significantly from the values that would have been used had a ready market for such securities existed. If trading or events occurring after the close of the principal market in which securities are traded are expected to materially affect the value of those securities, then they may be valued at their fair value, taking this trading or these events into account. Fair value is determined in good faith by the Advisor under procedures approved by and under the general supervision and responsibility of the Fund’s Board of Directors (the “Board”).
Various inputs are used in determining the value of the Series’ assets or liabilities carried at market value. These inputs are summarized in three broad levels. Level 1 includes quoted prices in active markets for identical assets and liabilities. Level 2 includes other significant observable inputs (including quoted prices for similar securities, interest rates, prepayment speeds, credit risk, etc.). Level 3 includes significant unobservable inputs (including the Series’ own assumptions in determining the fair value of investments). The inputs or methodology used for valuing securities are not necessarily an indication of the risk associated with investing in those securities.
The following is a summary of the valuation levels used for major security types as of June 30, 2011 in valuing the Series’ assets or liabilities carried at market value:
| | | | | | | | | | | | | | | | | | | | |
Description | | Total | | Level 1 | | Level 2 | | Level 3 |
Assets: | | | | | | | | | | | | | | | | | | | | |
Equity securities*: | | | $ | — | | | | $ | — | | | | $ | — | | | | $ | — | |
Preferred securities: | | | | | | | | | | | | | | | | | | | | |
Financials | | | | 3,189,535 | | | | | 766,294 | | | | | 2,423,241 | | | | | — | |
Debt securities: | | | | | | | | | | | | | | | | | | | | |
U.S. Treasury and other U.S. Government agencies | | | | 14,108,614 | | | | | — | | | | | 14,108,614 | | | | | — | |
States and political subdivisions (municipals) | | | | 1,091,785 | | | | | — | | | | | 1,091,785 | | | | | — | |
Corporate debt: | | | | | | | | | | | | | | | | | | | — | |
Consumer Discretionary | | | | 19,147,155 | | | | | — | | | | | 19,147,155 | | | | | — | |
Consumer Staples | | | | 3,757,598 | | | | | — | | | | | 3,757,598 | | | | | — | |
Energy | | | | 8,384,945 | | | | | — | | | | | 8,384,945 | | | | | — | |
Financials | | | | 43,764,456 | | | | | — | | | | | 43,764,456 | | | | | — | |
Health Care | | | | 5,398,948 | | | | | — | | | | | 5,398,948 | | | | | — | |
Industrials | | | | 17,621,013 | | | | | — | | | | | 17,621,013 | | | | | — | |
Information Technology | | | | 5,633,470 | | | | | — | | | | | 5,633,470 | | | | | — | |
Materials | | | | 11,340,274 | | | | | — | | | | | 11,340,274 | | | | | — | |
Telecommunication Services | | | | 2,216,155 | | | | | — | | | | | 2,216,155 | | | | | — | |
Utilities | | | | 3,180,103 | | | | | — | | | | | 3,180,103 | | | | | — | |
Convertible corporate debt: | | | | | | | | | | | | | | | | | | | — | |
Health Care | | | | 654,687 | | | | | — | | | | | 654,687 | | | | | — | |
Information Technology | | | | 1,524,675 | | | | | — | | | | | 1,524,675 | | | | | — | |
Asset-backed securities | | | | 1,190,824 | | | | | — | | | | | 1,190,824 | | | | | — | |
Commercial mortgage-backed securities | | | | 5,227,337 | | | | | — | | | | | 5,227,337 | | | | | | |
Mutual funds | | | | 7,647,726 | | | | | 7,647,726 | | | | | — | | | | | — | |
Other financial instruments** | | | | — | | | | | — | | | | | — | | | | | — | |
| | | | | | | | | | | | | | | | | | | | |
Total assets: | | | $ | 155,079,300 | | | | $ | 8,414,020 | | | | $ | 146,665,280 | | | | $ | — | |
| | | | | | | | | | | | | | | | | | | | |
Notes to Financial Statements (unaudited)
| 2. | SIGNIFICANT ACCOUNTING POLICIES (continued) |
Security Valuation (continued)
| | | | | | | | | | | | | | | | | | | | |
Description | | Total | | Level 1 | | Level 2 | | Level 3 |
Liabilities: | | | | | | | | | | | | | | | | | | | | |
Other financial instruments** | | | $ | — | | | | $ | — | | | | $ | — | | | | $ | — | |
| | | | | | | | | | | | | | | | | | | | |
Total liabilities | | | | — | | | | | — | | | | | — | | | | | — | |
| | | | | | | | | | | | | | | | | | | | |
Total | | | $ | 155,079,300 | | | | $ | 8,414,020 | | | | $ | 146,665,280 | | | | $ | — | |
| | | | | | | | | | | | | | | | | | | | |
| * | Includes common stock, warrants and rights. |
| ** | Other financial instruments are derivative instruments not reflected in the Investment Portfolio, such as futures, forwards and swap contracts, which are valued at the unrealized appreciation/depreciation on the instrument. As of June 30, 2011, the Series did not hold any derivative instruments. |
There were no Level 3 securities held by the Series as of December 31, 2010 or June 30, 2011.
The Fund’s policy is to recognize transfers in and transfers out of the valuation levels as of the beginning of the reporting period. There were no significant transfers between Level 1 and Level 2 during the six months ended June 30, 2011.
Recent Accounting Standard
In May 2011, the Financial Accounting Standards Board issued amended guidance to improve disclosure about fair value measurements which will require the following disclosures for fair value measurements categorized as Level 3: quantitative information about the unobservable inputs and assumptions used in the fair value measurement, a description of the valuation policies and procedures and a narrative description of the sensitivity of the fair value measurement to changes in unobservable inputs and the interrelationships between those unobservable inputs. In addition, the amounts and reasons for all transfers in and out of Level 1 and Level 2 will be required to be disclosed. The amended guidance is effective for financial statements for fiscal years beginning after December 15, 2011, and interim periods within those fiscal years. Management is evaluating the impact of this guidance on the Series’ financial statements and disclosures.
Security Transactions, Investment Income and Expenses
Security transactions are accounted for on trade date. Dividend income is recorded on the ex-dividend date, except that if the ex-dividend date has passed, certain dividends from foreign securities are recorded as soon as the Fund is informed of the ex-dividend date. Non-cash dividends, if any, are recorded at the fair market value of the securities received. Interest income, including amortization of premium and accretion of discounts using the effective interest method, is earned from settlement date and accrued daily.
Expenses are recorded on an accrual basis. Most expenses of the Fund can be attributed to a specific series. Expenses which cannot be directly attributed are apportioned among the series in the Fund in such a manner as deemed equitable by the Fund’s Board, taking into consideration, among other things, the nature and type of expense.
The Series uses the identified cost method for determining realized gain or loss on investments for both financial statement and federal income tax reporting purposes.
Foreign Currency Translation
The books and records of the Series are maintained in U.S. dollars. Foreign currencies, investments and other assets and liabilities are translated into U.S. dollars at the current exchange rates. Purchases and sales of investment securities and income and expenses are translated on the respective dates of such transactions. The Series does
Notes to Financial Statements (unaudited)
Foreign Currency Translation (continued)
not isolate realized and unrealized gains and losses attributable to changes in the exchange rates from gains and losses that arise from changes in the market value of investments. Such fluctuations are included with net realized and unrealized gain or loss on investments. Net realized foreign currency gains and losses represent foreign currency gains and losses between trade date and settlement date on securities transactions, gains and losses on disposition of foreign currencies and the difference between the amount of income and foreign withholding taxes recorded on the books of the Series and the amounts actually received or paid.
Securities Purchased on a When-Issued Basis or Forward Commitment
The Series may purchase securities on a when-issued basis or forward commitment. These transactions involve a commitment by the Series to purchase securities for a predetermined price with payment and delivery taking place beyond the customary settlement period. When such purchases are outstanding, the Series will designate liquid assets in an amount sufficient to meet the purchase price. When purchasing a security on a delayed delivery basis, the Series assumes the rights and risks of ownership of the security, including the risk of price and yield fluctuations, and takes such fluctuations into account when determining its net asset value. The Series may sell the when-issued securities before they are delivered, which may result in a capital gain or loss. No such investments were held by the Series as of June 30, 2011.
In connection with its ability to purchase or sell securities on a forward commitment basis, the Series may enter into forward roll transactions principally using To Be Announced (TBA) securities. Forward roll transactions require the sale of securities for delivery in the current month, and a simultaneous agreement to repurchase substantially similar (same type, coupon and maturity) securities on a specified future date. Risks of entering into forward roll transactions include the potential inability of the counterparty to meet the terms of the agreement; the potential of the Series to receive inferior securities at redelivery as compared to the securities sold to the counterparty; counterparty credit risk; and the potential pay down speed variance between the mortgage-backed pools. During the roll period, the Series forgoes principal and interest paid on the securities. The Series accounts for such dollar rolls as purchases and sales. Information regarding securities purchased on a when-issued basis is included in the Series’ Investment Portfolio. No such investments were held by the Series as of June 30, 2011.
Restricted Securities
Restricted securities are purchased in private placement transactions, are not registered under the Securities Act of 1933, as amended, and may have contractual restrictions on resale. Information regarding restricted securities is included at the end of the Series’ Investment Portfolio.
Illiquid Securities
A security may be considered illiquid if so deemed in good faith by the Advisor under procedures approved by and under the general supervision and responsibility of the Fund’s Board. Securities that are illiquid are marked with the applicable footnote on the Investment Portfolio. No such investments were held by the Series on June 30, 2011.
Federal Taxes
The Series’ policy is to comply with the provisions of the Internal Revenue Code applicable to regulated investment companies. The Series is not subject to federal income tax or excise tax to the extent that the Series distributes to shareholders each year its taxable income, including any net realized gains on investments, in accordance with requirements of the Internal Revenue Code. Accordingly, no provision for federal income tax or excise tax has been made in the financial statements.
Management evaluates its tax positions to determine if the tax positions taken meet the minimum recognition threshold in connection with accounting for uncertainties in income tax positions taken or expected to be taken for the purposes of measuring and recognizing tax liabilities in the financial statements. Recognition of tax benefits of an uncertain
Notes to Financial Statements (unaudited)
| 2. | SIGNIFICANT ACCOUNTING POLICIES (continued) |
Federal Taxes (continued)
tax position is required only when the position is “more likely than not” to be sustained assuming examination by taxing authorities. At June 30, 2011, the Series has recorded no liability for net unrecognized tax benefits relating to uncertain income tax positions taken or expected to be taken in future tax returns.
The Series files income tax returns in the U.S. federal jurisdiction, various states and foreign jurisdictions, as required. No income tax returns are currently under investigation. The statute of limitations on the Series’ tax returns remains open for the years ended December 31, 2007 through December 31, 2010. The Fund is not aware of any tax positions for which it is reasonably possible that the total amounts of unrecognized tax benefits will significantly change in the next twelve months.
Additionally, based on the Fund’s understanding of the tax rules and rates related to income, gains and transactions for foreign jurisdictions in which it invests, the Series will provide for foreign taxes, and where appropriate, deferred foreign tax.
Distributions of Income and Gains
Distributions to shareholders of net investment income and net realized gains are made annually. An additional distribution may be necessary to avoid taxation of the Series. Distributions are recorded on the ex-dividend date.
Indemnifications
The Fund’s organizational documents provide former and current directors and officers with a limited indemnification against liabilities arising in connection with the performance of their duties to the Fund. In the normal course of business, the Fund may also enter into contracts that provide general indemnifications. The Fund’s maximum exposure under these arrangements is unknown as this would be dependent on future claims that may be made against the Fund. The risk of material loss from such claims is considered remote.
Other
The preparation of financial statements in conformity with accounting principles generally accepted in the United States of America requires management to make estimates and assumptions that affect the reported amounts of assets and liabilities and the disclosure of contingent assets and liabilities at the date of the financial statements and the reported amounts of income and expenses during the reporting period. Actual results could differ from those estimates.
| 3. | TRANSACTIONS WITH AFFILIATES |
The Fund has an Investment Advisory Agreement (the “Agreement”) with the Advisor, for which the Series pays a fee, computed daily and payable monthly, at an annual rate of 0.60% of the Series’ average daily net assets.
Under the Agreement, personnel of the Advisor provide the Series with advice and assistance in the choice of investments and the execution of securities transactions, and otherwise maintain the Series’ organization. The Advisor also provides the Fund with necessary office space and fund administration and support services. The salaries of all officers of the Fund (except a percentage of the Fund’s Chief Compliance Officer’s salary, which is paid by the Fund), and of all Directors who are “affiliated persons” of the Fund, or of the Advisor, and all personnel of the Fund, or of the Advisor, performing services relating to research, statistical and investment activities, are paid by the Advisor. Each “non-affiliated” Director receives an annual stipend, which is allocated among all the active series of the Fund. In addition, these Directors also receive a fee per Board meeting attended plus a fee for each committee meeting attended.
The Advisor has contractually agreed, until at least April 30, 2012, to waive its fee and, if necessary, pay other operating expenses of the Series in order to maintain total direct annual fund operating expenses for the Series at
Notes to Financial Statements (unaudited)
| 3. | TRANSACTIONS WITH AFFILIATES (continued) |
no more than 0.80% of average daily net assets each year. The Advisor did not waive any fees for the six months ended June 30, 2011. The Advisor is not eligible to recoup any expenses that have been waived or reimbursed in prior years.
Manning & Napier Investor Services, Inc., a registered broker-dealer affiliate of the Advisor, acts as distributor for the Fund’s shares. The services of Manning & Napier Investor Services, Inc. are provided at no additional cost to the Series.
The Advisor has agreements with BNY Mellon Investment Servicing (U.S.) Inc. (“BNY”) under which BNY serves as sub-accountant services agent and sub-transfer agent. The Fund pays the Advisor an annual fee related to fund accounting and administration of 0.0175% on the first $3 billion of average daily net assets (excluding Target Series); 0.015% on the next $3 billion of average daily net assets (excluding Target Series); and 0.01% of the average daily net assets in excess of $6 billion (excluding Target Series); plus a base fee of $25,500 per Series. Transfer Agent fees are charged to the Fund on a per account basis. Additionally, certain transaction- and cusip-based fees and out-of-pocket expenses, including charges for reporting relating to the Fund’s compliance program, are charged.
Expenses not directly attributable to a Series are allocated based on each Series’ relative net assets or number of accounts, depending on the expense.
| 4. | PURCHASES AND SALES OF SECURITIES |
For the six months ended June 30, 2011, purchases and sales of securities, other than U.S. Government securities and short-term securities, were $52,657,980 and $13,488,199 respectively. Purchases and sales of U.S. Government securities, other than short-term securities, were $7,835,602 and $2,726,615, respectively.
| 5. | CAPITAL STOCK TRANSACTIONS |
Transactions in shares of Core Bond Series were:
| | | | | | | | | | | | | | | | | | | | |
| | | For the Six Months
Ended 6/30/11 | | For the Year
Ended 12/31/10 |
| | |
| | | Shares | | Amount | | Shares | | Amount |
Sold | | | | 3,901,418 | | | | $ | 43,034,837 | | | | | 3,256,147 | | | | $ | 35,669,098 | |
Reinvested | | | | — | | | | | — | | | | | 338,001 | | | | | 3,639,306 | |
Repurchased | | | | (374,427 | ) | | | | (4,182,292 | ) | | | | (553,027 | ) | | | | (5,900,104 | ) |
| | | | | | | | | | | | | | | | | | | | |
Total | | | | 3,526,991 | | | | $ | 38,852,545 | | | | | 3,041,121 | | | | $ | 33,408,300 | |
| | | | | | | | | | | | | | | | | | | | |
Substantially all of the Series’ shares represent investments by fiduciary accounts over which the Advisor has sole investment discretion.
The Series may trade in instruments including written and purchased options, forward foreign currency exchange contracts and futures contracts and other derivatives in the normal course of investing activities to assist in managing exposure to various market risks. The Series may be subject to various elements of risk, which may involve, to a varying degree, elements of risk in excess of the amounts recognized for financial statement purposes. These risks include: the risk that changes in the value of a derivative may not correlate perfectly with the underlying asset, rate or index, counterparty credit risk related to over the counter derivatives’ counterparties failure to perform under contract terms, liquidity risk related to the lack of a liquid market for these contracts allowing the fund to close out
Notes to Financial Statements (unaudited)
| 6. | FINANCIAL INSTRUMENTS (continued) |
its position(s) and documentation risk relating to disagreement over contract terms. No such investments were held by the Series on June 30, 2011.
Investing in securities of foreign companies and foreign governments involves special risks and considerations not typically associated with investing in securities of domestic companies and the U.S. Government. These risks include revaluation of currencies and future adverse political and economic developments. Moreover, securities of foreign companies and foreign governments and their markets may be less liquid and their prices more volatile than those of comparable domestic companies and the U.S. Government.
| 8. | FEDERAL INCOME TAX INFORMATION |
The amount and characterization of certain income and capital gains to be distributed are determined in accordance with federal income tax regulations, which may differ from accounting principles generally accepted in the United States of America. The Series may periodically make reclassifications among its capital accounts to reflect income and gains available for distribution (or available capital loss carryovers) under income tax regulations, without impacting the Series’ net asset value. Any such reclassifications are not reflected in the financial highlights.
The final determination of the tax character of current year distributions will be made at the conclusion of the fiscal year. The tax character of distributions paid for the year ended December 31, 2010 was as follows:
| | | | | |
Ordinary income | | | $ | 3,683,326 | |
At December 31, 2010, the Series had a capital loss carryover of $370,690, available to the extent allowed by tax law to offset future net capital gain, if any, which will expire as follows:
| | | | | | | | |
Loss Carryover | | | Expiration Date |
| $ | 350,661 | | | December 31, 2016 |
| | 20,299 | | | December 31, 2017 |
Under the recently enacted Regulated Investment Company Modernization Act of 2010, capital losses incurred by the Funds after December 31, 2010 will not be subject to expiration. In addition, such losses must be used prior to the losses incurred in the years preceding enactment.
At June 30, 2011, the identified cost of investments for federal income tax purposes, the resulting gross unrealized appreciation and depreciation, and the net unrealized appreciation were as follows:
| | | | | |
Cost for federal income tax purposes | | | $ | 147,597,802 | |
Unrealized appreciation | | | $ | 7,842,407 | |
Unrealized depreciation | | | | (360,909 | ) |
| | | | | |
Net unrealized appreciation | | | $ | 7,481,498 | |
| | | | | |
Literature Requests (unaudited)
Proxy Voting Policies and Procedures
A description of the policies and procedures that the Fund uses to determine how to vote proxies relating to portfolio securities is available, without charge, upon request:
| | |
| By phone | | 1-800-466-3863 |
| On the Securities and Exchange Commission’s | | |
| (SEC) web site | | http://www.sec.gov |
Proxy Voting Record
Information regarding how the Fund voted proxies relating to portfolio securities during the most recent 12-month period ended June 30th is available, without charge, upon request:
| | |
| By phone | | 1-800-466-3863 |
| On the SEC’s web site | | http://www.sec.gov |
Quarterly Portfolio Holdings
The Series’ complete schedule of portfolio holdings for the 1st and 3rd quarters of each fiscal year are provided on Form N-Q, and are available, without charge, upon request:
| | |
| By phone | | 1-800-466-3863 |
| On the SEC’s web site | | http://www.sec.gov |
The Series’ Form N-Q may be reviewed and copied at the SEC’s Public Reference Room in Washington, D.C. Information on the operation of the Public Reference Room may be obtained by calling 1-800-SEC-0330.
Prospectus and Statement of Additional Information (SAI)
The prospectus and SAI provide additional information about each Series, including charges, expenses and risks. These documents are available, without charge, upon request:
| | |
| By phone | | 1-800-466-3863 |
| On the SEC’s web site | | http://www.sec.gov |
| On our web site | | http://www.manning-napier.com |
Additional information available at www.manning-napier.com
1. Fund Holdings - Month-End
2. Fund Holdings - Quarter-End
3. Shareholder Report - Annual
4. Shareholder Report - Semi-Annual
The Fund also offers electronic notification or “e-delivery” when certain documents are available on-line to be downloaded or reviewed. Direct shareholders can elect to receive electronic notification when shareholder reports, prospectus updates, and / or quarterly statements are available. If you do not currently have on-line access to your account, you can establish access by going to www.manning-napier.com, click on “Login” in the top corner of the page, and follow the prompts to self-enroll. Once enrolled, you can set your electronic notification preferences by clicking on the Account Options tab located within the green toolbar and then select E-Delivery Option. Should you have any questions on either how to establish on-line access or how to update your account settings, please do not hesitate to contact Investor Services at 1-800-466-3863.
MNCRBND-6/11-SAR


Shareholder Expense Example (unaudited)
As a shareholder of the Series, you may incur two types of costs: (1) transaction costs and (2) ongoing costs, including management fees and other Series expenses. This example is intended to help you understand your ongoing costs (in dollars) of investing in the Series and to compare these costs with the ongoing costs of investing in other mutual funds.
The example is based on an investment of $1,000 invested at the beginning of the period and held for the entire period (January 1, 2011 to June 30, 2011).
Actual Expenses
The first line of the table below provides information about actual account values and actual expenses. You may use the information in this line, together with the amount you invested, to estimate the expenses that you paid over the period. Simply divide your account value by $1,000 (for example, an $8,600 account value divided by $1,000 = 8.6), then multiply the result by the number in the first line under the heading entitled “Expenses Paid During Period” to estimate the expenses you paid on your account during this period.
Hypothetical Example for Comparison Purposes
The second line of the table below provides information about hypothetical account values and hypothetical expenses based on the Series’ actual expense ratio and an assumed rate of return of 5% per year before expenses, which is not the Series’ actual return. The hypothetical account values and expenses may not be used to estimate the actual ending account balance or expenses you paid during the period. You may use this information to compare the ongoing costs of investing in the Series and other funds. To do so, compare this 5% hypothetical example with the 5% hypothetical examples that appear in the shareholder reports of the other funds.
Please note that the expenses shown in the table are meant to highlight your ongoing costs only and do not reflect any transaction costs. Therefore, the second line of the table is useful in comparing ongoing costs only, and will not help you determine the relative total costs of owning different funds. In addition, if these transaction costs were included, your costs would have been higher.
| | | | | | | | | | | | | | | |
| | | Beginning
Account Value
1/1/11 | | Ending
Account Value
6/30/11 | | Expenses Paid
During Period*
1/1/11-6/30/11 |
Actual | | | $ | 1,000.00 | | | | $ | 1,032.90 | | | | $ | 3.78 | |
Hypothetical
(5% return before expenses) | | | $ | 1,000.00 | | | | $ | 1,021.08 | | | | $ | 3.76 | |
| * | Expenses are equal to the Series’ annualized expense ratio (for the six-month period) of 0.75%, multiplied by the average account value over the period, multiplied by 181/365 (to reflect the one-half year period). Expenses are based on the most recent fiscal half year. |
Portfolio Composition as of June 30, 2011 (unaudited)
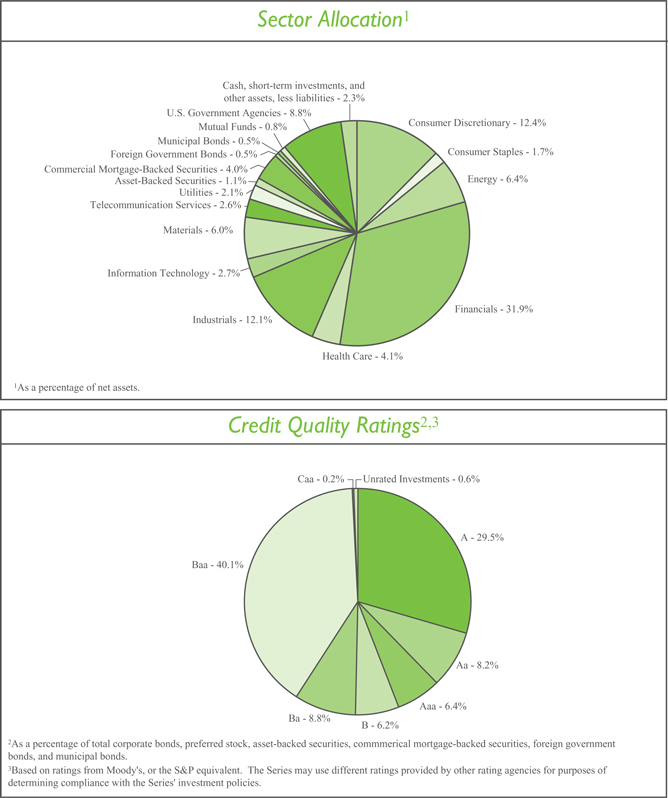
Investment Portfolio - June 30, 2011 (unaudited)
| | | | | | | | | | | | | | | |
| | | Credit
Rating1 | | Principal Amount | | Value
(Note 2) |
| | | |
CORPORATE BONDS - 79.4% | | | | | | | | | | | | | | | |
| | | |
Convertible Corporate Bonds - 1.6% | | | | | | | | | | | | | | | |
Financials - 0.5% | | | | | | | | | | | | | | | |
Real Estate Investment Trusts (REITS) - 0.5% | | | | | | | | | | | | | | | |
BioMed Realty LP2, 3.75%, 1/15/2030 | | | | WR | 3 | | | $ | 2,375,000 | | | | $ | 2,811,406 | |
| | | | | | | | | | | | | | | |
Health Care - 0.6% | | | | | | | | | | | | | | | |
Biotechnology - 0.6% | | | | | | | | | | | | | | | |
Amgen, Inc., 0.375%, 2/1/2013 | | | | A3 | | | | | 3,270,000 | | | | | 3,282,262 | |
| | | | | | | | | | | | | | | |
Information Technology - 0.5% | | | | | | | | | | | | | | | |
Computers & Peripherals - 0.5% | | | | | | | | | | | | | | | |
EMC Corp., 1.75%, 12/1/2013 | | | | A | 4 | | | | 1,685,000 | | | | | 2,952,963 | |
| | | | | | | | | | | | | | | |
Total Convertible Corporate Bonds
(Identified Cost $8,036,995) | | | | | | | | | | | | | | 9,046,631 | |
| | | | | | | | | | | | | | | |
Non-Convertible Corporate Bonds - 77.8% | | | | | | | | | | | | | | | |
Consumer Discretionary - 12.4% | | | | | | | | | | | | | | | |
Auto Components - 0.2% | | | | | | | | | | | | | | | |
UCI International, Inc., 8.625%, 2/15/2019 | | | | B3 | | | | | 1,000,000 | | | | | 1,030,000 | |
| | | | | | | | | | | | | | | |
Hotels, Restaurants & Leisure - 1.5% | | | | | | | | | | | | | | | |
International Game Technology, 7.50%, 6/15/2019 | | | | Baa2 | | | | | 5,505,000 | | | | | 6,293,795 | |
Wendy’s - Arby’s Restaurants LLC, 10.00%, 7/15/2016 | | | | B3 | | | | | 610,000 | | | | | 675,575 | |
Wyndham Worldwide Corp., 9.875%, 5/1/2014 | | | | Ba1 | | | | | 405,000 | | | | | 475,617 | |
Wyndham Worldwide Corp., 6.00%, 12/1/2016 | | | | Ba1 | | | | | 800,000 | | | | | 849,583 | |
| | | | | | | | | | | | | | | |
| | | | | | | | | | | | | | 8,294,570 | |
| | | | | | | | | | | | | | | |
Household Durables - 1.6% | | | | | | | | | | | | | | | |
Fortune Brands, Inc., 5.375%, 1/15/2016 | | | | Baa3 | | | | | 4,485,000 | | | | | 4,859,816 | |
Tupperware Brands Corp.2, 4.75%, 6/1/2021 | | | | Baa3 | | | | | 4,000,000 | | | | | 3,944,256 | |
| | | | | | | | | | | | | | | |
| | | | | | | | | | | | | | 8,804,072 | |
| | | | | | | | | | | | | | | |
Media - 4.6% | | | | | | | | | | | | | | | |
Cablevision Systems Corp., 8.625%, 9/15/2017 | | | | B1 | | | | | 835,000 | | | | | 904,931 | |
Columbus International, Inc. (Barbados)2, 11.50%, 11/20/2014 | | | | B2 | | | | | 900,000 | | | | | 1,022,625 | |
DIRECTV Holdings LLC - DIRECTV Financing Co., Inc., 5.20%, 3/15/2020 | | | | Baa2 | | | | | 4,710,000 | | | | | 4,983,594 | |
Discovery Communications LLC, 5.05%, 6/1/2020 | | | | Baa2 | | | | | 4,875,000 | | | | | 5,162,123 | |
MDC Partners, Inc. (Canada), 11.00%, 11/1/2016 | | | | B2 | | | | | 620,000 | | | | | 695,175 | |
NBC Universal Media LLC2, 5.15%, 4/30/2020 | | | | Baa2 | | | | | 5,510,000 | | | | | 5,818,020 | |
Sirius XM Radio, Inc.2, 9.75%, 9/1/2015 | | | | Ba2 | | | | | 1,405,000 | | | | | 1,545,500 | |
Time Warner, Inc., 4.75%, 3/29/2021 | | | | Baa2 | | | | | 4,110,000 | | | | | 4,180,906 | |
UPCB Finance III Ltd. (Cayman Islands)2, 6.625%, 7/1/2020 | | | | Ba3 | | | | | 1,435,000 | | | | | 1,417,063 | |
| | | | | | | | | | | | | | | |
| | | | | | | | | | | | | | 25,729,937 | |
| | | | | | | | | | | | | | | |
Multiline Retail - 0.6% | | | | | | | | | | | | | | | |
Target Corp., 6.00%, 1/15/2018 | | | | A2 | | | | | 3,225,000 | | | | | 3,726,755 | |
| | | | | | | | | | | | | | | |
| | | | | | |
| | The accompanying notes are an integral part of the financial statements. | | | 3 | |
Investment Portfolio - June 30, 2011 (unaudited)
| | | | | | | | | | | | | | | |
| | | Credit
Rating1 | | Principal Amount | | Value
(Note 2) |
| | | |
CORPORATE BONDS (continued) | | | | | | | | | | | | | | | |
| | | |
Non-Convertible Corporate Bonds (continued) | | | | | | | | | | | | | | | |
Consumer Discretionary (continued) | | | | | | | | | | | | | | | |
Specialty Retail - 3.3% | | | | | | | | | | | | | | | |
AutoZone, Inc., 4.00%, 11/15/2020 | | | | Baa2 | | | | $ | 1,650,000 | | | | $ | 1,576,656 | |
Best Buy Co., Inc., 5.50%, 3/15/2021 | | | | Baa2 | | | | | 4,000,000 | | | | | 3,938,328 | |
DirectBuy Holdings, Inc.2, 12.00%, 2/1/2017 | | | | B2 | | | | | 1,000,000 | | | | | 390,000 | |
The Home Depot, Inc., 5.40%, 3/1/2016 | | | | Baa1 | | | | | 4,325,000 | | | | | 4,832,816 | |
Lowe’s Companies, Inc., 6.10%, 9/15/2017 | | | | A1 | | | | | 3,175,000 | | | | | 3,733,705 | |
O’Reilly Automotive, Inc., 4.875%, 1/14/2021 | | | | Baa3 | | | | | 2,500,000 | | | | | 2,512,120 | |
Rent-A-Center, Inc., 6.625%, 11/15/2020 | | | | BB | | | | | 1,000,000 | | | | | 995,000 | |
Toys R Us Property Co. II, LLC, 8.50%, 12/1/2017 | | | | Ba1 | | | | | 920,000 | | | | | 961,400 | |
| | | | | | | | | | | | | | | |
| | | | | | | | | | | | | | 18,940,025 | |
| | | | | | | | | | | | | | | |
Textiles, Apparel & Luxury Goods - 0.6% | | | | | | | | | | | | | | | |
VF Corp., 5.95%, 11/1/2017 | | | | A3 | | | | | 2,815,000 | | | | | 3,251,632 | |
| | | | | | | | | | | | | | | |
Total Consumer Discretionary | | | | | | | | | | | | | | 69,776,991 | |
| | | | | | | | | | | | | | | |
Consumer Staples - 1.7% | | | | | | | | | | | | | | | |
Beverages - 0.8% | | | | | | | | | | | | | | | |
CEDC Finance Corp. International, Inc.2, 9.125%, 12/1/2016 | | | | B1 | | | | | 1,215,000 | | | | | 1,108,688 | |
Constellation Brands, Inc., 8.375%, 12/15/2014 | | | | Ba2 | | | | | 1,205,000 | | | | | 1,370,688 | |
Constellation Brands, Inc., 7.25%, 9/1/2016 | | | | Ba2 | | | | | 750,000 | | | | | 819,375 | |
PepsiCo, Inc., 7.90%, 11/1/2018 | | | | Aa3 | | | | | 713,000 | | | | | 918,879 | |
| | | | | | | | | | | | | | | |
| | | | | | | | | | | | | | 4,217,630 | |
| | | | | | | | | | | | | | | |
Food Products - 0.7% | | | | | | | | | | | | | | | |
Kraft Foods, Inc., 6.125%, 2/1/2018 | | | | Baa2 | | | | | 3,610,000 | | | | | 4,153,070 | |
| | | | | | | | | | | | | | | |
Household Products - 0.0%* | | | | | | | | | | | | | | | |
The Procter & Gamble Co., 4.85%, 12/15/2015 | | | | Aa3 | | | | | 25,000 | | | | | 28,145 | |
| | | | | | | | | | | | | | | |
Personal Products - 0.2% | | | | | | | | | | | | | | | |
Revlon Consumer Products Corp., 9.75%, 11/15/2015 | | | | B2 | | | | | 990,000 | | | | | 1,064,250 | |
| | | | | | | | | | | | | | | |
Total Consumer Staples | | | | | | | | | | | | | | 9,463,095 | |
| | | | | | | | | | | | | | | |
Energy - 6.4% | | | | | | | | | | | | | | | |
Energy Equipment & Services - 3.2% | | | | | | | | | | | | | | | |
Baker Hughes, Inc., 7.50%, 11/15/2018 | | | | A2 | | | | | 3,155,000 | | | | | 3,977,707 | |
Calfrac Holdings LP2, 7.50%, 12/1/2020 | | | | B2 | | | | | 1,000,000 | | | | | 1,010,000 | |
Schlumberger Oilfield plc (United Kingdom)2, 4.20%, 1/15/2021 | | | | A1 | | | | | 2,630,000 | | | | | 2,659,232 | |
SESI LLC2, 6.375%, 5/1/2019 | | | | Ba3 | | | | | 710,000 | | | | | 702,900 | |
Thermon Industries, Inc., 9.50%, 5/1/2017 | | | | B1 | | | | | 666,000 | | | | | 714,285 | |
Trinidad Drilling Ltd. (Canada)2, 7.875%, 1/15/2019 | | | | B2 | | | | | 1,000,000 | | | | | 1,035,000 | |
Weatherford International Ltd. (Switzerland), 9.625%, 3/1/2019 | | | | Baa2 | | | | | 6,175,000 | | | | | 7,974,654 | |
| | | | | | | | | | | | | | | |
| | | | | | | | | | | | | | 18,073,778 | |
| | | | | | | | | | | | | | | |
Oil, Gas & Consumable Fuels - 3.2% | | | | | | | | | | | | | | | |
Anadarko Petroleum Corp., 5.95%, 9/15/2016 | | | | Ba1 | | | | | 5,825,000 | | | | | 6,556,544 | |
| | | | |
| 4 | | The accompanying notes are an integral part of the financial statements. | | |
Investment Portfolio - June 30, 2011 (unaudited)
| | | | | | | | | | | | | | | |
| | | Credit
Rating1 | | Principal Amount | | Value
(Note 2) |
| | | |
CORPORATE BONDS (continued) | | | | | | | | | | | | | | | |
| | | |
Non-Convertible Corporate Bonds (continued) | | | | | | | | | | | | | | | |
Energy (continued) | | | | | | | | | | | | | | | |
Oil, Gas & Consumable Fuels (continued) | | | | | | | | | | | | | | | |
Arch Western Finance LLC, 6.75%, 7/1/2013 | | | | B1 | | | | $ | 694,000 | | | | $ | 694,867 | |
Coffeyville Resources LLC - Coffeyville Finance, Inc.2, 9.00%, 4/1/2015 | | | | Ba3 | | | | | 373,000 | | | | | 404,705 | |
Coffeyville Resources LLC - Coffeyville Finance, Inc.2, 10.875%, 4/1/2017 | | | | B3 | | | | | 395,000 | | | | | 448,325 | |
Crosstex Energy LP - Crosstex Energy Finance Corp., 8.875%, 2/15/2018 | | | | B2 | | | | | 885,000 | | | | | 942,525 | |
Hess Corp., 5.60%, 2/15/2041 | | | | Baa2 | | | | | 5,125,000 | | | | | 5,009,503 | |
Martin Midstream Partners LP - Martin Midstream Finance Corp., 8.875%, 4/1/2018 | | | | B | 4 | | | | 840,000 | | | | | 882,000 | |
Niska Gas Storage US LLC - Niska Gas Storage Canada ULC, 8.875%, 3/15/2018 | | | | B1 | | | | | 605,000 | | | | | 635,250 | |
Targa Resources Partners LP - Targa Resources Partners | | | | | | | | | | | | | | | |
Finance Corp., 8.25%, 7/1/2016 | | | | B1 | | | | | 750,000 | | | | | 791,250 | |
Tesoro Corp., 9.75%, 6/1/2019 | | | | Ba1 | | | | | 615,000 | | | | | 687,263 | |
Whiting Petroleum Corp., 7.00%, 2/1/2014 | | | | Ba3 | | | | | 1,000,000 | | | | | 1,075,000 | |
| | | | | | | | | | | | | | | |
| | | | | | | | | | | | | | 18,127,232 | |
| | | | | | | | | | | | | | | |
Total Energy | | | | | | | | | | | | | | 36,201,010 | |
| | | | | | | | | | | | | | | |
Financials - 28.8% | | | | | | | | | | | | | | | |
Capital Markets - 6.7% | | | | | | | | | | | | | | | |
Credit Suisse AG (Switzerland)2, 2.60%, 5/27/2016 | | | | Aaa | | | | | 4,295,000 | | | | | 4,284,778 | |
Goldman Sachs Capital I, 6.345%, 2/15/2034 | | | | A3 | | | | | 3,450,000 | | | | | 3,262,534 | |
Goldman Sachs Capital II5, 5.793%, 12/29/2049 | | | | Baa2 | | | | | 4,205,000 | | | | | 3,364,000 | |
The Goldman Sachs Group, Inc., 6.15%, 4/1/2018 | | | | A1 | | | | | 3,385,000 | | | | | 3,684,041 | |
The Goldman Sachs Group, Inc., 5.375%, 3/15/2020 | | | | A1 | | | | | 4,510,000 | | | | | 4,657,229 | |
Jefferies Group, Inc., 8.50%, 7/15/2019 | | | | Baa2 | | | | | 4,110,000 | | | | | 4,860,839 | |
Morgan Stanley, 5.55%, 4/27/2017 | | | | A2 | | | | | 3,544,000 | | | | | 3,756,799 | |
Morgan Stanley, 5.50%, 1/26/2020 | | | | A2 | | | | | 4,485,000 | | | | | 4,543,444 | |
Morgan Stanley, 5.75%, 1/25/2021 | | | | A2 | | | | | 5,400,000 | | | | | 5,463,877 | |
| | | | | | | | | | | | | | | |
| | | | | | | | | | | | | | 37,877,541 | |
| | | | | | | | | | | | | | | |
Commercial Banks - 8.1% | | | | | | | | | | | | | | | |
Intesa Sanpaolo S.p.A. (Italy)2, 6.50%, 2/24/2021 | | | | Aa3 | | | | | 5,545,000 | | | | | 5,783,019 | |
KeyBank National Association, 5.45%, 3/3/2016 | | | | Baa1 | | | | | 4,640,000 | | | | | 5,033,964 | |
Manufacturers & Traders Trust Co., 6.625%, 12/4/2017 | | | | A3 | | | | | 5,665,000 | | | | | 6,506,315 | |
National City Corp., 6.875%, 5/15/2019 | | | | Baa1 | | | | | 1,920,000 | | | | | 2,212,598 | |
PNC Bank National Association, 5.25%, 1/15/2017 | | | | A3 | | | | | 5,640,000 | | | | | 6,122,914 | |
Santander Holdings USA, Inc., 4.625%, 4/19/2016 | | | | Baa1 | | | | | 750,000 | | | | | 753,725 | |
Santander Issuances S.A. Unipersonal (Spain)2, 5.911%, 6/20/2016 | | | | Aa3 | | | | | 5,300,000 | | | | | 5,393,890 | |
| | | | | | |
| | The accompanying notes are an integral part of the financial statements. | | | 5 | |
Investment Portfolio - June 30, 2011 (unaudited)
| | | | | | | | | | | | | | | |
| | | Credit
Rating1 | | Principal Amount | | Value
(Note 2) |
| | | |
CORPORATE BONDS (continued) | | | | | | | | | | | | | | | |
| | | |
Non-Convertible Corporate Bonds (continued) | | | | | | | | | | | | | | | |
Financials (continued) | | | | | | | | | | | | | | | |
Commercial Banks (continued) | | | | | | | | | | | | | | | |
Societe Generale S.A. (France)2, 5.75%, 4/20/2016 | | | | Aa3 | | | | $ | 5,515,000 | | | | $ | 5,510,577 | |
U.S. Bank National Association, 6.375%, 8/1/2011 | | | | Aa3 | | | | | 85,000 | | | | | 85,357 | |
USB Capital XIII Trust, 6.625%, 12/15/2039 | | | | A2 | | | | | 3,580,000 | | | | | 3,679,954 | |
Wachovia Corp., 5.25%, 8/1/2014 | | | | A2 | | | | | 4,500,000 | | | | | 4,823,393 | |
| | | | | | | | | | | | | | | |
| | | | | | | | | | | | | | 45,905,706 | |
| | | | | | | | | | | | | | | |
Consumer Finance - 1.9% | | | | | | | | | | | | | | | |
American Express Co., 8.125%, 5/20/2019 | | | | A3 | | | | | 3,935,000 | | | | | 4,988,742 | |
American Express Co.5, 6.80%, 9/1/2066 | | | | Baa2 | | | | | 3,445,000 | | | | | 3,539,738 | |
Credit Acceptance Corp., 9.125%, 2/1/2017 | | | | B1 | | | | | 1,060,000 | | | | | 1,134,200 | |
Discover Financial Services, 10.25%, 7/15/2019 | | | | Ba1 | | | | | 860,000 | | | | | 1,111,248 | |
| | | | | | | | | | | | | | | |
| | | | | | | | | | | | | | 10,773,928 | |
| | | | | | | | | | | | | | | |
Diversified Financial Services - 3.6% | | | | | | | | | | | | | | | |
Bank of America Corp., 5.75%, 8/15/2016 | | | | A3 | | | | | 3,715,000 | | | | | 3,919,953 | |
Bank of America Corp., 7.625%, 6/1/2019 | | | | A2 | | | | | 3,315,000 | | | | | 3,840,069 | |
Bank of America Corp.6, 5.13%, 2/24/2026 | | | | A2 | | | | | 2,720,000 | | | | | 2,652,269 | |
Citigroup, Inc., 8.50%, 5/22/2019 | | | | A3 | | | | | 4,110,000 | | | | | 5,094,982 | |
JPMorgan Chase & Co., 6.30%, 4/23/2019 | | | | Aa3 | | | | | 4,300,000 | | | | | 4,846,685 | |
| | | | | | | | | | | | | | | |
| | | | | | | | | | | | | | 20,353,958 | |
| | | | | | | | | | | | | | | |
Insurance - 1.4% | | | | | | | | | | | | | | | |
American International Group, Inc., 4.25%, 5/15/2013 | | | | Baa1 | | | | | 1,840,000 | | | | | 1,891,470 | |
Fidelity National Financial, Inc., 6.60%, 5/15/2017 | | | | Baa3 | | | | | 5,035,000 | | | | | 5,314,669 | |
Hartford Financial Services Group, Inc.5, 8.125%, 6/15/2038 | | | | Ba1 | | | | | 580,000 | | | | | 624,950 | |
| | | | | | | | | | | | | | | |
| | | | | | | | | | | | | | 7,831,089 | |
| | | | | | | | | | | | | | | |
Real Estate Investment Trusts (REITS) - 7.1% | | | | | | | | | | | | | | | |
BioMed Realty LP, 3.85%, 4/15/2016 | | | | Baa3 | | | | | 2,750,000 | | | | | 2,771,698 | |
Boston Properties LP, 5.875%, 10/15/2019 | | | | Baa2 | | | | | 4,455,000 | | | | | 4,881,067 | |
Camden Property Trust, 5.70%, 5/15/2017 | | | | Baa1 | | | | | 4,025,000 | | | | | 4,433,485 | |
Digital Realty Trust LP, 5.875%, 2/1/2020 | | | | Baa2 | | | | | 1,000,000 | | | | | 1,048,409 | |
Digital Realty Trust LP, 5.25%, 3/15/2021 | | | | Baa2 | | | | | 4,180,000 | | | | | 4,158,306 | |
HCP, Inc., 6.70%, 1/30/2018 | | | | Baa2 | | | | | 4,500,000 | | | | | 5,030,730 | |
Health Care REIT, Inc., 6.20%, 6/1/2016 | | | | Baa2 | | | | | 4,390,000 | | | | | 4,874,265 | |
Host Hotels & Resorts LP, 6.375%, 3/15/2015 | | | | Ba1 | | | | | 740,000 | | | | | 754,800 | |
Mack-Cali Realty LP, 7.75%, 8/15/2019 | | | | Baa2 | | | | | 2,665,000 | | | | | 3,206,006 | |
National Retail Properties, Inc., 6.875%, 10/15/2017 | | | | Baa2 | | | | | 2,365,000 | | | | | 2,637,845 | |
Omega Healthcare Investors, Inc., 7.50%, 2/15/2020 | | | | Ba2 | | | | | 1,000,000 | | | | | 1,060,000 | |
Simon Property Group LP, 10.35%, 4/1/2019 | | | | A3 | | | | | 3,670,000 | | | | | 5,080,054 | |
| | | | | | | | | | | | | | | |
| | | | | | | | | | | | | | 39,936,665 | |
| | | | | | | | | | | | | | | |
Total Financials | | | | | | | | | | | | | | 162,678,887 | |
| | | | | | | | | | | | | | | |
| | | | |
| 6 | | The accompanying notes are an integral part of the financial statements. | | |
Investment Portfolio - June 30, 2011 (unaudited)
| | | | | | | | | | | | | | | |
| | | Credit
Rating1 | | Principal Amount | | Value
(Note 2) |
| | | |
CORPORATE BONDS (continued) | | | | | | | | | | | | | | | |
| | | |
Non-Convertible Corporate Bonds (continued) | | | | | | | | | | | | | | | |
Health Care - 3.5% | | | | | | | | | | | | | | | |
Biotechnology - 0.9% | | | | | | | | | | | | | | | |
Amgen, Inc., 3.45%, 10/1/2020 | | | | A3 | | | | $ | 5,000,000 | | | | $ | 4,767,560 | |
| | | | | | | | | | | | | | | |
Health Care Equipment & Supplies - 0.9% | | | | | | | | | | | | | | | |
Alere, Inc., 9.00%, 5/15/2016 | | | | B3 | | | | | 1,300,000 | | | | | 1,353,625 | |
CR Bard, Inc., 4.40%, 1/15/2021 | | | | A3 | | | | | 800,000 | | | | | 823,935 | |
Fresenius Medical Care US Finance, Inc., 6.875%, 7/15/2017 | | | | Ba2 | | | | | 720,000 | | | | | 761,400 | |
Fresenius US Finance II, Inc.2, 9.00%, 7/15/2015 | | | | Ba1 | | | | | 1,320,000 | | | | | 1,493,250 | |
Teleflex, Inc., 6.875%, 6/1/2019 | | | | B1 | | | | | 705,000 | | | | | 713,813 | |
| | | | | | | | | | | | | | | |
| | | | | | | | | | | | | | 5,146,023 | |
| | | | | | | | | | | | | | | |
Health Care Providers & Services - 1.1% | | | | | | | | | | | | | | | |
BioScrip, Inc., 10.25%, 10/1/2015 | | | | Caa1 | | | | | 795,000 | | | | | 829,781 | |
Health Management Associates, Inc., 6.125%, 4/15/2016 | | | | BB | 4 | | | | 1,050,000 | | | | | 1,089,375 | |
UnitedHealth Group, Inc., 4.70%, 2/15/2021 | | | | Baa1 | | | | | 4,000,000 | | | | | 4,170,132 | |
| | | | | | | | | | | | | | | |
| | | | | | | | | | | | | | 6,089,288 | |
| | | | | | | | | | | | | | | |
Life Sciences Tools & Services - 0.6% | | | | | | | | | | | | | | | |
PharmaNet Development Group, Inc.2, 10.875%, 4/15/2017 | | | | B3 | | | | | 825,000 | | | | | 1,031,250 | |
Thermo Fisher Scientific, Inc., 4.50%, 3/1/2021 | | | | A3 | | | | | 2,400,000 | | | | | 2,474,215 | |
| | | | | | | | | | | | | | | |
| | | | | | | | | | | | | | 3,505,465 | |
| | | | | | | | | | | | | | | |
Total Health Care | | | | | | | | | | | | | | 19,508,336 | |
| | | | | | | | | | | | | | | |
Industrials - 12.1% | | | | | | | | | | | | | | | |
Aerospace & Defense - 0.8% | | | | | | | | | | | | | | | |
The Boeing Co., 6.00%, 3/15/2019 | | | | A2 | | | | | 3,465,000 | | | | | 4,022,214 | |
Ducommun, Inc.2, 9.75%, 7/15/2018 | | | | B3 | | | | | 720,000 | | | | | 739,800 | |
| | | | | | | | | | | | | | | |
| | | | | | | | | | | | | | 4,762,014 | |
| | | | | | | | | | | | | | | |
Air Freight & Logistics - 0.3% | | | | | | | | | | | | | | | |
Aguila 3 S.A. (Luxembourg)2, 7.875%, 1/31/2018 | | | | B2 | | | | | 1,110,000 | | | | | 1,116,937 | |
FedEx Corp., 8.00%, 1/15/2019 | | | | Baa2 | | | | | 435,000 | | | | | 546,656 | |
| | | | | | | | | | | | | | | |
| | | | | | | | | | | | | | 1,663,593 | |
| | | | | | | | | | | | | | | |
Airlines - 1.6% | | | | | | | | | | | | | | | |
Continental Airlines Pass-Through Trust, Series 1997-4, Class A, 6.90%, 1/2/2018 | | | | Baa2 | | | | | 329,569 | | | | | 348,915 | |
Continental Airlines, Inc.2, 6.75%, 9/15/2015 | | | | Ba2 | | | | | 1,000,000 | | | | | 1,005,000 | |
Delta Air Lines Pass-Through Trust, Series 2001-1, Class A-2, 7.111%, 9/18/2011 | | | | BBB | 4 | | | | 1,245,000 | | | | | 1,258,944 | |
Delta Air Lines Pass-Through Trust, Series 2007-1, Class A, 6.821%, 8/10/2022 | | | | Baa1 | | | | | 1,177,346 | | | | | 1,224,439 | |
Delta Air Lines Pass-Through Trust, Series 2010-1, Class B2, 6.375%, 1/2/2016 | | | | Ba3 | | | | | 630,000 | | | | | 604,800 | |
| | | | | | |
| | The accompanying notes are an integral part of the financial statements. | | | 7 | |
Investment Portfolio - June 30, 2011 (unaudited)
| | | | | | | | | | | | | | | |
| | | Credit
Rating1 | | Principal Amount | | Value
(Note 2) |
| | | |
CORPORATE BONDS (continued) | | | | | | | | | | | | | | | |
| | | |
Non-Convertible Corporate Bonds (continued) | | | | | | | | | | | | | | | |
Industrials (continued) | | | | | | | | | | | | | | | |
Airlines (continued) | | | | | | | | | | | | | | | |
Delta Air Lines Pass-Through Trust, Series 2010-2, Class B, 6.75%, 11/23/2015 | | | | Ba3 | | | | $ | 365,000 | | | | $ | 350,400 | |
Southwest Airlines Co., 5.25%, 10/1/2014 | | | | Baa3 | | | | | 3,925,000 | | | | | 4,247,082 | |
| | | | | | | | | | | | | | | |
| | | | | | | | | | | | | | 9,039,580 | |
| | | | | | | | | | | | | | | |
Building Products - 0.3% | | | | | | | | | | | | | | | |
Building Materials Corp. of America2, 6.875%, 8/15/2018 | | | | Ba3 | | | | | 630,000 | | | | | 642,600 | |
Owens Corning, 9.00%, 6/15/2019 | | | | Ba1 | | | | | 840,000 | | | | | 1,003,292 | |
| | | | | | | | | | | | | | | |
| | | | | | | | | | | | | | 1,645,892 | |
| | | | | | | | | | | | | | | |
Commercial Services & Supplies - 1.2% | | | | | | | | | | | | | | | |
Clean Harbors, Inc., 7.625%, 8/15/2016 | | | | Ba3 | | | | | 900,000 | | | | | 954,000 | |
Garda World Security Corp. (Canada)2, 9.75%, 3/15/2017 | | | | B2 | | | | | 800,000 | | | | | 846,000 | |
Waste Management, Inc., 7.375%, 3/11/2019 | | | | Baa3 | | | | | 3,930,000 | | | | | 4,773,846 | |
| | | | | | | | | | | | | | | |
| | | | | | | | | | | | | | 6,573,846 | |
| | | | | | | | | | | | | | | |
Industrial Conglomerates - 3.7% | | | | | | | | | | | | | | | |
GE Capital Trust I5, 6.375%, 11/15/2067 | | | | Aa3 | | | | | 3,545,000 | | | | | 3,629,194 | |
General Electric Capital Corp., 5.625%, 5/1/2018 | �� | | | Aa2 | | | | | 2,150,000 | | | | | 2,351,494 | |
General Electric Capital Corp., 5.50%, 1/8/2020 | | | | Aa2 | | | | | 3,105,000 | | | | | 3,325,138 | |
General Electric Capital Corp., Series A, 6.75%, 3/15/2032 | | | | Aa2 | | | | | 3,695,000 | | | | | 4,105,337 | |
General Electric Co., 5.25%, 12/6/2017 | | | | Aa2 | | | | | 2,100,000 | | | | | 2,326,430 | |
Textron, Inc., 7.25%, 10/1/2019 | | | | Baa3 | | | | | 3,790,000 | | | | | 4,455,801 | |
Tyco Electronics Group S.A. (Luxembourg), 4.875%, 1/15/2021 | | | | Baa2 | | | | | 800,000 | | | | | 829,422 | |
| | | | | | | | | | | | | | | |
| | | | | | | | | | | | | | 21,022,816 | |
| | | | | | | | | | | | | | | |
Machinery - 1.8% | | | | | | | | | | | | | | | |
Caterpillar Financial Services Corp., 7.05%, 10/1/2018 | | | | A2 | | | | | 3,385,000 | | | | | 4,133,024 | |
John Deere Capital Corp., 5.50%, 4/13/2017 | | | | A2 | | | | | 1,240,000 | | | | | 1,423,075 | |
John Deere Capital Corp., 5.75%, 9/10/2018 | | | | A2 | | | | | 3,795,000 | | | | | 4,356,504 | |
| | | | | | | | | | | | | | | |
| | | | | | | | | | | | | | 9,912,603 | |
| | | | | | | | | | | | | | | |
Marine - 0.3% | | | | | | | | | | | | | | | |
Navios Maritime Holdings, Inc. - Navios Maritime Finance US, Inc. (Marshall Island), 8.875%, 11/1/2017 | | | | Ba3 | | | | | 1,530,000 | | | | | 1,575,900 | |
| | | | | | | | | | | | | | | |
Road & Rail - 2.1% | | | | | | | | | | | | | | | |
JB Hunt Transport Services, Inc., 3.375%, 9/15/2015 | | | | Baa3 | | | | | 7,865,000 | | | | | 7,943,619 | |
Union Pacific Corp., 5.65%, 5/1/2017 | | | | Baa2 | | | | | 3,675,000 | | | | | 4,160,486 | |
| | | | | | | | | | | | | | | |
| | | | | | | | | | | | | | 12,104,105 | |
| | | | | | | | | | | | | | | |
Total Industrials | | | | | | | | | | | | | | 68,300,349 | |
| | | | | | | | | | | | | | | |
| | | | |
| 8 | | The accompanying notes are an integral part of the financial statements. | | |
Investment Portfolio - June 30, 2011 (unaudited)
| | | | | | | | | | | | | | | |
| | | Credit
Rating1 | | Principal Amount | | Value
(Note 2) |
| | | |
CORPORATE BONDS (continued) | | | | | | | | | | | | | | | |
| | | |
Non-Convertible Corporate Bonds (continued) | | | | | | | | | | | | | | | |
Information Technology - 2.2% | | | | | | | | | | | | | | | |
Communications Equipment - 0.3% | | | | | | | | | | | | | | | |
Alcatel-Lucent USA, Inc., 6.50%, 1/15/2028 | | | | B1 | | | | $ | 1,000,000 | | | | $ | 897,500 | |
EH Holding Corp.2, 6.50%, 6/15/2019 | | | | Ba3 | | | | | 705,000 | | | | | 717,337 | |
| | | | | | | | | | | | | | | |
| | | | | | | | | | | | | | 1,614,837 | |
| | | | | | | | | | | | | | | |
Electronic Equipment, Instruments & Components - 0.6% | | | | | | | | | | | | | | | |
Corning, Inc., 4.25%, 8/15/2020 | | | | Baa1 | | | | | 2,500,000 | | | | | 2,509,663 | |
CPI International Acquisition, Inc.2, 8.00%, 2/15/2018 | | | | B3 | | | | | 730,000 | | | | | 689,850 | |
| | | | | | | | | | | | | | | |
| | | | | | | | | | | | | | 3,199,513 | |
| | | | | | | | | | | | | | | |
IT Services - 0.9% | | | | | | | | | | | | | | | |
The Western Union Co., 5.253%, 4/1/2020 | | | | A3 | | | | | 4,810,000 | | | | | 5,065,690 | |
| | | | | | | | | | | | | | | |
Semiconductors & Semiconductor Equipment - 0.2% | | | | | | | | | | | | | | | |
Advanced Micro Devices, Inc., 8.125%, 12/15/2017 | | | | Ba3 | | | | | 475,000 | | | | | 496,375 | |
MagnaChip Semiconductor S.A. - MagnaChip Semiconductor Finance Co., 10.50%, 4/15/2018 | | | | B2 | | | | | 830,000 | | | | | 908,850 | |
| | | | | | | | | | | | | | | |
| | | | | | | | | | | | | | 1,405,225 | |
| | | | | | | | | | | | | | | |
Software - 0.2% | | | | | | | | | | | | | | | |
Oracle Corp.2, 3.875%, 7/15/2020 | | | | A1 | | | | | 1,325,000 | | | | | 1,316,606 | |
| | | | | | | | | | | | | | | |
Total Information Technology | | | | | | | | | | | | | | 12,601,871 | |
| | | | | | | | | | | | | | | |
Materials - 6.0% | | | | | | | | | | | | | | | |
Chemicals - 0.9% | | | | | | | | | | | | | | | |
E.I. du Pont de Nemours & Co., 6.00%, 7/15/2018 | | | | A2 | | | | | 3,435,000 | | | | | 3,963,853 | |
Ferro Corp., 7.875%, 8/15/2018 | | | | B2 | | | | | 1,030,000 | | | | | 1,068,625 | |
| | | | | | | | | | | | | | | |
| | | | | | | | | | | | | | 5,032,478 | |
| | | | | | | | | | | | | | | |
Containers & Packaging - 0.2% | | | | | | | | | | | | | | | |
Reynolds Group Issuer, Inc. - Reynolds Group Issuer LLC2, 7.125%, 4/15/2019 | | | | Ba3 | | | | | 1,375,000 | | | | | 1,364,687 | |
| | | | | | | | | | | | | | | |
Metals & Mining - 3.5% | | | | | | | | | | | | | | | |
Alcoa, Inc., 5.87%, 2/23/2022 | | | | Baa3 | | | | | 2,185,000 | | | | | 2,239,002 | |
Allegheny Technologies, Inc., 5.95%, 1/15/2021 | | | | Baa3 | | | | | 1,450,000 | | | | | 1,543,403 | |
ArcelorMittal (Luxembourg), 5.50%, 3/1/2021 | | | | Baa3 | | | | | 5,460,000 | | | | | 5,468,523 | |
BHP Billiton Finance (USA) Ltd. (Australia), 6.50%, 4/1/2019 | | | | A1 | | | | | 3,230,000 | | | | | 3,865,083 | |
Calcipar S.A. (Luxembourg)2, 6.875%, 5/1/2018 | | | | B1 | | | | | 1,075,000 | | | | | 1,077,687 | |
Cliffs Natural Resources, Inc., 5.90%, 3/15/2020 | | | | Baa3 | | | | | 1,000,000 | | | | | 1,082,662 | |
Cliffs Natural Resources, Inc., 4.80%, 10/1/2020 | | | | Baa3 | | | | | 2,000,000 | | | | | 2,010,536 | |
FMG Resources August 2006 Pty. Ltd. (Australia)2, 6.875%, 2/1/2018 | | | | B1 | | | | | 720,000 | | | | | 730,800 | |
Mirabela Nickel Ltd. (Australia)2, 8.75%, 4/15/2018 | | | | B2 | | | | | 710,000 | | | | | 706,450 | |
| | | | | | |
| | The accompanying notes are an integral part of the financial statements. | | | 9 | |
Investment Portfolio - June 30, 2011 (unaudited)
| | | | | | | | | | | | | | | |
| | | Credit
Rating1 | | Principal Amount | | Value
(Note 2) |
| | | |
CORPORATE BONDS (continued) | | | | | | | | | | | | | | | |
| | | |
Non-Convertible Corporate Bonds (continued) | | | | | | | | | | | | | | | |
Materials (continued) | | | | | | | | | | | | | | | |
Metals & Mining (continued) | | | | | | | | | | | | | | | |
Steel Dynamics, Inc., 7.75%, 4/15/2016 | | | | Ba2 | | | | $ | 655,000 | | | | $ | 687,750 | |
| | | | | | | | | | | | | | | |
| | | | | | | | | | | | | | 19,411,896 | |
| | | | | | | | | | | | | | | |
Paper & Forest Products - 1.4% | | | | | | | | | | | | | | | |
Georgia-Pacific LLC2, 8.25%, 5/1/2016 | | | | Ba1 | | | | | 910,000 | | | | | 1,031,539 | |
International Paper Co., 7.50%, 8/15/2021 | | | | Baa3 | | | | | 5,330,000 | | | | | 6,229,939 | |
Longview Fibre Paper & Packaging, Inc.2, 8.00%, 6/1/2016 | | | | B2 | | | | | 705,000 | | | | | 708,525 | |
| | | | | | | | | | | | | | | |
| | | | | | | | | | | | | | 7,970,003 | |
| | | | | | | | | | | | | | | |
Total Materials | | | | | | | | | | | | | | 33,779,064 | |
| | | | | | | | | | | | | | | |
Telecommunication Services - 2.6% | | | | | | | | | | | | | | | |
Diversified Telecommunication Services - 1.0% | | | | | | | | | | | | | | | |
Inmarsat Finance plc (United Kingdom)2, 7.375%, 12/1/2017 | | | | Ba2 | | | | | 1,000,000 | | | | | 1,060,000 | |
Intelsat Jackson Holdings S.A. (Luxembourg)2, 7.25%, 4/1/2019 | | | | B3 | | | | | 1,095,000 | | | | | 1,086,787 | |
Verizon Communications, Inc., 3.00%, 4/1/2016 | | | | A3 | | | | | 2,765,000 | | | | | 2,824,207 | |
Wind Acquisition Finance S.A. (Luxembourg)2, 11.75%, 7/15/2017 | | | | B2 | | | | | 905,000 | | | | | 1,024,913 | |
| | | | | | | | | | | | | | | |
| | | | | | | | | | | | | | 5,995,907 | |
| | | | | | | | | | | | | | | |
Wireless Telecommunication Services - 1.6% | | | | | | | | | | | | | | | |
CC Holdings GS V LLC - Crown Castle GS III Corp.2, 7.75%, 5/1/2017 | | | | Baa3 | | | | | 1,465,000 | | | | | 1,585,863 | |
Crown Castle Towers LLC2, 6.113%, 1/15/2020 | | | | A2 | | | | | 4,070,000 | | | | | 4,440,854 | |
Crown Castle Towers LLC2, 4.883%, 8/15/2020 | | | | A2 | | | | | 610,000 | | | | | 613,370 | |
SBA Tower Trust2, 5.101%, 4/15/2017 | | | | A2 | | | | | 2,095,000 | | | | | 2,184,038 | |
| | | | | | | | | | | | | | | |
| | | | | | | | | | | | | | 8,824,125 | |
| | | | | | | | | | | | | | | |
Total Telecommunication Services | | | | | | | | | | | | | | 14,820,032 | |
| | | | | | | | | | | | | | | |
Utilities - 2.1% | | | | | | | | | | | | | | | |
Electric Utilities - 1.8% | | | | | | | | | | | | | | | |
Allegheny Energy Supply Co. LLC2, 5.75%, 10/15/2019 | | | | Baa3 | | | | | 2,385,000 | | | | | 2,495,251 | |
Exelon Generation Co. LLC, 4.00%, 10/1/2020 | | | | A3 | | | | | 4,000,000 | | | | | 3,775,272 | |
Southwestern Electric Power Co., 6.45%, 1/15/2019 | | | | Baa3 | | | | | 3,240,000 | | | | | 3,670,865 | |
| | | | | | | | | | | | | | | |
| | | | | | | | | | | | | | 9,941,388 | |
| | | | | | | | | | | | | | | |
Gas Utilities - 0.2% | | | | | | | | | | | | | | | |
Ferrellgas LP - Ferrellgas Finance Corp.2, 6.50%, 5/1/2021 | | | | Ba3 | | | | | 1,000,000 | | | | | 945,000 | |
| | | | | | | | | | | | | | | |
| | | | |
| 10 | | The accompanying notes are an integral part of the financial statements. | | |
Investment Portfolio - June 30, 2011 (unaudited)
| | | | | | | | | | | | | | | |
| | | Credit
Rating1 | | Principal Amount/
Shares | | Value
(Note 2) |
| | | |
CORPORATE BONDS (continued) | | | | | | | | | | | | | | | |
| | | |
Non-Convertible Corporate Bonds (continued) | | | | | | | | | | | | | | | |
Utilities (continued) | | | | | | | | | | | | | | | |
Independent Power Producers & Energy Traders - 0.1% | | | | | | | | | | | | | | | |
The AES Corp., 8.00%, 10/15/2017 | | | | B1 | | | | $ | 745,000 | | | | $ | 789,700 | |
| | | | | | | | | | | | | | | |
Total Utilities | | | | | | | | | | | | | | 11,676,088 | |
| | | | | | | | | | | | | | | |
Total Non-Convertible Corporate Bonds
(Identified Cost $409,365,047) | | | | | | | | | | | | | | 438,805,723 | |
| | | | | | | | | | | | | | | |
TOTAL CORPORATE BONDS
(Identified Cost $417,402,042) | | | | | | | | | | | | | | 447,852,354 | |
| | | | | | | | | | | | | | | |
PREFERRED STOCKS - 2.6% | | | | | | | | | | | | | | | |
Financials - 2.6% | | | | | | | | | | | | | | | |
Commercial Banks - 0.9% | | | | | | | | | | | | | | | |
PNC Financial Services Group, Inc., Series K7, 8.25% | | | | Baa3 | | | | | 1,850,000 | | | | | 1,956,817 | |
Wells Fargo & Co., Series K7, 7.98% | | | | Baa3 | | | | | 3,145,000 | | | | | 3,396,600 | |
| | | | | | | | | | | | | | | |
| | | | | | | | | | | | | | 5,353,417 | |
| | | | | | | | | | | | | | | |
Diversified Financial Services - 1.2% | | | | | | | | | | | | | | | |
Bank of America Corp., Series K7, 8.00% | | | | Ba3 | | | | | 3,350,000 | | | | | 3,498,439 | |
JPMorgan Chase & Co., Series 17, 7.90% | | | | Baa1 | | | | | 2,985,000 | | | | | 3,206,159 | |
| | | | | | | | | | | | | | | |
| | | | | | | | | | | | | | 6,704,598 | |
| | | | | | | | | | | | | | | |
Real Estate Investment Trusts (REITS) - 0.5% | | | | | | | | | | | | | | | |
Public Storage, Series Q, 6.50% | | | | Baa1 | | | | | 109,100 | | | | | 2,795,142 | |
| | | | | | | | | | | | | | | |
TOTAL PREFERRED STOCKS
(Identified Cost $13,624,251) | | | | | | | | | | | | | | 14,853,157 | |
| | | | | | | | | | | | | | | |
ASSET-BACKED SECURITIES - 1.1% | | | | | | | | | | | | | | | |
Capital Auto Receivables Asset Trust, Series 2007-1, Class A4A, 5.01%, 4/16/2012 | | | | Aaa | | | | $ | 27,200 | | | | | 27,292 | |
Capital Auto Receivables Asset Trust, Series 2007-3, Class A4, 5.21%, 3/17/2014 | | | | Aaa | | | | | 74,961 | | | | | 76,004 | |
Ford Credit Auto Owner Trust, Series 2008-C, Class A4B5, 1.937%, 4/15/2013 | | | | Aaa | | | | | 300,000 | | | | | 302,228 | |
GMAC Mortgage Servicer Advance Funding Co. Ltd., Series 2011-1A, Class A2, 3.72%, 3/15/2023 | | | | Aaa | | | | | 260,000 | | | | | 261,950 | |
Hertz Vehicle Financing LLC, Series 2009-2A, Class A22, 5.29%, 3/25/2016 | | | | Aaa | | | | | 2,585,000 | | | | | 2,834,673 | |
Hertz Vehicle Financing LLC, Series 2010-1A, Class A22, 3.74%, 2/25/2017 | | | | Aaa | | | | | 2,360,000 | | | | | 2,436,219 | |
| | | | | | |
| | The accompanying notes are an integral part of the financial statements. | | | 11 | |
Investment Portfolio - June 30, 2011 (unaudited)
| | | | | | | | | | | | | | | |
| | | Credit
Rating1 | | Principal Amount | | Value
(Note 2) |
ASSET-BACKED SECURITIES (continued) | | | | | | | | | | | | | | | |
| | | |
SLM Student Loan Trust, Series 2002-4, Class A45, 0.387%, 3/15/2017 | | | | Aaa | | | | $ | 306,818 | | | | $ | 306,580 | |
| | | | | | | | | | | | | | | |
TOTAL ASSET-BACKED SECURITIES
(Identified Cost $5,885,537) | | | | | | | | | | | | | | 6,244,946 | |
| | | | | | | | | | | | | | | |
COMMERCIAL MORTGAGE-BACKED SECURITIES - 4.0% | | | | | | | | | | | | | | | |
Americold LLC Trust, Series 2010-ARTA, Class A12, 3.847%, 1/14/2029 | | | | AAA | 4 | | | | 420,846 | | | | | 429,283 | |
Banc of America Commercial Mortgage, Inc., Series 2006-2, Class A45, 5.731%, 5/10/2045 | | | | AAA | 4 | | | | 700,000 | | | | | 774,674 | |
Banc of America Commercial Mortgage, Inc., Series 2006-4, Class A4, 5.634%, 7/10/2046 | | | | Aaa | | | | | 335,000 | | | | | 366,547 | |
Bear Stearns Commercial Mortgage Securities, Series 2005-PWR9, Class A4A, 4.871%, 9/11/2042 | | | | Aaa | | | | | 715,000 | | | | | 767,372 | |
Bear Stearns Commercial Mortgage Securities, Series 2006-PW12, Class A45, 5.72%, 9/11/2038 | | | | Aaa | | | | | 1,010,000 | | | | | 1,112,251 | |
Bear Stearns Commercial Mortgage Securities, Series 2006-PW13, Class A4, 5.54%, 9/11/2041 | | | | AAA | 4 | | | | 650,000 | | | | | 708,352 | |
CFCRE Commercial Mortgage Trust, Series 2011-C1, Class A22, 3.759%, 4/15/2044 | | | | Aaa | | | | | 240,000 | | | | | 243,634 | |
Citigroup Commercial Mortgage Trust, Series 2006-C4, Class A35, 5.729%, 3/15/2049 | | | | Aaa | | | | | 575,000 | | | | | 633,531 | |
Commercial Mortgage Pass-Through Certificates, Series 2006-C7, Class A45, 5.751%, 6/10/2046 | | | | AAA | 4 | | | | 900,000 | | | | | 996,971 | |
Commercial Mortgage Pass-Through Certificates, Series 2010-C1, Class A12, 3.156%, 7/10/2046 | | | | Aaa | | | | | 1,288,747 | | | | | 1,297,941 | |
FREMF Mortgage Trust, Series 2011-K701, Class B2,5, 4.437%, 7/25/2048 | | | | A | 4 | | | | 950,000 | | | | | 928,140 | |
FREMF Mortgage Trust, Series 2011-K702, Class B2,5, 4.771%, 4/25/2044 | | | | A3 | | | | | 230,000 | | | | | 217,440 | |
Greenwich Capital Commercial Funding Corp., Series 2006-GG7, Class A45, 5.881%, 7/10/2038 | | | | Aaa | | | | | 1,695,000 | | | | | 1,881,858 | |
JP Morgan Chase Commercial Mortgage Securities Corp., Series 2005-CB13, Class A45, 5.278%, 1/12/2043 | | | | Aaa | | | | | 350,000 | | | | | 378,452 | |
JP Morgan Chase Commercial Mortgage Securities Corp., Series 2005-LDP5, Class A45, 5.205%, 12/15/2044 | | | | Aaa | | | | | 1,670,000 | | | | | 1,822,423 | |
JP Morgan Chase Commercial Mortgage Securities Corp., Series 2006-LDP7, Class A45, 5.88%, 4/15/2045 | | | | Aaa | | | | | 560,000 | | | | | 621,517 | |
JP Morgan Chase Commercial Mortgage Securities Corp., Series 2010-C2, Class A32, 4.07%, 11/15/2043 | | | | AAA | 4 | | | | 750,000 | | | | | 725,029 | |
LB-UBS Commercial Mortgage Trust, Series 2006-C4, Class A45, 5.87%, 6/15/2038 | | | | Aaa | | | | | 970,000 | | | | | 1,071,656 | |
| | | | |
| 12 | | The accompanying notes are an integral part of the financial statements. | | |
Investment Portfolio - June 30, 2011 (unaudited)
| | | | | | | | | | | | | | | |
| | | Credit
Rating1 | | Principal Amount/
Shares | | Value
(Note 2) |
COMMERCIAL MORTGAGE-BACKED SECURITIES (continued) | | | | | | | | | | | | | | | |
Merrill Lynch - Countrywide Commercial Mortgage Trust, Series 2006-3, Class A45, 5.414%, 7/12/2046 | | | | Aaa | | | | $ | 605,000 | | | | $ | 651,872 | |
Morgan Stanley Capital I, Series 2005-HQ7, Class A45, 5.202%, 11/14/2042 | | | | Aaa | | | | | 385,000 | | | | | 418,190 | |
Morgan Stanley Capital I, Series 2005-IQ10, Class A4A5, 5.23%, 9/15/2042 | | | | Aaa | | | | | 210,000 | | | | | 227,764 | |
Morgan Stanley Capital I, Series 2011-C1, Class A22, 3.884%, 9/15/2047 | | | | AAA | 4 | | | | 200,000 | | | | | 205,655 | |
OBP Depositor LLC Trust, Series 2010-OBP, Class A2, 4.646%, 7/15/2045 | | | | AAA | 4 | | | | 420,000 | | | | | 435,902 | |
Vornado DP LLC, Series 2010-VNO, Class A2FX2, 4.004%, 9/13/2028 | | | | AAA | 4 | | | | 1,195,000 | | | | | 1,163,879 | |
Wachovia Bank Commercial Mortgage Trust, Series 2005-C21, Class A45, 5.206%, 10/15/2044 | | | | Aaa | | | | | 820,000 | | | | | 894,138 | |
Wachovia Bank Commercial Mortgage Trust, Series 2006-C25, Class A45, 5.737%, 5/15/2043 | | | | Aaa | | | | | 770,000 | | | | | 849,785 | |
Wachovia Bank Commercial Mortgage Trust, Series 2006-C26, Class A35, 6.011%, 6/15/2045 | | | | Aaa | | | | | 1,220,000 | | | | | 1,354,464 | |
Wells Fargo Commercial Mortgage Trust, Series 2010-C1, Class A22, 4.393%, 11/15/2043 | | | | Aaa | | | | | 1,350,000 | | | | | 1,344,728 | |
| | | | | | | | | | | | | | | |
| | | |
TOTAL COMMERCIAL MORTGAGE-BACKED SECURITIES
(Identified Cost $22,131,556) | | | | | | | | | | | | | | 22,523,448 | |
| | | | | | | | | | | | | | | |
| | | |
FOREIGN GOVERNMENT BONDS - 0.5% | | | | | | | | | | | | | | | |
| | | |
Hellenic Republic Government Bond (Greece), 6.00%, 7/19/2019
(Identified Cost $5,190,594) | | | | Ba1 EUR | | | | | 4,000,000 | | | | | 2,827,808 | |
| | | | | | | | | | | | | | | |
| | | |
MUNICIPAL BONDS - 0.5% | | | | | | | | | | | | | | | |
| | | |
New York City, Public Impt., G.O. Bond, 6.646%, 12/1/2031
(Identified Cost $2,500,000) | | | | Aa2 | | | | $ | 2,500,000 | | | | | 2,698,750 | |
| | | | | | | | | | | | | | | |
| | | |
MUTUAL FUNDS - 0.8% | | | | | | | | | | | | | | | |
| | | |
iShares iBoxx Investment Grade Corporate Bond Fund | | | | | | | | | 37,640 | | | | | 4,145,293 | |
John Hancock Preferred Income Fund | | | | | | | | | 10,500 | | | | | 218,085 | |
| | | | | | | | | | | | | | | |
TOTAL MUTUAL FUNDS
(Identified Cost $3,617,219) | | | | | | | | | | | | | | 4,363,378 | |
| | | | | | | | | | | | | | | |
| | | |
U.S. GOVERNMENT AGENCIES - 8.8% | | | | | | | | | | | | | | | |
| | | |
Mortgage-Backed Securities - 8.8% | | | | | | | | | | | | | | | |
Fannie Mae, Pool #888468, 5.50%, 9/1/2021 | | | | | | | | $ | 4,122,671 | | | | | 4,482,507 | |
Fannie Mae, Pool #995233, 5.50%, 10/1/2021 | | | | | | | | | 304,717 | | | | | 331,503 | |
| | | | | | |
| | The accompanying notes are an integral part of the financial statements. | | | 13 | |
Investment Portfolio - June 30, 2011 (unaudited)
| | | | | | | | | | |
| | | Principal Amount/
Shares | | Value
(Note 2) |
U.S. GOVERNMENT AGENCIES (continued) | | | | | | | | | | |
| | |
Mortgage-Backed Securities (continued) | | | | | | | | | | |
Fannie Mae, Pool #888017, 6.00%, 11/1/2021 | | | $ | 325,739 | | | | $ | 356,970 | |
Fannie Mae, Pool #995329, 5.50%, 12/1/2021 | | | | 2,463,741 | | | | | 2,678,781 | |
Fannie Mae, Pool #888136, 6.00%, 12/1/2021 | | | | 428,199 | | | | | 469,253 | |
Fannie Mae, Pool #888810, 5.50%, 11/1/2022 | | | | 4,443,317 | | | | | 4,831,140 | |
Fannie Mae, Pool #AD0462, 5.50%, 10/1/2024 | | | | 257,847 | | | | | 279,653 | |
Fannie Mae, Pool #918516, 5.50%, 6/1/2037 | | | | 2,201,815 | | | | | 2,385,263 | |
Fannie Mae, Pool #995876, 6.00%, 11/1/2038 | | | | 12,080,726 | | | | | 13,291,478 | |
Fannie Mae, Pool #AE0061, 6.00%, 2/1/2040 | | | | 5,292,586 | | | | | 5,819,825 | |
Freddie Mac, Pool #G11850, 5.50%, 7/1/2020 | | | | 1,380,179 | | | | | 1,497,808 | |
Freddie Mac, Pool #G12610, 6.00%, 3/1/2022 | | | | 420,296 | | | | | 460,330 | |
Freddie Mac, Pool #G12655, 6.00%, 5/1/2022 | | | | 290,189 | | | | | 317,829 | |
Freddie Mac, Pool #G12988, 6.00%, 1/1/2023 | | | | 240,842 | | | | | 263,330 | |
Freddie Mac, Pool #G13078, 6.00%, 3/1/2023 | | | | 420,689 | | | | | 460,760 | |
Freddie Mac, Pool #G13331, 5.50%, 10/1/2023 | | | | 215,872 | | | | | 233,460 | |
Freddie Mac, Pool #G03332, 6.00%, 10/1/2037 | | | | 612,353 | | | | | 674,011 | |
Freddie Mac, Pool #G03696, 5.50%, 1/1/2038 | | | | 152,856 | | | | | 165,496 | |
Freddie Mac, Pool #G04176, 5.50%, 5/1/2038 | | | | 3,192,260 | | | | | 3,453,240 | |
Freddie Mac, Pool #A78227, 5.50%, 6/1/2038 | | | | 2,526,928 | | | | | 2,733,515 | |
Freddie Mac, Pool #G05671, 5.50%, 8/1/2038 | | | | 289,723 | | | | | 314,133 | |
Freddie Mac, Pool #G06021, 5.50%, 1/1/2040 | | | | 355,310 | | | | | 384,691 | |
Freddie Mac, Pool #G05900, 6.00%, 3/1/2040 | | | | 1,993,977 | | | | | 2,194,752 | |
Freddie Mac, Pool #G05906, 6.00%, 4/1/2040 | | | | 1,290,202 | | | | | 1,420,113 | |
| | | | | | | | | | |
TOTAL U.S. GOVERNMENT AGENCIES
(Identified Cost $48,973,211) | | | | | | | | | 49,499,841 | |
| | | | | | | | | | |
| | |
SHORT-TERM INVESTMENTS - 1.1% | | | | | | | | | | |
Dreyfus Cash Management, Inc. - Institutional Shares8, 0.10%,
(Identified Cost $6,177,099) | | | | 6,177,099 | | | | | 6,177,099 | |
| | | | | | | | | | |
| | |
TOTAL INVESTMENTS - 98.8%
(Identified Cost $525,501,509) | | | | | | | | | 557,040,781 | |
OTHER ASSETS, LESS LIABILITIES - 1.2% | | | | | | | | | 6,824,903 | |
| | | | | | | | | | |
NET ASSETS - 100% | | | | | | | | $ | 563,865,684 | |
| | | | | | | | | | |
FORWARD FOREIGN CURRENCY EXCHANGE CONTRACTS OPEN AT JUNE 30, 20119:
| | | | | | | | | | | | | | | | | | | | |
Settlement Date | | Contracts to Deliver | | In Exchange
For | | Contracts
At Value | | Unrealized
Depreciation |
7/27/2011 | | EUR 2,730,000 | | $3,865,407 | | $3,955,865 | | $(90,458) |
| | | | |
| 14 | | The accompanying notes are an integral part of the financial statements. | | |
Investment Portfolio - June 30, 2011 (unaudited)
| G.O. | Bond - General Obligation Bond |
| 1 | Credit ratings from Moody’s (unaudited). |
| 2 | Restricted securities - Investment in securities that are restricted as to public resale under the Securities Act of 1933, as amended. These securities have been sold under rule 144A and have been determined to be liquid under guidelines established by the Board of Directors. These securities amount to $89,073,651, or 15.8%, of the Series’ net assets as of June 30, 2011. |
| 3 | Credit rating has been withdrawn. As of June 30, 2011, there is no rating available. |
| 4 | Credit ratings from S&P (unaudited). |
| 5 | The coupon rate is floating and is the stated rate as of June 30, 2011. |
| 6 | Represents a step-up bond that pays initial coupon rate for the first period and then a higher coupon rate for the following periods. Rate shown reflects the current coupon as of June 30, 2011. |
| 7 | The rate shown is a fixed rate as of June 30, 2011; the rate becomes floating in 2049. |
| 8 | Rate shown is the current yield as of June 30, 2011. |
| 9 | The counterparty for all forward foreign currency exchange contracts is the Bank of New York Mellon Corp. |
| | | | | | |
| | The accompanying notes are an integral part of the financial statements. | | | 15 | |
Statement of Assets and Liabilities (unaudited)
June 30, 2011
| | | | | |
ASSETS: | | | | | |
Investments, at value (identified cost $525,501,509) (Note 2) | | | $ | 557,040,781 | |
Interest receivable | | | | 7,592,900 | |
Receivable for fund shares sold | | | | 577,281 | |
Dividends receivable | | | | 727 | |
| | | | | |
| |
TOTAL ASSETS | | | | 565,211,689 | |
| | | | | |
| |
LIABILITIES: | | | | | |
| |
Accrued management fees (Note 3) | | | | 325,394 | |
Accrued fund accounting and administration fees (Note 3) | | | | 27,353 | |
Accrued transfer agent fees (Note 3) | | | | 1,569 | |
Accrued directors’ fees (Note 3) | | | | 1,249 | |
Accrued Chief Compliance Officer service fees (Note 3) | | | | 465 | |
Payable for fund shares repurchased | | | | 867,896 | |
Unrealized depreciation on foreign forward currency contracts (Note 2) | | | | 90,458 | |
Other payables and accrued expenses | | | | 31,621 | |
| | | | | |
| |
TOTAL LIABILITIES | | | | 1,346,005 | |
| | | | | |
| |
TOTAL NET ASSETS | | | $ | 563,865,684 | |
| | | | | |
| |
NET ASSETS CONSIST OF: | | | | | |
| |
Capital stock | | | $ | 498,136 | |
Additional paid-in-capital | | | | 508,509,851 | |
Undistributed net investment income | | | | 12,475,114 | |
Accumulated net realized gain on investments, foreign currency and translation of other assets and liabilities | | | | 10,915,352 | |
Net unrealized appreciation on investments, foreign currency and translation of other assets and liabilities | | | | 31,467,231 | |
| | | | | |
| |
TOTAL NET ASSETS | | | $ | 563,865,684 | |
| | | | | |
| |
NET ASSET VALUE, OFFERING PRICE AND REDEMPTION PRICE PER SHARE - Class A ($563,865,684/49,813,633 shares) | | | $ | 11.32 | |
| | | | | |
| | | | |
| 16 | | The accompanying notes are an integral part of the financial statements. | | |
Statement of Operations (unaudited)
For the Six Months Ended June 30, 2011
| | | | | |
INVESTMENT INCOME: | | | | | |
| |
Interest | | | $ | 13,900,787 | |
Dividends | | | | 659,111 | |
| | | | | |
| |
Total Investment Income | | | | 14,559,898 | |
| | | | | |
| |
EXPENSES: | | | | | |
| |
Management fees (Note 3) | | | | 1,916,902 | |
Fund accounting and administration fees (Note 3) | | | | 62,232 | |
Directors’ fees (Note 3) | | | | 7,804 | |
Transfer agent fees (Note 3) | | | | 3,770 | |
Chief Compliance Officer service fees (Note 3) | | | | 1,315 | |
Custodian fees | | | | 14,915 | |
Miscellaneous | | | | 49,470 | |
| | | | | |
| |
Total Expenses | | | | 2,056,408 | |
| | | | | |
| |
NET INVESTMENT INCOME | | | | 12,503,490 | |
| | | | | |
| |
REALIZED AND UNREALIZED GAIN (LOSS) ON INVESTMENTS AND FOREIGN CURRENCY: | | | | | |
| |
Net realized gain (loss) on- | | | | | |
Investments | | | | 8,050,705 | |
Foreign currency and translation of other assets and liabilities | | | | (51,586 | ) |
Forward foreign currency exchange contracts | | | | (389,704 | ) |
| | | | | |
| |
| | | | 7,609,415 | |
| | | | | |
| |
Net change in unrealized appreciation (depreciation) on- | | | | | |
Investments | | | | (2,525,331 | ) |
Foreign currency and translation of other assets and liabilities | | | | 17,210 | |
Forward foreign currency exchange contracts | | | | (14,767 | ) |
| | | | | |
| |
| | | | (2,522,888 | ) |
| | | | | |
| |
NET REALIZED AND UNREALIZED GAIN ON INVESTMENTS AND FOREIGN CURRENCY | | | | 5,086,527 | |
| | | | | |
| |
NET INCREASE IN NET ASSETS RESULTING FROM OPERATIONS | | | $ | 17,590,017 | |
| | | | | |
| | | | | | |
| | The accompanying notes are an integral part of the financial statements. | | | 17 | |
Statement of Changes in Net Assets
| | | | | | | | | | |
| | | For the Six
Months Ended
6/30/11
(unaudited) | | For the
Year Ended
12/31/10 |
INCREASE (DECREASE) IN NET ASSETS: | | | | | | | | | | |
| | |
OPERATIONS: | | | | | | | | | | |
| | |
Net investment income | | | $ | 12,503,490 | | | | $ | 23,870,202 | |
Net realized gain on investments and foreign currency | | | | 7,609,415 | | | | | 8,763,961 | |
Net change in unrealized appreciation (depreciation) on investments and foreign currency | | | | (2,522,888 | ) | | | | 13,352,510 | |
| | | | | | | | | | |
| | |
Net increase from operations | | | | 17,590,017 | | | | | 45,986,673 | |
| | | | | | | | | | |
| | |
DISTRIBUTIONS TO SHAREHOLDERS (Note 8): | | | | | | | | | | |
| | |
From net investment income | | | | — | | | | | (24,015,126 | ) |
From net realized gain on investments | | | | — | | | | | (3,214,343 | ) |
| | | | | | | | | | |
| | |
Total distributions to shareholders | | | | — | | | | | (27,229,469 | ) |
| | | | | | | | | | |
| | |
CAPITAL STOCK ISSUED AND REPURCHASED: | | | | | | | | | | |
| | |
Net increase from capital share transactions (Note 5) | | | | 10,920,320 | | | | | 121,289,798 | |
| | | | | | | | | | |
| | |
Net increase in net assets | | | | 28,510,337 | | | | | 140,047,002 | |
| | |
NET ASSETS: | | | | | | | | | | |
| | |
Beginning of period | | | | 535,355,347 | | | | | 395,308,345 | |
| | | | | | | | | | |
| | |
End of period (including undistributed net investment income of $12,475,114 and distributions in excess of net investment income of $(28,376), respectively) | | | $ | 563,865,684 | | | | $ | 535,355,347 | |
| | | | | | | | | | |
| | | | |
| 18 | | The accompanying notes are an integral part of the financial statements. | | |
Financial Highlights
| | | | | | | | | | | | | | | | | | | | | | | | | | | | | | |
| | | For the Six Months Ended 6/30/11 (unaudited) | | For the Years Ended |
| | |
| | |
| | | | 12/31/10 | | 12/31/09 | | 12/31/08 | | 12/31/07 | | 12/31/06 |
Per share data (for a share outstanding throughout each period): | | | | | | | | | | | | | | | | | | | | | | | | | | | | | | |
Net asset value - Beginning of period | | | $ | 10.96 | | | | $ | 10.49 | | | | $ | 9.66 | | | | $ | 10.02 | | | | $ | 9.98 | | | | $ | 9.89 | |
| | | | | | | | | | | | | | | | | | | | | | | | | | | | | | |
Income (loss) from investment operations: | | | | | | | | | | | | | | | | | | | | | | | | | | | | | | |
Net investment income | | | | 0.25 | 1 | | | | 0.55 | 1 | | | | 0.57 | 1 | | | | 0.42 | | | | | 0.40 | | | | | 0.37 | |
Net realized and unrealized gain (loss)on investments | | | | 0.11 | | | | | 0.51 | | | | | 0.82 | | | | | (0.32 | ) | | | | 0.03 | | | | | 0.08 | |
| | | | | | | | | | | | | | | | | | | | | | | | | | | | | | |
Total from investment operations | | | | 0.36 | | | | | 1.06 | | | | | 1.39 | | | | | 0.10 | | | | | 0.43 | | | | | 0.45 | |
| | | | | | | | | | | | | | | | | | | | | | | | | | | | | | |
Less distributions to shareholders: | | | | | | | | | | | | | | | | | | | | | | | | | | | | | | |
From net investment income | | | | — | | | | | (0.52 | ) | | | | (0.56 | ) | | | | (0.45 | ) | | | | (0.39 | ) | | | | (0.36 | ) |
From net realized gain on investments | | | | — | | | | | (0.07 | ) | | | | — | | | | | (0.01 | ) | | | | — | | | | | — | |
| | | | | | | | | | | | | | | | | | | | | | | | | | | | | | |
Total distributions to shareholders | | | | — | | | | | (0.59 | ) | | | | (0.56 | ) | | | | (0.46 | ) | | | | (0.39 | ) | | | | (0.36 | ) |
| | | | | | | | | | | | | | | | | | | | | | | | | | | | | | |
Net asset value - End of period | | | $ | 11.32 | | | | $ | 10.96 | | | | $ | 10.49 | | | | $ | 9.66 | | | | $ | 10.02 | | | | $ | 9.98 | |
| | | | | | | | | | | | | | | | | | | | | | | | | | | | | | |
Net assets - End of period (000’s omitted) | | | $ | 563,866 | | | | $ | 535,355 | | | | $ | 395,308 | | | | $ | 340,631 | | | | $ | 278,494 | | | | $ | 224,145 | |
| | | | | | | | | | | | | | | | | | | | | | | | | | | | | | |
Total return2 | | | | 3.29 | % | | | | 10.18 | % | | | | 14.35 | % | | | | 1.24 | % | | | | 4.34 | % | | | | 4.59 | % |
Ratios (to average net assets)/ Supplemental Data: | | | | | | | | | | | | | | | | | | | | | | | | | | | | | | |
Expenses* | | | | 0.75 | %3 | | | | 0.76 | % | | | | 0.78 | % | | | | 0.80 | % | | | | 0.81 | % | | | | 0.83 | % |
Net investment income | | | | 4.57 | %3 | | | | 4.92 | % | | | | 5.60 | % | | | | 4.84 | % | | | | 4.20 | % | | | | 3.95 | % |
Portfolio turnover | | | | 21 | % | | | | 31 | % | | | | 72 | % | | | | 63 | % | | | | 341 | % | | | | 315 | % |
|
* The investment advisor did not impose all or a portion of its management fees, CCO fees, fund accounting and transfer agent fees and other fees in some periods and in some periods paid a portion of the Series’ expenses. If these expenses had been incurred by the Series, the expense ratio (to average net assets) would have been increased by the following amount: | |
| | | | N/A | | | | | 0.00 | %4 | | | | 0.00 | %4 | | | | N/A | | | | | N/A | | | | | N/A | |
| 1 | Calculated based on average shares outstanding during the period. |
| 2 | Represents aggregate total return for the periods indicated, and assumes reinvestment of all distributions. Total return would have been lower had certain expenses not been waived or reimbursed during certain periods. Periods less than one year are not annualized. |
| | | | | | |
| | The accompanying notes are an integral part of the financial statements. | | | 19 | |
Notes to Financial Statements (unaudited)
Core Plus Bond Series (the “Series”) is a no-load diversified series of Manning & Napier Fund, Inc. (the “Fund”). The Fund is organized in Maryland and is registered under the Investment Company Act of 1940, as amended, as an open-end management investment company.
The Series’ investment objective is to provide long-term total return by investing primarily in fixed income securities.
The Fund’s Advisor is Manning & Napier Advisors, Inc. (the “Advisor”). Shares of the Series are offered to investors, clients and employees of the Advisor and its affiliates. The total authorized capital stock of the Fund consists of 10.0 billion shares of common stock each having a par value of $0.01. As of June 30, 2011, 6.4 billion shares have been designated in total among 31 series, of which 125 million have been designated as Core Plus Bond Series Class A common stock.
| 2. | SIGNIFICANT ACCOUNTING POLICIES |
Security Valuation
Portfolio securities, including domestic equities, foreign equities, warrants and options, listed on an exchange other than the NASDAQ National Market System are valued at the latest quoted sales price of the exchange on which the security is primarily traded. Securities not traded on valuation date or securities not listed on an exchange are valued at the latest quoted bid price provided by the Fund’s pricing service. Securities listed on the NASDAQ National Market System are valued in accordance with the NASDAQ Official Closing Price.
Debt securities, including government bonds, foreign bonds, asset-backed securities, structured notes, supranational obligations, sovereign bonds, corporate bonds and mortgage-backed securities will normally be valued on the basis of evaluated bid prices provided directly by an independent pricing service. The pricing services use multiple valuation techniques to determine fair value. In instances where sufficient market activity exists, the pricing services may utilize a market-based approach through which quotes from market makers are used to determine fair value. In instances where sufficient market activity may not exist or is limited, the pricing services also utilize proprietary valuation models which may consider market characteristics such as benchmark yield curves, option-adjusted spreads, credit spreads, estimated default rates, coupon rates, anticipated timing of principal repayments, underlying collateral, and other unique security features in order to estimate the relevant cash flows, which are then discounted to calculate the fair value. Certain investments in securities held by the Series may be valued on a basis of a price provided directly by a principal market maker. These prices may differ from the value that would have been used had a broader market for securities existed.
Municipal securities will normally be valued on the basis of market valuations provided by an independent pricing service that utilizes the latest price quotations and a matrix system (which considers such factors as security prices of similar securities, yields, maturities and ratings).
Short-term investments that mature in sixty days or less are valued at amortized cost, which approximates market value. Investments in open-end investment companies are valued at their net asset value per share on valuation date.
Volume and level of activity in established markets for an asset or liability are evaluated to determine whether recent transactions and quoted prices are determinative of fair value. Where there have been significant decreases in volume and level of activity, further analysis and adjustment may be necessary to estimate fair value. The Series measures fair value in these instances by the use of inputs and valuation techniques which may be based upon current market prices of securities that are comparable in coupon, rating, maturity and industry and/or expectation of future cash flows. As a result of trading in relatively thin markets and/or markets that experience significant volatility, the prices used by the Series to value these securities may differ from the value that would be realized if these securities were sold, and the differences could be material.
Notes to Financial Statements (unaudited)
| 2. | SIGNIFICANT ACCOUNTING POLICIES (continued) |
Security Valuation (continued)
Securities for which representative valuations or prices are not available from the Fund’s pricing service may be valued at fair value. Due to the inherent uncertainty of valuations of such securities, the fair value may differ significantly from the values that would have been used had a ready market for such securities existed. If trading or events occurring after the close of the principal market in which securities are traded are expected to materially affect the value of those securities, then they may be valued at their fair value, taking this trading or these events into account. Fair value is determined in good faith by the Advisor under procedures approved by and under the general supervision and responsibility of the Fund’s Board of Directors (the “Board”).
Various inputs are used in determining the value of the Series’ assets or liabilities carried at market value. These inputs are summarized in three broad levels. Level 1 includes quoted prices in active markets for identical assets and liabilities. Level 2 includes other significant observable inputs (including quoted prices for similar securities, interest rates, prepayment speeds, credit risk, etc.). Level 3 includes significant unobservable inputs (including the Series’ own assumptions in determining the fair value of investments). The inputs or methodology used for valuing securities are not necessarily an indication of the risk associated with investing in those securities.
The following is a summary of the valuation levels used for major security types as of June 30, 2011 in valuing the Series’ assets or liabilities carried at market value:
| | | | | | | | | | | | | | | | | | | | |
Description | | Total | | Level 1 | | Level 2 | | Level 3 |
Assets: | | | | | | | | | | | | | | | | | | | | |
Equity securities*: | | | $ | — | | | | $ | — | | | | $ | — | | | | $ | — | |
Preferred securities: | | | | | | | | | | | | | | | | | | | | |
Financials | | | | 14,853,157 | | | | | 2,795,142 | | | | | 12,058,015 | | | | | — | |
Debt securities: | | | | | | | | | | | | | | | | | | | | |
U.S. Treasury and other U.S. Government agencies | | | | 49,499,841 | | | | | — | | | | | 49,499,841 | | | | | — | |
States and political subdivisions (municipals) | | | | 2,698,750 | | | | | — | | | | | 2,698,750 | | | | | — | |
Corporate debt: | | | | | | | | | | | | | | | | | | | — | |
Consumer Discretionary | | | | 69,776,991 | | | | | — | | | | | 69,776,991 | | | | | — | |
Consumer Staples | | | | 9,463,095 | | | | | — | | | | | 9,463,095 | | | | | — | |
Energy | | | | 36,201,010 | | | | | — | | | | | 36,201,010 | | | | | — | |
Financials | | | | 162,678,887 | | | | | — | | | | | 162,678,887 | | | | | — | |
Health Care | | | | 19,508,336 | | | | | — | | | | | 19,508,336 | | | | | — | |
Industrials | | | | 68,300,349 | | | | | — | | | | | 68,300,349 | | | | | — | |
Information Technology | | | | 12,601,871 | | | | | — | | | | | 12,601,871 | | | | | — | |
Materials | | | | 33,779,064 | | | | | — | | | | | 33,779,064 | | | | | — | |
Telecommunication Services | | | | 14,820,032 | | | | | — | | | | | 14,820,032 | | | | | — | |
Utilities | | | | 11,676,088 | | | | | — | | | | | 11,676,088 | | | | | — | |
Convertible corporate debt: | | | | | | | | | | | | | | | | | | | — | |
Financials | | | | 2,811,406 | | | | | — | | | | | 2,811,406 | | | | | — | |
Health Care | | | | 3,282,262 | | | | | — | | | | | 3,282,262 | | | | | — | |
Information Technology | | | | 2,952,963 | | | | | — | | | | | 2,952,963 | | | | | — | |
Asset-backed securities | | | | 6,244,946 | | | | | — | | | | | 6,244,946 | | | | | — | |
Commercial mortgage-backed securities | | | | 22,523,448 | | | | | — | | | | | 22,523,448 | | | | | | |
Foreign government bonds | | | | 2,827,808 | | | | | — | | | | | 2,827,808 | | | | | — | |
Mutual funds | | | | 10,540,477 | | | | | 10,540,477 | | | | | — | | | | | — | |
Other financial instruments** | | | | — | | | | | — | | | | | — | | | | | — | |
| | | | | | | | | | | | | | | | | | | | |
Notes to Financial Statements (unaudited)
| 2. | SIGNIFICANT ACCOUNTING POLICIES (continued) |
Security Valuation (continued)
| | | | | | | | | | | | | | | | | | | | |
Description | | Total | | Level 1 | | Level 2 | | Level 3 |
Total assets: | | | $ | 557,040,781 | | | | $ | 13,335,619 | | | | $ | 543,705,162 | | | | $ | — | |
| | | | | | | | | | | | | | | | | | | | |
Liabilities: | | | | | | | | | | | | | | | | | | | | |
Other financial instruments** | | | | (90,458 | ) | | | | — | | | | | (90,458 | ) | | | | — | |
| | | | | | | | | | | | | | | | | | | | |
Total liabilities | | | | — | | | | | — | | | | | — | | | | | — | |
| | | | | | | | | | | | | | | | | | | | |
Total | | | $ | 556,950,323 | | | | $ | 13,335,619 | | | | $ | 543,614,704 | | | | $ | — | |
| | | | | | | | | | | | | | | | | | | | |
| * | Includes common stock, warrants and rights. |
| ** | Other financial instruments are derivative instruments not reflected in the Investment Portfolio, such as futures, forwards and swap contracts, which are valued at the unrealized appreciation/depreciation on the instrument. |
There were no Level 3 securities held by the Series as of December 31, 2010 or June 30, 2011.
The Fund’s policy is to recognize transfers in and transfers out of the valuation levels as of the beginning of the reporting period. There were no significant transfers between Level 1 and Level 2 during the six months ended June 30, 2011.
Recent Accounting Standard
In May 2011, the Financial Accounting Standards Board issued amended guidance to improve disclosure about fair value measurements which will require the following disclosures for fair value measurements categorized as Level 3: quantitative information about the unobservable inputs and assumptions used in the fair value measurement, a description of the valuation policies and procedures and a narrative description of the sensitivity of the fair value measurement to changes in unobservable inputs and the interrelationships between those unobservable inputs. In addition, the amounts and reasons for all transfers in and out of Level 1 and Level 2 will be required to be disclosed. The amended guidance is effective for financial statements for fiscal years beginning after December 15, 2011, and interim periods within those fiscal years. Management is evaluating the impact of this guidance on the Series’ financial statements and disclosures.
Security Transactions, Investment Income and Expenses
Security transactions are accounted for on trade date. Dividend income is recorded on the ex-dividend date, except that if the ex-dividend date has passed, certain dividends from foreign securities are recorded as soon as the Fund is informed of the ex-dividend date. Non-cash dividends, if any, are recorded at the fair market value of the securities received. Interest income, including amortization of premium and accretion of discounts using the effective interest method, is earned from settlement date and accrued daily.
Expenses are recorded on an accrual basis. Most expenses of the Fund can be attributed to a specific series. Expenses which cannot be directly attributed are apportioned among the series in the Fund in such a manner as deemed equitable by the Fund’s Board, taking into consideration, among other things, the nature and type of expense.
The Series uses the identified cost method for determining realized gain or loss on investments for both financial statement and federal income tax reporting purposes.
Foreign Currency Translation
The books and records of the Series are maintained in U.S. dollars. Foreign currencies, investments and other assets and liabilities are translated into U.S. dollars at the current exchange rates. Purchases and sales of investment securities and income and expenses are translated on the respective dates of such transactions. The Series does
Notes to Financial Statements (unaudited)
| 2. | SIGNIFICANT ACCOUNTING POLICIES (continued) |
Foreign Currency Translation (continued)
not isolate realized and unrealized gains and losses attributable to changes in the exchange rates from gains and losses that arise from changes in the market value of investments. Such fluctuations are included with net realized and unrealized gain or loss on investments. Net realized foreign currency gains and losses represent foreign currency gains and losses between trade date and settlement date on securities transactions, gains and losses on disposition of foreign currencies and the difference between the amount of income and foreign withholding taxes recorded on the books of the Series and the amounts actually received or paid.
Forward Foreign Currency Exchange Contracts
The Series may purchase or sell forward foreign currency exchange contracts in order to hedge a portfolio position or specific transaction. Risks may arise if the counterparties to a contract are unable to meet the terms of the contract or if the value of the foreign currency moves unfavorably.
All forward foreign currency exchange contracts are adjusted daily by the exchange rate of the underlying currency and, for financial statement purposes, any gain or loss is recorded as unrealized gain or loss until a contract has been closed. Realized and unrealized gain or loss arising from a transaction is included in net realized and unrealized gain (loss) on investments.
The Series may regularly trade forward foreign currency exchange contracts with off-balance sheet risk in the normal course of its investing activities to assist in managing exposure to changes in foreign currency exchange rates.
The notional or contractual amount of these instruments represents the investment the Series has in forward foreign currency exchange contracts and does not necessarily represent the amounts potentially at risk. The measurement of the risks associated with forward foreign currency exchange contracts is meaningful only when all related and offsetting transactions are considered. Investments in forward foreign currency exchange contacts held by the Series on June 30, 2011 are shown at the end of the Investment Portfolio, which is indicative of volume of derivative activity during the period.
Securities Purchased on a When-Issued Basis or Forward Commitment
The Series may purchase securities on a when-issued basis or forward commitment. These transactions involve a commitment by the Series to purchase securities for a predetermined price with payment and delivery taking place beyond the customary settlement period. When such purchases are outstanding, the Series will designate liquid assets in an amount sufficient to meet the purchase price. When purchasing a security on a delayed delivery basis, the Series assumes the rights and risks of ownership of the security, including the risk of price and yield fluctuations, and takes such fluctuations into account when determining its net asset value. The Series may sell the when-issued securities before they are delivered, which may result in a capital gain or loss. No such investments were held by the Series on June 30, 2011.
In connection with its ability to purchase or sell securities on a forward commitment basis, the Series may enter into forward roll transactions principally using To Be Announced (TBA) securities. Forward roll transactions require the sale of securities for delivery in the current month, and a simultaneous agreement to repurchase substantially similar (same type, coupon and maturity) securities on a specified future date. Risks of entering into forward roll transactions include the potential inability of the counterparty to meet the terms of the agreement; the potential of the Series to receive inferior securities at redelivery as compared to the securities sold to the counterparty; counterparty credit risk; and the potential pay down speed variance between the mortgage-backed pools. During the roll period, the Series forgoes principal and interest paid on the securities. The Series accounts for such dollar rolls as purchases and sales. Information regarding securities purchased on a when-issued basis is included in the Series’ Investment Portfolio. No such investments were held by the Series on June 30, 2011.
Notes to Financial Statements (unaudited)
| 2. | SIGNIFICANT ACCOUNTING POLICIES (continued) |
Restricted Securities
Restricted securities are purchased in private placement transactions, are not registered under the Securities Act of 1933, as amended, and may have contractual restrictions on resale. Information regarding restricted securities is included at the end of the Series’ Investment Portfolio.
Illiquid Securities
A security may be considered illiquid if so deemed in good faith by the Advisor under procedures approved by and under the general supervision and responsibility of the Fund’s Board. Securities that are illiquid are marked with the applicable footnote on the Investment Portfolio. No such investments were held by the Series on June 30, 2011.
Federal Taxes
The Series’ policy is to comply with the provisions of the Internal Revenue Code applicable to regulated investment companies. The Series is not subject to federal income tax or excise tax to the extent that the Series distributes to shareholders each year its taxable income, including any net realized gains on investments, in accordance with requirements of the Internal Revenue Code. Accordingly, no provision for federal income tax or excise tax has been made in the financial statements.
Management evaluates its tax positions to determine if the tax positions taken meet the minimum recognition threshold in connection with accounting for uncertainties in income tax positions taken or expected to be taken for the purposes of measuring and recognizing tax liabilities in the financial statements. Recognition of tax benefits of an uncertain tax position is required only when the position is “more likely than not” to be sustained assuming examination by taxing authorities. At June 30, 2011, the Series has recorded no liability for net unrecognized tax benefits relating to uncertain income tax positions taken or expected to be taken in future tax returns.
The Series files income tax returns in the U.S. federal jurisdiction, various states and foreign jurisdictions, as required. No income tax returns are currently under investigation. The statute of limitations on the Series’ tax returns remains open for the years ended December 31, 2007 through December 31, 2010. The Fund is not aware of any tax positions for which it is reasonably possible that the total amounts of unrecognized tax benefits will significantly change in the next twelve months.
Additionally, based on the Fund’s understanding of the tax rules and rates related to income, gains and transactions for foreign jurisdictions in which it invests, the Series will provide for foreign taxes, and where appropriate, deferred foreign tax.
Distributions of Income and Gains
Distributions to shareholders of net investment income and net realized gains are made annually. An additional distribution may be necessary to avoid taxation of the Series. Distributions are recorded on the ex-dividend date.
Indemnifications
The Fund’s organizational documents provide former and current directors and officers with a limited indemnification against liabilities arising in connection with the performance of their duties to the Fund. In the normal course of business, the Fund may also enter into contracts that provide general indemnifications. The Fund’s maximum exposure under these arrangements is unknown as this would be dependent on future claims that may be made against the Fund. The risk of material loss from such claims is considered remote.
Other
The preparation of financial statements in conformity with accounting principles generally accepted in the United States of America requires management to make estimates and assumptions that affect the reported amounts of
Notes to Financial Statements (unaudited)
| 2. | SIGNIFICANT ACCOUNTING POLICIES (continued) |
Other (continued)
assets and liabilities and the disclosure of contingent assets and liabilities at the date of the financial statements and the reported amounts of income and expenses during the reporting period. Actual results could differ from those estimates.
| 3. | TRANSACTIONS WITH AFFILIATES |
The Fund has an Investment Advisory Agreement (the “Agreement”) with the Advisor, for which the Series pays a fee, computed daily and payable monthly, at an annual rate of 0.70% of the Series’ average daily net assets.
Under the Agreement, personnel of the Advisor provide the Series with advice and assistance in the choice of investments and the execution of securities transactions, and otherwise maintain the Series’ organization. The Advisor also provides the Fund with necessary office space and fund administration and support services. The salaries of all officers of the Fund (except a percentage of the Fund’s Chief Compliance Officer’s salary, which is paid by the Fund), and of all Directors who are “affiliated persons” of the Fund, or of the Advisor, and all personnel of the Fund, or of the Advisor, performing services relating to research, statistical and investment activities, are paid by the Advisor. Each “non-affiliated” Director receives an annual stipend, which is allocated among all the active series of the Fund. In addition, these Directors also receive a fee per Board meeting attended plus a fee for each committee meeting attended.
The Advisor has contractually agreed, until at least April 30, 2012, to waive its fee and, if necessary, pay other operating expenses of the Series in order to maintain total direct annual fund operating expenses for the Series at no more than 0.90% of average daily net assets each year. The Advisor did not waive any fees for the six months ended June 30, 2011. The Advisor is not eligible to recoup any expenses that have been waived or reimbursed in prior years.
Manning & Napier Investor Services, Inc., a registered broker-dealer affiliate of the Advisor, acts as distributor for the Fund’s shares. The services of Manning & Napier Investor Services, Inc. are provided at no additional cost to the Series.
The Advisor has agreements with BNY Mellon Investment Servicing (U.S.) Inc. (“BNY”) under which BNY serves as sub-accountant services agent and sub-transfer agent. The Fund pays the Advisor an annual fee related to fund accounting and administration of 0.0175% on the first $3 billion of average daily net assets (excluding Target Series); 0.015% on the next $3 billion of average daily net assets (excluding Target Series); and 0.01% of the average daily net assets in excess of $6 billion (excluding Target Series); plus a base fee of $25,500 per Series. Transfer Agent fees are charged to the Fund on a per account basis. Additionally, certain transaction- and cusip-based fees and out-of-pocket expenses, including charges for reporting relating to the Fund’s compliance program, are charged.
Expenses not directly attributable to a Series are allocated based on each Series’ relative net assets or number of accounts, depending on the expense.
| 4. | PURCHASES AND SALES OF SECURITIES |
For the six months ended June 30, 2011, purchases and sales of securities, other than U.S. Government securities and short-term securities, were $111,969,150 and $99,734,520, respectively. Purchases and sales of U.S. Government securities, other than short-term securities, were $34,739,888 and $13,582,507, respectively.
Notes to Financial Statements (unaudited)
| 5. | CAPITAL STOCK TRANSACTIONS |
Transactions in shares of Core Plus Bond Series were:
| | | | | | | | | | | | | | | | | | | | |
| | | For the Six Months
Ended 6/30/11 | | For the Year
Ended 12/31/10 |
| | | Shares | | Amount | | Shares | | Amount |
Sold | | | | 3,294,624 | | | | $ | 36,753,519 | | | | | 12,957,005 | | | | $ | 142,303,123 | |
Reinvested | | | | — | | | | | — | | | | | 2,483,553 | | | | | 26,822,714 | |
Repurchased | | | | (2,315,873 | ) | | | | (25,833,199 | ) | | | | (4,296,032 | ) | | | | (47,836,039 | ) |
| | | | | | | | | | | | | | | | | | | | |
Total | | | | 978,751 | | | | $ | 10,920,320 | | | | | 11,144,526 | | | | $ | 121,289,798 | |
| | | | | | | | | | | | | | | | | | | | |
Substantially all of the Series’ shares represent investments by fiduciary accounts over which the Advisor has sole investment discretion.
The Series may trade in instruments including written and purchased options, forward foreign currency exchange contracts and futures contracts and other derivatives in the normal course of investing activities to assist in managing exposure to various market risks. The Series may be subject to various elements of risk, which may involve, to a varying degree, elements of risk in excess of the amounts recognized for financial statement purposes. These risks include: the risk that changes in the value of a derivative may not correlate perfectly with the underlying asset, rate or index, counterparty credit risk related to over the counter derivatives’ counterparties failure to perform under contract terms, liquidity risk related to the lack of a liquid market for these contracts allowing the fund to close out its position(s) and documentation risk relating to disagreement over contract terms. No such investments were held by the Series on June 30, 2011, except forward foreign currency exchange contracts, as shown at the end the Investment Portfolio.
Investing in securities of foreign companies and foreign governments involves special risks and considerations not typically associated with investing in securities of domestic companies and the U.S. Government. These risks include revaluation of currencies and future adverse political and economic developments. Moreover, securities of foreign companies and foreign governments and their markets may be less liquid and their prices more volatile than those of comparable domestic companies and the U.S. Government.
| 8. | FEDERAL INCOME TAX INFORMATION |
The amount and characterization of certain income and capital gains to be distributed are determined in accordance with federal income tax regulations, which may differ from accounting principles generally accepted in the United States of America. The Series may periodically make reclassifications among its capital accounts to reflect income and gains available for distribution (or available capital loss carryovers) under income tax regulations, without impacting the Series’ net asset value. Any such reclassifications are not reflected in the financial highlights.
Notes to Financial Statements (unaudited)
| 8. | FEDERAL INCOME TAX INFORMATION (continued) |
The final determination of the tax character of current year distributions will be made at the conclusion of the fiscal year. The tax character of distributions paid for the year ended December 31, 2010 was as follows:
| | | | | |
Ordinary income | | | $ | 25,263,864 | |
Long-term capital gains | | | | 1,965,605 | |
At June 30, 2011, the identified cost of investments for federal income tax purposes, the resulting gross unrealized appreciation and depreciation, and the net unrealized appreciation were as follows:
| | | | | |
Cost for federal income tax purposes | | | $ | 525,510,066 | |
Unrealized appreciation | | | $ | 36,600,911 | |
Unrealized depreciation | | | | (5,070,196 | ) |
| | | | | |
Net unrealized appreciation | | | $ | 31,530,715 | |
| | | | | |
Literature Requests (unaudited)
Proxy Voting Policies and Procedures
A description of the policies and procedures that the Fund uses to determine how to vote proxies relating to portfolio securities is available, without charge, upon request:
| | |
| By phone | | 1-800-466-3863 |
| On the Securities and Exchange Commission’s | | |
| (SEC) web site | | http://www.sec.gov |
Proxy Voting Record
Information regarding how the Fund voted proxies relating to portfolio securities during the most recent 12-month period ended June 30th is available, without charge, upon request:
| | |
| By phone | | 1-800-466-3863 |
| On the SEC’s web site | | http://www.sec.gov |
Quarterly Portfolio Holdings
The Series’ complete schedule of portfolio holdings for the 1st and 3rd quarters of each fiscal year are provided on Form N-Q, and are available, without charge, upon request:
| | |
| By phone | | 1-800-466-3863 |
| On the SEC’s web site | | http://www.sec.gov |
The Series’ Form N-Q may be reviewed and copied at the SEC’s Public Reference Room in Washington, D.C. Information on the operation of the Public Reference Room may be obtained by calling 1-800-SEC-0330.
Prospectus and Statement of Additional Information (SAI)
The prospectus and SAI provide additional information about each Series, including charges, expenses and risks. These documents are available, without charge, upon request:
| | |
| By phone | | 1-800-466-3863 |
| On the SEC’s web site | | http://www.sec.gov |
| On our web site | | http://www.manning-napier.com |
Additional information available at www.manning-napier.com
1. Fund Holdings - Month-End
2. Fund Holdings - Quarter-End
3. Shareholder Report - Annual
4. Shareholder Report - Semi-Annual
The Fund also offers electronic notification or “e-delivery” when certain documents are available on-line to be downloaded or reviewed. Direct shareholders can elect to receive electronic notification when shareholder reports, prospectus updates, and / or quarterly statements are available. If you do not currently have on-line access to your account, you can establish access by going to www.manning-napier.com, click on “Login” in the top corner of the page, and follow the prompts to self-enroll. Once enrolled, you can set your electronic notification preferences by clicking on the Account Options tab located within the green toolbar and then select E-Delivery Option. Should you have any questions on either how to establish on-line access or how to update your account settings, please do not hesitate to contact Investor Services at 1-800-466-3863.
MNCRPLBND-6/11-SAR


Shareholder Expense Example (unaudited)
As a shareholder of the Series, you may incur two types of costs: (1) transaction costs and (2) ongoing costs, including management fees and other Series expenses. This example is intended to help you understand your ongoing costs (in dollars) of investing in the Series and to compare these costs with the ongoing costs of investing in other mutual funds.
The example is based on an investment of $1,000 invested at the beginning of the period and held for the entire period (January 1, 2011 to June 30, 2011).
Actual Expenses
The first line of the table below provides information about actual account values and actual expenses. You may use the information in this line, together with the amount you invested, to estimate the expenses that you paid over the period. Simply divide your account value by $1,000 (for example, an $8,600 account value divided by $1,000 = 8.6), then multiply the result by the number in the first line under the heading entitled “Expenses Paid During Period” to estimate the expenses you paid on your account during this period.
Hypothetical Example for Comparison Purposes
The second line of the table below provides information about hypothetical account values and hypothetical expenses based on the Series’ actual expense ratio and an assumed rate of return of 5% per year before expenses, which is not the Series’ actual return. The hypothetical account values and expenses may not be used to estimate the actual ending account balance or expenses you paid during the period. You may use this information to compare the ongoing costs of investing in the Series and other funds. To do so, compare this 5% hypothetical example with the 5% hypothetical examples that appear in the shareholder reports of the other funds.
Please note that the expenses shown in the table are meant to highlight your ongoing costs only and do not reflect any transaction costs. Therefore, the second line of the table is useful in comparing ongoing costs only, and will not help you determine the relative total costs of owning different funds. In addition, if these transaction costs were included, your costs would have been higher.
| | | | | | | | | | | | | | | |
| | | Beginning
Account Value
1/1/11 | | Ending
Account Value
6/30/11 | | Expenses Paid
During Period*
1/1/11-6/30/11 |
Actual | | | $ | 1,000.00 | | | | $ | 1,039.10 | | | | $ | 5.61 | |
Hypothetical
(5% return before expenses) | | | $ | 1,000.00 | | | | $ | 1,019.29 | | | | $ | 5.56 | |
| * | Expenses are equal to the Series’ annualized expense ratio (for the six-month period) of 1.11%, multiplied by the average account value over the period, multiplied by 181/365 (to reflect the one-half year period). Expenses are based on the most recent fiscal half year. |
Portfolio Composition as of June 30, 2011 (unaudited)
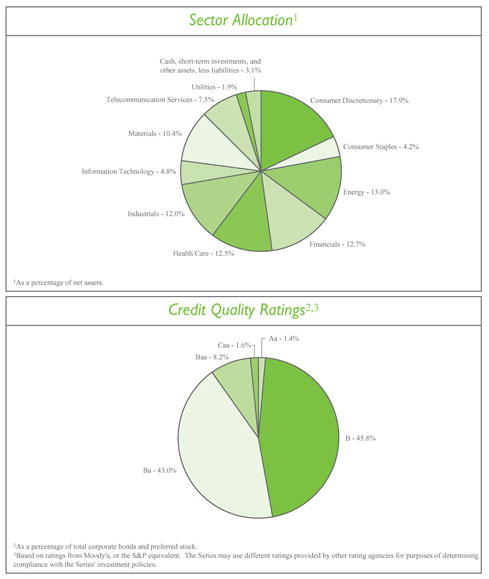
Investment Portfolio - June 30, 2011 (unaudited)
| | | | | | | | | | | | | | | |
| | | Credit
Rating1 | | Principal Amount | | Value
(Note 2) |
| | | |
CORPORATE BONDS - 93.1% | | | | | | | | | | | | | | | |
| | | |
Non-Convertible Corporate Bonds - 93.1% | | | | | | | | | | | | | | | |
Consumer Discretionary - 17.9% | | | | | | | | | | | | | | | |
Auto Components - 0.9% | | | | | | | | | | | | | | | |
UCI International, Inc., 8.625%, 2/15/2019 | | | | B3 | | | | $ | 1,460,000 | | | | $ | 1,503,800 | |
| | | | | | | | | | | | | | | |
Hotels, Restaurants & Leisure - 3.1% | | | | | | | | | | | | | | | |
Cedar Fair LP - Canada’s Wonderland Co. - Magnum Management Corp., 9.125%, 8/1/2018 | | | | B2 | | | | | 660,000 | | | | | 704,550 | |
Wendy’s - Arby’s Restaurants LLC, 10.00%, 7/15/2016 | | | | B3 | | | | | 1,455,000 | | | | | 1,611,413 | |
Wyndham Worldwide Corp., 9.875%, 5/1/2014 | | | | Ba1 | | | | | 570,000 | | | | | 669,386 | |
Wyndham Worldwide Corp., 6.00%, 12/1/2016 | | | | Ba1 | | | | | 2,260,000 | | | | | 2,400,072 | |
| | | | | | | | | | | | | | | |
| | | | | | | | | | | | | | 5,385,421 | |
| | | | | | | | | | | | | | | |
Media - 9.6% | | | | | | | | | | | | | | | |
Cablevision Systems Corp., 8.625%, 9/15/2017 | | | | B1 | | | | | 2,030,000 | | | | | 2,200,013 | |
Columbus International, Inc. (Barbados)2, 11.50%, 11/20/2014 | | | | B2 | | | | | 1,770,000 | | | | | 2,011,163 | |
Kabel BW Erste Beteiligungs GmbH - Kabel Baden-Wurttemberg GmbH & Co. KG (Germany)2, 7.50%, 3/15/2019 | | | | B1 | | | | | 1,660,000 | | | | | 1,693,200 | |
MDC Partners, Inc. (Canada), 11.00%, 11/1/2016 | | | | B2 | | | | | 1,495,000 | | | | | 1,676,269 | |
Sirius XM Radio, Inc.2, 9.75%, 9/1/2015 | | | | Ba2 | | | | | 940,000 | | | | | 1,034,000 | |
Unitymedia Hessen GmbH & Co. KG - Unitymedia NRW GmbH (Germany)2, 8.125%, 12/1/2017 | | | | B1 | | | | | 1,590,000 | | | | | 1,689,375 | |
UPCB Finance III Ltd. (Cayman Islands)2, 6.625%, 7/1/2020 | | | | Ba3 | | | | | 3,035,000 | | | | | 2,997,063 | |
Virgin Media Finance plc (United Kingdom), 8.375%, 10/15/2019 | | | | Ba2 | | | | | 1,535,000 | | | | | 1,711,525 | |
XM Satellite Radio, Inc.2, 7.625%, 11/1/2018 | | | | B2 | | | | | 1,315,000 | | | | | 1,374,175 | |
| | | | | | | | | | | | | | | |
| | | | | | | | | | | | | | 16,386,783 | |
| | | | | | | | | | | | | | | |
Specialty Retail - 2.9% | | | | | | | | | | | | | | | |
DirectBuy Holdings, Inc.2, 12.00%, 2/1/2017 | | | | B2 | | | | | 1,540,000 | | | | | 600,600 | |
Rent-A-Center, Inc., 6.625%, 11/15/2020 | | | | BB | 3 | | | | 2,375,000 | | | | | 2,363,125 | |
Toys R Us Property Co. II, LLC, 8.50%, 12/1/2017 | | | | Ba1 | | | | | 1,885,000 | | | | | 1,969,825 | |
| | | | | | | | | | | | | | | |
| | | | | | | | | | | | | | 4,933,550 | |
| | | | | | | | | | | | | | | |
Textiles, Apparel & Luxury Goods - 1.4% | | | | | | | | | | | | | | | |
Jones Group - Apparel Group Holdings - Apparel Group USA - Footwear Accessories Retail, 6.875%, 3/15/2019 | | | | Ba3 | | | | | 2,560,000 | | | | | 2,470,400 | |
| | | | | | | | | | | | | | | |
Total Consumer Discretionary | | | | | | | | | | | | | | 30,679,954 | |
| | | | | | | | | | | | | | | |
Consumer Staples - 4.2% | | | | | | | | | | | | | | | |
Beverages - 2.9% | | | | | | | | | | | | | | | |
CEDC Finance Corp. International, Inc.2, 9.125%, 12/1/2016 | | | | B1 | | | | | 1,885,000 | | | | | 1,720,063 | |
Constellation Brands, Inc., 8.375%, 12/15/2014 | | | | Ba2 | | | | | 1,830,000 | | | | | 2,081,625 | |
Constellation Brands, Inc., 7.25%, 9/1/2016 | | | | Ba2 | | | | | 1,000,000 | | | | | 1,092,500 | |
| | | | | | | | | | | | | | | |
| | | | | | | | | | | | | | 4,894,188 | |
| | | | | | | | | | | | | | | |
| | | | | | |
| | The accompanying notes are an integral part of the financial statements. | | | 3 | |
Investment Portfolio - June 30, 2011 (unaudited)
| | | | | | | | | | | | | | | |
| | | Credit
Rating1 | | Principal Amount | | Value
(Note 2) |
| | | |
CORPORATE BONDS (continued) | | | | | | | | | | | | | | | |
| | | |
Non-Convertible Corporate Bonds (continued) | | | | | | | | | | | | | | | |
Consumer Staples (continued) | | | | | | | | | | | | | | | |
Personal Products - 1.3% | | | | | | | | | | | | | | | |
Revlon Consumer Products Corp., 9.75%, 11/15/2015 | | | | B2 | | | | $ | 2,055,000 | | | | $ | 2,209,125 | |
| | | | | | | | | | | | | | | |
Total Consumer Staples | | | | | | | | | | | | | | 7,103,313 | |
| | | | | | | | | | | | | | | |
Energy - 13.0% | | | | | | | | | | | | | | | |
Energy Equipment & Services - 4.2% | | | | | | | | | | | | | | | |
Calfrac Holdings LP2, 7.50%, 12/1/2020 | | | | B2 | | | | | 1,595,000 | | | | | 1,610,950 | |
Complete Production Services, Inc., 8.00%, 12/15/2016 | | | | B1 | | | | | 150,000 | | | | | 156,750 | |
SESI LLC2, 6.375%, 5/1/2019 | | | | Ba3 | | | | | 1,675,000 | | | | | 1,658,250 | |
Thermon Industries, Inc., 9.50%, 5/1/2017 | | | | B1 | | | | | 1,518,000 | | | | | 1,628,055 | |
Trinidad Drilling Ltd. (Canada)2, 7.875%, 1/15/2019 | | | | B2 | | | | | 1,980,000 | | | | | 2,049,300 | |
| | | | | | | | | | | | | | | |
| | | | | | | | | | | | | | 7,103,305 | |
| | | | | | | | | | | | | | | |
Oil, Gas & Consumable Fuels - 8.8% | | | | | | | | | | | | | | | |
Arch Coal, Inc.2, 7.00%, 6/15/2019 | | | | B1 | | | | | 1,050,000 | | | | | 1,047,375 | |
Arch Western Finance LLC, 6.75%, 7/1/2013 | | | | B1 | | | | | 611,000 | | | | | 611,764 | |
Coffeyville Resources LLC - Coffeyville Finance, Inc.2, 9.00%, 4/1/2015 | | | | Ba3 | | | | | 604,000 | | | | | 655,340 | |
Coffeyville Resources LLC - Coffeyville Finance, Inc.2, 10.875%, 4/1/2017 | | | | B3 | | | | | 640,000 | | | | | 726,400 | |
Crosstex Energy LP - Crosstex Energy Finance Corp., 8.875%, 2/15/2018 | | | | B2 | | | | | 2,143,000 | | | | | 2,282,295 | |
Linn Energy LLC - Linn Energy Finance Corp.2, 7.75%, 2/1/2021 | | | | B2 | | | | | 1,455,000 | | | | | 1,513,200 | |
MarkWest Energy Partners LP - MarkWest Energy Finance Corp., 6.75%, 11/1/2020 | | | | B1 | | | | | 1,550,000 | | | | | 1,581,000 | |
Martin Midstream Partners LP - Martin Midstream Finance Corp., 8.875%, 4/1/2018 | | | | B | 3 | | | | 1,360,000 | | | | | 1,428,000 | |
Niska Gas Storage US LLC - Niska Gas Storage Canada ULC, 8.875%, 3/15/2018 | | | | B1 | | | | | 1,540,000 | | | | | 1,617,000 | |
Targa Resources Partners LP - Targa Resources Partners Finance Corp., 8.25%, 7/1/2016 | | | | B1 | | | | | 1,410,000 | | | | | 1,487,550 | |
Tesoro Corp., 9.75%, 6/1/2019 | | | | Ba1 | | | | | 1,440,000 | | | | | 1,609,200 | |
Whiting Petroleum Corp., 7.00%, 2/1/2014 | | | | Ba3 | | | | | 485,000 | | | | | 521,375 | |
| | | | | | | | | | | | | | | |
| | | | | | | | | | | | | | 15,080,499 | |
| | | | | | | | | | | | | | | |
Total Energy | | | | | | | | | | | | | | 22,183,804 | |
| | | | | | | | | | | | | | | |
Financials - 8.9% | | | | | | | | | | | | | | | |
Capital Markets - 0.8% | | | | | | | | | | | | | | | |
Goldman Sachs Capital II4, 5.793%, 12/29/2049 | | | | Baa2 | | | | | 1,650,000 | | | | | 1,320,000 | |
| | | | | | | | | | | | | | | |
Commercial Banks - 0.5% | | | | | | | | | | | | | | | |
Wilmington Trust Corp., 8.50%, 4/2/2018 | | | | Baa1 | | | | | 755,000 | | | | | 921,995 | |
| | | | | | | | | | | | | | | |
Consumer Finance - 4.1% | | | | | | | | | | | | | | | |
American Express Co.4, 6.80%, 9/1/2066 | | | | Baa2 | | | | | 2,940,000 | | | | | 3,020,850 | |
| | | | |
| 4 | | The accompanying notes are an integral part of the financial statements. | | |
Investment Portfolio - June 30, 2011 (unaudited)
| | | | | | | | | | | | | | | |
| | | Credit
Rating1 | | Principal Amount | | Value
(Note 2) |
| | | |
CORPORATE BONDS (continued) | | | | | | | | | | | | | | | |
| | | |
Non-Convertible Corporate Bonds (continued) | | | | | | | | | | | | | | | |
Financials (continued) | | | | | | | | | | | | | | | |
Consumer Finance (continued) | | | | | | | | | | | | | | | |
Credit Acceptance Corp., 9.125%, 2/1/2017 | | | | B1 | | | | $ | 2,185,000 | | | | $ | 2,337,950 | |
Discover Financial Services, 10.25%, 7/15/2019 | | | | Ba1 | | | | | 1,305,000 | | | | | 1,686,254 | |
| | | | | | | | | | | | | | | |
| | | | | | | | | | | | | | 7,045,054 | |
| | | | | | | | | | | | | | | |
Insurance - 1.0% | | | | | | | | | | | | | | | |
Hartford Financial Services Group, Inc.4, 8.125%, 6/15/2038 | | | | Ba1 | | | | | 1,500,000 | | | | | 1,616,250 | |
| | | | | | | | | | | | | | | |
Real Estate Investment Trusts (REITS) - 2.5% | | | | | | | | | | | | | | | |
DuPont Fabros Technology LP, 8.50%, 12/15/2017 | | | | Ba2 | | | | | 1,480,000 | | | | | 1,616,900 | |
Host Hotels & Resorts LP, 6.875%, 11/1/2014 | | | | BB | 3 | | | | 665,000 | | | | | 681,625 | |
Host Hotels & Resorts LP, 6.375%, 3/15/2015 | | | | Ba1 | | | | | 550,000 | | | | | 561,000 | |
Omega Healthcare Investors, Inc., 7.50%, 2/15/2020 | | | | Ba2 | | | | | 1,335,000 | | | | | 1,415,100 | |
| | | | | | | | | | | | | | | |
| | | | | | | | | | | | | | 4,274,625 | |
| | | | | | | | | | | | | | | |
Total Financials | | | | | | | | | | | | | | 15,177,924 | |
| | | | | | | | | | | | | | | |
Health Care - 12.5% | | | | | | | | | | | | | | | |
Biotechnology - 1.0% | | | | | | | | | | | | | | | |
STHI Holding Corp.2, 8.00%, 3/15/2018 | | | | B2 | | | | | 1,725,000 | | | | | 1,750,875 | |
| | | | | | | | | | | | | | | |
Health Care Equipment & Supplies - 6.1% | | | | | | | | | | | | | | | |
Alere, Inc., 7.875%, 2/1/2016 | | | | B2 | | | | | 1,725,000 | | | | | 1,785,375 | |
Alere, Inc., 9.00%, 5/15/2016 | | | | B3 | | | | | 1,323,000 | | | | | 1,377,574 | |
Fresenius Medical Care US Finance, Inc., 6.875%, 7/15/2017 | | | | Ba2 | | | | | 2,370,000 | | | | | 2,506,275 | |
Fresenius US Finance II, Inc.2, 9.00%, 7/15/2015 | | | | Ba1 | | | | | 2,820,000 | | | | | 3,190,125 | |
Teleflex, Inc., 6.875%, 6/1/2019 | | | | B1 | | | | | 1,650,000 | | | | | 1,670,625 | |
| | | | | | | | | | | | | | | |
| | | | | | | | | | | | | | 10,529,974 | |
| | | | | | | | | | | | | | | |
Health Care Providers & Services - 4.4% | | | | | | | | | | | | | | | |
BioScrip, Inc., 10.25%, 10/1/2015 | | | | Caa1 | | | | | 1,285,000 | | | | | 1,341,218 | |
HCA, Inc., 7.875%, 2/15/2020 | | | | Ba2 | | | | | 2,370,000 | | | | | 2,571,450 | |
Health Management Associates, Inc., 6.125%, 4/15/2016 | | | | BB | 3 | | | | 1,935,000 | | | | | 2,007,563 | |
LifePoint Hospitals, Inc., 6.625%, 10/1/2020 | | | | Ba1 | | | | | 1,500,000 | | | | | 1,545,000 | |
| | | | | | | | | | | | | | | |
| | | | | | | | | | | | | | 7,465,231 | |
| | | | | | | | | | | | | | | |
Life Sciences Tools & Services - 1.0% | | | | | | | | | | | | | | | |
PharmaNet Development Group, Inc.2, 10.875%, 4/15/2017 | | | | B3 | | | | | 1,350,000 | | | | | 1,687,500 | |
| | | | | | | | | | | | | | | |
Total Health Care | | | | | | | | | | | | | | 21,433,580 | |
| | | | | | | | | | | | | | | |
Industrials - 12.0% | | | | | | | | | | | | | | | |
Aerospace & Defense - 1.6% | | | | | | | | | | | | | | | |
Ducommun, Inc.2, 9.75%, 7/15/2018 | | | | B3 | | | | | 1,665,000 | | | | | 1,710,787 | |
GeoEye, Inc., 9.625%, 10/1/2015 | | | | Ba3 | | | | | 945,000 | | | | | 1,067,850 | |
| | | | | | | | | | | | | | | |
| | | | | | | | | | | | | | 2,778,637 | |
| | | | | | | | | | | | | | | |
| | | | | | |
| | The accompanying notes are an integral part of the financial statements. | | | 5 | |
Investment Portfolio - June 30, 2011 (unaudited)
| | | | | | | | | | | | | | | |
| | | Credit
Rating1 | | Principal Amount | | Value
(Note 2) |
| | | |
CORPORATE BONDS (continued) | | | | | | | | | | | | | | | |
| | | |
Non-Convertible Corporate Bonds (continued) | | | | | | | | | | | | | | | |
Industrials (continued) | | | | | | | | | | | | | | | |
Air Freight & Logistics - 1.0% | | | | | | | | | | | | | | | |
Aguila 3 S.A. (Luxembourg)2, 7.875%, 1/31/2018 | | | | B2 | | | | $ | 1,690,000 | | | | $ | 1,700,563 | |
| | | | | | | | | | | | | | | |
Airlines - 2.2% | | | | | | | | | | | | | | | |
Continental Airlines, Inc.2, 6.75%, 9/15/2015 | | | | Ba2 | | | | | 1,495,000 | | | | | 1,502,475 | |
Delta Air Lines Pass-Through Trust, Series 2010-1, Class B2, 6.375%, 1/2/2016 | | | | Ba3 | | | | | 1,490,000 | | | | | 1,430,400 | |
Delta Air Lines Pass-Through Trust, Series 2010-2, Class B, 6.75%, 11/23/2015 | | | | Ba3 | | | | | 850,000 | | | | | 816,000 | |
| | | | | | | | | | | | | | | |
| | | | | | | | | | | | | | 3,748,875 | |
| | | | | | | | | | | | | | | |
Building Products - 2.3% | | | | | | | | | | | | | | | |
Building Materials Corp. of America2, 6.875%, 8/15/2018 | | | | Ba3 | | | | | 825,000 | | | | | 841,500 | |
Building Materials Corp. of America2, 7.50%, 3/15/2020 | | | | Ba3 | | | | | 645,000 | | | | | 678,863 | |
Owens Corning, 9.00%, 6/15/2019 | | | | Ba1 | | | | | 2,075,000 | | | | | 2,478,369 | |
| | | | | | | | | | | | | | | |
| | | | | | | | | | | | | | 3,998,732 | |
| | | | | | | | | | | | | | | |
Commercial Services & Supplies - 1.6% | | | | | | | | | | | | | | | |
Clean Harbors, Inc., 7.625%, 8/15/2016 | | | | Ba3 | | | | | 1,072,000 | | | | | 1,136,320 | |
Clean Harbors, Inc.2, 7.625%, 8/15/2016 | | | | Ba3 | | | | | 250,000 | | | | | 265,000 | |
Garda World Security Corp. (Canada)2, 9.75%, 3/15/2017 | | | | B2 | | | | | 1,290,000 | | | | | 1,364,175 | |
| | | | | | | | | | | | | | | |
| | | | | | | | | | | | | | 2,765,495 | |
| | | | | | | | | | | | | | | |
Construction & Engineering - 0.6% | | | | | | | | | | | | | | | |
Boart Longyear Management Pty. Ltd. (Australia)2, 7.00%, 4/1/2021 | | | | Ba2 | | | | | 960,000 | | | | | 981,600 | |
| | | | | | | | | | | | | | | |
Industrial Conglomerates - 1.4% | | | | | | | | | | | | | | | |
GE Capital Trust I4, 6.375%, 11/15/2067 | | | | Aa3 | | | | | 2,250,000 | | | | | 2,303,437 | |
| | | | | | | | | | | | | | | |
Marine - 1.3% | | | | | | | | | | | | | | | |
Navios Maritime Holdings, Inc. - Navios Maritime Finance US,
Inc. (Marshall Island), 8.875%, 11/1/2017 | | | | Ba3 | | | | | 2,195,000 | | | | | 2,260,850 | |
| | | | | | | | | | | | | | | |
Total Industrials | | | | | | | | | | | | | | 20,538,189 | |
| | | | | | | | | | | | | | | |
Information Technology - 4.8% | | | | | | | | | | | | | | | |
Communications Equipment - 1.8% | | | | | | | | | | | | | | | |
Alcatel-Lucent USA, Inc., 6.45%, 3/15/2029 | | | | B1 | | | | | 1,580,000 | | | | | 1,422,000 | |
EH Holding Corp.2, 6.50%, 6/15/2019 | | | | Ba3 | | | | | 1,665,000 | | | | | 1,694,137 | |
| | | | | | | | | | | | | | | |
| | | | | | | | | | | | | | 3,116,137 | |
| | | | | | | | | | | | | | | |
Electronic Equipment, Instruments & Components - 1.0% | | | | | | | | | | | | | | | |
CPI International Acquisition, Inc.2, 8.00%, 2/15/2018 | | | | B3 | | | | | 1,700,000 | | | | | 1,606,500 | |
| | | | | | | | | | | | | | | |
Semiconductors & Semiconductor Equipment - 1.7% | | | | | | | | | | | | | | | |
Advanced Micro Devices, Inc., 8.125%, 12/15/2017 | | | | Ba3 | | | | | 645,000 | | | | | 674,025 | |
Advanced Micro Devices, Inc., 7.75%, 8/1/2020 | | | | Ba3 | | | | | 760,000 | | | | | 782,800 | |
| | | | |
| 6 | | The accompanying notes are an integral part of the financial statements. | | |
Investment Portfolio - June 30, 2011 (unaudited)
| | | | | | | | | | | | | | | |
| | | Credit
Rating1 | | Principal Amount | | Value
(Note 2) |
| | | |
CORPORATE BONDS (continued) | | | | | | | | | | | | | | | |
| | | |
Non-Convertible Corporate Bonds (continued) | | | | | | | | | | | | | | | |
Information Technology (continued) | | | | | | | | | | | | | | | |
Semiconductors & Semiconductor Equipment (continued) | | | | | | | | | | | | | | | |
MagnaChip Semiconductor S.A. - MagnaChip Semiconductor Finance Co., 10.50%, 4/15/2018 | | | | B2 | | | | $ | 1,360,000 | | | | $ | 1,489,200 | |
| | | | | | | | | | | | | | | |
| | | | | | | | | | | | | | 2,946,025 | |
| | | | | | | | | | | | | | | |
Software - 0.3% | | | | | | | | | | | | | | | |
Audatex North America, Inc.2, 6.75%, 6/15/2018 | | | | Ba2 | | | | | 500,000 | | | | | 502,500 | |
| | | | | | | | | | | | | | | |
Total Information Technology | | | | | | | | | | | | | | 8,171,162 | |
| | | | | | | | | | | | | | | |
Materials - 10.4% | | | | | | | | | | | | | | | |
Chemicals - 1.9% | | | | | | | | | | | | | | | |
Ferro Corp., 7.875%, 8/15/2018 | | | | B2 | | | | | 1,470,000 | | | | | 1,525,125 | |
Rhodia S.A. (France)2, 6.875%, 9/15/2020 | | | | B1 | | | | | 1,535,000 | | | | | 1,797,869 | |
| | | | | | | | | | | | | | | |
| | | | | | | | | | | | | | 3,322,994 | |
| | | | | | | | | | | | | | | |
Containers & Packaging - 2.8% | | | | | | | | | | | | | | | |
Longview Fibre Paper & Packaging, Inc.2, 8.00%, 6/1/2016 | | | | B2 | | | | | 1,665,000 | | | | | 1,673,325 | |
Reynolds Group Issuer, Inc. - Reynolds Group Issuer LLC2, 8.75%, 5/15/2018 | | | | Caa1 | | | | | 1,375,000 | | | | | 1,350,937 | |
Reynolds Group Issuer, Inc. - Reynolds Group Issuer LLC2, 7.125%, 4/15/2019 | | | | Ba3 | | | | | 1,830,000 | | | | | 1,816,275 | |
| | | | | | | | | | | | | | | |
| | | | | | | | | | | | | | 4,840,537 | |
| | | | | | | | | | | | | | | |
Metals & Mining - 4.3% | | | | | | | | | | | | | | | |
Calcipar S.A. (Luxembourg)2, 6.875%, 5/1/2018 | | | | B1 | | | | | 2,510,000 | | | | | 2,516,275 | |
FMG Resources August 2006 Pty. Ltd. (Australia)2, 6.875%, 2/1/2018 | | | | B1 | | | | | 1,690,000 | | | | | 1,715,350 | |
Mirabela Nickel Ltd. (Australia)2, 8.75%, 4/15/2018 | | | | B2 | | | | | 1,680,000 | | | | | 1,671,600 | |
Steel Dynamics, Inc., 7.75%, 4/15/2016 | | | | Ba2 | | | | | 1,300,000 | | | | | 1,365,000 | |
| | | | | | | | | | | | | | | |
| | | | | | | | | | | | | | 7,268,225 | |
| | | | | | | | | | | | | | | |
Paper & Forest Products - 1.4% | | | | | | | | | | | | | | | |
Georgia-Pacific LLC2, 8.25%, 5/1/2016 | | | | Ba1 | | | | | 2,115,000 | | | | | 2,397,477 | |
| | | | | | | | | | | | | | | |
Total Materials | | | | | | | | | | | | | | 17,829,233 | |
| | | | | | | | | | | | | | | |
Telecommunication Services - 7.5% | | | | | | | | | | | | | | | |
Diversified Telecommunication Services - 4.3% | | | | | | | | | | | | | | | |
Inmarsat Finance plc (United Kingdom)2, 7.375%, 12/1/2017 | | | | Ba2 | | | | | 2,385,000 | | | | | 2,528,100 | |
Intelsat Jackson Holdings S.A. (Luxembourg)2, 7.25%, 4/1/2019 | | | | B3 | | | | | 2,530,000 | | | | | 2,511,025 | |
Wind Acquisition Finance S.A. (Luxembourg)2, 11.75%, 7/15/2017 | | | | B2 | | | | | 1,800,000 | | | | | 2,038,500 | |
Wind Acquisition Finance S.A. (Luxembourg)2, 7.25%, 2/15/2018 | | | | Ba2 | | | | | 275,000 | | | | | 286,000 | |
| | | | | | | | | | | | | | | |
| | | | | | | | | | | | | | 7,363,625 | |
| | | | | | | | | | | | | | | |
| | | | | | |
| | The accompanying notes are an integral part of the financial statements. | | | 7 | |
Investment Portfolio - June 30, 2011 (unaudited)
| | | | | | | | | | | | | | | |
| | | Credit
Rating1 | | Principal Amount/
Shares | | Value
(Note 2) |
| | | |
CORPORATE BONDS (continued) | | | | | | | | | | | | | | | |
| | | |
Non - Convertible Corporate Bonds (continued) | | | | | | | | | | | | | | | |
Telecommunication Services (continued) | | | | | | | | | | | | | | | |
Wireless Telecommunication Services - 3.2% | | | | | | | | | | | | | | | |
CC Holdings GS V LLC - Crown Castle GS III Corp.2, 7.75%, 5/1/2017 | | | | Baa3 | | | | $ | 3,145,000 | | | | $ | 3,404,463 | |
NII Capital Corp., 8.875%, 12/15/2019 | | | | B2 | | | | | 1,845,000 | | | | | 2,036,419 | |
| | | | | | | | | | | | | | | |
| | | | | | | | | | | | | | 5,440,882 | |
| | | | | | | | | | | | | | | |
Total Telecommunication Services | | | | | | | | | | | | | | 12,804,507 | |
| | | | | | | | | | | | | | | |
Utilities - 1.9% | | | | | | | | | | | | | | | |
Gas Utilities - 0.9% | | | | | | | | | | | | | | | |
Ferrellgas LP - Ferrellgas Finance Corp.2, 6.50%, 5/1/2021 | | | | Ba3 | | | | | 1,615,000 | | | | | 1,526,175 | |
| | | | | | | | | | | | | | | |
Independent Power Producers & Energy Traders - 1.0% | | | | | | | | | | | | | | | |
The AES Corp., 8.00%, 10/15/2017 | | | | B1 | | | | | 1,655,000 | | | | | 1,754,300 | |
| | | | | | | | | | | | | | | |
Total Utilities | | | | | | | | | | | | | | 3,280,475 | |
| | | | | | | | | | | | | | | |
TOTAL CORPORATE BONDS
(Identified Cost $154,484,515) | | | | | | | | | | | | | | 159,202,141 | |
| | | | | | | | | | | | | | | |
| | | |
PREFERRED STOCKS - 3.8% | | | | | | | | | | | | | | | |
| | | |
Financials - 3.8% | | | | | | | | | | | | | | | |
Commercial Banks - 1.5% | | | | | | | | | | | | | | | |
Wells Fargo & Co., Series K5, 7.98% | | | | Baa3 | | | | | 2,335,000 | | | | | 2,521,800 | |
| | | | | | | | | | | | | | | |
Diversified Financial Services - 2.3% | | | | | | | | | | | | | | | |
Bank of America Corp., Series K5, 8.00% | | | | Ba3 | | | | | 1,410,000 | | | | | 1,472,477 | |
JPMorgan Chase & Co., Series 15, 7.90% | | | | Baa1 | | | | | 2,275,000 | | | | | 2,443,555 | |
| | | | | | | | | | | | | | | |
| | | | | | | | | | | | | | 3,916,032 | |
| | | | | | | | | | | | | | | |
TOTAL PREFERRED STOCKS
(Identified Cost $5,951,799) | | | | | | | | | | | | | | 6,437,832 | |
| | | | | | | | | | | | | | | |
| | | |
SHORT-TERM INVESTMENTS - 1.4% | | | | | | | | | | | | | | | |
Dreyfus Cash Management, Inc. - Institutional Shares6, 0.10%, (Identified Cost $2,364,687) | | | | | | | | | 2,364,687 | | | | | 2,364,687 | |
| | | | | | | | | | | | | | | |
| | | |
TOTAL INVESTMENTS - 98.3%
(Identified Cost $162,801,001) | | | | | | | | | | | | | | 168,004,660 | |
OTHER ASSETS, LESS LIABILITIES - 1.7% | | | | | | | | | | | | | | 2,904,580 | |
| | | | | | | | | | | | | | | |
NET ASSETS - 100% | | | | | | | | | | | | | $ | 170,909,240 | |
| | | | | | | | | | | | | | | |
| | | | |
| 8 | | The accompanying notes are an integral part of the financial statements. | | |
Investment Portfolio - June 30, 2011 (unaudited)
| 1 | Credit ratings from Moody’s (unaudited). |
| 2 | Restricted securities - Investment in securities that are restricted as to public resale under the Securities Act of 1933, as amended. These securities have been sold under rule 144A and have been determined to be liquid under guidelines established by the Board of Directors. These securities amount to $70,520,825, or 41.3%, of the Series’ net assets as of June 30, 2011. |
| 3 | Credit ratings from S&P (unaudited). |
| 4 | The coupon rate is floating and is the stated rate as of June 30, 2011. |
| 5 | The rate shown is a fixed rate as of June 30, 2011; the rate becomes floating in 2049. |
| 6 | Rate shown is the current yield as of June 30, 2011. |
| | | | | | |
| | The accompanying notes are an integral part of the financial statements. | | | 9 | |
Statement of Assets and Liabilities (unaudited)
June 30, 2011
| | | | | |
ASSETS: | | | | | |
Investments, at value (identified cost $162,801,001) (Note 2) | | | $ | 168,004,660 | |
Interest receivable | | | | 3,079,282 | |
Receivable for fund shares sold | | | | 183,125 | |
Dividends receivable | | | | 480 | |
| | | | | |
| |
TOTAL ASSETS | | | | 171,267,547 | |
| | | | | |
| |
LIABILITIES: | | | | | |
| |
Accrued management fees (Note 3) | | | | 140,409 | |
Accrued fund accounting and administration fees (Note 3) | | | | 11,728 | |
Accrued transfer agent fees (Note 3) | | | | 2,334 | |
Accrued Chief Compliance Officer service fees (Note 3) | | | | 465 | |
Accrued directors’ fees (Note 3) | | | | 348 | |
Payable for fund shares repurchased | | | | 162,311 | |
Audit fees payable | | | | 21,061 | |
Other payables and accrued expenses | | | | 19,651 | |
| | | | | |
| |
TOTAL LIABILITIES | | | | 358,307 | |
| | | | | |
| |
TOTAL NET ASSETS | | | $ | 170,909,240 | |
| | | | | |
| |
NET ASSETS CONSIST OF: | | | | | |
| |
Capital stock | | | $ | 153,134 | |
Additional paid-in-capital | | | | 156,931,109 | |
Undistributed net investment income | | | | 5,079,898 | |
Accumulated net realized gain on investments, foreign currency and translation of other assets and liabilities | | | | 3,541,440 | |
Net unrealized appreciation on investments | | | | 5,203,659 | |
| | | | | |
| |
TOTAL NET ASSETS | | | $ | 170,909,240 | |
| | | | | |
| |
NET ASSET VALUE, OFFERING PRICE AND REDEMPTION PRICE PER SHARE - Class A ($170,909,240/15,313,426 shares) | | | $ | 11.16 | |
| | | | | |
| | | | |
| 10 | | The accompanying notes are an integral part of the financial statements. | | |
Statement of Operations (unaudited)
For the Six Months Ended June 30, 2011
| | | | | |
INVESTMENT INCOME: | | | | | |
| |
Interest | | | $ | 5,784,342 | |
Dividends | | | | 197,915 | |
| | | | | |
| |
Total Investment Income | | | | 5,982,257 | |
| | | | | |
| |
EXPENSES: | | | | | |
| |
Management fees (Note 3) | | | | 830,307 | |
Fund accounting and administration fees (Note 3) | | | | 30,128 | |
Transfer agent fees (Note 3) | | | | 5,725 | |
Directors’ fees (Note 3) | | | | 2,299 | |
Chief Compliance Officer service fees (Note 3) | | | | 1,315 | |
Custodian fees | | | | 4,628 | |
Miscellaneous | | | | 49,212 | |
| | | | | |
| |
Total Expenses | | | | 923,614 | |
| | | | | |
| |
NET INVESTMENT INCOME | | | | 5,058,643 | |
| | | | | |
| |
REALIZED AND UNREALIZED GAIN (LOSS) ON INVESTMENTS AND FOREIGN CURRENCY: | | | | | |
| |
Net realized gain (loss) on- | | | | | |
Investments | | | | 3,134,915 | |
Foreign currency and translation of other assets and liabilities | | | | (35,845 | ) |
| | | | | |
| |
| | | | 3,099,070 | |
| | | | | |
| |
Net change in unrealized appreciation (depreciation) on- | | | | | |
Investments | | | | (1,826,470 | ) |
Foreign currency and translation of other assets and liabilities | | | | (75 | ) |
| | | | | |
| |
| | | | (1,826,545 | ) |
| | | | | |
| |
NET REALIZED AND UNREALIZED GAIN ON INVESTMENTS AND FOREIGN CURRENCY | | | | 1,272,525 | |
| | | | | |
| |
NET INCREASE IN NET ASSETS RESULTING FROM OPERATIONS | | | $ | 6,331,168 | |
| | | | | |
| | | | | | |
| | The accompanying notes are an integral part of the financial statements. | | | 11 | |
Statements of Changes in Net Assets
| | | | | | | | | | |
| | | For the Six
Months Ended
6/30/11
(unaudited) | | For the
Year Ended
12/31/10 |
INCREASE (DECREASE) IN NET ASSETS: | | | | | | | | | | |
| | |
OPERATIONS: | | | | | | | | | | |
| | |
Net investment income | | | $ | 5,058,643 | | | | $ | 9,775,342 | |
Net realized gain on investments and foreign currency | | | | 3,099,070 | | | | | 3,882,317 | |
Net change in unrealized appreciation (depreciation) on investments and foreign currency | | | | (1,826,545 | ) | | | | 4,696,008 | |
| | | | | | | | | | |
| | |
Net increase from operations | | | | 6,331,168 | | | | | 18,353,667 | |
| | | | | | | | | | |
| | |
DISTRIBUTIONS TO SHAREHOLDERS (Note 8): | | | | | | | | | | |
| | |
From net investment income | | | | — | | | | | (10,050,478 | ) |
From net realized gain on investments | | | | — | | | | | (3,847,008 | ) |
| | | | | | | | | | |
| | |
Total distributions to shareholders | | | | — | | | | | (13,897,486 | ) |
| | | | | | | | | | |
| | |
CAPITAL STOCK ISSUED AND REPURCHASED: | | | | | | | | | | |
| | |
Net increase from capital share transactions (Note 5) | | | | 6,396,761 | | | | | 26,046,907 | |
| | | | | | | | | | |
| | |
Net increase in net assets | | | | 12,727,929 | | | | | 30,503,088 | |
| | |
NET ASSETS: | | | | | | | | | | |
| | |
Beginning of period | | | | 158,181,311 | | | | | 127,678,223 | |
| | | | | | | | | | |
| | |
End of period (including undistributed net investment income of $5,079,898 and $21,255, respectively) | | | $ | 170,909,240 | | | | $ | 158,181,311 | |
| | | | | | | | | | |
| | | | |
| 12 | | The accompanying notes are an integral part of the financial statements. | | |
Financial Highlights
| | | | | | | | | | | | | | | |
| | | For the Six
Months Ended
6/30/11
(unaudited) | | For the
Year Ended
12/31/10 | | For the
Period
9/14/091 to
12/31/09 |
Per share data (for a share outstanding throughout each period): | | | | | | | | | | | | | | | |
Net asset value - Beginning of period | | | $ | 10.74 | | | | $ | 10.37 | | | | $ | 10.00 | |
| | | | | | | | | | | | | | | |
Income from investment operations: | | | | | | | | | | | | | | | |
Net investment income2 | | | | 0.33 | | | | | 0.75 | | | | | 0.20 | |
Net realized and unrealized gain on investments | | | | 0.09 | | | | | 0.66 | | | | | 0.28 | |
| | | | | | | | | | | | | | | |
Total from investment operations | | | | 0.42 | | | | | 1.41 | | | | | 0.48 | |
| | | | | | | | | | | | | | | |
Less distributions to shareholders: | | | | | | | | | | | | | | | |
From net investment income | | | | — | | | | | (0.75 | ) | | | | (0.10 | ) |
From net realized gain on investments | | | | — | | | | | (0.29 | ) | | | | (0.01 | ) |
| | | | | | | | | | | | | | | |
Total distributions to shareholders | | | | — | | | | | (1.04 | ) | | | | (0.11 | ) |
| | | | | | | | | | | | | | | |
Net asset value - End of period | | | $ | 11.16 | | | | $ | 10.74 | | | | $ | 10.37 | |
| | | | | | | | | | | | | | | |
Net assets - End of period (000’s omitted) | | | $ | 170,909 | | | | $ | 158,181 | | | | $ | 127,678 | |
| | | | | | | | | | | | | | | |
Total return3 | | | | 3.91 | % | | | | 13.59 | % | | | | 4.82 | % |
Ratios (to average net assets)/ Supplemental Data: | | | | | | | | | | | | | | | |
Expenses* | | | | 1.11 | %4 | | | | 1.14 | % | | | | 1.20 | %4 |
Net investment income | | | | 6.09 | %4 | | | | 6.79 | % | | | | 6.51 | %4 |
Portfolio turnover | | | | 32 | % | | | | 54 | % | | | | 22 | % |
|
* The investment advisor did not impose all or a portion of its management fees, CCO fees, fund accounting and transfer agent fees and other fees in some periods and in some periods paid a portion of the Series’ expenses. If these expenses had been incurred by the Series, the expense ratio (to average net assets) would have been increased by the following amount: | |
| | | | N/A | | | | | 0.00 | %5 | | | | 0.02 | %4 |
| 1 | Commencement of operations. |
| 2 | Calculated based on average shares outstanding during the period. |
| 3 | Represents aggregate total return for the periods indicated, and assumes reinvestment of all distributions. Total return would have been lower had certain expenses not been waived or reimbursed during certain periods. Periods less than one year are not annualized. |
| | | | | | |
| | The accompanying notes are an integral part of the financial statements. | | | 13 | |
Notes to Financial Statements (unaudited)
High Yield Bond Series (the “Series”) is a no-load non-diversified series of Manning & Napier Fund, Inc. (the “Fund”).
The Fund is organized in Maryland and is registered under the Investment Company Act of 1940, as amended, as an open-end management investment company.
The Series’ investment objective is to provide a high level of long-term total return by investing principally in non-investment grade fixed income securities that are issued by government and corporate entities.
The Fund’s Advisor is Manning & Napier Advisors, Inc. (the “Advisor”). On September 14, 2009 the Series resumed sales of shares to advisory clients and employees of the Advisor and its affiliates and directly to investors. The total authorized capital stock of the Fund consists of 10.0 billion shares of common stock each having a par value of $0.01. As of June 30, 2011, 6.4 billion shares have been designated in total among 31 series, of which 125 million have been designated as High Yield Bond Series Class A common stock.
| 2. | SIGNIFICANT ACCOUNTING POLICIES |
Security Valuation
Portfolio securities, including domestic equities, foreign equities, warrants and options, listed on an exchange other than the NASDAQ National Market System are valued at the latest quoted sales price of the exchange on which the security is primarily traded. Securities not traded on valuation date or securities not listed on an exchange are valued at the latest quoted bid price provided by the Fund’s pricing service. Securities listed on the NASDAQ National Market System are valued in accordance with the NASDAQ Official Closing Price.
Debt securities, including government bonds, foreign bonds, asset-backed securities, structured notes, supranational obligations, sovereign bonds, corporate bonds and mortgage-backed securities will normally be valued on the basis of evaluated bid prices provided directly by an independent pricing service. The pricing services use multiple valuation techniques to determine fair value. In instances where sufficient market activity exists, the pricing services may utilize a market-based approach through which quotes from market makers are used to determine fair value. In instances where sufficient market activity may not exist or is limited, the pricing services also utilize proprietary valuation models which may consider market characteristics such as benchmark yield curves, option-adjusted spreads, credit spreads, estimated default rates, coupon rates, anticipated timing of principal repayments, underlying collateral, and other unique security features in order to estimate the relevant cash flows, which are then discounted to calculate the fair value. Certain investments in securities held by the Series may be valued on a basis of a price provided directly by a principal market maker. These prices may differ from the value that would have been used had a broader market for securities existed.
Short-term investments that mature in sixty days or less are valued at amortized cost, which approximates market value. Investments in open-end investment companies are valued at their net asset value per share on valuation date.
Volume and level of activity in established markets for an asset or liability are evaluated to determine whether recent transactions and quoted prices are determinative of fair value. Where there have been significant decreases in volume and level of activity, further analysis and adjustment may be necessary to estimate fair value. The Series measures fair value in these instances by the use of inputs and valuation techniques which may be based upon current market prices of securities that are comparable in coupon, rating, maturity and industry and/or expectation of future cash flows. As a result of trading in relatively thin markets and/or markets that experience significant volatility, the prices used by the Series to value these securities may differ from the value that would be realized if these securities were sold, and the differences could be material.
Securities for which representative valuations or prices are not available from the Fund’s pricing service may be valued at fair value. Due to the inherent uncertainty of valuations of such securities, the fair value may differ significantly
Notes to Financial Statements (unaudited)
| 2. | SIGNIFICANT ACCOUNTING POLICIES (continued) |
Security Valuation (continued)
from the values that would have been used had a ready market for such securities existed. If trading or events occurring after the close of the principal market in which securities are traded are expected to materially affect the value of those securities, then they may be valued at their fair value, taking this trading or these events into account. Fair value is determined in good faith by the Advisor under procedures approved by and under the general supervision and responsibility of the Fund’s Board of Directors (the “Board”).
Various inputs are used in determining the value of the Series’ assets or liabilities carried at market value. These inputs are summarized in three broad levels. Level 1 includes quoted prices in active markets for identical assets and liabilities. Level 2 includes other significant observable inputs (including quoted prices for similar securities, interest rates, prepayment speeds, credit risk, etc.). Level 3 includes significant unobservable inputs (including the Series’ own assumptions in determining the fair value of investments). The inputs or methodology used for valuing securities are not necessarily an indication of the risk associated with investing in those securities.
The following is a summary of the valuation levels used for major security types as of June 30, 2011 in valuing the Series’ assets or liabilities carried at market value:
| | | | | | | | | | | | | | | | | | | | |
Description | | Total | | Level 1 | | Level 2 | | Level 3 |
Assets: | | | | | | | | | | | | | | | | | | | | |
Equity securities*: | | | $ | — | | | | $ | — | | | | $ | — | | | | $ | — | |
Preferred securities: | | | | | | | | | | | | | | | | | | | | |
Financials | | | | 6,437,832 | | | | | — | | | | | 6,437,832 | | | | | — | |
Debt securities: | | | | | | | | | | | | | | | | | | | | |
U.S. Treasury and other U.S. Government agencies | | | | — | | | | | — | | | | | — | | | | | — | |
Corporate debt: | | | | | | | | | | | | | | | | | | | — | |
Consumer Discretionary | | | | 30,679,954 | | | | | — | | | | | 30,679,954 | | | | | — | |
Consumer Staples | | | | 7,103,313 | | | | | — | | | | | 7,103,313 | | | | | — | |
Energy | | | | 22,183,804 | | | | | — | | | | | 22,183,804 | | | | | — | |
Financials | | | | 15,177,924 | | | | | — | | | | | 15,177,924 | | | | | — | |
Health Care | | | | 21,433,580 | | | | | — | | | | | 21,433,580 | | | | | — | |
Industrials | | | | 20,538,189 | | | | | — | | | | | 20,538,189 | | | | | — | |
Information Technology | | | | 8,171,162 | | | | | — | | | | | 8,171,162 | | | | | — | |
Materials | | | | 17,829,233 | | | | | — | | | | | 17,829,233 | | | | | — | |
Telecommunication Services | | | | 12,804,507 | | | | | — | | | | | 12,804,507 | | | | | — | |
Utilities | | | | 3,280,475 | | | | | — | | | | | 3,280,475 | | | | | — | |
Asset-backed securities | | | | — | | | | | — | | | | | — | | | | | — | |
Commercial mortgage-backed securities | | | | — | | | | | — | | | | | — | | | | | | |
Mutual funds | | | | 2,364,687 | | | | | 2,364,687 | | | | | — | | | | | — | |
Other financial instruments** | | | | — | | | | | — | | | | | — | | | | | — | |
| | | | | | | | | | | | | | | | | | | | |
Total assets: | | | | 168,004,660 | | | | | 2,364,687 | | | | | 165,639,973 | | | | | — | |
| | | | | | | | | | | | | | | | | | | | |
Liabilities: | | | | | | | | | | | | | | | | | | | | |
Other financial instruments** | | | | — | | | | | — | | | | | — | | | | | — | |
| | | | | | | | | | | | | | | | | | | | |
Total liabilities | | | | — | | | | | — | | | | | — | | | | | — | |
| | | | | | | | | | | | | | | | | | | | |
Total | | | $ | 168,004,660 | | | | $ | 2,364,687 | | | | $ | 165,639,973 | | | | $ | — | |
| | | | | | | | | | | | | | | | | | | | |
Notes to Financial Statements (unaudited)
| 2. | SIGNIFICANT ACCOUNTING POLICIES (continued) |
Security Valuation (continued)
| * | Includes common stock, warrants and rights. |
| ** | Other financial instruments are derivative instruments not reflected in the Investment Portfolio, such as futures, forwards and swap contracts, which are valued at the unrealized appreciation/depreciation on the instrument. As of June 30, 2011, the Series did not hold any derivative instruments. |
There were no Level 3 securities held by the Series as of December 31, 2010 or June 30, 2011.
The Fund’s policy is to recognize transfers in and transfers out of the valuation levels as of the beginning of the reporting period. There were no significant transfers between Level 1 and Level 2 during the six months ended June 30, 2011.
Recent Accounting Standard
In May 2011, the Financial Accounting Standards Board issued amended guidance to improve disclosure about fair value measurements which will require the following disclosures for fair value measurements categorized as Level 3: quantitative information about the unobservable inputs and assumptions used in the fair value measurement, a description of the valuation policies and procedures and a narrative description of the sensitivity of the fair value measurement to changes in unobservable inputs and the interrelationships between those unobservable inputs. In addition, the amounts and reasons for all transfers in and out of Level 1 and Level 2 will be required to be disclosed. The amended guidance is effective for financial statements for fiscal years beginning after December 15, 2011, and interim periods within those fiscal years. Management is evaluating the impact of this guidance on the Series’ financial statements and disclosures.
Security Transactions, Investment Income and Expenses
Security transactions are accounted for on trade date. Dividend income is recorded on the ex-dividend date, except that if the ex-dividend date has passed, certain dividends from foreign securities are recorded as soon as the Fund is informed of the ex-dividend date. Non-cash dividends, if any, are recorded at the fair market value of the securities received. Interest income, including amortization of premium and accretion of discounts using the effective interest method, is earned from settlement date and accrued daily.
Expenses are recorded on an accrual basis. Most expenses of the Fund can be attributed to a specific series. Expenses which cannot be directly attributed are apportioned among the series in the Fund in such a manner as deemed equitable by the Fund’s Board, taking into consideration, among other things, the nature and type of expense.
The Series uses the identified cost method for determining realized gain or loss on investments for both financial statement and federal income tax reporting purposes.
Foreign Currency Translation
The books and records of the Series are maintained in U.S. dollars. Foreign currencies, investments and other assets and liabilities are translated into U.S. dollars at the current exchange rates. Purchases and sales of investment securities and income and expenses are translated on the respective dates of such transactions. The Series do not isolate realized and unrealized gains and losses attributable to changes in the exchange rates from gains and losses that arise from changes in the market value of investments. Such fluctuations are included with net realized and unrealized gain or loss on investments. Net realized foreign currency gains and losses represent foreign currency gains and losses between trade date and settlement date on securities transactions, gains and losses on disposition of foreign currencies and the difference between the amount of income and foreign withholding taxes recorded on the books of the Series and the amounts actually received or paid.
Notes to Financial Statements (unaudited)
| 2. | SIGNIFICANT ACCOUNTING POLICIES (continued) |
Restricted Securities
Restricted securities are purchased in private placement transactions, are not registered under the Securities Act of 1933, as amended, and may have contractual restrictions on resale. Information regarding restricted securities is included at the end of the Series’ Investment Portfolio.
Illiquid Securities
A security may be considered illiquid if so deemed in good faith by the Advisor under procedures approved by and under the general supervision and responsibility of the Fund’s Board. Securities that are illiquid are marked with the applicable footnote on the Investment Portfolio. No such investments were held by the Series on June 30, 2011.
Federal Taxes
The Series’ policy is to comply with the provisions of the Internal Revenue Code applicable to regulated investment companies. The Series is not subject to federal income tax or excise tax to the extent that the Series distributes to shareholders each year its taxable income, including any net realized gains on investments, in accordance with requirements of the Internal Revenue Code. Accordingly, no provision for federal income tax or excise tax has been made in the financial statements.
Management evaluates its tax positions to determine if the tax positions taken meet the minimum recognition threshold in connection with accounting for uncertainties in income tax positions taken or expected to be taken for the purposes of measuring and recognizing tax liabilities in the financial statements. Recognition of tax benefits of an uncertain tax position is required only when the position is “more likely than not” to be sustained assuming examination by taxing authorities. At June 30, 2011, the Series has recorded no liability for net unrecognized tax benefits relating to uncertain income tax positions taken or expected to be taken in future tax returns.
The Series files income tax returns in the U.S. federal jurisdiction, various states and foreign jurisdictions, as required. No income tax returns are currently under investigation. The statute of limitations on the Series’ tax returns remains open for the period ended December 31, 2009 through the year ended December 31, 2010. The Fund is not aware of any tax positions for which it is reasonably possible that the total amounts of unrecognized tax benefits will significantly change in the next twelve months.
Additionally, based on the Fund’s understanding of the tax rules and rates related to income, gains and transactions for foreign jurisdictions in which it invests, the Series will provide for foreign taxes, and where appropriate, deferred foreign tax.
Distributions of Income and Gains
Distributions to shareholders of net investment income and net realized gains are made annually. An additional distribution may be necessary to avoid taxation of the Series. Distributions are recorded on the ex-dividend date.
Indemnifications
The Fund’s organizational documents provide former and current directors and officers with a limited indemnification against liabilities arising in connection with the performance of their duties to the Fund. In the normal course of business, the Fund may also enter into contracts that provide general indemnifications. The Fund’s maximum exposure under these arrangements is unknown as this would be dependent on future claims that may be made against the Fund. The risk of material loss from such claims is considered remote.
Other
The preparation of financial statements in conformity with accounting principles generally accepted in the United States of America requires management to make estimates and assumptions that affect the reported amounts of
Notes to Financial Statements (unaudited)
| 2. | SIGNIFICANT ACCOUNTING POLICIES (continued) |
Other (continued)
assets and liabilities and the disclosure of contingent assets and liabilities at the date of the financial statements and the reported amounts of income and expenses during the reporting period. Actual results could differ from those estimates.
| 3. | TRANSACTIONS WITH AFFILIATES |
The Fund has an Investment Advisory Agreement (the “Agreement”) with the Advisor, for which the Series pays a fee, computed daily and payable monthly, at an annual rate of 1.00% of the Series’ average daily net assets.
Under the Agreement, personnel of the Advisor provide the Series with advice and assistance in the choice of investments and the execution of securities transactions, and otherwise maintain the Series’ organization. The Advisor also provides the Fund with necessary office space and fund administration and support services. The salaries of all officers of the Fund (except a percentage of the Fund’s Chief Compliance Officer’s salary, which is paid by the Fund), and of all Directors who are “affiliated persons” of the Fund, or of the Advisor, and all personnel of the Fund, or of the Advisor, performing services relating to research, statistical and investment activities, are paid by the Advisor. Each “non-affiliated” Director receives an annual stipend, which is allocated among all the active series of the Fund. In addition, these Directors also receive a fee per Board meeting attended plus a fee for each committee meeting attended.
The Advisor has contractually agreed, until at least April 30, 2012, to waive its fee and, if necessary, pay other operating expenses of the Series in order to maintain total direct annual fund operating expenses for the Series at no more than 1.20% of average daily net assets each year. The Advisor did not waive any fees for the six months ended June 30, 2011. The Advisor is not eligible to recoup any expenses that have been waived or reimbursed in prior years.
Manning & Napier Investor Services, Inc., a registered broker-dealer affiliate of the Advisor, acts as distributor for the Fund’s shares. The services of Manning & Napier Investor Services, Inc. are provided at no additional cost to the Series.
The Advisor has agreements with BNY Mellon Investment Servicing (U.S.) Inc. (“BNY”) under which BNY serves as sub-accountant services agent and sub-transfer agent. The Fund pays the Advisor an annual fee related to fund accounting and administration of 0.0175% on the first $3 billion of average daily net assets (excluding Target Series); 0.015% on the next $3 billion of average daily net assets (excluding Target Series); and 0.01% of the average daily net assets in excess of $6 billion (excluding Target Series); plus a base fee of $25,500 per Series. Transfer Agent fees are charged to the Fund on a per account basis. Additionally, certain transaction- and cusip-based fees and out-of-pocket expenses, including charges for reporting relating to the Fund’s compliance program, are charged.
Expenses not directly attributable to a Series are allocated based on each Series’ relative net assets or number of accounts, depending on the expense.
| 4. | PURCHASES AND SALES OF SECURITIES |
For the six months ended June 30, 2011, purchases and sales of securities, other than U.S. Government securities and short-term securities, were $64,963,531 and $51,003,393, respectively. There were no purchases or sales of U.S. Government securities.
Notes to Financial Statements (unaudited)
| 5. | CAPITAL STOCK TRANSACTIONS |
Transactions in shares of High Yield Bond Series were:
| | | | | | | | | | | | | | | | | | | | |
| | | For the Six Months
Ended 6/30/11 | | For the Year
Ended 12/31/10 |
| | | Shares | | Amount | | Shares | | Amount |
Sold | | | | 1,050,661 | | | | $ | 11,592,705 | | | | | 2,275,341 | | | | $ | 24,816,656 | |
Reinvested | | | | — | | | | | — | | | | | 1,258,376 | | | | | 13,463,941 | |
Repurchased | | | | (470,382 | ) | | | | (5,195,944 | ) | | | | (1,117,255 | ) | | | | (12,233,690 | ) |
| | | | | | | | | | | | | | | | | | | | |
Total | | | | 580,279 | | | | $ | 6,396,761 | | | | | 2,416,462 | | | | $ | 26,046,907 | |
| | | | | | | | | | | | | | | | | | | | |
Substantially all of the Series’ shares represent investments by fiduciary accounts over which the Advisor has sole investment discretion.
The Series may trade in instruments including written and purchased options, forward foreign currency exchange contracts and futures contracts and other derivatives in the normal course of investing activities to assist in managing exposure to various market risks. The Series may be subject to various elements of risk, which may involve, to a varying degree, elements of risk in excess of the amounts recognized for financial statement purposes. These risks include: the risk that changes in the value of a derivative may not correlate perfectly with the underlying asset, rate or index, counterparty credit risk related to over the counter derivatives’ counterparties failure to perform under contract terms, liquidity risk related to the lack of a liquid market for these contracts allowing the fund to close out its position(s) and documentation risk relating to disagreement over contract terms. No such investments were held by the Series on June 30, 2011.
Investing in securities of foreign companies and foreign governments involves special risks and considerations not typically associated with investing in securities of domestic companies and the U.S. Government. These risks include revaluation of currencies and future adverse political and economic developments. Moreover, securities of foreign companies and foreign governments and their markets may be less liquid and their prices more volatile than those of comparable domestic companies and the U.S. Government.
| 8. | FEDERAL INCOME TAX INFORMATION |
The amount and characterization of certain income and capital gains to be distributed are determined in accordance with federal income tax regulations, which may differ from accounting principles generally accepted in the United States of America. The Series may periodically make reclassifications among its capital accounts to reflect income and gains available for distribution (or available capital loss carryovers) under income tax regulations, without impacting the Series’ net asset value. Any such reclassifications are not reflected in the financial highlights.
The final determination of the tax character of current year distributions will be made at the conclusion of the fiscal year. The tax character of distributions paid for the year ended December 31, 2010 was as follows:
| | | | | |
Ordinary income | | | $ | 13,587,061 | |
Long-term capital gains | | | | 310,425 | |
Notes to Financial Statements (unaudited)
| 8. | FEDERAL INCOME TAX INFORMATION (continued) |
At June 30, 2011, the identified cost for federal income tax purposes, the resulting gross unrealized appreciation and depreciation, and the net unrealized appreciation were as follows:
| | | | | |
Cost for federal income tax purposes | | | $ | 162,801,001 | |
Unrealized appreciation | | | $ | 6,903,009 | |
Unrealized depreciation | | | | (1,699,350 | ) |
| | | | | |
Net unrealized appreciation | | | $ | 5,203,659 | |
| | | | | |
Literature Requests (unaudited)
Proxy Voting Policies and Procedures
A description of the policies and procedures that the Fund uses to determine how to vote proxies relating to portfolio securities is available, without charge, upon request:
| | |
| By phone | | 1-800-466-3863 |
| On the Securities and Exchange Commission’s (SEC) web site | | http://www.sec.gov |
Proxy Voting Record
Information regarding how the Fund voted proxies relating to portfolio securities during the most recent 12-month period ended June 30th is available, without charge, upon request:
| | |
| By phone | | 1-800-466-3863 |
| On the SEC’s web site | | http://www.sec.gov |
Quarterly Portfolio Holdings
The Series’ complete schedule of portfolio holdings for the 1st and 3rd quarters of each fiscal year are provided on Form N-Q, and are available, without charge, upon request:
| | |
| By phone | | 1-800-466-3863 |
| On the SEC’s web site | | http://www.sec.gov |
The Series’ Form N-Q may be reviewed and copied at the SEC’s Public Reference Room in Washington, D.C. Information on the operation of the Public Reference Room may be obtained by calling 1-800-SEC-0330.
Prospectus and Statement of Additional Information (SAI)
The prospectus and SAI provide additional information about each Series, including charges, expenses and risks. These documents are available, without charge, upon request:
| | |
| By phone | | 1-800-466-3863 |
| On the SEC’s web site | | http://www.sec.gov |
| On our web site | | http://www.manning-napier.com |
Additional information available at www.manning-napier.com
1. Fund Holdings - Month-End
2. Fund Holdings - Quarter-End
3. Shareholder Report - Annual
4. Shareholder Report - Semi-Annual
The Fund also offers electronic notification or “e-delivery” when certain documents are available on-line to be downloaded or reviewed. Direct shareholders can elect to receive electronic notification when shareholder reports, prospectus updates, and / or quarterly statements are available. If you do not currently have on-line access to your account, you can establish access by going to www.manning-napier.com, click on “Login” in the top corner of the page, and follow the prompts to self-enroll. Once enrolled, you can set your electronic notification preferences by clicking on the Account Options tab located within the green toolbar and then select E-Delivery Option. Should you have any questions on either how to establish on-line access or how to update your account settings, please do not hesitate to contact Investor Services at 1-800-466-3863.
MNHYYLD-6/11-SAR
Not applicable for Semi-Annual Reports.
| ITEM 3: | AUDIT COMMITTEE FINANCIAL EXPERT |
Not applicable for Semi-Annual Reports.
| ITEM 4: | PRINCIPAL ACCOUNTANT FEES AND SERVICES |
Not applicable for Semi-Annual Reports.
| ITEM 5: | AUDIT COMMITTEE OF LISTED REGISTRANTS |
Not applicable.
| (a) | See Investment Portfolios under Item 1 on this Form N-CSR. |
| ITEM 7: | DISCLOSURE OF PROXY VOTING POLICIES AND PROCEDURES FOR CLOSED- END MANAGEMENT INVESTMENT COMPANIES |
Not applicable.
| ITEM 8: | PORTFOLIO MANAGERS OF CLOSED-END MANAGEMENT INVESTMENT COMPANIES |
Not applicable.
| ITEM 9: | PURCHASES OF EQUITY SECURITIES BY CLOSED-END MANAGEMENT INVESTMENT COMPANY AND AFFILIATED PURCHASERS |
Not applicable.
| ITEM 10: | SUBMISSION OF MATTERS TO A VOTE OF SECURITY HOLDERS |
There have been no material changes to the procedure by which shareholders may recommend nominees to the registrant’s board of directors.
| ITEM 11: | CONTROLS AND PROCEDURES |
(a) Based on their evaluation of the Funds’ disclosure controls and procedures, as of a date within 90 days of the filing date, the Funds’ Principal Executive Officer and Principal Financial Officer have concluded that the Funds’ disclosure controls and procedures are: (i) reasonably designed to ensure that information required to be disclosed in this report is appropriately communicated to the Funds’ officers to allow timely decisions regarding disclosures required in this report; (ii) reasonably designed to ensure that information required to be disclosed in this report is recorded, processed, summarized and reported in a timely manner; and (iii) are effective in achieving the goals described in (i) and (ii) above.
(b) During the second fiscal quarter of the period covered by this report, there have been no changes in the Funds’ internal control over financial reporting that the above officers believe to have materially affected, or to be reasonably likely to materially affect, the Funds’ internal control over financial reporting.
| | |
| |
| (a)(1) | | Not applicable for Semi-Annual Reports. |
| |
| (a)(2) | | Separate certifications for the Registrant’s principal executive officer and principal financial officer, as required by Section 302 of the Sarbanes-Oxley Act of 2002 and Rule 30a-2(a) under the Investment Company Act of 1940, are attached as EX-99.CERT. |
| |
| (a)(3) | | Not applicable. |
| |
| (b) | | A certification of the Registrant’s principal executive officer and principal financial officer, as required by 18 U.S.C Section 1350, as adopted pursuant to Section 906 of the Sarbanes-Oxley Act of 2002, and Rule 30a-2(b) under the Investment Company Act of 1940, is attached as EX- 99.906CERT. The certification furnished pursuant to this paragraph is not deemed to be “filed” for purposes of Section 18 of the Securities Exchange Act of 1934, or otherwise subject to the liability of that section. Such certification is not deemed to be incorporated by reference into any filing under the Securities Act of 1933 or the Securities Exchange Act of 1934, except to the extent that the Registrant specifically incorporates them by reference. |
SIGNATURES
Pursuant to the requirements of the Securities Exchange Act of 1934 and the Investment Company Act of 1940, the registrant has duly caused this report to be signed on its behalf by the undersigned, thereunto duly authorized.
Manning & Napier Fund, Inc.
|
| /s/ B. Reuben Auspitz |
| B. Reuben Auspitz |
President & Principal Executive Officer of Manning & Napier Fund, Inc.
August 29, 2011
Pursuant to the requirements of the Securities Exchange Act of 1934 and the Investment Company Act of 1940, this report has been signed below by the following persons on behalf of the registrant and in the capacities and on the dates indicated.
|
| /s/ B. Reuben Auspitz |
| B. Reuben Auspitz |
President & Principal Executive Officer of Manning & Napier Fund, Inc.
August 29, 2011
|
| /s/ Christine Glavin |
| Christine Glavin |
Chief Financial Officer & Principal Financial Officer of Manning & Napier Fund, Inc.
August 29, 2011