UNITED STATES
SECURITIES AND EXCHANGE COMMISSION
Washington, D.C. 20549
FORM N-CSR
CERTIFIED SHAREHOLDER REPORT OF REGISTERED MANAGEMENT INVESTMENT
COMPANIES
Investment Company Act file number 811-04087
Manning & Napier Fund, Inc.
(Exact name of registrant as specified in charter)
290 Woodcliff Drive, Fairport, NY 14450
(Address of principal executive offices)(Zip Code)
James Mikolaichik 290 Woodcliff Drive, Fairport, NY 14450
(Name and address of agent for service)
Registrant’s telephone number, including area code: 585-325-6880
Date of fiscal year end: December 31
Date of reporting period: January 1, 2015 through June 30, 2015
Form N-CSR is to be used by management investment companies to file reports with the Commission not later than 10 days after the transmission to stockholders of any report that is required to be transmitted to stockholders under Rule 30e-1 under the Investment Company Act of 1940 (17 CFR 270.30e-1). The Commission may use the information provided on Form N-CSR in its regulatory, disclosure review, inspection, and policymaking roles.
A registrant is required to disclose the information specified by Form N-CSR, and the Commission will make this information public. A registrant is not required to respond to the collection of information contained in Form N-CSR unless the Form displays a currently valid Office of Management and Budget (“OMB”) control number. Please direct comments concerning the accuracy of the information collection burden estimate and any suggestions for reducing the burden to Secretary, Securities and Exchange Commission, 100 F Street, NE, Washington, DC 20549. The OMB has reviewed this collection of information under the clearance requirements of 44 U.S.C. § 3507.
ITEM 1: REPORTS TO STOCKHOLDERS.

Real Estate Series
Shareholder Expense Example
(unaudited)
As a shareholder of the Series, you may incur two types of costs: (1) transaction costs and (2) ongoing costs, including management fees and other Series expenses. This example is intended to help you understand your ongoing costs (in dollars) of investing in the Series and to compare these costs with the ongoing costs of investing in other mutual funds.
The example is based on an investment of $1,000 invested in each class at the beginning of the period and held for the entire period (January 1, 2015 to June 30, 2015).
Actual Expenses
The Actual lines of the table below provide information about actual account values and actual expenses. You may use the information in this line, together with the amount you invested, to estimate the expenses that you paid over the period. Simply divide your account value by $1,000 (for example, an $8,600 account value divided by $1,000 = 8.6), then multiply the result by the number in the Actual line for the Class in which you have invested under the heading entitled “Expenses Paid During Period” to estimate the expenses you paid on your account during this period.
Hypothetical Example for Comparison Purposes
The Hypothetical lines of each Class in the table below provide information about hypothetical account values and hypothetical expenses based on the Class’ actual expense ratio and an assumed rate of return of 5% per year before expenses, which is not the Class’ actual return. The hypothetical account values and expenses may not be used to estimate the actual ending account balance or expenses you paid during the period. You may use this information to compare the ongoing costs of investing in a class of the Series and other funds. To do so, compare this 5% hypothetical example with the 5% hypothetical examples that appear in the shareholder reports of the other funds.
Please note that the expenses shown in the table are meant to highlight your ongoing costs only and do not reflect any transaction costs. Therefore, the Hypothetical lines for each Class in the table are useful in comparing ongoing costs only, and will not help you determine the relative total costs of owning different funds. In addition, if these transaction costs were included, your costs would have been higher.
| | | | | | | | |
| | | BEGINNING
ACCOUNT VALUE
1/1/15 | | ENDING
ACCOUNT VALUE
6/30/15 | | EXPENSES PAID
DURING PERIOD*
1/1/15-6/30/15 | | ANNUALIZED
EXPENSE RATIO |
Class S | | | | | | | | |
Actual | | $1,000.00 | | $ 964.40 | | $5.26 | | 1.08% |
Hypothetical (5% return before expenses) | | $1,000.00 | | $1,019.44 | | $5.41 | | 1.08% |
Class I | | | | | | | | |
Actual | | $1,000.00 | | $ 966.10 | | $4.05 | | 0.83% |
Hypothetical (5% return before expenses) | | $1,000.00 | | $1,020.68 | | $4.16 | | 0.83% |
*Expenses are equal to each Class’ annualized expense ratio (for the six-month period), multiplied by the average account value over the period, multiplied by 181/365 (to reflect the one-half year period). Expenses are based on the most recent fiscal half year.
1
Real Estate Series
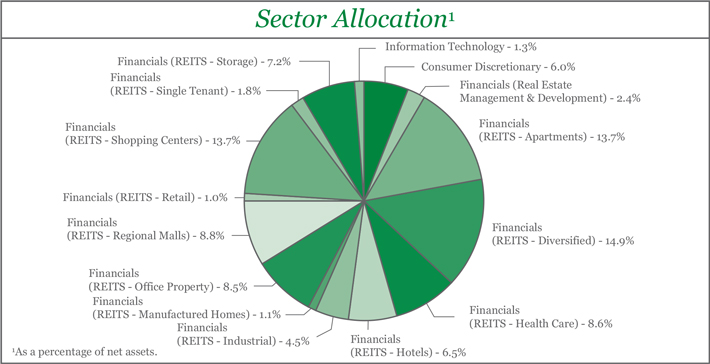
Portfolio Composition as of June 30, 2015
(unaudited)
| | | | | | | | | | |
Top Ten Stock Holdings2 | |
Simon Property Group, Inc. | | | 5.2 | % | | Chesapeake Lodging Trust | | | 2.6 | % |
AvalonBay Communities, Inc. | | | 3.0 | % | | Physicians Realty Trust | | | 2.4 | % |
Plum Creek Timber Co., Inc. | | | 2.8 | % | | CubeSmart | | | 2.3 | % |
Weyerhaeuser Co. | | | 2.8 | % | | Crown Castle International Corp. | | | 2.1 | % |
Brixmor Property Group, Inc. | | | 2.7 | % | | Sovran Self Storage, Inc. | | | 2.1 | % |
2 As a percentage of total investments. | | | | | | | | | | |
2
Real Estate Series
Investment Portfolio - June 30, 2015
(unaudited)
| | | | | | | | |
| | |
| | | SHARES | | | VALUE (NOTE 2) | |
| | |
COMMON STOCKS - 100.0% | | | | | | | | |
| | |
Consumer Discretionary - 6.0% | | | | | | | | |
Hotels, Restaurants & Leisure - 2.7% | | | | | | | | |
Accor S.A. (France)1 | | | 62,170 | | | $ | 3,146,439 | |
Hyatt Hotels Corp. - Class A* | | | 73,090 | | | | 4,143,472 | |
| | | | | | | | |
| | |
| | | | | | | 7,289,911 | |
| | | | | | | | |
Household Durables - 3.3% | | | | | | | | |
DR Horton, Inc. | | | 77,120 | | | | 2,110,003 | |
Lennar Corp. - Class A | | | 43,486 | | | | 2,219,526 | |
Toll Brothers, Inc.* | | | 55,862 | | | | 2,133,370 | |
TRI Pointe Homes, Inc.* | | | 146,210 | | | | 2,237,013 | |
| | | | | | | | |
| | |
| | | | | | | 8,699,912 | |
| | | | | | | | |
| | |
Total Consumer Discretionary | | | | | | | 15,989,823 | |
| | | | | | | | |
| | |
Financials - 92.7% | | | | | | | | |
Real Estate Management & Development - 2.4% | | | | | | | | |
First Capital Realty, Inc. (Canada) | | | 178,100 | | | | 2,549,582 | |
Forest City Enterprises, Inc. - Class A* | | | 178,070 | | | | 3,935,347 | |
| | | | | | | | |
| | |
| | | | | | | 6,484,929 | |
| | | | | | | | |
REITS - Apartments - 13.7% | | | | | | | | |
American Campus Communities, Inc. | | | 61,810 | | | | 2,329,619 | |
Apartment Investment & Management Co. - Class A | | | 129,240 | | | | 4,772,833 | |
AvalonBay Communities, Inc. | | | 50,470 | | | | 8,068,639 | |
Camden Property Trust | | | 55,820 | | | | 4,146,310 | |
Education Realty Trust, Inc. | | | 112,810 | | | | 3,537,722 | |
Equity Residential | | | 57,620 | | | | 4,043,195 | |
Mid-America Apartment Communities, Inc. | | | 74,280 | | | | 5,408,327 | |
UDR, Inc. | | | 128,920 | | | | 4,129,308 | |
| | | | | | | | |
| | |
| | | | | | | 36,435,953 | |
| | | | | | | | |
REITS - Diversified - 14.9% | | | | | | | | |
CatchMark Timber Trust, Inc. - Class A | | | 262,070 | | | | 3,032,150 | |
CoreSite Realty Corp. | | | 107,310 | | | | 4,876,166 | |
Crown Castle International Corp. | | | 71,030 | | | | 5,703,709 | |
Lamar Advertising Co. - Class A | | | 47,270 | | | | 2,717,080 | |
Liberty Property Trust | | | 118,310 | | | | 3,811,948 | |
Outfront Media, Inc. | | | 182,275 | | | | 4,600,621 | |
Plum Creek Timber Co., Inc. | | | 184,560 | | | | 7,487,599 | |
Weyerhaeuser Co. | | | 236,670 | | | | 7,455,105 | |
| | | | | | | | |
| | |
| | | | | | | 39,684,378 | |
| | | | | | | | |
REITS - Health Care - 8.6% | | | | | | | | |
Community Healthcare Trust, Inc.* | | | 208,530 | | | | 4,014,203 | |
HCP, Inc. | | | 73,900 | | | | 2,695,133 | |
Health Care REIT, Inc. | | | 54,010 | | | | 3,544,676 | |
The accompanying notes are an integral part of the financial statements.
3
Real Estate Series
Investment Portfolio - June 30, 2015
(unaudited)
| | | | | | | | |
| | | SHARES | | | VALUE (NOTE 2) | |
| | |
COMMON STOCKS (continued) | | | | | | | | |
| | |
Financials (continued) | | | | | | | | |
REITS - Health Care (continued) | | | | | | | | |
Physicians Realty Trust | | | 412,610 | | | $ | 6,337,690 | |
Sabra Health Care REIT, Inc. | | | 94,540 | | | | 2,433,459 | |
Ventas, Inc. | | | 64,420 | | | | 3,999,838 | |
| | | | | | | | |
| | |
| | | | | | | 23,024,999 | |
| | | | | | | | |
REITS - Hotels - 6.5% | | | | | | | | |
Chesapeake Lodging Trust | | | 228,340 | | | | 6,959,803 | |
Host Hotels & Resorts, Inc. | | | 139,880 | | | | 2,773,820 | |
LaSalle Hotel Properties | | | 138,160 | | | | 4,899,154 | |
Pebblebrook Hotel Trust | | | 62,774 | | | | 2,691,749 | |
| | | | | | | | |
| | |
| | | | | | | 17,324,526 | |
| | | | | | | | |
REITS - Industrial - 4.5% | | | | | | | | |
DCT Industrial Trust, Inc. | | | 125,170 | | | | 3,935,345 | |
Prologis, Inc. | | | 68,500 | | | | 2,541,350 | |
Rexford Industrial Realty, Inc. | | | 185,650 | | | | 2,706,777 | |
Terreno Realty Corp. | | | 135,810 | | | | 2,675,457 | |
| | | | | | | | |
| | |
| | | | | | | 11,858,929 | |
| | | | | | | | |
REITS - Manufactured Homes - 1.1% | | | | | | | | |
Equity LifeStyle Properties, Inc. | | | 55,840 | | | | 2,936,067 | |
| | | | | | | | |
REITS - Office Property - 8.5% | | | | | | | | |
Alexandria Real Estate Equities, Inc. | | | 55,220 | | | | 4,829,541 | |
Axiare Patrimonio SOCIMI S.A. (Spain)1 | | | 88,326 | | | | 1,185,584 | |
BioMed Realty Trust, Inc. | | | 135,187 | | | | 2,614,516 | |
Columbia Property Trust, Inc. | | | 111,530 | | | | 2,738,061 | |
Douglas Emmett, Inc. | | | 102,730 | | | | 2,767,546 | |
Mack-Cali Realty Corp. | | | 174,860 | | | | 3,222,670 | |
Paramount Group, Inc. | | | 304,860 | | | | 5,231,398 | |
| | | | | | | | |
| | |
| | | | | | | 22,589,316 | |
| | | | | | | | |
REITS - Regional Malls - 8.8% | | | | | | | | |
Fibra Shop Portafolios Inmobiliarios S.A.P.I. de C.V. (Mexico) | | | 1,905,315 | | | | 2,111,696 | |
General Growth Properties, Inc. | | | 122,460 | | | | 3,142,324 | |
Simon Property Group, Inc. | | | 80,270 | | | | 13,888,315 | |
Taubman Centers, Inc. | | | 60,260 | | | | 4,188,070 | |
| | | | | | | | |
| | |
| | | | | | | 23,330,405 | |
| | | | | | | | |
REITS - Retail - 1.0% | | | | | | | | |
Scentre Group (Australia)1 | | | 957,107 | | | | 2,764,805 | |
| | | | | | | | |
REITS - Shopping Centers - 13.7% | | | | | | | | |
Brixmor Property Group, Inc. | | | 310,450 | | | | 7,180,709 | |
DDR Corp. | | | 300,820 | | | | 4,650,677 | |
Equity One, Inc. | | | 169,000 | | | | 3,944,460 | |
The accompanying notes are an integral part of the financial statements.
4
Real Estate Series
Investment Portfolio - June 30, 2015
(unaudited)
| | | | | | | | |
| | | SHARES | | | VALUE (NOTE 2) | |
| | |
COMMON STOCKS (continued) | | | | | | | | |
| | |
Financials (continued) | | | | | | | | |
REITS - Shopping Centers (continued) | | | | | | | | |
Inland Real Estate Corp. | | | 418,740 | | | $ | 3,944,531 | |
Kite Realty Group Trust | | | 158,807 | | | | 3,886,007 | |
Urban Edge Properties | | | 248,800 | | | | 5,172,552 | |
Westfield Corp. (Australia)1 | | | 621,230 | | | | 4,363,358 | |
WP GLIMCHER, Inc. | | | 254,120 | | | | 3,438,244 | |
| | | | | | | | |
| | |
| | | | | | | 36,580,538 | |
| | | | | | | | |
REITS - Single Tenant - 1.8% | | | | | | | | |
Agree Realty Corp. | | | 167,960 | | | | 4,899,393 | |
| | | | | | | | |
REITS - Storage - 7.2% | | | | | | | | |
CubeSmart | | | 259,930 | | | | 6,019,979 | |
Extra Space Storage, Inc. | | | 41,150 | | | | 2,683,803 | |
Public Storage | | | 26,980 | | | | 4,974,302 | |
Sovran Self Storage, Inc. | | | 63,901 | | | | 5,553,636 | |
| | | | | | | | |
| | |
| | | | | | | 19,231,720 | |
| | | | | | | | |
| | |
Total Financials | | | | | | | 247,145,958 | |
| | | | | | | | |
| | |
Information Technology - 1.3% | | | | | | | | |
IT Services - 1.3% | | | | | | | | |
InterXion Holding N.V. - ADR (Netherlands)* | | | 120,890 | | | | 3,342,609 | |
| | | | | | | | |
Utilities - 0.0%# | | | | | | | | |
Electric Utilities - 0.0%# | | | | | | | | |
Prime AET&D Holdings No.1 Ltd. (Australia)*2 | | | 125,000 | | | | — | |
| | | | | | | | |
TOTAL COMMON STOCKS | | | | | | | | |
(Identified Cost $241,417,304) | | | | | | | 266,478,390 | |
| | | | | | | | |
| | |
TOTAL INVESTMENTS - 100.0% | | | | | | | | |
(Identified Cost $241,417,304) | | | | | | | 266,478,390 | |
OTHER ASSETS, LESS LIABILITIES - 0.0%# | | | | | | | 68,973 | |
| | | | | | | | |
NET ASSETS - 100% | | | | | | $ | 266,547,363 | |
| | | | | | | | |
No. - Number
ADR - American Depositary Receipt
REITS - Real Estate Investment Trusts
*Non-income producing security.
#Less than 0.1%.
1A factor from a third party vendor was applied to determine the security’s fair value following the close of local trading.
2Security has been valued at fair value as determined in good faith by the Advisor.
The Global Industry Classification Standard (GICS) was developed by and is the exclusive property and a service mark of MSCI Inc. (MSCI) and Standard & Poor’s, a division of The McGraw-Hill Companies, Inc. (S&P), and is licensed for use by Manning & Napier when referencing GICS sectors. Neither MSCI, S&P, nor any third party involved in making or compiling the GICS or any GICS classifications makes any express or implied warranties or representations with respect to such standard or classification, nor shall any such party have any liability therefrom.
The accompanying notes are an integral part of the financial statements.
5
Real Estate Series
Statement of Assets and Liabilities
June 30, 2015 (unaudited)
| | | | |
ASSETS: | | | | |
| |
Investments, at value (identified cost $241,417,304) (Note 2) | | $ | 266,478,390 | |
Foreign currency (cost $22,624) | | | 21,621 | |
Dividends receivable | | | 849,965 | |
Receivable for fund shares sold | | | 135,168 | |
Foreign tax reclaims receivable | | | 5,035 | |
Prepaid expenses | | | 413 | |
| | | | |
| |
TOTAL ASSETS | | | 267,490,592 | |
| | | | |
| |
LIABILITIES: | | | | |
| |
Due to custodian | | | 154,294 | |
Accrued management fees (Note 3) | | | 181,217 | |
Accrued shareholder services fees (Class S)(Note 3) | | | 48,837 | |
Accrued fund accounting and administration fees (Note 3) | | | 13,695 | |
Accrued transfer agent fees (Note 3) | | | 5,581 | |
Accrued Chief Compliance Officer service fees (Note 3) | | | 382 | |
Payable for fund shares repurchased | | | 483,454 | |
Payable for securities purchased | | | 6,480 | |
Other payables and accrued expenses | | | 49,289 | |
| | | | |
| |
TOTAL LIABILITIES | | | 943,229 | |
| | | | |
| |
TOTAL NET ASSETS | | $ | 266,547,363 | |
| | | | |
| |
NET ASSETS CONSIST OF: | | | | |
| |
Capital stock | | $ | 204,389 | |
Additional paid-in-capital | | | 216,036,244 | |
Undistributed net investment income | | | 333,282 | |
Accumulated net realized gain on investments, foreign currency and translation of other assets and liabilities | | | 24,913,658 | |
Net unrealized appreciation on investments, foreign currency and translation of other assets and liabilities | | | 25,059,790 | |
| | | | |
| |
TOTAL NET ASSETS | | $ | 266,547,363 | |
| | | | |
| |
NET ASSET VALUE, OFFERING PRICE AND REDEMPTION PRICE PER SHARE - Class S ($215,042,870/14,420,527 shares) | | $ | 14.91 | |
| | | | |
| |
NET ASSET VALUE, OFFERING PRICE AND REDEMPTION PRICE PER SHARE - Class I ($51,504,493/6,018,363 shares) | | $ | 8.56 | |
| | | | |
The accompanying notes are an integral part of the financial statements.
6
Real Estate Series
Statement of Operations
For the Six Months Ended June 30, 2015 (unaudited)
| | | | |
INVESTMENT INCOME: | | | | |
| |
Dividends (net of foreign taxes withheld, $29,050) | | $ | 3,532,321 | |
| | | | |
| |
EXPENSES: | | | | |
| |
Management fees (Note 3) | | | 1,087,491 | |
Shareholder services fees (Class S)(Note 3) | | | 294,388 | |
Fund accounting and administration fees (Note 3) | | | 30,791 | |
Transfer agent fees (Note 3) | | | 15,549 | |
Directors’ fees (Note 3) | | | 3,377 | |
Chief Compliance Officer service fees (Note 3) | | | 1,224 | |
Custodian fees | | | 9,299 | |
Miscellaneous | | | 53,680 | |
| | | | |
| |
Total Expenses | | | 1,495,799 | |
| | | | |
| |
NET INVESTMENT INCOME | | | 2,036,522 | |
| | | | |
| |
REALIZED AND UNREALIZED GAIN (LOSS) ON INVESTMENTS AND FOREIGN CURRENCY: | | | | |
| |
Net realized gain (loss) on- | | | | |
Investments | | | 21,601,953 | |
Options written | | | 190,635 | |
Foreign currency and translation of other assets and liabilities | | | (23,450 | ) |
| | | | |
| |
| | | 21,769,138 | |
| | | | |
| |
Net change in unrealized appreciation (depreciation) on- | | | | |
Investments | | | (33,893,508 | ) |
Foreign currency and translation of other assets and liabilities | | | 677 | |
| | | | |
| |
| | | (33,892,831 | ) |
| | | | |
| |
NET REALIZED AND UNREALIZED GAIN (LOSS) ON INVESTMENTS AND FOREIGN CURRENCY | | | (12,123,693 | ) |
| | | | |
| |
NET DECREASE IN NET ASSETS RESULTING FROM OPERATIONS | | $ | (10,087,171 | ) |
| | | | |
The accompanying notes are an integral part of the financial statements.
7
Real Estate Series
Statements of Changes in Net Assets
| | | | | | | | |
| | | FOR THE SIX
MONTHS ENDED
6/30/15
(UNAUDITED) | | | FOR THE
YEAR ENDED
12/31/14 | |
INCREASE (DECREASE) IN NET ASSETS: | | | | | | | | |
| | |
OPERATIONS: | | | | | | | | |
| | |
Net investment income | | $ | 2,036,522 | | | $ | 7,145,687 | |
Net realized gain (loss) on investments and foreign currency | | | 21,769,138 | | | | 19,278,792 | |
Net change in unrealized appreciation (depreciation) on investments and foreign currency | | | (33,892,831 | ) | | | 33,939,661 | |
| | | | | | | | |
| | |
Net increase (decrease) from operations | | | (10,087,171 | ) | | | 60,364,140 | |
| | | | | | | | |
| | |
DISTRIBUTIONS TO SHAREHOLDERS (Note 9): | | | | | | | | |
| | |
From net investment income (Class S) | | | — | | | | (6,031,527 | ) |
From net investment income (Class I) | | | — | | | | (2,316,228 | ) |
From net realized gain on investments (Class S) | | | — | | | | (14,939,980 | ) |
From net realized gain on investments (Class I) | | | — | | | | 5,249,295 | |
| | | | | | | | |
| | |
Total distributions to shareholders | | | — | | | | (28,537,030 | ) |
| | | | | | | | |
| | |
CAPITAL STOCK ISSUED AND REPURCHASED: | | | | | | | | |
| | |
Net increase from capital share transactions (Note 5) | | | (5,066,436 | ) | | | 44,396,863 | |
| | | | | | | | |
| | |
Net increase (decrease) in net assets | | | (15,153,607 | ) | | | 76,223,973 | |
| | |
NET ASSETS: | | | | | | | | |
| | |
Beginning of period | | | 281,700,970 | | | | 205,476,997 | |
| | | | | | | | |
| | |
End of period (including undistributed net investment income of $333,282 and distributions in excess of net investment income of $1,703,240, respectively) | | $ | 266,547,363 | | | $ | 281,700,970 | |
| | | | | | | | |
The accompanying notes are an integral part of the financial statements.
8
Real Estate Series
Financial Highlights - Class S*
| | | | | | | | | | | | | | | | | | | | | | | | | | | | | | |
| | | FOR THE SIX
MONTHS ENDED | | FOR THE YEARS ENDED |
| | | 6/30/15
(UNAUDITED) | | 12/31/14 | | 12/31/13 | | 12/31/12 | | 12/31/11 | | 12/31/10 |
Per share data (for a share outstanding throughout each period): | | | | | | | | | | | | | | | | | | | | | | | | | | | | | | |
Net asset value - Beginning of period | | | | $15.46 | | | | | $13.32 | | | | | $14.57 | | | | | $12.65 | | | | | $12.58 | | | | | $10.61 | |
| | | | | | | | | | | | | | | | | | | | | | | | | | | | | | |
| | | | | | |
Income from investment operations: | | | | | | | | | | | | | | | | | | | | | | | | | | | | | | |
Net investment income1 | | | | 0.11 | | | | | 0.44 | 2 | | | | 0.24 | | | | | 0.21 | | | | | 0.15 | | | | | 0.12 | |
Net realized and unrealized gain on investments | | | | (0.66 | ) | | | | 3.24 | | | | | 0.10 | | | | | 2.54 | | | | | 0.49 | | | | | 2.44 | |
| | | | | | | | | | | | | | | | | | | | | | | | | | | | | | |
Total from investment operations | | | | (0.55 | ) | | | | 3.68 | | | | | 0.34 | | | | | 2.75 | | | | | 0.64 | | | | | 2.56 | |
| | | | | | | | | | | | | | | | | | | | | | | | | | | | | | |
| | | | | | |
Less distributions to shareholders: | | | | | | | | | | | | | | | | | | | | | | | | | | | | | | |
From net investment income | | | | — | | | | | (0.44 | ) | | | | (0.21 | ) | | | | (0.29 | ) | | | | (0.15 | ) | | | | (0.12 | ) |
From net realized gain on investments | | | | — | | | | | (1.10 | ) | | | | (1.38 | ) | | | | (0.54 | ) | | | | (0.42 | ) | | | | (0.47 | ) |
| | | | | | | | | | | | | | | | | | | | | | | | | | | | | | |
| | | | | | |
Total distributions to shareholders | | | | — | | | | | (1.54 | ) | | | | (1.59 | ) | | | | (0.83 | ) | | | | (0.57 | ) | | | | (0.59 | ) |
| | | | | | | | | | | | | | | | | | | | | | | | | | | | | | |
| | | | | | |
Net asset value - End of period | | | | $14.91 | | | | | $15.46 | | | | | $13.32 | | | | | $14.57 | | | | | $12.65 | | | | | $12.58 | |
| | | | | | | | | | | | | | | | | | | | | | | | | | | | | | |
| | | | | | |
Net assets - End of period
(000’s omitted) | | | $ | 215,043 | | | | $ | 231,188 | | | | $ | 168,167 | | | | $ | 170,898 | | | | $ | 167,153 | | | | | $89,136 | |
| | | | | | | | | | | | | | | | | | | | | | | | | | | | | | |
Total return3 | | | | (3.56% | ) | | | | 28.14% | | | | | 2.67% | | | | | 21.93% | | | | | 5.29% | | | | | 24.40% | |
Ratios (to average net assets)/Supplemental Data: | | | | | | | | | | | | | | | | | | | | | | | | | | | | | | |
Expenses** | | | | 1.08% | 4 | | | | 1.11% | | | | | 1.12% | | | | | 1.10% | | | | | 1.18% | | | | | 1.20% | |
Net investment income | | | | 1.35% | 4 | | | | 2.89% | 2 | | | | 1.57% | | | | | 1.49% | | | | | 1.21% | | | | | 1.02% | |
Portfolio turnover | | | | 33% | | | | | 44% | | | | | 40% | | | | | 14% | | | | | 34% | | | | | 34% | |
|
*Effective August 1, 2012, the shares of the Series have been designated as Class S. **For certain years presented, the investment advisor did not impose all or a portion of its management and/or other fees, and in some years may have paid a portion of the Series’ expenses. If these expenses had been incurred by the Series, the expense ratio (to average net assets) would have increased by the following amounts: | |
| | | | N/A | | | | | N/A | | | | | N/A | | | | | N/A | | | | | N/A | | | | | 0.01% | |
1Calculated based on average shares outstanding during the period.
2Reflects a special dividend paid out during the period by two of the Series’ holdings. Had the Series not received the special dividends, the net investment income per share would have been $0.22 and the net investment income ratio would have been 1.49%.
3Represents aggregate total return for the periods indicated, and assumes reinvestment of all distributions. Total return would have been lower had certain expenses not been waived during certain periods. Periods less than one year are not annualized.
4Annualized.
The accompanying notes are an integral part of the financial statements.
9
Real Estate Series
Financial Highlights - Class I
| | | | | | | | | | | | | | | | | | | | |
| | | FOR THE SIX MONTHS ENDED | | FOR THE YEARS ENDED | | FOR THE PERIOD 8/1/121 TO
12/31/12 |
| | | 6/30/15
(UNAUDITED) | | 12/31/14 | | 12/31/13 | |
Per share data (for a share outstanding throughout each period): | | | | | | | | | | | | | | | | | | | | |
Net asset value - Beginning of period | | | | $8.86 | | | | | $8.18 | | | | | $9.55 | | | | | $10.00 | |
| | | | | | | | | | | | | | | | | | | | |
| | | | |
Income (loss) from investment operations: | | | | | | | | | | | | | | | | | | | | |
Net investment income2 | | | | 0.07 | | | | | 0.29 | 3 | | | | 0.19 | | | | | 0.08 | |
Net realized and unrealized gain (loss) on investments | | | | (0.37 | ) | | | | 1.97 | | | | | 0.04 | | | | | 0.32 | |
| | | | | | | | | | | | | | | | | | | | |
Total from investment operations | | | | (0.30 | ) | | | | 2.26 | | | | | 0.23 | | | | | 0.40 | |
| | | | | | | | | | | | | | | | | | | | |
| | | | |
Less distributions to shareholders: | | | | | | | | | | | | | | | | | | | | |
From net investment income | | | | — | | | | | (0.48 | ) | | | | (0.22 | ) | | | | (0.31 | ) |
From net realized gain on investments | | | | — | | | | | (1.10 | ) | | | | (1.38 | ) | | | | (0.54 | ) |
| | | | | | | | | | | | | | | | | | | | |
Total distributions to shareholders | | | | — | | | | | (1.58 | ) | | | | (1.60 | ) | | | | (0.85 | ) |
| | | | | | | | | | | | | | | | | | | | |
Net asset value - End of period | | | | $8.56 | | | | | $8.86 | | | | | $8.18 | | | | | $9.55 | |
| | | | | | | | | | | | | | | | | | | | |
Net assets - End of period (000’s omitted) | | | | $51,504 | | | | | $50,513 | | | | | $37,310 | | | | | $26,396 | |
| | | | | | | | | | | | | | | | | | | | |
| | | | |
Total return4 | | | | (3.39% | ) | | | | 28.44% | | | | | 2.94% | | | | | 4.16% | |
Ratios (to average net assets)/Supplemental Data: | | | | | | | | | | | | | | | | | | | | |
Expenses | | | | 0.83% | 5 | | | | 0.86% | | | | | 0.87% | | | | | 0.87% | 5 |
Net investment income | | | | 1.64% | 5 | | | | 3.14% | 3 | | | | 1.88% | | | | | 1.95% | 5 |
Portfolio turnover | | | | 33% | | | | | 44% | | | | | 40% | | | | | 14% | |
1Commencement of operations.
2Calculated based on average shares outstanding during the periods.
3Reflects a special dividend paid out during the period by two of the Series’ holdings. Had the Series not received the special dividends, the net investment income per share would have been $0.16 and the net investment income ratio would have been 1.74%.
4Represents aggregate total return for the periods indicated, and assumes reinvestment of all distributions. Periods less than one year are not annualized.
5Annualized.
The accompanying notes are an integral part of the financial statements.
10
Real Estate Series
Notes to Financial Statements
(unaudited)
Real Estate Series (the “Series”) is a no-load diversified series of Manning & Napier Fund, Inc. (the “Fund”). The Fund is organized in Maryland and is registered under the Investment Company Act of 1940, as amended, as an open-end management investment company.
The Series’ investment objective is to provide high current income and long-term capital appreciation by investing principally in companies in the real estate industry.
The Fund’s advisor is Manning & Napier Advisors, LLC (the “Advisor”). Shares of the Series are offered to investors, clients and employees of the Advisor and its affiliates. The Series is authorized to issue two classes of shares (Class S and Class I). Each class of shares is substantially the same, except that Class S shares bear shareholder services fees. The total authorized capital stock of the Fund consists of 15 billion shares of common stock each having a par value of $0.01. As of June 30, 2015, 10.6 billion shares have been designated in total among 41 series, of which 100 million have been designated as Real Estate Series Class S common stock and 100 million have been designated as Real Estate Series Class I common stock.
| 2. | Significant Accounting Policies |
The following is a summary of significant accounting policies followed by the Series. The Series is an investment company and, accordingly, follows the investment company accounting and reporting guidance of the Financial Accounting Standards Board Accounting Standards Codification Topic 946 - Investment Companies, which is part of accounting principles generally accepted in the United States of America (“GAAP”).
Security Valuation
Portfolio securities, including domestic equities, foreign equities, warrants and options, listed on an exchange other than the NASDAQ Stock Market are valued at the latest quoted sales price of the exchange on which the security is primarily traded. Securities not traded on valuation date or securities not listed on an exchange are valued at the latest quoted bid price provided by the Fund’s pricing service. Securities listed on the NASDAQ Stock Market are valued in accordance with the NASDAQ Official Closing Price.
Short-term investments that mature in sixty days or less are valued at amortized cost, which approximates fair value. Investments in open-end investment companies are valued at their net asset value per share on valuation date.
Volume and level of activity in established markets for an asset or liability are evaluated to determine whether recent transactions and quoted prices are determinative of fair value. Where there have been significant decreases in volume and level of activity, further analysis and adjustment may be necessary to estimate fair value. The Series measures fair value in these instances by the use of inputs and valuation techniques which may be based upon current market prices of securities that are comparable in coupon, rating, maturity and industry and/or expectation of future cash flows. As a result of trading in relatively thin markets and/or markets that experience significant volatility, the prices used by the Series to value these securities may differ from the value that would be realized if these securities were sold, and the differences could be material.
Securities for which representative valuations or prices are not available from the Series’ pricing service may be valued at fair value as determined in good faith by the Advisor under procedures approved by and under the general supervision and responsibility of the Fund’s Board of Directors (the “Board”). Due to the inherent uncertainty of valuations of such securities, the fair value may differ significantly from the values that would have been used had a ready market for such securities existed. If trading or events occurring after the close of the principal market in which securities are traded are expected to materially affect the value of those securities, then they may be valued at their fair value, taking this trading or these events into account. In accordance with the procedures approved by the Board, the values of certain securities trading outside the U.S. were adjusted following the close of local trading using a factor from a third party vendor. The third party vendor uses statistical analyses and quantitative models, which consider among other things subsequent movement and changes in the prices of indices, securities and exchange rates in other markets, to determine the factors which are used to adjust local market prices. The value of
11
Real Estate Series
Notes to Financial Statements (continued)
(unaudited)
| 2. | Significant Accounting Policies (continued) |
Security Valuation (continued)
securities used for net asset value calculation under these procedures may differ from published prices for the same securities. It is the Fund’s policy to classify each foreign equity security where a factor from a third party vendor is provided as a Level 2 security.
Various inputs are used in determining the value of the Series’ assets or liabilities carried at fair value. These inputs are summarized in three broad levels. Level 1 includes quoted prices in active markets for identical assets and liabilities. Level 2 includes other significant observable inputs (including quoted prices for similar securities, interest rates, prepayment speeds, credit risk, etc.). Level 3 includes significant unobservable inputs (including the Series’ own assumptions in determining the fair value of investments). A financial instrument’s level within the fair value hierarchy is based on the lowest level of any input both individually and in aggregate that is significant to the fair value measurement. The inputs or methodology used for valuing securities are not necessarily an indication of the risk associated with investing in those securities.
The following is a summary of the valuation levels used for major security types as of June 30, 2015 in valuing the Series’ assets or liabilities carried at fair value:
| | | | | | | | | | | | | | | | |
| DESCRIPTION | | TOTAL | | | LEVEL 1 | | | LEVEL 2 | | | LEVEL 3 | |
Assets: | | | | | | | | | | | | | | | | |
Equity securities: | | | | | | | | | | | | | | | | |
Consumer Discretionary | | $ | 15,989,823 | | | $ | 12,843,384 | | | $ | 3,146,439 | | | $ | — | |
Financials | | | 247,145,958 | | | | 238,832,211 | | | | 8,313,747 | | | | — | |
Information Technology | | | 3,342,609 | | | | 3,342,609 | | | | — | | | | — | |
Utilities | | | — | | | | — | | | | — | | | | —* | |
Mutual funds | | | — | | | | — | | | | — | | | | — | |
| | | | | | | | | | | | | | | | |
Total assets | | | 266,478,390 | | | | 255,018,204 | | | | 11,460,186 | | | | — | |
| | | | | | | | | | | | | | | | |
*Prime AET&D Holdings No.1 Ltd. is a Level 3 security as of June 30, 2015. However, there is no value for this security reported in the financial statements. There was no activity in this security for the six months ended June 30, 2015.
Please see the Investment Portfolio for foreign securities where a factor from a third party vendor was applied to determine the securities’ fair value following the close of local trading. Such securities are included in Level 2 in the table above.
The Fund’s policy is to recognize transfers in and transfers out of the valuation levels as of the beginning of the reporting period. There were no transfers between fair value levels during the six months ended June 30, 2015.
Security Transactions, Investment Income and Expenses
Security transactions are accounted for on trade date. Dividend income is recorded on the ex-dividend date, except that if the ex-dividend date has passed, certain dividends from foreign securities are recorded as soon as the Series is informed of the ex-dividend date. Non-cash dividends, if any, are recorded at the fair value of the securities received. Interest income, including amortization of premium and accretion of discounts using the effective interest method, is earned from settlement date and accrued daily.
Expenses are recorded on an accrual basis. Most expenses of the Fund can be attributed to a specific series. Expenses which cannot be directly attributed are apportioned among the series in the Fund in such a manner as deemed equitable by the Fund’s Board, taking into consideration, among other things, the nature and type of expense. Income, expenses (other than shareholder services fees), and realized and unrealized gains and losses are prorated among the classes based on the relative net assets of each class. Class specific expenses are directly charged to that class.
The Fund records distributions received in excess of income from underlying investments as a reduction of cost of investments and/or realized gain. Such amounts are based on estimates if actual amounts are not available and actual amounts of income, realized gain and return of capital may differ from the estimated amounts. The Fund adjusts the estimated amounts of
12
Real Estate Series
Notes to Financial Statements (continued)
(unaudited)
| 2. | Significant Accounting Policies (continued) |
Security Transactions, Investment Income and Expenses (continued)
components of distributions (and consequently its net investment income) as necessary once the issuers provide information about the actual composition of the distributions.
The Series uses the identified cost method for determining realized gain or loss on investments for both financial statement and federal income tax reporting purposes.
Option Contracts
The Series may write (sell) or buy call or put options on securities and other financial instruments. When the Series writes a call, the Series gives the purchaser the right to buy the underlying security from the Series at the price specified in the option contract (the “exercise price”) at any time during the option period. When the Series writes a put option, the Series gives the purchaser the right to sell to the Series the underlying security at the exercise price at any time during the option period. The Series will only write options on a “covered basis.” This means that the Series will own the underlying security when the Series writes a call or the Series will put aside cash, U.S. Government securities, or other liquid assets in an amount not less than the exercise price at all times the put option is outstanding.
When the Series writes an option, an amount equal to the premium received is reflected as a liability and is subsequently marked-to-market to reflect the current market value of the option. The Series, as a writer of an option, has no control over whether the underlying security or financial instrument may be sold (call) or purchased (put) and, as a result, bears the market risk of an unfavorable change in the price of the security or financial instrument underlying the written option. There is a risk that the Series may not be able to enter into a closing transaction because of an illiquid market.
The Series may also purchase options in an attempt to hedge against fluctuations in the value of its portfolio and to protect against declines in the value of the securities. The premium paid by the Series for the purchase of an option is reflected as an investment and subsequently marked-to-market to reflect the current market value of the option. The risk associated with purchasing options is limited to the premium paid.
When a security is purchased or sold through an exercise of an option, the related premium paid (or received) is added to (or deducted from) the basis of the security acquired or deducted from (or added to) the proceeds of the security sold. When an option expires (or the Series enters into a closing transaction), the Series realizes a gain or loss on the option to the extent of the premium received or paid (or gain or loss to the extent the cost of the closing transaction exceeds the premium paid or received).
The measurement of the risks associated with option contracts is meaningful only when all related and offsetting transactions are considered. The counterparty for the Series’ written options contracts outstanding at June 30, 2015 is Pershing LLC, a BNY Mellon Company.
13
Real Estate Series
Notes to Financial Statements (continued)
(unaudited)
| 2. | Significant Accounting Policies (continued) |
The following table presents the effect of the derivative instruments on the Statement of Operations:
| | | | | | |
STATEMENT OF OPERATIONS | | | | | |
| Derivative | | Location of Gain or (Loss) on Derivatives | | Realized Gain
(Loss) on
Derivatives | |
Equity contracts | | Net realized gain (loss) on options written | | $ | 190,635 | |
The average month-end balances for the period of January 1, 2015 to June 30, 2015 of outstanding derivative financial instruments were as follows:
| | | | |
| | | | |
Options: | | | | |
Average number of option contracts written | | 1,823 | | |
Average notional value of option contracts written | | $15,198,500 | | |
Written Option Rollforward
Transactions in options written for the six months ended June 30, 2015, were as follows:
| | | | | | | | |
| | | CALLS | |
| | | CONTRACTS | | | PREMIUMS RECEIVED | |
Outstanding options, beginning of period | | | — | | | | — | |
Options written | | | 4,095 | | | $ | 265,977 | |
Options exercised | | | (962 | ) | | | (62,049 | ) |
Options expired | | | (2,683 | ) | | | (192,846 | ) |
Options closed | | | (450 | ) | | | (11,082 | ) |
| | | | | | | | |
Outstanding options, end of period | | | — | | | $ | — | |
| | | | | | | | |
Foreign Currency Translation
The books and records of the Series are maintained in U.S. dollars. Foreign currencies, investments and other assets and liabilities are translated into U.S. dollars at the current exchange rates. Purchases and sales of investment securities and income and expenses are translated on the respective dates of such transactions. The Series does not isolate realized and unrealized gains and losses attributable to changes in the exchange rates from gains and losses that arise from changes in the market value of investments. Such fluctuations are included with net realized and unrealized gain or loss on investments. Net realized foreign currency gains and losses represent foreign currency gains and losses between trade date and settlement date on securities transactions, gains and losses on disposition of foreign currencies and the difference between the amount of income and foreign withholding taxes recorded on the books of the Series and the amounts actually received or paid.
Federal Taxes
The Series’ policy is to comply with the provisions of the Internal Revenue Code applicable to regulated investment companies. The Series is not subject to federal income tax or excise tax to the extent that the Series distributes to shareholders each year its taxable income, including any net realized gains on investments, in accordance with requirements of the Internal Revenue Code. Accordingly, no provision for federal income tax or excise tax has been made in the financial statements.
Management evaluates its tax positions to determine if the tax positions taken meet the minimum recognition threshold in connection with accounting for uncertainties in income tax positions taken or expected to be taken for the purposes of measuring and recognizing tax liabilities in the financial statements. Recognition of tax benefits of an uncertain tax position is required only when the position is “more likely than not” to be sustained assuming examination by taxing authorities. At June 30, 2015, the Series has recorded no liability for net unrecognized tax benefits relating to uncertain income tax positions taken or expected to be taken in future tax returns.
14
Real Estate Series
Notes to Financial Statements (continued)
(unaudited)
| 2. | Significant Accounting Policies (continued) |
Federal Taxes (continued)
The Series files income tax returns in the U.S. federal jurisdiction, various states and foreign jurisdictions, as required. No income tax returns are currently under investigation. The statute of limitations on the Series’ tax returns remains open for the years ended December 31, 2011 through December 31, 2014. The Series is not aware of any tax positions for which it is reasonably possible that the total amounts of unrecognized tax benefits will significantly change in the next twelve months.
Foreign Taxes
Based on the Series’ understanding of the tax rules and rates related to income, gains and currency purchase/repatriation transactions for foreign jurisdictions in which it invests, the Series will provide for foreign taxes, and where appropriate, deferred foreign tax.
Distributions of Income and Gains
Distributions to shareholders of net investment income and net realized gains are made annually. An additional distribution may be necessary to avoid taxation of the Series. Distributions are recorded on the ex-dividend date.
Indemnifications
The Fund’s organizational documents provide former and current directors and officers with a limited indemnification against liabilities arising in connection with the performance of their duties to the Fund. In the normal course of business, the Fund may also enter into contracts that provide general indemnifications. The Fund’s maximum exposure under these arrangements is unknown as this would be dependent on future claims that may be made against the Fund. The risk of material loss from such claims is considered remote.
Other
The preparation of financial statements in conformity with GAAP requires management to make estimates and assumptions that affect the reported amounts of assets and liabilities and the disclosure of contingent assets and liabilities at the date of the financial statements and the reported amounts of income and expenses during the reporting period. Actual results could differ from those estimates.
| 3. | Transactions with Affiliates |
The Fund has an Investment Advisory Agreement (the “Agreement”) with the Advisor, for which the Series pays a fee, computed daily and payable monthly, at an annual rate of 0.75% of the Series’ average daily net assets.
Under the Agreement, personnel of the Advisor provide the Series with advice and assistance in the choice of investments and the execution of securities transactions, and otherwise maintain the Series’ organization. The Advisor also provides the Fund with necessary office space and fund administration and support services. The salaries of all officers of the Fund (except a percentage of the Fund’s Chief Compliance Officer’s salary, which is paid by the Fund), and of all Directors who are “affiliated persons” of the Fund, or of the Advisor, and all personnel of the Fund, or of the Advisor, performing services relating to research, statistical and investment activities, are paid by the Advisor. Each “non-affiliated” Director receives an annual stipend, which is allocated among all the active series of the Fund. In addition, these Directors also receive a fee per Board meeting attended plus a fee for each committee meeting attended and are reimbursed for travel and other out-of-pocket expenses incurred by them in connection with attending such meetings. The Fund also has an Audit Committee Chair, who receives an additional annual stipend for this role.
The Class S shares of the Series are subject to a shareholder services fee in accordance with a shareholder services plan adopted by the Board. The shareholder services fee is intended to compensate financial intermediaries, including affiliates of the Fund, in connection with the provision of direct client service, personal services, maintenance of shareholder accounts and reporting services. For these services, Class S of the Series pays a fee, computed daily and payable monthly, at an annual rate of 0.25% of the average daily net assets of Class S. The Fund has a Shareholder Services Agreement with the Advisor, for which the Advisor receives the shareholder services fee as stated above.
15
Real Estate Series
Notes to Financial Statements (continued)
(unaudited)
| 3. | Transactions with Affiliates (continued) |
The Advisor has contractually agreed, until at least April 30, 2016, to waive its management fee and, if necessary, pay other operating expenses of the Series in order to maintain total direct annual fund operating expenses for the Series, exclusive of each share class’ shareholder services fee, at no more than 0.95% of average daily net assets. The Advisor did not waive any fees for the six months ended June 30, 2015. The Advisor is not eligible to recoup any expenses that have been waived or reimbursed in prior years.
Manning & Napier Investor Services, Inc., a registered broker-dealer affiliate of the Advisor, acts as distributor for the Fund’s shares. The services of Manning & Napier Investor Services, Inc. are provided at no additional cost to the Series.
Pursuant to a master services agreement dated November 1, 2014, the Fund pays the Advisor an annual fee related to fund accounting and administration of 0.0085% on the first $25 billion of average daily net assets (excluding Target Series and Strategic Income Series); 0.0075% on the next $15 billion of average daily net assets (excluding Target Series and Strategic Income Series); and 0.0065% of the average daily net assets in excess of $40 billion (excluding Target Series and Strategic Income Series); plus a base fee of $30,400 per series. Transfer agent fees are charged to the Fund on a per account basis. Additionally, certain transaction and out-of-pocket expenses, including charges for reporting relating to the Fund’s compliance program, are charged. The Advisor has agreements with BNY Mellon Investment Servicing (U.S.) Inc. (“BNY”) under which BNY serves as sub-accountant services agent and sub-transfer agent.
Expenses not directly attributable to a Series are allocated based on each Series’ relative net assets or number of accounts, depending on the expense.
| 4. | Purchases and Sales of Securities |
For the six months ended June 30, 2015, purchases and sales of securities, other than U.S. Government securities and short-term securities, were $96,483,302 and $93,213,029, respectively. There were no purchases or sales of U.S. Government securities.
| 5. | Capital Stock Transactions |
Transactions in shares of Class S and I shares of Real Estate Series were:
| | | | | | | | | | | | | | | | |
| CLASS S | | FOR THE SIX MONTHS ENDED 6/30/15 | | | FOR THE YEAR ENDED 12/31/2014 | |
| | | SHARES | | | AMOUNT | | | SHARES | | | AMOUNT | |
Sold | | | 1,280,112 | | | $ | 20,514,732 | | | | 2,877,508 | | | $ | 43,298,509 | |
Reinvested | | | — | | | | — | | | | 1,371,635 | | | | 20,505,790 | |
Repurchased | | | (1,812,968 | ) | | | (28,608,824 | ) | | | (1,925,594 | ) | | | (29,217,124 | ) |
| | | | | | | | | | | | | | | | |
Total | | | (532,856 | ) | | $ | (8,094,092 | ) | | | 2,323,549 | | | $ | 34,587,175 | |
| | | | | | | | | | | | | | | | |
| | | | | | | | | | | | | | | | | |
| CLASS I | | FOR THE SIX MONTHS ENDED 6/30/15 | | | FOR THE YEAR ENDED 12/31/14 | |
| | | SHARES | | | AMOUNT | | | SHARES | | | AMOUNT | |
Sold | | | 677,718 | | | $ | 6,286,333 | | | | 1,529,781 | | | $ | 13,799,732 | |
Reinvested | | | — | | | | — | | | | 828,373 | | | | 7,151,070 | |
Repurchased | | | (359,681 | ) | | | (3,258,677 | ) | | | (1,221,118 | ) | | | (11,141,114 | ) |
| | | | | | | | | | | | | | | | |
Total | | | 318,037 | | | $ | 3,027,656 | | | | 1,137,036 | | | $ | 9,809,688 | |
| | | | | | | | | | | | | | | | |
Approximately 90% of the shares outstanding are fiduciary accounts where the Advisor has sole investment discretion. No shareholder exceeds the 10% threshold.
16
Real Estate Series
Notes to Financial Statements (continued)
(unaudited)
The Series may trade in instruments including written and purchased options, forward foreign currency exchange contracts and futures contracts and other derivatives in the normal course of investing activities to assist in managing exposure to various market risks. The Series may be subject to various elements of risk, which may involve, to a varying degree, elements of risk in excess of the amounts recognized for financial statement purposes. These risks include: the risk that changes in the value of a derivative may not correlate perfectly with the underlying asset, rate or index; counterparty credit risk related to over the counter derivative counterparties’ failure to perform under contract terms; liquidity risk related to the lack of a liquid market for these contracts allowing the fund to close out its position(s); and documentation risk relating to disagreement over contract terms. The Series invested in written options (equity risk) during the six months ended June 30, 2015.
Investing in securities of foreign companies and foreign governments involves special risks and considerations not typically associated with investing in securities of domestic companies and the U.S. Government. These risks include revaluation of currencies and future adverse political and economic developments. Moreover, securities of foreign companies and foreign governments and their markets may be less liquid and their prices more volatile than those of comparable domestic companies and the U.S. Government.
The Series may focus its investments in certain real estate related industries; hence, the Series may subject itself to a greater degree of risk than a series that is more diversified.
| 9. | Federal Income Tax Information |
The amount and characterization of certain income and capital gains to be distributed are determined in accordance with federal income tax regulations, which may differ from GAAP. The Series may periodically make reclassifications among its capital accounts to reflect income and gains available for distribution (or available capital loss carryovers) under income tax regulations without impacting the Series’ net asset value. Any such reclassifications are not reflected in the financial highlights.
The final determination of the tax character of current year distributions will be made at the conclusion of the fiscal year. The tax character of distributions paid for the year ended December 31, 2014 was as follows:
| | | | | | | | | | | | |
Ordinary income | | $ | 10,317,395 | | | | | | | | | |
Long-term capital gains | | | 18,219,635 | | | | | | | | | |
At June 30, 2015, identified cost for federal income tax purposes, the resulting gross unrealized appreciation and depreciation, and the net unrealized appreciation were as follows:
| | | | | | | | |
Cost for federal income tax purposes | | $ | 241,417,307 | | | | | |
Unrealized appreciation | | | 36,434,554 | | | | | |
Unrealized depreciation | | | (11,373,471 | ) | | | | |
| | | | | | | | |
Net unrealized appreciation | | $ | 25,061,083 | | | | | |
| | | | | | | | |
17
Real Estate Series
Literature Requests
(unaudited)
Proxy Voting Policies and Procedures
A description of the policies and procedures that the Fund uses to determine how to vote proxies relating to portfolio securities is available, without charge, upon request:
| | | | | | |
| By phone | | 1-800-466-3863 | | | | |
| On the Securities and Exchange | | | | | | |
| Commission’s (SEC) web site | | http://www.sec.gov | | | | |
Proxy Voting Record
Information regarding how the Fund voted proxies relating to portfolio securities during the most recent 12-month period ended June 30th is available, without charge, upon request:
| | | | | | |
| By phone | | 1-800-466-3863 | | | | |
| On the SEC’s web site | | http://www.sec.gov | | | | |
Quarterly Portfolio Holdings
The Series’ complete schedule of portfolio holdings for the 1st and 3rd quarters of each fiscal year are provided on Form N-Q, and are available, without charge, upon request:
| | | | | | |
| By phone | | 1-800-466-3863 | | | | |
| On the SEC’s web site | | http://www.sec.gov | | | | |
The Series’ Form N-Q may be reviewed and copied at the SEC’s Public Reference Room in Washington, D.C. Information on the operation of the Public Reference Room may be obtained by calling 1-800-SEC-0330.
Prospectus and Statement of Additional Information (SAI)
For more information about any of the Manning & Napier Fund, Inc. Series, you may obtain a prospectus and SAI at www.manning-napier.com or by calling (800) 466-3863. Before investing, carefully consider the objectives, risks, charges and expenses of the investment and read the prospectus carefully as it contains this and other information about the investment company. In addition, this information can be found on the SEC’s web site, http://www.sec.gov.
Additional information available at www.manning-napier.com
1. Fund Holdings - Month-End
2. Fund Holdings - Quarter-End
3. Shareholder Report - Annual
4. Shareholder Report - Semi-Annual
The Fund also offers electronic notification or “e-delivery” when certain documents are available on-line to be downloaded or reviewed. Direct shareholders can elect to receive electronic notification when shareholder reports, prospectus updates, and/or statements are available. If you do not currently have on-line access to your account, you can establish access by going to www.manning-napier.com, click on “Login” in the top corner of the page, and follow the prompts to self-enroll. Once enrolled, you can set your electronic notification preferences by clicking on the Account Options tab located within the green toolbar and then select E-Delivery Option. Should you have any questions on either how to establish on-line access or how to update your account settings, please contact Investor Services at 1-800-466-3863.
The Manning & Napier Fund, Inc. is managed by Manning & Napier Advisors, LLC. Manning & Napier Investor Services, Inc., an affiliate of Manning & Napier Advisors, LLC, is the distributor of the Fund shares.
MNRES-6/15-SAR

International Series
Shareholder Expense Example
(unaudited)
As a shareholder of the Series, you may incur two types of costs: (1) transaction costs and (2) ongoing costs, including management fees and other Series expenses. This example is intended to help you understand your ongoing costs (in dollars) of investing in the Series and to compare these costs with the ongoing costs of investing in other mutual funds.
The example is based on an investment of $1,000 invested in each class at the beginning of the period and held for the entire period (January 1, 2015 to June 30, 2015).
Actual Expenses
The Actual lines of the table below provide information about actual account values and actual expenses. You may use the information in this line, together with the amount you invested, to estimate the expenses that you paid over the period. Simply divide your account value by $1,000 (for example, an $8,600 account value divided by $1,000 = 8.6), then multiply the result by the number in the Actual line for the Class in which you have invested under the heading entitled “Expenses Paid During Period” to estimate the expenses you paid on your account during this period.
Hypothetical Example for Comparison Purposes
The Hypothetical lines of each Class in the table below provide information about hypothetical account values and hypothetical expenses based on the Class’ actual expense ratio and an assumed rate of return of 5% per year before expenses, which is not the Class’ actual return. The hypothetical account values and expenses may not be used to estimate the actual ending account balance or expenses you paid during the period. You may use this information to compare the ongoing costs of investing in a class of the Series and other funds. To do so, compare this 5% hypothetical example with the 5% hypothetical examples that appear in the shareholder reports of the other funds.
Please note that the expenses shown in the table are meant to highlight your ongoing costs only and do not reflect any transaction costs. Therefore, the Hypothetical lines for each Class in the table are useful in comparing ongoing costs only, and will not help you determine the relative total costs of owning different funds. In addition, if these transaction costs were included, your costs would have been higher.
| | | | | | | | |
| | | BEGINNING
ACCOUNT VALUE 1/1/15 | | ENDING
ACCOUNT VALUE 6/30/15 | | EXPENSES PAID
DURING PERIOD* 1/1/15-6/30/15 | | ANNUALIZED
EXPENSE RATIO |
Class S | | | | | | | | |
Actual | | $1,000.00 | | $1,028.40 | | $5.53 | | 1.10% |
Hypothetical (5% return before expenses) | | $1,000.00 | | $1,019.34 | | $5.51 | | 1.10% |
Class I | | | | | | | | |
Actual | | $1,000.00 | | $1,029.70 | | $4.28 | | 0.85% |
Hypothetical (5% return before expenses) | | $1,000.00 | | $1,020.58 | | $4.26 | | 0.85% |
*Expenses are equal to the Class’ annualized expense ratio (for the six-month period), multiplied by the average account value over the period, multiplied by 181/365 (to reflect the one-half year period). Expenses are based on the most recent fiscal half year. The Class’ total return would have been lower had certain expenses not been waived during the period.
1
International Series
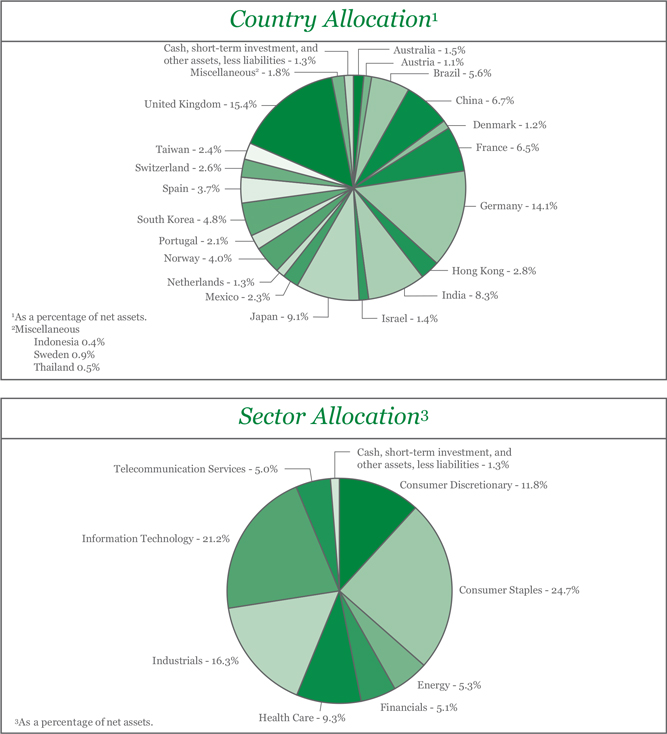
Portfolio Composition as of June 30, 2015
(unaudited)
2
International Series
Investment Portfolio - June 30, 2015
(unaudited)
| | | | | | | | |
| | |
| | | SHARES | | | VALUE (NOTE 2) | |
| | |
COMMON STOCKS - 98.7% | | | | | | | | |
| | |
Consumer Discretionary - 11.8% | | | | | | | | |
Auto Components - 1.3% | | | | | | | | |
F.C.C. Co. Ltd. (Japan)1 | | | 158,000 | | | $ | 2,411,526 | |
Hankook Tire Co. Ltd. (South Korea)1 | | | 145,591 | | | | 5,475,461 | |
| | | | | | | | |
| | |
| | | | | | | 7,886,987 | |
| | | | | | | | |
| | |
Diversified Consumer Services - 0.6% | | | | | | | | |
Fu Shou Yuan International Group Ltd. (China)1 | | | 6,290,000 | | | | 3,494,243 | |
| | | | | | | | |
| | |
Household Durables - 1.0% | | | | | | | | |
LG Electronics, Inc. (South Korea)1 | | | 74,000 | | | | 3,128,731 | |
Nikon Corp. (Japan)1 | | | 224,000 | | | | 2,588,700 | |
| | | | | | | | |
| | |
| | | | | | | 5,717,431 | |
| | | | | | | | |
Internet & Catalog Retail - 5.0% | | | | | | | | |
ASOS plc (United Kingdom)*1 | | | 156,760 | | | | 9,554,271 | |
MakeMyTrip Ltd. (India)* | | | 285,890 | | | | 5,626,315 | |
Rakuten, Inc. (Japan)1 | | | 894,190 | | | | 14,435,921 | |
| | | | | | | | |
| | |
| | | | | | | 29,616,507 | |
| | | | | | | | |
Media - 0.8% | | | | | | | | |
Mediaset Espana Comunicacion S.A. (Spain)1 | | | 382,640 | | | | 5,023,581 | |
| | | | | | | | |
| | |
Specialty Retail - 1.3% | | | | | | | | |
Groupe Fnac S.A. (France)*1 | | | 3,891 | | | | 233,292 | |
Komeri Co. Ltd. (Japan)1 | | | 188,800 | | | | 4,314,836 | |
Sa Sa International Holdings Ltd. (Hong Kong)1 | | | 6,288,390 | | | | 3,403,957 | |
| | | | | | | | |
| | |
| | | | | | | 7,952,085 | |
| | | | | | | | |
Textiles, Apparel & Luxury Goods - 1.8% | | | | | | | | |
Kering (France)1 | | | 59,760 | | | | 10,684,343 | |
| | | | | | | | |
| | |
Total Consumer Discretionary | | | | | | | 70,375,177 | |
| | | | | | | | |
| | |
Consumer Staples - 24.7% | | | | | | | | |
Beverages - 7.5% | | | | | | | | |
AMBEV S.A. - ADR (Brazil)* | | | 1,350,000 | | | | 8,235,000 | |
Carlsberg A/S - Class B (Denmark)1 | | | 80,000 | | | | 7,248,455 | |
Diageo plc (United Kingdom)1 | | | 431,750 | | | | 12,503,310 | |
Treasury Wine Estates Ltd. (Australia)1 | | | 2,285,660 | | | | 8,777,675 | |
Tsingtao Brewery Co. Ltd. - Class H (China)1 | | | 1,284,000 | | | | 7,784,761 | |
| | | | | | | | |
| | |
| | | | | | | 44,549,201 | |
| | | | | | | | |
Food & Staples Retailing - 5.0% | | | | | | | | |
Carrefour S.A. (France)1 | | | 169,962 | | | | 5,461,488 | |
Casino Guichard-Perrachon S.A. (France)1 | | | 34,170 | | | | 2,593,594 | |
Dairy Farm International Holdings Ltd. (Hong Kong)1 | | | 681,300 | | | | 5,900,217 | |
Tesco plc (United Kingdom)1 | | | 2,618,070 | | | | 8,722,784 | |
The accompanying notes are an integral part of the financial statements.
3
International Series
Investment Portfolio - June 30, 2015
(unaudited)
| | | | | | | | |
| | |
| | | SHARES | | | VALUE (NOTE 2) | |
| | |
COMMON STOCKS (continued) | | | | | | | | |
| | |
Consumer Staples (continued) | | | | | | | | |
Food & Staples Retailing (continued) | | | | | | | | |
Wal-Mart de Mexico S.A.B. de C.V. (Mexico) | | | 2,946,000 | | | $ | 7,195,606 | |
| | | | | | | | |
| | |
| | | | | | | 29,873,689 | |
| | | | | | | | |
Food Products - 7.8% | | | | | | | | |
Biostime International Holdings Ltd. (China)1 | | | 2,526,500 | | | | 7,388,393 | |
Charoen Pokphand Foods PCL (Thailand)1 | | | 3,841,800 | | | | 2,724,844 | |
Danone S.A. (France)1 | | | 107,012 | | | | 6,931,657 | |
Grupo Bimbo S.A.B. de C.V. - Class A (Mexico)* | | | 2,604,000 | | | | 6,728,070 | |
Nestle S.A. (Switzerland)1 | | | 105,220 | | | | 7,591,689 | |
Sao Martinho S.A. (Brazil) | | | 386,750 | | | | 4,700,808 | |
Suedzucker AG (Germany)1 | | | 625,447 | | | | 10,417,394 | |
| | | | | | | | |
| | |
| | | | | | | 46,482,855 | |
| | | | | | | | |
Personal Products - 3.1% | | | | | | | | |
Unilever plc - ADR (United Kingdom) | | | 420,230 | | | | 18,053,081 | |
| | | | | | | | |
| | |
Tobacco - 1.3% | | | | | | | | |
Gudang Garam Tbk PT (Indonesia)1 | | | 730,000 | | | | 2,464,043 | |
Swedish Match AB (Sweden)1 | | | 191,000 | | | | 5,430,250 | |
| | | | | | | | |
| | |
| | | | | | | 7,894,293 | |
| | | | | | | | |
| | |
Total Consumer Staples | | | | | | | 146,853,119 | |
| | | | | | | | |
| | |
Energy - 5.3% | | | | | | | | |
Energy Equipment & Services - 1.9% | | | | | | | | |
Spectrum ASA (Norway)1 | | | 578,746 | | | | 2,354,712 | |
TGS Nopec Geophysical Co. ASA (Norway)1 | | | 391,280 | | | | 9,140,689 | |
| | | | | | | | |
| | |
| | | | | | | 11,495,401 | |
| | | | | | | | |
Oil, Gas & Consumable Fuels - 3.4% | | | | | | | | |
Galp Energia SGPS S.A. (Portugal)1 | | | 1,050,040 | | | | 12,360,340 | |
Royal Dutch Shell plc - Class B - ADR (Netherlands) | | | 87,780 | | | | 5,034,183 | |
Royal Dutch Shell plc - Class B (Netherlands)1 | | | 88,430 | | | | 2,517,632 | |
| | | | | | | | |
| | |
| | | | | | | 19,912,155 | |
| | | | | | | | |
| | |
Total Energy | | | | | | | 31,407,556 | |
| | | | | | | | |
| | |
Financials - 5.1% | | | | | | | | |
Capital Markets - 1.0% | | | | | | | | |
Daiwa Securities Group, Inc. (Japan)1 | | | 830,000 | | | | 6,208,987 | |
| | | | | | | | |
| | |
Diversified Financial Services - 1.2% | | | | | | | | |
IDFC Ltd. (India)1 | | | 3,023,300 | | | | 6,999,921 | |
| | | | | | | | |
| | |
Insurance - 1.6% | | | | | | | | |
Mapfre S.A. (Spain)1 | | | 1,877,000 | | | | 6,487,122 | |
Zurich Insurance Group AG (Switzerland)1 | | | 10,500 | | | | 3,196,512 | |
| | | | | | | | |
| | |
| | | | | | | 9,683,634 | |
| | | | | | | | |
The accompanying notes are an integral part of the financial statements.
4
International Series
Investment Portfolio - June 30, 2015
(unaudited)
| | | | | | | | |
| | |
| | | SHARES | | | VALUE (NOTE 2) | |
| | |
COMMON STOCKS (continued) | | | | | | | | |
| | |
Financials (continued) | | | | | | | | |
Real Estate Investment Trusts (REITS) - 1.3% | | | | | | | | |
Alstria Office REIT AG (Germany)1 | | | 595,480 | | | $ | 7,670,989 | |
| | | | | | | | |
| | |
Total Financials | | | | | | | 30,563,531 | |
| | | | | | | | |
| | |
Health Care - 9.3% | | | | | | | | |
Health Care Equipment & Supplies - 1.0% | | | | | | | | |
Carl Zeiss Meditec AG (Germany)1 | | | 232,000 | | | | 5,918,523 | |
| | | | | | | | |
| | |
Health Care Providers & Services - 2.6% | | | | | | | | |
Fresenius Medical Care AG & Co. KGaA - ADR (Germany) | | | 200,000 | | | | 8,318,000 | |
Odontoprev S.A. (Brazil) | | | 2,000,000 | | | | 6,966,646 | |
| | | | | | | | |
| | |
| | | | | | | 15,284,646 | |
| | | | | | | | |
Life Sciences Tools & Services - 1.2% | | | | | | | | |
Gerresheimer AG (Germany)1 | | | 118,970 | | | | 7,412,032 | |
| | | | | | | | |
| | |
Pharmaceuticals - 4.5% | | | | | | | | |
AstraZeneca plc - ADR (United Kingdom) | | | 154,370 | | | | 9,834,913 | |
GlaxoSmithKline plc (United Kingdom)1 | | | 172,980 | | | | 3,596,568 | |
Novartis AG - ADR (Switzerland) | | | 49,000 | | | | 4,818,660 | |
Teva Pharmaceutical Industries Ltd. - ADR (Israel) | | | 140,000 | | | | 8,274,000 | |
| | | | | | | | |
| | |
| | | | | | | 26,524,141 | |
| | | | | | | | |
| | |
Total Health Care | | | | | | | 55,139,342 | |
| | | | | | | | |
| | |
Industrials - 16.3% | | | | | | | | |
Airlines - 0.8% | | | | | | | | |
Gol Linhas Aereas Inteligentes S.A. - ADR (Brazil) | | | 1,893,363 | | | | 4,487,270 | |
| | | | | | | | |
| | |
Commercial Services & Supplies - 1.4% | | | | | | | | |
Aggreko plc (United Kingdom)1 | | | 381,247 | | | | 8,611,286 | |
| | | | | | | | |
| | |
Construction & Engineering - 2.8% | | | | | | | | |
Larsen & Toubro Ltd. (India)1 | | | 591,285 | | | | 16,526,744 | |
| | | | | | | | |
| | |
Electrical Equipment - 4.1% | | | | | | | | |
Alstom S.A. (France)1 | | | 295,560 | | | | 8,395,182 | |
Bharat Heavy Electricals Ltd. (India)1 | | | 2,049,250 | | | | 7,966,072 | |
Schneider Electric SE (France)1 | | | 66,000 | | | | 4,569,785 | |
Teco Electric and Machinery Co. Ltd. (Taiwan)1 | | | 4,084,000 | | | | 3,170,395 | |
| | | | | | | | |
| | |
| | | | | | | 24,101,434 | |
| | | | | | | | |
Industrial Conglomerates - 4.0% | | | | | | | | |
Siemens AG (Germany)1 | | | 237,600 | | | | 24,038,378 | |
| | | | | | | | |
| | |
Machinery - 3.2% | | | | | | | | |
ANDRITZ AG (Austria)1 | | | 123,000 | | | | 6,811,268 | |
FANUC Corp. (Japan)1 | | | 37,540 | | | | 7,681,270 | |
Jain Irrigation Systems Ltd. - DVR (India)1 | | | 44,872 | | | | 25,825 | |
The accompanying notes are an integral part of the financial statements.
5
International Series
Investment Portfolio - June 30, 2015
(unaudited)
| | | | | | | | |
| | |
| | | SHARES | | | VALUE (NOTE 2) | |
| | |
COMMON STOCKS (continued) | | | | | | | | |
| | |
Industrials (continued) | | | | | | | | |
Machinery (continued) | | | | | | | | |
Jain Irrigation Systems Ltd. (India)1 | | | 4,464,000 | | | $ | 4,680,015 | |
| | | | | | | | |
| | |
| | | | | | | 19,198,378 | |
| | | | | | | | |
| | |
Total Industrials | | | | | | | 96,963,490 | |
| | | | | | | | |
| | |
Information Technology - 21.2% | | | | | | | | |
Electronic Equipment, Instruments & Components - 4.0% | | | | | | | | |
Hitachi Ltd. (Japan)1 | | | 1,646,660 | | | | 10,847,454 | |
Keyence Corp. (Japan)1 | | | 10,809 | | | | 5,825,801 | |
PAX Global Technology Ltd. (Hong Kong)*1 | | | 5,036,000 | | | | 7,213,628 | |
| | | | | | | | |
| | |
| | | | | | | 23,886,883 | |
| | | | | | | | |
Internet Software & Services - 3.6% | | | | | | | | |
NetEase, Inc. - ADR (China) | | | 48,145 | | | | 6,974,525 | |
Qihoo 360 Technology Co. Ltd. - ADR (China)* | | | 214,420 | | | | 14,514,090 | |
| | | | | | | | |
| | |
| | | | | | | 21,488,615 | |
| | | | | | | | |
Semiconductors & Semiconductor Equipment - 1.8% | | | | | | | | |
MediaTek, Inc. (Taiwan)1 | | | 794,830 | | | | 10,864,999 | |
| | | | | | | | |
| | |
Software - 8.4% | | | | | | | | |
AVEVA Group plc (United Kingdom)1 | | | 733,322 | | | | 20,832,225 | |
SAP SE (Germany)1 | | | 284,360 | | | | 19,926,935 | |
Totvs S.A. (Brazil) | | | 721,250 | | | | 9,044,913 | |
| | | | | | | | |
| | |
| | | | | | | 49,804,073 | |
| | | | | | | | |
Technology Hardware, Storage & Peripherals - 3.4% | | | | | | | | |
Samsung Electronics Co. Ltd. (South Korea)1 | | | 17,490 | | | | 19,843,913 | |
| | | | | | | | |
| | |
Total Information Technology | | | | | | | 125,888,483 | |
| | | | | | | | |
| | |
Telecommunication Services - 5.0% | | | | | | | | |
Diversified Telecommunication Services - 3.8% | | | | | | | | |
Telefonica S.A. - ADR (Spain) | | | 727,200 | | | | 10,326,240 | |
Telenor ASA - ADR (Norway) | | | 184,380 | | | | 12,096,250 | |
| | | | | | | | |
| | |
Wireless Telecommunication Services - 1.2% | | | | | | | | |
Bharti Infratel Ltd. (India)1 | | | 1,041,080 | | | | 7,307,832 | |
| | | | | | | | |
| | |
Total Telecommunication Services | | | | | | | 29,730,322 | |
| | | | | | | | |
| | |
TOTAL COMMON STOCKS | | | | | | | | |
(Identified Cost $572,696,761) | | | | | | | 586,921,020 | |
| | | | | | | | |
The accompanying notes are an integral part of the financial statements.
6
International Series
Investment Portfolio - June 30, 2015
(unaudited)
| | | | | | | | |
| | |
| | | SHARES | | | VALUE (NOTE 2) | |
| | |
SHORT-TERM INVESTMENT - 0.9% | | | | | | | | |
| | |
Dreyfus Cash Management, Inc. - Institutional Shares2, 0.04%, | | | | | | | | |
(Identified Cost $ 5,265,638) | | | 5,265,638 | | | $ | 5,265,638 | |
| | | | | | | | |
| | |
TOTAL INVESTMENTS - 99.6% | | | | | | | | |
(Identified Cost $ 577,962,399) | | | | | | | 592,186,658 | |
OTHER ASSETS, LESS LIABILITIES - 0.4% | | | | | | | 2,340,644 | |
| | | | | | | | |
| | |
NET ASSETS - 100% | | | | | | $ | 594,527,302 | |
| | | | | | | | |
ADR - American Depositary Receipt
DVR - Differential Voting Rights
*Non-income producing security.
1A factor from a third party vendor was applied to determine the security’s fair value following the close of local trading.
2Rate shown is the current yield as of June 30, 2015.
The Series’ portfolio holds, as a percentage of net assets, greater than 10% in the following countries:
United Kingdom 15.4%; Germany 14.1%.
The Global Industry Classification Standard (GICS) was developed by and is the exclusive property and a service mark of MSCI Inc. (MSCI) and Standard & Poor’s, a division of The McGraw-Hill Companies, Inc. (S&P), and is licensed for use by Manning & Napier when referencing GICS sectors. Neither MSCI, S&P, nor any third party involved in making or compiling the GICS or any GICS classifications makes any express or implied warranties or representations with respect to such standard or classification, nor shall any such party have any liability therefrom.
The accompanying notes are an integral part of the financial statements.
7
International Series
Statement of Assets & Liabilities
June 30, 2015 (unaudited)
| | | | |
ASSETS: | | | | |
| |
Investments, at value (identified cost $577,962,399) (Note 2) | | $ | 592,186,658 | |
Foreign currency (identified cost $98,096) | | | 98,808 | |
Receivable for securities sold | | | 2,227,524 | |
Foreign tax reclaims receivable | | | 1,548,689 | |
Receivable for fund shares sold | | | 569,318 | |
Dividends receivable | | | 300,397 | |
Prepaid and other expenses | | | 2,652 | |
| | | | |
| |
TOTAL ASSETS | | | 596,934,046 | |
| | | | |
| |
LIABILITIES: | | | | |
| |
Accrued foreign capital gains tax (Note 2) | | | 432,746 | |
Accrued management fees (Note 3) | | | 380,823 | |
Accrued custodian fees | | | 230,757 | |
Accrued shareholder services fees (Class S) (Note 3) | | | 102,753 | |
Accrued transfer agent fees (Note 3) | | | 61,604 | |
Accrued fund accounting and administration fees (Note 3) | | | 25,438 | |
Accrued Directors’ fees (Note 3) | | | 8,575 | |
Accrued Chief Compliance Officer service fees (Note 3) | | | 382 | |
Payable for fund shares repurchased | | | 789,993 | |
Payable for securities purchased | | | 264,171 | |
Other payables and accrued expenses | | | 109,502 | |
| | | | |
| |
TOTAL LIABILITIES | | | 2,406,744 | |
| | | | |
| |
TOTAL NET ASSETS | | $ | 594,527,302 | |
| | | | |
| |
NET ASSETS CONSIST OF: | | | | |
| |
Capital stock | | $ | 679,537 | |
Additional paid-in-capital | | | 561,538,075 | |
Undistributed net investment income | | | 4,326,211 | |
Accumulated net realized gain on investments, foreign currency and translation of other assets and liabilities | | | 14,363,946 | |
Net unrealized appreciation on investments (net of foreign capital gains tax of $432,746), foreign currency and translation of other assets and liabilities | | | 13,619,533 | |
| | | | |
| |
TOTAL NET ASSETS | | $ | 594,527,302 | |
| | | | |
| |
NET ASSET VALUE, OFFERING PRICE AND REDEMPTION PRICE PER SHARE - Class S ($452,472,608/54,294,946 shares) | | $ | 8.33 | |
| | | | |
| |
NET ASSET VALUE, OFFERING PRICE AND REDEMPTION PRICE PER SHARE - Class I ($142,054,694/13,658,737 shares) | | $ | 10.40 | |
| | | | |
The accompanying notes are an integral part of the financial statements.
8
International Series
Statement of Operations
For the Six Months Ended June 30, 2015 (unaudited)
| | | | |
INVESTMENT INCOME: | | | | |
| |
Dividends (net of foreign taxes withheld, $885,036) | | $ | 7,465,916 | |
| | | | |
| |
EXPENSES: | | | | |
| |
Management fees (Note 3) | | | 2,340,195 | |
Shareholder services fees (Class S)(Note 3) | | | 605,262 | |
Transfer agent fees (Note 3) | | | 105,679 | |
Fund accounting and administration fees (Note 3) | | | 47,207 | |
Directors’ fees (Note 3) | | | 17,253 | |
Chief Compliance Officer service fees (Note 3) | | | 1,225 | |
Custodian fees | | | 195,625 | |
Miscellaneous | | | 101,193 | |
| | | | |
| |
Total Expenses | | | 3,413,639 | |
Less reduction of expenses (Note 3) | | | (162,033 | ) |
| | | | |
| |
Net Expenses | | | 3,251,606 | |
| | | | |
| |
NET INVESTMENT INCOME | | | 4,214,310 | |
| | | | |
| |
REALIZED AND UNREALIZED GAIN (LOSS) ON INVESTMENTS AND FOREIGN CURRENCY: | | | | |
| |
Net realized gain (loss) on- | | | | |
Investments | | | 8,286,803 | |
Foreign currency and translation of other assets and liabilities | | | (354,753 | ) |
| | | | |
| |
| | | 7,932,050 | |
| | | | |
| |
Net change in unrealized appreciation (depreciation) on- | | | | |
Investments (net of decrease in accrued foreign capital gains tax of $58,192) | | | 6,638,717 | |
Foreign currency and translation of other assets and liabilities | | | (59,178 | ) |
| | | | |
| |
| | | 6,579,539 | |
| | | | |
| |
NET REALIZED AND UNREALIZED GAIN (LOSS) ON INVESTMENTS AND FOREIGN CURRENCY | | | 14,511,589 | |
| | | | |
| |
NET INCREASE IN NET ASSETS RESULTING FROM OPERATIONS | | $ | 18,725,899 | |
| | | | |
The accompanying notes are an integral part of the financial statements.
9
International Series
Statements of Changes in Net Assets
| | | | | | | | |
| | | FOR THE SIX
MONTH
ENDED 6/30/15
(UNAUDITED) | | | FOR THE
YEAR ENDED
12/31/14 | |
INCREASE (DECREASE) IN NET ASSETS: | | | | | | | | |
| | |
OPERATIONS: | | | | | | | | |
| | |
Net investment income | | $ | 4,214,310 | | | $ | 8,960,558 | |
Net realized gain on investments and foreign currency | | | 7,932,050 | | | | 68,919,989 | |
Net change in unrealized appreciation (depreciation) on investments and foreign currency | | | 6,579,539 | | | | (127,193,320 | ) |
| | | | | | | | |
| | |
Net increase (decrease) from operations | | | 18,725,899 | | | | (49,312,773 | ) |
| | | | | | | | |
| | |
DISTRIBUTIONS TO SHAREHOLDERS (Note 8): | | | | | | | | |
| | |
From net investment income (Class S) | | | — | | | | (6,758,776 | ) |
From net investment income (Class I) | | | — | | | | (1,659,943 | ) |
From net realized gain on investments (Class S) | | | — | | | | (53,674,182 | ) |
From net realized gain on investments (Class I) | | | — | | | | (10,868,137 | ) |
| | | | | | | | |
| | |
Total distributions to shareholders | | | — | | | | (72,961,038 | ) |
| | | | | | | | |
| | |
CAPITAL STOCK ISSUED AND REPURCHASED: | | | | | | | | |
| | |
Net decrease from capital share transactions (Note 5) | | | (41,352,750 | ) | | | (38,957,031 | ) |
| | | | | | | | |
| | |
Net decrease in net assets | | | (22,626,851 | ) | | | (161,230,842 | ) |
| | |
NET ASSETS: | | | | | | | | |
| | |
Beginning of period | | | 617,154,153 | | | | 778,384,995 | |
| | | | | | | | |
| | |
End of period (including undistributed net investment income of $4,326,211 and $111,901, respectively) | | $ | 594,527,302 | | | $ | 617,154,153 | |
| | | | | | | | |
The accompanying notes are an integral part of the financial statements.
10
International Series
Financial Highlights - Class S*
| | | | | | | | | | | | | | | | | | | | | | | | | | | | | | |
| | | FOR THE SIX
MONTHS ENDED | | FOR THE YEARS ENDED |
| | | 6/30/15
(UNAUDITED) | | 12/31/14 | | 12/31/13 | | 12/31/12 | | 12/31/11 | | 12/31/10 |
Per share data (for a share outstanding throughout each period): | | | | | | | | | | | | | | | | | | | | | | | | | | | | | | |
Net asset value - Beginning of period | | | | $8.10 | | | | | $9.91 | | | | | $8.70 | | | | | $7.61 | | | | | $8.85 | | | | | $8.39 | |
| | | | | | | | | | | | | | | | | | | | | | | | | | | | | | |
Income (loss) from investment operations: | | | | | | | | | | | | | | | | | | | | | | | | | | | | | | |
Net investment income1 | | | | 0.05 | | | | | 0.12 | | | | | 0.11 | | | | | 0.10 | | | | | 0.13 | | | | | 0.14 | |
Net realized and unrealized gain (loss) on investments | | | | 0.18 | | | | | (0.84 | ) | | | | 1.59 | | | | | 1.10 | | | | | (1.26 | ) | | | | 0.86 | |
| | | | | | | | | | | | | | | | | | | | | | | | | | | | | | |
Total from investment operations | | | | 0.23 | | | | | (0.72 | ) | | | | 1.70 | | | | | 1.20 | | | | | (1.13 | ) | | | | 1.00 | |
| | | | | | | | | | | | | | | | | | | | | | | | | | | | | | |
Less distributions to shareholders: | | | | | | | | | | | | | | | | | | | | | | | | | | | | | | |
From net investment income | | | | — | | | | | (0.12 | ) | | | | (0.12 | ) | | | | (0.10 | ) | | | | (0.10 | ) | | | | (0.19 | ) |
From return of capital | | | | — | | | | | — | | | | | — | | | | | (0.01 | ) | | | | — | | | | | — | |
From net realized gain on investments | | | | — | | | | | (0.97 | ) | | | | (0.37 | ) | | | | — | | | | | (0.01 | ) | | | | (0.35 | ) |
| | | | | | | | | | | | | | | | | | | | | | | | | | | | | | |
Total distributions to shareholders | | | | — | | | | | (1.09 | ) | | | | (0.49 | ) | | | | (0.11 | ) | | | | (0.11 | ) | | | | (0.54 | ) |
| | | | | | | | | | | | | | | | | | | | | | | | | | | | | | |
Net asset value - End of period | | | | $8.33 | | | | | $8.10 | | | | | $9.91 | | | | | $8.70 | | | | | $7.61 | | | | | $8.85 | |
| | | | | | | | | | | | | | | | | | | | | | | | | | | | | | |
Net assets - End of period (000’s omitted) | | | $ | 452,473 | | | | $ | 490,833 | | | | $ | 637,598 | | | | $ | 565,609 | | | | $ | 513,267 | | | | $ | 317,199 | |
| | | | | | | | | | | | | | | | | | | | | | | | | | | | | | |
Total return2 | | | | 2.84% | | | | | (7.03% | ) | | | | 19.69% | | | | | 15.78% | | | | | (12.82% | ) | | | | 12.04% | |
Ratios (to average net assets)/Supplemental Data: | | | | | | | | | | | | | | | | | | | | | | | | | | | | | | |
Expenses** | | | | 1.10% | 3 | | | | 1.10% | | | | | 1.10% | | | | | 1.10% | | | | | 1.16% | | | | | 1.15% | |
Net investment income | | | | 1.29% | 3 | | | | 1.20% | | | | | 1.21% | | | | | 1.30% | | | | | 1.49% | | | | | 1.68% | |
Portfolio turnover | | | | 15% | | | | | 22% | | | | | 22% | | | | | 22% | | | | | 7% | | | | | 13% | |
|
*Effective December 31, 2011, the shares of the Series have been designated as Class S. **The investment advisor did not impose all or a portion of its management and/or other fees, and in some periods may have paid a portion of the Series’ expenses. If these expenses had been incurred by the Class, the expense ratio (to average net assets) would have increased by the following amounts: | |
| | | | | | |
| | | | 0.05% | | | | | 0.04% | | | | | 0.03% | | | | | 0.07% | | | | | N/A | | | | | 0.00% | 4 |
1Calculated based on average shares outstanding during the periods.
2Represents aggregate total return for the periods indicated, and assumes reinvestment of all distributions. Total return would have been lower had certain expenses not been waived or reimbursed during certain periods. Periods less than one year are not annualized.
3Annualized.
4Less than 0.01%.
The accompanying notes are an integral part of the financial statements.
11
International Series
Financial Highlights - Class I
| | | | | | | | | | | | | | | | | | | | |
| | | FOR THE SIX
MONTHS ENDED
6/30/15
(UNAUDITED) | | FOR THE YEARS ENDED | | FOR THE PERIOD
3/15/121 TO
12/31/12 |
| | | | 12/31/14 | | 12/31/13 | |
Per share data (for a share outstanding throughout each period): | | | | | | | | | | | | | | | | | | | | |
Net asset value - Beginning of period | | | | $10.10 | | | | | $12.05 | | | | | $10.47 | | | | | $10.00 | |
| | | | | | | | | | | | | | | | | | | | |
Income (loss) from investment operations: | | | | | | | | | | | | | | | | | | | | |
Net investment income2 | | | | 0.08 | | | | | 0.17 | | | | | 0.17 | | | | | 0.13 | |
Net realized and unrealized gain (loss) on investments | | | | 0.22 | | | | | (1.00 | ) | | | | 1.91 | | | | | 0.46 | |
| | | | | | | | | | | | | | | | | | | | |
Total from investment operations | | | | 0.30 | | | | | (0.83 | ) | | | | 2.08 | | | | | 0.59 | |
| | | | | | | | | | | | | | | | | | | | |
Less distributions to shareholders: | | | | | | | | | | | | | | | | | | | | |
From net investment income | | | | — | | | | | (0.15 | ) | | | | (0.13 | ) | | | | (0.11 | ) |
From return of capital | | | | — | | | | | — | | | | | — | | | | | (0.01 | ) |
From net realized gain on investments | | | | — | | | | | (0.97 | ) | | | | (0.37 | ) | | | | — | |
| | | | | | | | | | | | | | | | | | | | |
Total distributions to shareholders | | | | — | | | | | (1.12 | ) | | | | (0.50 | ) | | | | (0.12 | ) |
| | | | | | | | | | | | | | | | | | | | |
Net asset value - End of period | | | | $10.40 | | | | | $10.10 | | | | | $12.05 | | | | | $10.47 | |
| | | | | | | | | | | | | | | | | | | | |
Net assets - End of period (000’s omitted) | | | $ | 142,055 | | | | $ | 126,321 | | | | $ | 140,787 | | | | $ | 95,925 | |
| | | | | | | | | | | | | | | | | | | | |
Total return3 | | | | 2.97% | | | | | (6.72% | ) | | | | 19.97% | | | | | 5.88% | |
Ratios (to average net assets)/Supplemental Data: | | | | | | | | | | | | | | | | | | | | |
Expenses* | | | | 0.85% | 4 | | | | 0.85% | | | | | 0.85% | | | | | 0.85% | 4 |
Net investment income | | | | 1.56% | 4 | | | | 1.42% | | | | | 1.48% | | | | | 1.67% | 4 |
Portfolio turnover | | | | 15% | | | | | 22% | | | | | 22% | | | | | 22% | |
|
| *The investment advisor did not impose all or a portion of its management and/or other fees during the period, and may have paid a portion of the Series’ expenses. If these expenses had been incurred by the Class, the expense ratio (to average net assets) would have increased by the following amounts: | |
| | | | |
| | | | 0.05% | | | | | 0.04% | | | | | 0.03% | | | | | 0.09% | 4 |
1Commencement of operations.
2Calculated based on average shares outstanding during the periods.
3Represents aggregate total return for the periods indicated, and assumes reinvestment of all distributions. Total return would have been lower had certain expenses not been waived during certain periods. Periods less than one year are not annualized.
4Annualized.
The accompanying notes are an integral part of the financial statements.
12
International Series
Notes to Financial Statements
(unaudited)
International Series (the “Series”) is a no-load diversified series of Manning & Napier Fund, Inc. (the “Fund”). The Fund is organized in Maryland and is registered under the Investment Company Act of 1940, as amended, as an open-end management investment company.
The Series’ investment objective is to provide long-term growth by investing principally in the common stocks of companies located outside the United States.
The Fund’s advisor is Manning & Napier Advisors, LLC (the “Advisor”). Shares of the Series are offered to investors, clients and employees of the Advisor and its affiliates. The Series is authorized to issue two classes of shares (Class S and Class I). Each class of shares is substantially the same, except that Class S shares bear shareholder services fees. The total authorized capital stock of the Fund consists of 15 billion shares of common stock each having a par value of $0.01. As of June 30, 2015, 10.6 billion shares have been designated in total among 41 series, of which 250 million have been designated as International Series Class S common stock and 100 million have been designated as International Series Class I common stock.
| 2. | Significant Accounting Policies |
The following is a summary of significant accounting policies followed by the Series. The Series is an investment company and, accordingly, follows the investment company accounting and reporting guidance of the Financial Accounting Standards Board Accounting Standards Codification Topic 946 - Investment Companies, which is part of accounting principles generally accepted in the United States of America (“GAAP”).
Security Valuation
Portfolio securities, including domestic equities, foreign equities, warrants and options, listed on an exchange other than the NASDAQ Stock Market are valued at the latest quoted sales price of the exchange on which the security is primarily traded. Securities not traded on valuation date or securities not listed on an exchange are valued at the latest quoted bid price provided by the Fund’s pricing service. Securities listed on the NASDAQ Stock Market are valued in accordance with the NASDAQ Official Closing Price.
Short-term investments that mature in sixty days or less are valued at amortized cost, which approximates fair value. Investments in open-end investment companies are valued at their net asset value per share on valuation date.
Volume and level of activity in established markets for an asset or liability are evaluated to determine whether recent transactions and quoted prices are determinative of fair value. Where there have been significant decreases in volume and level of activity, further analysis and adjustment may be necessary to estimate fair value. The Series measures fair value in these instances by the use of inputs and valuation techniques which may be based upon current market prices of securities that are comparable in coupon, rating, maturity and industry and/or expectation of future cash flows. As a result of trading in relatively thin markets and/or markets that experience significant volatility, the prices used by the Series to value these securities may differ from the value that would be realized if these securities were sold, and the differences could be material.
Securities for which representative valuations or prices are not available from the Series’ pricing service may be valued at fair value as determined in good faith by the Advisor under procedures approved by and under the general supervision and responsibility of the Fund’s Board of Directors (the “Board”). Due to the inherent uncertainty of valuations of such securities, the fair value may differ significantly from the values that would have been used had a ready market for such securities existed. If trading or events occurring after the close of the principal market in which securities are traded are expected to materially affect the value of those securities, then they may be valued at their fair value, taking this trading or these events into account. In accordance with the procedures approved by the Board, the values of certain securities trading outside the U.S. were adjusted following the close of local trading using a factor from a third party vendor. The third party vendor uses statistical analyses and quantitative models, which consider among other things subsequent movement and changes in the prices of indices, securities and exchange rates in other markets, to determine the factors which are used to adjust local market prices. The value of
13
International Series
Notes to Financial Statements (continued)
(unaudited)
| 2. | Significant Accounting Policies (continued) |
Security Valuation (continued)
securities used for net asset value calculation under these procedures may differ from published prices for the same securities. It is the Fund’s policy to classify each foreign equity security where a factor from a third party vendor is provided as a Level 2 security.
Various inputs are used in determining the value of the Series’ assets or liabilities carried at fair value. These inputs are summarized in three broad levels. Level 1 includes quoted prices in active markets for identical assets and liabilities. Level 2 includes other significant observable inputs (including quoted prices for similar securities, interest rates, prepayment speeds, credit risk, etc.). Level 3 includes significant unobservable inputs (including the Series’ own assumptions in determining the fair value of investments). A financial instrument’s level within the fair value hierarchy is based on the lowest level of any input both individually and in aggregate that is significant to the fair value measurement. The inputs or methodology used for valuing securities are not necessarily an indication of the risk associated with investing in those securities.
The following is a summary of the valuation levels used for major security types as of June 30, 2015 in valuing the Series’ assets or liabilities carried at fair value:
| | | | | | | | | | | | | | | | |
| DESCRIPTION | | TOTAL | | | LEVEL 1 | | | LEVEL 2 | | | LEVEL 3 | |
Assets: | | | | | | | | | | | | | | | | |
Equity securities: | | | | | | | | | | | | | | | | |
Consumer Discretionary | | $ | 70,375,177 | | | $ | 5,626,315 | | | $ | 64,748,862 | | | $ | — | |
Consumer Staples | | | 146,853,119 | | | | 44,912,565 | | | | 101,940,554 | | | | — | |
Energy | | | 31,407,556 | | | | 5,034,183 | | | | 26,373,373 | | | | — | |
Financials | | | 30,563,531 | | | | — | | | | 30,563,531 | | | | — | |
Health Care | | | 55,139,342 | | | | 38,212,219 | | | | 16,927,123 | | | | — | |
Industrials | | | 96,963,490 | | | | 4,487,270 | | | | 92,476,220 | | | | — | |
Information Technology | | | 125,888,483 | | | | 30,533,528 | | | | 95,354,955 | | | | — | |
Telecommunication Services | | | 29,730,322 | | | | 22,422,490 | | | | 7,307,832 | | | | — | |
Mutual fund | | | 5,265,638 | | | | 5,265,638 | | | | — | | | | — | |
| | | | | | | | | | | | | | | | |
Total assets | | $ | 592,186,658 | | | $ | 156,494,208 | | | $ | 435,692,450 | | | $ | — | |
| | | | | | | | | | | | | | | | |
Please see the Investment Portfolio for foreign securities where a factor from a third party vendor was applied to determine the security’s fair value following close of local trading. Such securities are included in Level 2 in the table above.
There were no Level 3 securities held by the Series as of December 31, 2014 or June 30, 2015.
The Fund’s policy is to recognize transfers in and transfers out of the valuation levels as of the beginning of the reporting period. There were no transfers between Level 1 and Level 2 during the six months ended June 30, 2015.
Security Transactions, Investment Income and Expenses
Security transactions are accounted for on trade date. Dividend income is recorded on the ex-dividend date, except that if the ex-dividend date has passed, certain dividends from foreign securities are recorded as soon as the Series is informed of the ex-dividend date. Non-cash dividends, if any, are recorded at the fair value of the securities received. Interest income, including amortization of premium and accretion of discounts using the effective interest method, is earned from settlement date and accrued daily.
Expenses are recorded on an accrual basis. Most expenses of the Fund can be attributed to a specific series. Expenses which cannot be directly attributed are apportioned among the series in the Fund in such a manner as deemed equitable by the Fund’s Board, taking into consideration, among other things, the nature and type of expense. Income, expenses (other than shareholder services fees), and realized and unrealized gains and losses are prorated among the classes based on the relative net assets of each class. Class specific expenses are directly charged to that class.
14
International Series
Notes to Financial Statements (continued)
(unaudited)
| 2. | Significant Accounting Policies (continued) |
Security Transactions, Investment Income and Expenses (continued)
The Series uses the identified cost method for determining realized gain or loss on investments for both financial statement and federal income tax reporting purposes.
Foreign Currency Translation
The books and records of the Series are maintained in U.S. dollars. Foreign currencies, investments and other assets and liabilities are translated into U.S. dollars at the current exchange rates. Purchases and sales of investment securities and income and expenses are translated on the respective dates of such transactions. The Series does not isolate realized and unrealized gains and losses attributable to changes in the exchange rates from gains and losses that arise from changes in the fair value of investments. Such fluctuations are included with net realized and unrealized gain or loss on investments. Net realized foreign currency gains and losses represent foreign currency gains and losses between trade date and settlement date on securities transactions, gains and losses on disposition of foreign currencies and the difference between the amount of income and foreign withholding taxes recorded on the books of the Series and the amounts actually received or paid.
Federal Taxes
The Series’ policy is to comply with the provisions of the Internal Revenue Code applicable to regulated investment companies. The Series is not subject to federal income tax or excise tax to the extent that the Series distributes to shareholders each year its taxable income, including any net realized gains on investments, in accordance with requirements of the Internal Revenue Code. Accordingly, no provision for federal income tax or excise tax has been made in the financial statements.
Management evaluates its tax positions to determine if the tax positions taken meet the minimum recognition threshold in connection with accounting for uncertainties in income tax positions taken or expected to be taken for the purposes of measuring and recognizing tax liabilities in the financial statements. Recognition of tax benefits of an uncertain tax position is required only when the position is “more likely than not” to be sustained assuming examination by taxing authorities. At June 30, 2015, the Series has recorded no liability for net unrecognized tax benefits relating to uncertain income tax positions taken or expected to be taken in future tax returns.
The Series files income tax returns in the U.S. federal jurisdiction, various states and foreign jurisdictions, as required. No income tax returns are currently under investigation. The statute of limitations on the Series’ tax returns remains open for the years ended December 31, 2011 through December 31, 2014. The Series is not aware of any tax positions for which it is reasonably possible that the total amounts of unrecognized tax benefits will significantly change in the next twelve months.
Foreign Taxes
Based on the Series’ understanding of the tax rules and rates related to income, gains and currency purchase/repatriation transactions for foreign jurisdictions in which it invests, the Series will provide for foreign taxes, and where appropriate, deferred foreign tax. The Series is subject to a tax imposed on short term capital gains on securities of issuers domiciled in India. The Series records an estimated deferred tax liability for securities that have been held for less than a year at the end of the reporting period, assuming those positions were disposed of at the end of the period. This amount is reported in Accrued foreign capital gains tax in the accompanying Statement of Assets and Liabilities. Realized losses on the sale of securities of issuers domiciled in India can be carried forward for eight years to offset potential future short term realized capital gains.
Distributions of Income and Gains
Distributions to shareholders of net investment income and net realized gains are made annually. An additional distribution may be necessary to avoid taxation of the Series. Distributions are recorded on the ex-dividend date.
Indemnifications
The Fund’s organizational documents provide former and current directors and officers with a limited indemnification against liabilities arising in connection with the performance of their duties to the Fund. In the normal course of business, the Fund may also enter into contracts that provide general indemnifications. The Fund’s maximum exposure under these arrangements is unknown as this would be dependent on future claims that may be made against the Fund. The risk of material loss from such claims is considered remote.
15
International Series
Notes to Financial Statements (continued)
(unaudited)
| 2. | Significant Accounting Policies (continued) |
Other
The preparation of financial statements in conformity with GAAP requires management to make estimates and assumptions that affect the reported amounts of assets and liabilities and the disclosure of contingent assets and liabilities at the date of the financial statements and the reported amounts of income and expenses during the reporting period. Actual results could differ from those estimates.
| 3. | Transactions with Affiliates |
The Fund has an Investment Advisory Agreement (the “Agreement”) with the Advisor, for which the Series pays a fee, computed daily and payable monthly, at an annual rate of 0.75% of the Series’ average daily net assets.
Under the Agreement, personnel of the Advisor provide the Series with advice and assistance in the choice of investments and the execution of securities transactions, and otherwise maintain the Series’ organization. The Advisor also provides the Fund with necessary office space and fund administration and support services. The salaries of all officers of the Fund (except a percentage of the Fund’s Chief Compliance Officer’s salary, which is paid by the Fund), and of all Directors who are “affiliated persons” of the Fund, or of the Advisor, and all personnel of the Fund, or of the Advisor, performing services relating to research, statistical and investment activities, are paid by the Advisor. Each “non-affiliated” Director receives an annual stipend, which is allocated among all the active series of the Fund. In addition, these Directors also receive a fee per Board meeting attended plus a fee for each committee meeting attended and are reimbursed for travel and other out-of-pocket expenses incurred by them in connection with attending such meetings. The Fund also has an Audit Committee Chair, who receives an additional annual stipend for this role.
The Class S shares of the Series are subject to a shareholder services fee in accordance with a shareholder services plan adopted by the Board. The shareholder services fee is intended to compensate financial intermediaries, including affiliates of the Fund, in connection with the provision of direct client service, personal services, maintenance of shareholder accounts and reporting services. For these services, Class S of the Series pays a fee, computed daily and payable monthly, at an annual rate of 0.25% of the average daily net assets of Class S. The Fund has a Shareholder Services Agreement with the Advisor, for which the Advisor receives the shareholder services fee as stated above.
The Advisor has contractually agreed, until at least April 30, 2016, to waive its management fee and, if necessary, pay other operating expenses of the Series in order to maintain total direct annual fund operating expenses for the Series, exclusive of each share class’ shareholder services fee, at no more than 0.85% of average daily net assets. Accordingly, the Advisor waived fees of $162,033 for the six months ended June 30, 2015, which is included as a reduction of expenses on the Statement of Operations. The Advisor is not eligible to recoup any expenses that have been waived or reimbursed in prior years.
Manning & Napier Investor Services, Inc., a registered broker-dealer affiliate of the Advisor, acts as distributor for the Fund’s shares. The services of Manning & Napier Investor Services, Inc. are provided at no additional cost to the Series.
Pursuant to a master services agreement dated November 1, 2014, the Fund pays the Advisor an annual fee related to fund accounting and administration of 0.0085% on the first $25 billion of average daily net assets (excluding Target Series and Strategic Income Series); 0.0075% on the next $15 billion of average daily net assets (excluding Target Series and Strategic Income Series); and 0.0065% of the average daily net assets in excess of $40 billion (excluding Target Series and Strategic Income Series); plus a base fee of $30,400 per series. Transfer agent fees are charged to the Fund on a per account basis. Additionally, certain transaction and out-of-pocket expenses, including charges for reporting relating to the Fund’s compliance program, are charged. The Advisor has agreements with BNY Mellon Investment Servicing (U.S.) Inc. (“BNY”) under which BNY serves as sub-accountant services agent and sub-transfer agent.
Expenses not directly attributable to a series are allocated based on each series’ relative net assets or number of accounts, depending on the expense.
16
International Series
Notes to Financial Statements (continued)
(unaudited)
| 4. | Purchases and Sales of Securities |
For the six months ended June 30, 2015, purchases and sales of securities, other than U.S. Government securities and short-term securities, were $90,372,039 and $137,023,486, respectively. There were no purchases or sales of U.S. Government securities.
| 5. | Capital Stock Transactions |
Transactions in shares of Class S and I shares of International Series were:
| | | | | | | | | | | | | | | | |
| CLASS S | | FOR THE SIX MONTHS ENDED 6/30/15 | | | FOR THE YEAR ENDED 12/31/14 | |
| | | SHARES | | | AMOUNT | | | SHARES | | | AMOUNT | |
Sold | | | 2,943,403 | | | $ | 24,725,826 | | | | 5,034,580 | | | $ | 48,663,625 | |
Reinvested | | | — | | | | — | | | | 7,333,073 | | | | 58,712,204 | |
Repurchased | | | (9,231,077 | ) | | | (77,940,598 | ) | | | (16,134,004 | ) | | | (154,441,126 | ) |
| | | | | | | | | | | | | | | | |
Total | | | (6,287,674 | ) | | $ | (53,214,772 | ) | | | (3,766,351 | ) | | $ | (47,065,297 | ) |
| | | | | | | | | | | | | | | | |
| | | | | | | | | | | | | | | | |
| CLASS I | | FOR THE SIX MONTHS ENDED 6/30/15 | | | FOR THE YEAR ENDED 12/31/14 | |
| | | SHARES | | | AMOUNT | | | SHARES | | | AMOUNT | |
Sold | | | 1,888,400 | | | $ | 19,588,172 | | | | 1,936,083 | | | $ | 23,008,129 | |
Reinvested | | | — | | | | — | | | | 1,242,972 | | | | 12,385,248 | |
Repurchased | | | (738,185 | ) | | | (7,726,150 | ) | | | (2,350,034 | ) | | | (27,285,111 | ) |
| | | | | | | | | | | | | | | | |
Total | | | 1,150,215 | | | $ | 11,862,022 | | | | 829,021 | | | $ | 8,108,266 | |
| | | | | | | | | | | | | | | | |
Approximately 59% of the shares outstanding are fiduciary accounts where the Advisor has sole investment discretion. No shareholder exceeds the 10% threshold.
The Series may trade in instruments including written and purchased options, forward foreign currency exchange contracts and futures contracts and other derivatives in the normal course of investing activities to assist in managing exposure to various market risks. The Series may be subject to various elements of risk, which may involve, to a varying degree, elements of risk in excess of the amounts recognized for financial statement purposes. These risks include: the risk that changes in the value of a derivative may not correlate perfectly with the underlying asset, rate or index; counterparty credit risk related to over the counter derivative counterparties’ failure to perform under contract terms; liquidity risk related to the lack of a liquid market for these contracts allowing the fund to close out its position(s); and documentation risk relating to disagreement over contract terms. No such investments were held by the Series as of June 30, 2015.
Investing in securities of foreign companies and foreign governments involves special risks and considerations not typically associated with investing in securities of domestic companies and the U.S. Government. These risks include revaluation of currencies and future adverse political and economic developments. Moreover, securities of foreign companies and foreign governments and their markets may be less liquid and their prices more volatile than those of comparable domestic companies and the U.S. Government.
| 8. | Federal Income Tax Information |
The amount and characterization of certain income and capital gains to be distributed are determined in accordance with federal income tax regulations, which may differ from GAAP. The Series may periodically make reclassifications among its capital accounts to reflect income and gains available for distribution (or available capital loss carryovers) under income tax regulations without impacting the Series’ net asset value. Any such reclassifications are not reflected in the financial highlights.
17
International Series
Notes to Financial Statements (continued)
(unaudited)
| 8. | Federal Income Tax Information (continued) |
The tax character of distributions paid for the year ended December 31, 2014 were as follows:
| | | | | | |
Ordinary income | | | $16,622,851 | | | |
Long-term capital gains | | | 56,338,187 | | | |
At June 30, 2015, the tax basis of components of distributable earnings and the net unrealized appreciation based on the identified cost of investments for federal income tax purposes were as follows:
| | | | | | |
Cost for federal income tax purposes | | $ | 577,962,399 | | | |
Unrealized appreciation | | | 77,203,736 | | | |
Unrealized depreciation | | | (62,979,477 | ) | | |
| | | | | | |
Net unrealized appreciation | | $ | 14,224,259 | | | |
| | | | | | |
18
International Series
Literature Requests
(unaudited)
Proxy Voting Policies and Procedures
A description of the policies and procedures that the Fund uses to determine how to vote proxies relating to portfolio securities is available, without charge, upon request:
| | |
| By phone | | 1-800-466-3863 |
| On the Securities and Exchange | | |
| Commission’s (SEC) web site | | http://www.sec.gov |
Proxy Voting Record
Information regarding how the Fund voted proxies relating to portfolio securities during the most recent 12-month period ended June 30th is available, without charge, upon request:
| | |
| By phone | | 1-800-466-3863 |
| On the SEC’s web site | | http://www.sec.gov |
Quarterly Portfolio Holdings
The Series’ complete schedule of portfolio holdings for the 1st and 3rd quarters of each fiscal year are provided on Form N-Q, and are available, without charge, upon request:
| | |
| By phone | | 1-800-466-3863 |
| On the SEC’s web site | | http://www.sec.gov |
The Series’ Form N-Q may be reviewed and copied at the SEC’s Public Reference Room in Washington, D.C. Information on the operation of the Public Reference Room may be obtained by calling 1-800-SEC-0330.
Prospectus and Statement of Additional Information (SAI)
For more information about any of the Manning & Napier Fund, Inc. Series, you may obtain a prospectus and SAI at www.manning-napier.com or by calling (800) 466-3863. Before investing, carefully consider the objectives, risks, charges and expenses of the investment and read the prospectus carefully as it contains this and other information about the investment company. In addition, this information can be found on the SEC’s web site, http://www.sec.gov.
Additional information available at www.manning-napier.com
1. Fund Holdings - Month-End
2. Fund Holdings - Quarter-End
3. Shareholder Report - Annual
4. Shareholder Report - Semi-Annual
The Fund also offers electronic notification or “e-delivery” when certain documents are available on-line to be downloaded or reviewed. Direct shareholders can elect to receive electronic notification when shareholder reports, prospectus updates, and/or statements are available. If you do not currently have on-line access to your account, you can establish access by going to www.manning-napier.com, click on “Login” in the top corner of the page, and follow the prompts to self-enroll. Once enrolled, you can set your electronic notification preferences by clicking on the Account Options tab located within the green toolbar and then select E-Delivery Option. Should you have any questions on either how to establish on-line access or how to update your account settings, please contact Investor Services at 1-800-466-3863.
The Manning & Napier Fund, Inc. is managed by Manning & Napier Advisors, LLC. Manning & Napier Investor Services, Inc., an affiliate of Manning & Napier Advisors, LLC, is the distributor of the Fund shares.
MNINT-6/15-SAR

World Opportunities Series
Shareholder Expense Example
(unaudited)
As a shareholder of the Series, you may incur two types of costs: (1) transaction costs and (2) ongoing costs, including management fees and other Series expenses. This example is intended to help you understand your ongoing costs (in dollars) of investing in the Series and to compare these costs with the ongoing costs of investing in other mutual funds.
The example is based on an investment of $1,000 invested at the beginning of the period and held for the entire period (January 1, 2015 to June 30, 2015).
Actual Expenses
The first line of the table below provides information about actual account values and actual expenses. You may use the information in this line, together with the amount you invested, to estimate the expenses that you paid over the period. Simply divide your account value by $1,000 (for example, an $8,600 account value divided by $1,000 = 8.6), then multiply the result by the number in the first line under the heading entitled “Expenses Paid During Period” to estimate the expenses you paid on your account during this period.
Hypothetical Example for Comparison Purposes
The second line of the table below provides information about hypothetical account values and hypothetical expenses based on the Series’ actual expense ratio and an assumed rate of return of 5% per year before expenses, which is not the Series’ actual return. The hypothetical account values and expenses may not be used to estimate the actual ending account balance or expenses you paid during the period. You may use this information to compare the ongoing costs of investing in the Series and other funds. To do so, compare this 5% hypothetical example with the 5% hypothetical examples that appear in the shareholder reports of the other funds.
Please note that the expenses shown in the table are meant to highlight your ongoing costs only and do not reflect any transaction costs. Therefore, the second line of the table is useful in comparing ongoing costs only, and will not help you determine the relative total costs of owning different funds. In addition, if these transaction costs were included, your costs would have been higher.
| | | | | | |
| | | BEGINNING
ACCOUNT VALUE
1/1/15 | | ENDING
ACCOUNT VALUE
6/30/15 | | EXPENSES PAID
DURING PERIOD*
1/1/15-6/30/15 |
Actual | | $1,000.00 | | $1,034.10 | | $5.55 |
| |
Hypothetical (5% return before expenses) | | $1,000.00 | | $1,019.34 | | $5.51 |
| |
*Expenses are equal to the Series’ annualized expense ratio (for the six-month period) of 1.10%, multiplied by the average account value over the period, multiplied by 181/365 (to reflect the one-half year period). Expenses are based on the most recent fiscal half year.
1
World Opportunities Series
Portfolio Composition as of June 30, 2015
(unaudited)
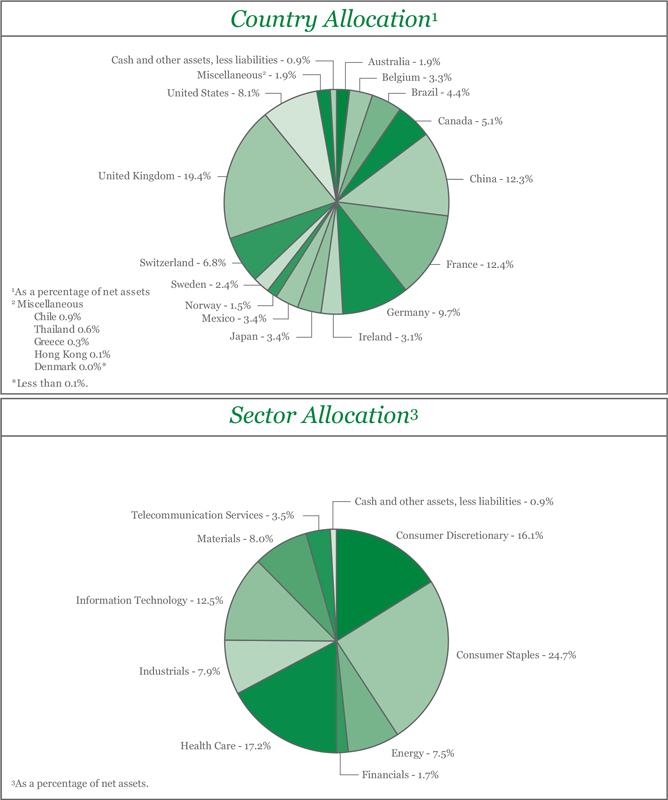
2
World Opportunities Series
Investment Portfolio - June 30, 2015
(unaudited)
| | | | | | | | | | |
| | | |
| | | SHARES | | | VALUE (NOTE 2) | | | |
| | | |
COMMON STOCKS - 99.1% | | | | | | | | | | |
| | | |
Consumer Discretionary - 16.1% | | | | | | | | | | |
Diversified Consumer Services - 2.7% | | | | | | | | | | |
Kroton Educacional S.A. (Brazil) | | | 22,561,051 | | | $ | 86,206,711 | | | |
| | | | | | | | | | |
| | | |
Hotels, Restaurants & Leisure - 2.6% | | | | | | | | | | |
Accor S.A. (France)1 | | | 1,635,440 | | | | 82,770,024 | | | |
| | | | | | | | | | |
| | | |
Internet & Catalog Retail - 0.7% | | | | | | | | | | |
Ocado Group plc (United Kingdom)*1 | | | 3,122,475 | | | | 21,859,336 | | | |
| | | | | | | | | | |
| | | |
Media - 4.0% | | | | | | | | | | |
ITV plc (United Kingdom)1 | | | 12,769,552 | | | | 52,832,887 | | | |
Liberty Global plc - Class A - ADR (United Kingdom)* | | | 1,001,730 | | | | 54,163,541 | | | |
Modern Times Group AB - Class B (Sweden)1 | | | 866,696 | | | | 23,260,586 | | | |
| | | | | | | | | | |
| | | | | | | 130,257,014 | | | |
| | | | | | | | | | |
| | | |
Specialty Retail - 2.2% | | | | | | | | | | |
Kingfisher plc (United Kingdom)1 | | | 12,708,430 | | | | 69,317,612 | | | |
| | | | | | | | | | |
| | | |
Textiles, Apparel & Luxury Goods - 3.9% | | | | | | | | | | |
Adidas AG (Germany)1 | | | 712,900 | | | | 54,547,212 | | | |
lululemon athletica, Inc.* | | | 1,088,120 | | | | 71,054,236 | | | |
| | | | | | | | | | |
| | | | | | | 125,601,448 | | | |
| | | | | | | | | | |
Total Consumer Discretionary | | | | | | | 516,012,145 | | | |
| | | | | | | | | | |
| | | |
Consumer Staples - 24.7% | | | | | | | | | | |
Beverages - 11.3% | | | | | | | | | | |
AMBEV S.A. - ADR (Brazil)* | | | 9,034,936 | | | | 55,113,110 | | | |
Anheuser-Busch InBev N.V. (Belgium)1 | | | 871,290 | | | | 104,851,648 | | | |
Diageo plc (United Kingdom)1 | | | 3,433,680 | | | | 99,438,020 | | | |
Remy Cointreau S.A. (France)1 | | | 261,570 | | | | 18,897,389 | | | |
SABMiller plc (United Kingdom)1 | | | 1,643,050 | | | | 85,192,278 | | | |
| | | | | | | | | | |
| | | | | | | 363,492,445 | | | |
| | | | | | | | | | |
| | | |
Food & Staples Retailing - 4.1% | | | | | | | | | | |
Carrefour S.A. (France)1 | | | 1,666,855 | | | | 53,562,019 | | | |
Tesco plc (United Kingdom)1 | | | 23,558,620 | | | | 78,491,691 | | | |
| | | | | | | | | | |
| | | | | | | 132,053,710 | | | |
| | | | | | | | | | |
| | | |
Food Products - 4.2% | | | | | | | | | | |
Charoen Pokphand Foods PCL (Thailand)1 | | | 25,846,160 | | | | 18,331,707 | | | |
Danone S.A. (France)1 | | | 1,226,380 | | | | 79,438,242 | | | |
Nestle S.A. (Switzerland)1 | | | 497,000 | | | | 35,858,863 | | | |
| | | | | | | | | | |
| | | | | | | 133,628,812 | | | |
| | | | | | | | | | |
| | | |
Personal Products - 2.3% | | | | | | | | | | |
Beiersdorf AG (Germany)1 | | | 419,206 | | | | 35,125,469 | | | |
Unilever plc - ADR (United Kingdom) | | | 858,710 | | | | 36,890,182 | | | |
| | | | | | | | | | |
| | | | | | | 72,015,651 | | | |
| | | | | | | | | | |
The accompanying notes are an integral part of the financial statements.
3
World Opportunities Series
Investment Portfolio - June 30, 2015
(unaudited)
| | | | | | | | | | |
| | | |
| | | SHARES | | | VALUE (NOTE 2) | | | |
| | | |
COMMON STOCKS (continued) | | | | | | | | | | |
| | | |
Consumer Staples (continued) | | | | | | | | | | |
Tobacco - 2.8% | | | | | | | | | | |
Japan Tobacco, Inc. (Japan)1 | | | 1,523,900 | | | $ | 54,173,546 | | | |
Swedish Match AB (Sweden)1 | | | 1,293,571 | | | | 36,777,039 | | | |
| | | | | | | | | | |
| | | |
| | | | | | | 90,950,585 | | | |
| | | | | | | | | | |
| | | |
Total Consumer Staples | | | | | | | 792,141,203 | | | |
| | | | | | | | | | |
Energy - 7.5% | | | | | | | | | | |
Energy Equipment & Services - 3.7% | | | | | | | | | | |
CGG S.A. (France)*1 | | | 1,120,589 | | | | 6,304,855 | | | |
Petroleum Geo-Services ASA (Norway)1 | | | 2,609,615 | | | | 14,038,102 | | | |
Schlumberger Ltd. | | | 1,165,990 | | | | 100,496,678 | | | |
| | | | | | | | | | |
| | | |
| | | | | | | 120,839,635 | | | |
| | | | | | | | | | |
Oil, Gas & Consumable Fuels - 3.8% | | | | | | | | | | |
Cameco Corp. (Canada) | | | 5,102,370 | | | | 72,861,844 | | | |
Encana Corp. (Canada) | | | 2,930,538 | | | | 32,294,529 | | | |
Whitehaven Coal Ltd. (Australia)*1 | | | 15,996,342 | | | | 16,176,750 | | | |
| | | | | | | | | | |
| | | |
| | | | | | | 121,333,123 | | | |
| | | | | | | | | | |
| | | |
Total Energy | | | | | | | 242,172,758 | | | |
| | | | | | | | | | |
Financials - 1.7% | | | | | | | | | | |
Insurance - 1.7% | | | | | | | | | | |
Admiral Group plc (United Kingdom)1 | | | 2,482,060 | | | | 54,084,509 | | | |
| | | | | | | | | | |
Health Care - 17.2% | | | | | | | | | | |
Health Care Equipment & Supplies - 1.8% | | | | | | | | | | |
BioMerieux (France)1 | | | 162,679 | | | | 17,348,549 | | | |
Shandong Weigao Group Medical Polymer Co. Ltd. - Class H (China)1 | | | 56,764,000 | | | | 42,356,274 | | | |
| | | | | | | | | | |
| | | |
| | | | | | | 59,704,823 | | | |
| | | | | | | | | | |
Health Care Providers & Services - 3.7% | | | | | | | | | | |
Fresenius Medical Care AG & Co. KGaA (Germany)1 | | | 1,420,390 | | | | 117,589,079 | | | |
| | | | | | | | | | |
Life Sciences Tools & Services - 1.2% | | | | | | | | | | |
QIAGEN N.V.*1 | | | 1,501,460 | | | | 36,901,060 | | | |
QIAGEN N.V. - ADR* | | | 22,370 | | | | 554,552 | | | |
| | | | | | | | | | |
| | | |
| | | | | | | 37,455,612 | | | |
| | | | | | | | | | |
Pharmaceuticals - 10.5% | | | | | | | | | | |
Novartis AG - ADR (Switzerland) | | | 363,600 | | | | 35,756,424 | | | |
Otsuka Holdings Co. Ltd. (Japan)1 | | | 1,682,629 | | | | 53,613,939 | | | |
Roche Holding AG (Switzerland)1 | | | 301,720 | | | | 84,599,725 | | | |
Sanofi (France)1 | | | 1,116,726 | | | | 110,477,866 | | | |
Shire plc - ADR (Ireland) | | | 220,000 | | | | 53,127,800 | | | |
| | | | | | | | | | |
| | | |
| | | | | | | 337,575,754 | | | |
| | | | | | | | | | |
| | | |
Total Health Care | | | | | | | 552,325,268 | | | |
| | | | | | | | | | |
The accompanying notes are an integral part of the financial statements.
4
World Opportunities Series
Investment Portfolio - June 30, 2015
(unaudited)
| | | | | | | | | | |
| | | |
| | | SHARES | | | VALUE (NOTE 2) | | | |
| | | |
COMMON STOCKS (continued) | | | | | | | | | | |
| | | |
Industrials - 7.9% | | | | | | | | | | |
Airlines - 1.5% | | | | | | | | | | |
Ryanair Holdings plc - ADR (Ireland) | | | 660,646 | | | $ | 47,137,092 | | | |
| | | | | | | | | | |
Commercial Services & Supplies - 2.2% | | | | | | | | | | |
Aggreko plc (United Kingdom)1 | | | 3,083,613 | | | | 69,650,054 | | | |
| | | | | | | | | | |
Electrical Equipment - 0.9% | | | | | | | | | | |
Nexans S.A. (France)1 | | | 741,380 | | | | 27,881,599 | | | |
| | | | | | | | | | |
Machinery - 1.4% | | | | | | | | | | |
SKF AB - Class B (Sweden)1 | | | 794,071 | | | | 18,119,129 | | | |
Sulzer AG (Switzerland)1 | | | 277,300 | | | | 28,523,578 | | | |
| | | | | | | | | | |
| | | | | | | 46,642,707 | | | |
| | | | | | | | | | |
Marine - 0.4% | | | | | | | | | | |
D/S Norden A/S (Denmark)*1 | | | 56,662 | | | | 1,427,316 | | | |
Diana Shipping, Inc. (Greece)* | | | 708,192 | | | | 4,992,754 | | | |
Pacific Basin Shipping Ltd. (Hong Kong)1 | | | 7,437,169 | | | | 2,499,104 | | | |
Star Bulk Carriers Corp. (Greece)* | | | 1,991,284 | | | | 5,854,375 | | | |
| | | | | | | | | | |
| | | | | | | 14,773,549 | | | |
| | | | | | | | | | |
Trading Companies & Distributors - 1.5% | | | | | | | | | | |
Brenntag AG (Germany)1 | | | 833,938 | | | | 47,852,657 | | | |
| | | | | | | | | | |
Total Industrials | | | | | | | 253,937,658 | | | |
| | | | | | | | | | |
Information Technology - 12.5% | | | | | | | | | | |
Internet Software & Services - 10.9% | | | | | | | | | | |
Alibaba Group Holding Ltd. - ADR (China)* | | | 1,187,700 | | | | 97,712,079 | | | |
Baidu, Inc. - ADR (China)* | | | 358,350 | | | | 71,340,318 | | | |
Qihoo 360 Technology Co. Ltd. - ADR (China)* | | | 1,348,740 | | | | 91,296,211 | | | |
Tencent Holdings Ltd. - Class H (China)1 | | | 4,547,695 | | | | 90,938,133 | | | |
| | | | | | | | | | |
| | | | | | | 351,286,741 | | | |
| | | | | | | | | | |
IT Services - 1.6% | | | | | | | | | | |
Amdocs Ltd. - ADR | | | 950,614 | | | | 51,894,018 | | | |
| | | | | | | | | | |
Total Information Technology | | | | | | | 403,180,759 | | | |
| | | | | | | | | | |
Materials - 8.0% | | | | | | | | | | |
Chemicals - 2.0% | | | | | | | | | | |
Potash Corp. of Saskatchewan, Inc. (Canada) | | | 630,620 | | | | 19,530,301 | | | |
Sociedad Quimica y Minera de Chile S.A. - ADR (Chile) | | | 1,707,778 | | | | 27,358,604 | | | |
Syngenta AG (Switzerland)1 | | | 41,930 | | | | 17,108,359 | | | |
| | | | | | | | | | |
| | | | | | | 63,997,264 | | | |
| | | | | | | | | | |
Construction Materials - 0.6% | | | | | | | | | | |
Holcim Ltd. (Switzerland)1 | | | 242,930 | | | | 17,924,724 | | | |
| | | | | | | | | | |
Metals & Mining - 5.4% | | | | | | | | | | |
Alumina Ltd. (Australia)1 | | | 25,893,506 | | | | 30,479,321 | | | |
The accompanying notes are an integral part of the financial statements.
5
World Opportunities Series
Investment Portfolio - June 30, 2015
(unaudited)
| | | | | | | | | | |
| | | |
| | | SHARES | | | VALUE (NOTE 2) | | | |
| | | |
COMMON STOCKS (continued) | | | | | | | | | | |
| | | |
Materials (continued) | | | | | | | | | | |
Metals & Mining (continued) | | | | | | | | | | |
Iluka Resources Ltd. (Australia)1 | | | 2,264,215 | | | $ | 13,389,911 | | | |
Norsk Hydro ASA (Norway)1 | | | 8,179,946 | | | | 34,330,667 | | | |
Teck Resources Ltd. - Class B (Canada) | | | 4,092,550 | | | | 40,557,172 | | | |
ThyssenKrupp AG (Germany)1 | | | 2,131,300 | | | | 55,444,682 | | | |
| | | | | | | | | | |
| | | | | | | 174,201,753 | | | |
| | | | | | | | | | |
Total Materials | | | | | | | 256,123,741 | | | |
| | | | | | | | | | |
| | | |
Telecommunication Services - 3.5% | | | | | | | | | | |
Wireless Telecommunication Services - 3.5% | | | | | | | | | | |
America Movil S.A.B. de C.V. - Class L - ADR (Mexico) | | | 5,220,915 | | | | 111,257,699 | | | |
| | | | | | | | | | |
TOTAL COMMON STOCKS | | | | | | | | | | |
(Identified Cost $3,219,728,015) | | | | | | | 3,181,235,740 | | | |
| | | | | | �� | | | | |
| | | |
TOTAL INVESTMENTS - 99.1% | | | | | | | | | | |
(Identified Cost $3,219,728,015) | | | | | | | 3,181,235,740 | | | |
OTHER ASSETS, LESS LIABILITIES - 0.9% | | | | | | | 27,314,165 | | | |
| | | | | | | | | | |
NET ASSETS - 100% | | | | | | $ | 3,208,549,905 | | | |
| | | | | | | | | | |
KEY:
ADR - American Depositary Receipt
*Non-income producing security.
1A factor from a third party vendor was applied to determine the security’s fair value following the close of local trading.
The Series’ portfolio holds, as a percentage of net assets, greater than 10% in the following countries: United Kingdom - 19.4%; France - 12.4%; China - 12.3%.
The Global Industry Classification Standard (GICS) was developed by and is the exclusive property and a service mark of MSCI Inc. (MSCI) and Standard & Poor’s, a division of The McGraw-Hill Companies, Inc. (S&P), and is licensed for use by Manning & Napier when referencing GICS sectors. Neither MSCI, S&P, nor any third party involved in making or compiling the GICS or any GICS classifications makes any express or implied warranties or representations with respect to such standard or classification, nor shall any such party have any liability therefrom.
The accompanying notes are an integral part of the financial statements.
6
World Opportunities Series
Statement of Assets and Liabilities
June 30, 2015 (unaudited)
| | | | |
ASSETS: | | | | |
| |
Investments (identified cost $3,219,728,015) | | $ | 3,181,235,740 | |
Foreign currency (identified cost $316) | | | 316 | |
Cash | | | 2,755,162 | |
Receivable for securities sold | | | 31,883,015 | |
Foreign tax reclaims receivable | | | 9,651,873 | |
Dividends receivable | | | 4,377,228 | |
Receivable for fund shares sold | | | 3,845,183 | |
Prepaid expenses | | | 1,984 | |
| | | | |
| |
TOTAL ASSETS | | | 3,233,750,501 | |
| | | | |
| |
LIABILITIES: | | | | |
| |
Accrued management fees (Note 3) | | | 3,147,197 | |
Accrued transfer agent fees (Note 3) | | | 348,310 | |
Accrued fund accounting and administration fees (Note 3) | | | 125,992 | |
Accrued directors’ fees (Note 3) | | | 40,818 | |
Accrued Chief Compliance Officer service fees (Note 3) | | | 382 | |
Payable for fund shares repurchased | | | 17,468,003 | |
Payable for securities purchased | | | 2,385,150 | |
Other payables and accrued expenses | | | 1,684,744 | |
| | | | |
| |
TOTAL LIABILITIES | | | 25,200,596 | |
| | | | |
| |
TOTAL NET ASSETS | | $ | 3,208,549,905 | |
| | | | |
| |
NET ASSETS CONSIST OF: | | | | |
| |
Capital stock | | $ | 4,230,246 | |
Additional paid-in-capital | | | 3,545,365,705 | |
Undistributed net investment income | | | 24,600,594 | |
Accumulated net realized loss on investments, foreign currency and translation of other assets and liabilities | | | (326,246,511 | ) |
Net unrealized depreciation on investments, foreign currency and translation of other assets and liabilities | | | (39,400,129 | ) |
| | | | |
| |
TOTAL NET ASSETS | | $ | 3,208,549,905 | |
| | | | |
| |
NET ASSET VALUE, OFFERING PRICE AND REDEMPTION PRICE PER SHARE - Class A ($3,208,549,905/423,024,574 shares) | | $ | 7.58 | |
| | | | |
The accompanying notes are an integral part of the financial statements.
7
World Opportunities Series
Statement of Operations
For the Six Months Ended June 30, 2015 (unaudited)
| | | | |
INVESTMENT INCOME: | | | | |
| |
Dividends (net of foreign taxes withheld, $5,578,344) (Note 2) | | $ | 51,209,092 | |
| | | | |
| |
EXPENSES: | | | | |
| |
Management fees (Note 3) | | | 21,477,982 | |
Transfer agent fees (Note 3) | | | 522,592 | |
Fund accounting and administration fees (Note 3) | | | 190,268 | |
Directors’ fees (Note 3) | | | 108,313 | |
Chief Compliance Officer service fees (Note 3) | | | 1,224 | |
Custodian fees | | | 756,288 | |
Miscellaneous | | | 634,403 | |
| | | | |
| |
Total Expenses | | | 23,691,070 | |
| | | | |
| |
NET INVESTMENT INCOME | | | 27,518,022 | |
| | | | |
| |
REALIZED AND UNREALIZED GAIN (LOSS) ON INVESTMENTS AND FOREIGN CURRENCY: | | | | |
| |
Net realized gain (loss) on- | | | | |
Investments (net of foreign capital gains tax, $5,578,345), (Note 2) | | | (157,633,201 | ) |
Foreign currency and translation of other assets and liabilities | | | 4,287,063 | |
| | | | |
| |
| | | (153,346,138 | ) |
| | | | |
| |
Net change in unrealized appreciation (depreciation) on- | | | | |
Investments | | | 284,750,870 | |
Foreign currency and translation of other assets and liabilities | | | (69,375 | ) |
| | | | |
| |
| | | 284,681,495 | |
| |
NET REALIZED AND UNREALIZED GAIN (LOSS) ON INVESTMENTS AND FOREIGN CURRENCY | | | 131,335,357 | |
| | | | |
| |
NET INCREASE IN NET ASSETS RESULTING FROM OPERATIONS | | $ | 158,853,379 | |
| | | | |
The accompanying notes are an integral part of the financial statements.
8
World Opportunities Series
Statements of Changes in Net Assets
| | | | | | | | | | | | |
| | | | | FOR THE SIX
MONTHS ENDED
6/30/15
(UNAUDITED) | | | | | FOR THE
YEAR ENDED
12/31/14 | |
INCREASE (DECREASE) IN NET ASSETS: | | | | | | | | | | | | |
| | | | |
OPERATIONS: | | | | | | | | | | | | |
| | | | |
Net investment income | | | | $ | 27,518,022 | | | | | $ | 88,301,678 | |
Net realized gain (loss) on investments and foreign currency | | | | | (153,346,138 | ) | | | | | 315,261,349 | |
Net change in unrealized appreciation (depreciation) on investments and foreign currency | | | | | 284,681,495 | | | | | | (1,121,031,627 | ) |
| | | | | | | | | | | | |
| | | | |
Net increase (decrease) from operations | | | | | 158,853,379 | | | | | | (717,468,600 | ) |
| | | | | | | | | | | | |
| | | | |
DISTRIBUTIONS TO SHAREHOLDERS (Note 9): | | | | | | | | | | | | |
| | | | |
From net investment income | | | | | — | | | | | | (72,063,094 | ) |
From net realized gain on investments | | | | | — | | | | | | (529,776,133 | ) |
| | | | | | | | | | | | |
| | | | |
Total distributions to shareholders | | | | | — | | | | | | (601,839,227 | ) |
| | | | | | | | | | | | |
| | | | |
CAPITAL STOCK ISSUED AND REPURCHASED: | | | | | | | | | | | | |
| | | | |
Net decrease from capital share transactions (Note 5) | | | | | (2,394,495,357 | ) | | | | | (1,161,377,106 | ) |
| | | | | | | | | | | | |
| | | | |
Net decrease in net assets | | | | | (2,235,641,978 | ) | | | | | (2,480,684,933 | ) |
| | | | |
NET ASSETS: | | | | | | | | | �� | | | |
| | | | |
Beginning of period | | | | | 5,444,191,883 | | | | | | 7,924,876,816 | |
| | | | | | | | | | | | |
| | | | |
End of period (including distributions in excess of net investment income of $24,600,594 and $(2,917,428), respectively) | | | | $ | 3,208,549,905 | | | | | $ | 5,444,191,883 | |
| | | | | | | | | | | | |
The accompanying notes are an integral part of the financial statements.
9
World Opportunities Series
Financial Highlights
| | | | | | | | | | | | | | | | | | | | | | | | | | | | | | |
| | | FOR THE SIX MONTHS ENDED | | FOR THE YEARS ENDED |
| | | 6/30/15 (UNAUDITED) | | 12/31/14 | | 12/31/13 | | 12/31/12 | | 12/31/11 | | 12/31/10 |
Per share data (for a share outstanding throughout each period): | | | | | | | | | | | | | | | | | | | | | | | | | | | | | | |
| | | | | | |
Net asset value - Beginning of period | | | | $7.33 | | | | | $9.05 | | | | | $7.75 | | | | | $6.63 | | | | | $8.61 | | | | | $8.12 | |
| | | | | | | | | | | | | | | | | | | | | | | | | | | | | | |
| | | | | | |
Income (loss) from investment operations: | | | | | | | | | | | | | | | | | | | | | | | | | | | | | | |
Net investment income1 | | | | 0.05 | | | | | 0.10 | | | | | 0.10 | | | | | 0.12 | | | | | 0.24 | 2 | | | | 0.07 | |
Net realized and unrealized gain (loss) on investments | | | | 0.20 | | | | | (1.01 | ) | | | | 1.35 | | | | | 1.13 | | | | | (1.64 | ) | | | | 0.67 | |
| | | | | | | | | | | | | | | | | | | | | | | | | | | | | | |
| | | | | | |
Total from investment operations | | | | 0.25 | | | | | (0.91 | ) | | | | 1.45 | | | | | 1.25 | | | | | (1.40 | ) | | | | 0.74 | |
| | | | | | | | | | | | | | | | | | | | | | | | | | | | | | |
| | | | | | |
Less distributions to shareholders: | | | | | | | | | | | | | | | | | | | | | | | | | | | | | | |
From net investment income | | | | — | | | | | (0.10 | ) | | | | (0.10 | ) | | | | (0.13 | ) | | | | (0.24 | ) | | | | (0.07 | ) |
From net realized gain on investments | | | | — | | | | | (0.71 | ) | | | | (0.05 | ) | | | | — | | | | | (0.34 | ) | | | | (0.18 | ) |
| | | | | | | | | | | | | | | | | | | | | | | | | | | | | | |
| | | | | | |
Total distributions to shareholders | | | | — | | | | | (0.81 | ) | | | | (0.15 | ) | | | | (0.13 | ) | | | | (0.58 | ) | | | | (0.25 | ) |
| | | | | | | | | | | | | | | | | | | | | | | | | | | | | | |
| | | | | | |
Net asset value - End of period | | | | $7.58 | | | | | $7.33 | | | | | $9.05 | | | | | $7.75 | | | | | $6.63 | | | | | $8.61 | |
| | | | | | | | | | | | | | | | | | | | | | | | | | | | | | |
| | | | | | |
Net assets - End of period (000’s omitted) | | | $ | 3,208,550 | | | | $ | 5,444,192 | | | | $ | 7,924,877 | | | | $ | 6,925,778 | | | | $ | 5,967,029 | | | | $ | 6,455,426 | |
| | | | | | | | | | | | | | | | | | | | | | | | | | | | | | |
| | | | | | |
Total return3 | | | | 3.41% | | | | | (9.77% | ) | | | | 18.79% | | | | | 18.81% | | | | | (16.14% | )2 | | | | 9.23% | |
Ratios (to average net assets)/Supplemental Data: | | | | | | | | | | | | | | | | | | | | | | | | | | | | | | |
Expenses* | | | | 1.10% | 4 | | | | 1.07% | | | | | 1.07% | | | | | 1.08% | | | | | 1.09% | | | | | 1.11% | |
Net investment income | | | | 1.28% | 4 | | | | 1.16% | | | | | 1.17% | | | | | 1.64% | | | | | 2.84% | 2 | | | | 0.92% | |
Portfolio turnover | | | | 37% | | | | | 43% | | | | | 46% | | | | | 45% | | | | | 52% | | | | | 39% | |
*For certain periods presented, the investment advisor did not impose all or a portion of its management and/or other fees, and in some periods may have paid a portion of the Series’ expenses. If these expenses had been incurred by the Series, the expense ratio (to average net assets) would have increased by the following amounts:
| | | | | | | | | | | | | | | | | | | | | | | | |
| | | N/A | | | | N/A | | | | N/A | | | | N/A | | | | N/A | | | | 0.00% | 5 |
1Calculated based on average shares outstanding during the periods.
2Includes a special dividend paid by one of the Series’ securities during the year. Without the special dividend, the Series’ net investment income per share, total return and net investment income ratio would have been $0.11, (17.71%) and 1.30%, respectively.
3Represents aggregate total return for the periods indicated, and assumes reinvestment of all distributions. Total return would have been lower had certain expenses not been waived or reimbursed during certain periods. Periods less than one year are not annualized.
4Annualized.
5Less than 0.01%.
The accompanying notes are an integral part of the financial statements.
10
World Opportunities Series
Notes to Financial Statements
(unaudited)
World Opportunities Series (the “Series”) is a no-load diversified series of Manning & Napier Fund, Inc. (the “Fund”). The Fund is organized in Maryland and is registered under the Investment Company Act of 1940 (the “1940 Act”), as amended, as an open-end management investment company.
The Series’ investment objective is to provide long-term growth by investing principally in the common stocks of companies located around the world.
The Fund’s advisor is Manning & Napier Advisors, LLC (the “Advisor”). Shares of the Series are offered to investors, clients and employees of the Advisor and its affiliates. The total authorized capital stock of the Fund consists of 15 billion shares of common stock each having a par value of $0.01. As of June 30, 2015, 10.6 billion shares have been designated in total among 41 series, of which 2.5 billion have been designated as World Opportunities Series Class A common stock.
| 2. | Significant Accounting Policies |
The following is a summary of significant accounting policies followed by the Series. The Series is an investment company and, accordingly, follows the investment company accounting and reporting guidance of the Financial Accounting Standards Board Accounting Standards Codification Topic 946 - Investment Companies, which is part of accounting principles generally accepted in the United States of America (“GAAP”).
Security Valuation
Portfolio securities, including domestic equities, foreign equities, warrants and options, listed on an exchange other than the NASDAQ Stock Market are valued at the latest quoted sales price of the exchange on which the security is primarily traded. Securities not traded on valuation date or securities not listed on an exchange are valued at the latest quoted bid price provided by the Fund’s pricing service. Securities listed on the NASDAQ Stock Market are valued in accordance with the NASDAQ Official Closing Price.
Short-term investments that mature in sixty days or less are valued at amortized cost, which approximates fair value. Investments in open-end investment companies are valued at their net asset value per share on valuation date.
Volume and level of activity in established markets for an asset or liability are evaluated to determine whether recent transactions and quoted prices are determinative of fair value. Where there have been significant decreases in volume and level of activity, further analysis and adjustment may be necessary to estimate fair value. The Series measures fair value in these instances by the use of inputs and valuation techniques which may be based upon current market prices of securities that are comparable in coupon, rating, maturity and industry and/or expectation of future cash flows. As a result of trading in relatively thin markets and/or markets that experience significant volatility, the prices used by the Series to value these securities may differ from the value that would be realized if these securities were sold, and the differences could be material.
Securities for which representative valuations or prices are not available from the Series’ pricing service may be valued at fair value as determined in good faith by the Advisor under procedures approved by and under the general supervision and responsibility of the Fund’s Board of Directors (the “Board”). Due to the inherent uncertainty of valuations of such securities, the fair value may differ significantly from the values that would have been used had a ready market for such securities existed. If trading or events occurring after the close of the principal market in which securities are traded are expected to materially affect the value of those securities, then they may be valued at their fair value, taking this trading or these events into account. In accordance with the procedures approved by the Board, the values of certain securities trading outside the U.S. were adjusted following the close of local trading using a factor from a third party vendor. The third party vendor uses statistical analyses and quantitative models, which consider among other things subsequent movement and changes in the prices of indices, securities and exchange rates in other markets, to determine the factors which are used to adjust local market prices. The value of securities used for net asset value calculation under these procedures may differ from published prices for the same securities. It is the Fund’s policy to classify each foreign equity security where a factor from a third party vendor is provided as a Level 2 security.
11
World Opportunities Series
Notes to Financial Statements (continued)
(unaudited)
| 2. | Significant Accounting Policies (continued) |
Security Valuation (continued)
Various inputs are used in determining the value of the Series’ assets or liabilities carried at fair value. These inputs are summarized in three broad levels. Level 1 includes quoted prices in active markets for identical assets and liabilities. Level 2 includes other significant observable inputs (including quoted prices for similar securities, interest rates, prepayment speeds, credit risk, etc.). Level 3 includes significant unobservable inputs (including the Series’ own assumptions in determining the fair value of investments). A financial instrument’s level within the fair value hierarchy is based on the lowest level of any input both individually and in aggregate that is significant to the fair value measurement. The inputs or methodology used for valuing securities are not necessarily an indication of the risk associated with investing in those securities.
The following is a summary of the valuation levels used for major security types as of June 30, 2015 in valuing the Series’ assets or liabilities carried at fair value:
| | | | | | | | | | | | | | | | |
| DESCRIPTION | | TOTAL | | | LEVEL 1 | | | LEVEL 2 | | | LEVEL 3 | |
Assets: | | | | | | | | | | | | | | | | |
Equity securities: | | | | | | | | | | | | | | | | |
Consumer Discretionary | | $ | 516,012,145 | | | $ | 211,424,488 | | | $ | 304,587,657 | | | $ | — | |
Consumer Staples | | | 792,141,203 | | | | 92,003,292 | | | | 700,137,911 | | | | — | |
Energy | | | 242,172,758 | | | | 205,653,051 | | | | 36,519,707 | | | | — | |
Financials | | | 54,084,509 | | | | — | | | | 54,084,509 | | | | — | |
Health Care | | | 552,325,268 | | | | 89,438,776 | | | | 462,886,492 | | | | — | |
Industrials | | | 253,937,658 | | | | 57,984,221 | | | | 195,953,437 | | | | — | |
Information Technology | | | 403,180,759 | | | | 312,242,626 | | | | 90,938,133 | | | | — | |
Materials | | | 256,123,741 | | | | 87,446,077 | | | | 168,677,664 | | | | — | |
Telecommunication Services | | | 111,257,699 | | | | 111,257,699 | | | | — | | | | — | |
| | | | | | | | | | | | | | | | |
Total assets | | $ | 3,181,235,740 | | | $ | 1,167,450,230 | | | $ | 2,013,785,510 | | | $ | — | |
| | | | | | | | | | | | | | | | |
Please see the Investment Portfolio for foreign securities where a factor from a third party vendor was applied to determine the securities’ fair value following the close of local trading. Such securities are included in Level 2 in the table above.
There were no Level 3 securities held by the Series as of December 31, 2014 or June 30, 2015.
The Fund’s policy is to recognize transfers in and transfers out of the valuation levels as of the beginning of the reporting period. There were no transfers between Level 1 and Level 2 during the six months ended June 30, 2015.
Security Transactions, Investment Income and Expenses
Security transactions are accounted for on trade date. Dividend income is recorded on the ex-dividend date, except that if the ex-dividend date has passed, certain dividends from foreign securities are recorded as soon as the Series is informed of the ex-dividend date. Non-cash dividends, if any, are recorded at the fair value of the securities received. Interest income, including amortization of premium and accretion of discounts using the effective interest method, is earned from settlement date and accrued daily.
Expenses are recorded on an accrual basis. Most expenses of the Fund can be attributed to a specific series. Expenses which cannot be directly attributed are apportioned among the series in the Fund in such a manner as deemed equitable by the Fund’s Board, taking into consideration, among other things, the nature and type of expense.
The Series uses the identified cost method for determining realized gain or loss on investments for both financial statement and federal income tax reporting purposes.
Foreign Currency Translation
The books and records of the Series are maintained in U.S. dollars. Foreign currencies, investments and other assets and liabilities are translated into U.S. dollars at the current exchange rates. Purchases and sales of investment securities and income and expenses are translated on the respective dates of such transactions. The Series does not isolate realized and
12
World Opportunities Series
Notes to Financial Statements (continued)
(unaudited)
| 2. | Significant Accounting Policies (continued) |
Foreign Currency Translation (continued)
unrealized gains and losses attributable to changes in the exchange rates from gains and losses that arise from changes in the fair value of investments. Such fluctuations are included with net realized and unrealized gain or loss on investments. Net realized foreign currency gains and losses represent foreign currency gains and losses between trade date and settlement date on securities transactions, gains and losses on disposition of foreign currencies and the difference between the amount of income and foreign withholding taxes recorded on the books of the Series and the amounts actually received or paid.
Federal Taxes
The Series’ policy is to comply with the provisions of the Internal Revenue Code applicable to regulated investment companies. The Series is not subject to federal income tax or excise tax to the extent that the Series distributes to shareholders each year its taxable income, including any net realized gains on investments, in accordance with requirements of the Internal Revenue Code. Accordingly, no provision for federal income tax or excise tax has been made in the financial statements.
Management evaluates its tax positions to determine if the tax positions taken meet the minimum recognition threshold in connection with accounting for uncertainties in income tax positions taken or expected to be taken for the purposes of measuring and recognizing tax liabilities in the financial statements. Recognition of tax benefits of an uncertain tax position is required only when the position is “more likely than not” to be sustained assuming examination by taxing authorities. At June 30, 2015, the Series has recorded no liability for net unrecognized tax benefits relating to uncertain income tax positions taken or expected to be taken in future tax returns.
The Series files income tax returns in the U.S. federal jurisdiction, various states and foreign jurisdictions, as required. No income tax returns are currently under investigation. The statute of limitations on the Series’ tax returns remains open for the years ended December 31, 2011 through December 31, 2014. The Series is not aware of any tax positions for which it is reasonably possible that the total amounts of unrecognized tax benefits will significantly change in the next twelve months.
Foreign Taxes
Based on the Series’ understanding of the tax rules and rates related to income, gains and currency purchase/repatriation transactions for foreign jurisdictions in which it invests, the Series will provide for foreign taxes, and where appropriate, deferred foreign tax.
Distributions of Income and Gains
Distributions to shareholders of net investment income and net realized gains are made annually. An additional distribution may be necessary to avoid taxation of the Series. Distributions are recorded on the ex-dividend date.
Indemnifications
The Fund’s organizational documents provide former and current directors and officers with a limited indemnification against liabilities arising in connection with the performance of their duties to the Fund. In the normal course of business, the Fund may also enter into contracts that provide general indemnifications. The Fund’s maximum exposure under these arrangements is unknown as this would be dependent on future claims that may be made against the Fund. The risk of material loss from such claims is considered remote.
Other
The preparation of financial statements in conformity with GAAP requires management to make estimates and assumptions that affect the reported amounts of assets and liabilities and the disclosure of contingent assets and liabilities at the date of the financial statements and the reported amounts of income and expenses during the reporting period. Actual results could differ from those estimates.
| 3. | Transactions with Affiliates |
The Fund has an Investment Advisory Agreement (the “Agreement”) with the Advisor, for which the Series pays a fee, computed daily and payable monthly, at an annual rate of 1.00% of the Series’ average daily net assets.
13
World Opportunities Series
Notes to Financial Statements (continued)
(unaudited)
| 3. | Transactions with Affiliates (continued) |
Under the Agreement, personnel of the Advisor provide the Series with advice and assistance in the choice of investments and the execution of securities transactions, and otherwise maintain the Series’ organization. The Advisor also provides the Fund with necessary office space and fund administration and support services. The salaries of all officers of the Fund (except a percentage of the Fund’s Chief Compliance Officer’s salary, which is paid by the Fund), and of all Directors who are “affiliated persons” of the Fund, or of the Advisor, and all personnel of the Fund, or of the Advisor, performing services relating to research, statistical and investment activities, are paid by the Advisor. Each “non-affiliated” Director receives an annual stipend, which is allocated among all the active series of the Fund. In addition, these Directors also receive a fee per Board meeting attended plus a fee for each committee meeting attended and are reimbursed for travel and other out-of-pocket expenses incurred by them in connection with attending such meetings. The Fund also has an Audit Committee Chair, who receives an additional annual stipend for this role.
Manning & Napier Investor Services, Inc., a registered broker-dealer affiliate of the Advisor, acts as distributor for the Fund’s shares. The services of Manning & Napier Investor Services, Inc. are provided at no additional cost to the Series.
The Advisor did not waive any fees for the six months ended June 30, 2015. The Advisor is not eligible to recoup any expenses that have been waived or reimbursed in prior years.
Pursuant to a master services agreement dated November 1, 2014, the Fund pays the Advisor an annual fee related to fund accounting and administration of 0.0085% on the first $25 billion of average daily net assets (excluding Target Series and Strategic Income Series); 0.0075% on the next $15 billion of average daily net assets (excluding Target Series and Strategic Income Series); and 0.0065% of the average daily net assets in excess of $40 billion (excluding Target Series and Strategic Income Series); plus a base fee of $30,400 per series. Transfer agent fees are charged to the Fund on a per account basis. Additionally, certain transaction and out-of-pocket expenses, including charges for reporting relating to the Fund’s compliance program, are charged. The Advisor has agreements with BNY Mellon Investment Servicing (U.S.) Inc. (“BNY”) under which BNY serves as sub-accountant services agent and sub-transfer agent.
Expenses not directly attributable to a series are allocated based on each series’ relative net assets or number of accounts, depending on the expense.
| 4. | Purchases and Sales of Securities |
For the six months ended June 30, 2015, purchases and sales of securities, other than U.S. Government securities and short-term securities, were $1,556,645,824 and $3,804,023,091, respectively. There were no purchases or sales of U.S. Government securities.
| 5. | Capital Stock Transactions |
Transactions in Class A shares of World Opportunities Series were:
| | | | | | | | | | | | | | | | |
| | | FOR THE SIX MONTHS ENDED 6/30/15 | | | FOR THE YEAR ENDED 12/31/14 | |
| | | SHARES | | | AMOUNT | | | SHARES | | | AMOUNT | |
Sold | | | 47,927,972 | | | $ | 363,179,090 | | | | 152,753,313 | | | $ | 1,333,900,544 | |
Reinvested | | | — | | | | — | | | | 61,467,184 | | | | 444,829,184 | |
Repurchased | | | (367,402,815 | ) | | | (2,757,674,447 | ) | | | (347,523,122 | ) | | | (2,940,106,834 | ) |
| | | | | | | | | | | | | | | | |
| | | | |
Total | | | (319,474,843 | ) | | $ | (2,394,495,357 | ) | | | (133,302,625 | ) | | $ | (1,161,377,106 | ) |
| | | | | | | | | | | | | | | | |
Approximately 4% of the shares outstanding are fiduciary accounts where the Advisor has sole investment discretion.
14
World Opportunities Series
Notes to Financial Statements (continued)
(unaudited)
The Series has entered into a $50 million credit facility (the “line of credit”) with Bank of New York Mellon. The Series may borrow under the line of credit for temporary or emergency purposes, including funding shareholder redemptions and other short-term liquidity purposes. The Series pays an annual commitment fee on the unused portion of the line of credit which amounted to $11,553 for the six months ended June 30, 2015, which is included in miscellaneous expenses in the Statement of Operations. Interest on the used portion is charged to the Series based on rates determined pursuant to the terms of the agreement at the time of borrowing. During the six months ended June 30, 2015, the Series did not borrow under the line of credit. The line of credit expired on June 5, 2015 and was not renewed.
The Series may trade in instruments including written and purchased options, forward foreign currency exchange contracts and futures contracts and other derivatives in the normal course of investing activities to assist in managing exposure to various market risks. The Series may be subject to various elements of risk, which may involve, to a varying degree, elements of risk in excess of the amounts recognized for financial statement purposes. These risks include: the risk that changes in the value of a derivative may not correlate perfectly with the underlying asset, rate or index; counterparty credit risk related to over the counter derivative counterparties’ failure to perform under contract terms; liquidity risk related to the lack of a liquid market for these contracts allowing the fund to close out its position(s); and documentation risk relating to disagreement over contract terms. No such investments were held by the Series on June 30, 2015.
Investing in securities of foreign companies and foreign governments involves special risks and considerations not typically associated with investing in securities of domestic companies and the U.S. Government. These risks include revaluation of currencies and future adverse political and economic developments. Moreover, securities of foreign companies and foreign governments and their markets may be less liquid and their prices more volatile than those of comparable domestic companies and the U.S. Government.
| 9. | Federal Income Tax Information |
The amount and characterization of certain income and capital gains to be distributed are determined in accordance with federal income tax regulations, which may differ from GAAP. The Series may periodically make reclassifications among its capital accounts to reflect income and gains available for distribution (or available capital loss carryovers) under income tax regulations without impacting the Series’ net asset value. Any such reclassifications are not reflected in the financial highlights.
The final determination of the tax character of current year distributions will be made at the conclusion of the fiscal year. The tax character of distributions paid for the year ended December 31, 2014, were as follows:
| | | | | | |
Ordinary income | | $ | 147,867,959 | | | |
Long-term capital gains | | | 453,971,268 | | | |
At June 30, 2015, the identified cost for federal income tax purposes, the resulting gross unrealized appreciation and depreciation, and the net unrealized depreciation were as follows:
| | | | | | | | |
Cost for federal income tax purposes | | $ | 3,283,081,533 | | | | | |
Unrealized appreciation | | | 223,882,872 | | | | | |
Unrealized depreciation | | | (325,728,665 | ) | | | | |
| | | | | | | | |
Net unrealized depreciation | | $ | (101,845,793 | ) | | | | |
| | | | | | | | |
15
{This page intentionally left blank}
16
{This page intentionally left blank}
17
World Opportunities Series
Literature Requests
(unaudited)
Proxy Voting Policies and Procedures
A description of the policies and procedures that the Fund uses to determine how to vote proxies relating to portfolio securities is available, without charge, upon request:
| | | | |
| By phone | | 1-800-466-3863 | | |
| On the Securities and Exchange | | | | |
| Commission’s (SEC) web site | | http://www.sec.gov | | |
Proxy Voting Record
Information regarding how the Fund voted proxies relating to portfolio securities during the most recent 12-month period ended June 30th is available, without charge, upon request:
| | | | |
| By phone | | 1-800-466-3863 | | |
| On the SEC’s web site | | http://www.sec.gov | | |
Quarterly Portfolio Holdings
The Series’ complete schedule of portfolio holdings for the 1st and 3rd quarters of each fiscal year are provided on Form N-Q, and are available, without charge, upon request:
| | | | |
| By phone | | 1-800-466-3863 | | |
| On the SEC’s web site | | http://www.sec.gov | | |
The Series’ Form N-Q may be reviewed and copied at the SEC’s Public Reference Room in Washington, D.C. Information on the operation of the Public Reference Room may be obtained by calling 1-800-SEC-0330.
Prospectus and Statement of Additional Information (SAI)
For more information about any of the Manning & Napier Fund, Inc. Series, you may obtain a prospectus and SAI at www.manning-napier.com or by calling (800) 466-3863. Before investing, carefully consider the objectives, risks, charges and expenses of the investment and read the prospectus carefully as it contains this and other information about the investment company. In addition, this information can be found on the SEC’s web site, http://www.sec.gov.
Additional information available at www.manning-napier.com
1. Fund Holdings - Month-End
2. Fund Holdings - Quarter-End
3. Shareholder Report - Annual
4. Shareholder Report - Semi-Annual
The Fund also offers electronic notification or “e-delivery” when certain documents are available on-line to be downloaded or reviewed. Direct shareholders can elect to receive electronic notification when shareholder reports, prospectus updates, and/or statements are available. If you do not currently have on-line access to your account, you can establish access by going to www.manning-napier.com, click on “Login” in the top corner of the page, and follow the prompts to self-enroll. Once enrolled, you can set your electronic notification preferences by clicking on the Account Options tab located within the green toolbar and then select E-Delivery Option. Should you have any questions on either how to establish on-line access or how to update your account settings, please contact Investor Services at 1-800-466-3863.
The Manning & Napier Fund, Inc. is managed by Manning & Napier Advisors, LLC. Manning & Napier Investor Services, Inc., an affiliate of Manning & Napier Advisors, LLC, is the distributor of the Fund shares.
MNWOP-6/15-SAR

Ohio Tax Exempt Series
Shareholder Expense Example
(unaudited)
As a shareholder of the Series, you may incur two types of costs: (1) transaction costs and (2) ongoing costs, including management fees and other Series expenses. This example is intended to help you understand your ongoing costs (in dollars) of investing in the Series and to compare these costs with the ongoing costs of investing in other mutual funds.
The example is based on an investment of $1,000 invested at the beginning of the period and held for the entire period (January 1, 2015 to June 30, 2015).
Actual Expenses
The first line of the table below provides information about actual account values and actual expenses. You may use the information in this line, together with the amount you invested, to estimate the expenses that you paid over the period. Simply divide your account value by $1,000 (for example, an $8,600 account value divided by $1,000 = 8.6), then multiply the result by the number in the first line under the heading entitled “Expenses Paid During Period” to estimate the expenses you paid on your account during this period.
Hypothetical Example for Comparison Purposes
The second line of the table below provides information about hypothetical account values and hypothetical expenses based on the Series’ actual expense ratio and an assumed rate of return of 5% per year before expenses, which is not the Series’ actual return. The hypothetical account values and expenses may not be used to estimate the actual ending account balance or expenses you paid during the period. You may use this information to compare the ongoing costs of investing in the Series and other funds. To do so, compare this 5% hypothetical example with the 5% hypothetical examples that appear in the shareholder reports of the other funds.
Please note that the expenses shown in the table are meant to highlight your ongoing costs only and do not reflect any transaction costs. Therefore, the second line of the table is useful in comparing ongoing costs only, and will not help you determine the relative total costs of owning different funds. In addition, if these transaction costs were included, your costs would have been higher.
| | | | | | |
| | | BEGINNING
ACCOUNT VALUE
1/1/15 | | ENDING
ACCOUNT VALUE
6/30/15 | | EXPENSES PAID
DURING PERIOD*
1/1/15-6/30/15 |
Actual | | $1,000.00 | | $1,000.90 | | $3.67 |
| |
Hypothetical (5% return before expenses) | | $1,000.00 | | $1,021.12 | | $3.71 |
| |
*Expenses are equal to the Series’ annualized expense ratio (for the six-month period) of 0.74%, multiplied by the average account value over the period, multiplied by 181/365 (to reflect the one-half year period). Expenses are based on the most recent fiscal half year.
1
Ohio Tax Exempt Series
Portfolio Composition as of June 30, 2015
(unaudited)
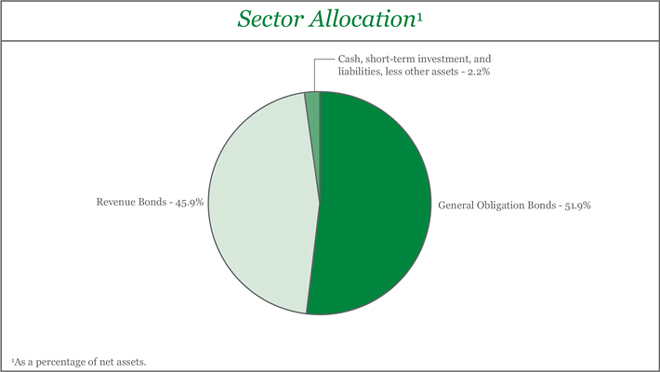
2
Ohio Tax Exempt Series
Investment Portfolio - June 30, 2015
(unaudited)
| | | | | | | | | | | | | | | | | | | | |
| | | COUPON
RATE | | | MATURITY
DATE | | | CREDIT
RATING1 (UNAUDITED) | | | PRINCIPAL
AMOUNT | | | VALUE (NOTE 2) | |
| | | | | |
OHIO MUNICIPAL SECURITIES - 97.8% | | | | | | | | | | | | | | | | | | | | |
| | | | | |
Akron, Recreational Facilities Impt., Refunded, G.O. Bond | | | 6.500% | | | | 11/1/2015 | | | | Aa3 | | | $ | 300,000 | | | $ | 306,309 | |
Akron, Various Purposes Impt., G.O. Bond | | | 3.000% | | | | 12/1/2017 | | | | Aa3 | | | | 100,000 | | | | 104,984 | |
Akron, Various Purposes Impt., Series A, G.O. Bond | | | 1.250% | | | | 12/1/2017 | | | | AA2 | | | | 350,000 | | | | 352,699 | |
Akron, Various Purposes Impt., Series A, G.O. Bond | | | 5.000% | | | | 12/1/2017 | | | | AA2 | | | | 100,000 | | | | 109,759 | |
Akron, Various Purposes Impt., Series C, G.O. Bond | | | 3.000% | | | | 12/1/2017 | | | | AA2 | | | | 300,000 | | | | 314,952 | |
American Municipal Power, Inc., Fremont Energy Center Project, Series B, Revenue Bond | | | 5.000% | | | | 2/15/2019 | | | | A1 | | | | 720,000 | | | | 812,383 | |
American Municipal Power, Inc., Fremont Energy Center Project, Series B, Revenue Bond | | | 5.000% | | | | 2/15/2022 | | | | A1 | | | | 200,000 | | | | 233,038 | |
American Municipal Power, Inc., Prairie State Energy Campus Project, Series A, Revenue Bond, AGC | | | 4.375% | | | | 2/15/2020 | | | | A1 | | | | 100,000 | | | | 109,633 | |
American Municipal Power, Inc., Prairie State Energy Campus Project, Unrefunded Balance, Series A, Revenue Bond, AGC | | | 4.500% | | | | 2/15/2018 | | | | A1 | | | | 100,000 | | | | 108,834 | |
Batavia Local School District, G.O. Bond, NATL | | | 5.625% | | | | 12/1/2022 | | | | A2 | | | | 170,000 | | | | 188,722 | |
Butler County Sewer System, Revenue Bond, AGM | | | 5.000% | | | | 12/1/2017 | | | | Aa3 | | | | 300,000 | | | | 328,761 | |
Butler County, Prerefunded Balance, G.O. Bond, AMBAC | | | 5.000% | | | | 12/1/2016 | | | | Aa2 | | | | 5,000 | | | | 5,315 | |
Butler County, Unrefunded Balance, G.O. Bond, AMBAC | | | 5.000% | | | | 12/1/2016 | | | | Aa2 | | | | 95,000 | | | | 100,847 | |
Centerville City School District, School Impt., G.O. Bond | | | 3.000% | | | | 12/1/2016 | | | | Aa1 | | | | 100,000 | | | | 103,348 | |
Cincinnati City School District, School Impt., G.O. Bond | | | 4.500% | | | | 6/1/2018 | | | | Aa2 | | | | 350,000 | | | | 384,853 | |
Cincinnati City School District, School Impt., G.O. Bond, AGM | | | 5.000% | | | | 12/1/2018 | | | | Aa2 | | | | 400,000 | | | | 451,364 | |
Cincinnati Water System, Series A, Revenue Bond | | | 5.000% | | | | 12/1/2016 | | | | Aaa | | | | 150,000 | | | | 159,630 | |
Cincinnati Water System, Series A, Revenue Bond | | | 5.000% | | | | 12/1/2017 | | | | Aaa | | | | 110,000 | | | | 116,533 | |
Cincinnati Water System, Series A, Revenue Bond | | | 5.000% | | | | 12/1/2018 | | | | Aaa | | | | 230,000 | | | | 259,935 | |
Cincinnati Water System, Series A, Revenue Bond | | | 5.000% | | | | 12/1/2018 | | | | Aaa | | | | 120,000 | | | | 135,618 | |
Cincinnati Water System, Series A, Revenue Bond | | | 4.250% | | | | 12/1/2019 | | | | Aaa | | | | 200,000 | | | | 224,966 | |
Cincinnati, Public Impt., Series A, G.O. Bond | | | 5.000% | | | | 12/1/2017 | | | | Aa2 | | | | 500,000 | | | | 549,030 | |
Cincinnati, Public Impt., Series B, G.O. Bond | | | 4.250% | | | | 12/1/2017 | | | | Aa2 | | | | 140,000 | | | | 146,836 | |
Cincinnati, Various Purposes Impt., Series C, G.O. Bond | | | 5.000% | | | | 12/1/2015 | | | | Aa2 | | | | 300,000 | | | | 306,024 | |
Cincinnati, Various Purposes Impt., Series C, G.O. Bond | | | 4.250% | | | | 12/1/2017 | | | | Aa2 | | | | 150,000 | | | | 161,685 | |
Cleveland Department of Public Utilities Division of Public Power, Prerefunded Balance, Series A-1, Revenue Bond, NATL | | | 5.000% | | | | 11/15/2018 | | | | A3 | | | | 1,000,000 | | | | 1,060,090 | |
Cleveland Department of Public Utilities Division of Water, Series T, Revenue Bond | | | 5.000% | | | | 1/1/2019 | | | | Aa1 | | | | 370,000 | | | | 419,314 | |
Cleveland Department of Public Utilities Division of Water, Series Y, Revenue Bond | | | 5.000% | | | | 1/1/2022 | | | | Aa1 | | | | 1,000,000 | | | | 1,182,750 | |
The accompanying notes are an integral part of the financial statements.
3
Ohio Tax Exempt Series
Investment Portfolio - June 30, 2015
(unaudited)
| | | | | | | | | | | | | | | | | | | | |
| | | COUPON RATE | | | MATURITY DATE | | | CREDIT
RATING1 (UNAUDITED) | | | PRINCIPAL AMOUNT | | | VALUE (NOTE 2) | |
| | | | | |
OHIO MUNICIPAL SECURITIES (continued) | | | | | | | | | | | | | | | | | | | | |
| | | | | |
Cleveland Department of Public Utilities Division of Water, Water Utility Impt., 2nd Lien, Series A, Revenue Bond | | | 5.000% | | | | 1/1/2019 | | | | Aa2 | | | $ | 235,000 | | | $ | 265,369 | |
Cleveland, Public Impt., Revenue Bond | | | 4.000% | | | | 11/15/2020 | | | | A1 | | | | 220,000 | | | | 244,660 | |
Columbus City School District, Facilities Construction & Impt., Prerefunded Balance, G.O. Bond, AGM | | | 5.000% | | | | 12/1/2017 | | | | Aa2 | | | | 265,000 | | | | 281,608 | |
Columbus City School District, Facilities Construction & Impt., Prerefunded Balance, G.O. Bond, AGM | | | 5.000% | | | | 12/1/2018 | | | | Aa2 | | | | 125,000 | | | | 132,834 | |
Columbus, Recreational Facilities Impt., Series A, G.O. Bond | | | 4.000% | | | | 2/15/2021 | | | | Aaa | | | | 500,000 | | | | 562,550 | |
Columbus, Series 1, G.O. Bond | | | 5.000% | | | | 7/1/2021 | | | | Aaa | | | | 300,000 | | | | 355,806 | |
Columbus, Various Purposes Impt., Series 2, G.O. Bond | | | 4.000% | | | | 2/15/2017 | | | | Aaa | | | | 100,000 | | | | 105,552 | |
Columbus, Various Purposes Impt., Series A, G.O. Bond | | | 5.000% | | | | 12/15/2016 | | | | Aaa | | | | 105,000 | | | | 111,770 | |
Columbus, Various Purposes Impt., Series A, G.O. Bond | | | 5.000% | | | | 8/15/2018 | | | | Aaa | | | | 100,000 | | | | 112,285 | |
Cuyahoga County, G.O. Bond | | | 5.000% | | | | 12/1/2018 | | | | Aa1 | | | | 250,000 | | | | 282,537 | |
Cuyahoga County, Limited Tax, Various Purposes Impt., Series A, G.O. Bond | | | 4.000% | | | | 12/1/2018 | | | | Aa1 | | | | 400,000 | | | | 438,676 | |
Cuyahoga County, Public Impt., Revenue Bond | | | 2.000% | | | | 12/1/2017 | | | | Aa1 | | | | 280,000 | | | | 287,465 | |
Cuyahoga County, Public Impt., Revenue Bond | | | 2.000% | | | | 12/1/2018 | | | | Aa1 | | | | 185,000 | | | | 190,759 | |
Cuyahoga County, Public Impt., Revenue Bond | | | 2.000% | | | | 12/1/2019 | | | | Aa1 | | | | 85,000 | | | | 87,577 | |
Cuyahoga County, Public Impt., Revenue Bond | | | 5.000% | | | | 12/1/2024 | | | | Aa1 | | | | 500,000 | | | | 609,630 | |
Cuyahoga County, Public Impt., Series A, G.O. Bond | | | 5.000% | | | | 12/1/2020 | | | | Aa1 | | | | 395,000 | | | | 464,180 | |
Delaware County Sanitary Sewer System, Revenue Bond, AGM | | | 4.500% | | | | 12/1/2019 | | | | Aa2 | | | | 150,000 | | | | 159,873 | |
Delaware County Sanitary Sewer System, Sewer Impt., Revenue Bond | | | 1.000% | | | | 12/1/2016 | | | | Aa2 | | | | 255,000 | | | | 257,175 | |
Delaware County, Public Impt., Revenue Bond | | | 3.000% | | | | 12/1/2024 | | | | Aa1 | | | | 305,000 | | | | 314,958 | |
Delaware County, Public Impt., Series A, G.O. Bond | | | 4.000% | | | | 12/1/2015 | | | | Aa1 | | | | 250,000 | | | | 254,047 | |
Delaware County, Series B, G.O. Bond | | | 4.000% | | | | 12/1/2015 | | | | Aa1 | | | | 200,000 | | | | 203,238 | |
Dublin City School District, Various Purposes Impt., Series A, G.O. Bond | | | 5.000% | | | | 12/1/2017 | | | | Aa1 | | | | 400,000 | | | | 440,032 | |
Fairfield City School District, G.O. Bond | | | 3.000% | | | | 12/1/2016 | | | | Aa3 | | | | 330,000 | | | | 341,382 | |
Fairfield City School District, G.O. Bond | | | 5.000% | | | | 12/1/2020 | | | | Aa3 | | | | 200,000 | | | | 234,658 | |
Fairfield County, Public Impt., G.O. Bond | | | 2.000% | | | | 12/1/2018 | | | | Aa2 | | | | 300,000 | | | | 308,523 | |
Fairfield Township, Public Impt., Prerefunded Balance, G.O. Bond, AGM | | | 5.000% | | | | 12/1/2017 | | | | Aa2 | | | | 290,000 | | | | 295,797 | |
Franklin County, G.O. Bond | | | 4.000% | | | | 6/1/2017 | | | | Aaa | | | | 1,145,000 | | | | 1,218,761 | |
Franklin County, G.O. Bond | | | 5.000% | | | | 12/1/2025 | | | | Aaa | | | | 275,000 | | | | 336,487 | |
Franklin County, Various Purposes Impt., G.O. Bond | | | 5.000% | | | | 12/1/2020 | | | | Aaa | | | | 100,000 | | | | 112,156 | |
Franklin County, Various Purposes Impt., Prerefunded Balance, G.O. Bond | | | 5.000% | | | | 12/1/2027 | | | | Aaa | | | | 500,000 | | | | 548,440 | |
Gahanna, Public Impt., G.O. Bond | | | 4.000% | | | | 12/1/2023 | | | | Aa1 | | | | 300,000 | | | | 339,318 | |
The accompanying notes are an integral part of the financial statements.
4
Ohio Tax Exempt Series
Investment Portfolio - June 30, 2015
(unaudited)
| | | | | | | | | | | | | | | | | | | | |
| | | COUPON RATE | | | MATURITY DATE | | | CREDIT
RATING1 (UNAUDITED) | | | PRINCIPAL AMOUNT | | | VALUE (NOTE 2) | |
| | | | | |
OHIO MUNICIPAL SECURITIES (continued) | | | | | | | | | | | | | | | | | | | | |
| | | | | |
Gahanna, Public Impt., G.O. Bond | | | 4.000% | | | | 12/1/2024 | | | | Aa1 | | | $ | 375,000 | | | $ | 425,081 | |
Greater Cleveland Regional Transit Authority, Capital Impt., Revenue Bond | | | 5.000% | | | | 12/1/2026 | | | | Aa1 | | | | 500,000 | | | | 599,090 | |
Greater Cleveland Regional Transit Authority, Transit Impt., Revenue Bond | | | 4.000% | | | | 12/1/2017 | | | | Aa1 | | | | 350,000 | | | | 375,438 | |
Greater Cleveland Regional Transit Authority, Transit Impt., Revenue Bond | | | 5.000% | | | | 12/1/2018 | | | | Aa1 | | | | 350,000 | | | | 394,419 | |
Greene County Water System, Series A, Revenue Bond, NATL | | | 5.250% | | | | 12/1/2020 | | | | Aa2 | | | | 100,000 | | | | 117,050 | |
Hamilton City School District, Various Purposes Impt., G.O. Bond | | | 4.000% | | | | 12/1/2018 | | | | AA2 | | | | 200,000 | | | | 217,988 | |
Hamilton County Sewer System, Series A, Revenue Bond | | | 5.000% | | | | 12/1/2020 | | | | Aa2 | | | | 500,000 | | | | 585,865 | |
Hamilton County Sewer System, Series A, Revenue Bond | | | 5.000% | | | | 12/1/2024 | | | | Aa2 | | | | 570,000 | | | | 691,233 | |
Hamilton County Sewer System, Sewer Impt., Series A, Revenue Bond | | | 3.750% | | | | 12/1/2015 | | | | Aa2 | | | | 200,000 | | | | 203,010 | |
Hamilton County Sewer System, Sewer Impt., Series A, Revenue Bond | | | 4.000% | | | | 12/1/2018 | | | | Aa2 | | | | 150,000 | | | | 164,292 | |
Hamilton County Sewer System, Sewer Impt., Series A, Revenue Bond | | | 5.000% | | | | 12/1/2020 | | | | Aa2 | | | | 500,000 | | | | 585,865 | |
Hamilton County, Limited Tax, Riverfront Infrastructure, Parking Facility Impt., G.O. Bond | | | 2.000% | | | | 12/1/2016 | | | | Aa2 | | | | 200,000 | | | | 204,274 | |
Hamilton County, Limited Tax, Riverfront Infrastructure, Parking Facility Impt., G.O. Bond | | | 5.000% | | | | 12/1/2021 | | | | Aa2 | | | | 500,000 | | | | 593,740 | |
Hamilton County, Various Purposes Impt., G.O. Bond | | | 4.000% | | | | 12/1/2024 | | | | Aa2 | | | | 320,000 | | | | 360,723 | |
Hamilton Local School District, School Impt., Prerefunded Balance, G.O. Bond, AGM | | | 4.500% | | | | 6/1/2016 | | | | A2 | | | | 200,000 | | | | 207,570 | |
Hancock County, Various Purposes Impt., G.O. Bond, NATL | | | 4.000% | | | | 12/1/2016 | | | | Aa2 | | | | 200,000 | | | | 202,906 | |
Hilliard School District, School Construction, Prerefunded Balance, G.O. Bond, NATL | | | 5.000% | | | | 12/1/2015 | | | | Aa1 | | | | 325,000 | | | | 331,455 | |
Hilliard School District, School Impt., Series A, G.O. Bond | | | 5.000% | | | | 12/1/2018 | | | | Aa1 | | | | 500,000 | | | | 565,435 | |
Hilliard, Limited Tax, Various Purposes Impt., G.O. Bond | | | 3.000% | | | | 12/1/2018 | | | | Aa1 | | | | 100,000 | | | | 105,838 | |
Huber Heights City School District, School Impt., G.O. Bond | | | 5.000% | | | | 12/1/2019 | | | | A1 | | | | 300,000 | | | | 345,123 | |
Huber Heights, Various Purposes Impt., G.O. Bond, AGM | | | 5.000% | | | | 6/1/2017 | | | | Aa2 | | | | 115,000 | | | | 124,430 | |
Independence, Various Purposes Impt., G.O. Bond | | | 3.000% | | | | 12/1/2017 | | | | Aa1 | | | | 100,000 | | | | 104,661 | |
Ironton City School District, School Impt., Prerefunded Balance, G.O. Bond, NATL | | | 4.250% | | | | 12/1/2016 | | | | A3 | | | | 200,000 | | | | 210,418 | |
Kenston Local School District, School Impt., G.O. Bond | | | 2.000% | | | | 12/1/2017 | | | | Aa1 | | | | 100,000 | | | | 102,278 | |
The accompanying notes are an integral part of the financial statements.
5
Ohio Tax Exempt Series
Investment Portfolio - June 30, 2015
(unaudited)
| | | | | | | | | | | | | | | | | | | | |
| | | COUPON RATE | | | MATURITY DATE | | | CREDIT
RATING1 (UNAUDITED) | | | PRINCIPAL AMOUNT | | | VALUE (NOTE 2) | |
| | | | | |
OHIO MUNICIPAL SECURITIES (continued) | | | | | | | | | | | | | | | | | | | | |
| | | | | |
Lakota Local School District, Butler County, G.O. Bond | | | 5.000% | | | | 12/1/2019 | | | | Aa1 | | | $ | 175,000 | | | $ | 201,645 | |
Loveland City School District, School Impt., G.O. Bond, AGM | | | 5.000% | | | | 12/1/2015 | | | | Aa2 | | | | 300,000 | | | | 305,934 | |
Mahoning Valley Sanitary District, Revenue Bond, AGC | | | 2.125% | | | | 12/1/2015 | | | | A3 | | | | 100,000 | | | | 100,804 | |
Marysville City Wastewater Treatment System, Revenue Bond, BAM | | | 4.000% | | | | 12/1/2017 | | | | AA2 | | | | 200,000 | | | | 213,830 | |
Marysville City Wastewater Treatment System, Revenue Bond, BAM | | | 4.000% | | | | 12/1/2018 | | | | AA2 | | | | 335,000 | | | | 363,509 | |
Middleburg Heights, G.O. Bond | | | 3.750% | | | | 12/1/2017 | | | | Aa1 | | | | 100,000 | | | | 106,846 | |
Middletown, Various Purposes Impt., G.O. Bond, AGM | | | 4.500% | | | | 12/1/2018 | | | | Aa3 | | | | 100,000 | | | | 109,619 | |
Middletown, Various Purposes Impt., G.O. Bond, AGM | | | 5.000% | | | | 12/1/2021 | | | | Aa3 | | | | 230,000 | | | | 254,125 | |
New Albany Plain Local School District, G.O. Bond, AGM | | | 5.000% | | | | 12/1/2015 | | | | Aa1 | | | | 150,000 | | | | 152,949 | |
New Albany, Limited Tax, Recreational Facility Impt., G.O. Bond | | | 3.000% | | | | 12/1/2020 | | | | Aa1 | | | | 340,000 | | | | 364,201 | |
North Ridgeville, Water Utility Impt., G.O. Bond, AGC | | | 4.750% | | | | 12/1/2018 | | | | Aa2 | | | | 200,000 | | | | 224,334 | |
Northeast Ohio Regional Sewer District, Sewer Impt., Revenue Bond | | | 5.000% | | | | 11/15/2021 | | | | Aa1 | | | | 750,000 | | | | 890,085 | |
Ohio State Turnpike Commission, Highway Impt., Series A, Revenue Bond | | | 5.000% | | | | 2/15/2018 | | | | Aa3 | | | | 275,000 | | | | 304,013 | |
Ohio State Turnpike Commission, Highway Impt., Series A, Revenue Bond | | | 5.000% | | | | 2/15/2019 | | | | Aa3 | | | | 375,000 | | | | 425,685 | |
Ohio State Turnpike Commission, Highway Impt., Series A-1, Revenue Bond | | | 5.000% | | | | 2/15/2024 | | | | A1 | | | | 400,000 | | | | 467,476 | |
Ohio State Turnpike Commission, Series A, Revenue Bond | | | 3.250% | | | | 2/15/2016 | | | | Aa3 | | | | 100,000 | | | | 101,822 | |
Ohio State Turnpike Commission, Series A, Revenue Bond, NATL | | | 5.500% | | | | 2/15/2019 | | | | Aa3 | | | | 260,000 | | | | 299,741 | |
The Ohio State University, Series A, Prerefunded Balance, Revenue Bond | | | 5.000% | | | | 12/1/2016 | | | | WR3 | | | | 400,000 | | | | 425,188 | |
The Ohio State University, Series A, Prerefunded Balance, Revenue Bond | | | 5.000% | | | | 12/1/2018 | | | | WR3 | | | | 715,000 | | | | 807,285 | |
Ohio State Water Development Authority, Drinking Water Assistance, Revenue Bond | | | 5.000% | | | | 6/1/2021 | | | | Aaa | | | | 500,000 | | | | 590,850 | |
Ohio State Water Development Authority, Drinking Water, Prerefunded Balance, Series B, Revenue Bond | | | 5.000% | | | | 12/1/2015 | | | | WR3 | | | | 500,000 | | | | 509,890 | |
Ohio State Water Development Authority, Fresh Water, Revenue Bond | | | 5.500% | | | | 12/1/2018 | | | | Aaa | | | | 100,000 | | | | 114,906 | |
Ohio State Water Development Authority, Fresh Water, Revenue Bond | | | 5.500% | | | | 12/1/2021 | | | | Aaa | | | | 125,000 | | | | 152,451 | |
The accompanying notes are an integral part of the financial statements.
6
Ohio Tax Exempt Series
Investment Portfolio - June 30, 2015
(unaudited)
| | | | | | | | | | | | | | | | | | | | |
| | | COUPON RATE | | | MATURITY DATE | | | CREDIT
RATING1 (UNAUDITED) | | | PRINCIPAL AMOUNT | | | VALUE (NOTE 2) | |
| | | | | |
OHIO MUNICIPAL SECURITIES (continued) | | | | | | | | | | | | | | | | | | | | |
| | | | | |
Ohio State Water Development Authority, Pollution Control, Series C, Revenue Bond | | | 3.000 | % | | | 12/1/2021 | | | | Aaa | | | $ | 300,000 | | | $ | 320,691 | |
Ohio State Water Development Authority, Pure Water, Prerefunded Balance, Series I, Revenue Bond, AMBAC | | | 6.000 | % | | | 12/1/2016 | | | | Aaa | | | | 10,000 | | | | 10,394 | |
Ohio State Water Development Authority, Revenue Bond | | | 5.250 | % | | | 12/1/2015 | | | | Aaa | | | | 200,000 | | | | 204,294 | |
Ohio State Water Development Authority, Revenue Bond | | | 5.000 | % | | | 12/1/2018 | | | | Aaa | | | | 100,000 | | | | 113,231 | |
Ohio State Water Development Authority, Series A, Revenue Bond | | | 5.000 | % | | | 12/1/2017 | | | | Aaa | | | | 150,000 | | | | 165,051 | |
Ohio State Water Development Authority, Series B-1, Revenue Bond | | | 5.000 | % | | | 12/1/2017 | | | | Aaa | | | | 125,000 | | | | 137,543 | |
Ohio State Water Development Authority, Sewer Impt., Series A, Revenue Bond | | | 5.000 | % | | | 6/1/2020 | | | | Aaa | | | | 450,000 | | | | 525,312 | |
Ohio State, Infrastructure Impt., Series A, G.O. Bond | | | 5.000 | % | | | 9/1/2025 | | | | Aa1 | | | | 350,000 | | | | 426,373 | |
Ohio State, School Impt., Series A, Prerefunded Balance, G.O. Bond | | | 5.000 | % | | | 6/15/2016 | | | | Aa1 | | | | 410,000 | | | | 428,220 | |
Ohio State, School Impt., Series B, G.O. Bond | | | 5.000 | % | | | 6/15/2024 | | | | Aa1 | | | | 1,150,000 | | | | 1,356,839 | |
Ohio State, Series A, G.O. Bond | | | 5.000 | % | | | 9/15/2021 | | | | Aa1 | | | | 500,000 | | | | 593,020 | |
Ohio State, Series B, Revenue Bond | | | 5.000 | % | | | 12/15/2018 | | | | Aa2 | | | | 650,000 | | | | 735,306 | |
Ohio State, Series B, Revenue Bond | | | 5.000 | % | | | 12/15/2019 | | | | Aa2 | | | | 350,000 | | | | 405,401 | |
Olentangy Local School District, Public Impt., Prerefunded Balance, G.O. Bond, AGM | | | 5.000 | % | | | 6/1/2016 | | | | Aa1 | | | | 100,000 | | | | 104,225 | |
Olentangy Local School District, School Impt., G.O. Bond | | | 5.000 | % | | | 12/1/2019 | | | | Aa1 | | | | 100,000 | | | | 115,598 | |
Olentangy Local School District, School Impt., Series A, G.O. Bond | | | 4.300 | % | | | 12/1/2016 | | | | Aa1 | | | | 150,000 | | | | 157,656 | |
Olentangy Local School District, Series B, G.O. Bond | | | 5.000 | % | | | 12/1/2018 | | | | Aa1 | | | | 150,000 | | | | 169,307 | |
Olentangy Local School District, Series B, G.O. Bond | | | 3.000 | % | | | 12/1/2020 | | | | Aa1 | | | | 115,000 | | | | 123,747 | |
Oregon City School District, School Impt., G.O. Bond | | | 4.000 | % | | | 12/1/2017 | | | | Aa3 | | | | 100,000 | | | | 107,268 | |
Portage County, Limited Tax, Various Purposes Impt., G.O. Bond | | | 4.000 | % | | | 12/1/2017 | | | | AA2 | | | | 250,000 | | | | 267,953 | |
Sandy Valley Local School District, School Impt., Prerefunded Balance, G.O. Bond, XLCA | | | 4.500 | % | | | 6/1/2016 | | | | A2 | | | | 100,000 | | | | 103,785 | |
Sheffield, Limited Tax, Various Purposes Impt., G.O. Bond | | | 2.000 | % | | | 12/1/2018 | | | | AA2 | | | | 140,000 | | | | 143,147 | |
Springboro Community City School District, G.O. Bond, AGM | | | 5.250 | % | | | 12/1/2018 | | | | Aa3 | | | | 200,000 | | | | 226,454 | |
Springboro Sewer System, Revenue Bond | | | 4.000 | % | | | 6/1/2018 | | | | Aa2 | | | | 100,000 | | | | 107,694 | |
Springboro, Limited Tax, Public Impt., G.O. Bond | | | 5.000 | % | | | 12/1/2019 | | | | Aa1 | | | | 100,000 | | | | 111,623 | |
Summit County, Series A, G.O. Bond, NATL | | | 4.750 | % | | | 12/1/2019 | | | | Aa1 | | | | 120,000 | | | | 127,258 | |
The accompanying notes are an integral part of the financial statements.
7
Ohio Tax Exempt Series
Investment Portfolio - June 30, 2015
(unaudited)
| | | | | | | | | | | | | | | | | | | | | | |
| | | COUPON RATE | | | MATURITY DATE | | | CREDIT
RATING1 (UNAUDITED) | | | PRINCIPAL
AMOUNT/
SHARES | | | VALUE (NOTE 2) | | | |
| | | | | | |
OHIO MUNICIPAL SECURITIES (continued) | | | | | | | | | | | | | | | | | | | | | | |
| | | | | | |
Summit County, Various Purposes Impt., Series R, G.O. Bond, NATL | | | 5.500 | % | | | 12/1/2019 | | | | Aa1 | | | $ | 100,000 | | | $ | 118,073 | | | |
Sylvania City School District, School Impt., Prerefunded Balance, G.O. Bond, AGC | | | 5.000 | % | | | 12/1/2020 | | | | A1 | | | | 150,000 | | | | 162,215 | | | |
Sylvania City School District, School Impt., Prerefunded Balance, G.O. Bond, AGC | | | 5.000 | % | | | 12/1/2025 | | | | A1 | | | | 270,000 | | | | 291,986 | | | |
Toledo Water System, Water Utility Impt., Revenue Bond | | | 5.000 | % | | | 11/15/2018 | | | | Aa3 | | | | 500,000 | | | | 562,835 | | | |
Toledo Water System, Water Utility Impt., Revenue Bond | | | 5.000 | % | | | 11/15/2019 | | | | Aa3 | | | | 500,000 | | | | 575,780 | | | |
Toledo, Limited Tax, Capital Impt., G.O. Bond | | | 5.000 | % | | | 12/1/2019 | | | | A2 | | | | 275,000 | | | | 313,219 | | | |
Troy, Limited Tax, Water & Sewer Impt., G.O. Bond | | | 2.000 | % | | | 12/1/2020 | | | | Aa1 | | | | 100,000 | | | | 101,560 | | | |
Upper Arlington, Various Purposes Impt., G.O. Bond | | | 4.000 | % | | | 12/1/2024 | | | | Aaa | | | | 535,000 | | | | 610,809 | | | |
Westerville, Various Purposes Impt., G.O. Bond | | | 5.000 | % | | | 12/1/2020 | | | | Aaa | | | | 100,000 | | | | 117,453 | | | |
Worthington City School District, G.O. Bond | | | 4.000 | % | | | 12/1/2018 | | | | Aa1 | | | | 400,000 | | | | 436,072 | | | |
| | | | | | | | | | | | | | | | | | | | | | |
| | | | | | |
TOTAL MUNICIPAL BONDS | | | | | | | | | | | | | | | | | | | | | | |
(Identified Cost $44,372,037) | | | | | | | | | | | | | | | | | | | 44,519,077 | | | |
| | | | | | | | | | | | | | | | | | | | | | |
| | | | | | |
SHORT-TERM INVESTMENT - 2.5% | | | | | | | | | | | | | | | | | | | | | | |
| | | | | | |
Dreyfus AMT - Free Municipal Reserves - Class R | | | | | | | | | | | | | | | | | | | | | | |
(Identified Cost $1,144,997) | | | 0.00 | %4 | | | | | | | | | | | 1,144,997 | | | | 1,144,997 | | | |
| | | | | | | | | | | | | | | | | | | | | | |
| | | | | | |
TOTAL INVESTMENTS - 100.3% | | | | | | | | | | | | | | | | | | | | | | |
(Identified Cost $45,517,034) | | | | | | | | | | | | | | | | | | | 45,664,074 | | | |
LIABILITIES, LESS OTHER ASSETS - (0.3%) | | | | | | | | | | | | | | | | | | | (136,731 | ) | | |
| | | | | | | | | | | | | | | | | | | | | | |
NET ASSETS - 100% | | | | | | | | | | | | | | | | | | $ | 45,527,343 | | | |
| | | | | | | | | | | | | | | | | | | | | | |
KEY:
G.O. Bond - General Obligation Bond
Impt. - Improvement
Scheduled principal and interest payments are guaranteed by:
AGC (Assured Guaranty Corp.)
AGM (Assurance Guaranty Municipal Corp.)
AMBAC (AMBAC Assurance Corp.)
BAM (Build America Mutual Assurance Co.)
NATL (National Public Finance Guarantee Corp.)
XLCA (XL Capital Assurance)
The insurance does not guarantee the market value of the municipal bonds.
1Credit ratings from Moody’s (unaudited).
2Credit ratings from S&P (unaudited).
3Credit rating has been withdrawn. As of June 30, 2015, there is no rating available (unaudited).
4Rate shown is the current yield as of June 30, 2015. Rate is less than 0.01%.
The accompanying notes are an integral part of the financial statements.
8
Ohio Tax Exempt Series
Statement of Assets and Liabilities
June 30, 2015 (unaudited)
| | | | |
ASSETS: | | | | |
| |
Investments, at value (identified cost $45,517,034) (Note 2) | | $ | 45,664,074 | |
Interest receivable | | | 237,343 | |
Receivable for fund shares sold | | | 6,858 | |
Prepaid expenses | | | 79 | |
| | | | |
| |
TOTAL ASSETS | | | 45,908,354 | |
| | | | |
| |
LIABILITIES: | | | | |
| |
Accrued management fees (Note 3) | | | 20,010 | |
Accrued fund accounting and administration fees (Note 3) | | | 11,427 | |
Accrued transfer agent fees (Note 3) | | | 994 | |
Accrued Chief Compliance Officer service fees (Note 3) | | | 382 | |
Payable for securities purchased | | | 314,339 | |
Payable for fund shares repurchased | | | 18,037 | |
Other payables and accrued expenses | | | 15,822 | |
| | | | |
| |
TOTAL LIABILITIES | | | 381,011 | |
| | | | |
| |
TOTAL NET ASSETS | | $ | 45,527,343 | |
| | | | |
| |
NET ASSETS CONSIST OF: | | | | |
| |
Capital stock | | $ | 43,154 | |
Additional paid-in-capital | | | 45,361,262 | |
Undistributed net investment income | | | 54,080 | |
Accumulated net realized loss on investments | | | (78,193 | ) |
Net unrealized appreciation (depreciation) on investments | | | 147,040 | |
| | | | |
| |
TOTAL NET ASSETS | | $ | 45,527,343 | |
| | | | |
| |
NET ASSET VALUE, OFFERING PRICE AND REDEMPTION PRICE PER SHARE - Class A ($45,527,343/4,315,441 shares) | | $ | 10.55 | |
| | | | |
The accompanying notes are an integral part of the financial statements.
9
Ohio Tax Exempt Series
Statement of Operations
For the Six Months Ended June 30, 2015 (unaudited)
| | | | |
INVESTMENT INCOME: | | | | |
| |
Interest | | $ | 295,389 | |
Dividends | | | 237 | |
| | | | |
| |
Total Investment Income | | | 295,626 | |
| | | | |
| |
EXPENSES: | | | | |
| |
Management fees (Note 3) | | | 113,462 | |
Fund accounting and administration fees (Note 3) | | | 28,413 | |
Chief Compliance Officer service fees (Note 3) | | | 1,224 | |
Transfer agent fees (Note 3) | | | 1,041 | |
Directors’ fees (Note 3) | | | 454 | |
Audit fees | | | 14,096 | |
Custodian fees | | | 1,051 | |
Miscellaneous | | | 7,372 | |
| | | | |
| |
Total Expenses | | | 167,113 | |
| | | | |
| |
NET INVESTMENT INCOME | | | 128,513 | |
| | | | |
| |
REALIZED AND UNREALIZED LOSS ON INVESTMENTS: | | | | |
| |
Net realized loss on investments | | | (46,701 | ) |
Net change in unrealized appreciation (depreciation) on investments | | | (56,092 | ) |
| | | | |
| |
NET REALIZED AND UNREALIZED LOSS ON INVESTMENTS | | | (102,793 | ) |
| | | | |
| |
NET INCREASE IN NET ASSETS RESULTING FROM OPERATIONS | | $ | 25,720 | |
| | | | |
The accompanying notes are an integral part of the financial statements.
10
Ohio Tax Exempt Series
Statements of Changes in Net Assets
| | | | | | | | |
| | | FOR THE SIX MONTHS ENDED 6/30/15
(UNAUDITED) | | | FOR THE YEAR ENDED 12/31/14 | |
INCREASE IN NET ASSETS: | | | | | | | | |
| | |
OPERATIONS: | | | | | | | | |
| | |
Net investment income | | $ | 128,513 | | | $ | 275,269 | |
Net realized gain (loss) on investments | | | (46,701 | ) | | | 117,853 | |
Net change in unrealized appreciation (depreciation) on investments | | | (56,092 | ) | | | 138,436 | |
| | | | | | | | |
| | |
Net increase from operations | | | 25,720 | | | | 531,558 | |
| | | | | | | | |
| | |
DISTRIBUTIONS TO SHAREHOLDERS (Note 8): | | | | | | | | |
| | |
From net investment income | | | (130,676 | ) | | | (241,046 | ) |
From net realized gain on investments | | | — | | | | (179,131 | ) |
| | | | | | | | |
| | |
Total distributions to shareholders | | | (130,676 | ) | | | (420,177 | ) |
| | | | | | | | |
| | |
CAPITAL STOCK ISSUED AND REPURCHASED: | | | | | | | | |
| | |
Net increase from capital share transactions (Note 5) | | | 1,036,552 | | | | 4,291,335 | |
| | | | | | | | |
| | |
Net increase in net assets | | | 931,596 | | | | 4,402,716 | |
| | |
NET ASSETS: | | | | | | | | |
| | |
Beginning of period | | | 44,595,747 | | | | 40,193,031 | |
| | | | | | | | |
| | |
End of period (including undistributed net investment income of $54,080 and $56,243, respectively) | | $ | 45,527,343 | | | $ | 44,595,747 | |
| | | | | | | | |
The accompanying notes are an integral part of the financial statements.
11
Ohio Tax Exempt Series
Financial Highlights
| | | | | | | | | | | | | | | | | | | | | | | | | | | | | | |
| | | FOR THE SIX
MONTHS ENDED | | FOR THE YEARS ENDED |
| | | 6/30/15 (UNAUDITED) | | 12/31/14 | | 12/31/13 | | 12/31/12 | | 12/31/11 | | 12/31/10 |
Per share data (for a share outstanding throughout each period): | | | | | | | | | | | | | | | | | | | | | | | | | | | | | | |
| | | | | | |
Net asset value - Beginning of period | | | | $10.57 | | | | | $10.54 | | | | | $10.93 | | | | | $10.77 | | | | | $10.30 | | | | | $10.62 | |
| | | | | | | | | | | | | | | | | | | | | | | | | | | | | | |
| | | | | | |
Income (loss) from investment operations: | | | | | | | | | | | | | | | | | | | | | | | | | | | | | | |
Net investment income1 | | | | 0.03 | | | | | 0.07 | | | | | 0.14 | | | | | 0.16 | | | | | 0.26 | | | | | 0.35 | |
Net realized and unrealized gain (loss) on investments | | | | (0.02 | ) | | | | 0.06 | | | | | (0.31 | ) | | | | 0.17 | | | | | 0.62 | | | | | (0.33 | ) |
| | | | | | | | | | | | | | | | | | | | | | | | | | | | | | |
| | | | | | |
Total from investment operations | | | | 0.01 | | | | | 0.13 | | | | | (0.17 | ) | | | | 0.33 | | | | | 0.88 | | | | | 0.02 | |
| | | | | | | | | | | | | | | | | | | | | | | | | | | | | | |
| | | | | | |
Less distributions to shareholders: | | | | | | | | | | | | | | | | | | | | | | | | | | | | | | |
From net investment income | | | | (0.03 | ) | | | | (0.06 | ) | | | | (0.14 | ) | | | | (0.17 | ) | | | | (0.25 | ) | | | | (0.34 | ) |
From net realized gain on investments | | | | — | | | | | (0.04 | ) | | | | (0.08 | ) | | | | — | 2 | | | | (0.16 | ) | | | | — | |
| | �� | | | | | | | | | | | | | | | | | | | | | | | | | | | | |
| | | | | | |
Total distributions to shareholders | | | | (0.03 | ) | | | | (0.10 | ) | | | | (0.22 | ) | | | | (0.17 | ) | | | | (0.41 | ) | | | | (0.34 | ) |
| | | | | | | | | | | | | | | | | | | | | | | | | | | | | | |
| | | | | | |
Net asset value - End of period | | | | $10.55 | | | | | $10.57 | | | | | $10.54 | | | | | $10.93 | | | | | $10.77 | | | | | $10.30 | |
| | | | | | | | | | | | | | | | | | | | | | | | | | | | | | |
| | | | | | |
Net assets - End of period (000’s omitted) | | | | $45,527 | | | | | $44,596 | | | | | $40,193 | | | | | $38,749 | | | | | $37,676 | | | | | $34,370 | |
| | | | | | | | | | | | | | | | | | | | | | | | | | | | | | |
| | | | | | |
Total return3 | | | | 0.09% | | | | | 1.27% | | | | | (1.59% | ) | | | | 3.09% | | | | | 8.65% | | | | | 0.14% | |
Ratios (to average net assets)/Supplemental Data: | | | | | | | | | | | | | | | | | | | | | | | | | | | | | | |
Expenses* | | | | 0.74% | 4 | | | | 0.72% | | | | | 0.78% | | | | | 0.76% | | | | | 0.80% | | | | | 0.85% | |
Net investment income | | | | 0.57% | 4 | | | | 0.65% | | | | | 1.34% | | | | | 1.45% | | | | | 2.41% | | | | | 3.25% | |
Portfolio turnover | | | | 20% | | | | | 41% | | | | | 27% | | | | | 9% | | | | | 60% | | | | | 0% | 5 |
|
| *For certain periods presented, the investment advisor did not impose all or a portion of its management and/or other fees, and in some periods may have paid a portion of the Series’ expenses. If these expenses had been incurred by the Series, the expense ratio (to average net assets) would have increased by the following amounts: | |
| | | | N/A | | | | | N/A | | | | | N/A | | | | | N/A | | | | | N/A | | | | | 0.00% | 6 |
1Calculated based on average shares outstanding during the periods.
2Less than $0.01 per share.
3Represents aggregate total return for the periods indicated, and assumes reinvestment of all distributions. Total return would have been lower had certain expenses not been waived or reimbursed during certain periods. Periods less than one year are not annualized.
4Annualized.
5Less than 1%.
6Less than 0.01%.
The accompanying notes are an integral part of the financial statements.
12
Ohio Tax Exempt Series
Notes to Financial Statements
(unaudited)
Ohio Tax Exempt Series (the “Series”) is a no-load diversified series of Manning & Napier Fund, Inc. (the ���Fund”). The Fund is organized in Maryland and is registered under the Investment Company Act of 1940, as amended, as an open-end management investment company.
The Series’ investment objective is to provide as high a level of current income exempt from federal income tax and Ohio State personal income tax as the Advisor believes is consistent with the preservation of capital.
The Fund’s advisor is Manning & Napier Advisors, LLC (the “Advisor”). Shares of the Series are offered to investors, clients and employees of the Advisor and its affiliates. The total authorized capital stock of the Fund consists of 15 billion shares of common stock each having a par value of $0.01. As of June 30, 2015, 10.6 billion shares have been designated in total among 41 series, of which 100 million have been designated as Ohio Tax Exempt Series Class A common stock.
| 2. | Significant Accounting Policies |
The following is a summary of significant accounting policies followed by the Series. The Series is an investment company and, accordingly, follows the investment company accounting and reporting guidance of the Financial Accounting Standards Board Accounting Standards Codification Topic 946 - Investment Companies, which is part of accounting principles generally accepted in the United States of America (“GAAP”).
Security Valuation
Municipal securities will normally be valued on the basis of market valuations provided by an independent pricing service (the “Service”). The Service utilizes the latest price quotations and a matrix system (which considers such factors as security prices of similar securities, yields, maturities and ratings). The Service has been approved by the Fund’s Board of Directors (the “Board”).
Short-term investments that mature in sixty days or less are valued at amortized cost, which approximates fair value. Investments in open-end investment companies are valued at their net asset value per share on valuation date.
Volume and level of activity in established markets for an asset or liability are evaluated to determine whether recent transactions and quoted prices are determinative of fair value. Where there have been significant decreases in volume and level of activity, further analysis and adjustment may be necessary to estimate fair value. The Series measures fair value in these instances by the use of inputs and valuation techniques which may be based upon current market prices of securities that are comparable in coupon, rating, maturity and industry and/or expectation of future cash flows. As a result of trading in relatively thin markets and/or markets that experience significant volatility, the prices used by the Series to value these securities may differ from the value that would be realized if these securities were sold, and the differences could be material.
Securities for which representative valuations or prices are not available from the Series’ pricing service may be valued at fair value as determined in good faith by the Advisor under procedures approved by and under the general supervision and responsibility of the Board. Due to the inherent uncertainty of valuations of such securities, the fair value may differ significantly from the values that would have been used had a ready market for such securities existed. If trading or events occurring after the close of the principal market in which securities are traded are expected to materially affect the value of those securities, then they may be valued at their fair value, taking this trading or these events into account.
Various inputs are used in determining the value of the Series’ assets or liabilities carried at fair value. These inputs are summarized in three broad levels. Level 1 includes quoted prices in active markets for identical assets and liabilities. Level 2 includes other significant observable inputs (including quoted prices for similar securities, interest rates, prepayment speeds, credit risk, etc.). Level 3 includes significant unobservable inputs (including the Series’ own assumptions in determining the fair value of investments). A financial instrument’s level within the fair value hierarchy is based on the lowest level of any input both individually and in aggregate that is significant to the fair value measurement. The inputs or methodology used for valuing securities are not necessarily an indication of the risk associated with investing in those securities.
13
Ohio Tax Exempt Series
Notes to Financial Statements (continued)
(unaudited)
| 2. | Significant Accounting Policies (continued) |
Security Valuation (continued)
The following is a summary of the valuation levels used for major security types as of June 30, 2015 in valuing the Series’ assets or liabilities carried at fair value:
| | | | | | | | | | | | | | | | |
| DESCRIPTION | | TOTAL | | | LEVEL 1 | | | LEVEL 2 | | | LEVEL 3 | |
Assets: | | | | | | | | | | | | | | | | |
Debt securities: | | | | | | | | | | | | | | | | |
States and political subdivisions (municipals) | | $ | 44,519,077 | | | $ | — | | | $ | 44,519,077 | | | $ | — | |
Mutual fund | | | 1,144,997 | | | | 1,144,997 | | | | — | | | | — | |
| | | | | | | | | | | | | | | | |
Total assets | | $ | 45,664,074 | | | $ | 1,144,997 | | | $ | 44,519,077 | | | $ | — | |
| | | | | | | | | | | | | | | | |
There were no Level 3 securities held by the Series as of December 31, 2014 or June 30, 2015.
The Fund’s policy is to recognize transfers in and transfers out of the valuation levels as of the beginning of the reporting period. There were no transfers between Level 1 and Level 2 during the six months ended June 30, 2015.
Security Transactions, Investment Income and Expenses
Security transactions are accounted for on trade date. Dividend income is recorded on the ex-dividend date, except that if the ex-dividend date has passed, certain dividends from foreign securities are recorded as soon as the Series is informed of the ex-dividend date. Non-cash dividends, if any, are recorded at the fair value of the securities received. Interest income, including amortization of premium and accretion of discounts using the effective interest method, is earned from settlement date and accrued daily.
Expenses are recorded on an accrual basis. Most expenses of the Fund can be attributed to a specific series. Expenses which cannot be directly attributed are apportioned among the series in the Fund in such a manner as deemed equitable by the Fund’s Board, taking into consideration, among other things, the nature and type of expense.
The Series uses the identified cost method for determining realized gain or loss on investments for both financial statement and federal income tax reporting purposes.
Federal Taxes
The Series’ policy is to comply with the provisions of the Internal Revenue Code applicable to regulated investment companies. The Series is not subject to federal income tax or excise tax to the extent that the Series distributes to shareholders each year its taxable income, including any net realized gains on investments, in accordance with requirements of the Internal Revenue Code. Accordingly, no provision for federal income tax or excise tax has been made in the financial statements.
Management evaluates its tax positions to determine if the tax positions taken meet the minimum recognition threshold in connection with accounting for uncertainties in income tax positions taken or expected to be taken for the purposes of measuring and recognizing tax liabilities in the financial statements. Recognition of tax benefits of an uncertain tax position is required only when the position is “more likely than not” to be sustained assuming examination by taxing authorities. At June 30, 2015, the Series has recorded no liability for net unrecognized tax benefits relating to uncertain income tax positions taken or expected to be taken in future tax returns.
The Series files income tax returns in the U.S. federal jurisdiction and various states, as required. No income tax returns are currently under investigation. The statute of limitations on the Series’ tax returns remains open for the years ended December 31, 2011 through December 31, 2014. The Series is not aware of any tax positions for which it is reasonably possible that the total amounts of unrecognized tax benefits will significantly change in the next twelve months.
Distributions of Income and Gains
Distributions to shareholders of net investment income are made quarterly. Distributions of net realized gains are made annually. An additional distribution may be necessary to avoid taxation of the Series. Distributions are recorded on the ex-dividend date.
14
Ohio Tax Exempt Series
Notes to Financial Statements (continued)
(unaudited)
| 2. | Significant Accounting Policies (continued) |
Indemnifications
The Fund’s organizational documents provide former and current directors and officers with a limited indemnification against liabilities arising in connection with the performance of their duties to the Fund. In the normal course of business, the Fund may also enter into contracts that provide general indemnifications. The Fund’s maximum exposure under these arrangements is unknown as this would be dependent on future claims that may be made against the Fund. The risk of material loss from such claims is considered remote.
Other
The preparation of financial statements in conformity with GAAP requires management to make estimates and assumptions that affect the reported amounts of assets and liabilities and the disclosure of contingent assets and liabilities at the date of the financial statements and the reported amounts of income and expenses during the reporting period. Actual results could differ from those estimates.
| 3. | Transactions with Affiliates |
The Fund has an Investment Advisory Agreement (the “Agreement”) with the Advisor, for which the Series pays a fee, computed daily and payable monthly, at an annual rate of 0.50% of the Series’ average daily net assets.
Under the Agreement, personnel of the Advisor provide the Series with advice and assistance in the choice of investments and the execution of securities transactions, and otherwise maintain the Series’ organization. The Advisor also provides the Fund with necessary office space and fund administration and support services. The salaries of all officers of the Fund (except a percentage of the Fund’s Chief Compliance Officer’s salary, which is paid by the Fund), and of all Directors who are “affiliated persons” of the Fund, or of the Advisor, and all personnel of the Fund, or of the Advisor, performing services relating to research, statistical and investment activities, are paid by the Advisor. Each “non-affiliated” Director receives an annual stipend, which is allocated among all the active series of the Fund. In addition, these Directors also receive a fee per Board meeting attended plus a fee for each committee meeting attended and are reimbursed for travel and other out-of-pocket expenses incurred by them in connection with attending such meetings. The Fund also has an Audit Committee Chair, who receives an additional annual stipend for this role.
The Advisor has contractually agreed, until at least April 30, 2016, to waive its management fee and, if necessary, pay other operating expenses of the Series in order to maintain total direct annual fund operating expenses for the Series at no more than 0.85% of average daily net assets each year. The Advisor did not waive any fees for the six months ended June 30, 2015. The Advisor is not eligible to recoup any expenses that have been waived or reimbursed in prior years.
Manning & Napier Investor Services, Inc., a registered broker-dealer affiliate of the Advisor, acts as distributor for the Fund’s shares. The services of Manning & Napier Investor Services, Inc. are provided at no additional cost to the Series.
Pursuant to a master services agreement dated November 1, 2014, the Fund pays the Advisor an annual fee related to fund accounting and administration of 0.0085% on the first $25 billion of average daily net assets (excluding Target Series and Strategic Income Series); 0.0075% on the next $15 billion of average daily net assets (excluding Target Series and Strategic Income Series); and 0.0065% of the average daily net assets in excess of $40 billion (excluding Target Series and Strategic Income Series); plus a base fee of $30,400 per series. Transfer agent fees are charged to the Fund on a per account basis. Additionally, certain transaction and out-of-pocket expenses, including charges for reporting relating to the Fund’s compliance program, are charged. The Advisor has agreements with BNY Mellon Investment Servicing (U.S.) Inc. (“BNY”) under which BNY serves as sub-accountant services agent and sub-transfer agent.
Expenses not directly attributable to a series are allocated based on each series’ relative net assets or number of accounts, depending on the expense.
15
Ohio Tax Exempt Series
Notes to Financial Statements (continued)
(unaudited)
| 4. | Purchases and Sales of Securities |
For the six months ended June 30, 2015, purchases and sales of securities, other than U.S. Government securities and short-term securities, were $11,251,595 and $8,858,883, respectively. There were no purchases or sales of U.S. Government securities.
| 5. | Capital Stock Transactions |
Transactions in shares of Ohio Tax Exempt Series were:
| | | | | | | | | | | | | | | | |
| | | FOR THE SIX MONTHS ENDED 6/30/15 | | | FOR THE YEAR ENDED 12/31/14 | |
| | | SHARES | | | AMOUNT | | | SHARES | | | AMOUNT | |
Sold | | | 269,023 | | | $ | 2,855,740 | | | | 785,090 | | | $ | 8,344,570 | |
Reinvested | | | 12,167 | | | | 128,295 | | | | 39,016 | | | | 414,025 | |
Repurchased | | | (184,099 | ) | | | (1,947,483 | ) | | | (420,466 | ) | | | (4,467,260 | ) |
| | | | | | | | | | | | | | | | |
Total | | | 97,091 | | | $ | 1,036,552 | | | | 403,640 | | | $ | 4,291,335 | |
| | | | | | | | | | | | | | | | |
Over 90% of the shares outstanding are fiduciary accounts where the Advisor has sole investment discretion. No shareholder exceeds the 10% threshold.
The Series may trade in instruments including written and purchased options, forward foreign currency exchange contracts and futures contracts and other derivatives in the normal course of investing activities to assist in managing exposure to various market risks. The Series may be subject to various elements of risk, which may involve, to a varying degree, elements of risk in excess of the amounts recognized for financial statement purposes. These risks include: the risk that changes in the value of a derivative may not correlate perfectly with the underlying asset, rate or index; counterparty credit risk related to over the counter derivative counterparties’ failure to perform under contract terms; liquidity risk related to the lack of a liquid market for these contracts allowing the fund to close out its position(s); and documentation risk relating to disagreement over contract terms. No such investments were held by the Series as of June 30, 2015.
| 7. | Concentration of Credit |
The Series primarily invests in debt obligations issued by the State of Ohio and its political subdivisions, agencies and public authorities to obtain funds for various public purposes. The Series is more susceptible to factors adversely affecting issues of Ohio municipal securities than is a municipal bond fund that is not concentrated in these issues to the same extent.
| 8. | Federal Income Tax Information |
The amount and characterization of certain income and capital gains to be distributed are determined in accordance with federal income tax regulations, which may differ from GAAP. The Series may periodically make reclassifications among its capital accounts to reflect income and gains available for distribution (or available capital loss carryovers) under income tax regulations without impacting the Series’ net asset value. Any such reclassifications are not reflected in the financial highlights.
16
Ohio Tax Exempt Series
Notes to Financial Statements (continued)
(unaudited)
| 8. | Federal Income Tax Information (continued) |
The final determination of the tax character of current year distributions will be made at the conclusion of the fiscal year. The tax character of distributions paid for the year ended December 31, 2014, were as follows::
| | | | | | |
| | Ordinary income | | $ | 2,669 | |
| | Tax exempt income | | | 238,385 | |
| | Long-term capital gains | | | 179,123 | |
At June 30, 2015, the identified cost for federal income tax purposes, the resulting gross unrealized appreciation and depreciation, and the net unrealized appreciation were as follows:
| | | | | | |
| | Cost for federal income tax purposes | | $ | 45,517,034 | |
| | Unrealized appreciation | | | 235,020 | |
| | Unrealized depreciation | | | (87,980 | ) |
| | | | | | |
| | Net unrealized appreciation | | $ | 147,040 | |
| | | | | | |
17
Ohio Tax Exempt Series
Literature Requests
(unaudited)
Proxy Voting Policies and Procedures
A description of the policies and procedures that the Fund uses to determine how to vote proxies relating to portfolio securities is available, without charge, upon request:
| | |
| By phone | | 1-800-466-3863 |
| On the Securities and Exchange | | |
| Commission’s (SEC) web site | | http://www.sec.gov |
Proxy Voting Record
Information regarding how the Fund voted proxies relating to portfolio securities during the most recent 12-month period ended June 30th is available, without charge, upon request:
| | |
| By phone | | 1-800-466-3863 |
| On the SEC’s web site | | http://www.sec.gov |
Quarterly Portfolio Holdings
The Series’ complete schedule of portfolio holdings for the 1st and 3rd quarters of each fiscal year are provided on Form N-Q, and are available, without charge, upon request:
| | |
| By phone | | 1-800-466-3863 |
| On the SEC’s web site | | http://www.sec.gov |
The Series’ Form N-Q may be reviewed and copied at the SEC’s Public Reference Room in Washington, D.C. Information on the operation of the Public Reference Room may be obtained by calling 1-800-SEC-0330.
Prospectus and Statement of Additional Information (SAI)
For more information about any of the Manning & Napier Fund, Inc. Series, you may obtain a prospectus and SAI at www.manning-napier.com or by calling (800) 466-3863. Before investing, carefully consider the objectives, risks, charges and expenses of the investment and read the prospectus carefully as it contains this and other information about the investment company. In addition, this information can be found on the SEC’s web site, http://www.sec.gov.
Additional information available at www.manning-napier.com
1. Fund Holdings - Month-End
2. Fund Holdings - Quarter-End
3. Shareholder Report - Annual
4. Shareholder Report - Semi-Annual
The Fund also offers electronic notification or “e-delivery” when certain documents are available on-line to be downloaded or reviewed. Direct shareholders can elect to receive electronic notification when shareholder reports, prospectus updates, and/or statements are available. If you do not currently have on-line access to your account, you can establish access by going to www.manning-napier.com, click on “Login” in the top corner of the page, and follow the prompts to self-enroll. Once enrolled, you can set your electronic notification preferences by clicking on the Account Options tab located within the green toolbar and then select E-Delivery Option. Should you have any questions on either how to establish on-line access or how to update your account settings, please contact Investor Services at 1-800-466-3863.
The Manning & Napier Fund, Inc. is managed by Manning & Napier Advisors, LLC. Manning & Napier Investor Services, Inc., an affiliate of Manning & Napier Advisors, LLC, is the distributor of the Fund shares.
MNOTE-6/15-SAR

Diversified Tax Exempt Series
Shareholder Expense Example
(unaudited)
As a shareholder of the Series, you may incur two types of costs: (1) transaction costs and (2) ongoing costs, including management fees and other Series expenses. This example is intended to help you understand your ongoing costs (in dollars) of investing in the Series and to compare these costs with the ongoing costs of investing in other mutual funds.
The example is based on an investment of $1,000 invested at the beginning of the period and held for the entire period (January 1, 2015 to June 30, 2015).
Actual Expenses
The first line of the table below provides information about actual account values and actual expenses. You may use the information in this line, together with the amount you invested, to estimate the expenses that you paid over the period. Simply divide your account value by $1,000 (for example, an $8,600 account value divided by $1,000 = 8.6), then multiply the result by the number in the first line under the heading entitled “Expenses Paid During Period” to estimate the expenses you paid on your account during this period.
Hypothetical Example for Comparison Purposes
The second line of the table below provides information about hypothetical account values and hypothetical expenses based on the Series’ actual expense ratio and an assumed rate of return of 5% per year before expenses, which is not the Series’ actual return. The hypothetical account values and expenses may not be used to estimate the actual ending account balance or expenses you paid during the period. You may use this information to compare the ongoing costs of investing in the Series and other funds. To do so, compare this 5% hypothetical example with the 5% hypothetical examples that appear in the shareholder reports of the other funds.
Please note that the expenses shown in the table are meant to highlight your ongoing costs only and do not reflect any transaction costs. Therefore, the second line of the table is useful in comparing ongoing costs only, and will not help you determine the relative total costs of owning different funds. In addition, if these transaction costs were included, your costs would have been higher.
| | | | | | |
| | | BEGINNING
ACCOUNT VALUE
1/1/15 | | ENDING
ACCOUNT VALUE
6/30/15 | | EXPENSES PAID
DURING PERIOD*
1/1/15-6/30/15 |
Actual | | $1,000.00 | | $1,001.80 | | $2.78 |
| |
Hypothetical (5% return before expenses) | | $1,000.00 | | $1,022.02 | | $2.81 |
| |
*Expenses are equal to the Series’ annualized expense ratio (for the six-month period) of 0.56%, multiplied by the average account value over the period, multiplied by 181/365 (to reflect the one-half year period). Expenses are based on the most recent fiscal half year.
1
Diversified Tax Exempt Series
Portfolio Composition as of June 30, 2015
(unaudited)
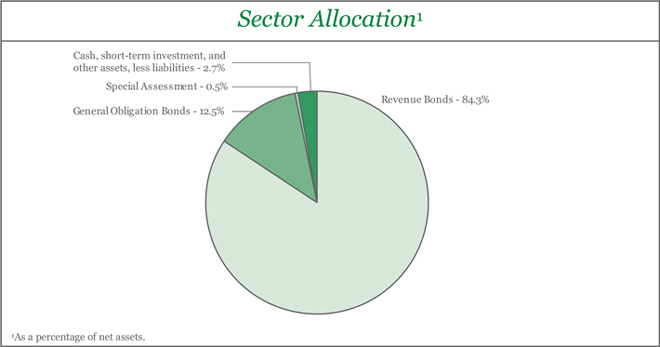
| | | | | | | | | | | | |
| |
Top Ten States2 | |
Florida | | | 8.5 | % | | | | Ohio | | | 5.6 | % |
Washington | | | 7.7 | % | | | | North Carolina | | | 4.6 | % |
Texas | | | 6.9 | % | | | | Georgia | | | 3.6 | % |
New York | | | 6.9 | % | | | | Nebraska | | | 3.5 | % |
Pennsylvania | | | 6.8 | % | | | | Tennessee | | | 3.5 | % |
| | | | | |
| 2 As a percentage of total investments. | | | | | | | | | | | | |
2
Diversified Tax Exempt Series
Investment Portfolio - June 30, 2015
(unaudited)
| | | | | | | | | | | | | | | | | | | | | | |
| | | COUPON
RATE | | | MATURITY
DATE | | | CREDIT
RATING1 | | | PRINCIPAL
AMOUNT | | | VALUE
(NOTE 2) | | | |
| | | | | | |
MUNICIPAL BONDS - 97.3% | | | | | | | | | | | | | | | | | | | | | | |
| | | | | | |
ALASKA - 0.1% | | | | | | | | | | | | | | | | | | | | | | |
| | | | | | |
Alaska Municipal Bond Bank Authority, Series 2, Revenue Bond | | | 5.000% | | | | 9/1/2022 | | | | Aa2 | | | $ | 500,000 | | | $ | 583,125 | | | |
| | | | | | | | | | | | | | | | | | | | | | |
| | | | | | |
ARIZONA - 3.3% | | | | | | | | | | | | | | | | | | | | | | |
| | | | | | |
Arizona Health Facilities Authority, Banner Health, Series A, Revenue Bond | | | 5.000% | | | | 1/1/2019 | | | | AA2 | | | | 795,000 | | | | 844,282 | | | |
Mesa, Multiple Utility Impt., Revenue Bond | | | 5.000% | | | | 7/1/2023 | | | | Aa2 | | | | 1,050,000 | | | | 1,242,276 | | | |
Mesa, Multiple Utility Impt., Revenue Bond | | | 5.000% | | | | 7/1/2024 | | | | Aa2 | | | | 1,200,000 | | | | 1,430,388 | | | |
Pima County Sewer System, Series A, Revenue Bond | | | 5.000% | | | | 7/1/2019 | | | | AA2 | | | | 1,000,000 | | | | 1,145,120 | | | |
Pima County Sewer System, Series B, Revenue Bond | | | 5.000% | | | | 7/1/2020 | | | | AA2 | | | | 1,400,000 | | | | 1,630,930 | | | |
Salt River Project Agricultural Impt. & Power District, Series A, Revenue Bond | | | 5.000% | | | | 12/1/2018 | | | | Aa1 | | | | 1,340,000 | | | | 1,514,401 | | | |
Salt River Project Agricultural Impt. & Power District, Series B, Revenue Bond | | | 4.000% | | | | 1/1/2018 | | | | Aa1 | | | | 1,715,000 | | | | 1,845,837 | | | |
Salt River Project Agricultural Impt. & Power District, Series B, Revenue Bond | | | 5.000% | | | | 12/1/2020 | | | | Aa1 | | | | 400,000 | | | | 470,056 | | | |
Tucson Water System, Revenue Bond, NATL | | | 4.000% | | | | 7/1/2016 | | | | Aa2 | | | | 1,000,000 | | | | 1,036,510 | | | |
Tucson Water System, Series A, Revenue Bond | | | 5.000% | | | | 7/1/2018 | | | | Aa2 | | | | 1,400,000 | | | | 1,565,690 | | | |
Yavapai County Industrial Development Authority, Northern Arizona Healthcare System, Revenue Bond | | | 5.000% | | | | 10/1/2020 | | | | AA2 | | | | 460,000 | | | | 531,824 | | | |
| | | | | | | | | | | | | | | | | | | | | | |
| | | | | | |
| | | | | | | | | | | | | | | | | | | 13,257,314 | | | |
| | | | | | | | | | | | | | | | | | | | | | |
| | | | | | |
COLORADO - 1.9% | | | | | | | | | | | | | | | | | | | | | | |
| | | | | | |
Boulder Water & Sewer, Revenue Bond | | | 5.000% | | | | 12/1/2019 | | | | Aa1 | | | | 1,500,000 | | | | 1,735,140 | | | |
Colorado Springs Utilities System, Series C-1, Revenue Bond | | | 5.000% | | | | 11/15/2019 | | | | Aa2 | | | | 2,435,000 | | | | 2,818,902 | | | |
Denver Wastewater Management Division Department of Public Works, Revenue Bond | | | 4.000% | | | | 11/1/2020 | | | | Aa2 | | | | 1,500,000 | | | | 1,691,280 | | | |
Platte River Power Authority, Series GG, Revenue Bond, AGM | | | 5.000% | | | | 6/1/2018 | | | | Aa2 | | | | 1,210,000 | | | | 1,348,037 | | | |
| | | | | | | | | | | | | | | | | | | | | | |
| | | | | | |
| | | | | | | | | | | | | | | | | | | 7,593,359 | | | |
| | | | | | | | | | | | | | | | | | | | | | |
| | | | | | |
CONNECTICUT - 0.1% | | | | | | | | | | | | | | | | | | | | | | |
| | | | | | |
Connecticut Municipal Electric Energy Cooperative, Series A, Revenue Bond | | | 4.000% | | | | 1/1/2017 | | | | Aa3 | | | | 420,000 | | | | 440,878 | | | |
| | | | | | | | | | | | | | | | | | | | | | |
The accompanying notes are an integral part of the financial statements.
3
Diversified Tax Exempt Series
Investment Portfolio - June 30, 2015
(unaudited)
| | | | | | | | | | | | | | | | | | | | | | |
| | | COUPON
RATE | | | MATURITY
DATE | | | CREDIT
RATING1 | | | PRINCIPAL
AMOUNT | | | VALUE
(NOTE 2) | | | |
| | | | | | |
MUNICIPAL BONDS (continued) | | | | | | | | | | | | | | | | | | | | | | |
| | | | | | |
DELAWARE - 0.9% | | | | | | | | | | | | | | | | | | | | | | |
| | | | | | |
Delaware River & Bay Authority, Series C, Revenue Bond | | | 5.000% | | | | 1/1/2019 | | | | A1 | | | $ | 2,000,000 | | | $ | 2,250,400 | | | |
New Castle County, Public Impt., Prerefunded Balance, Series A, G.O. Bond | | | 4.250% | | | | 7/15/2026 | | | | Aaa | | | | 1,265,000 | | | | 1,267,113 | | | |
| | | | | | | | | | | | | | | | | | | | | | |
| | | | | | |
| | | | | | | | | | | | | | | | | | | 3,517,513 | | | |
| | | | | | | | | | | | | | | | | | | | | | |
| | | | | | |
DISTRICT OF COLUMBIA - 0.3% | | | | | | | | | | | | | | | | | | | | | | |
| | | | | | |
District of Columbia Water & Sewer Authority, Series C, Revenue Bond | | | 5.000% | | | | 10/1/2022 | | | | Aa3 | | | | 1,000,000 | | | | 1,190,600 | | | |
| | | | | | | | | | | | | | | | | | | | | | |
| | | | | | |
FLORIDA - 8.4% | | | | | | | | | | | | | | | | | | | | | | |
| | | | | | |
Cape Coral, Water Utility Impt., Special Assessment, NATL | | | 4.500% | | | | 7/1/2021 | | | | A2 | | | | 1,780,000 | | | | 1,845,771 | | | |
Charlotte County Utility System Revenue, Revenue Bond, AGM | | | 4.100% | | | | 10/1/2021 | | | | Aa3 | | | | 900,000 | | | | 936,810 | | | |
Daytona Beach Utility System, Water Utility Impt., Revenue Bond, AGM | | | 5.000% | | | | 11/1/2019 | | | | A2 | | | | 1,010,000 | | | | 1,155,076 | | | |
Florida Municipal Power Agency, St. Lucie Project, Series A, Revenue Bond | | | 5.000% | | | | 10/1/2018 | | | | A2 | | | | 1,065,000 | | | | 1,189,168 | | | |
Florida Municipal Power Agency, Stanton II Project, Swap Termination, Series A, Revenue Bond | | | 4.000% | | | | 10/1/2017 | | | | A1 | | | | 635,000 | | | | 677,024 | | | |
Florida’s Turnpike Enterprise, Series A, Revenue Bond | | | 5.000% | | | | 7/1/2017 | | | | Aa3 | | | | 1,000,000 | | | | 1,085,160 | | | |
Florida’s Turnpike Enterprise, Series C, Revenue Bond | | | 5.000% | | | | 7/1/2019 | | | | Aa3 | | | | 920,000 | | | | 1,052,738 | | | |
Fort Lauderdale, Water & Sewer, Revenue Bond | | | 5.000% | | | | 9/1/2020 | | | | Aa1 | | | | 1,545,000 | | | | 1,803,170 | | | |
Fort Myers Utility System, Utility Impt., Revenue Bond | | | 5.000% | | | | 10/1/2019 | | | | Aa3 | | | | 785,000 | | | | 902,303 | | | |
JEA Electric System, Series B, Revenue Bond | | | 5.000% | | | | 10/1/2019 | | | | Aa3 | | | | 2,000,000 | | | | 2,292,620 | | | |
JEA Electric System, Swap Termination, Series B, Revenue Bond | | | 5.000% | | | | 10/1/2015 | | | | Aa3 | | | | 1,000,000 | | | | 1,012,190 | | | |
JEA Electric System, Swap Termination, Series B, Revenue Bond | | | 5.000% | | | | 10/1/2019 | | | | Aa3 | | | | 1,500,000 | | | | 1,719,465 | | | |
Miami-Dade County Expressway Authority, Swap Termination, Series A, Revenue Bond, AGM | | | 4.000% | | | | 7/1/2018 | | | | A2 | | | | 1,000,000 | | | | 1,079,260 | | | |
Miami-Dade County, Transit System Sales Surtax, Transit Impt., Series A, Revenue Bond, AGC | | | 4.000% | | | | 7/1/2017 | | | | A1 | | | | 1,465,000 | | | | 1,558,555 | | | |
Miami-Dade County, Water & Sewer System, Revenue Bond | | | 5.000% | | | | 10/1/2023 | | | | Aa3 | | | | 2,000,000 | | | | 2,353,960 | | | |
Miami-Dade County, Water & Sewer System, Series B, Revenue Bond, AGM | | | 5.250% | | | | 10/1/2019 | | | | Aa3 | | | | 500,000 | | | | 579,865 | | | |
Miami-Dade County, Water & Sewer System, Series C, Revenue Bond, BHAC | | | 5.000% | | | | 10/1/2015 | | | | Aa1 | | | | 700,000 | | | | 708,351 | | | |
The accompanying notes are an integral part of the financial statements.
4
Diversified Tax Exempt Series
Investment Portfolio - June 30, 2015
(unaudited)
| | | | | | | | | | | | | | | | | | | | | | |
| | | COUPON
RATE | | | MATURITY
DATE | | | CREDIT
RATING1 | | | PRINCIPAL
AMOUNT | | | VALUE
(NOTE 2) | | | |
| | | | | | |
MUNICIPAL BONDS (continued) | | | | | | | | | | | | | | | | | | | | | | |
| | | | | | |
FLORIDA (continued) | | | | | | | | | | | | | | | | | | | | | | |
| | | | | | |
Okaloosa County, Water & Sewer, Revenue Bond | | | 5.000% | | | | 7/1/2023 | | | | Aa3 | | | $ | 2,065,000 | | | $ | 2,438,207 | | | |
Orlando Utilities Commission, Revenue Bond | | | 5.000% | | | | 10/1/2019 | | | | Aa2 | | | | 740,000 | | | | 783,512 | | | |
Orlando Utilities Commission, Series A, Revenue Bond | | | 4.000% | | | | 10/1/2017 | | | | Aa2 | | | | 400,000 | | | | 428,604 | | | |
Orlando Utilities Commission, Series C, Revenue Bond | | | 5.000% | | | | 10/1/2016 | | | | Aa2 | | | | 1,000,000 | | | | 1,057,150 | | | |
Orlando-Orange County Expressway Authority, Revenue Bond | | | 5.000% | | | | 7/1/2018 | | | | A2 | | | | 675,000 | | | | 752,544 | | | |
Orlando-Orange County Expressway Authority, Revenue Bond | | | 5.000% | | | | 7/1/2019 | | | | A2 | | | | 500,000 | | | | 571,090 | | | |
Orlando-Orange County Expressway Authority, Swap Termination, Series B, Revenue Bond | | | 5.000% | | | | 7/1/2020 | | | | A2 | | | | 1,165,000 | | | | 1,352,285 | | | |
Port St. Lucie Utility System, Revenue Bond, AGC | | | 5.000% | | | | 9/1/2017 | | | | A1 | | | | 1,730,000 | | | | 1,881,859 | | | |
Port St. Lucie Utility System, Revenue Bond, AGC | | | 5.000% | | | | 9/1/2018 | | | | A1 | | | | 400,000 | | | | 447,116 | | | |
Port St. Lucie Utility System, Water Utility Impt., Revenue Bond, NATL | | | 5.250% | | | | 9/1/2023 | | | | A1 | | | | 500,000 | | | | 588,080 | | | |
South Miami Health Facilities Authority, Baptist Health South Florida Group, Revenue Bond | | | 5.000% | | | | 8/15/2018 | | | | Aa2 | | | | 500,000 | | | | 543,395 | | | |
Tampa, BayCare Health System, Revenue Bond | | | 5.000% | | | | 11/15/2018 | | | | Aa2 | | | | 500,000 | | | | 559,830 | | | |
| | | | | | | | | | | | | | | | | | | | | | |
| | | | | | |
| | | | | | | | | | | | | | | | | | | 33,355,158 | | | |
| | | | | | | | | | | | | | | | | | | | | | |
| | | | | | |
GEORGIA - 3.6% | | | | | | | | | | | | | | | | | | | | | | |
| | | | | | |
Atlanta, Water & Wastewater, Series B, Revenue Bond | | | 5.000% | | | | 11/1/2017 | | | | Aa3 | | | | 1,000,000 | | | | 1,095,430 | | | |
Atlanta, Water & Wastewater, Series B, Revenue Bond | | | 5.000% | | | | 11/1/2019 | | | | Aa3 | | | | 1,160,000 | | | | 1,335,752 | | | |
Augusta Water & Sewerage, Revenue Bond, AGM | | | 5.000% | | | | 10/1/2016 | | | | Aa3 | | | | 1,050,000 | | | | 1,109,461 | | | |
DeKalb County, Water & Sewerage, Revenue Bond | | | 5.000% | | | | 10/1/2019 | | | | Aa3 | | | | 500,000 | | | | 573,825 | | | |
DeKalb County, Water & Sewerage, Series A, Revenue Bond | | | 5.000% | | | | 10/1/2018 | | | | Aa3 | | | | 1,585,000 | | | | 1,777,879 | | | |
Fulton County Water & Sewerage, Revenue Bond | | | 5.000% | | | | 1/1/2017 | | | | Aa3 | | | | 1,000,000 | | | | 1,065,410 | | | |
Fulton County Water & Sewerage, Revenue Bond | | | 5.000% | | | | 1/1/2019 | | | | Aa3 | | | | 1,200,000 | | | | 1,357,284 | | | |
Madison, Water & Sewer, Prerefunded Balance, Revenue Bond, AMBAC | | | 4.625% | | | | 7/1/2030 | | | | WR3 | | | | 1,000,000 | | | | 1,021,810 | | | |
Municipal Electric Authority of Georgia, Series A, Revenue Bond | | | 5.250% | | | | 1/1/2019 | | | | A2 | | | | 2,250,000 | | | | 2,551,703 | | | |
Municipal Electric Authority of Georgia, Series A, Revenue Bond | | | 5.250% | | | | 1/1/2019 | | | | A2 | | | | 500,000 | | | | 567,045 | | | |
Municipal Electric Authority of Georgia, Series A, Revenue Bond | | | 5.000% | | | | 11/1/2019 | | | | A1 | | | | 485,000 | | | | 557,158 | | | |
The accompanying notes are an integral part of the financial statements.
5
Diversified Tax Exempt Series
Investment Portfolio - June 30, 2015
(unaudited)
| | | | | | | | | | | | | | | | | | | | | | |
| | | COUPON
RATE | | | MATURITY
DATE | | | CREDIT
RATING1 | | | PRINCIPAL
AMOUNT | | | VALUE
(NOTE 2) | | | |
| | | | | | |
MUNICIPAL BONDS (continued) | | | | | | | | | | | | | | | | | | | | | | |
| | | | | | |
GEORGIA (continued) | | | | | | | | | | | | | | | | | | | | | | |
| | | | | | |
Municipal Electric Authority of Georgia, Series A, Revenue Bond | | | 5.000% | | | | 11/1/2020 | | | | A1 | | | $ | 1,000,000 | | | $ | 1,165,760 | | | |
| | | | | | | | | | | | | | | | | | | | | | |
| | | | | | |
| | | | | | | | | | | | | | | | | | | 14,178,517 | | | |
| | | | | | | | | | | | | | | | | | | | | | |
| | | | | | |
HAWAII - 1.0% | | | | | | | | | | | | | | | | | | | | | | |
| | | | | | |
Honolulu County Wastewater System, Sewer Impt., Series A, Revenue Bond | | | 5.000% | | | | 7/1/2020 | | | | Aa3 | | | | 1,000,000 | | | | 1,135,120 | | | |
Honolulu County Wastewater System, Sewer Impt., Series B, Revenue Bond | | | 5.000% | | | | 7/1/2020 | | | | Aa2 | | | | 2,320,000 | | | | 2,720,989 | | | |
| | | | | | | | | | | | | | | | | | | | | | |
| | | | | | |
| | | | | | | | | | | | | | | | | | | 3,856,109 | | | |
| | | | | | | | | | | | | | | | | | | | | | |
| | | | | | |
ILLINOIS - 3.2% | | | | | | | | | | | | | | | | | | | | | | |
| | | | | | |
Aurora, Waterworks & Sewerage, Series B, Revenue Bond | | | 3.000% | | | | 12/1/2022 | | | | AA2 | | | | 500,000 | | | | 516,540 | | | |
Aurora, Waterworks & Sewerage, Series B, Revenue Bond | | | 3.000% | | | | 12/1/2023 | | | | AA2 | | | | 625,000 | | | | 639,931 | | | |
Central Lake County Joint Action Water Agency, Revenue Bond | | | 4.000% | | | | 5/1/2018 | | | | Aa2 | | | | 750,000 | | | | 811,080 | | | |
Central Lake County Joint Action Water Agency, Revenue Bond | | | 4.000% | | | | 5/1/2019 | | | | Aa2 | | | | 760,000 | | | | 835,947 | | | |
Central Lake County Joint Action Water Agency, Series A, Revenue Bond | | | 2.000% | | | | 5/1/2017 | | | | Aa2 | | | | 575,000 | | | | 585,298 | | | |
Chicago Waterworks, Water Utility Impt., Revenue Bond | | | 3.000% | | | | 11/1/2016 | | | | Baa2 | | | | 875,000 | | | | 891,266 | | | |
Chicago Waterworks, Water Utility Impt., Revenue Bond | | | 5.000% | | | | 11/1/2017 | | | | Baa2 | | | | 600,000 | | | | 639,528 | | | |
Du Page & Will Counties Community School District No. 204 Indian Prairie, Series A, G.O. Bond | | | 5.000% | | | | 12/30/2018 | | | | Aa1 | | | | 820,000 | | | | 926,206 | | | |
Illinois Municipal Electric Agency, Series A, Revenue Bond | | | 5.000% | | | | 2/1/2018 | | | | A1 | | | | 500,000 | | | | 548,985 | | | |
Illinois Municipal Electric Agency, Series A, Revenue Bond | | | 5.000% | | | | 2/1/2025 | | | | A1 | | | | 2,000,000 | | | | 2,340,700 | | | |
Illinois State Toll Highway Authority, Series A, Revenue Bond | | | 5.000% | | | | 12/1/2019 | | | | Aa3 | | | | 1,000,000 | | | | 1,146,710 | | | |
Illinois State, Public Impt., G.O. Bond | | | 4.000% | | | | 7/1/2016 | | | | A3 | | | | 2,000,000 | | | | 2,053,220 | | | |
Sangamon & Morgan Counties Community Unit School District No. 16 New Berlin, School Impt., G.O. Bond, NATL | | | 5.500% | | | | 2/1/2019 | | | | A3 | | | | 725,000 | | | | 820,562 | | | |
| | | | | | | | | | | | | | | | | | | | | | |
| | | | | | |
| | | | | | | | | | | | | | | | | | | 12,755,973 | | | |
| | | | | | | | | | | | | | | | | | | | | | |
The accompanying notes are an integral part of the financial statements.
6
Diversified Tax Exempt Series
Investment Portfolio - June 30, 2015
(unaudited)
| | | | | | | | | | | | | | | | | | | | | | |
| | | COUPON
RATE | | | MATURITY
DATE | | | CREDIT
RATING1 | | | PRINCIPAL
AMOUNT | | | VALUE
(NOTE 2) | | | |
| | | | | | |
MUNICIPAL BONDS (continued) | | | | | | | | | | | | | | | | | | | | | | |
| | | | | | |
INDIANA - 2.8% | | | | | | | | | | | | | | | | | | | | | | |
| | | | | | |
Avon Community School Building Corp., Revenue Bond, AMBAC | | | 4.250% | | | | 7/15/2018 | | | | AA2 | | | $ | 1,450,000 | | | $ | 1,540,495 | | | |
Fort Wayne Waterworks, Water Utility Impt., Revenue Bond | | | 2.000% | | | | 12/1/2020 | | | | Aa3 | | | | 745,000 | | | | 755,609 | | | |
Indiana Finance Authority, Beacon Health System, Series A, Revenue Bond | | | 5.000% | | | | 8/15/2017 | | | | AA2 | | | | 500,000 | | | | 543,360 | | | |
Indiana Municipal Power Agency, Series A, Revenue Bond | | | 5.000% | | | | 1/1/2019 | | | | A1 | | | | 2,540,000 | | | | 2,857,068 | | | |
Indiana Municipal Power Agency, Series A, Revenue Bond | | | 4.000% | | | | 1/1/2020 | | | | A1 | | | | 750,000 | | | | 827,557 | | | |
Lafayette, Sewage Works, Revenue Bond | | | 4.000% | | | | 7/1/2017 | | | | AA2 | | | | 500,000 | | | | 531,930 | | | |
Lafayette, Sewage Works, Sewer Impt., Revenue Bond | | | 3.000% | | | | 1/1/2017 | | | | AA2 | | | | 470,000 | | | | 486,417 | | | |
Lafayette, Sewage Works, Sewer Impt., Revenue Bond | | | 3.000% | | | | 7/1/2018 | | | | AA2 | | | | 475,000 | | | | 501,006 | | | |
Shelbyville Central Renovation School Building Corp., Prerefunded Balance, School Impt., Revenue Bond, NATL | | | 5.000% | | | | 7/15/2018 | | | | A3 | | | | 3,000,000 | | | | 3,005,880 | | | |
| | | | | | | | | | | | | | | | | | | | | | |
| | | | | | |
| | | | | | | | | | | | | | | | | | | 11,049,322 | | | |
| | | | | | | | | | | | | | | | | | | | | | |
| | | | | | |
IOWA - 0.6% | | | | | | | | | | | | | | | | | | | | | | |
| | | | | | |
Cedar Falls, Electric Utility, Revenue Bond | | | 5.000% | | | | 12/1/2023 | | | | Aa2 | | | | 2,000,000 | | | | 2,389,180 | | | |
| | | | | | | | | | | | | | | | | | | | | | |
| | | | | | |
KANSAS - 3.2% | | | | | | | | | | | | | | | | | | | | | | |
| | | | | | |
Kansas Development Finance Authority, Series D, Revenue Bond | | | 5.000% | | | | 11/15/2020 | | | | Aa2 | | | | 500,000 | | | | 572,260 | | | |
Kansas Turnpike Authority, Series A, Revenue Bond | | | 5.000% | | | | 9/1/2019 | | | | AA2 | | | | 2,965,000 | | | | 3,402,634 | | | |
Topeka Combined Utility, Series A, Revenue Bond | | | 4.000% | | | | 8/1/2019 | | | | Aa3 | | | | 845,000 | | | | 930,227 | | | |
Wichita, Water & Sewer Utility, Series A, Revenue Bond | | | 5.000% | | | | 10/1/2017 | | | | AA2 | | | | 2,000,000 | | | | 2,185,700 | | | |
Wichita, Water & Sewer Utility, Series A, Revenue Bond | | | 5.000% | | | | 10/1/2018 | | | | AA2 | | | | 1,000,000 | | | | 1,123,910 | | | |
Wichita, Water & Sewer Utility, Series B, Revenue Bond | | | 5.000% | | | | 10/1/2019 | | | | AA2 | | | | 2,000,000 | | | | 2,297,520 | | | |
Wyandotte County-Kansas City Unified Government Utility System, Water Utility Impt., Series A, Revenue Bond | | | 4.000% | | | | 9/1/2018 | | | | A3 | | | | 450,000 | | | | 487,201 | | | |
Wyandotte County-Kansas City Unified Government Utility System, Water Utility Impt., Series A, Revenue Bond | | | 5.000% | | | | 9/1/2020 | | | | A3 | | | | 1,495,000 | | | | 1,729,267 | | | |
| | | | | | | | | | | | | | | | | | | | | | |
| | | | | | |
| | | | | | | | | | | | | | | | | | | 12,728,719 | | | |
| | | | | | | | | | | | | | | | | | | | | | |
The accompanying notes are an integral part of the financial statements.
7
Diversified Tax Exempt Series
Investment Portfolio - June 30, 2015
(unaudited)
| | | | | | | | | | | | | | | | | | | | | | |
| | | COUPON
RATE | | | MATURITY
DATE | | | CREDIT
RATING1 | | | PRINCIPAL
AMOUNT | | | VALUE
(NOTE 2) | | | |
| | | | | | |
MUNICIPAL BONDS (continued) | | | | | | | | | | | | | | | | | | | | | | |
| | | | | | |
KENTUCKY - 0.1% | | | | | | | | | | | | | | | | | | | | | | |
| | | | | | |
Kentucky Turnpike Authority, Series A, Revenue Bond | | | 5.000% | | | | 7/1/2019 | | | | Aa2 | | | $ | 500,000 | | | $ | 570,250 | | | |
| | | | | | | | | | | | | | | | | | | | | | |
| | | | | | |
LOUISIANA - 1.3% | | | | | | | | | | | | | | | | | | | | | | |
| | | | | | |
Lafayette Utilities, Sewer Impt., Revenue Bond | | | 4.000% | | | | 11/1/2018 | | | | A1 | | | | 1,135,000 | | | | 1,236,900 | | | |
Lafayette Utilities, Water & Sewer Impt., Revenue Bond | | | 5.000% | | | | 11/1/2019 | | | | A1 | | | | 990,000 | | | | 1,136,391 | | | |
New Orleans, Water Utility Impt., Revenue Bond | | | 5.000% | | | | 12/1/2020 | | | | BBB2 | | | | 1,700,000 | | | | 1,947,333 | | | |
St. Charles Parish Waterworks & Wastewater District No. 1, Revenue Bond | | | 2.000% | | | | 7/1/2017 | | | | A2 | | | | 750,000 | | | | 765,735 | | | |
| | | | | | | | | | | | | | | | | | | | | | |
| | | | | | |
| | | | | | | | | | | | | | | | | | | 5,086,359 | | | |
| | | | | | | | | | | | | | | | | | | | | | |
| | | | | | |
MAINE - 0.6% | | | | | | | | | | | | | | | | | | | | | | |
| | | | | | |
Maine Municipal Bond Bank, Various Purposes Impt., Series E, Revenue Bond | | | 4.000% | | | | 11/1/2021 | | | | Aa2 | | | | 570,000 | | | | 638,582 | | | |
Maine Turnpike Authority, Revenue Bond | | | 5.000% | | | | 7/1/2017 | | | | Aa3 | | | | 1,500,000 | | | | 1,627,740 | | | |
| | | | | | | | | | | | | | | | | | | | | | |
| | | | | | |
| | | | | | | | | | | | | | | | | | | 2,266,322 | | | |
| | | | | | | | | | | | | | | | | | | | | | |
| | | | | | |
MARYLAND - 0.6% | | | | | | | | | | | | | | | | | | | | | | |
| | | | | | |
Baltimore, Water Utility Impt., Series A, Revenue Bond | | | 4.000% | | | | 7/1/2018 | | | | Aa3 | | | | 500,000 | | | | 542,715 | | | |
Maryland Health & Higher Educational Facilities Authority, Revenue Bond | | | 5.000% | | | | 7/1/2019 | | | | A2 | | | | 500,000 | | | | 563,175 | | | |
Maryland State, Public Impt., Series A, G.O. Bond | | | 5.250% | | | | 3/1/2017 | | | | Aaa | | | | 1,000,000 | | | | 1,077,600 | | | |
| | | | | | | | | | | | | | | | | | | | | | |
| | | | | | |
| | | | | | | | | | | | | | | | | | | 2,183,490 | | | |
| | | | | | | | | | | | | | | | | | | | | | |
| | | | | | |
MASSACHUSETTS - 1.6% | | | | | | | | | | | | | | | | | | | | | | |
| | | | | | |
Commonwealth of Massachusetts, Public Impt., Series D-2, G.O. Bond4 | | | 0.340% | | | | 8/1/2043 | | | | Aa1 | | | | 1,225,000 | | | | 1,218,397 | | | |
Commonwealth of Massachusetts, Public Impt., Series E, G.O. Bond | | | 5.000% | | | | 12/1/2016 | | | | Aa1 | | | | 500,000 | | | | 532,085 | | | |
Lynn Water & Sewer Commission, Revenue Bond | | | 5.000% | | | | 6/1/2017 | | | | A1 | | | | 1,500,000 | | | | 1,621,845 | | | |
Massachusetts Health & Educational Facilities Authority, Series G, Revenue Bond | | | 5.000% | | | | 7/1/2018 | | | | Aa3 | | | | 600,000 | | | | 649,680 | | | |
Massachusetts Municipal Wholesale Electric Co., Project No. 3, Revenue Bond | | | 5.000% | | | | 7/1/2016 | | | | A3 | | | | 1,000,000 | | | | 1,045,370 | | | |
Massachusetts Municipal Wholesale Electric Co., Project No. 5, Series A, Revenue Bond | | | 5.000% | | | | 7/1/2015 | | | | A2 | | | | 500,000 | | | | 500,065 | | | |
Massachusetts Municipal Wholesale Electric Co., Project No. 6, Revenue Bond | | | 5.000% | | | | 7/1/2017 | | | | A3 | | | | 590,000 | | | | 638,887 | | | |
| | | | | | | | | | | | | | | | | | | | | | |
| | | | | | |
| | | | | | | | | | | | | | | | | | | 6,206,329 | | | |
| | | | | | | | | | | | | | | | | | | | | | |
The accompanying notes are an integral part of the financial statements.
8
Diversified Tax Exempt Series
Investment Portfolio - June 30, 2015
(unaudited)
| | | | | | | | | | | | | | | | | | | | | | |
| | | COUPON
RATE | | | MATURITY
DATE | | | CREDIT
RATING1 | | | PRINCIPAL
AMOUNT | | | VALUE
(NOTE 2) | | | |
| | | | | | |
MUNICIPAL BONDS (continued) | | | | | | | | | | | | | | | | | | | | | | |
| | | | | | |
MICHIGAN - 1.2% | | | | | | | | | | | | | | | | | | | | | | |
| | | | | | |
Ann Arbor Sewage Disposal System, Revenue Bond | | | 3.000% | | | | 7/1/2020 | | | | AA2 | | | $ | 1,000,000 | | | $ | 1,074,050 | | | |
Bay City School District, G.O. Bond | | | 3.000% | | | | 11/1/2016 | | | | AA2 | | | | 500,000 | | | | 514,780 | | | |
Emmet County, Public Impt., G.O. Bond | | | 2.250% | | | | 5/1/2018 | | | | Aa3 | | | | 910,000 | | | | 935,799 | | | |
Grand Rapids, Water Supply System, Revenue Bond | | | 5.000% | | | | 1/1/2018 | | | | Aa2 | | | | 550,000 | | | | 604,961 | | | |
Walled Lake Consolidated School District, G.O. Bond | | | 5.000% | | | | 5/1/2019 | | | | Aa2 | | | | 1,000,000 | | | | 1,126,800 | | | |
West Ottawa Public Schools, Series I, G.O. Bond | | | 5.000% | | | | 5/1/2019 | | | | Aa2 | | | | 400,000 | | | | 450,720 | | | |
| | | | | | | | | | | | | | | | | | | | | | |
| | | | | | |
| | | | | | | | | | | | | | | | | | | 4,707,110 | | | |
| | | | | | | | | | | | | | | | | | | | | | |
| | | | | | |
MINNESOTA - 0.7% | | | | | | | | | | | | | | | | | | | | | | |
| | | | | | |
Minnesota Agricultural & Economic Development Board, Series C-1, Revenue Bond, AGC | | | 5.000% | | | | 2/15/2016 | | | | AA2 | | | | 540,000 | | | | 554,429 | | | |
Minnesota Municipal Power Agency, Series A, Revenue Bond | | | 5.000% | | | | 10/1/2018 | | | | A2 | | | | 2,130,000 | | | | 2,382,682 | | | |
Western Minnesota Municipal Power Agency, Prerefunded Balance, Revenue Bond | | | 6.625% | | | | 1/1/2016 | | | | Aaa | | | | 35,000 | | | | 36,115 | | | |
| | | | | | | | | | | | | | | | | | | | | | |
| | | | | | |
| | | | | | | | | | | | | | | | | | | 2,973,226 | | | |
| | | | | | | | | | | | | | | | | | | | | | |
| | | | | | |
MISSISSIPPI - 0.2% | | | | | | | | | | | | | | | | | | | | | | |
| | | | | | |
Mississippi Hospital Equipment & Facilities Authority, Series 1, Revenue Bond | | | 5.000% | | | | 10/1/2017 | | | | Aa3 | | | | 750,000 | | | | 815,325 | | | |
| | | | | | | | | | | | | | | | | | | | | | |
| | | | | | |
MISSOURI - 2.2% | | | | | | | | | | | | | | | | | | | | | | |
| | | | | | |
Kansas City, Sanitary Sewer System, Revenue Bond | | | 4.000% | | | | 1/1/2017 | | | | Aa2 | | | | 2,155,000 | | | | 2,264,108 | | | |
Kansas City, Sanitary Sewer System, Series A, Revenue Bond | | | 2.000% | | | | 1/1/2018 | | | | Aa2 | | | | 2,425,000 | | | | 2,489,044 | | | |
Missouri Housing Development Commission, Series A, Revenue Bond | | | 1.600% | | | | 11/1/2019 | | | | AA2 | | | | 300,000 | | | | 301,479 | | | |
Missouri Joint Municipal Electric Utility Commission, Prerefunded Balance, Series A, Revenue Bond, AMBAC | | | 5.000% | | | | 1/1/2021 | | | | A2 | | | | 1,535,000 | | | | 1,634,929 | | | |
Missouri Joint Municipal Electric Utility Commission, Revenue Bond | | | 5.000% | | | | 1/1/2018 | | | | A3 | | | | 500,000 | | | | 548,140 | | | |
Missouri Joint Municipal Electric Utility Commission, Series A, Revenue Bond | | | 4.000% | | | | 1/1/2018 | | | | A2 | | | | 750,000 | | | | 804,127 | | | |
Missouri State Health & Educational Facilities Authority, Revenue Bond | | | 5.000% | | | | 1/1/2020 | | | | Aa2 | | | | 725,000 | | | | 830,321 | | | |
| | | | | | | | | | | | | | | | | | | | | | |
| | | | | | |
| | | | | | | | | | | | | | | | | | | 8,872,148 | | | |
| | | | | | | | | | | | | | | | | | | | | | |
The accompanying notes are an integral part of the financial statements.
9
Diversified Tax Exempt Series
Investment Portfolio - June 30, 2015
(unaudited)
| | | | | | | | | | | | | | | | | | | | | | |
| | | COUPON
RATE | | | MATURITY
DATE | | | CREDIT
RATING1 | | | PRINCIPAL
AMOUNT | | | VALUE (NOTE 2) | | | |
| | | | | | |
MUNICIPAL BONDS (continued) | | | | | | | | | | | | | | | | | | | | | | |
| | | | | | |
NEBRASKA - 3.5% | | | | | | | | | | | | | | | | | | | | | | |
| | | | | | |
Lincoln Electric System, Revenue Bond | | | 5.000% | | | | 9/1/2021 | | | | AA2 | | | $ | 2,000,000 | | | $ | 2,366,920 | | | |
Municipal Energy Agency of Nebraska, Series A, Revenue Bond | | | 5.000% | | | | 4/1/2018 | | | | A2 | | | | 630,000 | | | | 695,444 | | | |
Municipal Energy Agency of Nebraska, Series A, Revenue Bond | | | 5.000% | | | | 4/1/2018 | | | | A2 | | | | 500,000 | | | | 551,940 | | | |
Nebraska Public Power District, Prerefunded Balance, Series B, Revenue Bond | | | 5.000% | | | | 1/1/2019 | | | | A1 | | | | 600,000 | | | | 659,646 | | | |
Nebraska Public Power District, Revenue Bond | | | 5.000% | | | | 1/1/2019 | | | | A1 | | | | 1,000,000 | | | | 1,128,500 | | | |
Nebraska Public Power District, Series A, Revenue Bond | | | 5.000% | | | | 1/1/2019 | | | | A1 | | | | 500,000 | | | | 564,250 | | | |
Nebraska Public Power District, Series B, Revenue Bond | | | 3.000% | | | | 1/1/2016 | | | | A1 | | | | 905,000 | | | | 917,453 | �� | | |
Nebraska Public Power District, Series B, Revenue Bond | | | 5.000% | | | | 1/1/2020 | | | | A1 | | | | 1,000,000 | | | | 1,150,430 | | | |
Nebraska Public Power District, Series C, Revenue Bond | | | 5.000% | | | | 1/1/2018 | | | | A1 | | | | 2,160,000 | | | | 2,375,849 | | | |
Omaha Public Power District, Series A, Revenue Bond | | | 4.000% | | | | 2/1/2018 | | | | A1 | | | | 1,120,000 | | | | 1,205,098 | | | |
Omaha Public Power District, Series C, Revenue Bond | | | 5.000% | | | | 2/1/2018 | | | | Aa2 | | | | 675,000 | | | | 745,085 | | | |
Omaha Public Power District, Series C, Revenue Bond | | | 5.000% | | | | 2/1/2019 | | | | Aa2 | | | | 1,265,000 | | | | 1,434,396 | | | |
| | | | | | | | | | | | | | | | | | | | | | |
| | | | | | |
| | | | | | | | | | | | | | | | | | | 13,795,011 | | | |
| | | | | | | | | | | | | | | | | | | | | | |
| | | | | | |
NEW HAMPSHIRE - 0.7% | | | | | | | | | | | | | | | | | | | | | | |
| | | | | | |
New Hampshire State Turnpike System, Series B, Revenue Bond | | | 5.000% | | | | 2/1/2020 | | | | A1 | | | | 2,575,000 | | | | 2,963,233 | | | |
| | | | | | | | | | | | | | | | | | | | | | |
| | | | | | |
NEW JERSEY - 1.4% | | | | | | | | | | | | | | | | | | | | | | |
| | | | | | |
Hudson County, G.O. Bond | | | 2.000% | | | | 12/1/2017 | | | | AA2 | | | | 1,000,000 | | | | 1,025,330 | | | |
New Jersey Health Care Facilities Financing Authority, Kennedy Health System, Revenue Bond | | | 2.000% | | | | 7/1/2018 | | | | A3 | | | | 455,000 | | | | 464,214 | | | |
New Jersey State Turnpike Authority, Series A, Revenue Bond | | | 3.000% | | | | 1/1/2016 | | | | A3 | | | | 1,100,000 | | | | 1,114,630 | | | |
New Jersey State Turnpike Authority, Series B, Revenue Bond | | | 5.000% | | | | 1/1/2019 | | | | A3 | | | | 1,625,000 | | | | 1,826,061 | | | |
New Jersey State Turnpike Authority, Series H, Revenue Bond | | | 5.000% | | | | 1/1/2020 | | | | A3 | | | | 915,000 | | | | 1,021,222 | | | |
| | | | | | | | | | | | | | | | | | | | | | |
| | | | | | |
| | | | | | | | | | | | | | | | | | | 5,451,457 | | | |
| | | | | | | | | | | | | | | | | | | | | | |
| | | | | | | | | | | | | | | | | | | | | | |
The accompanying notes are an integral part of the financial statements.
10
Diversified Tax Exempt Series
Investment Portfolio - June 30, 2015
(unaudited)
| | | | | | | | | | | | | | | | | | | | | | |
| | | COUPON
RATE | | | MATURITY
DATE | | | CREDIT
RATING1 | | | PRINCIPAL
AMOUNT | | | VALUE (NOTE 2) | | | |
| | | | | | |
MUNICIPAL BONDS (continued) | | | | | | | | | | | | | | | | | | | | | | |
| | | | | | |
NEW MEXICO - 1.2% | | | | | | | | | | | | | | | | | | | | | | |
| | | | | | |
Albuquerque Bernalillo County Water Utility Authority, Water Utility Impt., Revenue Bond | | | 5.000% | | | | 7/1/2022 | | | | Aa2 | | | $ | 1,250,000 | | | $ | 1,488,087 | | | |
Albuquerque Bernalillo County Water Utility Authority, Water Utility Impt., Revenue Bond | | | 5.000% | | | | 7/1/2023 | | | | Aa2 | | | | 2,000,000 | | | | 2,402,420 | | | |
Las Cruces, Multiple Utility Impt., Revenue Bond | | | 2.000% | | | | 6/1/2018 | | | | Aa2 | | | | 875,000 | | | | 899,255 | | | |
| | | | | | | | | | | | | | | | | | | | | | |
| | | | | | |
| | | | | | | | | | | | | | | | | | | 4,789,762 | | | |
| | | | | | | | | | | | | | | | | | | | | | |
| | | | | | |
NEW YORK - 6.8% | | | | | | | | | | | | | | | | | | | | | | |
| | | | | | |
Metropolitan Transportation Authority, Series F, Revenue Bond | | | 5.000% | | | | 11/15/2018 | | | | A1 | | | | 725,000 | | | | 815,016 | | | |
Metropolitan Transportation Authority, Transit Impt., Series F, Revenue Bond | | | 5.000% | | | | 11/15/2017 | | | | A1 | | | | 1,145,000 | | | | 1,255,412 | | | |
Metropolitan Transportation Authority, Transit Impt., Series F, Revenue Bond | | | 5.000% | | | | 11/15/2019 | | | | A1 | | | | 1,315,000 | | | | 1,511,277 | | | |
Metropolitan Transportation Authority, Transit Impt., Subseries D-2, Revenue Bond4 | | | 0.430% | | | | 11/15/2044 | | | | A1 | | | | 1,600,000 | | | | 1,591,264 | | | |
Nassau County, Public Impt., Series A, G.O. Bond | | | 5.000% | | | | 4/1/2019 | | | | A2 | | | | 1,000,000 | | | | 1,130,170 | | | |
New York City Transitional Finance Authority, Future Tax Secured, Prerefunded Balance, Subseries F-1, Revenue Bond | | | 5.000% | | | | 5/1/2019 | | | | Aa1 | | | | 2,565,000 | | | | 2,916,918 | | | |
New York City, Public Impt., Series F-1, G.O. Bond | | | 5.000% | | | | 6/1/2024 | | | | Aa2 | | | | 2,880,000 | | | | 3,446,035 | | | |
New York City, Series 1, G.O. Bond | | | 5.000% | | | | 8/1/2023 | | | | Aa2 | | | | 2,000,000 | | | | 2,385,100 | | | |
New York State Dormitory Authority, Series 1, Revenue Bond | | | 4.000% | | | | 7/1/2020 | | | | Aa3 | | | | 420,000 | | | | 466,255 | | | |
New York State Thruway Authority Highway & Bridge Trust Fund, Series B, Revenue Bond | | | 5.000% | | | | 4/1/2019 | | | | AA2 | | | | 2,135,000 | | | | 2,393,613 | | | |
New York State Thruway Authority, Highway Impt., Series H, Revenue Bond, NATL | | | 5.000% | | | | 1/1/2017 | | | | A2 | | | | 600,000 | | | | 638,502 | | | |
New York State Thruway Authority, Highway Impt., Series I, Revenue Bond | | | 4.000% | | | | 1/1/2019 | | | | A2 | | | | 1,000,000 | | | | 1,086,430 | | | |
New York State Urban Development Corp., Highway Impt., Series C, Revenue Bond | | | 5.000% | | | | 3/15/2024 | | | | Aa1 | | | | 765,000 | | | | 909,027 | | | |
Triborough Bridge & Tunnel Authority, Highway Impt., Series A, Revenue Bond | | | 4.000% | | | | 11/15/2018 | | | | Aa3 | | | | 500,000 | | | | 548,085 | | | |
Triborough Bridge & Tunnel Authority, Series B, Revenue Bond | | | 5.000% | | | | 11/15/2017 | | | | Aa3 | | | | 575,000 | | | | 630,804 | | | |
Triborough Bridge & Tunnel Authority, Series B, Revenue Bond | | | 4.000% | | | | 11/15/2019 | | | | Aa3 | | | | 725,000 | | | | 806,671 | | | |
Triborough Bridge & Tunnel Authority, Series B, Revenue Bond | | | 5.000% | | | | 11/15/2020 | | | | Aa3 | | | | 920,000 | | | | 1,081,386 | | | |
Triborough Bridge & Tunnel Authority, Subseries A, Revenue Bond | | | 5.000% | | | | 11/15/2023 | | | | A1 | | | | 2,805,000 | | | | 3,314,949 | | | |
| | | | | | | | | | | | | | | | | | | | | | |
| | | | | | |
| | | | | | | | | | | | | | | | | | | 26,926,914 | | | |
| | | | | | | | | | | | | | | | | | | | | | |
The accompanying notes are an integral part of the financial statements.
11
Diversified Tax Exempt Series
Investment Portfolio - June 30, 2015
(unaudited)
| | | | | | | | | | | | | | | | | | | | | | |
| | | COUPON
RATE | | | MATURITY
DATE | | | CREDIT
RATING1 | | | PRINCIPAL
AMOUNT | | | VALUE (NOTE 2) | | | |
| | | | | | |
MUNICIPAL BONDS (continued) | | | | | | | | | | | | | | | | | | | | | | |
| | | | | | |
NORTH CAROLINA - 4.6% | | | | | | | | | | | | | | | | | | | | | | |
| | | | | | |
Cape Fear Public Utility Authority, Sewer Impt., Revenue Bond | | | 5.000% | | | | 8/1/2019 | | | | Aa2 | | | $ | 1,240,000 | | | $ | 1,379,550 | | | |
Charlotte, Water & Sewer System, Revenue Bond | | | 5.000% | | | | 12/1/2020 | | | | Aaa | | | | 1,400,000 | | | | 1,651,300 | | | |
The Charlotte-Mecklenburg Hospital Authority, Series A, Revenue Bond | | | 5.000% | | | | 1/15/2017 | | | | Aa3 | | | | 415,000 | | | | 442,647 | | | |
The Charlotte-Mecklenburg Hospital Authority, Series A, Revenue Bond | | | 3.000% | | | | 1/15/2018 | | | | Aa3 | | | | 500,000 | | | | 523,085 | | | |
Mecklenburg County, Public Impt., Prerefunded Balance, Series A, G.O. Bond | | | 5.000% | | | | 2/1/2018 | | | | Aaa | | | | 5,855,000 | | | | 6,257,941 | | | |
North Carolina Eastern Municipal Power Agency, Series A, Revenue Bond, AGC | | | 5.250% | | | | 1/1/2019 | | | | A3 | | | | 1,265,000 | | | | 1,390,943 | | | |
North Carolina Medical Care Commission, Moses Cone Health System, Revenue Bond | | | 5.000% | | | | 10/1/2020 | | | | AA2 | | | | 580,000 | | | | 660,742 | | | |
North Carolina Municipal Power Agency No. 1, Series A, Revenue Bond | | | 5.250% | | | | 1/1/2017 | | | | A2 | | | | 2,000,000 | | | | 2,136,740 | | | |
North Carolina Municipal Power Agency No. 1, Series A, Revenue Bond | | | 5.000% | | | | 1/1/2020 | | | | A2 | | | | 400,000 | | | | 458,296 | | | |
North Carolina State, Series B, G.O. Bond | | | 5.000% | | | | 6/1/2017 | | | | Aaa | | | | 3,000,000 | | | | 3,249,210 | | | |
| | | | | | | | | | | | | | | | | | | | | | |
| | | | | | |
| | | | | | | | | | | | | | | | | | | 18,150,454 | | | |
| | | | | | | | | | | | | | | | | | | | | | |
| | | | | | |
NORTH DAKOTA - 0.3% | | | | | | | | | | | | | | | | | | | | | | |
| | | | | | |
Fargo, Health System, Revenue Bond | | | 5.500% | | | | 11/1/2016 | | | | A1 | | | | 450,000 | | | | 478,854 | | | |
North Dakota Public Finance Authority, Series A, Revenue Bond | | | 4.000% | | | | 6/1/2018 | | | | AA2 | | | | 800,000 | | | | 864,424 | | | |
| | | | | | | | | | | | | | | | | | | | | | |
| | | | | | |
| | | | | | | | | | | | | | | | | | | 1,343,278 | | | |
| | | | | | | | | | | | | | | | | | | | | | |
| | | | | | |
OHIO - 5.5% | | | | | | | | | | | | | | | | | | | | | | |
| | | | | | |
American Municipal Power, Inc., Fremont Energy Center Project, Series B, Revenue Bond | | | 5.000% | | | | 2/15/2018 | | | | A1 | | | | 425,000 | | | | 467,797 | | | |
American Municipal Power, Inc., Fremont Energy Center Project, Series B, Revenue Bond | | | 5.000% | | | | 2/15/2023 | | | | A1 | | | | 1,895,000 | | | | 2,207,088 | | | |
American Municipal Power, Inc., Prairie State Energy Campus Project, Prerefunded Balance, Revenue Bond | | | 5.000% | | | | 2/15/2016 | | | | WR3 | | | | 820,000 | | | | 843,903 | | | |
American Municipal Power, Inc., Prairie State Energy Campus Project, Unrefunded Balance, Revenue Bond | | | 5.000% | | | | 2/15/2016 | | | | A1 | | | | 330,000 | | | | 339,514 | | | |
American Municipal Power, Inc., Prairie State Energy Campus Project, Unrefunded Balance, Revenue Bond | | | 5.250% | | | | 2/15/2023 | | | | A1 | | | | 25,000 | | | | 27,569 | | | |
Franklin County, Ohio Health Corp., Revenue Bond | | | 5.000% | | | | 5/15/2018 | | | | Aa2 | | | | 640,000 | | | | 709,114 | | | |
The accompanying notes are an integral part of the financial statements.
12
Diversified Tax Exempt Series
Investment Portfolio - June 30, 2015
(unaudited)
| | | | | | | | | | | | | | | | | | | | | | |
| | | COUPON
RATE | | | MATURITY
DATE | | | CREDIT
RATING1 | | | PRINCIPAL
AMOUNT | | | VALUE (NOTE 2) | | | |
| | | | | | |
MUNICIPAL BONDS (continued) | | | | | | | | | | | | | | | | | | | | | | |
| | | | | | |
OHIO (continued) | | | | | | | | | | | | | | | | | | | | | | |
| | | | | | |
Northeast Ohio Regional Sewer District, Sewer Impt., Prerefunded Balance, Revenue Bond, NATL | | | 5.000% | | | | 11/15/2018 | | | | Aa1 | | | $ | 1,000,000 | | | $ | 1,079,780 | | | |
Ohio State Turnpike Commission, Series A, Revenue Bond, NATL | | | 5.500% | | | | 2/15/2018 | | | | Aa3 | | | | 1,000,000 | | | | 1,118,440 | | | |
Ohio State Turnpike Commission, Series A, Revenue Bond, NATL | | | 5.500% | | | | 2/15/2019 | | | | Aa3 | | | | 3,735,000 | | | | 4,305,895 | | | |
Ohio State, Highway Impt., Revenue Bond | | | 4.000% | | | | 12/15/2017 | | | | Aa2 | | | | 1,000,000 | | | | 1,076,340 | | | |
Ohio State, School Impt., Series B, G.O. Bond | | | 5.000% | | | | 6/15/2024 | | | | Aa1 | | | | 4,200,000 | | | | 4,955,412 | | | |
Toledo Water System, Revenue Bond | | | 3.000% | | | | 11/15/2017 | | | | Aa3 | | | | 1,000,000 | | | | 1,048,570 | | | |
Toledo Water System, Water Utility Impt., Revenue Bond | | | 5.000% | | | | 11/15/2018 | | | | Aa3 | | | | 1,175,000 | | | | 1,322,662 | | | |
Toledo Water System, Water Utility Impt., Revenue Bond | | | 5.000% | | | | 11/15/2019 | | | | Aa3 | | | | 1,010,000 | | | | 1,163,076 | | | |
Toledo Water System, Water Utility Impt., Series A, Revenue Bond | | | 5.000% | | | | 11/15/2022 | | | | Aa3 | | | | 610,000 | | | | 705,813 | | | |
Toledo, Capital Impt., G.O. Bond | | | 5.000% | | | | 12/1/2020 | | | | A2 | | | | 610,000 | | | | 701,695 | | | |
| | | | | | | | | | | | | | | | | | | | | | |
| | | | | | |
| | | | | | | | | | | | | | | | | | | 22,072,668 | | | |
| | | | | | | | | | | | | | | | | | | | | | |
| | | | | | |
OKLAHOMA - 1.9% | | | | | | | | | | | | | | | | | | | | | | |
| | | | | | |
Oklahoma City Water Utilities Trust, Series B, Revenue Bond | | | 5.000% | | | | 7/1/2017 | | | | Aa1 | | | | 655,000 | | | | 710,230 | | | |
Oklahoma Development Finance Authority, Prerefunded Balance, Series C, Revenue Bond | | | 5.000% | | | | 8/15/2018 | | | | Aa3 | | | | 500,000 | | | | 560,235 | | | |
Oklahoma Turnpike Authority, Series A, Revenue Bond | | | 5.000% | | | | 1/1/2017 | | | | Aa3 | | | | 855,000 | | | | 911,327 | | | |
Oklahoma Turnpike Authority, Series A, Revenue Bond | | | 5.000% | | | | 1/1/2020 | | | | Aa3 | | | | 2,750,000 | | | | 3,179,248 | | | |
Oklahoma Turnpike Authority, Series A, Revenue Bond | | | 5.000% | | | | 1/1/2022 | | | | Aa3 | | | | 2,000,000 | | | | 2,319,080 | | | |
| | | | | | | | | | | | | | | | | | | | | | |
| | | | | | |
| | | | | | | | | | | | | | | | | | | 7,680,120 | | | |
| | | | | | | | | | | | | | | | | | | | | | |
| | | | | | |
OREGON - 1.0% | | | | | | | | | | | | | | | | | | | | | | |
| | | | | | |
Medford Hospital Facilities Authority, Asante Health System, Revenue Bond, AGM | | | 5.000% | | | | 8/15/2019 | | | | AA2 | | | | 440,000 | | | | 497,134 | | | |
Oregon State Housing & Community Services Department, Series A, Revenue Bond | | | 1.950% | | | | 7/1/2020 | | | | Aa2 | | | | 230,000 | | | | 233,303 | | | |
Portland Sewer System, Series A, Revenue Bond | | | 5.000% | | | | 8/1/2019 | | | | Aa3 | | | | 1,285,000 | | | | 1,476,439 | | | |
Portland Water System, Water Utility Impt., Prerefunded Balance, Series A, Revenue Bond, NATL | | | 4.500% | | | | 10/1/2031 | | | | Aa1 | | | | 550,000 | | | | 577,577 | | | |
The accompanying notes are an integral part of the financial statements.
13
Diversified Tax Exempt Series
Investment Portfolio - June 30, 2015
(unaudited)
| | | | | | | | | | | | | | | | | | | | | | |
| | | COUPON
RATE | | | MATURITY
DATE | | | CREDIT
RATING1 | | | PRINCIPAL
AMOUNT | | | VALUE (NOTE 2) | | | |
| | | | | | |
MUNICIPAL BONDS (continued) | | | | | | | | | | | | | | | | | | | | | | |
| | | | | | |
OREGON (continued) | | | | | | | | | | | | | | | | | | | | | | |
| | | | | | |
Washington County Clean Water Services, Sewer Impt., Series B, Revenue Bond | | | 5.000% | | | | 10/1/2021 | | | | Aa2 | | | $ | 1,015,000 | | | $ | 1,201,953 | | | |
| | | | | | | | | | | | | | | | | | | | | | |
| | | | | | |
| | | | | | | | | | | | | | | | | | | 3,986,406 | | | |
| | | | | | | | | | | | | | | | | | | | | | |
| | | | | | |
PENNSYLVANIA - 6.7% | | | | | | | | | | | | | | | | | | | | | | |
| | | | | | |
Allegheny County Hospital Development Authority, University of Pittsburgh Medical Center, Revenue Bond | | | 5.000% | | | | 8/15/2019 | | | | Aa3 | | | | 640,000 | | | | 728,787 | | | |
Allegheny County Hospital Development Authority, University of Pittsburgh Medical Center, Series A, Revenue Bond | | | 5.000% | | | | 5/15/2018 | | | | Aa3 | | | | 500,000 | | | | 553,170 | | | |
Allegheny County Sanitary Authority, Revenue Bond, AGM | | | 5.000% | | | | 6/1/2018 | | | | A1 | | | | 1,465,000 | | | | 1,626,238 | | | |
Allegheny County Sanitary Authority, Revenue Bond, AGM | | | 5.000% | | | | 12/1/2019 | | | | A1 | | | | 1,500,000 | | | | 1,724,115 | | | |
Central Bradford Progress Authority, Guthrie Healthcare System, Revenue Bond | | | 5.250% | | | | 12/1/2018 | | | | AA2 | | | | 600,000 | | | | 676,284 | | | |
Lancaster County Hospital Authority, Lancaster General, Revenue Bond | | | 4.000% | | | | 7/1/2017 | | | | Aa3 | | | | 460,000 | | | | 487,674 | | | |
North Wales Water Authority, Series A, Revenue Bond | | | 5.000% | | | | 11/1/2020 | | | | AA2 | | | | 1,000,000 | | | | 1,160,220 | | | |
Pennsylvania Turnpike Commission, Highway Impt., Series A-1, Revenue Bond | | | 5.000% | | | | 12/1/2023 | | | | A1 | | | | 1,200,000 | | | | 1,407,480 | | | |
Pennsylvania Turnpike Commission, Series A, Revenue Bond, AGM | | | 5.250% | | | | 7/15/2018 | | | | Aa3 | | | | 615,000 | | | | 688,615 | | | |
Pennsylvania Turnpike Commission, Series A, Revenue Bond, AGM | | | 5.250% | | | | 7/15/2019 | | | | Aa3 | | | | 1,050,000 | | | | 1,205,285 | | | |
Pennsylvania Turnpike Commission, Series B, Revenue Bond | | | 5.000% | | | | 12/1/2017 | | | | A1 | | | | 2,440,000 | | | | 2,675,045 | | | |
Pennsylvania Turnpike Commission, Series B, Revenue Bond | | | 5.000% | | | | 12/1/2020 | | | | A1 | | | | 1,000,000 | | | | 1,140,830 | | | |
Pennsylvania Turnpike Commission, Subseries B, Revenue Bond | | | 5.000% | | | | 6/1/2017 | | | | A3 | | | | 1,000,000 | | | | 1,077,840 | | | |
Philadelphia, Water & Wastewater, Prerefunded Balance, Revenue Bond, NATL | | | 5.600% | | | | 8/1/2018 | | | | AA2 | | | | 20,000 | | | | 22,348 | | | |
Philadelphia, Water & Wastewater, Series A, Revenue Bond | | | 5.000% | | | | 1/1/2018 | | | | A1 | | | | 385,000 | | | | 423,073 | | | |
Philadelphia, Water & Wastewater, Series A, Revenue Bond | | | 5.000% | | | | 7/1/2018 | | | | A1 | | | | 500,000 | | | | 556,815 | | | |
Philadelphia, Water & Wastewater, Series B, Revenue Bond | | | 5.000% | | | | 11/1/2017 | | | | A1 | | | | 750,000 | | | | 821,025 | | | |
Philadelphia, Water & Wastewater, Series B, Revenue Bond | | | 5.000% | | | | 11/1/2018 | | | | A1 | | | | 1,370,000 | | | | 1,539,058 | | | |
The accompanying notes are an integral part of the financial statements.
14
Diversified Tax Exempt Series
Investment Portfolio - June 30, 2015
(unaudited)
| | | | | | | | | | | | | | | | | | | | | | |
| | | COUPON
RATE | | | MATURITY
DATE | | | CREDIT
RATING1 | | | PRINCIPAL
AMOUNT | | | VALUE (NOTE 2) | | | |
| | | | | | |
MUNICIPAL BONDS (continued) | | | | | | | | | | | | | | | | | | | | | | |
| | | | | | |
PENNSYLVANIA (continued) | | | | | | | | | | | | | | | | | | | | | | |
| | | | | | |
Philadelphia, Water & Wastewater, Series B, Revenue Bond | | | 5.000% | | | | 11/1/2022 | | | | A1 | | | $ | 1,115,000 | | | $ | 1,289,486 | | | |
Philadelphia, Water & Wastewater, Series C, Revenue Bond, AGM | | | 5.000% | | | | 8/1/2017 | | | | A1 | | | | 1,000,000 | | | | 1,086,740 | | | |
Philadelphia, Water & Wastewater, Swap Termination, Series A, Revenue Bond, AGM | | | 5.000% | | | | 6/15/2019 | | | | A1 | | | | 1,000,000 | | | | 1,140,510 | | | |
Pittsburgh Water & Sewer Authority, Series B, Revenue Bond, AGM | | | 5.000% | | | | 9/1/2019 | | | | A2 | | | | 1,000,000 | | | | 1,146,430 | | | |
Pittsburgh Water & Sewer Authority, Swap Termination, Series A, Revenue Bond, AGM | | | 5.000% | | | | 9/1/2018 | | | | A2 | | | | 1,325,000 | | | | 1,483,709 | | | |
Pittsburgh, Series B, G.O. Bond | | | 5.000% | | | | 9/1/2018 | | | | A1 | | | | 1,000,000 | | | | 1,116,250 | | | |
Southcentral General Authority, Wellspan Health Obligated Group, Prerefunded Balance, Revenue Bond | | | 5.625% | | | | 6/1/2018 | | | | WR3 | | | | 465,000 | | | | 525,906 | | | |
Southcentral General Authority, Wellspan Health Obligated Group, Unrefunded Balance, Revenue Bond | | | 5.625% | | | | 6/1/2018 | | | | Aa3 | | | | 190,000 | | | | 212,794 | | | |
| | | | | | | | | | | | | | | | | | | | | | |
| | | | | | |
| | | | | | | | | | | | | | | | | | | 26,515,727 | | | |
| | | | | | | | | | | | | | | | | | | | | | |
| | | | | | |
RHODE ISLAND - 0.3% | | | | | | | | | | | | | | | | | | | | | | |
| | | | | | |
Rhode Island Clean Water Finance Agency, Series A, Revenue Bond, NATL | | | 5.000% | | | | 10/1/2035 | | | | A3 | | | | 1,000,000 | | | | 1,000,880 | | | |
| | | | | | | | | | | | | | | | | | | | | | |
| | | | | | |
SOUTH CAROLINA - 3.2% | | | | | | | | | | | | | | | | | | | | | | |
| | | | | | |
Charleston, Waterworks & Sewer System, Revenue Bond | | | 5.000% | | | | 1/1/2022 | | | | Aaa | | | | 530,000 | | | | 622,421 | | | |
Piedmont Municipal Power Agency, Revenue Bond, AGC | | | 5.000% | | | | 1/1/2018 | | | | A3 | | | | 1,690,000 | | | | 1,853,153 | | | |
Piedmont Municipal Power Agency, Revenue Bond, NATL | | | 6.250% | | | | 1/1/2021 | | | | A3 | | | | 1,000,000 | | | | 1,218,520 | | | |
South Carolina State Public Service Authority, Prerefunded Balance, Series A, Revenue Bond, AMBAC | | | 4.250% | | | | 1/1/2017 | | | | A1 | | | | 1,550,000 | | | | 1,634,506 | | | |
South Carolina State Public Service Authority, Prerefunded Balance, Series B, Revenue Bond, NATL | | | 5.000% | | | | 1/1/2019 | | | | A1 | | | | 85,000 | | | | 95,860 | | | |
South Carolina State Public Service Authority, Series A, Revenue Bond | | | 5.000% | | | | 12/1/2019 | | | | A1 | | | | 2,500,000 | | | | 2,873,700 | | | |
South Carolina State Public Service Authority, Series C, Revenue Bond | | | 5.000% | | | | 12/1/2020 | | | | A1 | | | | 1,000,000 | | | | 1,166,090 | | | |
South Carolina Transportation Infrastructure Bank, Series A, Revenue Bond | | | 5.000% | | | | 10/1/2018 | | | | A1 | | | | 685,000 | | | | 768,358 | | | |
The accompanying notes are an integral part of the financial statements.
15
Diversified Tax Exempt Series
Investment Portfolio - June 30, 2015
(unaudited)
| | | | | | | | | | | | | | | | | | | | | | |
| | | COUPON
RATE | | | MATURITY
DATE | | | CREDIT
RATING1 | | | PRINCIPAL
AMOUNT | | | VALUE
(NOTE 2) | | | |
| | | | | | |
MUNICIPAL BONDS (continued) | | | | | | | | | | | | | | | | | | | | | | |
| | | | | | |
SOUTH CAROLINA (continued) | | | | | | | | | | | | | | | | | | | | | | |
| | | | | | |
South Carolina Transportation Infrastructure Bank, Series A, Revenue Bond, AMBAC | | | 5.250% | | | | 10/1/2018 | | | | A1 | | | $ | 700,000 | | | $ | 790,755 | | | |
Spartanburg County School District No. 7, School Impt., Prerefunded Balance, G.O. Bond | | | 5.000% | | | | 3/1/2018 | | | | Aa1 | | | | 1,400,000 | | | | 1,501,136 | | | |
| | | | | | | | | | | | | | | | | | | | | | |
| | | | | | |
| | | | | | | | | | | | | | | | | | | 12,524,499 | | | |
| | | | | | | | | | | | | | | | | | | | | | |
| | | | | | |
TENNESSEE - 3.4% | | | | | | | | | | | | | | | | | | | | | | |
| | | | | | |
Clarksville City Water, Sewer & Gas, Revenue Bond | | | 5.000% | | | | 2/1/2019 | | | | Aa3 | | | | 2,740,000 | | | | 3,097,789 | | | |
Knoxville Electric System Revenue, Series FF, Revenue Bond | | | 5.000% | | | | 7/1/2023 | | | | Aa2 | | | | 800,000 | | | | 947,512 | | | |
Knoxville Electric System Revenue, Series FF, Revenue Bond | | | 5.000% | | | | 7/1/2025 | | | | Aa2 | | | | 705,000 | | | | 820,789 | | | |
Knoxville Wastewater System, Series A, Revenue Bond | | | 4.000% | | | | 4/1/2020 | | | | Aa2 | | | | 685,000 | | | | 764,768 | | | |
Knoxville Wastewater System, Sewer Impt., Series B, Revenue Bond | | | 4.000% | | | | 4/1/2024 | | | | Aa2 | | | | 400,000 | | | | 434,724 | | | |
Madison Suburban Utility District, Revenue Bond, AGM | | | 5.000% | | | | 2/1/2019 | | | | A1 | | | | 655,000 | | | | 738,768 | | | |
Memphis Electric System, Revenue Bond | | | 5.000% | | | | 12/1/2018 | | | | Aa2 | | | | 2,000,000 | | | | 2,258,140 | | | |
Memphis Electric System, Revenue Bond | | | 5.000% | | | | 12/1/2018 | | | | Aa2 | | | | 1,000,000 | | | | 1,129,070 | | | |
Metropolitan Government of Nashville & Davidson County, Series A, Revenue Bond | | | 5.000% | | | | 7/1/2016 | | | | Aa3 | | | | 750,000 | | | | 784,260 | | | |
Metropolitan Government of Nashville & Davidson County, Series A, Revenue Bond, AGM | | | 4.000% | | | | 1/1/2018 | | | | Aa2 | | | | 445,000 | | | | 479,065 | | | |
Metropolitan Government of Nashville & Davidson County, Series A, Revenue Bond, AGM | | | 5.250% | | | | 1/1/2019 | | | | Aa2 | | | | 1,505,000 | | | | 1,716,799 | | | |
Metropolitan Government of Nashville & Davidson County, Series B, Revenue Bond | | | 5.000% | | | | 5/15/2016 | | | | AA2 | | | | 400,000 | | | | 416,436 | | | |
| | | | | | | | | | | | | | | | | | | | | | |
| | | | | | |
| | | | | | | | | | | | | | | | | | | 13,588,120 | | | |
| | | | | | | | | | | | | | | | | | | | | | |
| | | | | | |
TEXAS - 6.8% | | | | | | | | | | | | | | | | | | | | | | |
| | | | | | |
Austin Electric Utility, Revenue Bond | | | 5.000% | | | | 11/15/2020 | | | | A1 | | | | 1,600,000 | | | | 1,858,288 | | | |
Austin Electric Utility, Series A, Revenue Bond | | | 5.000% | | | | 11/15/2022 | | | | A1 | | | | 500,000 | | | | 588,030 | | | |
Austin Electric Utility, Series A, Revenue Bond, AMBAC | | | 5.500% | | | | 11/15/2016 | | | | A1 | | | | 1,000,000 | | | | 1,068,070 | | | |
Austin Electric Utility, Series A, Revenue Bond, AMBAC | | | 5.000% | | | | 11/15/2016 | | | | A1 | | | | 600,000 | | | | 636,738 | | | |
Corpus Christi Utility System, Multiple Utility Impt., Revenue Bond | | | 5.000% | | | | 7/15/2018 | | | | A1 | | | | 1,000,000 | | | | 1,110,040 | | | |
Corpus Christi Utility System, Multiple Utility Impt., Revenue Bond | | | 5.000% | | | | 7/15/2019 | | | | A1 | | | | 2,400,000 | | | | 2,725,488 | | | |
Fort Worth Water & Sewer System, Revenue Bond | | | 5.000% | | | | 2/15/2020 | | | | Aa1 | | | | 550,000 | | | | 637,373 | | | |
The accompanying notes are an integral part of the financial statements.
16
Diversified Tax Exempt Series
Investment Portfolio - June 30, 2015
(unaudited)
| | | | | | | | | | | | | | | | | | | | | | |
| | | COUPON
RATE | | | MATURITY
DATE | | | CREDIT
RATING1 | | | PRINCIPAL
AMOUNT | | | VALUE (NOTE 2) | | | |
| | | | | | |
MUNICIPAL BONDS (continued) | | | | | | | | | | | | | | | | | | | | | | |
| | | | | | |
TEXAS (continued) | | | | | | | | | | | | | | | | | | | | | | |
| | | | | | |
Harris County Cultural Education Facilities Finance Corp., Revenue Bond | | | 4.000% | | | | 12/1/2019 | | | | A1 | | | $ | 500,000 | | | $ | 548,975 | | | |
Houston Combined Utility System, Series S, Revenue Bond4 | | | 0.940% | | | | 5/15/2034 | | | | AA2 | | | | 1,000,000 | | | | 998,680 | | | |
Irving Waterworks & Sewer System, Water Utility Impt., Revenue Bond | | | 4.000% | | | | 8/15/2018 | | | | Aa1 | | | | 1,110,000 | | | | 1,210,055 | | | |
Metropolitan Transit Authority of Harris County, Transit Impt., Revenue Bond | | | 5.000% | | | | 11/1/2019 | | | | Aa2 | | | | 845,000 | | | | 973,922 | | | |
North Texas Municipal Water District, Water Utility Impt., Revenue Bond | | | 5.250% | | | | 9/1/2020 | | | | Aa2 | | | | 2,000,000 | | | | 2,374,180 | | | |
North Texas Municipal Water District, Water Utility Impt., Revenue Bond | | | 5.000% | | | | 9/1/2023 | | | | Aa2 | | | | 2,535,000 | | | | 3,048,287 | | | |
San Antonio Public Service Board, Revenue Bond | | | 5.000% | | | | 2/1/2022 | | | | Aa1 | | | | 2,000,000 | | | | 2,364,740 | | | |
San Antonio Water System, Revenue Bond | | | 5.000% | | | | 5/15/2020 | | | | Aa1 | | | | 1,000,000 | | | | 1,164,370 | | | |
Tarrant Regional Water District, Revenue Bond | | | 5.000% | | | | 3/1/2017 | | | | AAA2 | | | | 900,000 | | | | 965,115 | | | |
Texas State, Highway Impt., Series B, G.O. Bond | | | 5.000% | | | | 4/1/2017 | | | | Aaa | | | | 1,575,000 | | | | 1,694,921 | | | |
Trinity River Authority Central Regional Wastewater System Revenue, Revenue Bond | | | 5.000% | | | | 8/1/2024 | | | | AAA2 | | | | 2,200,000 | | | | 2,622,840 | | | |
Trinity River Authority LLC, Tarrant County Water Project, Revenue Bond | | | 5.000% | | | | 2/1/2019 | | | | AA2 | | | | 500,000 | | | | 564,540 | | | |
| | | | | | | | | | | | | | | | | | | | | | |
| | | | | | |
| | | | | | | | | | | | | | | | | | | 27,154,652 | | | |
| | | | | | | | | | | | | | | | | | | | | | |
| | | | | | |
UTAH - 1.2% | | | | | | | | | | | | | | | | | | | | | | |
| | | | | | |
Intermountain Power Agency, Series A, Revenue Bond | | | 5.000% | | | | 7/1/2020 | | | | A1 | | | | 2,000,000 | | | | 2,220,400 | | | |
Provo Energy System Revenue, Series A, Revenue Bond, BAM | | | 5.000% | | | | 2/1/2026 | | | | AA2 | | | | 975,000 | | | | 1,151,504 | | | |
Utah State, Highway Impt., Series A, G.O. Bond | | | 3.000% | | | | 7/1/2015 | | | | Aaa | | | | 500,000 | | | | 500,040 | | | |
Utah Transit Authority, Subseries B, Revenue Bond | | | 1.600% | | | | 6/15/2018 | | | | A1 | | | | 1,025,000 | | | | 1,037,331 | | | |
| | | | | | | | | | | | | | | | | | | | | | |
| | | | | | |
| | | | | | | | | | | | | | | | | | | 4,909,275 | | | |
| | | | | | | | | | | | | | | | | | | | | | |
| | | | | | |
VIRGINIA - 0.9% | | | | | | | | | | | | | | | | | | | | | | |
| | | | | | |
Fairfax County Industrial Development Authority, Inova Health, Series C, Revenue Bond | | | 5.000% | | | | 5/15/2018 | | | | Aa2 | | | | 500,000 | | | | 554,560 | | | |
Norfolk Economic Development Authority, Sentara Healthcare, Series B, Revenue Bond | | | 4.000% | | | | 11/1/2018 | | | | Aa2 | | | | 400,000 | | | | 434,680 | | | |
Norfolk, Water Revenue, Revenue Bond | | | 5.000% | | | | 11/1/2016 | | | | Aa2 | | | | 1,075,000 | | | | 1,140,016 | | | |
Virginia Resources Authority, Sewer Impt., Series B, Revenue Bond | | | 5.000% | | | | 10/1/2019 | | | | Aaa | | | | 1,290,000 | | | | 1,490,582 | | | |
| | | | | | | | | | | | | | | | | | | | | | |
| | | | | | |
| | | | | | | | | | | | | | | | | | | 3,619,838 | | | |
| | | | | | | | | | | | | | | | | | | | | | |
The accompanying notes are an integral part of the financial statements.
17
Diversified Tax Exempt Series
Investment Portfolio - June 30, 2015
(unaudited)
| | | | | | | | | | | | | | | | | | | | | | |
| | | COUPON
RATE | | | MATURITY
DATE | | | CREDIT
RATING1 | | | PRINCIPAL
AMOUNT | | | VALUE
(NOTE 2) | | | |
| | | | | | |
MUNICIPAL BONDS (continued) | | | | | | | | | | | | | | | | | | | | | | |
| | | | | | |
WASHINGTON - 7.6% | | | | | | | | | | | | | | | | | | | | | | |
| | | | | | |
Benton County Public Utility District No. 1, Revenue Bond | | | 5.000% | | | | 11/1/2018 | | | | Aa3 | | | $ | 400,000 | | | $ | 448,524 | | | |
Everett Water & Sewer, Revenue Bond | | | 5.000% | | | | 12/1/2020 | | | | AA2 | | | | 1,330,000 | | | | 1,561,420 | | | |
Everett, G.O. Bond4 | | | 0.440% | | | | 12/1/2034 | | | | AA2 | | | | 1,000,000 | | | | 994,860 | | | |
King County Sewer Revenue, Series B, Revenue Bond | | | 5.000% | | | | 1/1/2020 | | | | Aa2 | | | | 750,000 | | | | 867,067 | | | |
King County, G.O. Bond | | | 5.000% | | | | 1/1/2017 | | | | Aa1 | | | | 2,000,000 | | | | 2,132,380 | | | |
Seattle Municipal Light & Power, Series A, Revenue Bond | | | 5.000% | | | | 6/1/2019 | | | | Aa2 | | | | 1,675,000 | | | | 1,914,843 | | | |
Seattle Municipal Light & Power, Series B, Revenue Bond | | | 4.000% | | | | 2/1/2016 | | | | Aa2 | | | | 550,000 | | | | 562,051 | | | |
Seattle Municipal Light & Power, Series B, Revenue Bond | | | 5.000% | | | | 2/1/2017 | | | | Aa2 | | | | 1,585,000 | | | | 1,693,905 | | | |
Seattle Water System Revenue, Revenue Bond | | | 5.000% | | | | 5/1/2026 | | | | Aa1 | | | | 4,000,000 | | | | 4,811,760 | | | |
Seattle, Drainage & Wastewater, Sewer Impt., Revenue Bond | | | 5.000% | | | | 9/1/2021 | | | | Aa1 | | | | 2,000,000 | | | | 2,366,920 | | | |
Snohomish County Public Utility District No. 1, Revenue Bond | | | 5.000% | | | | 12/1/2016 | | | | Aa3 | | | | 740,000 | | | | 787,034 | | | |
Tacoma, Sewer Impt., Revenue Bond | | | 5.000% | | | | 12/1/2018 | | | | Aa2 | | | | 1,060,000 | | | | 1,194,525 | | | |
Tacoma, Sewer Impt., Revenue Bond | | | 4.000% | | | | 12/1/2019 | | | | Aa2 | | | | 1,095,000 | | | | 1,215,417 | | | |
Tacoma, Water Revenue, Series A, Revenue Bond | | | 4.000% | | | | 12/1/2018 | | | | Aa2 | | | | 1,000,000 | | | | 1,094,220 | | | |
Washington Health Care Facilities Authority, Multicare Health System, Prerefunded Balance, Series A, Revenue Bond, AGC | | | 4.000% | | | | 8/15/2016 | | | | Aa3 | | | | 525,000 | | | | 545,743 | | | |
Washington Health Care Facilities Authority, Providence Health & Services, Series A, Revenue Bond | | | 5.000% | | | | 10/1/2018 | | | | Aa3 | | | | 475,000 | | | | 530,945 | | | |
Washington State, Correctional Facilities Impt., Series C, Prerefunded Balance, G.O. Bond, NATL | | | 5.000% | | | | 1/1/2027 | | | | Aa1 | | | | 4,905,000 | | | | 5,227,406 | | | |
Washington State, Series 2011-A, G.O. Bond | | | 5.000% | | | | 1/1/2020 | | | | Aa1 | | | | 2,000,000 | | | | 2,312,180 | | | |
| | | | | | | | | | | | | | | | | | | | | | |
| | | | | | |
| | | | | | | | | | | | | | | | | | | 30,261,200 | | | |
| | | | | | | | | | | | | | | | | | | | | | |
| | | | | | |
WEST VIRGINIA - 0.3% | | | | | | | | | | | | | | | | | | | | | | |
Fairmont, Series D, Revenue Bond, AGM | | | 3.000% | | | | 7/1/2018 | | | | A2 | | | | 1,210,000 | | | | 1,277,361 | | | |
| | | | | | | | | | | | | | | | | | | | | | |
| | | | | | |
WISCONSIN - 2.0% | | | | | | | | | | | | | | | | | | | | | | |
Milwaukee Sewerage System, Sewer Impt., Series S1, Revenue Bond | | | 5.000% | | | | 6/1/2021 | | | | Aa2 | | | | 470,000 | | | | 551,644 | | | |
Wisconsin Health & Educational Facilities Authority, Ascension Health Credit, Series A, Revenue Bond | | | 5.000% | | | | 11/15/2018 | | | | Aa2 | | | | 600,000 | | | | 672,222 | | | |
Wisconsin Health & Educational Facilities Authority, Froedtert Health, Series A, Revenue Bond | | | 4.000% | | | | 4/1/2017 | | | | AA2 | | | | 565,000 | | | | 595,239 | | | |
The accompanying notes are an integral part of the financial statements.
18
Diversified Tax Exempt Series
Investment Portfolio - June 30, 2015
(unaudited)
| | | | | | | | | | | | | | | | | | | | |
| | | COUPON
RATE | | | MATURITY
DATE | | | CREDIT
RATING1 | | | PRINCIPAL
AMOUNT/
SHARES | | | VALUE (NOTE 2) | |
| | | | | |
MUNICIPAL BONDS (continued) | | | | | | | | | | | | | | | | | | | | |
| | | | | |
WISCONSIN (continued) | | | | | | | | | | | | | | | | | | | | |
| | | | | |
Wisconsin Health & Educational Facilities Authority, ProHealth Care, Inc., Revenue Bond | | | 3.000 | % | | | 8/15/2019 | | | | A1 | | | $ | 510,000 | | | $ | 537,244 | |
Wisconsin Public Power, Inc., Series A, Revenue Bond, AGM | | | 5.000 | % | | | 7/1/2016 | | | | A1 | | | | 515,000 | | | | 538,154 | |
Wisconsin Public Power, Inc., Series A, Revenue Bond, AGM | | | 5.250 | % | | | 7/1/2020 | | | | A1 | | | | 1,100,000 | | | | 1,227,072 | |
Wisconsin State, Public Impt., Series D, Prerefunded Balance, G.O. Bond | | | 5.000 | % | | | 5/1/2018 | | | | Aa2 | | | | 400,000 | | | | 415,608 | |
WPPI Energy, Series A, Revenue Bond | | | 4.000 | % | | | 7/1/2017 | | | | A1 | | | | 1,120,000 | | | | 1,191,523 | |
WPPI Energy, Series A, Revenue Bond | | | 5.000 | % | | | 7/1/2020 | | | | A1 | | | | 2,000,000 | | | | 2,318,400 | |
| | | | | | | | | | | | | | | | | | | | |
| | | | | |
| | | | | | | | | | | | | | | | | | | 8,047,106 | |
| | | | | | | | | | | | | | | | | | | | |
| | | | | |
WYOMING - 0.1% | | | | | | | | | | | | | | | | | | | | |
| | | | | |
Wyoming Municipal Power Agency, Inc., Series A, Revenue Bond | | | 5.000 | % | | | 1/1/2018 | | | | A2 | | | | 500,000 | | | | 546,965 | |
| | | | | | | | | | | | | | | | | | | | |
| | | | | |
TOTAL MUNICIPAL BONDS | | | | | | | | | | | | | | | | | | | | |
(Identified Cost $386,678,854) | | | | | | | | | | | | | | | | | | | 387,181,252 | |
| | | | | | | | | | | | | | | | | | | | |
| | | | | |
SHORT-TERM INVESTMENT - 1.1% | | | | | | | | | | | | | | | | | | | | |
| | | | | |
Dreyfus AMT - Free Municipal Reserves - Class R | | | | | | | | | | | | | | | | | | | | |
(Identified Cost $4,497,738) | | | 0.00 | %5 | | | | | | | | | | | 4,497,738 | | | | 4,497,738 | |
| | | | | | | | | | | | | | | | | | | | |
| | | | | |
TOTAL INVESTMENTS - 98.4% | | | | | | | | | | | | | | | | | | | | |
(Identified Cost $391,176,592) | | | | | | | | | | | | | | | | | | | 391,678,990 | |
OTHER ASSETS, LESS LIABILITIES - 1.6% | | | | | | | | | | | | | | | | | | | 6,204,905 | |
| | | | | | | | | | | | | | | | | | | | |
| | | | | |
NET ASSETS - 100% | | | | | | | | | | | | | | | | | | $ | 397,883,895 | |
| | | | | | | | | | | | | | | | | | | | |
KEY:
G.O. Bond - General Obligation Bond
Impt. - Improvement
No. - Number
Scheduled principal and interest payments are guaranteed by:
AGC (Assurance Guaranty Corp.)
AGM (Assurance Guaranty Municipal Corp.)
AMBAC (AMBAC Assurance Corp.)
BAM (Build America Mutual Assurance Co.)
BHAC (Berkshire Hathaway Assurance Corp.)
NATL (National Public Finance Guarantee Corp.)
The insurance does not guarantee the market value of the municipal bonds.
1Credit ratings from Moody’s (unaudited).
2Credit ratings from S&P (unaudited).
3Credit rating has been withdrawn. As of June 30, 2015, there is no rating available (unaudited).
4The coupon rate is floating and is the effective rate as of June 30, 2015.
5Rate shown is the current yield as of June 30, 2015. Rate is less than 0.01%.
The accompanying notes are an integral part of the financial statements.
19
Diversified Tax Exempt Series
Statement of Assets and Liabilities
June 30, 2015 (unaudited)
| | | | |
ASSETS: | | | | |
| |
Investments, at value (identified cost $391,176,592) (Note 2) | | $ | 391,678,990 | |
Interest receivable | | | 4,923,212 | |
Receivable for fund shares sold | | | 1,953,321 | |
Prepaid expenses | | | 755 | |
| | | | |
| |
TOTAL ASSETS | | | 398,556,278 | |
| | | | |
| |
LIABILITIES: | | | | |
| |
Accrued management fees (Note 3) | | | 173,266 | |
Accrued fund accounting and administration fees (Note 3) | | | 26,841 | |
Accrued transfer agent fees (Note 3) | | | 1,638 | |
Accrued Chief Compliance Officer service fees (Note 3) | | | 382 | |
Payable for fund shares repurchased | | | 447,431 | |
Other payables and accrued expenses | | | 22,825 | |
| | | | |
| |
TOTAL LIABILITIES | | | 672,383 | |
| | | | |
| |
TOTAL NET ASSETS | | $ | 397,883,895 | |
| | | | |
| |
NET ASSETS CONSIST OF: | | | | |
| |
Capital stock | | $ | 362,495 | |
Additional paid-in-capital | | | 397,410,673 | |
Undistributed net investment income | | | 618,970 | |
Accumulated net realized gain (loss) on investments | | | (1,010,641 | ) |
Net unrealized appreciation (depreciation) on investments | | | 502,398 | |
| | | | |
| |
TOTAL NET ASSETS | | $ | 397,883,895 | |
| | | | |
| |
NET ASSET VALUE, OFFERING PRICE AND REDEMPTION PRICE PER SHARE - Class A ($397,883,895/36,249,478 shares) | | $ | 10.98 | |
| | | | |
The accompanying notes are an integral part of the financial statements.
20
Diversified Tax Exempt Series
Statement of Operations
For the Six Months Ended June 30, 2015 (unaudited)
| | | | |
INVESTMENT INCOME: | | | | |
| |
Interest | | $ | 2,518,845 | |
Dividends | | | 1,129 | |
| | | | |
| |
Total Investment Income | | | 2,519,974 | |
| | | | |
| |
EXPENSES: | | | | |
| |
Management fees (Note 3) | | | 984,976 | |
Fund accounting and administration fees (Note 3) | | | 55,679 | |
Directors’ fees (Note 3) | | | 3,486 | |
Transfer agent fees (Note 3) | | | 2,309 | |
Chief Compliance Officer service fees (Note 3) | | | 1,224 | |
Custodian fees | | | 7,326 | |
Miscellaneous | | | 41,826 | |
| | | | |
| |
Total Expenses | | | 1,096,826 | |
| | | | |
| |
NET INVESTMENT INCOME | | | 1,423,148 | |
| | | | |
| |
REALIZED AND UNREALIZED GAIN (LOSS) ON INVESTMENTS: | | | | |
| |
Net realized gain (loss) on investments | | | (1,046 | ) |
Net change in unrealized appreciation (depreciation) on investments | | | (1,035,650 | ) |
| | | | |
| |
NET REALIZED AND UNREALIZED GAIN (LOSS) ON INVESTMENTS | | | (1,036,696 | ) |
| | | | |
| |
NET INCREASE IN NET ASSETS RESULTING FROM OPERATIONS | | $ | 386,452 | |
| | | | |
The accompanying notes are an integral part of the financial statements.
21
Diversified Tax Exempt Series
Statements of Changes in Net Assets
| | | | | | | | | | |
| | | FOR THE SIX
MONTHS ENDED
6/30/15
(UNAUDITED) | | FOR THE YEAR ENDED 12/31/14 |
INCREASE (DECREASE) IN NET ASSETS: | | | | | | | | | | |
| | |
OPERATIONS: | | | | | | | | | | |
| | |
Net investment income | | | $ | 1,423,148 | | | | $ | 2,701,194 | |
Net realized gain (loss) on investments | | | | (1,046 | ) | | | | (491,642 | ) |
Net change in unrealized appreciation (depreciation) on investments | | | | (1,035,650 | ) | | | | 3,108,451 | |
| | | | | | | | | | |
| | |
Net increase from operations | | | | 386,452 | | | | | 5,318,003 | |
| | | | | | | | | | |
| | |
DISTRIBUTIONS TO SHAREHOLDERS (Note 7): | | | | | | | | | | |
| | |
From net investment income | | | | (1,449,991 | ) | | | | (2,488,998 | ) |
| | | | | | | | | | |
| | |
CAPITAL STOCK ISSUED AND REPURCHASED: | | | | | | | | | | |
| | |
Net increase from capital share transactions (Note 5) | | | | 22,676,697 | | | | | 37,762,519 | |
| | | | | | | | | | |
| | |
Net increase in net assets | | | | 21,613,158 | | | | | 40,591,524 | |
| | |
NET ASSETS: | | | | | | | | | | |
| | |
Beginning of period | | | | 376,270,737 | | | | | 335,679,213 | |
| | | | | | | | | | |
| | |
End of period (including undistributed net investment income of $618,970 and $645,813, respectively) | | | $ | 397,883,895 | | | | $ | 376,270,737 | |
| | | | | | | | | | |
The accompanying notes are an integral part of the financial statements.
22
Diversified Tax Exempt Series
Financial Highlights
| | | | | | | | | | | | | | | | | | | | | | | | | | | | | | |
| | | FOR THE SIX | | FOR THE YEARS ENDED | | | | |
| | | MONTHS ENDED | | | | | |
| | | 6/30/15 | | 12/31/14 | | 12/31/13 | | 12/31/12 | | 12/31/11 | | 12/31/10 |
| | | (UNAUDITED) | | | | | |
Per share data (for a share outstanding throughout each period): | | | | | | | | | | | | | | | | | | | | | | | | | | | | | | |
| | | | | | |
Net asset value - Beginning of period | | | | $11.00 | | | | | $10.91 | | | | | $11.39 | | | | | $11.28 | | | | | $10.77 | | | | | $11.17 | |
| | | | | | | | | | | | | | | | | | | | | | | | | | | | | | |
| | | | | | |
Income (loss) from investment operations: | | | | | | | | | | | | | | | | | | | | | | | | | | | | | | |
Net investment income1 | | | | 0.04 | | | | | 0.08 | | | | | 0.14 | | | | | 0.20 | | | | | 0.30 | | | | | 0.40 | |
Net realized and unrealized gain (loss) on investments | | | | (0.02 | ) | | | | 0.09 | | | | | (0.29 | ) | | | | 0.14 | | | | | 0.58 | | | | | (0.35 | ) |
| | | | | | | | | | | | | | | | | | | | | | | | | | | | | | |
| | | | | | |
Total from investment operations | | | | 0.02 | | | | | 0.17 | | | | | (0.15 | ) | | | | 0.34 | | | | | 0.88 | | | | | 0.05 | |
| | | | | | | | | | | | | | | | | | | | | | | | | | | | | | |
| | | | | | |
Less distributions to shareholders: | | | | | | | | | | | | | | | | | | | | | | | | | | | | | | |
From net investment income | | | | (0.04 | ) | | | | (0.08 | ) | | | | (0.13 | ) | | | | (0.20 | ) | | | | (0.29 | ) | | | | (0.45 | ) |
From net realized gain on investments | | | | — | | | | | — | | | | | (0.20 | ) | | | | (0.03 | ) | | | | (0.08 | ) | | | | — | 2 |
| | | | | | | | | | | | | | | | | | | | | | | | | | | | | | |
| | | | | | |
Total distributions to shareholders | | | | (0.04 | ) | | | | (0.08 | ) | | | | (0.33 | ) | | | | (0.23 | ) | | | | (0.37 | ) | | | | (0.45 | ) |
| | | | | | | | | | | | | | | | | | | | | | | | | | | | | | |
| | | | | | |
Net asset value - End of period | | | | $10.98 | | | | | $11.00 | | | | | $10.91 | | | | | $11.39 | | | | | $11.28 | | | | | $10.77 | |
| | | | | | | | | | | | | | | | | | | | | | | | | | | | | | |
| | | | | | |
Net assets - End of period (000’s omitted) | | | $ | 397,884 | | | | $ | 376,271 | | | | $ | 335,679 | | | | $ | 332,228 | | | | $ | 306,440 | | | | $ | 276,970 | |
| | | | | | | | | | | | | | | | | | | | | | | | | | | | | | |
| | | | | | |
Total return3 | | | | 0.18% | | | | | 1.51% | | | | | (1.28% | ) | | | | 3.01% | | | | | 8.25% | | | | | 0.41% | |
Ratios (to average net assets)/Supplemental Data: | | | | | | | | | | | | | | | | | | | | | | | | | | | | | | |
Expenses* | | | | 0.56% | 4 | | | | 0.56% | | | | | 0.57% | | | | | 0.57% | | | | | 0.58% | | | | | 0.58% | |
Net investment income | | | | 0.72% | 4 | | | | 0.75% | | | | | 1.21% | | | | | 1.71% | | | | | 2.67% | | | | | 3.51% | |
Portfolio turnover | | | | 19% | | | | | 25% | | | | | 58% | | | | | 9% | | | | | 53% | | | | | 3% | |
*The investment advisor did not impose all or a portion of its management and/or other fees, and in some periods may have paid a portion of the Series’ expenses. If these expenses had been incurred by the Series, the expense ratio (to average net assets) would have increased by the following amounts: | |
| | | | | | |
| | | | N/A | | | | | N/A | | | | | N/A | | | | | N/A | | | | | N/A | | | | | 0.00% | 5 |
1Calculated based on average shares outstanding during the periods.
2Less than $0.01 per share.
3Represents aggregate total return for the periods indicated, and assumes reinvestment of all distributions. Total return would have been lower had certain expenses not been waived during certain periods. Periods less than one year are not annualized.
4Annualized.
5Less than 0.01%.
The accompanying notes are an integral part of the financial statements.
23
Diversified Tax Exempt Series
Notes to Financial Statements
(unaudited)
Diversified Tax Exempt Series (the “Series”) is a no-load diversified series of Manning & Napier Fund, Inc. (the “Fund”). The Fund is organized in Maryland and is registered under the Investment Company Act of 1940, as amended, as an open-end management investment company.
The Series’ investment objective is to provide as high a level of current income exempt from federal income tax as the Advisor believes is consistent with the preservation of capital.
The Fund’s advisor is Manning & Napier Advisors, LLC (the “Advisor”). Shares of the Series are offered to investors, clients and employees of the Advisor and its affiliates. The total authorized capital stock of the Fund consists of 15 billion shares of common stock each having a par value of $0.01. As of June 30, 2015, 10.6 billion shares have been designated in total among 41 series, of which 100 million have been designated as Diversified Tax Exempt Series Class A common stock.
| 2. | Significant Accounting Policies |
The following is a summary of significant accounting policies followed by the Series. The Series is an investment company and, accordingly, follows the investment company accounting and reporting guidance of the Financial Accounting Standards Board Accounting Standards Codification Topic 946 - Investment Companies, which is part of accounting principles generally accepted in the United States of America (“GAAP”).
Security Valuation
Municipal securities will normally be valued on the basis of market valuations provided by an independent pricing service (the “Service”). The Service utilizes the latest price quotations and a matrix system (which considers such factors as security prices of similar securities, yields, maturities and ratings). The Service has been approved by the Fund’s Board of Directors (the “Board”).
Short-term investments that mature in sixty days or less are valued at amortized cost, which approximates fair value. Investments in open-end investment companies are valued at their net asset value per share on valuation date.
Volume and level of activity in established markets for an asset or liability are evaluated to determine whether recent transactions and quoted prices are determinative of fair value. Where there have been significant decreases in volume and level of activity, further analysis and adjustment may be necessary to estimate fair value. The Series measures fair value in these instances by the use of inputs and valuation techniques which may be based upon current market prices of securities that are comparable in coupon, rating, maturity and industry and/or expectation of future cash flows. As a result of trading in relatively thin markets and/or markets that experience significant volatility, the prices used by the Series to value these securities may differ from the value that would be realized if these securities were sold, and the differences could be material.
Securities for which representative valuations or prices are not available from the Series’ pricing service may be valued at fair value as determined in good faith by the Advisor under procedures approved by and under the general supervision and responsibility of the Board. Due to the inherent uncertainty of valuations of such securities, the fair value may differ significantly from the values that would have been used had a ready market for such securities existed. If trading or events occurring after the close of the principal market in which securities are traded are expected to materially affect the value of those securities, then they may be valued at their fair value, taking this trading or these events into account.
Various inputs are used in determining the value of the Series’ assets or liabilities carried at fair value. These inputs are summarized in three broad levels. Level 1 includes quoted prices in active markets for identical assets and liabilities. Level 2 includes other significant observable inputs (including quoted prices for similar securities, interest rates, prepayment speeds, credit risk, etc.). Level 3 includes significant unobservable inputs (including the Series’ own assumptions in determining the fair value of investments). A financial instrument’s level within the fair value hierarchy is based on the lowest level of any input both individually and in aggregate that is significant to the fair value measurement. The inputs or methodology used for valuing securities are not necessarily an indication of the risk associated with investing in those securities.
24
Diversified Tax Exempt Series
Notes to Financial Statements (continued)
(unaudited)
| 2. | Significant Accounting Policies (continued) |
Security Valuation (continued)
The following is a summary of the valuation levels used for major security types as of June 30, 2015 in valuing the Series’ assets or liabilities carried at fair value:
| | | | | | | | | | | | | | | | |
| DESCRIPTION | | TOTAL | | | LEVEL 1 | | | LEVEL 2 | | | LEVEL 3 | |
Assets: | | | | | | | | | | | | | | | | |
Debt securities: | | | | | | | | | | | | | | | | |
States and political subdivisions (municipals) | | $ | 387,181,252 | | | $ | — | | | $ | 387,181,252 | | | $ | — | |
Mutual fund | | | 4,497,738 | | | | 4,497,738 | | | | — | | | | — | |
| | | | | | | | | | | | | | | | |
| | | | |
Total assets | | $ | 391,678,990 | | | $ | 4,497,738 | | | $ | 387,181,252 | | | $ | — | |
| | | | | | | | | | | | | | | | |
There were no Level 3 securities held by the Series as of December 31, 2014 or June 30, 2015.
The Fund’s policy is to recognize transfers in and transfers out of the valuation levels as of the beginning of the reporting period. There were no transfers between Level 1 and Level 2 during the six months ended June 30, 2015.
Security Transactions, Investment Income and Expenses
Security transactions are accounted for on trade date. Dividend income is recorded on the ex-dividend date, except that if the ex-dividend date has passed, certain dividends from foreign securities are recorded as soon as the Series is informed of the ex-dividend date. Non-cash dividends, if any, are recorded at the fair value of the securities received. Interest income, including amortization of premium and accretion of discounts using the effective interest method, is earned from settlement date and accrued daily.
Expenses are recorded on an accrual basis. Most expenses of the Fund can be attributed to a specific series. Expenses which cannot be directly attributed are apportioned among the series in the Fund in such a manner as deemed equitable by the Fund’s Board, taking into consideration, among other things, the nature and type of expense.
The Series uses the identified cost method for determining realized gain or loss on investments for both financial statement and federal income tax reporting purposes.
Federal Taxes
The Series’ policy is to comply with the provisions of the Internal Revenue Code applicable to regulated investment companies. The Series is not subject to federal income tax or excise tax to the extent that the Series distributes to shareholders each year its taxable income, including any net realized gains on investments, in accordance with requirements of the Internal Revenue Code. Accordingly, no provision for federal income tax or excise tax has been made in the financial statements.
Management evaluates its tax positions to determine if the tax positions taken meet the minimum recognition threshold in connection with accounting for uncertainties in income tax positions taken or expected to be taken for the purposes of measuring and recognizing tax liabilities in the financial statements. Recognition of tax benefits of an uncertain tax position is required only when the position is “more likely than not” to be sustained assuming examination by taxing authorities. At June 30, 2015, the Series has recorded no liability for net unrecognized tax benefits relating to uncertain income tax positions taken or expected to be taken in future tax returns.
The Series files income tax returns in the U.S. federal jurisdiction and various states, as required. No income tax returns are currently under investigation. The statute of limitations on the Series’ tax returns remains open for the years ended December 31, 2011 through December 31, 2014. The Series is not aware of any tax positions for which it is reasonably possible that the total amounts of unrecognized tax benefits will significantly change in the next twelve months.
Distributions of Income and Gains
Distributions to shareholders of net investment income are made quarterly. Distributions of net realized gains are made annually. An additional distribution may be necessary to avoid taxation of the Series. Distributions are recorded on the ex-dividend date.
25
Diversified Tax Exempt Series
Notes to Financial Statements (continued)
(unaudited)
| 2. | Significant Accounting Policies (continued) |
Indemnifications
The Fund’s organizational documents provide former and current directors and officers with a limited indemnification against liabilities arising in connection with the performance of their duties to the Fund. In the normal course of business, the Fund may also enter into contracts that provide general indemnifications. The Fund’s maximum exposure under these arrangements is unknown as this would be dependent on future claims that may be made against the Fund. The risk of material loss from such claims is considered remote.
Other
The preparation of financial statements in conformity with GAAP requires management to make estimates and assumptions that affect the reported amounts of assets and liabilities and the disclosure of contingent assets and liabilities at the date of the financial statements and the reported amounts of income and expenses during the reporting period. Actual results could differ from those estimates.
| 3. | Transactions with Affiliates |
The Fund has an Investment Advisory Agreement (the “Agreement”) with the Advisor, for which the Series pays a fee, computed daily and payable monthly, at an annual rate of 0.50% of the Series’ average daily net assets.
Under the Agreement, personnel of the Advisor provide the Series with advice and assistance in the choice of investments and the execution of securities transactions, and otherwise maintain the Series’ organization. The Advisor also provides the Fund with necessary office space and fund administration and support services. The salaries of all officers of the Fund (except a percentage of the Fund’s Chief Compliance Officer’s salary, which is paid by the Fund), and of all Directors who are “affiliated persons” of the Fund, or of the Advisor, and all personnel of the Fund, or of the Advisor, performing services relating to research, statistical and investment activities, are paid by the Advisor. Each “non-affiliated” Director receives an annual stipend, which is allocated among all the active series of the Fund. In addition, these Directors also receive a fee per Board meeting attended plus a fee for each committee meeting attended and are reimbursed for travel and other out-of-pocket expenses incurred by them in connection with attending such meetings. The Fund also has an Audit Committee Chair, who receives an additional annual stipend for this role.
The Advisor has contractually agreed, until at least April 30, 2016, to waive its management fee and, if necessary, pay other operating expenses of the Series in order to maintain total direct annual fund operating expenses for the Series at no more than 0.85% of average daily net assets each year. The Advisor did not waive any fees for the six months ended June 30, 2015. The Advisor is not eligible to recoup any expenses that have been waived or reimbursed in prior years.
Manning & Napier Investor Services, Inc., a registered broker-dealer affiliate of the Advisor, acts as distributor for the Fund’s shares. The services of Manning & Napier Investor Services, Inc. are provided at no additional cost to the Series.
Pursuant to a master services agreement dated November 1, 2014, the Fund pays the Advisor an annual fee related to fund accounting and administration of 0.0085% on the first $25 billion of average daily net assets (excluding Target Series and Strategic Income Series); 0.0075% on the next $15 billion of average daily net assets (excluding Target Series and Strategic Income Series); and 0.0065% of the average daily net assets in excess of $40 billion (excluding Target Series and Strategic Income Series); plus a base fee of $30,400 per series. Transfer agent fees are charged to the Fund on a per account basis. Additionally, certain transaction and out-of-pocket expenses, including charges for reporting relating to the Fund’s compliance program, are charged. The Advisor has agreements with BNY Mellon Investment Servicing (U.S.) Inc. (“BNY”) under which BNY serves as sub-accountant services agent and sub-transfer agent.
Expenses not directly attributable to a series are allocated based on each series’ relative net assets or number of accounts, depending on the expense.
26
Diversified Tax Exempt Series
Notes to Financial Statements (continued)
(unaudited)
| 4. | Purchases and Sales of Securities |
For the six months ended June 30, 2015, purchases and sales of securities, other than U.S. Government securities and short-term securities, were $108,126,170 and $70,616,634 respectively. There were no purchases or sales of U.S. Government securities.
| 5. | Capital Stock Transactions |
Transactions in shares of Diversified Tax Exempt Series were:
| | | | | | | | | | | | | | | | |
| | | FOR THE SIX MONTHS ENDED 6/30/15 | | | FOR THE YEAR ENDED 12/31/14 | |
| | | SHARES | | | AMOUNT | | | SHARES | | | AMOUNT | |
Sold | | | 3,991,031 | | | $ | 44,098,335 | | | | 7,642,752 | | | $ | 84,158,145 | |
Reinvested | | | 122,578 | | | | 1,344,079 | | | | 209,581 | | | | 2,308,920 | |
Repurchased | | | (2,067,996 | ) | | | (22,765,717 | ) | | | (4,422,619 | ) | | | (48,704,546 | ) |
| | | | | | | | | | | | | | | | |
| | | | |
Total | | | 2,045,613 | | | $ | 22,676,697 | | | | 3,429,714 | | | $ | 37,762,519 | |
| | | | | | | | | | | | | | | | |
Over 90% of the shares outstanding are fiduciary accounts where the Advisor has sole investment discretion. No shareholder exceeds the 10% threshold.
The Series may trade in instruments including written and purchased options, forward foreign currency exchange contracts and futures contracts and other derivatives in the normal course of investing activities to assist in managing exposure to various market risks. The Series may be subject to various elements of risk, which may involve, to a varying degree, elements of risk in excess of the amounts recognized for financial statement purposes. These risks include: the risk that changes in the value of a derivative may not correlate perfectly with the underlying asset, rate or index; counterparty credit risk related to over the counter derivative counterparties’ failure to perform under contract terms; liquidity risk related to the lack of a liquid market for these contracts allowing the fund to close out its position(s); and documentation risk relating to disagreement over contract terms. No such investments were held by the Series as of June 30, 2015.
| 7. | Federal Income Tax Information |
The amount and characterization of certain income and capital gains to be distributed are determined in accordance with federal income tax regulations, which may differ from GAAP. The Series may periodically make reclassifications among its capital accounts to reflect income and gains available for distribution (or available capital loss carryovers) under income tax regulations without impacting the Series’ net asset value. Any such reclassifications are not reflected in the financial highlights.
The final determination of the tax character of current year distributions will be made at the conclusion of the fiscal year. The tax character of distributions paid for the year ended December 31, 2014 were as follows:
Tax exempt income $2,488,998
At June 30, 2015, the identified cost for federal income tax purposes, the resulting gross unrealized appreciation and depreciation, and the net unrealized appreciation were as follows:
| | | | | | | | |
Cost for federal income tax purposes | | $ | 391,176,592 | | | | | |
Unrealized appreciation | | | 1,497,239 | | | | | |
Unrealized depreciation | | | (994,841 | ) | | | | |
| | | | | | | | |
Net unrealized appreciation | | $ | 502,398 | | | | | |
| | | | | | | | |
27
{This page intentionally left blank}
28
{This page intentionally left blank}
29
Diversified Tax Exempt Series
Literature Requests
(unaudited)
Proxy Voting Policies and Procedures
A description of the policies and procedures that the Fund uses to determine how to vote proxies relating to portfolio securities is available, without charge, upon request:
| | |
| By phone | | 1-800-466-3863 |
| On the Securities and Exchange | | |
| Commission’s (SEC) web site | | http://www.sec.gov |
Proxy Voting Record
Information regarding how the Fund voted proxies relating to portfolio securities during the most recent 12-month period ended June 30th is available, without charge, upon request:
| | |
| By phone | | 1-800-466-3863 |
| On the SEC’s web site | | http://www.sec.gov |
Quarterly Portfolio Holdings
The Series’ complete schedule of portfolio holdings for the 1st and 3rd quarters of each fiscal year are provided on Form N-Q, and are available, without charge, upon request:
| | |
| By phone | | 1-800-466-3863 |
| On the SEC’s web site | | http://www.sec.gov |
The Series’ Form N-Q may be reviewed and copied at the SEC’s Public Reference Room in Washington, D.C. Information on the operation of the Public Reference Room may be obtained by calling 1-800-SEC-0330.
Prospectus and Statement of Additional Information (SAI)
For more information about any of the Manning & Napier Fund, Inc. Series, you may obtain a prospectus and SAI at www.manning-napier.com or by calling (800) 466-3863. Before investing, carefully consider the objectives, risks, charges and expenses of the investment and read the prospectus carefully as it contains this and other information about the investment company. In addition, this information can be found on the SEC’s web site, http://www.sec.gov.
Additional information available at www.manning-napier.com
1. Fund Holdings - Month-End
2. Fund Holdings - Quarter-End
3. Shareholder Report - Annual
4. Shareholder Report - Semi-Annual
The Fund also offers electronic notification or “e-delivery” when certain documents are available on-line to be downloaded or reviewed. Direct shareholders can elect to receive electronic notification when shareholder reports, prospectus updates, and/or statements are available. If you do not currently have on-line access to your account, you can establish access by going to www.manning-napier.com, click on “Login” in the top corner of the page, and follow the prompts to self-enroll. Once enrolled, you can set your electronic notification preferences by clicking on the Account Options tab located within the green toolbar and then select E-Delivery Option. Should you have any questions on either how to establish on-line access or how to update your account settings, please contact Investor Services at 1-800-466-3863.
The Manning & Napier Fund, Inc. is managed by Manning & Napier Advisors, LLC. Manning & Napier Investor Services, Inc., an affiliate of Manning & Napier Advisors, LLC, is the distributor of the Fund shares.
MNDTE-6/15-SAR

New York Tax Exempt Series
Shareholder Expense Example
(unaudited)
As a shareholder of the Series, you may incur two types of costs: (1) transaction costs and (2) ongoing costs, including management fees and other Series expenses. This example is intended to help you understand your ongoing costs (in dollars) of investing in the Series and to compare these costs with the ongoing costs of investing in other mutual funds.
The example is based on an investment of $1,000 invested at the beginning of the period and held for the entire period (January 1, 2015 to June 30, 2015).
Actual Expenses
The first line of the table below provides information about actual account values and actual expenses. You may use the information in this line, together with the amount you invested, to estimate the expenses that you paid over the period. Simply divide your account value by $1,000 (for example, an $8,600 account value divided by $1,000 = 8.6), then multiply the result by the number in the first line under the heading entitled “Expenses Paid During Period” to estimate the expenses you paid on your account during this period.
Hypothetical Example for Comparison Purposes
The second line of the table below provides information about hypothetical account values and hypothetical expenses based on the Series’ actual expense ratio and an assumed rate of return of 5% per year before expenses, which is not the Series’ actual return. The hypothetical account values and expenses may not be used to estimate the actual ending account balance or expenses you paid during the period. You may use this information to compare the ongoing costs of investing in the Series and other funds. To do so, compare this 5% hypothetical example with the 5% hypothetical examples that appear in the shareholder reports of the other funds.
Please note that the expenses shown in the table are meant to highlight your ongoing costs only and do not reflect any transaction costs. Therefore, the second line of the table is useful in comparing ongoing costs only, and will not help you determine the relative total costs of owning different funds. In addition, if these transaction costs were included, your costs would have been higher.
| | | | | | |
| | | BEGINNING ACCOUNT VALUE 1/1/15 | | ENDING ACCOUNT VALUE 6/30/15 | | EXPENSES PAID DURING PERIOD* 1/1/15-6/30/15 |
Actual | | $1,000.00 | | $1,001.00 | | $2.88 |
Hypothetical (5% return before expenses) | | $1,000.00 | | $1,021.92 | | $2.91 |
*Expenses are equal to the Series’ annualized expense ratio (for the six-month period) of 0.58%, multiplied by the average account value over the period, multiplied by 181/365 (to reflect the one-half year period). Expenses are based on the most recent fiscal half year.
1
New York Tax Exempt Series
Portfolio Composition as of June 30, 2015
(unaudited)
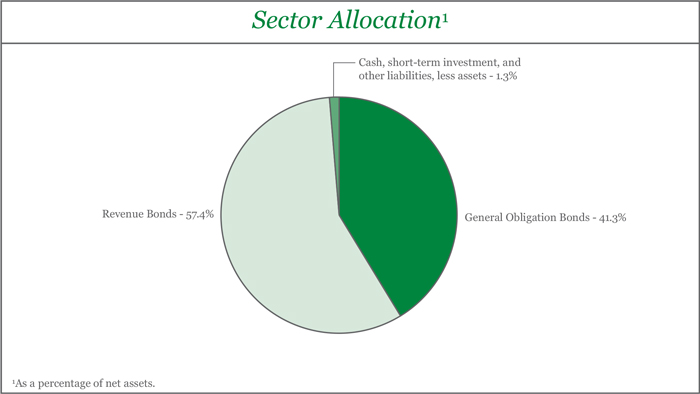
2
New York Tax Exempt Series
Investment Portfolio - June 30, 2015
(unaudited)
| | | | | | | | | | | | | | | | | | |
| | | COUPON
RATE | | | MATURITY
DATE | | | CREDIT
RATING1
(UNAUDITED) | | PRINCIPAL
AMOUNT | | | VALUE (NOTE 2) | |
| | | | | |
NEW YORK MUNICIPAL BONDS - 98.7% | | | | | | | | | | | | | | | | | | |
| | | | | |
Albany City School District, G.O. Bond, BAM | | | 4.000% | | | | 6/15/2017 | | | AA2 | | $ | 200,000 | | | $ | 212,534 | |
Albany Municipal Water Finance Authority, Series A, Revenue Bond | | | 5.000% | | | | 12/1/2016 | | | AA2 | | | 505,000 | | | | 536,295 | |
Albany Municipal Water Finance Authority, Series A, Revenue Bond | | | 5.000% | | | | 12/1/2018 | | | AA2 | | | 1,295,000 | | | | 1,453,793 | |
Albany Municipal Water Finance Authority, Series A, Revenue Bond | | | 5.000% | | | | 12/1/2019 | | | AA2 | | | 1,125,000 | | | | 1,291,016 | |
Amherst, Public Impt., G.O. Bond | | | 5.000% | | | | 9/15/2018 | | | Aa2 | | | 365,000 | | | | 409,504 | |
Arlington Central School District, G.O. Bond | | | 4.000% | | | | 12/15/2020 | | | Aa2 | | | 400,000 | | | | 450,568 | |
Arlington Central School District, G.O. Bond | | | 4.000% | | | | 12/15/2021 | | | Aa2 | | | 300,000 | | | | 338,643 | |
Auburn City School District, G.O. Bond, BAM | | | 2.000% | | | | 6/15/2018 | | | AA2 | | | 225,000 | | | | 229,757 | |
Bay Shore Union Free School District, G.O. Bond | | | 4.000% | | | | 1/15/2018 | | | Aa3 | | | 1,175,000 | | | | 1,264,782 | |
Beacon, Public Impt., Series A, G.O. Bond | | | 3.000% | | | | 10/1/2018 | | | Aa3 | | | 675,000 | | | | 715,189 | |
Bedford Central School District, G.O. Bond | | | 2.000% | | | | 10/15/2021 | | | Aa2 | | | 500,000 | | | | 507,455 | |
Binghamton, G.O. Bond, AGM | | | 5.000% | | | | 8/15/2017 | | | A2 | | | 200,000 | | | | 201,188 | |
Binghamton, Public Impt., G.O. Bond, MAC | | | 3.125% | | | | 1/15/2017 | | | A2 | | | 400,000 | | | | 414,408 | |
Briarcliff Manor, Public Impt., Series A, G.O. Bond | | | 3.000% | | | | 2/1/2020 | | | Aa2 | | | 265,000 | | | | 283,990 | |
Brookhaven, Public Impt., Series A, G.O. Bond | | | 2.000% | | | | 3/15/2017 | | | Aa2 | | | 500,000 | | | | 511,200 | |
Brookhaven, Public Impt., Series A, G.O. Bond | | | 3.000% | | | | 2/1/2019 | | | Aa2 | | | 1,385,000 | | | | 1,470,884 | |
Buffalo Fiscal Stability Authority, Sales Tax & State Aid, Series B, Revenue Bond, NATL | | | 5.000% | | | | 9/1/2016 | | | Aa1 | | | 525,000 | | | | 529,153 | |
Buffalo Municipal Water Finance Authority, Series A, Revenue Bond | | | 4.000% | | | | 7/1/2022 | | | A2 | | | 300,000 | | | | 329,562 | |
Buffalo Municipal Water Finance Authority, Series A, Revenue Bond | | | 5.000% | | | | 7/1/2023 | | | A2 | | | 300,000 | | | | 351,135 | |
Cattaraugus County, Highway Impt., G.O. Bond | | | 2.000% | | | | 4/15/2019 | | | Aa3 | | | 405,000 | | | | 409,180 | |
Chenango Valley Central School District, G.O. Bond, AGM | | | 2.125% | | | | 6/15/2021 | | | A2 | | | 500,000 | | | | 492,250 | |
Clarence Central School District, G.O. Bond | | | 4.000% | | | | 5/15/2021 | | | Aa2 | | | 250,000 | | | | 281,585 | |
Clarkstown Central School District, G.O. Bond | | | 4.000% | | | | 10/15/2021 | | | Aa2 | | | 500,000 | | | | 553,510 | |
Clarkstown, G.O. Bond | | | 4.000% | | | | 5/15/2019 | | | AAA2 | | | 375,000 | | | | 414,649 | |
Cortland County, Public Impt., G.O. Bond, BAM | | | 2.750% | | | | 9/1/2017 | | | AA2 | | | 265,000 | | | | 275,521 | |
Cortland County, Public Impt., G.O. Bond, BAM | | | 2.750% | | | | 9/1/2019 | | | AA2 | | | 305,000 | | | | 321,949 | |
DeWitt, Public Impt., G.O. Bond | | | 3.000% | | | | 5/15/2017 | | | AA2 | | | 315,000 | | | | 327,562 | |
Dutchess County, G.O. Bond | | | 2.125% | | | | 12/15/2023 | | | AA2 | | | 850,000 | | | | 834,403 | |
Dutchess County, Public Impt., G.O. Bond | | | 5.000% | | | | 10/1/2015 | | | Aa2 | | | 250,000 | | | | 253,070 | |
Dutchess County, Public Impt., G.O. Bond | | | 5.000% | | | | 10/1/2018 | | | Aa2 | | | 640,000 | | | | 697,472 | |
Dutchess County, Public Impt., Unrefunded Balance, G.O. Bond, NATL | | | 4.000% | | | | 12/15/2016 | | | Aa2 | | | 360,000 | | | | 360,486 | |
East Irondequoit Central School District, G.O. Bond | | | 3.000% | | | | 6/15/2018 | | | Aa2 | | | 310,000 | | | | 326,359 | |
East Islip Union Free School District, G.O. Bond | | | 5.000% | | | | 6/15/2018 | | | AA2 | | | 305,000 | | | | 339,919 | |
Erie County Fiscal Stability Authority, Public Impt., Series A, Revenue Bond | | | 4.000% | | | | 3/15/2019 | | | Aa1 | | | 600,000 | | | | 657,534 | |
Erie County Fiscal Stability Authority, Series A, Revenue Bond | | | 4.125% | | | | 5/15/2018 | | | Aa1 | | | 450,000 | | | | 488,466 | |
The accompanying notes are an integral part of the financial statements.
3
New York Tax Exempt Series
Investment Portfolio - June 30, 2015
(unaudited)
| | | | | | | | | | | | | | | | | | |
| | | COUPON
RATE | | | MATURITY
DATE | | | CREDIT
RATING1
(UNAUDITED) | | PRINCIPAL
AMOUNT | | | VALUE (NOTE 2) | |
| | | | | |
NEW YORK MUNICIPAL BONDS (continued) | | | | | | | | | | | | | | | | | | |
| | | | | |
Erie County Fiscal Stability Authority, Series C, Revenue Bond | | | 5.000% | | | | 3/15/2018 | | | Aa1 | | $ | 1,025,000 | | | $ | 1,133,322 | |
Erie County Water Authority, Revenue Bond | | | 5.000% | | | | 12/1/2017 | | | Aa2 | | | 300,000 | | | | 328,170 | |
Essex County, Public Impt., G.O. Bond | | | 5.000% | | | | 5/1/2020 | | | AA2 | | | 500,000 | | | | 576,625 | |
Fairport Central School District, School Impt., G.O. Bond | | | 2.000% | | | | 6/15/2018 | | | AA2 | | | 305,000 | | | | 312,704 | |
Gananda Central School District, G.O. Bond | | | 3.000% | | | | 6/15/2019 | | | AA2 | | | 250,000 | | | | 262,957 | |
Gates Chili Central School District, School Impt., G.O. Bond | | | 2.000% | | | | 6/15/2019 | | | Aa3 | | | 215,000 | | | | 220,025 | |
Geneva, Public Impt., G.O. Bond | | | 2.500% | | | | 2/1/2017 | | | A2 | | | 870,000 | | | | 893,133 | |
Greece Central School District, G.O. Bond, AGM | | | 4.000% | | | | 6/15/2019 | | | Aa3 | | | 2,675,000 | | | | 2,814,127 | |
Greece Central School District, G.O. Bond, BAM | | | 2.500% | | | | 6/15/2023 | | | Aa3 | | | 620,000 | | | | 630,081 | |
Herricks Union Free School District, G.O. Bond | | | 2.000% | | | | 11/1/2017 | | | Aa2 | | | 420,000 | | | | 431,075 | |
Huntington, Public Impt., G.O. Bond | | | 3.000% | | | | 7/15/2015 | | | Aaa | | | 925,000 | | | | 926,055 | |
Hyde Park Central School District, G.O. Bond | | | 2.000% | | | | 6/15/2018 | | | AA2 | | | 355,000 | | | | 365,206 | |
Iroquois Central School District, School Impt., G.O. Bond | | | 2.000% | | | | 6/15/2021 | | | Aa2 | | | 500,000 | | | | 504,680 | |
Islip Union Free School District, School Impt., G.O. Bond | | | 2.250% | | | | 3/1/2019 | | | Aa3 | | | 475,000 | | | | 490,551 | |
Jamestown City School District, G.O. Bond | | | 3.000% | | | | 4/1/2019 | | | A1 | | | 200,000 | | | | 208,152 | |
Kings Park Central School District, G.O. Bond | | | 2.000% | | | | 8/1/2020 | | | Aa2 | | | 500,000 | | | | 510,670 | |
Lockport City School District, G.O. Bond, AGM | | | 2.000% | | | | 8/1/2019 | | | A1 | | | 450,000 | | | | 457,506 | |
Long Island Power Authority, Prerefunded Balance, Series A, Revenue Bond, NATL | | | 5.250% | | | | 6/1/2016 | | | A3 | | | 750,000 | | | | 783,525 | |
Longwood Central School District, Suffolk County, School Impt., G.O. Bond | | | 2.250% | | | | 6/15/2018 | | | AA2 | | | 590,000 | | | | 611,122 | |
Mamaroneck, Various Purposes, Public Impt., G.O. Bond | | | 2.000% | | | | 7/15/2020 | | | Aa1 | | | 335,000 | | | | 344,196 | |
Metropolitan Transportation Authority, Transit Impt., Prerefunded Balance, Series A, Revenue Bond, NATL | | | 5.000% | | | | 11/15/2016 | | | A3 | | | 1,545,000 | | | | 1,640,697 | |
Metropolitan Transportation Authority, Transit Impt., Prerefunded Balance, Series B, Revenue Bond, NATL | | | 5.000% | | | | 11/15/2016 | | | A3 | | | 2,590,000 | | | | 2,750,425 | |
Metropolitan Transportation Authority, Transit Impt., Series 2008C, Revenue Bond | | | 6.500% | | | | 11/15/2028 | | | A1 | | | 1,000,000 | | | | 1,172,610 | |
Metropolitan Transportation Authority, Transit Impt., Series A, Revenue Bond, NATL | | | 5.250% | | | | 11/15/2017 | | | Aa2 | | | 1,000,000 | | | | 1,102,790 | |
Metropolitan Transportation Authority, Transit Impt., Series A, Revenue Bond, NATL | | | 5.250% | | | | 11/15/2018 | | | Aa2 | | | 200,000 | | | | 226,996 | |
Metropolitan Transportation Authority, Transit Impt., Series A-2, Revenue Bond | | | 5.000% | | | | 11/15/2017 | | | A1 | | | 340,000 | | | | 372,786 | |
Metropolitan Transportation Authority, Transit Impt., Series C, Revenue Bond | | | 5.000% | | | | 11/15/2018 | | | A1 | | | 650,000 | | | | 730,704 | |
Metropolitan Transportation Authority, Transit Impt., Series C, Revenue Bond | | | 5.000% | | | | 11/15/2019 | | | A1 | | | 500,000 | | | | 574,630 | |
The accompanying notes are an integral part of the financial statements.
4
New York Tax Exempt Series
Investment Portfolio - June 30, 2015
(unaudited)
| | | | | | | | | | | | | | | | | | |
| | | COUPON
RATE | | | MATURITY
DATE | | | CREDIT
RATING1
(UNAUDITED) | | PRINCIPAL
AMOUNT | | | VALUE (NOTE 2) | |
| | | | | |
NEW YORK MUNICIPAL BONDS (continued) | | | | | | | | | | | | | | | | | | |
| | | | | |
Metropolitan Transportation Authority, Transit Impt., Series F, Revenue Bond | | | 5.000% | | | | 11/15/2017 | | | A1 | | $ | 835,000 | | | $ | 915,519 | |
Metropolitan Transportation Authority, Transit Impt., Series F, Revenue Bond | | | 5.000% | | | | 11/15/2019 | | | A1 | | | 1,000,000 | | | | 1,149,260 | |
Metropolitan Transportation Authority, Transit Impt., Subseries D-2, Revenue Bond3 | | | 0.430% | | | | 11/15/2044 | | | A1 | | | 600,000 | | | | 596,724 | |
Monroe County Water Authority, Water Utility Impt., Revenue Bond | | | 4.500% | | | | 8/1/2016 | | | Aa2 | | | 310,000 | | | | 323,200 | |
Monroe County Water Authority, Water Utility Impt., Revenue Bond | | | 5.000% | | | | 8/1/2019 | | | Aa2 | | | 455,000 | | | | 517,754 | |
Monroe County, Public Impt., G.O. Bond, BAM | | | 5.000% | | | | 6/1/2018 | | | AA2 | | | 500,000 | | | | 552,745 | |
Naples Central School District, G.O. Bond, BAM | | | 2.500% | | | | 6/15/2020 | | | AA2 | | | 710,000 | | | | 742,007 | |
Nassau County Interim Finance Authority, Sales Tax Secured, Series A, Revenue Bond | | | 4.000% | | | | 11/15/2016 | | | Aa1 | | | 400,000 | | | | 419,428 | |
Nassau County Sewer & Storm Water Finance Authority, Multi Utility Impt., Series A, Revenue Bond, BHAC | | | 5.000% | | | | 11/1/2018 | | | WR4 | | | 350,000 | | | | 395,399 | |
Nassau County Sewer & Storm Water Finance Authority, Series A, Revenue Bond | | | 5.000% | | | | 10/1/2022 | | | Aa3 | | | 500,000 | | | | 599,385 | |
Nassau County Sewer & Storm Water Finance Authority, Sewer Impt., Series A, Revenue Bond | | | 5.000% | | | | 10/1/2017 | | | Aa3 | | | 500,000 | | | | 547,250 | |
Nassau County Sewer & Storm Water Finance Authority, Sewer Impt., Series A, Revenue Bond | | | 5.000% | | | | 10/1/2018 | | | Aa3 | | | 500,000 | | | | 563,325 | |
Nassau County, Public Impt., Series A, G.O. Bond | | | 5.000% | | | | 4/1/2018 | | | A2 | | | 500,000 | | | | 551,365 | |
Nassau County, Public Impt., Series A, G.O. Bond | | | 5.000% | | | | 4/1/2019 | | | A2 | | | 2,425,000 | | | | 2,740,662 | |
New Rochelle City School District, G.O. Bond | | | 5.000% | | | | 12/15/2017 | | | Aa2 | | | 365,000 | | | | 401,547 | |
New York City Transitional Finance Authority, Building Aid, Public Impt., Series S-1, Revenue Bond | | | 5.000% | | | | 7/15/2018 | | | Aa2 | | | 1,000,000 | | | | 1,117,330 | |
New York City Transitional Finance Authority, Building Aid, Public Impt., Series S-1, Revenue Bond | | | 5.000% | | | | 7/15/2019 | | | Aa2 | | | 1,000,000 | | | | 1,140,840 | |
New York City Transitional Finance Authority, Building Aid, Public Impt., Series S-2, Revenue Bond | | | 5.000% | | | | 7/15/2023 | | | Aa2 | | | 2,000,000 | | | | 2,390,560 | |
New York City Transitional Finance Authority, Future Tax Secured, Prerefunded Balance, Revenue Bond | | | 5.000% | | | | 8/1/2016 | | | WR4 | | | 770,000 | | | | 808,184 | |
New York City Transitional Finance Authority, Future Tax Secured, Prerefunded Balance, Series B, Revenue Bond | | | 5.000% | | | | 5/1/2017 | | | WR4 | | | 285,000 | | | | 307,392 | |
New York City Transitional Finance Authority, Future Tax Secured, Prerefunded Balance, Series B, Revenue Bond | | | 5.000% | | | | 5/1/2017 | | | WR4 | | | 275,000 | | | | 296,607 | |
New York City Transitional Finance Authority, Future Tax Secured, Prerefunded Balance, Series D, Revenue Bond | | | 5.000% | | | | 11/1/2015 | | | WR4 | | | 190,000 | | | | 193,025 | |
The accompanying notes are an integral part of the financial statements.
5
New York Tax Exempt Series
Investment Portfolio - June 30, 2015
(unaudited)
| | | | | | | | | | | | | | | | | | |
| | | COUPON
RATE | | | MATURITY
DATE | | | CREDIT
RATING1
(UNAUDITED) | | PRINCIPAL
AMOUNT | | | VALUE (NOTE 2) | |
| | | | | |
NEW YORK MUNICIPAL BONDS (continued) | | | | | | | | | | | | | | | | | | |
| | | | | |
New York City Transitional Finance Authority, Future Tax Secured, Prerefunded Balance, Subseries A-1, Revenue Bond | | | 5.000% | | | | 8/1/2016 | | | WR4 | | $ | 255,000 | | | $ | 267,645 | |
New York City Transitional Finance Authority, Future Tax Secured, Prerefunded Balance, Subseries A-1, Revenue Bond | | | 5.000% | | | | 11/1/2017 | | | Aa1 | | | 1,000,000 | | | | 1,094,690 | |
New York City Transitional Finance Authority, Future Tax Secured, Public Impt., Series E-1, Revenue Bond | | | 5.000% | | | | 2/1/2026 | | | Aa1 | | | 475,000 | | | | 569,079 | |
New York City Transitional Finance Authority, Future Tax Secured, Public Impt., Subseries B1, Revenue Bond | | | 5.000% | | | | 11/1/2023 | | | Aa1 | | | 2,000,000 | | | | 2,401,820 | |
New York City Transitional Finance Authority, Future Tax Secured, Series B, Revenue Bond | | | 5.000% | | | | 11/1/2023 | | | Aa1 | | | 2,500,000 | | | | 2,986,075 | |
New York City Transitional Finance Authority, Future Tax Secured, Series C, Revenue Bond | | | 5.000% | | | | 11/1/2025 | | | Aa1 | | | 750,000 | | | | 906,750 | |
New York City Transitional Finance Authority, Future Tax Secured, Unrefunded Balance, Series D, Revenue Bond | | | 5.000% | | | | 11/1/2015 | | | Aa1 | | | 1,460,000 | | | | 1,483,886 | |
New York City Water & Sewer System, Prerefunded Balance, Series BB, Revenue Bond | | | 5.000% | | | | 6/15/2017 | | | Aa2 | | | 200,000 | | | | 208,964 | |
New York City Water & Sewer System, Series AA, Prerefunded Balance, Revenue Bond | | | 5.000% | | | | 6/15/2020 | | | Aa2 | | | 950,000 | | | | 1,060,409 | |
New York City Water & Sewer System, Series AA, Revenue Bond | | | 5.000% | | | | 6/15/2021 | | | Aa2 | | | 1,905,000 | | | | 2,124,570 | |
New York City Water & Sewer System, Series BB, Revenue Bond | | | 5.000% | | | | 6/15/2020 | | | Aa2 | | | 500,000 | | | | 569,395 | |
New York City Water & Sewer System, Series GG, Revenue Bond | | | 4.000% | | | | 6/15/2020 | | | Aa2 | | | 700,000 | | | | 781,060 | |
New York City Water & Sewer System, Series HH, Revenue Bond | | | 5.000% | | | | 6/15/2025 | | | Aa2 | | | 3,000,000 | | | | 3,643,590 | |
New York City Water & Sewer System, Water Utility Impt., Prerefunded Balance, Series EE, Revenue Bond | | | 5.000% | | | | 6/15/2017 | | | Aa2 | | | 450,000 | | | | 487,764 | |
New York City Water & Sewer System, Water Utility Impt., Prerefunded Balance, Series EE, Revenue Bond | | | 5.000% | | | | 6/15/2018 | | | Aa2 | | | 175,000 | | | | 195,501 | |
New York City, Public Impt., Prerefunded Balance, Series A, G.O. Bond | | | 5.000% | | | | 8/1/2015 | | | WR4 | | | 2,765,000 | | | | 2,776,254 | |
New York City, Public Impt., Prerefunded Balance, Subseries F-1, G.O. Bond, XLCA | | | 5.000% | | | | 9/1/2015 | | | Aa2 | | | 490,000 | | | | 493,920 | |
New York City, Public Impt., Unrefunded Balance, Subseries F-1, G.O. Bond, XLCA | | | 5.000% | | | | 9/1/2019 | | | Aa2 | | | 10,000 | | | | 10,082 | |
New York City, Series 1, G.O. Bond | | | 5.000% | | | | 8/1/2023 | | | Aa2 | | | 2,700,000 | | | | 3,219,885 | |
New York City, Series A, G.O. Bond, AGM | | | 5.000% | | | | 8/1/2015 | | | Aa2 | | | 205,000 | | | | 205,855 | |
New York City, Series C, G.O. Bond | | | 5.000% | | | | 8/1/2024 | | | Aa2 | | | 4,865,000 | | | | 5,832,697 | |
The accompanying notes are an integral part of the financial statements.
6
New York Tax Exempt Series
Investment Portfolio - June 30, 2015
(unaudited)
| | | | | | | | | | | | | | | | | | |
| | | COUPON
RATE | | | MATURITY
DATE | | | CREDIT
RATING1
(UNAUDITED) | | PRINCIPAL
AMOUNT | | | VALUE (NOTE 2) | |
| | | | | |
NEW YORK MUNICIPAL BONDS (continued) | | | | | | | | | �� | | | | | | | | | |
| | | | | |
New York Local Government Assistance Corp., Subseries A-5/6, Revenue Bond | | | 5.500% | | | | 4/1/2019 | | | Aa1 | | $ | 445,000 | | | $ | 514,295 | |
New York Municipal Bond Bank Agency, Revenue Bond | | | 4.000% | | | | 12/1/2017 | | | AA2 | | | 2,000,000 | | | | 2,147,940 | |
The New York Power Authority, Series A, Revenue Bond | | | 4.000% | | | | 11/15/2018 | | | Aa1 | | | 220,000 | | | | 240,544 | |
The New York Power Authority, Series A, Revenue Bond, FGIC | | | 5.000% | | | | 11/15/2016 | | | Aa1 | | | 900,000 | | | | 916,245 | |
The New York Power Authority, Series C, Revenue Bond, NATL | | | 5.000% | | | | 11/15/2017 | | | Aa1 | | | 500,000 | | | | 548,030 | |
New York State Dormitory Authority, Consolidated Service Contract, Revenue Bond | | | 5.000% | | | | 7/1/2019 | | | Aa2 | | | 750,000 | | | | 853,177 | |
New York State Dormitory Authority, Public Impt., Series E, Revenue Bond | | | 5.000% | | | | 8/15/2017 | | | Aa1 | | | 3,000,000 | | | | 3,264,450 | |
New York State Dormitory Authority, Rochester Institute of Technology, Prerefunded Balance, Series A, Revenue Bond | | | 5.750% | | | | 7/1/2018 | | | A1 | | | 500,000 | | | | 567,855 | |
New York State Dormitory Authority, Rochester Institute of Technology, Revenue Bond | | | 4.000% | | | | 7/1/2017 | | | A1 | | | 300,000 | | | | 318,975 | |
New York State Dormitory Authority, School Impt., Series A, Revenue Bond, AGM | | | 3.000% | | | | 10/1/2017 | | | A2 | | | 750,000 | | | | 784,260 | |
New York State Dormitory Authority, Series B, Revenue Bond, AGM | | | 4.000% | | | | 10/1/2018 | | | AA2 | | | 250,000 | | | | 271,300 | |
New York State Dormitory Authority, Series B, Revenue Bond, AGM | | | 5.000% | | | | 4/1/2019 | | | AA2 | | | 1,265,000 | | | | 1,428,185 | |
New York State Dormitory Authority, Series F, Revenue Bond, AGM | | | 5.000% | | | | 10/1/2017 | | | A2 | | | 2,750,000 | | | | 3,005,667 | |
New York State Dormitory Authority, Series F, Revenue Bond, AGM | | | 5.000% | | | | 10/1/2018 | | | A2 | | | 500,000 | | | | 561,615 | |
New York State Dormitory Authority, University & College Impt., Series A, Revenue Bond | | | 5.000% | | | | 3/15/2017 | | | Aa1 | | | 500,000 | | | | 536,720 | |
New York State Dormitory Authority, University & College Impt., Series A, Revenue Bond | | | 5.000% | | | | 7/1/2020 | | | Aa3 | | | 225,000 | | | | 256,435 | |
New York State Environmental Facilities Corp., Revenue Bond | | | 5.000% | | | | 6/15/2017 | | | Aaa | | | 1,000,000 | | | | 1,082,770 | |
New York State Environmental Facilities Corp., Revenue Bond | | | 5.000% | | | | 6/15/2025 | | | Aaa | | | 1,000,000 | | | | 1,167,500 | |
New York State Environmental Facilities Corp., Subseries A, Revenue Bond | | | 5.000% | | | | 6/15/2020 | | | Aaa | | | 1,250,000 | | | | 1,463,925 | |
New York State Thruway Authority Highway & Bridge Trust Fund, Series B, Revenue Bond | | | 5.000% | | | | 4/1/2018 | | | AA2 | | | 225,000 | | | | 249,473 | |
New York State Thruway Authority Highway & Bridge Trust Fund, Series B, Revenue Bond | | | 5.000% | | | | 4/1/2019 | | | AA2 | | | 350,000 | | | | 392,395 | |
New York State Thruway Authority, Highway Impt., Series A, Revenue Bond | | | 5.000% | | | | 3/15/2017 | | | Aa1 | | | 470,000 | | | | 504,352 | |
The accompanying notes are an integral part of the financial statements.
7
New York Tax Exempt Series
Investment Portfolio - June 30, 2015
(unaudited)
| | | | | | | | | | | | | | | | | | |
| | | COUPON
RATE | | | MATURITY
DATE | | | CREDIT
RATING1
(UNAUDITED) | | PRINCIPAL
AMOUNT | | | VALUE (NOTE 2) | |
| | | | | |
NEW YORK MUNICIPAL BONDS (continued) | | | | | | | | | | | | | | | | | | |
| | | | | |
New York State Thruway Authority, Highway Impt., Series A, Revenue Bond | | | 5.000% | | | | 3/15/2020 | | | Aa1 | | $ | 550,000 | | | $ | 638,314 | |
New York State Thruway Authority, Highway Impt., Series I, Revenue Bond | | | 5.000% | | | | 1/1/2018 | | | A2 | | | 590,000 | | | | 646,805 | |
New York State Thruway Authority, Highway Impt., Series I, Revenue Bond | | | 4.000% | | | | 1/1/2019 | | | A2 | | | 525,000 | | | | 570,376 | |
New York State Thruway Authority, Prerefunded Balance, Series B, Revenue Bond AMBAC | | | 5.000% | | | | 10/1/2015 | | | WR4 | | | 335,000 | | | | 339,020 | |
New York State Thruway Authority, Revenue Bond | | | 5.000% | | | | 4/1/2018 | | | AA2 | | | 2,025,000 | | | | 2,245,259 | |
New York State Thruway Authority, Unrefunded Balance, Series B, Revenue Bond AMBAC | | | 5.000% | | | | 4/1/2019 | | | AA2 | | | 2,165,000 | | | | 2,191,023 | |
New York State Urban Development Corp., Personal Income Tax, Series D, Revenue Bond, | | | 5.000% | | | | 3/15/2022 | | | Aa1 | | | 3,185,000 | | | | 3,767,027 | |
New York State Urban Development Corp., Public Impt., Series A, Revenue Bond | | | 5.000% | | | | 3/15/2023 | | | Aa1 | | | 1,285,000 | | | | 1,502,679 | |
New York State Urban Development Corp., Public Impt., Series A-2, Revenue Bond, AMBAC | | | 5.500% | | | | 3/15/2017 | | | Aa1 | | | 505,000 | | | | 546,188 | |
New York State Urban Development Corp., Public Impt., Series B, Revenue Bond | | | 5.000% | | | | 3/15/2017 | | | Aa1 | | | 675,000 | | | | 724,336 | |
New York State Urban Development Corp., Service Contract, Series D, Revenue Bond | | | 5.250% | | | | 1/1/2017 | | | AA2 | | | 1,500,000 | | | | 1,603,260 | |
New York State, Water Utility Impt., Series A, G.O. Bond | | | 5.000% | | | | 3/1/2018 | | | Aa1 | | | 3,440,000 | | | | 3,811,864 | |
New York State, Water Utility Impt., Series A, G.O. Bond | | | 5.000% | | | | 3/1/2021 | | | Aa1 | | | 1,000,000 | | | | 1,182,610 | |
New York State, Water Utility Impt., Series E, G.O. Bond | | | 5.000% | | | | 12/15/2019 | | | Aa1 | | | 565,000 | | | | 654,558 | |
Niagara County, Water Utility Impt., G.O. Bond | | | 2.000% | | | | 2/1/2020 | | | Aa3 | | | 500,000 | | | | 511,220 | |
Niagara-Wheatfield Central School District, Prerefunded Balance, G.O. Bond, NATL | | | 4.125% | | | | 2/15/2019 | | | A2 | | | 610,000 | | | | 644,410 | |
Niagara-Wheatfield Central School District, Prerefunded Balance, G.O. Bond, NATL | | | 4.125% | | | | 2/15/2020 | | | A2 | | | 850,000 | | | | 897,949 | |
Niskayuna Central School District, G.O. Bond | | | 3.000% | | | | 4/15/2018 | | | AA2 | | | 360,000 | | | | 379,620 | |
North Colonie Central School District, G.O. Bond | | | 4.000% | | | | 7/15/2020 | | | AA2 | | | 400,000 | | | | 447,240 | |
Oneida County, Public Impt., G.O. Bond, AGM | | | 2.500% | | | | 5/15/2019 | | | A1 | | | 500,000 | | | | 523,385 | |
Oneida County, Public Impt., G.O. Bond, AGM | | | 3.000% | | | | 5/1/2020 | | | A1 | | | 400,000 | | | | 416,808 | |
Onondaga County Water Authority, Water Utility Impt., Series A, Revenue Bond | | | 3.000% | | | | 9/15/2017 | | | Aa3 | | | 195,000 | | | | 203,521 | |
Onondaga County Water Authority, Water Utility Impt., Series A, Revenue Bond, BAM | | | 3.000% | | | | 9/15/2018 | | | Aa3 | | | 200,000 | | | | 211,118 | |
Onondaga County, Public Impt., G.O. Bond | | | 4.000% | | | | 5/1/2017 | | | Aa2 | | | 500,000 | | | | 530,020 | |
Onondaga County, Public Impt., G.O. Bond | | | 4.000% | | | | 5/1/2018 | | | Aa2 | | | 1,400,000 | | | | 1,519,756 | |
Onondaga County, Public Impt., G.O. Bond | | | 5.000% | | | | 5/1/2020 | | | Aa2 | | | 250,000 | | | | 291,727 | |
Onondaga County, Public Impt., G.O. Bond | | | 5.000% | | | | 5/15/2022 | | | Aa2 | | | 1,000,000 | | | | 1,195,930 | |
Onondaga County, Public Impt., G.O. Bond | | | 5.000% | | | | 5/15/2023 | | | Aa2 | | | 1,000,000 | | | | 1,210,520 | |
The accompanying notes are an integral part of the financial statements.
8
New York Tax Exempt Series
Investment Portfolio - June 30, 2015
(unaudited)
| | | | | | | | | | | | | | | | | | |
| | | COUPON
RATE | | | MATURITY
DATE | | | CREDIT
RATING1
(UNAUDITED) | | PRINCIPAL
AMOUNT | | | VALUE (NOTE 2) | |
| | | | | |
NEW YORK MUNICIPAL BONDS (continued) | | | | | | | | | | | | | | | | | | |
| | | | | |
Onondaga County, Public Impt., Series A, G.O. Bond | | | 5.000% | | | | 3/1/2017 | | | Aa2 | | $ | 220,000 | | | $ | 235,880 | |
Orange County, Public Impt., G.O. Bond, AGM | | | 2.000% | | | | 8/15/2017 | | | Aa3 | | | 260,000 | | | | 265,910 | |
Orange County, Series A, G.O. Bond | | | 5.000% | | | | 7/15/2015 | | | Aa3 | | | 500,000 | | | | 501,010 | |
Orange County, Series A, G.O. Bond | | | 5.000% | | | | 7/15/2017 | | | Aa3 | | | 550,000 | | | | 596,503 | |
Ossining Union Free School District, School Impt., G.O. Bond | | | 2.250% | | | | 9/1/2016 | | | Aa2 | | | 730,000 | | | | 745,877 | |
Pittsford Central School District, G.O. Bond | | | 4.000% | | | | 10/1/2021 | | | Aa1 | | | 350,000 | | | | 394,013 | |
Port Authority of New York & New Jersey, Airport & Marina Impt., Consolidated Series 189, Revenue Bond | | | 5.000% | | | | 5/1/2024 | | | Aa3 | | | 800,000 | | | | 969,200 | |
Port Authority of New York & New Jersey, Airport & Marina Impt., Series 179, Revenue Bond | | | 5.000% | | | | 12/1/2016 | | | Aa3 | | | 460,000 | | | | 489,408 | |
Port Authority of New York & New Jersey, Airport & Marina Impt., Series 179, Revenue Bond | | | 5.000% | | | | 12/1/2018 | | | Aa3 | | | 400,000 | | | | 451,412 | |
Port Authority of New York & New Jersey, Airport & Marina Impt., Series 179, Revenue Bond | | | 5.000% | | | | 12/1/2024 | | | Aa3 | | | 765,000 | | | | 918,000 | |
Port Authority of New York & New Jersey, Consolidated Series 184, Revenue Bond | | | 5.000% | | | | 9/1/2025 | | | Aa3 | | | 2,500,000 | | | | 3,025,925 | |
Port Authority of New York & New Jersey, Series 180, Revenue Bond | | | 4.000% | | | | 6/1/2016 | | | Aa3 | | | 400,000 | | | | 413,244 | |
Port Authority of New York & New Jersey, Series 180, Revenue Bond | | | 4.000% | | | | 6/1/2019 | | | Aa3 | | | 200,000 | | | | 220,676 | |
Port Washington Union Free School District, G.O. Bond | | | 4.000% | | | | 7/1/2017 | | | Aa1 | | | 300,000 | | | | 318,975 | |
Putnam County, Parking Facility Impt., G.O. Bond | | | 2.000% | | | | 11/15/2018 | | | Aa2 | | | 300,000 | | | | 308,721 | |
Rensselaer County, Nursing Homes, Public Impt., G.O. Bond | | | 2.000% | | | | 7/15/2020 | | | AA2 | | | 930,000 | | | | 943,215 | |
Rochester, School Impt., Series A, G.O. Bond, AMBAC | | | 5.000% | | | | 8/15/2022 | | | Aa3 | | | 95,000 | | | | 111,582 | |
Rochester, School Impt., Series II, G.O. Bond | | | 5.000% | | | | 2/1/2019 | | | Aa3 | | | 1,625,000 | | | | 1,837,193 | |
Roslyn Union Free School District, G.O. Bond | | | 5.000% | | | | 10/15/2020 | | | Aa1 | | | 215,000 | | | | 251,335 | |
Sachem Central School District, G.O. Bond | | | 3.000% | | | | 7/15/2016 | | | AA2 | | | 1,005,000 | | | | 1,031,009 | |
Sachem Central School District, G.O. Bond, NATL | | | 5.250% | | | | 10/15/2017 | | | A3 | | | 225,000 | | | | 246,659 | |
Scarsdale Union Free School District, G.O. Bond | | | 5.000% | | | | 2/1/2017 | | | Aaa | | | 320,000 | | | | 342,022 | |
Shenendehowa Central School District, G.O. Bond | | | 4.000% | | | | 7/15/2020 | | | AA2 | | | 475,000 | | | | 533,800 | |
South Glens Falls Central School District, Unrefunded Balance, G.O. Bond, NATL | | | 5.375% | | | | 6/15/2018 | | | A1 | | | 95,000 | | | | 97,217 | |
South Jefferson Central School District, G.O. Bond, BAM | | | 2.000% | | | | 6/15/2019 | | | AA2 | | | 710,000 | | | | 722,737 | |
South Orangetown Central School District, G.O. Bond | | | 3.000% | | | | 8/1/2015 | | | Aa2 | | | 230,000 | | | | 230,531 | |
Suffolk County Water Authority, Revenue Bond | | | 5.000% | | | | 6/1/2021 | | | AA2 | | | 1,225,000 | | | | 1,445,941 | |
Suffolk County Water Authority, Revenue Bond | | | 4.000% | | | | 6/1/2022 | | | AA2 | | | 200,000 | | | | 223,240 | |
Suffolk County Water Authority, Water Utility Impt., Revenue Bond | | | 5.000% | | | | 6/1/2018 | | | AA2 | | | 2,000,000 | | | | 2,226,620 | |
The accompanying notes are an integral part of the financial statements.
9
New York Tax Exempt Series
Investment Portfolio - June 30, 2015
(unaudited)
| | | | | | | | | | | | | | | | | | |
| | | COUPON
RATE | | | MATURITY
DATE | | | CREDIT
RATING1
(UNAUDITED) | | PRINCIPAL
AMOUNT | | | VALUE (NOTE 2) | |
| | | | | |
NEW YORK MUNICIPAL BONDS (continued) | | | | | | | | | | | | | | | | | | |
| | | | | |
Suffolk County Water Authority, Water Utility Impt., Revenue Bond | | | 5.000% | | | | 6/1/2019 | | | AA2 | | $ | 775,000 | | | $ | 883,151 | |
Suffolk County Water Authority, Water Utility Impt., Series A, Revenue Bond | | | 5.000% | | | | 6/1/2018 | | | AA2 | | | 200,000 | | | | 222,662 | |
Suffolk County, G.O. Bond, AGM | | | 5.000% | | | | 2/1/2018 | | | A2 | | | 500,000 | | | | 550,985 | |
Suffolk County, Series B, G.O. Bond, AGM | | | 5.000% | | | | 10/1/2019 | | | AA2 | | | 1,000,000 | | | | 1,142,980 | |
Sullivan County, Public Impt., G.O. Bond | | | 2.000% | | | | 6/1/2019 | | | AA2 | | | 1,015,000 | | | | 1,044,222 | |
Syracuse, Public Impt., Series A, G.O. Bond, AGM | | | 4.000% | | | | 6/1/2018 | | | A1 | | | 545,000 | | | | 589,189 | |
Tonawanda, Public Impt., G.O. Bond | | | 2.000% | | | | 6/1/2017 | | | AA2 | | | 260,000 | | | | 265,320 | |
Tonawanda, Public Impt., G.O. Bond | | | 2.000% | | | | 6/1/2018 | | | AA2 | | | 365,000 | | | | 373,034 | |
Tonawanda, Public Impt., G.O. Bond | | | 2.000% | | | | 6/1/2019 | | | AA2 | | | 355,000 | | | | 361,660 | |
Triborough Bridge & Tunnel Authority, General Purpose, Prerefunded Balance, Series A, Revenue Bond, NATL | | | 4.750% | | | | 1/1/2016 | | | AA2 | | | 245,000 | | | | 250,537 | |
Triborough Bridge & Tunnel Authority, Highway Impt., Prerefunded Balance, Series A, Revenue Bond | | | 5.000% | | | | 5/15/2018 | | | Aa3 | | | 530,000 | | | | 589,821 | |
Triborough Bridge & Tunnel Authority, Highway Impt., Series A, Revenue Bond | | | 5.000% | | | | 11/15/2018 | | | Aa3 | | | 890,000 | | | | 1,004,053 | |
Triborough Bridge & Tunnel Authority, Highway Impt., Series A, Revenue Bond | | | 5.000% | | | | 11/15/2019 | | | Aa3 | | | 1,075,000 | | | | 1,241,625 | |
Triborough Bridge & Tunnel Authority, Highway Impt., Series A, Revenue Bond | | | 5.000% | | | | 11/15/2023 | | | Aa3 | | | 350,000 | | | | 420,504 | |
Triborough Bridge & Tunnel Authority, Prerefunded Balance, Series C, Revenue Bond | | | 5.000% | | | | 11/15/2018 | | | WR4 | | | 305,000 | | | | 344,165 | |
Triborough Bridge & Tunnel Authority, Prerefunded Balance, Subseries D, Revenue Bond | | | 5.000% | | | | 11/15/2018 | | | WR4 | | | 310,000 | | | | 350,027 | |
Triborough Bridge & Tunnel Authority, Series A, Revenue Bond | | | 4.000% | | | | 11/15/2017 | | | A1 | | | 430,000 | | | | 460,276 | |
Triborough Bridge & Tunnel Authority, Series B, Revenue Bond | | | 5.000% | | | | 11/15/2017 | | | Aa3 | | | 350,000 | | | | 383,967 | |
Triborough Bridge & Tunnel Authority, Series B, Revenue Bond | | | 4.000% | | | | 11/15/2018 | | | Aa3 | | | 250,000 | | | | 274,043 | |
Triborough Bridge & Tunnel Authority, Series B, Revenue Bond | | | 5.000% | | | | 11/15/2019 | | | Aa3 | | | 820,000 | | | | 947,100 | |
Triborough Bridge & Tunnel Authority, Series B, Revenue Bond | | | 5.000% | | | | 11/15/2022 | | | Aa3 | | | 1,000,000 | | | | 1,193,210 | |
Triborough Bridge & Tunnel Authority, Series B, Revenue Bond | | | 5.000% | | | | 11/15/2024 | | | Aa3 | | | 1,000,000 | | | | 1,188,990 | |
Triborough Bridge & Tunnel Authority, Series C, Revenue Bond | | | 5.000% | | | | 11/15/2018 | | | Aa3 | | | 500,000 | | | | 564,605 | |
Ulster County, Public Impt., G.O. Bond | | | 4.000% | | | | 11/15/2019 | | | AA2 | | | 510,000 | | | | 565,391 | |
Union Endicott Central School District, G.O. Bond, BAM | | | 2.125% | | | | 6/15/2019 | | | AA2 | | | 580,000 | | | | 596,524 | |
Voorheesville Central School District, G.O. Bond | | | 5.000% | | | | 6/15/2021 | | | AA2 | | | 500,000 | | | | 583,920 | |
Warren County, Public Impt., G.O. Bond, AGM | | | 4.000% | | | | 7/15/2020 | | | AA2 | | | 500,000 | | | | 547,290 | |
Wayne County, Public Impt., G.O. Bond | | | 3.000% | | | | 6/1/2021 | | | Aa2 | | | 295,000 | | | | 314,340 | |
The accompanying notes are an integral part of the financial statements.
10
New York Tax Exempt Series
Investment Portfolio - June 30, 2015
(unaudited)
| | | | | | | | | | | | | | | | | | | | | | |
| | | COUPON
RATE | | | MATURITY
DATE | | | CREDIT
RATING1
(UNAUDITED) | | | PRINCIPAL
AMOUNT/
SHARES | | | VALUE (NOTE 2) | | | |
| | | | | | |
NEW YORK MUNICIPAL BONDS (continued) | | | | | | | | | | | | | | | | | | | | | | |
| | | | | | |
Webster Central School District, G.O. Bond | | | 4.000% | | | | 10/1/2018 | | | | AA2 | | | $ | 375,000 | | | $ | 408,641 | | | |
Wellsville Central School District, G.O. Bond, AGM | | | 4.000% | | | | 6/15/2016 | | | | A2 | | | | 950,000 | | | | 979,897 | | | |
Westchester County, Prerefunded Balance, Series A, G.O. Bond | | | 3.000% | | | | 10/15/2017 | | | | WR4 | | | | 5,000 | | | | 5,245 | | | |
Westchester County, Unrefunded Balance, Series A, G.O. Bond | | | 3.000% | | | | 10/15/2017 | | | | Aa1 | | | | 410,000 | | | | 430,935 | | | |
Westchester County, Unrefunded Balance, Series C, G.O. Bond | | | 5.000% | | | | 11/1/2017 | | | | Aa1 | | | | 495,000 | | | | 543,451 | | | |
Wilson Central School District, G.O. Bond | | | 3.000% | | | | 6/15/2018 | | | | Aa3 | | | | 420,000 | | | | 441,412 | | | |
Yonkers, Public Impt., Series C, G.O. Bond, AGM | | | 2.000% | | | | 10/15/2017 | | | | A2 | | | | 500,000 | | | | 510,365 | | | |
| | | | | | | | | | | | | | | | | | | | | | |
| | | | | | |
TOTAL MUNICIPAL BONDS | | | | | | | | | | | | | | | | | | | | | | |
(Identified Cost $179,274,055) | | | | | | | | | | | | | | | | | | | 179,653,933 | | | |
| | | | | | | | | | | | | | | | | | | | | | |
| | | | | | |
SHORT-TERM INVESTMENT - 1.6% | | | | | | | | | | | | | | | | | | | | | | |
| | | | | | |
Dreyfus BASIC New York Municipal Money Market Fund | | | | | | | | | | | | | | | | | | | | | | |
(Identified Cost $2,930,686) | | | 0.00% | 5 | | | | | | | | | | | 2,930,686 | | | | 2,930,686 | | | |
| | | | | | | | | | | | | | | | | | | | | | |
TOTAL INVESTMENTS - 100.3% | | | | | | | | | | | | | | | | | | | | | | |
(Identified Cost $182,204,741) | | | | | | | | | | | | | | | | | | | 182,584,619 | | | |
LIABILITIES, LESS OTHER ASSETS - (0.3%) | | | | | | | | | | | | | | | | | | | (492,076 | ) | | |
| | | | | | | | | | | | | | | | | | | | | | |
NET ASSETS - 100% | | | | | | | | | | | | | | | | | | $ | 182,092,543 | | | |
| | | | | | | | | | | | | | | | | | | | | | |
KEY:
G.O. Bond - General Obligation Bond
Impt. - Improvement
Scheduled principal and interest payments are guaranteed by:
AGM (Assurance Guaranty Municipal Corp.)
AMBAC (AMBAC Assurance Corp.)
BAM (Build America Mutual Assurance Co.)
BHAC (Berkshire Hathaway Assurance Corp.)
FGIC (Financial Guaranty Insurance Co.)
MAC (Municipal Assurance Corp.)
NATL (National Public Finance Guarantee Corp.)
XLCA (XL Capital Assurance)
The insurance does not guarantee the market value of the municipal bonds.
1 Credit ratings from Moody’s (unaudited).
2 Credit ratings from S&P (unaudited).
3 The coupon rate is floating and is the effective rate as of June 30, 2015.
4 Credit rating has been withdrawn. As of June 30, 2015, there is no rating available (unaudited).
5 Rate shown is the current yield as of June 30, 2015. Rate is less than 0.01%.
The accompanying notes are an integral part of the financial statements.
11
New York Tax Exempt Series
Statement of Assets and Liabilities
June 30, 2015 (unaudited)
| | | | |
ASSETS: | | | | |
| |
Investments, at value (identified cost $182,204,741) (Note 2) | | $ | 182,584,619 | |
Interest receivable | | | 1,574,071 | |
Prepaid expenses | | | 251 | |
| | | | |
| |
TOTAL ASSETS | | | 184,158,941 | |
| | | | |
| |
LIABILITIES: | | | | |
| |
Due to custodian | | | 37,689 | |
Accrued management fees (Note 3) | | | 80,714 | |
Accrued fund accounting and administration fees (Note 3) | | | 18,571 | |
Accrued transfer agent fees (Note 3) | | | 1,596 | |
Accrued Chief Compliance Officer service fees (Note 3) | | | 382 | |
Payable for fund shares repurchased | | | 1,908,027 | |
Other payables and accrued expenses | | | 19,419 | |
| | | | |
| |
TOTAL LIABILITIES | | | 2,066,398 | |
| | | | |
| |
TOTAL NET ASSETS | | $ | 182,092,543 | |
| | | | |
| |
NET ASSETS CONSIST OF: | | | | |
| |
Capital stock | | $ | 175,121 | |
Additional paid-in-capital | | | 181,244,412 | |
Undistributed net investment income | | | 288,990 | |
Accumulated net realized gain on investments | | | 4,142 | |
Net unrealized appreciation (depreciation) on investments | | | 379,878 | |
| | | | |
| |
TOTAL NET ASSETS | | $ | 182,092,543 | |
| | | | |
| |
NET ASSET VALUE, OFFERING PRICE AND REDEMPTION PRICE PER SHARE -
Class A ($182,092,543/17,512,067 shares) | | $ | 10.40 | |
| | | | |
The accompanying notes are an integral part of the financial statements.
12
New York Tax Exempt Series
Statement of Operations
For the Six Months Ended June 30, 2015 (unaudited)
| | | | |
INVESTMENT INCOME: | | | | |
| |
Interest | | $ | 1,132,563 | |
Dividends | | | 1 | |
| | | | |
| |
Total Investment Income | | | 1,132,564 | |
| | | | |
| |
EXPENSES: | | | | |
| |
Management fees (Note 3) | | | 458,368 | |
Fund accounting and administration fees (Note 3) | | | 40,605 | |
Transfer agent fees (Note 3) | | | 2,251 | |
Directors’ fees (Note 3) | | | 1,706 | |
Chief Compliance Officer service fees (Note 3) | | | 1,224 | |
Custodian fees | | | 3,624 | |
Miscellaneous | | | 27,757 | |
| | | | |
| |
Total Expenses | | | 535,535 | |
| | | | |
| |
NET INVESTMENT INCOME | | | 597,029 | |
| | | | |
| |
REALIZED AND UNREALIZED GAIN (LOSS) ON INVESTMENTS: | | | | |
| |
Net realized gain on investments | | | 4,142 | |
Net change in unrealized appreciation (depreciation) on investments | | | (558,065 | ) |
| | | | |
| |
NET REALIZED AND UNREALIZED GAIN (LOSS) ON INVESTMENTS | | | (553,923 | ) |
| | | | |
| |
NET INCREASE IN NET ASSETS RESULTING FROM OPERATIONS | | $ | 43,106 | |
| | | | |
The accompanying notes are an integral part of the financial statements.
13
New York Tax Exempt Series
Statements of Changes in Net Assets
| | | | | | | | | | |
| | | FOR THE SIX
MONTHS ENDED
6/30/15
(UNAUDITED) | | FOR THE
YEAR ENDED
12/31/14 |
INCREASE IN NET ASSETS: | | | | | | | | | | |
| | |
OPERATIONS: | | | | | | | | | | |
| | |
Net investment income | | | $ | 597,029 | | | | $ | 1,160,455 | |
Net realized gain on investments | | | | 4,142 | | | | | 515,310 | |
Net change in unrealized appreciation (depreciation) on investments | | | | (558,065 | ) | | | | 560,816 | |
| | | | | | | | | | |
| | |
Net increase from operations | | | | 43,106 | | | | | 2,236,581 | |
| | | | | | | | | | |
| | |
DISTRIBUTIONS TO SHAREHOLDERS (Note 8): | | | | | | | | | | |
| | |
From net investment income | | | | (533,838 | ) | | | | (1,062,965 | ) |
From net realized gain on investments | | | | — | | | | | (789,676 | ) |
| | | | | | | | | | |
| | |
Total distributions to shareholders | | | | (533,838 | ) | | | | (1,852,641 | ) |
| | | | | | | | | | |
| | |
CAPITAL STOCK ISSUED AND REPURCHASED: | | | | | | | | | | |
| | |
Net increase from capital share transactions (Note 5) | | | | 1,854,017 | | | | | 16,509,561 | |
| | | | | | | | | | |
| | |
Net increase in net assets | | | | 1,363,285 | | | | | 16,893,501 | |
| | |
NET ASSETS: | | | | | | | | | | |
| | |
Beginning of period | | | | 180,729,258 | | | | | 163,835,757 | |
| | | | | | | | | | |
| | |
End of period (including undistributed net investment income of $288,990 and $225,799, respectively) | | | $ | 182,092,543 | | | | $ | 180,729,258 | |
| | | | | | | | | | |
The accompanying notes are an integral part of the financial statements.
14
New York Tax Exempt Series
Financial Highlights
| | | | | | | | | | | | | | | | | | | | | | | | | | | | | | |
| | | FOR THE SIX
MONTHS ENDED | | FOR THE YEARS ENDED |
| | | 6/30/15
(UNAUDITED) | | 12/31/14 | | 12/31/13 | | 12/31/12 | | 12/31/11 | | 12/31/10 |
Per share data (for a share outstanding throughout each period): | | | | | | | | | | | | | | | | | | | | | | | | | | | | | | |
Net asset value - Beginning of period | | | | $10.42 | | | | | $10.40 | | | | | $10.78 | | | | | $10.63 | | | | | $10.19 | | | | | $10.55 | |
| | | | | | | | | | | | | | | | | | | | | | | | | | | | | | |
| | | | | | |
Income (loss) from investment operations: | | | | | | | | | | | | | | | | | | | | | | | | | | | | | | |
Net investment income1 | | | | 0.03 | | | | | 0.07 | | | | | 0.17 | | | | | 0.19 | | | | | 0.28 | | | | | 0.36 | |
Net realized and unrealized gain (loss) on investments | | | | (0.02 | ) | | | | 0.07 | | | | | (0.36 | ) | | | | 0.16 | | | | | 0.56 | | | | | (0.32 | ) |
| | | | | | | | | | | | | | | | | | | | | | | | | | | | | | |
| | | | | | |
Total from investment operations | | | | 0.01 | | | | | 0.14 | | | | | (0.19 | ) | | | | 0.35 | | | | | 0.84 | | | | | 0.04 | |
| | | | | | | | | | | | | | | | | | | | | | | | | | | | | | |
| | | | | | |
Less distributions to shareholders: | | | | | | | | | | | | | | | | | | | | | | | | | | | | | | |
From net investment income | | | | (0.03 | ) | | | | (0.07 | ) | | | | (0.16 | ) | | | | (0.20 | ) | | | | (0.27 | ) | | | | (0.39 | ) |
From net realized gain on investments | | | | — | | | | | (0.05 | ) | | | | (0.03 | ) | | | | — | 2 | | | | (0.13 | ) | | | | (0.01 | ) |
| | | | | | | | | | | | | | | | | | | | | | | | | | | | | | |
| | | | | | |
Total distributions to shareholders | | | | (0.03 | ) | | | | (0.12 | ) | | | | (0.19 | ) | | | | (0.20 | ) | | | | (0.40 | ) | | | | (0.40 | ) |
| | | | | | | | | | | | | | | | | | | | | | | | | | | | | | |
| | | | | | |
Net asset value - End of period | | | | $10.40 | | | | | $10.42 | | | | | $10.40 | | | | | $10.78 | | | | | $10.63 | | | | | $10.19 | |
| | | | | | | | | | | | | | | | | | | | | | | | | | | | | | |
| | | | | | |
Net assets - End of period (000’s omitted) | | | $ | 182,093 | | | | $ | 180,729 | | | | $ | 163,836 | | | | $ | 162,785 | | | | $ | 158,092 | | | | $ | 136,225 | |
| | | | | | | | | | | | | | | | | | | | | | | | | | | | | | |
| | | | | | |
Total return3 | | | | 0.10% | | | | | 1.28% | | | | | (1.72% | ) | | | | 3.31% | | | | | 8.37% | | | | | 0.32% | |
Ratios (to average net assets)/Supplemental Data: | | | | | | | | | | | | | | | | | | | | | | | | | | | | | | |
Expenses* | | | | 0.58% | 4 | | | | 0.58% | | | | | 0.60% | | | | | 0.60% | | | | | 0.61% | | | | | 0.61% | |
Net investment income | | | | 0.65% | 4 | | | | 0.68% | | | | | 1.57% | | | | | 1.72% | | | | | 2.66% | | | | | 3.41% | |
Portfolio turnover | | | | 25% | | | | | 43% | | | | | 33% | | | | | 7% | | | | | 48% | | | | | 7% | |
* For certain periods presented, the investment advisor did not impose all or a portion of its management and/or other fees, and in some periods may have paid a portion of the Series’ expenses. If these expenses had been incurred by the Series, the expense ratio (to average net assets) would have increased by the following amounts: | |
| | | | N/A | | | | | N/A | | | | | N/A | | | | | N/A | | | | | N/A | | | | | 0.00% | 5 |
1Calculated based on average shares outstanding during the periods.
2Less than $0.01 per share.
3Represents aggregate total return for the periods indicated, and assumes reinvestment of all distributions. Total return would have been lower had certain expenses not been waived or reimbursed during certain periods. Periods less than one year are not annualized.
4Annualized.
5Less than 0.01%.
The accompanying notes are an integral part of the financial statements.
15
New York Tax Exempt Series
Notes to Financial Statements
(unaudited)
New York Tax Exempt Series (the “Series”) is a no-load diversified series of Manning & Napier Fund, Inc. (the “Fund”). The Fund is organized in Maryland and is registered under the Investment Company Act of 1940, as amended, as an open-end management investment company.
The Series’ investment objective is to provide as high a level of current income exempt from federal income tax and New York State personal income tax as the Advisor believes is consistent with the preservation of capital.
The Fund’s advisor is Manning & Napier Advisors, LLC (the “Advisor”). Shares of the Series are offered to investors, clients and employees of the Advisor and its affiliates. The total authorized capital stock of the Fund consists of 15 billion shares of common stock each having a par value of $0.01. As of June 30, 2015, 10.6 billion shares have been designated in total among 41 series, of which 100 million have been designated as New York Tax Exempt Series Class A common stock.
| 2. | Significant Accounting Policies |
The following is a summary of significant accounting policies followed by the Series. The Series is an investment company and, accordingly, follows the investment company accounting and reporting guidance of the Financial Accounting Standards Board Accounting Standards Codification Topic 946 - Investment Companies, which is part of accounting principles generally accepted in the United States of America (“GAAP”).
Security Valuation
Municipal securities will normally be valued on the basis of market valuations provided by an independent pricing service (the “Service”). The Service utilizes the latest price quotations and a matrix system (which considers such factors as security prices of similar securities, yields, maturities and ratings). The Service has been approved by the Fund’s Board of Directors (the “Board”).
Short-term investments that mature in sixty days or less are valued at amortized cost, which approximates fair value. Investments in open-end investment companies are valued at their net asset value per share on valuation date.
Volume and level of activity in established markets for an asset or liability are evaluated to determine whether recent transactions and quoted prices are determinative of fair value. Where there have been significant decreases in volume and level of activity, further analysis and adjustment may be necessary to estimate fair value. The Series measures fair value in these instances by the use of inputs and valuation techniques which may be based upon current market prices of securities that are comparable in coupon, rating, maturity and industry and/or expectation of future cash flows. As a result of trading in relatively thin markets and/or markets that experience significant volatility, the prices used by the Series to value these securities may differ from the value that would be realized if these securities were sold, and the differences could be material.
Securities for which representative valuations or prices are not available from the Series’ pricing service may be valued at fair value as determined in good faith by the Advisor under procedures approved by and under the general supervision and responsibility of the Board. Due to the inherent uncertainty of valuations of such securities, the fair value may differ significantly from the values that would have been used had a ready market for such securities existed. If trading or events occurring after the close of the principal market in which securities are traded are expected to materially affect the value of those securities, then they may be valued at their fair value, taking this trading or these events into account.
Various inputs are used in determining the value of the Series’ assets or liabilities carried at fair value. These inputs are summarized in three broad levels. Level 1 includes quoted prices in active markets for identical assets and liabilities. Level 2 includes other significant observable inputs (including quoted prices for similar securities, interest rates, prepayment speeds, credit risk, etc.). Level 3 includes significant unobservable inputs (including the Series’ own assumptions in determining the fair value of investments). A financial instrument’s level within the fair value hierarchy is based on the lowest level of any input both individually and in aggregate that is significant to the fair value measurement. The inputs or methodology used for valuing securities are not necessarily an indication of the risk associated with investing in those securities.
16
New York Tax Exempt Series
Notes to Financial Statements (continued)
(unaudited)
| 2. | Significant Accounting Policies (continued) |
Security Valuation (continued)
The following is a summary of the valuation levels used for major security types as of June 30, 2015 in valuing the Series’ assets or liabilities carried at fair value:
| | | | | | | | | | | | | | | | |
DESCRIPTION | | TOTAL | | | LEVEL 1 | | | LEVEL 2 | | | LEVEL 3 | |
Assets: | | | | | | | | | | | | | | | | |
Debt securities: | | | | | | | | | | | | | | | | |
States and political subdivisions (municipals) | | $ | 179,653,933 | | | $ | — | | | $ | 179,653,933 | | | $ | — | |
Mutual fund | | | 2,930,686 | | | | 2,930,686 | | | | — | | | | — | |
| | | | | | | | | | | | | | | | |
Total assets | | $ | 182,584,619 | | | $ | 2,930,686 | | | $ | 179,653,933 | | | $ | — | |
| | | | | | | | | | | | | | | | |
There were no Level 3 securities held by the Series as of December 31, 2014 or June 30, 2015.
The Fund’s policy is to recognize transfers in and transfers out of the valuation levels as of the beginning of the reporting period. There were no transfers between Level 1 and Level 2 during the six months ended June 30, 2015.
Security Transactions, Investment Income and Expenses
Security transactions are accounted for on trade date. Dividend income is recorded on the ex-dividend date, except that if the ex-dividend date has passed, certain dividends from foreign securities are recorded as soon as the Series is informed of the ex-dividend date. Non-cash dividends, if any, are recorded at the fair value of the securities received. Interest income, including amortization of premium and accretion of discounts using the effective interest method, is earned from settlement date and accrued daily.
Expenses are recorded on an accrual basis. Most expenses of the Fund can be attributed to a specific series. Expenses which cannot be directly attributed are apportioned among the series in the Fund in such a manner as deemed equitable by the Fund’s Board, taking into consideration, among other things, the nature and type of expense.
The Series uses the identified cost method for determining realized gain or loss on investments for both financial statement and federal income tax reporting purposes.
Federal Taxes
The Series’ policy is to comply with the provisions of the Internal Revenue Code applicable to regulated investment companies. The Series is not subject to federal income tax or excise tax to the extent that the Series distributes to shareholders each year its taxable income, including any net realized gains on investments, in accordance with requirements of the Internal Revenue Code. Accordingly, no provision for federal income tax or excise tax has been made in the financial statements.
Management evaluates its tax positions to determine if the tax positions taken meet the minimum recognition threshold in connection with accounting for uncertainties in income tax positions taken or expected to be taken for the purposes of measuring and recognizing tax liabilities in the financial statements. Recognition of tax benefits of an uncertain tax position is required only when the position is “more likely than not” to be sustained assuming examination by taxing authorities. At June 30, 2015, the Series has recorded no liability for net unrecognized tax benefits relating to uncertain income tax positions taken or expected to be taken in future tax returns.
The Series files income tax returns in the U.S. federal jurisdiction and various states, as required. No income tax returns are currently under investigation. The statute of limitations on the Series’ tax returns remains open for the years ended December 31, 2011 through December 31, 2014. The Series is not aware of any tax positions for which it is reasonably possible that the total amounts of unrecognized tax benefits will significantly change in the next twelve months.
Distributions of Income and Gains
Distributions to shareholders of net investment income are made quarterly. Distributions of net realized gains are made annually. An additional distribution may be necessary to avoid taxation of the Series. Distributions are recorded on the ex-dividend date.
17
New York Tax Exempt Series
Notes to Financial Statements (continued)
(unaudited)
| 2. | Significant Accounting Policies (continued) |
Indemnifications
The Fund’s organizational documents provide former and current directors and officers with a limited indemnification against liabilities arising in connection with the performance of their duties to the Fund. In the normal course of business, the Fund may also enter into contracts that provide general indemnifications. The Fund’s maximum exposure under these arrangements is unknown as this would be dependent on future claims that may be made against the Fund. The risk of material loss from such claims is considered remote.
Other
The preparation of financial statements in conformity with GAAP requires management to make estimates and assumptions that affect the reported amounts of assets and liabilities and the disclosure of contingent assets and liabilities at the date of the financial statements and the reported amounts of income and expenses during the reporting period. Actual results could differ from those estimates.
| 3. | Transactions with Affiliates |
The Fund has an Investment Advisory Agreement (the “Agreement”) with the Advisor, for which the Series pays a fee, computed daily and payable monthly, at an annual rate of 0.50% of the Series’ average daily net assets.
Under the Agreement, personnel of the Advisor provide the Series with advice and assistance in the choice of investments and the execution of securities transactions, and otherwise maintain the Series’ organization. The Advisor also provides the Fund with necessary office space and fund administration and support services. The salaries of all officers of the Fund (except a percentage of the Fund’s Chief Compliance Officer’s salary, which is paid by the Fund), and of all Directors who are “affiliated persons” of the Fund, or of the Advisor, and all personnel of the Fund, or of the Advisor, performing services relating to research, statistical and investment activities, are paid by the Advisor. Each “non-affiliated” Director receives an annual stipend, which is allocated among all the active series of the Fund. In addition, these Directors also receive a fee per Board meeting attended plus a fee for each committee meeting attended and are reimbursed for travel and other out-of-pocket expenses incurred by them in connection with attending such meetings. The Fund also has an Audit Committee Chair, who receives an additional annual stipend for this role.
The Advisor has contractually agreed, until at least April 30, 2016, to waive its management fee and, if necessary, pay other operating expenses of the Series in order to maintain total direct annual fund operating expenses for the Series at no more than 0.85% of average daily net assets each year. The Advisor did not waive any fees for the six months ended June 30, 2015. The Advisor is not eligible to recoup any expenses that have been waived or reimbursed in prior years.
Manning & Napier Investor Services, Inc., a registered broker-dealer affiliate of the Advisor, acts as distributor for the Fund’s shares. The services of Manning & Napier Investor Services, Inc. are provided at no additional cost to the Series.
Pursuant to a master services agreement dated November 1, 2014, the Fund pays the Advisor an annual fee related to fund accounting and administration of 0.0085% on the first $25 billion of average daily net assets (excluding Target Series and Strategic Income Series); 0.0075% on the next $15 billion of average daily net assets (excluding Target Series and Strategic Income Series); and 0.0065% of the average daily net assets in excess of $40 billion (excluding Target Series and Strategic Income Series); plus a base fee of $30,400 per series. Transfer agent fees are charged to the Fund on a per account basis. Additionally, certain transaction and out-of-pocket expenses, including charges for reporting relating to the Fund’s compliance program, are charged. The Advisor has agreements with BNY Mellon Investment Servicing (U.S.) Inc. (“BNY”) under which BNY serves as sub-accountant services agent and sub-transfer agent.
Expenses not directly attributable to a series are allocated based on each series’ relative net assets or number of accounts, depending on the expense.
18
New York Tax Exempt Series
Notes to Financial Statements (continued)
(unaudited)
| 4. | Purchases and Sales Securities |
For the six months ended June 30, 2015, purchases and sales of securities, other than U.S. Government securities and short-term securities, were $55,293,549 and $43,354,363, respectively. There were no purchases or sales of U.S. Government securities.
| 5. | Capital Stock Transactions |
Transactions in shares of New York Tax Exempt Series were:
| | | | | | | | | | | | | | | | | | | | |
| | | FOR THE SIX MONTHS ENDED 6/30/15 | | FOR THE YEAR ENDED 12/31/14 |
| | | SHARES | | AMOUNT | | SHARES | | AMOUNT |
Sold | | | | 1,124,831 | | | | $ | 11,749,442 | | | | | 2,760,068 | | | | $ | 28,891,095 | |
Reinvested | | | | 48,251 | | | | | 501,092 | | | | | 169,423 | | | | | 1,771,520 | |
Repurchased | | | | (998,002 | ) | | | | (10,396,517 | ) | | | | (1,350,557 | ) | | | | (14,153,054 | ) |
| | | | | | | | | | | | | | | | | | | | |
Total | | | | 175,080 | | | | $ | 1,854,017 | | | | | 1,578,934 | | | | $ | 16,509,561 | |
| | | | | | | | | | | | | | | | | | | | |
Over 90% of the shares outstanding are fiduciary accounts where the Advisor has sole investment discretion. No shareholder exceeds the 10% threshold.
The Series may trade in instruments including written and purchased options, forward foreign currency exchange contracts and futures contracts and other derivatives in the normal course of investing activities to assist in managing exposure to various market risks. The Series may be subject to various elements of risk, which may involve, to a varying degree, elements of risk in excess of the amounts recognized for financial statement purposes. These risks include: the risk that changes in the value of a derivative may not correlate perfectly with the underlying asset, rate or index; counterparty credit risk related to over the counter derivative counterparties’ failure to perform under contract terms; liquidity risk related to the lack of a liquid market for these contracts allowing the fund to close out its position(s); and documentation risk relating to disagreement over contract terms. No such investments were held by the Series as of June 30, 2015.
| 7. | Concentration of Credit |
The Series primarily invests in debt obligations issued by the State of New York and its political subdivisions, agencies and public authorities to obtain funds for various public purposes. The Series is more susceptible to factors adversely affecting issues of New York municipal securities than is a municipal bond fund that is not concentrated in these issues to the same extent.
| 8. | Federal Income Tax Information |
The amount and characterization of certain income and capital gains to be distributed are determined in accordance with federal income tax regulations, which may differ from GAAP. The Series may periodically make reclassifications among its capital accounts to reflect income and gains available for distribution (or available capital loss carryovers) under income tax regulations without impacting the Series’ net asset value. Any such reclassifications are not reflected in the financial highlights.
19
New York Tax Exempt Series
Notes to Financial Statements (continued)
(unaudited)
| 8. | Federal Income Tax Information (continued) |
The final determination of the tax character of current year distributions will be made at the conclusion of the fiscal year. The tax character of distributions paid for the year ended December 31, 2014, were as follows:
| | | | | | |
Tax exempt income | | | $1,063,499 | | | |
Long-term capital gains | | | 789,142 | | | |
At June 30, 2015, the identified cost for federal income tax purposes, the resulting gross unrealized appreciation and depreciation, and the net unrealized appreciation were as follows:
| | | | | | |
Cost for federal income tax purposes | | $ | 182,204,741 | | | |
Unrealized appreciation | | | 728,046 | | | |
Unrealized depreciation | | | (348,168 | ) | | |
| | | | | | |
Net unrealized appreciation | | $ | 379,878 | | | |
| | | | | | |
20
{This page intentionally left blank}
21
New York Tax Exempt Series
Literature Requests
(unaudited)
Proxy Voting Policies and Procedures
A description of the policies and procedures that the Fund uses to determine how to vote proxies relating to portfolio securities is available, without charge, upon request:
| | | | |
| By phone | | 1-800-466-3863 | | |
| On the Securities and Exchange | | | | |
| Commission’s (SEC) web site | | http://www.sec.gov | | |
Proxy Voting Record
Information regarding how the Fund voted proxies relating to portfolio securities during the most recent 12-month period ended June 30th is available, without charge, upon request:
| | | | |
| By phone | | 1-800-466-3863 | | |
| On the SEC’s web site | | http://www.sec.gov | | |
Quarterly Portfolio Holdings
The Series’ complete schedule of portfolio holdings for the 1st and 3rd quarters of each fiscal year are provided on Form N-Q, and are available, without charge, upon request:
| | | | |
| By phone | | 1-800-466-3863 | | |
| On the SEC’s web site | | http://www.sec.gov | | |
The Series’ Form N-Q may be reviewed and copied at the SEC’s Public Reference Room in Washington, D.C. Information on the operation of the Public Reference Room may be obtained by calling 1-800-SEC-0330.
Prospectus and Statement of Additional Information (SAI)
For more information about any of the Manning & Napier Fund, Inc. Series, you may obtain a prospectus and SAI at www.manning-napier.com or by calling (800) 466-3863. Before investing, carefully consider the objectives, risks, charges and expenses of the investment and read the prospectus carefully as it contains this and other information about the investment company. In addition, this information can be found on the SEC’s web site, http://www.sec.gov.
Additional information available at www.manning-napier.com
1. Fund Holdings - Month-End
2. Fund Holdings - Quarter-End
3. Shareholder Report - Annual
4. Shareholder Report - Semi-Annual
The Fund also offers electronic notification or “e-delivery” when certain documents are available on-line to be downloaded or reviewed. Direct shareholders can elect to receive electronic notification when shareholder reports, prospectus updates, and/or statements are available. If you do not currently have on-line access to your account, you can establish access by going to www.manning-napier.com, click on “Login” in the top corner of the page, and follow the prompts to self-enroll. Once enrolled, you can set your electronic notification preferences by clicking on the Account Options tab located within the green toolbar and then select E-Delivery Option. Should you have any questions on either how to establish on-line access or how to update your account settings, please contact Investor Services at 1-800-466-3863.
The Manning & Napier Fund, Inc. is managed by Manning & Napier Advisors, LLC. Manning & Napier Investor Services, Inc., an affiliate of Manning & Napier Advisors, LLC, is the distributor of the Fund shares.
MNNYT-6/15-SAR

Core Bond Series
Shareholder Expense Example
(unaudited)
As a shareholder of the Series, you may incur two types of costs: (1) transaction costs and (2) ongoing costs, including management fees and other Series expenses. This example is intended to help you understand your ongoing costs (in dollars) of investing in the Series and to compare these costs with the ongoing costs of investing in other mutual funds.
The example is based on an investment of $1,000 invested at the beginning of the period and held for the entire period (January 1, 2015 to June 30, 2015).
Actual Expenses
The first line of the table below provides information about actual account values and actual expenses. You may use the information in this line, together with the amount you invested, to estimate the expenses that you paid over the period. Simply divide your account value by $1,000 (for example, an $8,600 account value divided by $1,000 = 8.6), then multiply the result by the number in the first line under the heading entitled “Expenses Paid During Period” to estimate the expenses you paid on your account during this period.
Hypothetical Example for Comparison Purposes
The second line of the table below provides information about hypothetical account values and hypothetical expenses based on the Series’ actual expense ratio and an assumed rate of return of 5% per year before expenses, which is not the Series’ actual return. The hypothetical account values and expenses may not be used to estimate the actual ending account balance or expenses you paid during the period. You may use this information to compare the ongoing costs of investing in the Series and other funds. To do so, compare this 5% hypothetical example with the 5% hypothetical examples that appear in the shareholder reports of the other funds.
Please note that the expenses shown in the table are meant to highlight your ongoing costs only and do not reflect any transaction costs. Therefore, the second line of the table is useful in comparing ongoing costs only, and will not help you determine the relative total costs of owning different funds. In addition, if these transaction costs were included, your costs would have been higher.
| | | | | | |
| | | BEGINNING
ACCOUNT VALUE
1/1/15 | | ENDING
ACCOUNT VALUE
6/30/15 | | EXPENSES PAID DURING PERIOD* 1/1/15-6/30/15 |
Actual | | $1,000.00 | | $1,005.60 | | $3.43 |
Hypothetical
(5% return before expenses) | | $1,000.00 | | $1,021.37 | | $3.46 |
*Expenses are equal to the Series’ annualized expense ratio (for the six-month period) of 0.69%, multiplied by the average account value over the period, multiplied by 181/365 (to reflect the one-half year period). Expenses are based on the most recent fiscal half year.
1
Core Bond Series
Portfolio Composition as of June 30, 2015
(unaudited)
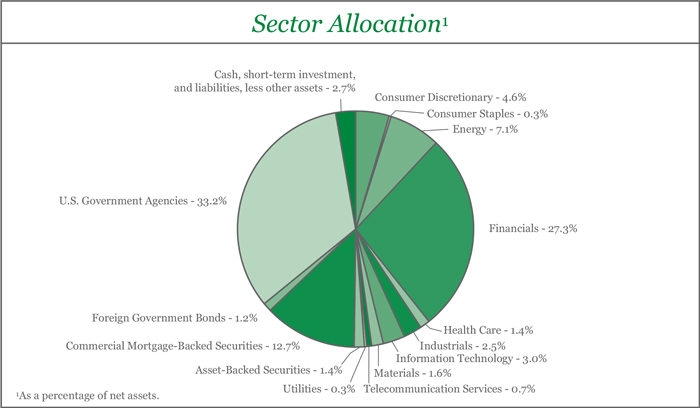
2
Core Bond Series
Investment Portfolio - June 30, 2015
(unaudited)
| | | | | | | | | | | | |
| | | CREDIT
RATING1 | | | PRINCIPAL
AMOUNT | | | VALUE (NOTE 2) | |
| | | |
CORPORATE BONDS - 48.4% | | | | | | | | | | | | |
| | | |
Convertible Corporate Bonds - 0.3% | | | | | | | | | | | | |
Consumer Discretionary - 0.3% | | | | | | | | | | | | |
Internet & Catalog Retail - 0.3% | | | | | | | | | | | | |
The Priceline Group, Inc., 0.35%, 6/15/2020 (Identified Cost $800,737) | | | BBB2 | | | $ | 655,000 | | | $ | 726,231 | |
| | | | | | | | | | | | |
Non-Convertible Corporate Bonds - 48.1% | | | | | | | | | | | | |
Consumer Discretionary - 4.3% | | | | | | | | | | | | |
Automobiles - 0.5% | | | | | | | | | | | | |
Ford Motor Credit Co. LLC, 8.125%, 1/15/2020 | | | Baa3 | | | | 1,000,000 | | | | 1,221,182 | |
| | | | | | | | | | | | |
Household Durables - 0.9% | | | | | | | | | | | | |
NVR, Inc., 3.95%, 9/15/2022 | | | Baa2 | | | | 1,775,000 | | | | 1,799,602 | |
Whirlpool Corp., 2.40%, 3/1/2019 | | | Baa2 | | | | 385,000 | | | | 388,541 | |
| | | | | | | | | | | | |
| | | |
| | | | | | | | | | | 2,188,143 | |
| | | | | | | | | | | | |
Media - 2.6% | | | | | | | | | | | | |
21st Century Fox America, Inc., 6.90%, 3/1/2019 | | | Baa1 | | | | 615,000 | | | | 714,095 | |
DIRECTV Holdings LLC - DIRECTV Financing Co., Inc., 5.20%, 3/15/2020 | | | Baa2 | | | | 1,280,000 | | | | 1,411,732 | |
Discovery Communications LLC, 5.05%, 6/1/2020 | | | Baa2 | | | | 635,000 | | | | 695,389 | |
NBCUniversal Media LLC, 4.375%, 4/1/2021 | | | A3 | | | | 1,100,000 | | | | 1,191,384 | |
Time Warner Entertainment Co. LP, 8.375%, 7/15/2033 | | | Baa2 | | | | 1,800,000 | | | | 2,209,356 | |
| | | | | | | | | | | | |
| | | | | | | | | | | 6,221,956 | |
| | | | | | | | | | | | |
Textiles, Apparel & Luxury Goods - 0.3% | | | | | | | | | | | | |
Coach, Inc., 4.25%, 4/1/2025 | | | Baa2 | | | | 735,000 | | | | 705,908 | |
| | | | | | | | | | | | |
Total Consumer Discretionary | | | | | | | | | | | 10,337,189 | |
| | | | | | | | | | | | |
Consumer Staples - 0.3% | | | | | | | | | | | | |
Beverages - 0.3% | | | | | | | | | | | | |
Anheuser-Busch InBev Worldwide, Inc. (Belgium), 7.75%, 1/15/2019 | | | A2 | | | | 350,000 | | | | 415,431 | |
Pernod-Ricard S.A. (France)3, 5.75%, 4/7/2021 | | | Baa3 | | | | 375,000 | | | | 422,203 | |
| | | | | | | | | | | | |
Total Consumer Staples | | | | | | | | | | | 837,634 | |
| | | | | | | | | | | | |
Energy - 7.1% | | | | | | | | | | | | |
Energy Equipment & Services - 1.1% | | | | | | | | | | | | |
Baker Hughes, Inc., 7.50%, 11/15/2018 | | | A2 | | | | 885,000 | | | | 1,039,752 | |
Ensco plc, 5.20%, 3/15/2025 | | | Baa1 | | | | 775,000 | | | | 767,300 | |
Schlumberger Oilfield plc3, 4.20%, 1/15/2021 | | | Aa3 | | | | 730,000 | | | | 784,387 | |
| | | | | | | | | | | | |
| | | | | | | | | | | 2,591,439 | |
| | | | | | | | | | | | |
| | | | | | | | | | | | |
Oil, Gas & Consumable Fuels - 6.0% | | | | | | | | | | | | |
BP Capital Markets plc (United Kingdom), 1.674%, 2/13/2018 | | | A2 | | | | 750,000 | | | | 752,629 | |
BP Capital Markets plc (United Kingdom), 3.535%, 11/4/2024 | | | A2 | | | | 750,000 | | | | 743,120 | |
CNOOC Finance 2015 Australia Pty. Ltd. (China), 2.625%, 5/5/2020 | | | Aa3 | | | | 800,000 | | | | 789,542 | |
Columbia Pipeline Group, Inc.3, 2.45%, 6/1/2018 | | | Baa2 | | | | 1,200,000 | | | | 1,209,266 | |
Columbia Pipeline Group, Inc.3, 4.50%, 6/1/2025 | | | Baa2 | | | | 600,000 | | | | 590,247 | |
The accompanying notes are an integral part of the financial statements.
3
Core Bond Series
Investment Portfolio - June 30, 2015
(unaudited)
| | | | | | | | | | | | |
| | | CREDIT
RATING1 | | | PRINCIPAL
AMOUNT | | | VALUE (NOTE 2) | |
| | | |
CORPORATE BONDS (continued) | | | | | | | | | | | | |
| | | |
Non-Convertible Corporate Bonds (continued) | | | | | | | | | | | | |
Energy (continued) | | | | | | | | | | | | |
Oil, Gas & Consumable Fuels (continued) | | | | | | | | | | | | |
ConocoPhillips Co., 3.35%, 5/15/2025 | | | A1 | | | $ | 1,100,000 | | | $ | 1,087,991 | |
El Paso Natural Gas Co. LLC, 8.625%, 1/15/2022 | | | Baa3 | | | | 180,000 | | | | 222,020 | |
Hess Corp., 8.125%, 2/15/2019 | | | Baa2 | | | | 630,000 | | | | 745,855 | |
Hiland Partners LP - Hiland Partners Finance Corp.3, 7.25%, 10/1/2020 | | | Baa3 | | | | 500,000 | | | | 540,000 | |
Kinder Morgan Energy Partners LP, 4.30%, 5/1/2024 | | | Baa3 | | | | 2,500,000 | | | | 2,467,110 | |
Kinder Morgan, Inc.3, 5.625%, 11/15/2023 | | | Baa3 | | | | 1,650,000 | | | | 1,755,169 | |
Petrobras Global Finance B.V. (Brazil)4, 1.896%, 5/20/2016 | | | Ba2 | | | | 1,200,000 | | | | 1,182,228 | |
Petroleos Mexicanos (Mexico), 5.75%, 3/1/2018 | | | A3 | | | | 680,000 | | | | 739,724 | |
Petroleos Mexicanos (Mexico)3, 4.50%, 1/23/2026 | | | A3 | | | | 1,150,000 | | | | 1,124,010 | |
Talisman Energy, Inc. (Canada), 3.75%, 2/1/2021 | | | Baa3 | | | | 780,000 | | | | 772,183 | |
| | | | | | | | | | | | |
| | | | | | | | | | | 14,721,094 | |
| | | | | | | | | | | | |
Total Energy | | | | | | | | | | | 17,312,533 | |
| | | | | | | | | | | | |
Financials - 26.9% | | | | | | | | | | | | |
Banks - 9.2% | | | | | | | | | | | | |
Bank of America Corp., 5.42%, 3/15/2017 | | | Baa3 | | | | 1,193,000 | | | | 1,264,106 | |
Bank of America Corp., 5.70%, 5/2/2017 | | | Baa3 | | | | 1,100,000 | | | | 1,173,576 | |
Bank of America Corp., 4.00%, 1/22/2025 | | | Baa3 | | | | 625,000 | | | | 608,934 | |
The Bank of Nova Scotia (Canada), 1.85%, 4/14/2020 | | | Aaa | | | | 1,250,000 | | | | 1,235,975 | |
Barclays Bank plc (United Kingdom)3, 6.05%, 12/4/2017 | | | Baa3 | | | | 555,000 | | | | 603,862 | |
Barclays Bank plc (United Kingdom)3, 10.179%, 6/12/2021 | | | Baa3 | | | | 1,750,000 | | | | 2,318,573 | |
BBVA Bancomer S.A. (Mexico)3, 6.75%, 9/30/2022 | | | Baa2 | | | | 1,185,000 | | | | 1,304,981 | |
Citigroup, Inc., 3.875%, 3/26/2025 | | | Baa3 | | | | 765,000 | | | | 732,797 | |
Citigroup, Inc.4, 0.832%, 8/25/2036 | | | Baa3 | | | | 1,000,000 | | | | 779,152 | |
Intesa Sanpaolo S.p.A. (Italy), 2.375%, 1/13/2017 | | | Baa1 | | | | 770,000 | | | | 773,784 | |
Intesa Sanpaolo S.p.A. (Italy), 3.875%, 1/15/2019 | | | Baa1 | | | | 800,000 | | | | 823,066 | |
Intesa Sanpaolo S.p.A. (Italy)3, 6.50%, 2/24/2021 | | | Baa1 | | | | 800,000 | | | | 912,631 | |
JPMorgan Chase & Co., 4.95%, 3/25/2020 | | | A3 | | | | 1,500,000 | | | | 1,653,413 | |
Lloyds Bank plc (United Kingdom)3, 6.50%, 9/14/2020 | | | Baa2 | | | | 3,745,000 | | | | 4,316,506 | |
National Australia Bank Ltd. (Australia)3, 2.00%, 2/22/2019 | | | Aaa | | | | 775,000 | | | | 783,923 | |
National Bank of Canada (Canada)3, 1.40%, 4/20/2018 | | | Aaa | | | | 800,000 | | | | 797,689 | |
Santander Bank N.A., 8.75%, 5/30/2018 | | | Baa2 | | | | 650,000 | | | | 757,650 | |
Santander Holdings USA, Inc., 2.65%, 4/17/2020 | | | Baa2 | | | | 750,000 | | | | 737,333 | |
Santander Issuances S.A.U. (Spain)3, 5.911%, 6/20/2016 | | | Baa2 | | | | 750,000 | | | | 778,400 | |
| | | | | | | | | | | | |
| | | | | | | | | | | 22,356,351 | |
| | | | | | | | | | | | |
Capital Markets - 5.0% | | | | | | | | | | | | |
Cooperatieve Centrale Raiffeisen-Boerenleenbank B.A. (Netherlands)5,6, 8.375% | | | WR7 | | | | 1,150,000 | | | | 1,201,605 | |
The Goldman Sachs Group, Inc., 5.625%, 1/15/2017 | | | Baa2 | | | | 1,000,000 | | | | 1,058,917 | |
The Goldman Sachs Group, Inc., 7.50%, 2/15/2019 | | | A3 | | | | 1,100,000 | | | | 1,292,070 | |
The Goldman Sachs Group, Inc.4, 1.884%, 11/29/2023 | | | A3 | | | | 755,000 | | | | 767,354 | |
The accompanying notes are an integral part of the financial statements.
4
Core Bond Series
Investment Portfolio - June 30, 2015
(unaudited)
| | | | | | | | | | | | |
| | | CREDIT
RATING1 | | | PRINCIPAL
AMOUNT | | | VALUE (NOTE 2) | |
| | | |
CORPORATE BONDS (continued) | | | | | | | | | | | | |
| | | |
Non-Convertible Corporate Bonds (continued) | | | | | | | | | | | | |
Financials (continued) | | | | | | | | | | | | |
Capital Markets (continued) | | | | | | | | | | | | |
The Goldman Sachs Group, Inc., 3.75%, 5/22/2025 | | | A3 | | | $ | 1,200,000 | | | $ | 1,184,210 | |
Morgan Stanley, 5.95%, 12/28/2017 | | | A3 | | | | 1,500,000 | | | | 1,648,823 | |
Morgan Stanley, 2.125%, 4/25/2018 | | | A3 | | | | 1,400,000 | | | | 1,409,461 | |
Morgan Stanley, 5.00%, 11/24/2025 | | | Baa2 | | | | 950,000 | | | | 994,516 | |
TD Ameritrade Holding Corp., 2.95%, 4/1/2022 | | | A3 | | | | 1,000,000 | | | | 991,507 | |
UBS AG (Switzerland)4, 7.25%, 2/22/2022 | | | BBB2 | | | | 475,000 | | | | 499,882 | |
UBS AG (Switzerland), 7.625%, 8/17/2022 | | | BBB2 | | | | 435,000 | | | | 509,820 | |
UBS AG (Switzerland)4, 4.75%, 5/22/2023 | | | BBB2 | | | | 510,000 | | | | 514,062 | |
| | | | | | | | | | | | |
| | | | | | | | | | | 12,072,227 | |
| | | | | | | | | | | | |
Diversified Financial Services - 2.9% | | | | | | | | | | | | |
General Electric Capital Corp.5,8, 7.125% | | | Baa1 | | | | 850,000 | | | | 980,687 | |
General Electric Capital Corp.4, 0.659%, 5/5/2026 | | | A1 | | | | 1,270,000 | | | | 1,211,703 | |
ING Bank N.V. (Netherlands)3, 5.80%, 9/25/2023 | | | Baa2 | | | | 735,000 | | | | 802,549 | |
ING Bank N.V. (Netherlands)4, 4.125%, 11/21/2023 | | | Baa2 | | | | 1,590,000 | | | | 1,633,223 | |
Peachtree Corners Funding Trust3, 3.976%, 2/15/2025 | | | Baa2 | | | | 1,350,000 | | | | 1,338,752 | |
Voya Financial, Inc., 2.90%, 2/15/2018 | | | Baa2 | | | | 1,150,000 | | | | 1,180,125 | |
| | | | | | | | | | | | |
| | | | | | | | | | | 7,147,039 | |
| | | | | | | | | | | | |
Insurance - 6.0% | | | | | | | | | | | | |
Aegon N.V. (Netherlands)4,5, 2.619% | | | Baa1 | | | | 875,000 | | | | 760,725 | |
American International Group, Inc., 4.875%, 6/1/2022 | | | Baa1 | | | | 2,450,000 | | | | 2,687,447 | |
American International Group, Inc., 4.125%, 2/15/2024 | | | Baa1 | | | | 1,700,000 | | | | 1,764,046 | |
Assured Guaranty US Holdings, Inc., 5.00%, 7/1/2024 | | | Baa2 | | | | 4,750,000 | | | | 4,658,605 | |
AXA S.A. (France)4,5, 2.007% | | | A3 | | | | 1,725,000 | | | | 1,518,000 | |
First American Financial Corp., 4.30%, 2/1/2023 | | | Baa3 | | | | 915,000 | | | | 906,730 | |
The Hartford Financial Services Group, Inc., 5.125%, 4/15/2022 | | | Baa2 | | | | 1,000,000 | | | | 1,109,027 | |
Prudential Financial, Inc.5,9, 5.875% | | | Baa2 | | | | 1,130,000 | | | | 1,194,184 | |
| | | | | | | | | | | | |
| | | | | | | | | | | 14,598,764 | |
| | | | | | | | | | | | |
Real Estate Investment Trusts (REITS) - 3.8% | | | | | | | | | | | | |
American Tower Corp., 2.80%, 6/1/2020 | | | Baa3 | | | | 1,300,000 | | | | 1,281,935 | |
AvalonBay Communities, Inc., 6.10%, 3/15/2020 | | | Baa1 | | | | 850,000 | | | | 977,322 | |
Crown Castle Towers LLC3, 6.113%, 1/15/2020 | | | A2 | | | | 745,000 | | | | 848,267 | |
Crown Castle Towers LLC3, 4.883%, 8/15/2020 | | | A2 | | | | 250,000 | | | | 271,338 | |
Crown Castle Towers LLC3, 3.222%, 5/15/2022 | | | A2 | | | | 400,000 | | | | 393,640 | |
Digital Realty Trust LP, 5.875%, 2/1/2020 | | | Baa2 | | | | 650,000 | | | | 730,403 | |
GTP Acquisition Partners I LLC3, 2.35%, 6/15/2020 | | | Aaa | | | | 450,000 | | | | 447,611 | |
HCP, Inc., 4.00%, 6/1/2025 | | | Baa1 | | | | 1,200,000 | | | | 1,174,804 | |
Health Care REIT, Inc., 4.95%, 1/15/2021 | | | Baa2 | | | | 990,000 | | | | 1,080,711 | |
Health Care REIT, Inc., 4.00%, 6/1/2025 | | | Baa2 | | | | 800,000 | | | | 789,570 | |
Host Hotels & Resorts LP, 4.00%, 6/15/2025 | | | Baa2 | | | | 1,000,000 | | | | 992,570 | |
The accompanying notes are an integral part of the financial statements.
5
Core Bond Series
Investment Portfolio - June 30, 2015
(unaudited)
| | | | | | | | | | | | | | |
| | | CREDIT
RATING1 | | | PRINCIPAL
AMOUNT | | | VALUE (NOTE 2) | | | |
CORPORATE BONDS (continued) | | | | | | | | | | | | | | |
Non-Convertible Corporate Bonds (continued) | | | | | | | | | | | | | | |
Financials (continued) | | | | | | | | | | | | | | |
Real Estate Investment Trusts (REITS) (continued) | | | | | | | | | | | | | | |
Ventas Realty LP - Ventas Capital Corp., 4.75%, 6/1/2021 | | | Baa1 | | | $ | 300,000 | | | $ | 325,069 | | | |
| | | | | | | | | | | | | | |
| | | | |
| | | | | | | | | | | 9,313,240 | | | |
| | | | | | | | | | | | | | |
| | | | |
Total Financials | | | | | | | | | | | 65,487,621 | | | |
| | | | | | | | | | | | | | |
Health Care - 1.4% | | | | | | | | | | | | | | |
Biotechnology - 0.3% | | | | | | | | | | | | | | |
Amgen, Inc., 2.70%, 5/1/2022 | | | Baa1 | | | | 775,000 | | | | 749,241 | | | |
| | | | | | | | | | | | | | |
Health Care Equipment & Supplies - 0.1% | | | | | | | | | | | | | | |
Zimmer Biomet Holdings, Inc., 1.45%, 4/1/2017 | | | Baa3 | | | | 350,000 | | | | 350,118 | | | |
| | | | | | | | | | | | | | |
Health Care Providers & Services - 0.6% | | | | | | | | | | | | | | |
Aetna, Inc., 3.50%, 11/15/2024 | | | Baa1 | | | | 765,000 | | | | 749,910 | | | |
Express Scripts Holding Co., 4.75%, 11/15/2021 | | | Baa3 | | | | 600,000 | | | | 651,064 | | | |
| | | | | | | | | | | | | | |
| | | | |
| | | | | | | | | | | 1,400,974 | | | |
| | | | | | | | | | | | | | |
Pharmaceuticals - 0.4% | | | | | | | | | | | | | | |
AbbVie, Inc., 1.80%, 5/14/2018 | | | Baa1 | | | | 1,000,000 | | | | 997,061 | | | |
| | | | | | | | | | | | | | |
| | | | |
Total Health Care | | | | | | | | | | | 3,497,394 | | | |
| | | | | | | | | | | | | | |
Industrials - 2.5% | | | | | | | | | | | | | | |
Aerospace & Defense - 0.3% | | | | | | | | | | | | | | |
Textron, Inc., 7.25%, 10/1/2019 | | | Baa3 | | | | 600,000 | | | | 702,273 | | | |
| | | | | | | | | | | | | | |
Airlines - 0.7% | | | | | | | | | | | | | | |
American Airlines Pass-Through Trust, Series 2013-2, Class A, 4.95%, 1/15/2023 | | | A2 | | | | 792,201 | | | | 841,714 | | | |
Southwest Airlines Co., 2.75%, 11/6/2019 | | | Baa1 | | | | 765,000 | | | | 776,170 | | | |
| | | | | | | | | | | | | | |
| | | | |
| | | | | | | | | | | 1,617,884 | | | |
| | | | | | | | | | | | | | |
Commercial Services & Supplies - 0.3% | | | | | | | | | | | | | | |
Waste Management, Inc., 3.125%, 3/1/2025 | | | Baa2 | | | | 750,000 | | | | 727,618 | | | |
| | | | | | | | | | | | | | |
Construction & Engineering - 0.3% | | | | | | | | | | | | | | |
Fluor Corp., 3.50%, 12/15/2024 | | | A3 | | | | 800,000 | | | | 802,106 | | | |
| | | | | | | | | | | | | | |
Industrial Conglomerates - 0.8% | | | | | | | | | | | | | | |
Siemens Financieringsmaatschappij N.V. (Germany)3, 2.90%, 5/27/2022 | | | A1 | | | | 2,000,000 | | | | 1,973,900 | | | |
| | | | | | | | | | | | | | |
Trading Companies & Distributors - 0.1% | | | | | | | | | | | | | | |
Air Lease Corp., 3.375%, 1/15/2019 | | | BBB2 | | | | 185,000 | | | | 188,469 | | | |
| | | | | | | | | | | | | | |
| | | | |
Total Industrials | | | | | | | | | | | 6,012,250 | | | |
| | | | | | | | | | | | | | |
Information Technology - 3.0% | | | | | | | | | | | | | | |
Communications Equipment - 0.7% | | | | | | | | | | | | | | |
QUALCOMM, Inc., 3.00%, 5/20/2022 | | | A1 | | | | 600,000 | | | | 595,933 | | | |
QUALCOMM, Inc., 3.45%, 5/20/2025 | | | A1 | | | | 1,200,000 | | | | 1,169,378 | | | |
| | | | | | | | | | | | | | |
| | | | |
| | | | | | | | | | | 1,765,311 | | | |
| | | | | | | | | | | | | | |
The accompanying notes are an integral part of the financial statements.
6
Core Bond Series
Investment Portfolio - June 30, 2015
(unaudited)
| | | | | | | | | | | | | | |
| | | CREDIT RATING1 | | | PRINCIPAL AMOUNT | | | VALUE (NOTE 2) | | | |
CORPORATE BONDS (continued) | | | | | | | | | | | | | | |
Non-Convertible Corporate Bonds (continued) | | | | | | | | | | | | | | |
Information Technology (continued) | | | | | | | | | | | | | | |
Internet Software & Services - 1.0% | | | | | | | | | | | | | | |
Alibaba Group Holding Ltd. (China)3, 2.50%, 11/28/2019 | | | A1 | | | $ | 750,000 | | | $ | 741,813 | | | |
Baidu, Inc. (China), 2.75%, 6/9/2019 | | | A3 | | | | 800,000 | | | | 800,399 | | | |
Tencent Holdings Ltd. (China)3, 3.375%, 5/2/2019 | | | A2 | | | | 825,000 | | | | 847,045 | | | |
| | | | | | | | | | | | | | |
| | | | |
| | | | | | | | | | | 2,389,257 | | | |
| | | | | | | | | | | | | | |
IT Services - 0.9% | | | | | | | | | | | | | | |
Fiserv, Inc., 2.70%, 6/1/2020 | | | Baa2 | | | | 1,200,000 | | | | 1,197,697 | | | |
Xerox Corp., 2.80%, 5/15/2020 | | | Baa2 | | | | 825,000 | | | | 822,317 | | | |
| | | | | | | | | | | | | | |
| | | | |
| | | | | | | | | | | 2,020,014 | | | |
| | | | | | | | | | | | | | |
Technology Hardware, Storage & Peripherals - 0.4% | | | | | | | | | | | | | | |
EMC Corp., 2.65%, 6/1/2020 | | | A1 | | | | 1,020,000 | | | | 1,030,459 | | | |
| | | | | | | | | | | | | | |
| | | | |
Total Information Technology | | | | | | | | | | | 7,205,041 | | | |
| | | | | | | | | | | | | | |
Materials - 1.6% | | | | | | | | | | | | | | |
Chemicals - 0.7% | | | | | | | | | | | | | | |
The Dow Chemical Co., 8.55%, 5/15/2019 | | | Baa2 | | | | 965,000 | | | | 1,176,560 | | | |
Eastman Chemical Co., 2.70%, 1/15/2020 | | | Baa2 | | | | 550,000 | | | | 548,215 | | | |
| | | | | | | | | | | | | | |
| | | | |
| | | | | | | | | | | 1,724,775 | | | |
| | | | | | | | | | | | | | |
Metals & Mining - 0.6% | | | | | | | | | | | | | | |
Rio Tinto Finance USA Ltd. (United Kingdom), 3.75%, 9/20/2021 | | | A3 | | | | 625,000 | | | | 647,701 | | | |
Teck Resources Ltd. (Canada), 3.00%, 3/1/2019 | | | Baa3 | | | | 845,000 | | | | 814,386 | | | |
| | | | | | | | | | | | | | |
| | | | |
| | | | | | | | | | | 1,462,087 | | | |
| | | | | | | | | | | | | | |
Paper & Forest Products - 0.3% | | | | | | | | | | | | | | |
Domtar Corp., 4.40%, 4/1/2022 | | | Baa3 | | | | 735,000 | | | | 746,958 | | | |
| | | | | | | | | | | | | | |
| | | | |
Total Materials | | | | | | | | | | | 3,933,820 | | | |
| | | | | | | | | | | | | | |
Telecommunication Services - 0.7% | | | | | | | | | | | | | | |
Diversified Telecommunication Services - 0.5% | | | | | | | | | | | | | | |
Verizon Communications, Inc., 6.35%, 4/1/2019 | | | Baa1 | | | | 1,000,000 | | | | 1,142,743 | | | |
| | | | | | | | | | | | | | |
Wireless Telecommunication Services - 0.2% | | | | | | | | | | | | | | |
SBA Tower Trust3, 3.598%, 4/15/2018 | | | Baa3 | | | | 465,000 | | | | 463,536 | | | |
| | | | | | | | | | | | | | |
| | | | |
Total Telecommunication Services | | | | | | | | | | | 1,606,279 | | | |
| | | | | | | | | | | | | | |
Utilities - 0.3% | | | | | | | | | | | | | | |
Independent Power and Renewable Electricity Producers - 0.3% | | | | | | | | | | | | | | |
Exelon Generation Co. LLC, 5.20%, 10/1/2019 | | | Baa2 | | | | 675,000 | | | | 742,369 | | | |
| | | | | | | | | | | | | | |
Total Non-Convertible Corporate Bonds | | | | | | | | | | | | | | |
(Identified Cost $116,894,116) | | | | | | | | | | | 116,972,130 | | | |
| | | | | | | | | | | | | | |
TOTAL CORPORATE BONDS | | | | | | | | | | | | | | |
(Identified Cost $117,694,853) | | | | | | | | | | | 117,698,361 | | | |
| | | | | | | | | | | | | | |
The accompanying notes are an integral part of the financial statements.
7
Core Bond Series
Investment Portfolio - June 30, 2015
(unaudited)
| | | | | | | | | | | | | | |
| | | CREDIT RATING1 | | | SHARES/ PRINCIPAL AMOUNT | | | VALUE (NOTE 2) | | | |
PREFERRED STOCK - 0.4% | | | | | | | | | | | | | | |
Financials - 0.4% | | | | | | | | | | | | | | |
Banks - 0.4% | | | | | | | | | | | | | | |
U.S. Bancorp., Series F (non-cumulative), 6.50%10
(Identified Cost $820,000) | | | Baa1 | | | | 32,800 | | | $ | 925,616 | | | |
| | | | | | | | | | | | | | |
ASSET-BACKED SECURITIES - 1.4% | | | | | | | | | | | | | | |
Alterna Funding I LLC, Series 2014-1A, Class NOTE3, 1.639%, 2/15/2021 | | | WR7 | | | $ | 239,407 | | | | 239,856 | | | |
Colony American Homes, Series 2015-1A, Class A3,4, 1.387%, 7/17/2032 | | | Aaa | | | | 575,000 | | | | 568,734 | | | |
FDIC Trust, Series 2011-R1, Class A3, 2.672%, 7/25/2026 | | | WR7 | | | | 100,795 | | | | 103,074 | | | |
FNA Trust, Series 2014-1A, Class A3, 1.296%, 12/10/2022 | | | WR7 | | | | 211,625 | | | | 211,557 | | | |
Hertz Vehicle Financing LLC, Series 2010-1A, Class A23, 3.74%, 2/25/2017 | | | Aaa | | | | 595,000 | | | | 602,300 | | | |
Invitation Homes Trust, Series 2015-SFR3, Class A3,4, 1.487%, 8/17/2032 | | | Aaa | | | | 600,000 | | | | 599,416 | | | |
NextGear Floorplan Master Owner Trust, Series 2014-1A, Class A3, 1.92%, 10/15/2019 | | | Aaa | | | | 390,000 | | | | 391,320 | | | |
SpringCastle America Funding LLC, Series 2014-AA, Class A3, 2.70%, 5/25/2023 | | | WR7 | | | | 275,840 | | | | 277,547 | | | |
Starwood Retail Property Trust, Series 2014-STAR, Class A3,4, 1.402%, 11/15/2027 | | | AAA2 | | | | 410,000 | | | | 407,168 | | | |
| | | | | | | | | | | | | | |
TOTAL ASSET-BACKED SECURITIES | | | | | | | | | | | | | | |
(Identified Cost $3,397,607) | | | | | | | | | | | 3,400,972 | | | |
| | | | | | | | | | | | | | |
COMMERCIAL MORTGAGE-BACKED SECURITIES - 12.7% | | | | | | | | | | | | | | |
Americold LLC Trust, Series 2010-ARTA, Class A13, 3.847%, 1/14/2029 | | | AAA2 | | | | 61,846 | | | | 64,344 | | | |
Banc of America Commercial Mortgage Trust, Series 2006-4, Class A4, 5.634%, 7/10/2046 | | | Aaa | | | | 87,136 | | | | 89,412 | | | |
Bear Stearns Commercial Mortgage Securities Trust, Series 2005-PWR9, Class A4A, 4.871%, 9/11/2042 | | | Aaa | | | | 9,149 | | | | 9,142 | | | |
Bear Stearns Commercial Mortgage Securities Trust, Series 2006-PW12, Class A1A4, 5.709%, 9/11/2038 | | | Aaa | | | | 776,063 | | | | 798,477 | | | |
Bear Stearns Commercial Mortgage Securities Trust, Series 2006-PW13, Class A4, 5.54%, 9/11/2041 | | | AAA2 | | | | 765,244 | | | | 790,266 | | | |
Bear Stearns Commercial Mortgage Securities Trust, Series 2006-T24, Class AM4, 5.568%, 10/12/2041 | | | A3 | | | | 200,000 | | | | 209,470 | | | |
BWAY Mortgage Trust, Series 2015-1740, Class A3, 2.917%, 1/13/2035 | | | AAA2 | | | | 400,000 | | | | 380,358 | | | |
CFCRE Commercial Mortgage Trust, Series 2011-C1, Class A23, 3.759%, 4/15/2044 | | | Aaa | | | | 55,473 | | | | 56,102 | | | |
Citigroup Commercial Mortgage Trust, Series 2006-C4, Class A34, 5.775%, 3/15/2049 | | | Aaa | | | | 342,773 | | | | 350,137 | | | |
COBALT CMBS Commercial Mortgage Trust, Series 2006-C1, Class A4, 5.223%, 8/15/2048 | | | AA2 | | | | 679,187 | | | | 706,394 | | | |
The accompanying notes are an integral part of the financial statements.
8
Core Bond Series
Investment Portfolio - June 30, 2015
(unaudited)
| | | | | | | | | | | | | | |
| | | CREDIT
RATING1 | | | PRINCIPAL
AMOUNT | | | VALUE (NOTE 2) | | | |
| | | |
COMMERCIAL MORTGAGE-BACKED SECURITIES (continued) | | | | | | | | | | | |
| | | | |
Commercial Mortgage Pass-Through Certificates, Series 2006-GG7, Class A44, 5.819%, 7/10/2038 | | | Aaa | | | $ | 394,952 | | | $ | 403,713 | | | |
Commercial Mortgage Pass-Through Certificates, Series 2010-C1, Class A13, 3.156%, 7/10/2046 | | | Aaa | | | | 81,543 | | | | 81,588 | | | |
Commercial Mortgage Pass-Through Certificates, Series 2015-3BP, Class A3, 3.178%, 2/10/2035 | | | WR7 | | | | 400,000 | | | | 392,601 | | | |
Commercial Mortgage Pass-Through Certificates, Series 2015-LC19, Class A4, 3.183%, 2/10/2048 | | | Aaa | | | | 1,100,000 | | | | 1,089,194 | | | |
Credit Suisse Commercial Mortgage Trust, Series 2006-C5, Class A1A, 5.297%, 12/15/2039 | | | Aaa | | | | 954,968 | | | | 996,531 | | | |
Credit Suisse Mortgage Capital Trust, Series 2013-IVR3, Class A13,4, 2.50%, 5/25/2043 | | | AAA2 | | | | 386,548 | | | | 365,514 | | | |
Credit Suisse Mortgage Capital Trust, Series 2013-TH1, Class A13,4, 2.13%, 2/25/2043 | | | AAA2 | | | | 340,232 | | | | 314,882 | | | |
Extended Stay America Trust, Series 2013-ESH7, Class A273, 2.958%, 12/5/2031 | | | Aaa | | | | 455,000 | | | | 456,461 | | | |
Fannie Mae Multifamily REMIC Trust, Series 2012-M13, Class ASQ2, 1.246%, 8/25/2017 | | | WR7 | | | | 308,565 | | | | 310,115 | | | |
Freddie Mac Multifamily Structured Pass-Through Certificates, Series K014, Class X1 (IO)4, 1.236%, 4/25/2021 | | | WR7 | | | | 7,843,156 | | | | 472,221 | | | |
Freddie Mac Multifamily Structured Pass-Through Certificates, Series K016, Class X1 (IO)4, 1.558%, 10/25/2021 | | | WR7 | | | | 1,202,567 | | | | 96,243 | | | |
Freddie Mac Multifamily Structured Pass-Through Certificates, Series K021, Class X1 (IO)4, 1.498%, 6/25/2022 | | | WR7 | | | | 9,743,662 | | | | 812,115 | | | |
Freddie Mac Multifamily Structured Pass-Through Certificates, Series K030, Class X1 (IO)4, 0.224%, 4/25/2023 | | | Aaa | | | | 14,481,161 | | | | 213,930 | | | |
Freddie Mac Multifamily Structured Pass-Through Certificates, Series K032, Class X1 (IO)4, 0.122%, 5/25/2023 | | | WR7 | | | | 8,560,562 | | | | 71,892 | | | |
Freddie Mac Multifamily Structured Pass-Through Certificates, Series K706, Class X1 (IO)4, 1.572%, 10/25/2018 | | | Aaa | | | | 1,660,158 | | | | 75,821 | | | |
Freddie Mac Multifamily Structured Pass-Through Certificates, Series K-P01, Class A2, 1.72%, 1/25/2019 | | | WR7 | | | | 420,000 | | | | 421,326 | | | |
FREMF Mortgage Trust, Series 2011-K15, Class B3,4, 4.949%, 8/25/2044 | | | WR7 | | | | 170,000 | | | | 185,942 | | | |
FREMF Mortgage Trust, Series 2011-K701, Class B3,4, 4.286%, 7/25/2048 | | | A2 | | | | 160,000 | | | | 168,191 | | | |
FREMF Mortgage Trust, Series 2013-K712, Class B3,4, 3.484%, 5/25/2045 | | | A2 | | | | 360,000 | | | | 366,434 | | | |
FREMF Mortgage Trust, Series 2015-K42, Class B3,4, 3.853%, 12/25/2024 | | | A3 | | | | 380,000 | | | | 378,133 | | | |
FREMF Mortgage Trust, Series 2015-K43, Class B3,4, 3.735%, 2/25/2048 | | | WR7 | | | | 400,000 | | | | 400,082 | | | |
GAHR Commercial Mortgage Trust, Series 2015-NRF, Class BFX3,4, 3.382%, 12/15/2019 | | | AA2 | | | | 400,000 | | | | 402,687 | | | |
GAHR Commercial Mortgage Trust, Series 2015-NRF, Class DFX3,4, 3.382%, 12/15/2019 | | | BBB2 | | | | 220,000 | | | | 215,518 | | | |
The accompanying notes are an integral part of the financial statements.
9
Core Bond Series
Investment Portfolio - June 30, 2015
(unaudited)
| | | | | | | | | | | | | | |
| | | CREDIT
RATING1 | | | PRINCIPAL
AMOUNT | | | VALUE (NOTE 2) | | | |
| | | |
COMMERCIAL MORTGAGE-BACKED SECURITIES (continued) | | | | | | | | | | | |
| | | | |
JP Morgan Chase Commercial Mortgage Securities Trust, Series 2005-CB13, Class A44, 5.242%, 1/12/2043 | | | Aaa | | | $ | 588,083 | | | $ | 588,942 | | | |
JP Morgan Chase Commercial Mortgage Securities Trust, Series 2005-CB13, Class AM4, 5.283%, 1/12/2043 | | | A2 | | | | 130,000 | | | | 130,964 | | | |
JP Morgan Chase Commercial Mortgage Securities Trust, Series 2005-LDP5, Class A44, 5.239%, 12/15/2044 | | | Aaa | | | | 170,364 | | | | 170,746 | | | |
JP Morgan Chase Commercial Mortgage Securities Trust, Series 2006-LDP7, Class A44, 5.905%, 4/15/2045 | | | Aaa | | | | 401,186 | | | | 410,323 | | | |
JP Morgan Chase Commercial Mortgage Securities Trust, Series 2010-C2, Class A33, 4.07%, 11/15/2043 | | | AAA | 2 | | | 200,000 | | | | 214,742 | | | |
JP Morgan Mortgage Trust, Series 2013-1, Class 1A23,4, 3.00%, 3/25/2043 | | | WR | 7 | | | 278,787 | | | | 271,553 | | | |
JP Morgan Mortgage Trust, Series 2013-2, Class A23,4, 3.50%, 5/25/2043 | | | AAA | 2 | | | 305,320 | | | | 306,918 | | | |
JP Morgan Mortgage Trust, Series 2014-2, Class 1A13,4, 3.00%, 6/25/2029 | | | AAA | 2 | | | 333,473 | | | | 338,814 | | | |
LB-UBS Commercial Mortgage Trust, Series 2006-C7, Class A1A, 5.335%, 11/15/2038 | | | AAA | 2 | | | 820,474 | | | | 859,434 | | | |
LSTAR Commercial Mortgage Trust, Series 2014-2, Class A23, 2.767%, 1/20/2041 | | | Aaa | | | | 330,000 | | | | 334,727 | | | |
Merrill Lynch Mortgage Trust, Series 2006-C2, Class A44, 5.742%, 8/12/2043 | | | Aaa | | | | 1,153,350 | | | | 1,190,048 | | | |
ML-CFC Commercial Mortgage Trust, Series 2006-4, Class A3, 5.172%, 12/12/2049 | | | Aaa | | | | 1,137,381 | | | | 1,182,027 | | | |
Morgan Stanley Bank of America Merrill Lynch Trust, Series 2014-C15, Class A4, 4.051%, 4/15/2047 | | | Aaa | | | | 1,100,000 | | | | 1,164,917 | | | |
Morgan Stanley Capital I Trust, Series 2006-IQ12, Class A4, 5.332%, 12/15/2043 | | | AAA | 2 | | | 2,213,631 | | | | 2,302,564 | | | |
Motel 6 Trust, Series 2015-MTL6, Class B3, 3.298%, 2/5/2030 | | | WR | 7 | | | 350,000 | | | | 349,089 | | | |
New Residential Mortgage Loan Trust, Series 2014-3A, Class AFX33,4, 3.75%, 11/25/2054 | | | AAA | 2 | | | 375,168 | | | | 384,717 | | | |
OBP Depositor LLC Trust, Series 2010-OBP, Class A3, 4.646%, 7/15/2045 | | | AAA | 2 | | | 100,000 | | | | 109,983 | | | |
Resource Capital Corp., Series 2013-CRE1, Class A (Cayman Islands)3,4, 1.486%, 12/15/2028 | | | AAA | 2 | | | 38,914 | | | | 38,909 | | | |
SCG Trust, Series 2013-SRP1, Class AJ3,4, 2.136%, 11/15/2026 | | | AAA | 2 | | | 450,000 | | | | 451,332 | | | |
Sequoia Mortgage Trust, Series 2011-2, Class A14, 3.90%, 9/25/2041 | | | WR | 7 | | | 159,584 | | | | 164,478 | | | |
Sequoia Mortgage Trust, Series 2012-2, Class A24, 3.50%, 4/25/2042 | | | WR | 7 | | | 200,601 | | | | 202,743 | | | |
Sequoia Mortgage Trust, Series 2013-7, Class A24, 3.00%, 6/25/2043 | | | AAA | 2 | | | 239,291 | | | | 230,617 | | | |
Sequoia Mortgage Trust, Series 2013-8, Class A14, 3.00%, 6/25/2043 | | | Aaa | | | | 326,873 | | | | 315,228 | | | |
U.S. Small Business Administration, Series 2015-10A, Class 1, 2.517%, 3/10/2025 | | | WR | 7 | | | 630,000 | | | | 631,006 | | | |
UBS-Barclays Commercial Mortgage Trust, Series 2013-C5, Class A4, 3.185%, 3/10/2046 | | | Aaa | | | | 800,000 | | | | 807,501 | | | |
Vornado DP LLC Trust, Series 2010-VNO, Class A2FX3, 4.004%, 9/13/2028 | | | AAA | 2 | | | 245,000 | | | | 263,044 | | | |
The accompanying notes are an integral part of the financial statements.
10
Core Bond Series
Investment Portfolio - June 30, 2015
(unaudited)
| | | | | | | | | | | | | | |
| | | CREDIT
RATING1 | | | PRINCIPAL
AMOUNT | | | VALUE (NOTE 2) | | | |
| | | |
COMMERCIAL MORTGAGE-BACKED SECURITIES (continued) | | | | | | | | | | | |
| | | | |
Wachovia Bank Commercial Mortgage Trust, Series 2005-C21, Class A44, 5.262%, 10/15/2044 | | | Aaa | | | $ | 47,811 | | | $ | 47,860 | | | |
Wachovia Bank Commercial Mortgage Trust, Series 2005-C22, Class AM4, 5.334%, 12/15/2044 | | | A2 | | | | 300,000 | | | | 303,105 | | | |
Wachovia Bank Commercial Mortgage Trust, Series 2006-C26, Class A34, 6.011%, 6/15/2045 | | | Aaa | | | | 1,030,000 | | | | 1,059,003 | | | |
Wells Fargo Commercial Mortgage Trust, Series 2010-C1, Class A23, 4.393%, 11/15/2043 | | | Aaa | | | | 275,000 | | | | 299,639 | | | |
WF-RBS Commercial Mortgage Trust, Series 2011-C2, Class A43,4, 4.869%, 2/15/2044 | | | Aaa | | | | 810,000 | | | | 897,755 | | | |
WF-RBS Commercial Mortgage Trust, Series 2014-C19, Class A5, 4.101%, 3/15/2047 | | | Aaa | | | | 700,000 | | | | 750,912 | | | |
WF-RBS Commercial Mortgage Trust, Series 2014-C20, Class A5, 3.995%, 5/15/2047 | | | Aaa | | | | 1,100,000 | | | | 1,167,541 | | | |
WinWater Mortgage Loan Trust, Series 2015-1, Class A13,4, 3.50%, 1/20/2045 | | | WR7 | | | | 348,758 | | | | 354,345 | | | |
WinWater Mortgage Loan Trust, Series 2015-3, Class A53,4, 3.50%, 3/20/2045 | | | Aaa | | | | 445,962 | | | | 455,505 | | | |
| | | | | | | | | | | | | | |
| | | | |
TOTAL COMMERCIAL MORTGAGE-BACKED SECURITIES | | | | | | | | | | | | | | |
(Identified Cost $31,262,401) | | | | | | | | | | | 30,896,267 | | | |
| | | | | | | | | | | | | | |
| | | | |
FOREIGN GOVERNMENT BONDS - 1.2% | | | | | | | | | | | | | | |
| | | | |
Brazilian Government International Bond (Brazil), 8.875%, 10/14/2019 | | | Baa2 | | | | 300,000 | | | | 372,750 | | | |
Export-Import Bank of Korea (South Korea), 2.625%, 12/30/2020 | | | Aa3 | | | | 2,500,000 | | | | 2,486,502 | | | |
| | | | | | | | | | | | | | |
| | | | |
TOTAL FOREIGN GOVERNMENT BONDS | | | | | | | | | | | | | | |
(Identified Cost $2,863,905) | | | | | | | | | | | 2,859,252 | | | |
| | | | | | | | | | | | | | |
| | | | |
U.S. GOVERNMENT AGENCIES - 33.2% | | | | | | | | | | | | | | |
| | | | |
Mortgage-Backed Securities - 6.8% | | | | | | | | | | | | | | |
Fannie Mae, Pool #888468, 5.50%, 9/1/2021 | | | | | | | 378,569 | | | | 411,416 | | | |
Fannie Mae, Pool #995233, 5.50%, 10/1/2021 | | | | | | | 28,896 | | | | 31,111 | | | |
Fannie Mae, Pool #888017, 6.00%, 11/1/2021 | | | | | | | 37,101 | | | | 40,731 | | | |
Fannie Mae, Pool #995329, 5.50%, 12/1/2021 | | | | | | | 259,327 | | | | 281,251 | | | |
Fannie Mae, Pool #888136, 6.00%, 12/1/2021 | | | | | | | 46,114 | | | | 50,505 | | | |
Fannie Mae, Pool #888810, 5.50%, 11/1/2022 | | | | | | | 458,045 | | | | 497,963 | | | |
Fannie Mae, Pool #AD0462, 5.50%, 10/1/2024 | | | | | | | 28,052 | | | | 30,731 | | | |
Fannie Mae, Pool #AL5861, 4.50%, 1/1/2031 | | | | | | | 676,832 | | | | 731,730 | | | |
Fannie Mae, Pool #MA1834, 4.50%, 2/1/2034 | | | | | | | 163,868 | | | | 178,526 | | | |
Fannie Mae, Pool #MA1890, 4.00%, 5/1/2034 | | | | | | | 306,285 | | | | 328,051 | | | |
Fannie Mae, Pool #MA2177, 4.00%, 2/1/2035 | | | | | | | 294,856 | | | | 315,833 | | | |
Fannie Mae, Pool #MA2198, 3.50%, 3/1/2035 | | | | | | | 980,347 | | | | 1,025,074 | | | |
Fannie Mae, Pool #828377, 5.50%, 6/1/2035 | | | | | | | 684,392 | | | | 770,467 | | | |
Fannie Mae, Pool #889494, 5.50%, 1/1/2037 | | | | | | | 737,891 | | | | 830,575 | | | |
The accompanying notes are an integral part of the financial statements.
11
Core Bond Series
Investment Portfolio - June 30, 2015
(unaudited)
| | | | | | | | | | |
| | | PRINCIPAL AMOUNT | | | VALUE (NOTE 2) | | | |
U.S. GOVERNMENT AGENCIES (continued) | | | | | | | | | | |
Mortgage-Backed Securities (continued) | | | | | | | | | | |
Fannie Mae, Pool #933731, 5.50%, 4/1/2038 | | $ | 101,782 | | | $ | 114,170 | | | |
Fannie Mae, Pool #889624, 5.50%, 5/1/2038 | | | 120,213 | | | | 134,776 | | | |
Fannie Mae, Pool #995876, 6.00%, 11/1/2038 | | | 323,641 | | | | 367,730 | | | |
Fannie Mae, Pool #AD0307, 5.50%, 1/1/2039 | | | 120,629 | | | | 135,242 | | | |
Fannie Mae, Pool #AD1067, 4.50%, 3/1/2040 | | | 810,357 | | | | 878,381 | | | |
Fannie Mae, Pool #AL0160, 4.50%, 5/1/2041 | | | 808,468 | | | | 876,261 | | | |
Fannie Mae, Pool #AB4300, 3.50%, 1/1/2042 | | | 333,942 | | | | 345,174 | | | |
Fannie Mae, Pool #AQ7871, 3.50%, 12/1/2042 | | | 352,546 | | | | 364,484 | | | |
Fannie Mae, Pool #AL6294, 4.50%, 11/1/2044 | | | 932,687 | | | | 1,013,487 | | | |
Freddie Mac, Pool #G11850, 5.50%, 7/1/2020 | | | 139,861 | | | | 149,328 | | | |
Freddie Mac, Pool #G12610, 6.00%, 3/1/2022 | | | 44,653 | | | | 48,760 | | | |
Freddie Mac, Pool #G12655, 6.00%, 5/1/2022 | | | 32,546 | | | | 35,642 | | | |
Freddie Mac, Pool #G12988, 6.00%, 1/1/2023 | | | 25,198 | | | | 27,834 | | | |
Freddie Mac, Pool #G13078, 6.00%, 3/1/2023 | | | 44,843 | | | | 49,397 | | | |
Freddie Mac, Pool #D98711, 4.50%, 7/1/2031 | | | 236,557 | | | | 258,102 | | | |
Freddie Mac, Pool #C91746, 4.50%, 12/1/2033 | | | 243,786 | | | | 265,077 | | | |
Freddie Mac, Pool #C91754, 4.50%, 3/1/2034 | | | 229,038 | | | | 249,270 | | | |
Freddie Mac, Pool #C91766, 4.50%, 5/1/2034 | | | 250,947 | | | | 273,509 | | | |
Freddie Mac, Pool #C91771, 4.50%, 6/1/2034 | | | 238,703 | | | | 261,242 | | | |
Freddie Mac, Pool #C91780, 4.50%, 7/1/2034 | | | 229,742 | | | | 250,463 | | | |
Freddie Mac, Pool #C91832, 3.50%, 6/1/2035 | | | 1,097,028 | | | | 1,145,258 | | | |
Freddie Mac, Pool #G07655, 5.50%, 12/1/2035 | | | 228,377 | | | | 256,158 | | | |
Freddie Mac, Pool #G05956, 5.50%, 7/1/2038 | | | 108,047 | | | | 120,898 | | | |
Freddie Mac, Pool #G05671, 5.50%, 8/1/2038 | | | 27,396 | | | | 30,653 | | | |
Freddie Mac, Pool #G08331, 4.50%, 2/1/2039 | | | 905,167 | | | | 978,713 | | | |
Freddie Mac, Pool #G05275, 5.50%, 2/1/2039 | | | 735,575 | | | | 831,939 | | | |
Freddie Mac, Pool #G05900, 6.00%, 3/1/2040 | | | 198,078 | | | | 223,915 | | | |
Freddie Mac, Pool #G60071, 4.50%, 7/1/2042 | | | 758,276 | | | | 818,287 | | | |
Freddie Mac, Pool #Q17513, 3.50%, 4/1/2043 | | | 286,143 | | | | 295,082 | | | |
Freddie Mac, Pool #C09068, 3.50%, 11/1/2044 | | | 208,104 | | | | 214,329 | | | |
| | | | | | | | | | |
Total Mortgage-Backed Securities | | | | | | | | | | |
(Identified Cost $16,474,222) | | | | | | | 16,537,525 | | | |
| | | | | | | | | | |
Other Agencies - 26.4% | | | | | | | | | | |
Fannie Mae, 0.875%, 5/21/2018 | | | 26,405,000 | | | | 26,246,966 | | | |
Fannie Mae, 2.625%, 9/6/2024 | | | 6,985,000 | | | | 6,987,696 | | | |
Freddie Mac, 1.00%, 6/29/2017 | | | 23,915,000 | | | | 24,046,222 | | | |
Freddie Mac, 2.375%, 1/13/2022 | | | 6,900,000 | | | | 6,986,043 | | | |
| | | | | | | | | | |
Total Other Agencies | | | | | | | | | | |
(Identified Cost $64,481,433) | | | | | | | 64,266,927 | | | |
| | | | | | | | | | |
TOTAL U.S. GOVERNMENT AGENCIES | | | | | | | | | | |
(Identified Cost $80,955,655) | | | | | | | 80,804,452 | | | |
| | | | | | | | | | |
The accompanying notes are an integral part of the financial statements.
12
Core Bond Series
Investment Portfolio - June 30, 2015
(unaudited)
| | | | | | | | | | |
| | | SHARES | | | VALUE (NOTE 2) | | | |
| | | |
SHORT-TERM INVESTMENT - 3.2% | | | | | | | | | | |
| | | |
Dreyfus Cash Management, Inc. - Institutional Shares11, 0.04%, | | | | | | | | | | |
(Identified Cost $7,631,093) | | | 7,631,093 | | | $ | 7,631,093 | | | |
| | | | | | | | | | |
| | | |
TOTAL INVESTMENTS - 100.5% | | | | | | | | | | |
(Identified Cost $244,625,514) | | | | | | | 244,216,013 | | | |
LIABILITIES, LESS OTHER ASSETS - (0.5%) | | | | | | | (1,099,763 | ) | | |
| | | | | | | | | | |
NET ASSETS - 100% | | | | | | $ | 243,116,250 | | | |
| | | | | | | | | | |
IO - Interest only
1Credit ratings from Moody’s (unaudited).
2Credit ratings from S&P (unaudited).
3Restricted securities - Investment in securities that are restricted as to public resale under the Securities Act of 1933, as amended. These securities have been sold under rule 144A and have been determined to be liquid under guidelines established by the Board of Directors. These securities amount to $39,071,179 or 16.1%, of the Series’ net assets as of June 30, 2015 (see Note 2 to the financial statements).
4The coupon rate is floating and is the effective rate as of June 30, 2015.
5Security is perpetual in nature and has no stated maturity date.
6The rate shown is a fixed rate as of June 30, 2015; the rate becomes floating, based on U.S. Treasury Note (5 Year) in July 2016.
7Credit rating has been withdrawn. As of June 30, 2015, there is no rating available (unaudited).
8The rate shown is a fixed rate as of June 30, 2015; the rate becomes floating, based on LIBOR plus a spread, in June 2022.
9The rate shown is a fixed rate as of June 30, 2015; the rate becomes floating, based on LIBOR plus a spread, in September 2022.
10The rate shown is a fixed rate as of June 30, 2015; the rate becomes floating, based on LIBOR plus a spread, in January 2022.
11Rate shown is the current yield as of June 30, 2015.
The Global Industry Classification Standard (GICS) was developed by and is the exclusive property and a service mark of MSCI Inc. (MSCI) and Standard & Poor’s, a division of The McGraw-Hill Companies, Inc. (S&P), and is licensed for use by Manning & Napier when referencing GICS sectors. Neither MSCI, S&P, nor any third party involved in making or compiling the GICS or any GICS classifications makes any express or implied warranties or representations with respect to such standard or classification, nor shall any such party have any liability therefrom.
The accompanying notes are an integral part of the financial statements.
13
Core Bond Series
Statement of Assets and Liabilities
June 30, 2015 (unaudited)
| | | | |
ASSETS: | | | | |
| |
Investments, at value (identified cost $244,625,514) (Note 2) | | $ | 244,216,013 | |
Interest receivable | | | 1,623,969 | |
Receivable for fund shares sold | | | 557,160 | |
Dividends receivable | | | 13,768 | |
| | | | |
| |
TOTAL ASSETS | | | 246,410,910 | |
| | | | |
| |
LIABILITIES: | | | | |
| |
Accrued management fees (Note 3) | | | 127,050 | |
Accrued fund accounting and administration fees (Note 3) | | | 17,005 | |
Accrued transfer agent fees (Note 3) | | | 1,234 | |
Accrued Chief Compliance Officer service fees (Note 3) | | | 382 | |
Payable for securities purchased | | | 2,353,392 | |
Payable for fund shares repurchased | | | 773,803 | |
Other payables and accrued expenses | | | 21,794 | |
| | | | |
| |
TOTAL LIABILITIES | | | 3,294,660 | |
| | | | |
| |
TOTAL NET ASSETS | | $ | 243,116,250 | |
| | | | |
| |
NET ASSETS CONSIST OF: | | | | |
| |
Capital stock | | $ | 227,621 | |
Additional paid-in-capital | | | 241,512,980 | |
Undistributed net investment income | | | 713,460 | |
Accumulated net realized gain on investments | | | 1,071,690 | |
Net unrealized appreciation (depreciation) on investments | | | (409,501 | ) |
| | | | |
| |
TOTAL NET ASSETS | | $ | 243,116,250 | |
| | | | |
| |
NET ASSET VALUE, OFFERING PRICE AND REDEMPTION PRICE PER SHARE - Class A
($243,116,250/22,762,124 shares) | | $ | 10.68 | |
| | | | |
The accompanying notes are an integral part of the financial statements.
14
Core Bond Series
Statement of Operations
For the Six Months Ended June 30, 2015 (unaudited)
| | | | |
INVESTMENT INCOME: | | | | |
| |
Interest | | $ | 2,534,915 | |
Dividends | | | 40,194 | |
| | | | |
| |
Total Investment Income | | | 2,575,109 | |
| | | | |
| |
EXPENSES: | | | | |
| |
Management fees (Note 3) | | | 524,154 | |
Fund accounting and administration fees (Note 3) | | | 36,819 | |
Transfer agent fees (Note 3) | | | 1,605 | |
Directors’ fees (Note 3) | | | 1,437 | |
Chief Compliance Officer service fees (Note 3) | | | 1,224 | |
Custodian fees | | | 5,733 | |
Miscellaneous | | | 34,746 | |
| | | | |
| |
Total Expenses | | | 605,718 | |
| | | | |
| |
NET INVESTMENT INCOME | | | 1,969,391 | |
| | | | |
| |
REALIZED AND UNREALIZED GAIN (LOSS) ON INVESTMENTS: | | | | |
| |
Net realized gain on investments | | | 1,049,551 | |
Net change in unrealized appreciation (depreciation) on investments | | | (2,668,529 | ) |
| | | | |
| |
NET REALIZED AND UNREALIZED GAIN (LOSS) ON INVESTMENTS | | | (1,618,978 | ) |
| | | | |
| |
NET INCREASE IN NET ASSETS RESULTING FROM OPERATIONS | | $ | 350,413 | |
| | | | |
The accompanying notes are an integral part of the financial statements.
15
Core Bond Series
Statements of Changes in Net Assets
| | | | | | | | |
| | | FOR THE SIX
MONTHS ENDED
6/30/15
(UNAUDITED) | | | FOR THE
YEAR ENDED
12/31/14 | |
INCREASE (DECREASE) IN NET ASSETS: | | | | | | | | |
| | |
OPERATIONS: | | | | | | | | |
| | |
Net investment income | | $ | 1,969,391 | | | $ | 4,492,307 | |
Net realized gain on investments | | | 1,049,551 | | | | 2,116,134 | |
Net change in unrealized appreciation (depreciation) on investments | | | (2,668,529 | ) | | | (962,167 | ) |
| | | | | | | | |
| | |
Net increase from operations | | | 350,413 | | | | 5,646,274 | |
| | | | | | | | |
| | |
DISTRIBUTIONS TO SHAREHOLDERS (Note 8): | | | | | | | | |
| | |
From net investment income | | | (1,255,931 | ) | | | (4,503,109 | ) |
From net realized gain on investments | | | — | | | | (1,691,493 | ) |
| | | | | | | | |
| | |
Total distributions to shareholders | | | (1,255,931 | ) | | | (6,194,602 | ) |
| | | | | | | | |
| | |
CAPITAL STOCK ISSUED AND REPURCHASED: | | | | | | | | |
| | |
Net increase from capital share transactions (Note 5) | | | 91,003,415 | | | | 457,670 | |
| | | | | | | | |
| | |
Net increase (decrease) in net assets | | | 90,097,897 | | | | (90,658 | ) |
| | |
NET ASSETS: | | | | | | | | |
| | |
Beginning of period | | | 153,018,353 | | | | 153,109,011 | |
| | | | | | | | |
| | |
End of period (including undistributed net investment income of $713,460 and $0, respectively) | | $ | 243,116,250 | | | $ | 153,018,353 | |
| | | | | | | | |
The accompanying notes are an integral part of the financial statements.
16
Core Bond Series
Financial Highlights
| | | | | | | | | | | | | | | | | | | | | | | | | | | | | | |
| | | FOR THE SIX
MONTHS ENDED | | FOR THE YEARS ENDED |
| | | 6/30/15
(UNAUDITED) | | 12/31/14 | | 12/31/13 | | 12/31/12 | | 12/31/11 | | 12/31/10 |
Per share data (for a share outstanding throughout each period): | | | | | | | | | | | | | | | | | | | | | | | | | | | | | | |
Net asset value - Beginning of period | | | | $10.69 | | | | | $10.74 | | | | | $11.56 | | | | | $11.05 | | | | | $10.94 | | | | | $10.38 | |
| | | | | | | | | | | | | | | | | | | | | | | | | | | | | | |
| | | | | | |
Income (loss) from investment operations: | | | | | | | | | | | | | | | | | | | | | | | | | | | | | | |
Net investment income1 | | | | 0.12 | | | | | 0.31 | | | | | 0.35 | | | | | 0.41 | | | | | 0.44 | | | | | 0.45 | |
Net realized and unrealized gain (loss) on investments | | | | (0.06 | ) | | | | 0.08 | | | | | (0.44 | ) | | | | 0.66 | | | | | 0.18 | | | | | 0.48 | |
| | | | | | | | | | | | | | | | | | | | | | | | | | | | | | |
Total from investment operations | | | | 0.06 | | | | | 0.39 | | | | | (0.09 | ) | | | | 1.07 | | | | | 0.62 | | | | | 0.93 | |
| | | | | | | | | | | | | | | | | | | | | | | | | | | | | | |
| | | | | | |
Less distributions to shareholders: | | | | | | | | | | | | | | | | | | | | | | | | | | | | | | |
From net investment income | | | | (0.07 | ) | | | | (0.32 | ) | | | | (0.36 | ) | | | | (0.41 | ) | | | | (0.44 | ) | | | | (0.37 | ) |
From net realized gain on investments | | | | — | | | | | (0.12 | ) | | | | (0.37 | ) | | | | (0.15 | ) | | | | (0.07 | ) | | | | — | |
| | | | | | | | | | | | | | | | | | | | | | | | | | | | | | |
| | | | | | |
Total distributions to shareholders | | | | (0.07 | ) | | | | (0.44 | ) | | | | (0.73 | ) | | | | (0.56 | ) | | | | (0.51 | ) | | | | (0.37 | ) |
| | | | | | | | | | | | | | | | | | | | | | | | | | | | | | |
| | | | | | |
Net asset value - End of period | | | | $10.68 | | | | | $10.69 | | | | | $10.74 | | | | | $11.56 | | | | | $11.05 | | | | | $10.94 | |
| | | | | | | | | | | | | | | | | | | | | | | | | | | | | | |
| | | | | | |
Net assets - End of period (000’s omitted) | | | $ | 243,116 | | | | $ | 153,018 | | | | $ | 153,109 | | | | $ | 189,616 | | | | $ | 164,086 | | | | $ | 114,058 | |
| | | | | | | | | | | | | | | | | | | | | | | | | | | | | | |
Total return2 | | | | 0.56% | | | | | 3.62% | | | | | (0.79% | ) | | | | 9.74% | | | | | 5.68% | | | | | 8.97% | |
Ratios (to average net assets)/Supplemental Data: | | | | | | | | | | | | | | | | | | | | | | | | | | | | | | |
Expenses* | | | | 0.69% | 3 | | | | 0.70% | | | | | 0.70% | | | | | 0.70% | | | | | 0.71% | | | | | 0.76% | |
Net investment income | | | | 2.25% | 3 | | | | 2.86% | | | | | 3.09% | | | | | 3.55% | | | | | 3.91% | | | | | 4.10% | |
Portfolio turnover | | | | 57% | | | | | 57% | | | | | 56% | | | | | 31% | | | | | 18% | | | | | 23% | |
|
| *The investment advisor did not impose all or a portion of its management and/or other fees, and in some years may have paid a portion of the Series’ expenses. If these expenses had been incurred by the Series, the expense ratio (to average net assets) would have increased by the following amounts: | |
| | | | N/A | | | | | N/A | | | | | N/A | | | | | N/A | | | | | N/A | | | | | 0.00% | 4 |
1Calculated based on average shares outstanding during the periods.
2Represents aggregate total return for the periods indicated, and assumes reinvestment of all distributions. Total return would have been lower had certain expenses not been waived during certain periods. Periods less than one year are not annualized.
3Annualized.
4Less than 0.01%.
The accompanying notes are an integral part of the financial statements.
17
Core Bond Series
Notes to Financial Statements
(unaudited)
Core Bond Series (the “Series”) is a no-load diversified series of Manning & Napier Fund, Inc. (the “Fund”). The Fund is organized in Maryland and is registered under the Investment Company Act of 1940, as amended, as an open-end management investment company.
The Series’ investment objective is to provide long-term total return by investing primarily in fixed income securities.
The Fund’s advisor is Manning & Napier Advisors, LLC (the “Advisor”). Shares of the Series are offered to investors, clients and employees of the Advisor and its affiliates. The total authorized capital stock of the Fund consists of 15 billion shares of common stock each having a par value of $0.01. As of June 30, 2015, 10.6 billion shares have been designated in total among 41 series, of which 125 million have been designated as Core Bond Series Class A common stock.
| 2. | Significant Accounting Policies |
The following is a summary of significant accounting policies followed by the Series. The Series is an investment company and, accordingly, follows the investment company accounting and reporting guidance of the Financial Accounting Standards Board Accounting Standards Codification Topic 946 - Investment Companies, which is part of accounting principles generally accepted in the United States of America (“GAAP”).
Security Valuation
Portfolio securities, including domestic equities, foreign equities, warrants and options, listed on an exchange other than the NASDAQ Stock Market are valued at the latest quoted sales price of the exchange on which the security is primarily traded. Securities not traded on valuation date or securities not listed on an exchange are valued at the latest quoted bid price provided by the Fund’s pricing service. Securities listed on the NASDAQ Stock Market are valued in accordance with the NASDAQ Official Closing Price.
Debt securities, including government bonds, foreign bonds, asset-backed securities, structured notes, supranational obligations, sovereign bonds, corporate bonds and mortgage-backed securities will normally be valued on the basis of evaluated bid prices provided directly by an independent pricing service. The pricing services use multiple valuation techniques to determine fair value. In instances where sufficient market activity exists, the pricing services may utilize a market-based approach through which quotes from market makers are used to determine fair value. In instances where sufficient market activity may not exist or is limited, the pricing services also utilize proprietary valuation models which may consider market characteristics such as benchmark yield curves, option-adjusted spreads, credit spreads, estimated default rates, coupon rates, anticipated timing of principal repayments, underlying collateral, and other unique security features in order to estimate the relevant cash flows, which are then discounted to calculate the fair value. Certain investments in securities held by the Series may be valued on a basis of a price provided directly by a principal market maker. These prices may differ from the value that would have been used had a broader market for securities existed.
Municipal securities will normally be valued on the basis of market valuations provided by an independent pricing service that utilizes the latest price quotations and a matrix system (which considers such factors as security prices of similar securities, yields, maturities and ratings).
Short-term investments that mature in sixty days or less are valued at amortized cost, which approximates fair value. Investments in open-end investment companies are valued at their net asset value per share on valuation date.
Volume and level of activity in established markets for an asset or liability are evaluated to determine whether recent transactions and quoted prices are determinative of fair value. Where there have been significant decreases in volume and level of activity, further analysis and adjustment may be necessary to estimate fair value. The Series measures fair value in these instances by the use of inputs and valuation techniques which may be based upon current market prices of securities that are comparable in coupon, rating, maturity and industry and/or expectation of future cash flows. As a result of trading in relatively thin markets and/or markets that experience significant volatility, the prices used by the Series to value these securities may differ from the value that would be realized if these securities were sold, and the differences could be material.
18
Core Bond Series
Notes to Financial Statements (continued)
(unaudited)
| 2. | Significant Accounting Policies (continued) |
Security Valuation (continued)
Securities for which representative valuations or prices are not available from the Series’ pricing service may be valued at fair value as determined in good faith by the Advisor under procedures approved by and under the general supervision and responsibility of the Fund’s Board of Directors (the “Board”). Due to the inherent uncertainty of valuations of such securities, the fair value may differ significantly from the values that would have been used had a ready market for such securities existed. If trading or events occurring after the close of the principal market in which securities are traded are expected to materially affect the value of those securities, then they may be valued at their fair value, taking this trading or these events into account.
Various inputs are used in determining the value of the Series’ assets or liabilities carried at fair value. These inputs are summarized in three broad levels. Level 1 includes quoted prices in active markets for identical assets and liabilities. Level 2 includes other significant observable inputs (including quoted prices for similar securities, interest rates, prepayment speeds, credit risk, etc.). Level 3 includes significant unobservable inputs (including the Series’ own assumptions in determining the fair value of investments). A financial instrument’s level within the fair value hierarchy is based on the lowest level of any input both individually and in aggregate that is significant to the fair value measurement. The inputs or methodology used for valuing securities are not necessarily an indication of the risk associated with investing in those securities.
The following is a summary of the valuation levels used for major security types as of June 30, 2015 in valuing the Series’ assets or liabilities carried at fair value:
| | | | | | | | | | | | | | | | |
| DESCRIPTION | | TOTAL | | | LEVEL 1 | | | LEVEL 2 | | | LEVEL 3 | |
Assets: | | | | | | | | | | | | | | | | |
Preferred securities: | | | | | | | | | | | | | | | | |
Financials | | $ | 925,616 | | | $ | 925,616 | | | $ | — | | | $ | — | |
Debt securities: | | | | | | | | | | | | | | | | |
U.S. Treasury and other U.S. Government agencies | | | 80,804,452 | | | | — | | | | 80,804,452 | | | | — | |
Corporate debt: | | | | | | | | | | | | | | | | |
Consumer Discretionary | | | 10,337,189 | | | | — | | | | 10,337,189 | | | | — | |
Consumer Staples | | | 837,634 | | | | — | | | | 837,634 | | | | — | |
Energy | | | 17,312,533 | | | | — | | | | 17,312,533 | | | | — | |
Financials | | | 65,487,621 | | | | — | | | | 65,487,621 | | | | — | |
Health Care | | | 3,497,394 | | | | — | | | | 3,497,394 | | | | — | |
Industrials | | | 6,012,250 | | | | — | | | | 6,012,250 | | | | — | |
Information Technology | | | 7,205,041 | | | | — | | | | 7,205,041 | | | | — | |
Materials | | | 3,933,820 | | | | — | | | | 3,933,820 | | | | — | |
Telecommunication Services | | | 1,606,279 | | | | — | | | | 1,606,279 | | | | — | |
Utilities | | | 742,369 | | | | — | | | | 742,369 | | | | — | |
Convertible corporate debt: | | | | | | | | | | | | | | | | |
Consumer Discretionary | | | 726,231 | | | | — | | | | 726,231 | | | | — | |
Asset-backed securities | | | 3,400,972 | | | | — | | | | 3,400,972 | | | | — | |
Commercial mortgage-backed securities | | | 30,896,267 | | | | — | | | | 30,896,267 | | | | — | |
Foreign government bonds | | | 2,859,252 | | | | — | | | | 2,859,252 | | | | — | |
Mutual fund | | | 7,631,093 | | | | 7,631,093 | | | | — | | | | — | |
| | | | | | | | | | | | | | | | |
Total assets | | $ | 244,216,013 | | | $ | 8,556,709 | | | $ | 235,659,304 | | | $ | — | |
| | | | | | | | | | | | | | | | |
There were no Level 3 securities held by the Series as of December 31, 2014 or June 30, 2015.
The Fund’s policy is to recognize transfers in and transfers out of the valuation levels as of the beginning of the reporting period. There were no transfers between Level 1 and Level 2 during the six months ended June 30, 2015.
19
Core Bond Series
Notes to Financial Statements (continued)
(unaudited)
| 2. | Significant Accounting Policies (continued) |
Security Transactions, Investment Income and Expenses
Security transactions are accounted for on trade date. Dividend income is recorded on the ex-dividend date, except that if the ex-dividend date has passed, certain dividends from foreign securities are recorded as soon as the Series is informed of the ex-dividend date. Non-cash dividends, if any, are recorded at the fair value of the securities received. Interest income, including amortization of premium and accretion of discounts using the effective interest method, is earned from settlement date and accrued daily.
Expenses are recorded on an accrual basis. Most expenses of the Fund can be attributed to a specific series. Expenses which cannot be directly attributed are apportioned among the series in the Fund in such a manner as deemed equitable by the Fund’s Board, taking into consideration, among other things, the nature and type of expense.
The Series uses the identified cost method for determining realized gain or loss on investments for both financial statement and federal income tax reporting purposes.
Foreign Currency Translation
The books and records of the Series are maintained in U.S. dollars. Foreign currencies, investments and other assets and liabilities are translated into U.S. dollars at the current exchange rates. Purchases and sales of investment securities and income and expenses are translated on the respective dates of such transactions. The Series does not isolate realized and unrealized gains and losses attributable to changes in the exchange rates from gains and losses that arise from changes in the fair value of investments. Such fluctuations are included with net realized and unrealized gain or loss on investments. Net realized foreign currency gains and losses represent foreign currency gains and losses between trade date and settlement date on securities transactions, gains and losses on disposition of foreign currencies and the difference between the amount of income and foreign withholding taxes recorded on the books of the Series and the amounts actually received or paid.
Securities Purchased on a When-Issued Basis or Forward Commitment
The Series may purchase securities on a when-issued basis or forward commitment. These transactions involve a commitment by the Series to purchase securities for a predetermined price with payment and delivery taking place beyond the customary settlement period. When such purchases are outstanding, the Series will designate liquid assets in an amount sufficient to meet the purchase price. When purchasing a security on a delayed delivery basis, the Series assumes the rights and risks of ownership of the security, including the risk of price and yield fluctuations, and takes such fluctuations into account when determining its net asset value. The Series may sell the when-issued securities before they are delivered, which may result in a capital gain or loss. No such investments were held by the Series on June 30, 2015.
In connection with its ability to purchase or sell securities on a forward commitment basis, the Series may enter into forward roll transactions principally using To Be Announced (TBA) securities. Forward roll transactions require the sale of securities for delivery in the current month, and a simultaneous agreement to repurchase substantially similar (same type, coupon and maturity) securities on a specified future date. Risks of entering into forward roll transactions include the potential inability of the counterparty to meet the terms of the agreement; the potential of the Series to receive inferior securities at redelivery as compared to the securities sold to the counterparty; counterparty credit risk; and the potential pay down speed variance between the mortgage-backed pools. During the roll period, the Series forgoes principal and interest paid on the securities. The Series accounts for such dollar rolls as purchases and sales. Information regarding securities purchased on a when-issued basis is included in the Series’ Investment Portfolio. No such investments were held by the Series on June 30, 2015.
Restricted Securities
Restricted securities are purchased in private placement transactions, are not registered under the Securities Act of 1933, as amended, and may have contractual restrictions on resale. Information regarding restricted securities is included at the end of the Series’ Investment Portfolio.
20
Core Bond Series
Notes to Financial Statements (continued)
(unaudited)
| 2. | Significant Accounting Policies (continued) |
Illiquid Securities
A security may be considered illiquid if so deemed in good faith by the Advisor under procedures approved by and under the general supervision and responsibility of the Fund’s Board. Securities that are illiquid are marked with the applicable footnote on the Investment Portfolio. No such investments were held by the Series on June 30, 2015.
Federal Taxes
The Series’ policy is to comply with the provisions of the Internal Revenue Code applicable to regulated investment companies. The Series is not subject to federal income tax or excise tax to the extent that the Series distributes to shareholders each year its taxable income, including any net realized gains on investments, in accordance with requirements of the Internal Revenue Code. Accordingly, no provision for federal income tax or excise tax has been made in the financial statements.
Management evaluates its tax positions to determine if the tax positions taken meet the minimum recognition threshold in connection with accounting for uncertainties in income tax positions taken or expected to be taken for the purposes of measuring and recognizing tax liabilities in the financial statements. Recognition of tax benefits of an uncertain tax position is required only when the position is “more likely than not” to be sustained assuming examination by taxing authorities. At June 30, 2015, the Series has recorded no liability for net unrecognized tax benefits relating to uncertain income tax positions taken or expected to be taken in future tax returns.
The Series files income tax returns in the U.S. federal jurisdiction, various states and foreign jurisdictions, as required. No income tax returns are currently under investigation. The statute of limitations on the Series’ tax returns remains open for the years ended December 31, 2011 through December 31, 2014. The Series is not aware of any tax positions for which it is reasonably possible that the total amounts of unrecognized tax benefits will significantly change in the next twelve months.
Foreign Taxes
Based on the Series’ understanding of the tax rules and rates related to income, gains and currency purchase/repatriation transactions for foreign jurisdictions in which it invests, the Series will provide for foreign taxes, and where appropriate, deferred foreign tax.
Distributions of Income and Gains
Distributions to shareholders of net investment income are made quarterly. Distributions of net realized gains are made annually. An additional distribution may be necessary to avoid taxation of the Series. Distributions are recorded on the ex-dividend date.
Indemnifications
The Fund’s organizational documents provide former and current directors and officers with a limited indemnification against liabilities arising in connection with the performance of their duties to the Fund. In the normal course of business, the Fund may also enter into contracts that provide general indemnifications. The Fund’s maximum exposure under these arrangements is unknown as this would be dependent on future claims that may be made against the Fund. The risk of material loss from such claims is considered remote.
Other
The preparation of financial statements in conformity with GAAP requires management to make estimates and assumptions that affect the reported amounts of assets and liabilities and the disclosure of contingent assets and liabilities at the date of the financial statements and the reported amounts of income and expenses during the reporting period. Actual results could differ from those estimates.
| 3. | Transactions with Affiliates |
The Fund has an Investment Advisory Agreement (the “Agreement”) with the Advisor, for which the Series pays a fee, computed daily and payable monthly, at an annual rate of 0.60% of the Series’ average daily net assets.
Under the Agreement, personnel of the Advisor provide the Series with advice and assistance in the choice of investments and the execution of securities transactions, and otherwise maintain the Series’ organization. The Advisor also provides the Fund
21
Core Bond Series
Notes to Financial Statements (continued)
(unaudited)
| 3. | Transactions with Affiliates (continued) |
with necessary office space and fund administration and support services. The salaries of all officers of the Fund (except a percentage of the Fund’s Chief Compliance Officer’s salary, which is paid by the Fund), and of all Directors who are “affiliated persons” of the Fund, or of the Advisor, and all personnel of the Fund, or of the Advisor, performing services relating to research, statistical and investment activities, are paid by the Advisor. Each “non-affiliated” Director receives an annual stipend, which is allocated among all the active series of the Fund. In addition, these Directors also receive a fee per Board meeting attended plus a fee for each committee meeting attended and are reimbursed for travel and other out-of-pocket expenses incurred by them in connection with attending such meetings. The Fund also has an Audit Committee Chair, who receives an additional annual stipend for this role.
The Advisor has contractually agreed, until at least April 30, 2016, to waive its fee and, if necessary, pay other operating expenses of the Series in order to maintain total direct annual fund operating expenses for the Series at no more than 0.80% of average daily net assets each year. The Advisor did not waive any fees for the six months ended June 30, 2015. The Advisor is not eligible to recoup any expenses that have been waived or reimbursed in prior years.
Manning & Napier Investor Services, Inc., a registered broker-dealer affiliate of the Advisor, acts as distributor for the Fund’s shares. The services of Manning & Napier Investor Services, Inc. are provided at no additional cost to the Series.
Pursuant to a master services agreement dated November 1, 2014, the Fund pays the Advisor an annual fee related to fund accounting and administration of 0.0085% on the first $25 billion of average daily net assets (excluding Target Series and Strategic Income Series); 0.0075% on the next $15 billion of average daily net assets (excluding Target Series and Strategic Income Series); and 0.0065% of the average daily net assets in excess of $40 billion (excluding Target Series and Strategic Income Series); plus a base fee of $30,400 per series. Transfer agent fees are charged to the Fund on a per account basis. Additionally, certain transaction and out-of-pocket expenses, including charges for reporting relating to the Fund’s compliance program, are charged. The Advisor has agreements with BNY Mellon Investment Servicing (U.S.) Inc. (“BNY”) under which BNY serves as sub-accountant services agent and sub-transfer agent.
Expenses not directly attributable to a series are allocated based on each series’ relative net assets or number of accounts, depending on the expense.
| 4. | Purchases and Sales of Securities |
For the six months ended June 30, 2015, purchases and sales of securities, other than U.S. Government securities and short-term securities, were $93,371,220 and $75,533,780, respectively. Purchases and sales of U.S. Government securities, other than short-term securities, were $97,400,093 and $22,155,836, respectively.
| 5. | Capital Stock Transactions |
Transactions in shares of Core Bond Series were:
| | | | | | | | | | | | | | | | |
| | | FOR THE SIX MONTHS ENDED 6/30/15 | | | FOR THE YEAR ENDED 12/31/14 | |
| | SHARES | | | AMOUNT | | | SHARES | | | AMOUNT | |
Sold | | | 9,572,086 | | | $ | 103,146,051 | | | | 1,832,616 | | | $ | 19,938,196 | |
Reinvested | | | 110,644 | | | | 1,184,870 | | | | 570,845 | | | | 6,171,326 | |
Repurchased | | | (1,236,462 | ) | | | (13,327,506 | ) | | | (2,340,559 | ) | | | (25,651,852 | ) |
| | | | | | | | | | | | | | | | |
Total | | | 8,446,268 | | | $ | 91,003,415 | | | | 62,902 | | | $ | 457,670 | |
| | | | | | | | | | | | | | | | |
Over 80% of the shares outstanding are fiduciary accounts where the Advisor has sole investment discretion.
22
Core Bond Series
Notes to Financial Statements (continued)
(unaudited)
The Series may trade in instruments including written and purchased options, forward foreign currency exchange contracts and futures contracts and other derivatives in the normal course of investing activities to assist in managing exposure to various market risks. The Series may be subject to various elements of risk, which may involve, to a varying degree, elements of risk in excess of the amounts recognized for financial statement purposes. These risks include: the risk that changes in the value of a derivative may not correlate perfectly with the underlying asset, rate or index; counterparty credit risk related to over the counter derivative counterparties’ failure to perform under contract terms; liquidity risk related to the lack of a liquid market for these contracts allowing the fund to close out its position(s); and documentation risk relating to disagreement over contract terms. No such investments were held by the Series as of June 30, 2015.
Investing in securities of foreign companies and foreign governments involves special risks and considerations not typically associated with investing in securities of domestic companies and the U.S. Government. These risks include revaluation of currencies and future adverse political and economic developments. Moreover, securities of foreign companies and foreign governments and their markets may be less liquid and their prices more volatile than those of comparable domestic companies and the U.S. Government.
| 8. | Federal Income Tax Information |
The amount and characterization of certain income and capital gains to be distributed are determined in accordance with federal income tax regulations, which may differ from GAAP. The Series may periodically make reclassifications among its capital accounts to reflect income and gains available for distribution (or available capital loss carryovers) under income tax regulations without impacting the Series’ net asset value. Any such reclassifications are not reflected in the financial highlights.
The final determination of the tax character of current year distributions will be made at the conclusion of the fiscal year. The tax character of distributions paid for the year ended December 31, 2014, were as follows:
| | | | | | |
Ordinary income | | $ | 4,492,307 | | | |
Long-term capital gains | | | 1,702,295 | | | |
At June 30, 2015, the identified cost for federal income tax purposes, the resulting gross unrealized appreciation and depreciation, and the net unrealized depreciation were as follows:
| | | | | | |
Cost for federal income tax purposes | | $ | 244,784,769 | | | |
Unrealized appreciation | | | 2,057,032 | | | |
Unrealized depreciation | | | (2,625,788 | ) | | |
| | | | | | |
Net unrealized depreciation | | $ | (568,756 | ) | | |
| | | | | | |
Effective August 3, 2015, the shares of the Series have been redesignated as Class S Shares and the Series issued Class I Shares. Each class of shares is substantially the same except that Class S shares bear shareholder service fees.
23
{This page intentionally left blank}
24
{This page intentionally left blank}
25
Core Bond Series
Literature Requests
(unaudited)
Proxy Voting Policies and Procedures
A description of the policies and procedures that the Fund uses to determine how to vote proxies relating to portfolio securities is available, without charge, upon request:
| | |
| By phone | | 1-800-466-3863 |
On the Securities and Exchange Commission’s (SEC) web site | | http://www.sec.gov |
Proxy Voting Record
Information regarding how the Fund voted proxies relating to portfolio securities during the most recent 12-month period ended June 30th is available, without charge, upon request:
| | |
| By phone | | 1-800-466-3863 |
| On the SEC’s web site | | http://www.sec.gov |
Quarterly Portfolio Holdings
The Series’ complete schedule of portfolio holdings for the 1st and 3rd quarters of each fiscal year are provided on Form N-Q, and are available, without charge, upon request:
| | |
| By phone | | 1-800-466-3863 |
| On the SEC’s web site | | http://www.sec.gov |
The Series’ Form N-Q may be reviewed and copied at the SEC’s Public Reference Room in Washington, D.C. Information on the operation of the Public Reference Room may be obtained by calling 1-800-SEC-0330.
Prospectus and Statement of Additional Information (SAI)
For more information about any of the Manning & Napier Fund, Inc. Series, you may obtain a prospectus and SAI at www.manning-napier.com or by calling (800) 466-3863. Before investing, carefully consider the objectives, risks, charges and expenses of the investment and read the prospectus carefully as it contains this and other information about the investment company. In addition, this information can be found on the SEC’s web site, http://www.sec.gov.
Additional information available at www.manning-napier.com
1. Fund Holdings - Month-End
2. Fund Holdings - Quarter-End
3. Shareholder Report - Annual
4. Shareholder Report - Semi-Annual
The Fund also offers electronic notification or “e-delivery” when certain documents are available on-line to be downloaded or reviewed. Direct shareholders can elect to receive electronic notification when shareholder reports, prospectus updates, and/or statements are available. If you do not currently have on-line access to your account, you can establish access by going to www.manning-napier.com, click on “Login” in the top corner of the page, and follow the prompts to self-enroll. Once enrolled, you can set your electronic notification preferences by clicking on the Account Options tab located within the green toolbar and then select E-Delivery Option. Should you have any questions on either how to establish on-line access or how to update your account settings, please contact Investor Services at 1-800-466-3863.
The Manning & Napier Fund, Inc. is managed by Manning & Napier Advisors, LLC. Manning & Napier Investor Services, Inc., an affiliate of Manning & Napier Advisors, LLC, is the distributor of the Fund shares.
MNCOB-6/15-SAR

Unconstrained Bond Series
Shareholder Expense Example
(unaudited)
As a shareholder of the Series, you may incur two types of costs: (1) transaction costs and (2) ongoing costs, including management fees and other Series expenses. This example is intended to help you understand your ongoing costs (in dollars) of investing in the Series and to compare these costs with the ongoing costs of investing in other mutual funds.
The example is based on an investment of $1,000 invested in each class at the beginning of the period and held for the entire period (January 1, 2015 to June 30, 2015).
Actual Expenses
The Actual lines of the table below provide information about actual account values and actual expenses. You may use the information in this line, together with the amount you invested, to estimate the expenses that you paid over the period. Simply divide your account value by $1,000 (for example, an $8,600 account value divided by $1,000 = 8.6), then multiply the result by the number in the Actual line for the Class in which you have invested under the heading entitled “Expenses Paid During Period” to estimate the expenses you paid on your account during this period.
Hypothetical Example for Comparison Purposes
The Hypothetical lines of each Class in the table below provide information about hypothetical account values and hypothetical expenses based on the Class’ actual expense ratio and an assumed rate of return of 5% per year before expenses, which is not the Class’ actual return. The hypothetical account values and expenses may not be used to estimate the actual ending account balance or expenses you paid during the period. You may use this information to compare the ongoing costs of investing in the Series and other funds. To do so, compare this 5% hypothetical example for the class in which you have invested with the 5% hypothetical examples that appear in the shareholder reports of the other funds.
Please note that the expenses shown in the table are meant to highlight your ongoing costs only and do not reflect any transaction costs. Therefore, the Hypothetical lines for each Class in the table are useful in comparing ongoing costs only, and will not help you determine the relative total costs of owning different funds. In addition, if these transaction costs were included, your costs would have been higher.
| | | | | | | | |
| | | BEGINNING ACCOUNT VALUE 1/1/15 | | ENDING ACCOUNT VALUE 6/30/15 | | EXPENSES PAID DURING PERIOD* 1/1/15-6/30/15 | | ANNUALIZED EXPENSE RATIO |
Class S | | | | | | | | |
Actual | | $1,000.00 | | $1,005.70 | | $3.73 | | 0.75% |
Hypothetical
(5% return before expenses) | | $1,000.00 | | $1,021.08 | | $3.76 | | 0.75% |
Class I | | | | | | | | |
Actual | | $1,000.00 | | $1,007.50 | | $2.49 | | 0.50% |
Hypothetical
(5% return before expenses) | | $1,000.00 | | $1,022.32 | | $2.51 | | 0.50% |
*Expenses are equal to each Class’ annualized expense ratio (for the six-month period), multiplied by the average account value over the period, multiplied by 181/365 (to reflect the one-half year period). Expenses are based on the most recent fiscal half year. The Series’ total return would have been lower had certain expenses not been waived during the period.
1
Unconstrained Bond Series
Portfolio Composition as of June 30, 2015
(unaudited)
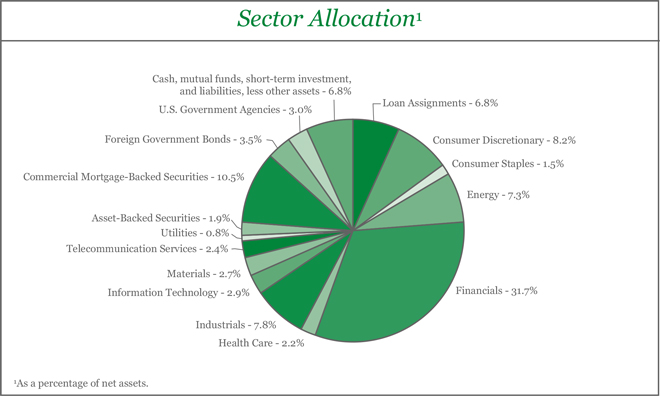
2
Unconstrained Bond Series
Investment Portfolio - June 30, 2015
(unaudited)
| | | | | | | | | | | | |
| | | CREDIT
RATING1 | | | PRINCIPAL
AMOUNT2 | | | VALUE (NOTE 2) | |
LOAN ASSIGNMENTS - 6.8% | | | | | | | | | | | | |
Berry Plastics Group, Inc., Term D3, 2/8/2020 | | | BB4 | | | | 6,163,831 | | | $ | 6,130,916 | |
Charter Communications Operating LLC, Term E5, 3.00%, 7/1/2020 | | | BB4 | | | | 7,992,366 | | | | 7,895,819 | |
Crown Castle Operating Co., 1st Lien Term Loan B25, 3.00%, 1/31/2021 | | | BBB4 | | | | 7,979,747 | | | | 7,928,437 | |
NRG Energy, Inc. Term B5, 2.75%, 7/1/2018 | | | BB4 | | | | 7,989,796 | | | | 7,920,524 | |
Outfront Media Capital LLC, Term B3, 1/31/2021 | | | BB4 | | | | 5,000,000 | | | | 4,982,050 | |
SBA Senior Finance II LLC, Term B3, 3/24/2021 | | | BB4 | | | | 6,000,000 | | | | 5,937,300 | |
Valeant Pharmaceuticals International, Inc., Term Loan BD5, 3.50%, 2/13/2019 | | | WR6 | | | | 6,000,000 | | | | 5,982,480 | |
Valeant Pharmaceuticals International, Inc., Term Loan D25, 3.50%, 2/13/2019 | | | Ba1 | | | | 2,000,000 | | | | 1,994,160 | |
| | | | | | | | | | | | |
TOTAL LOAN ASSIGNMENTS | | | | | | | | | | | | |
(Identified Cost $49,116,244) | | | | | | | | | | | 48,771,686 | |
| | | | | | | | | | | | |
CORPORATE BONDS - 67.5% | | | | | | | | | | | | |
Non-Convertible Corporate Bonds - 67.5% | | | | | | | | | | | | |
Consumer Discretionary - 8.2% | | | | | | | | | | | | |
Auto Components - 0.5% | | | | | | | | | | | | |
Icahn Enterprises LP - Icahn Enterprises Finance Corp., 3.50%, 3/15/2017 | | | Ba3 | | | | 2,000,000 | | | | 2,012,500 | |
Icahn Enterprises LP - Icahn Enterprises Finance Corp., 5.875%, 2/1/2022 | | | Ba3 | | | | 655,000 | | | | 667,281 | |
Techniplas LLC7, 10.00%, 5/1/2020 | | | Caa1 | | | | 795,000 | | | | 800,963 | |
| | | | | | | | | | | | |
| | | | | | | | | | | 3,480,744 | |
| | | | | | | | | | | | |
Automobiles - 0.8% | | | | | | | | | | | | |
Ford Motor Credit Co. LLC5, 1.209%, 11/4/2019 | | | Baa3 | | | | 6,000,000 | | | | 5,979,510 | |
| | | | | | | | | | | | |
Hotels, Restaurants & Leisure - 1.2% | | | | | | | | | | | | |
International Game Technology plc (United Kingdom)7, 6.25%, 2/15/2022 | | | Ba2 | | | | 805,000 | | | | 768,775 | |
MGM Resorts International, 10.00%, 11/1/2016 | | | B3 | | | | 7,000,000 | | | | 7,630,000 | |
| | | | | | | | | | | | |
| | | | | | | | | | | 8,398,775 | |
| | | | | | | | | | | | |
Household Durables - 4.6% | | | | | | | | | | | | |
Brookfield Residential Properties, Inc. - Brookfield Residential US Corp. (Canada)7, 6.125%, 7/1/2022 | | | B1 | | | | 1,120,000 | | | | 1,103,200 | |
Brookfield Residential Properties, Inc. (Canada)7, 6.375%, 5/15/2025 | | | B1 | | | | 330,000 | | | | 323,400 | |
Centex LLC, 6.50%, 5/1/2016 | | | Ba1 | | | | 1,000,000 | | | | 1,037,500 | |
DR Horton, Inc., 5.625%, 1/15/2016 | | | Ba1 | | | | 2,750,000 | | | | 2,777,500 | |
Jarden Corp., 7.50%, 5/1/2017 | | | B1 | | | | 7,000,000 | | | | 7,612,500 | |
Lennar Corp., 12.25%, 6/1/2017 | | | Ba2 | | | | 7,737,000 | | | | 9,129,660 | |
Meritage Homes Corp., 7.15%, 4/15/2020 | | | Ba3 | | | | 450,000 | | | | 486,000 | |
Meritage Homes Corp., 7.00%, 4/1/2022 | | | Ba3 | | | | 690,000 | | | | 736,575 | |
NVR, Inc., 3.95%, 9/15/2022 | | | Baa2 | | | | 6,225,000 | | | | 6,311,279 | |
TRI Pointe Holdings, Inc., 4.375%, 6/15/2019 | | | B1 | | | | 1,180,000 | | | | 1,156,400 | |
The accompanying notes are an integral part of the financial statements.
3
Unconstrained Bond Series
Investment Portfolio - June 30, 2015
(unaudited)
| | | | | | | | | | | | |
| | | CREDIT
RATING1 | | | PRINCIPAL
AMOUNT2 | | | VALUE (NOTE 2) | |
CORPORATE BONDS (continued) | | | | | | | | | | | | |
Non-Convertible Corporate Bonds (continued) | | | | | | | | | | | | |
Consumer Discretionary (continued) | | | | | | | | | | | | |
Household Durables (continued) | | | | | | | | | | | | |
Weekley Homes LLC - Weekley Finance Corp., 6.00%, 2/1/2023 | | | B2 | | | | 1,010,000 | | | $ | 954,450 | |
Whirlpool Corp., 2.40%, 3/1/2019 | | | Baa2 | | | | 1,615,000 | | | | 1,629,853 | |
| | | | | | | | | | | | |
| | | | | | | | | | | 33,258,317 | |
| | | | | | | | | | | | |
Media - 1.1% | | | | | | | | | | | | |
CCO Holdings LLC - CCO Holdings Capital Corp.7, 5.125%, 5/1/2023 | | | B1 | | | | 545,000 | | | | 530,013 | |
CCO Holdings LLC - CCO Holdings Capital Corp.7, 5.375%, 5/1/2025 | | | B1 | | | | 635,000 | | | | 618,331 | |
Cogeco Cable, Inc. (Canada)7, 4.875%, 5/1/2020 | | | BB4 | | | | 705,000 | | | | 715,575 | |
Columbus International, Inc. (Barbados)7, 7.375%, 3/30/2021 | | | Ba3 | | | | 1,085,000 | | | | 1,166,375 | |
DIRECTV Holdings LLC - DIRECTV Financing Co., Inc., 4.45%, 4/1/2024 | | | Baa2 | | | | 3,620,000 | | | | 3,704,382 | |
Sirius XM Radio, Inc.7, 5.375%, 4/15/2025 | | | Ba3 | | | | 795,000 | | | | 767,175 | |
VTR Finance B.V. (Chile)7, 6.875%, 1/15/2024 | | | B1 | | | | 695,000 | | | | 710,186 | |
| | | | | | | | | | | | |
| | | | | | | | | | | 8,212,037 | |
| | | | | | | | | | | | |
Total Consumer Discretionary | | | | | | | | | | | 59,329,383 | |
| | | | | | | | | | | | |
Consumer Staples - 1.5% | | | | | | | | | | | | |
Beverages - 0.4% | | | | | | | | | | | | |
Anheuser-Busch InBev Worldwide, Inc. (Belgium), 7.75%, 1/15/2019 | | | A2 | | | | 1,600,000 | | | | 1,899,115 | |
DS Services of America, Inc.7, 10.00%, 9/1/2021 | | | Ba3 | | | | 635,000 | | | | 742,950 | |
| | | | | | | | | | | | |
| | | | | | | | | | | 2,642,065 | |
| | | | | | | | | | | | |
Food & Staples Retailing - 0.3% | | | | | | | | | | | | |
C&S Group Enterprises LLC7, 5.375%, 7/15/2022 | | | B1 | | | | 1,115,000 | | | | 1,048,100 | |
KeHE Distributors LLC - KeHE Finance Corp.7, 7.625%, 8/15/2021 | | | B3 | | | | 430,000 | | | | 451,500 | |
Shearer’s Foods LLC - Chip Finance Corp.7, 9.00%, 11/1/2019 | | | B1 | | | | 455,000 | | | | 489,125 | |
| | | | | | | | | | | | |
| | | | | | | | | | | 1,988,725 | |
| | | | | | | | | | | | |
Food Products - 0.5% | | | | | | | | | | | | |
Kraft Heinz Foods Co.7, 1.60%, 6/30/2017 | | | Baa3 | | | | 2,000,000 | | | | 2,000,204 | |
Kraft Heinz Foods Co., 6.75%, 3/15/2032 | | | Baa3 | | | | 645,000 | | | | 757,875 | |
Pinnacle Operating Corp.7, 9.00%, 11/15/2020 | | | Caa1 | | | | 1,095,000 | | | | 1,086,787 | |
| | | | | | | | | | | | |
| | | | | | | | | | | 3,844,866 | |
| | | | | | | | | | | | |
Household Products - 0.2% | | | | | | | | | | | | |
HRG Group, Inc., 7.875%, 7/15/2019 | | | Ba3 | | | | 1,050,000 | | | | 1,107,750 | |
HRG Group, Inc., 7.75%, 1/15/2022 | | | Caa1 | | | | 560,000 | | | | 546,000 | |
| | | | | | | | | | | | |
| | | | | | | | | | | 1,653,750 | |
| | | | | | | | | | | | |
Tobacco - 0.1% | | | | | | | | | | | | |
Vector Group Ltd., 7.75%, 2/15/2021 | | | Ba3 | | | | 885,000 | | | | 946,950 | |
| | | | | | | | | | | | |
Total Consumer Staples | | | | | | | | | | | 11,076,356 | |
| | | | | | | | | | | | |
The accompanying notes are an integral part of the financial statements.
4
Unconstrained Bond Series
Investment Portfolio - June 30, 2015
(unaudited)
| | | | | | | | | | | | |
| | | CREDIT
RATING1 | | | PRINCIPAL
AMOUNT2 | | | VALUE (NOTE 2) | |
CORPORATE BONDS (continued) | | | | | | | | | | | | |
Non-Convertible Corporate Bonds (continued) | | | | | | | | | | | | |
Energy - 7.3% | | | | | | | | | | | | |
Energy Equipment & Services - 0.9% | | | | | | | | | | | | |
Calfrac Holdings LP (Canada)7, 7.50%, 12/1/2020 | | | B3 | | | | 670,000 | | | $ | 618,678 | |
Ensco plc, 5.20%, 3/15/2025 | | | Baa1 | | | | 3,900,000 | | | | 3,861,253 | |
FTS International, Inc., 6.25%, 5/1/2022 | | | Caa2 | | | | 425,000 | | | | 312,375 | |
Parker Drilling Co., 6.75%, 7/15/2022 | | | B1 | | | | 800,000 | | | | 690,000 | |
Seventy Seven Operating LLC, 6.625%, 11/15/2019 | | | B3 | | | | 430,000 | | | | 339,700 | |
Shelf Drilling Holdings Ltd. (United Arab Emirates)7, 8.625%, 11/1/2018 | | | Ba3 | | | | 600,000 | | | | 534,000 | |
| | | | | | | | | | | | |
| | | | | | | | | | | 6,356,006 | |
| | | | | | | | | | | | |
Oil, Gas & Consumable Fuels - 6.4% | | | | | | | | | | | | |
CNOOC Finance 2015 Australia Pty. Ltd. (China), 2.625%, 5/5/2020 | | | Aa3 | | | | 3,500,000 | | | | 3,454,245 | |
Columbia Pipeline Group, Inc.7, 2.45%, 6/1/2018 | | | Baa2 | | | | 3,500,000 | | | | 3,527,027 | |
Columbia Pipeline Group, Inc.7, 4.50%, 6/1/2025 | | | Baa2 | | | | 1,750,000 | | | | 1,721,554 | |
ConocoPhillips Co.5, 1.176%, 5/15/2022 | | | A1 | | | | 7,000,000 | | | | 7,050,785 | |
Energy XXI Gulf Coast, Inc., 7.50%, 12/15/2021 | | | Caa3 | | | | 1,075,000 | | | | 346,687 | |
Hiland Partners LP - Hiland Partners Finance Corp.7, 7.25%, 10/1/2020 | | | Baa3 | | | | 3,400,000 | | | | 3,672,000 | |
Kinder Morgan, Inc.7, 5.625%, 11/15/2023 | | | Baa3 | | | | 6,500,000 | | | | 6,914,303 | |
PBF Holding Co. LLC - PBF Finance Corp., 8.25%, 2/15/2020 | | | Ba3 | | | | 760,000 | | | | 803,700 | |
Petrobras Global Finance B.V. (Brazil)5, 1.896%, 5/20/2016 | | | Ba2 | | | | 5,225,000 | | | | 5,147,618 | |
Petroleos Mexicanos (Mexico), 5.75%, 3/1/2018 | | | A3 | | | | 3,330,000 | | | | 3,622,474 | |
Petroleos Mexicanos (Mexico)7, 4.50%, 1/23/2026 | | | A3 | | | | 4,500,000 | | | | 4,398,300 | |
Sabine Pass Liquefaction LLC, 5.625%, 2/1/2021 | | | Ba3 | | | | 615,000 | | | | 627,300 | |
Talisman Energy, Inc. (Canada), 3.75%, 2/1/2021 | | | Baa3 | | | | 3,785,000 | | | | 3,747,067 | |
WPX Energy, Inc., 6.00%, 1/15/2022 | | | Ba1 | | | | 900,000 | | | | 888,750 | |
| | | | | | | | | | | | |
| | | | | | | | | | | 45,921,810 | |
| | | | | | | | | | | | |
Total Energy | | | | | | | | | | | 52,277,816 | |
| | | | | | | | | | | | |
Financials - 31.7% | | | | | | | | | | | | |
Banks - 12.9% | | | | | | | | | | | | |
Bank of America Corp.5, 1.046%, 9/15/2026 | | | Baa3 | | | | 7,811,000 | | | | 7,172,248 | |
The Bank of Nova Scotia (Canada), 1.85%, 4/14/2020 | | | Aaa | | | | 6,285,000 | | | | 6,214,482 | |
Bank of Scotland plc (United Kingdom)7, 5.25%, 2/21/2017 | | | Aaa | | | | 8,000,000 | | | | 8,539,416 | |
Barclays Bank plc (United Kingdom)7, 10.179%, 6/12/2021 | | | Baa3 | | | | 2,540,000 | | | | 3,365,243 | |
BBVA Bancomer S.A. (Mexico)7, 6.75%, 9/30/2022 | | | Baa2 | | | | 2,000,000 | | | | 2,202,500 | |
CIT Group, Inc., 5.00%, 5/15/2017 | | | B1 | | | | 4,500,000 | | | | 4,640,400 | |
CIT Group, Inc., 4.25%, 8/15/2017 | | | B1 | | | | 2,500,000 | | | | 2,537,500 | |
CIT Group, Inc., 5.25%, 3/15/2018 | | | B1 | | | | 750,000 | | | | 775,312 | |
Citigroup, Inc.5,8, 5.95% | | | Ba2 | | | | 770,000 | | | | 743,204 | |
Citigroup, Inc.5, 0.832%, 8/25/2036 | | | Baa3 | | | | 6,330,000 | | | | 4,932,032 | |
Intesa Sanpaolo S.p.A. (Italy), 3.875%, 1/15/2019 | | | Baa1 | | | | 3,200,000 | | | | 3,292,262 | |
Intesa Sanpaolo S.p.A. (Italy)7, 6.50%, 2/24/2021 | | | Baa1 | | | | 2,800,000 | | | | 3,194,209 | |
JPMorgan Chase & Co., 4.95%, 3/25/2020 | | | A3 | | | | 4,000,000 | | | | 4,409,100 | |
Lloyds Bank plc (United Kingdom)7,8,9, 12.00% | | | Ba1 | | | | 315,000 | | | | 450,450 | |
The accompanying notes are an integral part of the financial statements.
5
Unconstrained Bond Series
Investment Portfolio - June 30, 2015
(unaudited)
| | | | | | | | | | | | |
| | | CREDIT
RATING1 | | | PRINCIPAL
AMOUNT2 | | | VALUE (NOTE 2) | |
CORPORATE BONDS (continued) | | | | | | | | | | | | |
Non-Convertible Corporate Bonds (continued) | | | | | | | | | | | | |
Financials (continued) | | | | | | | | | | | | |
Banks (continued) | | | | | | | | | | | | |
Lloyds Bank plc (United Kingdom)7, 6.50%, 9/14/2020 | | | Baa2 | | | | 6,430,000 | | | $ | 7,411,250 | |
National Australia Bank Ltd. (Australia)7, 2.00%, 2/22/2019 | | | Aaa | | | | 8,000,000 | | | | 8,092,112 | |
National Bank of Canada (Canada)7, 1.40%, 4/20/2018 | | | Aaa | | | | 8,000,000 | | | | 7,976,888 | |
Popular, Inc., 7.00%, 7/1/2019 | | | B1 | | | | 1,520,000 | | | | 1,520,000 | |
Royal Bank of Scotland Group plc (United Kingdom), 6.10%, 6/10/2023 | | | Ba2 | | | | 640,000 | | | | 680,472 | |
Royal Bank of Scotland Group plc (United Kingdom), 5.125%, 5/28/2024 | | | Ba2 | | | | 3,730,000 | | | | 3,725,461 | |
Santander Holdings USA, Inc., 2.65%, 4/17/2020 | | | Baa2 | | | | 3,750,000 | | | | 3,686,663 | |
The Toronto-Dominion Bank (Canada)7, 1.625%, 9/14/2016 | | | Aaa | | | | 7,086,000 | | | | 7,157,717 | |
| | | | | | | | | | | | |
| | | | | | | | | | | 92,718,921 | |
| | | | | | | | | | | | |
Capital Markets - 4.5% | | | | | | | | | | | | |
Cooperatieve Centrale Raiffeisen-Boerenleenbank B.A. (Netherlands)8,10, 8.40% | | | WR6 | | | | 2,980,000 | | | | 3,218,400 | |
The Goldman Sachs Group, Inc., 5.375%, 3/15/2020 | | | A3 | | | | 3,000,000 | | | | 3,340,560 | |
The Goldman Sachs Group, Inc.5, 1.884%, 11/29/2023 | | | A3 | | | | 8,305,000 | | | | 8,440,895 | |
Morgan Stanley5, 1.417%, 1/27/2020 | | | A3 | | | | 5,000,000 | | | | 5,068,805 | |
Morgan Stanley, 5.75%, 1/25/2021 | | | A3 | | | | 3,940,000 | | | | 4,488,905 | |
UBS AG (Switzerland)5, 1.133%, 6/1/2020 | | | A2 | | | | 8,000,000 | | | | 7,977,088 | |
| | | | | | | | | | | | |
| | | | | | | | | | | 32,534,653 | |
| | | | | | | | | | | | |
Consumer Finance - 2.7% | | | | | | | | | | | | |
Ally Financial, Inc., 3.50%, 7/18/2016 | | | B1 | | | | 2,277,000 | | | | 2,311,155 | |
Ally Financial, Inc., 2.75%, 1/30/2017 | | | B1 | | | | 4,000,000 | | | | 3,982,000 | |
American Express Credit Corp.5, 1.012%, 5/26/2020 | | | A2 | | | | 7,500,000 | | | | 7,503,427 | |
CNG Holdings, Inc.7, 9.375%, 5/15/2020 | | | Caa1 | | | | 775,000 | | | | 561,875 | |
Navient Corp., 3.875%, 9/10/2015 | | | Ba3 | | | | 3,450,000 | | | | 3,454,313 | |
Navient Corp., 6.125%, 3/25/2024 | | | Ba3 | | | | 1,610,000 | | | | 1,541,575 | |
| | | | | | | | | | | | |
| | | | | | | | | | | 19,354,345 | |
| | | | | | | | | | | | |
Diversified Financial Services - 2.5% | | | | | | | | | | | | |
General Electric Capital Corp.8,11, 7.125% | | | Baa1 | | | | 3,105,000 | | | | 3,582,394 | |
General Electric Capital Corp.5, 0.659%, 5/5/2026 | | | A1 | | | | 8,800,000 | | | | 8,396,054 | |
ING Bank N.V. (Netherlands)5, 4.125%, 11/21/2023 | | | Baa2 | | | | 3,465,000 | | | | 3,559,193 | |
Jefferies Finance LLC - JFIN Co-Issuer Corp.7, 7.375%, 4/1/2020 | | | B1 | | | | 575,000 | | | | 564,937 | |
Jefferies Finance LLC - JFIN Co-Issuer Corp.7, 6.875%, 4/15/2022 | | | B1 | | | | 410,000 | | | | 399,750 | |
Peachtree Corners Funding Trust7, 3.976%, 2/15/2025 | | | Baa2 | | | | 1,750,000 | | | | 1,735,419 | |
| | | | | | | | | | | | |
| | | | | | | | | | | 18,237,747 | |
| | | | | | | | | | | | |
Insurance - 4.9% | | | | | | | | | | | | |
Aegon N.V. (Netherlands)5,8, 2.619% | | | Baa1 | | | | 3,866,000 | | | | 3,361,100 | |
American International Group, Inc., 4.875%, 6/1/2022 | | | Baa1 | | | | 4,260,000 | | | | 4,672,866 | |
Assured Guaranty US Holdings, Inc., 5.00%, 7/1/2024 | | | Baa2 | | | | 10,700,000 | | | | 10,494,121 | |
The accompanying notes are an integral part of the financial statements.
6
Unconstrained Bond Series
Investment Portfolio - June 30, 2015
(unaudited)
| | | | | | | | | | | | |
| | | CREDIT
RATING1 | | | PRINCIPAL
AMOUNT2 | | | VALUE (NOTE 2) | |
CORPORATE BONDS (continued) | | | | | | | | | | | | |
Non-Convertible Corporate Bonds (continued) | | | | | | | | | | | | |
Financials (continued) | | | | | | | | | | | | |
Insurance (continued) | | | | | | | | | | | | |
AXA S.A. (France)5,8, 2.007% | | | A3 | | | | 7,199,000 | | | $ | 6,335,120 | |
AXA S.A. (France)5,8, 2.25% | | | A3 | | | | 1,239,000 | | | | 1,095,772 | |
First American Financial Corp., 4.30%, 2/1/2023 | | | Baa3 | | | | 3,160,000 | | | | 3,131,440 | |
The Hartford Financial Services Group, Inc., 5.125%, 4/15/2022 | | | Baa2 | | | | 3,415,000 | | | | 3,787,327 | |
Prudential Financial, Inc.8,12, 5.875% | | | Baa2 | | | | 2,460,000 | | | | 2,599,728 | |
| | | | | | | | | | | | |
| | | | | | | | | | | 35,477,474 | |
| | | | | | | | | | | | |
Real Estate Investment Trusts (REITS) - 3.7% | | | | | | | | | | | | |
American Tower Corp., 2.80%, 6/1/2020 | | | Baa3 | | | | 4,000,000 | | | | 3,944,416 | |
American Tower Trust I7, 1.551%, 3/15/2018 | | | Aaa | | | | 1,625,000 | | | | 1,616,833 | |
AvalonBay Communities, Inc., 4.20%, 12/15/2023 | | | Baa1 | | | | 3,000,000 | | | | 3,137,289 | |
Crown Castle Towers LLC7, 6.113%, 1/15/2020 | | | A2 | | | | 4,070,000 | | | | 4,634,159 | |
Crown Castle Towers LLC7, 4.883%, 8/15/2020 | | | A2 | | | | 610,000 | | | | 662,065 | |
Digital Realty Trust LP, 5.25%, 3/15/2021 | | | Baa2 | | | | 4,180,000 | | | | 4,574,425 | |
DuPont Fabros Technology LP, 5.875%, 9/15/2021 | | | Ba1 | | | | 1,295,000 | | | | 1,311,187 | |
Health Care REIT, Inc., 4.95%, 1/15/2021 | | | Baa2 | | | | 3,450,000 | | | | 3,766,113 | |
Qualitytech LP - QTS Finance Corp., 5.875%, 8/1/2022 | | | B2 | | | | 450,000 | | | | 452,250 | |
Rialto Holdings LLC - Rialto Corp.7, 7.00%, 12/1/2018 | | | B2 | | | | 955,000 | | | | 993,200 | |
Ventas Realty LP - Ventas Capital Corp., 4.75%, 6/1/2021 | | | Baa1 | | | | 1,400,000 | | | | 1,516,988 | |
| | | | | | | | | | | | |
| | | | | | | | | | | 26,608,925 | |
| | | | | | | | | | | | |
Real Estate Management & Development - 0.2% | | | | | | | | | | | | |
Forestar USA Real Estate Group, Inc.7, 8.50%, 6/1/2022 | | | B2 | | | | 735,000 | | | | 762,563 | |
Greystar Real Estate Partners LLC7, 8.25%, 12/1/2022 | | | B2 | | | | 430,000 | | | | 453,650 | |
| | | | | | | | | | | | |
| | | | | | | | | | | 1,216,213 | |
| | | | | | | | | | | | |
Thrifts & Mortgage Finance - 0.3% | | | | | | | | | | | | |
Ladder Capital Finance Holdings LLLP - Ladder Capital Finance Corp., 7.375%, 10/1/2017 | | | Ba3 | | | | 1,255,000 | | | | 1,308,337 | |
Ladder Capital Finance Holdings LLLP - Ladder Capital Finance Corp.7, 5.875%, 8/1/2021 | | | Ba3 | | | | 690,000 | | | | 671,025 | |
Prospect Holding Co. LLC - Prospect Holding Finance Co.7, 10.25%, 10/1/2018 | | | B2 | | | | 425,000 | | | | 280,500 | |
| | | | | | | | | | | | |
| | | | | | | | | | | 2,259,862 | |
| | | | | | | | | | | | |
Total Financials | | | | | | | | | | | 228,408,140 | |
| | | | | | | | | | | | |
Health Care - 2.2% | | | | | | | | | | | | |
Biotechnology - 0.5% | | | | | | | | | | | | |
Amgen, Inc., 2.70%, 5/1/2022 | | | Baa1 | | | | 4,000,000 | | | | 3,867,052 | |
| | | | | | | | | | | | |
Health Care Equipment & Supplies - 0.1% | | | | | | | | | | | | |
Halyard Health, Inc.7, 6.25%, 10/15/2022 | | | B2 | | | | 440,000 | | | | 460,900 | |
| | | | | | | | | | | | |
Health Care Providers & Services - 0.9% | | | | | | | | | | | | |
Express Scripts Holding Co., 4.75%, 11/15/2021 | | | Baa3 | | | | 2,885,000 | | | | 3,130,531 | |
The accompanying notes are an integral part of the financial statements.
7
Unconstrained Bond Series
Investment Portfolio - June 30, 2015
(unaudited)
| | | | | | | | | | | | |
| | | CREDIT
RATING1 | | | PRINCIPAL
AMOUNT2 | | | VALUE (NOTE 2) | |
CORPORATE BONDS (continued) | | | | | | | | | | | | |
Non-Convertible Corporate Bonds (continued) | | | | | | | | | | | | |
Health Care (continued) | | | | | | | | | | | | |
Health Care Providers & Services (continued) | | | | | | | | | | | | |
Fresenius Medical Care US Finance, Inc. (Germany), 6.875%, 7/15/2017 | | | Ba2 | | | | 1,000,000 | | | $ | 1,082,500 | |
Fresenius US Finance II, Inc. (Germany)7, 9.00%, 7/15/2015 | | | Ba1 | | | | 1,900,000 | | | | 1,903,040 | |
Tenet Healthcare Corp.5,7, 3.786%, 6/15/2020 | | | Ba2 | | | | 500,000 | | | | 504,375 | |
| | | | | | | | | | | | |
| | | | | | | | | | | 6,620,446 | |
| | | | | | | | | | | | |
Pharmaceuticals - 0.7% | | | | | | | | | | | | |
AbbVie, Inc., 2.50%, 5/14/2020 | | | Baa1 | | | | 3,000,000 | | | | 2,969,223 | |
Concordia Healthcare Corp. (Canada)7, 7.00%, 4/15/2023 | | | B3 | | | | 770,000 | | | | 770,000 | |
Horizon Pharma Financing, Inc.7, 6.625%, 5/1/2023 | | | B2 | | | | 765,000 | | | | 797,513 | |
Mallinckrodt International Finance S.A. - Mallinckrodt CB LLC7, 5.50%, 4/15/2025 | | | B1 | | | | 500,000 | | | | 485,000 | |
| | | | | | | | | | | | |
| | | | | | | | | | | 5,021,736 | |
| | | | | | | | | | | | |
Total Health Care | | | | | | | | | | | 15,970,134 | |
| | | | | | | | | | | | |
Industrials - 7.8% | | | | | | | | | | | | |
Aerospace & Defense - 0.2% | | | | | | | | | | | | |
DigitalGlobe, Inc.7, 5.25%, 2/1/2021 | | | B1 | | | | 1,473,000 | | | | 1,441,699 | |
| | | | | | | | | | | | |
Air Freight & Logistics - 0.1% | | | | | | | | | | | | |
Neovia Logistics Intermediate Holdings LLC - Logistics Intermediate Finance Corp.7,13, 10.00%, 2/15/2018 | | | Caa2 | | | | 915,000 | | | | 910,425 | |
| | | | | | | | | | | | |
Airlines - 1.4% | | | | | | | | | | | | |
Allegiant Travel Co., 5.50%, 7/15/2019 | | | B1 | | | | 1,095,000 | | | | 1,103,212 | |
American Airlines Pass-Through Trust, Series 2013-2, Class A, 4.95%, 1/15/2023 | | | A4 | | | | 2,930,686 | | | | 3,113,854 | |
Delta Air Lines Pass-Through Trust, Series 2010-1, Class B7, 6.375%, 1/2/2016 | | | Baa3 | | | | 1,220,000 | | | | 1,247,450 | |
Delta Air Lines Pass-Through Trust, Series 2010-2, Class B, 6.75%, 11/23/2015 | | | Ba1 | | | | 395,000 | | | | 401,913 | |
Southwest Airlines Co., 2.75%, 11/6/2019 | | | Baa1 | | | | 3,715,000 | | | | 3,769,243 | |
| | | | | | | | | | | | |
| | | | | | | | | | | 9,635,672 | |
| | | | | | | | | | | | |
Commercial Services & Supplies - 0.2% | | | | | | | | | | | | |
Constellis Holdings LLC - Constellis Finance Corp.7, 9.75%, 5/15/2020 | | | B3 | | | | 800,000 | | | | 772,000 | |
Modular Space Corp.7, 10.25%, 1/31/2019 | | | B3 | | | | 620,000 | | | | 536,300 | |
| | | | | | | | | | | | |
| | | | | | | | | | | 1,308,300 | |
| | | | | | | | | | | | |
Construction & Engineering - 0.1% | | | | | | | | | | | | |
Abengoa Finance S.A.U. (Spain)7, 7.75%, 2/1/2020 | | | B2 | | | | 990,000 | | | | 980,100 | |
| | | | | | | | | | | | |
Industrial Conglomerates - 0.4% | | | | | | | | | | | | |
Siemens Financieringsmaatschappij N.V. (Germany)7, 2.15%, 5/27/2020 | | | A1 | | | | 3,000,000 | | | | 2,962,590 | |
| | | | | | | | | | | | |
The accompanying notes are an integral part of the financial statements.
8
Unconstrained Bond Series
Investment Portfolio - June 30, 2015
(unaudited)
| | | | | | | | | | | | | | |
| | | CREDIT
RATING1 | | | PRINCIPAL
AMOUNT2 | | | VALUE (NOTE 2) | | | |
| | | | |
CORPORATE BONDS (continued) | | | | | | | | | | | | | | |
| | | | |
Non-Convertible Corporate Bonds (continued) | | | | | | | | | | | | | | |
Industrials (continued) | | | | | | | | | | | | | | |
Machinery - 1.3% | | | | | | | | | | | | | | |
CNH Industrial Capital LLC, 3.875%, 11/1/2015 | | | Ba1 | | | | 8,000,000 | | | $ | 8,020,000 | | | |
SPL Logistics Escrow LLC - SPL Logistics Finance Corp.7, 8.875%, 8/1/2020 | | | B2 | | | | 715,000 | | | | 757,900 | | | |
Waterjet Holdings, Inc.7, 7.625%, 2/1/2020 | | | B2 | | | | 530,000 | | | | 551,200 | | | |
| | | | | | | | | | | | | | |
| | | | | | | | | | | 9,329,100 | | | |
| | | | | | | | | | | | | | |
Trading Companies & Distributors - 4.1% | | | | | | | | | | | | | | |
AerCap Ireland Capital Ltd. - AerCap Global Aviation Trust (Netherlands)7, 2.75%, 5/15/2017 | | | Ba2 | | | | 2,250,000 | | | | 2,235,937 | | | |
Air Lease Corp., 5.625%, 4/1/2017 | | | BBB4 | | | | 4,000,000 | | | | 4,240,000 | | | |
Aircastle Ltd., 6.75%, 4/15/2017 | | | Ba2 | | | | 7,500,000 | | | | 7,987,500 | | | |
Aircastle Ltd., 5.50%, 2/15/2022 | | | Ba2 | | | | 940,000 | | | | 959,392 | | | |
Aviation Capital Group Corp.7, 3.875%, 9/27/2016 | | | BBB4 | | | | 7,020,000 | | | | 7,144,198 | | | |
Fly Leasing Ltd. (Ireland), 6.75%, 12/15/2020 | | | B2 | | | | 605,000 | | | | 623,150 | | | |
Fly Leasing Ltd. (Ireland), 6.375%, 10/15/2021 | | | B2 | | | | 950,000 | | | | 961,875 | | | |
International Lease Finance Corp., 8.625%, 9/15/2015 | | | Ba2 | | | | 335,000 | | | | 339,187 | | | |
International Lease Finance Corp., 5.75%, 5/15/2016 | | | Ba2 | | | | 540,000 | | | | 553,500 | | | |
International Lease Finance Corp.5, 2.236%, 6/15/2016 | | | Ba2 | | | | 3,793,000 | | | | 3,788,259 | | | |
International Lease Finance Corp., 8.75%, 3/15/2017 | | | Ba2 | | | | 830,000 | | | | 908,111 | | | |
| | | | | | | | | | | | | | |
| | | | | | | | | | | 29,741,109 | | | |
| | | | | | | | | | | | | | |
Total Industrials | | | | | | | | | | | 56,308,995 | | | |
| | | | | | | | | | | | | | |
Information Technology - 2.9% | | | | | | | | | | | | | | |
Communications Equipment - 0.4% | | | | | | | | | | | | | | |
QUALCOMM, Inc., 3.00%, 5/20/2022 | | | A1 | | | | 2,400,000 | | | | 2,383,733 | | | |
| | | | | | | | | | | | | | |
Internet Software & Services - 1.6% | | | | | | | | | | | | | | |
Alibaba Group Holding Ltd. (China)7, 2.50%, 11/28/2019 | | | A1 | | | | 3,900,000 | | | | 3,857,428 | | | |
Baidu, Inc. (China), 2.75%, 6/9/2019 | | | A3 | | | | 4,000,000 | | | | 4,001,996 | | | |
Tencent Holdings Ltd. (China)7, 3.375%, 5/2/2019 | | | A2 | | | | 3,455,000 | | | | 3,547,321 | | | |
| | | | | | | | | | | | | | |
| | | | | | | | | | | 11,406,745 | | | |
| | | | | | | | | | | | | | |
IT Services - 0.4% | | | | | | | | | | | | | | |
Fiserv, Inc., 2.70%, 6/1/2020 | | | Baa2 | | | | 3,000,000 | | | | 2,994,243 | | | |
| | | | | | | | | | | | | | |
Technology Hardware, Storage & Peripherals - 0.5% | | | | | | | | | | | | | | |
EMC Corp., 2.65%, 6/1/2020 | | | A1 | | | | 3,715,000 | | | | 3,753,094 | | | |
| | | | | | | | | | | | | | |
Total Information Technology | | | | | | | | | | | 20,537,815 | | | |
| | | | | | | | | | | | | | |
Materials - 2.7% | | | | | | | | | | | | | | |
Chemicals - 0.9% | | | | | | | | | | | | | | |
Consolidated Energy Finance S.A. (Trinidad-Tobago)7, 6.75%, 10/15/2019 | | | B2 | | | | 1,075,000 | | | | 1,091,125 | | | |
The accompanying notes are an integral part of the financial statements.
9
Unconstrained Bond Series
Investment Portfolio - June 30, 2015
(unaudited)
| | | | | | | | | | | | | | |
| | | CREDIT
RATING1 | | | PRINCIPAL
AMOUNT2 | | | VALUE (NOTE 2) | | | |
| | | | |
CORPORATE BONDS (continued) | | | | | | | | | | | | | | |
| | | | |
Non-Convertible Corporate Bonds (continued) | | | | | | | | | | | | | | |
Materials (continued) | | | | | | | | | | | | | | |
Chemicals (continued) | | | | | | | | | | | | | | |
The Dow Chemical Co., 8.55%, 5/15/2019 | | | Baa2 | | | | 4,760,000 | | | $ | 5,803,549 | | | |
| | | | | | | | | | | | | | |
| | | | | | | | | | | 6,894,674 | | | |
| | | | | | | | | | | | | | |
Containers & Packaging - 0.2% | | | | | | | | | | | | | | |
Ardagh Packaging Finance plc - Ardagh Holdings USA, Inc.
(Ireland)5,7, 3.286%, 12/15/2019 | | | Ba3 | | | | 1,620,000 | | | | 1,575,450 | | | |
| | | | | | | | | | | | | | |
Metals & Mining - 1.1% | | | | | | | | | | | | | | |
Rio Tinto Finance USA Ltd. (United Kingdom), 3.75%, 9/20/2021 | | | A3 | | | | 4,000,000 | | | | 4,145,284 | | | |
SunCoke Energy Partners LP - SunCoke Energy Partners Finance Corp.7, 7.375%, 2/1/2020 | | | B1 | | | | 595,000 | | | | 600,950 | | | |
Teck Resources Ltd. (Canada), 3.00%, 3/1/2019 | | | Baa3 | | | | 3,010,000 | | | | 2,900,948 | | | |
| | | | | | | | | | | | | | |
| | | | | | | | | | | 7,647,182 | | | |
| | | | | | | | | | | | | | |
Paper & Forest Products - 0.5% | | | | | | | | | | | | | | |
Domtar Corp., 4.40%, 4/1/2022 | | | Baa3 | | | | 3,565,000 | | | | 3,622,999 | | | |
| | | | | | | | | | | | | | |
Total Materials | | | | | | | | | | | 19,740,305 | | | |
| | | | | | | | | | | | | | |
Telecommunication Services - 2.4% | | | | | | | | | | | | | | |
Diversified Telecommunication Services - 1.2% | | | | | | | | | | | | | | |
AT&T, Inc.5, 1.212%, 6/30/2020 | | | Baa1 | | | | 8,000,000 | | | | 8,030,992 | | | |
Windstream Services LLC, 7.875%, 11/1/2017 | | | B1 | | | | 685,000 | | | | 727,812 | | | |
| | | | | | | | | | | | | | |
| | | | | | | | | | | 8,758,804 | | | |
| | | | | | | | | | | | | | |
Wireless Telecommunication Services - 1.2% | | | | | | | | | | | | | | |
Altice Financing S.A. (Luxembourg)7, 6.50%, 1/15/2022 | | | B1 | | | | 1,550,000 | | | | 1,550,000 | | | |
SBA Tower Trust7, 5.101%, 4/17/2017 | | | A2 | | | | 2,095,000 | | | | 2,169,289 | | | |
SBA Tower Trust7, 2.933%, 12/15/2017 | | | A2 | | | | 1,515,000 | | | | 1,537,366 | | | |
SBA Tower Trust7, 3.598%, 4/15/2018 | | | Baa3 | | | | 1,640,000 | | | | 1,634,836 | | | |
Sixsigma Networks Mexico S.A. de C.V. (Mexico)7, 8.25%, 11/7/2021 | | | B1 | | | | 375,000 | | | | 387,637 | | | |
T-Mobile USA, Inc., 6.836%, 4/28/2023 | | | Ba3 | | | | 925,000 | | | | 972,406 | | | |
| | | | | | | | | | | | | | |
| | | | | | | | | | | 8,251,534 | | | |
| | | | | | | | | | | | | | |
Total Telecommunication Services | | | | | | | | | | | 17,010,338 | | | |
| | | | | | | | | | | | | | |
Utilities - 0.8% | | | | | | | | | | | | | | |
Gas Utilities - 0.3% | | | | | | | | | | | | | | |
National Fuel Gas Co., 3.75%, 3/1/2023 | | | Baa2 | | | | 2,000,000 | | | | 1,854,410 | | | |
| | | | | | | | | | | | | | |
Independent Power and Renewable Electricity Producers - 0.5% | | | | | | | | | | | | | | |
Abengoa Yield plc (Spain)7, 7.00%, 11/15/2019 | | | BB4 | | | | 1,140,000 | | | | 1,174,200 | | | |
ContourGlobal Power Holdings S.A. (France)7, 7.125%, 6/1/2019 | | | B3 | | | | 1,095,000 | | | | 1,147,013 | | | |
NRG Energy, Inc., 6.25%, 7/15/2022 | | | B1 | | | | 435,000 | | | | 441,525 | | | |
The accompanying notes are an integral part of the financial statements.
10
Unconstrained Bond Series
Investment Portfolio - June 30, 2015
(unaudited)
| | | | | | | | | | | | | | |
| | | CREDIT
RATING1 | | | PRINCIPAL
AMOUNT2 | | | VALUE (NOTE 2) | | | |
| | | | |
CORPORATE BONDS (continued) | | | | | | | | | | | | | | |
| | | | |
Non-Convertible Corporate Bonds (continued) | | | | | | | | | | | | | | |
Utilities (continued) | | | | | | | | | | | | | | |
Independent Power and Renewable Electricity Producers (continued) | | | | | | | | | | | | | | |
Talen Energy Supply LLC7, 5.125%, 7/15/2019 | | | Ba3 | | | | 1,190,000 | | | $ | 1,166,200 | | | |
| | | | | | | | | | | | | | |
| | | | | | | | | | | 3,928,938 | | | |
| | | | | | | | | | | | | | |
Total Utilities | | | | | | | | | | | 5,783,348 | | | |
| | | | | | | | | | | | | | |
TOTAL CORPORATE BONDS | | | | | | | | | | | | | | |
(Identified Cost $486,838,008) | | | | | | | | | | | 486,442,630 | | | |
| | | | | | | | | | | | | | |
ASSET-BACKED SECURITIES - 1.9% | | | | | | | | | | | | | | |
Alterna Funding I LLC, Series 2014-1A, Class NOTE7, 1.639%, 2/15/2021 | | | WR6 | | | | 1,197,036 | | | | 1,199,280 | | | |
Colony American Homes, Series 2015-1A, Class A5,7, 1.387%, 7/17/2032 | | | Aaa | | | | 1,850,000 | | | | 1,829,841 | | | |
FDIC Trust, Series 2011-R1, Class A7, 2.672%, 7/25/2026 | | | WR6 | | | | 505,829 | | | | 517,266 | | | |
FNA Trust, Series 2014-1A, Class A7, 1.296%, 12/10/2022 | | | WR6 | | | | 1,058,123 | | | | 1,057,784 | | | |
Hertz Vehicle Financing LLC, Series 2010-1A, Class A27, 3.74%, 2/25/2017 | | | Aaa | | | | 2,360,000 | | | | 2,388,953 | | | |
Invitation Homes Trust, Series 2015-SFR3, Class A5,7, 1.487%, 8/17/2032 | | | Aaa | | | | 1,825,000 | | | | 1,823,224 | | | |
NextGear Floorplan Master Owner Trust, Series 2014-1A, Class A7, 1.92%, 10/15/2019 | | | Aaa | | | | 1,900,000 | | | | 1,906,432 | | | |
SpringCastle America Funding LLC, Series 2014-AA, Class A7, 2.70%, 5/25/2023 | | | WR6 | | | | 1,379,198 | | | | 1,387,735 | | | |
Starwood Retail Property Trust, Series 2014-STAR, Class A5,7, 1.402%, 11/15/2027 | | | AAA4 | | | | 2,005,000 | | | | 1,991,147 | | | |
| | | | | | | | | | | | | | |
TOTAL ASSET-BACKED SECURITIES | | | | | | | | | | | | | | |
(Identified Cost $14,079,803) | | | | | | | | | | | 14,101,662 | | | |
| | | | | | | | | | | | | | |
COMMERCIAL MORTGAGE-BACKED SECURITIES - 10.5% | | | | | | | | | | | | | | |
Americold LLC Trust, Series 2010-ARTA, Class A17, 3.847%, 1/14/2029 | | | AAA4 | | | | 269,031 | | | | 279,897 | | | |
Banc of America Commercial Mortgage Trust, Series 2006-2, Class A45, 5.727%, 5/10/2045 | | | AAA4 | | | | 1,550,000 | | | | 1,575,767 | | | |
Banc of America Commercial Mortgage Trust, Series 2006-4, Class A4, 5.634%, 7/10/2046 | | | Aaa | | | | 1,947,487 | | | | 1,998,362 | | | |
Bear Stearns Commercial Mortgage Securities Trust, Series 2005-PWR9, Class A4A, 4.871%, 9/11/2042 | | | Aaa | | | | 40,884 | | | | 40,851 | | | |
Bear Stearns Commercial Mortgage Securities Trust, Series 2006-PW13, Class A4, 5.54%, 9/11/2041 | | | AAA4 | | | | 3,084,383 | | | | 3,185,239 | | | |
Bear Stearns Commercial Mortgage Securities Trust, Series 2006-T24, Class AM5, 5.568%, 10/12/2041 | | | A3 | | | | 800,000 | | | | 837,881 | | | |
CFCRE Commercial Mortgage Trust, Series 2011-C1, Class A27, 3.759%, 4/15/2044 | | | Aaa | | | | 221,891 | | | | 224,407 | | | |
The accompanying notes are an integral part of the financial statements.
11
Unconstrained Bond Series
Investment Portfolio - June 30, 2015
(unaudited)
| | | | | | | | | | | | | | |
| | | CREDIT
RATING1 | | | PRINCIPAL
AMOUNT2 | | | VALUE (NOTE 2) | | | |
| | | | |
COMMERCIAL MORTGAGE-BACKED SECURITIES (continued) | | | | | | | | | | | | | | |
| | | | |
COBALT CMBS Commercial Mortgage Trust, Series 2006-C1, Class A4, 5.223%, 8/15/2048 | | | AA4 | | | | 2,864,043 | | | $ | 2,978,768 | | | |
Commercial Mortgage Pass-Through Certificates, Series 2006-GG7, Class A45, 5.819%, 7/10/2038 | | | Aaa | | | | 1,613,116 | | | | 1,648,901 | | | |
Commercial Mortgage Pass-Through Certificates, Series 2010-C1, Class A17 , 3.156%, 7/10/2046 | | | Aaa | | | | 401,562 | | | | 401,782 | | | |
Credit Suisse Commercial Mortgage Trust, Series 2006-C3, Class A35, 5.806%, 6/15/2038 | | | Aaa | | | | 3,245,721 | | | | 3,314,878 | | | |
Credit Suisse Mortgage Capital Trust, Series 2013-TH1, Class A15,7, 2.13%, 2/25/2043 | | | AAA4 | | | | 1,185,205 | | | | 1,096,897 | | | |
Extended Stay America Trust, Series 2013-ESH7, Class A277, 2.958%, 12/5/2031 | | | Aaa | | | | 1,500,000 | | | | 1,504,818 | | | |
Fannie Mae Multifamily REMIC Trust, Series 2012-M13, Class ASQ2, 1.246%, 8/25/2017 | | | WR6 | | | | 1,075,919 | | | | 1,081,322 | | | |
Freddie Mac Multifamily Structured Pass-Through Certificates, Series K005, Class AX (IO)5, 1.372%, 11/25/2019 | | | WR6 | | | | 7,584,951 | | | | 401,532 | | | |
Freddie Mac Multifamily Structured Pass-Through Certificates, Series K009, Class X1 (IO)5, 1.457%, 8/25/2020 | | | WR6 | | | | 11,004,277 | | | | 614,237 | | | |
Freddie Mac Multifamily Structured Pass-Through Certificates, Series K014, Class X1 (IO)5, 1.236%, 4/25/2021 | | | WR6 | | | | 7,934,852 | | | | 477,742 | | | |
Freddie Mac Multifamily Structured Pass-Through Certificates, Series K016, Class X1 (IO)5, 1.558%, 10/25/2021 | | | WR6 | | | | 5,068,973 | | | | 405,675 | | | |
Freddie Mac Multifamily Structured Pass-Through Certificates, Series K017, Class X1 (IO)5, 1.424%, 12/25/2021 | | | WR6 | | | | 6,715,389 | | | | 493,413 | | | |
Freddie Mac Multifamily Structured Pass-Through Certificates, Series K021, Class X1 (IO)5, 1.498%, 6/25/2022 | | | WR6 | | | | 18,201,790 | | | | 1,517,083 | | | |
Freddie Mac Multifamily Structured Pass-Through Certificates, Series K030, Class X1 (IO)5, 0.224%, 4/25/2023 | | | Aaa | | | | 61,039,947 | | | | 901,743 | | | |
Freddie Mac Multifamily Structured Pass-Through Certificates, Series K032, Class X1 (IO)5, 0.122%, 5/25/2023 | | | WR6 | | | | 36,083,864 | | | | 303,033 | | | |
Freddie Mac Multifamily Structured Pass-Through Certificates, Series K706, Class X1 (IO)5, 1.572%, 10/25/2018 | | | Aaa | | | | 8,152,901 | | | | 372,351 | | | |
Freddie Mac Multifamily Structured Pass-Through Certificates, Series K-P01, Class A2, 1.72%, 1/25/2019 | | | WR6 | | | | 1,480,000 | | | | 1,484,674 | | | |
FREMF Mortgage Trust, Series 2011-K701, Class B5,7, 4.286%, 7/25/2048 | | | A4 | | | | 950,000 | | | | 998,633 | | | |
FREMF Mortgage Trust, Series 2011-K702, Class B5,7, 4.766%, 4/25/2044 | | | A3 | | | | 230,000 | | | | 245,361 | | | |
FREMF Mortgage Trust, Series 2013-K28, Class X2A (IO)7, 0.10%, 6/25/2046 | | | WR6 | | | | 95,161,184 | | | | 570,016 | | | |
FREMF Mortgage Trust, Series 2013-K712, Class B5,7, 3.484%, 5/25/2045 | | | A4 | | | | 1,300,000 | | | | 1,323,234 | | | |
FREMF Mortgage Trust, Series 2014-K716, Class B5,7, 3.954%, 8/25/2047 | | | A2 | | | | 2,550,000 | | | | 2,614,362 | | | |
FREMF Mortgage Trust, Series 2015-K42, Class B5,7, 3.853%, 12/25/2024 | | | A3 | | | | 1,900,000 | | | | 1,890,667 | | | |
The accompanying notes are an integral part of the financial statements.
12
Unconstrained Bond Series
Investment Portfolio - June 30, 2015
(unaudited)
| | | | | | | | | | | | | | |
| | | CREDIT
RATING1 | | | PRINCIPAL
AMOUNT2 | | | VALUE (NOTE 2) | | | |
| | | | |
COMMERCIAL MORTGAGE-BACKED SECURITIES (continued) | | | | | | | | | | | | | | |
| | | | |
FREMF Mortgage Trust, Series 2015-K43, Class B5,7, 3.735%, 2/25/2048 | | | WR6 | | | | 1,500,000 | | | $ | 1,500,309 | | | |
GAHR Commercial Mortgage Trust, Series 2015-NRF, Class BFX5,7, 3.382%, 12/15/2019 | | | AA4 | | | | 2,000,000 | | | | 2,013,436 | | | |
GAHR Commercial Mortgage Trust, Series 2015-NRF, Class DFX5,7, 3.382%, 12/15/2019 | | | BBB4 | | | | 1,150,000 | | | | 1,126,572 | | | |
JP Morgan Chase Commercial Mortgage Securities Trust, Series 2005-CB13, Class A45, 5.242%, 1/12/2043 | | | Aaa | | | | 769,032 | | | | 770,156 | | | |
JP Morgan Chase Commercial Mortgage Securities Trust, Series 2005-CB13, Class AM5, 5.283%, 1/12/2043 | | | A2 | | | | 460,000 | | | | 463,412 | | | |
JP Morgan Chase Commercial Mortgage Securities Trust, Series 2005-LDP5, Class A45, 5.239%, 12/15/2044 | | | Aaa | | | | 875,408 | | | | 877,373 | | | |
JP Morgan Chase Commercial Mortgage Securities Trust, Series 2006-CB16, Class A4, 5.552%, 5/12/2045 | | | Aaa | | | | 2,909,862 | | | | 2,986,566 | | | |
JP Morgan Chase Commercial Mortgage Securities Trust, Series 2006-LDP7, Class A45, 5.905%, 4/15/2045 | | | Aaa | | | | 991,437 | | | | 1,014,017 | | | |
JP Morgan Chase Commercial Mortgage Securities Trust, Series 2010-C2, Class A37, 4.07%, 11/15/2043 | | | AAA4 | | | | 750,000 | | | | 805,284 | | | |
JP Morgan Mortgage Trust, Series 2013-1, Class 1A25,7, 3.00%, 3/25/2043 | | | WR6 | | | | 971,160 | | | | 945,959 | | | |
JP Morgan Mortgage Trust, Series 2013-2, Class A25,7, 3.50%, 5/25/2043 | | | AAA4 | | | | 1,123,747 | | | | 1,129,629 | | | |
JP Morgan Mortgage Trust, Series 2014-2, Class 1A15,7, 3.00%, 6/25/2029 | | | AAA4 | | | | 1,500,630 | | | | 1,524,664 | | | |
LSTAR Commercial Mortgage Trust, Series 2014-2, Class A27, 2.767%, 1/20/2041 | | | Aaa | | | | 1,425,000 | | | | 1,445,410 | | | |
Morgan Stanley Capital I Trust, Series 2005-IQ10, Class A4A5, 5.23%, 9/15/2042 | | | Aaa | | | | 4,801 | | | | 4,798 | | | |
Morgan Stanley Capital I Trust, Series 2006-HQ10, Class A4, 5.328%, 11/12/2041 | | | Aaa | | | | 1,670,878 | | | | 1,729,090 | | | |
Morgan Stanley Capital I Trust, Series 2011-C1, Class A27, 3.884%, 9/15/2047 | | | AAA4 | | | | 137,554 | | | | 138,632 | | | |
Motel 6 Trust, Series 2015-MTL6, Class B7, 3.298%, 2/5/2030 | | | WR6 | | | | 1,900,000 | | | | 1,895,054 | | | |
New Residential Mortgage Loan Trust, Series 2014-3A, Class AFX35,7, 3.75%, 11/25/2054 | | | AAA4 | | | | 1,865,442 | | | | 1,912,923 | | | |
OBP Depositor LLC Trust, Series 2010-OBP, Class A7, 4.646%, 7/15/2045 | | | AAA4 | | | | 420,000 | | | | 461,929 | | | |
Resource Capital Corp., Series 2013-CRE1, Class A (Cayman Islands)5,7, 1.486%, 12/15/2028 | | | AAA4 | | | | 168,039 | | | | 168,017 | | | |
SCG Trust, Series 2013-SRP1, Class AJ5,7, 2.136%, 11/15/2026 | | | AAA4 | | | | 2,000,000 | | | | 2,005,922 | | | |
Sequoia Mortgage Trust, Series 2011-2, Class A15, 3.90%, 9/25/2041 | | | WR6 | | | | 508,132 | | | | 523,716 | | | |
Sequoia Mortgage Trust, Series 2012-2, Class A25, 3.50%, 4/25/2042 | | | WR6 | | | | 881,478 | | | | 890,891 | | | |
Sequoia Mortgage Trust, Series 2013-2, Class A15, 1.874%, 2/25/2043 | | | AAA4 | | | | 1,124,082 | | | | 1,019,709 | | | |
Sequoia Mortgage Trust, Series 2013-7, Class A25, 3.00%, 6/25/2043 | | | AAA4 | | | | 880,250 | | | | 848,341 | | | |
Sequoia Mortgage Trust, Series 2013-8, Class A15, 3.00%, 6/25/2043 | | | Aaa | | | | 1,209,005 | | | | 1,165,934 | | | |
The accompanying notes are an integral part of the financial statements.
13
Unconstrained Bond Series
Investment Portfolio - June 30, 2015
(unaudited)
| | | | | | | | | | | | | | |
| | | CREDIT
RATING1 | | | PRINCIPAL
AMOUNT2/ SHARES | | | VALUE (NOTE 2) | | | |
| | | | |
COMMERCIAL MORTGAGE-BACKED SECURITIES (continued) | | | | | | | | | | | | | | |
| | | | |
Vornado DP LLC Trust, Series 2010-VNO, Class A2FX7, 4.004%, 9/13/2028 | | | AAA4 | | | | 1,195,000 | | | $ | 1,283,009 | | | |
Wachovia Bank Commercial Mortgage Trust, Series 2005-C21, Class A45, 5.262%, 10/15/2044 | | | Aaa | | | | 388,862 | | | | 389,259 | | | |
Wachovia Bank Commercial Mortgage Trust, Series 2005-C22, Class AM5, 5.334%, 12/15/2044 | | | A2 | | | | 1,060,000 | | | | 1,070,971 | | | |
Wachovia Bank Commercial Mortgage Trust, Series 2006-C26, Class A35, 6.011%, 6/15/2045 | | | Aaa | | | | 1,220,000 | | | | 1,254,353 | | | |
Wells Fargo Commercial Mortgage Trust, Series 2010-C1, Class A27, 4.393%, 11/15/2043 | | | Aaa | | | | 1,350,000 | | | | 1,470,953 | | | |
WF-RBS Commercial Mortgage Trust, Series 2011-C2, Class A45,7, 4.869%, 2/15/2044 | | | Aaa | | | | 1,550,000 | | | | 1,717,925 | | | |
WinWater Mortgage Loan Trust, Series 2015-1, Class A15,7, 3.50%, 1/20/2045 | | | WR6 | | | | 1,743,791 | | | | 1,771,725 | | | |
WinWater Mortgage Loan Trust, Series 2015-3, Class A55,7, 3.50%, 3/20/2045 | | | Aaa | | | | 2,229,810 | | | | 2,277,523 | | | |
| | | | | | | | | | | | | | |
TOTAL COMMERCIAL MORTGAGE-BACKED SECURITIES | | | | | | | | | | | | | | |
(Identified Cost $76,099,545) | | | | | | | | | | | 75,386,987 | | | |
| | | | | | | | | | | | | | |
FOREIGN GOVERNMENT BONDS - 3.5% | | | | | | | | | | | | | | |
Brazilian Government International Bond (Brazil), 8.875%, 10/14/2019 | | | Baa2 | | | | 1,300,000 | | | | 1,615,250 | | | |
Chile Government International Bond (Chile), 5.50%, 8/5/2020 | | | Aa3 | | | CLP | 1,800,000,000 | | | | 3,005,087 | | | |
Malaysia Government Bond (Malaysia), 4.262%, 9/15/2016 | | | A3 | | | MYR | 8,905,000 | | | | 2,392,141 | | | |
Mexican Government Bond (Mexico), 8.00%, 12/17/2015 | | | A3 | | | MXN | 55,455,000 | | | | 3,604,909 | | | |
Mexican Government Bond (Mexico), 5.00%, 6/15/2017 | | | A3 | | | MXN | 64,000,000 | | | | 4,140,579 | | | |
Mexican Government Bond (Mexico), 8.00%, 6/11/2020 | | | A3 | | | MXN | 35,000,000 | | | | 2,489,067 | | | |
Mexican Government Bond (Mexico), 6.50%, 6/9/2022 | | | A3 | | | MXN | 126,000,000 | | | | 8,305,017 | | | |
| | | | | | | | | | | | | | |
TOTAL FOREIGN GOVERNMENT BONDS | | | | | | | | | | | | | | |
(Identified Cost $29,674,948) | | | | | | | | | | | 25,552,050 | | | |
| | | | | | | | | | | | | | |
MUTUAL FUNDS - 3.9% | | | | | | | | | | | | | | |
iShares iBoxx $ High Yield Corporate Bond ETF | | | | | | | 158,310 | | | | 14,057,928 | | | |
PowerShares Senior Loan Portfolio | | | | | | | 595,450 | | | | 14,165,755 | | | |
| | | | | | | | | | | | | | |
TOTAL MUTUAL FUNDS | | | | | | | | | | | | | | |
(Identified Cost $28,749,260) | | | | | | | | | | | 28,223,683 | | | |
| | | | | | | | | | | | | | |
U.S. GOVERNMENT AGENCIES - 3.0% | | | | | | | | | | | | | | |
Mortgage-Backed Securities - 3.0% | | | | | | | | | | | | | | |
Fannie Mae, Pool #888468, 5.50%, 9/1/2021 | | | | | | | 918,197 | | | | 997,863 | | | |
Fannie Mae, Pool #995233, 5.50%, 10/1/2021 | | | | | | | 75,620 | | | | 81,419 | | | |
Fannie Mae, Pool #888017, 6.00%, 11/1/2021 | | | | | | | 90,172 | | | | 98,993 | | | |
Fannie Mae, Pool #995329, 5.50%, 12/1/2021 | | | | | | | 630,490 | | | | 683,792 | | | |
Fannie Mae, Pool #888136, 6.00%, 12/1/2021 | | | | | | | 111,683 | | | | 122,316 | | | |
The accompanying notes are an integral part of the financial statements.
14
Unconstrained Bond Series
Investment Portfolio - June 30, 2015
(unaudited)
| | | | | | | | | | |
| | | PRINCIPAL
AMOUNT2 | | | VALUE (NOTE 2) | | | |
| | | |
U.S. GOVERNMENT AGENCIES (continued) | | | | | | | | | | |
| | | |
Mortgage-Backed Securities (continued) | | | | | | | | | | |
Fannie Mae, Pool #888810, 5.50%, 11/1/2022 | | | 1,111,264 | | | $ | 1,208,111 | | | |
Fannie Mae, Pool #AD0462, 5.50%, 10/1/2024 | | | 68,134 | | | | 74,642 | | | |
Fannie Mae, Pool #MA0115, 4.50%, 7/1/2029 | | | 197,902 | | | | 214,998 | | | |
Fannie Mae, Pool #MA1834, 4.50%, 2/1/2034 | | | 634,645 | | | | 691,417 | | | |
Fannie Mae, Pool #MA1890, 4.00%, 5/1/2034 | | | 1,324,474 | | | | 1,418,601 | | | |
Fannie Mae, Pool #918516, 5.50%, 6/1/2037 | | | 331,201 | | | | 371,421 | | | |
Fannie Mae, Pool #933731, 5.50%, 4/1/2038 | | | 394,190 | | | | 442,171 | | | |
Fannie Mae, Pool #889624, 5.50%, 5/1/2038 | | | 465,573 | | | | 521,976 | | | |
Fannie Mae, Pool #995876, 6.00%, 11/1/2038 | | | 1,139,822 | | | | 1,295,098 | | | |
Fannie Mae, Pool #AD0307, 5.50%, 1/1/2039 | | | 467,182 | | | | 523,780 | | | |
Freddie Mac, Pool #G11850, 5.50%, 7/1/2020 | | | 339,995 | | | | 363,010 | | | |
Freddie Mac, Pool #G12610, 6.00%, 3/1/2022 | | | 108,359 | | | | 118,327 | | | |
Freddie Mac, Pool #G12655, 6.00%, 5/1/2022 | | | 79,055 | | | | 86,575 | | | |
Freddie Mac, Pool #G12988, 6.00%, 1/1/2023 | | | 61,260 | | | | 67,669 | | | |
Freddie Mac, Pool #G13078, 6.00%, 3/1/2023 | | | 108,698 | | | | 119,735 | | | |
Freddie Mac, Pool #G13331, 5.50%, 10/1/2023 | | | 47,525 | | | | 52,012 | | | |
Freddie Mac, Pool #C91359, 4.50%, 2/1/2031 | | | 447,016 | | | | 485,402 | | | |
Freddie Mac, Pool #D98711, 4.50%, 7/1/2031 | | | 1,077,647 | | | | 1,175,798 | | | |
Freddie Mac, Pool #C91746, 4.50%, 12/1/2033 | | | 1,079,042 | | | | 1,173,280 | | | |
Freddie Mac, Pool #C91754, 4.50%, 3/1/2034 | | | 310,837 | | | | 338,295 | | | |
Freddie Mac, Pool #K92054, 4.00%, 10/1/2034 | | | 1,353,630 | | | | 1,446,056 | | | |
Freddie Mac, Pool #C91811, 4.00%, 1/1/2035 | | | 2,076,179 | | | | 2,218,589 | | | |
Freddie Mac, Pool #G07655, 5.50%, 12/1/2035 | | | 1,156,070 | | | | 1,296,702 | | | |
Freddie Mac, Pool #G04176, 5.50%, 5/1/2038 | | | 518,663 | | | | 580,284 | | | |
Freddie Mac, Pool #A78227, 5.50%, 6/1/2038 | | | 588,203 | | | | 658,646 | | | |
Freddie Mac, Pool #G05956, 5.50%, 7/1/2038 | | | 418,454 | | | | 468,225 | | | |
Freddie Mac, Pool #G05671, 5.50%, 8/1/2038 | | | 45,716 | | | | 51,151 | | | |
Freddie Mac, Pool #G05900, 6.00%, 3/1/2040 | | | 380,869 | | | | 430,549 | | | |
Freddie Mac, Pool #G07589, 5.50%, 6/1/2041 | | | 1,400,089 | | | | 1,566,432 | | | |
| | | | | | | | | | |
| | | |
TOTAL U.S. GOVERNMENT AGENCIES | | | | | | | | | | |
(Identified Cost $20,960,069) | | | | | | | 21,443,335 | | | |
| | | | | | | | | | |
The accompanying notes are an integral part of the financial statements.
15
Unconstrained Bond Series
Investment Portfolio - June 30, 2015
(unaudited)
| | | | | | | | | | |
| | | SHARES | | | VALUE (NOTE 2) | | | |
| | | |
SHORT-TERM INVESTMENT - 4.6% | | | | | | | | | | |
| | | |
Dreyfus Cash Management, Inc. - Institutional Shares14, 0.04%, | | | | | | | | | | |
(Identified Cost $33,285,393) | | | 33,285,393 | | | $ | 33,285,393 | | | |
| | | | | | | | | | |
| | | |
TOTAL INVESTMENTS - 101.7% | | | | | | | | | | |
(Identified Cost $738,803,270) | | | | | | | 733,207,426 | | | |
LIABILITIES, LESS OTHER ASSETS - (1.7%) | | | | | | | (12,282,026 | ) | | |
| | | | | | | | | | |
| | | |
NET ASSETS - 100% | | | | | | $ | 720,925,400 | | | |
| | | | | | | | | | |
CLP - Chilean Peso
ETF - Exchange-Traded Fund
IO - Interest only
MXN - Mexican Peso
MYR - Malaysian Ringgit
1Credit ratings from Moody’s (unaudited).
2Amount is stated in USD unless otherwise noted.
3This security is unsettled and the coupon rate has not yet been determined as of June 30, 2015.
4Credit ratings from S&P (unaudited).
5The coupon rate is floating and is the effective rate as of June 30, 2015.
6Credit rating has been withdrawn. As of June 30, 2015, there is no rating available (unaudited).
7Restricted securities - Investment in securities that are restricted as to public resale under the Securities Act of 1933, as amended. These securities have been sold under rule 144A and have been determined to be liquid under guidelines established by the Board of Directors. These securities amount to $193,180,335 or 26.8%, of the Series’ net assets as of June 30, 2015 (see Note 2 to the financial statements).
8Security is perpetual in nature and has no stated maturity date.
9The rate shown is a fixed rate as of June 30, 2015; the rate becomes floating, based on LIBOR plus a spread, in December 2024.
10The rate shown is a fixed rate as of June 30, 2015; the rate becomes floating, based on U.S. Treasury Yield Curve Rate Treasury Note Constant Maturity 5 Year in June 2017.
11The rate shown is a fixed rate as of June 30, 2015; the rate becomes floating, based on LIBOR plus a spread, in June 2022.
12The rate shown is a fixed rate as of June 30, 2015; the rate becomes floating, based on LIBOR plus a spread, in September 2022.
13Represents a Payment-In-Kind bond.
14Rate shown is the current yield as of June 30, 2015.
The Global Industry Classification Standard (GICS) was developed by and is the exclusive property and a service mark of MSCI Inc. (MSCI) and Standard & Poor’s, a division of The McGraw-Hill Companies, Inc. (S&P), and is licensed for use by Manning & Napier when referencing GICS sectors. Neither MSCI, S&P, nor any third party involved in making or compiling the GICS or any GICS classifications makes any express or implied warranties or representations with respect to such standard or classification, nor shall any such party have any liability therefrom.
The accompanying notes are an integral part of the financial statements.
16
Unconstrained Bond Series
Statement of Assets and Liabilities
June 30, 2015 (unaudited)
| | | | |
ASSETS: | | | | |
| |
Investments, at value (identified cost $738,803,270) (Note 2) | | $ | 733,207,426 | |
Cash | | | 37,022 | |
Receivable for securities sold | | | 14,859,783 | |
Interest receivable | | | 5,507,431 | |
Receivable for fund shares sold | | | 138,143 | |
Dividends receivable | | | 1,469 | |
Prepaid and other expenses | | | 1,138 | |
| | | | |
| |
TOTAL ASSETS | | | 753,752,412 | |
| | | | |
| |
LIABILITIES: | | | | |
| |
Accrued management fees (Note 3) | | | 283,405 | |
Accrued shareholder services fees (Class S) (Note 3) | | | 150,381 | |
Accrued fund accounting and administration fees (Note 3) | | | 35,440 | |
Accrued transfer agent fees (Note 3) | | | 5,695 | |
Accrued Chief Compliance Officer service fees (Note 3) | | | 382 | |
Payable for securities purchased | | | 30,976,115 | |
Payable for fund shares repurchased | | | 1,324,613 | |
Other payables and accrued expenses | | | 50,981 | |
| | | | |
| |
TOTAL LIABILITIES | | | 32,827,012 | |
| | | | |
| |
TOTAL NET ASSETS | | $ | 720,925,400 | |
| | | | |
| |
NET ASSETS CONSIST OF: | | | | |
| |
Capital stock | | $ | 692,469 | |
Additional paid-in-capital | | | 716,932,527 | |
Undistributed net investment income | | | 2,477,458 | |
Accumulated net realized gain on investments, foreign currency and translation of other assets and liabilities | | | 6,422,322 | |
Net unrealized appreciation (depreciation) on investments, foreign currency and translation of other assets and liabilities | | | (5,599,376 | ) |
| | | | |
| |
TOTAL NET ASSETS | | $ | 720,925,400 | |
| | | | |
| |
NET ASSET VALUE, OFFERING PRICE AND REDEMPTION PRICE PER SHARE - Class S | | | | |
($681,329,180/65,062,107 shares) | | $ | 10.47 | |
| | | | |
| |
NET ASSET VALUE, OFFERING PRICE AND REDEMPTION PRICE PER SHARE - Class I | | | | |
($39,596,220/4,184,745 shares) | | $ | 9.46 | |
| | | | |
The accompanying notes are an integral part of the financial statements.
17
Unconstrained Bond Series
Statement of Operations
For the Six Months Ended June 30, 2015 (unaudited)
| | | | |
INVESTMENT INCOME: | | | | |
| |
Interest | | $ | 13,625,547 | |
Dividends (net of foreign taxes withheld, $3,668) | | | 255,017 | |
| | | | |
| |
Total Investment Income | | | 13,880,564 | |
| | | | |
| |
EXPENSES: | | | | |
| |
Management fees (Note 3) | | | 1,716,957 | |
Shareholder services fees (Class S) (Note 3) | | | 867,428 | |
Fund accounting and administration fees (Note 3) | | | 72,779 | |
Transfer agent fees (Note 3) | | | 8,770 | |
Directors’ fees (Note 3) | | | 7,303 | |
Chief Compliance Officer service fees (Note 3) | | | 1,224 | |
Custodian fees | | | 19,544 | |
Miscellaneous | | | 67,081 | |
| | | | |
| |
Total Expenses | | | 2,761,086 | |
Less reduction of expenses (Note 3) | | | (2,802 | ) |
| | | | |
| |
Net Expenses | | | 2,758,284 | |
| | | | |
| |
NET INVESTMENT INCOME | | | 11,122,280 | |
| | | | |
| |
REALIZED AND UNREALIZED GAIN (LOSS) ON INVESTMENTS AND FOREIGN CURRENCY: | | | | |
| |
Net realized gain on- | | | | |
Investments | | | 5,390,189 | |
Foreign currency transactions and translation of other assets and liabilities | | | 7,342 | |
| | | | |
| |
| | | 5,397,531 | |
| | | | |
| |
Net change in unrealized appreciation (depreciation) on- | | | | |
Investments | | | (11,511,313 | ) |
Foreign currency and translation of other assets and liabilities | | | (395 | ) |
| | | | |
| |
| | | (11,511,708 | ) |
| | | | |
| |
NET REALIZED AND UNREALIZED GAIN (LOSS) ON INVESTMENTS AND FOREIGN CURRENCY | | | (6,114,177 | ) |
| | | | |
| |
NET INCREASE IN NET ASSETS RESULTING FROM OPERATIONS | | $ | 5,008,103 | |
| | | | |
The accompanying notes are an integral part of the financial statements.
18
Unconstrained Bond Series
Statements of Changes in Net Assets
| | | | | | | | |
| | | FOR THE SIX
MONTHS ENDED
6/30/15
(UNAUDITED) | | | FOR THE
YEAR ENDED
12/31/14 | |
INCREASE (DECREASE) IN NET ASSETS: | | | | | | | | |
| | |
OPERATIONS: | | | | | | | | |
| | |
Net investment income | | $ | 11,122,280 | | | $ | 23,039,953 | |
Net realized gain on investments and foreign currency | | | 5,397,531 | | | | 12,001,464 | |
Net change in unrealized appreciation (depreciation) on investments and foreign currency | | | (11,511,708 | ) | | | (13,554,963 | ) |
| | | | | | | | |
| | |
Net increase from operations | | | 5,008,103 | | | | 21,486,454 | |
| | | | | | | | |
| | |
DISTRIBUTIONS TO SHAREHOLDERS (Note 8): | | | | | | | | |
| | |
From net investment income (Class S) | | | (7,862,587 | ) | | | (20,951,102 | ) |
From net investment income (Class I) | | | (782,235 | ) | | | (2,159,679 | ) |
From net realized gain on investments (Class S) | | | — | | | | (7,741,329 | ) |
From net realized gain on investments (Class I) | | | — | | | | (979,791 | ) |
| | | | | | | | |
| | |
Total distributions to shareholders | | | (8,644,822 | ) | | | (31,831,901 | ) |
| | | | | | | | |
| | |
CAPITAL STOCK ISSUED AND REPURCHASED: | | | | | | | | |
| | |
Net increase (decrease) from capital share transactions (Note 5) | | | (34,946,283 | ) | | | 96,977,718 | |
| | | | | | | | |
| | |
Net increase (decrease) in net assets | | | (38,583,002 | ) | | | 86,632,271 | |
| | |
NET ASSETS: | | | | | | | | |
| | |
Beginning of period | | | 759,508,402 | | | | 672,876,131 | |
| | | | | | | | |
| | |
End of period (including undistributed net investment income of $2,477,458 and $0, respectively) | | $ | 720,925,400 | | | $ | 759,508,402 | |
| | | | | | | | |
The accompanying notes are an integral part of the financial statements.
19
Unconstrained Bond Series
Financial Highlights - Class S*
| | | | | | | | | | | | | | | | | | | | | | | | | | | | | | |
| | | FOR THE SIX MONTHS ENDED | | FOR THE YEARS ENDED |
| | | 6/30/15
(UNAUDITED) | | 12/31/14 | | 12/31/13 | | 12/31/12 | | 12/31/11 | | 12/31/10 |
Per share data (for a share outstanding throughout each period): | | | | | | | | | | | | | | | | | | | | | | | | | | | | | | |
Net asset value - Beginning of period | | | | $10.53 | | | | | $10.65 | | | | | $11.27 | | | | | $10.67 | | | | | $10.96 | | | | | $10.49 | |
| | | | | | | | | | | | | | | | | | | | | | | | | | | | | | |
| | | | | | |
Income (loss) from investment operations: | | | | | | | | | | | | | | | | | | | | | | | | | | | | | | |
Net investment income1 | | | | 0.15 | | | | | 0.34 | | | | | 0.37 | | | | | 0.45 | | | | | 0.51 | | | | | 0.55 | |
Net realized and unrealized gain (loss) on investments | | | | (0.09 | ) | | | | (0.00 | )2 | | | | (0.38 | ) | | | | 0.70 | | | | | 0.03 | | | | | 0.51 | |
| | | | | | | | | | | | | | | | | | | | | | | | | | | | | | |
| | | | | | |
Total from investment operations | | | | 0.06 | | | | | 0.34 | | | | | (0.01 | ) | | | | 1.15 | | | | | 0.54 | | | | | 1.06 | |
| | | | | | | | | | | | | | | | | | | | | | | | | | | | | | |
| | | | | | |
Less distributions to shareholders: | | | | | | | | | | | | | | | | | | | | | | | | | | | | | | |
From net investment income | | | | (0.12 | ) | | | | (0.34 | ) | | | | (0.37 | ) | | | | (0.45 | ) | | | | (0.51 | ) | | | | (0.52 | ) |
From net realized gain on investments | | | | — | | | | | (0.12 | ) | | | | (0.24 | ) | | | | (0.10 | ) | | | | (0.32 | ) | | | | (0.07 | ) |
| | | | | | | | | | | | | | | | | | | | | | | | | | | | | | |
| | | | | | |
Total distributions to shareholders | | | | (0.12 | ) | | | | (0.46 | ) | | | | (0.61 | ) | | | | (0.55 | ) | | | | (0.83 | ) | | | | (0.59 | ) |
| | | | | | | | | | | | | | | | | | | | | | | | | | | | | | |
| | | | | | |
Net asset value - End of period | | | | $10.47 | | | | | $10.53 | | | | | $10.65 | | | | | $11.27 | | | | | $10.67 | | | | | $10.96 | |
| | | | | | | | | | | | | | | | | | | | | | | | | | | | | | |
| | | | | | |
Net assets - End of period
(000’s omitted) | | | | $681,329 | | | | | $680,719 | | | | | $653,668 | | | | | $631,082 | | | | | $569,583 | | | | | $535,355 | |
| | | | | | | | | | | | | | | | | | | | | | | | | | | | | | |
| | | | | | |
Total return3 | | | | 0.57% | | | | | 3.18% | | | | | (0.02% | ) | | | | 10.94% | | | | | 4.91% | | | | | 10.18% | |
Ratios (to average net assets)/Supplemental Data: | | | | | | | | | | | | | | | | | | | | | | | | | | | | | | |
Expenses** | | | | 0.75% | 4 | | | | 0.75% | | | | | 0.75% | | | | | 0.75% | | | | | 0.75% | | | | | 0.76% | |
Net investment income | | | | 2.89% | 4 | | | | 3.16% | | | | | 3.35% | | | | | 4.01% | | | | | 4.56% | | | | | 4.92% | |
Portfolio turnover | | | | 68% | | | | | 53% | | | | | 49% | | | | | 41% | | | | | 35% | | | | | 31% | |
*Effective August 1, 2013, the shares of the Series have been designated as Class S. **The investment advisor did not impose all or a portion of its management and/or other fees, and in some periods may have paid a portion of the Series’ expenses. If these expenses had been incurred by the Series, the expense ratio (to average net assets) would have increased by the following amounts: | |
| | | | 0.00% | 4,5 | | | | N/A | | | | | 0.00% | 5 | | | | N/A | | | | | N/A | | | | | 0.00% | 5 |
1Calculated based on average shares outstanding during the periods.
2Less than $(0.01).
3Represents aggregate total return for the periods indicated, and assumes reinvestment of all distributions. Total return would have been lower had certain expenses not been waived during certain periods. Periods less than one year are not annualized.
4Annualized.
5Less than 0.01%.
The accompanying notes are an integral part of the financial statements.
20
Unconstrained Bond Series
Financial Highlights - Class I
| | | | | | | | | | | | |
| | | FOR THE SIX
MONTHS ENDED
6/30/15
(UNAUDITED) | | | FOR THE YEAR
ENDED 12/31/14 | | | FOR THE PERIOD
8/1/131 TO
12/31/13 | |
Per share data (for a share outstanding throughout each period): | | | | | | | | | | | | |
Net asset value - Beginning of period | | | $9.52 | | | | $9.68 | | | | $10.00 | |
| | | |
Income (loss) from investment operations: | | | | | | | | | | | | |
Net investment income2 | | | 0.15 | | | | 0.34 | | | | 0.15 | |
Net realized and unrealized gain (loss) on investments | | | (0.08) | | | | (0.02) | | | | 0.003 | |
| | | |
Total from investment operations | | | 0.07 | | | | 0.32 | | | | 0.15 | |
| | | |
Less distributions to shareholders: | | | | | | | | | | | | |
From net investment income | | | (0.13) | | | | (0.36) | | | | (0.23) | |
From net realized gain on investments | | | — | | | | (0.12) | | | | (0.24) | |
| | | |
Total distributions to shareholders | | | (0.13) | | | | (0.48) | | | | (0.47) | |
| | | |
Net asset value - End of period | | | $9.46 | | | | $9.52 | | | | $9.68 | |
| | | |
Net assets - End of period (000’s omitted) | | | $39,596 | | | | $78,789 | | | | $19,209 | |
| | | |
Total return4 | | | 0.75% | | | | 3.36% | | | | 1.60% | |
Ratios (to average net assets)/Supplemental Data: | | | | | | | | | | | | |
Expenses* | | | 0.50%5 | | | | 0.50% | | | | 0.50%5 | |
Net investment income | | | 3.20%5 | | | | 3.42% | | | | 3.55%5 | |
Portfolio turnover | | | 68% | | | | 53% | | | | 49% | |
| *The investment advisor did not impose all or a portion of its management and/or other fees, and in some periods may have paid a portion of the Series’ expenses. If these expenses had been incurred by the Series, the expense ratio (to average net assets) would have increased by the following amounts: | |
| | | 0.00%5,6 | | | | N/A | | | | 0.00%5,6 | |
1Commencement of operations.
2Calculated based on average shares outstanding during the periods.
3Less than $0.01 per share.
4Represents aggregate total return for the periods indicated, and assumes reinvestment of all distributions. Total return would have been lower had certain expenses not been waived during certain periods. Periods less than one year are not annualized.
5Annualized.
6Less than 0.01%.
The accompanying notes are an integral part of the financial statements.
21
Unconstrained Bond Series
Notes to Financial Statements
(unaudited)
Unconstrained Bond Series, formerly known as Core Plus Bond Series, (the “Series”) is a no-load diversified series of Manning & Napier Fund, Inc. (the “Fund”). The Fund is organized in Maryland and is registered under the Investment Company Act of 1940, as amended, as an open-end management investment company.
The Series’ primary investment objective is to provide long-term total return, and its secondary objective is to provide preservation of capital.
The Fund’s advisor is Manning & Napier Advisors, LLC (the “Advisor”). Shares of the Series are offered to investors, clients and employees of the Advisor and its affiliates. The Series is authorized to issue two classes of shares (Class S and Class I). Each class of shares is substantially the same except the Class S shares bear shareholder services fees. The total authorized capital stock of the Fund consists of 15 billion shares of common stock each having a par value of $0.01. As of June 30, 2015, 10.6 billion shares have been designated in total among 41 series, of which 125 million have been designated as Unconstrained Bond Series Class S common stock and 100 million have been designated as Unconstrained Bond Series Class I common stock.
| 2. | Significant Accounting Policies |
The following is a summary of significant accounting policies followed by the Series. The Series is an investment company and, accordingly, follows the investment company accounting and reporting guidance of the Financial Accounting Standards Board Accounting Standards Codification Topic 946 - Investment Companies, which is part of accounting principles generally accepted in the United States of America (“GAAP”).
Security Valuation
Portfolio securities, including domestic equities, foreign equities, warrants and options, listed on an exchange other than the NASDAQ Stock Market are valued at the latest quoted sales price of the exchange on which the security is primarily traded. Securities not traded on valuation date or securities not listed on an exchange are valued at the latest quoted bid price provided by the Fund’s pricing service. Securities listed on the NASDAQ Stock Market are valued in accordance with the NASDAQ Official Closing Price.
Debt securities, including government bonds, foreign bonds, asset-backed securities, structured notes, supranational obligations, sovereign bonds, corporate bonds, loan assignments, and mortgage-backed securities will normally be valued on the basis of evaluated bid prices provided directly by an independent pricing service. The pricing services use multiple valuation techniques to determine fair value. In instances where sufficient market activity exists, the pricing services may utilize a market-based approach through which quotes from market makers are used to determine fair value. In instances where sufficient market activity may not exist or is limited, the pricing services also utilize proprietary valuation models which may consider market characteristics such as benchmark yield curves, option-adjusted spreads, credit spreads, estimated default rates, coupon rates, anticipated timing of principal repayments, underlying collateral, and other unique security features in order to estimate the relevant cash flows, which are then discounted to calculate the fair value. Certain investments in securities held by the Series may be valued on a basis of a price provided directly by a principal market maker. These prices may differ from the value that would have been used had a broader market for securities existed.
The fair value of loan assignments is estimated using recently executed transactions, market price quotations, credit/market events, and cross-asset pricing. Inputs are generally observable market inputs obtained from independent sources. Loan assignments are generally categorized in Level 2 of the fair value hierarchy, unless key inputs are unobservable, in which case they would be categorized in Level 3.
Municipal securities will normally be valued on the basis of market valuations provided by an independent pricing service that utilizes the latest price quotations and a matrix system (which considers such factors as security prices of similar securities, yields, maturities and ratings).
22
Unconstrained Bond Series
Notes to Financial Statements (continued)
(unaudited)
| 2. | Significant Accounting Policies (continued) |
Security Valuation (continued)
Short-term investments that mature in sixty days or less are valued at amortized cost, which approximates fair value. Investments in open-end investment companies are valued at their net asset value per share on valuation date.
Volume and level of activity in established markets for an asset or liability are evaluated to determine whether recent transactions and quoted prices are determinative of fair value. Where there have been significant decreases in volume and level of activity, further analysis and adjustment may be necessary to estimate fair value. The Series measures fair value in these instances by the use of inputs and valuation techniques which may be based upon current market prices of securities that are comparable in coupon, rating, maturity and industry and/or expectation of future cash flows. As a result of trading in relatively thin markets and/or markets that experience significant volatility, the prices used by the Series to value these securities may differ from the value that would be realized if these securities were sold, and the differences could be material.
Securities for which representative valuations or prices are not available from the Series’ pricing service may be valued at fair value as determined in good faith by the Advisor under procedures approved by and under the general supervision and responsibility of the Fund’s Board of Directors (the “Board”). Due to the inherent uncertainty of valuations of such securities, the fair value may differ significantly from the values that would have been used had a ready market for such securities existed. If trading or events occurring after the close of the principal market in which securities are traded are expected to materially affect the value of those securities, then they may be valued at their fair value, taking this trading or these events into account.
Various inputs are used in determining the value of the Series’ assets or liabilities carried at fair value. These inputs are summarized in three broad levels. Level 1 includes quoted prices in active markets for identical assets and liabilities. Level 2 includes other significant observable inputs (including quoted prices for similar securities, interest rates, prepayment speeds, credit risk, etc.). Level 3 includes significant unobservable inputs (including the Series’ own assumptions in determining the fair value of investments). A financial instrument’s level within the fair value hierarchy is based on the lowest level of any input both individually and in aggregate that is significant to the fair value measurement. The inputs or methodology used for valuing securities are not necessarily an indication of the risk associated with investing in those securities.
The following is a summary of the valuation levels used for major security types as of June 30, 2015 in valuing the Series’ assets or liabilities carried at fair value:
| | | | | | | | | | | | | | | | |
| DESCRIPTION | | TOTAL | | | LEVEL 1 | | | LEVEL 2 | | | LEVEL 3 | |
Debt securities: | | | | | | | | | | | | | | | | |
Loan assignments | | $ | 48,771,686 | | | $ | — | | | $ | 48,771,686 | | | $ | — | |
U.S. Treasury and other U.S. Government agencies | | | 21,443,335 | | | | — | | | | 21,443,335 | | | | — | |
Corporate debt: | | | | | | | | | | | | | | | | |
Consumer Discretionary | | | 59,329,383 | | | | — | | | | 59,329,383 | | | | — | |
Consumer Staples | | | 11,076,356 | | | | — | | | | 11,076,356 | | | | — | |
Energy | | | 52,277,816 | | | | — | | | | 52,277,816 | | | | — | |
Financials | | | 228,408,140 | | | | — | | | | 228,408,140 | | | | — | |
Health Care | | | 15,970,134 | | | | — | | | | 15,970,134 | | | | — | |
Industrials | | | 56,308,995 | | | | — | | | | 56,308,995 | | | | — | |
Information Technology | | | 20,537,815 | | | | — | | | | 20,537,815 | | | | — | |
Materials | | | 19,740,305 | | | | — | | | | 19,740,305 | | | | — | |
Telecommunication Services | | | 17,010,338 | | | | — | | | | 17,010,338 | | | | — | |
Utilities | | | 5,783,348 | | | | — | | | | 5,783,348 | | | | — | |
Asset-backed securities | | | 14,101,662 | | | | — | | | | 14,101,662 | | | | — | |
Commercial mortgage-backed securities | | | 75,386,987 | | | | — | | | | 75,386,987 | | | | — | |
Foreign government bonds | | | 25,552,050 | | | | — | | | | 25,552,050 | | | | — | |
23
Unconstrained Bond Series
Notes to Financial Statements (continued)
(unaudited)
| 2. | Significant Accounting Policies (continued) |
Security Valuation (continued)
| | | | | | | | | | | | | | | | |
| DESCRIPTION | | TOTAL | | | LEVEL 1 | | | LEVEL 2 | | | LEVEL 3 | |
Mutual funds | | $ | 61,509,076 | | | $ | 61,509,076 | | | $ | — | | | $ | — | |
| | | | | | | | | | | | | | | | |
Total assets | | $ | 733,207,426 | | | $ | 61,509,076 | | | $ | 671,698,350 | | | $ | — | |
| | | | | | | | | | | | | | | | |
There were no Level 3 securities held by the Series as of December 31, 2014 or June 30, 2015.
The Fund’s policy is to recognize transfers in and transfers out of the valuation levels as of the beginning of the reporting period. There were no transfers between Level 1 and Level 2 during the six months ended June 30, 2015.
Security Transactions, Investment Income and Expenses
Security transactions are accounted for on trade date. Dividend income is recorded on the ex-dividend date, except that if the ex-dividend date has passed, certain dividends from foreign securities are recorded as soon as the Series is informed of the ex-dividend date. Non-cash dividends, if any, are recorded at the fair value of the securities received. Interest income, including amortization of premium and accretion of discounts using the effective interest method, is earned from settlement date and accrued daily.
Expenses are recorded on an accrual basis. Most expenses of the Fund can be attributed to a specific series. Expenses which cannot be directly attributed are apportioned among the series in the Fund in such a manner as deemed equitable by the Fund’s Board, taking into consideration, among other things, the nature and type of expense. Income, expenses (other than shareholder services fees), and realized and unrealized gains and losses are prorated among the classes based on the relative net assets of each class. Class specific examples are directly charged to that class.
The Series uses the identified cost method for determining realized gain or loss on investments for both financial statement and federal income tax reporting purposes.
Foreign Currency Translation
The books and records of the Series are maintained in U.S. dollars. Foreign currencies, investments and other assets and liabilities are translated into U.S. dollars at the current exchange rates. Purchases and sales of investment securities and income and expenses are translated on the respective dates of such transactions. The Series does not isolate realized and unrealized gains and losses attributable to changes in the exchange rates from gains and losses that arise from changes in the fair value of investments. Such fluctuations are included with net realized and unrealized gain or loss on investments. Net realized foreign currency gains and losses represent foreign currency gains and losses between trade date and settlement date on securities transactions, gains and losses on disposition of foreign currencies and the difference between the amount of income and foreign withholding taxes recorded on the books of the Series and the amounts actually received or paid.
Forward Foreign Currency Exchange Contracts
The Series may purchase or sell forward foreign currency exchange contracts in order to hedge a portfolio position or specific transaction. Risks may arise if the counterparties to a contract are unable to meet the terms of the contract or if the value of the foreign currency moves unfavorably.
All forward foreign currency exchange contracts are adjusted daily by the exchange rate of the underlying currency and, for financial statement purposes, any gain or loss is recorded as unrealized gain or loss until a contract has been closed.
The Series may regularly trade forward foreign currency exchange contracts with off-balance sheet risk in the normal course of its investing activities to assist in managing exposure to changes in foreign currency exchange rates.
The notional or contractual amount of these instruments represents the investment the Series has in forward foreign currency exchange contracts and does not necessarily represent the amounts potentially at risk. The measurement of the risks
24
Unconstrained Bond Series
Notes to Financial Statements (continued)
(unaudited)
| 2. | Significant Accounting Policies (continued) |
Forward Foreign Currency Exchange Contracts (continued)
associated with forward foreign currency exchange contracts is meaningful only when all related and offsetting transactions are considered. The Series did not hold any forward foreign currency exchange contracts during the six months ended June 30, 2015.
Securities Purchased on a When-Issued Basis or Forward Commitment
The Series may purchase securities on a when-issued basis or forward commitment. These transactions involve a commitment by the Series to purchase securities for a predetermined price with payment and delivery taking place beyond the customary settlement period. When such purchases are outstanding, the Series will designate liquid assets in an amount sufficient to meet the purchase price. When purchasing a security on a delayed delivery basis, the Series assumes the rights and risks of ownership of the security, including the risk of price and yield fluctuations, and takes such fluctuations into account when determining its net asset value. The Series may sell the when-issued securities before they are delivered, which may result in a capital gain or loss. No such investments were held by the Series on June 30, 2015.
In connection with its ability to purchase or sell securities on a forward commitment basis, the Series may enter into forward roll transactions principally using To Be Announced (TBA) securities. Forward roll transactions require the sale of securities for delivery in the current month, and a simultaneous agreement to repurchase substantially similar (same type, coupon and maturity) securities on a specified future date. Risks of entering into forward roll transactions include the potential inability of the counterparty to meet the terms of the agreement; the potential of the Series to receive inferior securities at redelivery as compared to the securities sold to the counterparty; counterparty credit risk; and the potential pay down speed variance between the mortgage-backed pools. During the roll period, the Series forgoes principal and interest paid on the securities. The Series accounts for such dollar rolls as purchases and sales. Information regarding securities purchased on a when-issued basis is included in the Series’ Investment Portfolio. No such investments were held by the Series on June 30, 2015.
Restricted Securities
Restricted securities are purchased in private placement transactions, are not registered under the Securities Act of 1933, as amended, and may have contractual restrictions on resale. Information regarding restricted securities is included at the end of the Series’ Investment Portfolio.
Illiquid Securities
A security may be considered illiquid if so deemed in good faith by the Advisor under procedures approved by and under the general supervision and responsibility of the Fund’s Board. Securities that are illiquid are marked with the applicable footnote on the Investment Portfolio. No such investments were held by the Series on June 30, 2015.
Federal Taxes
The Series’ policy is to comply with the provisions of the Internal Revenue Code applicable to regulated investment companies. The Series is not subject to federal income tax or excise tax to the extent that the Series distributes to shareholders each year its taxable income, including any net realized gains on investments, in accordance with requirements of the Internal Revenue Code. Accordingly, no provision for federal income tax or excise tax has been made in the financial statements.
Management evaluates its tax positions to determine if the tax positions taken meet the minimum recognition threshold in connection with accounting for uncertainties in income tax positions taken or expected to be taken for the purposes of measuring and recognizing tax liabilities in the financial statements. Recognition of tax benefits of an uncertain tax position is required only when the position is “more likely than not” to be sustained assuming examination by taxing authorities. At June 30, 2015, the Series has recorded no liability for net unrecognized tax benefits relating to uncertain income tax positions taken or expected to be taken in future tax returns.
The Series files income tax returns in the U.S. federal jurisdiction, various states and foreign jurisdictions, as required. No income tax returns are currently under investigation. The statute of limitations on the Series’ tax returns remains open for the years ended December 31, 2011 through December 31, 2014. The Series is not aware of any tax positions for which it is reasonably possible that the total amounts of unrecognized tax benefits will significantly change in the next twelve months.
25
Unconstrained Bond Series
Notes to Financial Statements (continued)
(unaudited)
| 2. | Significant Accounting Policies (continued) |
Foreign Taxes
Based on the Series’ understanding of the tax rules and rates related to income, gains and currency purchase/repatriation transactions for foreign jurisdictions in which it invests, the Series will provide for foreign taxes, and where appropriate, deferred foreign tax.
Distributions of Income and Gains
Distributions to shareholders of net investment income are made quarterly. Distributions of net realized gains are made annually. An additional distribution may be necessary to avoid taxation of the Series. Distributions are recorded on the ex-dividend date.
Indemnifications
The Fund’s organizational documents provide former and current directors and officers with a limited indemnification against liabilities arising in connection with the performance of their duties to the Fund. In the normal course of business, the Fund may also enter into contracts that provide general indemnifications. The Fund’s maximum exposure under these arrangements is unknown as this would be dependent on future claims that may be made against the Fund. The risk of material loss from such claims is considered remote.
Other
The preparation of financial statements in conformity with GAAP requires management to make estimates and assumptions that affect the reported amounts of assets and liabilities and the disclosure of contingent assets and liabilities at the date of the financial statements and the reported amounts of income and expenses during the reporting period. Actual results could differ from those estimates.
| 3. | Transactions with Affiliates |
The Fund has an Investment Advisory Agreement (the “Agreement”) with the Advisor, for which the Series pays a fee, computed daily and payable monthly, at an annual rate of 0.45% of the Series’ average daily net assets.
Under the Agreement, personnel of the Advisor provide the Series with advice and assistance in the choice of investments and the execution of securities transactions, and otherwise maintain the Series’ organization. The Advisor also provides the Fund with necessary office space and fund administration and support services. The salaries of all officers of the Fund (except a percentage of the Fund’s Chief Compliance Officer’s salary, which is paid by the Fund), and of all Directors who are “affiliated persons” of the Fund, or of the Advisor, and all personnel of the Fund, or of the Advisor, performing services relating to research, statistical and investment activities, are paid by the Advisor. Each “non-affiliated” Director receives an annual stipend, which is allocated among all the active series of the Fund. In addition, these Directors also receive a fee per Board meeting attended plus a fee for each committee meeting attended and are reimbursed for travel and other out-of-pocket expenses incurred by them in connection with attending such meetings. The Fund also has an Audit Committee Chair, who receives an additional annual stipend for this role.
The Class S shares of the Series are subject to a shareholder services fee in accordance with a shareholder services plan adopted by the Fund’s Board. The shareholder services fee is intended to compensate financial intermediaries, including affiliates of the Fund, in connection with the provision of direct client service, personal services, maintenance of shareholder accounts and reporting services. For these services, Class S of the Series pays a fee, computed daily and payable monthly, at an annual rate of 0.25% of the average daily net assets of Class S. The Fund has a Shareholder Services Agreement with the Advisor, for which the Advisor receives the shareholder services fee as stated above.
The Advisor has contractually agreed, until at least April 30, 2016, to waive its fee and, if necessary, pay other operating expenses of the Series in order to maintain total direct annual fund operating expenses for the Series, exclusive of each share class’ shareholder services fee, at no more than 0.50% of average daily net assets each year. For the six months ended June 30, 2015, the Advisor waived fees of $2,802, which is included as a reduction of expenses on the Statement of Operations. The Advisor is not eligible to recoup any expenses that have been waived or reimbursed in prior years.
26
Unconstrained Bond Series
Notes to Financial Statements (continued)
(unaudited)
| 3. | Transactions with Affiliates (continued) |
Manning & Napier Investor Services, Inc., a registered broker-dealer affiliate of the Advisor, acts as distributor for the Fund’s shares. The services of Manning & Napier Investor Services, Inc. are provided at no additional cost to the Series.
Pursuant to a master services agreement dated November 1, 2014, the Fund pays the Advisor an annual fee related to fund accounting and administration of 0.0085% on the first $25 billion of average daily net assets (excluding Target Series and Strategic Income Series); 0.0075% on the next $15 billion of average daily net assets (excluding Target Series and Strategic Income Series); and 0.0065% of the average daily net assets in excess of $40 billion (excluding Target Series and Strategic Income Series); plus a base fee of $30,400 per series. Transfer agent fees are charged to the Fund on a per account basis. Additionally, certain transaction and out-of-pocket expenses, including charges for reporting relating to the Fund’s compliance program, are charged. The Advisor has agreements with BNY Mellon Investment Servicing (U.S.) Inc. (“BNY”) under which BNY serves as sub-accountant services agent and sub-transfer agent.
Expenses not directly attributable to a series are allocated based on each Series’ relative net assets or number of accounts, depending on the expense.
| 4. | Purchases and Sales of Securities |
For the six months ended June 30, 2015, purchases and sales of securities, other than U.S. Government securities and short-term securities, were $437,930,723 and $445,019,248, respectively. Purchases and sales of U.S. Government securities, other than short-term securities, were $69,798,446 and $70,893,821, respectively.
| 5. | Capital Stock Transactions |
Transactions in shares of Class S and Class I of Unconstrained Bond Series were:
| | | | | | | | | | | | | | | | |
| CLASS S: | | FOR THE SIX MONTHS ENDED 6/30/15 | | | FOR THE YEAR ENDED 12/31/14 | |
| | | SHARES | | | AMOUNT | | | SHARES | | | AMOUNT | |
Sold | | | 5,233,282 | | | $ | 55,539,579 | | | | 9,467,982 | | | $ | 102,470,115 | |
Reinvested | | | 726,961 | | | | 7,643,369 | | | | 2,604,702 | | | | 27,789,942 | |
Repurchased | | | (5,562,947 | ) | | | (58,968,183 | ) | | | (8,805,748 | ) | | | (95,274,990 | ) |
| | | | | | | | | | | | | | | | |
Total | | | 397,296 | | | $ | 4,214,765 | | | | 3,266,936 | | | $ | 34,985,067 | |
| | | | | | | | | | | | | | | | |
| | | | | | | | | | | | | | | | |
| CLASS I: | | FOR THE SIX MONTHS ENDED 6/30/15 | | | FOR THE YEAR ENDED 12/31/14 | |
| | | SHARES | | | AMOUNT | | | SHARES | | | AMOUNT | |
Sold | | | 1,749,102 | | | $ | 16,779,950 | | | | 6,679,760 | | | $ | 65,876,921 | |
Reinvested | | | 58,681 | | | | 557,539 | | | | 205,053 | | | | 1,971,555 | |
Repurchased | | | (5,896,459 | ) | | | (56,498,537 | ) | | | (596,521 | ) | | | (5,855,825 | ) |
| | | | | | | | | | | | | | | | |
Total | | | (4,088,676 | ) | | $ | (39,161,048 | ) | | | 6,288,292 | | | $ | 61,992,651 | |
| | | | | | | | | | | | | | | | |
Over 90% of the shares outstanding are fiduciary accounts where the Advisor has sole investment discretion. No shareholder exceeds the 10% threshold.
| 6. | Financial Instruments and Loan Assignments |
The Series may trade in instruments including written and purchased options, forward foreign currency exchange contracts and futures contracts and other derivatives in the normal course of investing activities to assist in managing exposure to various market risks. The Series may be subject to various elements of risk, which may involve, to a varying degree, elements of risk in excess of the amounts recognized for financial statement purposes. These risks include: the risk that changes in the value of a derivative may not correlate perfectly with the underlying asset, rate or index; counterparty credit risk related to over the counter derivative counterparties’ failure to perform under contract terms; liquidity risk related to the lack of a liquid market for these
27
Unconstrained Bond Series
Notes to Financial Statements (continued)
(unaudited)
| 6. | Financial Instruments and Loan Assignments (continued) |
contracts allowing the fund to close out its position(s); and documentation risk relating to disagreement over contract terms. No such investments were held by the Series as of June 30, 2015.
The Series may invest in a loan assignment of all or a portion of the loans. The Series has direct rights against the borrower on a loan when it purchases an assignment; however, the Series’ rights may be more limited than the lender from which it acquired the assignment and the Series may be able to enforce its rights only through an administrative agent. Loan assignments are vulnerable to market conditions and may become illiquid due to economic conditions or other events may reduce the demand for loan assignments and certain loan assignments which were liquid when purchased may become illiquid. Loan assignment investments held by the Series as of June 30, 2015 are disclosed in the Investment Portfolio.
Investing in securities of foreign companies and foreign governments involves special risks and considerations not typically associated with investing in securities of domestic companies and the U.S. Government. These risks include revaluation of currencies and future adverse political and economic developments. Moreover, securities of foreign companies and foreign governments and their markets may be less liquid and their prices more volatile than those of comparable domestic companies and the U.S. Government.
| 8. | Federal Income Tax Information |
The amount and characterization of certain income and capital gains to be distributed are determined in accordance with federal income tax regulations, which may differ from GAAP. The Series may periodically make reclassifications among its capital accounts to reflect income and gains available for distribution (or available capital loss carryovers) under income tax regulations without impacting the Series’ net asset value. Any such reclassifications are not reflected in the financial highlights.
The final determination of the tax character of current year distributions will be made at the conclusion of the fiscal year. The tax character of distributions paid for the year ended December 31, 2014 were as follows:
| | | | | | |
Ordinary income | | $ | 23,011,079 | | | |
Long-term capital gains | | | 8,820,822 | | | |
At June 30, 2015, the identified cost for federal income tax purposes, the resulting gross unrealized appreciation and depreciation, and the net unrealized depreciation were as follows:
| | | | | | |
Cost for federal income tax purposes | | $ | 738,803,270 | | | |
Unrealized appreciation | | | 7,225,985 | | | |
Unrealized depreciation | | | (12,821,829 | ) | | |
| | | | | | |
Net unrealized depreciation | | $ | (5,595,844 | ) | | |
| | | | | | |
28
{This page intentionally left blank}
29
Unconstrained Bond Series
Literature Requests
(unaudited)
Proxy Voting Policies and Procedures
A description of the policies and procedures that the Fund uses to determine how to vote proxies relating to portfolio securities is available, without charge, upon request:
| | |
| By phone | | 1-800-466-3863 |
| On the Securities and Exchange | | |
| Commission’s (SEC) web site | | http://www.sec.gov |
Proxy Voting Record
Information regarding how the Fund voted proxies relating to portfolio securities during the most recent 12-month period ended June 30th is available, without charge, upon request:
| | |
| By phone | | 1-800-466-3863 |
| On the SEC’s web site | | http://www.sec.gov |
Quarterly Portfolio Holdings
The Series’ complete schedule of portfolio holdings for the 1st and 3rd quarters of each fiscal year are provided on Form N-Q, and are available, without charge, upon request:
| | |
| By phone | | 1-800-466-3863 |
| On the SEC’s web site | | http://www.sec.gov |
The Series’ Form N-Q may be reviewed and copied at the SEC’s Public Reference Room in Washington, D.C. Information on the operation of the Public Reference Room may be obtained by calling 1-800-SEC-0330.
Prospectus and Statement of Additional Information (SAI)
For more information about any of the Manning & Napier Fund, Inc. Series, you may obtain a prospectus and SAI at www.manning-napier.com or by calling (800) 466-3863. Before investing, carefully consider the objectives, risks, charges and expenses of the investment and read the prospectus carefully as it contains this and other information about the investment company. In addition, this information can be found on the SEC’s web site, http://www.sec.gov.
Additional information available at www.manning-napier.com
1. Fund Holdings - Month-End
2. Fund Holdings - Quarter-End
3. Shareholder Report - Annual
4. Shareholder Report - Semi-Annual
The Fund also offers electronic notification or “e-delivery” when certain documents are available on-line to be downloaded or reviewed. Direct shareholders can elect to receive electronic notification when shareholder reports, prospectus updates, and/or statements are available. If you do not currently have on-line access to your account, you can establish access by going to www.manning-napier.com, click on “Login” in the top corner of the page, and follow the prompts to self-enroll. Once enrolled, you can set your electronic notification preferences by clicking on the Account Options tab located within the green toolbar and then select E-Delivery Option. Should you have any questions on either how to establish on-line access or how to update your account settings, please contact Investor Services at 1-800-466-3863.
The Manning & Napier Fund, Inc. is managed by Manning & Napier Advisors, LLC. Manning & Napier Investor Services, Inc., an affiliate of Manning & Napier Advisors, LLC, is the distributor of the Fund shares.
MNCPB-6/15-SAR

High Yield Bond Series
Shareholder Expense Example
(unaudited)
As a shareholder of the Series, you may incur two types of costs: (1) transaction costs and (2) ongoing costs, including management fees and other Series expenses. This example is intended to help you understand your ongoing costs (in dollars) of investing in the Series and to compare these costs with the ongoing costs of investing in other mutual funds.
The example is based on an investment of $1,000 invested in each class at the beginning of the period and held for the entire period (January 1, 2015 to June 30, 2015).
Actual Expenses
The Actual lines of the table below provide information about actual account values and actual expenses. You may use the information in this line, together with the amount you invested, to estimate the expenses that you paid over the period. Simply divide your account value by $1,000 (for example, an $8,600 account value divided by $1,000 = 8.6), then multiply the result by the number in the Actual line for the Class in which you have invested under the heading entitled “Expenses Paid During Period” to estimate the expenses you paid on your account during this period.
Hypothetical Example for Comparison Purposes
The Hypothetical lines of each Class in the table below provide information about hypothetical account values and hypothetical expenses based on the Class’ actual expense ratio and an assumed rate of return of 5% per year before expenses, which is not the Class’ actual return. The hypothetical account values and expenses may not be used to estimate the actual ending account balance or expenses you paid during the period. You may use this information to compare the ongoing costs of investing in the Series and other funds. To do so, compare this 5% hypothetical example with the 5% hypothetical examples that appear in the shareholder reports of the other funds.
Please note that the expenses shown in the table are meant to highlight your ongoing costs only and do not reflect any transaction costs. Therefore, the Hypothetical lines for each Class in the table are useful in comparing ongoing costs only, and will not help you determine the relative total costs of owning different funds. In addition, if these transaction costs were included, your costs would have been higher.
| | | | | | | | |
| | | BEGINNING ACCOUNT VALUE 1/1/15 | | ENDING ACCOUNT VALUE 6/30/15 | | EXPENSES PAID DURING PERIOD* 1/1/15-6/30/15 | | ANNUALIZED EXPENSE RATIO |
Class S | | | | | | | | |
Actual | | $1,000.00 | | $1,031.00 | | $5.44 | | 1.08% |
Hypothetical | | | | | | | | |
(5% return before expenses) | | $1,000.00 | | $1,019.44 | | $5.41 | | 1.08% |
Class I | | | | | | | | |
Actual | | $1,000.00 | | $1,032.60 | | $4.18 | | 0.83% |
Hypothetical | | | | | | | | |
(5% return before expenses) | | $1,000.00 | | $1,020.68 | | $4.16 | | 0.83% |
*Expenses are equal to each Class’ annualized expense ratio (for the six-month period), multiplied by the average account value over the period, multiplied by 181/365 (to reflect the one-half year period). Expenses are based on the most recent fiscal half year.
1
High Yield Bond Series
Portfolio Composition as of June 30, 2015
(unaudited)
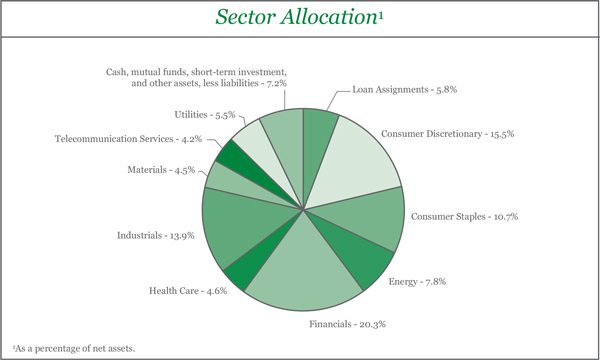
2
High Yield Bond Series
Investment Portfolio - June 30, 2015
(unaudited)
| | | | | | | | | | | | |
| | | | | | |
| | | CREDIT
RATING1 | | | | PRINCIPAL AMOUNT | | | | VALUE (NOTE 2) | | |
| | | | | | |
LOAN ASSIGNMENTS - 5.8% | | | | | | | | | | | | |
| | | | | | |
CPI International, Inc., 1st Lien Term Loan B2 , 4.25%, 11/17/2017 | | B3 | | | | $ 2,977,387 | | | | $ 2,966,222 | | |
Crown Castle Operating Co., 1st Lien Term Loan B22, 3.00%, 1/31/2021 | | BBB3 | | | | 3,939,992 | | | | 3,914,657 | | |
NRG Energy, Inc. Term B2, 2.75%, 7/1/2018 | | BB3 | | | | 3,944,521 | | | | 3,910,322 | | |
Valeant Pharmaceuticals International, Inc., Term Loan D22, 3.50%, 2/13/2019 | | Ba1 | | | | 4,000,000 | | | | 3,988,320 | | |
| | | | | | | | | | | | |
| | | | | | |
TOTAL LOAN ASSIGNMENTS | | | | | | | | | | | | |
(Identified Cost $14,831,134) | | | | | | | | | | 14,779,521 | | |
| | | | | | | | | | | | |
| | | | | | |
CORPORATE BONDS - 87.0% | | | | | | | | | | | | |
| | | | | | |
Non-Convertible Corporate Bonds - 87.0% | | | | | | | | | | | | |
Consumer Discretionary - 15.5% | | | | | | | | | | | | |
Auto Components - 2.0% | | | | | | | | | | | | |
Icahn Enterprises LP - Icahn Enterprises Finance Corp., 5.875%, 2/1/2022 | | Ba3 | | | | 2,455,000 | | | | 2,501,031 | | |
Techniplas LLC4, 10.00%, 5/1/2020 | | Caa1 | | | | 2,580,000 | | | | 2,599,350 | | |
| | | | | | | | | | | | |
| | | | | | |
| | | | | | | | | | 5,100,381 | | |
| | | | | | | | | | | | |
Hotels, Restaurants & Leisure - 1.0% | | | | | | | | | | | | |
International Game Technology plc (United Kingdom)4, 6.25%, 2/15/2022 | | Ba2 | | | | 2,635,000 | | | | 2,516,425 | | |
| | | | | | | | | | | | |
Household Durables - 6.1% | | | | | | | | | | | | |
Brookfield Residential Properties, Inc. - Brookfield Residential US Corp. (Canada)4, 6.125%, 7/1/2022 | | B1 | | | | 4,601,000 | | | | 4,531,985 | | |
Brookfield Residential Properties, Inc. (Canada)4, 6.375%, 5/15/2025 | | B1 | | | | 525,000 | | | | 514,500 | | |
Meritage Homes Corp., 7.15%, 4/15/2020 | | Ba3 | | | | 1,460,000 | | | | 1,576,800 | | |
Meritage Homes Corp., 7.00%, 4/1/2022 | | Ba3 | | | | 2,250,000 | | | | 2,401,875 | | |
TRI Pointe Holdings, Inc., 4.375%, 6/15/2019 | | B1 | | | | 3,820,000 | | | | 3,743,600 | | |
Weekley Homes LLC - Weekley Finance Corp., 6.00%, 2/1/2023 | | B2 | | | | 3,180,000 | | | | 3,005,100 | | |
| | | | | | | | | | | | |
| | | | | | |
| | | | | | | | | | 15,773,860 | | |
| | | | | | | | | | | | |
| | | | | | |
Media - 6.4% | | | | | | | | | | | | |
CCO Holdings LLC - CCO Holdings Capital Corp.4, 5.125%, 5/1/2023 | | B1 | | | | 1,760,000 | | | | 1,711,600 | | |
CCO Holdings LLC - CCO Holdings Capital Corp.4, 5.375%, 5/1/2025 | | B1 | | | | 2,055,000 | | | | 2,001,056 | | |
Cogeco Cable, Inc. (Canada)4, 4.875%, 5/1/2020 | | BB3 | | | | 3,830,000 | | | | 3,887,450 | | |
Columbus International, Inc. (Barbados)4, 7.375%, 3/30/2021 | | Ba3 | | | | 3,440,000 | | | | 3,698,000 | | |
Sirius XM Radio, Inc.4, 5.375%, 4/15/2025 | | Ba3 | | | | 2,650,000 | | | | 2,557,250 | | |
VTR Finance B.V. (Chile)4, 6.875%, 1/15/2024 | | B1 | | | | 2,480,000 | | | | 2,534,188 | | |
| | | | | | | | | | | | |
| | | | | | |
| | | | | | | | | | 16,389,544 | | |
| | | | | | | | | | | | |
| | | | | | |
Total Consumer Discretionary | | | | | | | | | | 39,780,210 | | |
| | | | | | | | | | | | |
| | | | | | |
Consumer Staples - 10.7% | | | | | | | | | | | | |
Beverages - 1.0% | | | | | | | | | | | | |
DS Services of America, Inc.4, 10.00%, 9/1/2021 | | Ba3 | | | | 2,115,000 | | | | 2,474,550 | | |
| | | | | | | | | | | | |
The accompanying notes are an integral part of the financial statements.
3
High Yield Bond Series
Investment Portfolio - June 30, 2015
(unaudited)
| | | | | | | | | | | | |
| | | | | | |
| | | CREDIT
RATING1 | | | | PRINCIPAL
AMOUNT | | | | VALUE (NOTE 2) | | |
| | | | | | |
CORPORATE BONDS (continued) | | | | | | | | | | | | |
| | | | | | |
Non-Convertible Corporate Bonds (continued) | | | | | | | | | | | | |
Consumer Staples (continued) | | | | | | | | | | | | |
Food & Staples Retailing - 3.3% | | | | | | | | | | | | |
C&S Group Enterprises LLC4, 5.375%, 7/15/2022 | | B1 | | | | $ 3,720,000 | | | | $ 3,496,800 | | |
KeHE Distributors LLC - KeHE Finance Corp.4, 7.625%, 8/15/2021 | | B3 | | | | 2,305,000 | | | | 2,420,250 | | |
Shearer’s Foods LLC - Chip Finance Corp.4, 9.00%, 11/1/2019 | | B1 | | | | 2,390,000 | | | | 2,569,250 | | |
| | | | | | | | | | | | |
| | | | | | |
| | | | | | | | | | 8,486,300 | | |
| | | | | | | | | | | | |
| | | | | | |
Food Products - 2.6% | | | | | | | | | | | | |
Kraft Heinz Foods Co., 6.75%, 3/15/2032 | | Baa3 | | | | 2,805,000 | | | | 3,295,875 | | |
Pinnacle Operating Corp.4, 9.00%, 11/15/2020 | | Caa1 | | | | 3,435,000 | | | | 3,409,237 | | |
| | | | | | | | | | | | |
| | | | | | |
| | | | | | | | | | 6,705,112 | | |
| | | | | | | | | | | | |
| | | | | | |
Household Products - 2.6% | | | | | | | | | | | | |
HRG Group, Inc., 7.875%, 7/15/2019 | | Ba3 | | | | 3,385,000 | | | | 3,571,175 | | |
HRG Group, Inc., 7.75%, 1/15/2022 | | Caa1 | | | | 3,100,000 | | | | 3,022,500 | | |
| | | | | | | | | | | | |
| | | | | | |
| | | | | | | | | | 6,593,675 | | |
| | | | | | | | | | | | |
| | | | | | |
Tobacco - 1.2% | | | | | | | | | | | | |
Vector Group Ltd., 7.75%, 2/15/2021 | | Ba3 | | | | 2,970,000 | | | | 3,177,900 | | |
| | | | | | | | | | | | |
| | | | | | |
Total Consumer Staples | | | | | | | | | | 27,437,537 | | |
| | | | | | | | | | | | |
Energy - 7.8% | | | | | | | | | | | | |
Energy Equipment & Services - 4.0% | | | | | | | | | | | | |
Calfrac Holdings LP (Canada)4, 7.50%, 12/1/2020 | | B3 | | | | 2,470,000 | | | | 2,280,798 | | |
FTS International, Inc., 6.25%, 5/1/2022 | | Caa2 | | | | 2,470,000 | | | | 1,815,450 | | |
Parker Drilling Co., 6.75%, 7/15/2022 | | B1 | | | | 2,325,000 | | | | 2,005,313 | | |
Seventy Seven Operating LLC, 6.625%, 11/15/2019 | | B3 | | | | 2,395,000 | | | | 1,892,050 | | |
Shelf Drilling Holdings Ltd. (United Arab Emirates)4, 8.625%, 11/1/2018 | | Ba3 | | | | 2,590,000 | | | | 2,305,100 | | |
| | | | | | | | | | | | |
| | | | | | |
| | | | | | | | | | 10,298,711 | | |
| | | | | | | | | | | | |
| | | | | | |
Oil, Gas & Consumable Fuels - 3.8% | | | | | | | | | | | | |
Energy XXI Gulf Coast, Inc., 7.50%, 12/15/2021 | | Caa3 | | | | 2,445,000 | | | | 788,513 | | |
PBF Holding Co. LLC - PBF Finance Corp., 8.25%, 2/15/2020 | | Ba3 | | | | 2,435,000 | | | | 2,575,013 | | |
Sabine Pass Liquefaction LLC, 5.625%, 2/1/2021 | | Ba3 | | | | 4,155,000 | | | | 4,238,100 | | |
WPX Energy, Inc., 6.00%, 1/15/2022 | | Ba1 | | | | 2,250,000 | | | | 2,221,875 | | |
| | | | | | | | | | | | |
| | | | | | |
| | | | | | | | | | 9,823,501 | | |
| | | | | | | | | | | | |
| | | | | | |
Total Energy | | | | | | | | | | 20,122,212 | | |
| | | | | | | | | | | | |
Financials - 20.3% | | | | | | | | | | | | |
Banks - 4.9% | | | | | | | | | | | | |
CIT Group, Inc., 5.25%, 3/15/2018 | | B1 | | | | 2,535,000 | | | | 2,620,556 | | |
Citigroup, Inc.2,5, 5.95% | | Ba2 | | | | 2,505,000 | | | | 2,417,826 | | |
Lloyds Bank plc (United Kingdom)4,5,6, 12.00% | | Ba1 | | | | 1,015,000 | | | | 1,451,450 | | |
Popular, Inc., 7.00%, 7/1/2019 | | B1 | | | | 4,840,000 | | | | 4,840,000 | | |
Royal Bank of Scotland Group plc (United Kingdom), 6.10%, 6/10/2023 | | Ba2 | | | | 1,170,000 | | | | 1,243,987 | | |
| | | | | | | | | | | | |
| | | | | | |
| | | | | | | | | | 12,573,819 | | |
| | | | | | | | | | | | |
The accompanying notes are an integral part of the financial statements.
4
High Yield Bond Series
Investment Portfolio - June 30, 2015
(unaudited)
| | | | | | | | | | | | |
| | | | | | |
| | | CREDIT
RATING1 | | | | PRINCIPAL AMOUNT | | | | VALUE (NOTE 2) | | |
| | | | | | |
CORPORATE BONDS (continued) | | | | | | | | | | | | |
| | | | | | |
Non-Convertible Corporate Bonds (continued) | | | | | | | | | | | | |
Financials (continued) | | | | | | | | | | | | |
Capital Markets - 1.5% | | | | | | | | | | | | |
Drawbridge Special Opportunities Fund LP - Drawbridge Special Opportunities Finance4, 5.00%, 8/1/2021 | | BBB3 | | | | $ 3,725,000 | | | | $ 3,725,000 | | |
| | | | | | | | | | | | |
| | | | | | |
Consumer Finance - 2.7% | | | | | | | | | | | | |
CNG Holdings, Inc.4, 9.375%, 5/15/2020 | | Caa1 | | | | 2,600,000 | | | | 1,885,000 | | |
Navient Corp., 6.125%, 3/25/2024 | | Ba3 | | | | 5,365,000 | | | | 5,136,988 | | |
| | | | | | | | | | | | |
| | | | | | |
| | | | | | | | | | 7,021,988 | | |
| | | | | | | | | | | | |
| | | | | | |
Diversified Financial Services - 2.0% | | | | | | | | | | | | |
Jefferies Finance LLC - JFIN Co-Issuer Corp.4, 7.375%, 4/1/2020 | | B1 | | | | 2,970,000 | | | | 2,918,025 | | |
Jefferies Finance LLC - JFIN Co-Issuer Corp.4, 6.875%, 4/15/2022 | | B1 | | | | 2,400,000 | | | | 2,340,000 | | |
| | | | | | | | | | | | |
| | | | | | |
| | | | | | | | | | 5,258,025 | | |
| | | | | | | | | | | | |
| | | | | | |
Real Estate Investment Trusts (REITS) - 4.0% | | | | | | | | | | | | |
DuPont Fabros Technology LP, 5.875%, 9/15/2021 | | Ba1 | | | | 4,595,000 | | | | 4,652,437 | | |
Qualitytech LP - QTS Finance Corp., 5.875%, 8/1/2022 | | B2 | | | | 2,437,000 | | | | 2,449,185 | | |
Rialto Holdings LLC - Rialto Corp.4, 7.00%, 12/1/2018 | | B2 | | | | 3,085,000 | | | | 3,208,400 | | |
| | | | | | | | | | | | |
| | | | | | |
| | | | | | | | | | 10,310,022 | | |
| | | | | | | | | | | | |
| | | | | | |
Real Estate Management & Development - 2.0% | | | | | | | | | | | | |
Forestar USA Real Estate Group, Inc.4, 8.50%, 6/1/2022 | | B2 | | | | 2,350,000 | | | | 2,438,125 | | |
Greystar Real Estate Partners LLC4, 8.25%, 12/1/2022 | | B2 | | | | 2,500,000 | | | | 2,637,500 | | |
| | | | | | | | | | | | |
| | | | | | |
| | | | | | | | | | 5,075,625 | | |
| | | | | | | | | | | | |
| | | | | | |
Thrifts & Mortgage Finance - 3.2% | | | | | | | | | | | | |
Ladder Capital Finance Holdings LLLP - Ladder Capital Finance Corp., 7.375%, 10/1/2017 | | Ba3 | | | | 3,125,000 | | | | 3,257,813 | | |
Ladder Capital Finance Holdings LLLP - Ladder Capital Finance Corp.4, 5.875%, 8/1/2021 | | Ba3 | | | | 3,335,000 | | | | 3,243,287 | | |
Prospect Holding Co. LLC - Prospect Holding Finance Co.4, 10.25%, 10/1/2018 | | B2 | | | | 2,470,000 | | | | 1,630,200 | | |
| | | | | | | | | | | | |
| | | | | | |
| | | | | | | | | | 8,131,300 | | |
| | | | | | | | | | | | |
| | | | | | |
Total Financials | | | | | | | | | | 52,095,779 | | |
| | | | | | | | | | | | |
| | | | | | |
Health Care - 4.6% | | | | | | | | | | | | |
Health Care Equipment & Supplies - 0.6% | | | | | | | | | | | | |
Halyard Health, Inc.4, 6.25%, 10/15/2022 | | B2 | | | | 1,380,000 | | | | 1,445,550 | | |
| | | | | | | | | | | | |
| | | | | | |
Health Care Providers & Services - 1.1% | | | | | | | | | | | | |
Fresenius US Finance II, Inc. (Germany)4, 9.00%, 7/15/2015 | | Ba1 | | | | 2,925,000 | | | | 2,929,680 | | |
| | | | | | | | | | | | |
| | | | | | |
Pharmaceuticals - 2.9% | | | | | | | | | | | | |
Concordia Healthcare Corp. (Canada)4, 7.00%, 4/15/2023 | | B3 | | | | 2,500,000 | | | | 2,500,000 | | |
Horizon Pharma Financing, Inc.4, 6.625%, 5/1/2023 | | B2 | | | | 2,500,000 | | | | 2,606,250 | | |
The accompanying notes are an integral part of the financial statements.
5
High Yield Bond Series
Investment Portfolio - June 30, 2015
(unaudited)
| | | | | | | | | | | | |
| | | | | | |
| | | CREDIT
RATING1 | | | | PRINCIPAL
AMOUNT | | | | VALUE (NOTE 2) | | |
| | | | | | |
CORPORATE BONDS (continued) | | | | | | | | | | | | |
| | | | | | |
Non-Convertible Corporate Bonds (continued) | | | | | | | | | | | | |
Health Care (continued) | | | | | | | | | | | | |
Pharmaceuticals (continued) | | | | | | | | | | | | |
Mallinckrodt International Finance S.A. - Mallinckrodt CB LLC4, 5.50%, 4/15/2025 | | B1 | | | | $ 2,500,000 | | | | $ 2,425,000 | | |
| | | | | | | | | | | | |
| | | | | | |
| | | | | | | | | | 7,531,250 | | |
| | | | | | | | | | | | |
| | | | | | |
Total Health Care | | | | | | | | | | 11,906,480 | | |
| | | | | | | | | | | | |
| | | | | | |
Industrials - 13.9% | | | | | | | | | | | | |
Aerospace & Defense - 1.4% | | | | | | | | | | | | |
DigitalGlobe, Inc.4, 5.25%, 2/1/2021 | | B1 | | | | 3,779,000 | | | | 3,698,696 | | |
| | | | | | | | | | | | |
| | | | | | |
Air Freight & Logistics - 1.0% | | | | | | | | | | | | |
Neovia Logistics Intermediate Holdings LLC - Logistics Intermediate Finance Corp.4,7, 10.00%, 2/15/2018 | | Caa2 | | | | 2,485,000 | | | | 2,472,575 | | |
| | | | | | | | | | | | |
| | | | | | |
Airlines - 2.3% | | | | | | | | | | | | |
Allegiant Travel Co., 5.50%, 7/15/2019 | | B1 | | | | 3,645,000 | | | | 3,672,338 | | |
Delta Air Lines Pass-Through Trust, Series 2010-1, Class B4, 6.375%, 1/2/2016 | | Baa3 | | | | 2,290,000 | | | | 2,341,525 | | |
| | | | | | | | | | | | |
| | | | | | |
| | | | | | | | | | 6,013,863 | | |
| | | | | | | | | | | | |
| | | | | | |
Commercial Services & Supplies - 1.8% | | | | | | | | | | | | |
Constellis Holdings LLC - Constellis Finance Corp.4, 9.75%, 5/15/2020 | | B3 | | | | 2,590,000 | | | | 2,499,350 | | |
Modular Space Corp.4, 10.25%, 1/31/2019 | | B3 | | | | 2,390,000 | | | | 2,067,350 | | |
| | | | | | | | | | | | |
| | | | | | |
| | | | | | | | | | 4,566,700 | | |
| | | | | | | | | | | | |
| | | | | | |
Construction & Engineering - 0.1% | | | | | | | | | | | | |
Abengoa Finance S.A.U. (Spain)4, 7.75%, 2/1/2020 | | B2 | | | | 295,000 | | | | 292,050 | | |
| | | | | | | | | | | | |
| | | | | | |
Machinery - 3.4% | | | | | | | | | | | | |
CNH Industrial Capital LLC, 3.875%, 11/1/2015 | | Ba1 | | | | 2,720,000 | | | | 2,726,800 | | |
SPL Logistics Escrow LLC - SPL Logistics Finance Corp.4, 8.875%, 8/1/2020 | | B2 | | | | 2,760,000 | | | | 2,925,600 | | |
Waterjet Holdings, Inc.4, 7.625%, 2/1/2020 | | B2 | | | | 2,925,000 | | | | 3,042,000 | | |
| | | | | | | | | | | | |
| | | | | | |
| | | | | | | | | | 8,694,400 | | |
| | | | | | | | | | | | |
| | | | | | |
Trading Companies & Distributors - 3.9% | | | | | | | | | | | | |
Aircastle Ltd., 5.50%, 2/15/2022 | | Ba2 | | | | 2,446,000 | | | | 2,496,461 | | |
Fly Leasing Ltd. (Ireland), 6.75%, 12/15/2020 | | B2 | | | | 3,485,000 | | | | 3,589,550 | | |
Fly Leasing Ltd. (Ireland), 6.375%, 10/15/2021 | | B2 | | | | 1,600,000 | | | | 1,620,000 | | |
International Lease Finance Corp., 8.75%, 3/15/2017 | | Ba2 | | | | 2,000,000 | | | | 2,188,220 | | |
| | | | | | | | | | | | |
| | | | | | |
| | | | | | | | | | 9,894,231 | | |
| | | | | | | | | | | | |
| | | | | | |
Total Industrials | | | | | | | | | | 35,632,515 | | |
| | | | | | | | | | | | |
| | | | | | |
Materials - 4.5% | | | | | | | | | | | | |
Chemicals - 1.4% | | | | | | | | | | | | |
Consolidated Energy Finance S.A. (Trinidad-Tobago)4, 6.75%, 10/15/2019 | | B2 | | | | 3,610,000 | | | | 3,664,150 | | |
| | | | | | | | | | | | |
The accompanying notes are an integral part of the financial statements.
6
High Yield Bond Series
Investment Portfolio - June 30, 2015
(unaudited)
| | | | | | | | | | | | | | |
| | | CREDIT
RATING1 | | | PRINCIPAL
AMOUNT/
SHARES | | | VALUE (NOTE 2) | | | |
| | | | |
CORPORATE BONDS (continued) | | | | | | | | | | | | | | |
| | | | |
Non-Convertible Corporate Bonds (continued) | | | | | | | | | | | | | | |
Materials (continued) | | | | | | | | | | | | | | |
Containers & Packaging - 2.0% | | | | | | | | | | | | | | |
Ardagh Packaging Finance plc - Ardagh Holdings USA, Inc. (Ireland)2,4, 3.286%, 12/15/2019 | | | Ba3 | | | $ | 5,230,000 | | | $ | 5,086,175 | | | |
| | | | | | | | | | | | | | |
| | | | |
Metals & Mining - 1.1% | | | | | | | | | | | | | | |
SunCoke Energy Partners LP - SunCoke Energy Partners Finance Corp.4, 7.375%, 2/1/2020 | | | B1 | | | | 2,890,000 | | | | 2,918,900 | | | |
| | | | | | | | | | | | | | |
| | | | |
Total Materials | | | | | | | | | | | 11,669,225 | | | |
| | | | | | | | | | | | | | |
| | | | |
Telecommunication Services - 4.2% | | | | | | | | | | | | | | |
Diversified Telecommunication Services - 1.0% | | | | | | | | | | | | | | |
Windstream Services LLC, 7.875%, 11/1/2017 | | | B1 | | | | 2,525,000 | | | | 2,682,813 | | | |
| | | | | | | | | | | | | | |
| | | | |
Wireless Telecommunication Services - 3.2% | | | | | | | | | | | | | | |
Altice Financing S.A. (Luxembourg)4, 6.50%, 1/15/2022 | | | B1 | | | | 4,960,000 | | | | 4,960,000 | | | |
T-Mobile USA, Inc., 6.836%, 4/28/2023 | | | Ba3 | | | | 3,025,000 | | | | 3,180,031 | | | |
| | | | | | | | | | | | | | |
| | | | |
| | | | | | | | | | | 8,140,031 | | | |
| | | | | | | | | | | | | | |
| | | | |
Total Telecommunication Services | | | | | | | | | | | 10,822,844 | | | |
| | | | | | | | | | | | | | |
| | | | |
Utilities - 5.5% | | | | | | | | | | | | | | |
Independent Power and Renewable Electricity Producers - 5.5% | | | | | | | | | | | | | | |
Abengoa Yield plc (Spain)4, 7.00%, 11/15/2019 | | | BB3 | | | | 3,845,000 | | | | 3,960,350 | | | |
ContourGlobal Power Holdings S.A. (France)4, 7.125%, 6/1/2019 | | | B3 | | | | 3,560,000 | | | | 3,729,100 | | | |
NRG Energy, Inc., 6.25%, 7/15/2022 | | | B1 | | | | 2,400,000 | | | | 2,436,000 | | | |
Talen Energy Supply LLC4, 5.125%, 7/15/2019 | | | Ba3 | | | | 3,980,000 | | | | 3,900,400 | | | |
| | | | | | | | | | | | | | |
| | | | |
Total Utilities | | | | | | | | | | | 14,025,850 | | | |
| | | | | | | | | | | | | | |
| | | | |
Total Non-Convertible Corporate Bonds
(Identified Cost $228,776,266) | | | | | | | | | | | 223,492,652 | | | |
| | | | | | | | | | | | | | |
| | | | |
MUTUAL FUND - 1.9% | | | | | | | | | | | | | | |
| | | | |
iShares iBoxx $ High Yield Corporate Bond ETF (Identified Cost $4,994,847) | | | | | | | 55,510 | | | | 4,929,288 | | | |
| | | | | | | | | | | | | | |
| | | | |
SHORT-TERM INVESTMENT - 3.3% | | | | | | | | | | | | | | |
| | | | |
Dreyfus Cash Management, Inc. - Institutional Shares8, 0.04%, (Identified Cost $8,452,131) | | | | | | | 8,452,131 | | | | 8,452,131 | | | |
| | | | | | | | | | | | | | |
| | | | |
TOTAL INVESTMENTS - 98.0%
(Identified Cost $257,054,378) | | | | | | | | | | | 251,653,592 | | | |
OTHER ASSETS, LESS LIABILITIES - 2.0% | | | | | | | | | | | 5,191,004 | | | |
| | | | | | | | | | | | | | |
| | | | |
NET ASSETS - 100% | | | | | | | | | | $ | 256,844,596 | | | |
| | | | | | | | | | | | | | |
The accompanying notes are an integral part of the financial statements.
7
High Yield Bond Series
Investment Portfolio - June 30, 2015
(unaudited)
ETF - Exchange-Traded Fund
1Credit ratings from Moody’s (unaudited).
2The coupon rate is floating and is the effective rate as of June 30, 2015.
3Credit ratings from S&P (unaudited).
4Restricted securities - Investment in securities that are restricted as to public resale under the Securities Act of 1933, as amended. These securities have been sold under rule 144A and have been determined to be liquid under guidelines established by the Board of Directors. These securities amount to $130,449,477 or 50.8% of the Series’ net assets as of June 30, 2015 (see Note 2 to the financial statements).
5Security is perpetual in nature and has no stated maturity date.
6The rate shown is a fixed rate as of June 30, 2015; the rate becomes floating, based on LIBOR plus a spread, in December 2024.
7Represents a Payment-In-Kind bond.
8Rate shown is the current yield as of June 30, 2015.
The Global Industry Classification Standard (GICS) was developed by and is the exclusive property and a service mark of MSCI Inc. (MSCI) and Standard & Poor’s, a division of The McGraw-Hill Companies, Inc. (S&P), and is licensed for use by Manning & Napier when referencing GICS sectors. Neither MSCI, S&P, nor any third party involved in making or compiling the GICS or any GICS classifications makes any express or implied warranties or representations with respect to such standard or classification, nor shall any such party have any liability therefrom.
The accompanying notes are an integral part of the financial statements.
8
High Yield Bond Series
Statement of Assets and Liabilities
June 30, 2015 (unaudited)
| | | | |
ASSETS: | | | | |
| |
Investments, at value (identified cost $257,054,378) (Note 2) | | $ | 251,653,592 | |
Cash | | | 20,533 | |
Interest receivable | | | 4,493,461 | |
Receivable for securities sold | | | 1,309,611 | |
Receivable for fund shares sold | | | 90,906 | |
Dividends receivable | | | 508 | |
Prepaid expenses | | | 326 | |
| | | | |
| |
TOTAL ASSETS | | | 257,568,937 | |
| | | | |
| |
LIABILITIES: | | | | |
| |
Accrued management fees (Note 3) | | | 171,059 | |
Accrued shareholder services fees (Class S) (Note 3) | | | 45,629 | |
Accrued fund accounting and administration fees (Note 3) | | | 15,174 | |
Accrued transfer agent fees (Note 3) | | | 4,432 | |
Accrued Chief Compliance Officer service fees (Note 3) | | | 382 | |
Payable for fund shares repurchased | | | 449,868 | |
Other payables and accrued expenses | | | 37,797 | |
| | | | |
| |
TOTAL LIABILITIES | | | 724,341 | |
| | | | |
| |
TOTAL NET ASSETS | | $ | 256,844,596 | |
| | | | |
| |
NET ASSETS CONSIST OF: | | | | |
| |
Capital stock | | $ | 259,041 | |
Additional paid-in-capital | | | 262,378,655 | |
Undistributed net investment income | | | 1,610,918 | |
Accumulated net realized loss on investments | | | (2,003,232 | ) |
Net unrealized appreciation (depreciation) on investments | | | (5,400,786 | ) |
| | | | |
| |
TOTAL NET ASSETS | | $ | 256,844,596 | |
| | | | |
| |
NET ASSET VALUE, OFFERING PRICE AND REDEMPTION PRICE PER SHARE - Class S ($204,968,123/20,177,017 shares) | | $ | 10.16 | |
| | | | |
| |
NET ASSET VALUE, OFFERING PRICE AND REDEMPTION PRICE PER SHARE - Class I ($51,876,473/5,727,065 shares) | | $ | 9.06 | |
| | | | |
The accompanying notes are an integral part of the financial statements.
9
High Yield Bond Series
Statement of Operations
For the Six Months Ended June 30, 2015 (unaudited)
| | | | |
INVESTMENT INCOME: | | | | |
| |
Interest | | $ | 7,618,496 | |
Dividends | | | 200,078 | |
| | | | |
| |
Total Investment Income | | | 7,818,574 | |
| | | | |
| |
EXPENSES: | | | | |
| |
Management fees (Note 3) | | | 961,798 | |
Shareholder services fees (Class S) (Note 3) | | | 257,163 | |
Fund accounting and administration fees (Note 3) | | | 33,302 | |
Transfer agent fees (Note 3) | | | 9,594 | |
Directors’ fees (Note 3) | | | 2,873 | |
Chief Compliance Officer service fees (Note 3) | | | 1,224 | |
Custodian fees | | | 5,782 | |
Miscellaneous | | | 54,481 | |
| | | | |
| |
Total Expenses | | | 1,326,217 | |
| | | | |
| |
NET INVESTMENT INCOME | | | 6,492,357 | |
| | | | |
| |
REALIZED AND UNREALIZED GAIN (LOSS) ON INVESTMENTS: | | | | |
| |
Net realized loss on investments | | | (1,576,383 | ) |
Net change in unrealized appreciation (depreciation) on investments | | | 2,943,410 | |
| | | | |
| |
NET REALIZED AND UNREALIZED GAIN (LOSS) ON INVESTMENTS | | | 1,367,027 | |
| | | | |
| |
NET INCREASE IN NET ASSETS RESULTING FROM OPERATIONS | | $ | 7,859,384 | |
| | | | |
The accompanying notes are an integral part of the financial statements.
10
High Yield Bond Series
Statements of Changes in Net Assets
| | | | | | | | |
| | | FOR THE SIX
MONTHS ENDED
6/30/15 (UNAUDITED) | | | FOR THE YEAR ENDED 12/31/14 | |
INCREASE (DECREASE) IN NET ASSETS: | | | | | | | | |
| | |
OPERATIONS: | | | | | | | | |
| | |
Net investment income | | $ | 6,492,357 | | | $ | 11,718,547 | |
Net realized gain (loss) on investments | | | (1,576,383 | ) | | | 5,867,932 | |
Net change in unrealized appreciation (depreciation) on investments | | | 2,943,410 | | | | (12,738,672 | ) |
| | | | | | | | |
| | |
Net increase from operations | | | 7,859,384 | | | | 4,847,807 | |
| | | | | | | | |
| | |
DISTRIBUTIONS TO SHAREHOLDERS (Note 8): | | | | | | | | |
| | |
From net investment income (Class S) | | | (3,860,724 | ) | | | (9,427,102 | ) |
From net investment income (Class I) | | | (1,169,880 | ) | | | (2,140,735 | ) |
From net realized gain on investments (Class S) | | | — | | | | (6,037,874 | ) |
From net realized gain on investments (Class I) | | | — | | | | (1,355,223 | ) |
| | | | | | | | |
| | |
Total distributions to shareholders | | | (5,030,604 | ) | | | (18,960,934 | ) |
| | | | | | | | |
| | |
CAPITAL STOCK ISSUED AND REPURCHASED: | | | | | | | | |
| | |
Net increase from capital share transactions (Note 5) | | | 9,658,048 | | | | 42,249,663 | |
| | | | | | | | |
| | |
Net increase in net assets | | | 12,486,828 | | | | 28,136,536 | |
| | |
NET ASSETS: | | | | | | | | |
| | |
Beginning of period | | | 244,357,768 | | | | 216,221,232 | |
| | | | | | | | |
| | |
End of period (including undistributed net investment income of $1,610,918 and $149,165, respectively) | | $ | 256,844,596 | | | $ | 244,357,768 | |
| | | | | | | | |
The accompanying notes are an integral part of the financial statements.
11
High Yield Bond Series
Financial Highlights - Class S*
| | | | | | | | | | | | | | | | | | | | | | | | | | | | | | |
| | | FOR THE SIX MONTHS ENDED | | FOR THE YEARS ENDED |
| | | 6/30/15
(UNAUDITED) | | 12/31/14 | | 12/31/13 | | 12/31/12 | | 12/31/11 | | 12/31/10 |
Per share data (for a share outstanding throughout each period): | | | | | | | | | | | | | | | | | | | | | | | | | | | | | | |
| | | | | | |
Net asset value - Beginning of period | | | | $10.04 | | | | | $10.64 | | | | | $10.75 | | | | | $10.30 | | | | | $10.74 | | | | | $10.37 | |
| | | | | | |
Income from investment operations: | | | | | | | | | | | | | | | | | | | | | | | | | | | | | | |
Net investment income1 | | | | 0.25 | | | | | 0.52 | | | | | 0.54 | | | | | 0.63 | | | | | 0.69 | | | | | 0.75 | |
Net realized and unrealized gain (loss) on investments | | | | 0.06 | | | | | (0.30 | ) | | | | 0.21 | | | | | 0.83 | | | | | (0.17 | ) | | | | 0.66 | |
| | | | | | |
Total from investment operations | | | | 0.31 | | | | | 0.22 | | | | | 0.75 | | | | | 1.46 | | | | | 0.52 | | | | | 1.41 | |
| | | | | | |
Less distributions to shareholders: | | | | | | | | | | | | | | | | | | | | | | | | | | | | | | |
From net investment income | | | | (0.19 | ) | | | | (0.50 | ) | | | | (0.53 | ) | | | | (0.64 | ) | | | | (0.67 | ) | | | | (0.75 | ) |
From net realized gain on investments | | | | — | | | | | (0.32 | ) | | | | (0.33 | ) | | | | (0.37 | ) | | | | (0.29 | ) | | | | (0.29 | ) |
| | | | | | |
Total distributions to shareholders | | | | (0.19 | ) | | | | (0.82 | ) | | | | (0.86 | ) | | | | (1.01 | ) | | | | (0.96 | ) | | | | (1.04 | ) |
| | | | | | |
Net asset value - End of period | | | | $10.16 | | | | | $10.04 | | | | | $10.64 | | | | | $10.75 | | | | | $10.30 | | | | | $10.74 | |
| | | | | | |
Net assets - End of period (000’s omitted) | | | | $204,968 | | | | | $202,772 | | | | | $191,922 | | | | | $179,187 | | | | | $175,350 | | | | | $158,181 | |
| | | | | | |
Total return2 | | | | 3.10% | | | | | 2.04% | | | | | 7.17% | | | | | 14.46% | | | | | 4.87% | | | | | 13.59% | |
Ratios (to average net assets)/Supplemental Data: | | | | | | | | | | | | | | | | | | | | | | | | | | | | | | |
Expenses** | | | | 1.08% | 3 | | | | 1.11% | | | | | 1.12% | | | | | 1.10% | | | | | 1.12% | | | | | 1.14% | |
Net investment income | | | | 5.01% | 3 | | | | 4.78% | | | | | 4.99% | | | | | 5.83% | | | | | 6.26% | | | | | 6.79% | |
Portfolio turnover | | | | 44% | | | | | 104% | | | | | 93% | | | | | 91% | | | | | 63% | | | | | 54% | |
* Effective August 1, 2012, the shares of the Series have been designated as Class S. ** For certain periods presented, the investment advisor did not impose all or a portion of its management and/or other fees, and in some periods may have paid a portion of the Series’ expenses. If these expenses had been incurred by the Series, the expense ratio (to average net assets) would have increased by the following amounts: | |
| | | | N/A | | | | | N/A | | | | | N/A | | | | | N/A | | | | | N/A | | | | | 0.00%4 | |
1Calculated based on average shares outstanding during the periods.
2Represents aggregate total return for the periods indicated, and assumes reinvestment of all distributions. Total return would have been lower had certain expenses not been waived or reimbursed during certain periods. Periods less than one year are not annualized.
3Annualized.
4Less than 0.01%.
The accompanying notes are an integral part of the financial statements.
12
High Yield Bond Series
Financial Highlights - Class I
| | | | | | | | | | | | | | | | | | | | |
| | | FOR THE SIX MONTHS ENDED
6/30/15
(UNAUDITED) | | FOR THE YEARS ENDED | | FOR THE PERIOD 8/1/121 TO 12/31/12 |
| | | 12/31/14 | | 12/31/13 | |
Per share data (for a share outstanding throughout each period): | | | | | | | | | | | | | | | | | | | | |
| | | | |
Net asset value - Beginning of period | | | | $8.97 | | | | | $9.59 | | | | | $9.78 | | | | | $10.00 | |
| | | | | | | | | | | | | | | | | | | | |
| | | | |
Income (loss) from investment operations: | | | | | | | | | | | | | | | | | | | | |
Net investment income2 | | | | 0.24 | | | | | 0.49 | | | | | 0.52 | | | | | 0.25 | |
Net realized and unrealized gain (loss) on investments | | | | 0.05 | | | | | (0.26 | ) | | | | 0.18 | | | | | 0.30 | |
| | | | | | | | | | | | | | | | | | | | |
| | | | |
Total from investment operations | | | | 0.29 | | | | | 0.23 | | | | | 0.70 | | | | | 0.55 | |
| | | | | | | | | | | | | | | | | | | | |
| | | | |
Less distributions to shareholders: | | | | | | | | | | | | | | | | | | | | |
From net investment income | | | | (0.20 | ) | | | | (0.53 | ) | | | | (0.56 | ) | | | | (0.40 | ) |
From net realized gain on investments | | | | — | | | | | (0.32 | ) | | | | (0.33 | ) | | | | (0.37 | ) |
| | | | | | | | | | | | | | | | | | | | |
| | | | |
Total distributions to shareholders | | | | (0.20 | ) | | | | (0.85 | ) | | | | (0.89 | ) | | | | (0.77 | ) |
| | | | | | | | | | | | | | | | | | | | |
| | | | |
Net asset value - End of period | | | | $9.06 | | | | | $8.97 | | | | | $9.59 | | | | | $9.78 | |
| | | | | | | | | | | | | | | | | | | | |
| | | | |
Net assets - End of period (000’s omitted) | | | | $51,876 | | | | | $41,586 | | | | | $24,299 | | | | | $14,002 | |
| | | | | | | | | | | | | | | | | | | | |
| | | | |
Total return3 | | | | 3.26% | | | | | 2.33% | | | | | 7.35% | | | | | 5.59% | |
Ratios (to average net assets)/Supplemental Data: | | | | | | | | | | | | | | | | | | | | |
Expenses | | | | 0.83% | 4 | | | | 0.86% | | | | | 0.87% | | | | | 0.87% | 4 |
Net investment income | | | | 5.28% | 4 | | | | 5.05% | | | | | 5.24% | | | | | 5.90% | 4 |
Portfolio turnover | | | | 44% | | | | | 104% | | | | | 93% | | | | | 91% | |
1Commencement of operations.
2Calculated based on average shares outstanding during the periods.
3Represents aggregate total return for the periods indicated, and assumes reinvestment of all distributions. Periods less than one year are not annualized.
4Annualized.
The accompanying notes are an integral part of the financial statements.
13
High Yield Bond Series
Notes to Financial Statements
(unaudited)
High Yield Bond Series (the “Series”) is a no-load diversified series of Manning & Napier Fund, Inc. (the “Fund”). The Fund is organized in Maryland and is registered under the Investment Company Act of 1940, as amended, as an open-end management investment company.
The Series’ investment objective is to provide a high level of long-term total return by investing principally in non-investment grade fixed income securities that are issued by government and corporate entities.
The Fund’s advisor is Manning & Napier Advisors, LLC (the “Advisor”). Shares of the Series are offered to investors, clients and employees of the Advisor and its affiliates. The series is authorized to issue two classes of shares (Class S & Class I). Each class of shares is substantially the same, except that Class S shares bear shareholder services fees. The total authorized capital stock of the Fund consists of 15 billion shares of common stock each having a par value of $0.01. As of June 30, 2015, 10.6 billion shares have been designated in total among 41 series, of which 125 million have been designated as High Yield Bond Series Class S common stock and 100 million have been designated as High Yield Bond Series Class I common stock.
| 2. | Significant Accounting Policies |
The following is a summary of significant accounting policies followed by the Series. The Series is an investment company and, accordingly, follows the investment company accounting and reporting guidance of the Financial Accounting Standards Board Accounting Standards Codification Topic 946 - Investment Companies, which is part of accounting principles generally accepted in the United States of America (“GAAP”).
Security Valuation
Portfolio securities, including domestic equities, foreign equities, warrants and options, listed on an exchange other than the NASDAQ Stock Market are valued at the latest quoted sales price of the exchange on which the security is primarily traded. Securities not traded on valuation date or securities not listed on an exchange are valued at the latest quoted bid price provided by the Fund’s pricing service. Securities listed on the NASDAQ Stock Market are valued in accordance with the NASDAQ Official Closing Price.
Debt securities, including government bonds, foreign bonds, asset-backed securities, structured notes, supranational obligations, sovereign bonds, corporate bonds, loan assignments, and mortgage-backed securities will normally be valued on the basis of evaluated bid prices provided directly by an independent pricing service. The pricing services use multiple valuation techniques to determine fair value. In instances where sufficient market activity exists, the pricing services may utilize a market-based approach through which quotes from market makers are used to determine fair value. In instances where sufficient market activity may not exist or is limited, the pricing services also utilize proprietary valuation models which may consider market characteristics such as benchmark yield curves, option-adjusted spreads, credit spreads, estimated default rates, coupon rates, anticipated timing of principal repayments, underlying collateral, and other unique security features in order to estimate the relevant cash flows, which are then discounted to calculate the fair value. Certain investments in securities held by the Series may be valued on a basis of a price provided directly by a principal market maker. These prices may differ from the value that would have been used had a broader market for securities existed.
The fair value of loan assignments is estimated using recently executed transactions, market price quotations, credit/market events, and cross-asset pricing. Inputs are generally observable market inputs obtained from independent sources. Loan assignments are generally categorized in Level 2 of the fair value hierarchy, unless key inputs are unobservable, in which case they would be categorized in Level 3.
Short-term investments that mature in sixty days or less are valued at amortized cost, which approximates fair value. Investments in open-end investment companies are valued at their net asset value per share on valuation date.
Volume and level of activity in established markets for an asset or liability are evaluated to determine whether recent transactions and quoted prices are determinative of fair value. Where there have been significant decreases in volume and level
14
High Yield Bond Series
Notes to Financial Statements (continued)
(unaudited)
| 2. | Significant Accounting Policies (continued) |
Security Valuation (continued)
of activity, further analysis and adjustment may be necessary to estimate fair value. The Series measures fair value in these instances by the use of inputs and valuation techniques which may be based upon current market prices of securities that are comparable in coupon, rating, maturity and industry and/or expectation of future cash flows. As a result of trading in relatively thin markets and/or markets that experience significant volatility, the prices used by the Series to value these securities may differ from the value that would be realized if these securities were sold, and the differences could be material.
Securities for which representative valuations or prices are not available from the Series’ pricing service may be valued at fair value as determined in good faith by the Advisor under procedures approved by and under the general supervision and responsibility of the Fund’s Board of Directors (the “Board”). Due to the inherent uncertainty of valuations of such securities, the fair value may differ significantly from the values that would have been used had a ready market for such securities existed. If trading or events occurring after the close of the principal market in which securities are traded are expected to materially affect the value of those securities, then they may be valued at their fair value, taking this trading or these events into account.
Various inputs are used in determining the value of the Series’ assets or liabilities carried at fair value. These inputs are summarized in three broad levels. Level 1 includes quoted prices in active markets for identical assets and liabilities. Level 2 includes other significant observable inputs (including quoted prices for similar securities, interest rates, prepayment speeds, credit risk, etc.). Level 3 includes significant unobservable inputs (including the Series’ own assumptions in determining the fair value of investments). A financial instrument’s level within the fair value hierarchy is based on the lowest level of any input both individually and in aggregate that is significant to the fair value measurement. The inputs or methodology used for valuing securities are not necessarily an indication of the risk associated with investing in those securities.
The following is a summary of the valuation levels used for major security types as of June 30, 2015 in valuing the Series’ assets or liabilities carried at fair value:
| | | | | | | | | | | | | | | | |
DESCRIPTION | | TOTAL | | | LEVEL 1 | | | LEVEL 2 | | | LEVEL 3 | |
Assets: | | | | | | | | | | | | | | | | |
Debt securities: | | | | | | | | | | | | | | | | |
Loan assignments | | $ | 14,779,521 | | | $ | — | | | $ | 14,779,521 | | | $ | — | |
Corporate debt: | | | | | | | | | | | | | | | | |
Consumer Discretionary | | | 39,780,210 | | | | — | | | | 39,780,210 | | | | — | |
Consumer Staples | | | 27,437,537 | | | | — | | | | 27,437,537 | | | | — | |
Energy | | | 20,122,212 | | | | — | | | | 20,122,212 | | | | — | |
Financials | | | 52,095,779 | | | | — | | | | 52,095,779 | | | | — | |
Health Care | | | 11,906,480 | | | | — | | | | 11,906,480 | | | | — | |
Industrials | | | 35,632,515 | | | | — | | | | 35,632,515 | | | | — | |
Materials | | | 11,669,225 | | | | — | | | | 11,669,225 | | | | — | |
Telecommunication Services | | | 10,822,844 | | | | — | | | | 10,822,844 | | | | — | |
Utilities | | | 14,025,850 | | | | — | | | | 14,025,850 | | | | — | |
Mutual funds | | | 13,381,419 | | | | 13,381,419 | | | | — | | | | — | |
| | | | | | | | | | | | | | | | |
| | | | |
Total assets | | $ | 251,653,592 | | | $ | 13,381,419 | | | $ | 238,272,173 | | | $ | — | |
| | | | | | | | | | | | | | | | |
There were no Level 3 securities held by the Series as of December 31, 2014 or June 30, 2015.
The Fund’s policy is to recognize transfers in and transfers out of the valuation levels as of the beginning of the reporting period. There were no transfers between Level 1 and Level 2 during the six months ended June 30, 2015.
Security Transactions, Investment Income and Expenses
Security transactions are accounted for on trade date. Dividend income is recorded on the ex-dividend date, except that if the ex-dividend date has passed, certain dividends from foreign securities are recorded as soon as the Series is informed of the
15
High Yield Bond Series
Notes to Financial Statements (continued)
(unaudited)
| 2. | Significant Accounting Policies (continued) |
Security Transactions, Investment Income and Expenses (continued)
ex-dividend date. Non-cash dividends, if any, are recorded at the fair value of the securities received. Interest income, including amortization of premium and accretion of discounts using the effective interest method, is earned from settlement date and accrued daily.
Expenses are recorded on an accrual basis. Most expenses of the Fund can be attributed to a specific series. Expenses which cannot be directly attributed are apportioned among the series in the Fund in such a manner as deemed equitable by the Fund’s Board, taking into consideration, among other things, the nature and type of expense. Income, expenses (other than shareholder services fees), and realized and unrealized gains and losses are prorated among the classes based on the relative net assets of each class. Class specific expenses are directly charged to that class.
The Series uses the identified cost method for determining realized gain or loss on investments for both financial statement and federal income tax reporting purposes.
Foreign Currency Translation
The books and records of the Series are maintained in U.S. dollars. Foreign currencies, investments and other assets and liabilities are translated into U.S. dollars at the current exchange rates. Purchases and sales of investment securities and income and expenses are translated on the respective dates of such transactions. The Series does not isolate realized and unrealized gains and losses attributable to changes in the exchange rates from gains and losses that arise from changes in the fair value of investments. Such fluctuations are included with net realized and unrealized gain or loss on investments. Net realized foreign currency gains and losses represent foreign currency gains and losses between trade date and settlement date on securities transactions, gains and losses on disposition of foreign currencies and the difference between the amount of income and foreign withholding taxes recorded on the books of the Series and the amounts actually received or paid.
Securities Purchased on a When-Issued Basis or Forward Commitment
The Series may purchase securities on a when-issued basis or forward commitment. These transactions involve a commitment by the Series to purchase securities for a predetermined price with payment and delivery taking place beyond the customary settlement period. When such purchases are outstanding, the Series will designate liquid assets in an amount sufficient to meet the purchase price. When purchasing a security on a delayed delivery basis, the Series assumes the rights and risks of ownership of the security, including the risk of price and yield fluctuations, and takes such fluctuations into account when determining its net asset value. The Series may sell the when-issued securities before they are delivered, which may result in a capital gain or loss. No such investments were held by the Series on June 30, 2015.
In connection with its ability to purchase or sell securities on a forward commitment basis, the Series may enter into forward roll transactions principally using To Be Announced (TBA) securities. Forward roll transactions require the sale of securities for delivery in the current month, and a simultaneous agreement to repurchase substantially similar (same type, coupon and maturity) securities on a specified future date. Risks of entering into forward roll transactions include the potential inability of the counterparty to meet the terms of the agreement; the potential of the Series to receive inferior securities at redelivery as compared to the securities sold to the counterparty; counterparty credit risk; and the potential pay down speed variance between the mortgage-backed pools. During the roll period, the Series forgoes principal and interest paid on the securities. The Series accounts for such dollar rolls as purchases and sales. Information regarding securities purchased on a when-issued basis is included in the Series’ Investment Portfolio. No such investments were held by the Series on June 30, 2015.
Restricted Securities
Restricted securities are purchased in private placement transactions, are not registered under the Securities Act of 1933, as amended, and may have contractual restrictions on resale. Information regarding restricted securities is included at the end of the Series’ Investment Portfolio.
16
High Yield Bond Series
Notes to Financial Statements (continued)
(unaudited)
| 2. | Significant Accounting Policies (continued) |
Illiquid Securities
A security may be considered illiquid if so deemed in good faith by the Advisor under procedures approved by and under the general supervision and responsibility of the Fund’s Board. Securities that are illiquid are marked with the applicable footnote on the Investment Portfolio. No such investments were held by the Series on June 30, 2015.
Federal Taxes
The Series’ policy is to comply with the provisions of the Internal Revenue Code applicable to regulated investment companies. The Series is not subject to federal income tax or excise tax to the extent that the Series distributes to shareholders each year its taxable income, including any net realized gains on investments, in accordance with requirements of the Internal Revenue Code. Accordingly, no provision for federal income tax or excise tax has been made in the financial statements.
Management evaluates its tax positions to determine if the tax positions taken meet the minimum recognition threshold in connection with accounting for uncertainties in income tax positions taken or expected to be taken for the purposes of measuring and recognizing tax liabilities in the financial statements. Recognition of tax benefits of an uncertain tax position is required only when the position is “more likely than not” to be sustained assuming examination by taxing authorities. At June 30, 2015, the Series has recorded no liability for net unrecognized tax benefits relating to uncertain income tax positions taken or expected to be taken in future tax returns.
The Series files income tax returns in the U.S. federal jurisdiction, various states and foreign jurisdictions, as required. No income tax returns are currently under investigation. The statute of limitations on the Series’ tax returns remains open for the years ended December 31, 2011 through December 31, 2014. The Series is not aware of any tax positions for which it is reasonably possible that the total amounts of unrecognized tax benefits will significantly change in the next twelve months.
Foreign Taxes
Based on the Series’ understanding of the tax rules and rates related to income, gains and currency purchase/repatriation transactions for foreign jurisdictions in which it invests, the Series will provide for foreign taxes, and where appropriate, deferred foreign tax.
Distributions of Income and Gains
Distributions to shareholders of net investment income are made quarterly. Distributions of net realized gains are made annually. An additional distribution may be necessary to avoid taxation of the Series. Distributions are recorded on the ex-dividend date.
Indemnifications
The Fund’s organizational documents provide former and current directors and officers with a limited indemnification against liabilities arising in connection with the performance of their duties to the Fund. In the normal course of business, the Fund may also enter into contracts that provide general indemnifications. The Fund’s maximum exposure under these arrangements is unknown as this would be dependent on future claims that may be made against the Fund. The risk of material loss from such claims is considered remote.
Other
The preparation of financial statements in conformity with GAAP requires management to make estimates and assumptions that affect the reported amounts of assets and liabilities and the disclosure of contingent assets and liabilities at the date of the financial statements and the reported amounts of income and expenses during the reporting period. Actual results could differ from those estimates.
| 3. | Transactions with Affiliates |
The Fund has an Investment Advisory Agreement (the “Agreement”) with the Advisor, for which the Series pays a fee, computed daily and payable monthly, at an annual rate of 0.75% of the Series’ average daily net assets.
17
High Yield Bond Series
Notes to Financial Statements (continued)
(unaudited)
| 3. | Transactions with Affiliates (continued) |
Under the Agreement, personnel of the Advisor provide the Series with advice and assistance in the choice of investments and the execution of securities transactions, and otherwise maintain the Series’ organization. The Advisor also provides the Fund with necessary office space and fund administration and support services. The salaries of all officers of the Fund (except a percentage of the Fund’s Chief Compliance Officer’s salary, which is paid by the Fund), and of all Directors who are “affiliated persons” of the Fund, or of the Advisor, and all personnel of the Fund, or of the Advisor, performing services relating to research, statistical and investment activities, are paid by the Advisor. Each “non-affiliated” Director receives an annual stipend, which is allocated among all the active series of the Fund. In addition, these Directors also receive a fee per Board meeting attended plus a fee for each committee meeting attended and are reimbursed for travel and other out-of-pocket expenses incurred by them in connection with attending such meetings. The Fund also has an Audit Committee Chair, who receives an additional annual stipend for this role.
The Class S shares of the Series are subject to a shareholder services fee in accordance with a shareholder services plan adopted by the Board. The shareholder services fee is intended to compensate financial intermediaries, including affiliates of the Fund, in connection with the provision of direct client service, personal services, maintenance of shareholder accounts and reporting services. For these services, Class S of the Series pays a fee, computed daily and payable monthly, at an annual rate of 0.25% of the average daily net assets of Class S. The Fund has a Shareholder Services Agreement with the Advisor, for which the Advisor receives the shareholder services fee as stated above.
The Advisor has contractually agreed, until at least April 30, 2016, to waive its management fee and, if necessary, pay other operating expenses of the Series in order to maintain total direct annual fund operating expenses for the Series, exclusive of each share class’ shareholder services fee, at no more than 0.95% of average daily net assets. The Advisor did not waive any fees for the six months ended June 30, 2015. The Advisor is not eligible to recoup any expenses that have been waived or reimbursed in prior years.
Manning & Napier Investor Services, Inc., a registered broker-dealer affiliate of the Advisor, acts as distributor for the Fund’s shares. The services of Manning & Napier Investor Services, Inc. are provided at no additional cost to the Series.
Pursuant to a master services agreement dated November 1, 2014, the Fund pays the Advisor an annual fee related to fund accounting and administration of 0.0085% on the first $25 billion of average daily net assets (excluding Target Series and Strategic Income Series); 0.0075% on the next $15 billion of average daily net assets (excluding Target Series and Strategic Income Series); and 0.0065% of the average daily net assets in excess of $40 billion (excluding Target Series and Strategic Income Series); plus a base fee of $30,400 per series. Transfer agent fees are charged to the Fund on a per account basis. Additionally, certain transaction and out-of-pocket expenses, including charges for reporting relating to the Fund’s compliance program, are charged. The Advisor has agreements with BNY Mellon Investment Servicing (U.S.) Inc. (“BNY”) under which BNY serves as sub-accountant services agent and sub-transfer agent.
Expenses not directly attributable to a series are allocated based on each series’ relative net assets or number of accounts, depending on the expense.
| 4. | Purchases and Sales of Securities |
For the six months ended June 30, 2015, purchases and sales of securities, other than U.S. Government securities and short-term securities, were $114,849,576 and $107,788,711, respectively. There were no purchases or sales of U.S. Government securities.
18
High Yield Bond Series
Notes to Financial Statements (continued)
(unaudited)
| 5. | Capital Stock Transactions |
Transactions in shares of Class S and Class I shares of High Yield Bond Series were:
| | | | | | | | | | | | | | | | |
| CLASS S | | FOR THE SIX MONTHS ENDED 6/30/15 | | | FOR THE YEAR ENDED 12/31/14 | |
| | | SHARES | | | AMOUNT | | | SHARES | | | AMOUNT | |
Sold | | | 1,705,609 | | | $ | 17,375,697 | | | | 3,953,447 | | | $ | 42,414,464 | |
Reinvested | | | 362,726 | | | | 3,685,687 | | | | 1,452,659 | | | | 14,913,394 | |
Repurchased | | | (2,081,526 | ) | | | (21,238,067 | ) | | | (3,259,439 | ) | | | (35,201,730 | ) |
| | | | | | | | | | | | | | | | |
Total | | | (13,191 | ) | | $ | (176,683 | ) | | | 2,146,667 | | | $ | 22,126,128 | |
| | | | | | | | | | | | | | | | |
| | | | | | | | | | | | | | | | |
| CLASS I | | FOR THE SIX MONTHS ENDED 6/30/15 | | | FOR THE YEAR ENDED 12/31/14 | |
| | | SHARES | | | AMOUNT | | | SHARES | | | AMOUNT | |
Sold | | | 1,858,747 | | | $ | 16,745,895 | | | | 2,472,698 | | | $ | 23,897,041 | |
Reinvested | | | 115,506 | | | | 1,046,462 | | | | 360,518 | | | | 3,313,848 | |
Repurchased | | | (880,854 | ) | | | (7,957,626 | ) | | | (732,438 | ) | | | (7,087,354 | ) |
| | | | | | | | | | | | | | | | |
Total | | | 1,093,399 | | | $ | 9,834,731 | | | | 2,100,778 | | | $ | 20,123,535 | |
| | | | | | | | | | | | | | | | |
Over 90% of the shares outstanding are fiduciary accounts where the Advisor has sole investment discretion. No shareholder exceeds the 10% threshold.
| 6. | Financial Instruments and Loan Assignments |
The Series may trade in instruments including written and purchased options, forward foreign currency exchange contracts and futures contracts and other derivatives in the normal course of investing activities to assist in managing exposure to various market risks. The Series may be subject to various elements of risk, which may involve, to a varying degree, elements of risk in excess of the amounts recognized for financial statement purposes. These risks include: the risk that changes in the value of a derivative may not correlate perfectly with the underlying asset, rate or index; counterparty credit risk related to over the counter derivative counterparties’ failure to perform under contract terms; liquidity risk related to the lack of a liquid market for these contracts allowing the fund to close out its position(s); and documentation risk relating to disagreement over contract terms. No such investments were held by the Series as of June 30, 2015.
The Series may invest in a loan assignment of all or a portion of the loans. The Series has direct rights against the borrower on a loan when it purchases an assignment; however, the Series’ rights may be more limited than the lender from which it acquired the assignment and the Series may be able to enforce its rights only through an administrative agent. Loan assignments are vulnerable to market conditions and may become illiquid due to economic conditions or other events may reduce the demand for loan assignments and certain loan assignments which were liquid when purchased may become illiquid. Loan assignment investments held by the Series as of June 30, 2015 are disclosed in the Investment Portfolio.
Investing in securities of foreign companies and foreign governments involves special risks and considerations not typically associated with investing in securities of domestic companies and the U.S. Government. These risks include revaluation of currencies and future adverse political and economic developments. Moreover, securities of foreign companies and foreign governments and their markets may be less liquid and their prices more volatile than those of comparable domestic companies and the U.S. Government.
| 8. | Federal Income Tax Information |
The amount and characterization of certain income and capital gains to be distributed are determined in accordance with federal income tax regulations, which may differ from GAAP. The Series may periodically make reclassifications among its capital
19
High Yield Bond Series
Notes to Financial Statements (continued)
(unaudited)
| 8. | Federal Income Tax Information (continued) |
accounts to reflect income and gains available for distribution (or available capital loss carryovers) under income tax regulations without impacting the Series’ net asset value. Any such reclassifications are not reflected in the financial highlights.
The final determination of the tax character of current year distributions will be made at the conclusion of the fiscal year. The tax character of distributions paid for the year ended December 31, 2014 were as follows:
| | | | | | |
Ordinary income | | $ | 15,057,497 | | | |
Long-term capital gains | | | 3,903,437 | | | |
At June 30, 2015, the identified cost for federal income tax purposes, the resulting gross unrealized appreciation and depreciation, and the net unrealized depreciation were as follows:
| | | | | | |
Cost for federal income tax purposes | | $ | 257,277,648 | | | |
Unrealized appreciation | | | 2,411,384 | | | |
Unrealized depreciation | | | (8,035,440 | ) | | |
| | | | | | |
Net unrealized depreciation | | $ | (5,624,056 | ) | | |
| | | | | | |
20
{This page intentionally left blank}
21
High Yield Bond Series
Literature Requests
(unaudited)
Proxy Voting Policies and Procedures
A description of the policies and procedures that the Fund uses to determine how to vote proxies relating to portfolio securities is available, without charge, upon request:
| | |
| By phone | | 1-800-466-3863 |
| On the Securities and Exchange | | |
| Commission’s (SEC) web site | | http://www.sec.gov |
Proxy Voting Record
Information regarding how the Fund voted proxies relating to portfolio securities during the most recent 12-month period ended June 30th is available, without charge, upon request:
| | |
| By phone | | 1-800-466-3863 |
| On the SEC’s web site | | http://www.sec.gov |
Quarterly Portfolio Holdings
The Series’ complete schedule of portfolio holdings for the 1st and 3rd quarters of each fiscal year are provided on Form N-Q, and are available, without charge, upon request:
| | |
| By phone | | 1-800-466-3863 |
| On the SEC’s web site | | http://www.sec.gov |
The Series’ Form N-Q may be reviewed and copied at the SEC’s Public Reference Room in Washington, D.C. Information on the operation of the Public Reference Room may be obtained by calling 1-800-SEC-0330.
Prospectus and Statement of Additional Information (SAI)
For more information about any of the Manning & Napier Fund, Inc. Series, you may obtain a prospectus and SAI at www.manning-napier.com or by calling (800) 466-3863. Before investing, carefully consider the objectives, risks, charges and expenses of the investment and read the prospectus carefully as it contains this and other information about the investment company. In addition, this information can be found on the SEC’s web site, http://www.sec.gov.
Additional information available at www.manning-napier.com
1. Fund Holdings - Month-End
2. Fund Holdings - Quarter-End
3. Shareholder Report - Annual
4. Shareholder Report - Semi-Annual
The Fund also offers electronic notification or “e-delivery” when certain documents are available on-line to be downloaded or reviewed. Direct shareholders can elect to receive electronic notification when shareholder reports, prospectus updates, and/or statements are available. If you do not currently have on-line access to your account, you can establish access by going to www.manning-napier.com, click on “Login” in the top corner of the page, and follow the prompts to self-enroll. Once enrolled, you can set your electronic notification preferences by clicking on the Account Options tab located within the green toolbar and then select E-Delivery Option. Should you have any questions on either how to establish on-line access or how to update your account settings, please contact Investor Services at 1-800-466-3863.
The Manning & Napier Fund, Inc. is managed by Manning & Napier Advisors, LLC. Manning & Napier Investor Services, Inc., an affiliate of Manning & Napier Advisors, LLC, is the distributor of the Fund shares.
MNHYB-6/15-SAR

Emerging Markets Series
Shareholder Expense Example
(unaudited)
As a shareholder of the Series, you may incur two types of costs: (1) transaction costs and (2) ongoing costs, including management fees and other Series expenses. This example is intended to help you understand your ongoing costs (in dollars) of investing in the Series and to compare these costs with the ongoing costs of investing in other mutual funds.
The example is based on an investment of $1,000 invested at the beginning of the period and held for the entire period (January 1, 2015 to June 30, 2015).
Actual Expenses
The Actual lines of the table below provide information about actual account values and actual expenses. You may use the information in this line, together with the amount you invested, to estimate the expenses that you paid over the period. Simply divide your account value by $1,000 (for example, an $8,600 account value divided by $1,000 = 8.6), then multiply the result by the number in the Actual line for the Class in which you have invested under the heading entitled “Expenses Paid During Period” to estimate the expenses you paid on your account during this period.
Hypothetical Example for Comparison Purposes
The Hypothetical lines of each Class in the table below provide information about hypothetical account values and hypothetical expenses based on the Class’ actual expense ratio and an assumed rate of return of 5% per year before expenses, which is not the Class’ actual return. The hypothetical account values and expenses may not be used to estimate the actual ending account balance or expenses you paid during the period. You may use this information to compare the ongoing costs of investing in the Series and other funds. To do so, compare this 5% hypothetical example for the class in which you have invested with the 5% hypothetical examples that appear in the shareholder reports of the other funds.
Please note that the expenses shown in the table are meant to highlight your ongoing costs only and do not reflect any transaction costs. Therefore, the Hypothetical lines for each Class in the table are useful in comparing ongoing costs only, and will not help you determine the relative total costs of owning different funds. In addition, if these transaction costs were included, your costs would have been higher.
| | | | | | | | |
| | | BEGINNING
ACCOUNT VALUE
1/1/15 | | ENDING
ACCOUNT VALUE
6/30/15 | | EXPENSES PAID
DURING PERIOD*
1/1/15-6/30/15 | | ANNUALIZED
EXPENSE RATIO |
Class S | | | | | | | | |
Actual | | $1,000.00 | | $ 993.50 | | $5.68 | | 1.15% |
Hypothetical (5% return before expenses) | | $1,000.00 | | $1,019.09 | | $5.76 | | 1.15% |
Class I | | | | | | | | |
Actual | | $1,000.00 | | $ 993.50 | | $4.45 | | 0.90% |
Hypothetical (5% return before expenses) | | $1,000.00 | | $1,020.33 | | $4.51 | | 0.90% |
*Expenses are equal to each Class’ annualized expense ratio (for the six-month period), multiplied by the average account value over the period, multiplied by 181/365 (to reflect the one-half year period). Expenses are based on the most recent fiscal half year. The Class’ total return would have been lower had certain expenses not been waived during the period.
1
Emerging Markets Series
Portfolio Composition as of June 30, 2015
(unaudited)
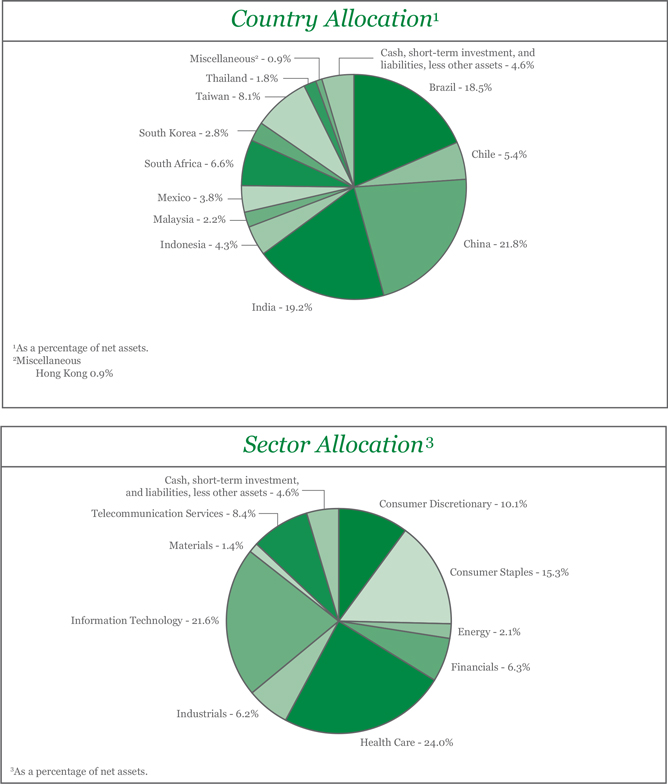
2
Emerging Markets Series
Investment Portfolio - June 30, 2015
(unaudited)
| | | | | | | | |
| | | SHARES | | | VALUE (NOTE 2) | |
| | |
COMMON STOCKS - 95.4% | | | | | | | | |
| | |
Consumer Discretionary - 10.1% | | | | | | | | |
Diversified Consumer Services - 5.7% | | | | | | | | |
Fu Shou Yuan International Group Ltd. (China)1 | | | 2,276,000 | | | $ | 1,264,371 | |
Kroton Educacional S.A. (Brazil) | | | 1,223,050 | | | | 4,673,325 | |
| | | | | | | | |
| | | | | | | 5,937,696 | |
| | | | | | | | |
| | |
Internet & Catalog Retail - 1.9% | | | | | | | | |
MakeMyTrip Ltd. (India)* | | | 95,990 | | | | 1,889,083 | |
| | | | | | | | |
| | |
Media - 1.6% | | | | | | | | |
Global Mediacom Tbk PT (Indonesia)1 | | | 19,040,380 | | | | 1,667,453 | |
| | | | | | | | |
| | |
Specialty Retail - 0.9% | | | | | | | | |
Sa Sa International Holdings Ltd. (Hong Kong)1 | | | 1,747,610 | | | | 945,995 | |
| | | | | | | | |
| | |
Total Consumer Discretionary | | | | | | | 10,440,227 | |
| | | | | | | | |
| | |
Consumer Staples - 15.3% | | | | | | | | |
Beverages - 4.5% | | | | | | | | |
AMBEV S.A. - ADR (Brazil)* | | | 272,830 | | | | 1,664,263 | |
Cia Cervecerias Unidas S.A. - ADR (Chile) | | | 143,960 | | | | 3,049,073 | |
| | | | | | | | |
| | | | | | | 4,713,336 | |
| | | | | | | | |
| | |
Food & Staples Retailing - 2.0% | | | | | | | | |
7-Eleven Malaysia Holdings Berhad (Malaysia)1 | | | 347,000 | | | | 147,151 | |
Raia Drogasil S.A. (Brazil) | | | 150,000 | | | | 1,934,161 | |
| | | | | | | | |
| | | | | | | 2,081,312 | |
| | | | | | | | |
| | |
Food Products - 8.8% | | | | | | | | |
Charoen Pokphand Foods PCL (Thailand)1 | | | 2,674,000 | | | | 1,896,567 | |
M Dias Branco S.A. (Brazil) | | | 81,000 | | | | 2,133,444 | |
Sao Martinho S.A. (Brazil) | | | 254,900 | | | | 3,098,218 | |
Tiger Brands Ltd. (South Africa)1 | | | 84,740 | | | | 1,976,821 | |
| | | | | | | | |
| | | | | | | 9,105,050 | |
| | | | | | | | |
| | |
Total Consumer Staples | | | | | | | 15,899,698 | |
| | | | | | | | |
| | |
Energy - 2.1% | | | | | | | | |
Oil, Gas & Consumable Fuels - 2.1% | | | | | | | | |
Cosan S.A. Industria e Comercio (Brazil) | | | 274,220 | | | | 2,216,445 | |
| | | | | | | | |
| | |
Financials - 6.3% | | | | | | | | |
Banks - 1.6% | | | | | | | | |
ICICI Bank Ltd. - ADR (India) | | | 161,450 | | | | 1,682,309 | |
| | | | | | | | |
| | |
Diversified Financial Services - 4.7% | | | | | | | | |
IDFC Ltd. (India)1 | | | 880,050 | | | | 2,037,601 | |
JSE Ltd. (South Africa)1 | | | 271,000 | | | | 2,862,140 | |
| | | | | | | | |
| | | | | | | 4,899,741 | |
| | | | | | | | |
Total Financials | | | | | | | 6,582,050 | |
| | | | | | | | |
The accompanying notes are an integral part of the financial statements.
3
Emerging Markets Series
Investment Portfolio - June 30, 2015
(unaudited)
| | | | | | | | | | |
| | | SHARES | | | VALUE (NOTE 2) | | | |
COMMON STOCKS (continued) | | | | | | | | | | |
Health Care - 24.0% | | | | | | | | | | |
Health Care Equipment & Supplies - 8.1% | | | | | | | | | | |
Ginko International Co. Ltd. (Taiwan)1 | | | 97,620 | | | $ | 1,226,968 | | | |
Shandong Weigao Group Medical Polymer Co. Ltd. - Class H (China)1 | | | 5,178,000 | | | | 3,863,730 | | | |
St. Shine Optical Co. Ltd. (Taiwan)1 | | | 206,530 | | | | 3,282,930 | | | |
| | | | | | | | | | |
| | | | | | | 8,373,628 | | | |
| | | | | | | | | | |
Health Care Providers & Services - 10.5% | | | | | | | | | | |
Apollo Hospitals Enterprise Ltd. (India)1 | | | 105,674 | | | | 2,180,995 | | | |
Fortis Healthcare Ltd. (India)*1 | | | 1,354,220 | | | | 3,812,031 | | | |
KPJ Healthcare Berhad (Malaysia)1 | | | 1,955,660 | | | | 2,187,354 | | | |
Siloam International Hospitals Tbk PT (Indonesia)1 | | | 2,545,100 | | | | 2,748,880 | | | |
| | | | | | | | | | |
| | | | | | | 10,929,260 | | | |
| | | | | | | | | | |
Pharmaceuticals - 5.4% | | | | | | | | | | |
Glenmark Pharmaceuticals Ltd. (India)1 | | | 203,033 | | | | 3,169,681 | | | |
Lupin Ltd. (India)1 | | | 81,482 | | | | 2,411,294 | | | |
| | | | | | | | | | |
| | | | | | | 5,580,975 | | | |
| | | | | | | | | | |
Total Health Care | | | | | | | 24,883,863 | | | |
| | | | | | | | | | |
Industrials - 6.2% | | | | | | | | | | |
Airlines - 2.1% | | | | | | | | | | |
Gol Linhas Aereas Inteligentes S.A. - ADR (Brazil) | | | 444,100 | | | | 1,052,517 | | | |
Latam Airlines Group S.A. - ADR (Chile)* | | | 162,400 | | | | 1,143,296 | | | |
| | | | | | | | | | |
| | | | | | | 2,195,813 | | | |
| | | | | | | | | | |
Commercial Services & Supplies - 1.9% | | | | | | | | | | |
MiX Telematics Ltd. - ADR (South Africa)* | | | 254,040 | | | | 1,978,972 | | | |
| | | | | | | | | | |
Electrical Equipment - 1.6% | | | | | | | | | | |
Teco Electric and Machinery Co. Ltd. (Taiwan)1 | | | 2,052,000 | | | | 1,592,960 | | | |
| | | | | | | | | | |
Marine - 0.6% | | | | | | | | | | |
Sinotrans Shipping Ltd. - Class H (China)1 | | | 2,604,000 | | | | 637,159 | | | |
| | | | | | | | | | |
Total Industrials | | | | | | | 6,404,904 | | | |
| | | | | | | | | | |
Information Technology - 21.6% | | | | | | | | | | |
Internet Software & Services - 14.3% | | | | | | | | | | |
Alibaba Group Holding Ltd. - ADR (China)* | | | 40,870 | | | | 3,362,375 | | | |
Baidu, Inc. - ADR (China)* | | | 16,740 | | | | 3,332,599 | | | |
Qihoo 360 Technology Co. Ltd. - ADR (China)* | | | 77,390 | | | | 5,238,529 | | | |
Tencent Holdings Ltd. - Class H (China)1 | | | 144,900 | | | | 2,897,498 | | | |
| | | | | | | | | | |
| | | | | | | 14,831,001 | | | |
| | | | | | | | | | |
Semiconductors & Semiconductor Equipment - 2.2% | | | | | | | | | | |
MediaTek, Inc. (Taiwan)1 | | | 166,000 | | | | 2,269,152 | | | |
| | | | | | | | | | |
Software - 2.3% | | | | | | | | | | |
TOTVS S.A. (Brazil) | | | 194,410 | | | | 2,438,019 | | | |
| | | | | | | | | | |
The accompanying notes are an integral part of the financial statements.
4
Emerging Markets Series
Investment Portfolio - June 30, 2015
(unaudited)
| | | | | | | | | | |
| | | SHARES | | | VALUE (NOTE 2) | | | |
COMMON STOCKS (continued) | | | | | | | | | | |
Information Technology (continued) | | | | | | | | | | |
Technology Hardware, Storage & Peripherals - 2.8% | | | | | | | | | | |
Samsung Electronics Co. Ltd. (South Korea)1 | | | 2,550 | | | $ | 2,893,195 | | | |
| | | | | | | | | | |
Total Information Technology | | | | | | | 22,431,367 | | | |
| | | | | | | | | | |
Materials - 1.4% | | | | | | | | | | |
Chemicals - 1.4% | | | | | | | | | | |
Sociedad Quimica y Minera de Chile S.A. - ADR (Chile) | | | 89,010 | | | | 1,425,940 | | | |
| | | | | | | | | | |
Telecommunication Services - 8.4% | | | | | | | | | | |
Wireless Telecommunication Services - 8.4% | | | | | | | | | | |
America Movil S.A.B. de C.V. - Class L - ADR (Mexico) | | | 184,820 | | | | 3,938,514 | | | |
Bharti Infratel Ltd. (India)1 | | | 390,390 | | | | 2,740,332 | | | |
China Mobile Ltd. - Class H (China)1 | | | 160,430 | | | | 2,052,528 | | | |
| | | | | | | | | | |
Total Telecommunication Services | | | | | | | 8,731,374 | | | |
| | | | | | | | | | |
TOTAL COMMON STOCKS | | | | | | | | | | |
(Identified Cost $97,763,633) | | | | | | | 99,015,868 | | | |
| | | | | | | | | | |
SHORT-TERM INVESTMENT - 5.4% | | | | | | | | | | |
Dreyfus Cash Management, Inc. - Institutional Shares2, 0.04%, | | | | | | | | | | |
(Identified Cost $5,643,279) | | | 5,643,279 | | | | 5,643,279 | | | |
| | | | | | | | | | |
TOTAL INVESTMENTS - 100.8% | | | | | | | | | | |
(Identified Cost $103,406,912) | | | | | | | 104,659,147 | | | |
LIABILITIES, LESS OTHER ASSETS - (0.8%) | | | | | | | (829,515 | ) | | |
| | | | | | | | | | |
NET ASSETS - 100% | | | | | | $ | 103,829,632 | | | |
| | | | | | | | | | |
ADR - American Depositary Receipt
*Non-income producing security.
1A factor from a third party vendor was applied to determine the security’s fair value following the close of local trading.
2Rate shown is the current yield as of June 30, 2015.
The Series’ portfolio holds, as a percentage of net assets, greater than 10% in the following countries:
China - 21.8%; Brazil - 18.5%; India - 19.2%.
The Global Industry Classification Standard (GICS) was developed by and is the exclusive property and a service mark of MSCI Inc. (MSCI) and Standard & Poor’s, a division of The McGraw-Hill Companies, Inc. (S&P), and is licensed for use by Manning & Napier when referencing GICS sectors. Neither MSCI, S&P, nor any third party involved in making or compiling the GICS or any GICS classifications makes any express or implied warranties or representations with respect to such standard or classification, nor shall any such party have any liability therefrom.
The accompanying notes are an integral part of the financial statements.
5
Emerging Markets Series
Statement of Assets & Liabilities
June 30, 2015 (unaudited)
| | | | |
ASSETS: | | | | |
Investments, at value (identified cost $103,406,912) (Note 2) | | $ | 104,659,147 | |
Cash | | | 30,108 | |
Dividends receivable | | | 93,566 | |
Receivable for fund shares sold | | | 46,437 | |
Foreign tax reclaims receivable | | | 1,785 | |
Prepaid expenses | | | 137 | |
| | | | |
TOTAL ASSETS | | | 104,831,180 | |
| | | | |
LIABILITIES: | | | | |
Accrued foreign capital gains tax (Note 2) | | | 95,764 | |
Accrued management fees (Note 3) | | | 55,213 | |
Accrued shareholder services fees (Class S) (Note 3) | | | 20,629 | |
Accrued fund accounting and administration fees (Note 3) | | | 8,139 | |
Accrued transfer agent fees (Note 3) | | | 6,237 | |
Accrued Chief Compliance Officer service fees (Note 3) | | | 382 | |
Accrued Directors’ fees (Note 3) | | | 95 | |
Payable for securities purchased | | | 636,803 | |
Accrued custodian fees | | | 92,534 | |
Payable for fund shares repurchased | | | 79,194 | |
Other payables and accrued expenses | | | 6,558 | |
| | | | |
TOTAL LIABILITIES | | | 1,001,548 | |
| | | | |
TOTAL NET ASSETS | | $ | 103,829,632 | |
| | | | |
NET ASSETS CONSIST OF: | | | | |
Capital stock | | $ | 113,140 | |
Additional paid-in-capital | | | 116,446,483 | |
Undistributed net investment loss | | | (195,773 | ) |
Accumulated net realized loss on investments, foreign currency and translation of other assets and liabilities | | | (13,690,568 | ) |
Net unrealized appreciation on investments, (net of foreign capital gains tax of $95,764), foreign currency and translation of other assets and liabilities | | | 1,156,350 | |
| | | | |
TOTAL NET ASSETS | | $ | 103,829,632 | |
| | | | |
NET ASSET VALUE, OFFERING PRICE AND REDEMPTION PRICE PER SHARE - Class S ($93,491,995/10,188,270 shares) | | $ | 9.18 | |
| | | | |
NET ASSET VALUE, OFFERING PRICE AND REDEMPTION PRICE PER SHARE - Class I ($10,337,637/1,125,696 shares) | | $ | 9.18 | |
| | | | |
The accompanying notes are an integral part of the financial statements.
6
Emerging Markets Series
Statement of Operations
For the Six Months Ended June 30, 2015 (unaudited)
| | | | |
INVESTMENT INCOME: | | | | |
Dividends (net of foreign taxes withheld, $67,915) | | $ | 503,402 | |
| | | | |
EXPENSES: | | | | |
Management fees (Note 3) | | | 379,509 | |
Shareholder services fees (Class S)(Note 3) | | | 115,257 | |
Fund accounting and administration fees (Note 3) | | | 24,475 | |
Transfer agent fees (Note 3) | | | 10,420 | |
Directors’ fees (Note 3) | | | 1,886 | |
Chief Compliance Officer service fees (Note 3) | | | 1,224 | |
Custodian fees | | | 71,700 | |
Miscellaneous | | | 54,031 | |
| | | | |
Total Expenses | | | 658,502 | |
Less reduction of expenses (Note 3) | | | (55,305 | ) |
| | | | |
Net Expenses | | | 603,197 | |
| | | | |
NET INVESTMENT LOSS | | | (99,795 | ) |
| | | | |
REALIZED AND UNREALIZED GAIN (LOSS) ON INVESTMENTS AND FOREIGN CURRENCY: | | | | |
Net realized loss on- | | | | |
Investments | | | (13,910,260 | ) |
Foreign currency and translation of other assets and liabilities | | | (142,163 | ) |
| | | | |
| | | (14,052,423 | ) |
| | | | |
Net change in unrealized appreciation (depreciation) on- | | | | |
Investments (net of increase in accrued foreign capital gains tax of $92,243) | | | 13,532,310 | |
Foreign currency and translation of other assets and liabilities | | | 77 | |
| | | | |
| | | 13,532,387 | |
| | | | |
NET REALIZED AND UNREALIZED GAIN (LOSS) ON INVESTMENTS AND FOREIGN CURRENCY | | | (520,036 | ) |
| | | | |
NET DECREASE IN NET ASSETS RESULTING FROM OPERATIONS | | $ | (619,831 | ) |
| | | | |
The accompanying notes are an integral part of the financial statements.
7
Emerging Markets Series
Statements of Changes in Net Assets
| | | | | | | | |
| | | FOR THE SIX
MONTHS ENDED
6/30/15
(UNAUDITED) | | | FOR THE YEAR
ENDED 12/31/14 | |
INCREASE (DECREASE) IN NET ASSETS: | | | | | | | | |
OPERATIONS: | | | | | | | | |
Net investment income (loss) | | $ | (99,795 | ) | | $ | 3,019,367 | |
Net realized gain (loss) on investments and foreign currency | | | (14,052,423 | ) | | | 4,130,363 | |
Net change in unrealized appreciation (depreciation) on investments and foreign currency | | | 13,532,387 | | | | (22,080,769 | ) |
| | | | | | | | |
Net decrease from operations | | | (619,831 | ) | | | (14,931,039 | ) |
| | | | | | | | |
DISTRIBUTIONS TO SHAREHOLDERS (Note 8): | | | | | | | | |
From net investment income (Class S) | | | — | | | | (2,682,683 | ) |
From net investment income (Class I) | | | — | | | | (550,665 | ) |
From net realized gain on investments (Class S) | | | — | | | | (4,420,831 | ) |
From net realized gain on investments (Class I) | | | — | | | | (784,320 | ) |
| | | | | | | | |
Total distributions to shareholders | | | — | | | | (8,438,499 | ) |
| | | | | | | | |
CAPITAL STOCK ISSUED AND REPURCHASED: | | | | | | | | |
Net increase (decrease) from capital share transactions (Note 5) | | | (3,701,698 | ) | | | 25,548,419 | |
| | | | | | | | |
Net increase (decrease) in net assets | | | (4,321,529 | ) | | | 2,178,881 | |
NET ASSETS: | | | | | | | | |
Beginning of period | | | 108,151,161 | | | | 105,972,280 | |
| | | | | | | | |
End of period (including undistributed net investment loss of $195,773 and distributions in excess of net investment income of $95,978, respectively) | | $ | 103,829,632 | | | $ | 108,151,161 | |
| | | | | | | | |
The accompanying notes are an integral part of the financial statements.
8
Emerging Markets Series
Financial Highlights - Class S*
| | | | | | | | | | | | | | | | | | | | | | | | | |
| | | FOR THE SIX
MONTHS ENDED 6/30/15 (UNAUDITED) | | FOR THE YEARS ENDED | | FOR THE PERIOD 11/16/111 TO
12/31/11 |
| | | | |
| | | | | 12/31/14 | | 12/31/13 | | 12/31/12 | |
Per share data (for a share outstanding throughout each period): | | | | | | | | | | | | | | | | | | | | | | | | | |
Net asset value - Beginning of period | | | | $9.24 | | | | | $11.40 | | | | | $11.64 | | | | | $9.85 | | | | | $10.00 | |
| | | | | |
Income (loss) from investment operations: | | | | | | | | | | | | | | | | | | | | | | | | | |
Net investment income2 | | | | (0.01 | ) | | | | 0.28 | 3 | | | | 0.06 | | | | | 0.04 | | | | | 0.01 | |
Net realized and unrealized gain (loss) on investments | | | | (0.05 | ) | | | | (1.67 | ) | | | | 0.95 | | | | | 2.20 | | | | | (0.15 | ) |
| | | | | |
Total from investment operations | | | | (0.06 | ) | | | | (1.39 | ) | | | | 1.01 | | | | | 2.24 | | | | | (0.14 | ) |
| | | | | |
Less distributions to shareholders: | | | | | | | | | | | | | | | | | | | | | | | | | |
From net investment income | | | | — | | | | | (0.29 | ) | | | | (0.02 | ) | | | | (0.03 | ) | | | | (0.01 | ) |
From net realized gain on investments | | | | — | | | | | (0.48 | ) | | | | (1.23 | ) | | | | (0.42 | ) | | | | — | |
| | | | | |
Total distributions to shareholders | | | | — | | | | | (0.77 | ) | | | | (1.25 | ) | | | | (0.45 | ) | | | | (0.01 | ) |
| | | | | |
Net asset value - End of period | | | | $9.18 | | | | | $9.24 | | | | | $11.40 | | | | | $11.64 | | | | | $9.85 | |
| | | | | |
Net assets - End of period (000’s omitted) | | | | $93,492 | | | | | $91,178 | | | | | $104,884 | | | | | $95,253 | | | | | $78,114 | |
| | | | | |
Total return4 | | | | (0.65% | ) | | | | (12.24% | ) | | | | 8.91% | | | | | 22.77% | | | | | (1.37% | ) |
Ratios (to average net assets)/Supplemental Data: | | | | | | | | | | | | | | | | | | | | | | | | | |
Expenses** | | | | 1.15% | 5 | | | | 1.15% | | | | | 1.20% | | | | | 1.20% | | | | | 1.20% | 5 |
Net investment income | | | | (0.20% | )5 | | | | 2.54% | 3 | | | | 0.54% | | | | | 0.39% | | | | | 0.86% | 5 |
Portfolio turnover | | | | 38% | | | | | 26% | | | | | 44% | | | | | 40% | | | | | 0% | |
*Effective December 18, 2013, the shares of the Series have been designated as Class S.
**The investment advisor did not impose all or a portion of its management and/or other fees, and in some periods may have paid a portion of the Series’ expenses. If these expenses had been incurred by the Series, the expense ratio (to average net assets) would have increased by the following amounts:
| | | | | | | | | | | | | | | | | | | | | | | | | |
| | | | 0.10% | 5 | | | | 0.11% | | | | | 0.09% | | | | | N/A | | | | | N/A | |
1Commencement of operations.
2Calculated based on average shares outstanding during the periods.
3Reflects a special dividend paid out during the period by one of the Series’ holdings. Had the Series not received the special dividend, the net investment income per share would have been $0.05 and the net investment income ratio would have been 0.48%.
4Represents aggregate total return for the periods indicated, and assumes reinvestment of all distributions. Total return would have been lower had certain expenses not been waived or reimbursed during certain periods. Periods less than one year are not annualized.
5Annualized.
The accompanying notes are an integral part of the financial statements.
9
Emerging Markets Series
Financial Highlights - Class I
| | | | | | | | | | | | | | | |
| | | FOR THE SIX
MONTHS ENDED
6/30/15
(UNAUDITED) | | FOR THE YEAR
ENDED 12/31/14 | | FOR THE PERIOD
12/18/131 TO
12/31/13 |
Per share data (for a share outstanding throughout each period): | | | | | | | | | | | | | | | |
Net asset value - Beginning of period | | | | $9.24 | | | | | $11.40 | | | | | $11.18 | |
| | | |
Income (loss) from investment operations: | | | | | | | | | | | | | | | |
Net investment income2 | | | | (0.00 | )3 | | | | 0.43 | 4 | | | | 0.01 | |
Net realized and unrealized gain (loss) on investments | | | | (0.06 | ) | | | | (1.79 | ) | | | | 0.21 | |
| | | |
Total from investment operations | | | | (0.06 | ) | | | | (1.36 | ) | | | | 0.22 | |
| | | |
Less distributions to shareholders: | | | | | | | | | | | | | | | |
From net investment income | | | | — | | | | | (0.32 | ) | | | | — | |
From net realized gain on investments | | | | — | | | | | (0.48 | ) | | | | — | |
| | | |
Total distributions to shareholders | | | | — | | | | | (0.80 | ) | | | | — | |
| | | |
Net asset value - End of period | | | | $9.18 | | | | | $9.24 | | | | | $11.40 | |
| | | |
Net assets - End of period (000’s omitted) | | | | $10,338 | | | | | $16,973 | | | | | $1,088 | |
| | | |
Total return5 | | | | (0.65% | ) | | | | (11.98% | ) | | | | 1.97% | |
Ratios (to average net assets)/Supplemental Data: | | | | | | | | | | | | | | | |
Expenses | | | | 0.90% | 6 | | | | 0.90% | | | | | 1.89% | 6 |
Net investment income | | | | (0.11% | )6 | | | | 3.93% | 4 | | | | 4.91% | 6,7 |
Portfolio turnover | | | | 38% | | | | | 26% | | | | | 44% | |
*The investment advisor did not impose all or a portion of its management and/or other fees, and in some periods may have paid a portion of the Series’ expenses. If these expenses had been incurred by the Series, the expense ratio (to average net assets) would have increased by the following amounts:
1Commencement of operations.
2Calculated based on average shares outstanding during the periods.
3Less than $0.01.
4Reflects a special dividend paid out during the period by one of the Series’ holdings. Had the Series not received the special dividend, the net investment income per share would have been $0.08 and the net investment income ratio would have been 0.72%.
5Represents aggregate total return for the periods indicated, and assumes reinvestment of all distributions. Total return would have been lower had certain expenses not been waived during certain periods. Periods less than one year are not annualized.
6Annualized.
7The annualized net investment income ratio may not be indicative of operating results for a full year.
The accompanying notes are an integral part of the financial statements.
10
Emerging Markets Series
Notes to Financial Statements
(unaudited)
Emerging Markets Series (the “Series”) is a no-load non-diversified series of Manning & Napier Fund, Inc. (the “Fund”). The Fund is organized in Maryland and is registered under the Investment Company Act of 1940, as amended, as an open-end management investment company.
The Series’ investment objective is to provide long-term growth.
The Fund’s advisor is Manning & Napier Advisors, LLC (the “Advisor”). Shares of the Series are offered to investors, clients and employees of the Advisor and its affiliates. The Series is authorized to issue two classes of shares (Class S and Class I). Each class of shares is substantially the same, except that Class S shares bear shareholder services fees. The total authorized capital stock of the Fund consists of 15 billion shares of common stock each having a par value of $0.01. As of June 30, 2015, 10.6 billion shares have been designated in total among 41 series, of which 100 million have been designated as Emerging Markets Series Class S common stock, and 100 million have been designated as Emerging Markets Series Class I common stock.
| 2. | Significant Accounting Policies |
The following is a summary of significant accounting policies followed by the Series. The Series is an investment company and, accordingly, follows the investment company accounting and reporting guidance of the Financial Accounting Standards Board Accounting Standards Codification Topic 946 - Investment Companies, which is part of accounting principles generally accepted in the United States of America (“GAAP”).
Security Valuation
Portfolio securities, including domestic equities, foreign equities, warrants and options, listed on an exchange other than the NASDAQ Stock Market are valued at the latest quoted sales price of the exchange on which the security is primarily traded. Securities not traded on valuation date or securities not listed on an exchange are valued at the latest quoted bid price provided by the Fund’s pricing service. Securities listed on the NASDAQ Stock Market are valued in accordance with the NASDAQ Official Closing Price.
Short-term investments that mature in sixty days or less are valued at amortized cost, which approximates fair value. Investments in open-end investment companies are valued at their net asset value per share on valuation date.
Volume and level of activity in established markets for an asset or liability are evaluated to determine whether recent transactions and quoted prices are determinative of fair value. Where there have been significant decreases in volume and level of activity, further analysis and adjustment may be necessary to estimate fair value. The Series measures fair value in these instances by the use of inputs and valuation techniques which may be based upon current market prices of securities that are comparable in coupon, rating, maturity and industry and/or expectation of future cash flows. As a result of trading in relatively thin markets and/or markets that experience significant volatility, the prices used by the Series to value these securities may differ from the value that would be realized if these securities were sold, and the differences could be material.
Securities for which representative valuations or prices are not available from the Series’ pricing service may be valued at fair value as determined in good faith by the Advisor under procedures approved by and under the general supervision and responsibility of the Fund’s Board of Directors (the “Board”). Due to the inherent uncertainty of valuations of such securities, the fair value may differ significantly from the values that would have been used had a ready market for such securities existed. If trading or events occurring after the close of the principal market in which securities are traded are expected to materially affect the value of those securities, then they may be valued at their fair value, taking this trading or these events into account. In accordance with the procedures approved by the Board, the values of certain securities trading outside the U.S. were adjusted following the close of local trading using a factor from a third party vendor. The third party vendor uses statistical analyses and quantitative models, which consider among other things subsequent movement and changes in the prices of indices, securities and exchange rates in other markets, to determine the factors which are used to adjust local market prices. The value of
11
Emerging Markets Series
Notes to Financial Statements (continued)
(unaudited)
| 2. | Significant Accounting Policies (continued) |
Security Valuation (continued)
securities used for net asset value calculation under these procedures may differ from published prices for the same securities. It is the Fund’s policy to classify each foreign equity security where a factor from a third party vendor is provided as a Level 2 security.
Various inputs are used in determining the value of the Series’ assets or liabilities carried at fair value. These inputs are summarized in three broad levels. Level 1 includes quoted prices in active markets for identical assets and liabilities. Level 2 includes other significant observable inputs (including quoted prices for similar securities, interest rates, prepayment speeds, credit risk, etc.). Level 3 includes significant unobservable inputs (including the Series’ own assumptions in determining the fair value of investments). A financial instrument’s level within the fair value hierarchy is based on the lowest level of any input both individually and in aggregate that is significant to the fair value measurement. The inputs or methodology used for valuing securities are not necessarily an indication of the risk associated with investing in those securities.
The following is a summary of the valuation levels used for major security types as of June 30, 2015 in valuing the Series’ assets or liabilities carried at fair value:
| | | | | | | | | | | | | | | | |
| DESCRIPTION | | TOTAL | | | LEVEL 1 | | | LEVEL 2 | | | LEVEL 3 | |
Assets: | | | | | | | | | | | | | | | | |
Equity securities: | | | | | | | | | | | | | | | | |
Consumer Discretionary | | $ | 10,440,227 | | | $ | 6,562,408 | | | $ | 3,877,819 | | | $ | — | |
Consumer Staples | | | 15,899,698 | | | | 11,879,159 | | | | 4,020,539 | | | | — | |
Energy | | | 2,216,445 | | | | 2,216,445 | | | | — | | | | — | |
Financials | | | 6,582,050 | | | | 1,682,309 | | | | 4,899,741 | | | | — | |
Health Care | | | 24,883,863 | | | | — | | | | 24,883,863 | | | | — | |
Industrials | | | 6,404,904 | | | | 4,174,785 | | | | 2,230,119 | | | | — | |
Information Technology | | | 22,431,367 | | | | 14,371,522 | | | | 8,059,845 | | | | — | |
Materials | | | 1,425,940 | | | | 1,425,940 | | | | — | | | | — | |
Telecommunication Services | | | 8,731,374 | | | | 3,938,514 | | | | 4,792,860 | | | | — | |
Mutual funds | | | 5,643,279 | | | | 5,643,279 | | | | — | | | | — | |
| | | | | | | | | | | | | | | | |
Total assets | | $ | 104,659,147 | | | $ | 51,894,361 | | | $ | 52,764,786 | | | $ | — | |
| | | | | | | | | | | | | | | | |
Please see the Investment Portfolio for foreign securities where a factor from a third party vendor was applied to determine the securities’ fair value following the close of local trading. Such securities are included in Level 2 in the table above.
There were no Level 3 securities held by the Series as of December 31, 2014 or June 30, 2015.
The Fund’s policy is to recognize transfers in and transfers out of the valuation levels as of the beginning of the reporting period. There were no transfers between Level 1 and Level 2 during the six months ended June 30, 2015.
Security Transactions, Investment Income and Expenses
Security transactions are accounted for on trade date. Dividend income is recorded on the ex-dividend date, except that if the ex-dividend date has passed, certain dividends from foreign securities are recorded as soon as the Series is informed of the ex-dividend date. Non-cash dividends, if any, are recorded at the fair value of the securities received. Interest income, including amortization of premium and accretion of discounts using the effective interest method, is earned from settlement date and accrued daily.
Expenses are recorded on an accrual basis. Most expenses of the Fund can be attributed to a specific series. Expenses which cannot be directly attributed are apportioned among the series in the Fund in such a manner as deemed equitable by the Fund’s Board, taking into consideration, among other things, the nature and type of expense. Income, expenses (other than shareholder services fees), and realized and unrealized gains and losses are prorated among the classes based on the relative net assets of each class. Class specific expenses are directly charged to that class.
12
Emerging Markets Series
Notes to Financial Statements (continued)
(unaudited)
| 2. | Significant Accounting Policies (continued) |
Security Transactions, Investment Income and Expenses (continued)
The Series uses the identified cost method for determining realized gain or loss on investments for both financial statement and federal income tax reporting purposes.
Foreign Currency Translation
The books and records of the Series are maintained in U.S. dollars. Foreign currencies, investments and other assets and liabilities are translated into U.S. dollars at the current exchange rates. Purchases and sales of investment securities and income and expenses are translated on the respective dates of such transactions. The Series does not isolate realized and unrealized gains and losses attributable to changes in the exchange rates from gains and losses that arise from changes in the fair value of investments. Such fluctuations are included with net realized and unrealized gain or loss on investments. Net realized foreign currency gains and losses represent foreign currency gains and losses between trade date and settlement date on securities transactions, gains and losses on disposition of foreign currencies and the difference between the amount of income and foreign withholding taxes recorded on the books of the Series and the amounts actually received or paid.
Forward Foreign Currency Exchange Contracts
The Series may purchase or sell forward foreign currency exchange contracts in order to hedge a portfolio position or specific transaction. Risks may arise if the counterparties to a contract are unable to meet the terms of the contract or if the value of the foreign currency moves unfavorably.
All forward foreign currency exchange contracts are adjusted daily by the exchange rate of the underlying currency and, for financial statement purposes, any gain or loss is recorded as unrealized gain or loss until a contract has been closed.
The Series may regularly trade forward foreign currency exchange contracts with off-balance sheet risk in the normal course of its investing activities to assist in managing exposure to changes in foreign currency exchange rates.
The notional or contractual amount of these instruments represents the investment the Series has in forward foreign currency exchange contracts and does not necessarily represent the amounts potentially at risk. The measurement of the risks associated with forward foreign currency exchange contracts is meaningful only when all related and offsetting transactions are considered. As of June 30, 2015, no investments in forward foreign currency exchange contracts were held by the Series.
Federal Taxes
The Series’ policy is to comply with the provisions of the Internal Revenue Code applicable to regulated investment companies. The Series is not subject to federal income tax or excise tax to the extent that the Series distributes to shareholders each year its taxable income, including any net realized gains on investments, in accordance with requirements of the Internal Revenue Code. Accordingly, no provision for federal income tax or excise tax has been made in the financial statements.
Management evaluates its tax positions to determine if the tax positions taken meet the minimum recognition threshold in connection with accounting for uncertainties in income tax positions taken or expected to be taken for the purposes of measuring and recognizing tax liabilities in the financial statements. Recognition of tax benefits of an uncertain tax position is required only when the position is “more likely than not” to be sustained assuming examination by taxing authorities. At June 30, 2015, the Series has recorded no liability for net unrecognized tax benefits relating to uncertain income tax positions taken or expected to be taken in future tax returns.
The Series files income tax returns in the U.S. federal jurisdiction, various states and foreign jurisdictions, as required. No income tax returns are currently under investigation. The statute of limitations on the Series’ tax returns remains open for the period ended December 31, 2011 and the years ended December 31, 2012 through December 31, 2014. The Series is not aware of any tax positions for which it is reasonably possible that the total amounts of unrecognized tax benefits will significantly change in the next twelve months.
13
Emerging Markets Series
Notes to Financial Statements (continued)
(unaudited)
| 2. | Significant Accounting Policies (continued) |
Foreign Taxes
Based on the Series’ understanding of the tax rules and rates related to income, gains and currency purchase/repatriation transactions for foreign jurisdictions in which it invests, the Series will provide for foreign taxes, and where appropriate, deferred foreign tax. The Series is subject to a tax imposed on short term capital gains on securities of issuers domiciled in India. The Series records an estimated deferred tax liability for securities that have been held for less than a year at the end of the reporting period, assuming those positions were disposed of at the end of the period. This amount is reported in Accrued foreign capital gains tax in the accompanying Statement of Assets and Liabilities. Realized losses on the sale of securities of issuers domiciled in India can be carried forward for eight years to offset potential future short term realized capital gains.
Distributions of Income and Gains
Distributions to shareholders of net investment income and net realized gains are made annually. An additional distribution may be necessary to avoid taxation of the Series. Distributions are recorded on the ex-dividend date.
Indemnifications
The Fund’s organizational documents provide former and current directors and officers with a limited indemnification against liabilities arising in connection with the performance of their duties to the Fund. In the normal course of business, the Fund may also enter into contracts that provide general indemnifications. The Fund’s maximum exposure under these arrangements is unknown as this would be dependent on future claims that may be made against the Fund. The risk of material loss from such claims is considered remote.
Other
The preparation of financial statements in conformity with GAAP requires management to make estimates and assumptions that affect the reported amounts of assets and liabilities and the disclosure of contingent assets and liabilities at the date of the financial statements and the reported amounts of income and expenses during the reporting period. Actual results could differ from those estimates.
| 3. | Transactions with Affiliates |
The Fund has an Investment Advisory Agreement (the “Agreement”) with the Advisor for which the Series pays a fee, computed daily and payable monthly, at an annual rate of 0.70% of the Series’ average daily net assets.
Under the Agreement, personnel of the Advisor provide the Series with advice and assistance in the choice of investments and the execution of securities transactions, and otherwise maintain the Series’ organization. The Advisor also provides the Fund with necessary office space and fund administration and support services. The salaries of all officers of the Fund (except a percentage of the Fund’s Chief Compliance Officer’s salary, which is paid by the Fund), and of all Directors who are “affiliated persons” of the Fund, or of the Advisor, and all personnel of the Fund, or of the Advisor, performing services relating to research, statistical and investment activities, are paid by the Advisor. Each “non-affiliated” Director receives an annual stipend, which is allocated among all the active series of the Fund. In addition, these Directors also receive a fee per Board meeting attended plus a fee for each committee meeting attended and are reimbursed for travel and other out-of-pocket expenses incurred by them in connection with attending such meetings. The Fund also has an Audit Committee Chair, who receives an additional annual stipend for this role.
The Class S shares of the Series are subject to a shareholder services fee in accordance with a shareholder services plan adopted by the Fund’s Board. The shareholder services fee is intended to compensate financial intermediaries, including affiliates of the Fund, in connection with the provision of direct client service, personal services, maintenance of shareholder accounts and reporting services. For these services, Class S of the Series pays a fee, computed daily and payable monthly, at an annual rate of 0.25% of the average daily net assets of Class S. The Fund has a Shareholder Services Agreement with the Advisor, for which the Advisor receives the shareholder services fee as stated above.
The Advisor has contractually agreed, until at least April 30, 2016, to waive its fee and, if necessary, pay other operating expenses of the Series in order to maintain total direct annual fund operating expenses for the Series, exclusive of each share
14
Emerging Markets Series
Notes to Financial Statements (continued)
(unaudited)
| 3. | Transactions with Affiliates (continued) |
class’ shareholder services fee, at no more than 0.90% of average daily net assets each year. Accordingly, the Advisor waived fees of $55,305 for the six months ended June 30, 2015, which is included as a reduction of expenses on the statement of operations. The Advisor is not eligible to recoup any expenses that have been waived or reimbursed.
Manning & Napier Investor Services, Inc., a registered broker-dealer affiliate of the Advisor, acts as distributor for the Fund’s shares. The services of Manning & Napier Investor Services, Inc. are provided at no additional cost to the Series.
Pursuant to a master services agreement dated November 1, 2014, the Fund pays the Advisor an annual fee related to fund accounting and administration of 0.0085% on the first $25 billion of average daily net assets (excluding Target Series and Strategic Income Series); 0.0075% on the next $15 billion of average daily net assets (excluding Target Series and Strategic Income Series); and 0.0065% of the average daily net assets in excess of $40 billion (excluding Target Series and Strategic Income Series); plus a base fee of $30,400 per series. Transfer agent fees are charged to the Fund on a per account basis. Additionally, certain transaction and out-of-pocket expenses, including charges for reporting relating to the Fund’s compliance program, are charged. The Advisor has agreements with BNY Mellon Investment Servicing (U.S.) Inc. (“BNY”) under which BNY serves as sub-accountant services agent and sub-transfer agent.
Expenses not directly attributable to a series are allocated based on each series’ relative net assets or number of accounts, depending on the expense.
| 4. | Purchases and Sales of Securities |
For the six months ended June 30, 2015, purchases and sales of securities, other than U.S. Government securities and short-term securities, were $39,224,439 and $43,525,887, respectively. There were no purchases or sales of U.S. Government securities.
| 5. | Capital Stock Transactions |
Transactions in shares of Class S and Class I of Emerging Markets Series were:
| | | | | | | | | | | | | | | | |
CLASS S: | | FOR THE SIX MONTHS ENDED 6/30/15 | | | FOR THE YEAR ENDED 12/31/14 | |
| | SHARES | | | AMOUNT | | | SHARES | | | AMOUNT | |
Sold | | | 812,529 | | | $ | 7,374,835 | | | | 1,309,793 | | | $ | 14,270,807 | |
Reinvested | | | — | | | | — | | | | 738,209 | | | | 6,947,173 | |
Repurchased | | | (490,438 | ) | | | (4,508,919 | ) | | | (1,379,719 | ) | | | (15,094,248 | ) |
| | | | | | | | | | | | | | | | |
Total | | | 322,091 | | | $ | 2,865,916 | | | | 668,283 | | | $ | 6,123,732 | |
| | | | | | | | | | | | | | | | |
15
Emerging Markets Series
Notes to Financial Statements (continued)
(unaudited)
| 5. | Capital Stock Transactions (continued) |
| | | | | | | | | | | | | | | | |
CLASS I: | | FOR THE SIX MONTHS ENDED 6/30/15 | | | FOR THE YEAR ENDED 12/31/14 | |
| | SHARES | | | AMOUNT | | | SHARES | | | AMOUNT | |
Sold | | | 388,273 | | | $ | 3,553,150 | | | | 1,672,858 | | | $ | 18,862,196 | |
Reinvested | | | — | | | | — | | | | 124,690 | | | | 1,163,812 | |
Repurchased | | | (1,099,819 | ) | | | (10,120,764 | ) | | | (55,732 | ) | | | (601,321 | ) |
| | | | | | | | | | | | | | | | |
Total | | | (711,546 | ) | | $ | (6,567,614 | ) | | | 1,741,816 | | | $ | 19,424,687 | |
| | | | | | | | | | | | | | | | |
Over 90% of the shares outstanding are fiduciary accounts where the Advisor has sole investment discretion. No shareholder exceeds the 10% threshold.
The Series may trade in instruments including written and purchased options, forward foreign currency exchange contracts and futures contracts and other derivatives in the normal course of investing activities to assist in managing exposure to various market risks. The Series may be subject to various elements of risk, which may involve, to a varying degree, elements of risk in excess of the amounts recognized for financial statement purposes. These risks include: the risk that changes in the value of a derivative may not correlate perfectly with the underlying asset, rate or index; counterparty credit risk related to over the counter derivative counterparties’ failure to perform under contract terms; liquidity risk related to the lack of a liquid market for these contracts allowing the fund to close out its position(s); and documentation risk relating to disagreement over contract terms. No such investments were held by the Series as of June 30, 2015.
Investing in securities of foreign companies and foreign governments involves special risks and considerations not typically associated with investing in securities of domestic companies and the U.S. Government. These risks include revaluation of currencies and future adverse political and economic developments. Moreover, securities of foreign companies and foreign governments and their markets may be less liquid and their prices more volatile than those of comparable domestic companies and the U.S. Government.
| 8. | Federal Income Tax Information |
The amount and characterization of certain income and capital gains to be distributed are determined in accordance with federal income tax regulations, which may differ from GAAP. The Series may periodically make reclassifications among its capital accounts to reflect income and gains available for distribution (or available capital loss carryovers) under income tax regulations without impacting the Series’ net asset value. Any such reclassifications are not reflected in the financial highlights.
The final determination of the tax character of current year distributions will be made at the conclusion of the fiscal year. The tax character of distributions paid for the year ended December 31, 2014 were as follows:
| | | | | | |
Ordinary income | | $ | 5,643,207 | | | |
Long-term capital gains | | | 2,795,292 | | | |
At June 30, 2015, identified cost for federal income tax purposes, the resulting gross unrealized appreciation and depreciation, and the net unrealized appreciation were as follows:
| | | | | | |
Cost for federal income tax purposes | | $ | 103,406,912 | | | |
Unrealized appreciation | | | 11,152,323 | | | |
Unrealized depreciation | | | (9,900,088 | ) | | |
| | | | | | |
Net unrealized appreciation | | $ | 1,252,235 | | | |
| | | | | | |
16
{This page intentionally left blank}
17
Emerging Markets Series
Literature Requests
(unaudited)
Proxy Voting Policies and Procedures
A description of the policies and procedures that the Fund uses to determine how to vote proxies relating to portfolio securities is available, without charge, upon request:
| | |
| By phone | | 1-800-466-3863 |
On the Securities and Exchange Commission’s (SEC) web site | | http://www.sec.gov |
Proxy Voting Record
Information regarding how the Fund voted proxies relating to portfolio securities during the most recent 12-month period ended June 30th is available, without charge, upon request:
| | |
| By phone | | 1-800-466-3863 |
| On the SEC’s web site | | http://www.sec.gov |
Quarterly Portfolio Holdings
The Series’ complete schedule of portfolio holdings for the 1st and 3rd quarters of each fiscal year are provided on Form N-Q, and are available, without charge, upon request:
| | |
| By phone | | 1-800-466-3863 |
| On the SEC’s web site | | http://www.sec.gov |
The Series’ Form N-Q may be reviewed and copied at the SEC’s Public Reference Room in Washington, D.C. Information on the operation of the Public Reference Room may be obtained by calling 1-800-SEC-0330.
Prospectus and Statement of Additional Information (SAI)
For more information about any of the Manning & Napier Fund, Inc. Series, you may obtain a prospectus and SAI at www.manning-napier.com or by calling (800) 466-3863. Before investing, carefully consider the objectives, risks, charges and expenses of the investment and read the prospectus carefully as it contains this and other information about the investment company. In addition, this information can be found on the SEC’s web site, http://www.sec.gov.
Additional information available at www.manning-napier.com
1. Fund Holdings - Month-End
2. Fund Holdings - Quarter-End
3. Shareholder Report - Annual
4. Shareholder Report - Semi-Annual
The Fund also offers electronic notification or “e-delivery” when certain documents are available on-line to be downloaded or reviewed. Direct shareholders can elect to receive electronic notification when shareholder reports, prospectus updates, and/or statements are available. If you do not currently have on-line access to your account, you can establish access by going to www.manning-napier.com, click on “Login” in the top corner of the page, and follow the prompts to self-enroll. Once enrolled, you can set your electronic notification preferences by clicking on the Account Options tab located within the green toolbar and then select E-Delivery Option. Should you have any questions on either how to establish on-line access or how to update your account settings, please contact Investor Services at 1-800-466-3863.
The Manning & Napier Fund, Inc. is managed by Manning & Napier Advisors, LLC. Manning & Napier Investor Services, Inc., an affiliate of Manning & Napier Advisors, LLC, is the distributor of the Fund shares.
MNEMS-6/15-SAR

Shareholder Expense Example
(unaudited)
As a shareholder of the Series, you may incur two types of costs: (1) transaction costs and (2) ongoing costs, including management fees and other Series expenses. This example is intended to help you understand your ongoing costs (in dollars) of investing in the Series and to compare these costs with the ongoing costs of investing in other mutual funds.
The example is based on an investment of $1,000 invested at the beginning of the period and held for the entire period (January 1, 2015 to June 30, 2015).
Actual Expenses
The Actual lines of the tables below provide information about actual account values and actual expenses. You may use the information in these lines, together with the amount you invested, to estimate the expenses that you paid over the period. Simply divide your account value by $1,000 (for example, an $8,600 account value divided by $1,000 = 8.6), then multiply the result by the number in the Actual line for the Series and Class in which you have invested under the heading entitled “Expenses Paid During Period” to estimate the expenses you paid on your account during this period.
Hypothetical Example for Comparison Purposes
The Hypothetical lines of the tables below provide information about hypothetical account values and hypothetical expenses based on the Class’ actual expense ratio and an assumed rate of return of 5% per year before expenses, which is not the Class’ actual return. The hypothetical account values and expenses may not be used to estimate the actual ending account balance or expenses you paid during the period. You may use this information to compare the ongoing costs of investing in a Class of the Series and other funds. To do so, compare this 5% hypothetical example for the Series and Class in which you have invested with the 5% hypothetical examples that appear in the shareholder reports of the other funds.
Please note that the expenses shown in the tables are meant to highlight your ongoing costs only and do not reflect any transaction costs. Therefore, the Hypothetical lines of the tables are useful in comparing ongoing costs only, and will not help you determine the relative total costs of owning different funds. In addition, if these transaction costs were included, your costs would have been higher.
| | | | | | | | |
| | | BEGINNING
ACCOUNT VALUE
1/1/15 | | ENDING
ACCOUNT VALUE
6/30/15 | | EXPENSES PAID
DURING PERIOD*
1/1/15-6/30/15 | | ANNUALIZED
EXPENSE RATIO1,2 |
Strategic Income Conservative Series | | | | | | | | |
Actual (Class S) | | $1,000.00 | | $1,001.50 | | $1.49 | | 0.30% |
Hypothetical (5% return before expenses) | | $1,000.00 | | $1,023.31 | | $1.51 | | 0.30% |
Actual (Class I) | | $1,000.00 | | $1,002.60 | | $0.25 | | 0.05% |
Hypothetical (5% return before expenses) | | $1,000.00 | | $1,024.55 | | $0.25 | | 0.05% |
|
|
| | | BEGINNING
ACCOUNT VALUE
1/1/15 | | ENDING ACCOUNT VALUE
6/30/15 | | EXPENSES PAID
DURING PERIOD*
1/1/15-6/30/15 | | ANNUALIZED
EXPENSE RATIO1,2 |
Strategic Income Moderate Series | | | | | | | | |
Actual (Class S) | | $1,000.00 | | $ 999.00 | | $1.49 | | 0.30% |
Hypothetical (5% return before expenses) | | $1,000.00 | | $1,023.31 | | $1.51 | | 0.30% |
Actual (Class I) | | $1,000.00 | | $1,000.20 | | $0.25 | | 0.05% |
Hypothetical (5% return before expenses) | | $1,000.00 | | $1,024.55 | | $0.25 | | 0.05% |
1Expense ratios of the Class do not include fees and expenses indirectly incurred by the underlying funds. If these expenses were included, the expense ratios would have been higher.
2Expenses are equal to each Class’ annualized expense ratio (for the six month period), multiplied by the average account value over the period, multiplied by 181/365 (to reflect the one-half year period). Expenses are based on the most recent fiscal half year. The Class’ total returns would have been lower had certain expenses not been reimbursed during the period.
1
Portfolio Composition as of June 30, 2015 - Asset Allocation1
(unaudited)
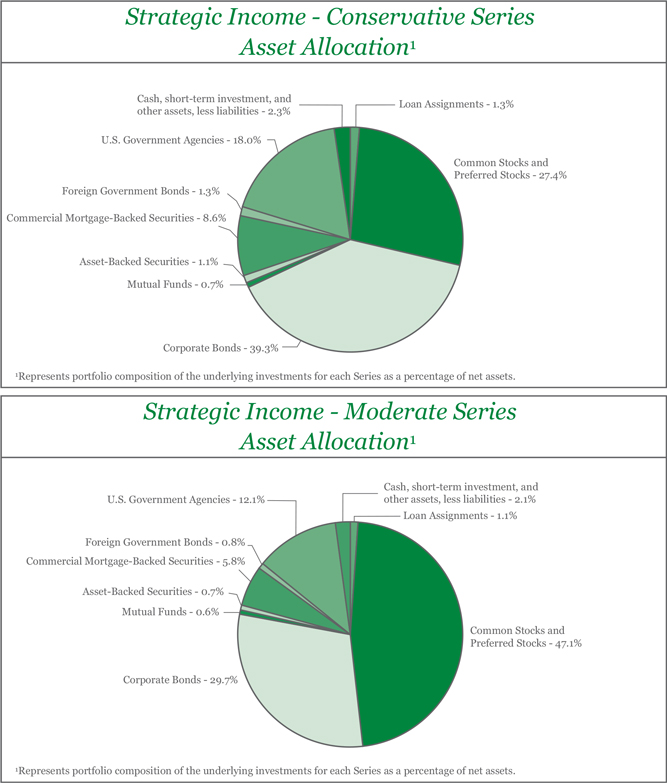
2
Investment Portfolios - June 30, 2015
(unaudited)
| | | | | | | | |
STRATEGIC INCOME CONSERVATIVE SERIES | | SHARES | | | VALUE (NOTE 2) | |
| | |
AFFILIATED INVESTMENT COMPANIES - 100.0% | | | | | | | | |
| | |
Manning & Napier Fund, Inc. - Core Bond Series, Class A | | | 1,220,837 | | | $ | 13,038,538 | |
Manning & Napier Fund, Inc. - Disciplined Value Series, Class I | | | 183,724 | | | | 2,902,841 | |
Manning & Napier Fund, Inc. - Equity Income Series, Class I | | | 229,591 | | | | 2,456,628 | |
Manning & Napier Fund, Inc. - High Yield Bond Series, Class I | | | 54,768 | | | | 496,202 | |
Manning & Napier Fund, Inc. - Real Estate Series, Class I | | | 170,535 | | | | 1,459,776 | |
Manning & Napier Fund, Inc. - Unconstrained Bond Series, Class I | | | 474,528 | | | | 4,489,037 | |
| | | | | | | | |
TOTAL AFFILIATED INVESTMENT COMPANIES | | | | | | | | |
(Identified Cost $25,201,103) | | | | | | | 24,843,022 | |
OTHER ASSETS, LESS LIABILITIES - 0.0%# | | | | | | | 5,950 | |
| | | | | | | | |
NET ASSETS - 100% | | | | | | $ | 24,848,972 | |
| | | | | | | | |
| | | | | | | | |
STRATEGIC INCOME MODERATE SERIES | | SHARES | | | VALUE (NOTE 2) | |
| | |
AFFILIATED INVESTMENT COMPANIES - 100.0% | | | | | | | | |
| | |
Manning & Napier Fund, Inc. - Core Bond Series, Class A | | | 702,883 | | | $ | 7,506,790 | |
Manning & Napier Fund, Inc. - Disciplined Value Series, Class I | | | 249,442 | | | | 3,941,189 | |
Manning & Napier Fund, Inc. - Emerging Markets Series, Class I | | | 70,156 | | | | 644,034 | |
Manning & Napier Fund, Inc. - Equity Income Series, Class I | | | 393,292 | | | | 4,208,222 | |
Manning & Napier Fund, Inc. - High Yield Bond Series, Class I | | | 117,181 | | | | 1,061,662 | |
Manning & Napier Fund, Inc. - Real Estate Series, Class I | | | 146,192 | | | | 1,251,399 | |
Manning & Napier Fund, Inc. - Unconstrained Bond Series, Class I | | | 270,668 | | | | 2,560,520 | |
| | | | | | | | |
TOTAL AFFILIATED INVESTMENT COMPANIES | | | | | | | | |
(Identified Cost $21,515,723) | | | | | | | 21,173,816 | |
LIABILITIES, LESS OTHER ASSETS - 0.0%# | | | | | | | (9,947 | ) |
| | | | | | | | |
NET ASSETS - 100% | | | | | | $ | 21,163,869 | |
| | | | | | | | |
#Less than 0.1%.
The accompanying notes are an integral part of the financial statements.
3
Statements of Assets and Liabilities
June 30, 2015 (unaudited)
| | | | | | | | | | | | |
| | | STRATEGIC INCOME
CONSERVATIVE SERIES | | STRATEGIC INCOME
MODERATE SERIES |
ASSETS: | | | | | | | | | | | | |
Total investments in Underlying Series: | | | | | | | | | | | | |
At value* (Note 2) | | $ | 24,843,022 | | | | | $ | 21,173,816 | | | |
Receivable from Advisor (Note 3) | | | 9,737 | | | | | | 9,817 | | | |
Receivable for shares of Underlying Series sold | | | 1,333,633 | | | | | | — | | | |
Receivable for fund shares sold | | | 15,000 | | | | | | — | | | |
Prepaid expenses | | | 11,094 | | | | | | 11,261 | | | |
| | | | | | | | | | | | |
TOTAL ASSETS | | | 26,212,486 | | | | | | 21,194,894 | | | |
| | | | | | | | | | | | |
LIABILITIES: | | | | | | | | | | | | |
Accrued fund accounting and administration fees (Note 3) | | | 8,049 | | | | | | 7,905 | | | |
Accrued shareholder services fees (Class S) (Note 3) | | | 3,248 | | | | | | 3,791 | | | |
Accrued transfer agent fees (Note 3) | | | 1,804 | | | | | | 1,702 | | | |
Accrued Chief Compliance Officer service fees (Note 3) | | | 382 | | | | | | 382 | | | |
Payable for fund shares repurchased | | | 1,333,633 | | | | | | — | | | |
Audit fees payable | | | 8,368 | | | | | | 8,385 | | | |
Accrued custodian fees | | | 4,923 | | | | | | 5,865 | | | |
Other payables and accrued expenses | | | 3,107 | | | | | | 2,995 | | | |
| | | | | | | | | | | | |
TOTAL LIABILITIES | | | 1,363,514 | | | | | | 31,025 | | | |
| | | | | | | | | | | | |
TOTAL NET ASSETS | | $ | 24,848,972 | | | | | $ | 21,163,869 | | | |
| | | | | | | | | | | | |
NET ASSETS CONSIST OF: | | | | | | | | | | | | |
Capital stock | | | 24,172 | | | | | | 19,659 | | | |
Additional paid-in-capital | | | 25,049,784 | | | | | | 21,357,755 | | | |
Undistributed net investment income | | | 21,236 | | | | | | 14,313 | | | |
Accumulated net realized gain on Underlying Series | | | 111,861 | | | | | | 114,049 | | | |
Net unrealized appreciation (depreciation) on Underlying Series | | | (358,081 | ) | | | | | (341,907 | ) | | |
| | | | | | | | | | | | |
TOTAL NET ASSETS | | $ | 24,848,972 | | | | | $ | 21,163,869 | | | |
| | | | | | | | | | | | |
Class S | | | | | | | | | | | | |
Net Assets | | $ | 14,301,941 | | | | | $ | 17,015,100 | | | |
Shares Outstanding | | | 1,391,263 | | | | | | 1,580,546 | | | |
Net Asset Value, Offering Price, and Redemption Price per share | | $ | 10.28 | | | | | $ | 10.77 | | | |
Class I | | | | | | | | | | | | |
Net Assets | | $ | 10,547,031 | | | | | $ | 4,148,769 | | | |
Shares Outstanding | | | 1,025,930 | | | | | | 385,366 | | | |
Net Asset Value, Offering Price, and Redemption Price per share | | $ | 10.28 | | | | | $ | 10.77 | | | |
*At identified cost | | $ | 25,201,103 | | | | | $ | 21,515,723 | | | |
| | | | | | | | | | | | |
The accompanying notes are an integral part of the financial statements.
4
Statements of Operations
For the Six Months Ended June 30, 2015 (unaudited)
| | | | | | | | | | | | |
| | | STRATEGIC INCOME
CONSERVATIVE SERIES | | STRATEGIC INCOME
MODERATE SERIES |
INVESTMENT INCOME: | | | | | | | | | | | | |
Income distributions from Underlying Series | | $ | 234,598 | | | | | $ | 161,641 | | | |
| | | | | | | | | | | | |
EXPENSES: | | | | | | | | | | | | |
Fund accounting and administration fees (Note 3) | | | 22,895 | | | | | | 22,981 | | | |
Shareholder services fees (Class S)(Note 3) | | | 19,095 | | | | | | 21,217 | | | |
Transfer agent fees (Note 3) | | | 2,034 | | | | | | 1,995 | | | |
Chief Compliance Officer service fees (Note 3) | | | 1,224 | | | | | | 1,224 | | | |
Directors’ fees (Note 3) | | | 294 | | | | | | 210 | | | |
Registration and filing fees | | | 13,930 | | | | | | 13,382 | | | |
Audit fees | | | 8,844 | | | | | | 8,838 | | | |
Custodian fees | | | 3,971 | | | | | | 4,657 | | | |
Miscellaneous | | | 5,840 | | | | | | 4,390 | | | |
| | | | | | | | | | | | |
Total Expenses | | | 78,127 | | | | | | 78,894 | | | |
Less reduction of expenses (Note 3) | | | (52,152 | ) | | | | | (52,580 | ) | | |
| | | | | | | | | | | | |
Net Expenses | | | 25,975 | | | | | | 26,314 | | | |
| | | | | | | | | | | | |
NET INVESTMENT INCOME | | | 208,623 | | | | | | 135,327 | | | |
| | | | | | | | | | | | |
REALIZED AND UNREALIZED GAIN (LOSS) ON UNDERLYING SERIES: | | | | | | | | | | | | |
Net realized gain (loss) on Underlying Series | | | (423,764 | ) | | | | | (205,060 | ) | | |
Net change in unrealized appreciation (depreciation) on Underlying Series | | | 286,670 | | | | | | 19,435 | | | |
| | | | | | | | | | | | |
NET REALIZED AND UNREALIZED GAIN (LOSS) ON UNDERLYING SERIES | | | (137,094 | ) | | | | | (185,625 | ) | | |
| | | | | | | | | | | | |
NET INCREASE IN NET ASSETS RESULTING FROM OPERATIONS | | $ | 71,529 | | | | | $ | (50,298 | ) | | |
| | | | | | | | | | | | |
The accompanying notes are an integral part of the financial statements.
5
Statements of Changes in Net Assets
| | | | | | | | | | | | | | | | | | | | | | | | |
| | | STRATEGIC INCOME CONSERVATIVE SERIES | | STRATEGIC INCOME MODERATE SERIES | | | |
| | | FOR THE SIX
MONTHS ENDED
6/30/15
(UNAUDITED) | | | | | FOR THE YEAR
ENDED 12/31/14 | | | | | FOR THE SIX
MONTHS ENDED
6/30/15
(UNAUDITED) | | | | | FOR THE YEAR
ENDED 12/31/14 | | | |
INCREASE (DECREASE) IN NET ASSETS: | | | | | | | | | | | | | | | | | | | | | | | | |
OPERATIONS: | | | | | | | | | | | | | | | | | | | | | | | | |
Net investment income | | | $ 208,623 | | | | | | $ 781,081 | | | | | | $ 135,327 | | | | | | $ 432,182 | | | |
Net realized gain (loss) on Underlying Series | | | (423,764 | ) | | | | | 223,007 | | | | | | (205,060 | ) | | | | | 125,386 | | | |
Distributions of realized gains from Underlying Series | | | — | | | | | | 621,734 | | | | | | — | | | | | | 459,349 | | | |
Net change in unrealized appreciation (depreciation) on underlying series | | | 286,670 | | | | | | (467,958 | ) | | | | | 19,435 | | | | | | (334,320 | ) | | |
Net increase (decrease) from operations | | | 71,529 | | | | | | 1,157,864 | | | | | | (50,298 | ) | | | | | 682,597 | | | |
DISTRIBUTIONS TO SHAREHOLDERS (Note 8): | | | | | | | | | | | | | | | | | | | | | | | | |
From net investment income (Class S) | | | (95,570 | ) | | | | | (447,032 | ) | | | | | (96,276 | ) | | | | | (447,885 | ) | | |
From net investment income (Class I) | | | (91,817 | ) | | | | | (397,266 | ) | | | | | (24,738 | ) | | | | | (72,798 | ) | | |
From net realized gain on investments (Class S) | | | — | | | | | | (267,079 | ) | | | | | — | | | | | | (370,111 | ) | | |
From net realized gain on investments (Class I) | | | — | | | | | | (239,700 | ) | | | | | — | | | | | | (57,935 | ) | | |
Total distributions to shareholders | | | (187,387 | ) | | | | | (1,351,077 | ) | | | | | (121,014 | ) | | | | | (948,729 | ) | | |
CAPITAL STOCK ISSUED AND REPURCHASED: | | | | | | | | | | | | | | | | | | | | | | | | |
Net increase (decrease) from capital share transactions (Note 6) | | | (2,696,191 | ) | | | | | 14,914,530 | | | | | | 3,448,031 | | | | | | 10,057,780 | | | |
Net increase (decrease) in net assets | | | (2,812,049 | ) | | | | | 14,721,317 | | | | | | 3,276,719 | | | | | | 9,791,648 | | | |
NET ASSETS: | | | | | | | | | | | | | | | | | | | | | | | | |
Beginning of period | | | 27,661,021 | | | | | | 12,939,704 | | | | | | 17,887,150 | | | | | | 8,095,502 | | | |
End of period (including undistributed net investment income of $21,236, $0, $14,313 and $0, respectively) | | | $24,848,972 | | | | | | $27,661,021 | | | | | | $21,163,869 | | | | | | $17,887,150 | | | |
The accompanying notes are an integral part of the financial statements.
6
Financial Highlights
| | | | | | | | | | | | | | | | | | | | |
STRATEGIC INCOME CONSERVATIVE SERIES CLASS S | | FOR THE SIX MONTHS ENDED | | FOR THE YEARS ENDED | | FOR THE PERIOD
8/1/121 TO 12/31/12 |
| | 6/30/15
(UNAUDITED) | | 12/31/14 | | 12/31/13 | |
Per share data (for a share outstanding throughout each period): | | | | | | | | | | | | | | | | | | | | |
Net asset value - Beginning of period | | | | $10.33 | | | | | $10.24 | | | | | $10.07 | | | | | $10.00 | |
| | | | | | | | | | | | | | | | | | | | |
Income (loss) from investment operations: | | | | | | | | | | | | | | | | | | | | |
Net investment income2,3 | | | | 0.07 | | | | | 0.37 | | | | | 0.39 | | | | | 0.30 | |
Net realized and unrealized gain (loss) on underlying series | | | | (0.05 | ) | | | | 0.28 | | | | | 0.10 | | | | | 0.01 | |
| | | | | | | | | | | | | | | | | | | | |
Total from investment operations | | | | 0.02 | | | | | 0.65 | | | | | 0.49 | | | | | 0.31 | |
| | | | | | | | | | | | | | | | | | | | |
Less distributions to shareholders: | | | | | | | | | | | | | | | | | | | | |
From net investment income | | | | (0.07 | ) | | | | (0.35 | ) | | | | (0.30 | ) | | | | (0.24 | ) |
From net realized gain on investments | | | | — | | | | | (0.21 | ) | | | | (0.02 | ) | | | | (0.00 | )4 |
| | | | | | | | | | | | | | | | | | | | |
Total distributions to shareholders | | | | (0.07 | ) | | | | (0.56 | ) | | | | (0.32 | ) | | | | (0.24 | ) |
| | | | | | | | | | | | | | | | | | | | |
Net asset value - End of period | | | | $10.28 | | | | | $10.33 | | | | | $10.24 | | | | | $10.07 | |
| | | | | | | | | | | | | | | | | | | | |
Net assets - End of period (000’s omitted) | | | | $14,302 | | | | | $15,394 | | | | | $8,927 | | | | | $2,115 | |
| | | | | | | | | | | | | | | | | | | | |
Total return5 | | | | 0.15% | | | | | 6.30% | | | | | 4.96% | | | | | 3.12% | |
Ratios (to average net assets)/Supplemental Data: | | | | | | | | | | | | | | | | | | | | |
Expenses* | | | | 0.30% | 6,7 | | | | 0.30% | 8 | | | | 0.30% | 9 | | | | 0.30% | 6,10 |
Net investment income3 | | | | 1.40% | 6 | | | | 3.50% | | | | | 3.84% | | | | | 2.95% | |
Series portfolio turnover11 | | | | 60% | | | | | 39% | | | | | 116% | | | | | 5% | |
* The investment advisor paid a portion of the Series’ expenses. If these expenses had been incurred by the Series, the expense ratios (to | |
average net assets) would have been increased by the following amounts: | | | | 0.38% | 6,7 | | | | 0.43% | 8 | | | | 1.23% | 9 | | | | 10.89% | 6,10,12 |
STRATEGIC INCOME CONSERVATIVE SERIES CLASS I | | FOR THE SIX MONTHS ENDED | | FOR THE YEARS ENDED | | FOR THE PERIOD
8/1/121 TO 12/31/12 |
| | 6/30/15
(UNAUDITED) | | 12/31/14 | | 12/31/13 | |
Per share data (for a share outstanding throughout each period): | | | | | | | | | | | | | | | | | | | | |
Net asset value - Beginning of period | | | | $10.33 | | | | | $10.24 | | | | | $10.06 | | | | | $10.00 | |
| | | | | | | | | | | | | | | | | | | | |
Income (loss) from investment operations: | | | | | | | | | | | | | | | | | | | | |
Net investment income2,3 | | | | 0.09 | | | | | 0.41 | | | | | 0.43 | | | | | 0.22 | |
Net realized and unrealized gain (loss) on underlying series | | | | (0.06 | ) | | | | 0.26 | | | | | 0.09 | | | | | 0.08 | |
| | | | | | | | | | | | | | | | | | | | |
Total from investment operations | | | | 0.03 | | | | | 0.67 | | | | | 0.52 | | | | | 0.30 | |
| | | | | | | | | | | | | | | | | | | | |
Less distributions to shareholders: | | | | | | | | | | | | | | | | | | | | |
From net investment income | | | | (0.08 | ) | | | | (0.37 | ) | | | | (0.32 | ) | | | | (0.24 | ) |
From net realized gain on investments | | | | — | | | | | (0.21 | ) | | | | (0.02 | ) | | | | (0.00 | )4 |
| | | | | | | | | | | | | | | | | | | | |
Total distributions to shareholders | | | | (0.08 | ) | | | | (0.58 | ) | | | | (0.34 | ) | | | | (0.24 | ) |
| | | | | | | | | | | | | | | | | | | | |
Net asset value - End of period | | | | $10.28 | | | | | $10.33 | | | | | $10.24 | | | | | $10.06 | |
| | | | | | | | | | | | | | | | | | | | |
Net assets - End of period (000’s omitted) | | | | $10,547 | | | | | $12,267 | | | | | $4,013 | | | | | $52 | |
| | | | | | | | | | | | | | | | | | | | |
Total return5 | | | | 0.26% | | | | | 6.55% | | | | | 5.28% | | | | | 3.08% | |
Ratios (to average net assets)/Supplemental Data: | | | | | | | | | | | | | | | | | | | | |
Expenses* | | | | 0.05% | 6,7 | | | | 0.05% | 8 | | | | 0.05% | 9 | | | | 0.05% | 6,10 |
Net investment income3 | | | | 1.66% | 6 | | | | 3.92% | | | | | 4.19% | | | | | 2.15% | |
Series portfolio turnover11 | | | | 60% | | | | | 39% | | | | | 116% | | | | | 5% | |
* The investment advisor paid a portion of the Series’ expenses. If these expenses had been incurred by the Series, the expense ratios (to | |
average net assets) would have been increased by the following amounts: | | | | 0.38% | 6,7 | | | | 0.41% | 8 | | | | 1.23% | 9 | | | | 27.14% | 6,10,12 |
1Commencement of operations.
2Calculated based on average shares outstanding during the periods.
3Net investment income is affected by the timing of distributions from the underlying funds in which the Trusts invest. The ratios do not include net investment income of the underlying funds in which the Trusts invest.
4Less than ($0.01) per share.
5Represents aggregate total return for the periods indicated. Total return would have been lower had certain expenses not been reimbursed during the periods. Periods less than one year are not annualized.
6Annualized.
7Expense ratios do not include expenses of the Underlying Series in which the Series invests. The average expense ratio of the Underlying Series was 0.59%.
8Expense ratios do not include expenses of the Underlying Series in which the Series invests. The average expense ratio of the Underlying Series was 0.48%.
9Expense ratios do not include expenses of the Underlying Series in which the Series invests. The average expense ratio of the Underlying Series was 0.64%.
10Expense ratios do not include expenses of the Underlying Series in which the Series invests. The average expense ratio of the Underlying Series was 0.71%.
11Reflects activity of the Series and does not include the activity of the Underlying Series.
12The increase to the expense ratios (to average net assets) is largely due to the small net assets in each class.
The accompanying notes are an integral part of the financial statements.
7
Financial Highlights
| | | | | | | | | | | | | | | | | | | | |
STRATEGIC INCOME MODERATE SERIES CLASS S | | FOR THE SIX MONTHS ENDED | | FOR THE YEARS ENDED | | FOR THE PERIOD
8/1/121 TO 12/31/12 |
| | 6/30/15
(UNAUDITED) | | 12/31/14 | | 12/31/13 | |
Per share data (for a share outstanding throughout each period): | | | | | | | | | | | | | | | | | | | | |
Net asset value - Beginning of period | | | | $10.84 | | | | | $10.80 | | | | | $10.07 | | | | | $10.00 | |
| | | | | | | | | | | | | | | | | | | | |
Income (loss) from investment operations: | | | | | | | | | | | | | | | | | | | | |
Net investment income2,3 | | | | 0.07 | | | | | 0.38 | | | | | 0.32 | | | | | 0.30 | |
Net realized and unrealized gain (loss) on underlying series | | | | (0.08 | ) | | | | 0.34 | | | | | 0.82 | | | | | 0.02 | |
| | | | | | | | | | | | | | | | | | | | |
Total from investment operations | | | | (0.01 | ) | | | | 0.72 | | | | | 1.14 | | | | | 0.32 | |
| | | | | | | | | | | | | | | | | | | | |
Less distributions to shareholders: | | | | | | | | | | | | | | | | | | | | |
From net investment income | | | | (0.06 | ) | | | | (0.37 | ) | | | | (0.30 | ) | | | | (0.25 | ) |
From net realized gain on investments | | | | — | | | | | (0.31 | ) | | | | (0.11 | ) | | | | (0.00 | )4 |
| | | | | | | | | | | | | | | | | | | | |
Total distributions to shareholders | | | | (0.06 | ) | | | | (0.68 | ) | | | | (0.41 | ) | | | | (0.25 | ) |
| | | | | | | | | | | | | | | | | | | | |
Net asset value - End of period | | | | $10.77 | | | | | $10.84 | | | | | $10.80 | | | | | $10.07 | |
| | | | | | | | | | | | | | | | | | | | |
Net assets - End of period (000’s omitted) | | | | $17,015 | | | | | $15,751 | | | | | $6,722 | | | | | $2,019 | |
| | | | | | | | | | | | | | | | | | | | |
Total return5 | | | | (0.10% | ) | | | | 6.66% | | | | | 11.49% | | | | | 3.23% | |
Ratios (to average net assets)/Supplemental Data: | | | | | | | | | | | | | | | | | | | | |
Expenses* | | | | 0.30% | 6,7 | | | | 0.30% | 8 | | | | 0.30% | 9 | | | | 0.30% | 6,10 |
Net investment income3 | | | | 1.27% | 6 | | | | 3.37% | | | | | 2.99% | | | | | 2.92% | |
Series portfolio turnover11 | | | | 49% | | | | | 35% | | | | | 78% | | | | | 7% | |
* The investment advisor paid a portion of the Series’ expenses. If these expenses had been incurred by the Series, the expense ratios (to | |
average net assets) would have been increased by the following amounts: | | | | 0.52% | 6,7 | | | | 0.73% | 8 | | | | 1.82% | 9 | | | | 10.28% | 6,10,12 |
STRATEGIC INCOME MODERATE SERIES CLASS I | | FOR THE SIX MONTHS ENDED | | FOR THE YEARS ENDED | | FOR THE PERIOD
8/1/121 TO 12/31/12 |
| | 6/30/15
(UNAUDITED) | | 12/31/14 | | 12/31/13 | |
Per share data (for a share outstanding throughout each period): | | | | | | | | | | | | | | | | | | | | |
Net asset value - Beginning of period | | | | $10.84 | | | | | $10.80 | | | | | $10.07 | | | | | $10.00 | |
| | | | | | | | | | | | | | | | | | | | |
Income (loss) from investment operations: | | | | | | | | | | | | | | | | | | | | |
Net investment income2,3 | | | | 0.09 | | | | | 0.41 | | | | | 0.55 | | | | | 0.22 | |
Net realized and unrealized gain (loss) on underlying series | | | | (0.09 | ) | | | | 0.34 | | | | | 0.62 | | | | | 0.10 | |
| | | | | | | | | | | | | | | | | | | | |
Total from investment operations | | | | — | | | | | 0.75 | | | | | 1.17 | | | | | 0.32 | |
| | | | | | | | | | | | | | | | | | | | |
Less distributions to shareholders: | | | | | | | | | | | | | | | | | | | | |
From net investment income | | | | (0.07 | ) | | | | (0.40 | ) | | | | (0.33 | ) | | | | (0.25 | ) |
From net realized gain on investments | | | | — | | | | | (0.31 | ) | | | | (0.11 | ) | | | | (0.00 | )4 |
| | | | | | | | | | | | | | | | | | | | |
Total distributions to shareholders | | | | (0.07 | ) | | | | (0.71 | ) | | | | (0.44 | ) | | | | (0.25 | ) |
| | | | | | | | | | | | | | | | | | | | |
Net asset value - End of period | | | | $10.77 | | | | | $10.84 | | | | | $10.80 | | | | | $10.07 | |
| | | | | | | | | | | | | | | | | | | | |
Net assets - End of period (000’s omitted) | | | | $4,149 | | | | | $2,136 | | | | | $1,373 | | | | | $53 | |
| | | | | | | | | | | | | | | | | | | | |
Total return5 | | | | 0.02% | | | | | 6.90% | | | | | 11.73% | | | | | 3.29% | |
Ratios (to average net assets)/Supplemental Data: | | | | | | | | | | | | | | | | | | | | |
Expenses* | | | | 0.05% | 6,7 | | | | 0.05% | 8 | | | | 0.05% | 9 | | | | 0.05% | 6,10 |
Net investment income3 | | | | 1.60% | 6 | | | | 3.65% | | | | | 5.17% | | | | | 2.16% | |
Series portfolio turnover11 | | | | 49% | | | | | 35% | | | | | 78% | | | | | 7% | |
* The investment advisor paid a portion of the Series’ expenses. If these expenses had been incurred by the Series, the expense ratios (to | |
average net assets) would have been increased by the following amounts: | | | | 0.52% | 6,7 | | | | 0.73% | 8 | | | | 1.82% | 9 | | | | 27.25% | 6,10,12 |
1Commencement of operations.
2Calculated based on average shares outstanding during the periods.
3Net investment income is affected by the timing of distributions from the underlying funds in which the Trusts invest. The ratios do not include net investment income of the underlying funds in which the Trusts invest.
4Less than ($0.01) per share.
5Represents aggregate total return for the periods indicated. Total return would have been lower had certain expenses not been reimbursed during the periods. Periods less than one year are not annualized.
6Annualized.
7Expense ratios do not include expenses of the Underlying Series in which the Series invests. The average expense ratio of the Underlying Series was 0.63%.
8Expense ratios do not include expenses of the Underlying Series in which the Series invests. The average expense ratio of the Underlying Series was 0.49%.
9Expense ratios do not include expenses of the Underlying Series in which the Series invests. The average expense ratio of the Underlying Series was 0.65%.
10Expense ratios do not include expenses of the Underlying Series in which the Series invests. The average expense ratio of the Underlying Series was 0.70%.
11Reflects activity of the Series and does not include the activity of the Underlying Series.
12The increase to the expense ratios (to average net assets) is largely due to the small net assets in each class.
The accompanying notes are an integral part of the financial statements.
8
Notes to Financial Statements
(unaudited)
Strategic Income Conservative Series and Strategic Income Moderate Series (each the “Series”) are no-load diversified series of Manning & Napier Fund, Inc. (the “Fund”). The Fund is organized in Maryland and is registered under the Investment Company Act of 1940 (the “1940 Act”), as amended, as an open-end management investment company.
Strategic Income Conservative Series’ investment objective is to manage against capital risk and generate income with a secondary goal of pursuing long-term capital growth. Strategic Income Moderate Series’ investment objective is to manage against capital risk while generating income and pursuing long-term capital growth.
Each Series seeks to achieve its investment objective by investing in a combination of other Manning & Napier mutual funds (the “Underlying Series”). As of June 30, 2015, the Underlying Series include the Core Bond Series, Unconstrained Bond Series, formerly Core Plus Bond Series, Disciplined Value Series, High Yield Bond Series, Real Estate Series and Equity Income Series of the Fund for Strategic Income Conservative Series, and the Core Bond Series, Unconstrained Bond Series, Disciplined Value Series, Emerging Markets Series, High Yield Bond Series, Real Estate Series and Equity Income Series of the Fund for Strategic Income Moderate Series. The financial statements of the Underlying Series, which are available at www.manning-napier.com, should be read in conjunction with the Series’ financial statements.
Each Series is authorized to issue two classes of shares (Class S and I). Each class of shares is substantially the same, except that Class S shares bear a shareholder services fee.
The Fund’s advisor is Manning & Napier Advisors, LLC (the “Advisor”). Shares of each Series are offered to investors and employees of the Advisor and its affiliates. The total authorized capital stock of the Fund consists of 15 billion shares of common stock each having a par value of $0.01. As of June 30, 2015, 10.6 billion shares have been designated in total among 41 series, of which 100 million have been designated in each of the Series for Class S common stock and 100 million have been designated in each of the Series for Class I common stock.
| 2. | Significant Accounting Policies |
The following is a summary of significant accounting policies followed by the Series. Each Series is an investment company and, accordingly, follows the investment company accounting and reporting guidance of the Financial Accounting Standards Board Accounting Standards Codification Topic 946 - Investment Companies, which is part of accounting principles generally accepted in the United States of America (“GAAP”).
Security Valuation
Investments in the Underlying Series are valued at their net asset value per share on valuation date. In the absence of the availability of a net asset value per share on the Underlying Series, security valuations may be determined in good faith by the Advisor under procedures approved by and under the general supervision and responsibility of the Fund’s Board of Directors (the “Board”).
Volume and level of activity in established markets for an asset or liability are evaluated to determine whether recent transactions and quoted prices are determinative of fair value. Where there have been significant decreases in volume and level of activity, further analysis and adjustment may be necessary to estimate fair value. The Series measure fair value in these instances by the use of inputs and valuation techniques which may be based upon current market prices of securities that are comparable in coupon, rating, maturity and industry and/or expectation of future cash flows. As a result of trading in relatively thin markets and/or markets that experience significant volatility, the prices used by the Series to value these securities may differ from the value that would be realized if these securities were sold, and the differences could be material.
Securities for which representative valuations or prices are not available from the Series’ pricing service may be valued at fair value as determined in good faith by the Advisor under procedures approved by and under the general supervision and responsibility of the Board. Due to the inherent uncertainty of valuations of such securities, the fair value may differ significantly from the values that would have been used had a ready market for such securities existed. If trading or events occurring after
9
Notes to Financial Statements (continued)
(unaudited)
| 2. | Significant Accounting Policies (continued) |
Security Valuation (continued)
the close of the principal market in which securities are traded are expected to materially affect the value of those securities, then they may be valued at their fair value, taking this trading or these events into account.
Various inputs are used in determining the value of the Series’ assets or liabilities carried at fair value. These inputs are summarized in three broad levels. Level 1 includes quoted prices in active markets for identical assets and liabilities. Level 2 includes other significant observable inputs (including quoted prices for similar securities, interest rates, prepayment speeds, credit risk, etc.). Level 3 includes significant unobservable inputs (including the Series’ own assumptions in determining the fair value of investments). A financial instrument’s level within the fair value hierarchy is based on the lowest level on any input both individually and in aggregate that is significant to the fair value measurement. The inputs or methodology used for valuing securities are not necessarily an indication of the risk associated with investing in those securities.
The following is a summary of the valuation levels used for major security types as of June 30, 2015 in valuing the Series’ assets or liabilities carried at fair value:
| | | | | | | | | | | | | | | | |
| | | STRATEGIC INCOME CONSERVATIVE SERIES | |
| DESCRIPTION | | TOTAL | | | LEVEL 1 | | | LEVEL 2 | | | LEVEL 3 | |
Assets: | | | | | | | | | | | | | | | | |
Mutual funds | | $ | 24,843,022 | | | $ | 24,843,022 | | | $ | — | | | $ | — | |
| | | | | | | | | | | | | | | | |
Total assets: | | $ | 24,843,022 | | | $ | 24,843,022 | | | $ | — | | | $ | — | |
| | | | | | | | | | | | | | | | |
| | | | | | | | | | | | | | | | |
| | | STRATEGIC INCOME MODERATE SERIES | |
| DESCRIPTION | | TOTAL | | | LEVEL 1 | | | LEVEL 2 | | | LEVEL 3 | |
Assets: | | | | | | | | | | | | | | | | |
Mutual funds | | $ | 21,173,816 | | | $ | 21,173,816 | | | $ | — | | | $ | — | |
| | | | | | | | | | | | | | | | |
Total assets: | | $ | 21,173,816 | | | $ | 21,173,816 | | | $ | — | | | $ | — | |
| | | | | | | | | | | | | | | | |
There were no Level 2 or Level 3 securities held by either of the Series as of December 31, 2014 or June 30, 2015.
The Fund’s policy is to recognize transfers in and transfers out of the valuation levels as of the beginning of the reporting period. There were no transfers between Level 1 and Level 2 during the six months ended June 30, 2015.
Security Transactions, Investment Income and Expenses
Security transactions are accounted for on trade date. Dividend income is recorded on the ex-dividend date. Non-cash dividends, if any, are recorded at the fair value of the securities received. Income and capital gains distributions from the Underlying Series, if any, are recorded on the ex-dividend date.
Expenses are recorded on an accrual basis. Most expenses of the Fund can be attributed to a specific series. Expenses which cannot be directly attributed are apportioned among the series in the Fund in such a manner as deemed equitable by the Fund’s Board, taking into consideration, among other things, the nature and type of expense. Income, expenses (other than shareholder services fees), and realized and unrealized gains and losses are prorated among the classes based on the relative net assets of each class. Class specific expenses are directly charged to that class. Expenses included in the accompanying Statements of Operations do not include any expense of the Underlying Series.
The Series use the identified cost method for determining realized gain or loss on investments for both financial statement and federal income tax reporting purposes.
Federal Taxes
Each Series’ policy is to comply with the provisions of the Internal Revenue Code applicable to regulated investment companies. The Series are not subject to federal income tax or excise tax to the extent that each Series distributes to shareholders each
10
Notes to Financial Statements (continued)
(unaudited)
| 2. | Significant Accounting Policies (continued) |
Federal Taxes (continued)
year its taxable income, including any net realized gains on investments, in accordance with requirements of the Internal Revenue Code. Accordingly, no provision for federal income tax or excise tax has been made in the financial statements.
Management evaluates its tax positions to determine if the tax positions taken meet the minimum recognition threshold in connection with accounting for uncertainties in income tax positions taken or expected to be taken for the purposes of measuring and recognizing tax liabilities in the financial statements. Recognition of tax benefits of an uncertain tax position is required only when the position is “more likely than not” to be sustained assuming examination by taxing authorities. At June 30, 2015, the Series have recorded no liability for net unrecognized tax benefits relating to uncertain income tax positions taken or expected to be taken in future tax returns.
The Series file income tax returns in the U.S. federal jurisdiction, various states and foreign jurisdictions, as required. No income tax returns are currently under investigation. As the commencement of operations of the Series was August 1, 2012, the statute of limitations remains open for the period ended December 31, 2012 and the years ended December 31, 2013 and December 31, 2014. The Series are not aware of any tax positions for which it is reasonably possible that the total amounts of unrecognized tax benefits will significantly change in the next twelve months.
Foreign Taxes
Based on the Series’ understanding of the tax rules and rates related to income, gains and currency purchase/ repatriation transactions for foreign jurisdictions in which they invest, the Series will provide for foreign taxes, and where appropriate, deferred foreign tax.
Distributions of Income and Gains
Distributions to shareholders of net investment income are made quarterly. Distributions of net realized gains are made annually. An additional distribution may be necessary to avoid taxation of a Series. Distributions are recorded on the ex-dividend date.
Indemnifications
The Fund’s organizational documents provide former and current directors and officers with a limited indemnification against liabilities arising in connection with the performance of their duties to the Fund. In the normal course of business, the Fund may also enter into contracts that provide general indemnifications. The Fund’s maximum exposure under these arrangements is unknown as this would be dependent on future claims that may be made against the Fund. The risk of material loss from such claims is considered remote.
Other
The preparation of financial statements in conformity with GAAP requires management to make estimates and assumptions that affect the reported amounts of assets and liabilities and the disclosure of contingent assets and liabilities at the date of the financial statements and the reported amounts of income and expenses during the reporting period. Actual results could differ from those estimates.
| 3. | Transactions with Affiliates |
The Fund has an Investment Advisory Agreement (the “Agreement”) with the Advisor, for which the Advisor does not receive an advisory fee for the services it performs for the Series. However, the Advisor is entitled to receive an advisory fee from each of the Underlying Series in which the Series invest.
Under the Agreement, personnel of the Advisor provide the Series with advice and assistance in the choice of investments and the execution of securities transactions, and otherwise maintain the Series’ organization. The Advisor also provides the Fund with necessary office space and fund administration and support services. The salaries of all officers of the Fund (except a percentage of the Fund’s Chief Compliance Officer’s salary, which is paid by the Fund), and of all Directors who are “affiliated persons” of the Fund, or of the Advisor, and all personnel of the Fund, or of the Advisor, performing services relating to research, statistical and investment activities, are paid by the Advisor. Each “non-affiliated” Director receives an annual stipend, which is allocated among all the active series of the Fund. In addition, these Directors also receive a fee per Board meeting
11
Notes to Financial Statements (continued)
(unaudited)
| 3. | Transactions with Affiliates (continued) |
attended plus a fee for each committee meeting attended and are reimbursed for travel and other out-of-pocket expenses incurred by them in connection with attending such meetings. The Fund also has an Audit Committee Chair, who receives an additional annual stipend for this role.
The Class S shares of the Series are subject to a shareholder services fee in accordance with a shareholder service plan adopted by the Board. The shareholder services fee is intended to compensate financial intermediaries, including affiliates of the Fund, in connection with the provision of direct client services, personal services, maintenance of shareholder accounts and reporting services. For these services, Class S of the Series pays a fee, computed daily and payable monthly, at an annual rate of 0.25% of the average daily net assets of Class S. The Fund has a Shareholder Services Agreement with the Advisor, for which the Advisor receives the shareholder services fee as stated above.
Manning & Napier Investor Services, Inc., a registered broker-dealer affiliate of the Advisor, acts as distributor for the Fund’s shares. The services of Manning & Napier Investor Services, Inc. are provided at no additional cost to the Series.
The Advisor has contractually agreed, until at least April 30, 2016, to limit each class’ total direct annual fund operating expenses for the Series at no more than 0.05% for each class, exclusive of each class’ shareholder services fee, of average daily net assets each year. The Advisor’s agreement to limit each class’ operating expenses is limited to direct operating expenses and, therefore, does not apply to the indirect expenses incurred by the Series through their investments in the Underlying Series. For the six months ended June 30, 2015, the Advisor reimbursed expenses of $52,152 for Strategic Income Conservative Series and $52,580 for Strategic Income Moderate Series, which is included as a reduction of expenses on the Statements of Operations. The Advisor is not eligible to recoup any expenses that have been waived or reimbursed in prior years.
Pursuant to a master services agreement dated November 1, 2014, the Fund pays the Advisor an annual fee related to fund accounting and administration of 0.00225% of average daily net assets with an annual base fee of $45,400 per series. Transfer agent fees are charged to the Fund on a per account basis. Additionally, certain transaction and out-of-pocket expenses, including charges for reporting relating to the Fund’s compliance program, are charged. The Advisor has agreements with BNY Mellon Investment Servicing (U.S.) Inc. (“BNY”) under which BNY serves as sub-accountant services agent and sub-transfer agent.
Expenses not directly attributable to a series are allocated based on each series’ relative net assets or number of accounts, depending on the expense.
| 4. | Purchases and Sales of Securities |
For the six months ended June 30, 2015, purchases and sales of Underlying Series were as follows:
| | | | | | | | | | | | |
| SERIES | | PURCHASES | | SALES | | |
Strategic Income Conservative Series | | | $ | 16,361,510 | | | | $ | 19,080,375 | | | |
Strategic Income Moderate Series | | | $ | 13,731,980 | | | | $ | 9,999,840 | | | |
12
Notes to Financial Statements (continued)
(unaudited)
| 5. | Investments in Affiliated Issuers |
A summary of the Series’ transactions in the shares of affiliated issuers during the six months ended June 30, 2015 is set forth below:
| | | | | | | | | | | | | | | | | | | | | | | | | | | | |
STRATEGIC
INCOME
CONSERVATIVE
SERIES | | VALUE AT
12/31/14 | | | PURCHASE
COST | | | SALES
PROCEEDS | | | VALUE AT
6/30/15 | | | SHARES HELD
AT 6/30/15 | | | DIVIDEND
INCOME
1/1/15
THROUGH
6/30/15 | | | DISTRIBUTIONS
AND NET REALIZED
GAIN/(LOSS)
1/1/15
THROUGH
6/30/15 | |
Manning & Napier Core Bond Series
- Class A | | | — | | | $ | 14,489,116 | | | $ | 1,345,488 | | | $ | 13,038,538 | | | $ | 1,220,837 | | | $ | 38,994 | | | $ | (7,864 | ) |
Manning & Napier Disciplined Value Series
- Class I | | $ | 3,268,770 | | | | 291,376 | | | | 629,304 | | | | 2,902,841 | | | | 183,724 | | | | 34,126 | | | | 41,750 | |
Manning & Napier Equity Income Series
- Class I | | | 2,814,926 | | | | 167,890 | | | | 509,384 | | | | 2,456,628 | | | | 229,591 | | | | — | | | | 42,806 | |
Manning & Napier High Yield Bond Series
- Class I | | | 549,158 | | | | 38,380 | | | | 97,360 | | | | 496,202 | | | | 54,768 | | | | 12,023 | | | | (6,958 | ) |
Manning & Napier Real Estate Series
- Class I | | | 1,517,163 | | | | 265,423 | | | | 263,866 | | | | 1,459,776 | | | | 170,535 | | | | — | | | | 8,052 | |
Manning & Napier Unconstrained Bond Series
- Class I | | | 19,548,965 | | | | 1,109,325 | | | | 16,234,973 | | | | 4,489,037 | | | | 474,528 | | | | 149,455 | | | | (501,550 | ) |
| | | | | | | | | | | | | | | | | | | | | | | | | | | | |
| | $ | 27,698,982 | | | $ | 16,361,510 | | | $ | 19,080,375 | | | $ | 24,843,022 | | | | | | | $ | 234,598 | | | $ | (423,764 | ) |
| | | | | | | | | | | | | | | | | | | | | | | | | | | | |
13
Notes to Financial Statements (continued)
(unaudited)
| 5. | Investments in Affiliated Issuers (continued) |
| | | | | | | | | | | | | | | | | | | | | | | | | | | | |
STRATEGIC INCOME MODERATE SERIES | | VALUE AT 12/31/14 | | | PURCHASE COST | | | SALES PROCEEDS | | | VALUE AT 6/30/15 | | | SHARES HELD AT 6/30/15 | | | DIVIDEND INCOME 1/1/15 THROUGH 6/30/15 | | | DISTRIBUTIONS AND NET REALIZED GAIN/(LOSS) 1/1/15 THROUGH 6/30/15 | |
Manning & Napier Core Bond Series - Class A | | | — | | | $ | 7,771,393 | | | $ | 208,649 | | | $ | 7,506,790 | | | $ | 702,883 | | | $ | 21,142 | | | $ | (303 | ) |
Manning & Napier Disciplined Value Series - Class I | | $ | 3,302,958 | | | | 1,115,675 | | | | 426,120 | | | | 3,941,189 | | | | 249,442 | | | | 41,961 | | | | 40,463 | |
Manning & Napier Emerging Markets Series - Class I | | | 512,070 | | | | 190,818 | | | | 56,944 | | | | 644,034 | | | | 70,156 | | | | — | | | | (18,968 | ) |
Manning & Napier Equity Income Series - Class I | | | 3,229,332 | | | | 1,388,666 | | | | 371,525 | | | | 4,208,222 | | | | 393,292 | | | | — | | | | 38,103 | |
Manning & Napier High Yield Bond Series - Class I | | | 876,712 | | | | 273,234 | | | | 97,593 | | | | 1,061,662 | | | | 117,181 | | | | 23,297 | | | | (10,175 | ) |
Manning & Napier Inflation Focus Equity Series - Class I | | | 359,224 | | | | 97,697 | | | | 447,682 | | | | — | | | | — | | | | — | | | | (38,571 | ) |
Manning & Napier Real Estate Series - Class I | | | 972,253 | | | | 438,855 | | | | 102,548 | | | | 1,251,399 | | | | 146,192 | | | | — | | | | 10,072 | |
Manning & Napier Unconstrained Bond Series - Class I | | | 8,374,752 | | | | 2,455,642 | | | | 8,288,779 | | | | 2,560,520 | | | | 270,668 | | | | 75,241 | | | | (225,681 | ) |
| | | | | | | | | | | | | | | | | | | | | | | | | | | | |
| | $ | 17,627,301 | | | $ | 13,731,980 | | | $ | 9,999,840 | | | $ | 21,173,816 | | | | | | | $ | 161,641 | | | $ | (205,060 | ) |
| | | | | | | | | | | | | | | | | | | | | | | | | | | | |
| 6. | Capital Stock Transactions |
Transactions in shares of Class S and Class I shares were:
| | | | | | | | | | | | | | | | | | | | | | | | | | | | | | | | |
STRATEGIC | | | | | | | | | | | | |
| INCOME | | FOR THE SIX | | | | | | FOR THE SIX | | | | |
| CONSERVATIVE | | MONTHS ENDED | | | FOR THE YEAR ENDED | | | MONTHS ENDED | | | FOR THE YEAR ENDED | |
| SERIES: | | 6/30/15 | | | 12/31/14 | | | 6/30/15 | | | 12/31/14 | |
| | | (UNAUDITED) | | | | | | (UNAUDITED) | | | | |
| | | | | | | | | | | | | |
| | | CLASS S | | | CLASS S | | | CLASS I | | | CLASS I | |
| | | SHARES | | | AMOUNTS | | | SHARES | | | AMOUNTS | | | SHARES | | | AMOUNTS | | | SHARES | | | AMOUNTS | |
Sold | | | 106,731 | | | $ | 1,113,482 | | | | 885,964 | | | $ | 9,376,736 | | | | 34,209 | | | $ | 356,562 | | | | 957,307 | | | $ | 10,081,880 | |
Reinvested | | | 8,892 | | | | 92,749 | | | | 66,223 | | | | 692,406 | | | | 8,803 | | | | 91,817 | | | | 60,899 | | | | 636,966 | |
Repurchased | | | (214,502 | ) | | | (2,232,970 | ) | | | (333,539 | ) | | | (3,524,134 | ) | | | (204,726 | ) | | | (2,117,831 | ) | | | (222,407 | ) | | | (2,349,324 | ) |
| | | | | | | | | | | | | | | | | | | | | | | | | | | | | | | | |
Total | | | (98,879 | ) | | $ | (1,026,739 | ) | | | 618,648 | | | $ | 6,545,008 | | | | (161,714 | ) | | $ | (1,669,452 | ) | | | 795,799 | | | $ | 8,369,522 | |
| | | | | | | | | | | | | | | | | | | | | | | | | | | | | | | | |
14
Notes to Financial Statements (continued)
(unaudited)
| 6. | Capital Stock Transactions (continued) |
| | | | | | | | | | | | | | | | | | | | | | | | | | | | | | | | |
STRATEGIC | | | | | | | | | | | | |
| INCOME | | FOR THE SIX | | | | | | FOR THE SIX | | | | |
| MODERATE | | MONTHS ENDED | | | FOR THE YEAR ENDED | | | MONTHS ENDED | | | FOR THE YEAR ENDED | |
| SERIES: | | 6/30/15 | | | 12/31/14 | | | 6/30/15 | | | 12/31/14 | |
| | | (UNAUDITED) | | | | | | (UNAUDITED) | | | | |
| | | | | | | | | | | | | |
| | | CLASS S | | | CLASS S | | | CLASS I | | | CLASS I | |
| | | SHARES | | | AMOUNTS | | | SHARES | | | AMOUNTS | | | SHARES | | | AMOUNTS | | | SHARES | | | AMOUNTS | |
Sold | | | 277,022 | | | $ | 3,032,629 | | | | 931,070 | | | $ | 10,351,280 | | | | 188,772 | | | $ | 2,061,891 | | | | 87,965 | | | $ | 1,001,032 | |
Reinvested | | | 7,952 | | | | 87,103 | | | | 70,763 | | | | 779,436 | | | | 2,259 | | | | 24,737 | | | | 11,850 | | | | 130,733 | |
Repurchased | | | (158,097 | ) | | | (1,728,329 | ) | | | (170,855 | ) | | | (1,879,607 | ) | | | (2,729 | ) | | | (30,000 | ) | | | (29,935 | ) | | | (325,094 | ) |
| | | | | | | | | | | | | | | | | | | | | | | | | | | | | | | | |
Total | | | 126,877 | | | $ | 1,391,403 | | | | 830,978 | | | $ | 9,251,109 | | | | 188,302 | | | $ | 2,056,628 | | | | 69,880 | | | $ | 806,671 | |
| | | | | | | | | | | | | | | | | | | | | | | | | | | | | | | | |
At June 30, 2015, two shareholder accounts owned 587,676 shares of the Strategic Income Conservative Series (approximately 24.3% of the shares outstanding) valued at $6,041,306. Approximately 6% of the shares outstanding of the Strategic Income Moderate Series are fiduciary accounts where the Advisor has sole investment discretion.
The Underlying Series may trade in instruments including written and purchased options, forward foreign currency exchange contracts and futures contracts and other derivatives in the normal course of investing activities to assist in managing exposure to various market risks. The Underlying Series may be subject to various elements of risk which may involve, to a varying degree, elements of risk in excess of the amounts recognized for financial statement purposes. These risks include: the risk that changes in the value of a derivative may not correlate perfectly with the underlying asset, rate or index; counterparty credit risk related to over the counter derivative counterparties’ failure to perform under contract terms; liquidity risk related to the lack of a liquid market for these contracts allowing the Underlying Series to close out their position(s); and documentation risk relating to disagreement over contract terms. No such investments were held by the Underlying Series as of June 30, 2015.
| 8. | Federal Income Tax Information |
The amount and characterization of certain income and capital gains to be distributed are determined in accordance with federal income tax regulations, which may differ from GAAP. Each Series may periodically make reclassifications among its capital accounts to reflect income and gains available for distribution (or available capital loss carryovers) under income tax regulations without impacting the Series’ net asset value. Any such reclassifications are not reflected in the financial highlights.
The final determination of the tax character of current year distributions will be made at the conclusion of the fiscal year. The tax character of distributions paid for the year ended December 31, 2014 were as follows:
| | | | |
| | | FOR THE YEAR ENDED 12/31/14 |
| | STRATEGIC INCOME CONSERVATIVE SERIES | | STRATEGIC INCOME MODERATE SERIES |
Ordinary income | | $970,832 | | $672,445 |
Long-term capital gain | | 380,245 | | 276,284 |
15
Notes to Financial Statements (continued)
(unaudited)
| 8. | Federal Income Tax Information (continued) |
At June 30, 2015, the identified cost for federal income tax purposes, the resulting gross unrealized appreciation and depreciation, and the net unrealized depreciation were as follows:
| | | | | | | | |
| | | STRATEGIC INCOME CONSERVATIVE SERIES | | | STRATEGIC INCOME MODERATE SERIES | |
Cost for federal income tax purposes | | $ | 25,309,879 | | | $ | 21,633,545 | |
Unrealized appreciation | | | 17,818 | | | | 28,529 | |
Unrealized depreciation | | | (484,675) | | | | (488,258) | |
| | | | | | | | |
Net unrealized depreciation | | $ | (466,857) | | | $ | (459,729) | |
| | | | | | | | |
16
{This page intentionally left blank}
17
Literature Requests
(unaudited)
Proxy Voting Policies and Procedures
A description of the policies and procedures that the Fund uses to determine how to vote proxies relating to portfolio securities is available, without charge, upon request:
| | |
| By phone | | 1-800-466-3863 |
On the Securities and Exchange Commission’s (SEC) web site | | http://www.sec.gov |
Proxy Voting Record
Information regarding how the Fund voted proxies relating to portfolio securities during the most recent 12-month period ended June 30th is available, without charge, upon request:
| | |
| By phone | | 1-800-466-3863 |
| On the SEC’s web site | | http://www.sec.gov |
Quarterly Portfolio Holdings
The Series’ complete schedule of portfolio holdings for the 1st and 3rd quarters of each fiscal year are provided on Form N-Q, and are available, without charge, upon request:
| | |
| By phone | | 1-800-466-3863 |
| On the SEC’s web site | | http://www.sec.gov |
The Series’ Form N-Q may be reviewed and copied at the SEC’s Public Reference Room in Washington, D.C. Information on the operation of the Public Reference Room may be obtained by calling 1-800-SEC-0330.
Prospectus and Statement of Additional Information (SAI)
For more information about any of the Manning & Napier Fund, Inc. Series, you may obtain a prospectus and SAI at www.manning-napier.com or by calling (800) 466-3863. Before investing, carefully consider the objectives, risks, charges and expenses of the investment and read the prospectus carefully as it contains this and other information about the investment company. In addition, this information can be found on the SEC’s web site, http://www.sec.gov.
Additional information available at www.manning-napier.com
1. Fund Holdings - Month-End
2. Fund Holdings - Quarter-End
3. Shareholder Report - Annual
4. Shareholder Report - Semi-Annual
The Fund also offers electronic notification or “e-delivery” when certain documents are available on-line to be downloaded or reviewed. Direct shareholders can elect to receive electronic notification when shareholder reports, prospectus updates, and/or statements are available. If you do not currently have on-line access to your account, you can establish access by going to www.manning-napier.com, click on “Login” in the top corner of the page, and follow the prompts to self-enroll. Once enrolled, you can set your electronic notification preferences by clicking on the Account Options tab located within the green toolbar and then select E-Delivery Option. Should you have any questions on either how to establish on-line access or how to update your account settings, please contact Investor Services at 1-800-466-3863.
The Manning & Napier Fund, Inc. is managed by Manning & Napier Advisors, LLC. Manning & Napier Investor Services, Inc., an affiliate of Manning & Napier Advisors, LLC, is the distributor of the Fund shares.
MNSTI-6/15-SAR

Global Fixed Income Series
Shareholder Expense Example
(unaudited)
As a shareholder of the Series, you may incur two types of costs: (1) transaction costs and (2) ongoing costs, including management fees and other Series expenses. This example is intended to help you understand your ongoing costs (in dollars) of investing in the Series and to compare these costs with the ongoing costs of investing in other mutual funds.
The example is based on an investment of $1,000 invested in each class at the beginning of the period and held for the entire period (January 1, 2015 to June 30, 2015).
Actual Expenses
The Actual lines of the table below provide information about actual account values and actual expenses. You may use the information in this line, together with the amount you invested, to estimate the expenses that you paid over the period. Simply divide your account value by $1,000 (for example, an $8,600 account value divided by $1,000 = 8.6), then multiply the result by the number in the Actual line for the class in which you have invested under the heading entitled “Expenses Paid During Period” to estimate the expenses you paid on your account during this period.
Hypothetical Example for Comparison Purposes
The Hypothetical lines of the table below provide information about hypothetical account values and hypothetical expenses based on the Class’ actual expense ratio and an assumed rate of return of 5% per year before expenses, which is not the Class’ actual return. The hypothetical account values and expenses may not be used to estimate the actual ending account balance or expenses you paid during the period. You may use this information to compare the ongoing costs of investing in a class of the Series and other funds. To do so, compare this 5% hypothetical example for the class in which you have invested with the 5% hypothetical examples that appear in the shareholder reports of the other funds.
Please note that the expenses shown in the table are meant to highlight your ongoing costs only and do not reflect any transaction costs. Therefore, the Hypothetical line for each class in the table is useful in comparing ongoing costs only, and will not help you determine the relative total costs of owning different funds. In addition, if these transaction costs were included, your costs would have been higher.
| | | | | | | | |
| | | BEGINNING
ACCOUNT VALUE 1/1/15 | | ENDING
ACCOUNT VALUE 6/30/15 | | EXPENSES PAID
DURING PERIOD* 1/1/15-6/30/15 | | ANNUALIZED
EXPENSE RATIO |
Class S | | | | | | | | |
Actual | | $1,000.00 | | $ 977.30 | | $4.17 | | 0.85% |
Hypothetical (5% return before expenses) | | $1,000.00 | | $1,020.58 | | $4.26 | | 0.85% |
Class I | | | | | | | | |
Actual | | $1,000.00 | | $ 989.44 | | $3.45 | | 0.70% |
Hypothetical (5% return before expenses) | | $1,000.00 | | $1,021.32 | | $3.51 | | 0.70% |
*Expenses are equal to the Class’ annualized expense ratio (for the six-month period), multiplied by the average account value over the period, multiplied by 181/365 (to reflect the one-half year period). Expenses are based on the most recent fiscal half year. The Class’ total return would have been lower had certain expenses not been waived during the period.
1
Global Fixed Income Series
Portfolio Composition as of June 30, 2015
(unaudited)
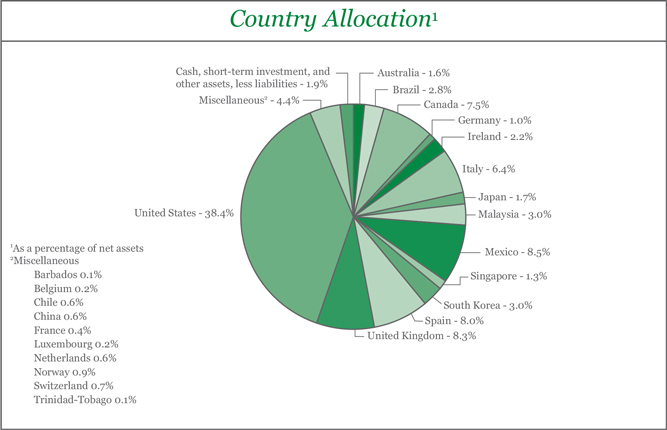
2
Global Fixed Income Series
Investment Portfolio - June 30, 2015
(unaudited)
| | | | | | | | | | | | | | |
| | | | |
| | | CREDIT
RATING1 | | | | | PRINCIPAL
AMOUNT2 | | | VALUE (NOTE 2) | |
| | | | |
CORPORATE BONDS - 44.5% | | | | | | | | | | | | | | |
| | | | |
Non-Convertible Corporate Bonds - 44.5% | | | | | | | | | | | | | | |
Consumer Discretionary - 5.5% | | | | | | | | | | | | | | |
Auto Components - 0.2% | | | | | | | | | | | | | | |
Icahn Enterprises LP - Icahn Enterprises Finance Corp., 5.875%, 2/1/2022 | | | Ba3 | | | | | | 250,000 | | | $ | 254,687 | |
Techniplas LLC3, 10.00%, 5/1/2020 | | | Caa1 | | | | | | 260,000 | | | | 261,950 | |
| | | | | | | | | | | | | | |
| | | | |
| | | | | | | | | | | | | 516,637 | |
| | | | | | | | | | | | | | |
Automobiles - 0.8% | | | | | | | | | | | | | | |
Ford Motor Credit Co. LLC, 5.00%, 5/15/2018 | | | Baa3 | | | | | | 1,615,000 | | | | 1,736,267 | |
Ford Motor Credit Co. LLC, 8.125%, 1/15/2020 | | | Baa3 | | | | | | 275,000 | | | | 335,825 | |
| | | | | | | | | | | | | | |
| | | | |
| | | | | | | | | | | | | 2,072,092 | |
| | | | | | | | | | | | | | |
Diversified Consumer Services - 0.5% | | | | | | | | | | | | | | |
Block Financial LLC, 5.50%, 11/1/2022 | | | Baa2 | | | | | | 1,165,000 | | | | 1,255,969 | |
| | | | | | | | | | | | | | |
Hotels, Restaurants & Leisure - 0.1% | | | | | | | | | | | | | | |
International Game Technology plc (United Kingdom)3, 6.25%, 2/15/2022 | | | Ba2 | | | | | | 265,000 | | | | 253,075 | |
| | | | | | | | | | | | | | |
Household Durables - 1.3% | | | | | | | | | | | | | | |
Brookfield Residential Properties, Inc. - Brookfield Residential US Corp. (Canada)3, 6.125%, 7/1/2022 | | | B1 | | | | | | 405,000 | | | | 398,925 | |
Brookfield Residential Properties, Inc. (Canada)3, 6.375%, 5/15/2025 | | | B1 | | | | | | 110,000 | | | | 107,800 | |
Meritage Homes Corp., 7.15%, 4/15/2020 | | | Ba3 | | | | | | 150,000 | | | | 162,000 | |
Meritage Homes Corp., 7.00%, 4/1/2022 | | | Ba3 | | | | | | 225,000 | | | | 240,187 | |
Newell Rubbermaid, Inc., 2.875%, 12/1/2019 | | | Baa3 | | | | | | 400,000 | | | | 404,277 | |
NVR, Inc., 3.95%, 9/15/2022 | | | Baa2 | | | | | | 1,280,000 | | | | 1,297,741 | |
TRI Pointe Holdings, Inc., 4.375%, 6/15/2019 | | | B1 | | | | | | 390,000 | | | | 382,200 | |
Tupperware Brands Corp., 4.75%, 6/1/2021 | | | Baa3 | | | | | | 90,000 | | | | 94,940 | |
Weekley Homes LLC - Weekley Finance Corp., 6.00%, 2/1/2023 | | | B2 | | | | | | 345,000 | | | | 326,025 | |
| | | | | | | | | | | | | | |
| | | | |
| | | | | | | | | | | | | 3,414,095 | |
| | | | | | | | | | | | | | |
Media - 1.9% | | | | | | | | | | | | | | |
21st Century Fox America, Inc., 6.90%, 3/1/2019 | | | Baa1 | | | | | | 325,000 | | | | 377,367 | |
CCO Holdings LLC - CCO Holdings Capital Corp.3, 5.125%, 5/1/2023 | | | B1 | | | | | | 180,000 | | | | 175,050 | |
CCO Holdings LLC - CCO Holdings Capital Corp.3, 5.375%, 5/1/2025 | | | B1 | | | | | | 210,000 | | | | 204,487 | |
Cogeco Cable, Inc. (Canada)3, 4.875%, 5/1/2020 | | | BB4 | | | | | | 330,000 | | | | 334,950 | |
Columbus International, Inc. (Barbados)3, 7.375%, 3/30/2021 | | | Ba3 | | | | | | 250,000 | | | | 268,750 | |
DIRECTV Holdings LLC - DIRECTV Financing Co., Inc., 5.20%, 3/15/2020 | | | Baa2 | | | | | | 835,000 | | | | 920,935 | |
DIRECTV Holdings LLC - DIRECTV Financing Co., Inc., 4.45%, 4/1/2024 | | | Baa2 | | | | | | 320,000 | | | | 327,459 | |
Discovery Communications LLC, 5.05%, 6/1/2020 | | | Baa2 | | | | | | 320,000 | | | | 350,432 | |
Sirius XM Radio, Inc.3, 5.375%, 4/15/2025 | | | Ba3 | | | | | | 265,000 | | | | 255,725 | |
Time Warner Entertainment Co. LP, 8.375%, 7/15/2033 | | | Baa2 | | | | | | 500,000 | | | | 613,710 | |
Time Warner, Inc., 4.75%, 3/29/2021 | | | Baa2 | | | | | | 770,000 | | | | 832,378 | |
The accompanying notes are an integral part of the financial statements.
3
Global Fixed Income Series
Investment Portfolio - June 30, 2015
(unaudited)
| | | | | | | | | | | | | | |
| | | | |
| | | CREDIT
RATING1 | | | | | PRINCIPAL
AMOUNT2 | | | VALUE (NOTE 2) | |
| | | | |
CORPORATE BONDS (continued) | | | | | | | | | | | | | | |
| | | | |
Non-Convertible Corporate Bonds (continued) | | | | | | | | | | | | | | |
Consumer Discretionary (continued) | | | | | | | | | | | | | | |
Media (continued) | | | | | | | | | | | | | | |
VTR Finance B.V. (Chile)3, 6.875%, 1/15/2024 | | | B1 | | | | | | 245,000 | | | $ | 250,353 | |
| | | | | | | | | | | | | | |
| | | | |
| | | | | | | | | | | | | 4,911,596 | |
| | | | | | | | | | | | | | |
Multiline Retail - 0.1% | | | | | | | | | | | | | | |
Macy’s Retail Holdings, Inc., 2.875%, 2/15/2023 | | | Baa2 | | | | | | 350,000 | | | | 336,934 | |
| | | | | | | | | | | | | | |
Specialty Retail - 0.2% | | | | | | | | | | | | | | |
The TJX Companies, Inc., 2.75%, 6/15/2021 | | | A3 | | | | | | 400,000 | | | | 404,777 | |
| | | | | | | | | | | | | | |
Textiles, Apparel & Luxury Goods - 0.4% | | | | | | | | | | | | | | |
Coach, Inc., 4.25%, 4/1/2025 | | | Baa2 | | | | | | 285,000 | | | | 273,719 | |
VF Corp., 5.95%, 11/1/2017 | | | A3 | | | | | | 625,000 | | | | 691,715 | |
| | | | | | | | | | | | | | |
| | | | |
| | | | | | | | | | | | | 965,434 | |
| | | | | | | | | | | | | | |
| | | | |
Total Consumer Discretionary | | | | | | | | | | | | | 14,130,609 | |
| | | | | | | | | | | | | | |
Consumer Staples - 1.4% | | | | | | | | | | | | | | |
Beverages - 0.4% | | | | | | | | | | | | | | |
Anheuser-Busch InBev Worldwide, Inc. (Belgium), 7.75%, 1/15/2019 | | | A2 | | | | | | 350,000 | | | | 415,431 | |
Pernod-Ricard S.A. (France)3, 5.75%, 4/7/2021 | | | Baa3 | | | | | | 350,000 | | | | 394,057 | |
SABMiller plc (United Kingdom)3, 6.50%, 7/15/2018 | | | A3 | | | | | | 200,000 | | | | 225,749 | |
| | | | | | | | | | | | | | |
| | | | |
| | | | | | | | | | | | | 1,035,237 | |
| | | | | | | | | | | | | | |
Food & Staples Retailing - 0.5% | | | | | | | | | | | | | | |
C&S Group Enterprises LLC3, 5.375%, 7/15/2022 | | | B1 | | | | | | 400,000 | | | | 376,000 | |
KeHE Distributors LLC - KeHE Finance Corp.3, 7.625%, 8/15/2021 | | | B3 | | | | | | 500,000 | | | | 525,000 | |
Shearer’s Foods LLC - Chip Finance Corp.3, 9.00%, 11/1/2019 | | | B1 | | | | | | 250,000 | | | | 268,750 | |
| | | | | | | | | | | | | | |
| | | | |
| | | | | | | | | | | | | 1,169,750 | |
| | | | | | | | | | | | | | |
Food Products - 0.2% | | | | | | | | | | | | | | |
Kraft Heinz Foods Co., 6.75%, 3/15/2032 | | | Baa3 | | | | | | 210,000 | | | | 246,750 | |
Pinnacle Operating Corp.3, 9.00%, 11/15/2020 | | | Caa1 | | | | | | 380,000 | | | | 377,150 | |
| | | | | | | | | | | | | | |
| | | | |
| | | | | | | | | | | | | 623,900 | |
| | | | | | | | | | | | | | |
Household Products - 0.2% | | | | | | | | | | | | | | |
HRG Group, Inc., 7.875%, 7/15/2019 | | | Ba3 | | | | | | 355,000 | | | | 374,525 | |
| | | | | | | | | | | | | | |
Tobacco - 0.1% | | | | | | | | | | | | | | |
Vector Group Ltd., 7.75%, 2/15/2021 | | | Ba3 | | | | | | 280,000 | | | | 299,600 | |
| | | | | | | | | | | | | | |
| | | | |
Total Consumer Staples | | | | | | | | | | | | | 3,503,012 | |
| | | | | | | | | | | | | | |
Energy - 4.4% | | | | | | | | | | | | | | |
Energy Equipment & Services - 1.0% | | | | | | | | | | | | | | |
Baker Hughes, Inc., 7.50%, 11/15/2018 | | | A2 | | | | | | 575,000 | | | | 675,545 | |
Calfrac Holdings LP (Canada)3, 7.50%, 12/1/2020 | | | B3 | | | | | | 240,000 | | | | 221,616 | |
Ensco plc, 5.20%, 3/15/2025 | | | Baa1 | | | | | | 750,000 | | | | 742,549 | |
Parker Drilling Co., 6.75%, 7/15/2022 | | | B1 | | | | | | 250,000 | | | | 215,625 | |
The accompanying notes are an integral part of the financial statements.
4
Global Fixed Income Series
Investment Portfolio - June 30, 2015
(unaudited)
| | | | | | | | | | | | | | | | |
| | | | |
| | | CREDIT
RATING1 | | | | | | PRINCIPAL
AMOUNT2 | | | VALUE (NOTE 2) | |
| | | | |
CORPORATE BONDS (continued) | | | | | | | | | | | | | | | | |
| | | | |
Non-Convertible Corporate Bonds (continued) | | | | | | | | | | | | | | | | |
Energy (continued) | | | | | | | | | | | | | | | | |
Energy Equipment & Services (continued) | | | | | | | | | | | | | | | | |
Schlumberger Oilfield plc3, 4.20%, 1/15/2021 | | | Aa3 | | | | | | | | 560,000 | | | $ | 601,722 | |
Seventy Seven Operating LLC, 6.625%, 11/15/2019 | | | B3 | | | | | | | | 155,000 | | | | 122,450 | |
| | | | | | | | | | | | | | | | |
| | | | |
| | | | | | | | | | | | | | | 2,579,507 | |
| | | | | | | | | | | | | | | | |
Oil, Gas & Consumable Fuels - 3.4% | | | | | | | | | | | | | | | | |
CNOOC Finance 2015 Australia Pty. Ltd. (China), 2.625%, 5/5/2020 | | | Aa3 | | | | | | | | 500,000 | | | | 493,463 | |
CNOOC Nexen Finance 2014 ULC (China), 1.625%, 4/30/2017 | | | Aa3 | | | | | | | | 400,000 | | | | 400,570 | |
Columbia Pipeline Group, Inc.3, 2.45%, 6/1/2018 | | | Baa2 | | | | | | | | 400,000 | | | | 403,089 | |
Columbia Pipeline Group, Inc.3, 4.50%, 6/1/2025 | | | Baa2 | | | | | | | | 400,000 | | | | 393,498 | |
El Paso Natural Gas Co. LLC, 8.625%, 1/15/2022 | | | Baa3 | | | | | | | | 100,000 | | | | 123,344 | |
Energy XXI Gulf Coast, Inc., 7.50%, 12/15/2021 | | | Caa3 | | | | | | | | 375,000 | | | | 120,937 | |
EOG Resources, Inc., 2.625%, 3/15/2023 | | | A3 | | | | | | | | 490,000 | | | | 470,540 | |
EOG Resources, Inc., 3.15%, 4/1/2025 | | | A3 | | | | | | | | 325,000 | | | | 317,074 | |
Hiland Partners LP - Hiland Partners Finance Corp.3, 7.25%, 10/1/2020 | | | Baa3 | | | | | | | | 600,000 | | | | 648,000 | |
Kinder Morgan, Inc.3, 5.625%, 11/15/2023 | | | Baa3 | | | | | | | | 1,500,000 | | | | 1,595,609 | |
Petrobras Global Finance B.V. (Brazil)5, 1.896%, 5/20/2016 | | | Ba2 | | | | | | | | 1,400,000 | | | | 1,379,266 | |
Petroleos Mexicanos (Mexico), 5.75%, 3/1/2018 | | | A3 | | | | | | | | 350,000 | | | | 380,741 | |
Petroleos Mexicanos (Mexico)3, 4.50%, 1/23/2026 | | | A3 | | | | | | | | 950,000 | | | | 928,530 | |
Sabine Pass Liquefaction LLC, 5.625%, 2/1/2021 | | | Ba3 | | | | | | | | 250,000 | | | | 255,000 | |
Talisman Energy, Inc. (Canada), 3.75%, 2/1/2021 | | | Baa3 | | | | | | | | 600,000 | | | | 593,987 | |
WPX Energy, Inc., 6.00%, 1/15/2022 | | | Ba1 | | | | | | | | 320,000 | | | | 316,000 | |
| | | | | | | | | | | | | | | | |
| | | | |
| | | | | | | | | | | | | | | 8,819,648 | |
| | | | | | | | | | | | | | | | |
| | | | |
Total Energy | | | | | | | | | | | | | | | 11,399,155 | |
| | | | | | | | | | | | | | | | |
Financials - 23.3% | | | | | | | | | | | | | | | | |
Banks - 8.7% | | | | | | | | | | | | | | | | |
Banco Bilbao Vizcaya Argentaria S.A. (Spain)6,7, 9.00% | | | WR8 | | | | | | | | 400,000 | | | | 430,000 | |
Banco Santander S.A. (Spain)6,9, 6.375% | | | Ba1 | | | | | | | | 400,000 | | | | 390,101 | |
Banco Santander S.A. (Spain), 4.00%, 4/7/2020 | | | Aa2 | | | | EUR | | | | 100,000 | | | | 129,509 | |
Bank of America Corp., 5.75%, 8/15/2016 | | | Baa3 | | | | | | | | 680,000 | | | | 712,063 | |
Bank of America Corp., 5.42%, 3/15/2017 | | | Baa3 | | | | | | | | 1,500,000 | | | | 1,589,405 | |
Bank of America Corp., 5.70%, 5/2/2017 | | | Baa3 | | | | | | | | 250,000 | | | | 266,722 | |
Bank of America Corp., 6.875%, 4/25/2018 | | | Baa1 | | | | | | | | 480,000 | | | | 542,247 | |
Bank of America Corp., 4.00%, 1/22/2025 | | | Baa3 | | | | | | | | 375,000 | | | | 365,360 | |
Barclays Bank plc (United Kingdom), 5.14%, 10/14/2020 | | | Baa3 | | | | | | | | 200,000 | | | | 217,395 | |
Barclays Bank plc (United Kingdom)3, 10.179%, 6/12/2021 | | | Baa3 | | | | | | | | 300,000 | | | | 397,470 | |
Barclays plc (United Kingdom)6,10, 6.625% | | | B4 | | | | | | | | 400,000 | | | | 389,951 | |
BBVA Bancomer S.A. (Mexico)3, 6.75%, 9/30/2022 | | | Baa2 | | | | | | | | 845,000 | | | | 930,556 | |
BBVA US Senior S.A.U. (Spain), 4.664%, 10/9/2015 | | | Baa1 | | | | | | | | 1,455,000 | | | | 1,468,939 | |
BNP Paribas Home Loan Covered Bonds S.A. (France), 3.75%, 4/20/2020 | | | AAA4 | | | | EUR | | | | 50,000 | | | | 64,759 | |
CIT Group, Inc., 5.25%, 3/15/2018 | | | B1 | | | | | | | | 245,000 | | | | 253,269 | |
The accompanying notes are an integral part of the financial statements.
5
Global Fixed Income Series
Investment Portfolio - June 30, 2015
(unaudited)
| | | | | | | | | | | | | | | | |
| | | | |
| | | CREDIT
RATING1 | | | | | | PRINCIPAL
AMOUNT2 | | | VALUE (NOTE 2) | |
| | | | |
CORPORATE BONDS (continued) | | | | | | | | | | | | | | | | |
| | | | |
Non-Convertible Corporate Bonds (continued) | | | | | | | | | | | | | | | | |
Financials (continued) | | | | | | | | | | | | | | | | |
Banks (continued) | | | | | | | | | | | | | | | | |
Citigroup, Inc.5,6, 5.95% | | | Ba2 | | | | | | | | 255,000 | | | $ | 246,126 | |
Citigroup, Inc., 1.80%, 2/5/2018 | | | Baa1 | | | | | | | | 1,000,000 | | | | 997,590 | |
Citigroup, Inc., 3.875%, 3/26/2025 | | | Baa3 | | | | | | | | 1,000,000 | | | | 957,905 | |
Commonwealth Bank of Australia (Australia), 5.75%, 1/25/2017 | | | Aaa | | | | AUD | | | | 1,680,000 | | | | 1,360,508 | |
ING Bank N.V. (Netherlands)3, 1.80%, 3/16/2018 | | | A1 | | | | | | | | 150,000 | | | | 150,093 | |
Intesa Sanpaolo S.p.A. (Italy), 3.875%, 1/15/2019 | | | Baa1 | | | | | | | | 790,000 | | | | 812,777 | |
Intesa Sanpaolo S.p.A. (Italy)3, 6.50%, 2/24/2021 | | | Baa1 | | | | | | | | 350,000 | | | | 399,276 | |
JPMorgan Chase & Co., 6.30%, 4/23/2019 | | | A3 | | | | | | | | 820,000 | | | | 939,411 | |
Lloyds Bank plc (United Kingdom)3,6,11, 12.00% | | | Ba1 | | | | | | | | 105,000 | | | | 150,150 | |
Lloyds Bank plc (United Kingdom)3, 6.50%, 9/14/2020 | | | Baa2 | | | | | | | | 1,580,000 | | | | 1,821,116 | |
Lloyds Bank plc (United Kingdom)5, 9.875%, 12/16/2021 | | | Baa2 | | | | | | | | 250,000 | | | | 276,437 | |
Popular, Inc., 7.00%, 7/1/2019 | | | B1 | | | | | | | | 520,000 | | | | 520,000 | |
Royal Bank of Canada (Canada), 3.77%, 3/30/2018 | | | Aaa | | | | CAD | | | | 1,995,000 | | | | 1,709,918 | |
Royal Bank of Scotland Group plc (United Kingdom), 6.10%, 6/10/2023 | | | Ba2 | | | | | | | | 230,000 | | | | 244,544 | |
Royal Bank of Scotland Group plc (United Kingdom), 5.125%, 5/28/2024 | | | Ba2 | | | | | | | | 1,000,000 | | | | 998,783 | |
Santander Bank N.A., 8.75%, 5/30/2018 | | | Baa2 | | | | | | | | 300,000 | | | | 349,685 | |
Santander Holdings USA, Inc., 4.625%, 4/19/2016 | | | Baa2 | | | | | | | | 230,000 | | | | 235,734 | |
Santander Holdings USA, Inc., 2.65%, 4/17/2020 | | | Baa2 | | | | | | | | 500,000 | | | | 491,555 | |
Westpac Banking Corp. (Australia), 5.75%, 2/6/2017 | | | Aaa | | | | AUD | | | | 2,100,000 | | | | 1,702,250 | |
| | | | | | | | | | | | | | | | |
| | | | |
| | | | | | | | | | | | | | | 22,511,604 | |
| | | | | | | | | | | | | | | | |
Capital Markets - 4.2% | | | | | | | | | | | | | | | | |
Cooperatieve Centrale Raiffeisen-Boerenleenbank B.A. (Netherlands)6,12, 8.40% | | | WR8 | | | | | | | | 100,000 | | | | 108,000 | |
Goldman Sachs Capital II5,6, 4.00% | | | Ba1 | | | | | | | | 400,000 | | | | 304,500 | |
The Goldman Sachs Group, Inc., 2.375%, 1/22/2018 | | | A3 | | | | | | | | 330,000 | | | | 335,019 | |
The Goldman Sachs Group, Inc., 6.15%, 4/1/2018 | | | A3 | | | | | | | | 1,790,000 | | | | 1,990,265 | |
The Goldman Sachs Group, Inc.5, 1.374%, 11/15/2018 | | | A3 | | | | | | | | 1,680,000 | | | | 1,694,881 | |
The Goldman Sachs Group, Inc., 5.375%, 3/15/2020 | | | A3 | | | | | | | | 615,000 | | | | 684,815 | |
The Goldman Sachs Group, Inc.5, 1.884%, 11/29/2023 | | | A3 | | | | | | | | 350,000 | | | | 355,727 | |
The Goldman Sachs Group, Inc., 3.75%, 5/22/2025 | | | A3 | | | | | | | | 300,000 | | | | 296,053 | |
Morgan Stanley, 2.125%, 4/25/2018 | | | A3 | | | | | | | | 740,000 | | | | 745,001 | |
Morgan Stanley, 5.75%, 1/25/2021 | | | A3 | | | | | | | | 2,015,000 | | | | 2,295,722 | |
Morgan Stanley, 5.00%, 11/24/2025 | | | Baa2 | | | | | | | | 800,000 | | | | 837,487 | |
UBS AG (Switzerland)5, 7.25%, 2/22/2022 | | | BBB4 | | | | | | | | 400,000 | | | | 420,953 | |
UBS AG (Switzerland), 7.625%, 8/17/2022 | | | BBB4 | | | | | | | | 250,000 | | | | 293,000 | |
UBS AG (Switzerland)5, 4.75%, 5/22/2023 | | | BBB4 | | | | | | | | 400,000 | | | | 403,186 | |
| | | | | | | | | | | | | | | | |
| | | | |
| | | | | | | | | | | | | | | 10,764,609 | |
| | | | | | | | | | | | | | | | |
Consumer Finance - 0.7% | | | | | | | | | | | | | | | | |
Caterpillar Financial Services Corp., 7.05%, 10/1/2018 | | | A2 | | | | | | | | 675,000 | | | | 788,078 | |
The accompanying notes are an integral part of the financial statements.
6
Global Fixed Income Series
Investment Portfolio - June 30, 2015
(unaudited)
| | | | | | | | | | | | | | |
| | | | |
| | | CREDIT
RATING1 | | | | | PRINCIPAL
AMOUNT2 | | | VALUE (NOTE 2) | |
| | | | |
CORPORATE BONDS (continued) | | | | | | | | | | | | | | |
| | | | |
Non-Convertible Corporate Bonds (continued) | | | | | | | | | | | | | | |
Financials (continued) | | | | | | | | | | | | | | |
Consumer Finance (continued) | | | | | | | | | | | | | | |
CNG Holdings, Inc.3, 9.375%, 5/15/2020 | | | Caa1 | | | | | | 255,000 | | | $ | 184,875 | |
Discover Bank, 4.20%, 8/8/2023 | | | Baa3 | | | | | | 320,000 | | | | 323,902 | |
Navient Corp., 6.125%, 3/25/2024 | | | Ba3 | | | | | | 530,000 | | | | 507,475 | |
| | | | | | | | | | | | | | |
| | | | |
| | | | | | | | | | | | | 1,804,330 | |
| | | | | | | | | | | | | | |
| | | | | | | | | | | | | | |
Diversified Financial Services - 2.3% | | | | | | | | | | | | | | |
CME Group, Inc., 3.00%, 9/15/2022 | | | Aa3 | | | | | | 660,000 | | | | 663,750 | |
General Electric Capital Corp.6,13, 7.125% | | | Baa1 | | | | | | 585,000 | | | | 674,944 | |
General Electric Capital Corp., 5.30%, 2/11/2021 | | | A2 | | | | | | 500,000 | | | | 562,216 | |
General Electric Capital Corp.5, 0.659%, 5/5/2026 | | | A1 | | | | | | 855,000 | | | | 815,753 | |
ING Bank N.V. (Netherlands)3, 5.80%, 9/25/2023 | | | Baa2 | | | | | | 350,000 | | | | 382,166 | |
ING Bank N.V. (Netherlands)5, 4.125%, 11/21/2023 | | | Baa2 | | | | | | 400,000 | | | | 410,874 | |
Jefferies Finance LLC - JFIN Co-Issuer Corp.3, 7.375%, 4/1/2020 | | | B1 | | | | | | 500,000 | | | | 491,250 | |
Jefferies Group LLC, 8.50%, 7/15/2019 | | | Baa3 | | | | | | 900,000 | | | | 1,068,438 | |
Peachtree Corners Funding Trust3, 3.976%, 2/15/2025 | | | Baa2 | | | | | | 100,000 | | | | 99,167 | |
Voya Financial, Inc., 2.90%, 2/15/2018 | | | Baa2 | | | | | | 370,000 | | | | 379,693 | |
Voya Financial, Inc., 5.50%, 7/15/2022 | | | Baa2 | | | | | | 270,000 | | | | 303,167 | |
| | | | | | | | | | | | | | |
| | | | |
| | | | | | | | | | | | | 5,851,418 | |
| | | | | | | | | | | | | | |
Insurance - 3.4% | | | | | | | | | | | | | | |
Aegon N.V. (Netherlands)5,6, 2.619% | | | Baa1 | | | | | | 435,000 | | | | 378,189 | |
American International Group, Inc., 6.40%, 12/15/2020 | | | Baa1 | | | | | | 400,000 | | | | 475,538 | |
American International Group, Inc., 4.875%, 6/1/2022 | | | Baa1 | | | | | | 1,875,000 | | | | 2,056,719 | |
Assured Guaranty US Holdings, Inc., 5.00%, 7/1/2024 | | | Baa2 | | | | | | 2,600,000 | | | | 2,549,973 | |
AXA S.A. (France)5,6, 2.007% | | | A3 | | | | | | 425,000 | | | | 374,000 | |
First American Financial Corp., 4.30%, 2/1/2023 | | | Baa3 | | | | | | 565,000 | | | | 559,894 | |
The Hartford Financial Services Group, Inc., 5.125%, 4/15/2022 | | | Baa2 | | | | | | 1,320,000 | | | | 1,463,916 | |
Prudential Financial, Inc.6,14, 5.875% | | | Baa2 | | | | | | 800,000 | | | | 845,440 | |
| | | | | | | | | | | | | | |
| | | | |
| | | | | | | | | | | | | 8,703,669 | |
| | | | | | | | | | | | | | |
Real Estate Investment Trusts (REITS) - 3.6% | | | | | | | | | | | | | | |
American Campus Communities Operating Partnership LP, 3.75%, 4/15/2023 | | | Baa3 | | | | | | 500,000 | | | | 490,991 | |
American Tower Corp., 2.80%, 6/1/2020 | | | Baa3 | | | | | | 500,000 | | | | 493,052 | |
AvalonBay Communities, Inc., 4.20%, 12/15/2023 | | | Baa1 | | | | | | 500,000 | | | | 522,882 | |
BioMed Realty LP, 3.85%, 4/15/2016 | | | Baa2 | | | | | | 140,000 | | | | 142,631 | |
Brixmor Operating Partnership LP, 3.85%, 2/1/2025 | | | Baa3 | | | | | | 500,000 | | | | 480,531 | |
Digital Realty Trust LP, 5.875%, 2/1/2020 | | | Baa2 | | | | | | 1,110,000 | | | | 1,247,304 | |
Duke Realty LP, 3.75%, 12/1/2024 | | | Baa2 | | | | | | 500,000 | | | | 496,796 | |
DuPont Fabros Technology LP, 5.875%, 9/15/2021 | | | Ba1 | | | | | | 465,000 | | | | 470,813 | |
HCP, Inc., 6.70%, 1/30/2018 | | | Baa1 | | | | | | 865,000 | | | | 964,686 | |
HCP, Inc., 4.00%, 6/1/2025 | | | Baa1 | | | | | | 400,000 | | | | 391,601 | |
Health Care REIT, Inc., 4.95%, 1/15/2021 | | | Baa2 | | | | | | 635,000 | | | | 693,183 | |
The accompanying notes are an integral part of the financial statements.
7
Global Fixed Income Series
Investment Portfolio - June 30, 2015
(unaudited)
| | | | | | | | | | | | | | | | |
| | | | |
| | | CREDIT
RATING1 | | | | | | PRINCIPAL
AMOUNT2 | | | VALUE (NOTE 2) | |
| | | | |
CORPORATE BONDS (continued) | | | | | | | | | | | | | | | | |
| | | | |
Non-Convertible Corporate Bonds (continued) | | | | | | | | | | | | | | | | |
Financials (continued) | | | | | | | | | | | | | | | | |
Real Estate Investment Trusts (REITS) (continued) | | | | | | | | | | | | | | | | |
Health Care REIT, Inc., 4.00%, 6/1/2025 | | | Baa2 | | | | | | | | 300,000 | | | $ | 296,089 | |
Hospitality Properties Trust, 6.70%, 1/15/2018 | | | Baa2 | | | | | | | | 350,000 | | | | 379,653 | |
Rialto Holdings LLC - Rialto Corp.3, 7.00%, 12/1/2018 | | | B2 | | | | | | | | 315,000 | | | | 327,600 | |
Simon Property Group LP, 10.35%, 4/1/2019 | | | A2 | | | | | | | | 1,125,000 | | | | 1,429,044 | |
UDR, Inc., 4.625%, 1/10/2022 | | | Baa1 | | | | | | | | 460,000 | | | | 491,330 | |
| | | | | | | | | | | | | | | | |
| | | | |
| | | | | | | | | | | | | | | 9,318,186 | |
| | | | | | | | | | | | | | | | |
Real Estate Management & Development - 0.2% | | | | | | | | | | | | | | | | |
Forestar USA Real Estate Group, Inc.3, 8.50%, 6/1/2022 | | | B2 | | | | | | | | 250,000 | | | | 259,375 | |
Greystar Real Estate Partners LLC3, 8.25%, 12/1/2022 | | | B2 | | | | | | | | 155,000 | | | | 163,525 | |
| | | | | | | | | | | | | | | | |
| | | | |
| | | | | | | | | | | | | | | 422,900 | |
| | | | | | | | | | | | | | | | |
Thrifts & Mortgage Finance - 0.2% | | | | | | | | | | | | | | | | |
Ladder Capital Finance Holdings LLLP - Ladder Capital Finance Corp., 7.375%, 10/1/2017 | | | Ba3 | | | | | | | | 575,000 | | | | 599,438 | |
Ladder Capital Finance Holdings LLLP - Ladder Capital Finance Corp.3, 5.875%, 8/1/2021 | | | Ba3 | | | | | | | | 50,000 | | | | 48,625 | |
| | | | | | | | | | | | | | | | |
| | | | |
| | | | | | | | | | | | | | | 648,063 | |
| | | | | | | | | | | | | | | | |
| | | | |
Total Financials | | | | | | | | | | | | | | | 60,024,779 | |
| | | | | | | | | | | | | | | | |
Health Care - 1.7% | | | | | | | | | | | | | | | | |
Biotechnology - 0.2% | | | | | | | | | | | | | | | | |
Amgen, Inc., 2.70%, 5/1/2022 | | | Baa1 | | | | | | | | 500,000 | | | | 483,381 | |
| | | | | | | | | | | | | | | | |
Health Care Equipment & Supplies - 0.0%* | | | | | | | | | | | | | | | | |
Zimmer Biomet Holdings, Inc., 1.45%, 4/1/2017 | | | Baa3 | | | | | | | | 100,000 | | | | 100,034 | |
| | | | | | | | | | | | | | | | |
Health Care Providers & Services - 1.1% | | | | | | | | | | | | | | | | |
Aetna, Inc., 3.50%, 11/15/2024 | | | Baa1 | | | | | | | | 400,000 | | | | 392,110 | |
Express Scripts Holding Co., 4.75%, 11/15/2021 | | | Baa3 | | | | | | | | 500,000 | | | | 542,553 | |
FMC Finance VIII S.A. (Germany)3, 6.50%, 9/15/2018 | | | Ba2 | | | | EUR | | | | 1,540,000 | | | | 1,966,677 | |
| | | | | | | | | | | | | | | | |
| | | | |
| | | | | | | | | | | | | | | 2,901,340 | |
| | | | | | | | | | | | | | | | |
Pharmaceuticals - 0.4% | | | | | | | | | | | | | | | | |
Concordia Healthcare Corp. (Canada)3, 7.00%, 4/15/2023 | | | B3 | | | | | | | | 255,000 | | | | 255,000 | |
Roche Holdings, Inc. (Switzerland)3, 6.00%, 3/1/2019 | | | A1 | | | | | | | | 559,000 | | | | 636,119 | |
| | | | | | | | | | | | | | | | |
| | | | |
| | | | | | | | | | | | | | | 891,119 | |
| | | | | | | | | | | | | | | | |
| | | | |
Total Health Care | | | | | | | | | | | | | | | 4,375,874 | |
| | | | | | | | | | | | | | | | |
Industrials - 3.0% | | | | | | | | | | | | | | | | |
Aerospace & Defense - 0.2% | | | | | | | | | | | | | | | | |
DigitalGlobe, Inc.3, 5.25%, 2/1/2021 | | | B1 | | | | | | | | 520,000 | | | | 508,950 | |
| | | | | | | | | | | | | | | | |
Airlines - 0.5% | | | | | | | | | | | | | | | | |
Allegiant Travel Co., 5.50%, 7/15/2019 | | | B1 | | | | | | | | 370,000 | | | | 372,775 | |
The accompanying notes are an integral part of the financial statements.
8
Global Fixed Income Series
Investment Portfolio - June 30, 2015
(unaudited)
| | | | | | | | | | | | | | | | |
| | | | | |
| | | CREDIT
RATING1 | | | | | PRINCIPAL
AMOUNT2 | | | VALUE (NOTE 2) | | | |
| | | | | |
CORPORATE BONDS (continued) | | | | | | | | | | | | | | | | |
| | | | | |
Non-Convertible Corporate Bonds (continued) | | | | | | | | | | | | | | | | |
Industrials (continued) | | | | | | | | | | | | | | | | |
Airlines (continued) | | | | | | | | | | | | | | | | |
Delta Air Lines Pass-Through Trust, Series 2010-1, Class B3, 6.375%, 1/2/2016 | | | Baa3 | | | | | | 625,000 | | | $ | 639,062 | | | |
Southwest Airlines Co., 2.75%, 11/6/2019 | | | Baa1 | | | | | | 400,000 | | | | 405,840 | | | |
| | | | | | | | | | | | | | | | |
| | | | | |
| | | | | | | | | | | | | 1,417,677 | | | |
| | | | | | | | | | | | | | | | |
Commercial Services & Supplies - 0.2% | | | | | | | | | | | | | | | | |
Constellis Holdings LLC - Constellis Finance Corp.3, 9.75%, 5/15/2020 | | | B3 | | | | | | 265,000 | | | | 255,725 | | | |
Modular Space Corp.3, 10.25%, 1/31/2019 | | | B3 | | | | | | 250,000 | | | | 216,250 | | | |
| | | | | | | | | | | | | | | | |
| | | | | |
| | | | | | | | | | | | | 471,975 | | | |
| | | | | | | | | | | | | | | | |
Construction & Engineering - 0.1% | | | | | | | | | | | | | | | | |
Abengoa Finance S.A.U. (Spain)3, 7.75%, 2/1/2020 | | | B2 | | | | | | 300,000 | | | | 297,000 | | | |
| | | | | | | | | | | | | | | | |
Industrial Conglomerates - 0.2% | | | | | | | | | | | | | | | | |
Siemens Financieringsmaatschappij N.V. (Germany)3, 2.90%, 5/27/2022 . | | | A1 | | | | | | 500,000 | | | | 493,475 | | | |
| | | | | | | | | | | | | | | | |
Machinery - 0.3% | | | | | | | | | | | | | | | | |
CNH Industrial Capital LLC, 3.875%, 11/1/2015 | | | Ba1 | | | | | | 660,000 | | | | 661,650 | | | |
| | | | | | | | | | | | | | | | |
Road & Rail - 0.1% | | | | | | | | | | | | | | | | |
Burlington Northern Santa Fe LLC, 3.00%, 4/1/2025 | | | A3 | | | | | | 200,000 | | | | 191,537 | | | |
| | | | | | | | | | | | | | | | |
Trading Companies & Distributors - 1.4% | | | | | | | | | | | | | | | | |
Air Lease Corp., 3.375%, 1/15/2019 | | | BBB4 | | | | | | 1,150,000 | | | | 1,171,563 | | | |
Aircastle Ltd., 5.50%, 2/15/2022 | | | Ba2 | | | | | | 510,000 | | | | 520,521 | | | |
Fly Leasing Ltd. (Ireland), 6.75%, 12/15/2020 | | | B2 | | | | | | 250,000 | | | | 257,500 | | | |
Fly Leasing Ltd. (Ireland), 6.375%, 10/15/2021 | | | B2 | | | | | | 240,000 | | | | 243,000 | | | |
International Lease Finance Corp., 5.75%, 5/15/2016 | | | Ba2 | | | | | | 250,000 | | | | 256,250 | | | |
International Lease Finance Corp.5, 2.236%, 6/15/2016 | | | Ba2 | | | | | | 750,000 | | | | 749,062 | | | |
International Lease Finance Corp., 8.75%, 3/15/2017 | | | Ba2 | | | | | | 380,000 | | | | 415,762 | | | |
| | | | | | | | | | | | | | | | |
| | | | | |
| | | | | | | | | | | | | 3,613,658 | | | |
| | | | | | | | | | | | | | | | |
| | | | | |
Total Industrials | | | | | | | | | | | | | 7,655,922 | | | |
| | | | | | | | | | | | | | | | |
Information Technology - 1.4% | | | | | | | | | | | | | | | | |
Communications Equipment - 0.2% | | | | | | | | | | | | | | | | |
QUALCOMM, Inc., 3.45%, 5/20/2025 | | | A1 | | | | | | 500,000 | | | | 487,241 | | | |
| | | | | | | | | | | | | | | | |
Internet Software & Services - 0.3% | | | | | | | | | | | | | | | | |
Alibaba Group Holding Ltd. (China)3, 2.50%, 11/28/2019 | | | A1 | | | | | | 250,000 | | | | 247,271 | | | |
Tencent Holdings Ltd. (China)3, 3.375%, 5/2/2019 | | | A2 | | | | | | 400,000 | | | | 410,688 | | | |
| | | | | | | | | | | | | | | | |
| | | | | |
| | | | | | | | | | | | | 657,959 | | | |
| | | | | | | | | | | | | | | | |
IT Services - 0.3% | | | | | | | | | | | | | | | | |
Fiserv, Inc., 2.70%, 6/1/2020 | | | Baa2 | | | | | | 400,000 | | | | 399,232 | | | |
Xerox Corp., 2.80%, 5/15/2020 | | | Baa2 | | | | | | 400,000 | | | | 398,699 | | | |
| | | | | | | | | | | | | | | | |
| | | | | |
| | | | | | | | | | | | | 797,931 | | | |
| | | | | | | | | | | | | | | | |
The accompanying notes are an integral part of the financial statements.
9
Global Fixed Income Series
Investment Portfolio - June 30, 2015
(unaudited)
| | | | | | | | | | | | | | | | |
| | | | | |
| | | CREDIT
RATING1 | | | | | PRINCIPAL
AMOUNT2 | | | VALUE
(NOTE 2) | | | |
| | | | | |
CORPORATE BONDS (continued) | | | | | | | | | | | | | | | | |
| | | | | |
Non-Convertible Corporate Bonds (continued) | | | | | | | | | | | | | | | | |
Information Technology (continued) | | | | | | | | | | | | | | | | |
Semiconductors & Semiconductor Equipment - 0.3% | | | | | | | | | | | | | | | | |
KLA-Tencor Corp., 4.125%, 11/1/2021 | | | Baa2 | | | | | | 885,000 | | | $ | 907,898 | | | |
| | | | | | | | | | | | | | | | |
Technology Hardware, Storage & Peripherals - 0.3% | | | | | | | | | | | | | | | | |
Apple, Inc., 2.40%, 5/3/2023 | | | Aa1 | | | | | | 100,000 | | | | 95,662 | | | |
EMC Corp., 2.65%, 6/1/2020 | | | A1 | | | | | | 795,000 | | | | 803,152 | | | |
| | | | | | | | | | | | | | | | |
| | | | | |
| | | | | | | | | | | | | 898,814 | | | |
| | | | | | | | | | | | | | | | |
| | | | | |
Total Information Technology | | | | | | | | | | | | | 3,749,843 | | | |
| | | | | | | | | | | | | | | | |
Materials - 2.1% | | | | | | | | | | | | | | | | |
Chemicals - 0.8% | | | | | | | | | | | | | | | | |
Consolidated Energy Finance S.A. (Trinidad-Tobago)3, 6.75%, 10/15/2019 | | | B2 | | | | | | 235,000 | | | | 238,525 | | | |
The Dow Chemical Co., 8.55%, 5/15/2019 | | | Baa2 | | | | | | 700,000 | | | | 853,463 | | | |
Eastman Chemical Co., 2.70%, 1/15/2020 | | | Baa2 | | | | | | 550,000 | | | | 548,215 | | | |
LyondellBasell Industries N.V., 5.00%, 4/15/2019 | | | Baa1 | | | | | | 200,000 | | | | 216,653 | | | |
The Mosaic Co., 4.25%, 11/15/2023 | | | Baa1 | | | | | | 100,000 | | | | 102,823 | | | |
| | | | | | | | | | | | | | | | |
| | | | | |
| | | | | | | | | | | | | 1,959,679 | | | |
| | | | | | | | | | | | | | | | |
Containers & Packaging - 0.2% | | | | | | | | | | | | | | | | |
Ardagh Packaging Finance plc - Ardagh Holdings USA, Inc. (Ireland)3,5, 3.286%, 12/15/2019 | | | Ba3 | | | | | | 500,000 | | | | 486,250 | | | |
| | | | | | | | | | | | | | | | |
Metals & Mining - 0.9% | | | | | | | | | | | | | | | | |
BHP Billiton Finance (USA) Ltd. (Australia), 6.50%, 4/1/2019 | | | A1 | | | | | | 580,000 | | | | 671,067 | | | |
Freeport-McMoRan, Inc., 3.10%, 3/15/2020 | | | Baa3 | | | | | | 470,000 | | | | 463,384 | | | |
Rio Tinto Finance USA Ltd. (United Kingdom), 3.75%, 9/20/2021 | | | A3 | | | | | | 360,000 | | | | 373,076 | | | |
SunCoke Energy Partners LP - SunCoke Energy Partners Finance Corp.3, 7.375%, 2/1/2020 | | | B1 | | | | | | 250,000 | | | | 252,500 | | | |
Teck Resources Ltd. (Canada), 3.00%, 3/1/2019 | | | Baa3 | | | | | | 645,000 | | | | 621,632 | | | |
| | | | | | | | | | | | | | | | |
| | | | | |
| | | | | | | | | | | | | 2,381,659 | | | |
| | | | | | | | | | | | | | | | |
Paper & Forest Products - 0.2% | | | | | | | | | | | | | | | | |
Domtar Corp., 4.40%, 4/1/2022 | | | Baa3 | | | | | | 500,000 | | | | 508,135 | | | |
| | | | | | | | | | | | | | | | |
| | | | | |
Total Materials | | | | | | | | | | | | | 5,335,723 | | | |
| | | | | | | | | | | | | | | | |
Telecommunication Services - 1.1% | | | | | | | | | | | | | | | | |
Diversified Telecommunication Services - 0.6% | | | | | | | | | | | | | | | | |
Telefonica Emisiones S.A.U. (Spain), 6.221%, 7/3/2017 | | | Baa2 | | | | | | 1,200,000 | | | | 1,304,324 | | | |
Windstream Services LLC, 7.875%, 11/1/2017 | | | B1 | | | | | | 235,000 | | | | 249,687 | | | |
| | | | | | | | | | | | | | | | |
| | | | | |
| | | | | | | | | | | | | 1,554,011 | | | |
| | | | | | | | | | | | | | | | |
Wireless Telecommunication Services - 0.5% | | | | | | | | | | | | | | | | |
Altice Financing S.A. (Luxembourg)3, 6.50%, 1/15/2022 | | | B1 | | | | | | 535,000 | | | | 535,000 | | | |
SBA Tower Trust3, 3.598%, 4/15/2018 | | | Baa3 | | | | | | 500,000 | | | | 498,426 | | | |
The accompanying notes are an integral part of the financial statements.
10
Global Fixed Income Series
Investment Portfolio - June 30, 2015
(unaudited)
| | | | | | | | | | | | | | | | |
| | | | | |
| | | CREDIT
RATING1 | | | | | PRINCIPAL
AMOUNT2 | | | VALUE (NOTE 2) | | | |
| | | | | |
CORPORATE BONDS (continued) | | | | | | | | | | | | | | | | |
| | | | | |
Non-Convertible Corporate Bonds (continued) | | | | | | | | | | | | | | | | |
Telecommunication Services (continued) | | | | | | | | | | | | | | | | |
Wireless Telecommunication Services (continued) | | | | | | | | | | | | | | | | |
T-Mobile USA, Inc., 6.836%, 4/28/2023 | | | Ba3 | | | | | | 305,000 | | | $ | 320,631 | | | |
| | | | | | | | | | | | | | | | |
| | | | | |
| | | | | | | | | | | | | 1,354,057 | | | |
| | | | | | | | | | | | | | | | |
| | | | | |
Total Telecommunication Services | | | | | | | | | | | | | 2,908,068 | | | |
| | | | | | | | | | | | | | | | |
Utilities - 0.6% | | | | | | | | | | | | | | | | |
Gas Utilities - 0.1% | | | | | | | | | | | | | | | | |
National Fuel Gas Co., 3.75%, 3/1/2023 | | | Baa2 | | | | | | 400,000 | | | | 370,882 | | | |
| | | | | | | | | | | | | | | | |
Independent Power and Renewable Electricity Producers - 0.5% | | | | | | | | | | | | | | | | |
Abengoa Yield plc (Spain)3, 7.00%, 11/15/2019 | | | BB4 | | | | | | 400,000 | | | | 412,000 | | | |
ContourGlobal Power Holdings S.A. (France)3, 7.125%, 6/1/2019 | | | B3 | | | | | | 250,000 | | | | 261,875 | | | |
Talen Energy Supply LLC3, 5.125%, 7/15/2019 | | | Ba3 | | | | | | 530,000 | | | | 519,400 | | | |
| | | | | | | | | | | | | | | | |
| | | | | |
| | | | | | | | | | | | | 1,193,275 | | | |
| | | | | | | | | | | | | | | | |
| | | | | |
Total Utilities | | | | | | | | | | | | | 1,564,157 | | | |
| | | | | | | | | | | | | | | | |
TOTAL CORPORATE BONDS | | | | | | | | | | | | | | | | |
(Identified Cost $117,086,559) | | | | | | | | | | | | | 114,647,142 | | | |
| | | | | | | | | | | | | | | | |
| | | | | |
COMMERCIAL MORTGAGE-BACKED SECURITIES - 3.7% | | | | | | | | | | | | | | | | |
| | | | | |
Citigroup Commercial Mortgage Trust, Series 2006-C4, Class A35, 5.775%, 3/15/2049 | | | Aaa | | | | | | 942,627 | | | | 962,875 | | | |
COBALT CMBS Commercial Mortgage Trust, Series 2006-C1, Class A4, 5.223%, 8/15/2048 | | | AA4 | | | | | | 1,227,447 | | | | 1,276,615 | | | |
Commercial Mortgage Pass-Through Certificates, Series 2015-LC19, Class A4, 3.183%, 2/10/2048 | | | Aaa | | | | | | 1,250,000 | | | | 1,237,720 | | | |
Freddie Mac Multifamily Structured Pass-Through Certificates, Series K016, Class X1 (IO)5, 1.558%, 10/25/2021 | | | WR8 | | | | | | 4,100,775 | | | | 328,189 | | | |
Freddie Mac Multifamily Structured Pass-Through Certificates, Series K030, Class X1 (IO)5, 0.224%, 4/25/2023 | | | Aaa | | | | | | 23,499,183 | | | | 347,154 | | | |
Freddie Mac Multifamily Structured Pass-Through Certificates, Series K706, Class X1 (IO)5, 1.572%, 10/25/2018 | | | Aaa | | | | | | 6,044,310 | | | | 276,050 | | | |
GS Mortgage Securities Trust, Series 2006-GG8, Class A4, 5.56%, 11/10/2039 | | | Aaa | | | | | | 451,314 | | | | 467,886 | | | |
LB-UBS Commercial Mortgage Trust, Series 2006-C6, Class A4, 5.372%, 9/15/2039 | | | Aaa | | | | | | 500,000 | | | | 518,710 | | | |
LB-UBS Commercial Mortgage Trust, Series 2006-C7, Class A1A, 5.335%, 11/15/2038 | | | AAA4 | | | | | | 1,230,711 | | | | 1,289,151 | | | |
Morgan Stanley Capital I Trust, Series 2006-IQ12, Class A4, 5.332%, 12/15/2043 | | | AAA4 | | | | | | 1,192,650 | | | | 1,240,565 | | | |
U.S. Small Business Administration, Series 2015-10A, Class 1, 2.517%, 3/10/2025 | | | WR8 | | | | | | 250,000 | | | | 250,399 | | | |
The accompanying notes are an integral part of the financial statements.
11
Global Fixed Income Series
Investment Portfolio - June 30, 2015
(unaudited)
| | | | | | | | | | | | | | | | |
| | | | | |
| | | CREDIT
RATING1 | | | | | PRINCIPAL
AMOUNT2 | | | VALUE (NOTE 2) | | | |
| | | | | |
COMMERCIAL MORTGAGE-BACKED SECURITIES (continued) | | | | | | | | | | | | | | | | |
| | | | | |
WF-RBS Commercial Mortgage Trust, Series 2014-C19, Class A5, 4.101%, 3/15/2047 | | | Aaa | | | | | | 1,100,000 | | | $ | 1,180,005 | | | |
| | | | | | | | | | | | | | | | |
| | | | | |
TOTAL COMMERCIAL MORTGAGE-BACKED SECURITIES | | | | | | | | | | | | | | | | |
(Identified Cost $9,499,417) | | | | | | | | | | | | | 9,375,319 | | | |
| | | | | | | | | | | | | | | | |
| | | | | |
FOREIGN GOVERNMENT BONDS - 46.6% | | | | | | | | | | | | | | | | |
| | | | | |
Australia Government Bond (Australia), 4.50%, 4/15/2020 | | | Aaa | | | AUD | | | 600,000 | | | | 508,949 | | | |
Brazil Notas do Tesouro Nacional (Brazil), 10.00%, 1/1/2025 | | | Baa2 | | | BRL | | | 19,060,000 | | | | 5,305,179 | | | |
Brazilian Government International Bond (Brazil), 8.875%, 10/14/2019 | | | Baa2 | | | | | | 400,000 | | | | 497,000 | | | |
Canada Housing Trust No. 1 (Canada)3, 4.10%, 12/15/2018 | | | Aaa | | | CAD | | | 2,485,000 | | | | 2,201,503 | | | |
Canadian Government Bond (Canada), 1.50%, 9/1/2017 | | | Aaa | | | CAD | | | 13,000,000 | | | | 10,638,559 | | | |
Canadian Government Bond (Canada), 2.75%, 6/1/2022 | | | Aaa | | | CAD | | | 2,500,000 | | | | 2,194,656 | | | |
Chile Government International Bond (Chile), 5.50%, 8/5/2020 | | | Aa3 | | | CLP | | | 700,000,000 | | | | 1,168,645 | | | |
Export-Import Bank of Korea (South Korea), 2.625%, 12/30/2020 | | | Aa3 | | | | | | 1,500,000 | | | | 1,491,902 | | | |
Ireland Government Bond (Ireland), 5.00%, 10/18/2020 | | | Baa1 | | | EUR | | | 1,340,000 | | | | 1,822,934 | | | |
Ireland Government Bond (Ireland), 0.80%, 3/15/2022 | | | Baa1 | | | EUR | | | 2,000,000 | | | | 2,203,795 | | | |
Ireland Government Bond (Ireland), 3.90%, 3/20/2023 | | | Baa1 | | | EUR | | | 400,000 | | | | 531,303 | | | |
Italy Buoni Poliennali Del Tesoro (Italy), 5.50%, 9/1/2022 | | | Baa2 | | | EUR | | | 2,835,000 | | | | 3,917,937 | | | |
Italy Buoni Poliennali Del Tesoro (Italy), 5.50%, 11/1/2022 | | | Baa2 | | | EUR | | | 4,410,000 | | | | 6,086,241 | | | |
Italy Buoni Poliennali Del Tesoro (Italy), 1.50%, 6/1/2025 | | | Baa2 | | | EUR | | | 5,200,000 | | | | 5,388,839 | | | |
Japan Government Five Year Bond (Japan), 0.30%, 12/20/2016 | | | A1 | | | JPY | | | 530,700,000 | | | | 4,355,465 | | | |
Korea Treasury Bond (South Korea), 2.75%, 6/10/2016 | | | Aa3 | | | KRW | | | 2,400,000,000 | | | | 2,174,310 | | | |
Korea Treasury Bond (South Korea), 2.00%, 12/10/2017 | | | WR8 | | | KRW | | | 4,300,000,000 | | | | 3,876,025 | | | |
Malaysia Government Bond (Malaysia), 3.172%, 7/15/2016 | | | WR8 | | | MYR | | | 29,570,000 | | | | 7,848,104 | | | |
Mexican Government Bond (Mexico), 8.00%, 12/17/2015 | | | A3 | | | MXN | | | 21,454,000 | | | | 1,394,639 | | | |
Mexican Government Bond (Mexico), 6.25%, 6/16/2016 | | | A3 | | | MXN | | | 15,000,000 | | | | 979,618 | | | |
Mexican Government Bond (Mexico), 7.25%, 12/15/2016 | | | A3 | | | MXN | | | 33,570,000 | | | | 2,238,159 | | | |
Mexican Government Bond (Mexico), 5.00%, 6/15/2017 | | | A3 | | | MXN | | | 51,500,000 | | | | 3,331,872 | | | |
Mexican Government Bond (Mexico), 7.75%, 12/14/2017 | | | A3 | | | MXN | | | 28,000,000 | | | | 1,923,573 | | | |
Mexican Government Bond (Mexico), 8.00%, 6/11/2020 | | | A3 | | | MXN | | | 57,500,000 | | | | 4,089,182 | | | |
Mexican Government Bond (Mexico), 6.50%, 6/10/2021 | | | A3 | | | MXN | | | 46,000,000 | | | | 3,047,528 | | | |
Mexican Government Bond (Mexico), 6.50%, 6/9/2022 | | | A3 | | | MXN | | | 34,000,000 | | | | 2,241,036 | | | |
Mexican Government Bond (Mexico), 7.75%, 5/29/2031 | | | A3 | | | MXN | | | 6,500,000 | | | | 461,217 | | | |
Norway Government Bond (Norway)3, 4.25%, 5/19/2017 | | | Aaa | | | NOK | | | 17,800,000 | | | | 2,416,370 | | | |
Singapore Government Bond (Singapore), 2.50%, 6/1/2019 | | | Aaa | | | SGD | | | 4,515,000 | | | | 3,467,920 | | | |
Spain Government Bond (Spain), 4.50%, 1/31/2018 | | | Baa2 | | | EUR | | | 1,415,000 | | | | 1,734,355 | | | |
Spain Government Bond (Spain)3, 4.00%, 4/30/2020 | | | Baa2 | | | EUR | | | 2,740,000 | | | | 3,452,575 | | | |
Spain Government Bond (Spain)3, 5.40%, 1/31/2023 | | | Baa2 | | | EUR | | | 6,505,000 | | | | 9,009,009 | | | |
Spain Government Bond (Spain)3, 1.60%, 4/30/2025 | | | Baa2 | | | EUR | | | 2,000,000 | | | | 2,097,929 | | | |
United Kingdom Gilt (United Kingdom), 2.00%, 1/22/2016 | | | Aa1 | | | GBP | | | 4,750,000 | | | | 7,526,045 | | | |
United Kingdom Gilt (United Kingdom), 1.00%, 9/7/2017 | | | Aa1 | | | GBP | | | 2,435,000 | | | | 3,847,127 | | | |
The accompanying notes are an integral part of the financial statements.
12
Global Fixed Income Series
Investment Portfolio - June 30, 2015
(unaudited)
| | | | | | | | | | | | | | | | |
| | | | | |
| | | CREDIT
RATING1 | | | | | PRINCIPAL
AMOUNT2/
SHARES | | | VALUE (NOTE 2) | | | |
| | | | | |
FOREIGN GOVERNMENT BONDS (continued) | | | | | | | | | | | | | | | | |
| | | | | |
United Kingdom Gilt (United Kingdom), 5.00%, 3/7/2018 | | | Aa1 | | | GBP | | | 2,610,000 | | | $ | 4,557,699 | | | |
| | | | | | | | | | | | | | | | |
| | | | | |
TOTAL FOREIGN GOVERNMENT BONDS | | | | | | | | | | | | | | | | |
(Identified Cost $130,134,876) | | | | | | | | | | | | | 120,027,199 | | | |
| | | | | | | | | | | | | | | | |
| | | | | |
MUTUAL FUND - 0.1% | | | | | | | | | | | | | | | | |
| | | | | |
iShares iBoxx $ High Yield Corporate Bond ETF | | | | | | | | | | | | | | | | |
(Identified Cost $299,593) | | | | | | | | | 3,250 | | | | 288,600 | | | |
| | | | | | | | | | | | | | | | |
| | | | | |
U.S. GOVERNMENT AGENCIES - 3.2% | | | | | | | | | | | | | | | | |
| | | | | |
Mortgage-Backed Securities - 3.2% | | | | | | | | | | | | | | | | |
Fannie Mae, Pool #MA1890, 4.00%, 5/1/2034 | | | | | | | | | 910,576 | | | | 975,288 | | | |
Fannie Mae, Pool #735500, 5.50%, 5/1/2035 | | | | | | | | | 1,194,411 | | | | 1,345,013 | | | |
Freddie Mac, Pool #Z50018, 3.50%, 7/1/2026 | | | | | | | | | 1,621,297 | | | | 1,712,830 | | | |
Freddie Mac, Pool #K92054, 4.00%, 10/1/2034 | | | | | | | | | 905,666 | | | | 967,505 | | | |
Freddie Mac, Pool #C91832, 3.50%, 6/1/2035 | | | | | | | | | 1,196,758 | | | | 1,249,372 | | | |
Freddie Mac, Pool #G08273, 5.50%, 6/1/2038 | | | | | | | | | 1,764,557 | | | | 1,975,103 | | | |
| | | | | | | | | | | | | | | | |
| | | | | |
TOTAL U.S. GOVERNMENT AGENCIES | | | | | | | | | | | | | | | | |
(Identified Cost $8,087,055) | | | | | | | | | | | | | 8,225,111 | | | |
| | | | | | | | | | | | | | | | |
| | | | | |
SHORT-TERM INVESTMENT - 1.0% | | | | | | | | | | | | | | | | |
| | | | | |
Dreyfus Cash Management, Inc. - Institutional Shares15, 0.04%, | | | | | | | | | | | | | | | | |
(Identified Cost $2,608,504) | | | | | | | | | 2,608,504 | | | | 2,608,504 | | | |
| | | | | | | | | | | | | | | | |
TOTAL INVESTMENTS - 99.1% | | | | | | | | | | | | | | | | |
(Identified Cost $267,716,004) | | | | | | | | | | | | | 255,171,875 | | | |
OTHER ASSETS, LESS LIABILITIES - 0.9% | | | | | | | | | | | | | 2,422,400 | | | |
| | | | | | | | | | | | | | | | |
| | | | | |
NET ASSETS - 100% | | | | | | | | | | | | $ | 257,594,275 | | | |
| | | | | | | | | | | | | | | | |
| | | | | |
| AUD - Australian Dollar | | | | | | | | | | | | | | | | |
| BRL - Brazilian Real | | | | | | | | | | | | | | | | |
| CAD - Canadian Dollar | | | | | | | | | | | | | | | | |
| CLP - Chilean Peso | | | | | | | | | | | | | | | | |
| ETF - Exchange-Traded Fund | | | | | | | | | | | | | | | | |
| EUR - Euro | | | | | | | | | | | | | | | | |
| GBP - British Pound | | | | | | | | | | | | | | | | |
| IO - Interest only | | | | | | | | | | | | | | | | |
| JPY - Japanese Yen | | | | | | | | | | | | | | | | |
| KRW - South Korean Won | | | | | | | | | | | | | | | | |
| MXN - Mexican Peso | | | | | | | | | | | | | | | | |
| MYR - Malaysian Ringgit | | | | | | | | | | | | | | | | |
| NOK - Norwegian Krone | | | | | | | | | | | | | | | | |
| SGD - Singapore Dollar | | | | | | | | | | | | | | | | |
| | | | | |
| *Less than 0.1%. | | | | | | | | | | | | | | | | |
| 1Credit ratings from Moody’s (unaudited). | | | | | | | | | | | | | | | | |
The accompanying notes are an integral part of the financial statements.
13
Global Fixed Income Series
Investment Portfolio - June 30, 2015
(unaudited)
2Amount is stated in USD unless otherwise noted.
3Restricted securities - Investment in securities that are restricted as to public resale under the Securities Act of 1933, as amended. These securities have been sold under rule 144A and have been determined to be liquid under guidelines established by the Board of Directors. These securities amount to $43,582,658 or 16.9% of the Series’ net assets as of June 30, 2015 (see Note 2 to the financial statements).
4Credit ratings from S&P (unaudited).
5The coupon rate is floating and is the effective rate as of June 30, 2015.
6Security is perpetual in nature and has no stated maturity date.
7The rate shown is a fixed rate as of June 30, 2015; the rate becomes floating, based on USD Swap Semi 30/360 5-Year plus a spread, in May 2018.
8Credit rating has been withdrawn. As of June 30, 2015, there is no rating available (unaudited).
9The rate shown is a fixed rate as of June 30, 2015; the rate becomes floating, based on USD Swap Semi 30/360 5-Year plus a spread, in May 2019.
10The rate shown is a fixed rate as of June 30, 2015; the rate becomes floating, based on USD Swap Semi 30/360 5-Year plus a spread, in September 2019.
11The rate shown is a fixed rate as of June 30, 2015; the rate becomes floating, based on LIBOR plus a spread, in December 2024.
12The rate shown is a fixed rate as of June 30, 2015; the rate becomes floating, based on U.S. Treasury Yield Curve Rate Treasury Note Constant Maturity 5 Year in June 2017.
13The rate shown is a fixed rate as of June 30, 2015; the rate becomes floating, based on LIBOR plus a spread, in June 2022.
14The rate shown is a fixed rate as of June 30, 2015; the rate becomes floating, based on LIBOR plus a spread, in September 2022.
15Rate shown is the current yield as of June 30, 2015.
The Series’ portfolio holds, as a percentage of net assets, greater than 10% in the following countries: United States 38.4%.
The Global Industry Classification Standard (GICS) was developed by and is the exclusive property and a service mark of MSCI Inc. (MSCI) and Standard & Poor’s, a division of The McGraw-Hill Companies, Inc. (S&P), and is licensed for use by Manning & Napier when referencing GICS sectors. Neither MSCI, S&P, nor any third party involved in making or compiling the GICS or any GICS classifications makes any express or implied warranties or representations with respect to such standard or classification, nor shall any such party have any liability therefrom.
The accompanying notes are an integral part of the financial statements.
14
Global Fixed Income Series
Statement of Assets and Liabilities
June 30, 2015 (unaudited)
| | | | |
ASSETS: | | | | |
| |
Investments, at value (identified cost $267,716,004) (Note 2) | | $ | 255,171,875 | |
Foreign currency (identified cost $47,251) | | | 46,269 | |
Interest receivable | | | 2,457,574 | |
Receivable for securities sold | | | 269,300 | |
Receivable for fund shares sold | | | 127,996 | |
Foreign tax reclaims receivable | | | 263 | |
Dividends receivable | | | 164 | |
Prepaid expenses | | | 1,507 | |
| | | | |
| |
TOTAL ASSETS | | | 258,074,948 | |
| | | | |
| |
LIABILITIES: | | | | |
| |
Accrued management fees (Note 3) | | | 133,491 | |
Accrued shareholder services fees (Class S) (Note 3) | | | 27,222 | |
Accrued fund accounting and administration fees (Note 3) | | | 14,614 | |
Accrued foreign capital gains tax (Note 2) | | | 7,421 | |
Accrued transfer agent fees (Note 3) | | | 4,856 | |
Accrued Chief Compliance Officer service fees (Note 3) | | | 382 | |
Payable for fund shares repurchased | | | 216,780 | |
Accrued custodian fees | | | 35,377 | |
Payable for securities purchased | | | 20,077 | |
Other payables and accrued expenses | | | 20,453 | |
| | | | |
| |
TOTAL LIABILITIES | | | 480,673 | |
| | | | |
| |
TOTAL NET ASSETS | | $ | 257,594,275 | |
| | | | |
| |
NET ASSETS CONSIST OF: | | | | |
| |
Capital stock | | $ | 273,019 | |
Additional paid-in-capital | | | 272,132,490 | |
Undistributed net investment income | | | 2,031,098 | |
Accumulated net realized gain (loss) on investments, foreign currency and translation of other assets and liabilities | | | (4,287,595 | ) |
Net unrealized appreciation (depreciation) on investments (net of foreign capital gains tax of $7,421), foreign currency and translation of other assets and liabilities | | | (12,554,737 | ) |
| | | | |
| |
TOTAL NET ASSETS | | $ | 257,594,275 | |
| | | | |
| |
NET ASSET VALUE, OFFERING PRICE AND REDEMPTION PRICE PER SHARE - Class S ($204,865,187/21,719,626 shares) | | $ | 9.43 | |
| | | | |
| |
NET ASSET VALUE, OFFERING PRICE AND REDEMPTION PRICE PER SHARE - Class I ($52,729,088/5,582,259 shares) | | $ | 9.45 | |
| | | | |
The accompanying notes are an integral part of the financial statements.
15
Global Fixed Income Series
Statement of Operations
For the Six Months Ended June 30, 2015 (unaudited)
| | | | |
INVESTMENT INCOME: | | | | |
| |
Interest (net of foreign withholding tax of $33,224) | | $ | 4,065,788 | |
Dividends | | | 11,012 | |
| | | | |
| |
Total Investment Income | | | 4,076,800 | |
| | | | |
| |
EXPENSES: | | | | |
| |
Management fees (Note 3) | | | 779,834 | |
Shareholder services fees (Class S) (Note 3) | | | 156,077 | |
Fund accounting and administration fees (Note 3) | | | 45,862 | |
Transfer agent fees (Note 3) | | | 7,687 | |
Directors’ fees (Note 3) | | | 2,884 | |
Chief Compliance Officer service fees (Note 3) | | | 1,224 | |
Custodian fees | | | 30,872 | |
Miscellaneous | | | 56,608 | |
| | | | |
| |
Total Expenses | | | 1,081,048 | |
Less reduction of expenses (Note 3) | | | (16,962 | ) |
| | | | |
| |
Net Expenses | | | 1,064,086 | |
| | | | |
| |
NET INVESTMENT INCOME | | | 3,012,714 | |
| | | | |
| |
REALIZED AND UNREALIZED GAIN (LOSS) ON INVESTMENTS AND FOREIGN CURRENCY: | | | | |
| |
Net realized gain (loss) on- | | | | |
Investments | | | (1,130,268 | ) |
Foreign currency and translation of other assets and liabilities | | | (2,875,440 | ) |
| | | | |
| |
| | | (4,005,708 | ) |
| | | | |
| |
Net change in unrealized appreciation (depreciation) on- | | | | |
Investments (net of decrease in accrued foreign capital gains tax of $502) | | | (5,047,203 | ) |
Foreign currency and translation of other assets and liabilities | | | 65,278 | |
| | | | |
| |
| | | (4,981,925 | ) |
| | | | |
| |
NET REALIZED AND UNREALIZED GAIN (LOSS) ON INVESTMENTS AND FOREIGN CURRENCY | | | (8,987,633 | ) |
| | | | |
| |
NET DECREASE IN NET ASSETS RESULTING FROM OPERATIONS | | $ | (5,974,919 | ) |
| | | | |
The accompanying notes are an integral part of the financial statements.
16
Global Fixed Income Series
Statements of Changes in Net Assets
| | | | | | | | |
| | | FOR THE SIX
MONTHS ENDED
6/30/15
(UNAUDITED) | | | FOR THE
YEAR ENDED
12/31/14 | |
INCREASE (DECREASE) IN NET ASSETS: | | | | | | | | |
| | |
OPERATIONS: | | | | | | | | |
| | |
Net investment income | | $ | 3,012,714 | | | $ | 5,581,029 | |
Net realized gain (loss) on investments and foreign currency | | | (4,005,708 | ) | | | 3,413,776 | |
Net change in unrealized appreciation (depreciation) on investments and foreign currency | | | (4,981,925 | ) | | | (8,078,036 | ) |
| | | | | | | | |
| | |
Net increase (decrease) from operations | | | (5,974,919 | ) | | | 916,769 | |
| | | | | | | | |
| | |
DISTRIBUTIONS TO SHAREHOLDERS (Note 8): | | | | | | | | |
| | |
From net investment income (Class S) | | | (667,637 | ) | | | (5,045,777 | ) |
From net investment income (Class I) | | | (178,978 | ) | | | (1,197,071 | ) |
From net realized gain on investments (Class S) | | | — | | | | (928,775 | ) |
From net realized gain on investments (Class I) | | | — | | | | (209,576 | ) |
| | | | | | | | |
| | |
Total distributions to shareholders | | | (846,615 | ) | | | (7,381,199 | ) |
| | | | | | | | |
| | |
CAPITAL STOCK ISSUED AND REPURCHASED: | | | | | | | | |
| | |
Net increase from capital share transactions (Note 5) | | | 8,699,311 | | | | 30,131,263 | |
| | | | | | | | |
| | |
Net increase in net assets | | | 1,877,777 | | | | 23,666,833 | |
| | |
NET ASSETS: | | | | | | | | |
| | |
Beginning of period | | | 255,716,498 | | | | 232,049,665 | |
| | | | | | | | |
| | |
End of period (including undistributed net investment income of $2,031,098 and distributions in excess of net investment income of $135,001, respectively) | | $ | 257,594,275 | | | $ | 255,716,498 | |
| | | | | | | | |
The accompanying notes are an integral part of the financial statements.
17
Global Fixed Income Series
Financial Highlights - Class S
| | | | | | |
| | | FOR THE SIX MONTHS ENDED 6/30/15 (UNAUDITED) | | FOR THE YEAR
ENDED 12/31/14 | | FOR THE PERIOD
4/1/131 TO
12/31/13 |
| | | | | | | | | | | | | | | |
Per share data (for a share outstanding throughout each period): | | | | | | | | | | | | | | | |
Net asset value - Beginning of period | | | | $9.68 | | | | | $9.92 | | | | | $10.00 | |
| | | | | | | | | | | | | | | |
| | | |
Income (loss) from investment operations: | | | | | | | | | | | | | | | |
Net investment income2 | | | | 0.11 | | | | | 0.22 | | | | | 0.16 | |
Net realized and unrealized gain (loss) on investments | | | | (0.33 | ) | | | | (0.18 | ) | | | | (0.16 | ) |
| | | | | | | | | | | | | | | |
| | | |
Total from investment operations | | | | (0.22 | ) | | | | 0.04 | | | | | 0.00 | |
| | | | | | | | | | | | | | | |
| | | |
Less distributions to shareholders: | | | | | | | | | | | | | | | |
| | | |
From net investment income | | | | (0.03 | ) | | | | (0.24 | ) | | | | (0.08 | ) |
| | | |
From net realized gain on investments | | | | — | | | | | (0.04 | ) | | | | — | 3 |
| | | | | | | | | | | | | | | |
| | | |
Total distributions to shareholders | | | | (0.03 | ) | | | | (0.28 | ) | | | | (0.08 | ) |
| | | | | | | | | | | | | | | |
| | | |
Net asset value - End of period | | | | $9.43 | | | | | $9.68 | | | | | $9.92 | |
| | | | | | | | | | | | | | | |
| | | |
Net assets - End of period (000’s omitted) | | | $ | 204,865 | | | | $ | 208,842 | | | | $ | 196,860 | |
| | | | | | | | | | | | | | | |
| | | |
Total return4 | | | | (2.27% | ) | | | | 0.42% | | | | | 0.07% | |
Ratios (to average net assets)/Supplemental Data: | | | | | | | | | | | | | | | |
Expenses* | | | | 0.85% | 5 | | | | 0.85% | | | | | 0.85% | 5 |
Net investment income | | | | 2.29% | 5 | | | | 2.16% | | | | | 2.16% | 5 |
Portfolio turnover | | | | 23% | | | | | 40% | | | | | 51% | |
|
| *The investment advisor did not impose all or a portion of its management and/or other fees, and in some periods may have paid a portion of the Series’ expenses. If these expenses had been incurred by the Class, the expense ratio (to average net assets) would have increased by the following amounts: | |
| | | | 0.01% | 5 | | | | 0.01% | | | | | 0.00% | 5,6 |
1Commencement of operations.
2Calculated based on average shares outstanding during the periods.
3Less than $0.01.
4Represents aggregate total return for the periods indicated, and assumes reinvestment of all distributions. Total return would have been lower had certain expenses not been waived during the periods. Periods less than one year are not annualized.
5Annualized.
6Less than 0.01%.
The accompanying notes are an integral part of the financial statements.
18
Global Fixed Income Series
Financial Highlights - Class I
| | | | | | | | |
| | | FOR THE SIX MONTHS ENDED | | FOR THE YEARS ENDED | | FOR THE PERIOD 10/1/121 TO 12/31/12 |
| | | 6/30/15 (UNAUDITED) | | 12/31/14 | | 12/31/13 | |
| | | | | | | | | | | | | | | | | | | | |
Per share data (for a share outstanding throughout each
period): | | | | | | | | | | | | | | | | | | | | |
Net asset value - Beginning of period | | | | $9.69 | | | | | $9.93 | | | | | $10.09 | | | | | $10.00 | |
| | | | | | | | | | | | | | | | | | | | |
| | | | |
Income (loss) from investment operations: | | | | | | | | | | | | | | | | | | | | |
| | | | |
Net investment income2 | | | | 0.12 | | | | | 0.23 | | | | | 0.23 | | | | | 0.04 | |
| | | | |
Net realized and unrealized gain (loss) on investments | | | | (0.33 | ) | | | | (0.17 | ) | | | | (0.26 | ) | | | | 0.05 | |
| | | | | | | | | | | | | | | | | | | | |
| | | | |
Total from investment operations | | | | (0.21 | ) | | | | 0.06 | | | | | (0.03 | ) | | | | 0.09 | |
| | | | | | | | | | | | | | | | | | | | |
| | | | |
Less distributions to shareholders: | | | | | | | | | | | | | | | | | | | | |
| | | | |
From net investment income | | | | (0.03 | ) | | | | (0.26 | ) | | | | (0.13 | ) | | | | — | 3 |
| | | | |
From net realized gain on investments | | | | — | | | | | (0.04 | ) | | | | — | 3 | | | | — | 3 |
| | | | | | | | | | | | | | | | | | | | |
| | | | |
Total distributions to shareholders | | | | (0.03 | ) | | | | (0.30 | ) | | | | (0.13 | ) | | | | — | 3 |
| | | | | | | | | | | | | | | | | | | | |
| | | | |
Net asset value - End of period | | | | $9.45 | | | | | $9.69 | | | | | $9.93 | | | | | $10.09 | |
| | | | | | | | | | | | | | | | | | | | |
| | | | |
Net assets - End of period (000’s omitted) | | | $ | 52,729 | | | | $ | 46,875 | | | | $ | 35,190 | | | | $ | 5,106 | |
| | | | | | | | | | | | | | | | | | | | |
| | | | |
Total return4 | | | | (2.13% | ) | | | | 0.57% | | | | | (0.32% | ) | | | | 0.95% | |
Ratios (to average net assets)/Supplemental Data: | | | | | | | | | | | | | | | | | | | | |
Expenses* | | | | 0.70% | 5 | | | | 0.70% | | | | | 0.70% | | | | | 0.70% | 5 |
Net investment income | | | | 2.44% | 5 | | | | 2.31% | | | | | 2.32% | | | | | 1.60% | 5 |
Portfolio turnover | | | | 23% | | | | | 40% | | | | | 51% | | | | | 4% | |
|
| *The investment advisor did not impose all or a portion of its management and/or other fees, and in some periods may have paid a portion of the Series’ expenses. If these expenses had been incurred by the Class, the expense ratio (to average net assets) would have increased by the following amounts: | |
| | | | 0.01% | 5 | | | | 0.02% | | | | | 0.11% | | | | | 4.08% | 5 |
1Commencement of operations.
2Calculated based on average shares outstanding during the periods.
3Less than $0.01.
4Represents aggregate total return for the periods indicated, and assumes reinvestment of all distributions. Total return would have been lower had certain expenses not been waived during the periods. Periods less than one year are not annualized.
5Annualized.
The accompanying notes are an integral part of the financial statements.
19
Global Fixed Income Series
Notes to Financial Statements
(unaudited)
Global Fixed Income Series (the “Series”) is a no-load non-diversified series of Manning & Napier Fund, Inc. (the “Fund”). The Fund is organized in Maryland and is registered under the Investment Company Act of 1940, as amended, as an open-end management investment company.
The Series’ investment objective is to provide long-term total return by investing principally in fixed income securities of issuers located anywhere in the world.
The Fund’s advisor is Manning & Napier Advisors, LLC (the “Advisor”). Shares of the Series are offered to investors, clients and employees of the Advisor and its affiliates. The Series is authorized to issue two classes of shares (Class S and Class I). Each class of shares is substantially the same except the Class S shares bear shareholder services fees. The total authorized capital stock of the Fund consists of 15 billion shares of common stock each having a par value of $0.01. As of June 30, 2015, 10.6 billion shares have been designated in total among 41 series, of which 100 million have been designated as Global Fixed Income Series Class S common stock, and 100 million designated as Global Fixed Income Series Class I common stock.
| 2. | Significant Accounting Policies |
The following is a summary of significant accounting policies followed by the Series. The Series is an investment company and, accordingly, follows the investment company accounting and reporting guidance of the Financial Accounting Standards Board Accounting Standards Codification Topic 946 - Investment Companies, which is part of accounting principles generally accepted in the United States of America (“GAAP”).
Security Valuation
Portfolio securities, including domestic equities, foreign equities, warrants and options, listed on an exchange other than the NASDAQ Stock Market are valued at the latest quoted sales price of the exchange on which the security is primarily traded. Securities not traded on valuation date or securities not listed on an exchange are valued at the latest quoted bid price provided by the Fund’s pricing service. Securities listed on the NASDAQ Stock Market are valued in accordance with the NASDAQ Official Closing Price.
Debt securities, including government bonds, foreign bonds, asset-backed securities, structured notes, supranational obligations, sovereign bonds, corporate bonds and mortgage-backed securities will normally be valued on the basis of evaluated bid prices provided directly by an independent pricing service. The pricing services use multiple valuation techniques to determine fair value. In instances where sufficient market activity exists, the pricing services may utilize a market-based approach through which quotes from market makers are used to determine fair value. In instances where sufficient market activity may not exist or is limited, the pricing services also utilize proprietary valuation models which may consider market characteristics such as benchmark yield curves, option-adjusted spreads, credit spreads, estimated default rates, coupon rates, anticipated timing of principal repayments, underlying collateral, and other unique security features in order to estimate the relevant cash flows, which are then discounted to calculate the fair value. Certain investments in securities held by the Series may be valued on a basis of a price provided directly by a principal market maker. These prices may differ from the value that would have been used had a broader market for securities existed.
Municipal securities will normally be valued on the basis of market valuations provided by an independent pricing service that utilizes the latest price quotations and a matrix system (which considers such factors as security prices of similar securities, yields, maturities and ratings).
Short-term investments that mature in sixty days or less are valued at amortized cost, which approximates fair value. Investments in open-end investment companies are valued at their net asset value per share on valuation date.
Volume and level of activity in established markets for an asset or liability are evaluated to determine whether recent transactions and quoted prices are determinative of fair value. Where there have been significant decreases in volume and level of activity, further analysis and adjustment may be necessary to estimate fair value. The Series measures fair value in these instances by the use of inputs and valuation techniques which may be based upon current market prices of securities that are
20
Global Fixed Income Series
Notes to Financial Statements (continued)
(unaudited)
| 2. | Significant Accounting Policies (continued) |
Security Valuation (continued)
comparable in coupon, rating, maturity and industry and/or expectation of future cash flows. As a result of trading in relatively thin markets and/or markets that experience significant volatility, the prices used by the Series to value these securities may differ from the value that would be realized if these securities were sold, and the differences could be material.
Securities for which representative valuations or prices are not available from the Series’ pricing service may be valued at fair value as determined in good faith by the Advisor under procedures approved by and under the general supervision and responsibility of the Fund’s Board of Directors (the “Board”). Due to the inherent uncertainty of valuations of such securities, the fair value may differ significantly from the values that would have been used had a ready market for such securities existed. If trading or events occurring after the close of the principal market in which securities are traded are expected to materially affect the value of those securities, then they may be valued at their fair value, taking this trading or these events into account.
Various inputs are used in determining the value of the Series’ assets or liabilities carried at fair value. These inputs are summarized in three broad levels. Level 1 includes quoted prices in active markets for identical assets and liabilities. Level 2 includes other significant observable inputs (including quoted prices for similar securities, interest rates, prepayment speeds, credit risk, etc.). Level 3 includes significant unobservable inputs (including the Series’ own assumptions in determining the fair value of investments). A financial instrument’s level within the fair value hierarchy is based on the lowest level of any input both individually and in aggregate that is significant to the fair value measurement. The inputs or methodology used for valuing securities are not necessarily an indication of the risk associated with investing in those securities.
The following is a summary of the valuation levels used for major security types as of June 30, 2015 in valuing the Series’ assets or liabilities carried at fair value:
| | | | | | | | | | | | | | | | |
| DESCRIPTION | | TOTAL | | | LEVEL 1 | | | LEVEL 2 | | | LEVEL 3 | |
Assets: | | | | | | | | | | | | | | | | |
Debt securities: | | | | | | | | | | | | | | | | |
U.S. Treasury and other U.S. | | | | | | | | | | | | | | | | |
Government agencies | | $ | 8,225,111 | | | $ | — | | | $ | 8,225,111 | | | $ | — | |
Corporate debt: | | | | | | | | | | | | | | | | |
Consumer Discretionary | | | 14,130,609 | | | | — | | | | 14,130,609 | | | | — | |
Consumer Staples | | | 3,503,012 | | | | — | | | | 3,503,012 | | | | — | |
Energy | | | 11,399,155 | | | | — | | | | 11,399,155 | | | | — | |
Financials | | | 60,024,779 | | | | — | | | | 60,024,779 | | | | — | |
Health Care | | | 4,375,874 | | | | — | | | | 4,375,874 | | | | — | |
Industrials | | | 7,655,922 | | | | — | | | | 7,655,922 | | | | — | |
Information Technology | | | 3,749,843 | | | | — | | | | 3,749,843 | | | | — | |
Materials | | | 5,335,723 | | | | — | | | | 5,335,723 | | | | — | |
Telecommunication Services | | | 2,908,068 | | | | — | | | | 2,908,068 | | | | — | |
Utilities | | | 1,564,157 | | | | — | | | | 1,564,157 | | | | — | |
Commercial mortgage-backed securities | | | 9,375,319 | | | | — | | | | 9,375,319 | | | | — | |
Foreign government bonds | | | 120,027,199 | | | | — | | | | 120,027,199 | | | | — | |
Mutual funds | | | 2,897,104 | | | | 2,897,104 | | | | — | | | | — | |
| | | | | | | | | | | | | | | | |
Total assets | | $ | 255,171,875 | | | $ | 2,897,104 | | | $ | 252,274,771 | | | $ | — | |
| | | | | | | | | | | | | | | | |
There were no Level 3 securities held by the Series as of December 31, 2014 or June 30, 2015.
The Fund’s policy is to recognize transfers in and transfers out of the valuation levels as of the beginning of the reporting period. There were no transfers between Level 1 and Level 2 during the six months ended June 30, 2015.
Security Transactions, Investment Income and Expenses
Security transactions are accounted for on trade date. Dividend income is recorded on the ex-dividend date, except that if the ex-dividend date has passed, certain dividends from foreign securities are recorded as soon as the Series is informed of the
21
Global Fixed Income Series
Notes to Financial Statements (continued)
(unaudited)
| 2. | Significant Accounting Policies (continued) |
Security Transactions, Investment Income and Expenses (continued)
ex-dividend date. Non-cash dividends, if any, are recorded at the fair value of the securities received. Interest income, including amortization of premium and accretion of discounts using the effective interest method, is earned from settlement date and accrued daily.
Expenses are recorded on an accrual basis. Most expenses of the Fund can be attributed to a specific series. Expenses which cannot be directly attributed are apportioned among the series in the Fund in such a manner as deemed equitable by the Fund’s Board, taking into consideration, among other things, the nature and type of expense. Income, expenses (other than shareholder services fees), and realized and unrealized gains and losses are prorated among the classes based on the relative net assets of each class. Class specific expenses are directly charged to that class.
The Series uses the identified cost method for determining realized gain or loss on investments for both financial statement and federal income tax reporting purposes.
Foreign Currency Translation
The books and records of the Series are maintained in U.S. dollars. Foreign currencies, investments and other assets and liabilities are translated into U.S. dollars at the current exchange rates. Purchases and sales of investment securities and income and expenses are translated on the respective dates of such transactions. The Series does not isolate realized and unrealized gains and losses attributable to changes in the exchange rates from gains and losses that arise from changes in the fair value of investments. Such fluctuations are included with net realized and unrealized gain or loss on investments. Net realized foreign currency gains and losses represent foreign currency gains and losses between trade date and settlement date on securities transactions, gains and losses on disposition of foreign currencies and the difference between the amount of income and foreign withholding taxes recorded on the books of the Series and the amounts actually received or paid.
Securities Purchased on a When-Issued Basis or Forward Commitment
The Series may purchase securities on a when-issued basis or forward commitment. These transactions involve a commitment by the Series to purchase securities for a predetermined price with payment and delivery taking place beyond the customary settlement period. When such purchases are outstanding, the Series will designate liquid assets in an amount sufficient to meet the purchase price. When purchasing a security on a delayed delivery basis, the Series assumes the rights and risks of ownership of the security, including the risk of price and yield fluctuations, and takes such fluctuations into account when determining its net asset value. The Series may sell the when-issued securities before they are delivered, which may result in a capital gain or loss. No such investments were held by the Series on June 30, 2015.
In connection with its ability to purchase or sell securities on a forward commitment basis, the Series may enter into forward roll transactions principally using To Be Announced (TBA) securities. Forward roll transactions require the sale of securities for delivery in the current month, and a simultaneous agreement to repurchase substantially similar (same type, coupon and maturity) securities on a specified future date. Risks of entering into forward roll transactions include the potential inability of the counterparty to meet the terms of the agreement; the potential of the Series to receive inferior securities at redelivery as compared to the securities sold to the counterparty; counterparty credit risk; and the potential pay down speed variance between the mortgage-backed pools. During the roll period, the Series forgoes principal and interest paid on the securities. The Series accounts for such dollar rolls as purchases and sales. Information regarding securities purchased on a when-issued basis is included in the Series’ Investment Portfolio. No such investments were held by the Series on June 30, 2015.
Restricted Securities
Restricted securities are purchased in private placement transactions, are not registered under the Securities Act of 1933, as amended, and may have contractual restrictions on resale. Information regarding restricted securities is included at the end of the Series’ Investment Portfolio.
Illiquid Securities
A security may be considered illiquid if so deemed in good faith by the Advisor under procedures approved by and under the general supervision and responsibility of the Fund’s Board. Securities that are illiquid are marked with the applicable footnote on the Investment Portfolio. No such investments were held by the Series at June 30, 2015.
22
Global Fixed Income Series
Notes to Financial Statements (continued)
(unaudited)
| 2. | Significant Accounting Policies (continued) |
Federal Taxes
The Series’ policy is to comply with the provisions of the Internal Revenue Code applicable to regulated investment companies. The Series is not subject to federal income tax or excise tax to the extent that the Series distributes to shareholders each year its taxable income, including any net realized gains on investments, in accordance with requirements of the Internal Revenue Code. Accordingly, no provision for federal income tax or excise tax has been made in the financial statements.
Management evaluates its tax positions to determine if the tax positions taken meet the minimum recognition threshold in connection with accounting for uncertainties in income tax positions taken or expected to be taken for the purposes of measuring and recognizing tax liabilities in the financial statements. Recognition of tax benefits of an uncertain tax position is required only when the position is “more likely than not” to be sustained assuming examination by taxing authorities. At June 30, 2015, the Series has recorded no liability for net unrecognized tax benefits relating to uncertain income tax positions taken or expected to be taken in future tax returns.
The Series files income tax returns in the U.S. federal jurisdiction, various states and foreign jurisdictions, as required. No income tax returns are currently under investigation. The statute of limitations on the Series’ tax returns remains open for the period ended December 31, 2012 and the years ended December 31, 2013 through December 31, 2014. The Series is not aware of any tax positions for which it is reasonably possible that the total amounts of unrecognized tax benefits will significantly change in the next twelve months.
Foreign Taxes
Based on the Series’ understanding of the tax rules and rates related to income, gains and currency purchase/repatriation transactions for foreign jurisdictions in which it invests, the Series will provide for foreign taxes, and where appropriate, deferred foreign tax. The Series is subject to a tax imposed on short term capital gains on securities of issuers domiciled in India. The Series records an estimated deferred tax liability for securities that have been held for less than a year at the end of the reporting period, assuming those positions were disposed of at the end of the period. This amount is reported in Accrued foreign capital gains tax in the accompanying Statement of Assets and Liabilities. Realized losses on the sale of securities of issuers domiciled in India can be carried forward for eight years to offset potential future short term realized capital gains.
Distributions of Income and Gains
Distributions to shareholders of net investment income are made quarterly. Distributions of net realized gains are made annually. An additional distribution may be necessary to avoid taxation of the Series. Distributions are recorded on the ex-dividend date.
Indemnifications
The Fund’s organizational documents provide former and current directors and officers with a limited indemnification against liabilities arising in connection with the performance of their duties to the Fund. In the normal course of business, the Fund may also enter into contracts that provide general indemnifications. The Fund’s maximum exposure under these arrangements is unknown as this would be dependent on future claims that may be made against the Fund. The risk of material loss from such claims is considered remote.
Other
The preparation of financial statements in conformity with GAAP requires management to make estimates and assumptions that affect the reported amounts of assets and liabilities and the disclosure of contingent assets and liabilities at the date of the financial statements and the reported amounts of income and expenses during the reporting period. Actual results could differ from those estimates.
| 3. | Transactions with Affiliates |
The Fund has an Investment Advisory Agreement (the “Agreement”) with the Advisor, for which the Series pays a fee, computed daily and payable monthly, at an annual rate of 0.60% of the Series’ average daily net assets.
Under the Agreement, personnel of the Advisor provide the Series with advice and assistance in the choice of investments and the execution of securities transactions, and otherwise maintain the Series’ organization. The Advisor also provides the Fund
23
Global Fixed Income Series
Notes to Financial Statements (continued)
(unaudited)
| 3. | Transactions with Affiliates (continued) |
with necessary office space and fund administration and support services. The salaries of all officers of the Fund (except a percentage of the Fund’s Chief Compliance Officer’s salary, which is paid by the Fund), and of all Directors who are “affiliated persons” of the Fund, or of the Advisor, and all personnel of the Fund, or of the Advisor, performing services relating to research, statistical and investment activities, are paid by the Advisor. Each “non-affiliated” Director receives an annual stipend, which is allocated among all the active series of the Fund. In addition, these Directors also receive a fee per Board meeting attended plus a fee for each committee meeting attended and are reimbursed for travel and other out-of-pocket expenses incurred by them in connection with attending such meetings. The Fund also has an Audit Committee Chair, who receives an additional annual stipend for this role.
The Class S shares of the Series are subject to a shareholder services fee in accordance with a shareholder services plan adopted by the Board. The shareholder services fee is intended to compensate financial intermediaries, including affiliates of the Fund, in connection with the provision of direct client service, personal services, maintenance of shareholder accounts and reporting services. For these services, Class S of the Series pays a fee, computed daily and payable monthly, at an annual rate of 0.15% of the average daily net assets of Class S. The Fund has a Shareholder Services Agreement with the Advisor, for which the Advisor receives the shareholder services fee as stated above.
The Advisor has contractually agreed, until at least April 30, 2016, to waive its fee and, if necessary, pay other operating expenses of the Series in order to maintain total direct annual fund operating expenses for the Series, exclusive of Class S’s shareholder services fee, at no more than 0.70% of average daily net assets each year. For the six months ended June 30, 2015, the Advisor waived fees of $16,962, which is included as a reduction of expenses on the Statement of Operations. The Advisor is not eligible to recoup any expenses that have been waived or reimbursed in prior years.
Manning & Napier Investor Services, Inc., a registered broker-dealer affiliate of the Advisor, acts as distributor for the Fund’s shares. The services of Manning & Napier Investor Services, Inc. are provided at no additional cost to the Series.
Pursuant to a master services agreement dated November 1, 2014, the Fund pays the Advisor an annual fee related to fund accounting and administration of 0.0085% on the first $25 billion of average daily net assets (excluding Target Series and Strategic Income Series); 0.0075% on the next $15 billion of average daily net assets (excluding Target Series and Strategic Income Series); and 0.0065% of the average daily net assets in excess of $40 billion (excluding Target Series and Strategic Income Series); plus a base fee of $30,400 per series. Transfer agent fees are charged to the Fund on a per account basis. Additionally, certain transaction and out-of-pocket expenses, including charges for reporting relating to the Fund’s compliance program, are charged. The Advisor has agreements with BNY Mellon Investment Servicing (U.S.) Inc. (“BNY”) under which BNY serves as sub-accountant services agent and sub-transfer agent.
Expenses not directly attributable to a series are allocated based on each series’ relative net assets or number of accounts, depending on the expense.
| 4. | Purchases and Sales of Securities |
For the six months ended June 30, 2015, purchases and sales of securities, other than U.S. Government securities and short-term securities, were $67,175,662 and $44,375,019, respectively. Purchases and sales of U.S. Government securities, other than short-term securities, were $12,597,920 and $11,854,165, respectively.
24
Global Fixed Income Series
Notes to Financial Statements (continued)
(unaudited)
| 5. | Capital Stock Transactions |
Transactions in shares of Class S and I shares of Global Fixed Income Series were:
| | | | | | | | | | | | | | | | |
| CLASS S | | FOR THE SIX MONTHS ENDED 6/30/15 | | | FOR THE YEAR ENDED 12/31/14 | |
| | | SHARES | | | AMOUNT | | | SHARES | | | AMOUNT | |
Sold | | | 1,251,696 | | | $ | 12,002,235 | | | | 2,714,749 | | | $ | 27,373,610 | |
Reinvested | | | 67,747 | | | | 636,827 | | | | 576,221 | | | | 5,722,647 | |
Repurchased | | | (1,163,426 | ) | | | (11,132,289 | ) | | | (1,580,241 | ) | | | (15,952,388 | ) |
| | | | | | | | | | | | | | | | |
Total | | | 156,017 | | | $ | 1,506,773 | | | | 1,710,729 | | | $ | 17,143,869 | |
| | | | | | | | | | | | | | | | |
| | | | | | | | | | | | | | | | |
| CLASS I | | FOR THE SIX MONTHS ENDED 6/30/15 | | | FOR THE YEAR ENDED 12/31/14 | |
| | | SHARES | | | AMOUNT | | | SHARES | | | AMOUNT | |
Sold | | | 760,540 | | | $ | 7,323,809 | | | | 1,341,255 | | | $ | 13,538,946 | |
Reinvested | | | 19,020 | | | | 178,978 | | | | 141,458 | | | | 1,406,647 | |
Repurchased | | | (32,270 | ) | | | (310,249 | ) | | | (193,197 | ) | | | (1,958,199 | ) |
| | | | | | | | | | | | | | | | |
Total | | | 747,290 | | | $ | 7,192,538 | | | | 1,289,516 | | | $ | 12,987,394 | |
| | | | | | | | | | | | | | | | |
Over 90% of the shares outstanding are fiduciary accounts where the Advisor has sole investment discretion. No shareholder exceeds the 10% threshold.
The Series may trade in instruments including written and purchased options, forward foreign currency exchange contracts and futures contracts and other derivatives in the normal course of investing activities to assist in managing exposure to various market risks. The Series may be subject to various elements of risk, which may involve, to a varying degree, elements of risk in excess of the amounts recognized for financial statement purposes. These risks include: the risk that changes in the value of a derivative may not correlate perfectly with the underlying asset, rate or index; counterparty credit risk related to over the counter derivative counterparties’ failure to perform under contract terms; liquidity risk related to the lack of a liquid market for these contracts allowing the fund to close out its position(s); and documentation risk relating to disagreement over contract terms. No such investments were held by the Series as of June 30, 2015.
Investing in securities of foreign companies and foreign governments involves special risks and considerations not typically associated with investing in securities of domestic companies and the U.S. Government. These risks include revaluation of currencies and future adverse political and economic developments. Moreover, securities of foreign companies and foreign governments and their markets may be less liquid and their prices more volatile than those of comparable domestic companies and the U.S. Government.
| 8. | Federal Income Tax Information |
The amount and characterization of certain income and capital gains to be distributed are determined in accordance with federal income tax regulations, which may differ from GAAP. The Series may periodically make reclassifications among its capital accounts to reflect income and gains available for distribution (or available capital loss carryovers) under income tax regulations without impacting the Series’ net asset value. Any such reclassifications are not reflected in the financial highlights.
25
Global Fixed Income Series
Notes to Financial Statements (continued)
(unaudited)
| 8. | Federal Income Tax Information (continued) |
The final determination of the tax character of current year distributions will be made at the conclusion of the fiscal year. The tax character of distributions paid for the year ended December 31, 2014 were as follows:
| | | | | | |
Ordinary income | | | $6,243,524 | | | |
Long-term capital gains | | | 1,137,675 | | | |
At June 30, 2015, the identified cost of investments for federal income tax purposes, the resulting gross unrealized appreciation and depreciation, and the net unrealized depreciation were as follows:
| | | | | | |
Cost for federal income tax purposes | | $ | 267,716,004 | | | |
Unrealized appreciation | | | 1,630,325 | | | |
Unrealized depreciation | | | (14,174,454 | ) | | |
| | | | | | |
Net unrealized depreciation | | $ | (12,544,129 | ) | | |
| | | | | | |
26
Global Fixed Income Series
Literature Requests
(unaudited)
Proxy Voting Policies and Procedures
A description of the policies and procedures that the Fund uses to determine how to vote proxies relating to portfolio securities is available, without charge, upon request:
| | |
| By phone | | 1-800-466-3863 |
| On the Securities and Exchange | | |
| Commission’s (SEC) web site | | http://www.sec.gov |
Proxy Voting Record
Information regarding how the Fund voted proxies relating to portfolio securities during the most recent 12-month period ended June 30th is available, without charge, upon request:
| | |
| By phone | | 1-800-466-3863 |
| On the SEC’s web site | | http://www.sec.gov |
Quarterly Portfolio Holdings
The Series’ complete schedule of portfolio holdings for the 1st and 3rd quarters of each fiscal year are provided on Form N-Q, and are available, without charge, upon request:
| | |
| By phone | | 1-800-466-3863 |
| On the SEC’s web site | | http://www.sec.gov |
The Series’ Form N-Q may be reviewed and copied at the SEC’s Public Reference Room in Washington, D.C. Information on the operation of the Public Reference Room may be obtained by calling 1-800-SEC-0330.
Prospectus and Statement of Additional Information (SAI)
For more information about any of the Manning & Napier Fund, Inc. Series, you may obtain a prospectus and SAI at www.manning-napier.com or by calling (800) 466-3863. Before investing, carefully consider the objectives, risks, charges and expenses of the investment and read the prospectus carefully as it contains this and other information about the investment company. In addition, this information can be found on the SEC’s web site, http://www.sec.gov.
Additional information available at www.manning-napier.com
1. Fund Holdings - Month-End
2. Fund Holdings - Quarter-End
3. Shareholder Report - Annual
4. Shareholder Report - Semi-Annual
The Fund also offers electronic notification or “e-delivery” when certain documents are available on-line to be downloaded or reviewed. Direct shareholders can elect to receive electronic notification when shareholder reports, prospectus updates, and/or statements are available. If you do not currently have on-line access to your account, you can establish access by going to www.manning-napier.com, click on “Login” in the top corner of the page, and follow the prompts to self-enroll. Once enrolled, you can set your electronic notification preferences by clicking on the Account Options tab located within the green toolbar and then select E-Delivery Option. Should you have any questions on either how to establish on-line access or how to update your account settings, please contact Investor Services at 1-800-466-3863.
The Manning & Napier Fund, Inc. is managed by Manning & Napier Advisors, LLC. Manning & Napier Investor Services, Inc., an affiliate of Manning & Napier Advisors, LLC, is the distributor of the Fund shares.
MNGFI-6/15-SAR

Dynamic Opportunities Series
Shareholder Expense Example
(unaudited)
As a shareholder of the Series, you may incur two types of costs: (1) transaction costs and (2) ongoing costs, including management fees and other Series expenses. This example is intended to help you understand your ongoing costs (in dollars) of investing in the Series and to compare these costs with the ongoing costs of investing in other mutual funds.
The example is based on an investment of $1,000 invested at the beginning of the period and held for the entire period (January 1, 2015 to June 30, 2015).
Actual Expenses
The Actual lines of the table below provide information about actual account values and actual expenses. You may use the information in this line, together with the amount you invested, to estimate the expenses that you paid over the period. Simply divide your account value by $1,000 (for example, an $8,600 account value divided by $1,000 = 8.6), then multiply the result by the number in the Actual line for the Class in which you have invested under the heading entitled “Expenses Paid During Period” to estimate the expenses you paid on your account during this period.
Hypothetical Example for Comparison Purposes
The Hypothetical lines of each Class in the table below provide information about hypothetical account values and hypothetical expenses based on the Class’ actual expense ratio and an assumed rate of return of 5% per year before expenses, which is not the Class’ actual return. The hypothetical account values and expenses may not be used to estimate the actual ending account balance or expenses you paid during the period. You may use this information to compare the ongoing costs of investing in the Series and other funds. To do so, compare this 5% hypothetical example for the class in which you have invested with the 5% hypothetical examples that appear in the shareholder reports of the other funds.
Please note that the expenses shown in the table are meant to highlight your ongoing costs only and do not reflect any transaction costs. Therefore, the Hypothetical lines for each Class in the table are useful in comparing ongoing costs only, and will not help you determine the relative total costs of owning different funds. In addition, if these transaction costs were included, your costs would have been higher.
| | | | | | | | |
| | | BEGINNING
ACCOUNT VALUE
1/1/15 | | ENDING
ACCOUNT VALUE
6/30/15 | | EXPENSES PAID
DURING PERIOD*
1/1/15-6/30/15 | | ANNUALIZED
EXPENSE RATIO |
Class S | | | | | | | | |
Actual | | $1,000.00 | | $1,075.90 | | $5.46 | | 1.06% |
Hypothetical (5% return before expenses) | | $1,000.00 | | $1,019.54 | | $5.31 | | 1.06% |
Class I | | | | | | | | |
Actual | | $1,000.00 | | $1,076.80 | | $4.43 | | 0.86% |
Hypothetical (5% return before expenses) | | $1,000.00 | | $1,020.53 | | $4.31 | | 0.86% |
*Expenses are equal to each Class’ annualized expense ratio (for the six-month period), multiplied by the average account value over the period, multiplied by 181/365 (to reflect the one-half year period). Expenses are based on the most recent fiscal half year.
1
Dynamic Opportunities Series
Portfolio Composition as of June 30, 2015
(unaudited)
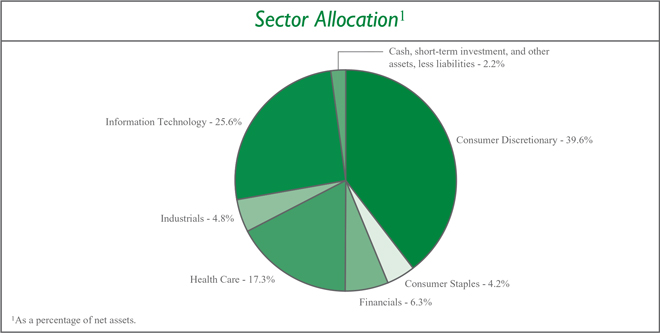
2
Dynamic Opportunities Series
Investment Portfolio - June 30, 2015
(unaudited)
| | | | | | | | |
| | |
| | | SHARES | | | VALUE (NOTE 2) | |
| | |
COMMON STOCKS - 97.8% | | | | | | | | |
| | |
Consumer Discretionary - 39.6% | | | | | | | | |
Diversified Consumer Services - 2.0% | | | | | | | | |
Houghton Mifflin Harcourt Co.* | | | 249,430 | | | $ | 6,285,636 | |
| | | | | | | | |
Internet & Catalog Retail - 5.0% | | | | | | | | |
TripAdvisor, Inc.* | | | 183,940 | | | | 16,028,532 | |
| | | | | | | | |
Media - 15.3% | | | | | | | | |
AMC Networks, Inc. - Class A* | | | 284,530 | | | | 23,288,781 | |
Discovery Communications, Inc. - Class A* | | | 496,820 | | | | 16,524,233 | |
Morningstar, Inc. | | | 112,290 | | | | 8,932,670 | |
| | | | | | | | |
| | |
| | | | | | | 48,745,684 | |
| | | | | | | | |
Specialty Retail - 8.4% | | | | | | | | |
Advance Auto Parts, Inc. | | | 92,280 | | | | 14,699,281 | |
Dick’s Sporting Goods, Inc. | | | 233,490 | | | | 12,087,777 | |
| | | | | | | | |
| | |
| | | | | | | 26,787,058 | |
| | | | | | | | |
Textiles, Apparel & Luxury Goods - 8.9% | | | | | | | | |
Gildan Activewear, Inc. (Canada) | | | 211,410 | | | | 7,027,268 | |
lululemon athletica, Inc.* | | | 323,720 | | | | 21,138,916 | |
| | | | | | | | |
| | |
| | | | | | | 28,166,184 | |
| | | | | | | | |
| | |
Total Consumer Discretionary | | | | | | | 126,013,094 | |
| | | | | | | | |
| | |
Consumer Staples - 4.2% | | | | | | | | |
Food Products - 4.2% | | | | | | | | |
Keurig Green Mountain, Inc. | | | 173,720 | | | | 13,312,164 | |
| | | | | | | | |
| | |
Financials - 6.3% | | | | | | | | |
Capital Markets - 3.1% | | | | | | | | |
Financial Engines, Inc. | | | 231,480 | | | | 9,833,270 | |
| | | | | | | | |
Consumer Finance - 3.2% | | | | | | | | |
SLM Corp.* | | | 1,038,880 | | | | 10,253,746 | |
| | | | | | | | |
| | |
Total Financials | | | | | | | 20,087,016 | |
| | | | | | | | |
| | |
Health Care - 17.3% | | | | | | | | |
Biotechnology - 2.1% | | | | | | | | |
Seattle Genetics, Inc.* | | | 137,200 | | | | 6,640,480 | |
| | | | | | | | |
Health Care Equipment & Supplies - 12.2% | | | | | | | | |
HeartWare International, Inc.* | | | 170,100 | | | | 12,364,569 | |
Shandong Weigao Group Medical Polymer Co. Ltd. - Class H (China)1 | | | 20,965,890 | | | | 15,644,370 | |
Thoratec Corp.* | | | 242,890 | | | | 10,825,607 | |
| | | | | | | | |
| | |
| | | | | | | 38,834,546 | |
| | | | | | | | |
Health Care Providers & Services - 3.0% | | | | | | | | |
DaVita HealthCare Partners, Inc.* | | | 121,300 | | | | 9,639,711 | |
| | | | | | | | |
| | |
Total Health Care | | | | | | | 55,114,737 | |
| | | | | | | | |
The accompanying notes are an integral part of the financial statements.
3
Dynamic Opportunities Series
Investment Portfolio - June 30, 2015
(unaudited)
| | | | | | | | |
| | |
| | | SHARES | | | VALUE (NOTE 2) | |
| | |
COMMON STOCKS (continued) | | | | | | | | |
| | |
Industrials - 4.8% | | | | | | | | |
Road & Rail - 4.8% | | | | | | | | |
Genesee & Wyoming, Inc.* | | | 140,520 | | | $ | 10,704,814 | |
Kansas City Southern | | | 51,240 | | | | 4,673,088 | |
| | | | | | | | |
| | |
Total Industrials | | | | | | | 15,377,902 | |
| | | | | | | | |
| | |
Information Technology - 25.6% | | | | | | | | |
Communications Equipment - 4.5% | | | | | | | | |
Ixia* | | | 1,159,480 | | | | 14,423,931 | |
| | | | | | | | |
Electronic Equipment, Instruments & Components - 6.5% | | | | | | | | |
FLIR Systems, Inc. | | | 268,590 | | | | 8,277,944 | |
Trimble Navigation Ltd.* | | | 527,660 | | | | 12,378,904 | |
| | | | | | | | |
| | |
| | | | | | | 20,656,848 | |
| | | | | | | | |
Internet Software & Services - 8.8% | | | | | | | | |
MercadoLibre, Inc. (Argentina) | | | 68,380 | | | | 9,689,446 | |
Q2 Holdings, Inc.* | | | 148,630 | | | | 4,198,797 | |
Qihoo 360 Technology Co. Ltd. - ADR (China)* | | | 155,670 | | | | 10,537,302 | |
Zillow Group, Inc. - Class A* | | | 41,250 | | | | 3,578,025 | |
| | | | | | | | |
| | |
| | | | | | | 28,003,570 | |
| | | | | | | | |
IT Services - 2.6% | | | | | | | | |
EVERTEC, Inc. | | | 394,210 | | | | 8,373,020 | |
| | | | | | | | |
Software - 3.2% | | | | | | | | |
Yodlee, Inc.* | | | 697,030 | | | | 10,065,113 | |
| | |
Total Information Technology | | | | | | | 81,522,482 | |
| | | | | | | | |
| | |
TOTAL COMMON STOCKS | | | | | | | | |
(Identified Cost $297,876,159) | | | | | | | 311,427,395 | |
| | | | | | | | |
The accompanying notes are an integral part of the financial statements.
4
Dynamic Opportunities Series
Investment Portfolio - June 30, 2015
(unaudited)
| | | | | | | | |
| | |
| | | SHARES | | | VALUE (NOTE 2) | |
| | |
SHORT-TERM INVESTMENT - 1.3% | | | | | | | | |
| | |
Dreyfus Cash Management, Inc. - Institutional Shares2, 0.04%, | | | | | | | | |
(Identified Cost $4,364,114) | | | 4,364,114 | | | $ | 4,364,114 | |
| | | | | | | | |
| | |
TOTAL INVESTMENTS - 99.1% | | | | | | | | |
(Identified Cost $302,240,273) | | | | | | | 315,791,509 | |
OTHER ASSETS, LESS LIABILITIES - 0.9% | | | | | | | 2,734,280 | |
| | | | | | | | |
| | |
NET ASSETS - 100% | | | | | | $ | 318,525,789 | |
| | | | | | | | |
ADR - American Depositary Receipt
*Non-income producing security.
1A factor from a third party vendor was applied to determine the security’s fair value following the close of local trading.
2Rate shown is the current yield as of June 30, 2015.
The Global Industry Classification Standard (GICS) was developed by and is the exclusive property and a service mark of MSCI Inc. (MSCI) and Standard & Poor’s, a division of The McGraw-Hill Companies, Inc. (S&P), and is licensed for use by Manning & Napier when referencing GICS sectors. Neither MSCI, S&P, nor any third party involved in making or compiling the GICS or any GICS classifications makes any express or implied warranties or representations with respect to such standard or classification, nor shall any such party have any liability therefrom.
The accompanying notes are an integral part of the financial statements.
5
Dynamic Opportunities Series
Statement of Assets & Liabilities
June 30, 2015 (unaudited)
| | | | |
ASSETS: | | | | |
| |
Investments, at value (identified cost $302,240,273) (Note 2) | | $ | 315,791,509 | |
Receivable for securities sold | | | 13,149,884 | |
Dividends receivable | | | 163,872 | |
Receivable for fund shares sold | | | 30,464 | |
Foreign tax reclaims receivable | | | 3,132 | |
Prepaid expenses | | | 1,979 | |
| | | | |
| |
TOTAL ASSETS | | | 329,140,840 | |
| | | | |
| |
LIABILITIES: | | | | |
| |
Accrued management fees (Note 3) | | | 228,228 | |
Accrued shareholder services fees (Class S) (Note 3) | | | 45,685 | |
Accrued fund accounting and administration fees (Note 3) | | | 6,236 | |
Accrued transfer agent fees (Note 3) | | | 5,716 | |
Accrued Chief Compliance Officer service fees (Note 3) | | | 382 | |
Payable for securities purchased | | | 9,842,019 | |
Payable for fund shares repurchased | | | 460,784 | |
Other payables and accrued expenses | | | 26,001 | |
| | | | |
| |
TOTAL LIABILITIES | | | 10,615,051 | |
| | | | |
| |
TOTAL NET ASSETS | | $ | 318,525,789 | |
| | | | |
| |
NET ASSETS CONSIST OF: | | | | |
| |
Capital stock | | $ | 299,598 | |
Additional paid-in-capital | | | 290,727,888 | |
Undistributed net investment loss | | | (1,254,522 | ) |
Accumulated net realized gain on investments, foreign currency and translation of other assets and liabilities | | | 15,201,594 | |
Net unrealized appreciation on investments, foreign currency and translation of other assets and liabilities | | | 13,551,231 | |
| | | | |
| |
TOTAL NET ASSETS | | $ | 318,525,789 | |
| | | | |
| |
NET ASSET VALUE, OFFERING PRICE AND REDEMPTION PRICE PER SHARE - Class S ($254,437,451/23,946,103 shares) | | $ | 10.63 | |
| | | | |
| |
NET ASSET VALUE, OFFERING PRICE AND REDEMPTION PRICE PER SHARE - Class I ($64,088,338/6,013,667 shares) | | $ | 10.66 | |
| | | | |
The accompanying notes are an integral part of the financial statements.
6
Dynamic Opportunities Series
Statement of Operations
For the Six Months Ended June 30, 2015 (unaudited)
| | | | |
INVESTMENT INCOME: | | | | |
| |
Dividends (net of foreign taxes withheld, $14,413) | | $ | 393,579 | |
| | | | |
| |
EXPENSES: | | | | |
| |
Management fees (Note 3) | | | 1,289,595 | |
Shareholder services fees (Class S)(Note 3) | | | 260,225 | |
Fund accounting and administration fees (Note 3) | | | 31,761 | |
Transfer agent fees (Note 3) | | | 9,081 | |
Directors’ fees (Note 3) | | | 3,522 | |
Chief Compliance Officer service fees (Note 3) | | | 1,224 | |
Custodian fees | | | 8,203 | |
Miscellaneous | | | 44,490 | |
| | | | |
| |
Total Expenses | | | 1,648,101 | |
| | | | |
| |
NET INVESTMENT LOSS | | | (1,254,522 | ) |
| | | | |
| |
REALIZED AND UNREALIZED GAIN (LOSS) ON INVESTMENTS AND FOREIGN CURRENCY: | | | | |
| |
Net realized gain (loss) on- | | | | |
Investments | | | 21,596,648 | |
Foreign currency and translation of other assets and liabilities | | | (1,187 | ) |
| | | | |
| |
| | | 21,595,461 | |
| | | | |
| |
Net change in unrealized appreciation (depreciation) on- | | | | |
Investments | | | 3,305,183 | |
Foreign currency and translation of other assets and liabilities | | | 224 | |
| | | | |
| |
| | | 3,305,407 | |
| | | | |
| |
NET REALIZED AND UNREALIZED GAIN (LOSS) ON INVESTMENTS AND FOREIGN CURRENCY | | | 24,900,868 | |
| | | | |
| |
NET INCREASE IN NET ASSETS RESULTING FROM OPERATIONS | | $ | 23,646,346 | |
| | | | |
The accompanying notes are an integral part of the financial statements.
7
Dynamic Opportunities Series
Statements of Changes in Net Assets
| | | | | | | | | | |
| | | FOR THE SIX
MONTHS ENDED 6/30/15
(UNAUDITED) | | FOR THE YEAR
ENDED 12/31/14* |
INCREASE (DECREASE) IN NET ASSETS: | | | | | | | | | | |
| | |
OPERATIONS: | | | | | | | | | | |
| | |
Net investment loss | | | $ | (1,254,522 | ) | | | $ | (1,700,667 | ) |
Net realized gain (loss) on investments and foreign currency | | | | 21,595,461 | | | | | 4,176,461 | |
Net change in unrealized appreciation (depreciation) on investments and foreign currency | | | | 3,305,407 | | | | | 10,245,824 | |
| | | | | | | | | | |
| | |
Net increase from operations | | | | 23,646,346 | | | | | 12,721,618 | |
| | | | | | | | | | |
| | |
DISTRIBUTIONS TO SHAREHOLDERS (Note 8): | | | | | | | | | | |
| | |
From net realized gain on investments (Class S) | | | | — | | | | | (7,357,799 | ) |
From net realized gain on investments (Class I) | | | | — | | | | | (1,602,675 | ) |
| | | | | | | | | | |
| | |
Total distributions to shareholders | | | | — | | | | | (8,960,474 | ) |
| | | | | | | | | | |
| | |
CAPITAL STOCK ISSUED AND REPURCHASED: | | | | | | | | | | |
| | |
Net increase (decrease) from capital share transactions (Note 5) | | | | (10,341,657 | ) | | | | 300,959,956 | |
| | | | | | | | | | |
| | |
Net increase in net assets | | | | 13,304,689 | | | | | 304,721,100 | |
| | |
NET ASSETS: | | | | | | | | | | |
| | |
Beginning of period | | | | 305,221,100 | | | | | 500,000 | |
| | | | | | | | | | |
| | |
End of period (including undistributed net investment loss of $1,254,522 and undistributed net investment income of $0, respectively) | | | $ | 318,525,789 | | | | $ | 305,221,100 | |
| | | | | | | | | | |
* Commencement of operations was December 31, 2013.
The accompanying notes are an integral part of the financial statements.
8
Dynamic Opportunities Series
Financial Highlights - Class S
| | | | | | | | | | |
| | | FOR THE SIX
MONTHS ENDED 6/30/15
(UNAUDITED) | | FOR THE YEAR
ENDED 12/31/14* |
Per share data (for a share outstanding throughout each period): | | | | | | | | | | |
Net asset value - Beginning of period | | | | $9.88 | | | | | $10.00 | |
| | | | | | | | | | |
| | |
Income (loss) from investment operations: | | | | | | | | | | |
Net investment loss1 | | | | (0.04 | ) | | | | (0.07 | ) |
Net realized and unrealized gain (loss) on investments | | | | 0.79 | | | | | 0.25 | |
| | | | | | | | | | |
| | |
Total from investment operations | | | | 0.75 | | | | | 0.18 | |
| | | | | | | | | | |
| | |
Less distributions to shareholders: | | | | | | | | | | |
From net realized gain on investments | | | | — | | | | | (0.30 | ) |
| | | | | | | | | | |
| | |
Total distributions to shareholders | | | | — | | | | | (0.30 | ) |
| | | | | | | | | | |
| | |
Net asset value - End of period | | | | $10.63 | | | | | $9.88 | |
| | | | | | | | | | |
| | |
Net assets - End of period (000’s omitted) | | | | $254,437 | | | | | $250,573 | |
| | | | | | | | | | |
| | |
Total return2 | | | | 7.59% | | | | | 1.93% | |
Ratios (to average net assets)/Supplemental Data: | | | | | | | | | | |
Expenses | | | | 1.06% | 3 | | | | 1.07% | |
Net investment loss | | | | (0.82% | )3 | | | | (0.71% | ) |
Portfolio turnover | | | | 41% | | | | | 68% | |
*Commencement of operations was December 31, 2013.
1Calculated based on average shares outstanding during the periods.
2Represents aggregate total return for the periods indicated, and assumes reinvestment of all distributions. Periods less than one year are not annualized.
3Annualized.
The accompanying notes are an integral part of the financial statements.
9
Dynamic Opportunities Series
Financial Highlights - Class I
| | | | | | | | | | |
| | | FOR THE SIX
MONTHS ENDED 6/30/15
(UNAUDITED) | | FOR THE YEAR
ENDED 12/31/14* |
Per share data (for a share outstanding throughout each period): | | | | | | | | | | |
Net asset value - Beginning of period | | | | $9.90 | | | | | $10.00 | |
| | | | | | | | | | |
| | |
Income (loss) from investment operations: | | | | | | | | | | |
Net investment loss1 | | | | (0.03 | ) | | | | (0.05 | ) |
Net realized and unrealized gain (loss) on investments | | | | 0.79 | | | | | 0.25 | |
| | | | | | | | | | |
| | |
Total from investment operations | | | | 0.76 | | | | | 0.20 | |
| | | | | | | | | | |
| | |
Less distributions to shareholders: | | | | | | | | | | |
From net realized gain on investments | | | | — | | | | | (0.30 | ) |
| | | | | | | | | | |
| | |
Total distributions to shareholders | | | | — | | | | | (0.30 | ) |
| | | | | | | | | | |
| | |
Net asset value - End of period | | | | $10.66 | | | | | $9.90 | |
| | | | | | | | | | |
| | |
Net assets - End of period (000’s omitted) | | | | $64,088 | | | | | $54,648 | |
| | | | | | | | | | |
| | |
Total return2 | | | | 7.68% | | | | | 2.13% | |
Ratios (to average net assets)/Supplemental Data: | | | | | | | | | | |
Expenses | | | | 0.86% | 3 | | | | 0.88% | |
Net investment loss | | | | (0.61% | )3 | | | | (0.51% | ) |
Portfolio turnover | | | | 41% | | | | | 68% | |
*Commencement of operations was December 31, 2013.
1Calculated based on average shares outstanding during the periods.
2Represents aggregate total return for the periods indicated, and assumes reinvestment of all distributions. Periods less than one year are not annualized.
3Annualized.
The accompanying notes are an integral part of the financial statements.
10
Dynamic Opportunities Series
Notes to Financial Statements
(unaudited)
Dynamic Opportunities Series (the “Series”) is a no-load diversified series of Manning & Napier Fund, Inc. (the “Fund”). The Fund is organized in Maryland and is registered under the Investment Company Act of 1940, as amended, as an open-end management investment company.
The Series’ investment objective is to provide long-term growth.
The Fund’s advisor is Manning & Napier Advisors, LLC (the “Advisor”). Shares of the Series are offered to investors, clients and employees of the Advisor and its affiliates. On December 31, 2013, the Series issued 25,000 shares of Class S and 25,000 shares of Class I, valued at $250,000 and $250,000, respectively, to the Advisor, who was the sole investor in the Series as of that date. The Series is authorized to issue two classes of shares (Class S and Class I). Each class of shares is substantially the same, except that Class S shares bear shareholder services fees. The total authorized capital stock of the Fund consists of 15 billion shares of common stock each having a par value of $0.01. As of June 30, 2015, 10.6 billion shares have been designated in total among 41 series, of which 100 million have been designated as Dynamic Opportunities Series Class S common stock, and 100 million have been designated as Dynamic Opportunities Series Class I common stock.
| 2. | Significant Accounting Policies |
The following is a summary of significant accounting policies followed by the Series. The Series is an investment company and, accordingly, follows the investment company accounting and reporting guidance of the Financial Accounting Standards Board Accounting Standards Codification Topic 946 - Investment Companies, which is part of accounting principles generally accepted in the United States of America (“GAAP”).
Security Valuation
Portfolio securities, including domestic equities, foreign equities, warrants and options, listed on an exchange other than the NASDAQ Stock Market are valued at the latest quoted sales price of the exchange on which the security is primarily traded. Securities not traded on valuation date or securities not listed on an exchange are valued at the latest quoted bid price provided by the Fund’s pricing service. Securities listed on the NASDAQ Stock Market are valued in accordance with the NASDAQ Official Closing Price.
Short-term investments that mature in sixty days or less are valued at amortized cost, which approximates fair value. Investments in open-end investment companies are valued at their net asset value per share on valuation date.
Volume and level of activity in established markets for an asset or liability are evaluated to determine whether recent transactions and quoted prices are determinative of fair value. Where there have been significant decreases in volume and level of activity, further analysis and adjustment may be necessary to estimate fair value. The Series measures fair value in these instances by the use of inputs and valuation techniques which may be based upon current market prices of securities that are comparable in coupon, rating, maturity and industry and/or expectation of future cash flows. As a result of trading in relatively thin markets and/or markets that experience significant volatility, the prices used by the Series to value these securities may differ from the value that would be realized if these securities were sold, and the differences could be material.
Securities for which representative valuations or prices are not available from the Series’ pricing service may be valued at fair value as determined in good faith by the Advisor under procedures approved by and under the general supervision and responsibility of the Fund’s Board of Directors (the “Board”). Due to the inherent uncertainty of valuations of such securities, the fair value may differ significantly from the values that would have been used had a ready market for such securities existed. If trading or events occurring after the close of the principal market in which securities are traded are expected to materially affect the value of those securities, then they may be valued at their fair value, taking this trading or these events into account. In accordance with the procedures approved by the Board, the values of certain securities trading outside the U.S. were adjusted following the close of local trading using a factor from a third party vendor. The third party vendor uses statistical analyses and quantitative models, which consider among other things subsequent movement and changes in the prices of indices, securities and exchange rates in other markets, to determine the factors which are used to adjust local market prices. The value of
11
Dynamic Opportunities Series
Notes to Financial Statements (continued)
(unaudited)
| 2. | Significant Accounting Policies (continued) |
Security Valuation (continued)
securities used for net asset value calculation under these procedures may differ from published prices for the same securities. It is the Fund’s policy to classify each foreign equity security where a factor from a third party vendor is provided as a Level 2 security.
Various inputs are used in determining the value of the Series’ assets or liabilities carried at fair value. These inputs are summarized in three broad levels. Level 1 includes quoted prices in active markets for identical assets and liabilities. Level 2 includes other significant observable inputs (including quoted prices for similar securities, interest rates, prepayment speeds, credit risk, etc.). Level 3 includes significant unobservable inputs (including the Series’ own assumptions in determining the fair value of investments). A financial instrument’s level within the fair value hierarchy is based on the lowest level of any input both individually and in aggregate that is significant to the fair value measurement. The inputs or methodology used for valuing securities are not necessarily an indication of the risk associated with investing in those securities.
The following is a summary of the valuation levels used for major security types as of June 30, 2015 in valuing the Series’ assets or liabilities carried at fair value:
| | | | | | | | | | | | | | | | |
| DESCRIPTION | | TOTAL | | | LEVEL 1 | | | LEVEL 2 | | | LEVEL 3 | |
Assets: | | | | | | | | | | | | | | | | |
Equity securities: | | | | | | | | | | | | | | | | |
Consumer Discretionary | | $ | 126,013,094 | | | $ | 126,013,094 | | | $ | — | | | $ | — | |
Consumer Staples | | | 13,312,164 | | | | 13,312,164 | | | | — | | | | — | |
Financials | | | 20,087,016 | | | | 20,087,016 | | | | — | | | | — | |
Health Care | | | 55,114,737 | | | | 39,470,367 | | | | 15,644,370 | | | | — | |
Industrials | | | 15,377,902 | | | | 15,377,902 | | | | — | | | | — | |
Information Technology | | | 81,522,482 | | | | 81,522,482 | | | | — | | | | — | |
Mutual fund | | | 4,364,114 | | | | 4,364,114 | | | | — | | | | — | |
| | | | | | | | | | | | | | | | |
Total assets | | $ | 315,791,509 | | | $ | 300,147,139 | | | $ | 15,644,370 | | | $ | — | |
| | | | | | | | | | | | | | | | |
There were no Level 2 or Level 3 securities held by the Series as of December 31, 2014 or June 30, 2015.
The Fund’s policy is to recognize transfers in and transfers out of the valuation levels as of the beginning of the reporting period. There were no transfers between Level 1 and Level 2 during the six months ended June 30, 2015.
Security Transactions, Investment Income and Expenses
Security transactions are accounted for on trade date. Dividend income is recorded on the ex-dividend date, except that if the ex-dividend date has passed, certain dividends from foreign securities are recorded as soon as the Series is informed of the ex-dividend date. Non-cash dividends, if any, are recorded at the fair value of the securities received. Interest income, including amortization of premium and accretion of discounts using the effective interest method, is earned from settlement date and accrued daily.
Expenses are recorded on an accrual basis. Most expenses of the Fund can be attributed to a specific series. Expenses which cannot be directly attributed are apportioned among the series in the Fund in such a manner as deemed equitable by the Fund’s Board, taking into consideration, among other things, the nature and type of expense. Income, expenses (other than shareholder services fees), and realized and unrealized gains and losses are prorated among the classes based on the relative net assets of each class. Class specific expenses are directly charged to that class.
The Series uses the identified cost method for determining realized gain or loss on investments for both financial statement and federal income tax reporting purposes.
Federal Taxes
The Series’ policy is to comply with the provisions of the Internal Revenue Code applicable to regulated investment companies. The Series is not subject to federal income tax or excise tax to the extent that the Series distributes to shareholders each year
12
Dynamic Opportunities Series
Notes to Financial Statements (continued)
(unaudited)
| 2. | Significant Accounting Policies (continued) |
Federal Taxes (continued)
its taxable income, including any net realized gains on investments, in accordance with requirements of the Internal Revenue Code. Accordingly, no provision for federal income tax or excise tax has been made in the financial statements.
Management evaluates its tax positions to determine if the tax positions taken meet the minimum recognition threshold in connection with accounting for uncertainties in income tax positions taken or expected to be taken for the purposes of measuring and recognizing tax liabilities in the financial statements. Recognition of tax benefits of an uncertain tax position is required only when the position is “more likely than not” to be sustained assuming examination by taxing authorities. At June 30, 2015, the Series has recorded no liability for net unrecognized tax benefits relating to uncertain income tax positions taken or expected to be taken in future tax returns.
The Series files income tax returns in the U.S. federal jurisdiction, various states and foreign jurisdictions, as required. No income tax returns are currently under investigation. The statute of limitations on the Series’ tax returns remains open for the period ended December 31, 2013 and the year ended December 31, 2014. The Series is not aware of any tax positions for which it is reasonably possible that the total amounts of unrecognized tax benefits will significantly change in the next twelve months.
Foreign Taxes
Based on the Series’ understanding of the tax rules and rates related to income, gains and currency purchase/repatriation transactions for foreign jurisdictions in which it invests, the Series will provide for foreign taxes, and where appropriate, deferred foreign tax.
Distributions of Income and Gains
Distributions to shareholders of net investment income and net realized gains are made annually. An additional distribution may be necessary to avoid taxation of the Series. Distributions are recorded on the ex-dividend date.
Indemnifications
The Fund’s organizational documents provide former and current directors and officers with a limited indemnification against liabilities arising in connection with the performance of their duties to the Fund. In the normal course of business, the Fund may also enter into contracts that provide general indemnifications. The Fund’s maximum exposure under these arrangements is unknown as this would be dependent on future claims that may be made against the Fund. The risk of material loss from such claims is considered remote.
Other
The preparation of financial statements in conformity with GAAP requires management to make estimates and assumptions that affect the reported amounts of assets and liabilities and the disclosure of contingent assets and liabilities at the date of the financial statements and the reported amounts of income and expenses during the reporting period. Actual results could differ from those estimates.
| 3. | Transactions with Affiliates |
The Fund has an Investment Advisory Agreement (the “Agreement”) with the Advisor for which the Series pays a fee, computed daily and payable monthly, at an annual rate of 0.80% of the Series’ average daily net assets.
Under the Agreement, personnel of the Advisor provide the Series with advice and assistance in the choice of investments and the execution of securities transactions, and otherwise maintain the Series’ organization. The Advisor also provides the Fund with necessary office space and fund administration and support services. The salaries of all officers of the Fund (except a percentage of the Fund’s Chief Compliance Officer’s salary, which is paid by the Fund), and of all Directors who are “affiliated persons” of the Fund, or of the Advisor, and all personnel of the Fund, or of the Advisor, performing services relating to research, statistical and investment activities, are paid by the Advisor. Each “non-affiliated” Director receives an annual stipend, which is allocated among all the active series of the Fund. In addition, these Directors also receive a fee per Board meeting attended plus a fee for each committee meeting attended and are reimbursed for travel and other out-of-pocket expenses
13
Dynamic Opportunities Series
Notes to Financial Statements (continued)
(unaudited)
| 3. | Transactions with Affiliates (continued) |
incurred by them in connection with attending such meetings. The Fund also has an Audit Committee Chair, who receives an additional annual stipend for this role.
The Class S shares of the Series are subject to a shareholder services fee in accordance with a shareholder services plan adopted by the Fund’s Board. The shareholder services fee is intended to compensate financial intermediaries, including affiliates of the Fund, in connection with the provision of direct client service, personal services, maintenance of shareholder accounts and reporting services. For these services, Class S of the Series pays a fee, computed daily and payable monthly, at an annual rate of 0.20% of the average daily net assets of Class S. The Fund has a Shareholder Services Agreement with the Advisor, for which the Advisor receives the shareholder services fee as stated above.
The Advisor has contractually agreed, until at least April 30, 2016, to waive its fee and, if necessary, pay other operating expenses of the Series in order to maintain total direct annual fund operating expenses for the Series exclusive of each share class’ shareholder services fee, at no more than 0.90% of average daily net assets. The Advisor did not waive any fees for the six months ended June 30, 2015. The Advisor is not eligible to recoup any expenses that have been waived or reimbursed.
Manning & Napier Investor Services, Inc., a registered broker-dealer affiliate of the Advisor, acts as distributor for the Fund’s shares. The services of Manning & Napier Investor Services, Inc. are provided at no additional cost to the Series.
Pursuant to a master services agreement dated November 1, 2014, the Fund pays the Advisor an annual fee related to fund accounting and administration of 0.0085% on the first $25 billion of average daily net assets (excluding Target Series and Strategic Income Series); 0.0075% on the next $15 billion of average daily net assets (excluding Target Series and Strategic Income Series); and 0.0065% of the average daily net assets in excess of $40 billion (excluding Target Series and Strategic Income Series); plus a base fee of $30,400 per series. Transfer agent fees are charged to the Fund on a per account basis. Additionally, certain transaction and out-of-pocket expenses, including charges for reporting relating to the Fund’s compliance program, are charged. The Advisor has agreements with BNY Mellon Investment Servicing (U.S.) Inc. (“BNY”) under which BNY serves as sub-accountant services agent and sub-transfer agent.
Expenses not directly attributable to a series are allocated based on each series’ relative net assets or number of accounts, depending on the expense.
| 4. | Purchases and Sales of Securities |
For the six months ended June 30, 2015, purchases and sales of securities, other than U.S. Government securities and short-term securities, were $129,126,822 and $143,555,737, respectively. There were no purchases or sales of U.S. Government securities.
| 5. | Capital Stock Transactions |
Transactions in shares of Class S and Class I of Dynamic Opportunities Series were:
| | | | | | | | | | | | | | | | |
CLASS S: | | FOR THE SIX MONTHS ENDED 6/30/15 | | | FOR THE YEAR ENDED 12/31/14* | |
| | SHARES | | | AMOUNT | | | SHARES | | | AMOUNT | |
Sold | | | 1,007,655 | | | $ | 10,478,040 | | | | 27,589,735 | | | $ | 269,742,077 | |
Reinvested | | | — | | | | — | | | | 768,470 | | | | 7,262,041 | |
Repurchased | | | (2,433,906 | ) | | | (25,861,522 | ) | | | (3,010,851 | ) | | | (29,848,786 | ) |
| | | | | | | | | | | | | | | | |
Total | | | (1,426,251 | ) | | $ | (15,383,482 | ) | | | 25,347,354 | | | $ | 247,155,332 | |
| | | | | | | | | | | | | | | | |
14
Dynamic Opportunities Series
Notes to Financial Statements (continued)
(unaudited)
| 5. | Capital Stock Transactions (continued) |
| | | | | | | | | | | | | | | | |
CLASS I: | | FOR THE SIX MONTHS ENDED 6/30/15 | | | FOR THE YEAR ENDED 12/31/14* | |
| | SHARES | | | AMOUNT | | | SHARES | | | AMOUNT | |
Sold | | | 858,748 | | | $ | 8,944,139 | | | | 5,588,004 | | | $ | 54,821,921 | |
Reinvested | | | — | | | | — | | | | 166,010 | | | | 1,572,115 | |
Repurchased | | | (367,624 | ) | | | (3,902,314 | ) | | | (256,471 | ) | | | (2,589,412 | ) |
| | | | | | | | | | | | | | | | |
Total | | | 491,124 | | | $ | 5,041,825 | | | | 5,497,543 | | | $ | 53,804,624 | |
| | | | | | | | | | | | | | | | |
* Commencement of operations was December 31, 2013.
Over 90% of the shares outstanding are fiduciary accounts where the Advisor has sole investment discretion. No shareholder exceeds the 10% threshold.
The Series may trade in instruments including written and purchased options, forward foreign currency exchange contracts and futures contracts and other derivatives in the normal course of investing activities to assist in managing exposure to various market risks. The Series may be subject to various elements of risk, which may involve, to a varying degree, elements of risk in excess of the amounts recognized for financial statement purposes. These risks include: the risk that changes in the value of a derivative may not correlate perfectly with the underlying asset, rate or index; counterparty credit risk related to over the counter derivative counterparties’ failure to perform under contract terms; liquidity risk related to the lack of a liquid market for these contracts allowing the fund to close out its position(s); and documentation risk relating to disagreement over contract terms. No such investments were held by the Series as of June 30, 2015.
Investing in securities of foreign companies and foreign governments involves special risks and considerations not typically associated with investing in securities of domestic companies and the U.S. Government. These risks include revaluation of currencies and future adverse political and economic developments. Moreover, securities of foreign companies and foreign governments and their markets may be less liquid and their prices more volatile than those of comparable domestic companies and the U.S. Government.
| 8. | Federal Income Tax Information |
The amount and characterization of certain income and capital gains to be distributed are determined in accordance with federal income tax regulations, which may differ from GAAP. The Series may periodically make reclassifications among its capital accounts to reflect income and gains available for distribution (or available capital loss carryovers) under income tax regulations without impacting the Series’ net asset value. Any such reclassifications are not reflected in the financial highlights.
The final determination of the tax character of current year distributions will be made at the conclusion of the fiscal year. The tax character of distributions paid for the year ended December 31, 2014 was as follows:
Ordinary income $8,960,474
At June 30, 2015, identified cost for federal income tax purposes, the resulting gross unrealized appreciation and depreciation, and the net unrealized appreciation were as follows:
| | | | | | |
| | Cost for federal income tax purposes | | $ | 302,471,523 | |
| | Unrealized appreciation | | | 30,139,944 | |
| | Unrealized depreciation | | | (16,819,958 | ) |
| | | | | | |
| | Net unrealized appreciation | | $ | 13,319,986 | |
| | | | | | |
15
{This page intentionally left blank}
16
{This page intentionally left blank}
17
Dynamic Opportunities Series
Literature Requests
(unaudited)
Proxy Voting Policies and Procedures
A description of the policies and procedures that the Fund uses to determine how to vote proxies relating to portfolio securities is available, without charge, upon request:
| | |
| By phone | | 1-800-466-3863 |
| On the Securities and Exchange | | |
| Commission’s (SEC) web site | | http://www.sec.gov |
Proxy Voting Record
Information regarding how the Fund voted proxies relating to portfolio securities during the most recent 12-month period ended June 30th is available, without charge, upon request:
| | |
| By phone | | 1-800-466-3863 |
| On the SEC’s web site | | http://www.sec.gov |
Quarterly Portfolio Holdings
The Series’ complete schedule of portfolio holdings for the 1st and 3rd quarters of each fiscal year are provided on Form N-Q, and are available, without charge, upon request:
| | |
| By phone | | 1-800-466-3863 |
| On the SEC’s web site | | http://www.sec.gov |
The Series’ Form N-Q may be reviewed and copied at the SEC’s Public Reference Room in Washington, D.C. Information on the operation of the Public Reference Room may be obtained by calling 1-800-SEC-0330.
Prospectus and Statement of Additional Information (SAI)
For more information about any of the Manning & Napier Fund, Inc. Series, you may obtain a prospectus and SAI at www.manning-napier.com or by calling (800) 466-3863. Before investing, carefully consider the objectives, risks, charges and expenses of the investment and read the prospectus carefully as it contains this and other information about the investment company. In addition, this information can be found on the SEC’s web site, http://www.sec.gov.
Additional information available at www.manning-napier.com
1. Fund Holdings - Month-End
2. Fund Holdings - Quarter-End
3. Shareholder Report - Annual
4. Shareholder Report - Semi-Annual
The Fund also offers electronic notification or “e-delivery” when certain documents are available on-line to be downloaded or reviewed. Direct shareholders can elect to receive electronic notification when shareholder reports, prospectus updates, and/or statements are available. If you do not currently have on-line access to your account, you can establish access by going to www.manning-napier.com, click on “Login” in the top corner of the page, and follow the prompts to self-enroll. Once enrolled, you can set your electronic notification preferences by clicking on the Account Options tab located within the green toolbar and then select E-Delivery Option. Should you have any questions on either how to establish on-line access or how to update your account settings, please contact Investor Services at 1-800-466-3863.
The Manning & Napier Fund, Inc. is managed by Manning & Napier Advisors, LLC. Manning & Napier Investor Services, Inc., an affiliate of Manning & Napier Advisors, LLC, is the distributor of the Fund shares.
MNDYN-6/15-SAR

Equity Income Series
Shareholder Expense Example
(unaudited)
As a shareholder of the Series, you may incur two types of costs: (1) transaction costs and (2) ongoing costs, including management fees and other Series expenses. This example is intended to help you understand your ongoing costs (in dollars) of investing in the Series and to compare these costs with the ongoing costs of investing in other mutual funds.
The example is based on an investment of $1,000 invested at the beginning of the period and held for the entire period (January 1, 2015 to June 30, 2015).
Actual Expenses
The Actual lines of the table below provide information about actual account values and actual expenses. You may use the information in this line, together with the amount you invested, to estimate the expenses that you paid over the period. Simply divide your account value by $1,000 (for example, an $8,600 account value divided by $1,000 = 8.6), then multiply the result by the number in the Actual line for the Class in which you have invested under the heading entitled “Expenses Paid During Period” to estimate the expenses you paid on your account during this period.
Hypothetical Example for Comparison Purposes
The Hypothetical lines of each Class in the table below provide information about hypothetical account values and hypothetical expenses based on the Class’ actual expense ratio and an assumed rate of return of 5% per year before expenses, which is not the Class’ actual return. The hypothetical account values and expenses may not be used to estimate the actual ending account balance or expenses you paid during the period. You may use this information to compare the ongoing costs of investing in the Series and other funds. To do so, compare this 5% hypothetical example for the class in which you have invested with the 5% hypothetical examples that appear in the shareholder reports of the other funds.
Please note that the expenses shown in the table are meant to highlight your ongoing costs only and do not reflect any transaction costs. Therefore, the Hypothetical lines for each Class in the table are useful in comparing ongoing costs only, and will not help you determine the relative total costs of owning different funds. In addition, if these transaction costs were included, your costs would have been higher.
| | | | | | | | |
| | | BEGINNING
ACCOUNT VALUE 1/1/15 | | ENDING
ACCOUNT VALUE 6/30/15 | | EXPENSES PAID
DURING PERIOD* 1/1/15-6/30/15 | | ANNUALIZED
EXPENSE RATIO |
Class S | | | | | | | | |
Actual | | $1,000.00 | | $ 991.70 | | $4.69 | | 0.95% |
Hypothetical | | | | | | | | |
(5% return before expenses) | | $1,000.00 | | $1,020.08 | | $4.76 | | 0.95% |
Class I | | | | | | | | |
Actual | | $1,000.00 | | $ 992.60 | | $3.71 | | 0.75% |
Hypothetical | | | | | | | | |
(5% return before expenses) | | $1,000.00 | | $1,021.08 | | $3.76 | | 0.75% |
*Expenses are equal to the Class’ annualized expense ratio (for the six-month period), multiplied by the average account value over the period, multiplied by 181/365 (to reflect the one-half year period). Expenses are based on the most recent fiscal half year. The Class’ total return would have been lower had certain expenses not been waived during the period.
1
Equity Income Series
Portfolio Composition as of June 30, 2015
(unaudited)
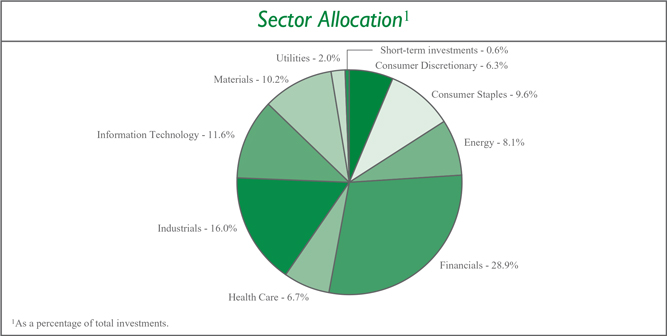
2
Equity Income Series
Investment Portfolio - June 30, 2015
(unaudited)
| | | | | | | | |
| | | SHARES | | | VALUE (NOTE 2) | |
| | |
COMMON STOCKS - 100.0% | | | | | | | | |
| | |
Consumer Discretionary - 6.3% | | | | | | | | |
Hotels, Restaurants & Leisure - 1.2% | | | | | | | | |
SeaWorld Entertainment, Inc. | | | 45,790 | | | $ | 844,367 | |
| | | | | | | | |
Media - 5.1% | | | | | | | | |
Time Warner, Inc. | | | 14,050 | | | | 1,228,111 | |
Twenty-First Century Fox, Inc. - Class A | | | 33,120 | | | | 1,077,890 | |
Viacom, Inc. - Class B | | | 20,690 | | | | 1,337,402 | |
| | | | | | | | |
| | | | | | | 3,643,403 | |
| | | | | | | | |
Total Consumer Discretionary | | | | | | | 4,487,770 | |
| | | | | | | | |
Consumer Staples - 9.7% | | | | | | | | |
Beverages - 4.4% | | | | | | | | |
Diageo plc (United Kingdom)1 | | | 45,140 | | | | 1,307,237 | |
Dr. Pepper Snapple Group, Inc. | | | 4,130 | | | | 301,077 | |
Molson Coors Brewing Co. - Class B | | | 13,620 | | | | 950,812 | |
PepsiCo, Inc. | | | 6,220 | | | | 580,575 | |
| | | | | | | | |
| | | | | | | 3,139,701 | |
| | | | | | | | |
Food Products - 1.5% | | | | | | | | |
ConAgra Foods, Inc. | | | 24,690 | | | | 1,079,447 | |
| | | | | | | | |
Household Products - 2.1% | | | | | | | | |
Energizer Holdings, Inc. | | | 11,240 | | | | 1,478,622 | |
| | | | | | | | |
Tobacco - 1.7% | | | | | | | | |
Philip Morris International, Inc. | | | 14,480 | | | | 1,160,862 | |
| | | | | | | | |
Total Consumer Staples | | | | | | | 6,858,632 | |
| | | | | | | | |
Energy - 8.1% | | | | | | | | |
Oil, Gas & Consumable Fuels - 8.1% | | | | | | | | |
BP plc - ADR (United Kingdom) | | | 23,250 | | | | 929,070 | |
Chevron Corp. | | | 13,550 | | | | 1,307,169 | |
ConocoPhillips | | | 10,940 | | | | 671,825 | |
Exxon Mobil Corp. | | | 23,900 | | | | 1,988,480 | |
Total S.A. (France)1 | | | 18,050 | | | | 885,372 | |
| | | | | | | | |
Total Energy | | | | | | | 5,781,916 | |
| | | | | | | | |
Financials - 29.1% | | | | | | | | |
Banks - 8.1% | | | | | | | | |
BankUnited, Inc. | | | 14,190 | | | | 509,847 | |
Citigroup, Inc. | | | 35,820 | | | | 1,978,697 | |
HSBC Holdings plc (United Kingdom)1 | | | 68,090 | | | | 609,702 | |
JPMorgan Chase & Co. | | | 13,950 | | | | 945,252 | |
U.S. Bancorp | | | 13,770 | | | | 597,618 | |
Wells Fargo & Co. | | | 20,040 | | | | 1,127,049 | |
| | | | | | | | |
| | | | | | | 5,768,165 | |
| | | | | | | | |
The accompanying notes are an integral part of the financial statements.
3
Equity Income Series
Investment Portfolio - June 30, 2015
(unaudited)
| | | | | | | | |
| | | SHARES | | | VALUE (NOTE 2) | |
| | |
COMMON STOCKS (continued) | | | | | | | | |
| | |
Financials (continued) | | | | | | | | |
Capital Markets - 3.6% | | | | | | | | |
American Capital Ltd.* | | | 20,980 | | | $ | 284,279 | |
Apollo Investment Corp. | | | 40,390 | | | | 285,961 | |
Ares Capital Corp. | | | 17,580 | | | | 289,367 | |
BlackRock Capital Investment Corp. | | | 31,150 | | | | 284,711 | |
Fifth Street Finance Corp. | | | 43,240 | | | | 283,222 | |
Medley Capital Corp. | | | 31,730 | | | | 282,714 | |
PennantPark Investment Corp. | | | 31,590 | | | | 277,360 | |
Prospect Capital Corp. | | | 38,700 | | | | 285,219 | |
Solar Capital Ltd. | | | 15,870 | | | | 285,660 | |
| | | | | | | | |
| | | | | | | 2,558,493 | |
| | | | | | | | |
Insurance - 5.1% | | | | | | | | |
Admiral Group plc (United Kingdom)1 | | | 70,670 | | | | 1,539,911 | |
Principal Financial Group, Inc. | | | 27,730 | | | | 1,422,272 | |
The Progressive Corp. | | | 24,100 | | | | 670,703 | |
| | | | | | | | |
| | | | | | | 3,632,886 | |
| | | | | | | | |
Real Estate Investment Trusts (REITS) - 10.9% | | | | | | | | |
CatchMark Timber Trust, Inc. - Class A | | | 62,070 | | | | 718,150 | |
Community Healthcare Trust, Inc.* | | | 19,550 | | | | 376,337 | |
Crown Castle International Corp. | | | 13,270 | | | | 1,065,581 | |
Lamar Advertising Co. - Class A | | | 12,360 | | | | 710,453 | |
Outfront Media, Inc. | | | 55,634 | | | | 1,404,202 | |
Plum Creek Timber Co., Inc. | | | 41,580 | | | | 1,686,900 | |
Weyerhaeuser Co. | | | 55,890 | | | | 1,760,535 | |
| | | | | | | | |
| | | | | | | 7,722,158 | |
| | | | | | | | |
Real Estate Management & Development - 0.4% | | | | | | | | |
First Capital Realty, Inc. (Canada) | | | 22,180 | | | | 317,517 | |
| | | | | | | | |
REITS - Mortgage - 1.0% | | | | | | | | |
American Capital Agency Corp. | | | 18,350 | | | | 337,089 | |
Annaly Capital Management, Inc. | | | 36,610 | | | | 336,446 | |
| | | | | | | | |
| | | | | | | 673,535 | |
| | | | | | | | |
Total Financials | | | | | | | 20,672,754 | |
| | | | | | | | |
Health Care - 6.7% | | | | | | | | |
Pharmaceuticals - 6.7% | | | | | | | | |
Eli Lilly & Co. | | | 10,200 | | | | 851,598 | |
Johnson & Johnson | | | 18,120 | | | | 1,765,975 | |
Merck & Co., Inc. | | | 13,160 | | | | 749,199 | |
Roche Holding AG (Switzerland)1 | | | 2,530 | | | | 709,390 | |
Sanofi (France)1 | | | 6,980 | | | | 690,532 | |
| | | | | | | | |
Total Health Care | | | | | | | 4,766,694 | |
| | | | | | | | |
The accompanying notes are an integral part of the financial statements.
4
Equity Income Series
Investment Portfolio - June 30, 2015
(unaudited)
| | | | | | | | |
| | | SHARES | | | VALUE (NOTE 2) | |
| | |
COMMON STOCKS (continued) | | | | | | | | |
| | |
Industrials - 16.1% | | | | | | | | |
Air Freight & Logistics - 1.4% | | | | | | | | |
United Parcel Service, Inc. - Class B | | | 10,290 | | | $ | 997,204 | |
| | | | | | | | |
Commercial Services & Supplies - 3.3% | | | | | | | | |
Pitney Bowes, Inc. | | | 45,850 | | | | 954,139 | |
Waste Management, Inc. | | | 30,390 | | | | 1,408,577 | |
| | | | | | | | |
| | | | | | | 2,362,716 | |
| | | | | | | | |
Electrical Equipment - 1.4% | | | | | | | | |
Rockwell Automation, Inc. | | | 7,920 | | | | 987,149 | |
| | | | | | | | |
Industrial Conglomerates - 3.6% | | | | | | | | |
3M Co. | | | 4,570 | | | | 705,151 | |
General Electric Co. | | | 69,060 | | | | 1,834,924 | |
| | | | | | | | |
| | | | | | | 2,540,075 | |
| | | | | | | | |
Machinery - 2.9% | | | | | | | | |
Donaldson Co., Inc. | | | 11,360 | | | | 406,688 | |
Flowserve Corp. | | | 17,920 | | | | 943,667 | |
Pentair plc (United Kingdom) | | | 10,600 | | | | 728,750 | |
| | | | | | | | |
| | | | | | | 2,079,105 | |
| | | | | | | | |
Road & Rail - 2.7% | | | | | | | | |
Kansas City Southern | | | 7,540 | | | | 687,648 | |
Union Pacific Corp. | | | 13,080 | | | | 1,247,440 | |
| | | | | | | | |
| | | | | | | 1,935,088 | |
| | | | | | | | |
Trading Companies & Distributors - 0.8% | | | | | | | | |
Fastenal Co. | | | 12,720 | | | | 536,529 | |
| | | | | | | | |
Total Industrials | | | | | | | 11,437,866 | |
| | | | | | | | |
Information Technology - 11.7% | | | | | | | | |
Communications Equipment - 3.2% | | | | | | | | |
Cisco Systems, Inc. | | | 23,250 | | | | 638,445 | |
Juniper Networks, Inc. | | | 62,460 | | | | 1,622,086 | |
| | | | | | | | |
| | | | | | | 2,260,531 | |
| | | | | | | | |
IT Services - 3.1% | | | | | | | | |
Broadridge Financial Solutions, Inc. | | | 21,890 | | | | 1,094,719 | |
Xerox Corp. | | | 105,350 | | | | 1,120,924 | |
| | | | | | | | |
| | | | | | | 2,215,643 | |
| | | | | | | | |
Software - 1.5% | | | | | | | | |
Microsoft Corp. | | | 24,270 | | | | 1,071,521 | |
| | | | | | | | |
Technology Hardware, Storage & Peripherals - 3.9% | | | | | | | | |
Apple, Inc. | | | 10,900 | | | | 1,367,133 | |
The accompanying notes are an integral part of the financial statements.
5
Equity Income Series
Investment Portfolio - June 30, 2015
(unaudited)
| | | | | | | | |
| | | SHARES | | | VALUE (NOTE 2) | |
| | |
COMMON STOCKS (continued) | | | | | | | | |
| | |
Information Technology (continued) | | | | | | | | |
Technology Hardware, Storage & Peripherals (continued) | | | | | | | | |
EMC Corp. | | | 53,870 | | | $ | 1,421,629 | |
| | | | | | | | |
| | | | | | | 2,788,762 | |
| | | | | | | | |
Total Information Technology | | | | | | | 8,336,457 | |
| | | | | | | | |
Materials - 10.3% | | | | | | | | |
Chemicals - 4.1% | | | | | | | | |
Ashland, Inc. | | | 8,940 | | | | 1,089,786 | |
The Dow Chemical Co. | | | 35,380 | | | | 1,810,394 | |
| | | | | | | | |
| | | | | | | 2,900,180 | |
| | | | | | | | |
Containers & Packaging - 6.2% | | | | | | | | |
Avery Dennison Corp. | | | 17,470 | | | | 1,064,622 | |
Bemis Co., Inc. | | | 16,090 | | | | 724,211 | |
Graphic Packaging Holding Co. | | | 48,140 | | | | 670,590 | |
Packaging Corp. of America | | | 16,010 | | | | 1,000,465 | |
Sonoco Products Co. | | | 21,930 | | | | 939,920 | |
| | | | | | | | |
| | | | | | | 4,399,808 | |
| | | | | | | | |
Total Materials | | | | | | | 7,299,988 | |
| | | | | | | | |
Utilities - 2.0% | | | | | | | | |
Electric Utilities - 1.2% | | | | | | | | |
Eversource Energy | | | 11,050 | | | | 501,781 | |
Exelon Corp. | | | 11,800 | | | | 370,756 | |
| | | | | | | | |
| | | | | | | 872,537 | |
| | | | | | | | |
Multi-Utilities - 0.8% | | | | | | | | |
CMS Energy Corp. | | | 16,780 | | | | 534,275 | |
| | | | | | | | |
Total Utilities | | | | | | | 1,406,812 | |
| | | | | | | | |
TOTAL COMMON STOCKS
(Identified Cost $70,309,197) | | | | | | | 71,048,889 | |
| | | | | | | | |
| | |
SHORT-TERM INVESTMENT - 0.6% | | | | | | | | |
| | |
BNY Mellon Cash Reserve2, 0.00%, 12/31/2049 | | | 22,120 | | | | 22,120 | |
Dreyfus Cash Management, Inc. - Institutional Shares2, 0.04% | | | 386,529 | | | | 386,529 | |
| | | | | | | | |
TOTAL SHORT-TERM INVESTMENT
(Identified Cost $408,649) | | | | | | | 408,649 | |
| | | | | | | | |
TOTAL INVESTMENTS - 100.6%
(Identified Cost $70,717,846) | | | | | | | 71,457,538 | |
LIABILITIES, LESS OTHER ASSETS - (0.6%) | | | | | | | (395,303 | ) |
| | | | | | | | |
NET ASSETS - 100% | | | | | | $ | 71,062,235 | |
| | | | | | | | |
The accompanying notes are an integral part of the financial statements.
6
Equity Income Series
Investment Portfolio - June 30, 2015
(unaudited)
ADR - American Depositary Receipt
ETF - Exchange-Traded Fund
*Non-income producing security.
1A factor from a third party vendor was applied to determine the security’s fair value following the close of local trading.
2Rate shown is the current yield as of June 30, 2015.
The Global Industry Classification Standard (GICS) was developed by and is the exclusive property and a service mark of MSCI Inc. (MSCI) and Standard & Poor’s, a division of The McGraw-Hill Companies, Inc. (S&P), and is licensed for use by Manning & Napier when referencing GICS sectors. Neither MSCI, S&P, nor any third party involved in making or compiling the GICS or any GICS classifications makes any express or implied warranties or representations with respect to such standard or classification, nor shall any such party have any liability therefrom.
The accompanying notes are an integral part of the financial statements.
7
Equity Income Series
Statement of Assets & Liabilities
June 30, 2015 (unaudited)
| | | | |
ASSETS: | | | | |
| |
Investments, at value (identified cost $70,717,846) (Note 2) | | $ | 71,457,538 | |
Cash | | | 4,155 | |
Receivable for securities sold | | | 908,913 | |
Dividends receivable | | | 178,619 | |
Foreign tax reclaims receivable | | | 5,252 | |
Receivable for fund shares sold | | | 4,565 | |
Prepaid expenses | | | 12 | |
| | | | |
| |
TOTAL ASSETS | | | 72,559,054 | |
| | | | |
| |
LIABILITIES: | | | | |
| |
Accrued management fees (Note 3) | | | 33,237 | |
Accrued fund accounting and administration fees (Note 3) | | | 8,059 | |
Accrued shareholder services fees (Class S) (Note 3) | | | 4,481 | |
Accrued transfer agent fees (Note 3) | | | 2,378 | |
Accrued Directors’ fees (Note 3) | | | 581 | |
Accrued Chief Compliance Officer service fees (Note 3) | | | 382 | |
Payable for securities purchased | | | 1,173,894 | |
Payable for fund shares repurchased | | | 231,101 | |
Other payables and accrued expenses | | | 42,706 | |
| | | | |
| |
TOTAL LIABILITIES | | | 1,496,819 | |
| | | | |
| |
TOTAL NET ASSETS | | $ | 71,062,235 | |
| | | | |
| |
NET ASSETS CONSIST OF: | | | | |
| |
Capital stock | | $ | 66,413 | |
Additional paid-in-capital | | | 68,779,664 | |
Undistributed net investment income | | | 665,651 | |
Accumulated net realized gain on investments, foreign currency and translation of other assets and liabilities | | | 810,910 | |
Net unrealized appreciation on investments, foreign currency and translation of other assets and liabilities | | | 739,597 | |
| | | | |
| |
TOTAL NET ASSETS | | $ | 71,062,235 | |
| | | | |
| |
NET ASSET VALUE, OFFERING PRICE AND REDEMPTION PRICE PER SHARE - Class S ($24,891,932/ 2,328,229 shares) | | $ | 10.69 | |
| | | | |
| |
NET ASSET VALUE, OFFERING PRICE AND REDEMPTION PRICE PER SHARE - Class I ($46,170,303/ 4,313,085 shares) | | $ | 10.70 | |
| | | | |
The accompanying notes are an integral part of the financial statements.
8
Equity Income Series
Statement of Operations
For the Six Months Ended June 30, 2015 (unaudited)
| | | | |
INVESTMENT INCOME: | | | | |
| |
Dividends (net of foreign taxes withheld, $8,360) | | $ | 940,801 | |
| | | | |
| |
EXPENSES: | | | | |
| |
Management fees (Note 3) | | | 216,993 | |
Shareholder services fees (Class S)(Note 3) | | | 24,772 | |
Fund accounting and administration fees (Note 3) | | | 21,094 | |
Transfer agent fees (Note 3) | | | 2,443 | |
Chief Compliance Officer service fees (Note 3) | | | 1,224 | |
Directors’ fees (Note 3) | | | 1,095 | |
Printing fees | | | 20,693 | |
Registration fees | | | 15,224 | |
Audit fees | | | 15,084 | |
Custodian fees | | | 8,046 | |
Miscellaneous | | | 1,019 | |
| | | | |
| |
Total Expenses | | | 327,687 | |
Less reduction of expenses (Note 3) | | | (52,537 | ) |
| | | | |
| |
Net Expenses | | | 275,150 | |
| | | | |
| |
NET INVESTMENT INCOME | | | 665,651 | |
| | | | |
| |
REALIZED AND UNREALIZED GAIN (LOSS) ON INVESTMENTS AND FOREIGN CURRENCY: | | | | |
| |
Net realized gain (loss) on- | | | | |
Investments | | | 864,161 | |
Options written | | | 98,954 | |
Foreign currency and translation of other assets and liabilities | | | (171 | ) |
| | | | |
| |
| | | 962,944 | |
| | | | |
| |
Net change in unrealized appreciation (depreciation) on- | | | | |
Investments | | | (2,236,996 | ) |
Options written | | | (2,850 | ) |
Foreign currency and translation of other assets and liabilities | | | 411 | |
| | | | |
| | | (2,239,435 | ) |
| | | | |
| |
NET REALIZED AND UNREALIZED GAIN (LOSS) ON INVESTMENTS AND FOREIGN CURRENCY | | | (1,276,491 | ) |
| | | | |
| |
NET DECREASE IN NET ASSETS RESULTING FROM OPERATIONS | | $ | (610,840 | ) |
| | | | |
The accompanying notes are an integral part of the financial statements.
9
Equity Income Series
Statement of Changes in Net Assets
| | | | | | | | | | | | | | |
| | | FOR THE SIX
MONTHS ENDED 6/30/15
(UNAUDITED) | | FOR THE YEAR
ENDED 12/31/14 |
INCREASE IN NET ASSETS: | | | | | | | | | | | | | | |
| | | | |
OPERATIONS: | | | | | | | | | | | | | | |
| | | | |
Net investment income | | | $ | 665,651 | | | | | | $ | 1,131,262 | | | |
Net realized gain on investments and foreign currency | | | | 962,944 | | | | | | | 644,732 | | | |
Net change in unrealized appreciation (depreciation) on investments and foreign currency | | | | (2,239,435 | ) | | | | | | 2,979,032 | | | |
| | | | | | | | | | | | | | |
| | | | |
Net increase (decrease) from operations | | | | (610,840 | ) | | | | | | 4,755,026 | | | |
| | | | | | | | | | | | | | |
| | | | |
DISTRIBUTIONS TO SHAREHOLDERS (Note 8): | | | | | | | | | | | | | | |
| | | | |
From net investment income (Class S) | | | | — | | | | | | | (386,141 | ) | | |
From net investment income (Class I) | | | | — | | | | | | | (844,207 | ) | | |
From net realized gain on investments (Class S) | | | | — | | | | | | | (228,447 | ) | | |
From net realized gain on investments (Class I) | | | | — | | | | | | | (469,233 | ) | | |
| | | | | | | | | | | | | | |
| | | | |
Total distributions to shareholders | | | | — | | | | | | | (1,928,028 | ) | | |
| | | | | | | | | | | | | | |
| | | | |
CAPITAL STOCK ISSUED AND REPURCHASED: | | | | | | | | | | | | | | |
| | | | |
Net increase from capital share transactions (Note 5) | | | | 8,989,154 | | | | | | | 59,356,923 | | | |
| | | | | | | | | | | | | | |
| | | | |
Net increase in net assets | | | | 8,378,314 | | | | | | | 62,183,921 | | | |
| | | | |
NET ASSETS: | | | | | | | | | | | | | | |
| | | | |
Beginning of period | | | | 62,683,921 | | | | | | | 500,000 | | | |
| | | | | | | | | | | | | | |
| | | | |
End of period (including undistributed net investment income of $665,651 and $ -, respectively) | | | $ | 71,062,235 | | | | | | $ | 62,683,921 | | | |
| | | | | | | | | | | | | | |
The accompanying notes are an integral part of the financial statements.
10
Equity Income Series
Financial Highlights - Class S*
| | | | | | | | | | |
| | | FOR THE SIX
MONTHS ENDED
6/30/15
(UNAUDITED) | | FOR THE YEAR
ENDED 12/31/14* |
Per share data (for a share outstanding throughout the period): | | | | | | | | | | |
Net asset value - Beginning of period | | | | $10.78 | | | | | $10.00 | |
| | | | | | | | | | |
| | |
Income (loss) from investment operations: | | | | | | | | | | |
Net investment income1 | | | | 0.10 | | | | | 0.29 | 2 |
Net realized and unrealized gain on investments | | | | (0.19 | ) | | | | 0.86 | |
| | | | | | | | | | |
| | |
Total from investment operations | | | | (0.09 | ) | | | | 1.15 | |
| | | | | | | | | | |
| | |
Less distributions to shareholders: | | | | | | | | | | |
From net investment income | | | | — | | | | | (0.23 | ) |
From net realized gain on investments | | | | — | | | | | (0.14 | ) |
| | | | | | | | | | |
| | |
Total distributions to shareholders | | | | — | | | | | (0.37 | ) |
| | | | | | | | | | |
| | |
Net asset value - End of period | | | | $10.69 | | | | | $10.78 | |
| | | | | | | | | | |
| | |
Net assets - End of period (000’s omitted) | | | | $24,892 | | | | | $24,178 | |
| | | | | | | | | | |
| | |
Total return3 | | | | (0.83% | ) | | | | 11.63% | |
Ratios (to average net assets)/Supplemental Data: | | | | | | | | | | |
Expenses** | | | | 0.95% | 4 | | | | 0.95% | |
Net investment income | | | | 1.85% | 4 | | | | 2.68% | 2 |
Portfolio turnover | | | | 24% | | | | | 55% | |
**The investment advisor did not impose all or a portion of its management and/or other fees, and in some periods may have paid a portion of the Series’ expenses. If these expenses had been incurred by the Class, the expense ratio (to average net assets) would have increased by the following amount:
*Commencement of operations was December 31, 2013.
1Calculated based on average shares outstanding during the period.
2Reflects a special dividend paid out during the period by two of the Series’ holdings. Had the Series not received the special dividends, the net investment income per share would have been $0.22 and the net investment income ratio would have been 2.07%.
3Represents aggregate total return for the period indicated, and assumes reinvestment of all distributions. Total return would have been lower had certain expenses not been reimbursed during the period. Periods less than one year are not annualized.
4Annualized.
The accompanying notes are an integral part of the financial statements.
11
Equity Income Series
Financial Highlights - Class I*
| | | | | | | | | | |
| | | FOR THE SIX
MONTHS ENDED
6/30/15
(UNAUDITED) | | FOR THE YEAR
ENDED 12/31/14* |
Per share data (for a share outstanding throughout the period): | | | | | | | | | | |
Net asset value - Beginning of period | | | | $10.78 | | | | | $10.00 | |
| | | | | | | | | | |
| | |
Income (loss) from investment operations: | | | | | | | | | | |
Net investment income1 | | | | 0.11 | | | | | 0.30 | 2 |
Net realized and unrealized gain on investments | | | | (0.19 | ) | | | | 0.87 | |
| | | | | | | | | | |
| | |
Total from investment operations | | | | (0.08 | ) | | | | 1.17 | |
| | | | | | | | | | |
| | |
Less distributions to shareholders: | | | | | | | | | | |
From net investment income | | | | — | | | | | (0.25 | ) |
From net realized gain on investments | | | | — | | | | | (0.14 | ) |
| | | | | | | | | | |
| | |
Total distributions to shareholders | | | | — | | | | | (0.39 | ) |
| | | | | | | | | | |
| | |
Net asset value - End of period | | | | $10.70 | | | | | $10.78 | |
| | | | | | | | | | |
| | |
Net assets - End of period (000’s omitted) | | | | $46,170 | | | | | $38,506 | |
| | | | | | | | | | |
| | |
Total return3 | | | | (0.74% | ) | | | | 11.79% | |
Ratios (to average net assets)/Supplemental Data: | | | | | | | | | | |
Expenses** | | | | 0.75% | 4 | | | | 0.75% | |
Net investment income | | | | 2.08% | 4 | | | | 2.82% | 2 |
Portfolio turnover | | | | 24% | | | | | 55% | |
**The investment advisor did not impose all or a portion of its management and/or other fees, and in some periods may have paid a portion of the Series’ expenses. If these expenses had been incurred by the Class, the expense ratio (to average net assets) would have increased by the following amount:
*Commencement of operations was December 31, 2013.
1Calculated based on average shares outstanding during the period.
2Reflects a special dividend paid out during the period by two of the Series’ holdings. Had the Series not received the special dividends, the net investment income per share would have been $0.24 and the net investment income ratio would have been 2.19%.
3Represents aggregate total return for the period indicated, and assumes reinvestment of all distributions. Total return would have been lower had certain expenses not been reimbursed during the period. Periods less than one year are not annualized.
4Annualized.
The accompanying notes are an integral part of the financial statements.
12
Equity Income Series
Notes to Financial Statements
(unaudited)
Equity Income Series (the “Series”) is a no-load diversified series of Manning & Napier Fund, Inc. (the “Fund”). The Fund is organized in Maryland and is registered under the Investment Company Act of 1940, as amended, as an open-end management investment company.
The Series’ primary investment objectives are to provide current income and income growth, and it has a secondary goal of providing long-term capital appreciation.
The Fund’s advisor is Manning & Napier Advisors, LLC (the “Advisor”). Shares of the Series are offered to investors, clients and employees of the Advisor and its affiliates. On December 31, 2013, the Series issued 25,000 shares of Class S and 25,000 shares of Class I, valued at $250,000 and $250,000, respectively, to the Advisor, who was the sole investor in the Series as of that date. The Series is authorized to issue two classes of shares (Class S and Class I). Each class of shares is substantially the same, except that Class S shares bear shareholder services fees. The total authorized capital stock of the Fund consists of 15 billion shares of common stock each having a par value of $0.01. As of June 30, 2015, 10.6 billion shares have been designated in total among 41 series, of which 100 million have been designated as Equity Income Series Class S common stock, and 100 million have been designated as Equity Income Series Class I common stock.
| 2. | Significant Accounting Policies |
The following is a summary of significant accounting policies followed by the Series. The Series is an investment company and, accordingly, follows the investment company accounting and reporting guidance of the Financial Accounting Standards Board Accounting Standards Codification Topic 946 - Investment Companies, which is part of accounting principles generally accepted in the United States of America (“GAAP”).
Security Valuation
Portfolio securities, including domestic equities, foreign equities, warrants and options, listed on an exchange other than the NASDAQ Stock Market are valued at the latest quoted sales price of the exchange on which the security is primarily traded. Securities not traded on valuation date or securities not listed on an exchange are valued at the latest quoted bid price provided by the Fund’s pricing service. Securities listed on the NASDAQ Stock Market are valued in accordance with the NASDAQ Official Closing Price.
Short-term investments that mature in sixty days or less are valued at amortized cost, which approximates fair value. Investments in open-end investment companies are valued at their net asset value per share on valuation date.
Volume and level of activity in established markets for an asset or liability are evaluated to determine whether recent transactions and quoted prices are determinative of fair value. Where there have been significant decreases in volume and level of activity, further analysis and adjustment may be necessary to estimate fair value. The Series measures fair value in these instances by the use of inputs and valuation techniques which may be based upon current market prices of securities that are comparable in coupon, rating, maturity and industry and/or expectation of future cash flows. As a result of trading in relatively thin markets and/or markets that experience significant volatility, the prices used by the Series to value these securities may differ from the value that would be realized if these securities were sold, and the differences could be material.
Securities for which representative valuations or prices are not available from the Series’ pricing service may be valued at fair value as determined in good faith by the Advisor under procedures approved by and under the general supervision and responsibility of the Fund’s Board of Directors (the “Board”). Due to the inherent uncertainty of valuations of such securities, the fair value may differ significantly from the values that would have been used had a ready market for such securities existed. If trading or events occurring after the close of the principal market in which securities are traded are expected to materially affect the value of those securities, then they may be valued at their fair value, taking this trading or these events into account. In accordance with the procedures approved by the Board, the values of certain securities trading outside the U.S. were adjusted following the close of local trading using a factor from a third party vendor. The third party vendor uses statistical analyses and quantitative models, which consider among other things subsequent movement and changes in the prices of indices, securities and exchange rates in other markets, to determine the factors which are used to adjust local market prices. The value of
13
Equity Income Series
Notes to Financial Statements (continued)
(unaudited)
| 2. | Significant Accounting Policies (continued) |
Security Valuation (continued)
securities used for net asset value calculation under these procedures may differ from published prices for the same securities. It is the Fund’s policy to classify each foreign equity security where a factor from a third party vendor is provided as a Level 2 security.
Various inputs are used in determining the value of the Series’ assets or liabilities carried at fair value. These inputs are summarized in three broad levels. Level 1 includes quoted prices in active markets for identical assets and liabilities. Level 2 includes other significant observable inputs (including quoted prices for similar securities, interest rates, prepayment speeds, credit risk, etc.). Level 3 includes significant unobservable inputs (including the Series’ own assumptions in determining the fair value of investments). A financial instrument’s level within the fair value hierarchy is based on the lowest level of any input both individually and in aggregate that is significant to the fair value measurement. The inputs or methodology used for valuing securities are not necessarily an indication of the risk associated with investing in those securities.
The following is a summary of the valuation levels used for major security types as of June 30, 2015 in valuing the Series’ assets or liabilities carried at fair value:
| | | | | | | | | | | | | | | | |
| DESCRIPTION | | TOTAL | | | LEVEL 1 | | | LEVEL 2 | | | LEVEL 3 | |
Assets: | | | | | | | | | | | | | | | | |
Equity securities: | | | | | | | | | | | | | | | | |
Consumer Discretionary | | $ | 4,487,770 | | | $ | 4,487,770 | | | $ | — | | | $ | — | |
Consumer Staples | | | 6,858,632 | | | | 5,551,395 | | | | 1,307,237 | | | | — | |
Energy | | | 5,781,916 | | | | 4,896,544 | | | | 885,372 | | | | — | |
Financials | | | 20,672,754 | | | | 18,523,141 | | | | 2,149,613 | | | | — | |
Health Care | | | 4,766,694 | | | | 3,366,772 | | | | 1,399,922 | | | | — | |
Industrials | | | 11,437,866 | | | | 11,437,866 | | | | — | | | | — | |
Information Technology | | | 8,336,457 | | | | 8,336,457 | | | | — | | | | — | |
Materials | | | 7,299,988 | | | | 7,299,988 | | | | — | | | | — | |
Utilities | | | 1,406,812 | | | | 1,406,812 | | | | — | | | | — | |
Mutual funds | | | 408,649 | | | | 408,649 | | | | — | | | | — | |
| | | | | | | | | | | | | | | | |
Total | | $ | 71,457,538 | | | $ | 65,715,394 | | | $ | 5,742,144 | | | $ | — | |
| | | | | | | | | | | | | | | | |
Please see the Investment Portfolio for foreign securities where a factor from a third party vendor was applied to determine the securities’ fair value following the close of local trading. Such securities are included in Level 2 in the table above.
There were no Level 3 securities held by the Series as of December 31, 2014 or June 30, 2015.
The Fund’s policy is to recognize transfers in and transfers out of the valuation levels as of the beginning of the reporting period. There were no transfers between Level 1 and Level 2 during the six months ended June 30, 2015.
Security Transactions, Investment Income and Expenses
Security transactions are accounted for on trade date. Dividend income is recorded on the ex-dividend date, except that if the ex-dividend date has passed, certain dividends from foreign securities are recorded as soon as the Series is informed of the ex-dividend date. Non-cash dividends, if any, are recorded at the fair value of the securities received. Interest income, including amortization of premium and accretion of discounts using the effective interest method, is earned from settlement date and accrued daily.
Expenses are recorded on an accrual basis. Most expenses of the Fund can be attributed to a specific series. Expenses which cannot be directly attributed are apportioned among the series in the Fund in such a manner as deemed equitable by the Fund’s Board, taking into consideration, among other things, the nature and type of expense. Income, expenses (other than shareholder services fees), and realized and unrealized gains and losses are prorated among the classes based on the relative net assets of each class. Class specific expenses are directly charged to that class.
14
Equity Income Series
Notes to Financial Statements (continued)
(unaudited)
| 2. | Significant Accounting Policies (continued) |
Security Transactions, Investment Income and Expenses (continued)
The Series uses the identified cost method for determining realized gain or loss on investments for both financial statement and federal income tax reporting purposes.
Option Contracts
The Series may write (sell) or buy call or put options on securities and other financial instruments. When the Series writes a call, the Series gives the purchaser the right to buy the underlying security from the Series at the price specified in the option contract (the “exercise price”) at any time during the option period. When the Series writes a put option, the Series gives the purchaser the right to sell to the Series the underlying security at the exercise price at any time during the option period. The Series will only write options on a “covered basis.” This means that the Series will own the underlying security when the Series writes a call or the Series will put aside cash, U.S. Government securities, or other liquid assets in an amount not less than the exercise price at all times the put option is outstanding.
When the Series writes an option, an amount equal to the premium received is reflected as a liability and is subsequently marked-to-market to reflect the current market value of the option. The Series, as a writer of an option, has no control over whether the underlying security or financial instrument may be sold (call) or purchased (put) and, as a result, bears the market risk of an unfavorable change in the price of the security or financial instrument underlying the written option. There is a risk that the Series may not be able to enter into a closing transaction because of an illiquid market.
The Series may also purchase options in an attempt to hedge against fluctuations in the value of its portfolio and to protect against declines in the value of the securities. The premium paid by the Series for the purchase of an option is reflected as an investment and subsequently marked-to-market to reflect the current market value of the option. The risk associated with purchasing options is limited to the premium paid.
When a security is purchased or sold through an exercise of an option, the related premium paid (or received) is added to (or deducted from) the basis of the security acquired or deducted from (or added to) the proceeds of the security sold. When an option expires (or the Series enters into a closing transaction), the Series realizes a gain or loss on the option to the extent of the premium received or paid (or gain or loss to the extent the cost of the closing transaction exceeds the premium paid or received).
The measurement of the risks associated with option contracts is meaningful only when all related and offsetting transactions are considered. The counterparty for the Series’ written options contracts outstanding during the six months ended June 30, 2015 is Pershing LLC, a BNY Mellon Company.
15
Equity Income Series
Notes to Financial Statements (continued)
(unaudited)
| 2. | Significant Accounting Policies (continued) |
The following table presents the present value of derivatives held during the six months ended June 30, 2015 as reflected on the Statement of Assets and Liabilities, and the effect of the derivative instruments on the Statement of Operations:
| | | | | | |
STATEMENT OF OPERATIONS | | | |
| Derivative | | Location of Gain or (Loss) on Derivatives | | Realized Gain
(Loss) on
Derivatives | |
Equity contracts | | Net realized gain (loss) on options written | | $ | 98,954 | |
| Derivative | | Location of Appreciation (Depreciation) on Derivatives | | Unrealized
Appreciation
(Depreciation)
on Derivatives | |
Equity contracts | | Net change in unrealized appreciation (depreciation) on options written | | $ | (2,850 | ) |
The average month-end balances for the six months ended June 30, 2015 of outstanding derivative financial instruments were as follows:
| | | | |
| | | | | |
Options: | | | | |
Average number of option contracts written | | 713 | | |
Average notional value of option contracts written | | $4,099,063 | | |
Written Option Rollforward
Transactions in options written for the six months ended June 30, 2015, were as follows:
| | | | | | | | |
| | | CALLS | |
| | | CONTRACTS | | | PREMIUMS RECEIVED | |
Outstanding options, beginning of period | | | 240 | | | $ | 19,140 | |
Options written | | | 2,850 | | | | 177,066 | |
Options exercised | | | (530 | ) | | | (44,161 | ) |
Options expired | | | (1,095 | ) | | | (66,325 | ) |
Options closed | | | (1,465 | ) | | | (85,720 | ) |
| | | | | | | | |
Outstanding options, end of period | | | — | | | $ | — | |
| | | | | | | | |
Federal Taxes
The Series’ policy is to comply with the provisions of the Internal Revenue Code applicable to regulated investment companies. The Series is not subject to federal income tax or excise tax to the extent that the Series distributes to shareholders each year its taxable income, including any net realized gains on investments, in accordance with requirements of the Internal Revenue Code. Accordingly, no provision for federal income tax or excise tax has been made in the financial statements.
Management evaluates its tax positions to determine if the tax positions taken meet the minimum recognition threshold in connection with accounting for uncertainties in income tax positions taken or expected to be taken for the purposes of measuring and recognizing tax liabilities in the financial statements. Recognition of tax benefits of an uncertain tax position is required only when the position is “more likely than not” to be sustained assuming examination by taxing authorities. At June 30, 2015, the Series has recorded no liability for net unrecognized tax benefits relating to uncertain income tax positions taken or expected to be taken in future tax returns.
The Series files income tax returns in the U.S. federal jurisdiction, various states and foreign jurisdictions, as required. No income tax returns are currently under investigation. The statute of limitations on the Series’ tax returns remains open for the
16
Equity Income Series
Notes to Financial Statements (continued)
(unaudited)
| 2. | Significant Accounting Policies (continued) |
Federal Taxes (continued)
period ended December 31, 2013 and the year ended December 31, 2014. The Series is not aware of any tax positions for which it is reasonably possible that the total amounts of unrecognized tax benefits will significantly change in the next twelve months.
Foreign Taxes
Based on the Series’ understanding of the tax rules and rates related to income, gains and currency purchase/repatriation transactions for foreign jurisdictions in which it invests, the Series will provide for foreign taxes, and where appropriate, deferred foreign tax.
Distributions of Income and Gains
Distributions to shareholders of net investment income and net realized gains are made annually. An additional distribution may be necessary to avoid taxation of the Series. Distributions are recorded on the ex-dividend date.
Indemnifications
The Fund’s organizational documents provide former and current directors and officers with a limited indemnification against liabilities arising in connection with the performance of their duties to the Fund. In the normal course of business, the Fund may also enter into contracts that provide general indemnifications. The Fund’s maximum exposure under these arrangements is unknown as this would be dependent on future claims that may be made against the Fund. The risk of material loss from such claims is considered remote.
Other
The preparation of financial statements in conformity with GAAP requires management to make estimates and assumptions that affect the reported amounts of assets and liabilities and the disclosure of contingent assets and liabilities at the date of the financial statements and the reported amounts of income and expenses during the reporting period. Actual results could differ from those estimates.
| 3. | Transactions with Affiliates |
The Fund has an Investment Advisory Agreement (the “Agreement”) with the Advisor for which the Series pays a fee, computed daily and payable monthly, at an annual rate of 0.65% of the Series’ average daily net assets.
Under the Agreement, personnel of the Advisor provide the Series with advice and assistance in the choice of investments and the execution of securities transactions, and otherwise maintain the Series’ organization. The Advisor also provides the Fund with necessary office space and fund administration and support services. The salaries of all officers of the Fund (except a percentage of the Fund’s Chief Compliance Officer’s salary, which is paid by the Fund), and of all Directors who are “affiliated persons” of the Fund, or of the Advisor, and all personnel of the Fund, or of the Advisor, performing services relating to research, statistical and investment activities, are paid by the Advisor. Each “non-affiliated” Director receives an annual stipend, which is allocated among all the active series of the Fund. In addition, these Directors also receive a fee per Board meeting attended plus a fee for each committee meeting attended and are reimbursed for travel and other out-of-pocket expenses incurred by them in connection with attending such meetings. The Fund also has an Audit Committee Chair, who receives an additional annual stipend for this role.
The Class S shares of the Series are subject to a shareholder services fee in accordance with a shareholder services plan adopted by the Fund’s Board. The shareholder services fee is intended to compensate financial intermediaries, including affiliates of the Fund, in connection with the provision of direct client service, personal services, maintenance of shareholder accounts and reporting services. For these services, Class S of the Series pays a fee, computed daily and payable monthly, at an annual rate of 0.20% of the average daily net assets of Class S. The Fund has a Shareholder Services Agreement with the Advisor, for which the Advisor receives the shareholder services fee as stated above.
The Advisor has contractually agreed, until at least April 30, 2016, to waive its fee and, if necessary, pay other operating expenses of the Series in order to maintain total direct annual fund operating expenses for the Series exclusive of each share
17
Equity Income Series
Notes to Financial Statements (continued)
(unaudited)
| 3. | Transactions with Affiliates (continued) |
class’ shareholder services fee, at no more than 0.75% of average daily net assets. Accordingly, the Advisor waived fees of $52,537 for the six months ended June 30, 2015, which is included as a reduction of expenses on the Statement of Operations. The Advisor is not eligible to recoup any expenses that have been waived or reimbursed.
Manning & Napier Investor Services, Inc., a registered broker-dealer affiliate of the Advisor, acts as distributor for the Fund’s shares. The services of Manning & Napier Investor Services, Inc. are provided at no additional cost to the Series.
Pursuant to a master services agreement dated November 1, 2014, the Fund pays the Advisor an annual fee related to fund accounting and administration of 0.0085% on the first $25 billion of average daily net assets (excluding Target Series and Strategic Income Series); 0.0075% on the next $15 billion of average daily net assets (excluding Target Series and Strategic Income Series); and 0.0065% of the average daily net assets in excess of $40 billion (excluding Target Series and Strategic Income Series); plus a base fee of $30,400 per series. Transfer agent fees are charged to the Fund on a per account basis. Additionally, certain transaction and out-of-pocket expenses, including charges for reporting relating to the Fund’s compliance program, are charged. The Advisor has agreements with BNY Mellon Investment Servicing (U.S.) Inc. (“BNY”) under which BNY serves as sub-accountant services agent and sub-transfer agent.
Expenses not directly attributable to a series are allocated based on each series’ relative net assets or number of accounts, depending on the expense.
| 4. | Purchases and Sales of Securities |
For the six months ended June 30, 2015, purchases and sales of securities, other than U.S. Government securities and short-term securities, were $28,213,866 and $15,785,902, respectively. There were no purchases or sales of U.S. Government securities.
| 5. | Capital Stock Transactions |
Transactions in shares of Class S and Class I of Equity Income Series were:
| | | | | | | | | | | | | | | | |
| CLASS S | | FOR THE SIX MONTHS
ENDED 6/30/15 | | | FOR THE YEAR ENDED 12/31/14 | |
| | | SHARES | | | AMOUNT | | | SHARES | | | AMOUNT | |
Sold | | | 271,496 | | | $ | 2,941,112 | | | | 3,008,903 | | | $ | 31,008,333 | |
Reinvested | | | — | | | | — | | | | 58,238 | | | | 603,342 | |
Repurchased | | | (186,879 | ) | | | (2,000,131 | ) | | | (848,529 | ) | | | (8,732,959 | ) |
| | | | | | | | | | | | | | | | |
Total | | | 84,617 | | | $ | 940,981 | | | | 2,218,612 | | | $ | 22,878,716 | |
| | | | | | | | | | | | | | | | |
| | | | | | | | | | | | | | | | |
| CLASS I | | FOR THE SIX MONTHS
ENDED 6/30/15 | | | FOR THE YEAR ENDED 12/31/14 | |
| | | SHARES | | | AMOUNT | | | SHARES | | | AMOUNT | |
Sold | | | 1,126,839 | | | $ | 12,277,784 | | | | 4,040,328 | | | $ | 41,909,297 | |
Reinvested | | | — | | | | — | | | | 100,751 | | | | 1,043,774 | |
Repurchased | | | (385,950 | ) | | | (4,229,611 | ) | | | (593,883 | ) | | | (6,474,864 | ) |
| | | | | | | | | | | | | | | | |
Total | | | 740,889 | | | $ | 8,048,173 | | | | 3,547,196 | | | $ | 36,478,207 | |
| | | | | | | | | | | | | | | | |
Over 80% of the shares outstanding are fiduciary accounts where the Advisor has sole investment discretion. No shareholder exceeds the 10% threshold.
The Series may trade in instruments including written and purchased options, forward foreign currency exchange contracts and futures contracts and other derivatives in the normal course of investing activities to assist in managing exposure to various market risks. The Series may be subject to various elements of risk, which may involve, to a varying degree, elements of risk in excess of the amounts recognized for financial statement purposes. These risks include: the risk that changes in the value of a
18
Equity Income Series
Notes to Financial Statements (continued)
(unaudited)
| 6. | Financial Instruments (continued) |
derivative may not correlate perfectly with the underlying asset, rate or index; counterparty credit risk related to over the counter derivative counterparties’ failure to perform under contract terms; liquidity risk related to the lack of a liquid market for these contracts allowing the fund to close out its position(s); and documentation risk relating to disagreement over contract terms.
Investing in securities of foreign companies and foreign governments involves special risks and considerations not typically associated with investing in securities of domestic companies and the U.S. Government. These risks include revaluation of currencies and future adverse political and economic developments. Moreover, securities of foreign companies and foreign governments and their markets may be less liquid and their prices more volatile than those of comparable domestic companies and the U.S. Government.
| 8. | Federal Income Tax Information |
The amount and characterization of certain income and capital gains to be distributed are determined in accordance with federal income tax regulations, which may differ from GAAP. The Series may periodically make reclassifications among its capital accounts to reflect income and gains available for distribution (or available capital loss carryovers) under income tax regulations without impacting the Series’ net asset value. Any such reclassifications are not reflected in the financial highlights.
The tax character of distributions paid for the year ended December 31, 2014 were as follows:
| | | | | | | | |
| | Ordinary income | | $ | 1,906,025 | | | |
| | Long-term capital gains | | | 22,003 | | | |
At June 30, 2015, the tax basis of components of distributable earnings and the net unrealized appreciation based on the identified cost of investments for federal income tax purposes were as follows:
| | | | | | |
| | Cost for federal income tax purposes | | | $70,762,079 | |
| | Unrealized appreciation | | | 3,366,535 | |
| | Unrealized depreciation | | | (2,671,076 | ) |
| | | | | | |
| | Net unrealized appreciation | | | $ 695,459 | |
| | | | | | |
19
{This page intentionally left blank}
20
{This page intentionally left blank}
21
Equity Income Series
Literature Requests
(unaudited)
Proxy Voting Policies and Procedures
A description of the policies and procedures that the Fund uses to determine how to vote proxies relating to portfolio securities is available, without charge, upon request:
| | | | | | |
| By phone | | 1-800-466-3863 | | | | |
On the Securities and Exchange
Commission’s (SEC) web site | | http://www.sec.gov | | | | |
Proxy Voting Record
Information regarding how the Fund voted proxies relating to portfolio securities during the most recent 12-month period ended June 30th is available, without charge, upon request:
| | | | | | |
| By phone | | 1-800-466-3863 | | | | |
On the SEC’s web site | | http://www.sec.gov | | | | |
Quarterly Portfolio Holdings
The Series’ complete schedule of portfolio holdings for the 1st and 3rd quarters of each fiscal year are provided on Form N-Q, and are available, without charge, upon request:
| | | | | | |
| By phone | | 1-800-466-3863 | | | | |
On the SEC’s web site | | http://www.sec.gov | | | | |
The Series’ Form N-Q may be reviewed and copied at the SEC’s Public Reference Room in Washington, D.C. Information on the operation of the Public Reference Room may be obtained by calling 1-800-SEC-0330.
Prospectus and Statement of Additional Information (SAI)
For more information about any of the Manning & Napier Fund, Inc. Series, you may obtain a prospectus and SAI at www.manning-napier.com or by calling (800) 466-3863. Before investing, carefully consider the objectives, risks, charges and expenses of the investment and read the prospectus carefully as it contains this and other information about the investment company. In addition, this information can be found on the SEC’s web site, http://www.sec.gov.
Additional information available at www.manning-napier.com
1. Fund Holdings - Month-End
2. Fund Holdings - Quarter-End
3. Shareholder Report - Annual
4. Shareholder Report - Semi-Annual
The Fund also offers electronic notification or “e-delivery” when certain documents are available on-line to be downloaded or reviewed. Direct shareholders can elect to receive electronic notification when shareholder reports, prospectus updates, and/or statements are available. If you do not currently have on-line access to your account, you can establish access by going to www.manning-napier.com, click on “Login” in the top corner of the page, and follow the prompts to self-enroll. Once enrolled, you can set your electronic notification preferences by clicking on the Account Options tab located within the green toolbar and then select E-Delivery Option. Should you have any questions on either how to establish on-line access or how to update your account settings, please contact Investor Services at 1-800-466-3863.
The Manning & Napier Fund, Inc. is managed by Manning & Napier Advisors, LLC. Manning & Napier Investor Services, Inc., an affiliate of Manning & Napier Advisors, LLC, is the distributor of the Fund shares.
MNEIN-6/15-SAR
Focused Opportunities Series
Shareholder Expense Example
(unaudited)
As a shareholder of the Series, you may incur two types of costs: (1) transaction costs and (2) ongoing costs, including management fees and other Series expenses. This example is intended to help you understand your ongoing costs (in dollars) of investing in the Series and to compare these costs with the ongoing costs of investing in other mutual funds.
The example is based on an investment of $1,000 invested at the beginning of the period and held for the entire period (January 1, 2015 to June 30, 2015).
Actual Expenses
The Actual lines of the table below provide information about actual account values and actual expenses. You may use the information in this line, together with the amount you invested, to estimate the expenses that you paid over the period. Simply divide your account value by $1,000 (for example, an $8,600 account value divided by $1,000 = 8.6), then multiply the result by the number in the Actual line for the Class in which you have invested under the heading entitled “Expenses Paid During Period” to estimate the expenses you paid on your account during this period.
Hypothetical Example for Comparison Purposes
The Hypothetical lines of each Class in the table below provide information about hypothetical account values and hypothetical expenses based on the Class’ actual expense ratio and an assumed rate of return of 5% per year before expenses, which is not the Class’ actual return. The hypothetical account values and expenses may not be used to estimate the actual ending account balance or expenses you paid during the period. You may use this information to compare the ongoing costs of investing in the Series and other funds. To do so, compare this 5% hypothetical example for the class in which you have invested with the 5% hypothetical examples that appear in the shareholder reports of the other funds.
Please note that the expenses shown in the table are meant to highlight your ongoing costs only and do not reflect any transaction costs. Therefore, the Hypothetical lines for each Class in the table are useful in comparing ongoing costs only, and will not help you determine the relative total costs of owning different funds. In addition, if these transaction costs were included, your costs would have been higher.
| | | | | | | | |
| | | BEGINNING
ACCOUNT VALUE
1/1/15 | | ENDING
ACCOUNT VALUE
6/30/15 | | EXPENSES PAID
DURING PERIOD*
1/1/15-6/30/15 | | ANNUALIZED
EXPENSE RATIO |
Class S | | | | | | | | |
Actual | | $1,000.00 | | $ 922.20 | | $4.62 | | 0.97% |
Hypothetical (5% return before expenses) | | $1,000.00 | | $1,019.98 | | $4.86 | | 0.97% |
Class I | | | | | | | | |
Actual | | $1,000.00 | | $ 922.20 | | $3.67 | | 0.77% |
Hypothetical (5% return before expenses) | | $1,000.00 | | $1,020.98 | | $3.86 | | 0.77% |
*Expenses are equal to each Class’ annualized expense ratio (for the six-month period), multiplied by the average account value over the period, multiplied by 181/365 (to reflect the one-half year period). Expenses are based on the most recent fiscal half year.
1
Focused Opportunities Series
Portfolio Composition as of June 30, 2015
(unaudited)
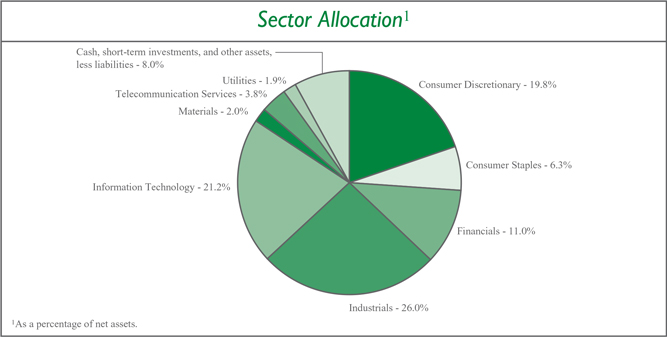
2
Focused Opportunities Series
Investment Portfolio - June 30, 2015
(unaudited)
| | | | | | | | | | |
| | | SHARES | | | VALUE (NOTE 2) | | | |
| | | |
COMMON STOCKS - 92.0% | | | | | | | | | | |
| | | |
Consumer Discretionary - 19.8% | | | | | | | | | | |
Diversified Consumer Services - 3.6% | | | | | | | | | | |
H&R Block, Inc. | | | 339,390 | | | $ | 10,062,913 | | | |
| | | | | | | | | | |
Media - 12.6% | | | | | | | | | | |
Cogeco Cable, Inc. (Canada) | | | 108,090 | | | | 6,251,739 | | | |
Discovery Communications, Inc. - Class A* | | | 363,310 | | | | 12,083,691 | | | |
Sinclair Broadcast Group, Inc. - Class A | | | 200,290 | | | | 5,590,094 | | | |
Tribune Media Co. - Class A | | | 211,490 | | | | 11,291,451 | | | |
| | | | | | | | | | |
| | | |
| | | | | | | 35,216,975 | | | |
| | | | | | | | | | |
Specialty Retail - 3.6% | | | | | | | | | | |
Advance Auto Parts, Inc. | | | 63,010 | | | | 10,036,863 | | | |
| | | | | | | | | | |
| | | |
Total Consumer Discretionary | | | | | | | 55,316,751 | | | |
| | | | | | | | | | |
Consumer Staples - 6.3% | | | | | | | | | | |
Food Products - 6.3% | | | | | | | | | | |
Post Holdings, Inc.* | | | 329,270 | | | | 17,757,531 | | | |
| | | | | | | | | | |
Financials - 11.0% | | | | | | | | | | |
Consumer Finance - 3.6% | | | | | | | | | | |
SLM Corp.* | | | 1,018,970 | | | | 10,057,234 | | | |
| | | | | | | | | | |
Real Estate Investment Trusts (REITS) - 2.9% | | | | | | | | | | |
Outfront Media, Inc. | | | 324,216 | | | | 8,183,212 | | | |
| | | | | | | | | | |
Real Estate Management & Development - 4.5% | | | | | | | | | | |
Realogy Holdings Corp.* | | | 267,160 | | | | 12,481,715 | | | |
| | | | | | | | | | |
| | | |
Total Financials | | | | | | | 30,722,161 | | | |
| | | | | | | | | | |
Industrials - 26.0% | | | | | | | | | | |
Aerospace & Defense - 2.1% | | | | | | | | | | |
KLX, Inc.* | | | 134,730 | | | | 5,945,635 | | | |
| | | | | | | | | | |
Airlines - 4.8% | | | | | | | | | | |
Republic Airways Holdings, Inc.* | | | 1,464,660 | | | | 13,445,579 | | | |
| | | | | | | | | | |
Building Products - 3.4% | | | | | | | | | | |
Masco Corp. | | | 357,730 | | | | 9,540,659 | | | |
| | | | | | | | | | |
Machinery - 5.9% | | | | | | | | | | |
Allison Transmission Holdings, Inc. | | | 285,020 | | | | 8,339,685 | | | |
Joy Global, Inc. | | | 226,260 | | | | 8,190,612 | | | |
| | | | | | | | | | |
| | | |
| | | | | | | 16,530,297 | | | |
| | | | | | | | | | |
Road & Rail - 9.8% | | | | | | | | | | |
Genesee & Wyoming, Inc.* | | | 73,770 | | | | 5,619,799 | | | |
Heartland Express, Inc. | | | 332,450 | | | | 6,725,463 | | | |
Hertz Global Holdings, Inc.* | | | 458,210 | | | | 8,302,765 | | | |
The accompanying notes are an integral part of the financial statements.
3
Focused Opportunities Series
Investment Portfolio - June 30, 2015
(unaudited)
| | | | | | | | | | |
| | | SHARES | | | VALUE (NOTE 2) | | | |
| | | |
COMMON STOCKS (continued) | | | | | | | | | | |
| | | |
Industrials (continued) | | | | | | | | | | |
Road & Rail (continued) | | | | | | | | | | |
Swift Transportation Co.* | | | 292,200 | | | $ | 6,624,174 | | | |
| | | | | | | | | | |
| | | |
| | | | | | | 27,272,201 | | | |
| | | | | | | | | | |
| | | |
Total Industrials | | | | | | | 72,734,371 | | | |
| | | | | | | | | | |
Information Technology - 21.2% | | | | | | | | | | |
Communications Equipment - 8.9% | | | | | | | | | | |
ARRIS Group, Inc.* | | | 353,680 | | | | 10,822,608 | | | |
Juniper Networks, Inc. | | | 212,120 | | | | 5,508,756 | | | |
Polycom, Inc.* | | | 754,720 | | | | 8,633,997 | | | |
| | | | | | | | | | |
| | | |
| | | | | | | 24,965,361 | | | |
| | | | | | | | | | |
Electronic Equipment, Instruments & Components - 2.0% | | | | | | | | | | |
Keysight Technologies, Inc.* | | | 174,390 | | | | 5,439,224 | | | |
| | | | | | | | | | |
IT Services - 10.3% | | | | | | | | | | |
EVERTEC, Inc. | | | 387,400 | | | | 8,228,376 | | | |
Sabre Corp. | | | 513,480 | | | | 12,220,824 | | | |
VeriFone Systems, Inc.* | | | 242,800 | | | | 8,245,488 | | | |
| | | | | | | | | | |
| | | |
| | | | | | | 28,694,688 | | | |
| | | | | | | | | | |
| | | |
Total Information Technology | | | | | | | 59,099,273 | | | |
| | | | | | | | | | |
Materials - 2.0% | | | | | | | | | | |
Chemicals - 2.0% | | | | | | | | | | |
Platform Specialty Products Corp.* | | | 220,030 | | | | 5,628,368 | | | |
| | | | | | | | | | |
Telecommunication Services - 3.8% | | | | | | | | | | |
Wireless Telecommunication Services - 3.8% | | | | | | | | | | |
Telephone & Data Systems, Inc. | | | 357,250 | | | | 10,503,150 | | | |
| | | | | | | | | | |
Utilities - 1.9% | | | | | | | | | | |
Independent Power and Renewable Electricity Producers - 1.9% | | | | | | | | | | |
NRG Energy, Inc. | | | 228,460 | | | | 5,227,165 | | | |
| | | | | | | | | | |
TOTAL COMMON STOCKS | | | | | | | | | | |
(Identified Cost $259,839,913) | | | | | | | 256,988,770 | | | |
| | | | | | | | | | |
| | | |
SHORT-TERM INVESTMENT - 3.1% | | | | | | | | | | |
| | | |
BNY Mellon Cash Reserve1, 0.00% | | | 4,155 | | | | 4,155 | | | |
Dreyfus Cash Management, Inc. - Institutional Shares1, 0.04% | | | 8,788,418 | | | | 8,788,418 | | | |
| | | | | | | | | | |
| | | |
TOTAL SHORT-TERM INVESTMENT | | | | | | | | | | |
(Identified Cost $8,792,573) | | | | | | | 8,792,573 | | | |
| | | | | | | | | | |
The accompanying notes are an integral part of the financial statements.
4
Focused Opportunities Series
Investment Portfolio - June 30, 2015
(unaudited)
| | | | | | | | |
| | | SHARES | | VALUE (NOTE 2) | | | |
| | | |
TOTAL INVESTMENTS - 95.1% | | | | | | | | |
(Identified Cost $268,632,486) | | | | | 265,781,343 | | | |
OTHER ASSETS, LESS LIABILITIES - 4.9% | | | | | 13,553,929 | | | |
| | | | | | | | |
| | | |
NET ASSETS - 100% | | | | $ | 279,335,272 | | | |
| | | | | | | | |
ADR - American Depositary Receipt
*Non-income producing security.
1Rate shown is the current yield as of June 30, 2015.
The Global Industry Classification Standard (GICS) was developed by and is the exclusive property and a service mark of MSCI Inc. (MSCI) and Standard & Poor’s, a division of The McGraw-Hill Companies, Inc. (S&P), and is licensed for use by Manning & Napier when referencing GICS sectors. Neither MSCI, S&P, nor any third party involved in making or compiling the GICS or any GICS classifications makes any express or implied warranties or representations with respect to such standard or classification, nor shall any such party have any liability therefrom.
The accompanying notes are an integral part of the financial statements.
5
Focused Opportunities Series
Statement of Assets & Liabilities
June 30, 2015 (unaudited)
| | | | |
ASSETS: | | | | |
| |
Investments, at value (identified cost $268,632,486) (Note 2) | | $ | 265,781,343 | |
Receivable for securities sold | | | 16,015,779 | |
Receivable for fund shares sold | | | 97,014 | |
Dividends receivable | | | 94,250 | |
Foreign tax reclaims receivable | | | 4,762 | |
Prepaid expenses | | | 1,972 | |
| | | | |
| |
TOTAL ASSETS | | | 281,995,120 | |
| | | | |
| |
LIABILITIES: | | | | |
| |
Accrued management fees (Note 3) | | | 179,574 | |
Accrued shareholder services fees (Class S) (Note 3) | | | 41,223 | |
Accrued fund accounting and administration fees (Note 3) | | | 13,293 | |
Accrued transfer agent fees (Note 3) | | | 5,751 | |
Accrued Chief Compliance Officer service fees (Note 3) | | | 382 | |
Payable for securities purchased | | | 2,133,567 | |
Payable for fund shares repurchased | | | 257,467 | |
Other payables and accrued expenses | | | 28,591 | |
| | | | |
| |
TOTAL LIABILITIES | | | 2,659,848 | |
| | | | |
| |
TOTAL NET ASSETS | | $ | 279,335,272 | |
| | | | |
| |
NET ASSETS CONSIST OF: | | | | |
| |
Capital stock | | $ | 302,035 | |
Additional paid-in-capital | | | 291,662,196 | |
Undistributed net investment income | | | 838,394 | |
Accumulated net realized loss on investments | | | (10,616,210 | ) |
Net unrealized depreciation on investments | | | (2,851,143 | ) |
| | | | |
| |
TOTAL NET ASSETS | | $ | 279,335,272 | |
| | | | |
| |
NET ASSET VALUE, OFFERING PRICE AND REDEMPTION PRICE PER SHARE - Class S ($224,052,893/24,228,513 shares) | | $ | 9.25 | |
| | | | |
| |
NET ASSET VALUE, OFFERING PRICE AND REDEMPTION PRICE PER SHARE - Class I ($55,282,379/5,975,003 shares) | | $ | 9.25 | |
| | | | |
The accompanying notes are an integral part of the financial statements.
6
Focused Opportunities Series
Statement of Operations
For the Six Months Ended June 30, 2015 (unaudited)
| | | | |
INVESTMENT INCOME: | | | | |
| |
Dividends (net of foreign taxes withheld, $4,393) | | $ | 2,206,713 | |
| | | | |
| |
EXPENSES: | | | | |
| |
Management fees (Note 3) | | | 1,032,740 | |
Shareholder services fees (Class S)(Note 3) | | | 236,912 | |
Fund accounting and administration fees (Note 3) | | | 30,550 | |
Transfer agent fees (Note 3) | | | 9,170 | |
Directors’ fees (Note 3) | | | 3,428 | |
Chief Compliance Officer service fees (Note 3) | | | 1,224 | |
Custodian fees | | | 9,771 | |
Miscellaneous | | | 44,524 | |
| | | | |
| |
Total Expenses | | | 1,368,319 | |
| | | | |
| |
NET INVESTMENT INCOME | | | 838,394 | |
| | | | |
| |
REALIZED AND UNREALIZED GAIN (LOSS) ON INVESTMENTS: | | | | |
| |
Net realized loss on investments | | | (11,347,090 | ) |
Net change in unrealized depreciation on investments | | | (13,111,762 | ) |
| | | | |
| |
NET REALIZED AND UNREALIZED GAIN (LOSS) ON INVESTMENTS | | | (24,458,852 | ) |
| | | | |
| |
NET DECREASE IN NET ASSETS RESULTING FROM OPERATIONS | | $ | (23,620,458 | ) |
| | | | |
The accompanying notes are an integral part of the financial statements.
7
Focused Opportunities Series
Statements of Changes in Net Assets
| | | | | | | | | | |
| | | FOR THE SIX
MONTHS ENDED
6/30/15
(UNAUDITED) | | FOR THE YEAR ENDED 12/31/14* | |
INCREASE (DECREASE) IN NET ASSETS: | | | | | | | | | | |
| | | |
OPERATIONS: | | | | | | | | | | |
| | | |
Net investment income | | $ | 838,394 | | | | | $ | 2,083,448 | |
Net realized gain (loss) on investments and foreign currency | | | (11,347,090 | ) | | | | | 21,283,534 | |
Net change in unrealized appreciation (depreciation) on investments and foreign currency | | | (13,111,762 | ) | | | | | 10,260,619 | |
| | | | | | | | | | |
| | | |
Net increase (decrease) from operations | | | (23,620,458 | ) | | | | | 33,627,601 | |
| | | | | | | | | | |
| | | |
DISTRIBUTIONS TO SHAREHOLDERS (Note 8): | | | | | | | | | | |
| | | |
From net investment income (Class S) | | | — | | | | | | (1,727,793 | ) |
From net investment income (Class I) | | | — | | | | | | (533,842 | ) |
From net realized gain on investments (Class S) | | | — | | | | | | (16,346,540 | ) |
From net realized gain on investments (Class I) | | | — | | | | | | (4,027,927 | ) |
| | | | | | | | | | |
| | | |
Total distributions to shareholders | | | — | | | | | | (22,636,102 | ) |
| | | | | | | | | | |
| | | |
CAPITAL STOCK ISSUED AND REPURCHASED: | | | | | | | | | | |
| | | |
Net increase (decrease) from capital share transactions (Note 5) | | | (1,799,692 | ) | | | | | 293,263,923 | |
| | | | | | | | | | |
| | | |
Net increase (decrease) in net assets | | | (25,420,150 | ) | | | | | 304,255,422 | |
| | | |
NET ASSETS: | | | | | | | | | | |
| | | |
Beginning of period | | | 304,755,422 | | | | | | 500,000 | |
| | | | | | | | | | |
| | | |
End of period (including undistributed net investment income of $838,394 and $0, respectively) | | $ | 279,335,272 | | | | | $ | 304,755,422 | |
| | | | | | | | | | |
*Commencement of operations was December 31, 2013.
The accompanying notes are an integral part of the financial statements.
8
Focused Opportunities Series
Financial Highlights - Class S
| | | | | | | | | | |
| | | FOR THE SIX
MONTHS ENDED
6/30/15
(UNAUDITED) | | FOR THE YEAR
ENDED 12/31/14* |
Per share data (for a share outstanding throughout each period): | | | | | | | | | | |
Net asset value - Beginning of period | | | | $10.03 | | | | | $10.00 | |
| | | | | | | | | | |
| | |
Income from investment operations: | | | | | | | | | | |
Net investment income1 | | | | 0.03 | | | | | 0.08 | 2 |
Net realized and unrealized gain on investments | | | | (0.81 | ) | | | | 0.76 | |
| | | | | | | | | | |
| | |
Total from investment operations | | | | (0.78 | ) | | | | 0.84 | |
| | | | | | | | | | |
| | |
Less distributions to shareholders: | | | | | | | | | | |
From net investment income | | | | — | | | | | (0.08 | ) |
From net realized gain on investments | | | | — | | | | | (0.73 | ) |
| | | | | | | | | | |
| | |
Total distributions to shareholders | | | | — | | | | | (0.81 | ) |
| | | | | | | | | | |
| | |
Net asset value - End of period | | | | $9.25 | | | | | $10.03 | |
| | | | | | | | | | |
| | |
Net assets - End of period (000’s omitted) | | | | $224,053 | | | | | $244,388 | |
| | | | | | | | | | |
| | |
Total return3 | | | | (7.78% | ) | | | | 8.86% | |
Ratios (to average net assets)/Supplemental Data: | | | | | | | | | | |
Expenses | | | | 0.97% | 4 | | | | 0.96% | |
Net investment income | | | | 0.53% | 4 | | | | 0.73% | 2 |
Portfolio turnover | | | | 51% | | | | | 75% | |
*Commencement of operations was December 31, 2013.
1Calculated based on average shares outstanding during the periods.
2Reflects a special dividend paid out during the period by one of the Series’ holdings. Had the Series not received the special dividend, the net investment income per share would have been $0.03 and the net investment income ratio would have been 0.27%.
3Represents aggregate total return for the periods indicated, and assumes reinvestment of all distributions. Periods less than one year are not annualized.
4Annualized.
The accompanying notes are an integral part of the financial statements.
9
Focused Opportunities Series
Financial Highlights - Class I
| | | | | | | | | | |
| | | FOR THE SIX
MONTHS ENDED
6/30/15
(UNAUDITED) | | FOR THE YEAR
ENDED 12/31/14* |
Per share data (for a share outstanding throughout each period): | | | | | | | | | | |
Net asset value - Beginning of period | | | | $10.03 | | | | | $10.00 | |
| | | | | | | | | | |
| | |
Income from investment operations: | | | | | | | | | | |
Net investment income1 | | | | 0.03 | | | | | 0.09 | 2 |
Net realized and unrealized gain on investments | | | | (0.81 | ) | | | | 0.77 | |
| | | | | | | | | | |
| | |
Total from investment operations | | | | (0.78 | ) | | | | 0.86 | |
| | | | | | | | | | |
| | |
Less distributions to shareholders: | | | | | | | | | | |
From net investment income | | | | — | | | | | (0.10 | ) |
From net realized gain on investments | | | | — | | | | | (0.73 | ) |
| | | | | | | | | | |
| | |
Total distributions to shareholders | | | | — | | | | | (0.83 | ) |
| | | | | | | | | | |
| | |
Net asset value - End of period | | | | $9.25 | | | | | $10.03 | |
| | | | | | | | | | |
| | |
Net assets - End of period (000’s omitted) | | | | $55,282 | | | | | $60,367 | |
| | | | | | | | | | |
| | |
Total return3 | | | | (7.78% | ) | | | | 9.07% | |
Ratios (to average net assets)/Supplemental Data: | | | | | | | | | | |
Expenses | | | | 0.77% | 4 | | | | 0.80% | |
Net investment income | | | | 0.72% | 4 | | | | 0.90% | 2 |
Portfolio turnover | | | | 51% | | | | | 75% | |
*Commencement of operations was December 31, 2013.
1Calculated based on average shares outstanding during the periods.
2Reflects a special dividend paid out during the period by one of the Series’ holdings. Had the Series not received the special dividend, the net investment income per share would have been $0.05 and the net investment income ratio would have been 0.43%.
3Represents aggregate total return for the periods indicated, and assumes reinvestment of all distributions. Periods less than one year are not annualized.
4Annualized.
The accompanying notes are an integral part of the financial statements.
10
Focused Opportunities Series
Notes to Financial Statements
(unaudited)
Focused Opportunities Series (the “Series”) is a no-load diversified series of Manning & Napier Fund, Inc. (the “Fund”). The Fund is organized in Maryland and is registered under the Investment Company Act of 1940, as amended, as an open-end management investment company.
The Series’ investment objective is to provide long-term capital appreciation.
The Fund’s advisor is Manning & Napier Advisors, LLC (the “Advisor”). Shares of the Series are offered to investors, clients and employees of the Advisor and its affiliates. On December 31, 2013, the Series issued 25,000 shares of Class S and 25,000 shares of Class I, valued at $250,000 and $250,000, respectively, to the Advisor, who was the sole investor in the Series as of that date. The Series is authorized to issue two classes of shares (Class S and Class I). Each class of shares is substantially the same, except that Class S shares bear shareholder services fees. The total authorized capital stock of the Fund consists of 15 billion shares of common stock each having a par value of $0.01. As of June 30, 2015, 10.6 billion shares have been designated in total among 41 series, of which 100 million have been designated as Focused Opportunities Series Class S common stock, and 100 million have been designated as Focused Opportunities Series Class I common stock.
| 2. | Significant Accounting Policies |
The following is a summary of significant accounting policies followed by the Series. The Series is an investment company and, accordingly, follows the investment company accounting and reporting guidance of the Financial Accounting Standards Board Accounting Standards Codification Topic 946 - Investment Companies, which is part of accounting principles generally accepted in the United States of America (“GAAP”).
Security Valuation
Portfolio securities, including domestic equities, foreign equities, warrants and options, listed on an exchange other than the NASDAQ Stock Market are valued at the latest quoted sales price of the exchange on which the security is primarily traded. Securities not traded on valuation date or securities not listed on an exchange are valued at the latest quoted bid price provided by the Fund’s pricing service. Securities listed on the NASDAQ Stock Market are valued in accordance with the NASDAQ Official Closing Price.
Short-term investments that mature in sixty days or less are valued at amortized cost, which approximates fair value. Investments in open-end investment companies are valued at their net asset value per share on valuation date.
Volume and level of activity in established markets for an asset or liability are evaluated to determine whether recent transactions and quoted prices are determinative of fair value. Where there have been significant decreases in volume and level of activity, further analysis and adjustment may be necessary to estimate fair value. The Series measures fair value in these instances by the use of inputs and valuation techniques which may be based upon current market prices of securities that are comparable in coupon, rating, maturity and industry and/or expectation of future cash flows. As a result of trading in relatively thin markets and/or markets that experience significant volatility, the prices used by the Series to value these securities may differ from the value that would be realized if these securities were sold, and the differences could be material.
Securities for which representative valuations or prices are not available from the Series’ pricing service may be valued at fair value as determined in good faith by the Advisor under procedures approved by and under the general supervision and responsibility of the Fund’s Board of Directors (the “Board”). Due to the inherent uncertainty of valuations of such securities, the fair value may differ significantly from the values that would have been used had a ready market for such securities existed. If trading or events occurring after the close of the principal market in which securities are traded are expected to materially affect the value of those securities, then they may be valued at their fair value, taking this trading or these events into account. In accordance with the procedures approved by the Board, the values of certain securities trading outside the U.S. were adjusted following the close of local trading using a factor from a third party vendor. The third party vendor uses statistical analyses and quantitative models, which consider among other things subsequent movement and changes in the prices of indices, securities and exchange rates in other markets, to determine the factors which are used to adjust local market prices. The value of
11
Focused Opportunities Series
Notes to Financial Statements (continued)
(unaudited)
| 2. | Significant Accounting Policies (continued) |
Security Valuation (continued)
securities used for net asset value calculation under these procedures may differ from published prices for the same securities. It is the Fund’s policy to classify each foreign equity security where a factor from a third party vendor is provided as a Level 2 security.
Various inputs are used in determining the value of the Series’ assets or liabilities carried at fair value. These inputs are summarized in three broad levels. Level 1 includes quoted prices in active markets for identical assets and liabilities. Level 2 includes other significant observable inputs (including quoted prices for similar securities, interest rates, prepayment speeds, credit risk, etc.). Level 3 includes significant unobservable inputs (including the Series’ own assumptions in determining the fair value of investments). A financial instrument’s level within the fair value hierarchy is based on the lowest level of any input both individually and in aggregate that is significant to the fair value measurement. The inputs or methodology used for valuing securities are not necessarily an indication of the risk associated with investing in those securities.
The following is a summary of the valuation levels used for major security types as of June 30, 2015 in valuing the Series’ assets or liabilities carried at fair value:
| | | | | | | | | | | | | | | | |
| DESCRIPTION | | TOTAL | | | LEVEL 1 | | | LEVEL 2 | | | LEVEL 3 | |
Assets: | | | | | | | | | | | | | | | | |
Equity securities: | | | | | | | | | | | | | | | | |
Consumer Discretionary | | $ | 55,316,751 | | | $ | 55,316,751 | | | $ | — | | | $ | — | |
Consumer Staples | | | 17,757,531 | | | | 17,757,531 | | | | — | | | | — | |
Financials | | | 30,722,161 | | | | 30,722,161 | | | | — | | | | — | |
Industrials | | | 72,734,371 | | | | 72,734,371 | | | | — | | | | — | |
Information Technology | | | 59,099,273 | | | | 59,099,273 | | | | — | | | | — | |
Materials | | | 5,628,368 | | | | 5,628,368 | | | | — | | | | — | |
Telecommunication Services | | | 10,503,150 | | | | 10,503,150 | | | | — | | | | — | |
Utilities | | | 5,227,165 | | | | 5,227,165 | | | | — | | | | — | |
Mutual fund | | | 8,792,573 | | | | 8,792,573 | | | | — | | | | — | |
| | | | | | | | | | | | | | | | |
| | | | |
Total assets | | $ | 265,781,343 | | | $ | 265,781,343 | | | $ | — | | | $ | — | |
| | | | | | | | | | | | | | | | |
There were no Level 3 securities held by the Series as of December 31, 2014 or June 30, 2015.
The Fund’s policy is to recognize transfers in and transfers out of the valuation levels as of the beginning of the reporting period. There were no transfers between Level 1 and Level 2 during the six months ended June 30, 2015.
Security Transactions, Investment Income and Expenses
Security transactions are accounted for on trade date. Dividend income is recorded on the ex-dividend date, except that if the ex-dividend date has passed, certain dividends from foreign securities are recorded as soon as the Series is informed of the ex-dividend date. Non-cash dividends, if any, are recorded at the fair value of the securities received. Interest income, including amortization of premium and accretion of discounts using the effective interest method, is earned from settlement date and accrued daily.
Expenses are recorded on an accrual basis. Most expenses of the Fund can be attributed to a specific series. Expenses which cannot be directly attributed are apportioned among the series in the Fund in such a manner as deemed equitable by the Fund’s Board, taking into consideration, among other things, the nature and type of expense. Income, expenses (other than shareholder services fees), and realized and unrealized gains and losses are prorated among the classes based on the relative net assets of each class. Class specific expenses are directly charged to that class.
The Series uses the identified cost method for determining realized gain or loss on investments for both financial statement and federal income tax reporting purposes.
12
Focused Opportunities Series
Notes to Financial Statements (continued)
(unaudited)
| 2. | Significant Accounting Policies (continued) |
Federal Taxes
The Series’ policy is to comply with the provisions of the Internal Revenue Code applicable to regulated investment companies. The Series is not subject to federal income tax or excise tax to the extent that the Series distributes to shareholders each year its taxable income, including any net realized gains on investments, in accordance with requirements of the Internal Revenue Code. Accordingly, no provision for federal income tax or excise tax has been made in the financial statements.
Management evaluates its tax positions to determine if the tax positions taken meet the minimum recognition threshold in connection with accounting for uncertainties in income tax positions taken or expected to be taken for the purposes of measuring and recognizing tax liabilities in the financial statements. Recognition of tax benefits of an uncertain tax position is required only when the position is “more likely than not” to be sustained assuming examination by taxing authorities. At June 30, 2015, the Series has recorded no liability for net unrecognized tax benefits relating to uncertain income tax positions taken or expected to be taken in future tax returns.
The Series files income tax returns in the U.S. federal jurisdiction, various states and foreign jurisdictions, as required. No income tax returns are currently under investigation. The statute of limitations on the Series’ tax returns remains open for the period ended December 31, 2013 and the year ended December 31, 2014. The Series is not aware of any tax positions for which it is reasonably possible that the total amounts of unrecognized tax benefits will significantly change in the next twelve months.
Foreign Taxes
Based on the Series’ understanding of the tax rules and rates related to income, gains and currency purchase/repatriation transactions for foreign jurisdictions in which it invests, the Series will provide for foreign taxes, and where appropriate, deferred foreign tax.
Distributions of Income and Gains
Distributions to shareholders of net investment income and net realized gains are made annually. An additional distribution may be necessary to avoid taxation of the Series. Distributions are recorded on the ex-dividend date.
Indemnifications
The Fund’s organizational documents provide former and current directors and officers with a limited indemnification against liabilities arising in connection with the performance of their duties to the Fund. In the normal course of business, the Fund may also enter into contracts that provide general indemnifications. The Fund’s maximum exposure under these arrangements is unknown as this would be dependent on future claims that may be made against the Fund. The risk of material loss from such claims is considered remote.
Other
The preparation of financial statements in conformity with GAAP requires management to make estimates and assumptions that affect the reported amounts of assets and liabilities and the disclosure of contingent assets and liabilities at the date of the financial statements and the reported amounts of income and expenses during the reporting period. Actual results could differ from those estimates.
| 3. | Transactions with Affiliates |
The Fund has an Investment Advisory Agreement (the “Agreement”) with the Advisor for which the Series pays a fee, computed daily and payable monthly, at an annual rate of 0.70% of the Series’ average daily net assets.
Under the Agreement, personnel of the Advisor provide the Series with advice and assistance in the choice of investments and the execution of securities transactions, and otherwise maintain the Series’ organization. The Advisor also provides the Fund with necessary office space and fund administration and support services. The salaries of all officers of the Fund (except a percentage of the Fund’s Chief Compliance Officer’s salary, which is paid by the Fund), and of all Directors who are “affiliated persons” of the Fund, or of the Advisor, and all personnel of the Fund, or of the Advisor, performing services relating to research, statistical and investment activities, are paid by the Advisor. Each “non-affiliated” Director receives an annual stipend,
13
Focused Opportunities Series
Notes to Financial Statements (continued)
(unaudited)
| 3. | Transactions with Affiliates (continued) |
which is allocated among all the active series of the Fund. In addition, these Directors also receive a fee per Board meeting attended plus a fee for each committee meeting attended and are reimbursed for travel and other out-of-pocket expenses incurred by them in connection with attending such meetings. The Fund also has an Audit Committee Chair, who receives an additional annual stipend for this role.
The Class S shares of the Series are subject to a shareholder services fee in accordance with a shareholder services plan adopted by the Fund’s Board. The shareholder services fee is intended to compensate financial intermediaries, including affiliates of the Fund, in connection with the provision of direct client service, personal services, maintenance of shareholder accounts and reporting services. For these services, Class S of the Series pays a fee, computed daily and payable monthly, at an annual rate of 0.20% of the average daily net assets of Class S. The Fund has a Shareholder Services Agreement with the Advisor, for which the Advisor receives the shareholder services fee as stated above.
The Advisor has contractually agreed, until at least April 30, 2016, to waive its fee and, if necessary, pay other operating expenses of the Series in order to maintain total direct annual fund operating expenses for the Series exclusive of each share class’ shareholder services fee, at no more than 0.80% of average daily net assets. The Advisor did not waive any fees for the six months ended June 30, 2015. The Advisor is not eligible to recoup any expenses that have been waived or reimbursed.
Manning & Napier Investor Services, Inc., a registered broker-dealer affiliate of the Advisor, acts as distributor for the Fund’s shares. The services of Manning & Napier Investor Services, Inc. are provided at no additional cost to the Series.
Pursuant to a master services agreement dated November 1, 2014, the Fund pays the Advisor an annual fee related to fund accounting and administration of 0.0085% on the first $25 billion of average daily net assets (excluding Target Series and Strategic Income Series); 0.0075% on the next $15 billion of average daily net assets (excluding Target Series and Strategic Income Series); and 0.0065% of the average daily net assets in excess of $40 billion (excluding Target Series and Strategic Income Series); plus a base fee of $30,400 per series. Transfer agent fees are charged to the Fund on a per account basis. Additionally, certain transaction and out-of-pocket expenses, including charges for reporting relating to the Fund’s compliance program, are charged. The Advisor has agreements with BNY Mellon Investment Servicing (U.S.) Inc. (“BNY”) under which BNY serves as sub-accountant services agent and sub-transfer agent.
Expenses not directly attributable to a series are allocated based on each series’ relative net assets or number of accounts, depending on the expense.
| 4. | Purchases and Sales of Securities |
For the six months ended June 30, 2015, purchases and sales of securities, other than U.S. Government securities and short-term securities, were $146,758,402 and $157,087,887, respectively. There were no purchases or sales of U.S. Government securities.
| 5. | Capital Stock Transactions |
Transactions in shares of Class S and Class I of Focused Opportunities Series were:
| | | | | | | | | | | | | | | | |
| CLASS S: | | FOR THE SIX MONTHS ENDED 6/30/15 | | | FOR THE YEAR ENDED 12/31/14* | |
| | | SHARES | | | AMOUNT | | | SHARES | | | AMOUNT | |
Sold | | | 1,282,630 | | | $ | 12,440,423 | | | | 24,938,373 | | | $ | 243,255,184 | |
Reinvested | | | — | | | | — | | | | 1,889,989 | | | | 17,784,799 | |
Repurchased | | | (1,414,701 | ) | | | (13,748,237 | ) | | | (2,492,778 | ) | | | (26,102,926 | ) |
| | | | | | | | | | | | | | | | |
| | | | |
Total | | | (132,071 | ) | | $ | (1,307,814 | ) | | | 24,335,584 | | | $ | 234,937,057 | |
| | | | | | | | | | | | | | | | |
14
Focused Opportunities Series
Notes to Financial Statements (continued)
(unaudited)
| 5. | Capital Stock Transactions (continued) |
| | | | | | | | | | | | | | | | |
| CLASS I: | | FOR THE SIX MONTHS ENDED 6/30/15 | | | FOR THE YEAR ENDED 12/31/14* | |
| | | SHARES | | | AMOUNT | | | SHARES | | | AMOUNT | |
Sold | | | 220,864 | | | $ | 2,097,914 | | | | 5,926,576 | | | $ | 58,130,793 | |
Reinvested | | | — | | | | — | | | | 476,683 | | | | 4,485,588 | |
Repurchased | | | (266,071 | ) | | | (2,589,792 | ) | | | (408,049 | ) | | | (4,289,515 | ) |
| | | | | | | | | | | | | | | | |
| | | | |
Total | | | (45,207 | ) | | $ | (491,878 | ) | | | 5,995,210 | | | $ | 58,326,866 | |
| | | | | | | | | | | | | | | | |
* Commencement of operations was December 31, 2013.
Over 90% of the shares outstanding are fiduciary accounts where the Advisor has sole investment discretion. No shareholder exceeds the 10% threshold.
The Series may trade in instruments including written and purchased options, forward foreign currency exchange contracts and futures contracts and other derivatives in the normal course of investing activities to assist in managing exposure to various market risks. The Series may be subject to various elements of risk, which may involve, to a varying degree, elements of risk in excess of the amounts recognized for financial statement purposes. These risks include: the risk that changes in the value of a derivative may not correlate perfectly with the underlying asset, rate or index; counterparty credit risk related to over the counter derivative counterparties’ failure to perform under contract terms; liquidity risk related to the lack of a liquid market for these contracts allowing the fund to close out its position(s); and documentation risk relating to disagreement over contract terms. No such investments were held by the Series as of June 30, 2015.
Investing in securities of foreign companies and foreign governments involves special risks and considerations not typically associated with investing in securities of domestic companies and the U.S. Government. These risks include revaluation of currencies and future adverse political and economic developments. Moreover, securities of foreign companies and foreign governments and their markets may be less liquid and their prices more volatile than those of comparable domestic companies and the U.S. Government.
| 8. | Federal Income Tax Information |
The amount and characterization of certain income and capital gains to be distributed are determined in accordance with federal income tax regulations, which may differ from GAAP. The Series may periodically make reclassifications among its capital accounts to reflect income and gains available for distribution (or available capital loss carryovers) under income tax regulations without impacting the Series’ net asset value. Any such reclassifications are not reflected in the financial highlights.
The final determination of the tax character of current year distributions will be made at the conclusion of the fiscal year. The tax character of distributions paid for the year ended December 31, 2014 was as follows:
Ordinary income $22,636,102
15
Focused Opportunities Series
Notes to Financial Statements (continued)
(unaudited)
| 8. | Federal Income Tax Information (continued) |
At June 30, 2015, the identified cost for federal income tax purposes, the resulting gross unrealized appreciation and depreciation, and the net unrealized depreciation were as follows:
| | | | | | |
Cost for federal income tax purposes | | $ | 268,838,568 | | | |
Unrealized appreciation | | | 14,273,764 | | | |
Unrealized depreciation | | | (17,330,989 | ) | | |
| | | | | | |
| | |
Net unrealized depreciation | | $ | (3,057,225 | ) | | |
| | | | | | |
As of December 31, 2014, the Series had a net short-term capital loss carryforward of $1,061,222, which is subject to limitations under the Internal Revenue Code, and is available to the extent allowed by tax law to offset future net capital gains, if any.
16
{This page intentionally left blank}
17
Focused Opportunities Series
Literature Requests
(unaudited)
Proxy Voting Policies and Procedures
A description of the policies and procedures that the Fund uses to determine how to vote proxies relating to portfolio securities is available, without charge, upon request:
| | |
| By phone | | 1-800-466-3863 |
On the Securities and Exchange Commission’s (SEC) web site | | http://www.sec.gov |
Proxy Voting Record
Information regarding how the Fund voted proxies relating to portfolio securities during the most recent 12-month period ended June 30th is available, without charge, upon request:
| | |
| By phone | | 1-800-466-3863 |
| On the SEC’s web site | | http://www.sec.gov |
Quarterly Portfolio Holdings
The Series’ complete schedule of portfolio holdings for the 1st and 3rd quarters of each fiscal year are provided on Form N-Q, and are available, without charge, upon request:
| | |
| By phone | | 1-800-466-3863 |
| On the SEC’s web site | | http://www.sec.gov |
The Series’ Form N-Q may be reviewed and copied at the SEC’s Public Reference Room in Washington, D.C. Information on the operation of the Public Reference Room may be obtained by calling 1-800-SEC-0330.
Prospectus and Statement of Additional Information (SAI)
For more information about any of the Manning & Napier Fund, Inc. Series, you may obtain a prospectus and SAI at www.manning-napier.com or by calling (800) 466-3863. Before investing, carefully consider the objectives, risks, charges and expenses of the investment and read the prospectus carefully as it contains this and other information about the investment company. In addition, this information can be found on the SEC’s web site, http://www.sec.gov.
Additional information available at www.manning-napier.com
1. Fund Holdings - Month-End
2. Fund Holdings - Quarter-End
3. Shareholder Report - Annual
4. Shareholder Report - Semi-Annual
The Fund also offers electronic notification or “e-delivery” when certain documents are available on-line to be downloaded or reviewed. Direct shareholders can elect to receive electronic notification when shareholder reports, prospectus updates, and/or statements are available. If you do not currently have on-line access to your account, you can establish access by going to www.manning-napier.com, click on “Login” in the top corner of the page, and follow the prompts to self-enroll. Once enrolled, you can set your electronic notification preferences by clicking on the Account Options tab located within the green toolbar and then select E-Delivery Option. Should you have any questions on either how to establish on-line access or how to update your account settings, please contact Investor Services at 1-800-466-3863.
The Manning & Napier Fund, Inc. is managed by Manning & Napier Advisors, LLC. Manning & Napier Investor Services, Inc., an affiliate of Manning & Napier Advisors, LLC, is the distributor of the Fund shares.
MNFOC-6/15-SAR
ITEM 2: CODE OF ETHICS
Not applicable for Semi-Annual Reports.
ITEM 3: AUDIT COMMITTEE FINANCIAL EXPERT
Not applicable for Semi-Annual Reports.
ITEM 4: PRINCIPAL ACCOUNTANT FEES AND SERVICES
Not applicable for Semi-Annual Reports.
ITEM 5: AUDIT COMMITTEE OF LISTED REGISTRANTS
Not applicable.
ITEM 6: INVESTMENTS
| (a) | See Investment Portfolios under Item 1 on this Form N-CSR. |
| ITEM 7: | DISCLOSURE OF PROXY VOTING POLICIES AND PROCEDURES FOR CLOSED-END MANAGEMENT INVESTMENT COMPANIES |
Not applicable.
ITEM 8: PORTFOLIO MANAGERS OF CLOSED-END MANAGEMENT INVESTMENT COMPANIES
Not applicable.
| ITEM 9: | PURCHASES OF EQUITY SECURITIES BY CLOSED-END MANAGEMENT INVESTMENT COMPANY AND AFFILIATED PURCHASERS |
Not applicable.
ITEM 10: SUBMISSION OF MATTERS TO A VOTE OF SECURITY HOLDERS
There have been no material changes to the procedure by which shareholders may recommend nominees to the registrant’s board of directors.
ITEM 11: CONTROLS AND PROCEDURES
(a) Based on their evaluation of the Funds’ disclosure controls and procedures, as of a date within 90 days of the filing date, the Funds’ Principal Executive Officer and Principal Financial Officer have concluded that the Funds’ disclosure controls and procedures are: (i) reasonably designed to ensure that information required to be disclosed in this report is appropriately communicated to the Funds’ officers to allow timely decisions regarding disclosures required in this report; (ii) reasonably designed to ensure that information required to be disclosed in this report is recorded, processed, summarized and reported in a timely manner; and (iii) are effective in achieving the goals described in (i) and (ii) above.
(b) During the second fiscal quarter of the period covered by this report, there have been no changes in the Funds’ internal control over financial reporting that the above officers believe to have materially affected, or to be reasonably likely to materially affect, the Funds’ internal control over financial reporting.
ITEM 12: EXHIBITS
| | |
(a)(1) | | Not applicable for Semi-Annual Reports. |
| |
(a)(2) | | Separate certifications for the Registrant’s principal executive officer and principal financial officer, as required by Section 302 of the Sarbanes-Oxley Act of 2002 and Rule 30a-2(a) under the Investment Company Act of 1940, are attached as EX-99.CERT. |
| |
(a)(3) | | Not applicable. |
| |
(b) | | A certification of the Registrant’s principal executive officer and principal financial officer, as required by 18 U.S.C Section 1350, as adopted pursuant to Section 906 of the Sarbanes-Oxley Act of 2002, and Rule 30a-2(b) under the Investment Company Act of 1940, is attached as EX- 99.906CERT. The certification furnished pursuant to this paragraph is not deemed to be “filed” for purposes of Section 18 of the Securities Exchange Act of 1934, or otherwise subject to the liability of that section. Such certification is not deemed to be incorporated by reference into any filing under the Securities Act of 1933 or the Securities Exchange Act of 1934, except to the extent that the Registrant specifically incorporates them by reference. |
SIGNATURES
Pursuant to the requirements of the Securities Exchange Act of 1934 and the Investment Company Act of 1940, the registrant has duly caused this report to be signed on its behalf by the undersigned, thereunto duly authorized.
|
| Manning & Napier Fund, Inc. |
|
/s/ James Mikolaichik |
| James Mikolaichik |
President & Principal Executive Officer of Manning & Napier Fund, Inc.
Date: August 19, 2015
Pursuant to the requirements of the Securities Exchange Act of 1934 and the Investment Company Act of 1940, this report has been signed below by the following persons on behalf of the registrant and in the capacities and on the dates indicated.
|
/s/ James Mikolaichik |
| James Mikolaichik |
President & Principal Executive Officer of Manning & Napier Fund, Inc.
Date: August 19, 2015
|
/s/ Christine Glavin |
Christine Glavin |
Chief Financial Officer & Principal Financial Officer of Manning & Napier Fund, Inc.
Date: August 19, 2015