UNITED STATES
SECURITIES AND EXCHANGE COMMISSION
Washington, D.C. 20549
FORM N-CSR
CERTIFIED SHAREHOLDER REPORT OF REGISTERED MANAGEMENT INVESTMENT
COMPANIES
Investment Company Act file number 811-04087
Manning & Napier Fund, Inc.
(Exact name of registrant as specified in charter)
290 Woodcliff Drive, Fairport, NY 14450
(Address of principal executive offices)(Zip Code)
James Mikolaichik 290 Woodcliff Drive, Fairport, NY 14450
(Name and address of agent for service)
Registrant’s telephone number, including area code: 585-325-6880
Date of fiscal year end: October 31
Date of reporting period: November 1, 2015 through April 30, 2016
Form N-CSR is to be used by management investment companies to file reports with the Commission not later than 10 days after the transmission to stockholders of any report that is required to be transmitted to stockholders under Rule 30e-1 under the Investment Company Act of 1940 (17 CFR 270.30e-1). The Commission may use the information provided on Form N-CSR in its regulatory, disclosure review, inspection, and policymaking roles.
A registrant is required to disclose the information specified by Form N-CSR, and the Commission will make this information public. A registrant is not required to respond to the collection of information contained in Form N-CSR unless the Form displays a currently valid Office of Management and Budget (“OMB”) control number. Please direct comments concerning the accuracy of the information collection burden estimate and any suggestions for reducing the burden to Secretary, Securities and Exchange Commission, 100 F Street, NE, Washington, DC 20549. The OMB has reviewed this collection of information under the clearance requirements of 44 U.S.C. § 3507.
ITEM 1: REPORTS TO STOCKHOLDERS.

Equity Series
Shareholder Expense Example
(unaudited)
As a shareholder of the Series, you incur ongoing costs, including management fees, shareholder service fees and other Series expenses. This example is intended to help you understand your ongoing costs (in dollars) of investing in the Series and to compare these costs with the ongoing costs of investing in other mutual funds.
The example is based on an investment of $1,000 invested at the beginning of the period and held for the entire period (November 1, 2015 to April 30, 2016).
Actual Expenses
The first line of the table below provides information about actual account values and actual expenses. You may use the information in this line, together with the amount you invested, to estimate the expenses that you paid over the period. Simply divide your account value by $1,000 (for example, an $8,600 account value divided by $1,000 = 8.6), then multiply the result by the number in the first line under the heading entitled “Expenses Paid During Period” to estimate the expenses you paid on your account during this period.
Hypothetical Example for Comparison Purposes
The second line of the table below provides information about hypothetical account values and hypothetical expenses based on the Series’ actual expense ratio and an assumed rate of return of 5% per year before expenses, which is not the Series’ actual return. The hypothetical account values and expenses may not be used to estimate the actual ending account balance or expenses you paid during the period. You may use this information to compare the ongoing costs of investing in the Series and other funds. To do so, compare this 5% hypothetical example with the 5% hypothetical examples that appear in the shareholder reports of the other funds.
Please note that the expenses shown in the table are meant to highlight your ongoing costs only and do not reflect any transaction costs, such as sales charges (loads), redemptions fees, or exchange fees that you may incur in other mutual funds. Therefore, the second line of the table is useful in comparing ongoing costs only, and will not help you determine the relative total costs of owning different funds.
| | | | | | |
| | | BEGINNING
ACCOUNT VALUE
11/1/15 | | ENDING
ACCOUNT VALUE
4/30/16 | | EXPENSES PAID
DURING PERIOD*
11/1/15-4/30/16 |
Actual | | $1,000.00 | | $1,029.50 | | $5.30 |
Hypothetical | | | | | | |
(5% return before expenses) | | $1,000.00 | | $1,019.64 | | $5.27 |
*Expenses are equal to the Series’ annualized expense ratio (for the six-month period) of 1.05%, multiplied by the average account value over the period, multiplied by 182/366 (to reflect the one-half year period). The Series’ total return would have been lower had certain expenses not been waived during the period.
1
Equity Series
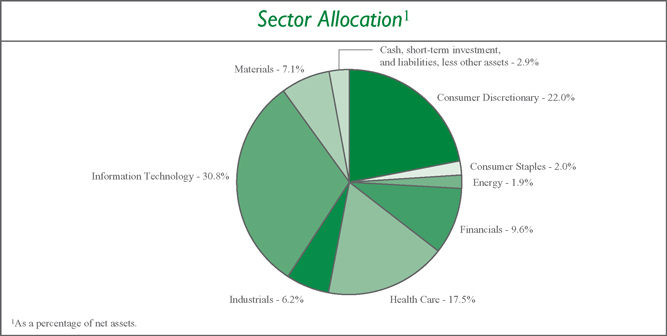
Portfolio Composition as of April 30, 2016
(unaudited)
2
Equity Series
Investment Portfolio - April 30, 2016
(unaudited)
| | | | | | | | |
| | | SHARES | | | VALUE (NOTE 2) | |
| | |
COMMON STOCKS - 97.1% | | | | | | | | |
| | |
Consumer Discretionary - 22.0% | | | | | | | | |
Diversified Consumer Services - 1.5% | | | | | | | | |
Houghton Mifflin Harcourt Co.* | | | 82,760 | | | $ | 1,697,408 | |
| | | | | | | | |
Hotels, Restaurants & Leisure - 2.8% | | | | | | | | |
Jack in the Box, Inc. | | | 8,560 | | | | 578,228 | |
Yum! Brands, Inc. | | | 32,220 | | | | 2,563,423 | |
| | | | | | | | |
| | |
| | | | | | | 3,141,651 | |
| | | | | | | | |
Internet & Catalog Retail - 7.8% | | | | | | | | |
Amazon.com, Inc.* | | | 4,680 | | | | 3,086,881 | |
The Priceline Group, Inc.* | | | 2,550 | | | | 3,426,333 | |
TripAdvisor, Inc.* | | | 35,070 | | | | 2,265,171 | |
| | | | | | | | |
| | |
| | | | | | | 8,778,385 | |
| | | | | | | | |
Media - 9.9% | | | | | | | | |
AMC Networks, Inc. - Class A* | | | 28,520 | | | | 1,860,360 | |
Sinclair Broadcast Group, Inc. - Class A | | | 38,700 | | | | 1,241,109 | |
TEGNA, Inc. | | | 19,120 | | | | 446,643 | |
Time Warner, Inc. | | | 38,520 | | | | 2,894,393 | |
Tribune Media Co. - Class A | | | 59,290 | | | | 2,285,630 | |
Twenty-First Century Fox, Inc. - Class A | | | 80,520 | | | | 2,436,535 | |
| | | | | | | | |
| | |
| | | | | | | 11,164,670 | |
| | | | | | | | |
| | |
Total Consumer Discretionary | | | | | | | 24,782,114 | |
| | | | | | | | |
| | |
Consumer Staples - 2.0% | | | | | | | | |
Beverages - 2.0% | | | | | | | | |
The Coca-Cola Co. | | | 50,430 | | | | 2,259,264 | |
| | | | | | | | |
| | |
Energy - 1.9% | | | | | | | | |
Oil, Gas & Consumable Fuels - 1.9% | | | | | | | | |
Range Resources Corp. | | | 47,220 | | | | 2,082,874 | |
| | | | | | | | |
Financials - 9.6% | | | | | | | | |
Capital Markets - 2.5% | | | | | | | | |
BlackRock, Inc. | | | 7,890 | | | | 2,811,444 | |
| | | | | | | | |
Consumer Finance - 3.6% | | | | | | | | |
SLM Corp.* | | | 255,490 | | | | 1,729,667 | |
Synchrony Financial* | | | 75,780 | | | | 2,316,595 | |
| | | | | | | | |
| | |
| | | | | | | 4,046,262 | |
| | | | | | | | |
Real Estate Investment Trusts (REITS) - 2.0% | | | | | | | | |
Weyerhaeuser Co. | | | 72,200 | | | | 2,319,064 | |
| | | | | | | | |
Real Estate Management & Development - 1.5% | | | | | | | | |
Realogy Holdings Corp.* | | | 46,950 | | | | 1,677,993 | |
| | | | | | | | |
Total Financials | | | | | | | 10,854,763 | |
| | | | | | | | |
The accompanying notes are an integral part of the financial statements.
3
Equity Series
Investment Portfolio - April 30, 2016
(unaudited)
| | | | | | | | |
| | | | | | VALUE | |
| | | SHARES | | | (NOTE 2) | |
| | |
COMMON STOCKS (continued) | | | | | | | | |
| | |
Health Care - 17.5% | | | | | | | | |
Health Care Equipment & Supplies - 4.6% | | | | | | | | |
The Cooper Companies, Inc. | | | 14,880 | | | $ | 2,277,830 | |
Intuitive Surgical, Inc.* | | | 4,590 | | | | 2,874,992 | |
| | | | | | | | |
| | |
| | | | | | | 5,152,822 | |
| | | | | | | | |
Health Care Providers & Services - 5.7% | | | | | | | | |
DaVita HealthCare Partners, Inc.* | | | 46,930 | | | | 3,468,127 | |
Express Scripts Holding Co.* | | | 40,340 | | | | 2,974,268 | |
| | | | | | | | |
| | |
| | | | | | | 6,442,395 | |
| | | | | | | | |
Health Care Technology - 3.2% | | | | | | | | |
Cerner Corp.* | | | 63,420 | | | | 3,560,399 | |
| | | | | | | | |
Life Sciences Tools & Services - 2.0% | | | | | | | | |
Thermo Fisher Scientific, Inc. | | | 15,930 | | | | 2,297,902 | |
| | | | | | | | |
Pharmaceuticals - 2.0% | | | | | | | | |
Johnson & Johnson | | | 20,360 | | | | 2,281,949 | |
| | | | | | | | |
| | |
Total Health Care | | | | | | | 19,735,467 | |
| | | | | | | | |
Industrials - 6.2% | | | | | | | | |
Building Products - 1.0% | | | | | | | | |
Masco Corp. | | | 36,040 | | | | 1,106,788 | |
| | | | | | | | |
Industrial Conglomerates - 3.1% | | | | | | | | |
Danaher Corp. | | | 36,380 | | | | 3,519,765 | |
| | | | | | | | |
Machinery - 2.1% | | | | | | | | |
Flowserve Corp. | | | 49,540 | | | | 2,418,047 | |
| | | | | | | | |
| | |
Total Industrials | | | | | | | 7,044,600 | |
| | | | | | | | |
Information Technology - 30.8% | | | | | | | | |
Electronic Equipment, Instruments & Components - 3.8% | | | | | | | | |
FLIR Systems, Inc. | | | 77,710 | | | | 2,347,619 | |
VeriFone Systems, Inc.* | | | 68,550 | | | | 1,950,933 | |
| | | | | | | | |
| | |
| | | | | | | 4,298,552 | |
| | | | | | | | |
Internet Software & Services - 6.1% | | | | | | | | |
Alphabet, Inc. - Class A* | | | 2,290 | | | | 1,621,045 | |
Alphabet, Inc. - Class C* | | | 2,310 | | | | 1,600,853 | |
Facebook, Inc. - Class A* | | | 30,860 | | | | 3,628,519 | |
| | | | | | | | |
| | |
| | | | | | | 6,850,417 | |
| | | | | | | | |
IT Services - 9.6% | | | | | | | | |
EVERTEC, Inc. | | | 125,800 | | | | 1,694,526 | |
MasterCard, Inc. - Class A | | | 33,050 | | | | 3,205,520 | |
PayPal Holdings, Inc.* | | | 73,560 | | | | 2,882,081 | |
Visa, Inc. - Class A | | | 39,800 | | | | 3,074,152 | |
| | | | | | | | |
| | |
| | | | | | | 10,856,279 | |
| | | | | | | | |
The accompanying notes are an integral part of the financial statements.
4
Equity Series
Investment Portfolio - April 30, 2016
(unaudited)
| | | | | | | | |
| | | | | | VALUE | |
| | | SHARES | | | (NOTE 2) | |
| | |
COMMON STOCKS (continued) | | | | | | | | |
| | |
Information Technology (continued) | | | | | | | | |
Semiconductors & Semiconductor Equipment - 2.4% | | | | | | | | |
QUALCOMM, Inc. | | | 54,780 | | | $ | 2,767,486 | |
| | | | | | | | |
Software - 6.3% | | | | | | | | |
Aspen Technology, Inc.* | | | 62,580 | | | | 2,379,917 | |
Electronic Arts, Inc.* | | | 34,810 | | | | 2,152,999 | |
ServiceNow, Inc.* | | | 36,550 | | | | 2,612,594 | |
| | | | | | | | |
| | |
| | | | | | | 7,145,510 | |
| | | | | | | | |
Technology Hardware, Storage & Peripherals - 2.6% | | | | | | | | |
Apple, Inc. | | | 30,770 | | | | 2,884,380 | |
| | | | | | | | |
| | |
Total Information Technology | | | | | | | 34,802,624 | |
| | | | | | | | |
Materials - 7.1% | | | | | | | | |
Chemicals - 3.9% | | | | | | | | |
Ashland, Inc. | | | 15,150 | | | | 1,690,740 | |
Monsanto Co. | | | 28,750 | | | | 2,693,300 | |
| | | | | | | | |
| | |
| | | | | | | 4,384,040 | |
| | | | | | | | |
Metals & Mining - 3.2% | | | | | | | | |
Alcoa, Inc. | | | 325,140 | | | | 3,631,814 | |
| | | | | | | | |
| | |
Total Materials | | | | | | | 8,015,854 | |
| | | | | | | | |
TOTAL COMMON STOCKS | | | | | | | | |
(Identified Cost $107,439,806) | | | | | | | 109,577,560 | |
| | | | | | | | |
| | |
SHORT-TERM INVESTMENT - 3.3% | | | | | | | | |
Dreyfus Cash Management, Inc. - Institutional Shares1, 0.29% | | | | | | | | |
(Identified Cost $3,757,862) | | | 3,757,862 | | | | 3,757,862 | |
| | | | | | | | |
TOTAL INVESTMENTS - 100.4% | | | | | | | | |
(Identified Cost $111,197,668) | | | | | | | 113,335,422 | |
LIABILITIES, LESS OTHER ASSETS - (0.4%) | | | | | | | (421,080 | ) |
| | | | | | | | |
| | |
NET ASSETS - 100% | | | | | | $ | 112,914,342 | |
| | | | | | | | |
ADR - American Depositary Receipt
*Non-income producing security.
1Rate shown is the current yield as of April 30, 2016.
The Global Industry Classification Standard (GICS) was developed by and is the exclusive property and a service mark of MSCI Inc. (MSCI) and Standard & Poor’s, a division of The McGraw-Hill Companies, Inc. (S&P), and is licensed for use by Manning & Napier when referencing GICS sectors. Neither MSCI, S&P, nor any third party involved in making or compiling the GICS or any GICS classifications makes any express or implied warranties or representations with respect to such standard or classification, nor shall any such party have any liability therefrom.
The accompanying notes are an integral part of the financial statements.
5
Equity Series
Statement of Assets and Liabilities
April 30, 2016 (unaudited)
| | | | |
ASSETS: | | | | |
| |
Investments, at value (identified cost $111,197,668) (Note 2) | | $ | 113,335,422 | |
Receivable for fund shares sold | | | 72,057 | |
Dividends receivable | | | 24,606 | |
Prepaid expenses | | | 3,607 | |
| | | | |
| |
TOTAL ASSETS | | | 113,435,692 | |
| | | | |
| |
LIABILITIES: | | | | |
| |
Accrued transfer agent fees (Note 3) | | | 70,618 | |
Accrued management fees (Note 3) | | | 49,914 | |
Accrued fund accounting and administration fees (Note 3) | | | 26,756 | |
Accrued Directors’ fees (Note 3) | | | 6,007 | |
Accrued Chief Compliance Officer service fees (Note 3) | | | 381 | |
Accrued printing and postage | | | 143,505 | |
Payable for fund shares repurchased | | | 133,775 | |
Accrued custodian fees | | | 48,493 | |
Other payables and accrued expenses | | | 41,901 | |
| | | | |
| |
TOTAL LIABILITIES | | | 521,350 | |
| | | | |
| |
TOTAL NET ASSETS | | $ | 112,914,342 | |
| | | | |
| |
NET ASSETS CONSIST OF: | | | | |
| |
Capital stock | | $ | 95,439 | |
Additional paid-in-capital | | | 103,487,737 | |
Undistributed net investment loss | | | (787,357 | ) |
Accumulated net realized gain on investments | | | 7,980,769 | |
Net unrealized appreciation (depreciation) on investments | | | 2,137,754 | |
| | | | |
| |
TOTAL NET ASSETS | | $ | 112,914,342 | |
| | | | |
NET ASSET VALUE, OFFERING PRICE AND REDEMPTION PRICE PER SHARE - Class A
($112,914,342/9,543,894 shares) | | $ | 11.83 | |
| | | | |
The accompanying notes are an integral part of the financial statements.
6
Equity Series
Statement of Operations
For the Six Months Ended April 30, 2016 (unaudited)
| | | | |
INVESTMENT INCOME: | | | | |
| |
Dividends | | $ | 170,210 | |
| | | | |
| |
EXPENSES: | | | | |
| |
Management fees (Note 3) | | | 892,585 | |
Transfer agent fees (Note 3) | | | 72,896 | |
Fund accounting and administration fees (Note 3) | | | 37,093 | |
Directors’ fees (Note 3) | | | 14,211 | |
Chief Compliance Officer service fees (Note 3) | | | 1,257 | |
Printing and postage fees | | | 82,502 | |
Custodian fees | | | 28,113 | |
Miscellaneous | | | 58,710 | |
| | | | |
| |
Total Expenses | | | 1,187,367 | |
Less reduction of expenses (Note 3) | | | (250,153 | ) |
| | | | |
| |
Net Expenses | | | 937,214 | |
| | | | |
| |
NET INVESTMENT LOSS | | | (767,004 | ) |
| | | | |
| |
REALIZED AND UNREALIZED GAIN (LOSS) ON INVESTMENTS: | | | | |
| |
Net realized gain on investments | | | 12,305,208 | |
Net change in unrealized appreciation (depreciation) on investments | | | (17,667,545 | ) |
| | | | |
| |
NET REALIZED AND UNREALIZED GAIN (LOSS) ON INVESTMENTS | | | (5,362,337 | ) |
| | | | |
| |
NET DECREASE IN NET ASSETS RESULTING FROM OPERATIONS | | $ | (6,129,341 | ) |
| | | | |
The accompanying notes are an integral part of the financial statements.
7
Equity Series
Statements of Changes in Net Assets
| | | | | | | | |
| | | FOR THE SIX MONTHS ENDED 4/30/16 (UNAUDITED) | | | FOR THE YEAR ENDED 10/31/15 | |
INCREASE (DECREASE) IN NET ASSETS: | | | | | | | | |
| | |
OPERATIONS: | | | | | | | | |
Net investment income (loss) | | $ | (767,004 | ) | | $ | 343,865 | |
Net realized gain on investments | | | 12,305,208 | | | | 108,788,624 | |
Net change in unrealized appreciation (depreciation) on investments | | | (17,667,545 | ) | | | (104,920,453 | ) |
| | | | | | | | |
| | |
Net increase (decrease) from operations | | | (6,129,341 | ) | | | 4,212,036 | |
| | | | | | | | |
| | |
DISTRIBUTIONS TO SHAREHOLDERS (Note 8): | | | | | | | | |
| | |
From net investment income | | | (42,667 | ) | | | (246,854 | ) |
From net realized gain on investments | | | (57,461,992 | ) | | | (202,981,217 | ) |
| | | | | | | | |
| | |
Total distributions to shareholders | | | (57,504,659 | ) | | | (203,228,071 | ) |
| | | | | | | | |
| | |
CAPITAL STOCK ISSUED AND REPURCHASED: | | | | | | | | |
| | |
Net decrease from capital share transactions (Note 5) | | | (324,397,877 | ) | | | (590,372,793 | ) |
| | | | | | | | |
| | |
Net decrease in net assets | | | (388,031,877 | ) | | | (789,388,828 | ) |
| | |
NET ASSETS: | | | | | | | | |
| | |
Beginning of period | | | 500,946,219 | | | | 1,290,335,047 | |
| | | | | | | | |
| | |
End of period (including undistributed net investment loss of $787,357 and $22,314, respectively) | | $ | 112,914,342 | | | $ | 500,946,219 | |
| | | | | | | | |
The accompanying notes are an integral part of the financial statements.
8
Equity Series
Financial Highlights
| | | | | | | | | | | | | | | | | | | | | | | | |
| | | FOR THE SIX
MONTHS ENDED 4/30/15 | | | FOR THE YEARS ENDED | |
| | | (UNAUDITED) | | | 10/31/15 | | | 10/31/14 | | | 10/31/13 | | | 10/31/12 | | | 10/31/11 | |
Per share data (for a share outstanding throughout each period): | | | | | | | | | | | | | | | | | | | | | | | | |
Net asset value - Beginning of period | | $ | 16.62 | | | $ | 21.15 | | | $ | 21.60 | | | $ | 19.03 | | | $ | 18.45 | | | $ | 17.91 | |
| | | | | | | | | | | | | | | | | | | | | | | | |
Income (loss) from investment operations: | | | | | | | | | | | | | | | | | | | | | | | | |
Net investment income (loss)1 | | | (0.06 | ) | | | 0.01 | | | | (0.00 | )2 | | | 0.01 | | | | 0.01 | | | | 0.04 | |
Net realized and unrealized gain (loss) on investments | | | 0.26 | | | | (0.42 | ) | | | 2.51 | | | | 5.14 | | | | 1.26 | | | | 0.55 | |
| | | | | | | | | | | | | | | | | | | | | | | | |
| | | | | | |
Total from investment operations | | | 0.20 | | | | (0.41 | ) | | | 2.51 | | | | 5.15 | | | | 1.27 | | | | 0.59 | |
| | | | | | | | | | | | | | | | | | | | | | | | |
| | | | | | |
Less distributions to shareholders: | | | | | | | | | | | | | | | | | | | | | | | | |
From net investment income | | | (0.00 | )2 | | | (0.00 | )2 | | | (0.01 | ) | | | (0.03 | ) | | | (0.04 | ) | | | (0.05 | ) |
From net realized gain on investments | | | (4.99 | ) | | | (4.12 | ) | | | (2.95 | ) | | | (2.55 | ) | | | (0.65 | ) | | | — | |
| | | | | | | | | | | | | | | | | | | | | | | | |
Total distributions to shareholders | | | (4.99 | ) | | | (4.12 | ) | | | (2.96 | ) | | | (2.58 | ) | | | (0.69 | ) | | | (0.05 | ) |
| | | | | | | | | | | | | | | | | | | | | | | | |
| | | | | | |
Net asset value - End of period | | $ | 11.83 | | | $ | 16.62 | | | $ | 21.15 | | | $ | 21.60 | | | $ | 19.03 | | | $ | 18.45 | |
| | | | | | | | | | | | | | | | | | | | | | | | |
| | | | | | |
Net assets - End of period (000’s omitted) | | $ | 112,914 | | | $ | 500,946 | | | $ | 1,290,335 | | | $ | 1,237,520 | | | $ | 1,418,468 | | | $ | 1,925,038 | |
| | | | | | | | | | | | | | | | | | | | | | | | |
Total return3 | | | 2.95 | % | | | (1.46 | %) | | | 13.23 | % | | | 30.61 | % | | | 7.37 | % | | | 3.30 | % |
Ratios (to average net assets)/Supplemental Data: | | | | | | | | | | | | | | | | | | | | | | | | |
Expenses* | | | 1.05 | %4 | | | 1.05 | % | | | 1.05 | % | | | 1.05 | % | | | 1.05 | % | | | 1.05 | % |
Net investment income (loss) | | | (0.86 | %)4 | | | 0.04 | % | | | (0.01 | %) | | | 0.06 | % | | | 0.06 | % | | | 0.24 | % |
Portfolio turnover | | | 21 | % | | | 62 | % | | | 61 | % | | | 52 | % | | | 63 | % | | | 54 | % |
|
| *The investment advisor did not impose all or a portion of its management and/or other fees, and in some years may have paid a portion of the Series’ expenses. If these expenses had been incurred by the Series, the expense ratio (to average net assets) would have increased by the following amounts: | |
| | | 0.28 | %4 | | | 0.03 | % | | | 0.02 | % | | | 0.06 | % | | | 0.05 | % | | | 0.02 | % |
1Calculated based on average shares outstanding during the periods.
2Less than $(0.01).
3Represents aggregate total return for the periods indicated, and assumes reinvestment of all distributions. Total return would have been lower had certain expenses not been waived or reimbursed during the periods. Periods less than one year are not annualized.
4Annualized.
The accompanying notes are an integral part of the financial statements.
9
Equity Series
Notes to Financial Statements
(unaudited)
Equity Series (the “Series”) is a no-load diversified series of Manning & Napier Fund, Inc. (the “Fund”). The Fund is organized in Maryland and is registered under the Investment Company Act of 1940, as amended, as an open-end management investment company.
The Series’ investment objective is to provide long-term growth of capital.
The Fund’s Advisor is Manning & Napier Advisors, LLC (the “Advisor”). Shares of the Series are offered to investors, clients and employees of the Advisor and its affiliates. The total authorized capital stock of the Fund consists of 15 billion shares of common stock each having a par value of $0.01. As of April 30, 2016, 10.5 billion shares have been designated in total among 40 series, of which 200 million have been designated as Equity Series Class A common stock.
| 2. | Significant Accounting Policies |
The following is a summary of significant accounting policies followed by the Series. The Series is an investment company and, accordingly, follows the investment company accounting and reporting guidance of the Financial Accounting Standards Board Accounting Standards Codification Topic 946 - Investment Companies, which is part of accounting principles generally accepted in the United States of America (“GAAP”).
Security Valuation
Portfolio securities, including domestic equities, listed on an exchange other than the NASDAQ Stock Market are valued at the latest quoted sales price of the exchange on which the security is primarily traded. Securities not traded on valuation date or securities not listed on an exchange are valued at the latest quoted bid price provided by the Fund’s pricing service. Securities listed on the NASDAQ Stock Market are valued in accordance with the NASDAQ Official Closing Price.
Short-term investments that mature in sixty days or less may be valued at amortized cost, which approximates fair value. Investments in open-end investment companies are valued at their net asset value per share on valuation date.
Volume and level of activity in established markets for an asset or liability are evaluated to determine whether recent transactions and quoted prices are determinative of fair value. Where there have been significant decreases in volume and level of activity, further analysis and adjustment may be necessary to estimate fair value. The Series measures fair value in these instances by the use of inputs and valuation techniques which may be based upon current market prices of securities that are comparable in coupon, rating, maturity and industry and/or expectation of future cash flows. As a result of trading in relatively thin markets and/or markets that experience significant volatility, the prices used by the Series to value these securities may differ from the value that would be realized if these securities were sold, and the differences could be material.
Securities for which representative valuations or prices are not available from the Series’ pricing service may be valued at fair value as determined in good faith by the Advisor under procedures approved by and under the general supervision and responsibility of the Fund’s Board of Directors (the “Board”). Due to the inherent uncertainty of valuations of such securities, the fair value may differ significantly from the values that would have been used had a ready market for such securities existed. If trading or events occurring after the close of the principal market in which securities are traded are expected to materially affect the value of those securities, then they may be valued at their fair value, taking this trading or these events into account.
Various inputs are used in determining the value of the Series’ assets or liabilities carried at fair value. These inputs are summarized in three broad levels. Level 1 includes quoted prices in active markets for identical assets and liabilities. Level 2 includes other significant observable inputs (including quoted prices for similar securities, interest rates, prepayment speeds, credit risk, etc.). Level 3 includes significant unobservable inputs (including the Series’ own assumptions in determining the fair value of investments). A financial instrument’s level within the fair value hierarchy is based on the lowest level of any input both individually and in aggregate that is significant to the fair value measurement. The inputs or methodology used for valuing securities are not necessarily an indication of the risk associated with investing in those securities.
10
Equity Series
Notes to Financial Statements (continued)
(unaudited)
| 2. | Significant Accounting Policies (continued) |
Security Valuation (continued)
The following is a summary of the valuation levels used for major security types as of April 30, 2016 in valuing the Series’ assets or liabilities carried at fair value:
| | | | | | | | | | | | | | | | |
| DESCRIPTION | | TOTAL | | | LEVEL 1 | | | LEVEL 2 | | | LEVEL 3 | |
Assets: | | | | | | | | | | | | | | | | |
Equity securities: | | | | | | | | | | | | | | | | |
Consumer Discretionary | | $ | 24,782,114 | | | $ | 24,782,114 | | | $ | — | | | $ | — | |
Consumer Staples | | | 2,259,264 | | | | 2,259,264 | | | | — | | | | — | |
Energy | | | 2,082,874 | | | | 2,082,874 | | | | — | | | | — | |
Financials | | | 10,854,763 | | | | 10,854,763 | | | | — | | | | — | |
Health Care | | | 19,735,467 | | | | 19,735,467 | | | | — | | | | — | |
Industrials | | | 7,044,600 | | | | 7,044,600 | | | | — | | | | — | |
Information Technology | | | 34,802,624 | | | | 34,802,624 | | | | — | | | | — | |
Materials | | | 8,015,854 | | | | 8,015,854 | | | | — | | | | — | |
Mutual Fund | | | 3,757,862 | | | | 3,757,862 | | | | — | | | | — | |
| | | | | | | | | | | | | | | | |
Total assets | | $ | 113,335,422 | | | $ | 113,335,422 | | | $ | — | | | $ | — | |
| | | | | | | | | | | | | | | | |
There were no Level 2 or Level 3 securities held by the Series as of October 31, 2015 or April 30, 2016.
The Fund’s policy is to recognize transfers in and transfers out of the valuation levels as of the beginning of the reporting period. There were no transfers between Level 1 and Level 2 during the six months ended April 30, 2016.
Security Transactions, Investment Income and Expenses
Security transactions are accounted for on trade date. Dividend income is recorded on the ex-dividend date, except that if the ex-dividend date has passed, certain dividends from foreign securities are recorded as soon as the Series is informed of the ex-dividend date. Non-cash dividends, if any, are recorded at the fair value of the securities received. Interest income, including amortization of premium and accretion of discounts using the effective interest method, is earned from settlement date and accrued daily.
Expenses are recorded on an accrual basis. Most expenses of the Fund can be attributed to a specific series. Expenses which cannot be directly attributed are apportioned among the series in the Fund in such a manner as deemed equitable by the Fund’s Board, taking into consideration, among other things, the nature and type of expense.
The Series uses the identified cost method for determining realized gain or loss on investments for both financial statement and federal income tax reporting purposes.
Federal Taxes
The Series’ policy is to comply with the provisions of the Internal Revenue Code applicable to regulated investment companies. The Series is not subject to federal income tax or excise tax to the extent that the Series distributes to shareholders each year its taxable income, including any net realized gains on investments, in accordance with requirements of the Internal Revenue Code. Accordingly, no provision for federal income tax or excise tax has been made in the financial statements.
Management evaluates its tax positions to determine if the tax positions taken meet the minimum recognition threshold in connection with accounting for uncertainties in income tax positions taken or expected to be taken for the purposes of measuring and recognizing tax liabilities in the financial statements. Recognition of tax benefits of an uncertain tax position is required only when the position is “more likely than not” to be sustained assuming examination by taxing authorities. At April 30, 2016, the Series has recorded no liability for net unrecognized tax benefits relating to uncertain income tax positions taken or expected to be taken in future tax returns.
11
Equity Series
Notes to Financial Statements (continued)
(unaudited)
| 2. | Significant Accounting Policies (continued) |
Federal Taxes (continued)
The Series files income tax returns in the U.S. federal jurisdiction, various states and foreign jurisdictions, as required. No income tax returns are currently under investigation. The statute of limitations on the Series’ tax returns remains open for the years ended October 31, 2012 through October 31, 2015. The Series is not aware of any tax positions for which it is reasonably possible that the total amounts of unrecognized tax benefits will significantly change in the next twelve months.
Foreign Taxes
Based on the Series’ understanding of the tax rules and rates related to income, gains and currency purchase/repatriation transactions for foreign jurisdictions in which it invests, the Series will provide for foreign taxes, and where appropriate, deferred foreign tax.
Distributions of Income and Gains
Distributions to shareholders of net investment income and net realized gains are made annually. An additional distribution may be necessary to avoid taxation of the Series. Distributions are recorded on the ex-dividend date.
Indemnifications
The Fund’s organizational documents provide former and current directors and officers with a limited indemnification against liabilities arising in connection with the performance of their duties to the Fund. In the normal course of business, the Fund may also enter into contracts that provide general indemnifications. The Fund’s maximum exposure under these arrangements is unknown as this would be dependent on future claims that may be made against the Fund. The risk of material loss from such claims is considered remote.
Other
The preparation of financial statements in conformity with GAAP requires management to make estimates and assumptions that affect the reported amounts of assets and liabilities and the disclosure of contingent assets and liabilities at the date of the financial statements and the reported amounts of income and expenses during the reporting period. Actual results could differ from those estimates.
| 3. | Transactions with Affiliates |
The Fund has an Investment Advisory Agreement (the “Agreement”) with the Advisor, for which the Series pays a fee, computed daily and payable monthly, at an annual rate of 1.00% of the Series’ average daily net assets.
Under the Agreement, personnel of the Advisor provide the Series with advice and assistance in the choice of investments and the execution of securities transactions, and otherwise maintain the Series’ organization. The Advisor also provides the Fund with necessary office space and fund administration and support services. The salaries of all officers of the Fund (except a percentage of the Fund’s Chief Compliance Officer’s salary, which is paid by the Fund), and of all Directors who are “affiliated persons” of the Fund, or of the Advisor, and all personnel of the Fund, or of the Advisor, performing services relating to research, statistical and investment activities, are paid by the Advisor. Each “non-affiliated” Director receives an annual stipend, which is allocated among all the active series of the Fund. In addition, these Directors also receive a fee per Board meeting attended plus a fee for each committee meeting attended and are reimbursed for travel and other out-of-pocket expenses incurred by them in connection with attending such meetings. The Fund also has an Audit Committee Chair, who receives an additional annual stipend for this role.
The Advisor has contractually agreed, until at least February 28, 2017, to waive its management fee and, if necessary, pay other operating expenses of the Series in order to maintain total direct annual fund operating expenses for the Series at no more than 1.05% of average daily net assets each year. Accordingly, the Advisor waived fees of $250,153 for the six months ended April 30, 2016, which is included as a reduction of expenses on the Statement of Operations. The Advisor is not eligible to recoup any expenses that have been waived or reimbursed in prior years.
Manning & Napier Investor Services, Inc., a registered broker-dealer affiliate of the Advisor, acts as distributor for the Fund’s shares. The services of Manning & Napier Investor Services, Inc. are provided at no additional cost to the Series.
12
Equity Series
Notes to Financial Statements (continued)
(unaudited)
| 3. | Transactions with Affiliates (continued) |
Pursuant to a master services agreement dated November 1, 2014, the Fund pays the Advisor an annual fee related to fund accounting and administration of 0.0085% on the first $25 billion of average daily net assets (excluding Target Series and Strategic Income Series); 0.0075% on the next $15 billion of average daily net assets (excluding Target Series and Strategic Income Series); and 0.0065% of the average daily net assets in excess of $40 billion (excluding Target Series and Strategic Income Series); plus a base fee of $30,400 per series. Transfer agent fees are charged to the Fund on a per account basis. Additionally, certain transaction and out-of-pocket expenses, including charges for reporting relating to the Fund’s compliance program, are charged. The Advisor has agreements with BNY Mellon Investment Servicing (U.S.) Inc. (“BNY”) under which BNY serves as sub-accountant services agent and sub-transfer agent.
Expenses not directly attributable to a series are allocated based on each series’ relative net assets or number of accounts, depending on the expense.
| 4. | Purchases and Sales of Securities |
For the six months ended April 30, 2016, purchases and sales of securities, other than U.S. Government securities and short-term securities, were $39,739,625 and $410,446,285, respectively. There were no purchases or sales of U.S. Government securities.
| 5. | Capital Stock Transactions |
Transactions in shares of Equity Series were:
| | | | | | | | | | | | | | | | |
| | | FOR THE SIX MONTHS ENDED 4/30/16 | | | FOR THE YEAR ENDED 10/31/15 | |
| | | SHARES | | | AMOUNT | | | SHARES | | | AMOUNT | |
Sold | | | 933,574 | | | $ | 11,678,036 | | | | 7,560,319 | | | $ | 132,732,396 | |
Reinvested | | | 4,999,943 | | | | 55,867,602 | | | | 12,219,383 | | | | 198,472,048 | |
Repurchased | | | (26,524,446 | ) | | | (391,943,515 | ) | | | (50,651,323 | ) | | | (921,577,237 | ) |
| | | | | | | | | | | | | | | | |
Total | | | (20,590,929 | ) | | $ | (324,397,877 | ) | | | (30,871,621 | ) | | $ | (590,372,793 | ) |
| | | | | | | | | | | | | | | | |
At April 30, 2016, the retirement plan of the Advisor and its affiliates owned 505,774 shares of the Series (5.3% of shares outstanding) valued at $5,983,306.
The Series may trade in instruments including written and purchased options, forward foreign currency exchange contracts and futures contracts and other derivatives in the normal course of investing activities to assist in managing exposure to various market risks. The Series may be subject to various elements of risk, which may involve, to a varying degree, elements of risk in excess of the amounts recognized for financial statement purposes. These risks include: the risk that changes in the value of a derivative may not correlate perfectly with the underlying asset, rate or index; counterparty credit risk related to over the counter derivative counterparties’ failure to perform under contract terms; liquidity risk related to the lack of a liquid market for these contracts allowing the fund to close out its position(s); and documentation risk relating to disagreement over contract terms. No such investments were held by the Series as of April 30, 2016.
Investing in securities of foreign companies and foreign governments involves special risks and considerations not typically associated with investing in securities of domestic companies and the U.S. Government. These risks include revaluation of currencies and future adverse political and economic developments. Moreover, securities of foreign companies and foreign governments and their markets may be less liquid and their prices more volatile than those of comparable domestic companies and the U.S. Government.
13
Equity Series
Notes to Financial Statements (continued)
(unaudited)
| 8. | Federal Income Tax Information |
The amount and characterization of certain income and capital gains to be distributed are determined in accordance with federal income tax regulations, which may differ from GAAP. The Series may periodically make reclassifications among its capital accounts to reflect income and gains available for distribution (or available capital loss carryovers) under income tax regulations, without impacting the Series’ net asset value. Any such reclassifications are not reflected in the financial highlights.
The final determination of the tax character of current year distributions will be made at the conclusion of the fiscal year. The tax character of distributions paid for the year ended October 31, 2015, were as follows:
| | | | |
Ordinary income | | $ | 49,123,867 | |
Long-term capital gains | | | 154,104,204 | |
At April 30, 2016, the identified cost of investments for federal income tax purposes, the resulting gross unrealized appreciation and depreciation, and the net unrealized appreciation were as follows:
| | | | |
Cost for federal income tax purposes | | $ | 113,158,801 | |
Unrealized appreciation | | | 6,683,542 | |
Unrealized depreciation | | | (6,506,921 | ) |
| | | | |
Net unrealized appreciation | | $ | 176,621 | |
| | | | |
14
Equity Series
Renewal of Investment Advisory Agreement
(unaudited)
At the Manning & Napier Fund, Inc. (the “Fund”) Board of Directors’ (the “Board”) meeting, held on November 17, 2015, the Investment Advisory Agreement (the “Agreement”) between the Fund and Manning & Napier Advisors, LLC (the “Advisor”) was considered by the Board for renewal. In connection with the decision whether to renew the Agreement, a variety of material was prepared for and considered by the Board.
Representatives of the Advisor attended the meeting and presented additional oral and written information to the Board to assist the Board in its considerations. The discussion immediately below outlines the materials and information presented to the Board in connection with the Board’s 2015 Annual consideration of the Agreement and the conclusions made by the Directors when determining to continue the Agreement.
| | • | | The Board considered the services provided by the Advisor under the Agreement including, among others: deciding what securities to purchase and sell for each Series; arranging for the purchase and sale of such securities by placing orders with broker-dealers; administering the affairs of the Fund (including the books and records of the Fund not maintained by third party service providers such as the custodian or sub-transfer agent); arranging for the insurance coverage for the Fund; and supervising the preparation of tax returns, SEC filings (including registration statements) and reports to shareholders for the Fund. The Board also considered the nature and quality of such services provided under the Agreement in light of the Advisor’s services provided to the Fund for 29 years. The Board discussed the quality of these services with representatives from the Advisor and concluded that the Advisor was performing its services to the Fund required under the Agreement in a reasonable manner. |
| | • | | The Board considered the performance of each Series since its inception, as well as performance over multiple time periods. Performance for one or more of the following time periods was considered as applicable to the Series’ inception date: inception, three year, five year, ten year, and current market cycle. A market cycle includes periods of both rising and falling markets. Returns for established benchmark indices for each Series were provided. In addition, the Board considered a number of other factors relevant to performance at the meeting (and considers on a quarterly basis) including: a peer group performance analysis consisting of Morningstar universes of mutual funds with similar investment objectives, investment performance of core products, product offerings, performance on an aggregate basis vs. performance over reasonable time periods and the Advisor’s investment process. The Directors acknowledged the challenging performance and discussed the investment process of the Advisor. The Directors confirmed that qualitative factors such as the Advisor’s investment process, including recent enhancements, were an important subset to be considered as part of their consideration of performance. The Board discussed the performance with representatives from the Advisor and concluded that the investment performance of each of the Fund’s Series was reasonable based on the Series’ actual performance and comparative performance, especially for those series with performance over the current market cycle. |
| | • | | The Board considered the costs of the Advisor’s services and the profits of the Advisor as they relate to the Advisor’s services to the Fund under the Agreement. In reviewing the Advisor’s costs and profits, the Board discussed the Advisor’s revenues generated from the Fund (on both an actual and adjusted basis) and its expenses associated with providing the services under the Agreement. In addition, the Board reviewed the Advisor’s expenses associated with Fund activities outside of the Agreement (such as expense reimbursements pursuant to expense caps and payments made by the Advisor to third party platforms on which shares of the Fund are available for purchase). It was noted by representatives of the Advisor that 22 of the 36 active Series of the Fund are currently experiencing expenses above the capped expense ratios, and thus the Advisor is incurring those expenses over the cap. After discussing the above costs and profits, the Board concluded that the Advisor’s profitability relating to its services provided under the Agreement was reasonable. |
| | • | | The Board considered the fees and expenses of the various Series of the Fund. The Advisor presented the advisory fees and total expenses for each Series, including the advisory fee adjusted for any expense waivers or reimbursements (either contractual or voluntary) paid by the Advisor. The advisory fees and expense ratios of each Series were compared to an average (on both a mean and median basis) of similar funds as disclosed on the Morningstar database. Representatives of the Advisor discussed with the Board the levels of its advisory fee for each Series of the Fund and as compared to the median and mean advisory fees for similar funds as listed on Morningstar. Expense ratios for every Series, except the Tax Managed Series, Equity Income Class S, High Yield Bond Class S, Pro-Blend Series Classes C and R, and Target Series’ Classes R and K, are lower than, or substantially similar to the Morningstar mean and median reported total expense ratio. |
15
Equity Series
Renewal of Investment Advisory Agreement
(unaudited)
| | The higher than mean and median total expense ratios for Classes C and R reflect higher distribution, marketing and shareholder service fees payable to broker-dealers through a 100bp 12b-1 fee for Class C and a 50bp 12b-1 fee for Class R. Based on their review of the information provided, the Board concluded that the fees and expenses of each Series of the Fund were reasonable on a comparative basis. |
| | • | | The Board also considered the other benefits the Advisor derives from its relationship with the Fund. Such other benefits include certain research services provided by soft dollars. The Board reviewed the broker-dealers who provided research to the Advisor and the products and services paid for, in whole or in part, using soft dollar commissions. Given the level of soft dollar transactions involving the Fund, the Board concluded that these additional benefits to the Advisor were reasonable. |
| | • | | In addition to the factors described above, the Board considered the Advisor’s personnel, investment strategies, policies and procedures relating to compliance with personal securities transactions, reputation, expertise and resources in domestic and foreign financial markets. The Board concluded that these factors support the conclusion that the Advisor performs its services in a reasonable manner. |
| | • | | The Board then considered economies of scale and concluded that the current fee schedule to the advisory agreement remained reasonable given the multiple uses of the Fund (for the Advisor’s discretionary investment account clients in addition to direct investors), the current profitability of the Advisor’s services to the Fund under the Agreement, the number of newly established series of the Fund and the overall size of the Fund complex. |
Based on the Board’s deliberations and their evaluation of the information described above, the Board, including a majority of Directors that are not “interested persons” as defined in the Investment Company Act of 1940, concluded that the compensation under the Agreement was fair and reasonable in light of the services and expenses and such other matters as the Directors considered to be relevant in the exercise of their reasonable judgment. Accordingly, the Board approved the renewal of the Agreement. In the course of their deliberations, the Directors did not identify any particular information that was all important or controlling.
16
{This page intentionally left blank}
17
Equity Series
Literature Requests
(unaudited)
Proxy Voting Policies and Procedures
A description of the policies and procedures that the Fund uses to determine how to vote proxies relating to portfolio securities is available, without charge, upon request:
| | | | |
| By phone | | 1-800-466-3863 | | |
| On the Securities and Exchange | | | | |
| Commission’s (SEC) web site | | http://www.sec.gov | | |
Proxy Voting Record
Information regarding how the Fund voted proxies relating to portfolio securities during the most recent 12-month period ended June 30th is available, without charge, upon request:
| | | | |
| By phone | | 1-800-466-3863 | | |
| On the SEC’s web site | | http://www.sec.gov | | |
Quarterly Portfolio Holdings
The Series’ complete schedule of portfolio holdings for the 1st and 3rd quarters of each fiscal year are provided on Form N-Q, and are available, without charge, upon request:
| | | | |
| By phone | | 1-800-466-3863 | | |
| On the SEC’s web site | | http://www.sec.gov | | |
The Series’ Form N-Q may be reviewed and copied at the SEC’s Public Reference Room in Washington, D.C. Information on the operation of the Public Reference Room may be obtained by calling 1-800-SEC-0330.
Prospectus and Statement of Additional Information (SAI)
For more information about any of the Manning & Napier Fund, Inc. Series, you may obtain a prospectus and SAI at www.manning-napier.com or by calling (800) 466-3863. Before investing, carefully consider the objectives, risks, charges and expenses of the investment and read the prospectus carefully as it contains this and other information about the investment company. In addition, this information can be found on the SEC’s web site, http://www.sec.gov.
Additional information available at www.manning-napier.com
1. Fund Holdings - Month-End
2. Fund Holdings - Quarter-End
3. Shareholder Report - Annual
4. Shareholder Report - Semi-Annual
The Fund also offers electronic notification or “e-delivery” when certain documents are available on-line to be downloaded or reviewed. Direct shareholders can elect to receive electronic notification when shareholder reports, prospectus updates, and/or statements are available. If you do not currently have on-line access to your account, you can establish access by going to www.manning-napier.com, click on “Login” in the top corner of the page, and follow the prompts to self-enroll. Once enrolled, you can set your electronic notification preferences by clicking on the Account Options tab located within the green toolbar and then select E-Delivery Option. Should you have any questions on either how to establish on-line access or how to update your account settings, please contact Investor Services at 1-800-466-3863.
The Manning & Napier Fund, Inc. is managed by Manning & Napier Advisors, LLC. Manning & Napier Investor Services, Inc., an affiliate of Manning & Napier Advisors, LLC, is the distributor of the Fund shares.
MNEQY-04/16-SAR

Tax Managed Series
Shareholder Expense Example
(unaudited)
As a shareholder of the Series, you incur ongoing costs, including management fees, shareholder service fees and other Series expenses. This example is intended to help you understand your ongoing costs (in dollars) of investing in the Series and to compare these costs with the ongoing costs of investing in other mutual funds.
The example is based on an investment of $1,000 invested at the beginning of the period and held for the entire period (November 1, 2015 to April 30, 2016).
Actual Expenses
The first line of the table below provides information about actual account values and actual expenses. You may use the information in this line, together with the amount you invested, to estimate the expenses that you paid over the period. Simply divide your account value by $1,000 (for example, an $8,600 account value divided by $1,000 = 8.6), then multiply the result by the number in the first line under the heading entitled “Expenses Paid During Period” to estimate the expenses you paid on your account during this period.
Hypothetical Example for Comparison Purposes
The second line of the table below provides information about hypothetical account values and hypothetical expenses based on the Series’ actual expense ratio and an assumed rate of return of 5% per year before expenses, which is not the Series’ actual return. The hypothetical account values and expenses may not be used to estimate the actual ending account balance or expenses you paid during the period. You may use this information to compare the ongoing costs of investing in the Series and other funds. To do so, compare this 5% hypothetical example with the 5% hypothetical examples that appear in the shareholder reports of the other funds.
Please note that the expenses shown in the table are meant to highlight your ongoing costs only and do not reflect any transaction costs, such as sales charges (loads), redemptions fees, or exchange fees that you may incur in other mutual funds. Therefore, the second line of the table is useful in comparing ongoing costs only, and will not help you determine the relative total costs of owning different funds.
| | | | | | |
| | | BEGINNING
ACCOUNT VALUE
11/1/15 | | ENDING
ACCOUNT VALUE
4/30/16 | | EXPENSES PAID
DURING PERIOD*
11/1/15-4/30/16 |
Actual | | $1,000.00 | | $1,012.60 | | $6.00 |
Hypothetical | | | | | | |
(5% return before expenses) | | $1,000.00 | | $1,018.90 | | $6.02 |
*Expenses are equal to the Series’ annualized expense ratio (for the six-month period) of 1.20%, multiplied by the average account value over the period, multiplied by 182/366 (to reflect the one-half year period). The Series’ total return would have been lower had certain expenses not been waived during the period.
1
Tax Managed Series
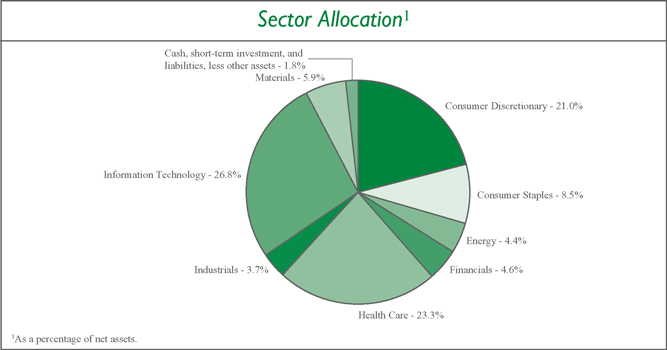
Portfolio Composition as of April 30, 2016
(unaudited)
2
Tax Managed Series
Investment Portfolio - April 30, 2016
(unaudited)
| | | | | | | | |
| | | SHARES | | | VALUE
(NOTE 2) | |
| | |
COMMON STOCKS - 98.2% | | | | | | | | |
| | |
Consumer Discretionary - 21.0% | | | | | | | | |
Diversified Consumer Services - 1.4% | | | | | | | | |
Houghton Mifflin Harcourt Co.* | | | 11,430 | | | $ | 234,429 | |
| | | | | | | | |
Hotels, Restaurants & Leisure - 1.9% | | | | | | | | |
Yum! Brands, Inc. | | | 4,100 | | | | 326,196 | |
| | | | | | | | |
Internet & Catalog Retail - 5.4% | | | | | | | | |
Amazon.com, Inc.* | | | 360 | | | | 237,452 | |
The Priceline Group, Inc.* | | | 340 | | | | 456,844 | |
TripAdvisor, Inc.* | | | 3,180 | | | | 205,396 | |
| | | | | | | | |
| | |
| | | | | | | 899,692 | |
| | | | | | | | |
Media - 10.6% | | | | | | | | |
AMC Networks, Inc. - Class A* | | | 3,760 | | | | 245,265 | |
Liberty Global plc - Class A - ADR (United Kingdom)* | | | 2,850 | | | | 107,530 | |
Sinclair Broadcast Group, Inc. - Class A | | | 3,370 | | | | 108,076 | |
TEGNA, Inc. | | | 2,300 | | | | 53,728 | |
Time Warner, Inc. | | | 5,880 | | | | 441,823 | |
Tribune Media Co. - Class A | | | 9,990 | | | | 385,114 | |
Twenty-First Century Fox, Inc. - Class A | | | 13,690 | | | | 414,260 | |
| | | | | | | | |
| | |
| | | | | | | 1,755,796 | |
| | | | | | | | |
Textiles, Apparel & Luxury Goods - 1.7% | | | | | | | | |
lululemon athletica, Inc.* | | | 4,220 | | | | 276,621 | |
| | | | | | | | |
| | |
Total Consumer Discretionary | | | | | | | 3,492,734 | |
| | | | | | | | |
| | |
Consumer Staples - 8.5% | | | | | | | | |
Beverages - 5.0% | | | | | | | | |
Anheuser-Busch InBev S.A./N.V. (Belgium)1 | | | 2,510 | | | | 311,377 | |
The Coca-Cola Co. | | | 5,210 | | | | 233,408 | |
Diageo plc (United Kingdom)1 | | | 10,300 | | | | 278,473 | |
| | | | | | | | |
| | |
| | | | | | | 823,258 | |
| | | | | | | | |
Food Products - 1.1% | | | | | | | | |
Nestle S.A. (Switzerland)1 | | | 2,550 | | | | 190,330 | |
| | | | | | | | |
Personal Products - 2.4% | | | | | | | | |
Beiersdorf AG (Germany)1 | | | 2,090 | | | | 187,673 | |
Unilever plc - ADR (United Kingdom) | | | 4,650 | | | | 208,599 | |
| | | | | | | | |
| | |
| | | | | | | 396,272 | |
| | | | | | | | |
| | |
Total Consumer Staples | | | | | | | 1,409,860 | |
| | | | | | | | |
Energy - 4.4% | | | | | | | | |
Energy Equipment & Services - 2.1% | | | | | | | | |
Schlumberger Ltd. | | | 4,260 | | | | 342,248 | |
| | | | | | | | |
The accompanying notes are an integral part of the financial statements.
3
Tax Managed Series
Investment Portfolio - April 30, 2016
(unaudited)
| | | | | | | | |
| | | SHARES | | | VALUE (NOTE 2) | |
| | |
COMMON STOCKS (continued) | | | | | | | | |
| | |
Energy (continued) | | | | | | | | |
Oil, Gas & Consumable Fuels - 2.3% | | | | | | | | |
Range Resources Corp. | | | 8,750 | | | $ | 385,962 | |
| | | | | | | | |
| | |
Total Energy | | | | | | | 728,210 | |
| | | | | | | | |
Financials - 4.6% | | | | | | | | |
Consumer Finance - 2.0% | | | | | | | | |
SLM Corp.* | | | 27,870 | | | | 188,680 | |
Synchrony Financial* | | | 4,960 | | | | 151,627 | |
| | | | | | | | |
| | |
| | | | | | | 340,307 | |
| | | | | | | | |
Real Estate Investment Trusts (REITS) - 1.9% | | | | | | | | |
Weyerhaeuser Co | | | 9,880 | | | | 317,346 | |
| | | | | | | | |
Real Estate Management & Development - 0.7% | | | | | | | | |
Realogy Holdings Corp.* | | | 3,030 | | | | 108,292 | |
| | | | | | | | |
| | |
Total Financials | | | | | | | 765,945 | |
| | | | | | | | |
Health Care - 23.3% | | | | | | | | |
Health Care Equipment & Supplies - 7.0% | | | | | | | | |
The Cooper Companies, Inc. | | | 2,030 | | | | 310,752 | |
Intuitive Surgical, Inc.* | | | 790 | | | | 494,824 | |
Medtronic plc | | | 4,490 | | | | 355,384 | |
| | | | | | | | |
| | |
| | | | | | | 1,160,960 | |
| | | | | | | | |
Health Care Providers & Services - 5.7% | | | | | | | | |
DaVita HealthCare Partners, Inc.* | | | 4,730 | | | | 349,547 | |
Express Scripts Holding Co.* | | | 5,090 | | | | 375,286 | |
Fresenius Medical Care AG & Co. KGaA (Germany)1 | | | 2,500 | | | | 217,594 | |
| | | | | | | | |
| | |
| | | | | | | 942,427 | |
| | | | | | | | |
Health Care Technology - 2.6% | | | | | | | | |
Cerner Corp.* | | | 7,570 | | | | 424,980 | |
| | | | | | | | |
Life Sciences Tools & Services - 3.1% | | | | | | | | |
QIAGEN N.V.* | | | 9,240 | | | | 207,530 | |
Thermo Fisher Scientific, Inc. | | | 2,130 | | | | 307,252 | |
| | | | | | | | |
| | |
| | | | | | | 514,782 | |
| | | | | | | | |
Pharmaceuticals - 4.9% | | | | | | | | |
Johnson & Johnson | | | 3,320 | | | | 372,106 | |
Novartis AG - ADR (Switzerland) | | | 2,320 | | | | 176,250 | |
Perrigo Co. plc | | | 2,780 | | | | 268,743 | |
| | | | | | | | |
| | |
| | | | | | | 817,099 | |
| | | | | | | | |
| | |
Total Health Care | | | | | | | 3,860,248 | |
| | | | | | | | |
Industrials - 3.7% | | | | | | | | |
Building Products - 1.7% | | | | | | | | |
Masco Corp. | | | 9,280 | | | | 284,989 | |
| | | | | | | | |
The accompanying notes are an integral part of the financial statements.
4
Tax Managed Series
Investment Portfolio - April 30, 2016
(unaudited)
| | | | | | | | |
| | | SHARES | | | VALUE
(NOTE 2) | |
| | |
COMMON STOCKS (continued) | | | | | | | | |
| | |
Industrials (continued) | | | | | | | | |
Industrial Conglomerates - 2.0% | | | | | | | | |
Danaher Corp. | | | 3,430 | | | $ | 331,853 | |
| | | | | | | | |
| | |
Total Industrials | | | | | | | 616,842 | |
| | | | | | | | |
Information Technology - 26.8% | | | | | | | | |
Electronic Equipment, Instruments & Components - 3.2% | | | | | | | | |
FLIR Systems, Inc. | | | 10,870 | | | | 328,383 | |
VeriFone Systems, Inc.* | | | 7,080 | | | | 201,497 | |
| | | | | | | | |
| | |
| | | | | | | 529,880 | |
| | | | | | | | |
Internet Software & Services - 7.3% | | | | | | | | |
Alphabet, Inc. - Class A* | | | 260 | | | | 184,049 | |
Alphabet, Inc. - Class C* | | | 290 | | | | 200,973 | |
Facebook, Inc. - Class A* | | | 5,400 | | | | 634,932 | |
Tencent Holdings Ltd. - Class H (China)1 | | | 9,200 | | | | 187,205 | |
| | | | | | | | |
| | |
| | | | | | | 1,207,159 | |
| | | | | | | | |
IT Services - 7.1% | | | | | | | | |
Amdocs Ltd. - ADR | | | 3,150 | | | | 178,101 | |
MasterCard, Inc. - Class A | | | 4,650 | | | | 451,004 | |
PayPal Holdings, Inc.* | | | 8,280 | | | | 324,410 | |
Visa, Inc. - Class A | | | 3,020 | | | | 233,265 | |
| | | | | | | | |
| | |
| | | | | | | 1,186,780 | |
| | | | | | | | |
Semiconductors & Semiconductor Equipment - 2.5% | | | | | | | | |
QUALCOMM, Inc. | | | 8,060 | | | | 407,191 | |
| | | | | | | | |
Software - 4.4% | | | | | | | | |
Aspen Technology, Inc.* | | | 3,770 | | | | 143,373 | |
Electronic Arts, Inc.* | | | 3,660 | | | | 226,371 | |
ServiceNow, Inc.* | | | 5,150 | | | | 368,122 | |
| | | | | | | | |
| | |
| | | | | | | 737,866 | |
| | | | | | | | |
Technology Hardware, Storage & Peripherals - 2.3% | | | | | | | | |
Apple, Inc. | | | 3,990 | | | | 374,023 | |
| | | | | | | | |
| | |
Total Information Technology | | | | | | | 4,442,899 | |
| | | | | | | | |
Materials - 5.9% | | | | | | | | |
Chemicals - 4.0% | | | | | | | | |
Ashland, Inc. | | | 1,910 | | | | 213,156 | |
Monsanto Co. | | | 4,810 | | | | 450,601 | |
| | | | | | | | |
| | |
| | | | | | | 663,757 | |
| | | | | | | | |
The accompanying notes are an integral part of the financial statements.
5
Tax Managed Series
Investment Portfolio - April 30, 2016
(unaudited)
| | | | | | | | |
| | | | | | VALUE | |
| | | SHARES | | | (NOTE 2) | |
| | |
COMMON STOCKS (continued) | | | | | | | | |
| | |
Materials (continued) | | | | | | | | |
Metals & Mining - 1.9% | | | | | | | | |
Alcoa, Inc. | | | 27,710 | | | $ | 309,521 | |
| | | | | | | | |
| | |
Total Materials | | | | | | | 973,278 | |
| | | | | | | | |
| | |
TOTAL COMMON STOCKS | | | | | | | | |
(Identified Cost $13,721,415) | | | | | | | 16,290,016 | |
| | | | | | | | |
| | |
SHORT-TERM INVESTMENT - 2.0% | | | | | | | | |
Dreyfus Cash Management, Inc. - Institutional Shares2, 0.29% | | | | | | | | |
(Identified Cost $335,999) | | | 335,999 | | | | 335,999 | |
| | | | | | | | |
TOTAL INVESTMENTS - 100.2% | | | | | | | | |
(Identified Cost $14,057,414) | | | | | | | 16,626,015 | |
LIABILITIES, LESS OTHER ASSETS - (0.2%) | | | | | | | (35,401 | ) |
| | | | | | | | |
NET ASSETS - 100% | | | | | | $ | 16,590,614 | |
| | | | | | | | |
ADR - American Depositary Receipt
*Non-income producing security.
1A factor from a third party vendor was applied to determine the security’s fair value following the close of local trading.
2Rate shown is the current yield as of April 30, 2016.
The Global Industry Classification Standard (GICS) was developed by and is the exclusive property and a service mark of MSCI Inc. (MSCI) and Standard & Poor’s, a division of The McGraw-Hill Companies, Inc. (S&P), and is licensed for use by Manning & Napier when referencing GICS sectors. Neither MSCI, S&P, nor any third party involved in making or compiling the GICS or any GICS classifications makes any express or implied warranties or representations with respect to such standard or classification, nor shall any such party have any liability therefrom.
The accompanying notes are an integral part of the financial statements.
6
Tax Managed Series
Statement of Assets and Liabilities
April 30, 2016 (unaudited)
| | | | |
| |
ASSETS: | | | | |
| |
Investments, at value (identified cost $14,057,414) (Note 2) | | $ | 16,626,015 | |
Foreign tax reclaims receivable | | | 16,357 | |
Dividends receivable | | | 9,544 | |
Prepaid expenses | | | 8,845 | |
| | | | |
| |
TOTAL ASSETS | | | 16,660,761 | |
| | | | |
| |
LIABILITIES: | | | | |
| |
Accrued management fees (Note 3) | | | 7,025 | |
Accrued fund accounting and administration fees (Note 3) | | | 6,125 | |
Accrued transfer agent fees (Note 3) | | | 2,142 | |
Accrued Chief Compliance Officer service fees (Note 3) | | | 381 | |
Payable for securities purchased | | | 20,855 | |
Audit fees payable | | | 16,404 | |
Accrued printing and postage fees | | | 10,330 | |
Other payables and accrued expenses | | | 6,885 | |
| | | | |
| |
TOTAL LIABILITIES | | | 70,147 | |
| | | | |
| |
TOTAL NET ASSETS | | $ | 16,590,614 | |
| | | | |
| |
NET ASSETS CONSIST OF: | | | | |
| |
Capital stock | | $ | 7,267 | |
Additional paid-in-capital | | | 12,891,893 | |
Undistributed net investment loss | | | (21,947 | ) |
Accumulated net realized gain (loss) on investments, foreign currency and translation of other assets and liabilities | | | 1,145,825 | |
Net unrealized appreciation (depreciation) on investments, foreign currency and translation of other assets and liabilities | | | 2,567,576 | |
| | | | |
| |
TOTAL NET ASSETS | | $ | 16,590,614 | |
| | | | |
NET ASSET VALUE, OFFERING PRICE AND REDEMPTION PRICE PER SHARE - Class A | | | | |
($16,590,614/726,681 shares) | | $ | 22.83 | |
| | | | |
The accompanying notes are an integral part of the financial statements.
7
Tax Managed Series
Statement of Operations
For the Six Months Ended April 30, 2016 (unaudited)
| | | | |
INVESTMENT INCOME: | | | | |
| |
Dividends (net of foreign taxes withheld, $3,711) | | $ | 82,958 | |
| | | | |
| |
EXPENSES: | | | | |
| |
Management fees (Note 3) | | | 87,343 | |
Fund accounting and administration fees (Note 3) | | | 16,957 | |
Transfer agent fees (Note 3) | | | 3,369 | |
Chief Compliance Officer service fees (Note 3) | | | 1,258 | |
Directors’ fees (Note 3) | | | 462 | |
Audit fees | | | 13,745 | |
Printing and postage fees | | | 8,403 | |
Registration and filing fees | | | 7,822 | |
Custodian fees | | | 2,266 | |
Miscellaneous | | | 2,442 | |
| | | | |
| |
Total Expenses | | | 144,067 | |
Less reduction of expenses (Note 3) | | | (39,255 | ) |
| | | | |
| |
Net Expenses | | | 104,812 | |
| | | | |
| |
NET INVESTMENT LOSS | | | (21,854 | ) |
| | | | |
REALIZED AND UNREALIZED GAIN (LOSS) ON INVESTMENTS AND FOREIGN CURRENCY: | | | | |
| |
Net realized gain (loss) on- | | | | |
Investments | | | 1,146,226 | |
Foreign currency and translation of other assets and liabilities | | | (385 | ) |
| | | | |
| |
| | | 1,145,841 | |
| | | | |
Net change in unrealized appreciation (depreciation) on- | | | | |
Investments | | | (993,977 | ) |
Foreign currency and translation of other assets and liabilities | | | 856 | |
| | | | |
| |
| | | (993,121 | ) |
| | | | |
| |
NET REALIZED AND UNREALIZED GAIN (LOSS) ON INVESTMENTS AND FOREIGN CURRENCY | | | 152,720 | |
| | | | |
| |
NET INCREASE IN NET ASSETS RESULTING FROM OPERATIONS | | $ | 130,866 | |
| | | | |
The accompanying notes are an integral part of the financial statements.
8
Tax Managed Series
Statements of Changes in Net Assets
| | | | | | | | |
| | | FOR THE SIX
MONTHS ENDED
4/30/16
(UNAUDITED) | | | FOR THE YEAR ENDED
10/31/15 | |
INCREASE (DECREASE) IN NET ASSETS: | | | | | | | | |
| | |
OPERATIONS: | | | | | | | | |
Net investment income (loss) | | $ | (21,854 | ) | | $ | 35,073 | |
Net realized gain on investments and foreign currency | | | 1,145,841 | | | | 2,702,559 | |
Net change in unrealized appreciation (depreciation) on investments and foreign currency | | | (993,121 | ) | | | (3,184,140 | ) |
| | | | | | | | |
Net increase (decrease) from operations | | | 130,866 | | | | (446,508 | ) |
| | | | | | | | |
| | |
DISTRIBUTIONS TO SHAREHOLDERS (Note 8): | | | | | | | | |
| | |
From net investment income | | | (22,080 | ) | | | (35,591 | ) |
From net realized gain on investments | | | (2,657,130 | ) | | | (5,685,380 | ) |
| | | | | | | | |
| | |
Total distributions to shareholders | | | (2,679,210 | ) | | | (5,720,971 | ) |
| | | | | | | | |
| | |
CAPITAL STOCK ISSUED AND REPURCHASED: | | | | | | | | |
| | |
Net decrease from capital share transactions (Note 5) | | | (3,092,221 | ) | | | (5,783,374 | ) |
| | | | | | | | |
| | |
Net decrease in net assets | | | (5,640,565 | ) | | | (11,950,853 | ) |
| | |
NET ASSETS: | | | | | | | | |
| | |
Beginning of period | | | 22,231,179 | | | | 34,182,032 | |
| | | | | | | | |
| | |
End of period (including undistributed net investment loss of $21,947 and undistributed net investment income of $21,987, respectively) | | $ | 16,590,614 | | | $ | 22,231,179 | |
| | | | | | | | |
The accompanying notes are an integral part of the financial statements.
9
Tax Managed Series
Financial Highlights
| | | | | | | | | | | | | | | | | | | | | | | | |
| | | FOR THE SIX
MONTHS ENDED
4/30/16 | | | FOR THE YEARS ENDED | |
| | | (UNAUDITED) | | | 10/31/15 | | | 10/31/14 | | | 10/31/13 | | | 10/31/12 | | | 10/31/11 | |
Per share data (for a share outstanding throughout each period): | | | | | | | | | | | | | | | | | | | | | | | | |
Net asset value - Beginning of period | | $ | 26.41 | | | $ | 33.05 | | | $ | 33.95 | | | $ | 27.69 | | | $ | 24.96 | | | $ | 25.01 | |
| | | | | | | | | | | | | | | | | | | | | | | | |
Income (loss) from investment operations: | | | | | | | | | | | | | | | | | | | | | | | | |
Net investment income (loss)1 | | | (0.03 | ) | | | 0.04 | | | | 0.04 | | | | 0.04 | | | | 0.03 | | | | 0.08 | |
Net realized and unrealized gain (loss) on investments | | | 0.23 | | | | (0.70 | ) | | | 3.73 | | | | 7.52 | | | | 2.77 | | | | (0.06 | ) |
| | | | | | | | | | | | | | | | | | | | | | | | |
| | | | | | |
Total from investment operations | | | 0.20 | | | | (0.66 | ) | | | 3.77 | | | | 7.56 | | | | 2.80 | | | | 0.02 | |
| | | | | | | | | | | | | | | | | | | | | | | | |
| | | | | | |
Less distributions to shareholders: | | | | | | | | | | | | | | | | | | | | | | | | |
From net investment income | | | (0.03 | ) | | | (0.04 | ) | | | (0.01 | ) | | | (0.06 | ) | | | (0.07 | ) | | | (0.07 | ) |
From net realized gain on investments | | | (3.75 | ) | | | (5.94 | ) | | | (4.66 | ) | | | (1.24 | ) | | | — | | | | — | |
| | | | | | | | | | | | | | | | | | | | | | | | |
| | | | | | |
Total distributions to shareholders | | | (3.78 | ) | | | (5.98 | ) | | | (4.67 | ) | | | (1.30 | ) | | | (0.07 | ) | | | (0.07 | ) |
| | | | | | | | | | | | | | | | | | | | | | | | |
| | | | | | |
Net asset value - End of period | | $ | 22.83 | | | $ | 26.41 | | | $ | 33.05 | | | $ | 33.95 | | | $ | 27.69 | | | $ | 24.96 | |
| | | | | | | | | | | | | | | | | | | | | | | | |
| | | | | | |
Net assets - End of period (000’s omitted) | | $ | 16,591 | | | $ | 22,231 | | | $ | 34,182 | | | $ | 33,669 | | | $ | 29,776 | | | $ | 47,663 | |
| | | | | | | | | | | | | | | | | | | | | | | | |
| | | | | | |
Total return2 | | | 1.26 | % | | | (1.67 | %) | | | 12.82 | % | | | 28.41 | % | | | 11.28 | % | | | 0.08 | % |
Ratios (to average net assets)/Supplemental Data: | | | | | | | | | | | | | | | | | | | | | | | | |
Expenses* | | | 1.20 | %3 | | | 1.20 | % | | | 1.20 | % | | | 1.20 | % | | | 1.20 | % | | | 1.20 | % |
Net investment income (loss) | | | (0.25 | %)3 | | | 0.13 | % | | | 0.11 | % | | | 0.13 | % | | | 0.12 | % | | | 0.29 | % |
Portfolio turnover | | | 26 | % | | | 60 | % | | | 47 | % | | | 56 | % | | | 47 | % | | | 57 | % |
|
| *The investment advisor did not impose all or a portion of its management and/or other fees, and in some periods may have paid a portion of the Series’ expenses. If these expenses had been incurred by the Series, the expense ratio (to average net assets) would have increased by the following amounts: | |
| | | | | | |
| | | 0.45 | %3 | | | 0.23 | % | | | 0.13 | % | | | 0.15 | % | | | 0.10 | % | | | 0.04 | % |
1Calculated based on average shares outstanding during the periods.
2Represents aggregate total return for the periods indicated, and assumes reinvestment of all distributions. Periods less than one year are not annualized.
3Annualized.
The accompanying notes are an integral part of the financial statements.
10
Tax Managed Series
Notes to Financial Statements
(unaudited)
Tax Managed Series (the “Series”) is a no-load diversified series of Manning & Napier Fund, Inc. (the “Fund”). The Fund is organized in Maryland and is registered under the Investment Company Act of 1940, as amended, as an open-end management investment company.
The Series’ investment objective is to maximize long-term growth while attempting to minimize the impact of taxes on the total return earned by shareholders.
The Fund’s Advisor is Manning & Napier Advisors, LLC (the “Advisor”). Shares of the Series are offered to investors, clients and employees of the Advisor and its affiliates. The total authorized capital stock of the Fund consists of 15 billion shares of common stock each having a par value of $0.01. As of April 30, 2016, 10.5 billion shares have been designated in total among 40 series, of which 87.5 million have been designated as Tax Managed Series Class A common stock.
| 2. | Significant Accounting Policies |
The following is a summary of significant accounting policies followed by the Series. The Series is an investment company and, accordingly, follows the investment company accounting and reporting guidance of the Financial Accounting Standards Board Accounting Standards Codification Topic 946 - Investment Companies, which is part of accounting principles generally accepted in the United States of America (“GAAP”).
Security Valuation
Portfolio securities, including domestic equities, foreign equities, warrants and options, listed on an exchange other than the NASDAQ Stock Market are valued at the latest quoted sales price of the exchange on which the security is primarily traded. Securities not traded on valuation date or securities not listed on an exchange are valued at the latest quoted bid price provided by the Fund’s pricing service. Securities listed on the NASDAQ Stock Market are valued in accordance with the NASDAQ Official Closing Price.
Short-term investments that mature in sixty days or less may be valued at amortized cost, which approximates fair value. Investments in open-end investment companies are valued at their net asset value per share on valuation date.
Volume and level of activity in established markets for an asset or liability are evaluated to determine whether recent transactions and quoted prices are determinative of fair value. Where there have been significant decreases in volume and level of activity, further analysis and adjustment may be necessary to estimate fair value. The Series measures fair value in these instances by the use of inputs and valuation techniques which may be based upon current market prices of securities that are comparable in coupon, rating, maturity and industry and/or expectation of future cash flows. As a result of trading in relatively thin markets and/or markets that experience significant volatility, the prices used by the Series to value these securities may differ from the value that would be realized if these securities were sold, and the differences could be material.
Securities for which representative valuations or prices are not available from the Series’ pricing service may be valued at fair value as determined in good faith by the Advisor under procedures approved by and under the general supervision and responsibility of the Fund’s Board of Directors (the “Board”). Due to the inherent uncertainty of valuations of such securities, the fair value may differ significantly from the values that would have been used had a ready market for such securities existed. If trading or events occurring after the close of the principal market in which securities are traded are expected to materially affect the value of those securities, then they may be valued at their fair value, taking this trading or these events into account. In accordance with the procedures approved by the Board, the values of certain securities trading outside the U.S. were adjusted following the close of local trading using a factor from a third party vendor. The third party vendor uses statistical analyses and quantitative models, which consider among other things subsequent movement and changes in the prices of indices, securities and exchange rates in other markets, to determine the factors which are used to adjust local market prices. The value of securities used for net asset value calculation under these procedures may differ from published prices for the same securities. It is the Fund’s policy to classify each foreign equity security where a factor from a third party vendor is provided as a Level 2 security.
11
Tax Managed Series
Notes to Financial Statements (continued)
(unaudited)
| 2. | Significant Accounting Policies (continued) |
Security Valuation (continued)
Various inputs are used in determining the value of the Series’ assets or liabilities carried at fair value. These inputs are summarized in three broad levels. Level 1 includes quoted prices in active markets for identical assets and liabilities. Level 2 includes other significant observable inputs (including quoted prices for similar securities, interest rates, prepayment speeds, credit risk, etc.). Level 3 includes significant unobservable inputs (including the Series’ own assumptions in determining the fair value of investments). A financial instrument’s level within the fair value hierarchy is based on the lowest level of any input both individually and in aggregate that is significant to the fair value measurement. The inputs or methodology used for valuing securities are not necessarily an indication of the risk associated with investing in those securities.
The following is a summary of the valuation levels used for major security types as of April 30, 2016 in valuing the Series’ assets or liabilities carried at fair value:
| | | | | | | | | | | | | | | | |
| DESCRIPTION | | TOTAL | | | LEVEL 1 | | | LEVEL 2 | | | LEVEL 3 | |
Assets: | | | | | | | | | | | | | | | | |
Equity securities: | | | | | | | | | | | | | | | | |
Consumer Discretionary | | $ | 3,492,734 | | | $ | 3,492,734 | | | $ | — | | | $ | — | |
Consumer Staples | | | 1,409,860 | | | | 442,007 | | | | 967,853 | | | | — | |
Energy | | | 728,210 | | | | 728,210 | | | | — | | | | — | |
Financials | | | 765,945 | | | | 765,945 | | | | — | | | | — | |
Health Care | | | 3,860,248 | | | | 3,642,654 | | | | 217,594 | | | | — | |
Industrials | | | 616,842 | | | | 616,842 | | | | — | | | | — | |
Information Technology | | | 4,442,899 | | | | 4,255,694 | | | | 187,205 | | | | — | |
Materials | | | 973,278 | | | | 973,278 | | | | — | | | | — | |
Mutual Fund | | | 335,999 | | | | 335,999 | | | | — | | | | — | |
| | | | | | | | | | | | | | | | |
Total assets | | $ | 16,626,015 | | | $ | 15,253,363 | | | $ | 1,372,652 | | | $ | — | |
| | | | | | | | | | | | | | | | |
Please see the Investment Portfolio for foreign securities where a factor from a third party vendor was applied to determine the security’s fair value following the close of local trading. Such securities are included in Level 2 in the table above.
There were no Level 3 securities held by the Series as of October 31, 2015 or April 30, 2016.
The Fund’s policy is to recognize transfers in and transfers out of the valuation levels as of the beginning of the reporting period. There were no transfers between Level 1 and Level 2 during the six months ended April 30, 2016.
Security Transactions, Investment Income and Expenses
Security transactions are accounted for on trade date. Dividend income is recorded on the ex-dividend date, except that if the ex-dividend date has passed, certain dividends from foreign securities are recorded as soon as the Series is informed of the ex-dividend date. Non-cash dividends, if any, are recorded at the fair value of the securities received. Interest income, including amortization of premium and accretion of discounts using the effective interest method, is earned from settlement date and accrued daily.
Expenses are recorded on an accrual basis. Most expenses of the Fund can be attributed to a specific series. Expenses which cannot be directly attributed are apportioned among the series in the Fund in such a manner as deemed equitable by the Fund’s Board, taking into consideration, among other things, the nature and type of expense.
The Series uses the identified cost method for determining realized gain or loss on investments for both financial statement and federal income tax reporting purposes.
Foreign Currency Translation
The books and records of the Series are maintained in U.S. dollars. Foreign currencies, investments and other assets and liabilities are translated into U.S. dollars at the current exchange rates. Purchases and sales of investment securities and income and expenses are translated on the respective dates of such transactions. The Series does not isolate realized and
12
Tax Managed Series
Notes to Financial Statements (continued)
(unaudited)
| 2. | Significant Accounting Policies (continued) |
Foreign Currency Translation (continued)
unrealized gains and losses attributable to changes in the exchange rates from gains and losses that arise from changes in the fair value of investments. Such fluctuations are included with net realized and unrealized gain or loss on investments. Net realized foreign currency gains and losses represent foreign currency gains and losses between trade date and settlement date on securities transactions, gains and losses on disposition of foreign currencies and the difference between the amount of income and foreign withholding taxes recorded on the books of the Series and the amounts actually received or paid.
Federal Taxes
The Series’ policy is to comply with the provisions of the Internal Revenue Code applicable to regulated investment companies. The Series is not subject to federal income tax or excise tax to the extent that the Series distributes to shareholders each year its taxable income, including any net realized gains on investments, in accordance with requirements of the Internal Revenue Code. Accordingly, no provision for federal income tax or excise tax has been made in the financial statements.
Management evaluates its tax positions to determine if the tax positions taken meet the minimum recognition threshold in connection with accounting for uncertainties in income tax positions taken or expected to be taken for the purposes of measuring and recognizing tax liabilities in the financial statements. Recognition of tax benefits of an uncertain tax position is required only when the position is “more likely than not” to be sustained assuming examination by taxing authorities. At April 30, 2016, the Series has recorded no liability for net unrecognized tax benefits relating to uncertain income tax positions taken or expected to be taken in future tax returns.
The Series files income tax returns in the U.S. federal jurisdiction, various states and foreign jurisdictions, as required. No income tax returns are currently under investigation. The statute of limitations on the Series’ tax returns remains open for the years ended October 31, 2012 through October 31, 2015. The Series is not aware of any tax positions for which it is reasonably possible that the total amounts of unrecognized tax benefits will significantly change in the next twelve months.
Foreign Taxes
Based on the Series’ understanding of the tax rules and rates related to income, gains and currency purchase/repatriation transactions for foreign jurisdictions in which it invests, the Series will provide for foreign taxes, and where appropriate, deferred foreign tax.
Distributions of Income and Gains
Distributions to shareholders of net investment income and net realized gains are made annually. An additional distribution may be necessary to avoid taxation of the Series. Distributions are recorded on the ex-dividend date.
Indemnifications
The Fund’s organizational documents provide former and current directors and officers with a limited indemnification against liabilities arising in connection with the performance of their duties to the Fund. In the normal course of business, the Fund may also enter into contracts that provide general indemnifications. The Fund’s maximum exposure under these arrangements is unknown as this would be dependent on future claims that may be made against the Fund. The risk of material loss from such claims is considered remote.
Other
The preparation of financial statements in conformity with GAAP requires management to make estimates and assumptions that affect the reported amounts of assets and liabilities and the disclosure of contingent assets and liabilities at the date of the financial statements and the reported amounts of income and expenses during the reporting period. Actual results could differ from those estimates.
| 3. | Transactions with Affiliates |
The Fund has an Investment Advisory Agreement (the “Agreement”) with the Advisor, for which the Series pays a fee, computed daily and payable monthly, at an annual rate of 1.00% of the Series’ average daily net assets.
13
Tax Managed Series
Notes to Financial Statements (continued)
(unaudited)
| 3. | Transactions with Affiliates (continued) |
Under the Agreement, personnel of the Advisor provide the Series with advice and assistance in the choice of investments and the execution of securities transactions, and otherwise maintain the Series’ organization. The Advisor also provides the Fund with necessary office space and fund administration and support services. The salaries of all officers of the Fund (except a percentage of the Fund’s Chief Compliance Officer’s salary, which is paid by the Fund), and of all Directors who are “affiliated persons” of the Fund, or of the Advisor, and all personnel of the Fund, or of the Advisor, performing services relating to research, statistical and investment activities, are paid by the Advisor. Each “non-affiliated” Director receives an annual stipend, which is allocated among all the active series of the Fund. In addition, these Directors also receive a fee per Board meeting attended plus a fee for each committee meeting attended and are reimbursed for travel and other out-of-pocket expenses incurred by them in connection with attending such meetings. The Fund also has an Audit Committee Chair, who receives an additional annual stipend for this role.
The Advisor has contractually agreed, until at least February 28, 2017, to waive its management fee and, if necessary, pay other operating expenses of the Series in order to maintain total direct annual fund operating expenses for the Series at no more than 1.20% of average daily net assets each year. Accordingly, the Advisor waived fees of $39,255 for the six months ended April 30, 2016, which is included as a reduction of expenses on the Statement of Operations. The Advisor is not eligible to recoup any expenses that have been waived or reimbursed in prior years.
Manning & Napier Investor Services, Inc., a registered broker-dealer affiliate of the Advisor, acts as distributor for the Fund’s shares. The services of Manning & Napier Investor Services, Inc. are provided at no additional cost to the Series.
Pursuant to a master services agreement dated November 1, 2014, the Fund pays the Advisor an annual fee related to fund accounting and administration of 0.0085% on the first $25 billion of average daily net assets (excluding Target Series and Strategic Income Series); 0.0075% on the next $15 billion of average daily net assets (excluding Target Series and Strategic Income Series); and 0.0065% of the average daily net assets in excess of $40 billion (excluding Target Series and Strategic Income Series); plus a base fee of $30,400 per series. Transfer agent fees are charged to the Fund on a per account basis. Additionally, certain transaction and out-of-pocket expenses, including charges for reporting relating to the Fund’s compliance program, are charged. The Advisor has agreements with BNY Mellon Investment Servicing (U.S.) Inc. (“BNY”) under which BNY serves as sub-accountant services agent and sub-transfer agent.
Expenses not directly attributable to a series are allocated based on each series’ relative net assets or number of accounts, depending on the expense.
| 4. | Purchases and Sales of Securities |
For the six months ended April 30, 2016, purchases and sales of securities, other than U.S. Government securities and short-term securities, were $4,526,073 and $10,052,915, respectively. There were no purchases or sales of U.S. Government securities.
| 5. | Capital Stock Transactions |
Transactions in shares of Tax Managed Series were:
| | | | | | | | | | | | | | | | |
| | | FOR THE SIX MONTHS
ENDED 4/30/16 | | | FOR THE YEAR ENDED 10/31/15 | |
| | | SHARES | | | AMOUNT | | | SHARES | | | AMOUNT | |
Sold | | | 15,596 | | | $ | 370,053 | | | | 87,223 | | | $ | 2,406,990 | |
Reinvested | | | 118,732 | | | | 2,622,782 | | | | 212,488 | | | | 5,512,395 | |
Repurchased | | | (249,388 | ) | | | (6,085,056 | ) | | | (492,364 | ) | | | (13,702,759 | ) |
| | | | | | | | | | | | | | | | |
Total | | | (115,060 | ) | | $ | (3,092,221 | ) | | | (192,653 | ) | | $ | (5,783,374 | ) |
| | | | | | | | | | | | | | | | |
14
Tax Managed Series
Notes to Financial Statements (continued)
(unaudited)
| 5. | Capital Stock Transactions (continued) |
Substantially all of the Series’ shares represent investments by fiduciary accounts over which the Advisor has sole investment discretion.
The Series may trade in instruments including written and purchased options, forward foreign currency exchange contracts and futures contracts and other derivatives in the normal course of investing activities to assist in managing exposure to various market risks. The Series may be subject to various elements of risk, which may involve, to a varying degree, elements of risk in excess of the amounts recognized for financial statement purposes. These risks include: the risk that changes in the value of a derivative may not correlate perfectly with the underlying asset, rate or index; counterparty credit risk related to over the counter derivative counterparties’ failure to perform under contract terms; liquidity risk related to the lack of a liquid market for these contracts allowing the fund to close out its position(s); and documentation risk relating to disagreement over contract terms. No such investments were held by the Series as of April 30, 2016.
Investing in securities of foreign companies and foreign governments involves special risks and considerations not typically associated with investing in securities of domestic companies and the U.S. Government. These risks include revaluation of currencies and future adverse political and economic developments. Moreover, securities of foreign companies and foreign governments and their markets may be less liquid and their prices more volatile than those of comparable domestic companies and the U.S. Government.
| 8. | Federal Income Tax Information |
The amount and characterization of certain income and capital gains to be distributed are determined in accordance with federal income tax regulations, which may differ from GAAP. The Series may periodically make reclassifications among its capital accounts to reflect income and gains available for distribution (or available capital loss carryovers) under income tax regulations, without impacting the Series’ net asset value. Any such reclassifications are not reflected in the financial highlights.
The final determination of the tax character of current year distributions will be made at the conclusion of the fiscal year. The tax character of distributions paid for the year ended October 31, 2015 were as follows:
| | | | |
Ordinary income | | $ | 35,591 | |
Long-term capital gains | | | 5,685,380 | |
At April 30, 2016, the tax basis of components of distributable earnings and the net unrealized appreciation based on identified cost of investments for federal income tax purposes were as follows:
| | | | |
Cost for federal income tax purposes | | $ | 14,058,828 | |
Unrealized appreciation | | | 2,886,869 | |
Unrealized depreciation | | | (319,682 | ) |
| | | | |
Net unrealized appreciation | | $ | 2,567,187 | |
| | | | |
15
Tax Managed Series
Renewal of Investment Advisory Agreement
(unaudited)
At the Manning & Napier Fund, Inc. (the “Fund”) Board of Directors’ (the “Board”) meeting, held on November 17, 2015, the Investment Advisory Agreement (the “Agreement”) between the Fund and Manning & Napier Advisors, LLC (the “Advisor”) was considered by the Board for renewal. In connection with the decision whether to renew the Agreement, a variety of material was prepared for and considered by the Board.
Representatives of the Advisor attended the meeting and presented additional oral and written information to the Board to assist the Board in its considerations. The discussion immediately below outlines the materials and information presented to the Board in connection with the Board’s 2015 Annual consideration of the Agreement and the conclusions made by the Directors when determining to continue the Agreement.
| | • | | The Board considered the services provided by the Advisor under the Agreement including, among others: deciding what securities to purchase and sell for each Series; arranging for the purchase and sale of such securities by placing orders with broker-dealers; administering the affairs of the Fund (including the books and records of the Fund not maintained by third party service providers such as the custodian or sub-transfer agent); arranging for the insurance coverage for the Fund; and supervising the preparation of tax returns, SEC filings (including registration statements) and reports to shareholders for the Fund. The Board also considered the nature and quality of such services provided under the Agreement in light of the Advisor’s services provided to the Fund for 29 years. The Board discussed the quality of these services with representatives from the Advisor and concluded that the Advisor was performing its services to the Fund required under the Agreement in a reasonable manner. |
| | • | | The Board considered the performance of each Series since its inception, as well as performance over multiple time periods. Performance for one or more of the following time periods was considered as applicable to the Series’ inception date: inception, three year, five year, ten year, and current market cycle. A market cycle includes periods of both rising and falling markets. Returns for established benchmark indices for each Series were provided. In addition, the Board considered a number of other factors relevant to performance at the meeting (and considers on a quarterly basis) including: a peer group performance analysis consisting of Morningstar universes of mutual funds with similar investment objectives, investment performance of core products, product offerings, performance on an aggregate basis vs. performance over reasonable time periods and the Advisor’s investment process. The Directors acknowledged the challenging performance and discussed the investment process of the Advisor. The Directors confirmed that qualitative factors such as the Advisor’s investment process, including recent enhancements, were an important subset to be considered as part of their consideration of performance. The Board discussed the performance with representatives from the Advisor and concluded that the investment performance of each of the Fund’s Series was reasonable based on the Series’ actual performance and comparative performance, especially for those series with performance over the current market cycle. |
| | • | | The Board considered the costs of the Advisor’s services and the profits of the Advisor as they relate to the Advisor’s services to the Fund under the Agreement. In reviewing the Advisor’s costs and profits, the Board discussed the Advisor’s revenues generated from the Fund (on both an actual and adjusted basis) and its expenses associated with providing the services under the Agreement. In addition, the Board reviewed the Advisor’s expenses associated with Fund activities outside of the Agreement (such as expense reimbursements pursuant to expense caps and payments made by the Advisor to third party platforms on which shares of the Fund are available for purchase). It was noted by representatives of the Advisor that 22 of the 36 active Series of the Fund are currently experiencing expenses above the capped expense ratios, and thus the Advisor is incurring those expenses over the cap. After discussing the above costs and profits, the Board concluded that the Advisor’s profitability relating to its services provided under the Agreement was reasonable. |
| | • | | The Board considered the fees and expenses of the various Series of the Fund. The Advisor presented the advisory fees and total expenses for each Series, including the advisory fee adjusted for any expense waivers or reimbursements (either contractual or voluntary) paid by the Advisor. The advisory fees and expense ratios of each Series were compared to an average (on both a mean and median basis) of similar funds as disclosed on the Morningstar database. Representatives of the Advisor discussed with the Board the levels of its advisory fee for each Series of the Fund and as compared to the median and mean advisory fees for similar funds as listed on Morningstar. Expense ratios for every Series, except the Tax Managed Series, Equity Income Class S, High Yield Bond Class S, Pro-Blend Series Classes C and R, and Target Series’ Classes R and K, are lower than, or substantially similar to the Morningstar mean and median reported total expense ratio. |
16
Tax Managed Series
Renewal of Investment Advisory Agreement
(unaudited)
The higher than mean and median total expense ratios for Classes C and R reflect higher distribution, marketing and shareholder service fees payable to broker-dealers through a 100bp 12b-1 fee for Class C and a 50bp 12b-1 fee for Class R. Based on their review of the information provided, the Board concluded that the fees and expenses of each Series of the Fund were reasonable on a comparative basis.
| | • | | The Board also considered the other benefits the Advisor derives from its relationship with the Fund. Such other benefits include certain research services provided by soft dollars. The Board reviewed the broker-dealers who provided research to the Advisor and the products and services paid for, in whole or in part, using soft dollar commissions. Given the level of soft dollar transactions involving the Fund, the Board concluded that these additional benefits to the Advisor were reasonable. |
| | • | | In addition to the factors described above, the Board considered the Advisor’s personnel, investment strategies, policies and procedures relating to compliance with personal securities transactions, reputation, expertise and resources in domestic and foreign financial markets. The Board concluded that these factors support the conclusion that the Advisor performs its services in a reasonable manner. |
| | • | | The Board then considered economies of scale and concluded that the current fee schedule to the advisory agreement remained reasonable given the multiple uses of the Fund (for the Advisor’s discretionary investment account clients in addition to direct investors), the current profitability of the Advisor’s services to the Fund under the Agreement, the number of newly established series of the Fund and the overall size of the Fund complex. |
Based on the Board’s deliberations and their evaluation of the information described above, the Board, including a majority of Directors that are not “interested persons” as defined in the Investment Company Act of 1940, concluded that the compensation under the Agreement was fair and reasonable in light of the services and expenses and such other matters as the Directors considered to be relevant in the exercise of their reasonable judgment. Accordingly, the Board approved the renewal of the Agreement. In the course of their deliberations, the Directors did not identify any particular information that was all important or controlling.
17
Tax Managed Series
Literature Requests
(unaudited)
Proxy Voting Policies and Procedures
A description of the policies and procedures that the Fund uses to determine how to vote proxies relating to portfolio securities is available, without charge, upon request:
| | | | |
| By phone | | 1-800-466-3863 | | |
| On the Securities and Exchange | | | | |
| Commission’s (SEC) web site | | http://www.sec.gov | | |
Proxy Voting Record
Information regarding how the Fund voted proxies relating to portfolio securities during the most recent 12-month period ended June 30th is available, without charge, upon request:
| | | | |
| By phone | | 1-800-466-3863 | | |
| On the SEC’s web site | | http://www.sec.gov | | |
Quarterly Portfolio Holdings
The Series’ complete schedule of portfolio holdings for the 1st and 3rd quarters of each fiscal year are provided on Form N-Q, and are available, without charge, upon request:
| | | | |
| By phone | | 1-800-466-3863 | | |
| On the SEC’s web site | | http://www.sec.gov | | |
The Series’ Form N-Q may be reviewed and copied at the SEC’s Public Reference Room in Washington, D.C. Information on the operation of the Public Reference Room may be obtained by calling 1-800-SEC-0330.
Prospectus and Statement of Additional Information (SAI)
For more information about any of the Manning & Napier Fund, Inc. Series, you may obtain a prospectus and SAI at www.manning-napier.com or by calling (800) 466-3863. Before investing, carefully consider the objectives, risks, charges and expenses of the investment and read the prospectus carefully as it contains this and other information about the investment company. In addition, this information can be found on the SEC’s web site, http://www.sec.gov.
Additional information available at www.manning-napier.com
1. Fund Holdings - Month-End
2. Fund Holdings - Quarter-End
3. Shareholder Report - Annual
4. Shareholder Report - Semi-Annual
The Fund also offers electronic notification or “e-delivery” when certain documents are available on-line to be downloaded or reviewed. Direct shareholders can elect to receive electronic notification when shareholder reports, prospectus updates, and/or statements are available. If you do not currently have on-line access to your account, you can establish access by going to www.manning-napier.com, click on “Login” in the top corner of the page, and follow the prompts to self-enroll. Once enrolled, you can set your electronic notification preferences by clicking on the Account Options tab located within the green toolbar and then select E-Delivery Option. Should you have any questions on either how to establish on-line access or how to update your account settings, please contact Investor Services at 1-800-466-3863.
The Manning & Napier Fund, Inc. is managed by Manning & Napier Advisors, LLC. Manning & Napier Investor Services, Inc., an affiliate of Manning & Napier Advisors, LLC, is the distributor of the Fund shares.
MNTAX-4/16-SAR

Shareholder Expense Example
(unaudited)
As a shareholder of the Series, you incur ongoing costs, including management fees, shareholder service fees and other Series expenses. This example is intended to help you understand your ongoing costs (in dollars) of investing in the Series and to compare these costs with the ongoing costs of investing in other mutual funds.
The example is based on an investment of $1,000 invested at the beginning of the period and held for the entire period (November 1, 2015 to April 30, 2016).
Actual Expenses
The Actual lines of the tables below provide information about actual account values and actual expenses. You may use the information in these lines, together with the amount you invested, to estimate the expenses that you paid over the period. Simply divide your account value by $1,000 (for example, an $8,600 account value divided by $1,000 = 8.6), then multiply the result by the number in the Actual line for the Series and Class in which you have invested under the heading entitled “Expenses Paid During Period” to estimate the expenses you paid on your account during this period.
Hypothetical Example for Comparison Purposes
The Hypothetical lines of the tables below provide information about hypothetical account values and hypothetical expenses based on the Class’ actual expense ratio and an assumed rate of return of 5% per year before expenses, which is not the Class’ actual return. The hypothetical account values and expenses may not be used to estimate the actual ending account balance or expenses you paid during the period. You may use this information to compare the ongoing costs of investing in a Class of the Series and other funds. To do so, compare this 5% hypothetical example for the Series and Class in which you have invested with the 5% hypothetical examples that appear in the shareholder reports of the other funds.
Please note that the expenses shown in the tables are meant to highlight your ongoing costs only and do not reflect any transaction costs, such as sales charges (loads), redemption fees, or exchange fees that you may incur in other mutual funds. Therefore, the Hypothetical lines of the tables are useful in comparing ongoing costs only, and will not help you determine the relative total costs of owning different funds.
| | | | | | | | |
| | | BEGINNING
ACCOUNT VALUE
11/1/15 | | ENDING
ACCOUNT VALUE
4/30/16 | | EXPENSES PAID
DURING PERIOD
11/1/15-4/30/161 | | ANNUALIZED
EXPENSE
RATIO2 |
Target Income | | | | | | | | |
Actual (Class K) | | $1,000.00 | | $1,008.60 | | $1.50 | | 0.30% |
Hypothetical3 | | $1,000.00 | | $1,023.37 | | $1.51 | | 0.30% |
| | | | |
Actual (Class R) | | $1,000.00 | | $1,008.10 | | $2.75 | | 0.55% |
Hypothetical3 | | $1,000.00 | | $1,022.13 | | $2.77 | | 0.55% |
| | | | |
Actual (Class I) | | $1,000.00 | | $1,010.90 | | $0.25 | | 0.05% |
Hypothetical3 | | $1,000.00 | | $1,024.61 | | $0.25 | | 0.05% |
| | | BEGINNING ACCOUNT VALUE 11/1/15 | | ENDING ACCOUNT VALUE 4/30/16 | | EXPENSES PAID DURING PERIOD 11/1/15-4/30/161 | | ANNUALIZED EXPENSE RATIO2 |
Target 2015 | | | | | | | | |
Actual (Class K) | | $1,000.00 | | $1,003.00 | | $1.49 | | 0.30% |
Hypothetical3 | | $1,000.00 | | $1,023.37 | | $1.51 | | 0.30% |
| | | | |
Actual (Class R) | | $1,000.00 | | $1,001.70 | | $2.74 | | 0.55% |
Hypothetical3 | | $1,000.00 | | $1,022.13 | | $2.77 | | 0.55% |
| | | | |
Actual (Class I) | | $1,000.00 | | $1,003.60 | | $0.25 | | 0.05% |
Hypothetical3 | | $1,000.00 | | $1,024.61 | | $0.25 | | 0.05% |
1
Shareholder Expense Example
(unaudited)
| | | | | | | | |
| | | BEGINNING
ACCOUNT VALUE
11/1/15 | | ENDING
ACCOUNT VALUE
4/30/16 | | EXPENSES PAID
DURING PERIOD
11/1/15-4/30/161 | | ANNUALIZED
EXPENSE
RATIO2 |
Target 2020 | | | | | | | | |
Actual (Class K) | | $1,000.00 | | $1,004.00 | | $1.49 | | 0.30% |
Hypothetical3 | | $1,000.00 | | $1,023.37 | | $1.51 | | 0.30% |
| | | | |
Actual (Class R) | | $1,000.00 | | $1,002.20 | | $2.74 | | 0.55% |
Hypothetical3 | | $1,000.00 | | $1,022.13 | | $2.77 | | 0.55% |
| | | | |
Actual (Class I) | | $1,000.00 | | $1,004.40 | | $0.25 | | 0.05% |
Hypothetical3 | | $1,000.00 | | $1,024.61 | | $0.25 | | 0.05% |
| | | BEGINNING ACCOUNT VALUE 11/1/15 | | ENDING ACCOUNT VALUE 4/30/16 | | EXPENSES PAID DURING PERIOD 11/1/15-4/30/161 | | ANNUALIZED
EXPENSE RATIO2 |
Target 2025 | | | | | | | | |
Actual (Class K) | | $1,000.00 | | $1,001.30 | | $1.49 | | 0.30% |
Hypothetical3 | | $1,000.00 | | $1,023.37 | | $1.51 | | 0.30% |
| | | | |
Actual (Class R) | | $1,000.00 | | $998.90 | | $2.73 | | 0.55% |
Hypothetical3 | | $1,000.00 | | $1,022.13 | | $2.77 | | 0.55% |
| | | | |
Actual (Class I) | | $1,000.00 | | $1,001.90 | | $0.25 | | 0.05% |
Hypothetical3 | | $1,000.00 | | $1,024.61 | | $0.25 | | 0.05% |
| | | BEGINNING ACCOUNT VALUE 11/1/15 | | ENDING ACCOUNT VALUE 4/30/16 | | EXPENSES PAID DURING PERIOD 11/1/15-4/30/161 | | ANNUALIZED
EXPENSE RATIO2 |
Target 2030 | | | | | | | | |
Actual (Class K) | | $1,000.00 | | $1,004.20 | | $1.49 | | 0.30% |
Hypothetical3 | | $1,000.00 | | $1,023.37 | | $1.51 | | 0.30% |
| | | | |
Actual (Class R) | | $1,000.00 | | $1,003.70 | | $2.74 | | 0.55% |
Hypothetical3 | | $1,000.00 | | $1,022.13 | | $2.77 | | 0.55% |
| | | | |
Actual (Class I) | | $1,000.00 | | $1,005.90 | | $0.25 | | 0.05% |
Hypothetical3 | | $1,000.00 | | $1,024.61 | | $0.25 | | 0.05% |
2
Shareholder Expense Example
(unaudited)
| | | | | | | | |
| | | BEGINNING
ACCOUNT VALUE
11/1/15 | | ENDING
ACCOUNT VALUE
4/30/16 | | EXPENSES PAID
DURING PERIOD
11/1/15-4/30/161 | | ANNUALIZED
EXPENSE
RATIO2 |
Target 2035 | | | | | | | | |
Actual (Class K) | | $1,000.00 | | $1,007.00 | | $1.50 | | 0.30% |
Hypothetical3 | | $1,000.00 | | $1,023.37 | | $1.51 | | 0.30% |
| | | | |
Actual (Class R) | | $1,000.00 | | $1,005.20 | | $2.74 | | 0.55% |
Hypothetical3 | | $1,000.00 | | $1,022.13 | | $2.77 | | 0.55% |
| | | | |
Actual (Class I) | | $1,000.00 | | $1,008.30 | | $0.25 | | 0.05% |
Hypothetical3 | | $1,000.00 | | $1,024.61 | | $0.25 | | 0.05% |
| | | BEGINNING ACCOUNT VALUE 11/1/15 | | ENDING ACCOUNT VALUE 4/30/16 | | EXPENSES PAID DURING PERIOD 11/1/15-4/30/161 | | ANNUALIZED
EXPENSE RATIO2 |
Target 2040 | | | | | | | | |
Actual (Class K) | | $1,000.00 | | $1,008.90 | | $1.50 | | 0.30% |
Hypothetical3 | | $1,000.00 | | $1,023.37 | | $1.51 | | 0.30% |
| | | | |
Actual (Class R) | | $1,000.00 | | $1,008.00 | | $2.75 | | 0.55% |
Hypothetical3 | | $1,000.00 | | $1,022.13 | | $2.77 | | 0.55% |
| | | | |
Actual (Class I) | | $1,000.00 | | $1,010.30 | | $0.25 | | 0.05% |
Hypothetical3 | | $1,000.00 | | $1,024.61 | | $0.25 | | 0.05% |
| | | BEGINNING ACCOUNT VALUE 11/1/15 | | ENDING ACCOUNT VALUE 4/30/16 | | EXPENSES PAID DURING PERIOD 11/1/15-4/30/161 | | ANNUALIZED
EXPENSE RATIO2 |
Target 2045 | | | | | | | | |
Actual (Class K) | | $1,000.00 | | $1,011.50 | | $1.50 | | 0.30% |
Hypothetical3 | | $1,000.00 | | $1,023.37 | | $1.51 | | 0.30% |
| | | | |
Actual (Class R) | | $1,000.00 | | $1,010.00 | | $2.75 | | 0.55% |
Hypothetical3 | | $1,000.00 | | $1,022.13 | | $2.77 | | 0.55% |
| | | | |
Actual (Class I) | | $1,000.00 | | $1,012.90 | | $0.25 | | 0.05% |
Hypothetical3 | | $1,000.00 | | $1,024.61 | | $0.25 | | 0.05% |
3
Shareholder Expense Example
(unaudited)
| | | | | | | | |
| | | BEGINNING
ACCOUNT VALUE
11/1/15 | | ENDING
ACCOUNT VALUE
4/30/16 | | EXPENSES PAID
DURING PERIOD
11/1/15-4/30/161 | | ANNUALIZED
EXPENSE
RATIO2 |
Target 2050 | | | | | | | | |
Actual (Class K) | | $1,000.00 | | $1,013.80 | | $1.50 | | 0.30% |
Hypothetical3 | | $1,000.00 | | $1,023.37 | | $1.51 | | 0.30% |
| | | | |
Actual (Class R) | | $1,000.00 | | $1,012.00 | | $2.75 | | 0.55% |
Hypothetical3 | | $1,000.00 | | $1,022.13 | | $2.77 | | 0.55% |
| | | | |
Actual (Class I) | | $1,000.00 | | $1,013.50 | | $0.25 | | 0.05% |
Hypothetical3 | | $1,000.00 | | $1,024.61 | | $0.25 | | 0.05% |
| | | BEGINNING ACCOUNT VALUE 11/1/15 | | ENDING ACCOUNT VALUE 4/30/16 | | EXPENSES PAID DURING PERIOD 11/1/15-4/30/161 | | ANNUALIZED EXPENSE RATIO2 |
Target 2055 | | | | | | | | |
Actual (Class K) | | $1,000.00 | | $1,013.50 | | $1.50 | | 0.30% |
Hypothetical3 | | $1,000.00 | | $1,023.37 | | $1.51 | | 0.30% |
| | | | |
Actual (Class R) | | $1,000.00 | | $1,012.20 | | $2.75 | | 0.55% |
Hypothetical3 | | $1,000.00 | | $1,022.13 | | $2.77 | | 0.55% |
| | | | |
Actual (Class I) | | $1,000.00 | | $1,015.00 | | $0.25 | | 0.05% |
Hypothetical3 | | $1,000.00 | | $1,024.61 | | $0.25 | | 0.05% |
| | | BEGINNING ACCOUNT VALUE 11/1/15 | | ENDING ACCOUNT VALUE 4/30/16 | | EXPENSES PAID DURING PERIOD 11/1/15-4/30/161 | | ANNUALIZED EXPENSE RATIO2 |
Target 2060 | | | | | | | | |
Actual (Class K) | | $1,000.00 | | $1,013.50 | | $1.50 | | 0.30% |
Hypothetical3 | | $1,000.00 | | $1,023.37 | | $1.51 | | 0.30% |
| | | | |
Actual (Class R) | | $1,000.00 | | $1,012.00 | | $2.75 | | 0.55% |
Hypothetical3 | | $1,000.00 | | $1,022.13 | | $2.77 | | 0.55% |
| | | | |
Actual (Class I) | | $1,000.00 | | $1,014.20 | | $0.25 | | 0.05% |
Hypothetical3 | | $1,000.00 | | $1,024.61 | | $0.25 | | 0.05% |
1Expenses are equal to the Class’ annualized expense ratio (for the six-month period), multiplied by the average account value over the period, multiplied by 182/366 (to reflect the one-half year period). Expenses are based on the most recent fiscal half year. The Class’ total returns would have been lower had certain expenses not been reimbursed during the period.
2Expense ratios of the Class do not include fees and expenses indirectly incurred by the underlying funds. If these expenses were included, the expense ratios would have been higher.
3Assumes 5% annual return before expenses.
4
Portfolio Composition as of April 30, 2016 - Asset Allocation1
(unaudited)
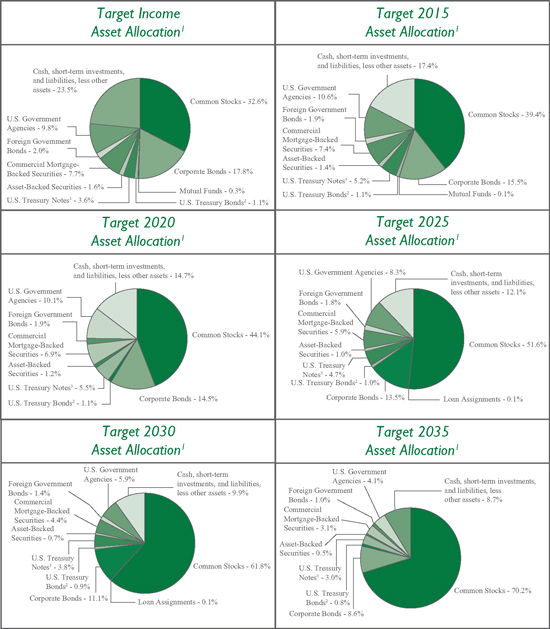
1 Represents portfolio composition of the underlying investment(s) for each Series as a percentage of net assets.
2 A U.S. Treasury Bond is a long-term obligation of the U.S. Treasury issued with a maturity period of more than ten years.
3 A U.S. Treasury Note is an intermediate-term obligation of the U.S. Treasury issued with a maturity period between one and ten years.
5
Portfolio Composition as of April 30, 2016 - Asset Allocation1
(unaudited)
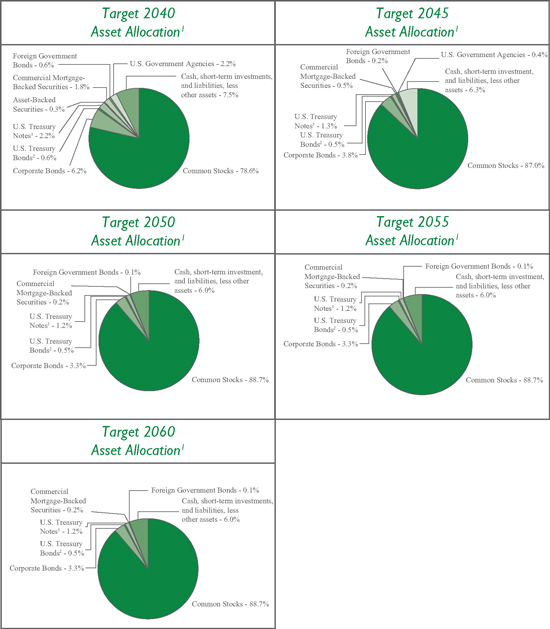
1 Represents portfolio composition of the underlying investment(s) for each Series as a percentage of net assets.
2 A U.S. Treasury Bond is a long-term obligation of the U.S. Treasury issued with a maturity period of more than ten years.
3 A U.S. Treasury Note is an intermediate-term obligation of the U.S. Treasury issued with a maturity period between one and ten years.
6
Investment Portfolios - April 30, 2016
(unaudited)
| | | | | | | | | | |
| TARGET INCOME SERIES | | SHARES | | | VALUE (NOTE 2) | | | |
| | | |
AFFILIATED INVESTMENT COMPANIES - 100.0% | | | | | | | | | | |
Manning & Napier Pro-Blend® Conservative Term Series - Class I | | | 8,116,433 | | | $ | 82,625,287 | | | |
| | | | | | | | | | |
| | | |
TOTAL AFFILIATED INVESTMENT COMPANIES | | | | | | | | | | |
(Identified Cost $87,218,203) | | | | | | | 82,625,287 | | | |
LIABILITIES, LESS OTHER ASSETS - 0.0%* | | | | | | | (20,139 | ) | | |
| | | | | | | | | | |
| | | |
NET ASSETS - 100% | | | | | | $ | 82,605,148 | | | |
| | | | | | | | | | |
*Less than (0.1%). | | | | | | | | | | |
| | | | | | | | | | |
| TARGET 2015 SERIES | | SHARES | | | VALUE (NOTE 2) | | | |
| | | |
AFFILIATED INVESTMENT COMPANIES - 100.3% | | | | | | | | | | |
Manning & Napier Pro-Blend® Conservative Term Series - Class I | | | 146,933 | | | $ | 1,495,777 | | | |
Manning & Napier Pro-Blend® Moderate Term Series - Class I | | | 525,216 | | | | 5,252,164 | | | |
| | | | | | | | | | |
| | | |
TOTAL AFFILIATED INVESTMENT COMPANIES | | | | | | | | | | |
(Identified Cost $6,755,413) | | | | | | | 6,747,941 | | | |
LIABILITIES, LESS OTHER ASSETS - (0.3%) | | | | | | | (23,174 | ) | | |
| | | | | | | | | | |
| | | |
NET ASSETS - 100% | | | | | | $ | 6,724,767 | | | |
| | | | | | | | | | |
| | | | | | | | | | |
| TARGET 2020 SERIES | | SHARES | | | VALUE (NOTE 2) | | | |
| | | |
AFFILIATED INVESTMENT COMPANIES - 100.0% | | | | | | | | | | |
Manning & Napier Pro-Blend® Extended Term Series - Class I | | | 3,233,934 | | | $ | 30,075,588 | | | |
Manning & Napier Pro-Blend® Moderate Term Series - Class I | | | 12,132,704 | | | | 121,327,040 | | | |
| | | | | | | | | | |
| | | |
TOTAL AFFILIATED INVESTMENT COMPANIES | | | | | | | | | | |
(Identified Cost $161,087,600) | | | | | | | 151,402,628 | | | |
LIABILITIES, LESS OTHER ASSETS - 0.0%* | | | | | | | (28,284 | ) | | |
| | | | | | | | | | |
| | | |
NET ASSETS - 100% | | | | | | $ | 151,374,344 | | | |
| | | | | | | | | | |
*Less than (0.1%). | | | | | | | | | | |
The accompanying notes are an integral part of the financial statements.
7
Investment Portfolios - April 30, 2016
(unaudited)
| | | | | | | | | | |
| TARGET 2025 SERIES | | SHARES | | | VALUE (NOTE 2) | | | |
| | | |
AFFILIATED INVESTMENT COMPANIES - 100.1% | | | | | | | | | | |
Manning & Napier Pro-Blend® Extended Term Series - Class I | | | 2,379,049 | | | $ | 22,125,154 | | | |
Manning & Napier Pro-Blend® Moderate Term Series - Class I | | | 777,616 | | | | 7,776,161 | | | |
| | | | | | | | | | |
| | | |
TOTAL AFFILIATED INVESTMENT COMPANIES | | | | | | | | | | |
(Identified Cost $30,579,741) | | | | | | | 29,901,315 | | | |
LIABILITIES, LESS OTHER ASSETS - (0.1%) | | | | | | | (32,171 | ) | | |
| | | | | | | | | | |
| | | |
NET ASSETS - 100% | | | | | | $ | 29,869,144 | | | |
| | | | | | | | | | |
| | | | | | | | | | |
| TARGET 2030 SERIES | | SHARES | | | VALUE (NOTE 2) | | | |
| | | |
AFFILIATED INVESTMENT COMPANIES - 100.0% | | | | | | | | | | |
Manning & Napier Pro-Blend® Extended Term Series - Class I | | | 14,222,047 | | | $ | 132,265,040 | | | |
Manning & Napier Pro-Blend® Maximum Term Series - Class I | | | 3,274,410 | | | | 32,744,095 | | | |
| | | | | | | | | | |
| | | |
TOTAL AFFILIATED INVESTMENT COMPANIES | | | | | | | | | | |
(Identified Cost $181,626,070) | | | | | | | 165,009,135 | | | |
LIABILITIES, LESS OTHER ASSETS - 0.0%* | | | | | | | (32,303 | ) | | |
| | | | | | | | | | |
| | | |
NET ASSETS - 100% | | | | | | $ | 164,976,832 | | | |
| | | | | | | | | | |
*Less than (0.1%). | | | | | | | | | | |
| | | | | | | | | | |
| TARGET 2035 SERIES | | SHARES | | | VALUE (NOTE 2) | | | |
| | | |
AFFILIATED INVESTMENT COMPANIES - 100.1% | | | | | | | | | | |
Manning & Napier Pro-Blend® Extended Term Series - Class I | | | 1,375,289 | | | $ | 12,790,187 | | | |
Manning & Napier Pro-Blend® Maximum Term Series - Class I | | | 1,044,219 | | | | 10,442,195 | | | |
| | | | | | | | | | |
| | | |
TOTAL AFFILIATED INVESTMENT COMPANIES | | | | | | | | | | |
(Identified Cost $25,345,050) | | | | | | | 23,232,382 | | | |
LIABILITIES, LESS OTHER ASSETS - (0.1%) | | | | | | | (32,624 | ) | | |
| | | | | | | | | | |
| | | |
NET ASSETS - 100% | | | | | | $ | 23,199,758 | | | |
| | | | | | | | | | |
The accompanying notes are an integral part of the financial statements.
8
Investment Portfolios - April 30, 2016
(unaudited)
| | | | | | | | | | |
| TARGET 2040 SERIES | | SHARES | | | VALUE (NOTE 2) | | | |
| | | |
AFFILIATED INVESTMENT COMPANIES - 100.0% | | | | | | | | | | |
Manning & Napier Pro-Blend® Extended Term Series - Class I | | | 3,326,381 | | | $ | 30,935,342 | | | |
Manning & Napier Pro-Blend® Maximum Term Series - Class I | | | 7,196,872 | | | | 71,968,719 | | | |
| | | | | | | | | | |
| | | |
TOTAL AFFILIATED INVESTMENT COMPANIES | | | | | | | | | | |
(Identified Cost $111,474,975) | | | | | | | 102,904,061 | | | |
LIABILITIES, LESS OTHER ASSETS - 0.0%* | | | | | | | (22,310 | ) | | |
| | | | | | | | | | |
| | | |
NET ASSETS - 100% | | | | | | $ | 102,881,751 | | | |
| | | | | | | | | | |
| | | |
*Less than (0.1%). | | | | | | | | | | |
| | | | | | | | | | |
| TARGET 2045 SERIES | | SHARES | | | VALUE (NOTE 2) | | | |
| | | |
AFFILIATED INVESTMENT COMPANIES - 100.2% | | | | | | | | | | |
Manning & Napier Pro-Blend® Extended Term Series - Class I | | | 66,024 | | | $ | 614,019 | | | |
Manning & Napier Pro-Blend® Maximum Term Series - Class I | | | 1,137,005 | | | | 11,370,050 | | | |
| | | | | | | | | | |
| | | |
TOTAL AFFILIATED INVESTMENT COMPANIES | | | | | | | | | | |
(Identified Cost $12,638,782) | | | | | | | 11,984,069 | | | |
LIABILITIES, LESS OTHER ASSETS - (0.2%) | | | | | | | (28,689 | ) | | |
| | | | | | | | | | |
| | | |
NET ASSETS - 100% | | | | | | $ | 11,955,380 | | | |
| | | | | | | | | | |
| | | | | | | | | | |
| TARGET 2050 SERIES | | SHARES | | | VALUE (NOTE 2) | | | |
| | | |
AFFILIATED INVESTMENT COMPANIES - 100.0% | | | | | | | | | | |
Manning & Napier Pro-Blend® Maximum Term Series - Class I | | | 3,420,322 | | | $ | 34,203,220 | | | |
| | | | | | | | | | |
| | | |
TOTAL AFFILIATED INVESTMENT COMPANIES | | | | | | | | | | |
(Identified Cost $36,096,928) | | | | | | | 34,203,220 | | | |
LIABILITIES, LESS OTHER ASSETS - 0.0%* | | | | | | | (9,867 | ) | | |
| | | | | | | | | | |
| | | |
NET ASSETS - 100% | | | | | | $ | 34,193,353 | | | |
| | | | | | | | | | |
| | | |
*Less than (0.1%). | | | | | | | | | | |
The accompanying notes are an integral part of the financial statements.
9
Investment Portfolios - April 30, 2016
(unaudited)
| | | | | | | | | | |
| TARGET 2055 SERIES | | SHARES | | | VALUE (NOTE 2) | | | |
| | | |
AFFILIATED INVESTMENT COMPANIES - 100.6% | | | | | | | | | | |
Manning & Napier Pro-Blend® Maximum Term Series - Class I | | | 434,751 | | | $ | 4,347,515 | | | |
| | | | | | | | | | |
| | | |
TOTAL AFFILIATED INVESTMENT COMPANIES | | | | | | | | | | |
(Identified Cost $4,502,892) | | | | | | | 4,347,515 | | | |
LIABILITIES, LESS OTHER ASSETS - (0.6%) | | | | | | | (27,455 | ) | | |
| | | | | | | | | | |
| | | |
NET ASSETS - 100% | | | | | | $ | 4,320,060 | | | |
| | | | | | | | | | |
| | | | | | | | | | |
| TARGET 2060 SERIES | | SHARES | | | VALUE (NOTE 2) | | | |
| | | |
AFFILIATED INVESTMENT COMPANIES - 102.0% | | | | | | | | | | |
Manning & Napier Pro-Blend® Maximum Term Series - Class I | | | 118,588 | | | $ | 1,185,875 | | | |
| | | | | | | | | | |
| | | |
TOTAL AFFILIATED INVESTMENT COMPANIES | | | | | | | | | | |
(Identified Cost $1,082,391) | | | | | | | 1,185,875 | | | |
LIABILITIES, LESS OTHER ASSETS - (2.0%) | | | | | | | (23,265 | ) | | |
| | | | | | | | | | |
| | | |
NET ASSETS - 100% | | | | | | $ | 1,162,610 | | | |
| | | | | | | | | | |
The accompanying notes are an integral part of the financial statements.
10
Statements of Assets and Liabilities
April 30, 2016 (unaudited)
| | | | | | | | | | | | | | | | | | | | |
| | | TARGET
INCOME | | | TARGET
2015 | | | TARGET 2020 | | | TARGET 2025 | | | TARGET 2030 | |
ASSETS: | | | | | | | | | | | | | | | | | | | | |
| | | | | |
Total investments in Underlying Series: | | | | | | | | | | | | | | | | | | | | |
At value* | | $ | 82,625,287 | | | $ | 6,747,941 | | | $ | 151,402,628 | | | $ | 29,901,315 | | | $ | 165,009,135 | |
Receivable from Advisor (Note 3) | | | 7,544 | | | | 9,689 | | | | 6,062 | | | | 9,173 | | | | 6,683 | |
Receivable for shares of Underlying Series sold | | | 43,528 | | | | 64,279 | | | | 20,665 | | | | 2,264 | | | | — | |
Receivable for fund shares sold | | | 11,209 | | | | 615 | | | | 29,783 | | | | 12,372 | | | | 43,592 | |
Prepaid expenses | | | 28,102 | | | | 92 | | | | 26,001 | | | | 348 | | | | 23,923 | |
| | | | | | | | | | | | | | | | | | | | |
| | | | | |
TOTAL ASSETS | | | 82,715,670 | | | | 6,822,616 | | | | 151,485,139 | | | | 29,925,472 | | | | 165,083,333 | |
| | | | | | | | | | | | | | | | | | | | |
LIABILITIES: | | | | | | | | | | | | | | | | | | | | |
Accrued fund accounting and administration fees (Note 3) | | | 18,873 | | | | 13,642 | | | | 14,776 | | | | 18,286 | | | | 14,669 | |
Accrued distribution and service (Rule 12b-1) fees (Note 3) | | | 13,813 | | | | 1,012 | | | | 18,288 | | | | 3,323 | | | | 19,920 | |
Accrued transfer agent fees (Note 3) | | | 1,874 | | | | 293 | | | | 1,380 | | | | 506 | | | | 2,992 | |
Accrued Chief Compliance Officer service fees (Note 3) | | | 381 | | | | 381 | | | | 381 | | | | 381 | | | | 381 | |
Payable for fund shares repurchased | | | 54,709 | | | | 64,678 | | | | 50,287 | | | | 14,173 | | | | 37,279 | |
Accrued printing and postage | | | 11,103 | | | | 2,162 | | | | 7,417 | | | | 2,173 | | | | 7,413 | |
Audit fees payable | | | 5,776 | | | | 11,761 | | | | 11,430 | | | | 11,706 | | | | 11,446 | |
Payable for shares of Underlying Series purchased | | | — | | | | — | | | | — | | | | — | | | | 5,019 | |
Custodian fees payable | | | 3,298 | | | | 1,449 | | | | 6,302 | | | | 1,820 | | | | 6,833 | |
Other payables and accrued expenses | | | 695 | | | | 2,471 | | | | 534 | | | | 3,960 | | | | 549 | |
| | | | | | | | | | | | | | | | | | | | |
| | | | | |
TOTAL LIABILITIES | | | 110,522 | | | | 97,849 | | | | 110,795 | | | | 56,328 | | | | 106,501 | |
| | | | | | | | | | | | | | | | | | | | |
| | | | | |
TOTAL NET ASSETS | | $ | 82,605,148 | | | $ | 6,724,767 | | | $ | 151,374,344 | | | $ | 29,869,144 | | | $ | 164,976,832 | |
| | | | | | | | | | | | | | | | | | | | |
NET ASSETS CONSIST OF: | | | | | | | | | | | | | | | | | | | | |
Capital stock | | | 89,418 | | | | 6,532 | | | | 176,589 | | | | 27,820 | | | | 196,008 | |
Additional paid-in-capital | | | 88,675,953 | | | | 7,628,586 | | | | 165,869,187 | | | | 33,322,570 | | | | 184,331,742 | |
Distributions in excess of net investment income | | | (69,495 | ) | | | (5,183 | ) | | | (98,651 | ) | | | (17,263 | ) | | | (104,313 | ) |
Accumulated net realized loss on Underlying Series | | | (1,497,812 | ) | | | (897,696 | ) | | | (4,887,809 | ) | | | (2,785,557 | ) | | | (2,829,670 | ) |
Net unrealized depreciation on Underlying Series | | | (4,592,916 | ) | | | (7,472 | ) | | | (9,684,972 | ) | | | (678,426 | ) | | | (16,616,935 | ) |
| | | | | | | | | | | | | | | | | | | | |
| | | | | |
TOTAL NET ASSETS | | $ | 82,605,148 | | | $ | 6,724,767 | | | $ | 151,374,344 | | | $ | 29,869,144 | | | $ | 164,976,832 | |
| | | | | | | | | | | | | | | | | | | | |
Class K | | | | | | | | | | | | | | | | | | | | |
Net Assets | | $ | 64,876,404 | | | $ | 3,291,469 | | | $ | 77,727,774 | | | $ | 12,219,904 | | | $ | 79,714,066 | |
Shares Outstanding | | | 7,026,691 | | | | 320,252 | | | | 9,081,618 | | | | 1,136,656 | | | | 9,510,575 | |
Net Asset Value, Offering Price, and Redemption Price per share | | $ | 9.23 | | | $ | 10.28 | | | $ | 8.56 | | | $ | 10.75 | | | $ | 8.38 | |
Class R | | | | | | | | | | | | | | | | | | | | |
Net Assets | | $ | 1,240,384 | | | $ | 780,054 | | | $ | 5,855,233 | | | $ | 2,126,085 | | | $ | 8,955,520 | |
Shares Outstanding | | | 135,862 | | | | 75,731 | | | | 692,972 | | | | 197,174 | | | | 1,078,252 | |
Net Asset Value, Offering Price, and Redemption Price per share | | $ | 9.13 | | | $ | 10.30 | | | $ | 8.45 | | | $ | 10.78 | | | $ | 8.31 | |
Class I | | | | | | | | | | | | | | | | | | | | |
Net Assets | | $ | 16,488,360 | | | $ | 2,653,244 | | | $ | 67,791,337 | | | $ | 15,523,155 | | | $ | 76,307,246 | |
Shares Outstanding | | | 1,779,295 | | | | 257,255 | | | | 7,884,311 | | | | 1,448,132 | | | | 9,011,978 | |
Net Asset Value, Offering Price, and Redemption Price per share | | $ | 9.27 | | | $ | 10.31 | | | $ | 8.60 | | | $ | 10.72 | | | $ | 8.47 | |
| | | | | |
*At identified cost | | $ | 87,218,203 | | | $ | 6,755,413 | | | $ | 161,087,600 | | | $ | 30,579,741 | | | $ | 181,626,070 | |
| | | | | | | | | | | | | | | | | | | | |
The accompanying notes are an integral part of the financial statements.
11
Statements of Assets and Liabilities
April 30, 2016 (unaudited)
| | | | | | | | | | | | | | | | | | | | | | | | |
| | | TARGET
2035 | | | TARGET 2040 | | | TARGET
2045 | | | TARGET
2050 | | | TARGET
2055 | | | TARGET
2060 | |
ASSETS: | | | | | | | | | | | | | | | | | | | | | | | | |
| | | | | | |
Total investments in Underlying Series: | | | | | | | | | | | | | | | | | | | | | | | | |
At value* | | $ | 23,232,382 | | | $ | 102,904,061 | | | $ | 11,984,069 | | | $ | 34,203,220 | | | $ | 4,347,515 | | | $ | 1,185,875 | |
Receivable from Advisor (Note 3) | | | 9,371 | | | | 7,527 | | | | 9,531 | | | | 9,726 | | | | 9,868 | | | | 7,434 | |
Receivable for shares of Underlying Series sold | | | — | | | | — | | | | 5,570 | | | | 93,643 | | | | — | | | | — | |
Receivable for fund shares sold | | | 13,715 | | | | 32,252 | | | | 8,717 | | | | 33,931 | | | | 8,063 | | | | 4,512 | |
Prepaid expenses | | | 178 | | | | 23,770 | | | | 124 | | | | 20,881 | | | | 44 | | | | 4,502 | |
| | | | | | | | | | | | | | | | | | | | | | | | |
| | | | | | |
TOTAL ASSETS | | | 23,255,646 | | | | 102,967,610 | | | | 12,008,011 | | | | 34,361,401 | | | | 4,365,490 | | | | 1,202,323 | |
| | | | | | | | | | | | | | | | | | | | | | | | |
LIABILITIES: | | | | | | | | | | | | | | | | | | | | | | | | |
Accrued fund accounting and administration fees (Note 3) | | | 18,545 | | | | 16,116 | | | | 18,966 | | | | 17,636 | | | | 19,181 | | | | 15,012 | |
Accrued distribution and service (Rule 12b-1) fees (Note 3) | | | 3,092 | | | | 12,864 | | | | 1,787 | | | | 3,931 | | | | 466 | | | | 235 | |
Accrued transfer agent fees (Note 3) | | | 423 | | | | 1,598 | | | | 422 | | | | 2,238 | | | | 546 | | | | 386 | |
Accrued Chief Compliance Officer service fees (Note 3) | | | 381 | | | | 381 | | | | 381 | | | | 381 | | | | 381 | | | | 1,197 | |
Payable for shares of Underlying Series purchased | | | 12,842 | | | | 23,923 | | | | — | | | | — | | | | 5,149 | | | | 4,178 | |
Audit fees payable | | | 11,722 | | | | 11,580 | | | | 11,752 | | | | 10,996 | | | | 11,770 | | | | 18,120 | |
Custodian fees payable | | | 2,580 | | | | 5,213 | | | | 1,243 | | | | 2,646 | | | | 1,129 | | | | 353 | |
Accrued printing and postage | | | 2,547 | | | | 6,120 | | | | 2,618 | | | | 5,389 | | | | 2,029 | | | | 232 | |
Payable for fund shares repurchased | | | 798 | | | | 7,581 | | | | 13,404 | | | | 124,408 | | | | 2,329 | | | | — | |
Other payables and accrued expenses | | | 2,958 | | | | 483 | | | | 2,058 | | | | 423 | | | | 2,450 | | | | — | |
| | | | | | | | | | | | | | | | | | | | | | | | |
| | | | | | |
TOTAL LIABILITIES | | | 55,888 | | | | 85,859 | | | | 52,631 | | | | 168,048 | | | | 45,430 | | | | 39,713 | |
| | | | | | | | | | | | | | | | | | | | | | | | |
| | | | | | |
TOTAL NET ASSETS | | $ | 23,199,758 | | | $ | 102,881,751 | | | $ | 11,955,380 | | | $ | 34,193,353 | | | $ | 4,320,060 | | | $ | 1,162,610 | |
| | | | | | | | | | | | | | | | | | | | | | | | |
NET ASSETS CONSIST OF: | | | | | | | | | | | | | | | | | | | | | | | | |
Capital stock | | | 20,963 | | | | 120,066 | | | | 10,434 | | | | 36,952 | | | | 3,750 | | | | 1,112 | |
Additional paid-in-capital | | | 26,388,408 | | | | 115,262,370 | | | | 13,355,662 | | | | 37,414,183 | | | | 4,758,679 | | | | 1,055,675 | |
Distributions in excess of net investment income | | | (15,318 | ) | | | (65,515 | ) | | | (7,924 | ) | | | (20,374 | ) | | | (2,285 | ) | | | (916 | ) |
Accumulated net realized gain (loss) on Underlying Series | | | (1,081,627 | ) | | | (3,864,256 | ) | | | (748,080 | ) | | | (1,343,700 | ) | | | (284,707 | ) | | | 3,255 | |
Net unrealized appreciation (depreciation) on Underlying Series | | | (2,112,668 | ) | | | (8,570,914 | ) | | | (654,712 | ) | | | (1,893,708 | ) | | | (155,377 | ) | | | 103,484 | |
| | | | | | | | | | | | | | | | | | | | | | | | |
| | | | | | |
TOTAL NET ASSETS | | $ | 23,199,758 | | | $ | 102,881,751 | | | $ | 11,955,380 | | | $ | 34,193,353 | | | $ | 4,320,060 | | | $ | 1,162,610 | |
| | | | | | | | | | | | | | | | | | | | | | | | |
Class K | | | | | | | | | | | | | | | | | | | | | | | | |
Net Assets | | $ | 10,130,751 | | | $ | 54,003,214 | | | $ | 5,659,840 | | | $ | 13,994,279 | | | $ | 1,350,186 | | | $ | 1,021,686 | |
Shares Outstanding | | | 917,189 | | | | 6,323,042 | | | | 493,971 | | | | 1,516,992 | | | | 117,641 | | | | 97,704 | |
Net Asset Value, Offering Price, and Redemption Price per share | | $ | 11.05 | | | $ | 8.54 | | | $ | 11.46 | | | $ | 9.23 | | | $ | 11.48 | | | $ | 10.46 | |
Class R | | | | | | | | | | | | | | | | | | | | | | | | |
Net Assets | | $ | 2,570,159 | | | $ | 4,688,179 | | | $ | 1,688,755 | | | $ | 2,397,724 | | | $ | 492,389 | | | $ | 86,297 | |
Shares Outstanding | | | 232,081 | | | | 552,850 | | | | 148,202 | | | | 262,705 | | | | 43,302 | | | | 8,261 | |
Net Asset Value, Offering Price, and Redemption Price per share | | $ | 11.07 | | | $ | 8.48 | | | $ | 11.39 | | | $ | 9.13 | | | $ | 11.37 | | | $ | 10.45 | |
Class I | | | | | | | | | | | | | | | | | | | | | | | | |
Net Assets | | $ | 10,498,848 | | | $ | 44,190,358 | | | $ | 4,606,785 | | | $ | 17,801,350 | | | $ | 2,477,485 | | | $ | 54,627 | |
Shares Outstanding | | | 947,059 | | | | 5,130,674 | | | | 401,237 | | | | 1,915,501 | | | | 214,023 | | | | 5,220 | |
Net Asset Value, Offering Price, and Redemption Price per share | | $ | 11.09 | | | $ | 8.61 | | | $ | 11.48 | | | $ | 9.29 | | | $ | 11.58 | | | $ | 10.46 | |
| | | | | | |
*At identified cost | | $ | 25,345,050 | | | $ | 111,474,975 | | | $ | 12,638,782 | | | $ | 36,096,928 | | | $ | 4,502,892 | | | $ | 1,082,391 | |
| | | | | | | | | | | | | | | | | | | | | | | | |
The accompanying notes are an integral part of the financial statements.
12
Statements of Operations
For the Six Months Ended April 30, 2016 (unaudited)
| | | | | | | | | | | | | | | | | | | | |
| | | TARGET
INCOME | | | TARGET
2015 | | | TARGET
2020 | | | TARGET
2025 | | | TARGET
2030 | |
INVESTMENT INCOME: | | | | | | | | | | | | | | | | | | | | |
Income distributions from Underlying Series | | $ | 1,323,991 | | | $ | 71,613 | | | $ | 1,440,186 | | | $ | 271,512 | | | $ | 1,320,957 | |
| | | | | | | | | | | | | | | | | | | | |
EXPENSES: | | | | | | | | | | | | | | | | | | | | |
Distribution and services (Rule 12b-1) fees (Class K) (Note 3) | | | 80,520 | | | | 4,107 | | | | 95,801 | | | | 14,039 | | | | 95,490 | |
Distribution and services (Rule 12b-1) fees (Class R) (Note 3) | | | 4,319 | | | | 1,932 | | | | 16,420 | | | | 5,036 | | | | 24,108 | |
Fund accounting and administration fees (Note 3) | | | 25,312 | | | | 24,275 | | | | 26,028 | | | | 24,481 | | | | 26,046 | |
Transfer agent fees (Note 3) | | | 2,216 | | | | 650 | | | | 2,395 | | | | 1,037 | | | | 5,059 | |
Chief Compliance Officer service fees
(Note 3) | | | 1,258 | | | | 1,258 | | | | 1,257 | | | | 1,258 | | | | 1,258 | |
Directors’ fees (Note 3) | | | 1,137 | | | | 160 | | | | 2,868 | | | | 452 | | | | 3,048 | |
Registration and filing fees | | | 15,875 | | | | 18,992 | | | | 15,676 | | | | 19,447 | | | | 16,292 | |
Audit fees | | | 9,172 | | | | 9,140 | | | | 9,222 | | | | 9,147 | | | | 9,232 | |
Printing and postage fees | | | 6,035 | | | | 2,193 | | | | 8,929 | | | | 2,945 | | | | 12,065 | |
Custodian fees | | | 2,406 | | | | 1,309 | | | | 5,291 | | | | 1,640 | | | | 5,608 | |
Miscellaneous | | | 2,912 | | | | 2,523 | | | | 2,648 | | | | 2,563 | | | | 2,667 | |
| | | | | | | | | | | | | | | | | | | | |
| | | | | |
Total Expenses | | | 151,162 | | | | 66,539 | | | | 186,535 | | | | 82,045 | | | | 200,873 | |
Less reduction of expenses (Note 3) | | | (44,852 | ) | | | (58,622 | ) | | | (36,353 | ) | | | (55,922 | ) | | | (41,726 | ) |
| | | | | | | | | | | | | | | | | | | | |
| | | | | |
Net Expenses | | | 106,310 | | | | 7,917 | | | | 150,182 | | | | 26,123 | | | | 159,147 | |
| | | | | | | | | | | | | | | | | | | | |
| | | | | |
NET INVESTMENT INCOME | | | 1,217,681 | | | | 63,696 | | | | 1,290,004 | | | | 245,389 | | | | 1,161,810 | |
| | | | | | | | | | | | | | | | | | | | |
REALIZED AND UNREALIZED GAIN (LOSS) ON UNDERLYING SERIES: | | | | | | | | | | | | | | | | | | | | |
Net realized loss on Underlying Series | | | (1,296,698 | ) | | | (714,251 | ) | | | (4,852,202 | ) | | | (2,725,954 | ) | | | (5,357,608 | ) |
Distributions of realized gains from Underlying Series | | | — | | | | 27,713 | | | | 1,335,904 | | | | 658,304 | | | | 3,581,593 | |
Net change in unrealized depreciation on Underlying Series | | | 548,238 | | | | 587,612 | | | | 2,269,765 | | | | 1,932,202 | | | | 1,232,888 | |
| | | | | | | | | | | | | | | | | | | | |
| | | | | |
NET REALIZED AND UNREALIZED GAIN (LOSS) ON UNDERLYING SERIES | | | (748,460 | ) | | | (98,926 | ) | | | (1,246,533 | ) | | | (135,448 | ) | | | (543,127 | ) |
| | | | | | | | | | | | | | | | | | | | |
| | | | | |
NET INCREASE (DECREASE) IN NET ASSETS RESULTING FROM OPERATIONS | | $ | 469,221 | | | $ | (35,230 | ) | | $ | 43,471 | | | $ | 109,941 | | | $ | 618,683 | |
| | | | | | | | | | | | | | | | | | | | |
The accompanying notes are an integral part of the financial statements.
13
Statements of Operations
For the Six Months Ended April 30, 2016 (unaudited)
| | | | | | | | | | | | | | | | | | | | | | | | |
| | | TARGET 2035 | | | TARGET 2040 | | | TARGET
2045 | | | TARGET 2050 | | | TARGET 2055 | | | TARGET 2060 | |
| | | | | | |
INVESTMENT INCOME: | | | | | | | | | | | | | | | | | | | | | | | | |
| | | | | | |
Income distributions from Underlying Series | | $ | 146,575 | | | $ | 534,025 | | | $ | 38,498 | | | $ | 128,070 | | | $ | 13,126 | | | $ | 661 | |
| | | | | | | | | | | | | | | | | | | | | | | | |
| | | | | | |
EXPENSES: | | | | | | | | | | | | | | | | | | | | | | | | |
Distribution and services (Rule 12b-1) fees (Class K) (Note 3) | | | 11,413 | | | | 63,579 | | | | 5,148 | | | | 17,599 | | | | 1,425 | | | | 654 | |
Distribution and services (Rule 12b-1) fees (Class R) (Note 3) | | | 5,854 | | | | 11,637 | | | | 3,993 | | | | 5,376 | | | | 1,056 | | | | 162 | |
Fund accounting and administration fees (Note 3) | | | 24,408 | | | | 25,306 | | | | 24,250 | | | | 24,514 | | | | 24,175 | | | | 23,497 | |
Chief Compliance Officer service fees
(Note 3) | | | 1,257 | | | | 1,257 | | | | 1,258 | | | | 1,257 | | | | 1,257 | | | | 2,057 | |
Transfer agent fees (Note 3) | | | 870 | | | | 2,723 | | | | 919 | | | | 3,729 | | | | 1,087 | | | | 504 | |
Directors’ fees (Note 3) | | | 344 | | | | 1,890 | | | | 149 | | | | 756 | | | | 51 | | | | 50 | |
Registration and filing fees | | | 18,967 | | | | 15,443 | | | | 18,666 | | | | 15,439 | | | | 19,325 | | | | 8,547 | |
Audit fees | | | 9,143 | | | | 9,197 | | | | 9,138 | | | | 9,165 | | | | 9,136 | | | | 15,477 | |
Printing and postage fees | | | 2,710 | | | | 8,332 | | | | 2,701 | | | | 8,084 | | | | 2,381 | | | | 496 | |
Custodian fees | | | 2,312 | | | | 4,262 | | | | 1,121 | | | | 2,026 | | | | 1,014 | | | | 295 | |
Miscellaneous | | | 2,538 | | | | 2,602 | | | | 2,508 | | | | 2,542 | | | | 2,491 | | | | 1,379 | |
| | | | | | | | | | | | | | | | | | | | | | | | |
Total Expenses | | | 79,816 | | | | 146,228 | | | | 69,851 | | | | 90,487 | | | | 63,398 | | | | 53,118 | |
Less reduction of expenses (Note 3) | | | (57,166 | ) | | | (46,750 | ) | | | (58,218 | ) | | | (59,548 | ) | | | (60,037 | ) | | | (52,142 | ) |
| | | | | | | | | | | | | | | | | | | | | | | | |
Net Expenses | | | 22,650 | | | | 99,478 | | | | 11,633 | | | | 30,939 | | | | 3,361 | | | | 976 | |
| | | | | | | | | | | | | | | | | | | | | | | | |
NET INVESTMENT INCOME (LOSS) | | | 123,925 | | | | 434,547 | | | | 26,865 | | | | 97,131 | | | | 9,765 | | | | (315 | ) |
| | | | | | | | | | | | | | | | | | | | | | | | |
| | | | | | |
REALIZED AND UNREALIZED GAIN (LOSS) ON UNDERLYING SERIES: | | | | | | | | | | | | | | | | | | | | | | | | |
Net realized gain (loss) on Underlying Series | | | (744,380 | ) | | | (4,129,715 | ) | | | (510,985 | ) | | | (1,200,027 | ) | | | (100,482 | ) | | | 146 | |
Distributions of realized gains from Underlying Series | | | 456,356 | | | | 1,990,461 | | | | 183,337 | | | | 609,890 | | | | 62,510 | | | | 3,143 | |
Net change in unrealized appreciation (depreciation) on Underlying Series | | | 361,235 | | | | 2,546,361 | | | | 524,204 | | | | 948,516 | | | | 137,006 | | | | 97,993 | |
| | | | | | | | | | | | | | | | | | | | | | | | |
NET REALIZED AND UNREALIZED GAIN (LOSS) ON UNDERLYING SERIES | | | 73,211 | | | | 407,107 | | | | 196,556 | | | | 358,379 | | | | 99,034 | | | | 101,282 | |
| | | | | | | | | | | | | | | | | | | | | | | | |
NET INCREASE IN NET ASSETS RESULTING FROM OPERATIONS | | $ | 197,136 | | | $ | 841,654 | | | $ | 223,421 | | | $ | 455,510 | | | $ | 108,799 | | | $ | 100,967 | |
| | | | | | | | | | | | | | | | | | | | | | | | |
The accompanying notes are an integral part of the financial statements.
14
Statements of Changes in Net Assets
| | | | | | | | | | | | | | | | |
| | | TARGET INCOME
FOR THE SIX
MONTHS ENDED 4/30/16
(UNAUDITED) | | | FOR THE
YEAR ENDED
10/31/15 | | | TARGET 2015
FOR THE SIX
MONTHS
ENDED
4/30/16
(UNAUDITED) | | | FOR THE
YEAR ENDED
10/31/15 | |
| | | | |
INCREASE (DECREASE) IN NET ASSETS: | | | | | | | | | | | | | | | | |
| | | | |
OPERATIONS: | | | | | | | | | | | | | | | | |
Net investment income | | $ | 1,217,681 | | | $ | 1,174,075 | | | $ | 63,696 | | | $ | 115,679 | |
Net realized gain (loss) on Underlying Series | | | (1,296,698 | ) | | | 327,062 | | | | (714,251 | ) | | | (354,202 | ) |
Distributions of realized gains from Underlying Series | | | — | | | | 4,306,403 | | | | 27,713 | | | | 852,222 | |
Net change in unrealized appreciation (depreciation) on Underlying Series | | | 548,238 | | | | (6,081,504 | ) | | | 587,612 | | | | (763,903 | ) |
| | | | | | | | | | | | | | | | |
| | | | |
Net increase (decrease) from operations | | | 469,221 | | | | (273,964 | ) | | | (35,230 | ) | | | (150,204 | ) |
| | | | | | | | | | | | | | | | |
| | | | |
DISTRIBUTIONS TO SHAREHOLDERS (Note 8): | | | | | | | | | | | | | | | | |
From net investment income (Class K) | | | (948,068 | ) | | | (1,346,562 | ) | | | (28,641 | ) | | | (74,230 | ) |
From net investment income (Class R) | | | (26,997 | ) | | | (278,571 | ) | | | (6,194 | ) | | | (31,804 | ) |
From net investment income (Class I) | | | (363,250 | ) | | | (368,537 | ) | | | (40,501 | ) | | | (129,353 | ) |
From net realized gain on investments (Class K) | | | (2,870,405 | ) | | | (3,365,065 | ) | | | (238,125 | ) | | | (102,766 | ) |
From net realized gain on investments (Class R) | | | (90,931 | ) | | | (851,245 | ) | | | (59,085 | ) | | | (52,006 | ) |
From net realized gain on investments (Class I) | | | (1,015,587 | ) | | | (818,325 | ) | | | (289,064 | ) | | | (159,729 | ) |
| | | | | | | | | | | | | | | | |
| | | | |
Total distributions to shareholders | | | (5,315,238 | ) | | | (7,028,305 | ) | | | (661,610 | ) | | | (549,888 | ) |
| | | | | | | | | | | | | | | | |
| | | | |
CAPITAL STOCK ISSUED AND REPURCHASED: | | | | | | | | | | | | | | | | |
| | | | |
Net increase (decrease) from capital share transactions (Note 6) | | | (8,339,213 | ) | | | 25,635,184 | | | | (2,045,613 | ) | | | 595,483 | |
| | | | | | | | | | | | | | | | |
Net increase (decrease) in net assets | | | (13,185,230 | ) | | | 18,332,915 | | | | (2,742,453 | ) | | | (104,609 | ) |
| | | | |
NET ASSETS: | | | | | | | | | | | | | | | | |
| | | | |
Beginning of period | | | 95,790,378 | | | | 77,457,463 | | | | 9,467,220 | | | | 9,571,829 | |
| | | | | | | | | | | | | | | | |
| | | | |
End of period1 | | $ | 82,605,148 | | | $ | 95,790,378 | | | $ | 6,724,767 | | | $ | 9,467,220 | |
| | | | | | | | | | | | | | | | |
1 Including undistributed (distributions in excess of) net investment income: | | $ | (69,495 | ) | | $ | 51,139 | | | $ | (5,183 | ) | | $ | 6,457 | |
The accompanying notes are an integral part of the financial statements.
15
Statements of Changes in Net Assets
| | | | | | | | | | | | | | | | | | | | | | | | |
| | | TARGET 2020
FOR THE SIX
MONTHS
ENDED
4/30/16
(UNAUDITED) | | | FOR THE
YEAR ENDED
10/31/15 | | | TARGET 2025
FOR THE SIX
MONTHS
ENDED
4/30/16
(UNAUDITED) | | | FOR THE
YEAR ENDED
10/31/15 | | | TARGET 2030
FOR THE SIX
MONTHS
ENDED
4/30/16
(UNAUDITED) | | | FOR THE
YEAR ENDED
10/31/15 | |
| | | | | | |
INCREASE (DECREASE) IN NET ASSETS: | | | | | | | | | | | | | | | | | | | | | | | | |
| | | | | | |
OPERATIONS: | | | | | | | | | | | | | | | | | | | | | | | | |
Net investment income | | $ | 1,290,004 | | | $ | 2,188,348 | | | $ | 245,389 | | | $ | 334,757 | | | $ | 1,161,810 | | | $ | 2,130,691 | |
Net realized loss on Underlying Series | | | (4,852,202 | ) | | | (3,111,100 | ) | | | (2,725,954 | ) | | | (973,443 | ) | | | (5,357,608 | ) | | | (461,557 | ) |
Distributions of realized gains from Underlying Series | | | 1,335,904 | | | | 18,962,248 | | | | 658,304 | | | | 3,129,155 | | | | 3,581,593 | | | | 28,133,734 | |
Net change in unrealized appreciation (depreciation) on Underlying Series | | | 2,269,765 | | | | (21,261,309 | ) | | | 1,932,202 | | | | (3,130,833 | ) | | | 1,232,888 | | | | (33,119,207 | ) |
| | | | | | | | | | | | | | | | | | | | | | | | |
| | | | | | |
Net increase (decrease) from operations | | | 43,471 | | | | (3,221,813 | ) | | | 109,941 | | | | (640,364 | ) | | | 618,683 | | | | (3,316,339 | ) |
| | | | | | | | | | | | | | | | | | | | | | | | |
| | | | | | |
DISTRIBUTIONS TO SHAREHOLDERS (Note 8): | | | | | | | | | | | | | | | | | | | | | | | | |
From net investment income
(Class K) | | | (701,057 | ) | | | (2,505,775 | ) | | | (106,410 | ) | | | (297,449 | ) | | | (623,920 | ) | | | (4,570,890 | ) |
From net investment income
(Class R) | | | (54,306 | ) | | | (500,611 | ) | | | (16,095 | ) | | | (109,978 | ) | | | (67,374 | ) | | | (735,285 | ) |
From net investment income
(Class I) | | | (743,652 | ) | | | (2,125,424 | ) | | | (162,404 | ) | | | (477,523 | ) | | | (690,791 | ) | | | (2,871,200 | ) |
From net realized gain on investments
(Class K) | | | (6,912,732 | ) | | | (7,356,511 | ) | | | (918,204 | ) | | | (326,846 | ) | | | (10,610,704 | ) | | | (11,306,421 | ) |
From net realized gain on investments
(Class R) | | | (656,604 | ) | | | (1,722,295 | ) | | | (162,874 | ) | | | (140,351 | ) | | | (1,437,863 | ) | | | (1,986,960 | ) |
From net realized gain on investments
(Class I) | | | (6,366,879 | ) | | | (5,519,527 | ) | | | (1,221,422 | ) | | | (488,200 | ) | | | (10,036,066 | ) | | | (6,424,281 | ) |
| | | | | | | | | | | | | | | | | | | | | | | | |
| | | | | | |
Total distributions to shareholders | | | (15,435,230 | ) | | | (19,730,143 | ) | | | (2,587,409 | ) | | | (1,840,347 | ) | | | (23,466,718 | ) | | | (27,895,037 | ) |
| | | | | | | | | | | | | | | | | | | | | | | | |
| | | | | | |
CAPITAL STOCK ISSUED AND REPURCHASED: | | | | | | | | | | | | | | | | | | | | | | | | |
Net increase (decrease) from capital share transactions (Note 6) | | | 3,620,606 | | | | 6,496,480 | | | | 2,811,365 | | | | 7,669,888 | | | | 21,670,479 | | | | (391,486 | ) |
| | | | | | | | | | | | | | | | | | | | | | | | |
| | | | | | |
Net increase (decrease) in net assets | | | (11,771,153 | ) | | | (16,455,476 | ) | | | 333,897 | | | | 5,189,177 | | | | (1,177,556 | ) | | | (31,602,862 | ) |
| | | | | | |
NET ASSETS: | | | | | | | | | | | | | | | | | | | | | | | | |
| | | | | | |
Beginning of period | | | 163,145,497 | | | | 179,600,973 | | | | 29,535,247 | | | | 24,346,070 | | | | 166,154,388 | | | | 197,757,250 | |
| | | | | | | | | | | | | | | | | | | | | | | | |
| | | | | | |
End of period1 | | $ | 151,374,344 | | | $ | 163,145,497 | | | $ | 29,869,144 | | | $ | 29,535,247 | | | $ | 164,976,832 | | | $ | 166,154,388 | |
| | | | | | | | | | | | | | | | | | | | | | | | |
1 Including undistributed (distributions in excess of) net investment income: | | $ | (98,651 | ) | | $ | 110,360 | | | $ | (17,263 | ) | | $ | 22,257 | | | $ | (104,313 | ) | | $ | 115,962 | |
The accompanying notes are an integral part of the financial statements.
16
Statements of Changes in Net Assets
| | | | | | | | | | | | | | | | | | | | | | | | |
| | | TARGET 2035
FOR THE SIX
MONTHS
ENDED
4/30/16
(UNAUDITED) | | | FOR THE
YEAR ENDED
10/31/15 | | | TARGET 2040
FOR THE SIX
MONTHS
ENDED
4/30/16
(UNAUDITED) | | | FOR THE
YEAR ENDED
10/31/15 | | | TARGET 2045
FOR THE SIX
MONTHS
ENDED
4/30/16
(UNAUDITED) | | | FOR THE
YEAR ENDED
10/31/15 | |
| | | | | | |
INCREASE (DECREASE) IN NET ASSETS: | | | | | | | | | | | | | | | | | | | | | | | | |
| | | | | | |
OPERATIONS: | | | | | | | | | | | | | | | | | | | | | | | | |
Net investment income | | $ | 123,925 | | | $ | 206,341 | | | $ | 434,547 | | | $ | 982,885 | | | $ | 26,865 | | | $ | 63,984 | |
Net realized loss on Underlying Series | | | (744,380 | ) | | | (805,034 | ) | | | (4,129,715 | ) | | | (1,382,593 | ) | | | (510,985 | ) | | | (377,628 | ) |
Distributions of realized gains from Underlying Series | | | 456,356 | | | | 2,943,470 | | | | 1,990,461 | | | | 20,893,461 | | | | 183,337 | | | | 1,408,794 | |
Net change in unrealized appreciation (depreciation) on Underlying Series | | | 361,235 | | | | (2,867,926 | ) | | | 2,546,361 | | | | (22,351,962 | ) | | | 524,204 | | | | (1,330,359 | ) |
| | | | | | | | | | | | | | | | | | | | | | | | |
| | | | | | |
Net increase (decrease) from operations | | | 197,136 | | | | (523,149 | ) | | | 841,654 | | | | (1,858,209 | ) | | | 223,421 | | | | (235,209 | ) |
| | | | | | | | | | | | | | | | | | | | | | | | |
| | | | | | |
DISTRIBUTIONS TO SHAREHOLDERS (Note 8): | | | | | | | | | | | | | | | | | | | | | | | | |
From net investment income
(Class K) | | | (59,887 | ) | | | (329,120 | ) | | | (264,432 | ) | | | (4,088,810 | ) | | | (13,585 | ) | | | (156,127 | ) |
From net investment income
(Class R) | | | (11,869 | ) | | | (120,541 | ) | | | (16,731 | ) | | | (488,750 | ) | | | (3,972 | ) | | | (91,933 | ) |
From net investment income
(Class I) | | | (82,578 | ) | | | (472,419 | ) | | | (276,204 | ) | | | (2,080,865 | ) | | | (22,496 | ) | | | (220,609 | ) |
From net realized gain on investments
(Class K) | | | (911,580 | ) | | | (274,022 | ) | | | (8,092,255 | ) | | | (10,306,151 | ) | | | (375,447 | ) | | | (117,251 | ) |
From net realized gain on investments
(Class R) | | | (233,295 | ) | | | (108,826 | ) | | | (775,712 | ) | | | (1,318,271 | ) | | | (169,076 | ) | | | (73,722 | ) |
From net realized gain on investments
(Class I) | | | (1,053,646 | ) | | | (371,000 | ) | | | (6,693,299 | ) | | | (4,840,432 | ) | | | (455,925 | ) | | | (157,365 | ) |
| | | | | | | | | | | | | | | | | | | | | | | | |
| | | | | | |
Total distributions to shareholders | | | (2,352,855 | ) | | | (1,675,928 | ) | | | (16,118,633 | ) | | | (23,123,279 | ) | | | (1,040,501 | ) | | | (817,007 | ) |
| | | | | | | | | | | | | | | | | | | | | | | | |
| | | | | | |
CAPITAL STOCK ISSUED AND REPURCHASED: | | | | | | | | | | | | | | | | | | | | | | | | |
| | | | | | |
Net increase (decrease) from capital share transactions (Note 6) | | | 3,046,239 | | | | 6,731,366 | | | | 17,449,408 | | | | (1,385,064 | ) | | | 2,835,162 | | | | 3,229,422 | |
| | | | | | | | | | | | | | | | | | | | | | | | |
| | | | | | |
Net increase (decrease) in net assets | | | 890,520 | | | | 4,532,289 | | | | 2,172,429 | | | | (2,666,552 | ) | | | 2,018,082 | | | | 2,177,206 | |
| | | | | | |
NET ASSETS: | | | | | | | | | | | | | | | | | | | | | | | | |
| | | | | | |
Beginning of period | | | 22,309,238 | | | | 17,776,949 | | | | 100,709,322 | | | | 127,075,874 | | | | 9,937,298 | | | | 7,760,092 | |
| | | | | | | | | | | | | | | | | | | | | | | | |
| | | | | | |
End of period1 | | $ | 23,199,758 | | | $ | 22,309,238 | | | $ | 102,881,751 | | | $ | 100,709,322 | | | $ | 11,955,380 | | | $ | 9,937,298 | |
| | | | | | | | | | | | | | | | | | | | | | | | |
| | | | | | |
1 Including undistributed (distributions in excess of) net investment income: | | $ | (15,318 | ) | | $ | 15,091 | | | $ | (65,515 | ) | | $ | 57,305 | | | $ | (7,924 | ) | | $ | 5,264 | |
The accompanying notes are an integral part of the financial statements.
17
Statements of Changes in Net Assets
| | | | | | | | | | | | | | | | | | | | | | | | |
| | | TARGET 2050
FOR THE SIX
MONTHS
ENDED
4/30/16
(UNAUDITED) | | | FOR THE
YEAR ENDED
10/31/15 | | | TARGET 2055
FOR THE SIX
MONTHS
ENDED
4/30/16
(UNAUDITED) | | | FOR THE
YEAR ENDED
10/31/15 | | | TARGET 2060
FOR THE SIX
MONTHS
ENDED
4/30/16
(UNAUDITED) | | | FOR THE
PERIOD
9/21/151 TO
10/31/15 | |
| | | | | | |
INCREASE (DECREASE) IN NET ASSETS: | | | | | | | | | | | | | | | | | | | | | | | | |
| | | | | | |
OPERATIONS: | | | | | | | | | | | | | | | | | | | | | | | | |
| | | | | | |
Net investment income (loss) | | $ | 97,131 | | | $ | 346,546 | | | $ | 9,765 | | | $ | 21,660 | | | $ | (315 | ) | | $ | (50 | ) |
Net realized gain (loss) on Underlying Series | | | (1,200,027 | ) | | | (2,322,553 | ) | | | (100,482 | ) | | | (295,606 | ) | | | 146 | | | | 11 | |
Distributions of realized gains from Underlying Series | | | 609,890 | | | | 10,884,743 | | | | 62,510 | | | | 542,597 | | | | 3,143 | | | | — | |
| | | | | | |
Net change in unrealized appreciation (depreciation) on Underlying Series | | | 948,516 | | | | (9,156,768 | ) | | | 137,006 | | | | (313,271 | ) | | | 97,993 | | | | 5,491 | |
| | | | | | | | | | | | | | | | | | | | | | | | |
| | | | | | |
Net increase (decrease) from operations | | | 455,510 | | | | (248,032 | ) | | | 108,799 | | | | (44,620 | ) | | | 100,967 | | | | 5,452 | |
| | | | | | | | | | | | | | | | | | | | | | | | |
| | | | | | |
DISTRIBUTIONS TO SHAREHOLDERS (Note 8): | | | | | | | | | | | | | | | | | | | | | | | | |
From net investment income
(Class K) | | | (50,774 | ) | | | (2,509,188 | ) | | | (3,883 | ) | | | (98,964 | ) | | | (189 | ) | | | — | |
From net investment income
(Class R) | | | (3,713 | ) | | | (260,575 | ) | | | (988 | ) | | | (26,485 | ) | | | (187 | ) | | | — | |
From net investment income
(Class I) | | | (75,031 | ) | | | (742,815 | ) | | | (8,740 | ) | | | (53,400 | ) | | | (225 | ) | | | — | |
From net realized gain on investments
(Class K) | | | (2,778,003 | ) | | | (5,037,375 | ) | | | (100,952 | ) | | | (51,648 | ) | | | — | | | | — | |
From net realized gain on investments
(Class R) | | | (407,411 | ) | | | (541,441 | ) | | | (39,479 | ) | | | (14,363 | ) | | | — | | | | — | |
From net realized gain on investments
(Class I) | | | (2,969,532 | ) | | | (1,368,611 | ) | | | (162,904 | ) | | | (25,481 | ) | | | — | | | | — | |
| | | | | | | | | | | | | | | | | | | | | | | | |
| | | | | | |
Total distributions to shareholders | | | (6,284,464 | ) | | | (10,460,005 | ) | | | (316,946 | ) | | | (270,341 | ) | | | (601 | ) | | | — | |
| | | | | | | | | | | | | | | | | | | | | | | | |
| | | | | | |
CAPITAL STOCK ISSUED AND REPURCHASED: | | | | | | | | | | | | | | | | | | | | | | | | |
| | | | | | |
Net increase (decrease) from capital share transactions (Note 6) | | | 6,975,786 | | | | (20,993,216 | ) | | | 1,319,748 | | | | 359,064 | | | | 902,823 | | | | 153,969 | |
| | | | | | | | | | | | | | | | | | | | | | | | |
| | | | | | |
Net increase (decrease) in net assets | | | 1,146,832 | | | | (31,701,253 | ) | | | 1,111,601 | | | | 44,103 | | | | 1,003,189 | | | | 159,421 | |
| | | | | | |
NET ASSETS: | | | | | | | | | | | | | | | | | | | | | | | | |
| | | | | | |
Beginning of period | | | 33,046,521 | | | | 64,747,774 | | | | 3,208,459 | | | | 3,164,356 | | | | 159,421 | | | | — | |
| | | | | | | | | | | | | | | | | | | | | | | | |
| | | | | | |
End of period2 | | $ | 34,193,353 | | | $ | 33,046,521 | | | $ | 4,320,060 | | | $ | 3,208,459 | | | $ | 1,162,610 | | | $ | 159,421 | |
| | | | | | | | | | | | | | | | | | | | | | | | |
| | | | | | |
1 Commencement of operations. | | | | | | | | | | | | | | | | | | | | | | | | |
2 Including undistributed (distributions in excess of) net investment income: | | $ | (20,374 | ) | | $ | 12,013 | | | $ | (2,285 | ) | | $ | 1,561 | | | $ | (916 | ) | | $ | — | |
The accompanying notes are an integral part of the financial statements.
18
Financial Highlights
| | | | | | | | | | | | | | | | | | | | | | | | |
| TARGET INCOME SERIES CLASS K | | FOR THE SIX
MONTHS ENDED
4/30/16 | | | FOR THE YEARS ENDED | | | | |
| | (UNAUDITED) | | | 10/31/15 | | | 10/31/14 | | | 10/31/13 | | | 10/31/12 | | | 10/31/11 | |
Per share data (for a share outstanding throughout each period): | | | | | | | | | | | | | | | | | | | | | | | | |
Net asset value - Beginning of period | | $ | 9.72 | | | $ | 10.84 | | | $ | 11.00 | | | $ | 10.86 | | | $ | 10.86 | | | $ | 11.02 | |
| | | | | | | | | | | | | | | | | | | | | | | | |
Income (loss) from investment operations: | | | | | | | | | | | | | | | | | | | | | | | | |
Net investment income1,2 | | | 0.12 | | | | 0.15 | | | | 0.18 | | | | 0.18 | | | | 0.22 | | | | 0.23 | |
Net realized and unrealized gain (loss) on investments | | | (0.05 | ) | | | (0.29 | ) | | | 0.37 | | | | 0.63 | | | | 0.48 | | | | 0.06 | |
| | | | | | | | | | | | | | | | | | | | | | | | |
| | | | | | |
Total from investment operations | | | 0.07 | | | | (0.14 | ) | | | 0.55 | | | | 0.81 | | | | 0.70 | | | | 0.29 | |
| | | | | | | | | | | | | | | | | | | | | | | | |
Less distributions to shareholders: | | | | | | | | | | | | | | | | | | | | | | | | |
From net investment income | | | (0.14 | ) | | | (0.28 | ) | | | (0.29 | ) | | | (0.24 | ) | | | (0.25 | ) | | | (0.33 | ) |
From net realized gain on investments | | | (0.42 | ) | | | (0.70 | ) | | | (0.42 | ) | | | (0.43 | ) | | | (0.45 | ) | | | (0.12 | ) |
| | | | | | | | | | | | | | | | | | | | | | | | |
Total distributions to shareholders | | | (0.56 | ) | | | (0.98 | ) | | | (0.71 | ) | | | (0.67 | ) | | | (0.70 | ) | | | (0.45 | ) |
| | | | | | | | | | | | | | | | | | | | | | | | |
| | | | | | |
Net asset value - End of period | | $ | 9.23 | | | $ | 9.72 | | | $ | 10.84 | | | $ | 11.00 | | | $ | 10.86 | | | $ | 10.86 | |
| | | | | | | | | | | | | | | | | | | | | | | | |
| | | | | | |
Net assets - End of period (000’s omitted) | | $ | 64,876 | | | $ | 67,322 | | | $ | 52,442 | | | $ | 47,676 | | | $ | 45,926 | | | $ | 44,682 | |
| | | | | | | | | | | | | | | | | | | | | | | | |
| | | | | | |
Total return3 | | | 0.86 | % | | | (1.38 | %) | | | 5.35 | % | | | 7.83 | % | | | 6.98 | % | | | 2.77 | % |
Ratios (to average net assets)/Supplemental Data: | | | | | | | | | | | | | | | | | | | | | | | | |
Expenses* | | | 0.30 | %4,5 | | | 0.30 | %5 | | | 0.30 | %6 | | | 0.30 | %6 | | | 0.30 | %5 | | | 0.30 | %7 |
Net investment income2 | | | 2.65 | %4 | | | 1.54 | % | | | 1.63 | % | | | 1.69 | % | | | 2.07 | % | | | 2.11 | % |
Series portfolio turnover8 | | | 3 | % | | | 16 | % | | | 15 | % | | | 14 | % | | | 16 | % | | | 14 | % |
|
| *The investment advisor paid a portion of the Series’ expenses. If these expenses had been incurred by the Series, the expense ratios (to average net assets) would have been increased by the following amounts: | |
| | | 0.11 | %4,5 | | | 0.16 | %5 | | | 0.12 | %6 | | | 0.16 | %6 | | | 0.20 | %5 | | | 0.22 | %7 |
| TARGET INCOME SERIES CLASS R | | FOR THE SIX
MONTHS ENDED
4/30/16 | | | FOR THE YEARS ENDED | | | | |
| | (UNAUDITED) | | | 10/31/15 | | | 10/31/14 | | | 10/31/13 | | | 10/31/12 | | | 10/31/11 | |
Per share data (for a share outstanding throughout each period): | | | | | | | | | | | | | | | | | | | | | | | | |
Net asset value - Beginning of period | | $ | 9.61 | | | $ | 10.71 | | | $ | 10.89 | | | $ | 10.76 | | | $ | 10.77 | | | $ | 10.93 | |
| | | | | | | | | | | | | | | | | | | | | | | | |
Income (loss) from investment operations: | | | | | | | | | | | | | | | | | | | | | | | | |
Net investment income1,2 | | | 0.13 | | | | 0.21 | | | | 0.15 | | | | 0.07 | | | | 0.09 | | | | 0.16 | |
Net realized and unrealized gain (loss) on investments | | | (0.07 | ) | | | (0.38 | ) | | | 0.36 | | | | 0.70 | | | | 0.58 | | | | 0.10 | |
| | | | | | | | | | | | | | | | | | | | | | | | |
Total from investment operations | | | 0.06 | | | | (0.17 | ) | | | 0.51 | | | | 0.77 | | | | 0.67 | | | | 0.26 | |
| | | | | | | | | | | | | | | | | | | | | | | | |
Less distributions to shareholders: | | | | | | | | | | | | | | | | | | | | | | | | |
From net investment income | | | (0.12 | ) | | | (0.23 | ) | | | (0.27 | ) | | | (0.21 | ) | | | (0.23 | ) | | | (0.30 | ) |
From net realized gain on investments | | | (0.42 | ) | | | (0.70 | ) | | | (0.42 | ) | | | (0.43 | ) | | | (0.45 | ) | | | (0.12 | ) |
| | | | | | | | | | | | | | | | | | | | | | | | |
Total distributions to shareholders | | | (0.54 | ) | | | (0.93 | ) | | | (0.69 | ) | | | (0.64 | ) | | | (0.68 | ) | | | (0.42 | ) |
| | | | | | | | | | | | | | | | | | | | | | | | |
| | | | | | |
Net asset value - End of period | | $ | 9.13 | | | $ | 9.61 | | | $ | 10.71 | | | $ | 10.89 | | | $ | 10.76 | | | $ | 10.77 | |
| | | | | | | | | | | | | | | | | | | | | | | | |
| | | | | | |
Net assets - End of period (000’s omitted) | | $ | 1,240 | | | $ | 2,468 | | | $ | 13,406 | | | $ | 13,475 | | | $ | 3,853 | | | $ | 553 | |
| | | | | | | | | | | | | | | | | | | | | | | | |
| | | | | | |
Total return3 | | | 0.81 | % | | | (1.70 | %) | | | 5.00 | % | | | 7.52 | % | | | 6.77 | % | | | 2.50 | % |
Ratios (to average net assets)/Supplemental Data: | | | | | | | | | | | | | | | | | | | | | | | | |
Expenses* | | | 0.55 | %4,5 | | | 0.55 | %5 | | | 0.55 | %6 | | | 0.55 | %6 | | | 0.55 | %5 | | | 0.55 | %7 |
Net investment income2 | | | 2.95 | %4 | | | 2.05 | % | | | 1.40 | % | | | 0.66 | % | | | 0.84 | % | | | 1.47 | % |
Series portfolio turnover8 | | | 3 | % | | | 16 | % | | | 15 | % | | | 14 | % | | | 16 | % | | | 14 | % |
|
| *The investment advisor paid a portion of the Series’ expenses. If these expenses had been incurred by the Series, the expense ratios (to average net assets) would have been increased by the following amounts: | |
| | | 0.10 | %4,5 | | | 0.16 | %5 | | | 0.12 | %6 | | | 0.14 | %6 | | | 0.20 | %5 | | | 0.22 | %7 |
1Calculated based on average shares outstanding during the periods.
2Net investment income is affected by the timing of distributions from the Underlying Series in which the Series invest. The ratios do not include net investment income of the Underlying Series in which the Series invests.
3Represents aggregate total return for the periods indicated. Total return would have been lower had certain expenses not been reimbursed. Periods less than one year are not annualized.
4Annualized.
5Expense ratios do not include expenses of the Underlying Series in which the Series invests. The expense ratio of the Underlying Series was 0.68%.
6Expense ratios do not include expenses of the Underlying Series in which the Series invests. The expense ratio of the Underlying Series was 0.67%.
7Expense ratios do not include expenses of the Underlying Series in which the Series invests. The expense ratio of the Underlying Series was 0.69%.
8Reflects activity of the Series and does not include the activity of the Underlying Series.
The accompanying notes are an integral part of the financial statements.
19
Financial Highlights
| | | | | | | | | | | | | | | | | | | | | | | | |
| TARGET INCOME SERIES CLASS I | | FOR THE SIX
MONTHS ENDED
4/30/16 | | | FOR THE YEARS ENDED | | | | |
| | (UNAUDITED) | | | 10/31/15 | | | 10/31/14 | | | 10/31/13 | | | 10/31/12 | | | 10/31/11 | |
Per share data (for a share outstanding throughout each period): | | | | | | | | | | | | | | | | | | | | | | | | |
Net asset value - Beginning of period | | $ | 9.75 | | | $ | 10.88 | | | $ | 11.04 | | | $ | 10.90 | | | $ | 10.89 | | | $ | 11.05 | |
| | | | | | | | | | | | | | | | | | | | | | | | |
Income (loss) from investment operations: | | | | | | | | | | | | | | | | | | | | | | | | |
Net investment income1,2 | | | 0.16 | | | | 0.16 | | | | 0.21 | | | | 0.19 | | | | 0.24 | | | | 0.07 | |
Net realized and unrealized gain (loss) on investments | | | (0.07 | ) | | | (0.28 | ) | | | 0.37 | | | | 0.65 | | | | 0.50 | | | | 0.25 | |
| | | | | | | | | | | | | | | | | | | | | | | | |
Total from investment operations | | | 0.09 | | | | (0.12 | ) | | | 0.58 | | | | 0.84 | | | | 0.74 | | | | 0.32 | |
| | | | | | | | | | | | | | | | | | | | | | | | |
Less distributions to shareholders: | | | | | | | | | | | | | | | | | | | | | | | | |
From net investment income | | | (0.15 | ) | | | (0.31 | ) | | | (0.32 | ) | | | (0.27 | ) | | | (0.28 | ) | | | (0.36 | ) |
From net realized gain on investments | | | (0.42 | ) | | | (0.70 | ) | | | (0.42 | ) | | | (0.43 | ) | | | (0.45 | ) | | | (0.12 | ) |
| | | | | | | | | | | | | | | | | | | | | | | | |
Total distributions to shareholders | | | (0.57 | ) | | | (1.01 | ) | | | (0.74 | ) | | | (0.70 | ) | | | (0.73 | ) | | | (0.48 | ) |
| | | | | | | | | | | | | | | | | | | | | | | | |
| | | | | | |
Net asset value - End of period | | $ | 9.27 | | | $ | 9.75 | | | $ | 10.88 | | | $ | 11.04 | | | $ | 10.90 | | | $ | 10.89 | |
| | | | | | | | | | | | | | | | | | | | | | | | |
| | | | | | |
Net assets - End of period (000’s omitted) | | $ | 16,488 | | | $ | 26,000 | | | $ | 11,610 | | | $ | 11,271 | | | $ | 6,300 | | | $ | 4,068 | |
| | | | | | | | | | | | | | | | | | | | | | | | |
Total return3 | | | 1.09 | % | | | (1.21 | %) | | | 5.59 | % | | | 8.09 | % | | | 7.34 | % | | | 3.00 | % |
Ratios (to average net assets)/Supplemental Data: | | | | | | | | | | | | | | | | | | | | | | | | |
Expenses* | | | 0.05 | %4,5 | | | 0.05 | %5 | | | 0.05 | %6 | | | 0.05 | %6 | | | 0.05 | %5 | | | 0.05 | %7 |
Net investment income2 | | | 3.42 | %4 | | | 1.65 | % | | | 1.92 | % | | | 1.76 | % | | | 2.30 | % | | | 0.68 | % |
Series portfolio turnover8 | | | 3 | % | | | 16 | % | | | 15 | % | | | 14 | % | | | 16 | % | | | 14 | % |
|
| *The investment advisor paid a portion of the Series’ expenses. If these expenses had been incurred by the Series, the expense ratios (to average net assets) would have been increased by the following amounts: | |
| | | 0.10 | %4,5 | | | 0.16 | %5 | | | 0.12 | %6 | | | 0.16 | %6 | | | 0.20 | %5 | | | 0.23 | %7 |
1Calculated based on average shares outstanding during the periods.
2Net investment income is affected by the timing of distributions from the Underlying Series in which the Series invest. The ratios do not include net investment income of the Underlying Series in which the Series invests.
3Represents aggregate total return for the periods indicated. Total return would have been lower had certain expenses not been reimbursed. Periods less than one year are not annualized.
4Annualized.
5Expense ratios do not include expenses of the Underlying Series in which the Series invests. The expense ratio of the Underlying Series was 0.68%.
6Expense ratios do not include expenses of the Underlying Series in which the Series invests. The expense ratio of the Underlying Series was 0.67%.
7Expense ratios do not include expenses of the Underlying Series in which the Series invests. The expense ratio of the Underlying Series was 0.69%.
8Reflects activity of the Series and does not include the activity of the Underlying Series.
The accompanying notes are an integral part of the financial statements.
20
Financial Highlights
| | | | | | | | | | | | | | | | | | | | |
| TARGET 2015 SERIES CLASS K | | FOR THE SIX
MONTHS ENDED
4/30/16 | | | FOR THE YEARS ENDED | | | FOR THE PERIOD | |
| | (UNAUDITED) | | | 10/31/15 | | | 10/31/14 | | | 10/31/13 | | | 6/25/121 TO 10/31/12 | |
Per share data (for a share outstanding throughout each period): | | | | | | | | | | | | | | | | | | | | |
Net asset value - Beginning of period | | $ | 11.17 | | | $ | 12.07 | | | $ | 11.79 | | | $ | 10.59 | | | $ | 10.00 | |
| | | | | | | | | | | | | | | | | | | | |
Income (loss) from investment operations: | | | | | | | | | | | | | | | | | | | | |
Net investment income (loss)2,3 | | | 0.07 | | | | 0.12 | | | | 0.10 | | | | 0.15 | | | | (0.01 | ) |
Net realized and unrealized gain (loss) on investments | | | (0.06 | ) | | | (0.35 | ) | | | 0.53 | | | | 1.25 | | | | 0.60 | |
| | | | | | | | | | | | | | | | | | | | |
Total from investment operations | | | 0.01 | | | | (0.23 | ) | | | 0.63 | | | | 1.40 | | | | 0.59 | |
| | | | | | | | | | | | | | | | | | | | |
Less distributions to shareholders: | | | | | | | | | | | | | | | | | | | | |
From net investment income | | | (0.10 | ) | | | (0.28 | ) | | | (0.26 | ) | | | (0.20 | ) | | | — | |
From net realized gain on investments | | | (0.80 | ) | | | (0.39 | ) | | | (0.09 | ) | | | — | | | | — | |
| | | | | | | | | | | | | | | | | | | | |
Total distributions to shareholders | | | (0.90 | ) | | | (0.67 | ) | | | (0.35 | ) | | | (0.20 | ) | | | — | |
| | | | | | | | | | | | | | | | | | | | |
Net asset value - End of period | | $ | 10.28 | | | $ | 11.17 | | | $ | 12.07 | | | $ | 11.79 | | | $ | 10.59 | |
| | | | | | | | | | | | | | | | | | | | |
| | | | | |
Net assets - End of period (000’s omitted) | | $ | 3,291 | | | $ | 3,500 | | | $ | 3,200 | | | $ | 1,019 | | | $ | 1,498 | 4 |
| | | | | | | | | | | | | | | | | | | | |
Total return5 | | | 0.30 | % | | | (2.04 | %) | | | 5.45 | % | | | 13.45 | % | | | 5.90 | % |
Ratios (to average net assets)/Supplemental Data: | | | | | | | | | | | | | | | | | | | | |
Expenses* | | | 0.30 | %6,7 | | | 0.30 | %8 | | | 0.30 | %9 | | | 0.30 | %9 | | | 0.30 | %6,10 |
Net investment income (loss)3 | | | 1.47 | %6 | | | 1.01 | % | | | 0.80 | % | | | 1.34 | % | | | (0.30 | %)6 |
Series portfolio turnover11 | | | 35 | % | | | 46 | % | | | 46 | % | | | 50 | % | | | — | 12 |
|
| *The investment advisor paid a portion of the Series’ expenses. If these expenses had been incurred by the Series, the expense ratios (to average net assets) would have been increased by the following amounts: | |
| | | 1.56 | %6,7 | | | 1.14 | %8 | | | 1.41 | %9 | | | 6.06 | %9 | | | 9,646 | %6,10,13 |
| TARGET 2015 SERIES CLASS R | | FOR THE SIX
MONTHS ENDED
4/30/16 | | | FOR THE YEARS ENDED | | | FOR THE PERIOD | |
| | (UNAUDITED) | | | 10/31/15 | | | 10/31/14 | | | 10/31/13 | | | 6/25/121 TO 10/31/12 | |
Per share data (for a share outstanding throughout each period): | | | | | | | | | | | | | | | | | | | | |
Net asset value - Beginning of period | | $ | 11.19 | | | $ | 12.09 | | | $ | 11.81 | | | $ | 10.59 | | | $ | 10.00 | |
| | | | | | | | | | | | | | | | | | | | |
Income (loss) from investment operations: | | | | | | | | | | | | | | | | | | | | |
Net investment income (loss)2,3 | | | 0.07 | | | | 0.12 | | | | 0.07 | | | | 0.01 | | | | (0.02 | ) |
Net realized and unrealized gain (loss) on investments | | | (0.08 | ) | | | (0.39 | ) | | | 0.53 | | | | 1.39 | | | | 0.61 | |
| | | | | | | | | | | | | | | | | | | | |
Total from investment operations | | | (0.01 | ) | | | (0.27 | ) | | | 0.60 | | | | 1.40 | | | | 0.59 | |
| | | | | | | | | | | | | | | | | | | | |
Less distributions to shareholders: | | | | | | | | | | | | | | | | | | | | |
From net investment income | | | (0.08 | ) | | | (0.24 | ) | | | (0.23 | ) | | | (0.18 | ) | | | — | |
From net realized gain on investments | | | (0.80 | ) | | | (0.39 | ) | | | (0.09 | ) | | | — | | | | — | |
| | | | | | | | | | | | | | | | | | | | |
Total distributions to shareholders | | | (0.88 | ) | | | (0.63 | ) | | | (0.32 | ) | | | (0.18 | ) | | | — | |
| | | | | | | | | | | | | | | | | | | | |
Net asset value - End of period | | $ | 10.30 | | | $ | 11.19 | | | $ | 12.09 | | | $ | 11.81 | | | $ | 10.59 | |
| | | | | | | | | | | | | | | | | | | | |
| | | | | |
Net assets - End of period (000’s omitted) | | $ | 780 | | | $ | 839 | | | $ | 1,587 | | | $ | 1,015 | | | $ | 106 | 4 |
| | | | | | | | | | | | | | | | | | | | |
Total return5 | | | 0.17 | % | | | (2.37 | %) | | | 5.22 | % | | | 13.36 | % | | | 5.90 | % |
Ratios (to average net assets)/Supplemental Data: | | | | | | | | | | | | | | | | | | | | |
Expenses* | | | 0.55 | %6,7 | | | 0.55 | %8 | | | 0.55 | %9 | | | 0.55 | %9 | | | 0.55 | %6,10 |
Net investment income (loss)3 | | | 1.32 | %6 | | | 1.07 | % | | | 0.60 | % | | | 0.11 | % | | | (0.55 | %)6 |
Series portfolio turnover11 | | | 35 | % | | | 46 | % | | | 46 | % | | | 50 | % | | | — | 12 |
|
| *The investment advisor paid a portion of the Series’ expenses. If these expenses had been incurred by the Series, the expense ratios (to average net assets) would have been increased by the following amounts: | |
| | | 1.56 | %6,7 | | | 1.14 | %8 | | | 1.47 | %9 | | | 3.45 | %9 | | | 10,644 | %6,10,13 |
1Commencement of operations.
2Calculated based on average shares outstanding during the periods.
3Net investment income is affected by the timing of distributions from the Underlying Series in which the Series invest. The ratios do not include net investment income of the Underlying Series in which the Series invests.
4Represents the whole number without rounding to the 000s.
5Represents aggregate total return for the periods indicated. Total return would have been lower had certain expenses not been reimbursed. Periods less than one year are not annualized.
6Annualized.
7Expense ratios do not include expenses of the Underlying Series in which the Series invests. The expense ratios of the Underlying Series were 0.68% for Manning & Napier Pro-Blend® Conservative Term Series - Class I and 0.82% for Manning & Napier Pro-Blend® Moderate Term Series - Class I.
8Expense ratios do not include expenses of the Underlying Series in which the Series invests. The expense ratios of the Underlying Series were 0.81% for Manning & Napier Pro-Blend® Moderate Term Series - Class I and 0.82% for Manning & Napier Pro-Blend® Extended Term Series - Class I.
9Expense ratios do not include expenses of the Underlying Series in which the Series invests. The expense ratios of the Underlying Series were 0.81% for Manning & Napier Pro-Blend® Moderate Term Series - Class I and 0.81% for Manning & Napier Pro-Blend® Extended Term Series - Class I.
10Expense ratios do not include expenses of the Underlying Series in which the Series invests. The expense ratios of the Underlying Series were 0.82% for Manning & Napier Pro-Blend® Moderate Term Series - Class I and 0.82% for Manning & Napier Pro-Blend® Extended Term Series - Class I.
11Reflects activity of the Series and does not include the activity of the Underlying Series.
12Less than 1%.
13The increase to the expense ratios (to average net assets) is largely due to the small net assets in each class.
The accompanying notes are an integral part of the financial statements.
21
Financial Highlights
| | | | | | | | | | | | | | | | | | | | |
| TARGET 2015 SERIES CLASS I | | FOR THE SIX
MONTHS ENDED
4/30/16 | | | FOR THE YEARS ENDED | | | FOR THE PERIOD | |
| | (UNAUDITED) | | | 10/31/15 | | | 10/31/14 | | | 10/31/13 | | | 6/25/121 TO 10/31/12 | |
Per share data (for a share outstanding throughout each period): | | | | | | | | | | | | | | | | | | | | |
Net asset value - Beginning of period | | $ | 11.21 | | | $ | 12.11 | | | $ | 11.83 | | | $ | 10.61 | | | $ | 10.00 | |
| | | | | | | | | | | | | | | | | | | | |
| | | | | |
Income (loss) from investment operations: | | | | | | | | | | | | | | | | | | | | |
Net investment income2,3 | | | 0.10 | | | | 0.15 | | | | 0.14 | | | | 0.11 | | | | — | 4 |
Net realized and unrealized gain (loss) on investments | | | (0.09 | ) | | | (0.35 | ) | | | 0.51 | | | | 1.32 | | | | 0.61 | |
| | | | | | | | | | | | | | | | | | | | |
Total from investment operations | | | 0.01 | | | | (0.20 | ) | | | 0.65 | | | | 1.43 | | | | 0.61 | |
| | | | | | | | | | | | | | | | | | | | |
| | | | | |
Less distributions to shareholders: | | | | | | | | | | | | | | | | | | | | |
From net investment income | | | (0.11 | ) | | | (0.31 | ) | | | (0.28 | ) | | | (0.21 | ) | | | — | |
From net realized gain on investments | | | (0.80 | ) | | | (0.39 | ) | | | (0.09 | ) | | | — | | | | — | |
| | | | | | | | | | | | | | | | | | | | |
Total distributions to shareholders | | | (0.91 | ) | | | (0.70 | ) | | | (0.37 | ) | | | (0.21 | ) | | | — | |
| | | | | | | | | | | | | | | | | | | | |
Net asset value - End of period | | $ | 10.31 | | | $ | 11.21 | | | $ | 12.11 | | | $ | 11.83 | | | $ | 10.61 | |
| | | | | | | | | | | | | | | | | | | | |
Net assets - End of period (000’s omitted) | | $ | 2,653 | | | $ | 5,129 | | | $ | 4,785 | | | $ | 3,619 | | | $ | 209 | 5 |
| | | | | | | | | | | | | | | | | | | | |
Total return6 | | | 0.36 | % | | | (1.78 | %) | | | 5.67 | % | | | 13.71 | % | | | 6.10 | % |
Ratios (to average net assets)/Supplemental Data: | | | | | | | | | | | | | | | | | | | | |
Expenses* | | | 0.05 | %7,8 | | | 0.05 | %9 | | | 0.05 | %10 | | | 0.05 | %10 | | | 0.05 | %7,11 |
Net investment income (loss)3 | | | 2.00 | %7 | | | 1.28 | % | | | 1.12 | % | | | 1.01 | % | | | (0.05 | %)7 |
Series portfolio turnover12 | | | 35 | % | | | 46 | % | | | 46 | % | | | 50 | % | | | — | 13 |
|
| *The investment advisor paid a portion of the Series’ expenses. If these expenses had been incurred by the Series, the expense ratios (to average net assets) would have been increased by the following amounts: | |
| | | 1.56 | %7,8 | | | 1.14 | %9 | | | 1.46 | %10 | | | 4.09 | %10 | | | 9,682 | %7,11,14 |
1Commencement of operations.
2Calculated based on average shares outstanding during the periods.
3Net investment income is affected by the timing of distributions from the Underlying Series in which the Series invest. The ratios do not include net investment income of the Underlying Series in which the Series invests.
4Less than $0.01.
5Represents the whole number without rounding to the 000s.
6Represents aggregate total return for the periods indicated. Total return would have been lower had certain expenses not been reimbursed. Periods less than one year are not annualized.
7Annualized.
8Expense ratios do not include expenses of the Underlying Series in which the Series invests. The expense ratios of the Underlying Series were 0.68% for Manning & Napier Pro-Blend® Conservative Term Series - Class I and 0.82% for Manning & Napier Pro-Blend® Moderate Term Series - Class I.
9Expense ratios do not include expenses of the Underlying Series in which the Series invests. The expense ratios of the Underlying Series were 0.81% for Manning & Napier Pro-Blend® Moderate Term Series - Class I and 0.82% for Manning & Napier Pro-Blend® Extended Term Series - Class I.
10Expense ratios do not include expenses of the Underlying Series in which the Series invests. The expense ratios of the Underlying Series were 0.81% for Manning & Napier Pro-Blend® Moderate Term Series - Class I and 0.81% for Manning & Napier Pro-Blend® Extended Term Series - Class I.
11Expense ratios do not include expenses of the Underlying Series in which the Series invests. The expense ratios of the Underlying Series were 0.82% for Manning & Napier Pro-Blend® Moderate Term Series - Class I and 0.82% for Manning & Napier Pro-Blend® Extended Term Series - Class I.
12Reflects activity of the Series and does not include the activity of the Underlying Series.
13Less than 1%.
14The increase to the expense ratios (to average net assets) is largely due to the small net assets in each class.
The accompanying notes are an integral part of the financial statements.
22
Financial Highlights
| | | | | | | | | | | | | | | | | | | | | | | | |
| TARGET 2020 SERIES CLASS K | | FOR THE SIX
MONTHS ENDED
4/30/16 | | | FOR THE YEARS ENDED | |
| | (UNAUDITED) | | | 10/31/15 | | | 10/31/14 | | | 10/31/13 | | | 10/31/12 | | | 10/31/11 | |
Per share data (for a share outstanding throughout each period): | | | | | | | | | | | | | | | | | | | | | | | | |
Net asset value - Beginning of period | | $ | 9.45 | | | $ | 10.77 | | | $ | 10.79 | | | $ | 9.89 | | | $ | 10.12 | | | $ | 10.33 | |
| | | | | | | | | | | | | | | | | | | | | | | | |
Income (loss) from investment operations: | | | | | | | | | | | | | | | | | | | | | | | | |
Net investment income1,2 | | | 0.07 | | | | 0.11 | | | | 0.11 | | | | 0.12 | | | | 0.17 | | | | 0.20 | |
Net realized and unrealized gain (loss) on investments | | | (0.07 | ) | | | (0.33 | ) | | | 0.51 | | | | 1.33 | | | | 0.54 | | | | 0.12 | |
| | | | | | | | | | | | | | | | | | | | | | | | |
Total from investment operations | | | — | | | | (0.22 | ) | | | 0.62 | | | | 1.45 | | | | 0.71 | | | | 0.32 | |
| | | | | | | | | | | | | | | | | | | | | | | | |
Less distributions to shareholders: | | | | | | | | | | | | | | | | | | | | | | | | |
From net investment income | | | (0.08 | ) | | | (0.28 | ) | | | (0.25 | ) | | | (0.20 | ) | | | (0.21 | ) | | | (0.19 | ) |
From net realized gain on investments | | | (0.81 | ) | | | (0.82 | ) | | | (0.39 | ) | | | (0.35 | ) | | | (0.73 | ) | | | (0.34 | ) |
| | | | | | | | | | | | | | | | | | | | | | | | |
Total distributions to shareholders | | | (0.89 | ) | | | (1.10 | ) | | | (0.64 | ) | | | (0.55 | ) | | | (0.94 | ) | | | (0.53 | ) |
| | | | | | | | | | | | | | | | | | | | | | | | |
Net asset value - End of period | | $ | 8.56 | | | $ | 9.45 | | | $ | 10.77 | | | $ | 10.79 | | | $ | 9.89 | | | $ | 10.12 | |
| | | | | | | | | | | | | | | | | | | | | | | | |
Net assets - End of period (000’s omitted) | | $ | 77,728 | | | $ | 80,006 | | | $ | 95,364 | | | $ | 82,841 | | | $ | 67,039 | | | $ | 56,290 | |
| | | | | | | | | | | | | | | | | | | | | | | | |
Total return3 | | | 0.40 | % | | | (2.24 | %) | | | 6.14 | % | | | 15.43 | % | | | 8.08 | % | | | 3.14 | % |
Ratios (to average net assets)/Supplemental Data: | | | | | | | | | | | | | | | | | | | | | | | | |
Expenses* | | | 0.30 | %4,5 | | | 0.30 | %6 | | | 0.30 | %7 | | | 0.30 | %7 | | | 0.30 | %8 | | | 0.30 | %5 |
Net investment income2 | | | 1.56 | %4 | | | 1.17 | % | | | 1.06 | % | | | 1.20 | % | | | 1.72 | % | | | 1.97 | % |
Series portfolio turnover9 | | | 11 | % | | | 42 | % | | | 37 | % | | | 19 | % | | | 24 | % | | | 49 | % |
|
| *The investment advisor paid a portion of the Series’ expenses. If these expenses had been incurred by the Series, the expense ratios (to average net assets) would have been increased by the following amounts: | |
| | | 0.05 | %4,5 | | | 0.04 | %6 | | | 0.03 | %7 | | | 0.05 | %7 | | | 0.08 | %8 | | | 0.10 | %5 |
| TARGET 2020 SERIES CLASS R | | FOR THE SIX
MONTHS ENDED
4/30/16 | | | FOR THE YEARS ENDED | |
| | (UNAUDITED) | | | 10/31/15 | | | 10/31/14 | | | 10/31/13 | | | 10/31/12 | | | 10/31/11 | |
Per share data (for a share outstanding throughout each period): | | | | | | | | | | | | | | | | | | | | | | | | |
Net asset value - Beginning of period | | $ | 9.34 | | | $ | 10.60 | | | $ | 10.66 | | | $ | 9.78 | | | $ | 10.02 | | | $ | 10.24 | |
| | | | | | | | | | | | | | | | | | | | | | | | |
Income (loss) from investment operations: | | | | | | | | | | | | | | | | | | | | | | | | |
Net investment income1,2 | | | 0.06 | | | | 0.12 | | | | 0.09 | | | | 0.09 | | | | 0.14 | | | | 0.15 | |
Net realized and unrealized gain (loss) on investments | | | (0.07 | ) | | | (0.32 | ) | | | 0.47 | | | | 1.32 | | | | 0.54 | | | | 0.14 | |
| | | | | | | | | | | | | | | | | | | | | | | | |
Total from investment operations | | | (0.01 | ) | | | (0.20 | ) | | | 0.56 | | | | 1.41 | | | | 0.68 | | | | 0.29 | |
| | | | | | | | | | | | | | | | | | | | | | | | |
Less distributions to shareholders: | | | | | | | | | | | | | | | | | | | | | | | | |
From net investment income | | | (0.07 | ) | | | (0.24 | ) | | | (0.23 | ) | | | (0.18 | ) | | | (0.19 | ) | | | (0.17 | ) |
From net realized gain on investments | | | (0.81 | ) | | | (0.82 | ) | | | (0.39 | ) | | | (0.35 | ) | | | (0.73 | ) | | | (0.34 | ) |
| | | | | | | | | | | | | | | | | | | | | | | | |
Total distributions to shareholders | | | (0.88 | ) | | | (1.06 | ) | | | (0.62 | ) | | | (0.53 | ) | | | (0.92 | ) | | | (0.51 | ) |
| | | | | | | | | | | | | | | | | | | | | | | | |
Net asset value - End of period | | $ | 8.45 | | | $ | 9.34 | | | $ | 10.60 | | | $ | 10.66 | | | $ | 9.78 | | | $ | 10.02 | |
| | | | | | | | | | | | | | | | | | | | | | | | |
Net assets - End of period (000’s omitted) | | $ | 5,855 | | | $ | 8,193 | | | $ | 22,564 | | | $ | 30,393 | | | $ | 19,150 | | | $ | 16,105 | |
| | | | | | | | | | | | | | | | | | | | | | | | |
Total return3 | | | 0.22 | % | | | (2.13 | %) | | | 5.55 | % | | | 15.07 | % | | | 7.82 | % | | | 2.85 | % |
Ratios (to average net assets)/Supplemental Data: | | | | | | | | | | | | | | | | | | | | | | | | |
Expenses* | | | 0.55 | %4,5 | | | 0.55 | %6 | | | 0.55 | %7 | | | 0.55 | %7 | | | 0.55 | %8 | | | 0.55 | %5 |
Net investment income2 | | | 1.50 | %4 | | | 1.24 | % | | | 0.83 | % | | | 0.85 | % | | | 1.47 | % | | | 1.48 | % |
Series portfolio turnover9 | | | 11 | % | | | 42 | % | | | 37 | % | | | 19 | % | | | 24 | % | | | 49 | % |
|
| *The investment advisor paid a portion of the Series’ expenses. If these expenses had been incurred by the Series, the expense ratios (to average net assets) would have been increased by the following amounts: | |
| | | 0.05 | %4,5 | | | 0.04 | %6 | | | 0.03 | %7 | | | 0.05 | %7 | | | 0.08 | %8 | | | 0.10 | %5 |
1Calculated based on average shares outstanding during the periods.
2Net investment income is affected by the timing of distributions from the Underlying Series in which the Series invest. The ratios do not include net investment income of the Underlying Series in which the Series invests.
3Represents aggregate total return for the periods indicated. Total return would have been lower had certain expenses not been reimbursed. Periods less than one year are not annualized.
4Annualized.
5Expense ratios do not include expenses of the Underlying Series in which the Series invests. The expense ratios of the Underlying Series were 0.82% for Manning & Napier Pro-Blend® Moderate Term Series - Class I and 0.83% for Manning & Napier Pro-Blend® Extended Term Series - Class I.
6Expense ratios do not include expenses of the Underlying Series in which the Series invests. The expense ratios of the Underlying Series were 0.81% for Manning & Napier Pro-Blend® Moderate Term Series - Class I and 0.82% for Manning & Napier Pro-Blend® Extended Term Series - Class I.
7Expense ratios do not include expenses of the Underlying Series in which the Series invests. The expense ratios of the Underlying Series were 0.81% for Manning & Napier Pro-Blend® Moderate Term Series - Class I and 0.81% for Manning & Napier Pro-Blend® Extended Term Series - Class I.
8Expense ratios do not include expenses of the Underlying Series in which the Series invests. The expense ratios of the Underlying Series were 0.82% for Manning & Napier Pro-Blend® Moderate Term Series - Class I and 0.82% for Manning & Napier Pro-Blend® Extended Term Series - Class I.
9Reflects activity of the Series and does not include the activity of the Underlying Series.
The accompanying notes are an integral part of the financial statements.
23
Financial Highlights
| | | | | | | | | | | | | | | | | | | | | | | | |
| TARGET 2020 SERIES CLASS I | | FOR THE SIX
MONTHS ENDED
4/30/16 | | | FOR THE YEARS ENDED | | | | | | | |
| | (UNAUDITED) | | | 10/31/15 | | | 10/31/14 | | | 10/31/13 | | | 10/31/12 | | | 10/31/11 | |
Per share data (for a share outstanding throughout each period): | | | | | | | | | | | | | | | | | | | | | | | | |
Net asset value - Beginning of period | | $ | 9.50 | | | $ | 10.81 | | | $ | 10.83 | | | $ | 9.93 | | | $ | 10.16 | | | $ | 10.37 | |
| | | | | | | | | | | | | | | | | | | | | | | | |
Income (loss) from investment operations: | | | | | | | | | | | | | | | | | | | | | | | | |
Net investment income1,2 | | | 0.08 | | | | 0.13 | | | | 0.16 | | | | 0.14 | | | | 0.20 | | | | 0.09 | |
Net realized and unrealized gain (loss) on investments | | | (0.08 | ) | | | (0.31 | ) | | | 0.49 | | | | 1.34 | | | | 0.54 | | | | 0.25 | |
| | | | | | | | | | | | | | | | | | | | | | | | |
Total from investment operations | | | — | | | | (0.18 | ) | | | 0.65 | | | | 1.48 | | | | 0.74 | | | | 0.34 | |
| | | | | | | | | | | | | | | | | | | | | | | | |
Less distributions to shareholders: | | | | | | | | | | | | | | | | | | | | | | | | |
From net investment income | | | (0.09 | ) | | | (0.31 | ) | | | (0.28 | ) | | | (0.23 | ) | | | (0.24 | ) | | | (0.21 | ) |
From net realized gain on investments | | | (0.81 | ) | | | (0.82 | ) | | | (0.39 | ) | | | (0.35 | ) | | | (0.73 | ) | | | (0.34 | ) |
| | | | | | | | | | | | | | | | | | | | | | | | |
Total distributions to shareholders | | | (0.90 | ) | | | (1.13 | ) | | | (0.67 | ) | | | (0.58 | ) | | | (0.97 | ) | | | (0.55 | ) |
| | | | | | | | | | | | | | | | | | | | | | | | |
Net asset value - End of period | | $ | 8.60 | | | $ | 9.50 | | | $ | 10.81 | | | $ | 10.83 | | | $ | 9.93 | | | $ | 10.16 | |
| | | | | | | | | | | | | | | | | | | | | | | | |
| | | | | | |
Net assets - End of period (000’s omitted) | | $ | 67,791 | | | $ | 74,947 | | | $ | 61,673 | | | $ | 70,556 | | | $ | 39,523 | | | $ | 25,262 | |
| | | | | | | | | | | | | | | | | | | | | | | | |
| | | | | | |
Total return3 | | | 0.44 | % | | | (1.87 | %) | | | 6.37 | % | | | 15.65 | % | | | 8.36 | % | | | 3.37 | % |
Ratios (to average net assets)/Supplemental Data: | | | | | | | | | | | | | | | | | | | | | | | | |
Expenses* | | | 0.05 | %4,5 | | | 0.05 | %6 | | | 0.05 | %7 | | | 0.05 | %7 | | | 0.05 | %8 | | | 0.05 | %5 |
Net investment income2 | | | 1.87 | %4 | | | 1.33 | % | | | 1.48 | % | | | 1.34 | % | | | 2.10 | % | | | 0.85 | % |
Series portfolio turnover9 | | | 11 | % | | | 42 | % | | | 37 | % | | | 19 | % | | | 24 | % | | | 49 | % |
|
| *The investment advisor paid a portion of the Series’ expenses. If these expenses had been incurred by the Series, the expense ratios (to average net assets) would have been increased by the following amounts: | |
| | | | | | |
| | | 0.05 | %4,5 | | | 0.04 | %6 | | | 0.03 | %7 | | | 0.05 | %7 | | | 0.08 | %8 | | | 0.11 | %5 |
1Calculated based on average shares outstanding during the periods.
2Net investment income is affected by the timing of distributions from the Underlying Series in which the Series invest. The ratios do not include net investment income of the Underlying Series in which the Series invests.
3Represents aggregate total return for the periods indicated. Total return would have been lower had certain expenses not been reimbursed. Periods less than one year are not annualized.
4Annualized.
5Expense ratios do not include expenses of the Underlying Series in which the Series invests. The expense ratios of the Underlying Series were 0.82% for Manning & Napier Pro-Blend® Moderate Term Series—Class I and 0.83% for Manning & Napier Pro-Blend® Extended Term Series—Class I.
6Expense ratios do not include expenses of the Underlying Series in which the Series invests. The expense ratios of the Underlying Series were 0.81% for Manning & Napier Pro-Blend® Moderate Term Series—Class I and 0.82% for Manning & Napier Pro-Blend® Extended Term Series—Class I.
7Expense ratios do not include expenses of the Underlying Series in which the Series invests. The expense ratios of the Underlying Series were 0.81% for Manning & Napier Pro-Blend® Moderate Term Series—Class I and 0.81% for Manning & Napier Pro-Blend® Extended Term Series—Class I.
8Expense ratios do not include expenses of the Underlying Series in which the Series invests. The expense ratios of the Underlying Series were 0.82% for Manning & Napier Pro-Blend® Moderate Term Series—Class I and 0.82% for Manning & Napier Pro-Blend® Extended Term Series—Class I.
9Reflects activity of the Series and does not include the activity of the Underlying Series.
The accompanying notes are an integral part of the financial statements.
24
Financial Highlights
| | | | | | | | | | | | | | | | | | | | |
| TARGET 2025 SERIES CLASS K | | FOR THE SIX
MONTHS ENDED
4/30/16 | | | FOR THE YEARS ENDED | | | FOR THE PERIOD | |
| | (UNAUDITED) | | | 10/31/15 | | | 10/31/14 | | | 10/31/13 | | | 6/25/121 TO 10/31/12 | |
Per share data (for a share outstanding throughout each period): | | | | | | | | | | | | | | | | | | | | |
Net asset value - Beginning of period | | $ | 11.82 | | | $ | 13.01 | | | $ | 12.50 | | | $ | 10.77 | | | $ | 10.00 | |
| | | | | | | | | | | | | | | | | | | | |
Income (loss) from investment operations: | | | | | | | | | | | | | | | | | | | | |
Net investment income (loss)2,3 | | | 0.09 | | | | 0.12 | | | | 0.09 | | | | 0.09 | | | | (0.01 | ) |
Net realized and unrealized gain (loss) on investments | | | (0.11 | ) | | | (0.40 | ) | | | 0.80 | | | | 1.85 | | | | 0.78 | |
| | | | | | | | | | | | | | | | | | | | |
Total from investment operations | | | (0.02 | ) | | | (0.28 | ) | | | 0.89 | | | | 1.94 | | | | 0.77 | |
| | | | | | | | | | | | | | | | | | | | |
Less distributions to shareholders: | | | | | | | | | | | | | | | | | | | | |
From net investment income | | | (0.11 | ) | | | (0.43 | ) | | | (0.34 | ) | | | (0.21 | ) | | | — | |
From net realized gain on investments | | | (0.94 | ) | | | (0.48 | ) | | | (0.04 | ) | | | — | | | | — | |
| | | | | | | | | | | | | | | | | | | | |
Total distributions to shareholders | | | (1.05 | ) | | | (0.91 | ) | | | (0.38 | ) | | | (0.21 | ) | | | — | |
| | | | | | | | | | | | | | | | | | | | |
Net asset value - End of period | | $ | 10.75 | | | $ | 11.82 | | | $ | 13.01 | | | $ | 12.50 | | | $ | 10.77 | |
| | | | | | | | | | | | | | | | | | | | |
Net assets - End of period (000’s omitted) | | $ | 12,220 | | | $ | 11,896 | | | $ | 7,501 | | | $ | 710 | | | $ | 47,648 | 4 |
| | | | | | | | | | | | | | | | | | | | |
Total return5 | | | 0.13 | % | | | (2.31 | %) | | | 7.28 | % | | | 18.32 | % | | | 7.70 | % |
Ratios (to average net assets)/Supplemental Data: | | | | | | | | | | | | | | | | | | | | |
Expenses* | | | 0.30 | %6,7 | | | 0.30 | %8 | | | 0.30 | %9 | | | 0.30 | %9 | | | 0.30 | %6,10 |
Net investment income (loss)3 | | | 1.62 | %6 | | | 1.01 | % | | | 0.66 | % | | | 0.80 | % | | | (0.30 | %)6 |
Series portfolio turnover11 | | | 41 | % | | | 27 | % | | | 30 | % | | | 22 | % | | | — | 12 |
|
| *The investment advisor paid a portion of the Series’ expenses. If these expenses had been incurred by the Series, the expense ratios (to average net assets) would have been increased by the following amounts: | |
| | | | | |
| | | 0.40 | %6,7 | | | 0.39 | %8 | | | 0.59 | %9 | | | 10.70 | %9 | | | 259 | %6,10,13 |
| TARGET 2025 SERIES CLASS R | | FOR THE SIX
MONTHS ENDED
4/30/16 | | | FOR THE YEARS ENDED | | | FOR THE PERIOD | |
| | (UNAUDITED) | | | 10/31/15 | | | 10/31/14 | | | 10/31/13 | | | 6/25/121 TO 10/31/12 | |
Per share data (for a share outstanding throughout each period): | | | | | | | | | | | | | | | | | | | | |
Net asset value - Beginning of period | | $ | 11.86 | | | $ | 13.02 | | | $ | 12.53 | | | $ | 10.75 | | | $ | 10.00 | |
| | | | | | | | | | | | | | | | | | | | |
Income (loss) from investment operations: | | | | | | | | | | | | | | | | | | | | |
Net investment income (loss)2,3 | | | 0.07 | | | | 0.13 | | | | 0.10 | | | | (0.01 | ) | | | (0.02 | ) |
Net realized and unrealized gain (loss) on investments | | | (0.12 | ) | | | (0.43 | ) | | | 0.75 | | | | 1.98 | | | | 0.77 | |
| | | | | | | | | | | | | | | | | | | | |
Total from investment operations | | | (0.05 | ) | | | (0.30 | ) | | | 0.85 | | | | 1.97 | | | | 0.75 | |
| | | | | | | | | | | | | | | | | | | | |
Less distributions to shareholders: | | | | | | | | | | | | | | | | | | | | |
From net investment income | | | (0.09 | ) | | | (0.38 | ) | | | (0.32 | ) | | | (0.19 | ) | | | — | |
From net realized gain on investments | | | (0.94 | ) | | | (0.48 | ) | | | (0.04 | ) | | | — | | | | — | |
| | | | | | | | | | | | | | | | | | | | |
Total distributions to shareholders | | | (1.03 | ) | | | (0.86 | ) | | | (0.36 | ) | | | (0.19 | ) | | | — | |
| | | | | | | | | | | | | | | | | | | | |
Net asset value - End of period | | $ | 10.78 | | | $ | 11.86 | | | $ | 13.02 | | | $ | 12.53 | | | $ | 10.75 | |
| | | | | | | | | | | | | | | | | | | | |
Net assets - End of period (000’s omitted) | | $ | 2,126 | | | $ | 2,101 | | | $ | 3,799 | | | $ | 1,540 | | | $ | 108 | 4 |
| | | | | | | | | | | | | | | | | | | | |
Total return5 | | | (0.11 | %) | | | (2.44 | %) | | | 6.93 | % | | | 18.61 | % | | | 7.50 | % |
Ratios (to average net assets)/Supplemental Data: | | | | | | | | | | | | | | | | | | | | |
Expenses* | | | 0.55 | %6,7 | | | 0.55 | %8 | | | 0.55 | %9 | | | 0.55 | %9 | | | 0.55 | %6,10 |
Net investment income (loss)3 | | | 1.40 | %6 | | | 1.07 | % | | | 0.75 | % | | | (0.10 | %) | | | (0.55 | %)6 |
Series portfolio turnover11 | | | 41 | % | | | 27 | % | | | 30 | % | | | 22 | % | | | — | 12 |
|
| *The investment advisor paid a portion of the Series’ expenses. If these expenses had been incurred by the Series, the expense ratios (to average net assets) would have been increased by the following amounts: | |
| | | | | |
| | | 0.40 | %6,7 | | | 0.39 | %8 | | | 0.62 | %9 | | | 1.75 | %9 | | | 3,129 | %6,10,13 |
1Commencement of operations.
2Calculated based on average shares outstanding during the periods.
3Net investment income is affected by the timing of distributions from the Underlying Series in which the Series invest. The ratios do not include net investment income of the Underlying Series in which the Series invests.
4Represents the whole number without rounding to the 000s.
5Represents aggregate total return for the periods indicated. Total return would have been lower had certain expenses not been reimbursed. Periods less than one year are not annualized.
6Annualized.
7Expense ratios do not include expenses of the Underlying Series in which the Series invests. The expense ratios of the Underlying Series were 0.82% for Manning & Napier Pro-Blend® Moderate Term Series—Class I and 0.83% for Manning & Napier Pro-Blend® Extended Term Series—Class I.
8Expense ratios do not include expenses of the Underlying Series in which the Series invests. The expense ratios of the Underlying Series were 0.82% for Manning & Napier Pro-Blend® Extended Term Series—Class I and 0.83% for Manning & Napier Pro-Blend® Maximum Term Series—Class I.
9Expense ratios do not include expenses of the Underlying Series in which the Series invests. The expense ratios of the Underlying Series were 0.81% for Manning & Napier Pro-Blend® Extended Term Series—Class I and 0.82% for Manning & Napier Pro-Blend® Maximum Term Series—Class I.
10Expense ratios do not include expenses of the Underlying Series in which the Series invests. The expense ratios of the Underlying Series were 0.82% for Manning & Napier Pro-Blend® Extended Term Series—Class I and 0.84% for Manning & Napier Pro-Blend® Maximum Term Series—Class I.
11Reflects activity of the Series and does not include the activity of the Underlying Series.
12Less than 1%.
13The increase to the expense ratios (to average net assets) is largely due to the small net assets in each class.
The accompanying notes are an integral part of the financial statements.
25
Financial Highlights
| | | | | | | | | | | | | | | | | | | | |
| TARGET 2025 SERIES CLASS I | | FOR THE SIX
MONTHS ENDED
4/30/16 | | | FOR THE YEARS ENDED | | | FOR THE PERIOD | |
| | (UNAUDITED) | | | 10/31/15 | | | 10/31/14 | | | 10/31/13 | | | 6/25/121 TO 10/31/12 | |
Per share data (for a share outstanding throughout each period): | | | | | | | | | | | | | | | | | | | | |
Net asset value - Beginning of period | | $ | 11.80 | | | $ | 12.98 | | | $ | 12.47 | | | $ | 10.77 | | | $ | 10.00 | |
| | | | | | | | | | | | | | | | | | | | |
Income (loss) from investment operations: | | | | | | | | | | | | | | | | | | | | |
Net investment income (loss)2,3 | | | 0.10 | | | | 0.16 | | | | 0.16 | | | | 0.12 | | | | — | 4 |
Net realized and unrealized gain (loss) on investments | | | (0.12 | ) | | | (0.40 | ) | | | 0.75 | | | | 1.81 | | | | 0.77 | |
| | | | | | | | | | | | | | | | | | | | |
Total from investment operations | | | (0.02 | ) | | | (0.24 | ) | | | 0.91 | | | | 1.93 | | | | 0.77 | |
| | | | | | | | | | | | | | | | | | | | |
Less distributions to shareholders: | | | | | | | | | | | | | | | | | | | | |
From net investment income | | | (0.12 | ) | | | (0.46 | ) | | | (0.36 | ) | | | (0.23 | ) | | | — | |
From net realized gain on investments | | | (0.94 | ) | | | (0.48 | ) | | | (0.04 | ) | | | — | | | | — | |
| | | | | | | | | | | | | | | | | | | | |
Total distributions to shareholders | | | (1.06 | ) | | | (0.94 | ) | | | (0.40 | ) | | | (0.23 | ) | | | — | |
| | | | | | | | | | | | | | | | | | | | |
Net asset value - End of period | | $ | 10.72 | | | $ | 11.80 | | | $ | 12.98 | | | $ | 12.47 | | | $ | 10.77 | |
| | | | | | | | | | | | | | | | | | | | |
Net assets - End of period (000’s omitted) | | $ | 15,523 | | | $ | 15,539 | | | $ | 13,046 | | | $ | 9,373 | | | $ | 211 | 5 |
| | | | | | | | | | | | | | | | | | | | |
Total return6 | | | 0.19 | % | | | (2.00 | %) | | | 7.51 | % | | | 18.26 | % | | | 7.70 | % |
Ratios (to average net assets)/Supplemental Data: | | | | | | | | | | | | | | | | | | | | |
Expenses* | | | 0.05 | %7,8 | | | 0.05 | %9 | | | 0.05 | %10 | | | 0.05 | %10 | | | 0.05 | %7,11 |
Net investment income (loss)3 | | | 1.87 | %7 | | | 1.29 | % | | | 1.22 | % | | | 1.03 | % | | | (0.05 | %)7 |
Series portfolio turnover12 | | | 41 | % | | | 27 | % | | | 30 | % | | | 22 | % | | | — | 13 |
|
| *The investment advisor paid a portion of the Series’ expenses. If these expenses had been incurred by the Series, the expense ratios (to average net assets) would have been increased by the following amounts: | |
| | | | | |
| | | 0.40 | %7,8 | | | 0.39 | %9 | | | 0.64 | %10 | | | 1.43 | %10 | | | 1,967 | %7,11,14 |
1Commencement of operations.
2Calculated based on average shares outstanding during the periods.
3Net investment income is affected by the timing of distributions from the Underlying Series in which the Series invest. The ratios do not include net investment income of the Underlying Series in which the Series invests.
4Less than $0.01.
5Represents the whole number without rounding to the 000s.
6Represents aggregate total return for the periods indicated. Total return would have been lower had certain expenses not been reimbursed. Periods less than one year are not annualized.
7Annualized.
8Expense ratios do not include expenses of the Underlying Series in which the Series invests. The expense ratios of the Underlying Series were 0.82% for Manning & Napier Pro-Blend® Moderate Term Series - Class I and 0.83% for Manning & Napier Pro-Blend® Extended Term Series - Class I.
9Expense ratios do not include expenses of the Underlying Series in which the Series invests. The expense ratios of the Underlying Series were 0.82% for Manning & Napier Pro-Blend® Extended Term Series - Class I and 0.83% for Manning & Napier Pro-Blend® Maximum Term Series - Class I.
10Expense ratios do not include expenses of the Underlying Series in which the Series invests. The expense ratios of the Underlying Series were 0.81% for Manning & Napier Pro-Blend® Extended Term Series - Class I and 0.82% for Manning & Napier Pro-Blend® Maximum Term Series - Class I.
11Expense ratios do not include expenses of the Underlying Series in which the Series invests. The expense ratios of the Underlying Series were 0.82% for Manning & Napier Pro-Blend® Extended Term Series - Class I and 0.84% for Manning & Napier Pro-Blend® Maximum Term Series - Class I.
12Reflects activity of the Series and does not include the activity of the Underlying Series.
13Less than 1%.
14The increase to the expense ratios (to average net assets) is largely due to the small net assets in each class.
The accompanying notes are an integral part of the financial statements.
26
Financial Highlights
| | | | | | | | | | | | | | | | | | | | | | | | |
| TARGET 2030 SERIES CLASS K | | FOR THE SIX
MONTHS ENDED
4/30/16 | | | FOR THE YEARS ENDED | | | | | | | |
| | (UNAUDITED) | | | 10/31/15 | | | 10/31/14 | | | 10/31/13 | | | 10/31/12 | | | 10/31/11 | |
Per share data (for a share outstanding throughout each period): | | | | | | | | | | | | | | | | | | | | | | | | |
Net asset value - Beginning of period | | $ | 9.78 | | | $ | 11.52 | | | $ | 11.40 | | | $ | 9.94 | | | $ | 10.02 | | | $ | 10.15 | |
| | | | | | | | | | | | | | | | | | | | | | | | |
Income (loss) from investment operations: | | | | | | | | | | | | | | | | | | | | | | | | |
Net investment income1,2 | | | 0.06 | | | | 0.11 | | | | 0.10 | | | | 0.10 | | | | 0.14 | | | | 0.16 | |
Net realized and unrealized gain (loss) on investments | | | (0.07 | ) | | | (0.34 | ) | | | 0.73 | | | | 1.86 | | | | 0.66 | | | | 0.16 | |
| | | | | | | | | | | | | | | | | | | | | | | | |
Total from investment operations | | | (0.01 | ) | | | (0.23 | ) | | | 0.83 | | | | 1.96 | | | | 0.80 | | | | 0.32 | |
| | | | | | | | | | | | | | | | | | | | | | | | |
Less distributions to shareholders: | | | | | | | | | | | | | | | | | | | | | | | | |
From net investment income | | | (0.08 | ) | | | (0.44 | ) | | | (0.35 | ) | | | (0.15 | ) | | | (0.17 | ) | | | (0.15 | ) |
From net realized gain on investments | | | (1.31 | ) | | | (1.07 | ) | | | (0.36 | ) | | | (0.35 | ) | | | (0.71 | ) | | | (0.30 | ) |
| | | | | | | | | | | | | | | | | | | | | | | | |
Total distributions to shareholders | | | (1.39 | ) | | | (1.51 | ) | | | (0.71 | ) | | | (0.50 | ) | | | (0.88 | ) | | | (0.45 | ) |
| | | | | | | | | | | | | | | | | | | | | | | | |
Net asset value - End of period | | $ | 8.38 | | | $ | 9.78 | | | $ | 11.52 | | | $ | 11.40 | | | $ | 9.94 | | | $ | 10.02 | |
| | | | | | | | | | | | | | | | | | | | | | | | |
Net assets - End of period (000’s omitted) | | $ | 79,714 | | | $ | 79,169 | | | $ | 118,788 | | | $ | 91,676 | | | $ | 67,510 | | | $ | 63,436 | |
| | | | | | | | | | | | | | | | | | | | | | | | |
Total return3 | | | 0.42 | % | | | (2.33 | %) | | | 7.67 | % | | | 20.56 | % | | | 9.12 | % | | | 3.15 | % |
Ratios (to average net assets)/Supplemental Data: | | | | | | | | | | | | | | | | | | | | | | | | |
Expenses* | | | 0.30 | %4,5 | | | 0.30 | %6 | | | 0.30 | %7 | | | 0.30 | %7 | | | 0.30 | %8 | | | 0.30 | %5 |
Net investment income2 | | | 1.35 | %4 | | | 1.11 | % | | | 0.87 | % | | | 0.90 | % | | | 1.50 | % | | | 1.58 | % |
Series portfolio turnover9 | | | 13 | % | | | 38 | % | | | 27 | % | | | 9 | % | | | 62 | % | | | 40 | % |
|
| *The investment advisor paid a portion of the Series’ expenses. If these expenses had been incurred by the Series, the expense ratios (to average net assets) would have been increased by the following amounts: | |
| | | | | | |
| | | 0.05 | %4,5 | | | 0.04 | %6 | | | 0.03 | %7 | | | 0.05 | %7 | | | 0.09 | %8 | | | 0.11 | %5 |
| TARGET 2030 SERIES CLASS R | | FOR THE SIX
MONTHS ENDED
4/30/16 | | | FOR THE YEARS ENDED | | | | | | | |
| | (UNAUDITED) | | | 10/31/15 | | | 10/31/14 | | | 10/31/13 | | | 10/31/12 | | | 10/31/11 | |
Per share data (for a share outstanding throughout each period): | | | | | | | | | | | | | | | | | | | | | | | | |
Net asset value - Beginning of period | | $ | 9.70 | | | $ | 11.37 | | | $ | 11.31 | | | $ | 9.87 | | | $ | 9.96 | | | $ | 10.09 | |
| | | | | | | | | | | | | | | | | | | | | | | | |
Income (loss) from investment operations: | | | | | | | | | | | | | | | | | | | | | | | | |
Net investment income1,2 | | | 0.05 | | | | 0.10 | | | | 0.07 | | | | 0.07 | | | | 0.09 | | | | 0.11 | |
Net realized and unrealized gain (loss) on investments | | | (0.07 | ) | | | (0.30 | ) | | | 0.67 | | | | 1.85 | | | | 0.68 | | | | 0.19 | |
| | | | | | | | | | | | | | | | | | | | | | | | |
Total from investment operations | | | (0.02 | ) | | | (0.20 | ) | | | 0.74 | | | | 1.92 | | | | 0.77 | | | | 0.30 | |
| | | | | | | | | | | | | | | | | | | | | | | | |
Less distributions to shareholders: | | | | | | | | | | | | | | | | | | | | | | | | |
From net investment income | | | (0.06 | ) | | | (0.40 | ) | | | (0.32 | ) | | | (0.13 | ) | | | (0.15 | ) | | | (0.13 | ) |
From net realized gain on investments | | | (1.31 | ) | | | (1.07 | ) | | | (0.36 | ) | | | (0.35 | ) | | | (0.71 | ) | | | (0.30 | ) |
| | | | | | | | | | | | | | | | | | | | | | | | |
Total distributions to shareholders | | | (1.37 | ) | | | (1.47 | ) | | | (0.68 | ) | | | (0.48 | ) | | | (0.86 | ) | | | (0.43 | ) |
| | | | | | | | | | | | | | | | | | | | | | | | |
Net asset value - End of period | | $ | 8.31 | | | $ | 9.70 | | | $ | 11.37 | | | $ | 11.31 | | | $ | 9.87 | | | $ | 9.96 | |
| | | | | | | | | | | | | | | | | | | | | | | | |
Net assets - End of period (000’s omitted) | | $ | 8,956 | | | $ | 11,115 | | | $ | 20,894 | | | $ | 28,034 | | | $ | 18,759 | | | $ | 9,243 | |
| | | | | | | | | | | | | | | | | | | | | | | | |
Total return3 | | | 0.37 | % | | | (2.11 | %) | | | 6.90 | % | | | 20.19 | % | | | 8.84 | % | | | 2.94 | % |
Ratios (to average net assets)/Supplemental Data: | | | | | | | | | | | | | | | | | | | | | | | | |
Expenses* | | | 0.55 | %4,5 | | | 0.55 | %6 | | | 0.55 | %7 | | | 0.55 | %7 | | | 0.55 | %8 | | | 0.55 | %5 |
Net investment income2 | | | 1.24 | %4 | | | 0.95 | % | | | 0.62 | % | | | 0.63 | % | | | 0.94 | % | | | 1.11 | % |
Series portfolio turnover9 | | | 13 | % | | | 38 | % | | | 27 | % | | | 9 | % | | | 62 | % | | | 40 | % |
|
| *The investment advisor paid a portion of the Series’ expenses. If these expenses had been incurred by the Series, the expense ratios (to average net assets) would have been increased by the following amounts: | |
| | | | | | |
| | | 0.05 | %4,5 | | | 0.04 | %6 | | | 0.03 | %7 | | | 0.05 | %7 | | | 0.09 | %8 | | | 0.11 | %5 |
1Calculated based on average shares outstanding during the periods.
2Net investment income is affected by the timing of distributions from the Underlying Series in which the Series invest. The ratios do not include net investment income of the Underlying Series in which the Series invests.
3Represents aggregate total return for the periods indicated. Total return would have been lower had certain expenses not been reimbursed. Periods less than one year are not annualized.
4Annualized.
5Expense ratios do not include expenses of the Underlying Series in which the Series invests. The expense ratios of the Underlying Series were 0.83% for Manning & Napier Pro-Blend® Extended Term Series - Class I and 0.84% for Manning & Napier Pro-Blend® Maximum Term Series - Class I.
6Expense ratios do not include expenses of the Underlying Series in which the Series invests. The expense ratios of the Underlying Series were 0.82% for Manning & Napier Pro-Blend® Extended Term Series - Class I and 0.83% for Manning & Napier Pro-Blend® Maximum Term Series - Class I.
7Expense ratios do not include expenses of the Underlying Series in which the Series invests. The expense ratios of the Underlying Series were 0.81% for Manning & Napier Pro-Blend® Extended Term Series - Class I and 0.82% for Manning & Napier Pro-Blend® Maximum Term Series - Class I.
8Expense ratios do not include expenses of the Underlying Series in which the Series invests. The expense ratios of the Underlying Series were 0.82% for Manning & Napier Pro-Blend® Extended Term Series - Class I and 0.84% for Manning & Napier Pro-Blend® Maximum Term Series - Class I.
9Reflects activity of the Series and does not include the activity of the Underlying Series.
The accompanying notes are an integral part of the financial statements.
27
Financial Highlights
| | | | | | | | | | | | | | | | | | | | | | | | |
| TARGET 2030 SERIES CLASS I | | FOR THE SIX
MONTHS ENDED
4/30/16 | | | FOR THE YEARS ENDED | | | | |
| | (UNAUDITED) | | | 10/31/15 | | | 10/31/14 | | | 10/31/13 | | | 10/31/12 | | | 10/31/11 | |
Per share data (for a share outstanding throughout each period): | | | | | | | | | | | | | | | | | | | | | | | | |
Net asset value - Beginning of period | | $ | 9.87 | | | $ | 11.61 | | | $ | 11.48 | | | $ | 10.01 | | | $ | 10.09 | | | $ | 10.21 | |
| | | | | | | | | | | | | | | | | | | | | | | | |
Income (loss) from investment operations: | | | | | | | | | | | | | | | | | | | | | | | | |
Net investment income1,2 | | | 0.07 | | | | 0.12 | | | | 0.14 | | | | 0.12 | | | | 0.17 | | | | 0.07 | |
Net realized and unrealized gain (loss) on investments | | | (0.07 | ) | | | (0.32 | ) | | | 0.73 | | | | 1.88 | | | | 0.65 | | | | 0.28 | |
| | | | | | | | | | | | | | | | | | | | | | | | |
Total from investment operations | | | — | | | | (0.20 | ) | | | 0.87 | | | | 2.00 | | | | 0.82 | | | | 0.35 | |
| | | | | | | | | | | | | | | | | | | | | | | | |
Less distributions to shareholders: | | | | | | | | | | | | | | | | | | | | | | | | |
From net investment income | | | (0.09 | ) | | | (0.47 | ) | | | (0.38 | ) | | | (0.18 | ) | | | (0.19 | ) | | | (0.17 | ) |
From net realized gain on investments | | | (1.31 | ) | | | (1.07 | ) | | | (0.36 | ) | | | (0.35 | ) | | | (0.71 | ) | | | (0.30 | ) |
| | | | | | | | | | | | | | | | | | | | | | | | |
Total distributions to shareholders | | | (1.40 | ) | | | (1.54 | ) | | | (0.74 | ) | | | (0.53 | ) | | | (0.90 | ) | | | (0.47 | ) |
| | | | | | | | | | | | | | | | | | | | | | | | |
Net asset value - End of period | | $ | 8.47 | | | $ | 9.87 | | | $ | 11.61 | | | $ | 11.48 | | | $ | 10.01 | | | $ | 10.09 | |
| | | | | | | | | | | | | | | | | | | | | | | | |
Net assets - End of period (000’s omitted) | | $ | 76,307 | | | $ | 75,870 | | | $ | 58,075 | | | $ | 63,662 | | | $ | 37,832 | | | $ | 20,249 | |
| | | | | | | | | | | | | | | | | | | | | | | | |
Total return3 | | | 0.59 | % | | | (2.02 | %) | | | 7.95 | % | | | 20.81 | % | | | 9.36 | % | | | 3.47 | % |
Ratios (to average net assets)/Supplemental Data: | | | | | | | | | | | | | | | | | | | | | | | | |
Expenses* | | | 0.05 | %4,5 | | | 0.05 | %6 | | | 0.05 | %7 | | | 0.05 | %7 | | | 0.05 | %8 | | | 0.05 | %5 |
Net investment income2 | | | 1.62 | %4 | | | 1.22 | % | | | 1.23 | % | | | 1.14 | % | | | 1.78 | % | | | 0.74 | % |
Series portfolio turnover9 | | | 13 | % | | | 38 | % | | | 27 | % | | | 9 | % | | | 62 | % | | | 40 | % |
|
| *The investment advisor paid a portion of the Series’ expenses. If these expenses had been incurred by the Series, the expense ratios (to average net assets) would have been increased by the following amounts: | |
| | | | | | |
| | | 0.05 | %4,5 | | | 0.04 | %6 | | | 0.03 | %7 | | | 0.05 | %7 | | | 0.09 | %8 | | | 0.12 | %5 |
1Calculated based on average shares outstanding during the periods.
2Net investment income is affected by the timing of distributions from the Underlying Series in which the Series invest. The ratios do not include net investment income of the Underlying Series in which the Series invests.
3Represents aggregate total return for the periods indicated. Total return would have been lower had certain expenses not been reimbursed. Periods less than one year are not annualized.
4Annualized.
5Expense ratios do not include expenses of the Underlying Series in which the Series invests. The expense ratios of the Underlying Series were 0.83% for Manning & Napier Pro-Blend® Extended Term Series - Class I and 0.84% for Manning & Napier Pro-Blend® Maximum Term Series - Class I.
6Expense ratios do not include expenses of the Underlying Series in which the Series invests. The expense ratios of the Underlying Series were 0.82% for Manning & Napier Pro-Blend® Extended Term Series - Class I and 0.83% for Manning & Napier Pro-Blend® Maximum Term Series - Class I.
7Expense ratios do not include expenses of the Underlying Series in which the Series invests. The expense ratios of the Underlying Series were 0.81% for Manning & Napier Pro-Blend® Extended Term Series - Class I and 0.82% for Manning & Napier Pro-Blend® Maximum Term Series - Class I.
8Expense ratios do not include expenses of the Underlying Series in which the Series invests. The expense ratios of the Underlying Series were 0.82% for Manning & Napier Pro-Blend® Extended Term Series - Class I and 0.84% for Manning & Napier Pro-Blend® Maximum Term Series - Class I.
9Reflects activity of the Series and does not include the activity of the Underlying Series.
The accompanying notes are an integral part of the financial statements.
28
Financial Highlights
| | | | | | | | | | | | | | | | | | | | |
| TARGET 2035 SERIES CLASS K | | FOR THE SIX
MONTHS ENDED
4/30/16 (UNAUDITED) | | | FOR THE YEARS ENDED | | | | | | FOR THE PERIOD
6/25/121 TO 10/31/12 | |
| | | 10/31/15 | | | 10/31/14 | | | 10/31/13 | | |
Per share data (for a share outstanding throughout each period): | | | | | | | | | | | | | | | | | | | | |
Net asset value - Beginning of period | | $ | 12.32 | | | $ | 13.71 | | | $ | 13.22 | | | $ | 10.92 | | | $ | 10.00 | |
| | | | | | | | | | | | | | | | | | | | |
Income (loss) from investment operations: | | | | | | | | | | | | | | | | | | | | |
Net investment income (loss)2,3 | | | 0.06 | | | | 0.11 | | | | 0.06 | | | | 0.08 | | | | (0.01 | ) |
Net realized and unrealized gain (loss) on investments | | | (0.04 | ) | | | (0.38 | ) | | | 0.99 | | | | 2.35 | | | | 0.93 | 4 |
| | | | | | | | | | | | | | | | | | | | |
Total from investment operations | | | 0.02 | | | | (0.27 | ) | | | 1.05 | | | | 2.43 | | | | 0.92 | |
| | | | | | | | | | | | | | | | | | | | |
Less distributions to shareholders: | | | | | | | | | | | | | | | | | | | | |
From net investment income | | | (0.08 | ) | | | (0.61 | ) | | | (0.46 | ) | | | (0.13 | ) | | | — | |
From net realized gain on investments | | | (1.21 | ) | | | (0.51 | ) | | | (0.10 | ) | | | — | | | | — | |
| | | | | | | | | | | | | | | | | | | | |
Total distributions to shareholders | | | (1.29 | ) | | | (1.12 | ) | | | (0.56 | ) | | | (0.13 | ) | | | — | |
| | | | | | | | | | | | | | | | | | | | |
Net asset value - End of period | | $ | 11.05 | | | $ | 12.32 | | | $ | 13.71 | | | $ | 13.22 | | | $ | 10.92 | |
| | | | | | | | | | | | | | | | | | | | |
Net assets - End of period (000’s omitted) | | $ | 10,131 | | | $ | 8,979 | | | $ | 5,378 | | | $ | 465 | | | $ | 15,034 | 5 |
| | | | | | | | | | | | | | | | | | | | |
Total return6 | | | 0.70 | % | | | (2.20 | %) | | | 8.17 | % | | | 22.42 | % | | | 9.20 | % |
Ratios (to average net assets)/Supplemental Data: | | | | | | | | | | | | | | | | | | | | |
Expenses* | | | 0.30 | %7,8 | | | 0.30 | %9 | | | 0.30 | %10 | | | 0.30 | %10 | | | 0.30 | %7,11 |
Net investment income (loss)3 | | | 1.02 | %7 | | | 0.86 | % | | | 0.44 | % | | | 0.66 | % | | | (0.30 | %)7 |
Series portfolio turnover12 | | | 14 | % | | | 26 | % | | | 24 | % | | | 18 | % | | | — | 13 |
|
| *The investment advisor paid a portion of the Series’ expenses. If these expenses had been incurred by the Series, the expense ratios (to average net assets) would have been increased by the following amounts: | |
| | | | | |
| | | 0.53 | %7,8 | | | 0.52 | %9 | | | 0.83 | %10 | | | 9.70 | %10 | | | 4,581 | %7,11,14 |
| TARGET 2035 SERIES CLASS R | | FOR THE SIX
MONTHS ENDED
4/30/16 (UNAUDITED) | | | FOR THE YEARS ENDED | | | | | | FOR THE PERIOD
6/25/121 TO 10/31/12 | |
| | | 10/31/15 | | | 10/31/14 | | | 10/31/13 | | |
Per share data (for a share outstanding throughout each period): | | | | | | | | | | | | | | | | | | | | |
Net asset value - Beginning of period | | $ | 12.34 | | | $ | 13.72 | | | $ | 13.25 | | | $ | 10.91 | | | $ | 10.00 | |
| | | | | | | | | | | | | | | | | | | | |
Income (loss) from investment operations: | | | | | | | | | | | | | | | | | | | | |
Net investment income (loss)2,3 | | | 0.04 | | | | 0.08 | | | | 0.07 | | | | — | 15 | | | (0.02 | ) |
Net realized and unrealized gain (loss) on investments | | | (0.04 | ) | | | (0.38 | ) | | | 0.93 | | | | 2.44 | | | | 0.93 | 4 |
| | | | | | | | | | | | | | | | | | | | |
Total from investment operations | | | — | | | | (0.30 | ) | | | 1.00 | | | | 2.44 | | | | 0.91 | |
| | | | | | | | | | | | | | | | | | | | |
Less distributions to shareholders: | | | | | | | | | | | | | | | | | | | | |
From net investment income | | | (0.06 | ) | | | (0.57 | ) | | | (0.43 | ) | | | (0.10 | ) | | | — | |
From net realized gain on investments | | | (1.21 | ) | | | (0.51 | ) | | | (0.10 | ) | | | — | | | | — | |
| | | | | | | | | | | | | | | | | | | | |
Total distributions to shareholders | | | (1.27 | ) | | | (1.08 | ) | | | (0.53 | ) | | | (0.10 | ) | | | — | |
| | | | | | | | | | | | | | | | | | | | |
Net asset value - End of period | | $ | 11.07 | | | $ | 12.34 | | | $ | 13.72 | | | $ | 13.25 | | | $ | 10.91 | |
| | | | | | | | | | | | | | | | | | | | |
Net assets - End of period (000’s omitted) | | $ | 2,570 | | | $ | 2,337 | | | $ | 2,911 | | | $ | 1,172 | | | $ | 109 | 5 |
| | | | | | | | | | | | | | | | | | | | |
Total return6 | | | 0.52 | % | | | (2.44 | %) | | | 7.82 | % | | | 22.50 | % | | | 9.10 | % |
Ratios (to average net assets)/Supplemental Data: | | | | | | | | | | | | | | | | | | | | |
Expenses* | | | 0.55 | %7,8 | | | 0.55 | %9 | | | 0.55 | %10 | | | 0.55 | %10 | | | 0.55 | %7,11 |
Net investment income (loss)3 | | | 0.80 | %7 | | | 0.66 | % | | | 0.49 | % | | | 0.17 | % | | | (0.55 | %)7 |
Series portfolio turnover12 | | | 14 | % | | | 26 | % | | | 24 | % | | | 18 | % | | | — | 13 |
|
| *The investment advisor paid a portion of the Series’ expenses. If these expenses had been incurred by the Series, the expense ratios (to average net assets) would have been increased by the following amounts: | |
| | | | | |
| | | 0.53 | %7,8 | | | 0.52 | %9 | | | 0.88 | %10 | | | 2.38 | %10 | | | 9,077 | %7,11,14 |
1Commencement of operations.
2Calculated based on average shares outstanding during the periods.
3Net investment income is affected by the timing of distributions from the Underlying Series in which the Series invest. The ratios do not include net investment income of the Underlying Series in which the Series invests.
4Amount does not coincide with the amount shown on the Statements of Changes in Net Assets due to the timing of capital stock transactions and when the Series experienced unrealized gains and losses during the period.
5Represents the whole number without rounding to the 000s.
6Represents aggregate total return for the periods indicated. Total return would have been lower had certain expenses not been reimbursed. Periods less than one year are not annualized.
7Annualized.
8Expense ratios do not include expenses of the Underlying Series in which the Series invests. The expense ratios of the Underlying Series were 0.83% for Manning & Napier Pro-Blend® Extended Term Series - Class I and 0.84% for Manning & Napier Pro-Blend® Maximum Term Series - Class I.
9Expense ratios do not include expenses of the Underlying Series in which the Series invests. The expense ratios of the Underlying Series were 0.82% for Manning & Napier Pro-Blend® Extended Term Series - Class I and 0.83% for Manning & Napier Pro-Blend® Maximum Term Series - Class I.
10Expense ratios do not include expenses of the Underlying Series in which the Series invests. The expense ratios of the Underlying Series were 0.81% for Manning & Napier Pro-Blend® Extended Term Series - Class I and 0.82% for Manning & Napier Pro-Blend® Maximum Term Series - Class I.
11Expense ratios do not include expenses of the Underlying Series in which the Series invests. The expense ratios of the Underlying Series were 0.82% for Manning & Napier Pro-Blend® Extended Term Series - Class I and 0.84% for Manning & Napier Pro-Blend® Maximum Term Series - Class I.
12Reflects activity of the Series and does not include the activity of the Underlying Series.
13Less than 1%.
14The increase to the expense ratios (to average net assets) is largely due to the small net assets in each class.
15Less than $0.01.
The accompanying notes are an integral part of the financial statements.
29
Financial Highlights
| | | | | | | | | | | | | | | | | | | | |
| TARGET 2035 SERIES CLASS I | | FOR THE SIX
MONTHS ENDED
4/30/16 (UNAUDITED) | | | FOR THE YEARS ENDED | | | | | | FOR THE PERIOD
6/25/121 TO 10/31/12 | |
| | | 10/31/15 | | | 10/31/14 | | | 10/31/13 | | |
Per share data (for a share outstanding throughout each period): | | | | | | | | | | | | | | | | | | | | |
Net asset value - Beginning of period | | $ | 12.36 | | | $ | 13.75 | | | $ | 13.25 | | | $ | 10.92 | | | $ | 10.00 | |
| | | | | | | | | | | | | | | | | | | | |
Income (loss) from investment operations: | | | | | | | | | | | | | | | | | | | | |
Net investment income2,3 | | | 0.07 | | | | 0.14 | | | | 0.12 | | | | 0.09 | | | | — | 4 |
Net realized and unrealized gain (loss) on investments | | | (0.03 | ) | | | (0.38 | ) | | | 0.96 | | | | 2.38 | | | | 0.92 | 5 |
| | | | | | | | | | | | | | | | | | | | |
Total from investment operations | | | 0.04 | | | | (0.24 | ) | | | 1.08 | | | | 2.47 | | | | 0.92 | |
| | | | | | | | | | | | | | | | | | | | |
Less distributions to shareholders: | | | | | | | | | | | | | | | | | | | | |
From net investment income | | | (0.10 | ) | | | (0.64 | ) | | | (0.48 | ) | | | (0.14 | ) | | | — | |
From net realized gain on investments | | | (1.21 | ) | | | (0.51 | ) | | | (0.10 | ) | | | — | | | | — | |
| | | | | | | | | | | | | | | | | | | | |
Total distributions to shareholders | | | (1.31 | ) | | | (1.15 | ) | | | (0.58 | ) | | | (0.14 | ) | | | — | |
| | | | | | | | | | | | | | | | | | | | |
Net asset value - End of period | | $ | 11.09 | | | $ | 12.36 | | | $ | 13.75 | | | $ | 13.25 | | | $ | 10.92 | |
| | | | | | | | | | | | | | | | | | | | |
Net assets - End of period (000’s omitted) | | $ | 10,499 | | | $ | 10,993 | | | $ | 9,487 | | | $ | 6,322 | | | $ | 213 | 6 |
| | | | | | | | | | | | | | | | | | | | |
Total return7 | | | 0.83 | % | | | (1.98 | %) | | | 8.43 | % | | | 22.81 | % | | | 9.20 | % |
Ratios (to average net assets)/Supplemental Data: | | | | | | | | | | | | | | | | | | | | |
Expenses* | | | 0.05 | %8,9 | | | 0.05 | %10 | | | 0.05 | %11 | | | 0.05 | %11 | | | 0.05 | %8,12 |
Net investment income (loss)3 | | | 1.36 | %8 | | | 1.07 | % | | | 0.88 | % | | | 0.75 | % | | | (0.05 | %)8 |
Series portfolio turnover13 | | | 14 | % | | | 26 | % | | | 24 | % | | | 18 | % | | | — | 14 |
|
| *The investment advisor paid a portion of the Series’ expenses. If these expenses had been incurred by the Series, the expense ratios (to average net assets) would have been increased by the following amounts: | |
| | | | | |
| | | 0.53 | %8,9 | | | 0.52 | %10 | | | 0.91 | %11 | | | 2.40 | %11 | | | 7,930 | %8,12,15 |
1Commencement of operations.
2Calculated based on average shares outstanding during the periods.
3Net investment income is affected by the timing of distributions from the Underlying Series in which the Series invest. The ratios do not include net investment income of the Underlying Series in which the Series invests.
4Less than $0.01.
5Amount does not coincide with the amount shown on the Statements of Changes in Net Assets due to the timing of capital stock transactions and when the Series experienced unrealized gains and losses during the period.
6Represents the whole number without rounding to the 000s.
7Represents aggregate total return for the periods indicated. Total return would have been lower had certain expenses not been reimbursed. Periods less than one year are not annualized.
8Annualized.
9Expense ratios do not include expenses of the Underlying Series in which the Series invests. The expense ratios of the Underlying Series were 0.83% for Manning & Napier Pro-Blend® Extended Term Series - Class I and 0.84% for Manning & Napier Pro-Blend® Maximum Term Series - Class I.
10Expense ratios do not include expenses of the Underlying Series in which the Series invests. The expense ratios of the Underlying Series were 0.82% for Manning & Napier Pro-Blend® Extended Term Series - Class I and 0.83% for Manning & Napier Pro-Blend® Maximum Term Series - Class I.
11Expense ratios do not include expenses of the Underlying Series in which the Series invests. The expense ratios of the Underlying Series were 0.81% for Manning & Napier Pro-Blend® Extended Term Series - Class I and 0.82% for Manning & Napier Pro-Blend® Maximum Term Series - Class I.
12Expense ratios do not include expenses of the Underlying Series in which the Series invests. The expense ratios of the Underlying Series were 0.82% for Manning & Napier Pro-Blend® Extended Term Series - Class I and 0.84% for Manning & Napier Pro-Blend® Maximum Term Series - Class I.
13Reflects activity of the Series and does not include the activity of the Underlying Series.
14Less than 1%.
15The increase to the expense ratios (to average net assets) is largely due to the small net assets in each class.
The accompanying notes are an integral part of the financial statements.
30
Financial Highlights
| | | | | | | | | | | | | | | | | | | | | | | | |
| TARGET 2040 SERIES CLASS K | | FOR THE SIX
MONTHS ENDED 4/30/16
(UNAUDITED) | | | FOR THE YEARS ENDED | | | | | | | | | | |
| | | 10/31/15 | | | 10/31/14 | | | 10/31/13 | | | 10/31/12 | | | 10/31/11 | |
Per share data (for a share outstanding throughout each period): | | | | | | | | | | | | | | | | | | | | | | | | |
Net asset value - Beginning of period | | $ | 10.13 | | | $ | 12.50 | | | $ | 12.47 | | | $ | 10.29 | | | $ | 10.10 | | | $ | 10.20 | |
| | | | | | | | | | | | | | | | | | | | | | | | |
Income (loss) from investment operations: | | | | | | | | | | | | | | | | | | | | | | | | |
Net investment income1,2 | | | 0.03 | | | | 0.09 | | | | 0.07 | | | | 0.06 | | | | 0.07 | | | | 0.09 | |
Net realized and unrealized gain (loss) on investments | | | (0.02 | ) | | | (0.32 | ) | | | 0.94 | | | | 2.43 | | | | 0.74 | | | | (0.02 | ) |
| | | | | | | | | | | | | | | | | | | | | | | | |
Total from investment operations | | | 0.01 | | | | (0.23 | ) | | | 1.01 | | | | 2.49 | | | | 0.81 | | | | 0.07 | |
| | | | | | | | | | | | | | | | | | | | | | | | |
Less distributions to shareholders: | | | | | | | | | | | | | | | | | | | | | | | | |
From net investment income | | | (0.05 | ) | | | (0.61 | ) | | | (0.48 | ) | | | (0.07 | ) | | | (0.08 | ) | | | (0.08 | ) |
From net realized gain on investments | | | (1.55 | ) | | | (1.53 | ) | | | (0.50 | ) | | | (0.24 | ) | | | (0.54 | ) | | | (0.09 | ) |
| | | | | | | | | | | | | | | | | | | | | | | | |
Total distributions to shareholders | | | (1.60 | ) | | | (2.14 | ) | | | (0.98 | ) | | | (0.31 | ) | | | (0.62 | ) | | | (0.17 | ) |
| | | | | | | | | | | | | | | | | | | | | | | | |
Net asset value - End of period | | $ | 8.54 | | | $ | 10.13 | | | $ | 12.50 | | | $ | 12.47 | | | $ | 10.29 | | | $ | 10.10 | |
| | | | | | | | | | | | | | | | | | | | | | | | |
Net assets - End of period (000’s omitted) | | $ | 54,003 | | | $ | 51,931 | | | $ | 83,655 | | | $ | 67,576 | | | $ | 51,273 | | | $ | 39,853 | |
| | | | | | | | | | | | | | | | | | | | | | | | |
Total return3 | | | 0.89 | % | | | (2.30 | %) | | | 8.61 | % | | | 24.81 | % | | | 8.97 | % | | | 0.70 | % |
Ratios (to average net assets)/Supplemental Data: | | | | | | | | | | | | | | | | | | | | | | | | |
Expenses* | | | 0.30 | %4,5 | | | 0.30 | %6 | | | 0.30 | %7 | | | 0.30 | %7 | | | 0.30 | %8 | | | 0.30 | %9 |
Net investment income2 | | | 0.79 | %4 | | | 0.80 | % | | | 0.54 | % | | | 0.49 | % | | | 0.70 | % | | | 0.88 | % |
Series portfolio turnover10 | | | 13 | % | | | 45 | % | | | 22 | % | | | 13 | % | | | 24 | % | | | 19 | % |
|
| *The investment advisor paid a portion of the Series’ expenses. If these expenses had been incurred by the Series, the expense ratios (to average net assets) would have been increased by the following amounts: | |
| | | | | | |
| | | 0.10 | %4,5 | | | 0.08 | %6 | | | 0.06 | %7 | | | 0.09 | %7 | | | 0.14 | %8 | | | 0.17 | %9 |
| TARGET 2040 SERIES CLASS R | | FOR THE SIX
MONTHS ENDED 4/30/16
(UNAUDITED) | | | FOR THE YEARS ENDED | | | | | | | | | | |
| | | 10/31/15 | | | 10/31/14 | | | 10/31/13 | | | 10/31/12 | | | 10/31/11 | |
Per share data (for a share outstanding throughout each period): | | | | | | | | | | | | | | | | | | | | | | | | |
Net asset value - Beginning of period | | $ | 10.06 | | | $ | 12.33 | | | $ | 12.39 | | | $ | 10.22 | | | $ | 10.04 | | | $ | 10.14 | |
| | | | | | | | | | | | | | | | | | | | | | | | |
Income (loss) from investment operations: | | | | | | | | | | | | | | | | | | | | | | | | |
Net investment income1,2 | | | 0.02 | | | | 0.07 | | | | 0.03 | | | | 0.02 | | | | 0.05 | | | | 0.05 | |
Net realized and unrealized gain (loss) on investments | | | (0.02 | ) | | | (0.24 | ) | | | 0.86 | | | | 2.42 | | | | 0.73 | | | | — | 11 |
| | | | | | | | | | | | | | | | | | | | | | | | |
Total from investment operations | | | — | | | | (0.17 | ) | | | 0.89 | | | | 2.44 | | | | 0.78 | | | | 0.05 | |
| | | | | | | | | | | | | | | | | | | | | | | | |
Less distributions to shareholders: | | | | | | | | | | | | | | | | | | | | | | | | |
From net investment income | | | (0.03 | ) | | | (0.57 | ) | | | (0.45 | ) | | | (0.03 | ) | | | (0.06 | ) | | | (0.06 | ) |
From net realized gain on investments | | | (1.55 | ) | | | (1.53 | ) | | | (0.50 | ) | | | (0.24 | ) | | | (0.54 | ) | | | (0.09 | ) |
| | | | | | | | | | | | | | | | | | | | | | | | |
Total distributions to shareholders | | | (1.58 | ) | | | (2.10 | ) | | | (0.95 | ) | | | (0.27 | ) | | | (0.60 | ) | | | (0.15 | ) |
| | | | | | | | | | | | | | | | | | | | | | | | |
Net asset value - End of period | | $ | 8.48 | | | $ | 10.06 | | | $ | 12.33 | | | $ | 12.39 | | | $ | 10.22 | | | $ | 10.04 | |
| | | | | | | | | | | | | | | | | | | | | | | | |
Net assets - End of period (000’s omitted) | | $ | 4,688 | | | $ | 5,226 | | | $ | 10,469 | | | $ | 15,993 | | | $ | 11,827 | | | $ | 11,475 | |
| | | | | | | | | | | | | | | | | | | | | | | | |
Total return3 | | | 0.80 | % | | | (1.91 | %) | | | 7.60 | % | | | 24.50 | % | | | 8.67 | % | | | 0.50 | % |
Ratios (to average net assets)/Supplemental Data: | | | | | | | | | | | | | | | | | | | | | | | | |
Expenses* | | | 0.55 | %4,5 | | | 0.55 | %6 | | | 0.55 | %7 | | | 0.55 | %7 | | | 0.55 | %8 | | | 0.55 | %9 |
Net investment income2 | | | 0.58 | %4 | | | 0.62 | % | | | 0.23 | % | | | 0.20 | % | | | 0.54 | % | | | 0.52 | % |
Series portfolio turnover10 | | | 13 | % | | | 45 | % | | | 22 | % | | | 13 | % | | | 24 | % | | | 19 | % |
|
| *The investment advisor paid a portion of the Series’ expenses. If these expenses had been incurred by the Series, the expense ratios (to average net assets) would have been increased by the following amounts: | |
| | | | | | |
| | | 0.10 | %4,5 | | | 0.08 | %6 | | | 0.06 | %7 | | | 0.09 | %7 | | | 0.14 | %8 | | | 0.17 | %9 |
1Calculated based on average shares outstanding during the periods.
2Net investment income is affected by the timing of distributions from the Underlying Series in which the Series invest. The ratios do not include net investment income of the Underlying Series in which the Series invests.
3Represents aggregate total return for the periods indicated. Total return would have been lower had certain expenses not been reimbursed. Periods less than one year are not annualized.
4Annualized.
5Expense ratios do not include expenses of the Underlying Series in which the Series invests. The expense ratios of the Underlying Series were 0.83% for Manning & Napier Pro-Blend® Extended Term Series - Class I and 0.84% for Manning & Napier Pro-Blend® Maximum Term Series - Class I.
6Expense ratios do not include expenses of the Underlying Series in which the Series invests. The expense ratios of the Underlying Series were 0.82% for Manning & Napier Pro-Blend® Extended Term Series - Class I and 0.83% for Manning & Napier Pro-Blend® Maximum Term Series - Class I.
7Expense ratios do not include expenses of the Underlying Series in which the Series invests. The expense ratios of the Underlying Series were 0.81% for Manning & Napier Pro-Blend® Extended Term Series - Class I and 0.82% for Manning & Napier Pro-Blend® Maximum Term Series - Class I.
8Expense ratios do not include expenses of the Underlying Series in which the Series invests. The expense ratios of the Underlying Series were 0.82% for Manning & Napier Pro-Blend® Extended Term Series - Class I and 0.84% for Manning & Napier Pro-Blend® Maximum Term Series - Class I.
9Expense ratios do not include expenses of the Underlying Series in which the Series invests. The expense ratio of the Underlying Series was 0.84%.
10Reflects activity of the Series and does not include the activity of the Underlying Series.
11Less than $0.01.
The accompanying notes are an integral part of the financial statements.
31
Financial Highlights
| | | | | | | | | | | | | | | | | | | | | | | | |
| TARGET 2040 SERIES CLASS I | | FOR THE SIX
MONTHS ENDED 4/30/16
(UNAUDITED) | | | FOR THE YEARS ENDED | | | | | | | | | | |
| | | 10/31/15 | | | 10/31/14 | | | 10/31/13 | | | 10/31/12 | | | 10/31/11 | |
Per share data (for a share outstanding throughout each period): | | | | | | | | | | | | | | | | | | | | | | | | |
Net asset value - Beginning of period | | $ | 10.20 | | | $ | 12.58 | | | $ | 12.55 | | | $ | 10.35 | | | $ | 10.16 | | | $ | 10.26 | |
| | | | | | | | | | | | | | | | | | | | | | | | |
Income (loss) from investment operations: | | | | | | | | | | | | | | | | | | | | | | | | |
Net investment income1,2 | | | 0.05 | | | | 0.10 | | | | 0.10 | | | | 0.08 | | | | 0.10 | | | | 0.04 | |
Net realized and unrealized gain (loss) on investments | | | (0.03 | ) | | | (0.30 | ) | | | 0.94 | | | | 2.45 | | | | 0.74 | | | | 0.06 | |
| | | | | | | | | | | | | | | | | | | | | | | | |
Total from investment operations | | | 0.02 | | | | (0.20 | ) | | | 1.04 | | | | 2.53 | | | | 0.84 | | | | 0.10 | |
| | | | | | | | | | | | | | | | | | | | | | | | |
Less distributions to shareholders: | | | | | | | | | | | | | | | | | | | | | | | | |
From net investment income | | | (0.06 | ) | | | (0.65 | ) | | | (0.51 | ) | | | (0.09 | ) | | | (0.11 | ) | | | (0.11 | ) |
From net realized gain on investments | | | (1.55 | ) | | | (1.53 | ) | | | (0.50 | ) | | | (0.24 | ) | | | (0.54 | ) | | | (0.09 | ) |
| | | | | | | | | | | | | | | | | | | | | | | | |
Total distributions to shareholders | | | (1.61 | ) | | | (2.18 | ) | | | (1.01 | ) | | | (0.33 | ) | | | (0.65 | ) | | | (0.20 | ) |
| | | | | | | | | | | | | | | | | | | | | | | | |
Net asset value - End of period | | $ | 8.61 | | | $ | 10.20 | | | $ | 12.58 | | | $ | 12.55 | | | $ | 10.35 | | | $ | 10.16 | |
| | | | | | | | | | | | | | | | | | | | | | | | |
Net assets - End of period (000’s omitted) | | $ | 44,190 | | | $ | 43,552 | | | $ | 32,952 | | | $ | 33,545 | | | $ | 20,194 | | | $ | 11,298 | |
| | | | | | | | | | | | | | | | | | | | | | | | |
Total return3 | | | 1.03 | % | | | (2.08 | %) | | | 8.81 | % | | | 25.16 | % | | | 9.23 | % | | | 0.93 | % |
Ratios (to average net assets)/Supplemental Data: | | | | | | | | | | | | | | | | | | | | | | | | |
Expenses* | | | 0.05 | %4,5 | | | 0.05 | %6 | | | 0.05 | %7 | | | 0.05 | %7 | | | 0.05 | %8 | | | 0.05 | %9 |
Net investment income2 | | | 1.06 | %4 | | | 0.96 | % | | | 0.79 | % | | | 0.71 | % | | | 0.99 | % | | | 0.35 | % |
Series portfolio turnover10 | | | 13 | % | | | 45 | % | | | 22 | % | | | 13 | % | | | 24 | % | | | 19 | % |
|
| *The investment advisor paid a portion of the Series’ expenses. If these expenses had been incurred by the Series, the expense ratios (to average net assets) would have been increased by the following amounts: | |
| | | | | | |
| | | 0.10 | %4,5 | | | 0.08 | %6 | | | 0.06 | %7 | | | 0.09 | %7 | | | 0.14 | %8 | | | 0.18 | %9 |
1Calculated based on average shares outstanding during the periods.
2Net investment income is affected by the timing of distributions from the Underlying Series in which the Series invest. The ratios do not include net investment income of the Underlying Series in which the Series invests.
3Represents aggregate total return for the periods indicated. Total return would have been lower had certain expenses not been reimbursed. Periods less than one year are not annualized.
4Annualized.
5Expense ratios do not include expenses of the Underlying Series in which the Series invests. The expense ratios of the Underlying Series were 0.83% for Manning & Napier Pro-Blend® Extended Term Series - Class I and 0.84% for Manning & Napier Pro-Blend® Maximum Term Series - Class I.
6Expense ratios do not include expenses of the Underlying Series in which the Series invests. The expense ratios of the Underlying Series were 0.82% for Manning & Napier Pro-Blend® Extended Term Series - Class I and 0.83% for Manning & Napier Pro-Blend® Maximum Term Series - Class I.
7Expense ratios do not include expenses of the Underlying Series in which the Series invests. The expense ratios of the Underlying Series were 0.81% for Manning & Napier Pro-Blend® Extended Term Series - Class I and 0.82% for Manning & Napier Pro-Blend® Maximum Term Series - Class I.
8Expense ratios do not include expenses of the Underlying Series in which the Series invests. The expense ratios of the Underlying Series were 0.82% for Manning & Napier Pro-Blend® Extended Term Series - Class I and 0.84% for Manning & Napier Pro-Blend® Maximum Term Series - Class I.
9Expense ratios do not include expenses of the Underlying Series in which the Series invests. The expense ratio of the Underlying Series was 0.84%.
10Reflects activity of the Series and does not include the activity of the Underlying Series.
The accompanying notes are an integral part of the financial statements.
32
Financial Highlights
| | | | | | | | | | | | | | | | | | | | |
| TARGET 2045 SERIES CLASS K | | FOR THE SIX
MONTHS ENDED
4/30/16 (UNAUDITED) | | | FOR THE YEARS ENDED | | | | | | FOR THE PERIOD
6/25/121 TO 10/31/12 | |
| | | 10/31/15 | | | 10/31/14 | | | 10/31/13 | | |
Per share data (for a share outstanding throughout each period): | | | | | | | | | | | | | | | | | | | | |
Net asset value - Beginning of period | | $ | 12.71 | | | $ | 14.32 | | | $ | 13.73 | | | $ | 11.01 | | | $ | 10.00 | |
| | | | | | | | | | | | | | | | | | | | |
Income (loss) from investment operations: | | | | | | | | | | | | | | | | | | | | |
Net investment income (loss)2,3 | | | 0.02 | | | | 0.08 | | | | 0.03 | | | | 0.03 | | | | (0.01 | ) |
Net realized and unrealized gain (loss) on investments | | | 0.06 | | | | (0.34 | ) | | | 1.15 | | | | 2.74 | | | | 1.02 | 4 |
| | | | | | | | | | | | | | | | | | | | |
| | | | | |
Total from investment operations | | | 0.08 | | | | (0.26 | ) | | | 1.18 | | | | 2.77 | | | | 1.01 | |
| | | | | | | | | | | | | | | | | | | | |
| | | | | |
Less distributions to shareholders: | | | | | | | | | | | | | | | | | | | | |
From net investment income | | | (0.05 | ) | | | (0.77 | ) | | | (0.52 | ) | | | (0.05 | ) | | | — | |
From net realized gain on investments | | | (1.28 | ) | | | (0.58 | ) | | | (0.07 | ) | | | — | | | | — | |
| | | | | | | | | | | | | | | | | | | | |
| | | | | |
Total distributions to shareholders | | | (1.33 | ) | | | (1.35 | ) | | | (0.59 | ) | | | (0.05 | ) | | | — | |
| | | | | | | | | | | | | | | | | | | | |
| | | | | |
Net asset value - End of period | | $ | 11.46 | | | $ | 12.71 | | | $ | 14.32 | | | $ | 13.73 | | | $ | 11.01 | |
| | | | | | | | | | | | | | | | | | | | |
| | | | | |
Net assets - End of period (000’s omitted) | | $ | 5,660 | | | $ | 3,812 | | | $ | 3,041 | | | $ | 234 | | | $ | 3,320 | 5 |
| | | | | | | | | | | | | | | | | | | | |
| | | | | |
Total return6 | | | 1.15 | % | | | (2.10 | %) | | | 8.90 | % | | | 25.23 | % | | | 10.10 | % |
Ratios (to average net assets)/Supplemental Data: | | | | | | | | | | | | | | | | | | | | |
Expenses* | | | 0.30 | %7,8 | | | 0.30 | %9 | | | 0.30 | %10 | | | 0.30 | %10 | | | 0.30 | %7,11 |
Net investment income (loss)3 | | | 0.40 | %7 | | | 0.58 | % | | | 0.23 | % | | | 0.26 | % | | | (0.30 | %)7 |
Series portfolio turnover12 | | | 17 | % | | | 28 | % | | | 48 | % | | | 20 | % | | | — | 13 |
|
| *The investment advisor paid a portion of the Series’ expenses. If these expenses had been incurred by the Series, the expense ratios (to average net assets) would have been increased by the following amounts: | |
| | | | | |
| | | 1.17 | %7,8 | | | 1.21 | %9 | | | 1.95 | %10 | | | 17.80 | %10 | | | 3,204 | %7,11,14 |
| TARGET 2045 SERIES CLASS R | | FOR THE SIX
MONTHS ENDED
4/30/16 (UNAUDITED) | | | FOR THE YEARS ENDED | | | | | | FOR THE PERIOD
6/25/121 TO 10/31/12 | |
| | | 10/31/15 | | | 10/31/14 | | | 10/31/13 | | |
Per share data (for a share outstanding throughout each period): | | | | | | | | | | | | | | | | | | | | |
Net asset value - Beginning of period | | $ | 12.64 | | | $ | 14.25 | | | $ | 13.66 | | | $ | 10.99 | | | $ | 10.00 | |
| | | | | | | | | | | | | | | | | | | | |
Income (loss) from investment operations: | | | | | | | | | | | | | | | | | | | | |
Net investment income (loss)2,3 | | | 0.01 | | | | 0.05 | | | | 0.02 | | | | 0.01 | | | | (0.02 | ) |
Net realized and unrealized gain (loss) on investments | | | 0.05 | | | | (0.35 | ) | | | 1.13 | | | | 2.71 | | | | 1.01 | 4 |
| | | | | | | | | | | | | | | | | | | | |
| | | | | |
Total from investment operations | | | 0.06 | | | | (0.30 | ) | | | 1.15 | | | | 2.72 | | | | 0.99 | |
| | | | | | | | | | | | | | | | | | | | |
| | | | | |
Less distributions to shareholders: | | | | | | | | | | | | | | | | | | | | |
From net investment income | | | (0.03 | ) | | | (0.73 | ) | | | (0.49 | ) | | | (0.05 | ) | | | — | |
From net realized gain on investments | | | (1.28 | ) | | | (0.58 | ) | | | (0.07 | ) | | | — | | | | — | |
| | | | | | | | | | | | | | | | | | | | |
| | | | | |
Total distributions to shareholders | | | (1.31 | ) | | | (1.31 | ) | | | (0.56 | ) | | | (0.05 | ) | | | — | |
| | | | | | | | | | | | | | | | | | | | |
| | | | | |
Net asset value - End of period | | $ | 11.39 | | | $ | 12.64 | | | $ | 14.25 | | | $ | 13.66 | | | $ | 10.99 | |
| | | | | | | | | | | | | | | | | | | | |
| | | | | |
Net assets - End of period (000’s omitted) | | $ | 1,689 | | | $ | 1,631 | | | $ | 1,825 | | | $ | 618 | | | $ | 110 | 5 |
| | | | | | | | | | | | | | | | | | | | |
| | | | | |
Total return6 | | | 1.00 | % | | | (2.41 | %) | | | 8.71 | % | | | 24.87 | % | | | 9.90 | % |
Ratios (to average net assets)/Supplemental Data: | | | | | | | | | | | | | | | | | | | | |
Expenses* | | | 0.55 | %7,8 | | | 0.55 | %9 | | | 0.55 | %10 | | | 0.55 | %10 | | | 0.55 | %7,11 |
Net investment income (loss)3 | | | 0.25 | %7 | | | 0.36 | % | | | 0.12 | % | | | 0.11 | % | | | (0.55 | %)7 |
Series portfolio turnover12 | | | 17 | % | | | 28 | % | | | 48 | % | | | 20 | % | | | — | 13 |
|
| *The investment advisor paid a portion of the Series’ expenses. If these expenses had been incurred by the Series, the expense ratios (to average net assets) would have been increased by the following amounts: | |
| | | | | |
| | | 1.17 | %7,8 | | | 1.21 | %9 | | | 2.06 | %10 | | | 9.07 | %10 | | | 8,326 | %7,11,14 |
1Commencement of operations.
2Calculated based on average shares outstanding during the periods.
3Net investment income is affected by the timing of distributions from the Underlying Series in which the Series invest. The ratios do not include net investment income of the Underlying Series in which the Series invests.
4Amount does not coincide with the amount shown on the Statements of Changes in Net Assets due to the timing of capital stock transactions and when the Series experienced unrealized gains and losses during the period.
5Represents the whole number without rounding to the 000s.
6Represents aggregate total return for the periods indicated. Total return would have been lower had certain expenses not been reimbursed. Periods less than one year are not annualized.
7Annualized.
8Expense ratios do not include expenses of the Underlying Series in which the Series invests. The expense ratios of the Underlying Series were 0.83% for Manning & Napier Pro-Blend® Extended Term Series - Class I and 0.84% for Manning & Napier Pro-Blend® Maximum Term Series - Class I.
9Expense ratios do not include expenses of the Underlying Series in which the Series invests. The expense ratio of the Underlying Series was 0.83%.
10Expense ratios do not include expenses of the Underlying Series in which the Series invests. The expense ratio of the Underlying Series was 0.82%.
11Expense ratios do not include expenses of the Underlying Series in which the Series invests. The expense ratio of the Underlying Series was 0.84%.
12Reflects activity of the Series and does not include the activity of the Underlying Series.
13Less than 1%.
14The increase to the expense ratios (to average net assets) is largely due to the small net assets in each class.
The accompanying notes are an integral part of the financial statements.
33
Financial Highlights
| | | | | | | | | | | | | | | | | | | | |
| TARGET 2045 SERIES CLASS I | | FOR THE SIX
MONTHS ENDED
4/30/16 (UNAUDITED) | | | FOR THE YEARS ENDED | | | | | | FOR THE PERIOD
6/25/121 TO 10/31/12 | |
| | | 10/31/15 | | | 10/31/14 | | | 10/31/13 | | |
Per share data (for a share outstanding throughout each period): | | | | | | | | | | | | | | | | | | | | |
Net asset value - Beginning of period | | $ | 12.73 | | | $ | 14.35 | | | $ | 13.75 | | | $ | 11.01 | | | $ | 10.00 | |
| | | | | | | | | | | | | | | | | | | | |
Income (loss) from investment operations: | | | | | | | | | | | | | | | | | | | | |
Net investment income (loss)2,3 | | | 0.04 | | | | 0.11 | | | | 0.08 | | | | 0.06 | | | | — | 4 |
Net realized and unrealized gain (loss) on investments | | | 0.05 | | | | (0.35 | ) | | | 1.14 | | | | 2.74 | | | | 1.01 | 5 |
| | | | | | | | | | | | | | | | | | | | |
| | | | | |
Total from investment operations | | | 0.09 | | | | (0.24 | ) | | | 1.22 | | | | 2.80 | | | | 1.01 | |
| | | | | | | | | | | | | | | | | | | | |
Less distributions to shareholders: | | | | | | | | | | | | | | | | | | | | |
From net investment income | | | (0.06 | ) | | | (0.80 | ) | | | (0.55 | ) | | | (0.06 | ) | | | — | |
From net realized gain on investments | | | (1.28 | ) | | | (0.58 | ) | | | (0.07 | ) | | | — | | | | — | |
| | | | | | | | | | | | | | | | | | | | |
| | | | | |
Total distributions to shareholders | | | (1.34 | ) | | | (1.38 | ) | | | (0.62 | ) | | | (0.06 | ) | | | — | |
| | | | | | | | | | | | | | | | | | | | |
| | | | | |
Net asset value - End of period | | $ | 11.48 | | | $ | 12.73 | | | $ | 14.35 | | | $ | 13.75 | | | $ | 11.01 | |
| | | | | | | | | | | | | | | | | | | | |
| | | | | |
Net assets - End of period (000’s omitted) | | $ | 4,607.00 | | | $ | 4,494 | | | $ | 2,894 | | | $ | 1,983 | | | $ | 214 | 6 |
| | | | | | | | | | | | | | | | | | | | |
| | | | | |
Total return7 | | | 1.29 | % | | | (1.92 | %) | | | 9.15 | % | | | 25.58 | % | | | 10.10 | % |
Ratios (to average net assets)/Supplemental Data: | | | | | | | | | | | | | | | | | | | | |
Expenses* | | | 0.05 | %8,9 | | | 0.05 | %10 | | | 0.05 | %11 | | | 0.05 | %11 | | | 0.05 | %8,12 |
Net investment income (loss)3 | | | 0.78 | %8 | | | 0.86 | % | | | 0.57 | % | | | 0.46 | % | | | (0.05 | %)8 |
Series portfolio turnover13 | | | 17 | % | | | 28 | % | | | 48 | % | | | 20 | % | | | — | 14 |
|
| *The investment advisor paid a portion of the Series’ expenses. If these expenses had been incurred by the Series, the expense ratios (to average net assets) would have been increased by the following amounts: | |
| | | | | |
| | | 1.17 | %8,9 | | | 1.21 | %10 | | | 2.14 | %11 | | | 6.82 | %11 | | | 7,036 | %8,12,15 |
1Commencement of operations.
2Calculated based on average shares outstanding during the periods.
3Net investment income is affected by the timing of distributions from the Underlying Series in which the Series invest. The ratios do not include net investment income of the Underlying Series in which the Series invests.
4Less than $0.01.
5Amount does not coincide with the amount shown on the Statements of Changes in Net Assets due to the timing of capital stock transactions and when the Series experienced unrealized gains and losses during the period.
6Represents the whole number without rounding to the 000s.
7Represents aggregate total return for the periods indicated. Total return would have been lower had certain expenses not been reimbursed. Periods less than one year are not annualized.
8Annualized.
9Expense ratios do not include expenses of the Underlying Series in which the Series invests. The expense ratios of the Underlying Series were 0.83% for Manning & Napier Pro-Blend® Extended Term Series—Class I and 0.84% for Manning & Napier Pro-Blend® Maximum Term Series - Class I.
10Expense ratios do not include expenses of the Underlying Series in which the Series invests. The expense ratio of the Underlying Series was 0.83%.
11Expense ratios do not include expenses of the Underlying Series in which the Series invests. The expense ratio of the Underlying Series was 0.82%.
12Expense ratios do not include expenses of the Underlying Series in which the Series invests. The expense ratio of the Underlying Series was 0.84%.
13Reflects activity of the Series and does not include the activity of the Underlying Series.
14Less than 1%.
15The increase to the expense ratios (to average net assets) is largely due to the small net assets in each class.
The accompanying notes are an integral part of the financial statements.
34
Financial Highlights
| | | | | | | | | | | | | | | | | | | | | | | | |
| TARGET 2050 SERIES CLASS K | | FOR THE SIX
MONTHS ENDED 4/30/16
(UNAUDITED) | | | FOR THE YEARS ENDED | | | | | | | | | | |
| | | 10/31/15 | | | 10/31/14 | | | 10/31/13 | | | 10/31/12 | | | 10/31/11 | |
Per share data (for a share outstanding throughout each period): | | | | | | | | | | | | | | | | | | | | | | | | |
Net asset value - Beginning of period | | $ | 11.35 | | | $ | 13.73 | | | $ | 13.52 | | | $ | 10.81 | | | $ | 10.20 | | | $ | 10.22 | |
| | | | | | | | | | | | | | | | | | | | | | | | |
Income (loss) from investment operations: | | | | | | | | | | | | | | | | | | | | | | | | |
Net investment income1,2 | | | 0.02 | | | | 0.09 | | | | 0.05 | | | | 0.05 | | | | 0.07 | | | | 0.09 | |
Net realized and unrealized gain (loss) on investments | | | 0.02 | | | | (0.32 | ) | | | 1.07 | | | | 2.74 | | | | 0.81 | | | | (0.01 | ) |
| | | | | | | | | | | | | | | | | | | | | | | | |
| | | | | | |
Total from investment operations | | | 0.04 | | | | (0.23 | ) | | | 1.12 | | | | 2.79 | | | | 0.88 | | | | 0.08 | |
| | | | | | | | | | | | | | | | | | | | | | | | |
| | | | | | |
Less distributions to shareholders: | | | | | | | | | | | | | | | | | | | | | | | | |
From net investment income | | | (0.04 | ) | | | (0.72 | ) | | | (0.54 | ) | | | (0.05 | ) | | | (0.08 | ) | | | (0.08 | ) |
From net realized gain on investments | | | (2.12 | ) | | | (1.43 | ) | | | (0.37 | ) | | | (0.03 | ) | | | (0.19 | ) | | | (0.02 | ) |
| | | | | | | | | | | | | | | | | | | | | | | | |
| | | | | | |
Total distributions to shareholders | | | (2.16 | ) | | | (2.15 | ) | | | (0.91 | ) | | | (0.08 | ) | | | (0.27 | ) | | | (0.10 | ) |
| | | | | | | | | | | | | | | | | | | | | | | | |
| | | | | | |
Net asset value - End of period | | $ | 9.23 | | | $ | 11.35 | | | $ | 13.73 | | | $ | 13.52 | | | $ | 10.81 | | | $ | 10.20 | |
| | | | | | | | | | | | | | | | | | | | | | | | |
| | | | | | |
Net assets - End of period (000’s omitted) | | $ | 13,994 | | | $ | 15,144 | | | $ | 47,531 | | | $ | 36,591 | | | $ | 24,759 | | | $ | 18,293 | |
| | | | | | | | | | | | | | | | | | | | | | | | |
| | | | | | |
Total return3 | | | 1.38 | % | | | (2.15 | %) | | | 8.80 | % | | | 25.99 | % | | | 9.07 | % | | | 0.76 | % |
Ratios (to average net assets)/Supplemental Data: | | | | | | | | | | | | | | | | | | | | | | | | |
Expenses* | | | 0.30 | %4,5 | | | 0.30 | %6 | | | 0.30 | %7 | | | 0.30 | %7 | | | 0.30 | %5 | | | 0.30 | %5 |
Net investment income2 | | | 0.53 | %4 | | | 0.72 | % | | | 0.40 | % | | | 0.37 | % | | | 0.69 | % | | | 0.82 | % |
Series portfolio turnover8 | | | 12 | % | | | 49 | % | | | 13 | % | | | 5 | % | | | 5 | % | | | 10 | % |
|
| *The investment advisor paid a portion of the Series’ expenses. If these expenses had been incurred by the Series, the expense ratios (to average net assets) would have been increased by the following amounts: | |
| | | | | | |
| | | 0.37 | %4,5 | | | 0.26 | %6 | | | 0.18 | %7 | | | 0.26 | %7 | | | 0.43 | %5 | | | 0.54 | %5 |
| TARGET 2050 SERIES CLASS R | | FOR THE SIX
MONTHS ENDED 4/30/16
(UNAUDITED) | | | FOR THE YEARS ENDED | | | | | | | | | | |
| | | 10/31/15 | | | 10/31/14 | | | 10/31/13 | | | 10/31/12 | | | 10/31/11 | |
Per share data (for a share outstanding throughout each period): | | | | | | | | | | | | | | | | | | | | | | | | |
Net asset value - Beginning of period | | $ | 11.25 | | | $ | 13.60 | | | $ | 13.43 | | | $ | 10.74 | | | $ | 10.14 | | | $ | 10.16 | |
| | | | | | | | | | | | | | | | | | | | | | | | |
Income (loss) from investment operations: | | | | | | | | | | | | | | | | | | | | | | | | |
Net investment income1,2 | | | 0.01 | | | | 0.06 | | | | 0.01 | | | | 0.01 | | | | 0.05 | | | | 0.06 | |
Net realized and unrealized gain (loss) on investments | | | 0.01 | | | | (0.29 | ) | | | 1.04 | | | | 2.73 | | | | 0.80 | | | | — | 9 |
| | | | | | | | | | | | | | | | | | | | | | | | |
| | | | | | |
Total from investment operations | | | 0.02 | | | | (0.23 | ) | | | 1.05 | | | | 2.74 | | | | 0.85 | | | | 0.06 | |
| | | | | | | | | | | | | | | | | | | | | | | | |
| | | | | | |
Less distributions to shareholders: | | | | | | | | | | | | | | | | | | | | | | | | |
From net investment income | | | (0.02 | ) | | | (0.69 | ) | | | (0.51 | ) | | | (0.02 | ) | | | (0.06 | ) | | | (0.06 | ) |
From net realized gain on investments | | | (2.12 | ) | | | (1.43 | ) | | | (0.37 | ) | | | (0.03 | ) | | | (0.19 | ) | | | (0.02 | ) |
| | | | | | | | | | | | | | | | | | | | | | | | |
| | | | | | |
Total distributions to shareholders | | | (2.14 | ) | | | (2.12 | ) | | | (0.88 | ) | | | (0.05 | ) | | | (0.25 | ) | | | (0.08 | ) |
| | | | | | | | | | | | | | | | | | | | | | | | |
| | | | | | |
Net asset value - End of period | | $ | 9.13 | | | $ | 11.25 | | | $ | 13.60 | | | $ | 13.43 | | | $ | 10.74 | | | $ | 10.14 | |
| | | | | | | | | | | | | | | | | | | | | | | | |
| | | | | | |
Net assets - End of period (000’s omitted) | | $ | 2,398 | | | $ | 2,215 | | | $ | 5,140 | | | $ | 5,022 | | | $ | 3,448 | | | $ | 2,686 | |
| | | | | | | | | | | | | | | | | | | | | | | | |
| | | | | | |
Total return3 | | | 1.20 | % | | | (2.17 | %) | | | 8.28 | % | | | 25.69 | % | | | 8.75 | % | | | 0.56 | % |
Ratios (to average net assets)/Supplemental Data: | | | | | | | | | | | | | | | | | | | | | | | | |
Expenses* | | | 0.55 | %4,5 | | | 0.55 | %6 | | | 0.55 | %7 | | | 0.55 | %7 | | | 0.55 | %5 | | | 0.55 | %5 |
Net investment income2 | | | 0.21 | %4 | | | 0.54 | % | | | 0.10 | % | | | 0.11 | % | | | 0.45 | % | | | 0.55 | % |
Series portfolio turnover8 | | | 12 | % | | | 49 | % | | | 13 | % | | | 5 | % | | | 5 | % | | | 10 | % |
|
| *The investment advisor paid a portion of the Series’ expenses. If these expenses had been incurred by the Series, the expense ratios (to average net assets) would have been increased by the following amounts: | |
| | | | | | |
| | | 0.39 | %4,5 | | | 0.26 | %6 | | | 0.18 | %7 | | | 0.26 | %7 | | | 0.43 | %5 | | | 0.54 | %5 |
1Calculated based on average shares outstanding during the periods.
2Net investment income is affected by the timing of distributions from the Underlying Series in which the Series invest. The ratios do not include net investment income of the Underlying Series in which the Series invests.
3Represents aggregate total return for the periods indicated. Total return would have been lower had certain expenses not been reimbursed. Periods less than one year are not annualized.
4Annualized.
5Expense ratios do not include expenses of the Underlying Series in which the Series invests. The expense ratio of the Underlying Series was 0.84%.
6Expense ratios do not include expenses of the Underlying Series in which the Series invests. The expense ratio of the Underlying Series was 0.83%.
7Expense ratios do not include expenses of the Underlying Series in which the Series invests. The expense ratio of the Underlying Series was 0.82%.
8Reflects activity of the Series and does not include the activity of the Underlying Series.
9Less than $0.01.
The accompanying notes are an integral part of the financial statements.
35
Financial Highlights
| | | | | | | | | | | | | | | | | | | | | | | | |
| TARGET 2050 SERIES CLASS I | | FOR THE SIX
MONTHS ENDED 4/30/16
(UNAUDITED) | | | FOR THE YEARS ENDED | | | | | | | | | | |
| | | 10/31/15 | | | 10/31/14 | | | 10/31/13 | | | 10/31/12 | | | 10/31/11 | |
Per share data (for a share outstanding throughout each period): | | | | | | | | | | | | | | | | | | | | | | | | |
Net asset value - Beginning of period | | $ | 11.43 | | | $ | 13.82 | | | $ | 13.60 | | | $ | 10.88 | | | $ | 10.26 | | | $ | 10.28 | |
| | | | | | | | | | | | | | | | | | | | | | | | |
Income (loss) from investment operations: | | | | | | | | | | | | | | | | | | | | | | | | |
Net investment income1,2 | | | 0.03 | | | | 0.10 | | | | 0.08 | | | | 0.07 | | | | 0.09 | | | | 0.03 | |
Net realized and unrealized gain (loss) on investments | | | (0.00 | )3 | | | (0.29 | ) | | | 1.08 | | | | 2.76 | | | | 0.83 | | | | 0.08 | |
| | | | | | | | | | | | | | | | | | | | | | | | |
| | | | | | |
Total from investment operations | | | 0.03 | | | | (0.19 | ) | | | 1.16 | | | | 2.83 | | | | 0.92 | | | | 0.11 | |
| | | | | | | | | | | | | | | | | | | | | | | | |
| | | | | | |
Less distributions to shareholders: | | | | | | | | | | | | | | | | | | | | | | | | |
From net investment income | | | (0.05 | ) | | | (0.77 | ) | | | (0.57 | ) | | | (0.08 | ) | | | (0.11 | ) | | | (0.11 | ) |
From net realized gain on investments | | | (2.12 | ) | | | (1.43 | ) | | | (0.37 | ) | | | (0.03 | ) | | | (0.19 | ) | | | (0.02 | ) |
| | | | | | | | | | | | | | | | | | | | | | | | |
| | | | | | |
Total distributions to shareholders | | | (2.17 | ) | | | (2.20 | ) | | | (0.94 | ) | | | (0.11 | ) | | | (0.30 | ) | | | (0.13 | ) |
| | | | | | | | | | | | | | | | | | | | | | | | |
| | | | | | |
Net asset value - End of period | | $ | 9.29 | | | $ | 11.43 | | | $ | 13.82 | | | $ | 13.60 | | | $ | 10.88 | | | $ | 10.26 | |
| | | | | | | | | | | | | | | | | | | | | | | | |
| | | | | | |
Net assets - End of period (000’s omitted) | | $ | 17,801 | | | $ | 15,688 | | | $ | 12,077 | | | $ | 9,042 | | | $ | 4,016 | | | $ | 2,121 | |
| | | | | | | | | | | | | | | | | | | | | | | | |
| | | | | | |
Total return4 | | | 1.35 | % | | | (1.82 | %) | | | 9.07 | % | | | 26.21 | % | | | 9.39 | % | | | 0.98 | % |
Ratios (to average net assets)/Supplemental Data: | | | | | | | | | | | | | | | | | | | | | | | | |
Expenses* | | | 0.05 | %5,6 | | | 0.05 | %7 | | | 0.05 | %8 | | | 0.05 | %8 | | | 0.05 | %6 | | | 0.05 | %6 |
Net investment income2 | | | 0.74 | %5 | | | 0.84 | % | | | 0.62 | % | | | 0.57 | % | | | 0.89 | % | | | 0.25 | % |
Series portfolio turnover9 | | | 12 | % | | | 49 | % | | | 13 | % | | | 5 | % | | | 5 | % | | | 10 | % |
|
| *The investment advisor paid a portion of the Series’ expenses. If these expenses had been incurred by the Series, the expense ratios (to average net assets) would have been increased by the following amounts: | |
| | | | | | |
| | | 0.37 | %5,6 | | | 0.26 | %7 | | | 0.18 | %8 | | | 0.26 | %8 | | | 0.43 | %6 | | | 0.57 | %6 |
1Calculated based on average shares outstanding during the periods.
2Net investment income is affected by the timing of distributions from the Underlying Series in which the Series invest. The ratios do not include net investment income of the Underlying Series in which the Series invests.
3Less than $(0.01).
4Represents aggregate total return for the periods indicated. Total return would have been lower had certain expenses not been reimbursed. Periods less than one year are not annualized.
5Annualized.
6Expense ratios do not include expenses of the Underlying Series in which the Series invests. The expense ratio of the Underlying Series was 0.84%.
7Expense ratios do not include expenses of the Underlying Series in which the Series invests. The expense ratio of the Underlying Series was 0.83%.
8Expense ratios do not include expenses of the Underlying Series in which the Series invests. The expense ratio of the Underlying Series was 0.82%.
9Reflects activity of the Series and does not include the activity of the Underlying Series.
The accompanying notes are an integral part of the financial statements.
36
Financial Highlights
| | | | | | | | | | | | | | | | | | | | |
| TARGET 2055 SERIES CLASS K | | FOR THE SIX
MONTHS ENDED
4/30/16 (UNAUDITED) | | | FOR THE YEARS ENDED | | | | | | FOR THE PERIOD
6/25/121 TO 10/31/12 | |
| | | 10/31/15 | | | 10/31/14 | | | 10/31/13 | | |
Per share data (for a share outstanding throughout each period): | | | | | | | | | | | | | | | | | | | | |
Net asset value - Beginning of period | | $ | 12.56 | | | $ | 13.94 | | | $ | 13.85 | | | $ | 11.04 | | | $ | 10.00 | |
| | | | | | | | | | | | | | | | | | | | |
Income (loss) from investment operations: | | | | | | | | | | | | | | | | | | | | |
Net investment income (loss)2,3 | | | 0.03 | | | | 0.09 | | | | 0.06 | | | | (0.02 | ) | | | (0.01 | ) |
Net realized and unrealized gain (loss) on investments | | | 0.07 | | | | (0.35 | ) | | | 1.05 | | | | 2.86 | | | | 1.05 | |
| | | | | | | | | | | | | | | | | | | | |
| | | | | |
Total from investment operations | | | 0.10 | | | | (0.26 | ) | | | 1.11 | | | | 2.84 | | | | 1.04 | |
| | | | | | | | | | | | | | | | | | | | |
| | | | | |
Less distributions to shareholders: | | | | | | | | | | | | | | | | | | | | |
From net investment income | | | (0.04 | ) | | | (0.74 | ) | | | (0.55 | ) | | | (0.03 | ) | | | — | |
From net realized gain on investments | | | (1.14 | ) | | | (0.38 | ) | | | (0.47 | ) | | | — | | | | — | |
| | | | | | | | | | | | | | | | | | | | |
| | | | | |
Total distributions to shareholders | | | (1.18 | ) | | | (1.12 | ) | | | (1.02 | ) | | | (0.03 | ) | | | — | |
| | | | | | | | | | | | | | | | | | | | |
| | | | | |
Net asset value - End of period | | $ | 11.48 | | | $ | 12.56 | | | $ | 13.94 | | | $ | 13.85 | | | $ | 11.04 | |
| | | | | | | | | | | | | | | | | | | | |
| | | | | |
Net assets - End of period (000’s omitted) | | $ | 1,350 | | | $ | 1,142 | | | $ | 1,777 | | | $ | 208 | | | $ | 214 | 4 |
| | | | | | | | | | | | | | | | | | | | |
| | | | | |
Total return5 | | | 1.35 | % | | | (2.06 | %) | | | 8.50 | % | | | 25.79 | % | | | 10.40 | % |
Ratios (to average net assets)/Supplemental Data: | | | | | | | | | | | | | | | | | | | | |
Expenses* | | | 0.30 | %6,7 | | | 0.30 | %8 | | | 0.30 | %9 | | | 0.30 | %9 | | | 0.30 | %6,10 |
Net investment income (loss)3 | | | 0.48 | %6 | | | 0.68 | % | | | 0.43 | % | | | (0.17 | %) | | | (0.30 | %)6 |
Series portfolio turnover11 | | | 9 | % | | | 55 | % | | | 63 | % | | | 605 | % | | | — | 12 |
|
| *The investment advisor paid a portion of the Series’ expenses. If these expenses had been incurred by the Series, the expense ratios (to average net assets) would have been increased by the following amounts: | |
| | | | | |
| | | 3.41 | %6,7 | | | 3.68 | %8 | | | 4.79 | %9 | | | 62.25 | %9 | | | 19,197 | %6,10,13 |
| TARGET 2055 SERIES CLASS R | | FOR THE SIX
MONTHS ENDED
4/30/16 (UNAUDITED) | | | FOR THE YEARS ENDED | | | | | | FOR THE PERIOD
6/25/121 TO 10/31/12 | |
| | | 10/31/15 | | | 10/31/14 | | | 10/31/13 | | |
Per share data (for a share outstanding throughout each period): | | | | | | | | | | | | | | | | | | | | |
Net asset value - Beginning of period | | $ | 12.45 | | | $ | 13.83 | | | $ | 13.77 | | | $ | 11.03 | | | $ | 10.00 | |
| | | | | | | | | | | | | | | | | | | | |
Income (loss) from investment operations: | | | | | | | | | | | | | | | | | | | | |
Net investment income (loss)2,3 | | | 0.01 | | | | 0.05 | | | | 0.03 | | | | (0.01 | ) | | | (0.02 | ) |
Net realized and unrealized gain (loss) on investments | | | 0.08 | | | | (0.34 | ) | | | 1.04 | | | | 2.77 | | | | 1.05 | |
| | | | | | | | | | | | | | | | | | | | |
| | | | | |
Total from investment operations | | | 0.09 | | | | (0.29 | ) | | | 1.07 | | | | 2.76 | | | | 1.03 | |
| | | | | | | | | | | | | | | | | | | | |
| | | | | |
Less distributions to shareholders: | | | | | | | | | | | | | | | | | | | | |
From net investment income | | | (0.03 | ) | | | (0.71 | ) | | | (0.54 | ) | | | (0.02 | ) | | | — | |
From net realized gain on investments | | | (1.14 | ) | | | (0.38 | ) | | | (0.47 | ) | | | — | | | | — | |
| | | | | | | | | | | | | | | | | | | | |
| | | | | |
Total distributions to shareholders | | | (1.17 | ) | | | (1.09 | ) | | | (1.01 | ) | | | (0.02 | ) | | | — | |
| | | | | | | | | | | | | | | | | | | | |
| | | | | |
Net asset value - End of period | | $ | 11.37 | | | $ | 12.45 | | | $ | 13.83 | | | $ | 13.77 | | | $ | 11.03 | |
| | | | | | | | | | | | | | | | | | | | |
| | | | | |
Net assets - End of period (000’s omitted) | | $ | 492 | | | $ | 409 | | | $ | 515 | | | $ | 51 | | | $ | 110 | 4 |
| | | | | | | | | | | | | | | | | | | | |
| | | | | |
Total return5 | | | 1.22 | % | | | (2.32 | %) | | | 8.21 | % | | | 25.01 | % | | | 10.30 | % |
Ratios (to average net assets)/Supplemental Data: | | | | | | | | | | | | | | | | | | | | |
Expenses* | | | 0.55 | %6,7 | | | 0.55 | %8 | | | 0.55 | %9 | | | 0.55 | %9 | | | 0.55 | %6,10 |
Net investment income (loss)3 | | | 0.24 | %6 | | | 0.39 | % | | | 0.24 | % | | | (0.07 | %) | | | (0.55 | %)6 |
Series portfolio turnover11 | | | 9 | % | | | 55 | % | | | 63 | % | | | 605 | % | | | — | 12 |
|
| *The investment advisor paid a portion of the Series’ expenses. If these expenses had been incurred by the Series, the expense ratios (to average net assets) would have been increased by the following amounts: | |
| | | | | |
| | | 3.41 | %6,7 | | | 3.68 | %8 | | | 5.39 | %9 | | | 129.56 | %9 | | | 19,015 | %6,10,13 |
1Commencement of operations.
2Calculated based on average shares outstanding during the periods.
3Net investment income is affected by the timing of distributions from the Underlying Series in which the Series invest. The ratios do not include net investment income of the Underlying Series in which the Series invests.
4Represents the whole number without rounding to the 000s.
5Represents aggregate total return for the periods indicated. Total return would have been lower had certain expenses not been reimbursed. Periods less than one year are not annualized.
6Annualized.
7Expense ratios do not include expenses of the Underlying Series in which the Series invests. The expense ratio of the Underlying Series was 0.84%.
8Expense ratios do not include expenses of the Underlying Series in which the Series invests. The expense ratio of the Underlying Series was 0.83%.
9Expense ratios do not include expenses of the Underlying Series in which the Series invests. The expense ratio of the Underlying Series was 0.82%.
10Expense ratios do not include expenses of the Underlying Series in which the Series invests. The expense ratio of the Underlying Series was 0.84%.
11Reflects activity of the Series and does not include the activity of the Underlying Series.
12The Series had no portfolio turnover for the period.
13The increase to the expense ratios (to average net assets) is largely due to the small net assets in each class.
The accompanying notes are an integral part of the financial statements.
37
Financial Highlights
| | | | | | | | | | | | | | | | | | | | |
| TARGET 2055 SERIES CLASS I | | FOR THE SIX
MONTHS ENDED
4/30/16 (UNAUDITED) | | | FOR THE YEARS ENDED | | | | | | FOR THE PERIOD
6/25/121 TO 10/31/12 | |
| | | 10/31/15 | | | 10/31/14 | | | 10/31/13 | | |
Per share data (for a share outstanding throughout each period): | | | | | | | | | | | | | | | | | | | | |
Net asset value - Beginning of period | | $ | 12.66 | | | $ | 14.05 | | | $ | 13.94 | | | $ | 11.05 | | | $ | 10.00 | |
| | | | | | | | | | | | | | | | | | | | |
Income (loss) from investment operations: | | | | | | | | | | | | | | | | | | | | |
Net investment income2,3 | | | 0.04 | | | | 0.10 | | | | 0.08 | | | | — | 4 | | | — | 4 |
Net realized and unrealized gain (loss) on investments | | | 0.08 | | | | (0.33 | ) | | | 1.07 | | | | 2.94 | | | | 1.05 | |
| | | | | | | | | | | | | | | | | | | | |
| | | | | |
Total from investment operations | | | 0.12 | | | | (0.23 | ) | | | 1.15 | | | | 2.94 | | | | 1.05 | |
| | | | | | | | | | | | | | | | | | | | |
| | | | | |
Less distributions to shareholders: | | | | | | | | | | | | | | | | | | | | |
From net investment income | | | (0.06 | ) | | | (0.78 | ) | | | (0.57 | ) | | | (0.05 | ) | | | — | |
From net realized gain on investments | | | (1.14 | ) | | | (0.38 | ) | | | (0.47 | ) | | | — | | | | — | |
| | | | | | | | | | | | | | | | | | | | |
| | | | | |
Total distributions to shareholders | | | (1.20 | ) | | | (1.16 | ) | | | (1.04 | ) | | | (0.05 | ) | | | — | |
| | | | | | | | | | | | | | | | | | | | |
| | | | | |
Net asset value - End of period | | $ | 11.58 | | | $ | 12.66 | | | $ | 14.05 | | | $ | 13.94 | | | $ | 11.05 | |
| | | | | | | | | | | | | | | | | | | | |
| | | | | |
Net assets - End of period (000’s omitted) | | $ | 2,477 | | | $ | 1,658 | | | $ | 872 | | | $ | 366 | | | $ | 215 | 5 |
| | | | | | | | | | | | | | | | | | | | |
| | | | | |
Total return6 | | | 1.50 | % | | | (1.83 | %) | | | 8.75 | % | | | 26.67 | % | | | 10.50 | % |
Ratios (to average net assets)/Supplemental Data: | | | | | | | | | | | | | | | | | | | | |
Expenses* | | | 0.05 | %7,8 | | | 0.05 | %9 | | | 0.05 | %10 | | | 0.05 | %10 | | | 0.05 | %7,11 |
Net investment income (loss)3 | | | 0.67 | %7 | | | 0.80 | % | | | 0.57 | % | | | (0.03 | %) | | | (0.05 | %)7 |
Series portfolio turnover12 | | | 9 | % | | | 55 | % | | | 63 | % | | | 605 | % | | | — | 13 |
|
| *The investment advisor paid a portion of the Series’ expenses. If these expenses had been incurred by the Series, the expense ratios (to average the expense ratios (to average net assets) would have been increased by the following amount: | |
| | | | | |
| | | 3.41 | %7,8 | | | 3.68 | %9 | | | 7.80 | %10 | | | 8.21 | %10 | | | 19,201 | %7,11,14 |
1Commencement of operations.
2Calculated based on average shares outstanding during the periods.
3Net investment income is affected by the timing of distributions from the Underlying Series in which the Series invest. The ratios do not include net investment income of the Underlying Series in which the Series invests.
4Less than $0.01.
5Represents the whole number without rounding to the 000s.
6Represents aggregate total return for the periods indicated. Total return would have been lower had certain expenses not been reimbursed. Periods less than one year are not annualized.
7Annualized.
8Expense ratios do not include expenses of the Underlying Series in which the Series invests. The expense ratio of the Underlying Series was 0.84%.
9Expense ratios do not include expenses of the Underlying Series in which the Series invests. The expense ratio of the Underlying Series was 0.83%.
10Expense ratios do not include expenses of the Underlying Series in which the Series invests. The expense ratio of the Underlying Series was 0.82%.
11Expense ratios do not include expenses of the Underlying Series in which the Series invests. The expense ratio of the Underlying Series was 0.84%.
12Reflects activity of the Series and does not include the activity of the Underlying Series.
13The Series had no portfolio turnover for the period.
14The increase to the expense ratios (to average net assets) is largely due to the small net assets in each class.
The accompanying notes are an integral part of the financial statements.
38
Financial Highlights
| | | | | | | | |
| TARGET 2060 SERIES CLASS K | | FOR THE SIX
MONTHS ENDED
4/30/16 (UNAUDITED) | | | FOR THE PERIOD
9/21/151 TO 10/31/15 | |
Per share data (for a share outstanding throughout each period): | | | | | | | | |
Net asset value - Beginning of period | | $ | 10.36 | | | $ | 10.00 | |
| | | | | | | | |
Income (loss) from investment operations: | | | | | | | | |
Net investment loss2,3 | | | (0.01 | ) | | | (0.00 | )4 |
Net realized and unrealized gain on investments | | | 0.15 | | | | 0.36 | |
| | | | | | | | |
| | |
Total from investment operations | | | 0.14 | | | | 0.36 | |
| | | | | | | | |
Less distributions to shareholders: | | | | | | | | |
From net investment income | | | (0.04 | ) | | | — | |
| | | | | | | | |
| | |
Net asset value - End of period | | $ | 10.46 | | | $ | 10.36 | |
| | | | | | | | |
| | |
Net assets - End of period (000’s omitted) | | $ | 1,022 | | | $ | 52 | |
| | | | | | | | |
| | |
Total return5 | | | 1.35 | % | | | 3.60 | % |
Ratios (to average net assets)/Supplemental Data: | | | | | | | | |
Expenses*6 | | | 0.30 | %7 | | | 0.30 | %8 |
Net investment loss3,6 | | | (0.22 | %) | | | (0.30 | %) |
Series portfolio turnover9 | | | 8 | % | | | 4 | % |
|
| *The investment advisor paid a portion of the Series’ expenses. If these expenses had been incurred by the Series, the expense ratios (to average net assets) would have been increased by the following amounts6: | |
| | |
| | | 12.01 | %7 | | | 151.35 | %8,10 |
| TARGET 2060 SERIES CLASS R | | FOR THE SIX
MONTHS ENDED
4/30/16
(UNAUDITED) | | | FOR THE PERIOD
9/21/151 TO 10/31/15 | |
Per share data (for a share outstanding throughout each period): | | | | | | | | |
Net asset value - Beginning of period | | $ | 10.36 | | | $ | 10.00 | |
| | | | | | | | |
Income (loss) from investment operations: | | | | | | | | |
Net investment income (loss)2,3 | | | 0.01 | | | | (0.01 | )4 |
Net realized and unrealized gain on investments | | | 0.11 | | | | 0.37 | |
| | | | | | | | |
| | |
Total from investment operations | | | 0.12 | | | | 0.36 | |
| | | | | | | | |
Less distributions to shareholders: | | | | | | | | |
From net investment income | | | (0.03 | ) | | | — | |
| | | | | | | | |
| | |
Net asset value - End of period | | $ | 10.45 | | | $ | 10.36 | |
| | | | | | | | |
| | |
Net assets - End of period (000’s omitted) | | $ | 86 | | | $ | 56 | |
| | | | | | | | |
| | |
Total return5 | | | 1.20 | % | | | 3.60 | % |
Ratios (to average net assets)/Supplemental Data: | | | | | | | | |
Expenses*6 | | | 0.55 | %7 | | | 0.55 | %8 |
Net investment income (loss)3,6 | | | 0.20 | % | | | (0.55 | %) |
Series portfolio turnover9 | | | 8 | % | | | 4 | % |
|
| *The investment advisor paid a portion of the Series’ expenses. If these expenses had been incurred by the Series, the expense ratios (to average net assets) would have been increased by the following amounts6: | |
| | |
| | | 34.41 | %7 | | | 151.35 | %8,10 |
1Commencement of operations.
2Calculated based on average shares outstanding during the periods.
3Net investment income is affected by the timing of distributions from the Underlying Series in which the Series invest. The ratios do not include net investment income of the Underlying Series in which the Series invests.
4Less than $(0.01).
5Represents aggregate total return for the periods indicated. Total return would have been lower had certain expenses not been reimbursed. Periods less than one year are not annualized.
6Annualized.
7Expense ratios do not include expenses of the Underlying Series in which the Series invests. The expense ratio of the Underlying Series was 0.84%.
8Expense ratios do not include expenses of the Underlying Series in which the Series invests. The expense ratio of the Underlying Series was 0.83%.
9Reflects activity of the Series and does not include the activity of the Underlying Series.
10The increase to the expense ratios (to average net assets) is largely due to the small net assets in each class.
The accompanying notes are an integral part of the financial statements.
39
Financial Highlights
| | | | | | | | |
| TARGET 2060 SERIES CLASS I | | FOR THE SIX
MONTHS ENDED
4/30/16
(UNAUDITED) | | | FOR THE PERIOD
9/21/151 TO 10/31/15 | |
Per share data (for a share outstanding throughout each period): | | | | | | | | |
Net asset value - Beginning of period | | $ | 10.36 | | | $ | 10.00 | |
| | | | | | | | |
Income (loss) from investment operations: | | | | | | | | |
Net investment income (loss)2,3 | | | 0.04 | | | | (0.00 | )4 |
Net realized and unrealized gain on investments | | | 0.10 | | | | 0.36 | |
| | | | | | | | |
| | |
Total from investment operations | | | 0.14 | | | | 0.36 | |
| | | | | | | | |
Less distributions to shareholders: | | | | | | | | |
From net investment income | | | (0.04 | ) | | | — | |
| | |
Net asset value - End of period | | $ | 10.46 | | | $ | 10.36 | |
| | | | | | | | |
| | |
Net assets - End of period (000’s omitted) | | $ | 55 | | | $ | 52 | |
| | | | | | | | |
| | |
Total return5 | | | 1.42 | % | | | 3.60 | % |
Ratios (to average net assets)/Supplemental Data: | | | | | | | | |
Expenses*6 | | | 0.05 | %7 | | | 0.05 | %8 |
Net investment income (loss)3,6 | | | 0.79 | % | | | (0.05 | %) |
Series portfolio turnover9 | | | 8 | % | | | 4 | % |
|
| *The investment advisor paid a portion of the Series’ expenses. If these expenses had been incurred by the Series, the expense ratios (to average net assets) would have been increased by the following amounts6: | |
| | |
| | | 38.31 | %7 | | | 151.34 | %8,10 |
1Commencement of operations.
2Calculated based on average shares outstanding during the periods.
3Net investment income is affected by the timing of distributions from the Underlying Series in which the Series invest. The ratios do not include net investment income of the Underlying Series in which the Series invests.
4Less than $(0.01).
5Represents aggregate total return for the periods indicated. Total return would have been lower had certain expenses not been reimbursed. Periods less than one year are not annualized.
6Annualized.
7Expense ratios do not include expenses of the Underlying Series in which the Series invests. The expense ratio of the Underlying Series was 0.84%.
8Expense ratios do not include expenses of the Underlying Series in which the Series invests. The expense ratio of the Underlying Series was 0.83%.
9Reflects activity of the Series and does not include the activity of the Underlying Series.
10The increase to the expense ratios (to average net assets) is largely due to the small net assets in each class.
The accompanying notes are an integral part of the financial statements.
40
Notes to Financial Statements
(unaudited)
Target Income Series, Target 2015 Series, Target 2020 Series, Target 2025 Series, Target 2030 Series, Target 2035 Series, Target 2040 Series, Target 2045 Series, Target 2050 Series, Target 2055 Series and Target 2060 Series (each the “Series”) are no-load diversified series of Manning & Napier Fund, Inc. (the “Fund”). The Fund is organized in Maryland and is registered under the Investment Company Act of 1940 (the “1940 Act”), as amended, as an open-end management investment company.
Each Series seeks to achieve its investment objectives by investing in a combination of other Manning & Napier mutual funds (the “Underlying Series”) according to a target asset allocation strategy. The Series are designed to provide single investment portfolios that adjust over time to meet the changing risk and return objectives of investors over their expected investment horizon. As the target retirement date approaches, the Series’ portfolios become more conservative with a larger fixed-income investment component. The financial statements of the Underlying Series should be read in conjunction with the Series’ financial statements.
Each Series is authorized to issue three classes of shares (Class K, R and I). Each class of shares is substantially the same, except that class-specific distribution and shareholder servicing expenses are borne by the specific class of shares to which they relate.
The Fund’s Advisor is Manning & Napier Advisors, LLC (the “Advisor”). Shares of each Series are offered to investors and employees of the Advisor and its affiliates. The total authorized capital stock of the Fund consists of 15 billion shares of common stock each having a par value of $0.01. As of April 30, 2016, 10.5 billion shares have been designated in total among 40 series, of which 40 million have been designated in each of the Series for Class K and R common stock and 100 million have been designated in each of the Series for Class I common stock.
Reorganization
The Board of Directors (the “Board”) of Target Income Series and of Target 2010 Series, each a Series of the Fund, approved the reorganization of Target 2010 Series into Target Income Series pursuant to which Target Income Series acquired substantially all of the assets and assumed certain stated liabilities of Target 2010 Series in exchange for an equal aggregate value of Target Income Series shares.
Each shareholder of Target 2010 Series received shares of Target Income Series with the same class designation and an aggregate Net Asset Value of such shareholder’s Target 2010 Series shares, as determined at the close of business on September 18, 2015.
The reorganization was accomplished by a tax-free exchange of shares of Target Income Series in the following amounts and at the following conversion ratios:
| | | | | | | | | | | | |
| | | TARGET 2010
SERIES SHARES
PRIOR TO
REORGANIZATION | | | CONVERSION
RATIO | | | SHARES OF
TARGET INCOME
SERIES | |
Class K | | | 2,511,185 | | | | 0.910502 | | | | 2,286,439 | |
Class R | | | 81,698 | | | | 0.914253 | | | | 74,693 | |
Class I | | | 1,590,529 | | | | 0.911450 | | | | 1,449,688 | |
Target 2010 Series’ net assets and composition of net assets on September 18, 2015, the date of the reorganization, were as follows:
| | | | | | | | | | | | | | | | |
| NET ASSETS | | PAID-IN CAPITAL | | | ACCUMULATED NET INVESTMENT LOSS | | | ACCUMULATED
NET REALIZED GAINS | | | NET UNREALIZED
DEPRECIATION | |
$36,429,313 | | $ | 38,765,154 | | | | $ (528,334) | | | $ | 458,766 | | | | $ (2,266,273) | |
41
Notes to Financial Statements (continued)
(unaudited)
| 1. | Organization (continued) |
Reorganization (continued)
For financial reporting purposes, assets received and shares issued by Target Income Series were recorded at fair value; however, the cost basis of the investments received from Target 2010 Series was carried forward to align ongoing reporting of Target Income Series’ realized and unrealized gains and losses with amounts distributable to shareholders for tax purposes.
The aggregate net assets of Target Income Series immediately after the acquisition amounted to $96,959,284. Target 2010 Series’ fair value and cost of investments prior to the reorganization were $36,437,090 and $38,703,363, respectively.
The purpose of the transaction was to combine two funds managed by the Advisor, the investment advisor to both Target Income Series and Target 2010 Series, with the same or substantially similar (but not identical) investment objectives, investment policies, strategies, risks and restrictions. The reorganization was effective on September 21, 2015.
Assuming the acquisition had been completed on November 1, 2014, the beginning of the annual reporting period for Target Income Series, the pro forma results of operations for the year ended October 31, 2015, are as follows:
| | • | | Net investment income: $1,945,513 |
| | • | | Net realized and change in unrealized gain/loss on investments: ($3,429,309) |
| | • | | Net decrease in the net assets resulting from operations: ($1,483,796) |
Because the combined investment portfolios have been managed as a single integrated portfolio since the acquisition was completed, it is not practicable to separate the amounts of revenue and earnings of Target 2010 Series that have been included in the Target Income Series’ Statement of Operations since September 21, 2015.
Reorganization costs incurred by Target Income Series in connection with the reorganization were paid by the Advisor.
| 2. | Significant Accounting Policies |
The following is a summary of significant accounting policies followed by the Series. Each Series is an investment company and, accordingly, follows the investment company accounting and reporting guidance of the Financial Accounting Standards Board Accounting Standards Codification Topic 946 - Investment Companies, which is part of accounting principles generally accepted in the United States of America (“GAAP”).
Security Valuation
Investments in the Underlying Series are valued at their net asset value per share on valuation date. In the absence of the availability of a net asset value per share on the Underlying Series, security valuations may be determined in good faith by the Advisor under procedures approved by and under the general supervision and responsibility of the Fund’s Board of Directors (the “Board”).
Volume and level of activity in established markets for an asset or liability are evaluated to determine whether recent transactions and quoted prices are determinative of fair value. Where there have been significant decreases in volume and level of activity, further analysis and adjustment may be necessary to estimate fair value. The Series measure fair value in these instances by the use of inputs and valuation techniques which may be based upon current market prices of securities that are comparable in coupon, rating, maturity and industry and/or expectation of future cash flows. As a result of trading in relatively thin markets and/or markets that experience significant volatility, the prices used by the Series to value these securities may differ from the value that would be realized if these securities were sold, and the differences could be material.
Securities for which representative valuations or prices are not available from the Series’ pricing service may be valued at fair value as determined in good faith by the Advisor under procedures approved by and under the general supervision and responsibility of the Board. Due to the inherent uncertainty of valuations of such securities, the fair value may differ significantly
42
Notes to Financial Statements (continued)
(unaudited)
| 2. | Significant Accounting Policies (continued) |
Security Valuation (continued)
from the values that would have been used had a ready market for such securities existed. If trading or events occurring after the close of the principal market in which securities are traded are expected to materially affect the value of those securities, then they may be valued at their fair value, taking this trading or these events into account.
Various inputs are used in determining the value of the Series’ assets or liabilities carried at fair value. These inputs are summarized in three broad levels. Level 1 includes quoted prices in active markets for identical assets and liabilities. Level 2 includes other significant observable inputs (including quoted prices for similar securities, interest rates, prepayment speeds, credit risk, etc.). Level 3 includes significant unobservable inputs (including the Series’ own assumptions in determining the fair value of investments). A financial instrument’s level within the fair value hierarchy is based on the lowest level on any input both individually and in aggregate that is significant to the fair value measurement. The inputs or methodology used for valuing securities are not necessarily an indication of the risk associated with investing in those securities.
The following is a summary of the valuation levels used for major security types as of April 30, 2016 in valuing the Series’ assets or liabilities carried at fair value:
| | | | | | | | | | | | | | | | |
| | | TARGET INCOME SERIES | | | | |
| DESCRIPTION | | TOTAL | | | LEVEL 1 | | | LEVEL 2 | | | LEVEL 3 | |
Assets: | | | | | | | | | | | | | | | | |
Mutual fund | | $ | 82,625,287 | | | $ | 82,625,287 | | | $ | — | | | $ | — | |
| | | | | | | | | | | | | | | | |
Total assets | | $ | 82,625,287 | | | $ | 82,625,287 | | | $ | — | | | $ | — | |
| | | | | | | | | | | | | | | | |
| | | | | | | | | | | | | | | | |
| | | TARGET 2015 SERIES | | | | |
| DESCRIPTION | | TOTAL | | | LEVEL 1 | | | LEVEL 2 | | | LEVEL 3 | |
Assets: | | | | | | | | | | | | | | | | |
Mutual funds | | $ | 6,747,941 | | | $ | 6,747,941 | | | $ | — | | | $ | — | |
| | | | | | | | | | | | | | | | |
Total assets | | $ | 6,747,941 | | | $ | 6,747,941 | | | $ | — | | | $ | — | |
| | | | | | | | | | | | | | | | |
| | | | | | | | | | | | | | | | |
| | | TARGET 2020 SERIES | | | | |
| DESCRIPTION | | TOTAL | | | LEVEL 1 | | | LEVEL 2 | | | LEVEL 3 | |
Assets: | | | | | | | | | | | | | | | | |
Mutual funds | | $ | 151,402,628 | | | $ | 151,402,628 | | | $ | — | | | $ | — | |
| | | | | | | | | | | | | | | | |
Total assets | | $ | 151,402,628 | | | $ | 151,402,628 | | | $ | — | | | $ | — | |
| | | | | | | | | | | | | | | | |
| | | | | | | | | | | | | | | | |
| | | TARGET 2025 SERIES | | | | |
| DESCRIPTION | | TOTAL | | | LEVEL 1 | | | LEVEL 2 | | | LEVEL 3 | |
Assets: | | | | | | | | | | | | | | | | |
Mutual funds | | $ | 29,901,315 | | | $ | 29,901,315 | | | $ | — | | | $ | — | |
| | | | | | | | | | | | | | | | |
Total assets | | $ | 29,901,315 | | | $ | 29,901,315 | | | $ | — | | | $ | — | |
| | | | | | | | | | | | | | | | |
| | | | | | | | | | | | | | | | |
| | | TARGET 2030 SERIES | | | | |
| DESCRIPTION | | TOTAL | | | LEVEL 1 | | | LEVEL 2 | | | LEVEL 3 | |
Assets: | | | | | | | | | | | | | | | | |
Mutual funds | | $ | 165,009,135 | | | $ | 165,009,135 | | | $ | — | | | $ | — | |
| | | | | | | | | | | | | | | | |
Total assets | | $ | 165,009,135 | | | $ | 165,009,135 | | | $ | — | | | $ | — | |
| | | | | | | | | | | | | | | | |
43
Notes to Financial Statements (continued)
(unaudited)
| 2. | Significant Accounting Policies (continued) |
Security Valuation (continued)
| | | | | | | | | | | | | | | | |
| | | TARGET 2035 SERIES | | | | |
| DESCRIPTION | | TOTAL | | | LEVEL 1 | | | LEVEL 2 | | | LEVEL 3 | |
Assets: | | | | | | | | | | | | | | | | |
Mutual funds | | $ | 23,232,382 | | | $ | 23,232,382 | | | $ | — | | | $ | — | |
| | | | | | | | | | | | | | | | |
Total assets | | $ | 23,232,382 | | | $ | 23,232,382 | | | $ | — | | | $ | — | |
| | | | | | | | | | | | | | | | |
| | | | | | | | | | | | | | | | |
| | | TARGET 2040 SERIES | | | | |
| DESCRIPTION | | TOTAL | | | LEVEL 1 | | | LEVEL 2 | | | LEVEL 3 | |
Assets: | | | | | | | | | | | | | | | | |
Mutual funds | | $ | 102,904,061 | | | $ | 102,904,061 | | | $ | — | | | $ | — | |
| | | | | | | | | | | | | | | | |
Total assets | | $ | 102,904,061 | | | $ | 102,904,061 | | | $ | — | | | $ | — | |
| | | | | | | | | | | | | | | | |
| | | | | | | | | | | | | | | | |
| | | TARGET 2045 SERIES | | | | |
| DESCRIPTION | | TOTAL | | | LEVEL 1 | | | LEVEL 2 | | | LEVEL 3 | |
Assets: | | | | | | | | | | | | | | | | |
Mutual funds | | $ | 11,984,069 | | | $ | 11,984,069 | | | $ | — | | | $ | — | |
| | | | | | | | | | | | | | | | |
Total assets | | $ | 11,984,069 | | | $ | 11,984,069 | | | $ | — | | | $ | — | |
| | | | | | | | | | | | | | | | |
| | | | | | | | | | | | | | | | |
| | | TARGET 2050 SERIES | | | | |
| DESCRIPTION | | TOTAL | | | LEVEL 1 | | | LEVEL 2 | | | LEVEL 3 | |
Assets: | | | | | | | | | | | | | | | | |
Mutual fund | | $ | 34,203,220 | | | $ | 34,203,220 | | | $ | — | | | $ | — | |
| | | | | | | | | | | | | | | | |
Total assets | | $ | 34,203,220 | | | $ | 34,203,220 | | | $ | — | | | $ | — | |
| | | | | | | | | | | | | | | | |
| | | | | | | | | | | | | | | | |
| | | TARGET 2055 SERIES | | | | |
| DESCRIPTION | | TOTAL | | | LEVEL 1 | | | LEVEL 2 | | | LEVEL 3 | |
Assets: | | | | | | | | | | | | | | | | |
Mutual fund | | $ | 4,347,515 | | | $ | 4,347,515 | | | $ | — | | | $ | — | |
| | | | | | | | | | | | | | | | |
Total assets | | $ | 4,347,515 | | | $ | 4,347,515 | | | $ | — | | | $ | — | |
| | | | | | | | | | | | | | | | |
| | | | | | | | | | | | | | | | |
| | | TARGET 2060 SERIES | | | | |
| DESCRIPTION | | TOTAL | | | LEVEL 1 | | | LEVEL 2 | | | LEVEL 3 | |
Assets: | | | | | | | | | | | | | | | | |
Mutual fund | | $ | 1,185,875 | | | $ | 1,185,875 | | | $ | — | | | $ | — | |
| | | | | | | | | | | | | | | | |
Total assets | | $ | 1,185,875 | | | $ | 1,185,875 | | | $ | — | | | $ | — | |
| | | | | | | | | | | | | | | | |
There were no Level 2 or Level 3 securities held by any of the Series as of October 31, 2015 or April 30, 2016.
The Fund’s policy is to recognize transfers in and transfers out of the valuation levels as of the beginning of the reporting period. There were no transfers between Level 1 and Level 2 during the six months ended April 30, 2016.
Security Transactions, Investment Income and Expenses
Security transactions are accounted for on trade date. Dividend income is recorded on the ex-dividend date. Non-cash dividends, if any, are recorded at the fair value of the securities received. Income and capital gains distributions from the Underlying Series, if any, are recorded on the ex-dividend date.
Expenses are recorded on an accrual basis. Most expenses of the Fund can be attributed to a specific series. Expenses which cannot be directly attributed are apportioned among the series in the Fund in such a manner as deemed equitable by the
44
Notes to Financial Statements (continued)
(unaudited)
| 2. | Significant Accounting Policies (continued) |
Security Transactions, Investment Income and Expenses (continued)
Fund’s Board, taking into consideration, among other things, the nature and type of expense. Expenses included in the accompanying statements of operations do not include any expense of the Underlying Series.
Income, expenses (other than class specific expenses), and realized and unrealized gains and losses are prorated among the classes based on the relative net assets of each class. Class specific expenses are directly charged to that Class.
The Series use the identified cost method for determining realized gain or loss on investments for both financial statement and federal income tax reporting purposes.
Federal Taxes
Each Series’ policy is to comply with the provisions of the Internal Revenue Code applicable to regulated investment companies. The Series are not subject to federal income tax or excise tax to the extent that each Series distributes to shareholders each year its taxable income, including any net realized gains on investments, in accordance with requirements of the Internal Revenue Code. Accordingly, no provision for federal income tax or excise tax has been made in the financial statements.
Management evaluates its tax positions to determine if the tax positions taken meet the minimum recognition threshold in connection with accounting for uncertainties in income tax positions taken or expected to be taken for the purposes of measuring and recognizing tax liabilities in the financial statements. Recognition of tax benefits of an uncertain tax position is required only when the position is “more likely than not” to be sustained assuming examination by taxing authorities. At April 30, 2016, the Series have recorded no liability for net unrecognized tax benefits relating to uncertain income tax positions taken or expected to be taken in future tax returns.
The Series file income tax returns in the U.S. federal jurisdiction, various states and foreign jurisdictions, as required. No income tax returns are currently under investigation. The statute of limitations on Target Income Series, Target 2020 Series, Target 2030 Series, Target 2040 Series, and Target 2050 Series tax returns remains open for the years ended October 31, 2012 through October 31, 2015. The statute of limitations on Target 2015 Series, Target 2025 Series, Target 2035 Series, Target 2045 Series, Target 2055 Series remains open for the period ended October 31, 2012 and the years ended October 31, 2013 through October 31, 2015 and Target 2060 Series remains open for the period ended October 31, 2015. The Series are not aware of any tax positions for which it is reasonably possible that the total amounts of unrecognized tax benefits will significantly change in the next twelve months.
Foreign Taxes
Based on the Series’ understanding of the tax rules and rates related to income, gains and currency purchase/ repatriation transactions for foreign jurisdictions in which they invest, the Series will provide for foreign taxes, and where appropriate, deferred foreign tax.
Distributions of Income and Gains
Distributions to shareholders of net investment income are made semi-annually. Distributions of net realized gains are made annually. An additional distribution may be necessary to avoid taxation of a Series. Distributions are recorded on the ex-dividend date.
Indemnifications
The Fund’s organizational documents provide former and current directors and officers with a limited indemnification against liabilities arising in connection with the performance of their duties to the Fund. In the normal course of business, the Fund may also enter into contracts that provide general indemnifications. The Fund’s maximum exposure under these arrangements is unknown as this would be dependent on future claims that may be made against the Fund. The risk of material loss from such claims is considered remote.
Other
The preparation of financial statements in conformity with GAAP requires management to make estimates and assumptions that affect the reported amounts of assets and liabilities and the disclosure of contingent assets and liabilities at the date of the
45
Notes to Financial Statements (continued)
(unaudited)
| 2. | Significant Accounting Policies (continued) |
Other (continued)
financial statements and the reported amounts of income and expenses during the reporting period. Actual results could differ from those estimates.
| 3. | Transactions with Affiliates |
The Fund has an Investment Advisory Agreement (the “Agreement”) with the Advisor, for which the Advisor does not receive an advisory fee for the services it performs for the Series. However, the Advisor is entitled to receive an advisory fee from each of the Underlying Series in which the Series invest.
Under the Agreement, personnel of the Advisor provide the Series with advice and assistance in the choice of investments and the execution of securities transactions, and otherwise maintain the Series’ organization. The Advisor also provides the Fund with necessary office space and fund administration and support services. The salaries of all officers of the Fund (except a percentage of the Fund’s Chief Compliance Officer’s salary, which is paid by the Fund), and of all Directors who are “affiliated persons” of the Fund, or of the Advisor, and all personnel of the Fund, or of the Advisor, performing services relating to research, statistical and investment activities, are paid by the Advisor. Each “non-affiliated” Director receives an annual stipend, which is allocated among all the active series of the Fund. In addition, these Directors also receive a fee per Board meeting attended plus a fee for each committee meeting attended and are reimbursed for travel and other out-of-pocket expenses incurred by them in connection with attending such meetings. The Fund also has an Audit Committee Chair, who receives an additional annual stipend for this role.
The Advisor has contractually agreed, until at least February 28, 2020 for Target Income Series, Target 2020 Series, Target 2030 Series, Target 2040 Series, Target 2050 Series, until at least February 28, 2023 for Target 2015 Series, Target 2025 Series, Target 2035 Series, Target 2045 Series and Target 2055 Series and until at least February 28, 2026 for Target 2060 Series, to limit each class’ total direct annual fund operating expenses for the Series at no more than 0.05% for each class, exclusive of distribution and service fees, of average daily net assets each year. The Advisor’s agreement to limit each class’ operating expenses is limited to direct operating expenses and, therefore, does not apply to the indirect expenses incurred by the Series through their investments in the Underlying Series. For the six months ended April 30, 2016, the Advisor reimbursed expenses of $44,852 for Target Income Series, $58,622 for Target 2015 Series, $36,353 for Target 2020 Series, $55,922 for Target 2025 Series, $41,726 for Target 2030 Series, $57,166 for Target 2035 Series, $46,750 for Target 2040 Series, $58,218 for Target 2045 Series, $59,548 for Target 2050 Series, $60,037 for Target 2055 Series and $52,140 for Target 2060 Series, which is included as a reduction of expenses on the Statements of Operations. The Advisor is not eligible to recoup any expenses that have been reimbursed in prior years.
Manning & Napier Investor Services, Inc., a registered broker-dealer affiliate of the Advisor, acts as distributor for the Fund’s shares. Each Series compensates the distributor for distributing and servicing the Series’ Class K and Class R shares pursuant to a distribution plan adopted under Rule 12b-1 of the 1940 Act, regardless of expenses actually incurred. Under the agreement, each Series pays distribution and services fees to the distributor at an annual rate of 0.25% of average daily net assets attributable to Class K shares and 0.50% of average daily net assets attributable to Class R shares. There are no distribution and services fees on the Class I shares of each Series. The fees are accrued daily and paid monthly.
Pursuant to a master services agreement dated November 1, 2014, the Fund pays the Advisor an annual fee related to fund accounting and administration of 0.00225% of average daily net assets of the Target Series with an annual base fee of $40,000 per Target series. Transfer agent fees are charged to the Fund on a per account basis. Additionally, certain transaction and out-of-pocket expenses, including charges for reporting relating to the Fund’s compliance program, are charged. The Advisor has agreements with BNY Mellon Investment Servicing (U.S.) Inc. (“BNY”) under which BNY serves as sub-accountant services agent and sub-transfer agent.
Expenses not directly attributable to a series are allocated based on each series’ relative net assets or number of accounts, depending on the expense.
46
Notes to Financial Statements (continued)
(unaudited)
| 4. | Purchases and Sales of Securities |
For the six months ended April 30, 2016, purchases and sales of Underlying Series were as follows:
| | | | | | | | |
| SERIES | | PURCHASES | | | SALES | |
Target Income Series | | $ | 2,860,802 | | | $ | 15,321,466 | |
Target 2015 Series | | $ | 2,616,695 | | | $ | 5,176,951 | |
Target 2020 Series | | $ | 16,299,568 | | | $ | 25,509,589 | |
Target 2025 Series | | $ | 12,879,597 | | | $ | 11,745,513 | |
Target 2030 Series | | $ | 23,640,733 | | | $ | 20,707,842 | |
Target 2035 Series | | $ | 4,244,899 | | | $ | 2,964,021 | |
Target 2040 Series | | $ | 16,320,430 | | | $ | 12,577,967 | |
Target 2045 Series | | $ | 3,778,449 | | | $ | 1,767,113 | |
Target 2050 Series | | $ | 5,383,678 | | | $ | 3,995,771 | |
Target 2055 Series | | $ | 1,399,357 | | | $ | 318,308 | |
Target 2060 Series | | $ | 984,624 | | | $ | 54,130 | |
| 5. | Investments in Affiliated Issuers |
A summary of the Series’ transactions in the shares of affiliated issuers during the six months ended April 30, 2016 is set forth below:
| | | | | | | | | | | | | | | | | | | | | | | | | | | | |
TARGET INCOME SERIES | | VALUE AT
10/31/15 | | | PURCHASE
COST | | | SALES
PROCEEDS | | | VALUE AT
4/30/16 | | | SHARES HELD
AT 4/30/16 | | | DIVIDEND
INCOME | | | DISTRIBUTIONS AND
NET REALIZED LOSS | |
Manning & Napier Pro-Blend® Conservative Term Series - Class I | | $ | 95,834,412 | | | $ | 2,860,802 | | | $ | 15,321,466 | | | $ | 82,625,287 | | | | 8,116,433 | | | $ | 1,323,991 | | | $ | (1,296,698 | ) |
| | | | | | | | | | | | | | | | | | | | | | | | | | | | |
| | $ | 95,834,412 | | | $ | 2,860,802 | | | $ | 15,321,466 | | | $ | 82,625,287 | | | | | | | $ | 1,323,991 | | | $ | (1,296,698 | ) |
| | | | | | | | | | | | | | | | | | | | | | | | | | | | |
| | | | | | | | | | | | | | | | | | | | | | | | | | | | |
TARGET 2015 SERIES | | VALUE AT
10/31/15 | | | PURCHASE
COST | | | SALES
PROCEEDS | | | VALUE AT
4/30/16 | | | SHARES HELD
AT 4/30/16 | | | DIVIDEND
INCOME | | | DISTRIBUTIONS AND
NET REALIZED GAIN OR LOSS | |
Manning & Napier Pro-Blend® Conservative Term Series - Class I | | $ | — | | | $ | 1,713,228 | | | $ | 290,499 | | | $ | 1,495,777 | | | | 146,933 | | | $ | — | | | $ | 3,971 | |
Manning & Napier Pro-Blend® Moderate Term Series - Class I | | | 9,434,835 | | | | 903,467 | | | | 4,886,452 | | | | 5,252,164 | | | | 525,216 | | | | 71,613 | | | | (690,509 | ) |
| | | | | | | | | | | | | | | | | | | | | | | | | | | | |
| | $ | 9,434,835 | | | $ | 2,616,695 | | | $ | 5,176,951 | | | $ | 6,747,941 | | | | | | | $ | 71,613 | | | $ | (686,538 | ) |
| | | | | | | | | | | | | | | | | | | | | | | | | | | | |
47
Notes to Financial Statements (continued)
(unaudited)
| 5. | Investments in Affiliated Issuers (continued) |
| | | | | | | | | | | | | | | | | | | | | | | | | | | | |
TARGET 2020 SERIES | | VALUE AT
10/31/15 | | | PURCHASE
COST | | | SALES
PROCEEDS | | | VALUE AT
4/30/16 | | | SHARES HELD
AT 4/30/16 | | | DIVIDEND
INCOME | | | DISTRIBUTIONS
AND NET REALIZED
LOSS | |
Manning & Napier Pro-Blend® Extended Term Series - Class I | | $ | 41,033,658 | | | $ | 2,008,473 | | | $ | 11,212,536 | | | $ | 30,075,588 | | | | 3,233,934 | | | $ | 382,104 | | | $ | (1,822,069 | ) |
Manning & Napier Pro-Blend® Moderate Term Series - Class I | | | 122,161,428 | | | | 14,291,095 | | | | 14,297,053 | | | | 121,327,040 | | | | 12,132,704 | | | | 1,058,082 | | | | (1,694,229 | ) |
| | | | | | | | | | | | | | | | | | | | | | | | | | | | |
| | $ | 163,195,086 | | | $ | 16,299,568 | | | $ | 25,509,589 | | | $ | 151,402,628 | | | | | | | $ | 1,440,186 | | | $ | (3,516,298 | ) |
| | | | | | | | | | | | | | | | | | | | | | | | | | | | |
| | | | | | | | | | | | | | | | | | | | | | | | | | | | |
TARGET 2025 SERIES | | VALUE AT
10/31/15 | | | PURCHASE
COST | | | SALES
PROCEEDS | | | VALUE AT
4/30/16 | | | SHARES HELD
AT 4/30/16 | | | DIVIDEND
INCOME | | | DISTRIBUTIONS
AND NET REALIZED
GAIN OR LOSS | |
Manning & Napier Pro-Blend® Extended Term Series - Class I | | $ | 29,560,983 | | | $ | 4,769,691 | | | $ | 11,006,257 | | | $ | 22,125,154 | | | | 2,379,049 | | | $ | 271,512 | | | $ | (2,079,992 | ) |
Manning & Napier Pro-Blend® Moderate Term Series - Class I | | | — | | | | 8,109,906 | | | | 739,256 | | | | 7,776,161 | | | | 777,616 | | | | — | | | | 12,342 | |
| | | | | | | | | | | | | | | | | | | | | | | | | | | | |
| | $ | 29,560,983 | | | $ | 12,879,597 | | | $ | 11,745,513 | | | $ | 29,901,315 | | | | | | | $ | 271,512 | | | $ | (2,067,650 | ) |
| | | | | | | | | | | | | | | | | | | | | | | | | | | | |
| | | | | | | | | | | | | | | | | | | | | | | | | | | | |
TARGET 2030 SERIES | | VALUE AT
10/31/15 | | | PURCHASE
COST | | | SALES
PROCEEDS | | | VALUE AT
4/30/16 | | | SHARES HELD
AT 4/30/16 | | | DIVIDEND
INCOME | | | DISTRIBUTIONS
AND NET REALIZED
GAIN OR LOSS | |
Manning & Napier Pro-Blend® Extended Term Series - Class I | | $ | 124,265,001 | | | $ | 20,280,536 | | | $ | 9,356,387 | | | $ | 132,265,040 | | | | 14,222,047 | | | $ | 1,158,898 | | | $ | 1,244,992 | |
Manning & Napier Pro-Blend® Maximum Term Series - Class I | | | 41,935,963 | | | | 3,360,197 | | | | 11,351,455 | | | | 32,744,095 | | | | 3,274,410 | | | | 162,059 | | | | (3,021,007 | ) |
| | | | | | | | | | | | | | | | | | | | | | | | | | | | |
| | $ | 166,200,964 | | | $ | 23,640,733 | | | $ | 20,707,842 | | | $ | 165,009,135 | | | | | | | $ | 1,320,957 | | | $ | (1,776,015 | ) |
| | | | | | | | | | | | | | | | | | | | | | | | | | | | |
| | | | | | | | | | | | | | | | | | | | | | | | | | | | |
TARGET 2035 SERIES | | VALUE AT
10/31/15 | | | PURCHASE
COST | | | SALES
PROCEEDS | | | VALUE AT
4/30/16 | | | SHARES HELD
AT 4/30/16 | | | DIVIDEND
INCOME | | | DISTRIBUTIONS
AND NET REALIZED
GAIN OR LOSS | |
Manning & Napier Pro-Blend® Extended Term Series - Class I | | $ | 11,121,230 | | | $ | 2,807,751 | | | $ | 934,101 | | | $ | 12,790,187 | | | | 1,375,289 | | | $ | 103,378 | | | $ | 77,376 | |
Manning & Napier Pro-Blend® Maximum Term Series - Class I | | | 11,213,419 | | | | 1,437,148 | | | | 2,029,920 | | | | 10,442,195 | | | | 1,044,219 | | | | 43,197 | | | | (365,400 | ) |
| | | | | | | | | | | | | | | | | | | | | | | | | | | | |
| | $ | 22,334,649 | | | $ | 4,244,899 | | | $ | 2,964,021 | | | $ | 23,232,382 | | | | | | | $ | 146,575 | | | $ | (288,024 | ) |
| | | | | | | | | | | | | | | | | | | | | | | | | | | | |
48
Notes to Financial Statements (continued)
(unaudited)
| 5. | Investments in Affiliated Issuers (continued) |
| | | | | | | | | | | | | | | | | | | | | | | | | | | | |
TARGET 2040 SERIES | | VALUE AT
10/31/15 | | | PURCHASE
COST | | | SALES
PROCEEDS | | | VALUE AT
4/30/16 | | | SHARES HELD
AT 4/30/16 | | | DIVIDEND
INCOME | | | DISTRIBUTIONS
AND NET REALIZED
GAIN OR LOSS | |
Manning & Napier Pro-Blend® Extended Term Series - Class I | | $ | 24,945,227 | | | $ | 8,412,080 | | | $ | 2,058,197 | | | $ | 30,935,342 | | | | 3,326,381 | | | $ | 236,419 | | | $ | 128,378 | |
Manning & Napier Pro-Blend® Maximum Term Series - Class I | | | 75,799,725 | | | | 7,908,350 | | | | 10,519,770 | | | | 71,968,719 | | | | 7,196,872 | | | | 297,606 | | | | (2,267,632 | ) |
| | | | | | | | | | | | | | | | | | | | | | | | | | | | |
| | $ | 100,744,952 | | | $ | 16,320,430 | | | $ | 12,577,967 | | | $ | 102,904,061 | | | | | | | $ | 534,025 | | | $ | (2,139,254 | ) |
| | | | | | | | | | | | | | | | | | | | | | | | | | | | |
| | | | | | | | | | | | | | | | | | | | | | | | | | | | |
TARGET 2045 SERIES | | VALUE AT
10/31/15 | | | PURCHASE
COST | | | SALES
PROCEEDS | | | VALUE AT
4/30/16 | | | SHARES HELD
AT 4/30/16 | | | DIVIDEND
INCOME | | | DISTRIBUTIONS
AND NET REALIZED
GAIN OR LOSS | |
Manning & Napier Pro-Blend® Extended Term Series - Class I | | $ | — | | | $ | 606,946 | | | $ | 28,403 | | | $ | 614,019 | | | | 66,024 | | | $ | — | | | $ | 145 | |
| | | | | | | | | | | | | | | | | | | | | | | | | | | | |
Manning & Napier Pro-Blend® Maximum Term Series - Class I | | | 9,959,515 | | | | 3,171,503 | | | | 1,738,710 | | | | 11,370,050 | | | | 1,137,005 | | | | 38,498 | | | | (327,793 | ) |
| | | | | | | | | | | | | | | | | | | | | | | | | | | | |
| | $ | 9,959,515 | | | $ | 3,778,449 | | | $ | 1,767,113 | | | $ | 11,984,069 | | | | | | | $ | 38,498 | | | $ | (327,648 | ) |
| | | | | | | | | | | | | | | | | | | | | | | | | | | | |
| | | | | | | | | | | | | | | | | | | | | | | | | | | | |
TARGET 2050 SERIES | | VALUE AT
10/31/15 | | | PURCHASE
COST | | | SALES
PROCEEDS | | | VALUE AT
4/30/16 | | | SHARES HELD
AT 4/30/16 | | | DIVIDEND
INCOME | | | DISTRIBUTIONS
AND NET REALIZED
LOSS | |
Manning & Napier Pro-Blend® Maximum Term Series - Class I | | $ | 33,066,824 | | | $ | 5,383,678 | | | $ | 3,995,771 | | | $ | 34,203,220 | | | | 3,420,322 | | | $ | 128,070 | | | $ | (590,137 | ) |
| | | | | | | | | | | | | | | | | | | | | | | | | | | | |
| | $ | 33,066,824 | | | $ | 5,383,678 | | | $ | 3,995,771 | | | $ | 34,203,220 | | | | | | | $ | 128,070 | | | $ | (590,137 | ) |
| | | | | | | | | | | | | | | | | | | | | | | | | | | | |
| | | | | | | | | | | | | | | | | | | | | | | | | | | | |
TARGET 2055 SERIES | | VALUE AT
10/31/15 | | | PURCHASE
COST | | | SALES
PROCEEDS | | | VALUE AT
4/30/16 | | | SHARES HELD
AT 4/30/16 | | | DIVIDEND
INCOME | | | DISTRIBUTIONS
AND NET REALIZED
LOSS | |
Manning & Napier Pro-Blend® Maximum Term Series - Class I | | $ | 3,229,941 | | | $ | 1,399,357 | | | $ | 318,308 | | | $ | 4,347,515 | | | | 434,751 | | | $ | 13,126 | | | $ | (37,972 | ) |
| | | | | | | | | | | | | | | | | | | | | | | | | | | | |
| | $ | 3,229,941 | | | $ | 1,399,357 | | | $ | 318,308 | | | $ | 4,347,515 | | | | | | | $ | 13,126 | | | $ | (37,972 | ) |
| | | | | | | | | | | | | | | | | | | | | | | | | | | | |
| | | | | | | | | | | | | | | | | | | | | | | | | | | | |
TARGET 2060 SERIES | | VALUE AT
10/31/15 | | | PURCHASE
COST | | | SALES
PROCEEDS | | | VALUE AT
4/30/16 | | | SHARES HELD
AT 4/30/16 | | | DIVIDEND
INCOME | | | DISTRIBUTIONS
AND NET REALIZED
GAIN | |
Manning & Napier Pro-Blend® Maximum Term Series - Class I | | $ | 157,243 | | | $ | 984,624 | | | $ | 54,130 | | | $ | 1,185,875 | | | | 118,588 | | | $ | 661 | | | $ | 3,289 | |
| | | | | | | | | | | | | | | | | | | | | | | | | | | | |
| | $ | 157,243 | | | $ | 984,624 | | | $ | 54,130 | | | $ | 1,185,875 | | | | | | | $ | 661 | | | $ | 3,289 | |
| | | | | | | | | | | | | | | | | | | | | | | | | | | | |
49
Notes to Financial Statements (continued)
(unaudited)
| 6. | Capital Stock Transactions |
Transactions in Class K, Class R, and Class I shares:
| | | | | | | | | | | | | | | | | | | | | | | | | | | | | | | | |
TARGET INCOME SERIES: | | FOR THE SIX MONTHS
ENDED 4/30/16 | | | FOR THE YEAR ENDED
10/31/15 | | | FOR THE SIX MONTHS
ENDED 4/30/16 | | | FOR THE YEAR ENDED
10/31/15 | |
| | CLASS K | | | | | | CLASS K | | | | | | CLASS R | | | | | | CLASS R | | | | |
| | SHARES | | | AMOUNTS | | | SHARES | | | AMOUNTS | | | SHARES | | | AMOUNTS | | | SHARES | | | AMOUNTS | |
Shares | | | | | | | | | | | | | | | | | | | | | | | | | | | | | | | | |
Issued in | | | | | | | | | | | | | | | | | | | | | | | | | | | | | | | | |
Reorganization1 | | | | | | | | | | | 2,286,439 | | | $ | 21,835,482 | | | | | | | | | | | | 74,693 | | | $ | 705,844 | |
Sold | | | 146,429 | | | | 1,343,483 | | | | 417,583 | | | | 4,120,152 | | | | 12,834 | | | | 116,316 | | | | 46,949 | | | | 471,844 | |
Reinvested | | | 426,678 | | | | 3,805,972 | | | | 476,694 | | | | 4,705,653 | | | | 12,915 | | | | 114,040 | | | | 115,274 | | | | 11,123,916 | |
Repurchased | | | (475,032 | ) | | | (4,314,060 | ) | | | (1,088,610 | ) | | | (10,723,666 | ) | | | (146,570 | ) | | | (1,318,557 | ) | | | (1,231,416 | ) | | | (12,101,840 | ) |
| | | | | | | | | | | | | | | | | | | | | | | | | | | | | | | | |
Total | | | 98,075 | | | $ | 835,395 | | | | 2,092,106 | | | $ | 19,937,621 | | | | (120,821 | ) | | $ | (1,088,201 | ) | | | (994,500 | ) | | $ | (9,800,236 | ) |
| | | | | | | | | | | | | | | | | | | | | | | | | | | | | | | | |
| | | | | | | | | | | | | | | | | | | | | | | | | | | | | | | | |
TARGET INCOME SERIES: | | FOR THE SIX MONTHS
ENDED 4/30/16 | | | FOR THE YEAR ENDED
10/31/15 | | | | | | | |
| | CLASS I
SHARES | | | AMOUNTS | | | CLASS I
SHARES | | | AMOUNTS | | | | | | | | | | | | | |
Shares | | | | | | | | | | | | | | | | | | | | | | | | | | | | | | | | |
Issued in | | | | | | | | | | | | | | | | | | | | | | | | | | | | | | | | |
Reorganization1 | | | | | | | | | | | 1,449,688 | | | | 13,887,987 | | | | | | | | | | | | | | | | | |
Sold | | | 244,536 | | | | 2,226,673 | | | | 446,104 | | | | 4,558,364 | | | | | | | | | | | | | | | | | |
Reinvested | | | 144,500 | | | | 1,291,401 | | | | 108,763 | | | | 1,075,966 | | | | | | | | | | | | | | | | | |
Repurchased | | | (1,275,919 | ) | | | (11,604,481 | ) | | | (405,177 | ) | | | (4,024,518 | ) | | | | | | | | | | | | | | | | |
| | | | | | | | | | | | | | | | | | | | | | | | | | | | | | | | |
Total | | | (886,883 | ) | | $ | (8,086,407 | ) | | | 1,599,378 | | | $ | 15,497,799 | | | | | | | | | | | | | | | | | |
| | | | | | | | | | | | | | | | | | | | | | | | | | | | | | | | |
| | | | | | | | | | | | | | | | | | | | | | | | | | | | | | | | |
TARGET 2015 SERIES: | | FOR THE SIX MONTHS
ENDED 4/30/16 | | | FOR THE YEAR ENDED
10/31/15 | | | FOR THE SIX MONTHS
ENDED 4/30/16 | | | FOR THE YEAR ENDED
10/31/15 | |
| | CLASS K | | | | | | CLASS K | | | | | | CLASS R | | | | | | CLASS R | | | | |
| | SHARES | | | AMOUNTS | | | SHARES | | | AMOUNTS | | | SHARES | | | AMOUNTS | | | SHARES | | | AMOUNTS | |
Sold | | | 30,139 | | | $ | 304,135 | | | | 190,940 | | | $ | 2,175,614 | | | | 5,763 | | | $ | 59,248 | | | | 37,539 | | | $ | 426,489 | |
Reinvested | | | 26,838 | | | | 266,766 | | | | 15,518 | | | | 176,996 | | | | 6,547 | | | | 65,279 | | | | 7,339 | | | | 83,810 | |
Repurchased | | | (50,080 | ) | | | (527,474 | ) | | | (158,103 | ) | | | (1,821,499 | ) | | | (11,525 | ) | | | (116,878 | ) | | | (101,228 | ) | | | (1,160,178 | ) |
| | | | | | | | | | | | | | | | | | | | | | | | | | | | | | | | |
Total | | | 6,897 | | | $ | 43,427 | | | | 48,355 | | | $ | 531,111 | | | | 785 | | | $ | 7,649 | | | | (56,350 | ) | | $ | (649,879 | ) |
| | | | | | | | | | | | | | | | | | | | | | | | | | | | | | | | |
| | | | | | | | | | | | | | | | | | | | | | | | | | | | | | | | |
TARGET 2015 SERIES: | | FOR THE SIX MONTHS
ENDED 4/30/16 | | | FOR THE YEAR ENDED
10/31/15 | | | | | | | |
| | CLASS I | | | | | | CLASS I | | | | | | | | | | | | | | | | |
| | SHARES | | | AMOUNTS | | | SHARES | | | AMOUNTS | | | | | | | | | | | | | |
Sold | | | 68,829 | | | $ | 712,750 | | | | 182,270 | | | $ | 2,078,159 | | | | | | | | | | | | | | | | | |
Reinvested | | | 31,577 | | | | 314,509 | | | | 22,934 | | | | 262,346 | | | | | | | | | | | | | | | | | |
Repurchased | | | (300,800 | ) | | | (3,123,948 | ) | | | (142,593 | ) | | | (1,626,254 | ) | | | | | | | | | | | | | | | | |
| | | | | | | | | | | | | | | | | | | | | | | | | | | | | | | | |
Total | | | (200,394 | ) | | $ | (2,096,689 | ) | | | 62,611 | | | $ | 714,251 | | | | | | | | | | | | | | | | | |
| | | | | | | | | | | | | | | | | | | | | | | | | | | | | | | | |
| | | | | | | | | | | | | | | | | | | | | | | | | | | | | | | | |
TARGET 2020 SERIES: | | FOR THE SIX MONTHS
ENDED 4/30/16 | | | FOR THE YEAR ENDED
10/31/15 | | | FOR THE SIX MONTHS
ENDED 4/30/16 | | | FOR THE YEAR ENDED
10/31/15 | |
| | CLASS K | | | | | | CLASS K | | | | | | CLASS R | | | | | | CLASS R | | | | |
| | SHARES | | | AMOUNTS | | | SHARES | | | AMOUNTS | | | SHARES | | | AMOUNTS | | | SHARES | | | AMOUNTS | |
Sold | | | 663,833 | | | $ | 5,650,343 | | | | 1,820,935 | | | $ | 17,742,873 | | | | 69,026 | | | $ | 595,204 | | | | 221,254 | | | $ | 2,137,917 | |
Reinvested | | | 912,555 | | | | 7,537,701 | | | | 1,011,644 | | | | 9,774,681 | | | | 81,766 | | | | 667,211 | | | | 228,457 | | | | 2,181,770 | |
Repurchased | | | (956,932 | ) | | | (7,973,224 | ) | | | (3,228,733 | ) | | | (31,463,509 | ) | | | (334,899 | ) | | | (2,808,785 | ) | | | (1,701,100 | ) | | | (16,277,608 | ) |
| | | | | | | | | | | | | | | | | | | | | | | | | | | | | | | | |
Total | | | 619,456 | | | $ | 5,214,820 | | | | (396,154 | ) | | $ | (3,945,955 | ) | | | (184,107 | ) | | $ | (1,546,370 | ) | | | (1,251,389 | ) | | $ | (11,957,921 | ) |
| | | | | | | | | | | | | | | | | | | | | | | | | | | | | | | | |
50
Notes to Financial Statements (continued)
(unaudited)
| 6. | Capital Stock Transactions (continued) |
| | | | | | | | | | | | | | | | | | | | | | | | | | | | | | | | |
TARGET 2020 SERIES: | | FOR THE SIX MONTHS
ENDED 4/30/16 | | | FOR THE YEAR ENDED
10/31/15 | | | | | | | |
| | CLASS I
SHARES | | | AMOUNTS | | | CLASS I
SHARES | | | AMOUNTS | | | | | | | | | | | | | |
Sold | | | 913,483 | | | $ | 7,759,006 | | | | 2,802,754 | | | $ | 28,335,764 | | | | | | | | | | | | | | | | | |
Reinvested | | | 820,501 | | | | 6,799,324 | | | | 756,165 | | | | 7,337,982 | | | | | | | | | | | | | | | | | |
Repurchased | | | (1,742,052 | ) | | | (14,606,174 | ) | | | (1,371,700 | ) | | | (13,273,390 | ) | | | | | | | | | | | | | | | | |
| | | | | | | | | | | | | | | | | | | | | | | | | | | | | | | | |
Total | | | (8,068 | ) | | $ | (47,844 | ) | | | 2,187,219 | | | $ | 22,400,356 | | | | | | | | | | | | | | | | | |
| | | | | | | | | | | | | | | | | | | | | | | | | | | | | | | | |
| | | | | | | | | | | | | | | | | | | | | | | | | | | | | | | | |
TARGET 2025 SERIES: | | FOR THE SIX MONTHS
ENDED 4/30/16 | | | FOR THE YEAR ENDED
10/31/15 | | | FOR THE SIX MONTHS
ENDED 4/30/16 | | | FOR THE YEAR ENDED
10/31/15 | |
| | CLASS K
SHARES | | | AMOUNTS | | | CLASS K
SHARES | | | AMOUNTS | | | CLASS R
SHARES | | | AMOUNTS | | | CLASS R
SHARES | | | AMOUNTS | |
Sold | | | 240,231 | | | $ | 2,508,342 | | | | 556,093 | | | $ | 6,830,718 | | | | 32,696 | | | $ | 349,646 | | | | 56,808 | | | $ | 691,215 | |
Reinvested | | | 98,788 | | | | 1,023,443 | | | | 51,349 | | | | 623,352 | | | | 17,125 | | | | 178,101 | | | | 20,585 | | | | 250,329 | |
Repurchased | | | (208,340 | ) | | | (2,228,159 | ) | | | (178,234 | ) | | | (2,168,108 | ) | | | (29,829 | ) | | | (325,810 | ) | | | (191,936 | ) | | | (2,352,130 | ) |
| | | | | | | | | | | | | | | | | | | | | | | | | | | | | | | | |
Total | | | 130,679 | | | $ | 1,303,626 | | | | 429,208 | | | $ | 5,285,962 | | | | 19,992 | | | $ | 201,937 | | | | (114,543 | ) | | $ | (1,410,586 | ) |
| | | | | | | | | | | | | | | | | | | | | | | | | | | | | | | | |
| | | | | | | | | | | | | | | | | | | | | | | | | | | | | | | | |
TARGET 2025 SERIES: | | FOR THE SIX MONTHS
ENDED 4/30/16 | | | FOR THE YEAR ENDED
10/31/15 | | | | | | | |
| | CLASS I
SHARES | | | AMOUNTS | | | CLASS I
SHARES | | | AMOUNTS | | | | | | | | | | | | | |
Sold | | | 360,684 | | | $ | 3,757,728 | | | | 539,558 | | | $ | 6,563,102 | | | | | | | | | | | | | | | | | |
Reinvested | | | 111,633 | | | | 1,152,051 | | | | 66,271 | | | | 802,064 | | | | | | | | | | | | | | | | | |
Repurchased | | | (341,339 | ) | | | (3,603,977 | ) | | | (294,126 | ) | | | (3,570,654 | ) | | | | | | | | | | | | | | | | |
| | | | | | | | | | | | | | | | | | | | | | | | | | | | | | | | |
Total | | | 130,978 | | | $ | 1,305,802 | | | | 311,703 | | | $ | 3,794,512 | | | | | | | | | | | | | | | | | |
| | | | | | | | | | | | | | | | | | | | | | | | | | | | | | | | |
| | | | | | | | | | | | | | | | | | | | | | | | | | | | | | | | |
TARGET 2030 SERIES: | | FOR THE SIX MONTHS
ENDED 4/30/16 | | | FOR THE YEAR ENDED
10/31/15 | | | FOR THE SIX MONTHS
ENDED 4/30/16 | | | FOR THE YEAR ENDED
10/31/15 | |
| | CLASS K
SHARES | | | AMOUNTS | | | CLASS K
SHARES | | | AMOUNTS | | | CLASS R
SHARES | | | AMOUNTS | | | CLASS R
SHARES | | | AMOUNTS | |
Sold | | | 811,173 | | | $ | 6,784,697 | | | | 1,826,124 | | | $ | 18,788,095 | | | | 144,517 | | | $ | 1,236,058 | | | | 295,552 | | | $ | 3,006,502 | |
Reinvested | | | 1,358,619 | | | | 10,923,294 | | | | 1,546,306 | | | | 15,543,362 | | | | 187,970 | | | | 1,498,122 | | | | 272,475 | | | | 2,719,456 | |
Repurchased | | | (752,685 | ) | | | (6,287,086 | ) | | | (5,593,631 | ) | | | (56,679,063 | ) | | | (399,801 | ) | | | (3,305,161 | ) | | | (1,259,362 | ) | | | (12,487,469 | ) |
| | | | | | | | | | | | | | | | | | | | | | | | | | | | | | | | |
Total | | | 1,417,107 | | | $ | 11,420,905 | | | | (2,221,201 | ) | | $ | (22,347,606 | ) | | | (67,314 | ) | | $ | (570,981 | ) | | | (691,335 | ) | | $ | (6,761,511 | ) |
| | | | | | | | | | | | | | | | | | | | | | | | | | | | | | | | |
| | | | | | | | | | | | | | | | | | | | | | | | | | | | | | | | |
TARGET 2030 SERIES: | | FOR THE SIX MONTHS
ENDED 4/30/16 | | | FOR THE YEAR ENDED
10/31/15 | | | | | | | |
| | CLASS I
SHARES | | | AMOUNTS | | | CLASS I
SHARES | | | AMOUNTS | | | | | | | | | | | | | |
Sold | | | 1,266,687 | | | $ | 10,545,957 | | | | 2,936,452 | | | $ | 31,267,444 | | | | | | | | | | | | | | | | | |
Reinvested | | | 1,258,211 | | | | 10,204,090 | | | | 883,682 | | | | 8,956,560 | | | | | | | | | | | | | | | | | |
Repurchased | | | (1,198,694 | ) | | | (9,929,492 | ) | | | (1,136,582 | ) | | | (11,506,373 | ) | | | | | | | | | | | | | | | | |
| | | | | | | | | | | | | | | | | | | | | | | | | | | | | | | | |
Total | | | 1,326,204 | | | $ | 10,820,555 | | | | 2,683,552 | | | $ | 28,717,631 | | | | | | | | | | | | | | | | | |
| | | | | | | | | | | | | | | | | | | | | | | | | | | | | | | | |
51
Notes to Financial Statements (continued)
(unaudited)
| 6. | Capital Stock Transactions (continued) |
| | | | | | | | | | | | | | | | | | | | | | | | | | | | | | | | |
TARGET 2035 SERIES: | | FOR THE SIX MONTHS
ENDED 4/30/16 | | | FOR THE YEAR ENDED 10/31/15 | | | FOR THE SIX MONTHS
ENDED 4/30/16 | | | FOR THE YEAR ENDED 10/31/15 | |
| | CLASS K
SHARES | | | AMOUNTS | | | CLASS K
SHARES | | | AMOUNTS | | | CLASS R
SHARES | | | AMOUNTS | | | CLASS R
SHARES | | | AMOUNTS | |
Sold | | | 152,126 | | | $ | 1,652,898 | | | | 394,251 | | | $ | 5,158,839 | | | | 33,834 | | | $ | 374,873 | | | | 56,939 | | | $ | 727,311 | |
Reinvested | | | 92,018 | | | | 970,786 | | | | 47,513 | | | | 602,819 | | | | 23,149 | | | | 245,151 | | | | 18,029 | | | | 229,367 | |
Repurchased | | | (55,856 | ) | | | (616,289 | ) | | | (105,200 | ) | | | (1,338,625 | ) | | | (14,255 | ) | | | (161,172 | ) | | | (97,765 | ) | | | (1,238,203 | ) |
| | | | | | | | | | | | | | | | | | | | | | | | | | | | | | | | |
Total | | | 188,288 | | | $ | 2,007,395 | | | | 336,564 | | | $ | 4,423,033 | | | | 42,728 | | | $ | 458,852 | | | | (22,797 | ) | | $ | (281,525 | ) |
| | | | | | | | | | | | | | | | | | | | | | | | | | | | | | | | |
| | | | | | | | | | | | | | | | | | | | | | | | | | | | | | | | |
TARGET 2035 SERIES: | | FOR THE SIX MONTHS
ENDED 4/30/16 | | | FOR THE YEAR ENDED 10/31/15 | | | | | | | |
| | CLASS I
SHARES | | | AMOUNTS | | | CLASS I
SHARES | | | AMOUNTS | | | | | | | | | | | | | |
Sold | | | 145,711 | | | $ | 1,575,973 | | | | 461,178 | | | $ | 5,945,774 | | | | | | | | | | | | | | | | | |
Reinvested | | | 96,235 | | | | 1,018,163 | | | | 59,121 | | | | 752,204 | | | | | | | | | | | | | | | | | |
Repurchased | | | (184,199 | ) | | | (2,014,144 | ) | | | (321,116 | ) | | | (4,108,120 | ) | | | | | | | | | | | | | | | | |
| | | | | | | | | | | | | | | | | | | | | | | | | | | | | | | | |
Total | | | 57,747 | | | $ | 579,992 | | | | 199,183 | | | $ | 2,589,858 | | | | | | | | | | | | | | | | | |
| | | | | | | | | | | | | | | | | | | | | | | | | | | | | | | | |
| | | | | | | | | | | | | | | | | | | | | | | | | | | | | | | | |
TARGET 2040 SERIES: | | FOR THE SIX MONTHS
ENDED 4/30/16 | | | FOR THE YEAR ENDED 10/31/15 | | | FOR THE SIX MONTHS
ENDED 4/30/16 | | | FOR THE YEAR ENDED 10/31/15 | |
| | CLASS K
SHARES | | | AMOUNTS | | | CLASS K
SHARES | | | AMOUNTS | | | CLASS R
SHARES | | | AMOUNTS | | | CLASS R
SHARES | | | AMOUNTS | |
Sold | | | 827,785 | | | $ | 7,089,936 | | | | 1,367,068 | | | $ | 14,445,258 | | | | 86,101 | | | $ | 734,419 | | | | 173,002 | | | $ | 1,823,779 | |
Reinvested | | | 982,198 | | | | 7,985,273 | | | | 1,345,541 | | | | 14,049,199 | | | | 95,772 | | | | 773,836 | | | | 172,074 | | | | 1,786,156 | |
Repurchased | | | (613,384 | ) | | | (5,131,603 | ) | | | (4,280,661 | ) | | | (45,014,121 | ) | | | (148,321 | ) | | | (1,257,365 | ) | | | (675,002 | ) | | | (6,912,325 | ) |
| | | | | | | | | | | | | | | | | | | | | | | | | | | | | | | | |
Total | | | 1,196,599 | | | $ | 9,943,606 | | | | (1,568,052 | ) | | $ | (16,519,664 | ) | | | 33,552 | | | $ | 250,890 | | | | (329,926 | ) | | $ | (3,302,390 | ) |
| | | | | | | | | | | | | | | | | | | | | | | | | | | | | | | | |
| | | | | | | | | | | | | | | | | | | | | | | | | | | | | | | | |
TARGET 2040 SERIES: | | FOR THE SIX MONTHS
ENDED 4/30/16 | | | FOR THE YEAR ENDED 10/31/15 | | | | | | | |
| | CLASS I
SHARES | | | AMOUNTS | | | CLASS I
SHARES | | | AMOUNTS | | | | | | | | | | | | | |
Sold | | | 736,523 | | | $ | 6,289,443 | | | | 1,767,484 | | | $ | 19,737,040 | | | | | | | | | | | | | | | | | |
Reinvested | | | 826,261 | | | | 6,762,679 | | | | 643,884 | | | | 6,770,341 | | | | | | | | | | | | | | | | | |
Repurchased | | | (699,845 | ) | | | (5,797,210 | ) | | | (763,364 | ) | | | (8,070,391 | ) | | | | | | | | | | | | | | | | |
| | | | | | | | | | | | | | | | | | | | | | | | | | | | | | | | |
Total | | | 862,939 | | | $ | 7,254,912 | | | | 1,648,004 | | | $ | 18,436,990 | | | | | | | | | | | | | | | | | |
| | | | | | | | | | | | | | | | | | | | | | | | | | | | | | | | |
| | | | | | | | | | | | | | | | | | | | | | | | | | | | | | | | |
TARGET 2045 SERIES: | | FOR THE SIX MONTHS
ENDED 4/30/16 | | | FOR THE YEAR ENDED 10/31/15 | | | FOR THE SIX MONTHS
ENDED 4/30/16 | | | FOR THE YEAR ENDED 10/31/15 | |
| | CLASS K
SHARES | | | AMOUNTS | | | CLASS K
SHARES | | | AMOUNTS | | | CLASS R
SHARES | | | AMOUNTS | | | CLASS R
SHARES | | | AMOUNTS | |
Sold | | | 204,741 | | | $ | 2,248,033 | | | | 120,547 | | | $ | 1,575,737 | | | | 27,077 | | | $ | 300,222 | | | | 54,775 | | | $ | 714,708 | |
Reinvested | | | 35,763 | | | | 388,379 | | | | 20,811 | | | | 273,206 | | | | 16,008 | | | | 173,049 | | | | 12,683 | | | | 165,654 | |
Repurchased | | | (46,593 | ) | | | (543,564 | ) | | | (53,667 | ) | | | (719,230 | ) | | | (23,917 | ) | | | (256,867 | ) | | | (66,537 | ) | | | (873,072 | ) |
| | | | | | | | | | | | | | | | | | | | | | | | | | | | | | | | |
Total | | | 193,911 | | | $ | 2,092,848 | | | | 87,691 | | | $ | 1,129,713 | | | | 19,168 | | | $ | 216,404 | | | | 921 | | | $ | 7,290 | |
| | | | | | | | | | | | | | | | | | | | | | | | | | | | | | | | |
52
Notes to Financial Statements (continued)
(unaudited)
| 6. | Capital Stock Transactions (continued) |
| | | | | | | | | | | | | | | | | | | | | | | | | | | | | | | | |
TARGET 2045 SERIES: | | FOR THE SIX MONTHS
ENDED 4/30/16 | | | FOR THE YEAR ENDED 10/31/15 | | | | | | | |
| | CLASS I
SHARES | | | AMOUNTS | | | CLASS I
SHARES | | | AMOUNTS | | | | | | | | | | | | | |
Sold | | | 94,206 | | | $ | 1,043,924 | | | | 277,637 | | | $ | 3,744,526 | | | | | | | | | | | | | | | | | |
Reinvested | | | 40,022 | | | | 435,439 | | | | 26,079 | | | | 342,754 | | | | | | | | | | | | | | | | | |
Repurchased | | | (85,956 | ) | | | (953,453 | ) | | | (152,430 | ) | | | (1,994,861 | ) | | | | | | | | | | | | | | | | |
| | | | | | | | | | | | | | | | | | | | | | | | | | | | | | | | |
Total | | | 48,272 | | | $ | 525,910 | | | | 151,286 | | | $ | 2,092,419 | | | | | | | | | | | | | | | | | |
| | | | | | | | | | | | | | | | | | | | | | | | | | | | | | | | |
| | | | | | | | | | | | | | | | | | | | | | | | | | | | | | | | |
TARGET 2050 SERIES: | | FOR THE SIX MONTHS
ENDED 4/30/16 | | | FOR THE YEAR ENDED 10/31/15 | | | FOR THE SIX MONTHS
ENDED 4/30/16 | | | FOR THE YEAR
ENDED 10/31/15 | |
| | CLASS K
SHARES | | | AMOUNTS | | | CLASS K
SHARES | | | AMOUNTS | | | CLASS R
SHARES | | | AMOUNTS | | | CLASS R
SHARES | | | AMOUNTS | |
Sold | | | 295,911 | | | $ | 2,731,484 | | | | 663,894 | | | $ | 7,876,102 | | | | 55,508 | | | $ | 514,330 | | | | 111,753 | | | $ | 1,315,055 | |
Reinvested | | | 309,890 | | | | 2,708,298 | | | | 640,516 | | | | 7,494,105 | | | | 46,733 | | | | 404,245 | | | | 68,631 | | | | 797,489 | |
Repurchased | | | (422,493 | ) | | | (3,888,685 | ) | | | (3,433,652 | ) | | | (40,344,397 | ) | | | (36,426 | ) | | | (363,609 | ) | | | (361,376 | ) | | | (4,151,305 | ) |
| | | | | | | | | | | | | | | | | | | | | | | | | | | | | | | | |
Total | | | 183,308 | | | $ | 1,551,097 | | | | (2,129,242 | ) | | $ | (24,974,190 | ) | | | 65,815 | | | $ | 554,966 | | | | (180,992 | ) | | $ | (2,038,761 | ) |
| | | | | | | | | | | | | | | | | | | | | | | | | | | | | | | | |
| | | | | | | | | | | | | | | | | | | | | | | | | | | | | | | | |
TARGET 2050 SERIES: | | FOR THE SIX MONTHS
ENDED 4/30/16 | | | FOR THE YEAR ENDED 10/31/15 | | | | | | | |
| | CLASS I
SHARES | | | AMOUNTS | | | CLASS I
SHARES | | | AMOUNTS | | | | | | | | | | | | | |
Sold | | | 475,779 | | | $ | 4,434,417 | | | | 680,773 | | | $ | 8,212,637 | | | | | | | | | | | | | | | | | |
Reinvested | | | 334,139 | | | | 2,929,576 | | | | 173,370 | | | | 2,043,399 | | | | | | | | | | | | | | | | | |
Repurchased | | | (267,393 | ) | | | (2,494,270 | ) | | | (354,807 | ) | | | (4,236,301 | ) | | | | | | | | | | | | | | | | |
| | | | | | | | | | | | | | | | | | | | | | | | | | | | | | | | |
Total | | | 542,525 | | | $ | 4,869,723 | | | | 499,336 | | | $ | 6,019,735 | | | | | | | | | | | | | | | | | |
| | | | | | | | | | | | | | | | | | | | | | | | | | | | | | | | |
| | | | | | | | | | | | | | | | | | | | | | | | | | | | | | | | |
TARGET 2055 SERIES: | | FOR THE SIX MONTHS
ENDED 4/30/16 | | | FOR THE YEAR ENDED 10/31/15 | | | FOR THE SIX MONTHS
ENDED 4/30/16 | | | FOR THE YEAR
ENDED 10/31/15 | |
| | CLASS K
SHARES | | | AMOUNTS | | | CLASS K
SHARES | | | AMOUNTS | | | CLASS R
SHARES | | | AMOUNTS | | | CLASS R
SHARES | | | AMOUNTS | |
Sold | | | 35,289 | | | $ | 391,188 | | | | 70,074 | | | $ | 919,046 | | | | 12,552 | | | $ | 139,832 | | | | 20,716 | | | $ | 267,598 | |
Reinvested | | | 9,648 | | | | 104,778 | | | | 11,308 | | | | 146,585 | | | | 3,756 | | | | 40,453 | | | | 3,176 | | | | 40,849 | |
Repurchased | | | (18,215 | ) | | | (210,998 | ) | | | (117,934 | ) | | | (1,549,911 | ) | | | (5,870 | ) | | | (66,037 | ) | | | (28,276 | ) | | | (363,445 | ) |
| | | | | | | | | | | | | | | | | | | | | | | | | | | | | | | | |
Total | | | 26,722 | | | $ | 284,968 | | | | (36,552 | ) | | $ | (484,280 | ) | | | 10,438 | | | $ | 114,248 | | | | (4,384 | ) | | $ | (54,998 | ) |
| | | | | | | | | | | | | | | | | | | | | | | | | | | | | | | | |
| | | | | | | | | | | | | | | | | | | | | | | | | | | | | | | | |
TARGET 2055 SERIES: | | FOR THE SIX MONTHS
ENDED 4/30/16 | | | FOR THE YEAR ENDED 10/31/15 | | | | | | | |
| | CLASS I
SHARES | | | AMOUNTS | | | CLASS I
SHARES | | | AMOUNTS | | | | | | | | | | | | | |
Sold | | | 90,771 | | | $ | 1,013,302 | | | | 96,840 | | | $ | 1,265,526 | | | | | | | | | | | | | | | | | |
Reinvested | | | 14,184 | | | | 155,176 | | | | 5,406 | | | | 70,699 | | | | | | | | | | | | | | | | | |
Repurchased | | | (21,898 | ) | | | (247,946 | ) | | | (33,315 | ) | | | (437,883 | ) | | | | | | | | | | | | | | | | |
| | | | | | | | | | | | | | | | | | | | | | | | | | | | | | | | |
Total | | | 83,057 | | | $ | 920,532 | | | | 68,931 | | | $ | 898,342 | | | | | | | | | | | | | | | | | |
| | | | | | | | | | | | | | | | | | | | | | | | | | | | | | | | |
53
Notes to Financial Statements (continued)
(unaudited)
| 6. | Capital Stock Transactions (continued) |
| | | | | | | | | | | | | | | | | | | | | | | | | | | | | | | | |
TARGET 2060 SERIES: | | FOR THE SIX MONTHS ENDED 4/30/16 | | | FOR THE PERIOD 9/21/15
(COMMENCEMENT OF
OPERATIONS) TO 10/31/15 | | | FOR THE SIX MONTHS ENDED 4/30/16 | | | FOR THE PERIOD 9/21/15
(COMMENCEMENT OF
OPERATIONS) TO 10/31/15 | |
| | CLASS K
SHARES | | | AMOUNTS | | | CLASS K
SHARES | | | AMOUNTS | | | CLASS R
SHARES | | | AMOUNTS | | | CLASS R
SHARES | | | AMOUNTS | |
Sold | | | 93,899 | | | $ | 883,734 | | | | 5,000 | | | $ | 50,000 | | | | 3,011 | | | $ | 30,337 | | | | 5,397 | | | $ | 54,041 | |
Reinvested | | | — | | | | — | | | | — | | | | — | | | | 3 | | | | 28 | | | | — | | | | — | |
Repurchased | | | (1,195 | ) | | | (12,190 | ) | | | — | | | | — | | | | (143 | ) | | | (1,404 | ) | | | (7 | ) | | | (72 | ) |
| | | | | | | | | | | | | | | | | | | | | | | | | | | | | | | | |
Total | | | 92,704 | | | $ | 871,544 | | | | 5,000 | | | $ | 50,000 | | | | 2,871 | | | $ | 28,961 | | | | 5,390 | | | $ | 53,969 | |
| | | | | | | | | | | | | | | | | | | | | | | | | | | | | | | | |
| | | | | | | | | | | | | | | | | | | | | | | | | | | | | | | | |
TARGET 2060 SERIES: | | FOR THE SIX MONTHS ENDED 4/30/16 | | | FOR THE PERIOD 9/21/15
(COMMENCEMENT OF
OPERATIONS) TO 10/31/15 | | | | | | | | | | | | | |
| | CLASS I
SHARES | | | AMOUNTS | | | CLASS I
SHARES | | | AMOUNTS | | | | | | | | | | | | | |
Sold | | | 228 | | | $ | 2,391 | | | | 5,000 | | | $ | 50,000 | | | | | | | | | | | | | | | | | |
Reinvested | | | — | | | | — | | | | — | | | | — | | | | | | | | | | | | | | | | | |
Repurchased | | | (8 | ) | | | (73 | ) | | | — | | | | — | | | | | | | | | | | | | | | | | |
| | | | | | | | | | | | | | | | | | | | | | | | | | | | | | | | |
Total | | | 220 | | | $ | 2,318 | | | | 5,000 | | | $ | 50,000 | | | | | | | | | | | | | | | | | |
| | | | | | | | | | | | | | | | | | | | | | | | | | | | | | | | |
1See Note 1 regarding the reorganization.
The following table represents instances at April 30, 2016, where a shareholder account owned greater than 10% of a Series:
| | | | | | | | | | | | | | | | |
| SERIES | | NUMBER OF
ACCOUNTS
OVER 10% | | | SHARES
OWNED | | | PERCENTAGE
OF SERIES
SHARES
OUTSTANDING | | | VALUE | |
Target Income Series | | | 1 | | | | 5,805,349 | | | | 64.9 | % | | $ | 53,583,369 | |
Target 2015 Series | | | 1 | | | | 182,386 | | | | 28.0 | % | | $ | 1,880,396 | |
Target 2020 Series | | | 2 | | | | 7,122,587 | | | | 40.4 | % | | $ | 61,083,386 | |
Target 2025 Series | | | 1 | | | | 793,295 | | | | 28.5 | % | | $ | 8,504,127 | |
Target 2030 Series | | | 2 | | | | 7,507,708 | | | | 38.3 | % | | $ | 63,181,924 | |
Target 2035 Series | | | 2 | | | | 1,027,520 | | | | 49.0 | % | | $ | 11,380,007 | |
Target 2040 Series | | | 3 | | | | 5,438,305 | | | | 45.3 | % | | $ | 46,570,794 | |
Target 2045 Series | | | 2 | | | | 424,928 | | | | 40.8 | % | | $ | 4,873,642 | |
Target 2050 Series | | | 3 | | | | 1,564,746 | | | | 42.5 | % | | $ | 14,512,724 | |
Target 2055 Series | | | 1 | | | | 147,411 | | | | 39.5 | % | | $ | 1,707,015 | |
Target 2060 Series | | | 1 | | | | 92,317 | | | | 83.1 | % | | $ | 965,631 | |
Investment activities of these shareholders may have a material effect on the Series.
At April 30, 2016, the Advisor owned 15,000 shares of the Target 2060 Series (13.5% of shares outstanding) valued at $156,850.
The Underlying Series may trade in instruments including written and purchased options, forward foreign currency exchange contracts and futures contracts and other derivatives in the normal course of investing activities to assist in managing exposure to various market risks. The Underlying Series may be subject to various elements of risk which may involve, to a varying degree, elements of risk in excess of the amounts recognized for financial statement purposes. These risks include: the risk that changes in the value of a derivative may not correlate perfectly with the underlying asset, rate or index; counterparty credit risk related to over the counter derivative counterparties’ failure to perform under contract terms; liquidity risk related to the lack of a liquid market for these contracts allowing the fund to close out its position(s); and documentation risk relating to disagreement
54
Notes to Financial Statements (continued)
(unaudited)
| 7. | Financial Instruments (continued) |
over contract terms. No such investments were directly held by the Series as of April 30, 2016.
| 8. | Federal Income Tax Information |
The amount and characterization of certain income and capital gains to be distributed are determined in accordance with federal income tax regulations, which may differ from GAAP. Each Series may periodically make reclassifications among its capital accounts to reflect income and gains available for distribution (or available capital loss carryovers) under income tax regulations, without impacting the Series’ net asset value. Any such reclassifications are not reflected in the financial highlights.
The final determination of the tax character of current year distributions will be made at the conclusion of the fiscal year. The tax character of distributions paid for the year ended October 31, 2015 were as follows:
| | | | | | | | | | | | | | | | | | | | |
| | | TARGET
INCOME
SERIES | | | TARGET
2015
SERIES | | | TARGET
2020 SERIES | | | TARGET
2025
SERIES | | | TARGET
2030 SERIES | |
Ordinary income (2015) | | $ | 1,993,670 | | | $ | 323,856 | | | $ | 5,131,810 | | | $ | 994,754 | | | $ | 8,177,375 | |
Long-term capital gain (2015) | | $ | 5,034,635 | | | $ | 226,032 | | | $ | 14,598,333 | | | $ | 845,593 | | | $ | 19,717,662 | |
| | | | | | | | | | | | | | | | | | | | | | | | |
| | | TARGET
2035
SERIES | | | TARGET
2040 SERIES | | | TARGET
2045
SERIES | | | TARGET
2050
SERIES | | | TARGET
2055
SERIES | | | TARGET
2060
SERIES | |
Ordinary income (2015) | | $ | 1,009,386 | | | $ | 6,658,425 | | | $ | 575,767 | | | $ | 3,512,578 | | | $ | 202,996 | | | $ | — | |
Long-term capital gain (2015) | | $ | 666,542 | | | $ | 16,464,854 | | | $ | 241,240 | | | $ | 6,947,427 | | | $ | 67,345 | | | $ | — | |
At April 30, 2016, the identified cost of investments for federal income tax purposes, the resulting gross unrealized depreciation, and the net unrealized depreciation were as follows:
| | | | | | | | | | | | | | | | | | | | |
| | | TARGET
INCOME
SERIES | | | TARGET
2015
SERIES | | | TARGET 2020 SERIES | | | TARGET 2025 SERIES | | | TARGET 2030 SERIES | |
Cost for federal income tax purposes | | $ | 87,582,768 | | | $ | 7,061,297 | | | $ | 164,617,057 | | | $ | 32,370,357 | | | $ | 185,124,607 | |
Unrealized appreciation | | $ | — | | | $ | 69,077 | | | $ | — | | | $ | 393,170 | | | $ | — | |
Unrealized depreciation | | | (4,957,481 | ) | | | (382,433 | ) | | | (13,214,429 | ) | | | (2,862,212 | ) | | | (20,115,472 | ) |
| | | | | | | | | | | | | | | | | | | | |
Net unrealized depreciation | | $ | (4,957,481 | ) | | $ | (313,356 | ) | | $ | (13,214,429 | ) | | $ | (2,469,042 | ) | | $ | (20,115,472 | ) |
| | | | | | | | | | | | | | | | | | | | |
| | | | | | | | | | | | | | | | | | | | | | | | |
| | | TARGET 2035 SERIES | | | TARGET 2040 SERIES | | | TARGET 2045 SERIES | | | TARGET 2050 SERIES | | | TARGET
2055
SERIES | | | TARGET
2060
SERIES | |
Cost for federal income tax purposes | | $ | 26,582,182 | | | $ | 115,868,551 | | | $ | 13,562,418 | | | $ | 38,057,835 | | | $ | 4,850,889 | | | $ | 1,082,969 | |
Unrealized appreciation | | $ | — | | | $ | — | | | $ | 35,331 | | | $ | — | | | $ | — | | | $ | 102,906 | |
Unrealized depreciation | | | (3,349,800 | ) | | | (12,964,490 | ) | | | (1,613,680 | ) | | | (3,854,615 | ) | | | (503,374 | ) | | | — | |
| | | | | | | | | | | | | | | | | | | | | | | | |
Net unrealized appreciation (depreciation) | | $ | (3,349,800 | ) | | $ | (12,964,490 | ) | | $ | (1,578,349 | ) | | $ | (3,854,615 | ) | | $ | (503,374 | ) | | $ | 102,906 | |
| | | | | | | | | | | | | | | | | | | | | | | | |
55
Renewal of Investment Advisory Agreement
(unaudited)
At the Manning & Napier Fund, Inc. (the “Fund”) Board of Directors’ (the “Board”) meeting, held on November 17, 2015, the Investment Advisory Agreement (the “Agreement”) between the Fund and Manning & Napier Advisors, LLC (the “Advisor”) was considered by the Board for renewal. In connection with the decision whether to renew the Agreement, a variety of material was prepared for and considered by the Board.
Representatives of the Advisor attended the meeting and presented additional oral and written information to the Board to assist the Board in its considerations. The discussion immediately below outlines the materials and information presented to the Board in connection with the Board’s 2015 Annual consideration of the Agreement and the conclusions made by the Directors when determining to continue the Agreement.
| | • | | The Board considered the services provided by the Advisor under the Agreement including, among others: deciding what securities to purchase and sell for each Series; arranging for the purchase and sale of such securities by placing orders with broker-dealers; administering the affairs of the Fund (including the books and records of the Fund not maintained by third party service providers such as the custodian or sub-transfer agent); arranging for the insurance coverage for the Fund; and supervising the preparation of tax returns, SEC filings (including registration statements) and reports to shareholders for the Fund. The Board also considered the nature and quality of such services provided under the Agreement in light of the Advisor’s services provided to the Fund for 29 years. The Board discussed the quality of these services with representatives from the Advisor and concluded that the Advisor was performing its services to the Fund required under the Agreement in a reasonable manner. |
| | • | | The Board considered the performance of each Series since its inception, as well as performance over multiple time periods. Performance for one or more of the following time periods was considered as applicable to the Series’ inception date: inception, three year, five year, ten year, and current market cycle. A market cycle includes periods of both rising and falling markets. Returns for established benchmark indices for each Series were provided. In addition, the Board considered a number of other factors relevant to performance at the meeting (and considers on a quarterly basis) including: a peer group performance analysis consisting of Morningstar universes of mutual funds with similar investment objectives, investment performance of core products, product offerings, performance on an aggregate basis vs. performance over reasonable time periods and the Advisor’s investment process. The Directors acknowledged the challenging performance and discussed the investment process of the Advisor. The Directors confirmed that qualitative factors such as the Advisor’s investment process, including recent enhancements, were an important subset to be considered as part of their consideration of performance. The Board discussed the performance with representatives from the Advisor and concluded that the investment performance of each of the Fund’s Series was reasonable based on the Series’ actual performance and comparative performance, especially for those series with performance over the current market cycle. |
| | • | | The Board considered the costs of the Advisor’s services and the profits of the Advisor as they relate to the Advisor’s services to the Fund under the Agreement. In reviewing the Advisor’s costs and profits, the Board discussed the Advisor’s revenues generated from the Fund (on both an actual and adjusted basis) and its expenses associated with providing the services under the Agreement. In addition, the Board reviewed the Advisor’s expenses associated with Fund activities outside of the Agreement (such as expense reimbursements pursuant to expense caps and payments made by the Advisor to third party platforms on which shares of the Fund are available for purchase). It was noted by representatives of the Advisor that 22 of the 36 active Series of the Fund are currently experiencing expenses above the capped expense ratios, and thus the Advisor is incurring those expenses over the cap. After discussing the above costs and profits, the Board concluded that the Advisor’s profitability relating to its services provided under the Agreement was reasonable. |
| | • | | The Board considered the fees and expenses of the various Series of the Fund. The Advisor presented the advisory fees and total expenses for each Series, including the advisory fee adjusted for any expense waivers or reimbursements (either contractual or voluntary) paid by the Advisor. The advisory fees and expense ratios of each Series were compared to an average (on both a mean and median basis) of similar funds as disclosed on the Morningstar database. Representatives of the Advisor discussed with the Board the levels of its advisory fee for each Series of the Fund and as compared to the median and mean advisory fees for similar funds as listed on Morningstar. Expense ratios for every Series, except the Tax Managed Series, Equity Income Class S, High Yield Bond Class S, Pro-Blend Series Classes C and R, and Target Series’ Classes R and K, are lower than, or substantially similar to the Morningstar mean and median reported total expense ratio. |
56
Renewal of Investment Advisory Agreement
(unaudited)
| | The higher than mean and median total expense ratios for Classes C and R reflect higher distribution, marketing and shareholder service fees payable to broker-dealers through a 100bp 12b-1 fee for Class C and a 50bp 12b-1 fee for Class R. Based on their review of the information provided, the Board concluded that the fees and expenses of each Series of the Fund were reasonable on a comparative basis. |
| | • | | The Board also considered the other benefits the Advisor derives from its relationship with the Fund. Such other benefits include certain research services provided by soft dollars. The Board reviewed the broker-dealers who provided research to the Advisor and the products and services paid for, in whole or in part, using soft dollar commissions. Given the level of soft dollar transactions involving the Fund, the Board concluded that these additional benefits to the Advisor were reasonable. |
| | • | | In addition to the factors described above, the Board considered the Advisor’s personnel, investment strategies, policies and procedures relating to compliance with personal securities transactions, reputation, expertise and resources in domestic and foreign financial markets. The Board concluded that these factors support the conclusion that the Advisor performs its services in a reasonable manner. |
| | • | | The Board then considered economies of scale and concluded that the current fee schedule to the advisory agreement remained reasonable given the multiple uses of the Fund (for the Advisor’s discretionary investment account clients in addition to direct investors), the current profitability of the Advisor’s services to the Fund under the Agreement, the number of newly established series of the Fund and the overall size of the Fund complex. |
Based on the Board’s deliberations and their evaluation of the information described above, the Board, including a majority of Directors that are not “interested persons” as defined in the Investment Company Act of 1940, concluded that the compensation under the Agreement was fair and reasonable in light of the services and expenses and such other matters as the Directors considered to be relevant in the exercise of their reasonable judgment. Accordingly, the Board approved the renewal of the Agreement. In the course of their deliberations, the Directors did not identify any particular information that was all important or controlling.
57
Literature Requests
(unaudited)
Proxy Voting Policies and Procedures
A description of the policies and procedures that the Fund uses to determine how to vote proxies relating to portfolio securities is available, without charge, upon request:
| | | | |
| By phone | | 1-800-466-3863 | | |
| On the Securities and Exchange | | | | |
| Commission’s (SEC) web site | | http://www.sec.gov | | |
Proxy Voting Record
Information regarding how the Fund voted proxies relating to portfolio securities during the most recent 12-month period ended June 30th is available, without charge, upon request:
| | | | |
| By phone | | 1-800-466-3863 | | |
| On the SEC’s web site | | http://www.sec.gov | | |
Quarterly Portfolio Holdings
The Series’ complete schedule of portfolio holdings for the 1st and 3rd quarters of each fiscal year are provided on Form N-Q, and are available, without charge, upon request:
| | | | |
| By phone | | 1-800-466-3863 | | |
| On the SEC’s web site | | http://www.sec.gov | | |
The Series’ Form N-Q may be reviewed and copied at the SEC’s Public Reference Room in Washington, D.C. Information on the operation of the Public Reference Room may be obtained by calling 1-800-SEC-0330.
Prospectus and Statement of Additional Information (SAI)
For more information about any of the Manning & Napier Fund, Inc. Series, you may obtain a prospectus and SAI at www.manning-napier.com or by calling (800) 466-3863. Before investing, carefully consider the objectives, risks, charges and expenses of the investment and read the prospectus carefully as it contains this and other information about the investment company. In addition, this information can be found on the SEC’s web site, http://www.sec.gov.
Additional information available at www.manning-napier.com
1. Fund Holdings - Month-End
2. Fund Holdings - Quarter-End
3. Shareholder Report - Annual
4. Shareholder Report - Semi-Annual
The Fund also offers electronic notification or “e-delivery” when certain documents are available on-line to be downloaded or reviewed. Direct shareholders can elect to receive electronic notification when shareholder reports, prospectus updates, and/or statements are available. If you do not currently have on-line access to your account, you can establish access by going to www.manning-napier.com, click on “Login” in the top corner of the page, and follow the prompts to self-enroll. Once enrolled, you can set your electronic notification preferences by clicking on the Account Options tab located within the green toolbar and then select E-Delivery Option. Should you have any questions on either how to establish on-line access or how to update your account settings, please contact Investor Services at 1-800-466-3863.
The Manning & Napier Fund, Inc. is managed by Manning & Napier Advisors, LLC. Manning & Napier Investor Services, Inc., an affiliate of Manning & Napier Advisors, LLC, is the distributor of the Fund shares.
MNTGT-04/16-SAR

Disciplined Value Series
Shareholder Expense Example
(unaudited)
As a shareholder of the Series, you incur ongoing costs, including management fees, shareholder service fees and other Series expenses. This example is intended to help you understand your ongoing costs (in dollars) of investing in the Series and to compare these costs with the ongoing costs of investing in other mutual funds.
The example is based on an investment of $1,000 invested in each class at the beginning of the period and held for the entire period (November 1, 2015 to April 30, 2016).
Actual Expenses
The Actual lines of the table below provide information about actual account values and actual expenses. You may use the information in this line, together with the amount you invested, to estimate the expenses that you paid over the period. Simply divide your account value by $1,000 (for example, an $8,600 account value divided by $1,000 = 8.6), then multiply the result by the number in the Actual line for the Class in which you have invested under the heading entitled “Expenses Paid During Period” to estimate the expenses you paid on your account during this period.
Hypothetical Example for Comparison Purposes
The Hypothetical lines of each Class in the table below provide information about hypothetical account values and hypothetical expenses based on the Class’ actual expense ratio and an assumed rate of return of 5% per year before expenses, which is not the Class’ actual return. The hypothetical account values and expenses may not be used to estimate the actual ending account balance or expenses you paid during the period. You may use this information to compare the ongoing costs of investing in a class of the Series and other funds. To do so, compare this 5% hypothetical example for the Class in which you have invested with the 5% hypothetical examples that appear in the shareholder reports of the other funds.
Please note that the expenses shown in the table are meant to highlight your ongoing costs only and do not reflect any transaction costs, such as sales charges (loads), redemptions fees, or exchange fees that you may incur in other mutual funds. Therefore, the second line of the table is useful in comparing ongoing costs only, and will not help you determine the relative total costs of owning different funds.
| | | | | | | | |
| | | BEGINNING
ACCOUNT VALUE
11/1/15 | | ENDING
ACCOUNT VALUE
4/30/16 | | EXPENSES PAID DURING PERIOD* 11/1/15-4/30/16 | | ANNUALIZED
EXPENSE RATIO |
Class S | | | | | | | | |
Actual | | $1,000.00 | | $1,031.10 | | $4.09 | | 0.81% |
Hypothetical | | | | | | | | |
(5% return before expenses) | | $1,000.00 | | $1,020.84 | | $4.07 | | 0.81% |
Class I | | | | | | | | |
Actual | | $1,000.00 | | $1,032.50 | | $2.83 | | 0.56% |
Hypothetical | | | | | | | | |
(5% return before expenses) | | $1,000.00 | | $1,022.08 | | $2.82 | | 0.56% |
*Expenses are equal to each Class’ annualized expense ratio (for the six-month period), multiplied by the average account value over the period, multiplied by 182/366 to reflect the one-half year period.
1
Disciplined Value Series
Portfolio Composition as of April 30, 2016
(unaudited)
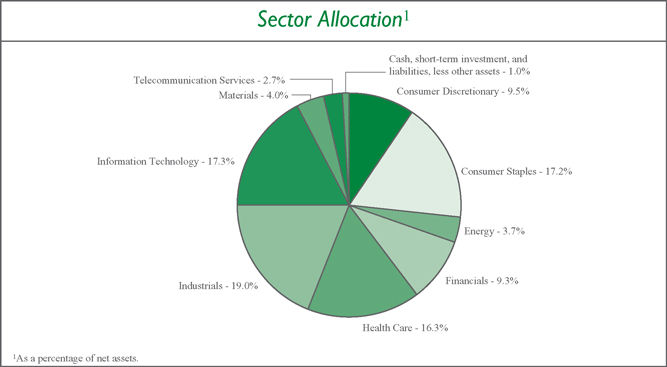
2
Disciplined Value Series
Investment Portfolio - April 30, 2016
(unaudited)
| | | | | | | | |
| | | SHARES | | | VALUE (NOTE 2) | |
| | |
COMMON STOCKS - 99.0% | | | | | | | | |
| | |
Consumer Discretionary - 9.5% | | | | | | | | |
Auto Components - 1.1% | | | | | | | | |
Johnson Controls, Inc. | | | 26,504 | | | $ | 1,097,266 | |
Magna International, Inc. (Canada) | | | 16,292 | | | | 684,590 | |
| | | | | | | | |
| | |
| | | | | | | 1,781,856 | |
| | | | | | | | |
Automobiles - 1.2% | | | | | | | | |
Harley-Davidson, Inc. | | | 13,307 | | | | 636,474 | |
Honda Motor Co., Ltd. - ADR (Japan) | | | 50,930 | | | | 1,373,073 | |
| | | | | | | | |
| | |
| | | | | | | 2,009,547 | |
| | | | | | | | |
Distributors - 0.4% | | | | | | | | |
Genuine Parts Co. | | | 7,590 | | | | 728,412 | |
| | | | | | | | |
Media - 1.7% | | | | | | | | |
Omnicom Group, Inc. | | | 10,920 | | | | 906,032 | |
Thomson Reuters Corp. | | | 29,853 | | | | 1,227,854 | |
Viacom, Inc. - Class B | | | 16,864 | | | | 689,738 | |
| | | | | | | | |
| | |
| | | | | | | 2,823,624 | |
| | | | | | | | |
Multiline Retail - 1.0% | | | | | | | | |
Target Corp. | | | 20,115 | | | | 1,599,142 | |
| | | | | | | | |
Specialty Retail - 3.5% | | | | | | | | |
Best Buy Co., Inc. | | | 18,484 | | | | 592,967 | |
The Gap, Inc. | | | 23,819 | | | | 552,124 | |
The Home Depot, Inc. | | | 34,583 | | | | 4,630,318 | |
| | | | | | | | |
| | |
| | | | | | | 5,775,409 | |
| | | | | | | | |
Textiles, Apparel & Luxury Goods - 0.6% | | | | | | | | |
VF Corp. | | | 14,745 | | | | 929,672 | |
| | | | | | | | |
| | |
Total Consumer Discretionary | | | | | | | 15,647,662 | |
| | | | | | | | |
Consumer Staples - 17.2% | | | | | | | | |
Beverages - 3.2% | | | | | | | | |
Dr. Pepper Snapple Group, Inc. | | | 9,599 | | | | 872,645 | |
PepsiCo, Inc. | | | 43,064 | | | | 4,433,869 | |
| | | | | | | | |
| | |
| | | | | | | 5,306,514 | |
| | | | | | | | |
Food & Staples Retailing - 3.7% | | | | | | | | |
Sysco Corp. | | | 24,938 | | | | 1,148,894 | |
Wal-Mart Stores, Inc. | | | 74,812 | | | | 5,002,678 | |
| | | | | | | | |
| | |
| | | | | | | 6,151,572 | |
| | | | | | | | |
Food Products - 2.4% | | | | | | | | |
ConAgra Foods, Inc. | | | 20,218 | | | | 900,914 | |
General Mills, Inc. | | | 22,996 | | | | 1,410,575 | |
The Hershey Co. | | | 9,545 | | | | 888,735 | |
The accompanying notes are an integral part of the financial statements.
3
Disciplined Value Series
Investment Portfolio - April 30, 2016
(unaudited)
| | | | | | | | |
| | | SHARES | | | VALUE (NOTE 2) | |
| | |
COMMON STOCKS (continued) | | | | | | | | |
| | |
Consumer Staples (continued) | | | | | | | | |
Food Products (continued) | | | | | | | | |
The J.M. Smucker Co. | | | 6,005 | | | $ | 762,515 | |
| | | | | | | | |
| | |
| | | | | | | 3,962,739 | |
| | | | | | | | |
Household Products - 5.8% | | | | | | | | |
The Clorox Co. | | | 6,305 | | | | 789,575 | |
Colgate-Palmolive Co. | | | 27,742 | | | | 1,967,463 | |
Kimberly-Clark Corp. | | | 10,147 | | | | 1,270,303 | |
The Procter & Gamble Co. | | | 69,240 | | | | 5,547,509 | |
| | | | | | | | |
| | |
| | | | | | | 9,574,850 | |
| | | | | | | | |
Personal Products - 2.1% | | | | | | | | |
Unilever plc - ADR (United Kingdom) | | | 75,216 | | | | 3,374,190 | |
| | | | | | | | |
| | |
Total Consumer Staples | | | | | | | 28,369,865 | |
| | | | | | | | |
Energy - 3.7% | | | | | | | | |
Energy Equipment & Services - 2.2% | | | | | | | | |
National Oilwell Varco, Inc. | | | 20,172 | | | | 726,999 | |
Schlumberger Ltd. | | | 35,736 | | | | 2,871,030 | |
| | | | | | | | |
| | |
| | | | | | | 3,598,029 | |
| | | | | | | | |
Oil, Gas & Consumable Fuels - 1.5% | | | | | | | | |
Marathon Petroleum Corp. | | | 20,436 | | | | 798,639 | |
Ultrapar Participacoes S.A. - ADR (Brazil) | | | 29,591 | | | | 620,819 | |
Valero Energy Corp. | | | 18,348 | | | | 1,080,147 | |
| | | | | | | | |
| | |
| | | | | | | 2,499,605 | |
| | | | | | | | |
| | |
Total Energy | | | | | | | 6,097,634 | |
| | | | | | | | |
Financials - 9.3% | | | | | | | | |
Banks - 9.3% | | | | | | | | |
BB&T Corp. | | | 32,263 | | | | 1,141,465 | |
Fifth Third Bancorp | | | 39,353 | | | | 720,553 | |
JPMorgan Chase & Co. | | | 74,112 | | | | 4,683,878 | |
The PNC Financial Services Group, Inc. | | | 17,466 | | | | 1,533,165 | |
U.S. Bancorp | | | 50,929 | | | | 2,174,159 | |
Wells Fargo & Co. | | | 99,184 | | | | 4,957,216 | |
| | | | | | | | |
| | |
Total Financials | | | | | | | 15,210,436 | |
| | | | | | | | |
Health Care - 16.3% | | | | | | | | |
Biotechnology - 2.8% | | | | | | | | |
AbbVie, Inc. | | | 36,446 | | | | 2,223,206 | |
Amgen, Inc. | | | 15,667 | | | | 2,480,086 | |
| | | | | | | | |
| | |
| | | | | | | 4,703,292 | |
| | | | | | | | |
Health Care Equipment & Supplies - 1.4% | | | | | | | | |
Abbott Laboratories | | | 37,268 | | | | 1,449,725 | |
The accompanying notes are an integral part of the financial statements.
4
Disciplined Value Series
Investment Portfolio - April 30, 2016
(unaudited)
| | | | | | | | |
| | | | | | VALUE | |
| | | SHARES | | | (NOTE 2) | |
| | |
COMMON STOCKS (continued) | | | | | | | | |
| | |
Health Care (continued) | | | | | | | | |
Health Care Equipment & Supplies (continued) | | | | | | | | |
St. Jude Medical, Inc. | | | 11,393 | | | $ | 868,147 | |
| | | | | | | | |
| | |
| | | | | | | 2,317,872 | |
| | | | | | | | |
Pharmaceuticals - 12.1% | | | | | | | | |
Johnson & Johnson | | | 60,332 | | | | 6,762,010 | |
Merck & Co., Inc. | | | 71,325 | | | | 3,911,463 | |
Pfizer, Inc. | | | 147,755 | | | | 4,833,066 | |
Sanofi - ADR (France) | | | 66,051 | | | | 2,714,696 | |
Teva Pharmaceutical Industries Ltd. - ADR (Israel) | | | 30,107 | | | | 1,639,326 | |
| | | | | | | | |
| | |
| | | | | | | 19,860,561 | |
| | | | | | | | |
| | |
Total Health Care | | | | | | | 26,881,725 | |
| | | | | | | | |
Industrials - 19.0% | | | | | | | | |
Aerospace & Defense - 6.1% | | | | | | | | |
The Boeing Co. | | | 18,669 | | | | 2,516,581 | |
General Dynamics Corp. | | | 11,566 | | | | 1,625,254 | |
Lockheed Martin Corp. | | | 9,270 | | | | 2,154,162 | |
Raytheon Co. | | | 11,019 | | | | 1,392,251 | |
United Technologies Corp. | | | 22,718 | | | | 2,371,078 | |
| | | | | | | | |
| | |
| | | | | | | 10,059,326 | |
| | | | | | | | |
Air Freight & Logistics - 1.5% | | | | | | | | |
United Parcel Service, Inc. - Class B | | | 23,924 | | | | 2,513,695 | |
| | | | | | | | |
Commercial Services & Supplies - 1.1% | | | | | | | | |
Tyco International plc | | | 18,079 | | | | 696,403 | |
Waste Management, Inc. | | | 19,253 | | | | 1,131,884 | |
| | | | | | | | |
| | |
| | | | | | | 1,828,287 | |
| | | | | | | | |
Electrical Equipment - 3.0% | | | | | | | | |
ABB Ltd. (Asea Brown Boveri) - ADR (Switzerland) | | | 79,481 | | | | 1,677,844 | |
Eaton Corp. plc | | | 18,311 | | | | 1,158,537 | |
Emerson Electric Co. | | | 25,042 | | | | 1,368,044 | |
Rockwell Automation, Inc. | | | 6,572 | | | | 745,725 | |
| | | | | | | | |
| | |
| | | | | | | 4,950,150 | |
| | | | | | | | |
Industrial Conglomerates - 2.6% | | | | | | | | |
3M Co. | | | 20,378 | | | | 3,410,870 | |
Koninklijke Philips N.V. - NY Shares (Netherlands) | | | 32,095 | | | | 882,933 | |
| | | | | | | | |
| | |
| | | | | | | 4,293,803 | |
| | | | | | | | |
Machinery - 3.4% | | | | | | | | |
Caterpillar, Inc. | | | 20,187 | | | | 1,568,934 | |
Cummins, Inc. | | | 7,681 | | | | 898,907 | |
Illinois Tool Works, Inc. | | | 13,612 | | | | 1,422,726 | |
The accompanying notes are an integral part of the financial statements.
5
Disciplined Value Series
Investment Portfolio - April 30, 2016
(unaudited)
| | | | | | | | |
| | | | | | VALUE | |
| | | SHARES | | | (NOTE 2) | |
| | |
COMMON STOCKS (continued) | | | | | | | | |
| | |
Industrials (continued) | | | | | | | | |
Machinery (continued) | | | | | | | | |
Parker-Hannifin Corp. | | | 6,653 | | | $ | 771,881 | |
Stanley Black & Decker, Inc. | | | 7,473 | | | | 836,378 | |
| | | | | | | | |
| | |
| | | | | | | 5,498,826 | |
| | | | | | | | |
Road & Rail - 1.3% | | | | | | | | |
Union Pacific Corp. | | | 24,966 | | | | 2,177,784 | |
| | | | | | | | |
| | |
Total Industrials | | | | | | | 31,321,871 | |
| | | | | | | | |
Information Technology - 17.3% | | | | | | | | |
Communications Equipment - 2.6% | | | | | | | | |
Cisco Systems, Inc. | | | 120,275 | | | | 3,306,360 | |
Telefonaktiebolaget LM Ericsson - ADR (Sweden) | | | 128,064 | | | | 1,036,038 | |
| | | | | | | | |
| | |
| | | | | | | 4,342,398 | |
| | | | | | | | |
IT Services - 3.7% | | | | | | | | |
Automatic Data Processing, Inc. | | | 16,570 | | | | 1,465,451 | |
International Business Machines Corp. | | | 21,685 | | | | 3,164,709 | |
Paychex, Inc. | | | 16,966 | | | | 884,268 | |
Xerox Corp. | | | 56,636 | | | | 543,706 | |
| | | | | | | | |
| | |
| | | | | | | 6,058,134 | |
| | | | | | | | |
Semiconductors & Semiconductor Equipment - 6.2% | | | | | | | | |
Intel Corp. | | | 119,346 | | | | 3,613,797 | |
QUALCOMM, Inc. | | | 43,921 | | | | 2,218,889 | |
Taiwan Semiconductor Manufacturing Co. Ltd. - ADR (Taiwan) | | | 105,057 | | | | 2,478,295 | |
Texas Instruments, Inc. | | | 31,992 | | | | 1,824,824 | |
| | | | | | | | |
| | |
| | | | | | | 10,135,805 | |
| | | | | | | | |
Software - 4.0% | | | | | | | | |
CA, Inc. | | | 22,673 | | | | 672,481 | |
Microsoft Corp. | | | 119,419 | | | | 5,955,425 | |
| | | | | | | | |
| | |
| | | | | | | 6,627,906 | |
| | | | | | | | |
Technology Hardware, Storage & Peripherals - 0.8% | | | | | | | | |
Canon, Inc. - ADR (Japan) | | | 48,045 | | | | 1,341,897 | |
| | | | | | | | |
| | |
Total Information Technology | | | | | | | 28,506,140 | |
| | | | | | | | |
Materials - 4.0% | | | | | | | | |
Chemicals - 2.3% | | | | | | | | |
LyondellBasell Industries N.V. - Class A | | | 15,786 | | | | 1,305,029 | |
Monsanto Co. | | | 13,357 | | | | 1,251,284 | |
Praxair, Inc. | | | 10,786 | | | | 1,266,923 | |
| | | | | | | | |
| | |
| | | | | | | 3,823,236 | |
| | | | | | | | |
Construction Materials - 0.6% | | | | | | | | |
CRH plc - ADR (Ireland) | | | 34,434 | | | | 1,002,374 | |
| | | | | | | | |
The accompanying notes are an integral part of the financial statements.
6
Disciplined Value Series
Investment Portfolio - April 30, 2016
(unaudited)
| | | | | | | | |
| | | SHARES | | | VALUE (NOTE 2) | |
| | |
COMMON STOCKS (continued) | | | | | | | | |
| | |
Materials (continued) | | | | | | | | |
Containers & Packaging - 0.6% | | | | | | | | |
International Paper Co. | | | 20,266 | | | $ | 876,910 | |
| | | | | | | | |
| | |
Metals & Mining - 0.5% | | | | | | | | |
Nucor Corp. | | | 15,515 | | | | 772,337 | |
| | | | | | | | |
| | |
Total Materials | | | | | | | 6,474,857 | |
| | | | | | | | |
Telecommunication Services - 2.7% | | | | | | | | |
Diversified Telecommunication Services - 0.7% | | | | | | | | |
Telekomunikasi Indonesia Persero Tbk PT - ADR (Indonesia) | | | 21,053 | | | | 1,123,599 | |
| | | | | | | | |
| | |
Wireless Telecommunication Services - 2.0% | | | | | | | | |
NTT DOCOMO, Inc. - ADR (Japan) | | | 105,511 | | | | 2,568,138 | |
SK Telecom Co. Ltd. - ADR (South Korea) | | | 36,602 | | | | 732,040 | |
| | | | | | | | |
| | |
| | | | | | | 3,300,178 | |
| | | | | | | | |
| | |
Total Telecommunication Services | | | | | | | 4,423,777 | |
| | | | | | | | |
| | |
TOTAL COMMON STOCKS
(Identified Cost $148,043,627) | | | | | | | 162,933,967 | |
| | | | | | | | |
| | |
SHORT-TERM INVESTMENT - 1.1% | | | | | | | | |
Dreyfus Cash Management, Inc. - Institutional Shares1, 0.29% | | | | | | | | |
(Identified Cost $1,859,938) | | | 1,859,938 | | | | 1,859,938 | |
| | | | | | | | |
TOTAL INVESTMENTS - 100.1% | | | | | | | | |
(Identified Cost $149,903,565) | | | | | | | 164,793,905 | |
LIABILITIES, LESS OTHER ASSETS - (0.1%) | | | | | | | (129,855 | ) |
| | | | | | | | |
NET ASSETS - 100% | | | | | | $ | 164,664,050 | |
| | | | | | | | |
ADR - American Depositary Receipt
1Rate shown is the current yield as of April 30, 2016.
The Global Industry Classification Standard (GICS) was developed by and is the exclusive property and a service mark of MSCI Inc. (MSCI) and Standard & Poor’s, a division of The McGraw-Hill Companies, Inc. (S&P), and is licensed for use by Manning & Napier when referencing GICS sectors. Neither MSCI, S&P, nor any third party involved in making or compiling the GICS or any GICS classifications makes any express or implied warranties or representations with respect to such standard or classification, nor shall any such party have any liability therefrom.
The accompanying notes are an integral part of the financial statements.
7
Disciplined Value Series
Statement of Assets and Liabilities
April 30, 2016 (unaudited)
| | | | |
| ASSETS: | | | | |
| |
Investments, at value (identified cost $149,903,565) (Note 2) | | $ | 164,793,905 | |
Dividends receivable | | | 255,811 | |
Foreign tax reclaims receivable | | | 111,072 | |
Receivable for fund shares sold | | | 66,546 | |
Prepaid and other expenses | | | 8,401 | |
| | | | |
| |
TOTAL ASSETS | | | 165,235,735 | |
| | | | |
| |
LIABILITIES: | | | | |
| |
Accrued management fees (Note 3) | | | 60,880 | |
Accrued fund accounting and administration fees (Note 3) | | | 11,836 | |
Accrued transfer agent fees (Note 3) | | | 4,001 | |
Accrued shareholder services fees (Class S) (Note 3) | | | 2,610 | |
Accrued Chief Compliance Officer service fees (Note 3) | | | 381 | |
Payable for fund shares repurchased | | | 459,381 | |
Audit fees payable | | | 16,626 | |
Other payables and accrued expenses | | | 15,970 | |
| | | | |
| |
TOTAL LIABILITIES | | | 571,685 | |
| | | | |
| |
TOTAL NET ASSETS | | $ | 164,664,050 | |
| | | | |
| |
NET ASSETS CONSIST OF: | | | | |
| |
Capital stock | | $ | 121,283 | |
Additional paid-in-capital | | | 144,909,164 | |
Undistributed net investment income | | | 499,180 | |
Accumulated net realized gain on investments | | | 4,244,083 | |
Net unrealized appreciation on investments | | | 14,890,340 | |
| | | | |
| |
TOTAL NET ASSETS | | $ | 164,664,050 | |
| | | | |
| |
NET ASSET VALUE, OFFERING PRICE AND REDEMPTION PRICE PER SHARE - Class S | | | | |
($12,844,828/1,304,211 shares) | | $ | 9.85 | |
| | | | |
| |
NET ASSET VALUE, OFFERING PRICE AND REDEMPTION PRICE PER SHARE - Class I | | | | |
($151,819,222/10,824,040 shares) | | $ | 14.03 | |
| | | | |
The accompanying notes are an integral part of the financial statements.
8
Disciplined Value Series
Statement of Operations
For the Six Months Ended April 30, 2016 (unaudited)
| | | | |
INVESTMENT INCOME: | | | | |
| |
Dividends (net of foreign taxes withheld, $22,498) | | $ | 2,392,873 | |
| | | | |
| |
EXPENSES: | | | | |
| |
Management fees (Note 3) | | | 361,294 | |
Fund accounting and administration fees (Note 3) | | | 27,206 | |
Shareholder services fees (Class S)(Note 3) | | | 17,237 | |
Transfer agent fees (Note 3) | | | 6,999 | |
Directors’ fees (Note 3) | | | 3,274 | |
Chief Compliance Officer service fees (Note 3) | | | 1,258 | |
Custodian fees | | | 5,378 | |
Miscellaneous | | | 43,057 | |
| | | | |
| |
Total Expenses | | | 465,703 | |
| | | | |
| |
NET INVESTMENT INCOME | | | 1,927,170 | |
| | | | |
| |
REALIZED AND UNREALIZED GAIN (LOSS) ON INVESTMENTS: | | | | |
| |
Net realized gain on investments | | | 4,345,655 | |
Net change in unrealized appreciation (depreciation) on investments | | | (1,232,577 | ) |
| | | | |
| |
NET REALIZED AND UNREALIZED GAIN (LOSS) ON INVESTMENTS | | | 3,113,078 | |
| | | | |
| |
NET INCREASE IN NET ASSETS RESULTING FROM OPERATIONS | | $ | 5,040,248 | |
| | | | |
The accompanying notes are an integral part of the financial statements.
9
Disciplined Value Series
Statements of Changes in Net Assets
| | | | | | | | |
| | | FOR THE SIX
MONTHS ENDED
4/30/16
(UNAUDITED) | | | FOR THE
YEAR ENDED
10/31/15 | |
DECREASE IN NET ASSETS: | | | | | | | | |
| | |
OPERATIONS: | | | | | | | | |
Net investment income | | $ | 1,927,170 | | | $ | 4,783,262 | |
Net realized gain on investments | | | 4,345,655 | | | | 21,255,846 | |
Net change in unrealized appreciation (depreciation) on investments | | | (1,232,577 | ) | | | (23,865,543 | ) |
| | | | | | | | |
Net increase from operations | | | 5,040,248 | | | | 2,173,565 | |
| | | | | | | | |
| | |
DISTRIBUTIONS TO SHAREHOLDERS (Note 8): | | | | | | | | |
| | |
From net investment income (Class S) | | | (214,101 | ) | | | (445,287 | ) |
From net investment income (Class I) | | | (1,784,343 | ) | | | (4,361,188 | ) |
From net realized gain on investments (Class S) | | | (2,478,979 | ) | | | (940,919 | ) |
From net realized gain on investments (Class I) | | | (18,818,161 | ) | | | (9,412,072 | ) |
| | | | | | | | |
| | |
Total distributions to shareholders | | | (23,295,584 | ) | | | (15,159,466 | ) |
| | | | | | | | |
| | |
CAPITAL STOCK ISSUED AND REPURCHASED: | | | | | | | | |
| | |
Net increase (decrease) from capital share transactions (Note 5) | | | 6,449,833 | | | | (15,596,999 | ) |
| | | | | | | | |
| | |
Net decrease in net assets | | | (11,805,503 | ) | | | (28,582,900 | ) |
| | |
NET ASSETS: | | | | | | | | |
| | |
Beginning of period | | | 176,469,553 | | | | 205,052,453 | |
| | | | | | | | |
| | |
End of period (including undistributed net investment income of $499,180 and $570,453, respectively) | | $ | 164,664,050 | | | $ | 176,469,553 | |
| | | | | | | | |
The accompanying notes are an integral part of the financial statements.
10
Disciplined Value Series
Financial Highlights - Class S
| | | | | | | | | | | | | | | | | | | | |
| | | FOR THE SIX MONTHS ENDED 4/30/16
(UNAUDITED) | | | FOR THE YEARS ENDED | | | FOR THE PERIOD 3/1/121 TO 10/31/12 | |
| | | | 10/31/15 | | | 10/31/14 | | | 10/31/13 | | |
Per share data (for a share outstanding throughout each period): | | | | | | | | | | | | | | | | | | | | |
Net asset value - Beginning of period | | $ | 11.64 | | | $ | 12.75 | | | $ | 11.88 | | | $ | 10.14 | | | $ | 10.00 | |
| | | | | | | | | | | | | | | | | | | | |
Income from investment operations: | | | | | | | | | | | | | | | | | | | | |
Net investment income2 | | | 0.10 | | | | 0.26 | | | | 0.26 | | | | 0.26 | | | | 0.12 | |
Net realized and unrealized gain (loss) on investments | | | 0.18 | | | | (0.21 | ) | | | 1.25 | | | | 1.89 | | | | 0.23 | |
| | | | | | | | | | | | | | | | | | | | |
| | | | | |
Total from investment operations | | | 0.28 | | | | 0.05 | | | | 1.51 | | | | 2.15 | | | | 0.35 | |
| | | | | | | | | | | | | | | | | | | | |
| | | | | |
Less distributions to shareholders: | | | | | | | | | | | | | | | | | | | | |
From net investment income | | | (0.16 | ) | | | (0.36 | ) | | | (0.34 | ) | | | (0.35 | ) | | | (0.21 | ) |
From net realized gain on investments | | | (1.91 | ) | | | (0.80 | ) | | | (0.30 | ) | | | (0.06 | ) | | | — | |
| | | | | | | | | | | | | | | | | | | | |
| | | | | |
Total distributions to shareholders | | | (2.07 | ) | | | (1.16 | ) | | | (0.64 | ) | | | (0.41 | ) | | | (0.21 | ) |
| | | | | | | | | | | | | | | | | | | | |
| | | | | |
Net asset value - End of period | | $ | 9.85 | | | $ | 11.64 | | | $ | 12.75 | | | $ | 11.88 | | | $ | 10.14 | |
| | | | | | | | | | | | | | | | | | | | |
| | | | | |
Net assets - End of period (000’s omitted) | | $ | 12,845 | | | $ | 15,471 | | | $ | 13,716 | | | $ | 10,667 | | | $ | 5,130 | |
| | | | | | | | | | | | | | | | | | | | |
Total return3 | | | 3.11 | % | | | 0.63 | % | | | 13.12 | % | | | 21.70 | % | | | 3.59 | % |
Ratios (to average net assets)/Supplemental Data: | | | | | | | | | | | | | | | | | | | | |
Expenses | | | 0.81 | %4 | | | 0.79 | % | | | 0.79 | % | | | 0.81 | % | | | 0.86 | %4 |
Net investment income | | | 2.01 | %4 | | | 2.14 | % | | | 2.11 | % | | | 2.31 | % | | | 1.76 | %4 |
Portfolio turnover | | | 22 | % | | | 49 | % | | | 23 | % | | | 19 | % | | | 16 | % |
1Commencement of operations.
2Calculated based on average shares outstanding during the periods.
3Represents aggregate total return for the periods indicated, and assumes reinvestment of all distributions. Periods less than one year are not annualized.
4Annualized.
The accompanying notes are an integral part of the financial statements.
11
Disciplined Value Series
Financial Highlights - Class I*
| | | | | | | | | | | | | | | | | | | | | | | | |
| | | FOR THE SIX
MONTHS ENDED
4/30/16 | | | FOR THE YEARS ENDED | |
| | (UNAUDITED) | | | 10/31/15 | | | 10/31/14 | | | 10/31/13 | | | 10/31/12 | | | 10/31/11 | |
Per share data (for a share outstanding throughout each period): | | | | | | | | | | | | | | | | | | | | | | | | |
Net asset value - Beginning of period | | $ | 15.69 | | | $ | 16.76 | | | $ | 15.41 | | | $ | 13.03 | | | $ | 11.96 | | | $ | 12.41 | |
| | | | | | | | | | | | | | | | | | | | | | | | |
Income from investment operations: | | | | | | | | | | | | | | | | | | | | | | | | |
Net investment income1 | | | 0.16 | | | | 0.39 | | | | 0.38 | | | | 0.37 | | | | 0.34 | | | | 0.27 | |
Net realized and unrealized gain (loss) on investments | | | 0.27 | | | | (0.27 | ) | | | 1.64 | | | | 2.45 | | | | 1.05 | | | | 0.88 | |
| | | | | | | | | | | | | | | | | | | | | | | | |
Total from investment operations | | | 0.43 | | | | 0.12 | | | | 2.02 | | | | 2.82 | | | | 1.39 | | | | 1.15 | |
| | | | | | | | | | | | | | | | | | | | | | | | |
Less distributions to shareholders: | | | | | | | | | | | | | | | | | | | | | | | | |
From net investment income | | | (0.18 | ) | | | (0.39 | ) | | | (0.37 | ) | | | (0.38 | ) | | | (0.30 | ) | | | (0.30 | ) |
From net realized gain on investments | | | (1.91 | ) | | | (0.80 | ) | | | (0.30 | ) | | | (0.06 | ) | | | (0.02 | ) | | | (1.30 | ) |
| | | | | | | | | | | | | | | | | | | | | | | | |
Total distributions to shareholders | | | (2.09 | ) | | | (1.19 | ) | | | (0.67 | ) | | | (0.44 | ) | | | (0.32 | ) | | | (1.60 | ) |
| | | | | | | | | | | | | | | | | | | | | | | | |
Net asset value - End of period | | $ | 14.03 | | | $ | 15.69 | | | $ | 16.76 | | | $ | 15.41 | | | $ | 13.03 | | | $ | 11.96 | |
| | | | | | | | | | | | | | | | | | | | | | | | |
Net assets - End of period (000’s omitted) | | $ | 151,819 | | | $ | 160,999 | | | $ | 191,337 | | | $ | 158,989 | | | $ | 128,760 | | | $ | 79,028 | |
| | | | | | | | | | | | | | | | | | | | | | | | |
Total return2 | | | 3.25 | % | | | 0.91 | % | | | 13.44 | % | | | 22.02 | % | | | 11.77 | % | | | 10.17 | % |
Ratios (to average net assets)/Supplemental Data: | | | | | | | | | | | | | | | | | | | | | | | | |
Expenses** | | | 0.56 | %3 | | | 0.54 | % | | | 0.54 | % | | | 0.56 | % | | | 0.59 | % | | | 0.60 | % |
Net investment income | | | 2.27 | %3 | | | 2.44 | % | | | 2.38 | % | | | 2.63 | % | | | 2.69 | % | | | 2.41 | % |
Portfolio turnover | | | 22 | % | | | 49 | % | | | 23 | % | | | 19 | % | | | 16 | % | | | 8 | % |
|
| *Effective March 1, 2012, the shares of the Series have been designated as Class I. | |
| **The investment advisor did not impose all or a portion of its management and/or other fees, and in some periods may have paid a portion of the Series’ expenses. If these expenses had been incurred by the Class, the expense ratio (to average net assets) would have increased by the following amounts: | |
| | | | | | |
| | | N/A | | | | N/A | | | | N/A | | | | N/A | | | | N/A | | | | 0.45 | % |
1Calculated based on average shares outstanding during the periods.
2Represents aggregate total return for the periods indicated, and assumes reinvestment of all distributions. Total return would have been lower had certain expenses not been waived during certain periods. Periods less than one year are not annualized.
3Annualized.
The accompanying notes are an integral part of the financial statements.
12
Disciplined Value Series
Notes to Financial Statements
(unaudited)
Disciplined Value Series (the “Series”) is a no-load diversified series of Manning & Napier Fund, Inc. (the “Fund”). The Fund is organized in Maryland and is registered under the Investment Company Act of 1940, as amended, as an open-end management investment company.
The Series’ investment objective is to provide competitive returns consistent with the broad equity market while providing a level of capital protection during market downturns.
The Fund’s Advisor is Manning & Napier Advisors, LLC (the “Advisor”). Shares of the Series are offered to investors, clients and employees of the Advisor and its affiliates. The total authorized capital stock of the Fund consists of 15 billion shares of common stock each having a par value of $0.01. As of April 30, 2016, 10.5 billion shares have been designated in total among 40 series, of which 100 million have been designated as Disciplined Value Series Class I common stock and 100 million have been designated as Disciplined Value Series Class S common stock.
| 2. | Significant Accounting Policies |
The following is a summary of significant accounting policies followed by the Series. The Series is an investment company and, accordingly, follows the investment company accounting and reporting guidance of the Financial Accounting Standards Board Accounting Standards Codification Topic 946 - Investment Companies, which is part of accounting principles generally accepted in the United States of America (“GAAP”).
Security Valuation
Portfolio securities, including domestic equities, foreign equities, warrants and options, listed on an exchange other than the NASDAQ Stock Market are valued at the latest quoted sales price of the exchange on which the security is primarily traded. Securities not traded on valuation date or securities not listed on an exchange are valued at the latest quoted bid price provided by the Fund’s pricing service. Securities listed on the NASDAQ Stock Market are valued in accordance with the NASDAQ Official Closing Price.
Short-term investments that mature in sixty days or less may be valued at amortized cost, which approximates fair value. Investments in open-end investment companies are valued at their net asset value per share on valuation date.
Volume and level of activity in established markets for an asset or liability are evaluated to determine whether recent transactions and quoted prices are determinative of fair value. Where there have been significant decreases in volume and level of activity, further analysis and adjustment may be necessary to estimate fair value. The Series measures fair value in these instances by the use of inputs and valuation techniques which may be based upon current market prices of securities that are comparable in coupon, rating, maturity and industry and/or expectation of future cash flows. As a result of trading in relatively thin markets and/or markets that experience significant volatility, the prices used by the Series to value these securities may differ from the value that would be realized if these securities were sold, and the differences could be material.
Securities for which representative valuations or prices are not available from the Series’ pricing service may be valued at fair value as determined in good faith by the Advisor under procedures approved by and under the general supervision and responsibility of the Fund’s Board of Directors (the “Board”). Due to the inherent uncertainty of valuations of such securities, the fair value may differ significantly from the values that would have been used had a ready market for such securities existed. If trading or events occurring after the close of the principal market in which securities are traded are expected to materially affect the value of those securities, then they may be valued at their fair value, taking this trading or these events into account.
Various inputs are used in determining the value of the Series’ assets or liabilities carried at fair value. These inputs are summarized in three broad levels. Level 1 includes quoted prices in active markets for identical assets and liabilities. Level 2 includes other significant observable inputs (including quoted prices for similar securities, interest rates, prepayment speeds, credit risk, etc.). Level 3 includes significant unobservable inputs (including the Series’ own assumptions in determining the fair value of investments). A financial instrument’s level within the fair value hierarchy is based on the lowest level of any input both
13
Disciplined Value Series
Notes to Financial Statements (continued)
(unaudited)
| 2. | Significant Accounting Policies (continued) |
Security Valuation (continued)
individually and in aggregate that is significant to the fair value measurement. The inputs or methodology used for valuing securities are not necessarily an indication of the risk associated with investing in those securities.
The following is a summary of the valuation levels used for major security types as of April 30, 2016 in valuing the Series’ assets or liabilities carried at fair value:
| | | | | | | | | | | | | | | | |
| DESCRIPTION | | TOTAL | | | LEVEL 1 | | | LEVEL 2 | | | LEVEL 3 | |
Assets: | | | | | | | | | | | | | | | | |
Equity securities: | | | | | | | | | | | | | | | | |
Consumer Discretionary | | $ | 15,647,662 | | | $ | 15,647,662 | | | $ | — | | | $ | — | |
Consumer Staples | | | 28,369,865 | | | | 28,369,865 | | | | — | | | | — | |
Energy | | | 6,097,634 | | | | 6,097,634 | | | | — | | | | — | |
Financials | | | 15,210,436 | | | | 15,210,436 | | | | — | | | | — | |
Health Care | | | 26,881,725 | | | | 26,881,725 | | | | — | | | | — | |
Industrials | | | 31,321,871 | | | | 31,321,871 | | | | — | | | | — | |
Information Technology | | | 28,506,140 | | | | 28,506,140 | | | | — | | | | — | |
Materials | | | 6,474,857 | | | | 6,474,857 | | | | — | | | | — | |
Telecommunication Services | | | 4,423,777 | | | | 4,423,777 | | | | — | | | | — | |
Mutual Fund | | | 1,859,938 | | | | 1,859,938 | | | | — | | | | — | |
| | | | | | | | | | | | | | | | |
Total assets | | $ | 164,793,905 | | | $ | 164,793,905 | | | $ | — | | | $ | — | |
| | | | | | | | | | | | | | | | |
There were no Level 2 or Level 3 securities held by the Series as of October 31, 2015 or April 30, 2016.
The Fund’s policy is to recognize transfers in and transfers out of the valuation levels as of the beginning of the reporting period. There were no transfers between Level 1 and Level 2 during the six months ended April 30, 2016.
Security Transactions, Investment Income and Expenses
Security transactions are accounted for on trade date. Dividend income is recorded on the ex-dividend date, except that if the ex-dividend date has passed, certain dividends from foreign securities are recorded as soon as the Series is informed of the ex-dividend date. Non-cash dividends, if any, are recorded at the fair value of the securities received. Interest income, including amortization of premium and accretion of discounts using the effective interest method, is earned from settlement date and accrued daily.
Expenses are recorded on an accrual basis. Most expenses of the Fund can be attributed to a specific series. Expenses which cannot be directly attributed are apportioned among the series in the Fund in such a manner as deemed equitable by the Fund’s Board, taking into consideration, among other things, the nature and type of expense. Income, expenses (other than class specific expenses), and realized and unrealized gains and losses are prorated among the classes based on the relative net assets of each class. Class specific expenses are directly charged to that class.
The Series uses the identified cost method for determining realized gain or loss on investments for both financial statement and federal income tax reporting purposes.
Foreign Currency Translation
The books and records of the Series are maintained in U.S. dollars. Foreign currencies, investments and other assets and liabilities are translated into U.S. dollars at the current exchange rates. Purchases and sales of investment securities and income and expenses are translated on the respective dates of such transactions. The Series does not isolate realized and unrealized gains and losses attributable to changes in the exchange rates from gains and losses that arise from changes in the fair value of investments. Such fluctuations are included with net realized and unrealized gain or loss on investments. Net realized foreign currency gains and losses represent foreign currency gains and losses between trade date and settlement date on securities transactions, gains and losses on disposition of foreign currencies and the difference between the amount of income and foreign withholding taxes recorded on the books of the Series and the amounts actually received or paid.
14
Disciplined Value Series
Notes to Financial Statements (continued)
(unaudited)
| 2. | Significant Accounting Policies (continued) |
Federal Taxes
The Series’ policy is to comply with the provisions of the Internal Revenue Code applicable to regulated investment companies. The Series is not subject to federal income or excise tax to the extent that the Series distributes to shareholders each year its taxable income, including any net realized gains on investments, in accordance with requirements of the Internal Revenue Code. Accordingly, no provision for federal income tax or excise tax has been made in the financial statements.
Management evaluates its tax positions to determine if the tax positions taken meet the minimum recognition threshold in connection with accounting for uncertainties in income tax positions taken or expected to be taken for the purposes of measuring and recognizing tax liabilities in the financial statements. Recognition of tax benefits of an uncertain tax position is required only when the position is “more likely than not” to be sustained assuming examination by taxing authorities. At April 30, 2016, the Series has recorded no liability for net unrecognized tax benefits relating to uncertain income tax positions taken or expected to be taken in future tax returns.
The Series files income tax returns in the U.S. federal jurisdiction, various states and foreign jurisdictions, as required. No income tax returns are currently under investigation. The statute of limitations on the Series’ tax returns remains open for the years ended October 31, 2012 through October 31, 2015. The Series is not aware of any tax positions for which it is reasonably possible that the total amounts of unrecognized tax benefits will significantly change in the next twelve months.
Foreign Taxes
Based on the Series’ understanding of the tax rules and rates related to income, gains and currency purchase/repatriation transactions for foreign jurisdictions in which it invests, the Series will provide for foreign taxes, and where appropriate, deferred foreign tax.
Distributions of Income and Gains
Distributions to shareholders of net investment income are made quarterly. Distributions of net realized gains are made annually. An additional distribution may be necessary to avoid taxation of the Series. Distributions are recorded on the ex-dividend date.
Indemnifications
The Fund’s organizational documents provide former and current directors and officers with a limited indemnification against liabilities arising in connection with the performance of their duties to the Fund. In the normal course of business, the Fund may also enter into contracts that provide general indemnifications. The Fund’s maximum exposure under these arrangements is unknown as this would be dependent on future claims that may be made against the Fund. The risk of material loss from such claims is considered remote.
Other
The preparation of financial statements in conformity with GAAP requires management to make estimates and assumptions that affect the reported amounts of assets and liabilities and the disclosure of contingent assets and liabilities at the date of the financial statements and the reported amounts of income and expenses during the reporting period. Actual results could differ from those estimates.
| 3. | Transactions with Affiliates |
The Fund has an Investment Advisory Agreement (the “Agreement”) with the Advisor, for which the Series pays a fee, computed daily and payable monthly, at an annual rate of 0.45% of the Series’ average daily net assets.
Under the Agreement, personnel of the Advisor provide the Series with advice and assistance in the choice of investments and the execution of securities transactions, and otherwise maintain the Series’ organization. The Advisor also provides the Fund with necessary office space and fund administration and support services. The salaries of all officers of the Fund (except a percentage of the Fund’s Chief Compliance Officer’s salary, which is paid by the Fund), and of all Directors who are “affiliated persons” of the Fund, or of the Advisor, and all personnel of the Fund, or of the Advisor, performing services relating to research, statistical and investment activities, are paid by the Advisor. Each “non-affiliated” Director receives an annual stipend, which is allocated among all the active series of the Fund. In addition, these Directors also receive a fee per Board meeting
15
Disciplined Value Series
Notes to Financial Statements (continued)
(unaudited)
| 3. | Transactions with Affiliates (continued) |
attended plus a fee for each committee meeting attended and are reimbursed for travel and other out-of-pocket expenses incurred by them in connection with attending such meetings. The Fund also has an Audit Committee Chair, who receives an additional annual stipend for this role.
The Class S shares of the Series are subject to a shareholder services fee in accordance with a shareholder services plan adopted by the Fund’s Board. The shareholder services fee is intended to compensate financial intermediaries, including affiliates of the Fund, in connection with the provision of direct client service, personal services, maintenance of shareholder accounts and reporting services. For these services, the Class S shares of the Series pay a fee, computed daily and payable monthly, at an annual rate of 0.25% of the average daily net assets of Class S. The Fund has a Shareholder Services Agreement with the Advisor, for which the Advisor receives the shareholder services fee as stated above.
The Advisor has contractually agreed, until at least February 28, 2017, to waive its management fee and, if necessary, pay other operating expenses of the Series in order to maintain total direct annual fund operating expenses for the Series, exclusive of shareholder service fees, at no more than 0.60% of average daily net assets each year. For the six months ended April 30, 2016, the Advisor did not waive fees or reimburse expenses for the Series. The Advisor is not eligible to recoup any expenses that have been waived or reimbursed in prior years.
Manning & Napier Investor Services, Inc., a registered broker-dealer affiliate of the Advisor, acts as distributor for the Fund’s shares. The services of Manning & Napier Investor Services, Inc. are provided at no additional cost to the Series.
Pursuant to a master services agreement dated November 1, 2014, the Fund pays the Advisor an annual fee related to fund accounting and administration of 0.0085% on the first $25 billion of average daily net assets (excluding Target Series and Strategic Income Series); 0.0075% on the next $15 billion of average daily net assets (excluding Target Series and Strategic Income Series); and 0.0065% of the average daily net assets in excess of $40 billion (excluding Target Series and Strategic Income Series); plus a base fee of $30,400 per series. Transfer agent fees are charged to the Fund on a per account basis. Additionally, certain transaction and out-of-pocket expenses, including charges for reporting relating to the Fund’s compliance program, are charged. The Advisor has agreements with BNY Mellon Investment Servicing (U.S.) Inc. (“BNY”) under which BNY serves as sub-accountant services agent and sub-transfer agent.
Expenses not directly attributable to a series are allocated based on each series’ relative net assets or number of accounts, depending on the expense.
| 4. | Purchases and Sales of Securities |
For the six months ended April 30, 2016, purchases and sales of securities, other than U.S. Government securities and short-term securities, were $35,684,908 and $50,582,524, respectively. There were no purchases or sales of U.S. Government securities.
| 5. | Capital Stock Transactions |
Transactions in Class S and I shares of Disciplined Value Series were:
| | | | | | | | | | | | | | | | |
| CLASS S | | FOR THE SIX MONTHS ENDED 4/30/16 | | | FOR THE YEAR ENDED 10/31/15 | |
| | | SHARES | | | AMOUNT | | | SHARES | | | AMOUNT | |
Sold | | | 183,920 | | | $ | 1,836,447 | | | | 502,112 | | | $ | 6,090,178 | |
Reinvested | | | 282,259 | | | | 2,687,964 | | | | 118,130 | | | | 1,368,047 | |
Repurchased | | | (491,136 | ) | | | (4,776,748 | ) | | | (367,006 | ) | | | (4,408,509 | ) |
| | | | | | | | | | | | | | | | |
Total | | | (24,957 | ) | | $ | (252,337 | ) | | | 253,236 | | | $ | 3,049,716 | |
| | | | | | | | | | | | | | | | |
16
Disciplined Value Series
Notes to Financial Statements (continued)
(unaudited)
| 5. | Capital Stock Transactions (continued) |
| | | | | | | | | | | | | | | | |
| CLASS I | | FOR THE SIX MONTHS ENDED 4/30/16 | | | FOR THE YEAR ENDED 10/31/15 | |
| | | SHARES | | | AMOUNT | | | SHARES | | | AMOUNT | |
Sold | | | 990,424 | | | $ | 13,516,246 | | | | 2,135,524 | | | $ | 34,619,779 | |
Reinvested | | | 731,879 | | | | 9,899,459 | | | | 405,303 | | | | 6,294,873 | |
Repurchased | | | (1,160,408 | ) | | | (16,713,535 | ) | | | (3,694,895 | ) | | | (59,561,367 | ) |
| | | | | | | | | | | | | | | | |
Total | | | 561,895 | | | $ | 6,702,170 | | | | (1,154,068 | ) | | $ | (18,646,715 | ) |
| | | | | | | | | | | | | | | | |
At April 30, 2016, one shareholder account owned 4,059,430 shares of the Series (34.6% of shares outstanding) valued at $56,953,804. In addition, the retirement plan of the Advisor and its affiliates owned 261,464 shares of the Series (2.2% of shares outstanding) valued at $3,668,346. Investment activities of these shareholders may have a material effect on the Series.
The Series may trade in instruments including written and purchased options, forward foreign currency exchange contracts and futures contracts and other derivatives in the normal course of investing activities to assist in managing exposure to various market risks. The Series may be subject to various elements of risk which may involve, to a varying degree, elements of risk in excess of the amounts recognized for financial statement purposes. These risks include: the risk that changes in the value of a derivative may not correlate perfectly with the underlying asset, rate or index; counterparty credit risk related to over the counter derivative counterparties’ failure to perform under contract terms; liquidity risk related to the lack of a liquid market for these contracts allowing the fund to close out its position(s); and documentation risk relating to disagreement over contract terms. No such investments were held by the Series as of April 30, 2016.
Investing in securities of foreign companies and foreign governments involves special risks and considerations not typically associated with investing in securities of domestic companies and the U.S. Government. These risks include revaluation of currencies and future adverse political and economic developments. Moreover, securities of foreign companies and foreign governments and their markets may be less liquid and their prices more volatile than those of comparable domestic companies and the U.S. Government.
| 8. | Federal Income Tax Information |
The amount and characterization of certain income and capital gains to be distributed are determined in accordance with federal income tax regulations, which may differ from GAAP. The Series may periodically make reclassifications among its capital accounts to reflect income and gains available for distribution (or available capital loss carryovers) under income tax regulations, without impacting the Series’ net asset value. Any such reclassifications are not reflected in the financial highlights.
The final determination of the tax character of current year distributions will be made at the conclusion of the fiscal year. The tax character of distributions paid for the year ended October 31, 2015 were as follows:
| | | | |
Ordinary income | | $ | 5,052,392 | |
Long-term capital gains | | | 10,107,074 | |
At April 30, 2016, the identified cost of investments for federal income tax purposes, the resulting gross unrealized appreciation and depreciation, and the net unrealized appreciation were as follows:
| | | | |
Cost for federal income tax purposes | | $ | 150,088,889 | |
Unrealized appreciation | | | 20,604,071 | |
Unrealized depreciation | | | (5,899,055 | ) |
| | | | |
Net unrealized appreciation | | $ | 14,705,016 | |
| | | | |
17
Disciplined Value Series
Renewal of Investment Advisory Agreement
(unaudited)
At the Manning & Napier Fund, Inc. (the “Fund”) Board of Directors’ (the “Board”) meeting, held on November 17, 2015, the Investment Advisory Agreement (the “Agreement”) between the Fund and Manning & Napier Advisors, LLC (the “Advisor”) was considered by the Board for renewal. In connection with the decision whether to renew the Agreement, a variety of material was prepared for and considered by the Board.
Representatives of the Advisor attended the meeting and presented additional oral and written information to the Board to assist the Board in its considerations. The discussion immediately below outlines the materials and information presented to the Board in connection with the Board’s 2015 Annual consideration of the Agreement and the conclusions made by the Directors when determining to continue the Agreement.
| | • | | The Board considered the services provided by the Advisor under the Agreement including, among others: deciding what securities to purchase and sell for each Series; arranging for the purchase and sale of such securities by placing orders with broker-dealers; administering the affairs of the Fund (including the books and records of the Fund not maintained by third party service providers such as the custodian or sub-transfer agent); arranging for the insurance coverage for the Fund; and supervising the preparation of tax returns, SEC filings (including registration statements) and reports to shareholders for the Fund. The Board also considered the nature and quality of such services provided under the Agreement in light of the Advisor’s services provided to the Fund for 29 years. The Board discussed the quality of these services with representatives from the Advisor and concluded that the Advisor was performing its services to the Fund required under the Agreement in a reasonable manner. |
| | • | | The Board considered the performance of each Series since its inception, as well as performance over multiple time periods. Performance for one or more of the following time periods was considered as applicable to the Series’ inception date: inception, three year, five year, ten year, and current market cycle. A market cycle includes periods of both rising and falling markets. Returns for established benchmark indices for each Series were provided. In addition, the Board considered a number of other factors relevant to performance at the meeting (and considers on a quarterly basis) including: a peer group performance analysis consisting of Morningstar universes of mutual funds with similar investment objectives, investment performance of core products, product offerings, performance on an aggregate basis vs. performance over reasonable time periods and the Advisor’s investment process. The Directors acknowledged the challenging performance and discussed the investment process of the Advisor. The Directors confirmed that qualitative factors such as the Advisor’s investment process, including recent enhancements, were an important subset to be considered as part of their consideration of performance. The Board discussed the performance with representatives from the Advisor and concluded that the investment performance of each of the Fund’s Series was reasonable based on the Series’ actual performance and comparative performance, especially for those series with performance over the current market cycle. |
| | • | | The Board considered the costs of the Advisor’s services and the profits of the Advisor as they relate to the Advisor’s services to the Fund under the Agreement. In reviewing the Advisor’s costs and profits, the Board discussed the Advisor’s revenues generated from the Fund (on both an actual and adjusted basis) and its expenses associated with providing the services under the Agreement. In addition, the Board reviewed the Advisor’s expenses associated with Fund activities outside of the Agreement (such as expense reimbursements pursuant to expense caps and payments made by the Advisor to third party platforms on which shares of the Fund are available for purchase). It was noted by representatives of the Advisor that 22 of the 36 active Series of the Fund are currently experiencing expenses above the capped expense ratios, and thus the Advisor is incurring those expenses over the cap. After discussing the above costs and profits, the Board concluded that the Advisor’s profitability relating to its services provided under the Agreement was reasonable. |
| | • | | The Board considered the fees and expenses of the various Series of the Fund. The Advisor presented the advisory fees and total expenses for each Series, including the advisory fee adjusted for any expense waivers or reimbursements (either contractual or voluntary) paid by the Advisor. The advisory fees and expense ratios of each Series were compared to an average (on both a mean and median basis) of similar funds as disclosed on the Morningstar database. Representatives of the Advisor discussed with the Board the levels of its advisory fee for each Series of the Fund and as compared to the median and mean advisory fees for similar funds as listed on Morningstar. Expense ratios for every Series, except the Tax Managed Series, Equity Income Class S, High Yield Bond Class S, Pro-Blend Series Classes C and R, and Target Series’ Classes R and K, are lower than, or substantially similar to the Morningstar mean and median reported total expense ratio. |
18
Disciplined Value Series
Renewal of Investment Advisory Agreement
(unaudited)
| | The higher than mean and median total expense ratios for Classes C and R reflect higher distribution, marketing and shareholder service fees payable to broker-dealers through a 100bp 12b-1 fee for Class C and a 50bp 12b-1 fee for Class R. Based on their review of the information provided, the Board concluded that the fees and expenses of each Series of the Fund were reasonable on a comparative basis. |
| | • | | The Board also considered the other benefits the Advisor derives from its relationship with the Fund. Such other benefits include certain research services provided by soft dollars. The Board reviewed the broker-dealers who provided research to the Advisor and the products and services paid for, in whole or in part, using soft dollar commissions. Given the level of soft dollar transactions involving the Fund, the Board concluded that these additional benefits to the Advisor were reasonable. |
| | • | | In addition to the factors described above, the Board considered the Advisor’s personnel, investment strategies, policies and procedures relating to compliance with personal securities transactions, reputation, expertise and resources in domestic and foreign financial markets. The Board concluded that these factors support the conclusion that the Advisor performs its services in a reasonable manner. |
| | • | | The Board then considered economies of scale and concluded that the current fee schedule to the advisory agreement remained reasonable given the multiple uses of the Fund (for the Advisor’s discretionary investment account clients in addition to direct investors), the current profitability of the Advisor’s services to the Fund under the Agreement, the number of newly established series of the Fund and the overall size of the Fund complex. |
Based on the Board’s deliberations and their evaluation of the information described above, the Board, including a majority of Directors that are not “interested persons” as defined in the Investment Company Act of 1940, concluded that the compensation under the Agreement was fair and reasonable in light of the services and expenses and such other matters as the Directors considered to be relevant in the exercise of their reasonable judgment. Accordingly, the Board approved the renewal of the Agreement. In the course of their deliberations, the Directors did not identify any particular information that was all important or controlling.
19
{This page intentionally left blank}
20
{This page intentionally left blank}
21
Disciplined Value Series
Literature Requests
(unaudited)
Proxy Voting Policies and Procedures
A description of the policies and procedures that the Fund uses to determine how to vote proxies relating to portfolio securities is available, without charge, upon request:
| | | | |
| By phone | | 1-800-466-3863 | | |
| On the Securities and Exchange | | | | |
| Commission’s (SEC) web site | | http://www.sec.gov | | |
Proxy Voting Record
Information regarding how the Fund voted proxies relating to portfolio securities during the most recent 12-month period ended June 30th is available, without charge, upon request:
| | | | |
| By phone | | 1-800-466-3863 | | |
| On the SEC’s web site | | http://www.sec.gov | | |
Quarterly Portfolio Holdings
The Series’ complete schedule of portfolio holdings for the 1st and 3rd quarters of each fiscal year are provided on Form N-Q, and are available, without charge, upon request:
| | | | |
| By phone | | 1-800-466-3863 | | |
| On the SEC’s web site | | http://www.sec.gov | | |
The Series’ Form N-Q may be reviewed and copied at the SEC’s Public Reference Room in Washington, D.C. Information on the operation of the Public Reference Room may be obtained by calling 1-800-SEC-0330.
Prospectus and Statement of Additional Information (SAI)
For more information about any of the Manning & Napier Fund, Inc. Series, you may obtain a prospectus and SAI at www.manning-napier.com or by calling (800) 466-3863. Before investing, carefully consider the objectives, risks, charges and expenses of the investment and read the prospectus carefully as it contains this and other information about the investment company. In addition, this information can be found on the SEC’s web site, http://www.sec.gov.
Additional information available at www.manning-napier.com
1. Fund Holdings - Month-End
2. Fund Holdings - Quarter-End
3. Shareholder Report - Annual
4. Shareholder Report - Semi-Annual
The Fund also offers electronic notification or “e-delivery” when certain documents are available on-line to be downloaded or reviewed. Direct shareholders can elect to receive electronic notification when shareholder reports, prospectus updates, and/or statements are available. If you do not currently have on-line access to your account, you can establish access by going to www.manning-napier.com, click on “Login” in the top corner of the page, and follow the prompts to self-enroll. Once enrolled, you can set your electronic notification preferences by clicking on the Account Options tab located within the green toolbar and then select E-Delivery Option. Should you have any questions on either how to establish on-line access or how to update your account settings, please contact Investor Services at 1-800-466-3863.
The Manning & Napier Fund, Inc. is managed by Manning & Napier Advisors, LLC. Manning & Napier Investor Services, Inc., an affiliate of Manning & Napier Advisors, LLC, is the distributor of the Fund shares.
MNDIV-04/16-SAR

Overseas Series
Shareholder Expense Example
(unaudited)
As a shareholder of the Series, you incur ongoing costs, including management fees, shareholder service fees and other Series expenses. This example is intended to help you understand your ongoing costs (in dollars) of investing in the Series and to compare these costs with the ongoing costs of investing in other mutual funds.
The example is based on an investment of $1,000 invested at the beginning of the period and held for the entire period (November 1, 2015 to April 30, 2016).
Actual Expenses
The first line of the table below provides information about actual account values and actual expenses. You may use the information in this line, together with the amount you invested, to estimate the expenses that you paid over the period. Simply divide your account value by $1,000 (for example, an $8,600 account value divided by $1,000 = 8.6), then multiply the result by the number in the first line under the heading entitled “Expenses Paid During Period” to estimate the expenses you paid on your account during this period.
Hypothetical Example for Comparison Purposes
The second line of the table below provides information about hypothetical account values and hypothetical expenses based on the Series’ actual expense ratio and an assumed rate of return of 5% per year before expenses, which is not the Series’ actual return. The hypothetical account values and expenses may not be used to estimate the actual ending account balance or expenses you paid during the period. You may use this information to compare the ongoing costs of investing in the Series and other funds. To do so, compare this 5% hypothetical example with the 5% hypothetical examples that appear in the shareholder reports of the other funds.
Please note that the expenses shown in the table are meant to highlight your ongoing costs only and do not reflect any transaction costs, such as sales charges (loads), redemptions fees, or exchange fees that you may incur in other mutual funds. Therefore, the second line of the table is useful in comparing ongoing costs only, and will not help you determine the relative total costs of owning different funds.
| | | | | | |
| | | BEGINNING ACCOUNT VALUE
11/1/15 | | ENDING
ACCOUNT VALUE
4/30/16 | | EXPENSES PAID DURING PERIOD* 11/1/15-4/30/16 |
Actual | | $1,000.00 | | $1,004.70 | | $3.74 |
Hypothetical | | | | | | |
| (5% return before expenses) | | $1,000.00 | | $1,021.13 | | $3.77 |
*Expenses are equal to the Series’ annualized expense ratio (for the six-month period) of 0.75%, multiplied by the average account value over the period, multiplied by 182/366 (to reflect the one-half year period). The Series’ total return would have been lower had certain expenses not been waived during the period.
1
Overseas Series
Portfolio Composition as of April 30, 2016
(unaudited)
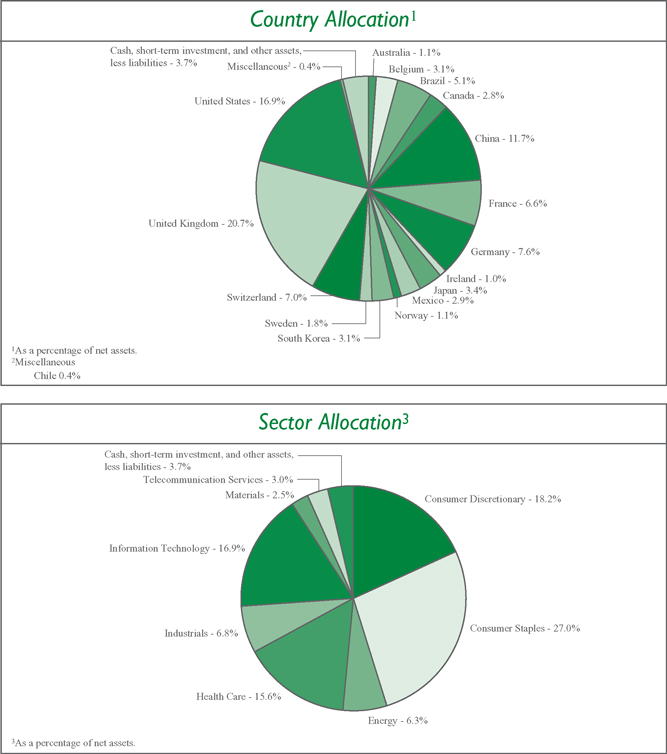
2
Overseas Series
Investment Portfolio - April 30, 2016
(unaudited)
| | | | | | | | |
| | | | | | VALUE | |
| | | SHARES | | | (NOTE 2) | |
| | |
COMMON STOCKS - 96.3% | | | | | | | | |
| | |
Consumer Discretionary - 18.2% | | | | | | | | |
Diversified Consumer Services - 2.3% | | | | | | | | |
Kroton Educacional S.A. (Brazil) | | | 7,693,020 | | | $ | 28,676,170 | |
| | | | | | | | |
Hotels, Restaurants & Leisure - 3.0% | | | | | | | | |
Accor S.A. (France)1 | | | 829,690 | | | | 36,741,547 | |
| | | | | | | | |
Media - 7.7% | | | | | | | | |
ITV plc (United Kingdom)1 | | | 12,394,440 | | | | 40,855,417 | |
Liberty Global plc - Class A - ADR (United Kingdom)* | | | 1,132,230 | | | | 42,719,038 | |
Modern Times Group MTG AB - Class B (Sweden)1 | | | 335,385 | | | | 10,069,413 | |
| | | | | | | | |
| | |
| | | | | | | 93,643,868 | |
| | | | | | | | |
Specialty Retail - 2.2% | | | | | | | | |
Kingfisher plc (United Kingdom)1 | | | 5,081,089 | | | | 27,070,729 | |
| | | | | | | | |
Textiles, Apparel & Luxury Goods - 3.0% | | | | | | | | |
lululemon athletica, Inc. (United States)* | | | 551,590 | | | | 36,156,723 | |
| | | | | | | | |
| | |
Total Consumer Discretionary | | | | | | | 222,289,037 | |
| | | | | | | | |
Consumer Staples - 27.0% | | | | | | | | |
Beverages - 11.1% | | | | | | | | |
Ambev S.A. - ADR (Brazil) | | | 6,105,365 | | | | 34,128,990 | |
Anheuser-Busch InBev N.V. (Belgium)1 | | | 305,920 | | | | 37,950,758 | |
Diageo plc (United Kingdom)1 | | | 1,497,880 | | | | 40,496,968 | |
Remy Cointreau S.A. (France)1 | | | 19,633 | | | | 1,632,466 | |
SABMiller plc (United Kingdom)1 | | | 344,650 | | | | 21,108,504 | |
| | | | | | | | |
| | |
| | | | | | | 135,317,686 | |
| | | | | | | | |
Food & Staples Retailing - 1.3% | | | | | | | | |
Tesco plc (United Kingdom)*1 | | | 6,462,910 | | | | 16,248,072 | |
| | | | | | | | |
Food Products - 4.9% | | | | | | | | |
Danone S.A. (France)1 | | | 424,450 | | | | 29,738,547 | |
Nestle S.A. (Switzerland)1 | | | 401,410 | | | | 29,961,117 | |
| | | | | | | | |
| | |
| | | | | | | 59,699,664 | |
| | | | | | | | |
Personal Products - 5.2% | | | | | | | | |
Beiersdorf AG (Germany)1 | | | 137,360 | | | | 12,334,344 | |
Unilever plc - ADR (United Kingdom) | | | 1,142,360 | | | | 51,246,270 | |
| | | | | | | | |
| | |
| | | | | | | 63,580,614 | |
| | | | | | | | |
Tobacco - 4.5% | | | | | | | | |
Japan Tobacco, Inc. (Japan)1 | | | 1,020,700 | | | | 41,703,698 | |
Swedish Match AB (Sweden)1 | | | 390,970 | | | | 12,417,927 | |
| | | | | | | | |
| | |
| | | | | | | 54,121,625 | |
| | | | | | | | |
| | |
Total Consumer Staples | | | | | | | 328,967,661 | |
| | | | | | | | |
The accompanying notes are an integral part of the financial statements.
3
Overseas Series
Investment Portfolio - April 30, 2016
(unaudited)
| | | | | | | | |
| | | | | | VALUE | |
| | | SHARES | | | (NOTE 2) | |
| | |
COMMON STOCKS (continued) | | | | | | | | |
Energy - 6.3% | | | | | | | | |
Energy Equipment & Services - 3.5% | | | | | | | | |
Schlumberger Ltd. (United States) | | | 530,400 | | | $ | 42,612,336 | |
| | | | | | | | |
Oil, Gas & Consumable Fuels - 2.8% | | | | | | | | |
Cameco Corp. (Canada) | | | 2,724,370 | | | | 34,081,869 | |
| | | | | | | | |
| | |
Total Energy | | | | | | | 76,694,205 | |
| | | | | | | | |
Health Care - 15.6% | | | | | | | | |
Health Care Equipment & Supplies - 4.9% | | | | | | | | |
Medtronic plc (United States) | | | 561,130 | | | | 44,413,440 | |
Shandong Weigao Group Medical Polymer Co. Ltd. - Class H (China)1 | | | 24,337,458 | | | | 14,610,397 | |
| | | | | | | | |
| | |
| | | | | | | 59,023,837 | |
| | | | | | | | |
Health Care Providers & Services - 4.0% | | | | | | | | |
Fresenius Medical Care AG & Co. KGaA (Germany)1 | | | 565,440 | | | | 49,214,504 | |
| | | | | | | | |
Life Sciences Tools & Services - 1.9% | | | | | | | | |
QIAGEN N.V. (United States)* | | | 484,254 | | | | 10,876,345 | |
QIAGEN N.V. (United States)*1 | | | 566,386 | | | | 12,738,441 | |
| | | | | | | | |
| | |
| | | | | | | 23,614,786 | |
| | | | | | | | |
Pharmaceuticals - 4.8% | | | | | | | | |
Novartis AG - ADR (Switzerland) | | | 524,830 | | | | 39,871,335 | |
Perrigo Co. plc (United States) | | | 189,280 | | | | 18,297,698 | |
| | | | | | | | |
| | |
| | | | | | | 58,169,033 | |
| | | | | | | | |
| | |
Total Health Care | | | | | | | 190,022,160 | |
| | | | | | | | |
Industrials - 6.8% | | | | | | | | |
Aerospace & Defense - 1.0% | | | | | | | | |
Safran S.A. (France)1 | | | 178,555 | | | | 12,309,575 | |
| | | | | | | | |
Airlines - 1.0% | | | | | | | | |
Ryanair Holdings plc - ADR (Ireland) | | | 148,697 | | | | 12,037,022 | |
| | | | | | | | |
Machinery - 2.3% | | | | | | | | |
Sulzer AG (Switzerland)1 | | | 164,155 | | | | 14,984,947 | |
The Weir Group plc (United Kingdom)1 | | | 746,250 | | | | 13,108,401 | |
| | | | | | | | |
| | |
| | | | | | | 28,093,348 | |
| | | | | | | | |
| | |
Trading Companies & Distributors - 2.5% | | | | | | | | |
Brenntag AG (Germany)1 | | | 526,879 | | | | 30,948,277 | |
| | | | | | | | |
| | |
Total Industrials | | | | | | | 83,388,222 | |
| | | | | | | | |
Information Technology - 16.9% | | | | | | | | |
Internet Software & Services - 10.5% | | | | | | | | |
Alibaba Group Holding Ltd. - ADR (China)* | | | 550,550 | | | | 42,359,317 | |
Baidu, Inc. - ADR (China)* | | | 225,580 | | | | 43,830,194 | |
Tencent Holdings Ltd. - Class H (China)1 | | | 2,049,400 | | | | 41,701,838 | |
| | | | | | | | |
| | |
| | | | | | | 127,891,349 | |
| | | | | | | | |
The accompanying notes are an integral part of the financial statements.
4
Overseas Series
Investment Portfolio - April 30, 2016
(unaudited)
| | | | | | | | |
| | | | | | VALUE | |
| | | SHARES | | | (NOTE 2) | |
| | |
COMMON STOCKS (continued) | | | | | | | | |
| | |
Information Technology (continued) | | | | | | | | |
IT Services - 3.3% | | | | | | | | |
Amdocs Ltd. - ADR (United States) | | | 712,904 | | | $ | 40,307,592 | |
| | | | | | | | |
Technology Hardware, Storage & Peripherals - 3.1% | | | | | | | | |
Samsung Electronics Co. Ltd. (South Korea)1 | | | 34,620 | | | | 37,729,971 | |
| | | | | | | | |
| | |
Total Information Technology | | | | | | | 205,928,912 | |
| | | | | | | | |
Materials - 2.5% | | | | | | | | |
Chemicals - 0.3% | | | | | | | | |
Sociedad Quimica y Minera de Chile S.A. - ADR (Chile) | | | 211,442 | | | | 4,404,337 | |
| | | | | | | | |
Metals & Mining - 2.2% | | | | | | | | |
Alumina Ltd. (Australia)1 | | | 11,356,728 | | | | 12,824,188 | |
Norsk Hydro ASA (Norway)1 | | | 3,137,214 | | | | 13,649,967 | |
| | | | | | | | |
| | |
| | | | | | | 26,474,155 | |
| | | | | | | | |
| | |
Total Materials | | | | | | | 30,878,492 | |
| | | | | | | | |
Telecommunication Services - 3.0% | | | | | | | | |
Wireless Telecommunication Services - 3.0% | | | | | | | | |
America Movil S.A.B. de C.V. - Class L - ADR (Mexico) | | | 2,537,830 | | | | 35,935,673 | |
| | | | | | | | |
TOTAL COMMON STOCKS | | | | | | | | |
(Identified Cost $1,180,999,317) | | | | | | | 1,174,104,362 | |
| | | | | | | | |
| | |
SHORT-TERM INVESTMENT - 0.3% | | | | | | | | |
| | |
Dreyfus Cash Management, Inc. - Institutional Shares2, 0.29% | | | | | | | | |
(Identified Cost $4,115,859) | | | 4,115,859 | | | | 4,115,859 | |
| | | | | | | | |
| | |
TOTAL INVESTMENTS - 96.6% | | | | | | | | |
(Identified Cost $1,185,115,176) | | | | | | | 1,178,220,221 | |
OTHER ASSETS, LESS LIABILITIES - 3.4% | | | | | | | 41,318,242 | |
| | | | | | | | |
NET ASSETS - 100% | | | | | | $ | 1,219,538,463 | |
| | | | | | | | |
ADR - American Depositary Receipt
*Non-income producing security.
1A factor from a third party vendor was applied to determine the security’s fair value following the close of local trading.
2Rate shown is the current yield as of April 30, 2016.
The Series’ portfolio holds, as a percentage of net assets, greater than 10% in the following countries: United Kingdom - 20.7%; United States - 16.9%; China - 11.7.%.
The Global Industry Classification Standard (GICS) was developed by and is the exclusive property and a service mark of MSCI Inc. (MSCI) and Standard & Poor’s, a division of The McGraw-Hill Companies, Inc. (S&P), and is licensed for use by Manning & Napier when referencing GICS sectors. Neither MSCI, S&P, nor any third party involved in making or compiling the GICS or any GICS classifications makes any express or implied warranties or representations with respect to such standard or classification, nor shall any such party have any liability therefrom.
The accompanying notes are an integral part of the financial statements.
5
Overseas Series
Statement of Assets & Liabilities
April 30, 2016 (unaudited)
| | | | |
ASSETS: | | | | |
| |
Investments, at value (identified cost $1,185,115,176) (Note 2) | | $ | 1,178,220,221 | |
Foreign currency, at value (identified cost $141) | | | 141 | |
Receivable for securities sold | | | 32,935,027 | |
Foreign tax reclaims receivable | | | 5,276,753 | |
Dividends receivable | | | 5,656,900 | |
Receivable for fund shares sold | | | 74,642 | |
Prepaid expenses | | | 29,494 | |
| | | | |
| |
TOTAL ASSETS | | | 1,222,193,178 | |
| | | | |
| |
LIABILITIES: | | | | |
| |
Accrued management fees (Note 3) | | | 698,673 | |
Accrued fund accounting and administration fees (Note 3) | | | 68,543 | |
Accrued transfer agent fees (Note 3) | | | 2,554 | |
Accrued Chief Compliance Officer service fees (Note 3) | | | 381 | |
Accrued custodian fees | | | 255,091 | |
Payable for securities purchased | | | 1,398,271 | |
Payable for fund shares repurchased | | | 149,585 | |
Other payables and accrued expenses | | | 81,617 | |
| | | | |
| |
TOTAL LIABILITIES | | | 2,654,715 | |
| | | | |
| |
TOTAL NET ASSETS | | $ | 1,219,538,463 | |
| | | | |
| |
NET ASSETS CONSIST OF: | | | | |
| |
Capital stock | | $ | 579,408 | |
Additional paid-in-capital | | | 1,410,428,853 | |
Undistributed net investment income | | | 12,259,768 | |
Accumulated net realized loss on investments, foreign currency and translation of other assets and liabilities | | | (196,697,126 | ) |
Net unrealized appreciation (depreciation) on investments, foreign currency and translation of other assets and liabilities | | | (7,032,440 | ) |
| | | | |
| |
TOTAL NET ASSETS | | $ | 1,219,538,463 | |
| | | | |
| |
NET ASSET VALUE, OFFERING PRICE AND REDEMPTION PRICE PER SHARE
($1,219,538,463/57,940,815 shares) | | $ | 21.05 | |
| | | | |
The accompanying notes are an integral part of the financial statements.
6
Overseas Series
Statement of Operations
For the Six Months Ended April 30, 2016 (unaudited)
| | | | |
INVESTMENT INCOME: | | | | |
| |
Dividends (net of foreign taxes withheld, $2,083,899) | | $ | 18,859,384 | |
| | | | |
| |
EXPENSES: | | | | |
| |
Management fees (Note 3) | | | 4,715,485 | |
Fund accounting and administration fees (Note 3) | | | 97,223 | |
Directors’ fees (Note 3) | | | 38,269 | |
Transfer agent fees (Note 3) | | | 3,789 | |
Chief Compliance Officer service fees (Note 3) | | | 1,258 | |
Custodian fees | | | 188,594 | |
Miscellaneous | | | 96,284 | |
| | | | |
| |
Total Expenses | | | 5,140,902 | |
| | | | |
| |
Less reduction of expenses (Note 3) | | | (88,787 | ) |
| | | | |
| |
Net Expenses | | | 5,052,115 | |
| | | | |
| |
NET INVESTMENT INCOME | | | 13,807,269 | |
| | | | |
| |
REALIZED AND UNREALIZED GAIN (LOSS) ON INVESTMENTS AND FOREIGN CURRENCY: | | | | |
| |
Net realized loss on- | | | | |
Investments | | | (100,000,131 | ) |
Foreign currency and translation of other assets and liabilities | | | (118,656 | ) |
| | | | |
| |
| | | (100,118,787 | ) |
| | | | |
Net change in unrealized appreciation (depreciation) on- | | | | |
Investments | | | 77,881,930 | |
Foreign currency and translation of other assets and liabilities | | | 198,268 | |
| | | | |
| |
| | | 78,080,198 | |
| | | | |
| |
NET REALIZED AND UNREALIZED GAIN (LOSS) ON INVESTMENTS AND FOREIGN CURRENCY | | | (22,038,589 | ) |
| | | | |
| |
NET DECREASE IN NET ASSETS RESULTING FROM OPERATIONS | | $ | (8,231,320 | ) |
| | | | |
The accompanying notes are an integral part of the financial statements.
7
Overseas Series
Statements of Changes in Net Assets
| | | | | | | | |
| | | FOR THE SIX
MONTHS ENDED 4/30/16 (UNAUDITED) | | | FOR THE YEAR ENDED 10/31/15 | |
INCREASE (DECREASE) IN NET ASSETS: | | | | | | | | |
| | |
OPERATIONS: | | | | | | | | |
| | |
Net investment income | | $ | 13,807,269 | | | $ | 31,225,146 | |
Net realized loss on investments and foreign currency | | | (100,118,787 | ) | | | (96,890,011 | ) |
Net change in unrealized appreciation (depreciation) on investments and foreign currency | | | 78,080,198 | | | | 11,166,783 | |
| | | | | | | | |
| | |
Net decrease from operations | | | (8,231,320 | ) | | | (54,498,082 | ) |
| | | | | | | | |
| | |
DISTRIBUTIONS TO SHAREHOLDERS (Note 8): | | | | | | | | |
| | |
From net investment income | | | (27,334,427 | ) | | | (38,104,257 | ) |
From net realized gain on investments | | | — | �� | | | (188,046,421 | ) |
| | | | | | | | |
| | |
Total distributions to shareholders | | | (27,334,427 | ) | | | (226,150,678 | ) |
| | | | | | | | |
| | |
CAPITAL STOCK ISSUED AND REPURCHASED: | | | | | | | | |
| | |
Net decrease from capital share transactions (Note 5) | | | (470,173,332 | ) | | | (646,381,264 | ) |
| | | | | | | | |
| | |
Net decrease in net assets | | | (505,739,079 | ) | | | (927,030,024 | ) |
| | |
NET ASSETS: | | | | | | | | |
| | |
Beginning of period | | | 1,725,277,542 | | | | 2,652,307,566 | |
| | | | | | | | |
| | |
End of period (including undistributed net investment income of $12,259,768 and $25,786,926, respectively) | | $ | 1,219,538,463 | | | $ | 1,725,277,542 | |
| | | | | | | | |
The accompanying notes are an integral part of the financial statements.
8
Overseas Series
Financial Highlights
| | | | | | | | | | | | | | | | | | | | | | | | |
| | | FOR THE SIX MONTHS ENDED 4/30/16 (UNAUDITED) | | | FOR THE YEARS ENDED | |
| | | | 10/31/15 | | | 10/31/14 | | | 10/31/13 | | | 10/31/12 | | | 10/31/11 | |
Per share data (for a share outstanding throughout each period): | | | | | | | | | | | | | | | | | | | | | | | | |
Net asset value - Beginning of period | | $ | 21.34 | | | $ | 24.31 | | | $ | 27.39 | | | $ | 22.47 | | | $ | 22.63 | | | $ | 24.22 | |
| | | | | | | | | | | | | | | | | | | | | | | | |
Income (loss) from investment operations: | | | | | | | | | | | | | | | | | | | | | | | | |
Net investment income1 | | | 0.21 | | | | 0.32 | | | | 0.36 | | | | 0.41 | | | | 0.36 | | | | 0.75 | |
Net realized and unrealized gain (loss) on investments | | | (0.13 | ) | | | (1.14 | ) | | | (1.98 | ) | | | 4.88 | | | | 0.51 | | | | (2.09 | ) |
| | | | | | | | | | | | | | | | | | | | | | | | |
| | | | | | |
Total from investment operations | | | 0.08 | | | | (0.82 | ) | | | (1.62 | ) | | | 5.29 | | | | 0.87 | | | | (1.34 | ) |
| | | | | | | | | | | | | | | | | | | | | | | | |
| | | | | | |
Less distributions to shareholders: | | | | | | | | | | | | | | | | | | | | | | | | |
From net investment income | | | (0.37 | ) | | | (0.36 | ) | | | (0.37 | ) | | | (0.37 | ) | | | (0.52 | ) | | | (0.25 | ) |
From net realized gain on investments | | | — | | | | (1.79 | ) | | | (1.09 | ) | | | — | | | | (0.51 | ) | | | — | 2 |
| | | | | | | | | | | | | | | | | | | | | | | | |
Total distributions to shareholders | | | (0.37 | ) | | | (2.15 | ) | | | (1.46 | ) | | | (0.37 | ) | | | (1.03 | ) | | | (0.25 | ) |
| | | | | | | | | | | | | | | | | | | | | | | | |
Net asset value - End of period | | $ | 21.05 | | | $ | 21.34 | | | $ | 24.31 | | | $ | 27.39 | | | $ | 22.47 | | | $ | 22.63 | |
| | | | | | | | | | | | | | | | | | | | | | | | |
Net assets - End of period (000’s omitted) | | $ | 1,219,538 | | | $ | 1,725,278 | | | $ | 2,652,308 | | | $ | 2,661,662 | | | $ | 1,993,999 | | | $ | 1,336,187 | |
| | | | | | | | | | | | | | | | | | | | | | | | |
Total return3 | | | 0.47 | % | | | (3.02 | %) | | | (6.13 | %) | | | 23.87 | % | | | 4.61 | % | | | (5.61 | %) |
Ratios (to average net assets)/Supplemental Data: | | | | | | | | | | | | | | | | | | | | | | | | |
Expenses* | | | 0.75 | %4 | | | 0.74 | % | | | 0.74 | % | | | 0.75 | % | | | 0.75 | % | | | 0.75 | % |
Net investment income | | | 2.05 | %4 | | | 1.41 | % | | | 1.37 | % | | | 1.65 | % | | | 1.68 | % | | | 3.04 | % |
Portfolio turnover | | | 23 | % | | | 59 | % | | | 39 | % | | | 43 | % | | | 42 | % | | | 37 | % |
|
| *The investment advisor did not impose all or a portion of its management and/or other fees, and in some years may have paid a portion of the Series’ expenses. If these expenses had been incurred by the Series, the expense ratio (to average net assets) would have increased by the following amounts: | |
| | | | | | |
| | | 0.01 | %4 | | | N/A | | | | N/A | | | | N/A | | | | 0.00 | %5 | | | 0.01 | % |
1Calculated based on average shares outstanding during the periods.
2Less than $0.01 per share.
3Represents aggregate total return for the period indicated, and assumes reinvestment of all distributions. Periods less than one year are not annualized.
4Annualized.
5Less than 0.01%.
The accompanying notes are an integral part of the financial statements.
9
Overseas Series
Notes to Financial Statements
(unaudited)
Overseas Series (the “Series”) is a no-load diversified series of Manning & Napier Fund, Inc. (the “Fund”). The Fund is organized in Maryland and is registered under the Investment Company Act of 1940, as amended, as an open-end management investment company.
The Series’ investment objective is to provide long-term growth.
The Fund’s Advisor is Manning & Napier Advisors, LLC (the “Advisor”). Shares of the Series are offered to investors, clients and employees of the Advisor and its affiliates. The total authorized capital stock of the Fund consists of 15 billion shares of common stock each having a par value of $0.01. As of April 30, 2016, 10.5 billion shares have been designated in total among 40 series, of which 200 million have been designated as Overseas Series Class A common stock.
| 2. | Significant Accounting Policies |
The following is a summary of significant accounting policies followed by the Series. The Series is an investment company and, accordingly, follows the investment company accounting and reporting guidance of the Financial Accounting Standards Board Accounting Standards Codification Topic 946 - Investment Companies, which is part of accounting principles generally accepted in the United States of America (“GAAP”).
Security Valuation
Portfolio securities, including domestic equities, foreign equities, warrants and options, listed on an exchange other than the NASDAQ Stock Market are valued at the latest quoted sales price of the exchange on which the security is primarily traded. Securities not traded on valuation date or securities not listed on an exchange are valued at the latest quoted bid price provided by the Fund’s pricing service. Securities listed on the NASDAQ Stock Market are valued in accordance with the NASDAQ Official Closing Price.
Short-term investments that mature in sixty days or less may be valued at amortized cost, which approximates fair value. Investments in open-end investment companies are valued at their net asset value per share on valuation date.
Volume and level of activity in established markets for an asset or liability are evaluated to determine whether recent transactions and quoted prices are determinative of fair value. Where there have been significant decreases in volume and level of activity, further analysis and adjustment may be necessary to estimate fair value. The Series measures fair value in these instances by the use of inputs and valuation techniques which may be based upon current market prices of securities that are comparable in coupon, rating, maturity and industry and/or expectation of future cash flows. As a result of trading in relatively thin markets and/or markets that experience significant volatility, the prices used by the Series to value these securities may differ from the value that would be realized if these securities were sold, and the differences could be material.
Securities for which representative valuations or prices are not available from the Series’ pricing service may be valued at fair value as determined in good faith by the Advisor under procedures approved by and under the general supervision and responsibility of the Fund’s Board of Directors (the “Board”). Due to the inherent uncertainty of valuations of such securities, the fair value may differ significantly from the values that would have been used had a ready market for such securities existed. If trading or events occurring after the close of the principal market in which securities are traded are expected to materially affect the value of those securities, then they may be valued at their fair value, taking this trading or these events into account. In accordance with the procedures approved by the Board, the values of certain securities trading outside the U.S. were adjusted following the close of local trading using a factor from a third party vendor. The third party vendor uses statistical analyses and quantitative models, which consider among other things subsequent movement and changes in the prices of indices, securities and exchange rates in other markets, to determine the factors which are used to adjust local market prices. The value of securities used for net asset value calculation under these procedures may differ from published prices for the same securities. It is the Fund’s policy to classify each foreign equity security where a factor from a third party vendor is provided as a Level 2 security.
10
Overseas Series
Notes to Financial Statements (continued)
(unaudited)
| 2. | Significant Accounting Policies (continued) |
Security Valuation (continued)
Various inputs are used in determining the value of the Series’ assets or liabilities carried at fair value. These inputs are summarized in three broad levels. Level 1 includes quoted prices in active markets for identical assets and liabilities. Level 2 includes other significant observable inputs (including quoted prices for similar securities, interest rates, prepayment speeds, credit risk, etc.). Level 3 includes significant unobservable inputs (including the Series’ own assumptions in determining the fair value of investments). A financial instrument’s level within the fair value hierarchy is based on the lowest level of any input both individually and in aggregate that is significant to the fair value measurement. The inputs or methodology used for valuing securities are not necessarily an indication of the risk associated with investing in those securities.
The following is a summary of the valuation levels used for major security types as of April 30, 2016 in valuing the Series’ assets or liabilities carried at fair value:
| | | | | | | | | | | | | | | | |
| DESCRIPTION | | TOTAL | | | LEVEL 1 | | | LEVEL 2 | | | LEVEL 3 | |
Assets: | | | | | | | | | | | | | | | | |
Equity securities: | | | | | | | | | | | | | | | | |
Consumer Discretionary | | $ | 222,289,037 | | | $ | 107,551,931 | | | $ | 114,737,106 | | | $ | — | |
Consumer Staples | | | 328,967,661 | | | | 85,375,260 | | | | 243,592,401 | | | | — | |
Energy | | | 76,694,205 | | | | 76,694,205 | | | | — | | | | — | |
Health Care | | | 190,022,160 | | | | 113,458,818 | | | | 76,563,342 | | | | — | |
Industrials | | | 83,388,222 | | | | 12,037,022 | | | | 71,351,200 | | | | — | |
Information Technology | | | 205,928,912 | | | | 126,497,103 | | | | 79,431,809 | | | | — | |
Materials | | | 30,878,492 | | | | 4,404,337 | | | | 26,474,155 | | | | — | |
Telecommunication Services | | | 35,935,673 | | | | 35,935,673 | | | | — | | | | — | |
Mutual Fund | | | 4,115,859 | | | | 4,115,859 | | | | — | | | | — | |
| | | | | | | | | | | | | | | | |
Total assets | | $ | 1,178,220,221 | | | $ | 566,070,208 | | | $ | 612,150,013 | | | $ | — | |
| | | | | | | | | | | | | | | | |
Please see the Investment Portfolio for foreign securities where a factor from a third party vendor was applied to determine the security’s fair value following the close of local trading. Such securities are included in Level 2 in the table above.
There were no Level 3 securities held by the Series as of October 31, 2015 or April 30, 2016.
The Fund’s policy is to recognize transfers in and transfers out of the valuation levels as of the beginning of the reporting period. There were no transfers between Level 1 and Level 2 during the six months ended April 30, 2016.
Security Transactions, Investment Income and Expenses
Security transactions are accounted for on trade date. Dividend income is recorded on the ex-dividend date, except that if the ex-dividend date has passed, certain dividends from foreign securities are recorded as soon as the Series is informed of the ex-dividend date. Non-cash dividends, if any, are recorded at the fair value of the securities received. Interest income, including amortization of premium and accretion of discounts using the effective interest method, is earned from settlement date and accrued daily.
Expenses are recorded on an accrual basis. Most expenses of the Fund can be attributed to a specific series. Expenses which cannot be directly attributed are apportioned among the series in the Fund in such a manner as deemed equitable by the Fund’s Board, taking into consideration, among other things, the nature and type of expense.
The Series uses the identified cost method for determining realized gain or loss on investments for both financial statement and federal income tax reporting purposes.
Foreign Currency Translation
The books and records of the Series are maintained in U.S. dollars. Foreign currencies, investments and other assets and liabilities are translated into U.S. dollars at the current exchange rates. Purchases and sales of investment securities and income and expenses are translated on the respective dates of such transactions. The Series does not isolate realized and
11
Overseas Series
Notes to Financial Statements (continued)
(unaudited)
| 2. | Significant Accounting Policies (continued) |
Foreign Currency Translation (continued)
unrealized gains and losses attributable to changes in the exchange rates from gains and losses that arise from changes in the fair value of investments. Such fluctuations are included with net realized and unrealized gain or loss on investments. Net realized foreign currency gains and losses represent foreign currency gains and losses between trade date and settlement date on securities transactions, gains and losses on disposition of foreign currencies and the difference between the amount of income and foreign withholding taxes recorded on the books of the Series and the amounts actually received or paid.
Federal Taxes
The Series’ policy is to comply with the provisions of the Internal Revenue Code applicable to regulated investment companies. The Series is not subject to federal income tax or excise tax to the extent that the Series distributes to shareholders each year its taxable income, including any net realized gains on investments, in accordance with requirements of the Internal Revenue Code. Accordingly, no provision for federal income tax or excise tax has been made in the financial statements.
Management evaluates its tax positions to determine if the tax positions taken meet the minimum recognition threshold in connection with accounting for uncertainties in income tax positions taken or expected to be taken for the purposes of measuring and recognizing tax liabilities in the financial statements. Recognition of tax benefits of an uncertain tax position is required only when the position is “more likely than not” to be sustained assuming examination by taxing authorities. At April 30, 2016, the Series has recorded no liability for net unrecognized tax benefits relating to uncertain income tax positions taken or expected to be taken in future tax returns.
The Series files income tax returns in the U.S. federal jurisdiction, various states and foreign jurisdictions, as required. No income tax returns are currently under investigation. The statute of limitations on the Series’ tax returns remains open for the years ended October 31, 2012 through October 31, 2015. The Series is not aware of any tax positions for which it is reasonably possible that the total amounts of unrecognized tax benefits will significantly change in the next twelve months.
Foreign Taxes
Based on the Series’ understanding of the tax rules and rates related to income, gains and currency purchase/repatriation transactions for foreign jurisdictions in which it invests, the Series will provide for foreign taxes, and where appropriate, deferred foreign tax.
Distributions of Income and Gains
Distributions to shareholders of net investment income and net realized gains are made annually. An additional distribution may be necessary to avoid taxation of the Series. Distributions are recorded on the ex-dividend date.
Indemnifications
The Fund’s organizational documents provide former and current directors and officers with a limited indemnification against liabilities arising in connection with the performance of their duties to the Fund. In the normal course of business, the Fund may also enter into contracts that provide general indemnifications. The Fund’s maximum exposure under these arrangements is unknown as this would be dependent on future claims that may be made against the Fund. The risk of material loss from such claims is considered remote.
Other
The preparation of financial statements in conformity with GAAP requires management to make estimates and assumptions that affect the reported amounts of assets and liabilities and the disclosure of contingent assets and liabilities at the date of the financial statements and the reported amounts of income and expenses during the reporting period. Actual results could differ from those estimates.
12
Overseas Series
Notes to Financial Statements (continued)
(unaudited)
| 3. | Transactions with Affiliates |
The Fund has an Investment Advisory Agreement (the “Agreement”) with the Advisor, for which the Series pays a fee, computed daily and payable monthly, at an annual rate of 0.70% of the Series’ average daily net assets.
Under the Agreement, personnel of the Advisor provide the Series with advice and assistance in the choice of investments and the execution of securities transactions, and otherwise maintain the Series’ organization. The Advisor also provides the Fund with necessary office space and fund administration and support services. The salaries of all officers of the Fund (except a percentage of the Fund’s Chief Compliance Officer’s salary, which is paid by the Fund), and of all Directors who are “affiliated persons” of the Fund, or of the Advisor, and all personnel of the Fund, or of the Advisor, performing services relating to research, statistical and investment activities, are paid by the Advisor. Each “non-affiliated” Director receives an annual stipend, which is allocated among all the active series of the Fund. In addition, these Directors also receive a fee per Board meeting attended plus a fee for each committee meeting attended and are reimbursed for travel and other out-of-pocket expenses incurred by them in connection with attending such meetings. The Fund also has an Audit Committee Chair, who receives an additional annual stipend for this role.
The Advisor has contractually agreed, until at least February 28, 2017, to waive its management fee and, if necessary, pay other operating expenses of the Series in order to maintain total direct annual fund operating expenses for the Series at no more than 0.75% of average daily net assets each year. Accordingly, the Advisor waived fees of $88,787 for the six months ended April 30, 2016, which is included as a reduction of expenses on the Statement of Operations. The Advisor is not eligible to recoup any expenses that have been waived or reimbursed in prior years.
Manning & Napier Investor Services, Inc., a registered broker-dealer affiliate of the Advisor, acts as distributor for the Fund’s shares. The services of Manning & Napier Investor Services, Inc. are provided at no additional cost to the Series.
Pursuant to a master services agreement dated November 1, 2014, the Fund pays the Advisor an annual fee related to fund accounting and administration of 0.0085% on the first $25 billion of average daily net assets (excluding Target Series and Strategic Income Series); 0.0075% on the next $15 billion of average daily net assets (excluding Target Series and Strategic Income Series); and 0.0065% of the average daily net assets in excess of $40 billion (excluding Target Series and Strategic Income Series); plus a base fee of $30,400 per series. Transfer agent fees are charged to the Fund on a per account basis. Additionally, certain transaction and out-of-pocket expenses, including charges for reporting relating to the Fund’s compliance program, are charged. The Advisor has agreements with BNY Mellon Investment Servicing (U.S.) Inc. (“BNY”) under which BNY serves as sub-accountant services agent and sub-transfer agent.
Expenses not directly attributable to a series are allocated based on each series’ relative net assets or number of accounts, depending on the expense.
| 4. | Purchases and Sales of Securities |
For the six months ended April 30, 2016, purchases and sales of securities, other than U.S. Government securities and short-term securities, were $303,377,486 and $793,606,301 respectively. There were no purchases or sales of U.S. Government securities.
13
Overseas Series
Notes to Financial Statements (continued)
(unaudited)
| 5. | Capital Stock Transactions |
Transactions in Class A shares of Overseas Series were:
| | | | | | | | | | | | | | | | |
| | | FOR THE SIX MONTHS ENDED 4/31/2016 | | | FOR THE YEAR ENDED 10/31/2015 | |
| | | SHARES | | | AMOUNT | | | SHARES | | | AMOUNT | |
Sold | | | 4,324,976 | | | $ | 84,220,284 | | | | 8,589,455 | | | $ | 192,939,757 | |
Reinvested | | | 1,253,129 | | | | 25,137,767 | | | | 10,511,668 | | | | 216,435,237 | |
Repurchased | | | (28,493,106 | ) | | | (579,531,383 | ) | | | (47,346,296 | ) | | | (1,055,756,258 | ) |
| | | | | | | | | | | | | | | | |
Total | | | (22,915,001 | ) | | $ | (470,173,332 | ) | | | (28,245,173 | ) | | ($ | 646,381,264 | ) |
| | | | | | | | | | | | | | | | |
At April 30, 2016, the retirement plan of the Advisor and its affiliates owned 229,666 shares of the Series (0.4% of shares outstanding) valued at $4,834,468.
The Series may trade in instruments including written and purchased options, forward foreign currency exchange contracts and futures contracts and other derivatives in the normal course of investing activities to assist in managing exposure to various market risks. The Series may be subject to various elements of risk, which may involve, to a varying degree, elements of risk in excess of the amounts recognized for financial statement purposes. These risks include: the risk that changes in the value of a derivative may not correlate perfectly with the underlying asset, rate or index; counterparty credit risk related to over the counter derivative counterparties’ failure to perform under contract terms; liquidity risk related to the lack of a liquid market for these contracts allowing the fund to close out its position(s); and documentation risk relating to disagreement over contract terms. No such investments were held by the Series as of April 30, 2016.
Investing in securities of foreign companies and foreign governments involves special risks and considerations not typically associated with investing in securities of domestic companies and the U.S. Government. These risks include revaluation of currencies and future adverse political and economic developments. Moreover, securities of foreign companies and foreign governments and their markets may be less liquid and their prices more volatile than those of comparable domestic companies and the U.S. Government.
| 8. | Federal Income Tax Information |
The amount and characterization of certain income and capital gains to be distributed are determined in accordance with federal income tax regulations, which may differ from GAAP. The Series may periodically make reclassifications among its capital accounts to reflect income and gains available for distribution (or available capital loss carryovers) under income tax regulations, without impacting the Series’ net asset value. Any such reclassifications are not reflected in the financial highlights.
The final determination of the tax character of current year distributions will be made at the conclusion of the fiscal year. The tax character of distributions paid for the year ended October 31, 2015 were as follows:
| | | | |
Ordinary income | | $ | 73,208,251 | |
Long-term capital gains | | | 152,942,427 | |
At April 30, 2016, the tax basis of components of distributable earnings and the net unrealized depreciation based on the identified cost for federal income tax purposes were as follows:
| | | | |
Cost for federal income tax purposes | | $ | 1,227,158,109 | |
Unrealized appreciation | | | 72,972,468 | |
Unrealized depreciation | | | (121,910,356 | ) |
| | | | |
Net unrealized depreciation | | $ | (48,937,888 | ) |
| | | | |
14
Overseas Series
Renewal of Investment Advisory Agreement
(unaudited)
At the Manning & Napier Fund, Inc. (the “Fund”) Board of Directors’ (the “Board”) meeting, held on November 17, 2015, the Investment Advisory Agreement (the “Agreement”) between the Fund and Manning & Napier Advisors, LLC (the “Advisor”) was considered by the Board for renewal. In connection with the decision whether to renew the Agreement, a variety of material was prepared for and considered by the Board.
Representatives of the Advisor attended the meeting and presented additional oral and written information to the Board to assist the Board in its considerations. The discussion immediately below outlines the materials and information presented to the Board in connection with the Board’s 2015 Annual consideration of the Agreement and the conclusions made by the Directors when determining to continue the Agreement.
| | • | | The Board considered the services provided by the Advisor under the Agreement including, among others: deciding what securities to purchase and sell for each Series; arranging for the purchase and sale of such securities by placing orders with broker-dealers; administering the affairs of the Fund (including the books and records of the Fund not maintained by third party service providers such as the custodian or sub-transfer agent); arranging for the insurance coverage for the Fund; and supervising the preparation of tax returns, SEC filings (including registration statements) and reports to shareholders for the Fund. The Board also considered the nature and quality of such services provided under the Agreement in light of the Advisor’s services provided to the Fund for 29 years. The Board discussed the quality of these services with representatives from the Advisor and concluded that the Advisor was performing its services to the Fund required under the Agreement in a reasonable manner. |
| | • | | The Board considered the performance of each Series since its inception, as well as performance over multiple time periods. Performance for one or more of the following time periods was considered as applicable to the Series’ inception date: inception, three year, five year, ten year, and current market cycle. A market cycle includes periods of both rising and falling markets. Returns for established benchmark indices for each Series were provided. In addition, the Board considered a number of other factors relevant to performance at the meeting (and considers on a quarterly basis) including: a peer group performance analysis consisting of Morningstar universes of mutual funds with similar investment objectives, investment performance of core products, product offerings, performance on an aggregate basis vs. performance over reasonable time periods and the Advisor’s investment process. The Directors acknowledged the challenging performance and discussed the investment process of the Advisor. The Directors confirmed that qualitative factors such as the Advisor’s investment process, including recent enhancements, were an important subset to be considered as part of their consideration of performance. The Board discussed the performance with representatives from the Advisor and concluded that the investment performance of each of the Fund’s Series was reasonable based on the Series’ actual performance and comparative performance, especially for those series with performance over the current market cycle. |
| | • | | The Board considered the costs of the Advisor’s services and the profits of the Advisor as they relate to the Advisor’s services to the Fund under the Agreement. In reviewing the Advisor’s costs and profits, the Board discussed the Advisor’s revenues generated from the Fund (on both an actual and adjusted basis) and its expenses associated with providing the services under the Agreement. In addition, the Board reviewed the Advisor’s expenses associated with Fund activities outside of the Agreement (such as expense reimbursements pursuant to expense caps and payments made by the Advisor to third party platforms on which shares of the Fund are available for purchase). It was noted by representatives of the Advisor that 22 of the 36 active Series of the Fund are currently experiencing expenses above the capped expense ratios, and thus the Advisor is incurring those expenses over the cap. After discussing the above costs and profits, the Board concluded that the Advisor’s profitability relating to its services provided under the Agreement was reasonable. |
| | • | | The Board considered the fees and expenses of the various Series of the Fund. The Advisor presented the advisory fees and total expenses for each Series, including the advisory fee adjusted for any expense waivers or reimbursements (either contractual or voluntary) paid by the Advisor. The advisory fees and expense ratios of each Series were compared to an average (on both a mean and median basis) of similar funds as disclosed on the Morningstar database. Representatives of the Advisor discussed with the Board the levels of its advisory fee for each Series of the Fund and as compared to the median and mean advisory fees for similar funds as listed on Morningstar. Expense ratios for every Series, except the Tax Managed Series, Equity Income Class S, High Yield Bond Class S, Pro-Blend Series Classes C and R, and Target Series’ Classes R and K, are lower than, or substantially similar to the Morningstar mean and median reported total expense ratio. |
15
Overseas Series
Renewal of Investment Advisory Agreement
(unaudited)
| | The higher than mean and median total expense ratios for Classes C and R reflect higher distribution, marketing and shareholder service fees payable to broker-dealers through a 100bp 12b-1 fee for Class C and a 50bp 12b-1 fee for Class R. Based on their review of the information provided, the Board concluded that the fees and expenses of each Series of the Fund were reasonable on a comparative basis. |
| | • | | The Board also considered the other benefits the Advisor derives from its relationship with the Fund. Such other benefits include certain research services provided by soft dollars. The Board reviewed the broker-dealers who provided research to the Advisor and the products and services paid for, in whole or in part, using soft dollar commissions. Given the level of soft dollar transactions involving the Fund, the Board concluded that these additional benefits to the Advisor were reasonable. |
| | • | | In addition to the factors described above, the Board considered the Advisor’s personnel, investment strategies, policies and procedures relating to compliance with personal securities transactions, reputation, expertise and resources in domestic and foreign financial markets. The Board concluded that these factors support the conclusion that the Advisor performs its services in a reasonable manner. |
| | • | | The Board then considered economies of scale and concluded that the current fee schedule to the advisory agreement remained reasonable given the multiple uses of the Fund (for the Advisor’s discretionary investment account clients in addition to direct investors), the current profitability of the Advisor’s services to the Fund under the Agreement, the number of newly established series of the Fund and the overall size of the Fund complex. |
Based on the Board’s deliberations and their evaluation of the information described above, the Board, including a majority of Directors that are not “interested persons” as defined in the Investment Company Act of 1940, concluded that the compensation under the Agreement was fair and reasonable in light of the services and expenses and such other matters as the Directors considered to be relevant in the exercise of their reasonable judgment. Accordingly, the Board approved the renewal of the Agreement. In the course of their deliberations, the Directors did not identify any particular information that was all important or controlling.
16
{This page intentionally left blank}
17
Overseas Series
Literature Requests
(unaudited)
Proxy Voting Policies and Procedures
A description of the policies and procedures that the Fund uses to determine how to vote proxies relating to portfolio securities is available, without charge, upon request:
| | | | |
| By phone | | 1-800-466-3863 | | |
| On the Securities and Exchange | | | | |
| Commission’s (SEC) web site | | http://www.sec.gov | | |
Proxy Voting Record
Information regarding how the Fund voted proxies relating to portfolio securities during the most recent 12-month period ended June 30th is available, without charge, upon request:
| | | | |
| By phone | | 1-800-466-3863 | | |
| On the SEC’s web site | | http://www.sec.gov | | |
Quarterly Portfolio Holdings
The Series’ complete schedule of portfolio holdings for the 1st and 3rd quarters of each fiscal year are provided on Form N-Q, and are available, without charge, upon request:
| | | | |
| By phone | | 1-800-466-3863 | | |
| On the SEC’s web site | | http://www.sec.gov | | |
The Series’ Form N-Q may be reviewed and copied at the SEC’s Public Reference Room in Washington, D.C. Information on the operation of the Public Reference Room may be obtained by calling 1-800-SEC-0330.
Prospectus and Statement of Additional Information (SAI)
For more information about any of the Manning & Napier Fund, Inc. Series, you may obtain a prospectus and SAI at www.manning-napier.com or by calling (800) 466-3863. Before investing, carefully consider the objectives, risks, charges and expenses of the investment and read the prospectus carefully as it contains this and other information about the investment company. In addition, this information can be found on the SEC’s web site, http://www.sec.gov.
Additional information available at www.manning-napier.com
1. Fund Holdings - Month-End
2. Fund Holdings - Quarter-End
3. Shareholder Report - Annual
4. Shareholder Report - Semi-Annual
The Fund also offers electronic notification or “e-delivery” when certain documents are available on-line to be downloaded or reviewed. Direct shareholders can elect to receive electronic notification when shareholder reports, prospectus updates, and/or statements are available. If you do not currently have on-line access to your account, you can establish access by going to www.manning-napier.com, click on “Login” in the top corner of the page, and follow the prompts to self-enroll. Once enrolled, you can set your electronic notification preferences by clicking on the Account Options tab located within the green toolbar and then select E-Delivery Option. Should you have any questions on either how to establish on-line access or how to update your account settings, please contact Investor Services at 1-800-466-3863.
The Manning & Napier Fund, Inc. is managed by Manning & Napier Advisors, LLC. Manning & Napier Investor Services, Inc., an affiliate of Manning & Napier Advisors, LLC, is the distributor of the Fund shares.
MNOVS-4/16-SAR

Shareholder Expense Example - Pro-Blend® Conservative Term Series
(unaudited)
As a shareholder of the Series, you incur ongoing costs, including management fees, shareholder service fees and other Series expenses. This example is intended to help you understand your ongoing costs (in dollars) of investing in the Series and to compare these costs with the ongoing costs of investing in other mutual funds.
The example is based on an investment of $1,000 invested in each class at the beginning of the period and held for the entire period (November 1, 2015 to April 30, 2016).
Actual Expenses
The Actual lines of the table below provide information about actual account values and actual expenses. You may use the information in these lines, together with the amount you invested, to estimate the expenses that you paid over the period. Simply divide your account value by $1,000 (for example, an $8,600 account value divided by $1,000 = 8.6), then multiply the result by the number in the Actual line for the Class in which you have invested under the heading entitled “Expenses Paid During Period” to estimate the expenses you paid on your account during this period.
Hypothetical Example for Comparison Purposes
The Hypothetical lines of each class in the table below provide information about hypothetical account values and hypothetical expenses based on the Class’ actual expense ratio and an assumed rate of return of 5% per year before expenses, which is not the Class’ actual return. The hypothetical account values and expenses may not be used to estimate the actual ending account balance or expenses you paid during the period. You may use this information to compare the ongoing costs of investing in a class of the Series and other funds. To do so, compare this 5% hypothetical example for the Class in which you have invested with the 5% hypothetical examples that appear in the shareholder reports of the other funds.
Please note that the expenses shown in the table are meant to highlight your ongoing costs only and do not reflect any transaction costs such as sales charges (loads), redemption fees, or exchange fees that you may incur in other mutual funds. Therefore, the second line of the table is useful in comparing ongoing costs only, and will not help you determine the relative total costs of owning different funds.
| | | | | | | | |
| | | BEGINNING ACCOUNT VALUE 11/1/15 | | ENDING ACCOUNT VALUE 4/30/16 | | EXPENSES PAID DURING PERIOD 11/1/15-4/30/16* | | ANNUALIZED EXPENSE RATIO |
Class S | | | | | | | | |
Actual | | $1,000.00 | | $1,009.30 | | $4.40 | | 0.88% |
Hypothetical (5% return before expenses) | | $1,000.00 | | $1,020.49 | | $4.42 | | 0.88% |
Class I | | | | | | | | |
Actual | | $1,000.00 | | $1,009.70 | | $3.40 | | 0.68% |
Hypothetical (5% return before expenses) | | $1,000.00 | | $1,021.48 | | $3.42 | | 0.68% |
Class C | | | | | | | | |
Actual | | $1,000.00 | | $1,005.10 | | $8.48 | | 1.70% |
Hypothetical (5% return before expenses) | | $1,000.00 | | $1,016.41 | | $8.52 | | 1.70% |
Class R | | | | | | | | |
Actual | | $1,000.00 | | $1,007.90 | | $5.89 | | 1.18% |
Hypothetical (5% return before expenses) | | $1,000.00 | | $1,019.00 | | $5.92 | | 1.18% |
*Expenses are equal to the Class’ annualized expense ratio (for the six-month period), multiplied by the average account value over the period, multiplied by 182/366 to reflect the one-half year period.
1
Portfolio Composition - Pro-Blend® Conservative Term Series
As of April 30, 2016 (unaudited)
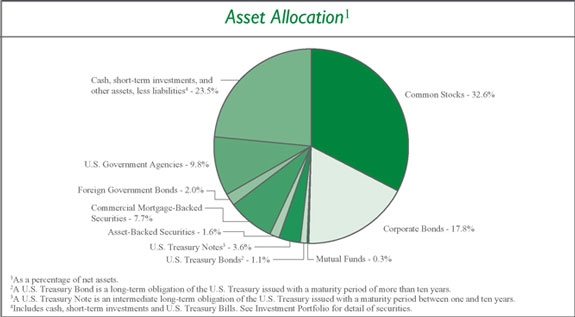
| | | | |
Sector Allocation5 | |
Financials | | | 14.0 | % |
Information Technology | | | 10.2 | % |
Consumer Discretionary | | | 9.0 | % |
Industrials | | | 5.1 | % |
Energy | | | 5.0 | % |
Health Care | | | 5.0 | % |
Consumer Staples | | | 4.8 | % |
Materials | | | 4.4 | % |
Telecommunication Services | | | 1.6 | % |
Utilities | | | 0.6 | % |
| | |
| 5Including common stocks and corporate bonds, as a percentage of total investments. | | | | |
| | | | |
Top Five Stock Holdings6 | |
QUALCOMM, Inc. | | | 1.3 | % |
Johnson & Johnson | | | 1.2 | % |
Time Warner, Inc. | | | 1.0 | % |
Monsanto Co. | | | 1.0 | % |
MasterCard, Inc. - Class A | | | 0.9 | % |
| | |
| 6 As a percentage of total investments. | | | | |
Top Five Bond Holdings7 | |
U.S. Treasury Bill, 0.28%, 6/23/2016 | | | 4.9 | % |
U.S. Treasury Note, 0.125%, 4/15/2020 | | | 1.9 | % |
U.S. Treasury Note, 0.125%, 4/15/2017 | | | 1.4 | % |
U.S. Treasury Bond, 0.75%, 2/15/2042 | | | 1.3 | % |
U.S. Treasury Note, 0.125%, 1/15/2023 | | | 1.0 | % |
| | |
| 7 As a percentage of total investments. | | | | |
2
Investment Portfolio - April 30, 2016
(unaudited)
| | | | | | | | |
| PRO-BLEND® CONSERVATIVE TERM SERIES | | SHARES | | | VALUE (NOTE 2) | |
| | |
COMMON STOCKS - 32.6% | | | | | | | | |
| | |
Consumer Discretionary - 6.0% | | | | | | | | |
Automobiles - 0.0%## | | | | | | | | |
Honda Motor Co., Ltd. - ADR (Japan) | | | 25,937 | | | $ | 699,262 | |
| | | | | | | | |
Hotels, Restaurants & Leisure - 0.5% | | | | | | | | |
Accor S.A. (France)1 | | | 5,220 | | | | 231,160 | |
Yum! Brands, Inc. | | | 69,760 | | | | 5,550,106 | |
| | | | | | | | |
| | |
| | | | | | | 5,781,266 | |
| | | | | | | | |
Internet & Catalog Retail - 0.9% | | | | | | | | |
The Priceline Group, Inc.* | | | 5,950 | | | | 7,994,777 | |
TripAdvisor, Inc.* | | | 54,030 | | | | 3,489,798 | |
| | | | | | | | |
| | |
| | | | | | | 11,484,575 | |
| | | | | | | | |
Media - 3.4% | | | | | | | | |
AMC Networks, Inc. - Class A* | | | 116,210 | | | | 7,580,378 | |
Liberty Global plc - Class A - ADR (United Kingdom)* | | | 110,490 | | | | 4,168,788 | |
Sinclair Broadcast Group, Inc. - Class A | | | 164,300 | | | | 5,269,101 | |
TEGNA, Inc. | | | 78,920 | | | | 1,843,571 | |
Thomson Reuters Corp. | | | 17,098 | | | | 703,241 | |
Time Warner, Inc. | | | 143,160 | | | | 10,757,042 | |
Tribune Media Co. - Class A | | | 143,240 | | | | 5,521,902 | |
Twenty-First Century Fox, Inc. - Class A2 | | | 225,630 | | | | 6,827,564 | |
| | | | | | | | |
| | |
| | | | | | | 42,671,587 | |
| | | | | | | | |
Multiline Retail - 0.2% | | | | | | | | |
Dollar General Corp. | | | 14,790 | | | | 1,211,449 | |
Macy’s, Inc. | | | 16,900 | | | | 669,071 | |
Target Corp. | | | 11,633 | | | | 924,823 | |
| | | | | | | | |
| | |
| | | | | | | 2,805,343 | |
| | | | | | | | |
Specialty Retail - 0.5% | | | | | | | | |
DSW, Inc. - Class A | | | 32,500 | | | | 798,525 | |
The Home Depot, Inc. | | | 19,908 | | | | 2,665,482 | |
Staples, Inc. | | | 154,990 | | | | 1,580,898 | |
Williams-Sonoma, Inc. | | | 17,580 | | | | 1,033,352 | |
| | | | | | | | |
| | |
| | | | | | | 6,078,257 | |
| | | | | | | | |
Textiles, Apparel & Luxury Goods - 0.5% | | | | | | | | |
lululemon athletica, Inc.* | | | 92,120 | | | | 6,038,466 | |
| | | | | | | | |
| | |
Total Consumer Discretionary | | | | | | | 75,558,756 | |
| | | | | | | | |
Consumer Staples - 3.0% | | | | | | | | |
Beverages - 1.6% | | | | | | | | |
Ambev S.A. - ADR (Brazil) | | | 1,107,230 | | | | 6,189,416 | |
Anheuser-Busch InBev S.A./N.V. (Belgium)1 | | | 40,890 | | | | 5,072,589 | |
The Coca-Cola Co. | | | 10,510 | | | | 470,848 | |
Diageo plc (United Kingdom)1 | | | 215,250 | | | | 5,819,540 | |
PepsiCo, Inc. | | | 29,089 | | | | 2,995,003 | |
| | | | | | | | |
| | |
| | | | | | | 20,547,396 | |
| | | | | | | | |
Food & Staples Retailing - 0.2% | | | | | | | | |
Wal-Mart Stores, Inc. | | | 43,076 | | | | 2,880,492 | |
| | | | | | | | |
Food Products - 0.1% | | | | | | | | |
General Mills, Inc. | | | 13,252 | | | | 812,878 | |
| | | | | | | | |
Household Products - 0.5% | | | | | | | | |
Colgate-Palmolive Co. | | | 16,000 | | | | 1,134,720 | |
Kimberly-Clark Corp. | | | 7,502 | | | | 939,175 | |
The Procter & Gamble Co. | | | 47,356 | | | | 3,794,163 | |
| | | | | | | | |
| | |
| | | | | | | 5,868,058 | |
| | | | | | | | |
Personal Products - 0.5% | | | | | | | | |
Unilever plc - ADR (United Kingdom) | | | 154,092 | | | | 6,912,567 | |
| | | | | | | | |
Tobacco - 0.1% | | | | | | | | |
Philip Morris International, Inc. | | | 10,060 | | | | 987,087 | |
| | | | | | | | |
| | |
Total Consumer Staples | | | | | | | 38,008,478 | |
| | | | | | | | |
Energy - 2.0% | | | | | | | | |
Energy Equipment & Services - 0.6% | | | | | | | | |
Schlumberger Ltd. | | | 91,370 | | | | 7,340,666 | |
| | | | | | | | |
Oil, Gas & Consumable Fuels - 1.4% | | | | | | | | |
BP plc - ADR (United Kingdom) | | | 45,190 | | | | 1,517,480 | |
Chevron Corp. | | | 15,450 | | | | 1,578,681 | |
ConocoPhillips | | | 16,220 | | | | 775,154 | |
Exxon Mobil Corp. | | | 28,950 | | | | 2,559,180 | |
Hess Corp. | | | 10,700 | | | | 637,934 | |
Occidental Petroleum Corp. | | | 15,690 | | | | 1,202,638 | |
Range Resources Corp. | | | 215,550 | | | | 9,507,910 | |
TOTAL S.A. (France)1 | | | 17,000 | | | | 859,198 | |
| | | | | | | | |
| | | | | | | 18,638,175 | |
| | | | | | | | |
| | |
Total Energy | | | | | | | 25,978,841 | |
| | | | | | | | |
Financials - 4.7% | | | | | | | | |
Banks - 1.1% | | | | | | | | |
Bank of America Corp. | | | 47,830 | | | | 696,405 | |
Citigroup, Inc. | | | 32,750 | | | | 1,515,670 | |
JPMorgan Chase & Co. | | | 66,507 | | | | 4,203,242 | |
KeyCorp. | | | 27,840 | | | | 342,154 | |
The PNC Financial Services Group, Inc. | | | 13,863 | | | | 1,216,894 | |
U.S. Bancorp | | | 46,236 | | | | 1,973,815 | |
Wells Fargo & Co. | | | 84,247 | | | | 4,210,665 | |
| | | | | | | | |
| | |
| | | | | | | 14,158,845 | |
| | | | | | | | |
The accompanying notes are an integral part of the financial statements.
3
Investment Portfolio - April 30, 2016
(unaudited)
| | | | | | | | |
| PRO-BLEND® CONSERVATIVE TERM SERIES | | SHARES | | | VALUE (NOTE 2) | |
| | |
COMMON STOCKS (continued) | | | | | | | | |
| | |
Financials (continued) | | | | | | | | |
Capital Markets - 0.5% | | | | | | | | |
American Capital Ltd.* | | | 19,980 | | | $ | 315,684 | |
Apollo Investment Corp. | | | 39,170 | | | | 227,969 | |
Ares Capital Corp. | | | 16,860 | | | | 256,103 | |
BlackRock, Inc. | | | 14,780 | | | | 5,266,557 | |
Fifth Street Finance Corp. | | | 40,580 | | | | 219,944 | |
Medley Capital Corp. | | | 30,140 | | | | 204,952 | |
PennantPark Investment Corp. | | | 30,700 | | | | 202,313 | |
Prospect Capital Corp. | | | 36,750 | | | | 274,890 | |
| | | | | | | | |
| | |
| | | | | | | 6,968,412 | |
| | | | | | | | |
Insurance - 0.1% | | | | | | | | |
Admiral Group plc (United Kingdom)1 | | | 13,330 | | | | 362,293 | |
Principal Financial Group, Inc. | | | 26,100 | | | | 1,113,948 | |
| | | | | | | | |
| | |
| | | | | | | 1,476,241 | |
| | | | | | | | |
Real Estate Investment Trusts (REITS) - 2.7% | | | | | | | | |
Agree Realty Corp. | | | 20,980 | | | | 813,604 | |
Alexandria Real Estate Equities, Inc. | | | 4,870 | | | | 452,667 | |
American Campus Communities, Inc. | | | 8,350 | | | | 373,663 | |
American Homes 4 Rent - Class A | | | 15,560 | | | | 246,159 | |
Apartment Investment & Management Co. - Class A | | | 12,820 | | | | 513,569 | |
AvalonBay Communities, Inc. | | | 3,860 | | | | 682,409 | |
Boston Properties, Inc. | | | 3,690 | | | | 475,493 | |
Brixmor Property Group, Inc. | | | 9,530 | | | | 240,633 | |
CatchMark Timber Trust, Inc. - Class A | | | 100,060 | | | | 1,061,637 | |
Chesapeake Lodging Trust | | | 17,860 | | | | 439,892 | |
Columbia Property Trust, Inc. | | | 10,970 | | | | 244,631 | |
Community Healthcare Trust, Inc. | | | 51,760 | | | | 942,032 | |
CoreSite Realty Corp. | | | 2,370 | | | | 177,584 | |
Crown Castle International Corp. | | | 11,390 | | | | 989,563 | |
CubeSmart | | | 18,220 | | | | 539,494 | |
DCT Industrial Trust, Inc. | | | 6,860 | | | | 276,938 | |
DDR Corp. | | | 20,640 | | | | 361,200 | |
Digital Realty Trust, Inc. | | | 3,270 | | | | 287,695 | |
Douglas Emmett, Inc. | | | 14,370 | | | | 466,307 | |
Education Realty Trust, Inc. | | | 9,010 | | | | 358,328 | |
Equinix, Inc. | | | 1,510 | | | | 498,828 | |
Equity LifeStyle Properties, Inc. | | | 4,150 | | | | 284,233 | |
Equity One, Inc. | | | 14,090 | | | | 398,747 | |
Equity Residential | | | 5,650 | | | | 384,596 | |
Extra Space Storage, Inc. | | | 3,240 | | | | 275,238 | |
Fibra Shop Portafolios Inmobiliarios S.A.P.I. de C.V. (Mexico) | | | 163,683 | | | | 157,930 | |
Forest City Realty Trust, Inc. - Class A | | | 32,360 | | | | 672,441 | |
General Growth Properties, Inc. | | | 14,320 | | | | 401,390 | |
HCP, Inc. | | | 6,630 | | | | 224,293 | |
Healthcare Realty Trust, Inc. | | | 9,080 | | | | 274,942 | |
Healthcare Trust of America, Inc. - Class A | | | 14,540 | | | | 420,061 | |
Host Hotels & Resorts, Inc. | | | 13,740 | | | | 217,367 | |
Kite Realty Group Trust | | | 8,827 | | | | 240,359 | |
Lamar Advertising Co. - Class A | | | 16,590 | | | | 1,029,244 | |
LaSalle Hotel Properties | | | 13,920 | | | | 332,688 | |
Mid-America Apartment Communities, Inc. | | | 7,370 | | | | 705,383 | |
NorthStar Realty Finance Corp. | | | 23,600 | | | | 301,844 | |
Outfront Media, Inc. | | | 70,980 | | | | 1,539,556 | |
Paramount Group, Inc. | | | 28,390 | | | | 474,113 | |
Pebblebrook Hotel Trust | | | 6,430 | | | | 177,725 | |
Pennsylvania Real Estate Investment Trust | | | 7,790 | | | | 178,703 | |
Physicians Realty Trust | | | 33,250 | | | | 602,822 | |
Prologis, Inc. | | | 20,350 | | | | 924,093 | |
Public Storage | | | 1,620 | | | | 396,592 | |
Retail Opportunity Investments Corp. | | | 42,140 | | | | 828,894 | |
Retail Properties of America, Inc. - Class A | | | 15,070 | | | | 240,969 | |
Rexford Industrial Realty, Inc. | | | 19,620 | | | | 368,267 | |
Simon Property Group, Inc. | | | 6,180 | | | | 1,243,231 | |
Sovran Self Storage, Inc. | | | 4,940 | | | | 524,727 | |
STORE Capital Corp. | | | 26,000 | | | | 667,420 | |
Tanger Factory Outlet Centers, Inc. | | | 7,640 | | | | 268,011 | |
Taubman Centers, Inc. | | | 4,240 | | | | 294,468 | |
Terreno Realty Corp. | | | 15,030 | | | | 342,233 | |
UDR, Inc. | | | 6,470 | | | | 225,932 | |
Urban Edge Properties | | | 18,540 | | | | 480,928 | |
Ventas, Inc. | | | 6,310 | | | | 391,977 | |
Vornado Realty Trust | | | 4,530 | | | | 433,657 | |
Welltower, Inc. | | | 5,670 | | | | 393,611 | |
Westfield Corp. (Australia)1 | | | 22,540 | | | | 172,152 | |
Weyerhaeuser Co. | | | 195,290 | | | | 6,272,715 | |
| | | | | | | | |
| | |
| | | | | | | 34,205,878 | |
| | | | | | | | |
Real Estate Management & Development - 0.3% | | | | | | | | |
CBRE Group, Inc. - Class A* | | | 5,880 | | | | 174,224 | |
First Capital Realty, Inc. (Canada) | | | 11,960 | | | | 193,598 | |
The accompanying notes are an integral part of the financial statements.
4
Investment Portfolio - April 30, 2016
(unaudited)
| | | | | | | | |
| PRO-BLEND® CONSERVATIVE TERM SERIES | | SHARES | | | VALUE (NOTE 2) | |
| | |
COMMON STOCKS (continued) | | | | | | | | |
| | |
Financials (continued) | | | | | | | | |
Real Estate Management & Development (continued) | | | | | | | | |
Realogy Holdings Corp.* | | | 81,320 | | | $ | 2,906,377 | |
| | | | | | | | |
| | | | | | | 3,274,199 | |
| | | | | | | | |
| | |
Total Financials | | | | | | | 60,083,575 | |
| | | | | | | | |
Health Care - 3.8% | | | | | | | | |
Biotechnology - 0.2% | | | | | | | | |
AbbVie, Inc. | | | 20,891 | | | | 1,274,351 | |
Amgen, Inc. | | | 9,005 | | | | 1,425,492 | |
| | | | | | | | |
| | |
| | | | | | | 2,699,843 | |
| | | | | | | | |
Health Care Equipment & Supplies - 0.7% | | | | | | | | |
Abbott Laboratories | | | 21,553 | | | | 838,412 | |
Medtronic plc | | | 104,280 | | | | 8,253,762 | |
| | | | | | | | |
| | |
| | | | | | | 9,092,174 | |
| | | | | | | | |
Health Care Providers & Services - 0.4% | | | | | | | | |
Brookdale Senior Living, Inc.* | | | 7,850 | | | | 144,911 | |
Express Scripts Holding Co.* | | | 57,360 | | | | 4,229,153 | |
| | | | | | | | |
| | |
| | | | | | | 4,374,064 | |
| | | | | | | | |
Health Care Technology - 0.6% | | | | | | | | |
Cerner Corp.* | | | 140,440 | | | | 7,884,302 | |
| | | | | | | | |
Pharmaceuticals - 1.9% | | | | | | | | |
Eli Lilly & Co. | | | 9,570 | | | | 722,822 | |
Johnson & Johnson | | | 112,990 | | | | 12,663,919 | |
Merck & Co., Inc. | | | 59,404 | | | | 3,257,715 | |
Pfizer, Inc. | | | 85,018 | | | | 2,780,939 | |
Roche Holding AG (Switzerland)1 | | | 3,550 | | | | 898,183 | |
Sanofi (France)1 | | | 10,080 | | | | 830,864 | |
Sanofi - ADR (France) | | | 38,122 | | | | 1,566,814 | |
Teva Pharmaceutical Industries Ltd. - ADR (Israel) | | | 17,204 | | | | 936,758 | |
| | | | | | | | |
| | |
| | | | | | | 23,658,014 | |
| | | | | | | | |
| | |
Total Health Care | | | | | | | 47,708,397 | |
| | | | | | | | |
Industrials - 2.2% | | | | | | | | |
Aerospace & Defense - 0.5% | | | | | | | | |
The Boeing Co. | | | 10,735 | | | | 1,447,078 | |
General Dynamics Corp. | | | 6,670 | | | | 937,268 | |
Honeywell International, Inc. | | | 11,040 | | | | 1,261,541 | |
Lockheed Martin Corp. | | | 5,349 | | | | 1,243,001 | |
Raytheon Co. | | | 6,333 | | | | 800,175 | |
United Technologies Corp. | | | 13,140 | | | | 1,371,422 | |
| | | | | | | | |
| | |
| | | | | | | 7,060,485 | |
| | | | | | | | |
Air Freight & Logistics - 0.2% | | | | | | | | |
United Parcel Service, Inc. - Class B | | | 23,714 | | | | 2,491,630 | |
| | | | | | | | |
Commercial Services & Supplies - 0.1% | | | | | | | | |
Waste Management, Inc. | | | 23,540 | | | | 1,383,917 | |
| | | | | | | | |
Electrical Equipment - 0.1% | | | | | | | | |
ABB Ltd. (Asea Brown Boveri) - ADR (Switzerland) | | | 45,636 | | | | 963,379 | |
Emerson Electric Co. | | | 14,392 | | | | 786,235 | |
| | | | | | | | |
| | |
| | | | | | | 1,749,614 | |
| | | | | | | | |
Industrial Conglomerates - 0.4% | | | | | | | | |
3M Co. | | | 17,359 | | | | 2,905,549 | |
General Electric Co. | | | 54,200 | | | | 1,666,650 | |
| | | | | | | | |
| | |
| | | | | | | 4,572,199 | |
| | | | | | | | |
Machinery - 0.6% | | | | | | | | |
Caterpillar, Inc. | | | 11,648 | | | | 905,283 | |
Flowserve Corp. | | | 90,680 | | | | 4,426,091 | |
Illinois Tool Works, Inc. | | | 7,773 | | | | 812,434 | |
Mueller Water Products, Inc. - Class A | | | 38,830 | | | | 417,422 | |
Pentair plc (United Kingdom) | | | 9,940 | | | | 577,315 | |
| | | | | | | | |
| | |
| | | | | | | 7,138,545 | |
| | | | | | | | |
Professional Services - 0.1% | | | | | | | | |
Nielsen Holdings plc | | | 18,510 | | | | 965,111 | |
| | | | | | | | |
Road & Rail - 0.2% | | | | | | | | |
Kansas City Southern | | | 13,270 | | | | 1,257,332 | |
Union Pacific Corp. | | | 20,474 | | | | 1,785,947 | |
| | | | | | | | |
| | |
| | | | | | | 3,043,279 | |
| | | | | | | | |
| | |
Total Industrials | | | | | | | 28,404,780 | |
| | | | | | | | |
Information Technology - 8.0% | | | | | | | | |
Communications Equipment - 0.2% | | | | | | | | |
Cisco Systems, Inc. | | | 91,336 | | | | 2,510,827 | |
Telefonaktiebolaget LM Ericsson - ADR (Sweden) | | | 73,714 | | | | 596,346 | |
| | | | | | | | |
| | |
| | | | | | | 3,107,173 | |
| | | | | | | | |
Electronic Equipment, Instruments & Components - 0.6% | | | | | | | | |
FLIR Systems, Inc. | | | 95,530 | | | | 2,885,961 | |
VeriFone Systems, Inc.* | | | 148,140 | | | | 4,216,064 | |
| | | | | | | | |
| | |
| | | | | | | 7,102,025 | |
| | | | | | | | |
Internet Software & Services - 1.2% | | | | | | | | |
Alphabet, Inc. - Class A* | | | 6,590 | | | | 4,664,929 | |
Alphabet, Inc. - Class C* | | | 6,560 | | | | 4,546,146 | |
Facebook, Inc. - Class A* | | | 49,780 | | | | 5,853,132 | |
| | | | | | | | |
| | |
| | | | | | | 15,064,207 | |
| | | | | | | | |
The accompanying notes are an integral part of the financial statements.
5
Investment Portfolio - April 30, 2016
(unaudited)
| | | | | | | | |
| PRO-BLEND® CONSERVATIVE TERM SERIES | | SHARES/ PRINCIPAL
AMOUNT3 | | | VALUE (NOTE 2) | |
| | |
COMMON STOCKS (continued) | | | | | | | | |
| | |
Information Technology (continued) | | | | | | | | |
IT Services - 2.1% | | | | | | | | |
Automatic Data Processing, Inc. | | | 9,532 | | | $ | 843,010 | |
Broadridge Financial Solutions, Inc. | | | 18,150 | | | | 1,086,096 | |
International Business Machines Corp. | | | 12,492 | | | | 1,823,082 | |
InterXion Holding N.V. - ADR (Netherlands)* | | | 11,940 | | | | 404,527 | |
MasterCard, Inc. - Class A | | | 103,880 | | | | 10,075,321 | |
PayPal Holdings, Inc.* | | | 143,530 | | | | 5,623,505 | |
Visa, Inc. - Class A2 | | | 72,720 | | | | 5,616,893 | |
Xerox Corp. | | | 72,520 | | | | 696,192 | |
| | | | | | | | |
| | |
| | | | | | | 26,168,626 | |
| | | | | | | | |
Semiconductors & Semiconductor Equipment - 1.4% | | | | | | | | |
Intel Corp. | | | 68,632 | | | | 2,078,177 | |
QUALCOMM, Inc. | | | 275,590 | | | | 13,922,807 | |
Taiwan Semiconductor Manufacturing Co. Ltd. - ADR (Taiwan) | | | 60,294 | | | | 1,422,335 | |
Texas Instruments, Inc. | | | 18,482 | | | | 1,054,213 | |
| | | | | | | | |
| | |
| | | | | | | 18,477,532 | |
| | | | | | | | |
Software - 1.6% | | | | | | | | |
Electronic Arts, Inc.* | | | 129,680 | | | | 8,020,708 | |
Microsoft Corp. | | | 96,012 | | | | 4,788,118 | |
ServiceNow, Inc.* | | | 111,410 | | | | 7,963,587 | |
| | | | | | | | |
| | |
| | | | | | | 20,772,413 | |
| | | | | | | | |
Technology Hardware, Storage & Peripherals - 0.9% | | | | | | | | |
Apple, Inc. | | | 99,100 | | | | 9,289,634 | |
Canon, Inc. - ADR (Japan) | | | 27,621 | | | | 771,455 | |
EMC Corp. | | | 33,520 | | | | 875,207 | |
| | | | | | | | |
| | |
| | | | | | | 10,936,296 | |
| | | | | | | | |
| | |
Total Information Technology | | | | | | | 101,628,272 | |
| | | | | | | | |
Materials - 2.7% | | | | | | | | |
Chemicals - 1.8% | | | | | | | | |
Ashland, Inc. | | | 71,420 | | | | 7,970,472 | |
The Dow Chemical Co. | | | 34,020 | | | | 1,789,792 | |
E.I. du Pont de Nemours & Co. | | | 11,340 | | | | 747,419 | |
LyondellBasell Industries N.V. - Class A | | | 9,143 | | | | 755,852 | |
Monsanto Co. | | | 111,056 | | | | 10,403,726 | |
Praxair, Inc. | | | 6,273 | | | | 736,827 | |
RPM International, Inc. | | | 18,250 | | | | 922,172 | |
| | | | | | | | |
| | |
| | | | | | | 23,326,260 | |
| | | | | | | | |
Containers & Packaging - 0.3% | | | | | | | | |
Avery Dennison Corp. | | | 9,120 | | | | 662,203 | |
Bemis Co., Inc. | | | 15,400 | | | | 772,772 | |
Graphic Packaging Holding Co. | | | 95,750 | | | | 1,271,560 | |
Sonoco Products Co. | | | 21,770 | | | | 1,020,795 | |
| | | | | | | | |
| | |
| | | | | | | 3,727,330 | |
| | | | | | | | |
Metals & Mining - 0.6% | | | | | | | | |
Alcoa, Inc. | | | 613,370 | | | | 6,851,343 | |
| | | | | | | | |
| | |
Total Materials | | | | | | | 33,904,933 | |
| | | | | | | | |
Telecommunication Services - 0.1% | | | | | | | | |
Wireless Telecommunication Services - 0.1% | | | | | | | | |
NTT DOCOMO, Inc. - ADR (Japan) | | | 60,982 | | | | 1,484,302 | |
| | | | | | | | |
Utilities - 0.1% | | | | | | | | |
Electric Utilities - 0.1% | | | | | | | | |
Eversource Energy | | | 11,010 | | | | 621,404 | |
Exelon Corp. | | | 11,720 | | | | 411,255 | |
| | | | | | | | |
| | |
| | | | | | | 1,032,659 | |
| | | | | | | | |
Multi-Utilities - 0.0%## | | | | | | | | |
CMS Energy Corp. | | | 17,020 | | | | 692,374 | |
| | | | | | | | |
Total Utilities | | | | | | | 1,725,033 | |
| | | | | | | | |
TOTAL COMMON STOCKS (Identified Cost $395,041,563) | | | | | | | 414,485,367 | |
| | | | | | | | |
CORPORATE BONDS - 17.8% | | | | | | | | |
Non-Convertible Corporate Bonds - 17.8% | | | | | | | | |
Consumer Discretionary - 1.7% | | | | | | | | |
Auto Components - 0.2% | | | | | | | | |
Magna International, Inc. (Canada), 4.15%, 10/1/2025 | | | 1,650,000 | | | | 1,770,513 | |
Techniplas LLC4, 10.00%, 5/1/2020 | | | 965,000 | | | | 675,500 | |
| | | | | | | | |
| | | | | | | 2,446,013 | |
| | | | | | | | |
Diversified Consumer Services - 0.4% | | | | | | | | |
Block Financial LLC, 5.50%, 11/1/2022 | | | 4,990,000 | | | | 5,383,846 | |
| | | | | | | | |
Hotels, Restaurants & Leisure - 0.1% | | | | | | | | |
MGM Resorts International, 10.00%, 11/1/2016 | | | 765,000 | | | | 796,594 | |
| | | | | | | | |
Household Durables - 0.6% | | | | | | | | |
Brookfield Residential Properties, Inc. - Brookfield Residential US Corp. (Canada)4, 6.125%, 7/1/2022 | | | 1,370,000 | | | | 1,268,647 | |
Lennar Corp., 12.25%, 6/1/2017 | | | 720,000 | | | | 793,800 | |
Meritage Homes Corp., 7.15%, 4/15/2020 | | | 575,000 | | | | 612,375 | |
Meritage Homes Corp., 7.00%, 4/1/2022 | | | 620,000 | | | | 664,950 | |
The accompanying notes are an integral part of the financial statements.
6
Investment Portfolio - April 30, 2016
(unaudited)
| | | | | | | | | | |
| PRO-BLEND® CONSERVATIVE TERM SERIES | | PRINCIPAL
AMOUNT3 | | | VALUE (NOTE 2) | | | |
| | | |
CORPORATE BONDS (continued) | | | | | | | | | | |
| | | |
Non-Convertible Corporate Bonds (continued) | | | | | | | | | | |
Consumer Discretionary (continued) | | | | | | | | | | |
Household Durables (continued) | | | | | | | | | | |
NVR, Inc., 3.95%, 9/15/2022 | | | 2,620,000 | | | $ | 2,677,320 | | | |
TRI Pointe Group, Inc. - TRI Pointe Homes, Inc., 4.375%, 6/15/2019 | | | 765,000 | | | | 766,912 | | | |
Weekley Homes LLC - Weekley Finance Corp., 6.00%, 2/1/2023 | | | 1,065,000 | | | | 990,450 | | | |
| | | | | | | | | | |
| | | |
| | | | | | | 7,774,454 | | | |
| | | | | | | | | | |
Media - 0.3% | | | | | | | | | | |
CCO Holdings LLC - CCO Holdings Capital Corp.4, 5.875%, 4/1/2024 | | | 750,000 | | | | 785,625 | | | |
Columbus International, Inc. (Barbados)4, 7.375%, 3/30/2021 | | | 735,000 | | | | 780,717 | | | |
Sinclair Television Group, Inc.4, 5.625%, 8/1/2024 | | | 615,000 | | | | 631,912 | | | |
VTR Finance B.V. (Netherlands)4, 6.875%, 1/15/2024 | | | 1,315,000 | | | | 1,313,356 | | | |
| | | | | | | | | | |
| | | |
| | | | | | | 3,511,610 | | | |
| | | | | | | | | | |
Multiline Retail - 0.1% | | | | | | | | | | |
Dollar General Corp., 3.25%, 4/15/2023 | | | 1,650,000 | | | | 1,662,788 | | | |
| | | | | | | | | | |
| | | |
Total Consumer Discretionary | | | | | | | 21,575,305 | | | |
| | | | | | | | | | |
Consumer Staples - 1.1% | | | | | | | | | | |
Beverages - 0.6% | | | | | | | | | | |
Anheuser-Busch InBev Worldwide, Inc. (Belgium), 7.75%, 1/15/2019 | | | 1,215,000 | | | | 1,414,872 | | | |
Anheuser-Busch InBev Worldwide, Inc. (Belgium), 8.20%, 1/15/2039 | | | 2,545,000 | | | | 3,947,203 | | | |
PepsiCo, Inc., 3.10%, 7/17/2022 | | | 2,880,000 | | | | 3,067,638 | | | |
| | | | | | | | | | |
| | | |
| | | | | | | 8,429,713 | | | |
| | | | | | | | | | |
Food & Staples Retailing - 0.3% | | | | | | | | | | |
C&S Group Enterprises LLC4, 5.375%, 7/15/2022 | | | 990,000 | | | | 950,400 | | | |
CVS Health Corp., 3.50%, 7/20/2022 | | | 1,440,000 | | | | 1,533,044 | | | |
The Kroger Co., 2.60%, 2/1/2021 | | | 920,000 | | | | 946,943 | | | |
| | | | | | | | | | |
| | | |
| | | | | | | 3,430,387 | | | |
| | | | | | | | | | |
Food Products - 0.1% | | | | | | | | | | |
Pinnacle Operating Corp.4, 9.00%, 11/15/2020 | | | 1,190,000 | | | | 1,011,500 | | | |
| | | | | | | | | | |
Household Products - 0.1% | | | | | | | | | | |
HRG Group, Inc., 7.75%, 1/15/2022 | | | 940,000 | | | | 940,000 | | | |
| | | | | | | | | | |
| | | |
Total Consumer Staples | | | | | | | 13,811,600 | | | |
| | | | | | | | | | |
Energy - 2.2% | | | | | | | | | | |
Energy Equipment & Services - 0.6% | | | | | | | | | | |
Baker Hughes, Inc., 7.50%, 11/15/2018 | | | 1,235,000 | | | | 1,388,291 | | | |
Ensco plc, 5.20%, 3/15/2025 | | | 2,030,000 | | | | 1,479,362 | | | |
FTS International, Inc., 6.25%, 5/1/2022 | | | 620,000 | | | | 96,410 | | | |
Pride International, Inc., 8.50%, 6/15/2019 | | | 700,000 | | | | 703,500 | | | |
Schlumberger Holdings Corp.4, 3.625%, 12/21/2022 | | | 2,710,000 | | | | 2,823,338 | | | |
TerraForm Global Operating LLC4, 9.75%, 8/15/2022 | | | 920,000 | | | | 815,350 | | | |
| | | | | | | | | | |
| | | |
| | | | | | | 7,306,251 | | | |
| | | | | | | | | | |
Oil, Gas & Consumable Fuels - 1.6% | | | | | | | | | | |
Carrizo Oil & Gas, Inc., 6.25%, 4/15/2023 | | | 170,000 | | | | 163,200 | | | |
Chevron Corp., 1.79%, 11/16/2018 | | | 1,585,000 | | | | 1,605,188 | | | |
Columbia Pipeline Group, Inc.4, 4.50%, 6/1/2025 | | | 1,450,000 | | | | 1,495,252 | | | |
Crestwood Midstream Partners LP - Crestwood Midstream Finance Corp., 6.125%, 3/1/2022 | | | 395,000 | | | | 360,438 | | | |
Hiland Partners LP - Hiland Partners Finance Corp.4, 7.25%, 10/1/2020 | | | 3,540,000 | | | | 3,703,725 | | | |
Hilcorp Energy I LP - Hilcorp Finance Co.4, 5.75%, 10/1/2025 | | | 170,000 | | | | 160,225 | | | |
Kinder Morgan, Inc.4, 5.625%, 11/15/2023 | | | 2,800,000 | | | | 2,894,041 | | | |
Oasis Petroleum, Inc., 6.875%, 1/15/2023 | | | 175,000 | | | | 157,062 | | | |
PBF Holding Co. LLC - PBF Finance Corp.4, 7.00%, 11/15/2023 | | | 610,000 | | | | 594,750 | | | |
Petrobras Global Finance B.V. (Brazil)5, 2.238%, 5/20/2016 | | | 4,415,000 | | | | 4,411,689 | | | |
Petroleos Mexicanos (Mexico), 4.50%, 1/23/2026 | | | 2,880,000 | | | | 2,740,032 | | | |
Sabine Pass Liquefaction LLC, 5.625%, 2/1/2021 | | | 1,385,000 | | | | 1,376,344 | | | |
Transocean, Inc., 3.75%, 10/15/2017 | | | 335,000 | | | | 321,600 | | | |
Weatherford International LLC, 6.35%, 6/15/2017 | | | 335,000 | | | | 340,025 | | | |
WPX Energy, Inc., 6.00%, 1/15/2022 | | | 350,000 | | | | 315,000 | | | |
| | | | | | | | | | |
| | | |
| | | | | | | 20,638,571 | | | |
| | | | | | | | | | |
| | | |
Total Energy | | | | | | | 27,944,822 | | | |
| | | | | | | | | | |
The accompanying notes are an integral part of the financial statements.
7
Investment Portfolio - April 30, 2016
(unaudited)
| | | | | | | | | | | | | | |
| PRO-BLEND® CONSERVATIVE TERM SERIES | | | | | PRINCIPAL
AMOUNT 3 | | | VALUE (NOTE 2) | | | |
| | | | |
CORPORATE BONDS (continued) | | | | | | | | | | | | | | |
| | | | |
Non-Convertible Corporate Bonds (continued) | | | | | | | | | | | | | | |
Financials - 7.1% | | | | | | | | | | | | | | |
Banks - 1.9% | | | | | | | | | | | | | | |
Bank of America Corp., 5.70%, 5/2/2017 | | | | | | | 1,100,000 | | | $ | 1,143,771 | | | |
Barclays Bank plc (United Kingdom)4, 10.179%, 6/12/2021 | | | | | | | 2,200,000 | | | | 2,799,331 | | | |
CIT Group, Inc., 4.25%, 8/15/2017 | | | | | | | 815,000 | | | | 826,716 | | | |
Citigroup, Inc., 3.875%, 3/26/2025 | | | | | | | 1,885,000 | | | | 1,872,465 | | | |
Commonwealth Bank of Australia (Australia), 5.75%, 1/25/2017 | | | AUD | | | | 300,000 | | | | 233,455 | | | |
Cooperatieve Rabobank U.A. (Netherlands)6,7, 8.375% | | | | | | | 1,000,000 | | | | 1,011,251 | | | |
Cooperatieve Rabobank U.A. (Netherlands)6,8, 8.40% | | | | | | | 850,000 | | | | 894,837 | | | |
Intesa Sanpaolo S.p.A. (Italy), 3.875%, 1/15/2019 | | | | | | | 1,975,000 | | | | 2,045,891 | | | |
Intesa Sanpaolo S.p.A. (Italy)4, 6.50%, 2/24/2021 | | | | | | | 1,400,000 | | | | 1,601,879 | | | |
JPMorgan Chase & Co., 4.95%, 3/25/2020 | | | | | | | 1,255,000 | | | | 1,382,587 | | | |
Lloyds Bank plc (United Kingdom)4,6,9, 12.00% | | | | | | | 945,000 | | | | 1,241,494 | | | |
Lloyds Bank plc (United Kingdom)5, 9.875%, 12/16/2021 | | | | | | | 1,247,000 | | | | 1,304,549 | | | |
Lloyds Banking Group plc (United Kingdom)4, 4.582%, 12/10/2025 | | | | | | | 3,740,000 | | | | 3,749,788 | | | |
Popular, Inc., 7.00%, 7/1/2019 | | | | | | | 1,195,000 | | | | 1,165,125 | | | |
Royal Bank of Canada (Canada), 3.77%, 3/30/2018 | | | CAD | | | | 340,000 | | | | 283,677 | | | |
Santander Bank N.A., 8.75%, 5/30/2018 | | | | | | | 1,225,000 | | | | 1,373,556 | | | |
Santander Holdings USA, Inc., 2.65%, 4/17/2020 | | | | | | | 1,565,000 | | | | 1,559,436 | | | |
Westpac Banking Corp. (Australia), 5.75%, 2/6/2017 | | | AUD | | | | 300,000 | | | | 233,676 | | | |
| | | | | | | | | | | | | | |
| | | | |
| | | | | | | | | | | 24,723,484 | | | |
| | | | | | | | | | | | | | |
Capital Markets - 1.9% | | | | | | | | | | | | | | |
The Goldman Sachs Group, Inc.5, 1.718%, 11/15/2018 | | | | | | | 6,350,000 | | | | 6,365,850 | | | |
The Goldman Sachs Group, Inc., 5.375%, 3/15/2020 | | | | | | | 6,125,000 | | | | 6,807,668 | | | |
The Goldman Sachs Group, Inc.5, 2.236%, 11/29/2023 | | | | | | | 1,415,000 | | | | 1,412,265 | | | |
The Goldman Sachs Group, Inc., 4.25%, 10/21/2025 | | | | | | | 1,625,000 | | | | 1,659,237 | | | |
Morgan Stanley, 2.125%, 4/25/2018 | | | | | | | 5,900,000 | | | | 5,952,539 | | | |
Morgan Stanley, 5.00%, 11/24/2025 | | | | | | | 1,200,000 | | | | 1,306,138 | | | |
| | | | | | | | | | | | | | |
| | | | |
| | | | | | | | | | | 23,503,697 | | | |
| | | | | | | | | | | | | | |
Consumer Finance - 0.2% | | | | | | | | | | | | | | |
Ally Financial, Inc., 2.75%, 1/30/2017 | | | | | | | 840,000 | | | | 838,950 | | | |
Ally Financial, Inc., 8.00%, 12/31/2018 | | | | | | | 40,000 | | | | 43,750 | | | |
Navient Corp., 6.00%, 1/25/2017 | | | | | | | 800,000 | | | | 813,000 | | | |
Navient Corp., 6.125%, 3/25/2024 | | | | | | | 1,255,000 | | | | 1,123,853 | | | |
| | | | | | | | | | | | | | |
| | | | |
| | | | | | | | | | | 2,819,553 | | | |
| | | | | | | | | | | | | | |
Diversified Financial Services - 0.1% | | | | | | | | | | | | | | |
Jefferies Finance LLC - JFIN Co-Issuer Corp.4, 7.375%, 4/1/2020 | | | | | | | 790,000 | | | | 728,775 | | | |
Jefferies Finance LLC - JFIN Co-Issuer Corp.4, 6.875%, 4/15/2022 | | | | | | | 590,000 | | | | 516,250 | | | |
| | | | | | | | | | | | | | |
| | | | |
| | | | | | | | | | | 1,245,025 | | | |
| | | | | | | | | | | | | | |
Insurance - 2.0% | | | | | | | | | | | | | | |
Aegon N.V. (Netherlands)5,6, 1.74% | | | | | | | 2,195,000 | | | | 1,341,037 | | | |
American International Group, Inc., 4.875%, 6/1/2022 | | | | | | | 9,095,000 | | | | 9,982,999 | | | |
Assured Guaranty US Holdings, Inc., 5.00%, 7/1/2024 | | | | | | | 6,735,000 | | | | 7,167,225 | | | |
AXA S.A. (France)5,6, 1.825% | | | | | | | 2,900,000 | | | | 1,987,428 | | | |
First American Financial Corp., 4.30%, 2/1/2023 | | | | | | | 1,145,000 | | | | 1,161,275 | | | |
Prudential Financial, Inc.10, 5.875%, 9/15/2042 | | | | | | | 3,180,000 | | | | 3,436,785 | | | |
| | | | | | | | | | | | | | |
| | | | |
| | | | | | | | | | | 25,076,749 | | | |
| | | | | | | | | | | | | | |
Real Estate Investment Trusts (REITS) - 0.6% | | | | | | | | | | | | | | |
Crown Castle Towers LLC4, 6.113%, 1/15/2020 | | | | | | | 390,000 | | | | 431,950 | | | |
Crown Castle Towers LLC4, 4.883%, 8/15/2020 | | | | | | | 224,000 | | | | 239,543 | | | |
Crown Castle Towers LLC4, 3.222%, 5/15/2022 | | | | | | | 1,590,000 | | | | 1,616,458 | | | |
Greystar Real Estate Partners LLC4, 8.25%, 12/1/2022 | | | | | | | 765,000 | | | | 795,600 | | | |
Welltower, Inc., 4.95%, 1/15/2021 | | | | | | | 4,100,000 | | | | 4,498,167 | | | |
| | | | | | | | | | | | | | |
| | | | |
| | | | | | | | | | | 7,581,718 | | | |
| | | | | | | | | | | | | | |
Real Estate Management & Development - 0.1% | | | | | | | | | | | | | | |
Forestar USA Real Estate Group, Inc.4, 8.50%, 6/1/2022 | | | | | | | 615,000 | | | | 627,300 | | | |
| | | | | | | | | | | | | | |
Thrifts & Mortgage Finance - 0.3% | | | | | | | | | | | | | | |
Ladder Capital Finance Holdings LLLP - Ladder Capital Finance Corp., 7.375%, 10/1/2017 | | | | | | | 1,050,000 | | | | 1,052,625 | | | |
The accompanying notes are an integral part of the financial statements.
8
Investment Portfolio - April 30, 2016
(unaudited)
| | | | | | | | | | | | |
| PRO-BLEND® CONSERVATIVE TERM SERIES | | | | PRINCIPAL
AMOUNT3 | | | VALUE (NOTE 2) | | | |
| | | | |
CORPORATE BONDS (continued) | | | | | | | | | | | | |
| | | | |
Non-Convertible Corporate Bonds (continued) | | | | | | | | | | | | |
Financials (continued) | | | | | | | | | | | | |
Thrifts & Mortgage Finance (continued) | | | | | | | | | | | | |
Ladder Capital Finance Holdings LLLP - Ladder Capital Finance Corp.4, 5.875%, 8/1/2021 | | | | | 1,370,000 | | | $ | 1,205,600 | | | |
Radian Group, Inc., 7.00%, 3/15/2021 | | | | | 610,000 | | | | 650,412 | | | |
Rialto Holdings LLC - Rialto Corp.4, 7.00%, 12/1/2018 | | | | | 1,475,000 | | | | 1,445,500 | | | |
| | | | | | | | | | | | |
| | | | |
| | | | | | | | | 4,354,137 | | | |
| | | | | | | | | | | | |
| | | | |
Total Financials | | | | | | | | | 89,931,663 | | | |
| | | | | | | | | | | | |
Health Care - 0.4% | | | | | | | | | | | | |
Biotechnology - 0.1% | | | | | | | | | | | | |
AMAG Pharmaceuticals, Inc.4, 7.875%, 9/1/2023 | | | | | 1,415,000 | | | | 1,269,961 | | | |
| | | | | | | | | | | | |
Health Care Providers & Services - 0.1% | | | | | | | | | | | | |
HCA, Inc., 7.50%, 2/15/2022 | | | | | 550,000 | | | | 622,875 | | | |
Tenet Healthcare Corp.4,5, 4.134%, 6/15/2020 | | | | | 635,000 | | | | 635,794 | | | |
Tenet Healthcare Corp., 8.125%, 4/1/2022 | | | | | 615,000 | | | | 638,062 | | | |
| | | | | | | | | | | | |
| | | | |
| | | | | | | | | 1,896,731 | | | |
| | | | | | | | | | | | |
Pharmaceuticals - 0.2% | | | | | | | | | | | | |
Concordia Healthcare Corp. (Canada)4, 7.00%, 4/15/2023 | | | | | 930,000 | | | | 862,575 | | | |
Horizon Pharma Financing, Inc.4, 6.625%, 5/1/2023 | | | | | 765,000 | | | | 696,150 | | | |
Mallinckrodt International Finance S.A. - Mallinckrodt CB LLC4, 5.625%, 10/15/2023 | | | | | 930,000 | | | | 871,875 | | | |
| | | | | | | | | | | | |
| | | | |
| | | | | | | | | 2,430,600 | | | |
| | | | | | | | | | | | |
| | | | |
Total Health Care | | | | | | | | | 5,597,292 | | | |
| | | | | | | | | | | | |
Industrials - 2.1% | | | | | | | | | | | | |
Aerospace & Defense - 0.1% | | | | | | | | | | | | |
DigitalGlobe, Inc.4, 5.25%, 2/1/2021 | | | | | 1,399,000 | | | | 1,264,346 | | | |
| | | | | | | | | | | | |
Air Freight & Logistics - 0.0%## | | | | | | | | | | | | |
Neovia Logistics Intermediate Holdings LLC - Logistics Intermediate Finance Corp.4,11, 10.00%, 2/15/2018 | | | | | 630,000 | | | | 331,537 | | | |
| | | | | | | | | | | | |
Airlines - 0.5% | | | | | | | | | | | | |
Allegiant Travel Co., 5.50%, 7/15/2019 | | | | | 910,000 | | | | 936,731 | | | |
American Airlines Pass-Through Trust, Series 2013-2, Class A, 4.95%, 1/15/2023 | | | | | 2,365,042 | | | | 2,539,464 | | | |
Southwest Airlines Co., 2.75%, 11/6/2019 | | | | | 1,530,000 | | | | 1,572,584 | | | |
Southwest Airlines Co., 2.65%, 11/5/2020 | | | | | 600,000 | | | | 609,982 | | | |
| | | | | | | | | | | | |
| | | | |
| | | | | | | | | 5,658,761 | | | |
| | | | | | | | | | | | |
Commercial Services & Supplies - 0.1% | | | | | | | | | | | | |
Constellis Holdings LLC - Constellis Finance Corp.4, 9.75%, 5/15/2020 | | | | | 780,000 | | | | 705,900 | | | |
Modular Space Corp.4, 10.25%, 1/31/2019 | | | | | 662,000 | | | | 340,930 | | | |
| | | | | | | | | | | | |
| | | | |
| | | | | | | | | 1,046,830 | | | |
| | | | | | | | | | | | |
Industrial Conglomerates - 0.2% | | | | | | | | | | | | |
General Electric Co.5, 1.013%, 5/5/2026 | | | | | 2,385,000 | | | | 2,199,962 | | | |
Siemens Financieringsmaatschappij N.V. (Germany)4, 2.90%, 5/27/2022 | | | | | 500,000 | | | | 523,181 | | | |
| | | | | | | | | | | | |
| | | | |
| | | | | | | | | 2,723,143 | | | |
| | | | | | | | | | | | |
Machinery - 0.1% | | | | | | | | | | | | |
Case New Holland Industrial, Inc. (United Kingdom), 7.875%, 12/1/2017 | | | | | 765,000 | | | | 814,725 | | | |
Waterjet Holdings, Inc.4, 7.625%, 2/1/2020 | | | | | 630,000 | | | | 629,212 | | | |
| | | | | | | | | | | | |
| | | | |
| | | | | | | | | 1,443,937 | | | |
| | | | | | | | | | | | |
Trading Companies & Distributors - 1.1% | | | | | | | | | | | | |
Air Lease Corp., 3.375%, 6/1/2021 | | | | | 1,300,000 | | | | 1,303,250 | | | |
Aircastle Ltd., 5.50%, 2/15/2022 | | | | | 590,000 | | | | 627,613 | | | |
Aviation Capital Group Corp.4, 3.875%, 9/27/2016 | | | | | 4,145,000 | | | | 4,171,114 | | | |
Aviation Capital Group Corp.4, 2.875%, 9/17/2018 | | | | | 1,700,000 | | | | 1,696,991 | | | |
Fly Leasing Ltd. (Ireland), 6.375%, 10/15/2021 | | | | | 1,160,000 | | | | 1,136,800 | | | |
International Lease Finance Corp., 5.75%, 5/15/2016 | | | | | 1,095,000 | | | | 1,095,690 | | | |
International Lease Finance Corp.5, 2.584%, 6/15/2016 | | | | | 1,980,000 | | | | 1,982,321 | | | |
International Lease Finance Corp., 8.75%, 3/15/2017 | | | | | 1,485,000 | | | | 1,563,705 | | | |
International Lease Finance Corp., 6.25%, 5/15/2019 | | | | | 205,000 | | | | 222,425 | | | |
| | | | | | | | | | | | |
| | | | |
| | | | | | | | | 13,799,909 | | | |
| | | | | | | | | | | | |
| | | | |
Total Industrials | | | | | | | | | 26,268,463 | | | |
| | | | | | | | | | | | |
The accompanying notes are an integral part of the financial statements.
9
Investment Portfolio - April 30, 2016
(unaudited)
| | | | | | | | | | | | |
| PRO-BLEND® CONSERVATIVE TERM SERIES | | | | PRINCIPAL
AMOUNT3 | | | VALUE (NOTE 2) | | | |
| | | | |
CORPORATE BONDS (continued) | | | | | | | | | | | | |
| | | | |
Non-Convertible Corporate Bonds (continued) | | | | | | | | | | | | |
Information Technology - 0.6% | | | | | | | | | | | | |
Internet Software & Services - 0.0%## | | | | | | | | | | | | |
VeriSign, Inc., 5.25%, 4/1/2025 | | | | | 310,000 | | | $ | 318,525 | | | |
| | | | | | | | | | | | |
IT Services - 0.3% | | | | | | | | | | | | |
Automatic Data Processing, Inc., 2.25%, 9/15/2020 | | | | | 1,900,000 | | | | 1,960,922 | | | |
Visa, Inc., 2.80%, 12/14/2022 | | | | | 1,560,000 | | | | 1,627,225 | | | |
| | | | | | | | | | | | |
| | | | |
| | | | | | | | | 3,588,147 | | | |
| | | | | | | | | | | | |
Semiconductors & Semiconductor Equipment - 0.1% | | | | | | | | | | | | |
Intel Corp., 2.45%, 7/29/2020 | | | | | 1,440,000 | | | | 1,489,117 | | | |
| | | | | | | | | | | | |
Technology Hardware, Storage & Peripherals - 0.2% | | | | | | | | | | | | |
Diebold, Inc.4, 8.50%, 4/15/2024 | | | | | 600,000 | | | | 607,500 | | | |
Hewlett Packard Enterprise Co.4, 2.45%, 10/5/2017 | | | | | 1,400,000 | | | | 1,415,662 | | | |
Western Digital Corp.4, 10.50%, 4/1/2024 | | | | | 635,000 | | | | 617,537 | | | |
| | | | | | | | | | | | |
| | | | |
| | | | | | | | | 2,640,699 | | | |
| | | | | | | | | | | | |
| | | | |
Total Information Technology | | | | | | | | | 8,036,488 | | | |
| | | | | | | | | | | | |
Materials - 1.0% | | | | | | | | | | | | |
Chemicals - 0.4% | | | | | | | | | | | | |
Consolidated Energy Finance S.A. (Trinidad-Tobago)4, 6.75%, 10/15/2019 | | | | | 1,340,000 | | | | 1,266,300 | | | |
The Dow Chemical Co., 8.55%, 5/15/2019 | | | | | 2,390,000 | | | | 2,854,062 | | | |
Solvay Finance America LLC (Belgium)4, 3.40%, 12/3/2020 | | | | | 1,400,000 | | | | 1,449,262 | | | |
| | | | | | | | | | | | |
| | | | |
| | | | | | | | | 5,569,624 | | | |
| | | | | | | | | | | | |
Containers & Packaging - 0.1% | | | | | | | | | | | | |
Ardagh Packaging Finance plc - Ardagh Holdings USA, Inc. (Ireland)4,5, 3.634%, 12/15/2019 | | | | | 645,000 | | | | 651,369 | | | |
| | | | | | | | | | | | |
Metals & Mining - 0.4% | | | | | | | | | | | | |
Alcoa, Inc., 5.87%, 2/23/2022 | | | | | 970,000 | | | | 989,400 | | | |
Anglo American Capital plc (United Kingdom)4, 3.625%, 5/14/2020 | | | | | 200,000 | | | | 188,000 | | | |
ArcelorMittal (Luxembourg), 10.85%, 6/1/2019 | | | | | 280,000 | | | | 320,600 | | | |
FMG Resources August 2006 Pty Ltd. (Australia)4, 6.875%, 4/1/2022 | | | | | 165,000 | | | | 150,150 | | | |
Rio Tinto Finance USA Ltd. (United Kingdom), 3.75%, 9/20/2021 | | | | | 2,990,000 | | | | 3,172,094 | | | |
SunCoke Energy Partners LP - SunCoke Energy Partners Finance Corp.4, 7.375%, 2/1/2020 | | | | | 925,000 | | | | 707,625 | | | |
| | | | | | | | | | | | |
| | | | |
| | | | | | | | | 5,527,869 | | | |
| | | | | | | | | | | | |
Paper & Forest Products - 0.1% | | | | | | | | | | | | |
Domtar Corp., 4.40%, 4/1/2022 | | | | | 1,465,000 | | | | 1,503,412 | | | |
| | | | | | | | | | | | |
| | | | |
Total Materials | | | | | | | | | 13,252,274 | | | |
| | | | | | | | | | | | |
Telecommunication Services - 1.2% | | | | | | | | | | | | |
Diversified Telecommunication Services - 0.7% | | | | | | | | | | | | |
AT&T, Inc., 5.20%, 3/15/2020 | | | | | 3,140,000 | | | | 3,497,184 | | | |
CenturyLink, Inc., 7.50%, 4/1/2024 | | | | | 1,245,000 | | | | 1,248,113 | | | |
Embarq Corp., 7.082%, 6/1/2016 | | | | | 840,000 | | | | 843,888 | | | |
Frontier Communications Corp.4, 11.00%, 9/15/2025 | | | | | 1,560,000 | | | | 1,575,600 | | | |
Inmarsat Finance plc (United Kingdom)4, 4.875%, 5/15/2022 | | | | | 1,085,000 | | | | 1,030,750 | | | |
Numericable-SFR S.A. (France)4, 6.25%, 5/15/2024 | | | | | 170,000 | | | | 164,475 | | | |
WideOpenWest Finance LLC - WideOpenWest Capital Corp., 10.25%, 7/15/2019 | | | | | 115,000 | | | | 115,287 | | | |
| | | | | | | | | | | | |
| | | | |
| | | | | | | | | 8,475,297 | | | |
| | | | | | | | | | | | |
Wireless Telecommunication Services - 0.5% | | | | | | | | | | | | |
Altice Financing S.A. (Luxembourg)4, 6.625%, 2/15/2023 | | | | | 2,255,000 | | | | 2,229,744 | | | |
SBA Tower Trust4, 3.598%, 4/15/2018 | | | | | 2,505,000 | | | | 2,501,251 | | | |
Sixsigma Networks Mexico S.A. de C.V. (Mexico)4, 8.25%, 11/7/2021 | | | | | 895,000 | | | | 859,200 | | | |
T-Mobile USA, Inc., 6.836%, 4/28/2023 | | | | | 735,000 | | | | 783,694 | | | |
Wind Acquisition Finance S.A. (Italy)4, 4.75%, 7/15/2020 | | | | | 715,000 | | | | 682,468 | | | |
| | | | | | | | | | | | |
| | | | |
| | | | | | | | | 7,056,357 | | | |
| | | | | | | | | | | | |
| | | | |
Total Telecommunication Services | | | | | | | | | 15,531,654 | | | |
| | | | | | | | | | | | |
Utilities - 0.4% | | | | | | | | | | | | |
Independent Power and Renewable Electricity Producers - 0.4% | | | | | | | | | | | | |
Abengoa Yield plc (Spain)4, 7.00%, 11/15/2019 | | | | | 1,165,000 | | | | 1,106,750 | | | |
ContourGlobal Power Holdings S.A. (France)4, 7.125%, 6/1/2019 | | | | | 820,000 | | | | 811,800 | | | |
NRG Energy, Inc., 6.25%, 7/15/2022 | | | | | 700,000 | | | | 686,224 | | | |
Talen Energy Supply LLC4, 4.625%, 7/15/2019 | | | | | 1,255,000 | | | | 1,167,150 | | | |
The accompanying notes are an integral part of the financial statements.
10
Investment Portfolio - April 30, 2016
(unaudited)
| | | | | | | | | | | | |
| PRO-BLEND® CONSERVATIVE TERM SERIES | | | | PRINCIPAL
AMOUNT3/ SHARES | | | VALUE (NOTE 2) | | | |
| | | | |
CORPORATE BONDS (continued) | | | | | | | | | | | | |
| | | | |
Non-Convertible Corporate Bonds (continued) | | | | | | | | | | | | |
Utilities (continued) | | | | | | | | | | | | |
Independent Power and Renewable Electricity Producers (continued) | | | | | | | | | | | | |
| | | | |
TerraForm Power Operating LLC4, 6.125%, 6/15/2025 | | | | | 1,180,000 | | | $ | 1,014,800 | | | |
| | | | | | | | | | | | |
| | | | |
Total Utilities | | | | | | | | | 4,786,724 | | | |
| | | | | | | | | | | | |
TOTAL CORPORATE BONDS | | | | | | | | | | | | |
(Identified Cost $227,765,023) | | | | | | | | | 226,736,285 | | | |
| | | | | | | | | | | | |
| | | | |
MUTUAL FUNDS - 0.3% | | | | | | | | | | | | |
Adams Natural Resources Fund, Inc. | | | | | 19,390 | | | | 374,228 | | | |
The Gabelli Dividend & Income Trust | | | | | 19,690 | | | | 370,172 | | | |
Schwab U.S. Dividend Equity ETF | | | | | 20,610 | | | | 824,812 | | | |
Tri-Continental Corp. | | | | | 43,630 | | | | 883,507 | | | |
Vanguard Dividend Appreciation ETF | | | | | 10,200 | | | | 825,996 | | | |
| | | | | | | | | | | | |
TOTAL MUTUAL FUNDS | | | | | | | | | | | | |
(Identified Cost $3,197,825) | | | | | | | | | 3,278,715 | | | |
| | | | | | | | | | | | |
| | | | |
U.S. TREASURY SECURITIES - 4.7% | | | | | | | | | | | | |
| | | | |
U.S. Treasury Bonds - 1.1% | | | | | | | | | | | | |
U.S. Treasury Inflation Indexed Bond, 0.75%, 2/15/2042 (Identified Cost $12,635,917) | | | | | 13,825,186 | | | | 13,468,759 | | | |
| | | | | | | | | | | | |
U.S. Treasury Notes - 3.6% | | | | | | | | | | | | |
U.S. Treasury Inflation Indexed Note, 0.125%, 4/15/2017 | | | | | 14,970,622 | | | | 15,109,609 | | | |
U.S. Treasury Inflation Indexed Note, 0.125%, 4/15/2020 | | | | | 19,857,042 | | | | 20,275,391 | | | |
U.S. Treasury Inflation Indexed Note, 0.125%, 1/15/2023 | | | | | 10,180,048 | | | | 10,288,210 | | | |
| | | | | | | | | | | | |
Total U.S. Treasury Notes | | | | | | | | | | | | |
(Identified Cost $44,544,999) | | | | | | | | | 45,673,210 | | | |
| | | | | | | | | | | | |
TOTAL U.S. TREASURY SECURITIES | | | | | | | | | | | | |
(Identified Cost $57,180,916) | | | | | | | | | 59,141,969 | | | |
| | | | | | | | | | | | |
| | | | |
ASSET-BACKED SECURITIES - 1.6% | | | | | | | | | | | | |
Alterna Funding I LLC, Series 2014-1A, Class NOTE4, 1.639%, 2/15/2021 | | | | | 1,050,651 | | | | 1,013,878 | | | |
Cazenovia Creek Funding I LLC, Series 2015-1A, Class A4, 2.00%, 12/10/2023 | | | | | 1,801,554 | | | | 1,785,791 | | | |
Colony American Homes, Series 2015-1A, Class A4,5, 1.636%, 7/17/2032 | | | | | 2,231,565 | | | | 2,208,819 | | | |
Enterprise Fleet Financing LLC, Series 2014-2, Class A34, 1.64%, 3/20/2020 | | | | | 1,975,000 | | | | 1,967,986 | | | |
Enterprise Fleet Financing LLC, Series 2015-2, Class A24, 1.59%, 2/22/2021 | | | | | 2,342,458 | | | | 2,342,915 | | | |
FDIC Trust, Series 2011-R1, Class A4, 2.672%, 7/25/2026 | | | | | 545,702 | | | | 555,808 | | | |
FNA Trust, Series 2014-1A, Class A4, 1.296%, 12/10/2022 | | | | | 530,630 | | | | 525,489 | | | |
Home Partners of America Trust, Series 2016-1, Class A4,5, 2.086%, 3/17/2033 | | | | | 1,200,344 | | | | 1,196,495 | | | |
Invitation Homes Trust, Series 2015-SFR3, Class A4,5, 1.736%, 8/17/2032 | | | | | 2,467,302 | | | | 2,473,659 | | | |
NextGear Floorplan Master Owner Trust, Series 2014-1A, Class A4, 1.92%, 10/15/2019 | | | | | 1,750,000 | | | | 1,739,932 | | | |
SpringCastle America Funding LLC, Series 2014-AA, Class A4, 2.70%, 5/25/2023 | | | | | 1,391,145 | | | | 1,394,379 | | | |
Starwood Retail Property Trust, Series 2014-STAR, Class A4,5, 1.653%, 11/15/2027 | | | | | 2,615,000 | | | | 2,587,018 | | | |
| | | | | | | | | | | | |
TOTAL ASSET-BACKED SECURITIES | | | | | | | | | | | | |
(Identified Cost $19,880,208) | | | | | | | | | 19,792,169 | | | |
| | | | | | | | | | | | |
| | | | |
COMMERCIAL MORTGAGE-BACKED SECURITIES - 7.7% | | | | | | | | | | | | |
| | | | |
Americold LLC Trust, Series 2010-ARTA, Class A14, 3.847%, 1/14/2029 | | | | | 268,322 | | | | 278,669 | | | |
Banc of America Commercial Mortgage Trust, Series 2006-3, Class A45, 5.889%, 7/10/2044 | | | | | 976,592 | | | | 976,360 | | | |
Banc of America Commercial Mortgage Trust, Series 2006-4, Class A4, 5.634%, 7/10/2046 | | | | | 397,379 | | | | 397,411 | | | |
Bear Stearns Commercial Mortgage Securities Trust, Series 2006-PW13, Class A4, 5.54%, 9/11/2041 | | | | | 807,751 | | | | 809,474 | | | |
The accompanying notes are an integral part of the financial statements.
11
Investment Portfolio - April 30, 2016
(unaudited)
| | | | | | | | | | | | |
| PRO-BLEND® CONSERVATIVE TERM SERIES | | | | PRINCIPAL
AMOUNT3 | | | VALUE (NOTE 2) | | | |
| | | | |
COMMERCIAL MORTGAGE-BACKED SECURITIES (continued) | | | | | | | | | | | | |
| | | | |
Bear Stearns Commercial Mortgage Securities Trust, Series 2006-T24, Class AM5, 5.568%, 10/12/2041 | | | | | 1,920,000 | | | $ | 1,939,429 | | | |
BWAY Mortgage Trust, Series 2015-1740, Class A4, 2.917%, 1/13/2035 | | | | | 5,200,000 | | | | 5,200,360 | | | |
COBALT CMBS Commercial Mortgage Trust, Series 2006-C1, Class A4, 5.223%, 8/15/2048 | | | | | 2,542,341 | | | | 2,567,164 | | | |
Commercial Mortgage Pass-Through Certificates, Series 2015-3BP, Class A4, 3.178%, 2/10/2035 | | | | | 500,000 | | | | 517,648 | | | |
Commercial Mortgage Pass-Through Certificates, Series 2015-DC1, Class A5, 3.35%, 2/10/2048 | | | | | 5,000,000 | | | | 5,232,380 | | | |
Credit Suisse Commercial Mortgage Trust, Series 2006-C5, Class A3, 5.311%, 12/15/2039 | | | | | 4,046,734 | | | | 4,066,456 | | | |
Credit Suisse Mortgage Capital Trust, Series 2013-IVR3, Class A14,5, 2.50%, 5/25/2043 | | | | | 1,965,852 | | | | 1,927,840 | | | |
Credit Suisse Mortgage Capital Trust, Series 2013-TH1, Class A14,5, 2.13%, 2/25/2043 | | | | | 1,523,690 | | | | 1,474,039 | | | |
DB-UBS Mortgage Trust, Series 2011-LC1A, Class A14, 3.742%, 11/10/2046 | | | | | 17,002 | | | | 17,104 | | | |
Extended Stay America Trust, Series 2013-ESH7, Class A274, 2.958%, 12/5/2031 | | | | | 1,593,651 | | | | 1,599,319 | | | |
Fannie Mae Multifamily REMIC Trust, Series 2012-M13, Class ASQ2, 1.246%, 8/25/2017 | | | | | 862,661 | | | | 861,892 | | | |
Freddie Mac Multifamily Structured Pass-Through Certificates, Series K009, Class X1 (IO)5, 1.43%, 8/25/2020 | | | | | 24,022,789 | | | | 1,118,929 | | | |
Freddie Mac Multifamily Structured Pass-Through Certificates, Series K014, Class X1 (IO)5, 1.212%, 4/25/2021 | | | | | 2,842,213 | | | | 146,693 | | | |
Freddie Mac Multifamily Structured Pass-Through Certificates, Series K016, Class X1 (IO)5, 1.548%, 10/25/2021 | | | | | 6,987,080 | | | | 477,927 | | | |
Freddie Mac Multifamily Structured Pass-Through Certificates, Series K017, Class X1 (IO)5, 1.411%, 12/25/2021 | | | | | 8,897,461 | | | | 558,363 | | | |
Freddie Mac Multifamily Structured Pass-Through Certificates, Series K021, Class X1 (IO)5, 1.488%, 6/25/2022 | | | | | 15,867,625 | | | | 1,161,764 | | | |
Freddie Mac Multifamily Structured Pass-Through Certificates, Series K030, Class X1 (IO)5, 0.22%, 4/25/2023 | | | | | 79,707,313 | | | | 1,018,014 | | | |
Freddie Mac Multifamily Structured Pass-Through Certificates, Series K032, Class X1 (IO)5, 0.119%, 5/25/2023 | | | | | 49,701,317 | | | | 375,901 | | | |
Freddie Mac Multifamily Structured Pass-Through Certificates, Series K706, Class X1 (IO)5, 1.563%, 10/25/2018 | | | | | 10,631,945 | | | | 354,116 | | | |
FREMF Mortgage Trust, Series 2011-K701, Class B4,5, 4.436%, 7/25/2048 | | | | | 875,000 | | | | 896,570 | | | |
FREMF Mortgage Trust, Series 2011-K702, Class B4,5, 4.931%, 4/25/2044 | | | | | 1,250,000 | | | | 1,299,452 | | | |
FREMF Mortgage Trust, Series 2013-K28, Class X2A (IO)4, 0.10%, 6/25/2046 | | | | | 213,860,084 | | | | 1,168,874 | | | |
FREMF Mortgage Trust, Series 2013-K502, Class B4,5, 2.746%, 3/25/2045 | | | | | 1,725,000 | | | | 1,727,136 | | | |
FREMF Mortgage Trust, Series 2013-K712, Class B4,5, 3.484%, 5/25/2045 | | | | | 1,160,000 | | | | 1,177,878 | | | |
FREMF Mortgage Trust, Series 2014-K41, Class B4,5, 3.961%, 11/25/2047 | | | | | 2,500,000 | | | | 2,387,116 | | | |
FREMF Mortgage Trust, Series 2014-K716, Class B4,5, 4.085%, 8/25/2047 | | | | | 3,075,000 | | | | 3,176,041 | | | |
FREMF Mortgage Trust, Series 2015-K42, Class B4,5, 3.985%, 12/25/2024 | | | | | 490,000 | | | | 486,797 | | | |
FREMF Mortgage Trust, Series 2015-K43, Class B4,5, 3.863%, 2/25/2048 | | | | | 500,000 | | | | 468,135 | | | |
FREMF Mortgage Trust, Series 2015-K720, Class B4,5, 3.506%, 7/25/2022 | | | | | 270,000 | | | | 251,552 | | | |
GAHR Commercial Mortgage Trust, Series 2015-NRF, Class BFX4,5, 3.382%, 12/15/2019 | | | | | 2,800,000 | | | | 2,853,615 | | | |
GAHR Commercial Mortgage Trust, Series 2015-NRF, Class DFX4,5, 3.382%, 12/15/2019 | | | | | 1,290,000 | | | | 1,258,484 | | | |
GCCFC Commercial Mortgage Trust, Series 2006-GG7, Class A45, 5.921%, 7/10/2038 | | | | | 27,158 | | | | 27,151 | | | |
GS Mortgage Securities Trust, Series 2010-C2, Class A14, 3.849%, 12/10/2043 | | | | | 150,823 | | | | 156,424 | | | |
The accompanying notes are an integral part of the financial statements.
12
Investment Portfolio - April 30, 2016
(unaudited)
| | | | | | | | | | | | | | |
| PRO-BLEND® CONSERVATIVE TERM SERIES | | | | | PRINCIPAL
AMOUNT3 | | | VALUE
(NOTE 2) | | | |
| | | | |
COMMERCIAL MORTGAGE-BACKED SECURITIES (continued) | | | | | | | | | | | | | | |
| | | | |
JP Morgan Chase Commercial Mortgage Securities Trust, Series 2006-CB16, Class A4, 5.552%, 5/12/2045 | | | | | | | 194,070 | | | $ | 194,501 | | | |
JP Morgan Chase Commercial Mortgage Securities Trust, Series 2006-LDP7, Class A45, 5.981%, 4/17/2045 | | | | | | | 145,374 | | | | 145,226 | | | |
JP Morgan Chase Commercial Mortgage Securities Trust, Series 2006-LDP9, Class A3, 5.336%, 5/15/2047 | | | | | | | 5,424,322 | | | | 5,506,196 | | | |
JP Morgan Mortgage Trust, Series 2013-1, Class 1A24,5, 3.00%, 3/25/2043 | | | | | | | 1,172,804 | | | | 1,173,056 | | | |
JP Morgan Mortgage Trust, Series 2013-2, Class A24,5, 3.50%, 5/25/2043 | | | | | | | 1,432,052 | | | | 1,452,772 | | | |
JP Morgan Mortgage Trust, Series 2014-2, Class 1A14,5, 3.00%, 6/25/2029 | | | | | | | 1,759,374 | | | | 1,802,533 | | | |
LB-UBS Commercial Mortgage Trust, Series 2006-C7, Class A3, 5.347%, 11/15/2038 | | | | | | | 2,763,371 | | | | 2,783,902 | | | |
LSTAR Commercial Mortgage Trust, Series 2014-2, Class A24, 2.767%, 1/20/2041 | | | | | | | 323,434 | | | | 324,823 | | | |
Morgan Stanley Capital I Trust, Series 2006-HQ10, Class A4, 5.328%, 11/12/2041 | | | | | | | 829,011 | | | | 832,107 | | | |
Motel 6 Trust, Series 2015-MTL6, Class B4, 3.298%, 2/5/2030 | | | | | | | 2,550,000 | | | | 2,563,460 | | | |
New Residential Mortgage Loan Trust, Series 2014-3A, Class AFX34,5, 3.75%, 11/25/2054 | | | | | | | 1,938,955 | | | | 1,996,000 | | | |
New Residential Mortgage Loan Trust, Series 2015-2A, Class A15, 3.75%, 8/25/2055 | | | | | | | 1,877,395 | | | | 1,934,198 | | | |
SBA Small Business Investment Companies, Series 2015-10A, Class 1, 2.517%, 3/10/2025 | | | | | | | 1,258,117 | | | | 1,286,148 | | | |
SBA Small Business Investment Companies, Series 2015-10B, Class 1, 2.829%, 9/10/2025 | | | | | | | 5,676,095 | | | | 5,817,006 | | | |
SCG Trust, Series 2013-SRP1, Class AJ4,5, 2.383%, 11/15/2026 | | | | | | | 4,050,000 | | | | 4,040,549 | | | |
Sequoia Mortgage Trust, Series 2013-2, Class A5, 1.874%, 2/25/2043 | | | | | | | 1,255,400 | | | | 1,187,821 | | | |
Sequoia Mortgage Trust, Series 2013-7, Class A25, 3.00%, 6/25/2043 | | | | | | | 1,187,289 | | | | 1,187,358 | | | |
Sequoia Mortgage Trust, Series 2013-8, Class A15, 3.00%, 6/25/2043 | | | | | | | 1,609,687 | | | | 1,603,279 | | | |
Vornado DP LLC Trust, Series 2010-VNO, Class A2FX4, 4.004%, 9/13/2028 | | | | | | | 155,000 | | | | 164,792 | | | |
Wachovia Bank Commercial Mortgage Trust, Series 2006-C26, Class A35, 6.011%, 6/15/2045 | | | | | | | 357,489 | | | | 357,012 | | | |
Wells Fargo Commercial Mortgage Trust, Series 2010-C1, Class A24, 4.393%, 11/15/2043 | | | | | | | 265,000 | | | | 288,549 | | | |
WF-RBS Commercial Mortgage Trust, Series 2011-C2, Class A44,5, 4.869%, 2/15/2044 | | | | | | | 1,225,000 | | | | 1,368,926 | | | |
WF-RBS Commercial Mortgage Trust, Series 2013-C11, Class A2, 2.029%, 3/15/2045 | | | | | | | 1,815,000 | | | | 1,826,735 | | | |
WF-RBS Commercial Mortgage Trust, Series 2014-C19, Class A5, 4.101%, 3/15/2047 | | | | | | | 960,000 | | | | 1,059,679 | | | |
WF-RBS Commercial Mortgage Trust, Series 2014-C20, Class A5, 3.995%, 5/15/2047 | | | | | | | 1,440,000 | | | | 1,579,861 | | | |
WinWater Mortgage Loan Trust, Series 2015-1, Class A14,5, 3.50%, 1/20/2045 | | | | | | | 2,204,021 | | | | 2,256,982 | | | |
WinWater Mortgage Loan Trust, Series 2015-3, Class A54,5, 3.50%, 3/20/2045 | | | | | | | 2,404,108 | | | | 2,461,845 | | | |
| | | | | | | | | | | | | | |
TOTAL COMMERCIAL MORTGAGE-BACKED SECURITIES | | | | | | | | | | | | | | |
(Identified Cost $98,051,243) | | | | | | | | | | | 97,607,793 | | | |
| | | | | | | | | | | | | | |
| | | | |
FOREIGN GOVERNMENT BONDS - 2.0% | | | | | | | | | | | | | | |
| | | | |
Bonos de la Tesoreria de la Republica en pesos (Chile), 6.00%, 1/1/2018 | | | CLP | | | | 330,000,000 | | | | 516,362 | | | |
Brazilian Government International Bond (Brazil), 8.875%, 10/14/2019 | | | | | | | 600,000 | | | | 720,001 | | | |
Bundesrepublik Deutschland (Germany), 1.50%, 9/4/2022 | | | EUR | | | | 200,000 | | | | 253,397 | | | |
Bundesrepublik Deutschland (Germany), 1.00%, 8/15/2024 | | | EUR | | | | 200,000 | | | | 246,510 | | | |
Canada Housing Trust No. 1 (Canada)4, 4.10%, 12/15/2018 | | | CAD | | | | 295,000 | | | | 254,104 | | | |
Canadian Government Bond (Canada), 1.50%, 9/1/2017 | | | CAD | | | | 125,000 | | | | 100,714 | | | |
Canadian Government Bond (Canada), 2.75%, 6/1/2022 | | | CAD | | | | 360,000 | | | | 315,742 | | | |
The accompanying notes are an integral part of the financial statements.
13
Investment Portfolio - April 30, 2016
(unaudited)
| | | | | | | | | | | | | | |
| PRO-BLEND® CONSERVATIVE TERM SERIES | | | | | PRINCIPAL
AMOUNT3 | | | VALUE (NOTE 2) | | | |
| | | | |
FOREIGN GOVERNMENT BONDS (continued) | | | | | | | | | | | | | | |
Export-Import Bank of Korea (South Korea), 2.625%, 12/30/2020 | | | | | | | 9,225,000 | | | $ | 9,427,756 | | | |
Ireland Government Bond (Ireland), 5.00%, 10/18/2020 | | | EUR | | | | 230,000 | | | | 321,625 | | | |
Ireland Government Bond (Ireland), 0.80%, 3/15/2022 | | | EUR | | | | 200,000 | | | | 236,248 | | | |
Ireland Government Bond (Ireland), 3.90%, 3/20/2023 | | | EUR | | | | 50,000 | | | | 70,450 | | | |
Italy Buoni Poliennali Del Tesoro (Italy), 5.50%, 9/1/2022 | | | EUR | | | | 480,000 | | | | 707,286 | | | |
Italy Buoni Poliennali Del Tesoro (Italy), 1.45%, 9/15/2022 | | | EUR | | | | 75,000 | | | | 89,061 | | | |
Italy Buoni Poliennali Del Tesoro (Italy), 5.50%, 11/1/2022 | | | EUR | | | | 565,000 | | | | 834,994 | | | |
Italy Buoni Poliennali Del Tesoro (Italy), 1.50%, 6/1/2025 | | | EUR | | | | 200,000 | | | | 230,931 | | | |
Japan Government Five Year Bond (Japan), 0.30%, 12/20/2016 | | | JPY | | | | 77,000,000 | | | | 725,841 | | | |
Korea Treasury Bond (South Korea), 2.75%, 6/10/2016 | | | KRW | | | | 370,000,000 | | | | 325,195 | | | |
Korea Treasury Bond (South Korea), 2.00%, 12/10/2017 | | | KRW | | | | 380,000,000 | | | | 336,335 | | | |
Malaysia Government Bond (Malaysia), 4.262%, 9/15/2016 | | | MYR | | | | 1,775,000 | | | | 457,487 | | | |
Mexican Government Bond (Mexico), 7.25%, 12/15/2016 | | | MXN | | | | 4,560,000 | | | | 270,431 | | | |
Mexican Government Bond (Mexico), 5.00%, 6/15/2017 | | | MXN | | | | 8,250,000 | | | | 484,548 | | | |
Mexican Government Bond (Mexico), 8.00%, 6/11/2020 | | | MXN | | | | 8,000,000 | | | | 514,988 | | | |
Mexican Government Bond (Mexico), 6.50%, 6/10/2021 | | | MXN | | | | 3,000,000 | | | | 183,885 | | | |
Mexican Government Bond (Mexico), 6.50%, 6/9/2022 | | | MXN | | | | 5,500,000 | | | | 336,402 | | | |
Mexican Government Bond (Mexico), 7.75%, 5/29/2031 | | | MXN | | | | 1,000,000 | | | | 66,250 | | | |
Norway Government Bond (Norway)4, 4.25%, 5/19/2017 | | | NOK | | | | 1,280,000 | | | | 165,026 | | | |
Province of New Brunswick Canada (Canada), 5.20%, 2/21/2017 | | | | | | | 3,500,000 | | | | 3,615,906 | | | |
Singapore Government Bond (Singapore), 2.50%, 6/1/2019 | | | SGD | | | | 650,000 | | | | 502,707 | | | |
Spain Government Bond (Spain), 4.50%, 1/31/2018 | | | EUR | | | | 250,000 | | | | 309,018 | | | |
Spain Government Bond (Spain)4, 4.00%, 4/30/2020 | | | EUR | | | | 390,000 | | | | 511,682 | | | |
Spain Government Bond (Spain)4, 5.40%, 1/31/2023 | | | EUR | | | | 575,000 | | | | 851,518 | | | |
Spain Government Bond (Spain)4, 1.60%, 4/30/2025 | | | EUR | | | | 400,000 | | | | 463,770 | | | |
United Kingdom Gilt (United Kingdom), 1.00%, 9/7/2017 | | | GBP | | | | 290,000 | | | | 426,652 | | | |
United Kingdom Gilt (United Kingdom), 5.00%, 3/7/2018 | | | GBP | | | | 365,000 | | | | 578,766 | | | |
| | | | | | | | | | | | | | |
| | | | |
TOTAL FOREIGN GOVERNMENT BONDS | | | | | | | | | | | | | | |
(Identified Cost $26,013,040) | | | | | | | | | | | 25,451,588 | | | |
| | | | | | | | | | | | | | |
| | | | |
U.S. GOVERNMENT AGENCIES - 9.8% | | | | | | | | | | | | | | |
| | | | |
Mortgage-Backed Securities - 9.8% | | | | | | | | | | | | | | |
Fannie Mae, Pool #888468, 5.50%, 9/1/2021 | | | | | | | 569,399 | | | | 612,733 | | | |
Fannie Mae, Pool #995233, 5.50%, 10/1/2021 | | | | | | | 49,559 | | | | 52,780 | | | |
Fannie Mae, Pool #888017, 6.00%, 11/1/2021 | | | | | | | 70,635 | | | | 76,738 | | | |
Fannie Mae, Pool #995329, 5.50%, 12/1/2021 | | | | | | | 385,490 | | | | 413,944 | | | |
Fannie Mae, Pool #888136, 6.00%, 12/1/2021 | | | | | | | 87,818 | | | | 95,471 | | | |
Fannie Mae, Pool #888815, 4.50%, 11/1/2022 | | | | | | | 62,086 | | | | 64,803 | | | |
Fannie Mae, Pool #888810, 5.50%, 11/1/2022 | | | | | | | 677,806 | | | | 728,689 | | | |
Fannie Mae, Pool #AA1563, 4.50%, 2/1/2024 | | | | | | | 55,419 | | | | 59,545 | | | |
Fannie Mae, Pool #AC1557, 4.50%, 9/1/2024 | | | | | | | 137,014 | | | | 147,272 | | | |
Fannie Mae, Pool #AD0462, 5.50%, 10/1/2024 | | | | | | | 55,272 | | | | 60,463 | | | |
Fannie Mae, Pool #MA1834, 4.50%, 2/1/2034 | | | | | | | 1,250,255 | | | | 1,369,644 | | | |
Fannie Mae, Pool #MA1890, 4.00%, 5/1/2034 | | | | | | | 1,612,171 | | | | 1,738,512 | | | |
Fannie Mae, Pool #MA1903, 4.50%, 5/1/2034 | | | | | | | 1,275,212 | | | | 1,396,688 | | | |
Fannie Mae, Pool #AS3677, 4.00%, 10/1/2034 | | | | | | | 2,022,900 | | | | 2,179,826 | | | |
Fannie Mae, Pool #MA2177, 4.00%, 2/1/2035 | | | | | | | 3,445,203 | | | | 3,713,728 | | | |
Fannie Mae, Pool #745147, 4.50%, 12/1/2035 | | | | | | | 54,862 | | | | 59,995 | | | |
Fannie Mae, Pool #745418, 5.50%, 4/1/2036 | | | | | | | 864,390 | | | | 974,081 | | | |
Fannie Mae, Pool #886904, 6.50%, 9/1/2036 | | | | | | | 63,945 | | | | 73,314 | | | |
Fannie Mae, Pool #888021, 6.00%, 12/1/2036 | | | | | | | 261,690 | | | | 298,815 | | | |
Fannie Mae, Pool #909786, 5.50%, 3/1/2037 | | | | | | | 289,417 | | | | 324,854 | | | |
Fannie Mae, Pool #256673, 5.50%, 4/1/2037 | | | | | | | 1,580,268 | | | | 1,775,126 | | | |
The accompanying notes are an integral part of the financial statements.
14
Investment Portfolio - April 30, 2016
(unaudited)
| | | | | | | | | | | | |
| PRO-BLEND® CONSERVATIVE TERM SERIES | | | | PRINCIPAL
AMOUNT3 | | | VALUE (NOTE 2) | | | |
| | | | |
U.S. GOVERNMENT AGENCIES (continued) | | | | | | | | | | | | |
| | | | |
Mortgage-Backed Securities (continued) | | | | | | | | | | | | |
Fannie Mae, Pool #918516, 5.50%, 6/1/2037 | | | | | 124,500 | | | $ | 139,629 | | | |
Fannie Mae, Pool #995050, 6.00%, 9/1/2037 | | | | | 363,350 | | | | 414,917 | | | |
Fannie Mae, Pool #AB8161, 6.00%, 12/1/2037 | | | | | 1,282,462 | | | | 1,464,675 | | | |
Fannie Mae, Pool #933521, 5.00%, 1/1/2038 | | | | | 24,616 | | | | 27,208 | | | |
Fannie Mae, Pool #972107, 5.00%, 2/1/2038 | | | | | 19,177 | | | | 21,197 | | | |
Fannie Mae, Pool #889260, 5.00%, 4/1/2038 | | | | | 38,171 | | | | 42,190 | | | |
Fannie Mae, Pool #933731, 5.50%, 4/1/2038 | | | | | 631,977 | | | | 708,973 | | | |
Fannie Mae, Pool #889576, 6.00%, 4/1/2038 | | | | | 783,160 | | | | 894,333 | | | |
Fannie Mae, Pool #912948, 5.00%, 5/1/2038 | | | | | 50,223 | | | | 55,511 | | | |
Fannie Mae, Pool #975840, 5.00%, 5/1/2038 | | | | | 99,781 | | | | 110,931 | | | |
Fannie Mae, Pool #889624, 5.50%, 5/1/2038 | | | | | 829,688 | | | | 932,086 | | | |
Fannie Mae, Pool #889579, 6.00%, 5/1/2038 | | | | | 693,471 | | | | 790,973 | | | |
Fannie Mae, Pool #995196, 6.00%, 7/1/2038 | | | | | 1,197,276 | | | | 1,367,120 | | | |
Fannie Mae, Pool #AD0119, 6.00%, 7/1/2038 | | | | | 488,317 | | | | 556,764 | | | |
Fannie Mae, Pool #986458, 6.00%, 8/1/2038 | | | | | 16,502 | | | | 18,818 | | | |
Fannie Mae, Pool #987831, 6.00%, 9/1/2038 | | | | | 61,825 | | | | 70,395 | | | |
Fannie Mae, Pool #990897, 6.00%, 9/1/2038 | | | | | 135,181 | | | | 153,985 | | | |
Fannie Mae, Pool #AD0220, 6.00%, 10/1/2038 | | | | | 138,598 | | | | 158,232 | | | |
Fannie Mae, Pool #993920, 6.00%, 11/1/2038 | | | | | 88,993 | | | | 101,329 | | | |
Fannie Mae, Pool #257497, 6.00%, 12/1/2038 | | | | | 41,699 | | | | 47,481 | | | |
Fannie Mae, Pool #AA0675, 6.00%, 12/1/2038 | | | | | 23,918 | | | | 27,233 | | | |
Fannie Mae, Pool #971022, 5.00%, 1/1/2039 | | | | | 72,195 | | | | 79,797 | | | |
Fannie Mae, Pool #AA1810, 5.00%, 1/1/2039 | | | | | 105,913 | | | | 117,066 | | | |
Fannie Mae, Pool #890294, 5.50%, 1/1/2039 | | | | | 1,539,183 | | | | 1,727,425 | | | |
Fannie Mae, Pool #AD0307, 5.50%, 1/1/2039 | | | | | 830,221 | | | | 933,397 | | | |
Fannie Mae, Pool #983686, 5.00%, 2/1/2039 | | | | | 153,189 | | | | 170,847 | | | |
Fannie Mae, Pool #AD0527, 5.50%, 6/1/2039 | | | | | 311,121 | | | | 349,771 | | | |
Fannie Mae, Pool #AE0604, 6.00%, 7/1/2039 | | | | | 1,043,963 | | | | 1,188,936 | | | |
Fannie Mae, Pool #AA6788, 6.00%, 8/1/2039 | | | | | 264,658 | | | | 304,200 | | | |
Fannie Mae, Pool #AC0463, 5.00%, 11/1/2039 | | | | | 126,253 | | | | 139,988 | | | |
Fannie Mae, Pool #AC5111, 5.00%, 11/1/2039 | | | | | 222,711 | | | | 246,681 | | | |
Fannie Mae, Pool #MA0258, 4.50%, 12/1/2039 | | | | | 1,869,119 | | | | 2,038,895 | | | |
Fannie Mae, Pool #MA0259, 5.00%, 12/1/2039 | | | | | 100,559 | | | | 111,490 | | | |
Fannie Mae, Pool #AC8573, 5.00%, 1/1/2040 | | | | | 164,692 | | | | 182,592 | | | |
Fannie Mae, Pool #890326, 5.50%, 1/1/2040 | | | | | 1,719,016 | | | | 1,932,893 | | | |
Fannie Mae, Pool #AL1595, 6.00%, 1/1/2040 | | | | | 1,214,945 | | | | 1,387,601 | | | |
Fannie Mae, Pool #AE0061, 6.00%, 2/1/2040 | | | | | 432,933 | | | | 494,113 | | | |
Fannie Mae, Pool #AL0152, 6.00%, 6/1/2040 | | | | | 1,632,460 | | | | 1,862,834 | | | |
Fannie Mae, Pool #AL2581, 6.00%, 6/1/2040 | | | | | 1,041,862 | | | | 1,189,603 | | | |
Fannie Mae, Pool #890519, 6.00%, 10/1/2040 | | | | | 2,424,139 | | | | 2,765,990 | | | |
Fannie Mae, Pool #AE0951, 4.50%, 2/1/2041 | | | | | 1,168,682 | | | | 1,275,253 | | | |
Fannie Mae, Pool #AH9054, 4.50%, 4/1/2041 | | | | | 499,721 | | | | 545,131 | | | |
Fannie Mae, Pool #AI2468, 4.50%, 5/1/2041 | | | | | 378,567 | | | | 413,096 | | | |
Fannie Mae, Pool #AL0160, 4.50%, 5/1/2041 | | | | | 1,186,458 | | | | 1,294,657 | | | |
Fannie Mae, Pool #AI5172, 4.00%, 8/1/2041 | | | | | 954,436 | | | | 1,022,755 | | | |
Fannie Mae, Pool #AJ1415, 4.50%, 9/1/2041 | | | | | 286,680 | | | | 312,756 | | | |
Fannie Mae, Pool #AL1410, 4.50%, 12/1/2041 | | | | | 2,385,900 | | | | 2,602,749 | | | |
Fannie Mae, Pool #AB4300, 3.50%, 1/1/2042 | | | | | 390,019 | | | | 409,442 | | | |
Fannie Mae, Pool #AK4940, 3.50%, 3/1/2042 | | | | | 1,955,515 | | | | 2,053,032 | | | |
Fannie Mae, Pool #AL7729, 4.00%, 6/1/2043 | | | | | 1,212,555 | | | | 1,298,199 | | | |
The accompanying notes are an integral part of the financial statements.
15
Investment Portfolio - April 30, 2016
(unaudited)
| | | | | | | | | | | | |
| PRO-BLEND® CONSERVATIVE TERM SERIES | | | | PRINCIPAL
AMOUNT3 | | | VALUE (NOTE 2) | | | |
| | | | |
U.S. GOVERNMENT AGENCIES (continued) | | | | | | | | | | | | |
| | | | |
Mortgage-Backed Securities (continued) | | | | | | | | | | | | |
Fannie Mae, Pool #AL7767, 4.50%, 6/1/2044 | | | | | 2,404,223 | | | $ | 2,619,755 | | | |
Fannie Mae, Pool #AX5234, 4.50%, 11/1/2044 | | | | | 4,462,711 | | | | 4,864,944 | | | |
Fannie Mae, Pool #AS4103, 4.50%, 12/1/2044 | | | | | 1,819,435 | | | | 1,995,672 | | | |
Fannie Mae, Pool #AZ3627, 4.00%, 11/1/2045 | | | | | 451,635 | | | | 482,731 | | | |
Fannie Mae, Pool #BA3890, 4.00%, 11/1/2045 | | | | | 622,961 | | | | 666,093 | | | |
Fannie Mae, Pool #BA6762, 4.00%, 12/1/2045 | | | | | 586,731 | | | | 627,006 | | | |
Fannie Mae, Pool #BA6763, 4.00%, 12/1/2045 | | | | | 666,652 | | | | 713,577 | | | |
Fannie Mae, Pool #MA2514, 4.50%, 1/1/2046 | | | | | 196,086 | | | | 214,370 | | | |
Fannie Mae, Pool #BC3490, 3.50%, 2/1/2046 | | | | | 2,990,021 | | | | 3,134,421 | | | |
Fannie Mae Pool, Pool #AZ2001, 3.50%, 5/1/2045 | | | | | 2,951,374 | | | | 3,103,295 | | | |
Fannie Mae Pool, Pool #MA2569, 4.50%, 3/1/2046 | | | | | 1,796,730 | | | | 1,962,619 | | | |
Freddie Mac, Pool #G11850, 5.50%, 7/1/2020 | | | | | 188,625 | | | | 198,800 | | | |
Freddie Mac, Pool #G12610, 6.00%, 3/1/2022 | | | | | 89,857 | | | | 98,394 | | | |
Freddie Mac, Pool #G12655, 6.00%, 5/1/2022 | | | | | 63,719 | | | | 69,791 | | | |
Freddie Mac, Pool #G13078, 6.00%, 3/1/2023 | | | | | 85,780 | | | | 93,629 | | | |
Freddie Mac, Pool #C91746, 4.50%, 12/1/2033 | | | | | 235,457 | | | | 257,945 | | | |
Freddie Mac, Pool #C91754, 4.50%, 3/1/2034 | | | | | 1,569,484 | | | | 1,719,385 | | | |
Freddie Mac, Pool #C91762, 4.50%, 5/1/2034 | | | | | 2,130,766 | | | | 2,334,283 | | | |
Freddie Mac, Pool #K92054, 4.00%, 10/1/2034 | | | | | 1,442,437 | | | | 1,555,738 | | | |
Freddie Mac, Pool #C91850, 4.00%, 9/1/2035 | | | | | 945,387 | | | | 1,017,512 | | | |
Freddie Mac, Pool #C91854, 4.00%, 10/1/2035 | | | | | 2,957,223 | | | | 3,182,841 | | | |
Freddie Mac, Pool #G07655, 5.50%, 12/1/2035 | | | | | 226,498 | | | | 255,361 | | | |
Freddie Mac, Pool #G08216, 5.50%, 8/1/2037 | | | | | 527,462 | | | | 591,697 | | | |
Freddie Mac, Pool #G03332, 6.00%, 10/1/2037 | | | | | 58,087 | | | | 66,168 | | | |
Freddie Mac, Pool #G03696, 5.50%, 1/1/2038 | | | | | 207,643 | | | | 232,940 | | | |
Freddie Mac, Pool #G03926, 6.00%, 2/1/2038 | | | | | 760,903 | | | | 865,993 | | | |
Freddie Mac, Pool #G04264, 5.50%, 4/1/2038 | | | | | 879,341 | | | | 988,315 | | | |
Freddie Mac, Pool #G04731, 5.50%, 4/1/2038 | | | | | 491,596 | | | | 551,106 | | | |
Freddie Mac, Pool #G04176, 5.50%, 5/1/2038 | | | | | 225,533 | | | | 253,928 | | | |
Freddie Mac, Pool #A78227, 5.50%, 6/1/2038 | | | | | 252,931 | | | | 283,450 | | | |
Freddie Mac, Pool #G08273, 5.50%, 6/1/2038 | | | | | 592,855 | | | | 666,022 | | | |
Freddie Mac, Pool #G04471, 5.50%, 7/1/2038 | | | | | 72,357 | | | | 80,804 | | | |
Freddie Mac, Pool #G04776, 5.50%, 7/1/2038 | | | | | 530,170 | | | | 594,396 | | | |
Freddie Mac, Pool #G05956, 5.50%, 7/1/2038 | | | | | 721,110 | | | | 809,207 | | | |
Freddie Mac, Pool #G05671, 5.50%, 8/1/2038 | | | | | 368,827 | | | | 413,558 | | | |
Freddie Mac, Pool #G05196, 5.50%, 10/1/2038 | | | | | 740,764 | | | | 831,386 | | | |
Freddie Mac, Pool #G05409, 5.50%, 3/1/2039 | | | | | 667,257 | | | | 749,338 | | | |
Freddie Mac, Pool #A86522, 4.50%, 5/1/2039 | | | | | 1,565,312 | | | | 1,707,734 | | | |
Freddie Mac, Pool #G06021, 5.50%, 1/1/2040 | | | | | 470,592 | | | | 529,023 | | | |
Freddie Mac, Pool #G05923, 5.50%, 2/1/2040 | | | | | 397,946 | | | | 447,128 | | | |
Freddie Mac, Pool #G05900, 6.00%, 3/1/2040 | | | | | 180,821 | | | | 205,553 | | | |
Freddie Mac, Pool #G05906, 6.00%, 4/1/2040 | | | | | 112,864 | | | | 128,644 | | | |
Freddie Mac, Pool #G07104, 5.50%, 5/1/2040 | | | | | 423,363 | | | | 477,687 | | | |
Freddie Mac, Pool #G06789, 6.00%, 5/1/2040 | | | | | 507,755 | | | | 576,658 | | | |
Freddie Mac, Pool #A92889, 4.50%, 7/1/2040 | | | | | 2,539,140 | | | | 2,773,252 | | | |
Freddie Mac, Pool #G07589, 5.50%, 6/1/2041 | | | | | 1,817,241 | | | | 2,038,847 | | | |
Freddie Mac, Pool #Q17513, 3.50%, 4/1/2043 | | | | | 2,698,300 | | | | 2,830,325 | | | |
Freddie Mac, Pool #Q17719, 3.50%, 4/1/2043 | | | | | 1,284,413 | | | | 1,346,672 | | | |
Freddie Mac, Pool #C09068, 3.50%, 11/1/2044 | | | | | 2,498,920 | | | | 2,619,825 | | | |
Freddie Mac, Pool #G08669, 4.00%, 9/1/2045 | | | | | 2,420,830 | | | | 2,584,869 | | | |
The accompanying notes are an integral part of the financial statements.
16
Investment Portfolio - April 30, 2016
(unaudited)
| | | | | | | | | | | | |
| PRO-BLEND® CONSERVATIVE TERM SERIES | | | | PRINCIPAL
AMOUNT3/ SHARES/
CONTRACTS | | | VALUE (NOTE 2) | | | |
| | | | |
U.S. GOVERNMENT AGENCIES (continued) | | | | | | | | | | | | |
| | | | |
Mortgage-Backed Securities (continued) | | | | | | | | | | | | |
Freddie Mac, Pool #G08672, 4.00%, 10/1/2045 | | | | | 5,471,235 | | | $ | 5,848,889 | | | |
Freddie Mac, Pool #Q36985, 4.00%, 10/1/2045 | | | | | 1,135,473 | | | | 1,213,360 | | | |
Freddie Mac, Pool #Q37174, 4.00%, 11/1/2045 | | | | | 1,200,769 | | | | 1,283,656 | | | |
Freddie Mac, Pool #Q37892, 4.00%, 12/1/2045 | | | | | 1,504,068 | | | | 1,609,044 | | | |
Freddie Mac Gold, Pool #Q37592, 4.00%, 12/1/2045 | | | | | 3,471,218 | | | | 3,717,806 | | | |
Freddie Mac Gold, Pool #Q38388, 4.00%, 1/1/2046 | | | | | 493,014 | | | | 528,092 | | | |
Freddie Mac Gold, Pool #Q38413, 4.00%, 1/1/2046 | | | | | 497,880 | | | | 532,693 | | | |
Ginnie Mae, Pool #671161, 5.50%, 11/15/2037 | | | | | 100,575 | | | | 112,495 | | | |
| | | | | | | | | | | | |
| | | | |
TOTAL U.S. GOVERNMENT AGENCIES | | | | | | | | | | | | |
(Identified Cost $122,303,775) | | | | | | | | | 125,030,912 | | | |
| | | | | | | | | | | | |
| | | | |
U.S. GOVERNMENT SECURITIES - 4.2% | | | | | | | | | | | | |
| | | | |
U.S. Treasury Bills - 4.2% | | | | | | | | | | | | |
U.S. Treasury Bill12, 0.28%, 6/23/2016 | | | | | | | | | | | | |
(Identified Cost $52,978,347) | | | | | 53,000,000 | | | | 52,988,817 | | | |
| | | | | | | | | | | | |
| | | | |
SHORT-TERM INVESTMENT - 3.8% | | | | | | | | | | | | |
| | | | |
Dreyfus Cash Management, Inc. - Institutional Shares13, 0.29%, | | | | | | | | | | | | |
(Identified Cost $48,796,415) | | | | | 48,796,415 | | | | 48,796,415 | | | |
| | | | | | | | | | | | |
TOTAL INVESTMENTS - 84.5% | | | | | | | | | | | | |
(Identified Cost $1,051,208,355) | | | | | | | | | 1,073,310,030 | | | |
OTHER ASSETS, LESS LIABILITIES - 15.5% | | | | | | | | | 197,045,065 | | | |
| | | | | | | | | | | | |
NET ASSETS - 100% | | | | | | | | $ | 1,270,355,095 | | | |
| | | | | | | | | | | | |
| | | | |
PUT OPTIONS WRITTEN - 0.0%## | | | | | | | | | | | | |
| | | | |
Alphabet, Inc. - Class C, Strike $690, Expiring May 20, 2016, | | | | | 17 | | | $ | (20,451 | ) | | |
Apple, Inc., Strike $95, Expiring May 20, 2016, | | | | | 129 | | | | (42,699 | ) | | |
| | | | | | | | | | | | |
| | | | |
TOTAL PUT OPTIONS WRITTEN | | | | | | | | | | | | |
(Premiums Received $15,576) | | | | | | | | $ | (63,150 | ) | | |
| | | | | | | | | | | | |
ADR - American Depositary Receipt
AUD - Australian Dollar
CAD - Canadian Dollar
CLP - Chilean Peso
ETF - Exchange-traded fund
EUR - Euro
GBP - British Pound
IO - Interest only
JPY - Japanese Yen
KRW - South Korean Won
MXN - Mexican Peso
MYR - Malaysian Ringgit
No. - Number
NOK - Norwegian Krone
SGD - Singapore Dollar
|
##Less than 0.1%. *Non-income producing security. 1A factor from a third party vendor was applied to determine the security’s fair value following the close of local trading. 2A portion of this security is designated with the broker as collateral for options contracts written. As of April 30, 2016, the total value of such securities was $7,713,984. 3Amount is stated in USD unless otherwise noted. 4Restricted securities - Investment in securities that are restricted as to public resale under the Securities Act of 1933, as amended. These securities have been sold under Rule 144A and have been determined to be liquid. These securities amount to $141,356,374 or 11.1%, of the Series’ net assets as of April 30, 2016 (see Note 2 to the financial statements). 5The coupon rate is floating and is the effective rate as of April 30, 2016. |
The accompanying notes are an integral part of the financial statements.
17
Investment Portfolio - April 30, 2016
(unaudited)
6Security is perpetual in nature and has no stated maturity date.
7The rate shown is a fixed rate as of April 30, 2016; the rate becomes floating, based on U.S. Treasury Note (5 Year) plus a spread, in July 2016.
8The rate shown is a fixed rate as of April 30, 2016; the rate becomes floating, based on U.S. Treasury Yield Curve Rate Treasury Note Constant Maturity 5 Year in June 2017.
9The rate shown is a fixed rate as of April 30, 2016; the rate becomes floating, based on LIBOR plus a spread, in December 2024.
10The rate shown is a fixed rate as of April 30, 2016; the rate becomes floating, based on LIBOR plus a spread, in September 2022.
11Represents a Payment-In-Kind bond.
12Represents the annualized yield at time of purchase.
13Rate shown is the current yield as of April 30, 2016.
The Global Industry Classification Standard (GICS) was developed by and is the exclusive property and a service mark of MSCI Inc. (MSCI) and Standard & Poor’s, a division of The McGraw-Hill Companies, Inc. (S&P), and is licensed for use by Manning & Napier when referencing GICS sectors. Neither MSCI, S&P, nor any third party involved in making or compiling the GICS or any GICS classifications makes any express or implied warranties or representations with respect to such standard or classification, nor shall any such party have any liability therefrom.
The accompanying notes are an integral part of the financial statements.
18
Statement of Assets and Liabilities - Pro-Blend® Conservative Term Series
April 30, 2016 (unaudited)
| | | | |
ASSETS: | | | | |
| |
Investments, at value (identified cost $1,051,208,355) (Note 2) | | $ | 1,073,310,030 | |
Foreign currency (identified cost $25,191) | | | 25,191 | |
Receivable for securities sold | | | 195,782,813 | |
Interest receivable | | | 4,229,979 | |
Receivable for fund shares sold | | | 626,342 | |
Dividends receivable | | | 334,015 | |
Foreign tax reclaims receivable | | | 202,184 | |
Prepaid and other expenses | | | 3,793 | |
| | | | |
| |
TOTAL ASSETS | | | 1,274,514,347 | |
| | | | |
| |
LIABILITIES: | | | | |
| |
Accrued management fees (Note 3) | | | 628,123 | |
Accrued shareholder services fees (Class S) (Note 3) | | | 131,650 | |
Accrued distribution and service (Rule 12b-1) fees (Class C) (Class R) (Note 3) | | | 119,246 | |
Accrued transfer agent fees (Note 3) | | | 85,594 | |
Accrued fund accounting and administration fees (Note 3) | | | 82,294 | |
Accrued Chief Compliance Officer service fees (Note 3) | | | 381 | |
Options written, at value (premiums received $15,576) (Note 2) | | | 63,150 | |
Accrued foreign capital gains tax (Note 2) | | | 509 | |
Payable for fund shares repurchased | | | 2,741,425 | |
Accrued printing and postage | | | 223,266 | |
Other payables and accrued expenses | | | 83,614 | |
| | | | |
| |
TOTAL LIABILITIES | | | 4,159,252 | |
| | | | |
| |
TOTAL NET ASSETS | | $ | 1,270,355,095 | |
| | | | |
| |
NET ASSETS CONSIST OF: | | | | |
| |
Capital stock | | $ | 1,078,217 | |
Additional paid-in-capital | | | 1,249,170,134 | |
Undistributed net investment income | | | 6,146,826 | |
Accumulated net realized loss on investments, foreign currency and translation of other assets and liabilities | | | (8,075,956 | ) |
Net unrealized appreciation on investments (net of foreign capital gains tax of $509), foreign currency and translation of other assets and liabilities | | | 22,035,874 | |
| | | | |
| |
TOTAL NET ASSETS | | $ | 1,270,355,095 | |
| | | | |
The accompanying notes are an integral part of the financial statements.
19
Statement of Assets and Liabilities - Pro-Blend® Conservative Term Series
April 30, 2016 (unaudited)
| | | | |
NET ASSET VALUE, OFFERING PRICE AND REDEMPTION PRICE PER SHARE - Class S
($798,147,499/ 60,764,449 shares) | | $ | 13.14 | |
| | | | |
| |
NET ASSET VALUE, OFFERING PRICE AND REDEMPTION PRICE PER SHARE - Class I
($315,447,415/ 31,004,663 shares) | | $ | 10.17 | |
| | | | |
| |
NET ASSET VALUE, OFFERING PRICE AND REDEMPTION PRICE PER SHARE - Class C
($133,098,231/ 13,630,062 shares) | | $ | 9.77 | |
| | | | |
| |
NET ASSET VALUE, OFFERING PRICE AND REDEMPTION PRICE PER SHARE - Class R
($23,661,950/ 2,422,519 shares) | | $ | 9.77 | |
| | | | |
The accompanying notes are an integral part of the financial statements.
20
Statement of Operations - Pro-Blend® Conservative Term Series
For the Six Months Ended April 30, 2016 (unaudited)
| | | | |
INVESTMENT INCOME: | | | | |
| |
Interest | | $ | 11,833,902 | |
Dividends (net of foreign taxes withheld, $58,373) | | | 4,043,514 | |
| | | | |
| |
Total Investment Income | | | 15,877,416 | |
| | | | |
| |
EXPENSES: | | | | |
| |
Management fees (Note 3) | | | 3,928,909 | |
Shareholder services fees (Class S) (Note 3) | | | 834,037 | |
Distribution and service (Rule 12b-1) fees (Class C) (Note 3) | | | 658,262 | |
Distribution and service (Rule 12b-1) fees (Class R) (Note 3) | | | 91,068 | |
Fund accounting and administration fees (Note 3) | | | 130,082 | |
Transfer agent fees (Note 3) | | | 129,722 | |
Directors’ fees (Note 3) | | | 26,581 | |
Chief Compliance Officer service fees (Note 3) | | | 1,258 | |
Custodian fees | | | 56,726 | |
Miscellaneous | | | 203,351 | |
| | | | |
| |
Total Expenses | | | 6,059,996 | |
| | | | |
| |
NET INVESTMENT INCOME | | | 9,817,420 | |
| | | | |
| |
REALIZED AND UNREALIZED GAIN (LOSS) ON INVESTMENTS AND FOREIGN CURRENCY: | | | | |
| |
Net realized gain (loss) on- | | | | |
Investments | | | 11,617,018 | |
Futures contracts | | | (10,954,642 | ) |
Options written | | | 63,569 | |
Foreign currency and translation of other assets and liabilities | | | (1,058,159 | ) |
| | | | |
| |
| | | (332,214 | ) |
| | | | |
| |
Net change in unrealized appreciation (depreciation) on- | | | | |
Investments (net of decrease in accrued foreign capital gains tax of $108) | | | (3,213,256 | ) |
Futures contracts | | | 1,416,619 | |
Options written | | | (47,574 | ) |
Foreign currency and translation of other assets and liabilities | | | 13,120 | |
| | | | |
| |
| | | (1,831,091 | ) |
| | | | |
| |
NET REALIZED AND UNREALIZED GAIN (LOSS) ON INVESTMENTS AND FOREIGN CURRENCY | | | (2,163,305 | ) |
| | | | |
| |
NET INCREASE IN NET ASSETS RESULTING FROM OPERATIONS | | $ | 7,654,115 | |
| | | | |
The accompanying notes are an integral part of the financial statements.
21
Statements of Changes in Net Assets - Pro-Blend® Conservative Term Series
| | | | | | | | |
| | | FOR THE SIX MONTHS ENDED
4/30/16
(UNAUDITED) | | | FOR THE YEAR ENDED
10/31/15 | |
DECREASE IN NET ASSETS: | | | | | | | | |
| | |
OPERATIONS: | | | | | | | | |
| | |
Net investment income | | $ | 9,817,420 | | | $ | 25,141,914 | |
Net realized loss on investments and foreign currency | | | (332,214 | ) | | | (6,336,316 | ) |
Net change in unrealized depreciation on investments and foreign currency | | | (1,831,091 | ) | | | (40,113,025 | ) |
| | | | | | | | |
| | |
Net increase (decrease) from operations | | | 7,654,115 | | | | (21,307,427 | ) |
| | | | | | | | |
| | |
DISTRIBUTIONS TO SHAREHOLDERS (Note 8): | | | | | | | | |
| | |
From net investment income (Class S) | | | (8,682,512 | ) | | | (14,242,164 | ) |
From net investment income (Class I) | | | (4,514,265 | ) | | | (6,793,036 | ) |
From net investment income (Class C) | | | (1,223,898 | ) | | | (1,402,026 | ) |
From net investment income (Class R) | | | (631,680 | ) | | | (950,123 | ) |
From net realized gain on investments (Class S) | | | — | | | | (50,314,602 | ) |
From net realized gain on investments (Class I) | | | — | | | | (19,920,640 | ) |
From net realized gain on investments (Class C) | | | — | | | | (8,129,404 | ) |
From net realized gain on investments (Class R) | | | — | | | | (3,664,976 | ) |
| | | | | | | | |
| | |
Total distributions to shareholders | | | (15,052,355 | ) | | | (105,416,971 | ) |
| | | | | | | | |
| | |
CAPITAL STOCK ISSUED AND REPURCHASED: | | | | | | | | |
| | |
Net decrease from capital share transactions (Note 5) | | | (152,915,518 | ) | | | (119,388,459 | ) |
| | | | | | | | |
| | |
Net decrease in net assets | | | (160,313,758 | ) | | | (246,112,857 | ) |
| | |
NET ASSETS: | | | | | | | | |
| | |
Beginning of period | | | 1,430,668,853 | | | | 1,676,781,710 | |
| | | | | | | | |
| | |
End of period (including undistributed net investment income of $6,146,826 and $11,381,761, respectively) | | $ | 1,270,355,095 | | | $ | 1,430,668,853 | |
| | | | | | | | |
The accompanying notes are an integral part of the financial statements.
22
Financial Highlights - Pro-Blend® Conservative Term Series - Class S
| | | | | | | | | | | | | | | | | | | | | | | | |
| | | FOR THE SIX
MONTHS ENDED
4/30/16 | | | FOR THE YEARS ENDED | |
| | | (UNAUDITED) | | | 10/31/15 | | | 10/31/14 | | | 10/31/13 | | | 10/31/12 | | | 10/31/11 | |
Per share data (for a share outstanding throughout each period): | | | | | | | | | | | | | | | | | | | | | | | | |
Net asset value - Beginning of period | | $ | 13.15 | | | $ | 14.13 | | | $ | 14.18 | | | $ | 13.62 | | | $ | 13.16 | | | $ | 13.37 | |
| | | | | | | | | | | | | | | | | | | | | | | | |
Income (loss) from investment operations: | | | | | | | | | | | | | | | | | | | | | | | | |
Net investment income1 | | | 0.10 | | | | 0.22 | | | | 0.22 | | | | 0.22 | | | | 0.22 | | | | 0.25 | |
Net realized and unrealized gain (loss) on investments | | | 0.02 | | | | (0.41 | ) | | | 0.52 | | | | 0.83 | | | | 0.69 | | | | 0.12 | |
| | | | | | | | | | | | | | | | | | | | | | | | |
| | | | | | |
Total from investment operations | | | 0.12 | | | | (0.19 | ) | | | 0.74 | | | | 1.05 | | | | 0.91 | | | | 0.37 | |
| | | | | | | | | | | | | | | | | | | | | | | | |
| | | | | | |
Less distributions to shareholders: | | | | | | | | | | | | | | | | | | | | | | | | |
From net investment income | | | (0.13 | ) | | | (0.18 | ) | | | (0.20 | ) | | | (0.20 | ) | | | (0.24 | ) | | | (0.24 | ) |
From net realized gain on investments | | | — | | | | (0.61 | ) | | | (0.59 | ) | | | (0.29 | ) | | | (0.21 | ) | | | (0.34 | ) |
| | | | | | | | | | | | | | | | | | | | | | | | |
| | | | | | |
Total distributions to shareholders | | | (0.13 | ) | | | (0.79 | ) | | | (0.79 | ) | | | (0.49 | ) | | | (0.45 | ) | | | (0.58 | ) |
| | | | | | | | | | | | | | | | | | | | | | | | |
| | | | | | |
Net asset value - End of period | | $ | 13.14 | | | $ | 13.15 | | | $ | 14.13 | | | $ | 14.18 | | | $ | 13.62 | | | $ | 13.16 | |
| | | | | | | | | | | | | | | | | | | | | | | | |
| | | | | | |
Net assets - End of period (000’s omitted) | | $ | 798,147 | | | $ | 911,956 | | | $ | 1,124,851 | | | $ | 1,027,160 | | | $ | 973,964 | | | $ | 870,693 | |
| | | | | | | | | | | | | | | | | | | | | | | | |
| | | | | | |
Total return2 | | | 0.93 | % | | | (1.33 | %) | | | 5.46 | % | | | 7.93 | % | | | 7.15 | % | | | 2.87 | % |
Ratios (to average net assets)/Supplemental Data: | | | | | | | | | | | | | | | | | | | | | | | | |
Expenses | | | 0.88 | %3 | | | 0.88 | % | | | 0.87 | % | | | 0.87 | % | | | 0.88 | % | | | 0.89 | % |
Net investment income | | | 1.54 | %3 | | | 1.60 | % | | | 1.57 | % | | | 1.58 | % | | | 1.65 | % | | | 1.87 | % |
Series portfolio turnover | | | 20 | % | | | 51 | % | | | 45 | % | | | 54 | % | | | 54 | % | | | 25 | % |
1Calculated based on average shares outstanding during the periods.
2Represents aggregate total return for the periods indicated, and assumes reinvestment of all distributions. Periods less than one year are not annualized.
3Annualized.
The accompanying notes are an integral part of the financial statements.
23
Financial Highlights - Pro-Blend® Conservative Term Series - Class I
| | | | | | | | | | | | | | | | | | | | | | | | |
| | | FOR THE SIX
MONTHS ENDED
4/30/16 | | | FOR THE YEARS ENDED | |
| | | (UNAUDITED) | | | 10/31/15 | | | 10/31/14 | | | 10/31/13 | | | 10/31/12 | | | 10/31/11 | |
Per share data (for a share outstanding throughout each period): | | | | | | | | | | | | | | | | | | | | | | | | |
Net asset value - Beginning of period | | $ | 10.22 | | | $ | 11.17 | | | $ | 11.38 | | | $ | 11.03 | | | $ | 10.75 | | | $ | 11.03 | |
| | | | | | | | | | | | | | | | | | | | | | | | |
Income (loss) from investment operations: | | | | | | | | | | | | | | | | | | | | | | | | |
Net investment income1 | | | 0.09 | | | | 0.19 | | | | 0.20 | | | | 0.20 | | | | 0.20 | | | | 0.22 | |
Net realized and unrealized gain (loss) on investments | | | 0.00 | 2 | | | (0.32 | ) | | | 0.40 | | | | 0.66 | | | | 0.55 | | | | 0.10 | |
| | | | | | | | | | | | | | | | | | | | | | | | |
| | | | | | |
Total from investment operations | | | 0.09 | | | | (0.13 | ) | | | 0.60 | | | | 0.86 | | | | 0.75 | | | | 0.32 | |
| | | | | | | | | | | | | | | | | | | | | | | | |
| | | | | | |
Less distributions to shareholders: | | | | | | | | | | | | | | | | | | | | | | | | |
From net investment income | | | (0.14 | ) | | | (0.21 | ) | | | (0.22 | ) | | | (0.22 | ) | | | (0.26 | ) | | | (0.26 | ) |
From net realized gain on investments | | | — | | | | (0.61 | ) | | | (0.59 | ) | | | (0.29 | ) | | | (0.21 | ) | | | (0.34 | ) |
| | | | | | | | | | | | | | | | | | | | | | | | |
| | | | | | |
Total distributions to shareholders | | | (0.14 | ) | | | (0.82 | ) | | | (0.81 | ) | | | (0.51 | ) | | | (0.47 | ) | | | (0.60 | ) |
| | | | | | | | | | | | | | | | | | | | | | | | |
| | | | | | |
Net asset value - End of period | | $ | 10.17 | | | $ | 10.22 | | | $ | 11.17 | | | $ | 11.38 | | | $ | 11.03 | | | $ | 10.75 | |
| | | | | | | | | | | | | | | | | | | | | | | | |
| | | | | | |
Net assets - End of period (000’s omitted) | | $ | 315,447 | | | $ | 325,700 | | | $ | 353,538 | | | $ | 318,106 | | | $ | 249,566 | | | $ | 181,345 | |
| | | | | | | | | | | | | | | | | | | | | | | | |
| | | | | | |
Total return3 | | | 0.97 | % | | | (1.15 | %) | | | 5.66 | % | | | 8.15 | % | | | 7.34 | % | | | 3.07 | % |
Ratios (to average net assets)/Supplemental Data: | | | | | | | | | | | | | | | | | | | | | | | | |
Expenses | | | 0.68 | %4 | | | 0.68 | % | | | 0.67 | % | | | 0.67 | % | | | 0.68 | % | | | 0.69 | % |
Net investment income | | | 1.74 | %4 | | | 1.81 | % | | | 1.77 | % | | | 1.77 | % | | | 1.84 | % | | | 2.07 | % |
Series portfolio turnover | | | 20 | % | | | 51 | % | | | 45 | % | | | 54 | % | | | 54 | % | | | 25 | % |
1Calculated based on average shares outstanding during the periods.
2Less than $0.01.
3Represents aggregate total return for the periods indicated, and assumes reinvestment of all distributions. Periods less than one year are not annualized.
4Annualized.
The accompanying notes are an integral part of the financial statements.
24
Financial Highlights - Pro-Blend® Conservative Term Series - Class C
| | | | | | | | | | | | | | | | | | | | | | | | |
| | | FOR THE SIX
MONTHS ENDED
4/30/16 | | | FOR THE YEARS ENDED | | | | |
| | | (UNAUDITED) | | | 10/31/15 | | | 10/31/14 | | | 10/31/13 | | | 10/31/12 | | | 10/31/11 | |
Per share data (for a share outstanding throughout each period): | | | | | | | | | | | | | | | | | | | | | | | | |
Net asset value - Beginning of period | | $ | 9.81 | | | $ | 10.75 | | | $ | 10.99 | | | $ | 10.68 | | | $ | 10.42 | | | $ | 10.73 | |
| | | | | | | | | | | | | | | | | | | | | | | | |
Income (loss) from investment operations: | | | | | | | | | | | | | | | | | | | | | | | | |
Net investment income1 | | | 0.04 | | | | 0.08 | | | | 0.08 | | | | 0.08 | | | | 0.09 | | | | 0.11 | |
Net realized and unrealized gain (loss) on investments | | | 0.01 | | | | (0.31 | ) | | | 0.39 | | | | 0.65 | | | | 0.55 | | | | 0.10 | |
| | | | | | | | | | | | | | | | | | | | | | | | |
| | | | | | |
Total from investment operations | | | 0.05 | | | | (0.23 | ) | | | 0.47 | | | | 0.73 | | | | 0.64 | | | | 0.21 | |
| | | | | | | | | | | | | | | | | | | | | | | | |
| | | | | | |
Less distributions to shareholders: | | | | | | | | | | | | | | | | | | | | | | | | |
From net investment income | | | (0.09 | ) | | | (0.10 | ) | | | (0.12 | ) | | | (0.13 | ) | | | (0.17 | ) | | | (0.18 | ) |
From net realized gain on investments | | | — | | | | (0.61 | ) | | | (0.59 | ) | | | (0.29 | ) | | | (0.21 | ) | | | (0.34 | ) |
| | | | | | | | | | | | | | | | | | | | | | | | |
| | | | | | |
Total distributions to shareholders | | | (0.09 | ) | | | (0.71 | ) | | | (0.71 | ) | | | (0.42 | ) | | | (0.38 | ) | | | (0.52 | ) |
| | | | | | | | | | | | | | | | | | | | | | | | |
| | | | | | |
Net asset value - End of period | | $ | 9.77 | | | $ | 9.81 | | | $ | 10.75 | | | $ | 10.99 | | | $ | 10.68 | | | $ | 10.42 | |
| | | | | | | | | | | | | | | | | | | | | | | | |
| | | | | | |
Net assets - End of period (000’s omitted) | | $ | 133,098 | | | $ | 137,697 | | | $ | 139,291 | | | $ | 102,919 | | | $ | 72,239 | | | $ | 42,898 | |
| | | | | | | | | | | | | | | | | | | | | | | | |
| | | | | | |
Total return2 | | | 0.51 | % | | | (2.10 | %) | | | 4.58 | % | | | 7.06 | % | | | 6.42 | % | | | 2.06 | % |
Ratios (to average net assets)/Supplemental Data: | | | | | | | | | | | | | | | | | | | | | | | | |
Expenses | | | 1.68 | %3 | | | 1.68 | % | | | 1.67 | % | | | 1.67 | % | | | 1.69 | % | | | 1.69 | % |
Net investment income | | | 0.74 | %3 | | | 0.81 | % | | | 0.77 | % | | | 0.78 | % | | | 0.84 | % | | | 1.03 | % |
Series portfolio turnover | | | 20 | % | | | 51 | % | | | 45 | % | | | 54 | % | | | 54 | % | | | 25 | % |
1Calculated based on average shares outstanding during the periods.
2Represents aggregate total return for the periods indicated, and assumes reinvestment of all distributions. Periods less than one year are not annualized.
3Annualized.
The accompanying notes are an integral part of the financial statements.
25
Financial Highlights - Pro-Blend® Conservative Term Series - Class R
| | | | | | | | | | | | | | | | | | | | | | | | |
| | | FOR THE SIX
MONTHS ENDED
4/30/16 | | | FOR THE YEARS ENDED | | | | | | | |
| | | (UNAUDITED) | | | 10/31/15 | | | 10/31/14 | | | 10/31/13 | | | 10/31/12 | | | 10/31/11 | |
Per share data (for a share outstanding throughout each period): | | | | | | | | | | | | | | | | | | | | | | | | |
Net asset value - Beginning of period | | $ | 9.81 | | | $ | 10.75 | | | $ | 10.99 | | | $ | 10.67 | | | $ | 10.44 | | | $ | 10.76 | |
| | | | | | | | | | | | | | | | | | | | | | | | |
Income (loss) from investment operations: | | | | | | | | | | | | | | | | | | | | | | | | |
Net investment income1 | | | 0.06 | | | | 0.13 | | | | 0.14 | | | | 0.14 | | | | 0.14 | | | | 0.13 | |
Net realized and unrealized gain (loss) on investments | | | 0.01 | | | | (0.30 | ) | | | 0.38 | | | | 0.64 | | | | 0.54 | | | | 0.13 | |
| | | | | | | | | | | | | | | | | | | | | | | | |
| | | | | | |
Total from investment operations | | | 0.07 | | | | (0.17 | ) | | | 0.52 | | | | 0.78 | | | | 0.68 | | | | 0.26 | |
| | | | | | | | | | | | | | | | | | | | | | | | |
| | | | | | |
Less distributions to shareholders: | | | | | | | | | | | | | | | | | | | | | | | | |
From net investment income | | | (0.11 | ) | | | (0.16 | ) | | | (0.17 | ) | | | (0.17 | ) | | | (0.24 | ) | | | (0.24 | ) |
From net realized gain on investments | | | — | | | | (0.61 | ) | | | (0.59 | ) | | | (0.29 | ) | | | (0.21 | ) | | | (0.34 | ) |
| | | | | | | | | | | | | | | | | | | | | | | | |
| | | | | | |
Total distributions to shareholders | | | (0.11 | ) | | | (0.77 | ) | | | (0.76 | ) | | | (0.46 | ) | | | (0.45 | ) | | | (0.58 | ) |
| | | | | | | | | | | | | | | | | | | | | | | | |
| | | | | | |
Net asset value - End of period | | $ | 9.77 | | | $ | 9.81 | | | $ | 10.75 | | | $ | 10.99 | | | $ | 10.67 | | | $ | 10.44 | |
| | | | | | | | | | | | | | | | | | | | | | | | |
| | | | | | |
Net assets - End of period (000’s omitted) | | $ | 23,662 | | | $ | 55,315 | | | $ | 59,101 | | | $ | 48,272 | | | $ | 32,988 | | | $ | 2,828 | |
| | | | | | | | | | | | | | | | | | | | | | | | |
| | | | | | |
Total return2 | | | 0.79 | % | | | (1.60 | %) | | | 5.08 | % | | | 7.64 | % | | | 6.85 | % | | | 2.61 | % |
Ratios (to average net assets)/Supplemental Data: | | | | | | | | | | | | | | | | | | | | | | | | |
Expenses | | | 1.18 | %3 | | | 1.18 | % | | | 1.17 | % | | | 1.17 | % | | | 1.19 | % | | | 1.19 | % |
Net investment income | | | 1.25 | %3 | | | 1.30 | % | | | 1.27 | % | | | 1.28 | % | | | 1.32 | % | | | 1.31 | % |
Series portfolio turnover | | | 20 | % | | | 51 | % | | | 45 | % | | | 54 | % | | | 54 | % | | | 25 | % |
1Calculated based on average shares outstanding during the periods.
2Represents aggregate total return for the periods indicated, and assumes reinvestment of all distributions. Periods less than one year are not annualized.
3Annualized.
The accompanying notes are an integral part of the financial statements.
26
Shareholder Expense Example - Pro-Blend® Moderate Term Series
(unaudited)
As a shareholder of the Series, you incur ongoing costs, including management fees, shareholder service fees and other Series expenses. This example is intended to help you understand your ongoing costs (in dollars) of investing in the Series and to compare these costs with the ongoing costs of investing in other mutual funds.
The example is based on an investment of $1,000 invested in each class at the beginning of the period and held for the entire period (November 1, 2015 to April 30, 2016).
Actual Expenses
The Actual lines of the table below provide information about actual account values and actual expenses. You may use the information in these lines, together with the amount you invested, to estimate the expenses that you paid over the period. Simply divide your account value by $1,000 (for example, an $8,600 account value divided by $1,000 = 8.6), then multiply the result by the number in the Actual line for the Class in which you have invested under the heading entitled “Expenses Paid During Period” to estimate the expenses you paid on your account during this period.
Hypothetical Example for Comparison Purposes
The Hypothetical lines of each class in the table below provide information about hypothetical account values and hypothetical expenses based on the Class’ actual expense ratio and an assumed rate of return of 5% per year before expenses, which is not the Class’ actual return. The hypothetical account values and expenses may not be used to estimate the actual ending account balance or expenses you paid during the period. You may use this information to compare the ongoing costs of investing in a class of the Series and other funds. To do so, compare this 5% hypothetical example for the Class in which you have invested with the 5% hypothetical examples that appear in the shareholder reports of the other funds.
Please note that the expenses shown in the table are meant to highlight your ongoing costs only and do not reflect any transaction costs such as sales charges (loads), redemption fees, or exchange fees that you may incur in other mutual funds. Therefore, the second line of the table is useful in comparing ongoing costs only, and will not help you determine the relative total costs of owning different funds.
| | | | | | | | |
| | | BEGINNING ACCOUNT VALUE
11/1/15 | | ENDING
ACCOUNT VALUE
4/30/16 | | EXPENSES PAID
DURING PERIOD
11/1/15-4/30/16* | | ANNUALIZED
EXPENSE RATIO |
Class S | | | | | | | | |
Actual | | $1,000.00 | | $1,004.10 | | $5.33 | | 1.07% |
Hypothetical (5% return before expenses) | | $1,000.00 | | $1,019.54 | | $5.37 | | 1.07% |
Class I | | | | | | | | |
Actual | | $1,000.00 | | $1,005.50 | | $4.09 | | 0.82% |
Hypothetical (5% return before expenses) | | $1,000.00 | | $1,020.79 | | $4.12 | | 0.82% |
Class C | | | | | | | | |
Actual | | $1,000.00 | | $1,000.30 | | $9.05 | | 1.82% |
Hypothetical (5% return before expenses) | | $1,000.00 | | $1,015.81 | | $9.12 | | 1.82% |
Class R | | | | | | | | |
Actual | | $1,000.00 | | $1,002.90 | | $6.57 | | 1.32% |
Hypothetical (5% return before expenses) | | $1,000.00 | | $1,018.30 | | $6.62 | | 1.32% |
* Expenses are equal to the Class’ annualized expense ratio (for the six-month period), multiplied by the average account value over the period, multiplied by 182/366 to reflect the one-half year period.
27
Portfolio Composition - Pro-Blend® Moderate Term Series
As of April 30, 2016 (unaudited)
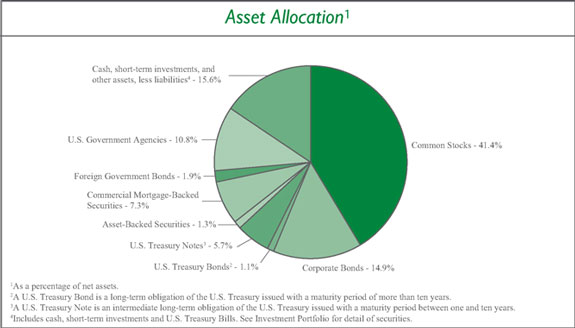
| | | | |
Sector Allocation5 | | | | |
Information Technology | | | 13.7 | % |
Consumer Discretionary | | | 12.5 | % |
Financials | | | 10.2 | % |
Health Care | | | 5.6 | % |
Consumer Staples | | | 5.6 | % |
Materials | | | 4.6 | % |
Energy | | | 4.4 | % |
Industrials | | | 3.6 | % |
Telecommunication Services | | | 1.2 | % |
Utilities | | | 0.4 | % |
| |
| 5Including common stocks and corporate bonds, as a percentage of total investments. | |
| | | | |
Top Ten Stock Holdings6 | | | | |
Time Warner, Inc. | | | 1.6 | % |
QUALCOMM, Inc. | | | 1.6 | % |
Monsanto Co. | | | 1.5 | % |
MasterCard, Inc. - Class A | | | 1.4 | % |
Range Resources Corp. | | | 1.4 | % |
Medtronic plc | | | 1.2 | % |
ServiceNow, Inc. | | | 1.2 | % |
AMC Networks, Inc. - Class A | | | 1.2 | % |
Cerner Corp. | | | 1.2 | % |
Johnson & Johnson | | | 1.2 | % |
| | |
| 6As a percentage of total investments. | | | | |
28
Investment Portfolio - April 30, 2016
(unaudited)
| | | | | | | | |
| PRO-BLEND® MODERATE TERM SERIES | | SHARES | | | VALUE (NOTE 2) | |
| | |
COMMON STOCKS - 41.4% | | | | | | | | |
| | |
Consumer Discretionary - 10.0% | | | | | | | | |
Diversified Consumer Services - 0.2% | | | | | | | | |
Fu Shou Yuan International Group Ltd. (China)1 | | | 1,308,000 | | | $ | 917,682 | |
Houghton Mifflin Harcourt Co.* | | | 32,510 | | | | 666,780 | |
Kroton Educacional S.A. (Brazil) | | | 279,932 | | | | 1,043,462 | |
| | | | | | | | |
| | |
| | | | | | | 2,627,924 | |
| | | | | | | | |
Hotels, Restaurants & Leisure - 0.9% | | | | | | | | |
Accor S.A. (France)1 | | | 17,960 | | | | 795,331 | |
Dunkin’ Brands Group, Inc. | | | 13,480 | | | | 626,820 | |
Yum! Brands, Inc. | | | 131,120 | | | | 10,431,907 | |
| | | | | | | | |
| | |
| | | | | | | 11,854,058 | |
| | | | | | | | |
Internet & Catalog Retail - 1.7% | | | | | | | | |
ASOS plc (United Kingdom)*1 | | | 11,400 | | | | 601,423 | |
The Priceline Group, Inc.* | | | 10,730 | | | | 14,417,472 | |
Rakuten, Inc. (Japan)1 | | | 117,360 | | | | 1,275,863 | |
TripAdvisor, Inc.*2 | | | 109,900 | | | | 7,098,441 | |
Zalando SE (Germany)*1,3 | | | 20,470 | | | | 679,505 | |
| | | | | | | | |
| | |
| | | | | | | 24,072,704 | |
| | | | | | | | |
Media - 5.8% | | | | | | | | |
AMC Networks, Inc. - Class A* | | | 235,320 | | | | 15,349,920 | |
Global Mediacom Tbk PT (Indonesia)1 | | | 2,723,660 | | | | 238,696 | |
ITV plc (United Kingdom)1 | | | 141,820 | | | | 467,477 | |
Liberty Global plc - Class A - ADR (United Kingdom)* | | | 211,779 | | | | 7,990,422 | |
Modern Times Group MTG AB - Class B (Sweden)1 | | | 4,696 | | | | 140,990 | |
Sinclair Broadcast Group, Inc. - Class A | | | 292,990 | | | | 9,396,189 | |
Surya Citra Media Tbk PT (Indonesia)1 | | | 1,776,910 | | | | 429,305 | |
TEGNA, Inc. | | | 142,160 | | | | 3,320,858 | |
Time Warner, Inc. | | | 267,350 | | | | 20,088,679 | |
Tribune Media Co. - Class A | | | 274,160 | | | | 10,568,868 | |
Twenty-First Century Fox, Inc. - Class A | | | 423,324 | | | | 12,809,784 | |
| | | | | | | | |
| | |
| | | | | | | 80,801,188 | |
| | | | | | | | |
Specialty Retail - 0.2% | | | | | | | | |
Advance Auto Parts, Inc. | | | 12,370 | | | | 1,930,957 | |
Kingfisher plc (United Kingdom)1 | | | 77,910 | | | | 415,084 | |
Monro Muffler Brake, Inc. | | | 9,060 | | | | 627,133 | |
| | | | | | | | |
| | |
| | | | | | | 2,973,174 | |
| | | | | | | | |
Textiles, Apparel & Luxury Goods - 1.2% | | | | | | | | |
Carter’s, Inc. | | | 6,260 | | | | 667,754 | |
Gildan Activewear, Inc. (Canada) | | | 22,140 | | | | 687,668 | |
Kering (France)1 | | | 4,280 | | | | 734,015 | |
lululemon athletica, Inc.* | | | 214,647 | | | | 14,070,111 | |
| | | | | | | | |
| | |
| | | | | | | 16,159,548 | |
| | | | | | | | |
| | |
Total Consumer Discretionary | | | | | | | 138,488,596 | |
| | | | | | | | |
Consumer Staples - 4.1% | | | | | | | | |
Beverages - 2.5% | | | | | | | | |
Ambev S.A. - ADR (Brazil) | | | 2,368,546 | | | | 13,240,172 | |
Anheuser-Busch InBev S.A./N.V. (Belgium)1 | | | 75,735 | | | | 9,395,269 | |
Cia Cervecerias Unidas S.A. - ADR (Chile) | | | 20,820 | | | | 466,784 | |
Diageo plc (United Kingdom)1 | | | 375,793 | | | | 10,160,011 | |
Fomento Economico Mexicano S.A.B. de C.V. - ADR (Mexico) | | | 2,200 | | | | 205,062 | |
SABMiller plc (United Kingdom)1 | | | 5,090 | | | | 311,743 | |
Treasury Wine Estates Ltd. (Australia)1 | | | 147,456 | | | | 1,038,278 | |
| | | | | | | | |
| | |
| | | | | | | 34,817,319 | |
| | | | | | | | |
Food & Staples Retailing - 0.1% | | | | | | | | |
Dairy Farm International Holdings Ltd. (Hong Kong)1 | | | 131,900 | | | | 909,514 | |
Sprouts Farmers Market, Inc.* | | | 24,090 | | | | 676,206 | |
Tesco plc (United Kingdom)*1 | | | 89,775 | | | | 225,699 | |
| | | | | | | | |
| | |
| | | | | | | 1,811,419 | |
| | | | | | | | |
Food Products - 0.5% | | | | | | | | |
Adecoagro S.A. (Luxembourg)* | | | 74,190 | | | | 790,865 | |
Danone S.A. (France)1 | | | 14,011 | | | | 981,663 | |
Grupo Bimbo S.A.B. de C.V. - Class A (Mexico) | | | 228,880 | | | | 696,964 | |
Nestle S.A. (Switzerland)1 | | | 15,824 | | | | 1,181,098 | |
Sao Martinho S.A. (Brazil) | | | 50,240 | | | | 653,408 | |
Suedzucker AG (Germany)1 | | | 61,317 | | | | 1,082,744 | |
Tiger Brands Ltd. (South Africa)1 | | | 12,180 | | | | 301,554 | |
Universal Robina Corp. (Philippines)1 | | | 98,310 | | | | 436,557 | |
The WhiteWave Foods Co.* | | | 15,550 | | | | 625,265 | |
| | | | | | | | |
| | |
| | | | | | | 6,750,118 | |
| | | | | | | | |
Household Products - 0.1% | | | | | | | | |
Pigeon Corp. (Japan)1 | | | 20,400 | | | | 535,819 | |
| | | | | | | | |
Personal Products - 0.8% | | | | | | | | |
Beiersdorf AG (Germany)1 | | | 2,270 | | | | 203,836 | |
Unilever plc - ADR (United Kingdom) | | | 253,939 | | | | 11,391,704 | |
| | | | | | | | |
| | |
| | | | | | | 11,595,540 | |
| | | | | | | | |
Tobacco - 0.1% | | | | | | | | |
Gudang Garam Tbk PT (Indonesia)1 | | | 172,000 | | | | 901,364 | |
Japan Tobacco, Inc. (Japan)1 | | | 15,600 | | | | 637,384 | |
The accompanying notes are an integral part of the financial statements.
29
Investment Portfolio - April 30, 2016
(unaudited)
| | | | | | | | |
| PRO-BLEND® MODERATE TERM SERIES | | SHARES | | | VALUE
(NOTE 2) | |
| | |
COMMON STOCKS (continued) | | | | | | | | |
| | |
Consumer Staples (continued) | | | | | | | | |
Tobacco (continued) | | | | | | | | |
Swedish Match AB (Sweden)1 | | | 4,695 | | | $ | 149,122 | |
| | | | | | | | |
| | |
| | | | | | | 1,687,870 | |
| | | | | | | | |
| | |
Total Consumer Staples | | | | | | | 57,198,085 | |
| | | | | | | | |
Energy - 2.3% | | | | | | | | |
Energy Equipment & Services - 0.8% | | | | | | | | |
Schlumberger Ltd. | | | 139,413 | | | | 11,200,440 | |
Spectrum ASA (Norway)1 | | | 27,468 | | | | 90,402 | |
| | | | | | | | |
| | |
| | | | | | | 11,290,842 | |
| | | | | | | | |
Oil, Gas & Consumable Fuels - 1.5% | | | | | | | | |
Cameco Corp. (Canada) | | | 35,769 | | | | 447,470 | |
Cosan S.A. Industria e Comercio (Brazil) | | | 20,580 | | | | 189,808 | |
Galp Energia SGPS S.A. (Portugal)1 | | | 69,040 | | | | 948,575 | |
Range Resources Corp. | | | 399,560 | | | | 17,624,592 | |
Royal Dutch Shell plc - Class B (Netherlands)1 | | | 18,152 | | | | 476,580 | |
Royal Dutch Shell plc - Class B - ADR (Netherlands) | | | 7,670 | | | | 409,195 | |
| | | | | | | | |
| | |
| | | | | | | 20,096,220 | |
| | | | | | | | |
| | |
Total Energy | | | | | | | 31,387,062 | |
| | | | | | | | |
Financials - 3.7% | | | | | | | | |
Banks - 0.0%## | | | | | | | | |
ICICI Bank Ltd. - ADR (India) | | | 38,250 | | | | 269,663 | |
| | | | | | | | |
Capital Markets - 0.8% | | | | | | | | |
BlackRock, Inc. | | | 29,130 | | | | 10,379,893 | |
| | | | | | | | |
Consumer Finance - 0.1% | | | | | | | | |
SLM Corp.* | | | 220,740 | | | | 1,494,410 | |
| | | | | | | | |
Diversified Financial Services - 0.1% | | | | | | | | |
JSE Ltd. (South Africa)1 | | | 40,370 | | | | 468,397 | |
| | | | | | | | |
Real Estate Investment Trusts (REITS) - 2.3% | | | | | | | | |
Agree Realty Corp. | | | 11,690 | | | | 453,338 | |
Alexandria Real Estate Equities, Inc. | | | 5,160 | | | | 479,622 | |
alstria office REIT AG (Germany)1 | | | 78,350 | | | | 1,100,177 | |
American Campus Communities, Inc. | | | 8,070 | | | | 361,133 | |
American Homes 4 Rent - Class A | | | 15,760 | | | | 249,323 | |
Apartment Investment & Management Co. - Class A | | | 12,430 | | | | 497,946 | |
AvalonBay Communities, Inc. | | | 4,100 | | | | 724,839 | |
Boston Properties, Inc. | | | 3,740 | | | | 481,936 | |
Brixmor Property Group, Inc. | | | 10,130 | | | | 255,783 | |
CatchMark Timber Trust, Inc. - Class A | | | 24,820 | | | | 263,340 | |
Chesapeake Lodging Trust | | | 18,880 | | | | 465,014 | |
Columbia Property Trust, Inc. | | | 10,670 | | | | 237,941 | |
Community Healthcare Trust, Inc. | | | 29,200 | | | | 531,440 | |
CoreSite Realty Corp. | | | 2,410 | | | | 180,581 | |
Crown Castle International Corp. | | | 2,730 | | | | 237,182 | |
CubeSmart | | | 18,110 | | | | 536,237 | |
DCT Industrial Trust, Inc. | | | 6,760 | | | | 272,901 | |
DDR Corp. | | | 21,950 | | | | 384,125 | |
Digital Realty Trust, Inc. | | | 3,470 | | | | 305,291 | |
Douglas Emmett, Inc. | | | 13,910 | | | | 451,380 | |
Education Realty Trust, Inc. | | | 8,793 | | | | 349,698 | |
Equinix, Inc. | | | 1,600 | | | | 528,560 | |
Equity LifeStyle Properties, Inc. | | | 4,130 | | | | 282,864 | |
Equity One, Inc. | | | 14,870 | | | | 420,821 | |
Equity Residential | | | 5,550 | | | | 377,789 | |
Extra Space Storage, Inc. | | | 3,440 | | | | 292,228 | |
Fibra Shop Portafolios Inmobiliarios S.A.P.I. de C.V. (Mexico) | | | 191,494 | | | | 184,764 | |
Forest City Realty Trust, Inc. - Class A | | | 24,570 | | | | 510,565 | |
General Growth Properties, Inc. | | | 15,250 | | | | 427,458 | |
HCP, Inc. | | | 7,060 | | | | 238,840 | |
Healthcare Realty Trust, Inc. | | | 8,990 | | | | 272,217 | |
Healthcare Trust of America, Inc. - Class A | | | 14,470 | | | | 418,038 | |
Host Hotels & Resorts, Inc. | | | 14,530 | | | | 229,865 | |
Kite Realty Group Trust | | | 9,945 | | | | 270,802 | |
Lamar Advertising Co. - Class A | | | 4,570 | | | | 283,523 | |
LaSalle Hotel Properties | | | 14,710 | | | | 351,569 | |
Mid-America Apartment Communities, Inc. | | | 7,120 | | | | 681,455 | |
NorthStar Realty Finance Corp. | | | 25,020 | | | | 320,006 | |
Outfront Media, Inc. | | | 17,837 | | | | 386,885 | |
Paramount Group, Inc. | | | 30,120 | | | | 503,004 | |
Pebblebrook Hotel Trust | | | 6,790 | | | | 187,676 | |
Pennsylvania Real Estate Investment Trust | | | 8,290 | | | | 190,173 | |
Physicians Realty Trust | | | 32,660 | | | | 592,126 | |
Prologis, Inc. | | | 21,550 | | | | 978,586 | |
Public Storage | | | 1,710 | | | | 418,625 | |
Retail Opportunity Investments Corp. | | | 20,410 | | | | 401,465 | |
Retail Properties of America, Inc. - Class A | | | 15,930 | | | | 254,721 | |
Rexford Industrial Realty, Inc. | | | 20,800 | | | | 390,416 | |
Simon Property Group, Inc. | | | 6,580 | | | | 1,323,699 | |
Sovran Self Storage, Inc. | | | 4,870 | | | | 517,291 | |
STORE Capital Corp. | | | 11,990 | | | | 307,783 | |
Tanger Factory Outlet Centers, Inc. | | | 7,680 | | | | 269,414 | |
Taubman Centers, Inc. | | | 4,520 | | | | 313,914 | |
Terreno Realty Corp. | | | 15,870 | | | | 361,360 | |
UDR, Inc. | | | 6,880 | | | | 240,250 | |
Urban Edge Properties | | | 19,560 | | | | 507,386 | |
Ventas, Inc. | | | 6,730 | | | | 418,068 | |
The accompanying notes are an integral part of the financial statements.
30
Investment Portfolio - April 30, 2016
(unaudited)
| | | | | | | | |
| PRO-BLEND® MODERATE TERM SERIES | | SHARES | | | VALUE (NOTE 2) | |
| | |
COMMON STOCKS (continued) | | | | | | | | |
| | |
Financials (continued) | | | | | | | | |
Real Estate Investment Trusts (REITS) (continued) | | | | | | | | |
Vornado Realty Trust | | | 4,590 | | | $ | 439,401 | |
Welltower, Inc. | | | 6,040 | | | | 419,297 | |
Westfield Corp. (Australia)1 | | | 24,010 | | | | 183,379 | |
Weyerhaeuser Co. | | | 235,722 | | | | 7,571,391 | |
| | | | | | | | |
| | |
| | | | | | | 32,086,901 | |
| | | | | | | | |
Real Estate Management & Development - 0.4% | | | | | | | | |
CBRE Group, Inc. - Class A* | | | 5,620 | | | | 166,521 | |
First Capital Realty, Inc. (Canada) | | | 12,570 | | | | 203,472 | |
Realogy Holdings Corp.* | | | 146,120 | | | | 5,222,329 | |
| | | | | | | | |
| | |
| | | | | | | 5,592,322 | |
| | | | | | | | |
| | |
Total Financials | | | | | | | 50,291,586 | |
| | | | | | | | |
Health Care - 4.7% | | | | | | | | |
Biotechnology - 0.2% | | | | | | | | |
Cepheid, Inc.* | | | 28,310 | | | | 807,967 | |
Seattle Genetics, Inc.* | | | 18,640 | | | | 661,347 | |
Vertex Pharmaceuticals, Inc.* | | | 8,270 | | | | 697,492 | |
| | | | | | | | |
| | |
| | | | | | | 2,166,806 | |
| | | | | | | | |
Health Care Equipment & Supplies - 1.2% | | | | | | | | |
LDR Holding Corp.* | | | 18,540 | | | | 499,653 | |
Medtronic plc | | | 198,710 | | | | 15,727,896 | |
Shandong Weigao Group Medical Polymer Co. Ltd. - Class H (China)1 | | | 250,393 | | | | 150,317 | |
| | | | | | | | |
| | |
| | | | | | | 16,377,866 | |
| | | | | | | | |
Health Care Providers & Services - 1.0% | | | | | | | | |
Acadia Healthcare Co., Inc.* | | | 10,380 | | | | 655,912 | |
Brookdale Senior Living, Inc.* | | | 8,340 | | | | 153,956 | |
DaVita HealthCare Partners, Inc.* | | | 22,680 | | | | 1,676,052 | |
Express Scripts Holding Co.* | | | 111,340 | | | | 8,209,098 | |
Fresenius Medical Care AG & Co. KGaA (Germany)1 | | | 8,390 | | | | 730,245 | |
Fresenius Medical Care AG & Co. KGaA - ADR (Germany) | | | 16,520 | | | | 720,768 | |
KPJ Healthcare Berhad (Malaysia)1 | | | 280,550 | | | | 303,783 | |
Odontoprev S.A. (Brazil) | | | 135,010 | | | | 415,717 | |
Siloam International Hospitals Tbk PT (Indonesia)1 | | | 429,900 | | | | 275,452 | |
| | | | | | | | |
| | |
| | | | | | | 13,140,983 | |
| | | | | | | | |
Health Care Technology - 1.1% | | | | | | | | |
Cerner Corp.* | | | 272,460 | | | | 15,295,904 | |
| | | | | | | | |
Life Sciences Tools & Services - 0.0%## | | | | | | | | |
QIAGEN N.V.* | | | 6,260 | | | | 140,600 | |
QIAGEN N.V.*1 | | | 7,760 | | | | 174,528 | |
| | | | | | | | |
| | | | | | | 315,128 | |
| | | | | | | | |
Pharmaceuticals - 1.2% | | | | | | | | |
AstraZeneca plc - ADR (United Kingdom) | | | 20,640 | | | | 597,734 | |
Genomma Lab Internacional S.A.B. de C.V. - Class B (Mexico)* | | | 484,560 | | | | 532,309 | |
GlaxoSmithKline plc (United Kingdom)1 | | | 11,020 | | | | 235,525 | |
Johnson & Johnson | | | 134,190 | | | | 15,040,015 | |
Novartis AG - ADR (Switzerland) | | | 8,350 | | | | 634,350 | |
Perrigo Co. plc | | | 2,560 | | | | 247,475 | |
| | | | | | | | |
| | | | | | | 17,287,408 | |
| | | | | | | | |
| | |
Total Health Care | | | | | | | 64,584,095 | |
| | | | | | | | |
Industrials - 1.3% | | | | | | | | |
Aerospace & Defense - 0.0%## | | | | | | | | |
Safran S.A. (France)1 | | | 2,440 | | | | 168,214 | |
| | | | | | | | |
Airlines - 0.0%## | | | | | | | | |
Ryanair Holdings plc - ADR (Ireland) | | | 1,894 | | | | 153,319 | |
| | | | | | | | |
Commercial Services & Supplies - 0.1% | | | | | | | | |
China Everbright International Ltd. (China)1 | | | 189,000 | | | | 211,591 | |
MiX Telematics Ltd. - ADR (South Africa) | | | 36,190 | | | | 147,655 | |
Stericycle, Inc.* | | | 10,840 | | | | 1,035,870 | |
| | | | | | | | |
| | |
| | | | | | | 1,395,116 | |
| | | | | | | | |
Industrial Conglomerates - 0.1% | | | | | | | | |
Siemens AG (Germany)1 | | | 13,380 | | | | 1,400,201 | |
| | | | | | | | |
Machinery - 0.8% | | | | | | | | |
Alstom S.A. (France)*1 | | | 22,720 | | | | 580,965 | |
ANDRITZ AG (Austria)1 | | | 13,150 | | | | 738,141 | |
FANUC Corp. (Japan)1 | | | 2,709 | | | | 400,179 | |
Flowserve Corp. | | | 140,980 | | | | 6,881,234 | |
GEA Group AG (Germany)1 | | | 24,520 | | | | 1,139,439 | |
SMC Corp. (Japan)1 | | | 2,800 | | | | 682,807 | |
Sulzer AG (Switzerland)1 | | | 2,210 | | | | 201,741 | |
The Weir Group plc (United Kingdom)1 | | | 10,450 | | | | 183,562 | |
| | | | | | | | |
| | |
| | | | | | | 10,808,068 | |
| | | | | | | | |
Professional Services - 0.1% | | | | | | | | |
Applus Services S.A. (Spain)1 | | | 47,450 | | | | 439,047 | |
Bureau Veritas S.A. (France)1 | | | 17,580 | | | | 416,705 | |
Intertek Group plc (United Kingdom)1 | | | 9,040 | | | | 431,261 | |
| | | | | | | | |
| | |
| | | | | | | 1,287,013 | |
| | | | | | | | |
Road & Rail - 0.2% | | | | | | | | |
Genesee & Wyoming, Inc. - Class A* | | | 22,580 | | | | 1,470,184 | |
Kansas City Southern | | | 13,070 | | | | 1,238,383 | |
| | | | | | | | |
| | |
| | | | | | | 2,708,567 | |
| | | | | | | | |
The accompanying notes are an integral part of the financial statements.
31
Investment Portfolio - April 30, 2016
(unaudited)
| | | | | | | | |
| PRO-BLEND® MODERATE TERM SERIES | | SHARES | | | VALUE (NOTE 2) | |
| | |
COMMON STOCKS (continued) | | | | | | | | |
| | |
Industrials (continued) | | | | | | | | |
Trading Companies & Distributors - 0.0%## | | | | | | | | |
Brenntag AG (Germany)1 | | | 7,993 | | | $ | 469,500 | |
| | | | | | | | |
| | |
Total Industrials | | | | | | | 18,389,998 | |
| | | | | | | | |
Information Technology - 11.9% | | | | | | | | |
Electronic Equipment, Instruments & Components - 1.3% | | | | | | | | |
FLIR Systems, Inc. | | | 205,050 | | | | 6,194,561 | |
Hitachi Ltd. (Japan)1 | | | 204,000 | | | | 934,774 | |
Keyence Corp. (Japan)1 | | | 1,523 | | | | 912,876 | |
PAX Global Technology Ltd. (Hong Kong)1 | | | 1,130,000 | | | | 973,179 | |
Trimble Navigation Ltd.* | | | 45,260 | | | | 1,083,977 | |
VeriFone Systems, Inc.* | | | 275,380 | | | | 7,837,315 | |
| | | | | | | | |
| | |
| | | | | | | 17,936,682 | |
| | | | | | | | |
Internet Software & Services - 2.6% | | | | | | | | |
Alibaba Group Holding Ltd. - ADR (China)* | | | 14,170 | | | | 1,090,240 | |
Alphabet, Inc. - Class A*2 | | | 12,690 | | | | 8,982,997 | |
Alphabet, Inc. - Class C* | | | 12,910 | | | | 8,946,759 | |
Baidu, Inc. - ADR (China)* | | | 6,090 | | | | 1,183,287 | |
Benefitfocus, Inc.* | | | 18,220 | | | | 690,538 | |
Envestnet, Inc.* | | | 35,520 | | | | 1,114,618 | |
Facebook, Inc. - Class A* | | | 91,510 | | | | 10,759,746 | |
Match Group, Inc.* | | | 47,500 | | | | 541,500 | |
MercadoLibre, Inc. (Argentina) | | | 8,390 | | | | 1,047,827 | |
Q2 Holdings, Inc.* | | | 34,120 | | | | 815,809 | |
Tencent Holdings Ltd. - Class H (China)1 | | | 50,900 | | | | 1,035,729 | |
| | | | | | | | |
| | |
| | | | | | | 36,209,050 | |
| | | | | | | | |
IT Services - 2.9% | | | | | | | | |
Amdocs Ltd. - ADR | | | 10,390 | | | | 587,451 | |
FleetCor Technologies, Inc.* | | | 4,470 | | | | 691,420 | |
InterXion Holding N.V. - ADR (Netherlands)* | | | 11,700 | | | | 396,396 | |
MasterCard, Inc. - Class A | | | 186,500 | | | | 18,088,635 | |
PayPal Holdings, Inc.* | | | 267,960 | | | | 10,498,673 | |
Visa, Inc. - Class A2 | | | 134,450 | | | | 10,384,918 | |
| | | | | | | | |
| | |
| | | | | | | 40,647,493 | |
| | | | | | | | |
Semiconductors & Semiconductor Equipment - 1.5% | | | | | | | | |
QUALCOMM, Inc. | | | 396,600 | | | | 20,036,232 | |
| | | | | | | | |
Software - 2.4% | | | | | | | | |
Electronic Arts, Inc.* | | | 239,410 | | | | 14,807,509 | |
Paylocity Holding Corp.* | | | 18,600 | | | | 711,822 | |
SAP SE (Germany)1 | | | 14,490 | | | | 1,136,906 | |
ServiceNow, Inc.* | | | 218,910 | | | | 15,647,687 | |
TOTVS S.A. (Brazil) | | | 52,040 | | | | 425,338 | |
The Ultimate Software Group, Inc.* | | | 5,510 | | | | 1,083,211 | |
| | | | | | | | |
| | |
| | | | | | | 33,812,473 | |
| | | | | | | | |
Technology Hardware, Storage & Peripherals - 1.2% | | | | | | | | |
Apple, Inc. | | | 154,780 | | | | 14,509,077 | |
Samsung Electronics Co. Ltd. (South Korea)1 | | | 1,680 | | | | 1,830,917 | |
| | | | | | | | |
| | |
| | | | | | | 16,339,994 | |
| | | | | | | | |
| | |
Total Information Technology | | | | | | | 164,981,924 | |
| | | | | | | | |
Materials - 3.3% | | | | | | | | |
Chemicals - 2.3% | | | | | | | | |
Ashland, Inc. | | | 97,710 | | | | 10,904,436 | |
Givaudan S.A. (Switzerland)1 | | | 250 | | | | 493,466 | |
Monsanto Co. | | | 207,370 | | | | 19,426,422 | |
Sociedad Quimica y Minera de Chile S.A. - ADR (Chile) | | | 13,752 | | | | 286,454 | |
Symrise AG (Germany)1 | | | 6,510 | | | | 432,078 | |
| | | | | | | | |
| | |
| | | | | | | 31,542,856 | |
| | | | | | | | |
Metals & Mining - 1.0% | | | | | | | | |
Alcoa, Inc. | | | 1,245,816 | | | | 13,915,765 | |
Alumina Ltd. (Australia)1 | | | 105,362 | | | | 118,976 | |
Norsk Hydro ASA (Norway)1 | | | 45,388 | | | | 197,482 | |
| | | | | | | | |
| | |
| | | | | | | 14,232,223 | |
| | | | | | | | |
| | |
Total Materials | | | | | | | 45,775,079 | |
| | | | | | | | |
Telecommunication Services - 0.1% | | | | | | | | |
Diversified Telecommunication Services - 0.0%## | | | | | | | | |
Telefonica S.A. - ADR (Spain) | | | 66,980 | | | | 730,752 | |
| | | | | | | | |
Wireless Telecommunication Services - 0.1% | | | | | | | | |
America Movil S.A.B. de C.V. - Class L - ADR (Mexico) | | | 55,703 | | | | 788,754 | |
China Mobile Ltd. - Class H (China)1 | | | 22,820 | | | | 261,991 | |
| | | | | | | | |
| | |
| | | | | | | 1,050,745 | |
| | | | | | | | |
| | |
Total Telecommunication Services | | | | | | | 1,781,497 | |
| | | | | | | | |
Utilities - 0.0%## | | | | | | | | |
Water Utilities - 0.0%## | | | | | | | | |
CT Environmental Group Ltd. (China)1 | | | 714,000 | | | | 208,258 | |
| | | | | | | | |
TOTAL COMMON STOCKS
(Identified Cost $543,839,503) | | | | | | | 573,086,180 | |
| | | | | | | | |
The accompanying notes are an integral part of the financial statements.
32
Investment Portfolio - April 30, 2016
(unaudited)
| | | | | | | | |
| PRO-BLEND® MODERATE TERM SERIES | | PRINCIPAL
AMOUNT4 | | | VALUE (NOTE 2) | |
| | |
CORPORATE BONDS - 14.9% | | | | | | | | |
| | |
Non-Convertible Corporate Bonds - 14.9% | | | | | | | | |
Consumer Discretionary - 1.4% | | | | | | | | |
Auto Components - 0.2% | | | | | | | | |
Magna International, Inc. (Canada), 4.15%, 10/1/2025 | | | 1,500,000 | | | $ | 1,609,557 | |
Techniplas LLC3, 10.00%, 5/1/2020 | | | 1,055,000 | | | | 738,500 | |
| | | | | | | | |
| | |
| | | | | | | 2,348,057 | |
| | | | | | | | |
Diversified Consumer Services - 0.2% | | | | | | | | |
Block Financial LLC, 5.50%, 11/1/2022 | | | 2,795,000 | | | | 3,015,601 | |
| | | | | | | | |
Hotels, Restaurants & Leisure - 0.1% | | | | | | | | |
MGM Resorts International, 10.00%, 11/1/2016 | | | 870,000 | | | | 905,931 | |
| | | | | | | | |
Household Durables - 0.5% | | | | | | | | |
Brookfield Residential Properties, Inc. - Brookfield Residential US Corp. (Canada)3, 6.125%, 7/1/2022 | | | 1,365,000 | | | | 1,264,017 | |
Lennar Corp., 12.25%, 6/1/2017 | | | 830,000 | | | | 915,075 | |
Meritage Homes Corp., 7.15%, 4/15/2020 | | | 555,000 | | | | 591,075 | |
Meritage Homes Corp., 7.00%, 4/1/2022 | | | 610,000 | | | | 654,225 | |
NVR, Inc., 3.95%, 9/15/2022 | | | 2,028,000 | | | | 2,072,369 | |
TRI Pointe Group, Inc. - TRI Pointe Homes, Inc., 4.375%, 6/15/2019 | | | 940,000 | | | | 942,350 | |
Weekley Homes LLC - Weekley Finance Corp., 6.00%, 2/1/2023 | | | 1,135,000 | | | | 1,055,550 | |
| | | | | | | | |
| | |
| | | | | | | 7,494,661 | |
| | | | | | | | |
Media - 0.3% | | | | | | | | |
Altice Financing S.A. (Luxembourg)3, 6.50%, 1/15/2022 | | | 630,000 | | | | 636,300 | |
CCO Holdings LLC - CCO Holdings Capital Corp.3, 5.875%, 4/1/2024 | | | 750,000 | | | | 785,625 | |
Columbus International, Inc. (Barbados)3, 7.375%, 3/30/2021 | | | 880,000 | | | | 934,736 | |
Sinclair Television Group, Inc.3, 5.625%, 8/1/2024 | | | 610,000 | | | | 626,775 | |
VTR Finance B.V. (Netherlands)3, 6.875%, 1/15/2024 | | | 1,260,000 | | | | 1,258,425 | |
WideOpenWest Finance LLC - WideOpenWest Capital Corp., 10.25%, 7/15/2019 | | | 135,000 | | | | 135,337 | |
| | | | | | | | |
| | |
| | | | | | | 4,377,198 | |
| | | | | | | | |
Multiline Retail - 0.1% | | | | | | | | |
Dollar General Corp., 3.25%, 4/15/2023 | | | 1,480,000 | | | | 1,491,470 | |
| | | | | | | | |
| | |
Total Consumer Discretionary | | | | | | | 19,632,918 | |
| | | | | | | | |
Consumer Staples - 0.9% | | | | | | | | |
Beverages - 0.5% | | | | | | | | |
Anheuser-Busch InBev Worldwide, Inc. (Belgium), 7.75%, 1/15/2019 | | | 1,060,000 | | | | 1,234,374 | |
Anheuser-Busch InBev Worldwide, Inc. (Belgium), 8.20%, 1/15/2039 | | | 1,900,000 | | | | 2,946,832 | |
PepsiCo, Inc., 3.10%, 7/17/2022 | | | 2,895,000 | | | | 3,083,615 | |
| | | | | | | | |
| | |
| | | | | | | 7,264,821 | |
| | | | | | | | |
Food & Staples Retailing - 0.3% | | | | | | | | |
C&S Group Enterprises LLC3 , 5.375%, 7/15/2022 | | | 995,000 | | | | 955,200 | |
CVS Health Corp., 3.50%, 7/20/2022 | | | 1,450,000 | | | | 1,543,690 | |
The Kroger Co., 2.60%, 2/1/2021 | | | 1,235,000 | | | | 1,271,168 | |
| | | | | | | | |
| | |
| | | | | | | 3,770,058 | |
| | | | | | | | |
Food Products - 0.1% | | | | | | | | |
Pinnacle Operating Corp.3, 9.00%, 11/15/2020 | | | 1,255,000 | | | | 1,066,750 | |
| | | | | | | | |
Household Products - 0.0%## | | | | | | | | |
HRG Group, Inc., 7.75%, 1/15/2022 | | | 915,000 | | | | 915,000 | |
| | | | | | | | |
| | |
Total Consumer Staples | | | | | | | 13,016,629 | |
| | | | | | | | |
Energy - 1.8% | | | | | | | | |
Energy Equipment & Services - 0.5% | | | | | | | | |
Baker Hughes, Inc., 7.50%, 11/15/2018 | | | 1,215,000 | | | | 1,365,808 | |
Ensco plc, 5.20%, 3/15/2025 | | | 1,465,000 | | | | 1,067,619 | |
FTS International, Inc., 6.25%, 5/1/2022 | | | 610,000 | | | | 94,855 | |
Pride International, Inc., 8.50%, 6/15/2019 | | | 700,000 | | | | 703,500 | |
Schlumberger Holdings Corp.3, 3.625%, 12/21/2022 | | | 3,095,000 | | | | 3,224,439 | |
TerraForm Global Operating LLC3, 9.75%, 8/15/2022 | | | 955,000 | | | | 846,369 | |
| | | | | | | | |
| | |
| | | | | | | 7,302,590 | |
| | | | | | | | |
Oil, Gas & Consumable Fuels - 1.3% | | | | | | | | |
Carrizo Oil & Gas, Inc., 6.25%, 4/15/2023 | | | 205,000 | | | | 196,800 | |
Chevron Corp., 1.79%, 11/16/2018 | | | 1,420,000 | | | | 1,438,087 | |
Columbia Pipeline Group, Inc.3, 4.50%, 6/1/2025 | | | 1,050,000 | | | | 1,082,768 | |
Crestwood Midstream Partners LP - Crestwood Midstream Finance Corp., 6.125%, 3/1/2022 | | | 470,000 | | | | 428,875 | |
Hiland Partners LP - Hiland Partners Finance Corp.3, 7.25%, 10/1/2020 | | | 2,900,000 | | | | 3,034,125 | |
Hilcorp Energy I LP - Hilcorp Finance Co.3, 5.75%, 10/1/2025 | | | 205,000 | | | | 193,213 | |
Kinder Morgan, Inc.3, 5.625%, 11/15/2023 | | | 1,950,000 | | | | 2,015,493 | |
Oasis Petroleum, Inc., 6.875%, 1/15/2023 | | | 200,000 | | | | 179,500 | |
PBF Holding Co. LLC - PBF Finance Corp.3, 7.00%, 11/15/2023 | | | 640,000 | | | | 624,000 | |
Petrobras Global Finance B.V. (Brazil)5, 2.238%, 5/20/2016 | | | 3,680,000 | | | | 3,677,240 | |
The accompanying notes are an integral part of the financial statements.
33
Investment Portfolio - April 30, 2016
(unaudited)
| | | | | | | | | | | | | | |
| PRO-BLEND® MODERATE TERM SERIES | | | | | PRINCIPAL
AMOUNT4 | | | VALUE (NOTE 2) | | | |
| | | | |
CORPORATE BONDS (continued) | | | | | | | | | | | | | | |
| | | | |
Non-Convertible Corporate Bonds (continued) | | | | | | | | | | | | | | |
Energy (continued) | | | | | | | | | | | | | | |
Oil, Gas & Consumable Fuels (continued) | | | | | | | | | | | | | | |
Petroleos Mexicanos (Mexico), 4.50%, 1/23/2026 | | | | | | | 1,925,000 | | | $ | 1,831,445 | | | |
Sabine Pass Liquefaction LLC, 5.625%, 2/1/2021 | | | | | | | 1,260,000 | | | | 1,252,125 | | | |
Transocean, Inc., 3.75%, 10/15/2017 | | | | | | | 395,000 | | | | 379,200 | | | |
Weatherford International LLC, 6.35%, 6/15/2017 | | | | | | | 395,000 | | | | 400,925 | | | |
WPX Energy, Inc., 6.00%, 1/15/2022 | | | | | | | 415,000 | | | | 373,500 | | | |
| | | | | | | | | | | | | | |
| | | | |
| | | | | | | | | | | 17,107,296 | | | |
| | | | | | | | | | | | | | |
| | | | |
Total Energy | | | | | | | | | | | 24,409,886 | | | |
| | | | | | | | | | | | | | |
Financials - 5.7% | | | | | | | | | | | | | | |
Banks - 2.0% | | | | | | | | | | | | | | |
Bank of America Corp., 5.70%, 5/2/2017 | | | | | | | 3,061,000 | | | | 3,182,803 | | | |
Barclays Bank plc (United Kingdom)3, 10.179%, 6/12/2021 | | | | | | | 1,200,000 | | | | 1,526,908 | | | |
CIT Group, Inc., 4.25%, 8/15/2017 | | | | | | | 910,000 | | | | 923,081 | | | |
Citigroup, Inc., 3.875%, 3/26/2025 | | | | | | | 1,325,000 | | | | 1,316,189 | | | |
Commonwealth Bank of Australia (Australia), 5.75%, 1/25/2017 | | | AUD | | | | 390,000 | | | | 303,492 | | | |
Cooperatieve Rabobank U.A. (Netherlands)6,7, 8.375% | | | | | | | 700,000 | | | | 707,876 | | | |
Intesa Sanpaolo S.p.A. (Italy), 3.875%, 1/15/2019 | | | | | | | 3,000,000 | | | | 3,107,682 | | | |
Intesa Sanpaolo S.p.A. (Italy)3, 6.50%, 2/24/2021 | | | | | | | 1,380,000 | | | | 1,578,995 | | | |
JPMorgan Chase & Co., 4.95%, 3/25/2020 | | | | | | | 4,040,000 | | | | 4,450,719 | | | |
Lloyds Bank plc (United Kingdom)3,6,8, 12.00% | | | | | | | 955,000 | | | | 1,254,631 | | | |
Lloyds Bank plc (United Kingdom)5, 9.875%, 12/16/2021 | | | | | | | 1,300,000 | | | | 1,359,995 | | | |
Lloyds Banking Group plc (United Kingdom)3, 4.582%, 12/10/2025 | | | | | | | 2,601,000 | | | | 2,607,807 | | | |
Popular, Inc., 7.00%, 7/1/2019 | | | | | | | 1,300,000 | | | | 1,267,500 | | | |
Royal Bank of Canada (Canada), 3.77%, 3/30/2018 | | | CAD | | | | 450,000 | | | | 375,454 | | | |
Santander Bank N.A., 8.75%, 5/30/2018 | | | | | | | 1,250,000 | | | | 1,401,587 | | | |
Santander Holdings USA, Inc., 2.65%, 4/17/2020 | | | | | | | 1,265,000 | | | | 1,260,503 | | | |
Westpac Banking Corp. (Australia), 5.75%, 2/6/2017 | | | AUD | | | | 400,000 | | | | 311,568 | | | |
| | | | | | | | | | | | | | |
| | | | |
| | | | | | | | | | | 26,936,790 | | | |
| | | | | | | | | | | | | | |
Capital Markets - 1.4% | | | | | | | | | | | | | | |
The Goldman Sachs Group, Inc.5, 1.718%, 11/15/2018 | | | | | | | 6,235,000 | | | | 6,250,563 | | | |
The Goldman Sachs Group, Inc., 5.375%, 3/15/2020 | | | | | | | 4,285,000 | | | | 4,762,589 | | | |
The Goldman Sachs Group, Inc.5, 2.236%, 11/29/2023 | | | | | | | 1,120,000 | | | | 1,117,835 | | | |
The Goldman Sachs Group, Inc., 4.25%, 10/21/2025 | | | | | | | 1,365,000 | | | | 1,393,759 | | | |
Morgan Stanley, 2.125%, 4/25/2018 | | | | | | | 5,000,000 | | | | 5,044,525 | | | |
Morgan Stanley, 5.00%, 11/24/2025 | | | | | | | 1,075,000 | | | | 1,170,082 | | | |
| | | | | | | | | | | | | | |
| | | | |
| | | | | | | | | | | 19,739,353 | | | |
| | | | | | | | | | | | | | |
Consumer Finance - 0.2% | | | | | | | | | | | | | | |
Ally Financial, Inc., 2.75%, 1/30/2017 | | | | | | | 955,000 | | | | 953,806 | | | |
Navient Corp., 6.00%, 1/25/2017 | | | | | | | 915,000 | | | | 929,869 | | | |
Navient Corp., 6.125%, 3/25/2024 | | | | | | | 1,250,000 | | | | 1,119,375 | | | |
| | | | | | | | | | | | | | |
| | | | |
| | | | | | | | | | | 3,003,050 | | | |
| | | | | | | | | | | | | | |
Diversified Financial Services - 0.2% | | | | | | | | | | | | | | |
ING Bank N.V. (Netherlands)5, 4.125%, 11/21/2023 | | | | | | | 1,475,000 | | | | 1,498,278 | | | |
Jefferies Finance LLC - JFIN Co-Issuer Corp.3, 7.375%, 4/1/2020 | | | | | | | 870,000 | | | | 802,575 | | | |
Jefferies Finance LLC - JFIN Co-Issuer Corp.3, 6.875%, 4/15/2022 | | | | | | | 555,000 | | | | 485,625 | | | |
| | | | | | | | | | | | | | |
| | | | |
| | | | | | | | | | | 2,786,478 | | | |
| | | | | | | | | | | | | | |
Insurance - 1.2% | | | | | | | | | | | | | | |
Aegon N.V. (Netherlands)5,6, 1.74% | | | | | | | 2,150,000 | | | | 1,313,545 | | | |
American International Group, Inc., 4.875%, 6/1/2022 | | | | | | | 3,705,000 | | | | 4,066,741 | | | |
Assured Guaranty US Holdings, Inc., 5.00%, 7/1/2024 | | | | | | | 4,835,000 | | | | 5,145,291 | | | |
AXA S.A. (France)5,6, 1.825% | | | | | | | 2,640,000 | | | | 1,809,245 | | | |
First American Financial Corp., 4.30%, 2/1/2023 | | | | | | | 1,650,000 | | | | 1,673,453 | | | |
Prudential Financial, Inc.9, 5.875%, 9/15/2042 | | | | | | | 1,950,000 | | | | 2,107,462 | | | |
| | | | | | | | | | | | | | |
| | | | |
| | | | | | | | | | | 16,115,737 | | | |
| | | | | | | | | | | | | | |
Real Estate Investment Trusts (REITS) - 0.3% | | | | | | | | | | | | | | |
Crown Castle Towers LLC3, 6.113%, 1/15/2020 | | | | | | | 1,040,000 | | | | 1,151,866 | | | |
Crown Castle Towers LLC3, 4.883%, 8/15/2020 | | | | | | | 333,000 | | | | 356,106 | | | |
Crown Castle Towers LLC3, 3.222%, 5/15/2022 | | | | | | | 1,300,000 | | | | 1,321,632 | | | |
Greystar Real Estate Partners LLC3, 8.25%, 12/1/2022 | | | | | | | 915,000 | | | | 951,600 | | | |
Welltower, Inc., 4.95%, 1/15/2021 | | | | | | | 330,000 | | | | 362,048 | | | |
| | | | | | | | | | | | | | |
| | | | |
| | | | | | | | | | | 4,143,252 | | | |
| | | | | | | | | | | | | | |
Real Estate Management & Development - 0.0%## | | | | | | | | | | | | | | |
Forestar USA Real Estate Group, Inc.3, 8.50%, 6/1/2022 | | | | | | | 615,000 | | | | 627,300 | | | |
| | | | | | | | | | | | | | |
The accompanying notes are an integral part of the financial statements.
34
Investment Portfolio - April 30, 2016
(unaudited)
| | | | | | | | |
| PRO-BLEND® MODERATE TERM SERIES | | PRINCIPAL
AMOUNT4 | | | VALUE (NOTE 2) | |
| | |
CORPORATE BONDS (continued) | | | | | | | | |
| | |
Non-Convertible Corporate Bonds (continued) | | | | | | | | |
Financials (continued) | | | | | | | | |
Thrifts & Mortgage Finance - 0.4% | | | | | | | | |
Ladder Capital Finance Holdings LLLP - Ladder Capital Finance Corp., 7.375%, 10/1/2017 | | | 1,455,000 | | | $ | 1,458,638 | |
Ladder Capital Finance Holdings LLLP - Ladder Capital Finance Corp.3, 5.875%, 8/1/2021 | | | 1,540,000 | | | | 1,355,200 | |
Radian Group, Inc., 7.00%, 3/15/2021 | | | 600,000 | | | | 639,750 | |
Rialto Holdings LLC - Rialto Corp.3, 7.00%, 12/1/2018 | | | 1,620,000 | | | | 1,587,600 | |
| | | | | | | | |
| | |
| | | | | | | 5,041,188 | |
| | | | | | | | |
| | |
Total Financials | | | | | | | 78,393,148 | |
| | | | | | | | |
Health Care - 0.4% | | | | | | | | |
Biotechnology - 0.1% | | | | | | | | |
AMAG Pharmaceuticals, Inc.3, 7.875%, 9/1/2023 | | | 1,555,000 | | | | 1,395,613 | |
| | | | | | | | |
Health Care Providers & Services - 0.1% | | | | | | | | |
HCA, Inc., 7.50%, 2/15/2022 | | | 560,000 | | | | 634,200 | |
Tenet Healthcare Corp.3,5, 4.134%, 6/15/2020 | | | 625,000 | | | | 625,781 | |
Tenet Healthcare Corp., 8.125%, 4/1/2022 | | | 595,000 | | | | 617,312 | |
| | | | | | | | |
| | |
| | | | | | | 1,877,293 | |
| | | | | | | | |
Pharmaceuticals - 0.2% | | | | | | | | |
Concordia Healthcare Corp. (Canada)3, 7.00%, 4/15/2023 | | | 925,000 | | | | 857,938 | |
Horizon Pharma Financing, Inc.3, 6.625%, 5/1/2023 | | | 905,000 | | | | 823,550 | |
Mallinckrodt International Finance S.A. - Mallinckrodt CB LLC3, 5.625%, 10/15/2023 | | | 935,000 | | | | 876,563 | |
| | | | | | | | |
| | |
| | | | | | | 2,558,051 | |
| | | | | | | | |
| | |
Total Health Care | | | | | | | 5,830,957 | |
| | | | | | | | |
Industrials - 2.0% | | | | | | | | |
Aerospace & Defense - 0.1% | | | | | | | | |
DigitalGlobe, Inc.3, 5.25%, 2/1/2021 | | | 1,405,000 | | | | 1,269,769 | |
| | | | | | | | |
Air Freight & Logistics - 0.0%## | | | | | | | | |
Neovia Logistics Intermediate Holdings LLC - Logistics Intermediate Finance Corp.3,10, 10.00%, 2/15/2018 | | | 645,000 | | | | 339,431 | |
| | | | | | | | |
Airlines - 0.4% | | | | | | | | |
Allegiant Travel Co., 5.50%, 7/15/2019 | | | 910,000 | | | | 936,731 | |
American Airlines Pass-Through Trust, Series 2013-2, Class A, 4.95%, 1/15/2023 | | | 1,852,546 | | | | 1,989,171 | |
Southwest Airlines Co., 2.75%, 11/6/2019 | | | 1,495,000 | | | | 1,536,610 | |
Southwest Airlines Co., 2.65%, 11/5/2020 | | | 500,000 | | | | 508,318 | |
| | | | | | | | |
| | |
| | | | | | | 4,970,830 | |
| | | | | | | | |
Commercial Services & Supplies - 0.1% | | | | | | | | |
Constellis Holdings LLC - Constellis Finance Corp.3, 9.75%, 5/15/2020 | | | 865,000 | | | | 782,825 | |
Modular Space Corp.3, 10.25%, 1/31/2019 | | | 645,000 | | | | 332,175 | |
| | | | | | | | |
| | |
| | | | | | | 1,115,000 | |
| | | | | | | | |
Industrial Conglomerates - 0.2% | | | | | | | | |
General Electric Co.5, 1.013%, 5/5/2026 | | | 2,310,000 | | | | 2,130,781 | |
| | | | | | | | |
Machinery - 0.1% | | | | | | | | |
Case New Holland Industrial, Inc. (United Kingdom), 7.875%, 12/1/2017 | | | 870,000 | | | | 926,550 | |
Waterjet Holdings, Inc.3, 7.625%, 2/1/2020 | | | 625,000 | | | | 624,219 | |
| | | | | | | | |
| | |
| | | | | | | 1,550,769 | |
| | | | | | | | |
Trading Companies & Distributors - 1.1% | | | | | | | | |
Air Lease Corp., 2.625%, 9/4/2018 | | | 2,875,000 | | | | 2,855,761 | |
Air Lease Corp., 3.375%, 6/1/2021 | | | 1,730,000 | | | | 1,734,325 | |
Aircastle Ltd., 6.75%, 4/15/2017 | | | 500,000 | | | | 516,350 | |
Aircastle Ltd., 5.50%, 2/15/2022 | | | 585,000 | | | | 622,294 | |
Aviation Capital Group Corp.3, 3.875%, 9/27/2016 | | | 3,995,000 | | | | 4,020,169 | |
Aviation Capital Group Corp.3, 2.875%, 9/17/2018 | | | 1,300,000 | | | | 1,297,699 | |
Fly Leasing Ltd. (Ireland), 6.375%, 10/15/2021 | | | 1,100,000 | | | | 1,078,000 | |
International Lease Finance Corp., 5.75%, 5/15/2016 | | | 970,000 | | | | 970,611 | |
International Lease Finance Corp.5, 2.584%, 6/15/2016 | | | 1,525,000 | | | | 1,526,787 | |
International Lease Finance Corp., 8.75%, 3/15/2017 | | | 825,000 | | | | 868,725 | |
International Lease Finance Corp., 6.25%, 5/15/2019 | | | 245,000 | | | | 265,825 | |
| | | | | | | | |
| | |
| | | | | | | 15,756,546 | |
| | | | | | | | |
| | |
Total Industrials | | | | | | | 27,133,126 | |
| | | | | | | | |
Information Technology - 0.5% | | | | | | | | |
Internet Software & Services - 0.0%## | | | | | | | | |
VeriSign, Inc., 5.25%, 4/1/2025 | | | 365,000 | | | | 375,037 | |
| | | | | | | | |
IT Services - 0.2% | | | | | | | | |
Automatic Data Processing, Inc., 2.25%, 9/15/2020 | | | 1,405,000 | | | | 1,450,050 | |
The accompanying notes are an integral part of the financial statements.
35
Investment Portfolio - April 30, 2016
(unaudited)
| | | | | | | | |
| PRO-BLEND® MODERATE TERM SERIES | | PRINCIPAL
AMOUNT4/ SHARES | | | VALUE (NOTE 2) | |
| | |
CORPORATE BONDS (continued) | | | | | | | | |
| | |
Non-Convertible Corporate Bonds (continued) | | | | | | | | |
Information Technology (continued) | | | | | | | | |
IT Services (continued) | | | | | | | | |
Visa, Inc., 2.80%, 12/14/2022 | | | 1,400,000 | | | $ | 1,460,330 | |
| | | | | | | | |
| | |
| | | | | | | 2,910,380 | |
| | | | | | | | |
Semiconductors & Semiconductor Equipment - 0.1% | | | | | | | | |
Intel Corp., 2.45%, 7/29/2020 | | | 1,490,000 | | | | 1,540,822 | |
| | | | | | | | |
Technology Hardware, Storage & Peripherals - 0.2% | | | | | | | | |
Diebold, Inc.3, 8.50%, 4/15/2024 | | | 615,000 | | | | 622,688 | |
Hewlett Packard Enterprise Co.3, 2.45%, 10/5/2017 | | | 1,545,000 | | | | 1,562,284 | |
Western Digital Corp.3, 10.50%, 4/1/2024 | | | 655,000 | | | | 636,987 | |
| | | | | | | | |
| | |
| | | | | | | 2,821,959 | |
| | | | | | | | |
| | |
Total Information Technology | | | | | | | 7,648,198 | |
| | | | | | | | |
Materials - 0.9% | | | | | | | | |
Chemicals - 0.4% | | | | | | | | |
Consolidated Energy Finance S.A. (Trinidad-Tobago)3, 6.75%, 10/15/2019 | | | 1,305,000 | | | | 1,233,225 | |
The Dow Chemical Co., 8.55%, 5/15/2019 | | | 2,305,000 | | | | 2,752,557 | |
Solvay Finance America LLC (Belgium)3, 3.40%, 12/3/2020 | | | 1,600,000 | | | | 1,656,299 | |
| | | | | | | | |
| | |
| | | | | | | 5,642,081 | |
| | | | | | | | |
Containers & Packaging - 0.1% | | | | | | | | |
Ardagh Packaging Finance plc - Ardagh Holdings USA, Inc. (Ireland)3,5, 3.634%, 12/15/2019 | | | 630,000 | | | | 636,221 | |
| | | | | | | | |
Metals & Mining - 0.3% | | | | | | | | |
Alcoa, Inc., 5.87%, 2/23/2022 | | | 915,000 | | | | 933,300 | |
Anglo American Capital plc (United Kingdom)3, 3.625%, 5/14/2020 | | | 345,000 | | | | 324,300 | |
ArcelorMittal (Luxembourg), 10.85%, 6/1/2019 | | | 270,000 | | | | 309,150 | |
BP Capital Markets plc (United Kingdom), 3.535%, 11/4/2024 | | | 350,000 | | | | 365,025 | |
FMG Resources August 2006 Pty Ltd. (Australia)3, 6.875%, 4/1/2022 | | | 195,000 | | | | 177,450 | |
Rio Tinto Finance USA Ltd. (United Kingdom), 3.75%, 9/20/2021 | | | 1,585,000 | | | | 1,681,528 | |
SunCoke Energy Partners LP - SunCoke Energy Partners Finance Corp.3, 7.375%, 2/1/2020 | | | 930,000 | | | | 711,450 | |
| | | | | | | | |
| | |
| | | | | | | 4,502,203 | |
| | | | | | | | |
Paper & Forest Products - 0.1% | | | | | | | | |
Domtar Corp., 4.40%, 4/1/2022 | | | 1,425,000 | | | | 1,462,364 | |
| | | | | | | | |
| | |
Total Materials | | | | | | | 12,242,869 | |
| | | | | | | | |
Telecommunication Services - 1.0% | | | | | | | | |
Diversified Telecommunication Services - 0.6% | | | | | | | | |
AT&T, Inc., 5.20%, 3/15/2020 | | | 2,115,000 | | | | 2,355,588 | |
CenturyLink, Inc., 7.50%, 4/1/2024 | | | 1,265,000 | | | | 1,268,163 | |
Embarq Corp., 7.082%, 6/1/2016 | | | 955,000 | | | | 959,420 | |
Frontier Communications Corp.3, 11.00%, 9/15/2025 | | | 1,555,000 | | | | 1,570,550 | |
Inmarsat Finance plc (United Kingdom)3, 4.875%, 5/15/2022 | | | 1,365,000 | | | | 1,296,750 | |
Numericable-SFR S.A. (France)3, 6.25%, 5/15/2024 | | | 205,000 | | | | 198,338 | |
Numericable-SFR S.A. (France)3, 7.375%, 5/1/2026 | | | 250,000 | | | | 253,750 | |
| | | | | | | | |
| | |
| | | | | | | 7,902,559 | |
| | | | | | | | |
Wireless Telecommunication Services - 0.4% | | | | | | | | |
Altice Financing S.A. (Luxembourg)3, 6.625%, 2/15/2023 | | | 1,775,000 | | | | 1,755,120 | |
SBA Tower Trust3, 3.598%, 4/15/2018 | | | 1,500,000 | | | | 1,497,755 | |
Sixsigma Networks Mexico S.A. de C.V. (Mexico)3, 8.25%, 11/7/2021 | | | 970,000 | | | | 931,200 | |
T-Mobile USA, Inc., 6.836%, 4/28/2023 | | | 740,000 | | | | 789,025 | |
Wind Acquisition Finance S.A. (Italy)3, 4.75%, 7/15/2020 | | | 420,000 | | | | 400,890 | |
| | | | | | | | |
| | |
| | | | | | | 5,373,990 | |
| | | | | | | | |
| | |
Total Telecommunication Services | | | | | | | 13,276,549 | |
| | | | | | | | |
Utilities - 0.3% | | | | | | | | |
Independent Power and Renewable Electricity Producers - 0.3% | | | | | | | | |
Abengoa Yield plc (Spain)3, 7.00%, 11/15/2019 | | | 1,430,000 | | | | 1,358,497 | |
ContourGlobal Power Holdings S.A. (France)3, 7.125%, 6/1/2019 | | | 615,000 | | | | 608,850 | |
NRG Energy, Inc., 6.25%, 7/15/2022 | | | 655,000 | | | | 642,110 | |
Talen Energy Supply LLC3, 4.625%, 7/15/2019 | | | 1,250,000 | | | | 1,162,500 | |
TerraForm Power Operating LLC3, 6.125%, 6/15/2025 | | | 1,165,000 | | | | 1,001,900 | |
| | | | | | | | |
| | |
Total Utilities | | | | | | | 4,773,857 | |
| | | | | | | | |
TOTAL CORPORATE BONDS
(Identified Cost $207,389,164) | | | | | | | 206,358,137 | |
| | | | | | | | |
| | |
MUTUAL FUND - 0.0%## | | | | | | | | |
| | |
iShares MSCI India ETF (Identified Cost $202,352) | | | 7,340 | | | | 198,620 | |
| | | | | | | | |
| | |
U.S. TREASURY SECURITIES - 6.8% | | | | | | | | |
| | |
U.S. Treasury Bonds - 1.1% | | | | | | | | |
U.S. Treasury Inflation Indexed Bond, 0.75%, 2/15/2042 (Identified Cost $13,954,656) | | | 15,268,043 | | | | 14,874,417 | |
| | | | | | | | |
The accompanying notes are an integral part of the financial statements.
36
Investment Portfolio - April 30, 2016
(unaudited)
| | | | | | | | |
| PRO-BLEND® MODERATE TERM SERIES | | PRINCIPAL
AMOUNT4 | | | VALUE (NOTE 2) | |
| | |
U.S. TREASURY SECURITIES (continued) | | | | | | | | |
| | |
U.S. Treasury Notes - 5.7% | | | | | | | | |
U.S. Treasury Floating Rate Note5, 0.418%, 10/31/2017 | | | 15,000,000 | | | $ | 15,013,845 | |
U.S. Treasury Inflation Indexed Note, 0.125%, 4/15/2017 | | | 24,160,634 | | | | 24,384,941 | |
U.S. Treasury Inflation Indexed Note, 0.125%, 4/15/2020 | | | 24,323,730 | | | | 24,836,183 | |
U.S. Treasury Inflation Indexed Note, 0.125%, 1/15/2023 | | | 14,251,450 | | | | 14,402,872 | |
| | | | | | | | |
Total U.S. Treasury Notes
(Identified Cost $77,101,690) | | | | | | | 78,637,841 | |
| | | | | | | | |
TOTAL U.S. TREASURY SECURITIES
(Identified Cost $91,056,346) | | | | | | | 93,512,258 | |
| | | | | | | | |
| | |
ASSET-BACKED SECURITIES - 1.3% | | | | | | | | |
| | |
Alterna Funding I LLC, Series 2014-1A, Class NOTE3, 1.639%, 2/15/2021 | | | 750,465 | | | | 724,199 | |
Cazenovia Creek Funding I LLC, Series 2015-1A, Class A3, 2.00%, 12/10/2023 | | | 1,625,315 | | | | 1,611,094 | |
Colony American Homes, Series 2015-1A, Class A3,5, 1.636%, 7/17/2032 | | | 1,298,002 | | | | 1,284,772 | |
Enterprise Fleet Financing LLC, Series 2014-2, Class A23, 1.05%, 3/20/2020 | | | 1,063,491 | | | | 1,059,787 | �� |
Enterprise Fleet Financing LLC, Series 2015-2, Class A23, 1.59%, 2/22/2021 | | | 3,488,768 | | | | 3,489,448 | |
FDIC Trust, Series 2011-R1, Class A3, 2.672%, 7/25/2026 | | | 577,296 | | | | 587,986 | |
FNA Trust, Series 2014-1A, Class A3, 1.296%, 12/10/2022 | | | 408,177 | | | | 404,223 | |
Home Partners of America Trust, Series 2016-1, Class A3,5, 2.086%, 3/17/2033 | | | 1,146,230 | | | | 1,142,554 | |
Invitation Homes Trust, Series 2015-SFR3, Class A3,5, 1.736%, 8/17/2032 | | | 2,467,302 | | | | 2,473,659 | |
NextGear Floorplan Master Owner Trust, Series 2014-1A, Class A3, 1.92%, 10/15/2019 | | | 1,400,000 | | | | 1,391,945 | |
SpringCastle America Funding LLC, Series 2014-AA, Class A3, 2.70%, 5/25/2023 | | | 1,264,677 | | | | 1,267,617 | |
Starwood Retail Property Trust, Series 2014-STAR, Class A3,5, 1.653%, 11/15/2027 | | | 2,116,000 | | | | 2,093,358 | |
| | | | | | | | |
| | |
TOTAL ASSET-BACKED SECURITIES
(Identified Cost $17,585,278) | | | | | | | 17,530,642 | |
| | | | | | | | |
| | |
COMMERCIAL MORTGAGE-BACKED SECURITIES - 7.3% | | | | | | | | |
| | |
Americold LLC Trust, Series 2010-ARTA, Class A13, 3.847%, 1/14/2029 | | | 222,707 | | | | 231,299 | |
Banc of America Commercial Mortgage Trust, Series 2006-3, Class A45, 5.889%, 7/10/2044 | | | 708,534 | | | | 708,366 | |
Banc of America Commercial Mortgage Trust, Series 2006-4, Class A4, 5.634%, 7/10/2046 | | | 246,048 | | | | 246,068 | |
Bear Stearns Commercial Mortgage Securities Trust, Series 2006-PW13, Class A4, 5.54%, 9/11/2041 | | | 641,204 | | | | 642,572 | |
Bear Stearns Commercial Mortgage Securities Trust, Series 2006-T24, Class AM5, 5.568%, 10/12/2041 | | | 1,600,000 | | | | 1,616,191 | |
BWAY Mortgage Trust, Series 2015-1740, Class A3, 2.917%, 1/13/2035 | | | 4,700,000 | | | | 4,700,325 | |
COBALT CMBS Commercial Mortgage Trust, Series 2006-C1, Class A4, 5.223%, 8/15/2048 | | | 2,816,605 | | | | 2,844,106 | |
Commercial Mortgage Pass-Through Certificates, Series 2015-DC1, Class A5, 3.35%, 2/10/2048 | | | 5,000,000 | | | | 5,232,380 | |
Commercial Mortgage Pass-Through Certificates, Series 2015-LC19, Class A4, 3.183%, 2/10/2048 | | | 5,225,000 | | | | 5,445,848 | |
Commercial Mortgage Pass-Through Certificates, Series 2015-PC1, Class A5, 3.902%, 7/10/2050 | | | 2,250,000 | | | | 2,444,361 | |
Credit Suisse Mortgage Capital Trust, Series 2013-IVR3, Class A13,5, 2.50%, 5/25/2043 | | | 1,679,836 | | | | 1,647,355 | |
Credit Suisse Mortgage Capital Trust, Series 2013-TH1, Class A13,5, 2.13%, 2/25/2043 | | | 1,356,534 | | | | 1,312,330 | |
DB-UBS Mortgage Trust, Series 2011-LC1A, Class A13, 3.742%, 11/10/2046 | | | 10,662 | | | | 10,726 | |
Extended Stay America Trust, Series 2013-ESH7, Class A273, 2.958%, 12/5/2031 | | | 1,482,926 | | | | 1,488,200 | |
Fannie Mae Multifamily REMIC Trust, Series 2012-M13, Class ASQ2, 1.246%, 8/25/2017 | | | 948,621 | | | | 947,775 | |
Freddie Mac Multifamily Structured Pass-Through Certificates, Series K009, Class X1 (IO)5, 1.43%, 8/25/2020 | | | 18,238,860 | | | | 849,526 | |
Freddie Mac Multifamily Structured Pass-Through Certificates, Series K014, Class X1 (IO)5, 1.212%, 4/25/2021 | | | 8,550,056 | | | | 441,286 | |
Freddie Mac Multifamily Structured Pass-Through Certificates, Series K016, Class X1 (IO)5, 1.548%, 10/25/2021 | | | 5,763,931 | | | | 394,262 | |
Freddie Mac Multifamily Structured Pass-Through Certificates, Series K017, Class X1 (IO)5, 1.411%, 12/25/2021 | | | 8,864,792 | | | | 556,313 | |
Freddie Mac Multifamily Structured Pass-Through Certificates, Series K021, Class X1 (IO)5, 1.488%, 6/25/2022 | | | 12,467,704 | | | | 912,835 | |
The accompanying notes are an integral part of the financial statements.
37
Investment Portfolio - April 30, 2016
(unaudited)
| | | | | | | | |
| PRO-BLEND® MODERATE TERM SERIES | | PRINCIPAL
AMOUNT 4 | | | VALUE (NOTE 2) | |
| | |
COMMERCIAL MORTGAGE-BACKED SECURITIES (continued) | | | | | | | | |
| | |
Freddie Mac Multifamily Structured Pass-Through Certificates, Series K030, Class X1 (IO)5, 0.22%, 4/25/2023 | | | 64,605,557 | | | $ | 825,136 | |
Freddie Mac Multifamily Structured Pass-Through Certificates, Series K032, Class X1 (IO)5, 0.119%, 5/25/2023 | | | 41,000,667 | | | | 310,096 | |
Freddie Mac Multifamily Structured Pass-Through Certificates, Series K706, Class X1 (IO)5, 1.563%, 10/25/2018 | | | 8,616,062 | | | | 286,973 | |
Freddie Mac Multifamily Structured Pass-Through Certificates, Series K-P01, Class A2, 1.72%, 1/25/2019 | | | 1,705,000 | | | | 1,704,812 | |
FREMF Mortgage Trust, Series 2011-K701, Class B3,5, 4.436%, 7/25/2048 | | | 750,000 | | | | 768,489 | |
FREMF Mortgage Trust, Series 2011-K702, Class B3,5, 4.931%, 4/25/2044 | | | 885,000 | | | | 920,012 | |
FREMF Mortgage Trust, Series 2013-K28, Class X2A (IO)3, 0.10%, 6/25/2046 | | | 162,369,336 | | | | 887,446 | |
FREMF Mortgage Trust, Series 2013-K502, Class B3,5, 2.746%, 3/25/2045 | | | 2,135,000 | | | | 2,137,643 | |
FREMF Mortgage Trust, Series 2013-K712, Class B3,5, 3.484%, 5/25/2045 | | | 885,000 | | | | 898,640 | |
FREMF Mortgage Trust, Series 2014-K37, Class B3,5, 4.713%, 1/25/2047 | | | 1,977,000 | | | | 2,054,734 | |
FREMF Mortgage Trust, Series 2014-K716, Class B3,5, 4.085%, 8/25/2047 | | | 2,885,000 | | | | 2,979,798 | |
GAHR Commercial Mortgage Trust, Series 2015-NRF, Class BFX3,5, 3.382%, 12/15/2019 | | | 2,300,000 | | | | 2,344,041 | |
GAHR Commercial Mortgage Trust, Series 2015-NRF, Class DFX3,5, 3.382%, 12/15/2019 | | | 1,000,000 | | | | 975,569 | |
GCCFC Commercial Mortgage Trust, Series 2006-GG7, Class A45, 5.921%, 7/10/2038 | | | 37,033 | | | | 37,025 | |
GS Mortgage Securities Trust, Series 2010-C2, Class A13, 3.849%, 12/10/2043 | | | 141,602 | | | | 146,861 | |
GS Mortgage Securities Trust, Series 2013-GC16, Class A4, 4.271%, 11/10/2046 | | | 4,500,000 | | | | 5,026,280 | |
JP Morgan Chase Commercial Mortgage Securities Trust, Series 2006-CB15, Class A45, 5.814%, 6/12/2043 | | | 830,818 | | | | 829,765 | |
JP Morgan Chase Commercial Mortgage Securities Trust, Series 2006-LDP7, Class A45, 5.981%, 4/17/2045 | | | 225,837 | | | | 225,606 | |
JP Morgan Chase Commercial Mortgage Securities Trust, Series 2006-LDP9, Class A3, 5.336%, 5/15/2047 | | | 5,768,436 | | | | 5,855,504 | |
JP Morgan Mortgage Trust, Series 2013-1, Class 1A23,5, 3.00%, 3/25/2043 | | | 1,044,142 | | | | 1,044,366 | |
JP Morgan Mortgage Trust, Series 2013-2, Class A23,5, 3.50%, 5/25/2043 | | | 1,221,767 | | | | 1,239,444 | |
JP Morgan Mortgage Trust, Series 2014-2, Class 1A13,5, 3.00%, 6/25/2029 | | | 1,490,082 | | | | 1,526,635 | |
LB-UBS Commercial Mortgage Trust, Series 2006-C7, Class A3, 5.347%, 11/15/2038 | | | 2,763,371 | | | | 2,783,902 | |
Motel 6 Trust, Series 2015-MTL6, Class B3, 3.298%, 2/5/2030 | | | 2,100,000 | | | | 2,111,085 | |
New Residential Mortgage Loan Trust, Series 2014-3A, Class AFX33,5, 3.75%, 11/25/2054 | | | 1,521,139 | | | | 1,565,892 | |
New Residential Mortgage Loan Trust, Series 2015-2A, Class A15, 3.75%, 8/25/2055 | | | 1,719,060 | | | | 1,771,073 | |
OBP Depositor LLC Trust, Series 2010-OBP, Class A3, 4.646%, 7/15/2045 | | | 115,000 | | | | 126,391 | |
SBA Small Business Investment Companies, Series 2015-10A, Class 1, 2.517%, 3/10/2025 | | | 1,025,316 | | | | 1,048,160 | |
SBA Small Business Investment Companies, Series 2015-10B, Class 1, 2.829%, 9/10/2025 | | | 5,910,110 | | | | 6,056,829 | |
SCG Trust, Series 2013-SRP1, Class AJ3,5, 2.383%, 11/15/2026 | | | 3,550,000 | | | | 3,541,716 | |
Sequoia Mortgage Trust, Series 2013-2, Class A5, 1.874%, 2/25/2043 | | | 1,161,664 | | | | 1,099,130 | |
Sequoia Mortgage Trust, Series 2013-7, Class A25, 3.00%, 6/25/2043 | | | 1,014,456 | | | | 1,014,514 | |
Sequoia Mortgage Trust, Series 2013-8, Class A15, 3.00%, 6/25/2043 | | | 1,368,530 | | | | 1,363,082 | |
Vornado DP LLC Trust, Series 2010-VNO, Class A2FX3, 4.004%, 9/13/2028 | | | 350,000 | | | | 372,111 | |
Wachovia Bank Commercial Mortgage Trust, Series 2006-C26, Class A35 , 6.011%, 6/15/2045 | | | 318,184 | | | | 317,759 | |
Wells Fargo Commercial Mortgage Trust, Series 2010-C1, Class A23, 4.393%, 11/15/2043 | | | 545,000 | | | | 593,432 | |
Wells Fargo Commercial Mortgage Trust, Series 2015-C26, Class A4, 3.166%, 2/15/2048 | | | 5,300,000 | | | | 5,468,396 | |
WF-RBS Commercial Mortgage Trust, Series 2013-C11, Class A2, 2.029%, 3/15/2045 | | | 1,950,000 | | | | 1,962,608 | |
WinWater Mortgage Loan Trust, Series 2015-1, Class A13,5, 3.50%, 1/20/2045 | | | 1,910,152 | | | | 1,956,051 | |
The accompanying notes are an integral part of the financial statements.
38
Investment Portfolio - April 30, 2016
(unaudited)
| | | | | | | | | | | | | | |
| PRO-BLEND® MODERATE TERM SERIES | | | | | PRINCIPAL
AMOUNT4 | | | VALUE (NOTE 2) | | | |
| | | | |
COMMERCIAL MORTGAGE-BACKED SECURITIES (continued) | | | | | | | | | | | | | | |
WinWater Mortgage Loan Trust, Series 2015-3, Class A53,5, 3.50%, 3/20/2045 | | | | | | | 2,060,664 | | | $ | 2,110,153 | | | |
| | | | | | | | | | | | | | |
TOTAL COMMERCIAL MORTGAGE-BACKED SECURITIES | | | | | | | | | | | | | | |
(Identified Cost $100,967,617) | | | | | | | | | | | 100,959,283 | | | |
| | | | | | | | | | | | | | |
| | | | |
FOREIGN GOVERNMENT BONDS - 1.9% | | | | | | | | | | | | | | |
Bonos de la Tesoreria de la Republica en pesos (Chile), 6.00%, 1/1/2018 | | | CLP | | | | 790,000,000 | | | | 1,236,138 | | | |
Brazilian Government International Bond (Brazil), 8.875%, 10/14/2019 | | | | | | | 800,000 | | | | 960,002 | | | |
Bundesrepublik Deutschland (Germany), 1.50%, 9/4/2022 | | | EUR | | | | 300,000 | | | | 380,095 | | | |
Bundesrepublik Deutschland (Germany), 1.00%, 8/15/2024 | | | EUR | | | | 300,000 | | | | 369,765 | | | |
Canada Housing Trust No. 1 (Canada)3, 4.10%, 12/15/2018 | | | CAD | | | | 390,000 | | | | 335,934 | | | |
Canadian Government Bond (Canada), 1.50%, 9/1/2017 | | | CAD | | | | 160,000 | | | | 128,914 | | | |
Canadian Government Bond (Canada), 2.75%, 6/1/2022 | | | CAD | | | | 500,000 | | | | 438,531 | | | |
Export-Import Bank of Korea (South Korea), 2.625%, 12/30/2020 | | | | | | | 9,100,000 | | | | 9,300,009 | | | |
Ireland Government Bond (Ireland), 5.00%, 10/18/2020 | | | EUR | | | | 300,000 | | | | 419,512 | | | |
Ireland Government Bond (Ireland), 0.80%, 3/15/2022 | | | EUR | | | | 200,000 | | | | 236,248 | | | |
Ireland Government Bond (Ireland), 3.90%, 3/20/2023 | | | EUR | | | | 50,000 | | | | 70,450 | | | |
Italy Buoni Poliennali Del Tesoro (Italy), 5.50%, 9/1/2022 | | | EUR | | | | 630,000 | | | | 928,313 | | | |
Italy Buoni Poliennali Del Tesoro (Italy), 1.45%, 9/15/2022 | | | EUR | | | | 75,000 | | | | 89,061 | | | |
Italy Buoni Poliennali Del Tesoro (Italy), 5.50%, 11/1/2022 | | | EUR | | | | 760,000 | | | | 1,123,177 | | | |
Italy Buoni Poliennali Del Tesoro (Italy), 1.50%, 6/1/2025 | | | EUR | | | | 200,000 | | | | 230,931 | | | |
Japan Government Five Year Bond (Japan), 0.30%, 12/20/2016 | | | JPY | | | | 101,000,000 | | | | 952,077 | | | |
Korea Treasury Bond (South Korea), 2.75%, 6/10/2016 | | | KRW | | | | 470,000,000 | | | | 413,086 | | | |
Korea Treasury Bond (South Korea), 2.00%, 12/10/2017 | | | KRW | | | | 480,000,000 | | | | 424,844 | | | |
Malaysia Government Bond (Malaysia), 4.262%, 9/15/2016 | | | MYR | | | | 3,205,000 | | | | 826,053 | | | |
Mexican Government Bond (Mexico), 7.25%, 12/15/2016 | | | MXN | | | | 6,000,000 | | | | 355,830 | | | |
Mexican Government Bond (Mexico), 5.00%, 6/15/2017 | | | MXN | | | | 9,500,000 | | | | 557,965 | | | |
Mexican Government Bond (Mexico), 8.00%, 6/11/2020 | | | MXN | | | | 9,900,000 | | | | 637,297 | | | |
Mexican Government Bond (Mexico), 6.50%, 6/10/2021 | | | MXN | | | | 4,000,000 | | | | 245,180 | | | |
Mexican Government Bond (Mexico), 6.50%, 6/9/2022 | | | MXN | | | | 6,500,000 | | | | 397,566 | | | |
Mexican Government Bond (Mexico), 7.75%, 5/29/2031 | | | MXN | | | | 1,250,000 | | | | 82,812 | | | |
Norway Government Bond (Norway)3, 4.25%, 5/19/2017 | | | NOK | | | | 1,610,000 | | | | 207,572 | | | |
Singapore Government Bond (Singapore), 2.50%, 6/1/2019 | | | SGD | | | | 855,000 | | | | 661,253 | | | |
Spain Government Bond (Spain), 4.50%, 1/31/2018 | | | EUR | | | | 325,000 | | | | 401,724 | | | |
Spain Government Bond (Spain)3, 4.00%, 4/30/2020 | | | EUR | | | | 515,000 | | | | 675,682 | | | |
Spain Government Bond (Spain)3, 5.40%, 1/31/2023 | | | EUR | | | | 760,000 | | | | 1,125,484 | | | |
Spain Government Bond (Spain)3, 1.60%, 4/30/2025 | | | EUR | | | | 500,000 | | | | 579,713 | | | |
United Kingdom Gilt (United Kingdom), 1.00%, 9/7/2017 | | | GBP | | | | 380,000 | | | | 559,061 | | | |
United Kingdom Gilt (United Kingdom), 5.00%, 3/7/2018 | | | GBP | | | | 475,000 | | | | 753,189 | | | |
| | | | | | | | | | | | | | |
| | | | |
TOTAL FOREIGN GOVERNMENT BONDS | | | | | | | | | | | | | | |
(Identified Cost $27,147,766) | | | | | | | | | | | 26,103,468 | | | |
| | | | | | | | | | | | | | |
| | | | |
U.S. GOVERNMENT AGENCIES - 10.8% | | | | | | | | | | | | | | |
| | | | |
Mortgage-Backed Securities - 9.6% | | | | | | | | | | | | | | |
Fannie Mae, Pool #888468, 5.50%, 9/1/2021 | | | | | | | 670,283 | | | | 721,294 | | | |
Fannie Mae, Pool #995233, 5.50%, 10/1/2021 | | | | | | | 46,601 | | | | 49,631 | | | |
Fannie Mae, Pool #888017, 6.00%, 11/1/2021 | | | | | | | 65,869 | | | | 71,561 | | | |
Fannie Mae, Pool #995329, 5.50%, 12/1/2021 | | | | | | | 456,284 | | | | 489,963 | | | |
Fannie Mae, Pool #888136, 6.00%, 12/1/2021 | | | | | | | 81,748 | | | | 88,873 | | | |
Fannie Mae, Pool #888810, 5.50%, 11/1/2022 | | | | | | | 802,630 | | | | 862,883 | | | |
Fannie Mae, Pool #AD0462, 5.50%, 10/1/2024 | | | | | | | 51,602 | | | | 56,449 | | | |
Fannie Mae, Pool #MA1834, 4.50%, 2/1/2034 | | | | | | | 1,167,536 | | | | 1,279,027 | | | |
Fannie Mae, Pool #MA1890, 4.00%, 5/1/2034 | | | | | | | 1,251,457 | | | | 1,349,530 | | | |
Fannie Mae, Pool #MA1903, 4.50%, 5/1/2034 | | | | | | | 958,420 | | | | 1,049,719 | | | |
The accompanying notes are an integral part of the financial statements.
39
Investment Portfolio - April 30, 2016
(unaudited)
| | | | | | | | | | | | |
| PRO-BLEND® MODERATE TERM SERIES | | | | PRINCIPAL
AMOUNT4 | | | VALUE (NOTE 2) | | | |
| | | | |
U.S. GOVERNMENT AGENCIES (continued) | | | | | | | | | | | | |
| | | | |
Mortgage-Backed Securities (continued) | | | | | | | | | | | | |
Fannie Mae, Pool #AS3677, 4.00%, 10/1/2034 | | | | | 1,854,324 | | | $ | 1,998,173 | | | |
Fannie Mae, Pool #MA2177, 4.00%, 2/1/2035 | | | | | 2,036,034 | | | | 2,194,726 | | | |
Fannie Mae, Pool #AZ3376, 4.00%, 7/1/2035 | | | | | 3,921,511 | | | | 4,222,363 | | | |
Fannie Mae, Pool #745418, 5.50%, 4/1/2036 | | | | | 1,105,738 | | | | 1,246,057 | | | |
Fannie Mae, Pool #888021, 6.00%, 12/1/2036 | | | | | 164,831 | | | | 188,215 | | | |
Fannie Mae, Pool #909786, 5.50%, 3/1/2037 | | | | | 280,590 | | | | 314,946 | | | |
Fannie Mae, Pool #256673, 5.50%, 4/1/2037 | | | | | 1,136,856 | | | | 1,277,037 | | | |
Fannie Mae, Pool #995050, 6.00%, 9/1/2037 | | | | | 363,679 | | | | 415,293 | | | |
Fannie Mae, Pool #AB8161, 6.00%, 12/1/2037 | | | | | 1,283,624 | | | | 1,466,003 | | | |
Fannie Mae, Pool #933731, 5.50%, 4/1/2038 | | | | | 590,162 | | | | 662,063 | | | |
Fannie Mae, Pool #889576, 6.00%, 4/1/2038 | | | | | 783,870 | | | | 895,143 | | | |
Fannie Mae, Pool #889624, 5.50%, 5/1/2038 | | | | | 774,792 | | | | 870,414 | | | |
Fannie Mae, Pool #889579, 6.00%, 5/1/2038 | | | | | 694,100 | | | | 791,690 | | | |
Fannie Mae, Pool #889575, 6.00%, 6/1/2038 | | | | | 476,372 | | | | 543,966 | | | |
Fannie Mae, Pool #995196, 6.00%, 7/1/2038 | | | | | 2,105,106 | | | | 2,403,734 | | | |
Fannie Mae, Pool #AD0119, 6.00%, 7/1/2038 | | | | | 488,760 | | | | 557,269 | | | |
Fannie Mae, Pool #AD0207, 6.00%, 10/1/2038 | | | | | 272,181 | | | | 310,142 | | | |
Fannie Mae, Pool #AD0220, 6.00%, 10/1/2038 | | | | | 91,564 | | | | 104,535 | | | |
Fannie Mae, Pool #890294, 5.50%, 1/1/2039 | | | | | 1,679,109 | | | | 1,884,464 | | | |
Fannie Mae, Pool #AD0307, 5.50%, 1/1/2039 | | | | | 775,290 | | | | 871,639 | | | |
Fannie Mae, Pool #AD0258, 5.50%, 3/1/2039 | | | | | 409,218 | | | | 459,653 | | | |
Fannie Mae, Pool #AD0527, 5.50%, 6/1/2039 | | | | | 245,089 | | | | 275,536 | | | |
Fannie Mae, Pool #MA0258, 4.50%, 12/1/2039 | | | | | 1,774,716 | | | | 1,935,916 | | | |
Fannie Mae, Pool #890326, 5.50%, 1/1/2040 | | | | | 1,878,449 | | | | 2,112,163 | | | |
Fannie Mae, Pool #AL1595, 6.00%, 1/1/2040 | | | | | 1,216,046 | | | | 1,388,859 | | | |
Fannie Mae, Pool #AE0061, 6.00%, 2/1/2040 | | | | | 993,903 | | | | 1,134,356 | | | |
Fannie Mae, Pool #AL0152, 6.00%, 6/1/2040 | | | | | 1,633,940 | | | | 1,864,522 | | | |
Fannie Mae, Pool #AL2581, 6.00%, 6/1/2040 | | | | | 1,042,806 | | | | 1,190,681 | | | |
Fannie Mae, Pool #890519, 6.00%, 10/1/2040 | | | | | 2,426,336 | | | | 2,768,497 | | | |
Fannie Mae, Pool #AE0951, 4.50%, 2/1/2041 | | | | | 1,117,931 | | | | 1,219,874 | | | |
Fannie Mae, Pool #AH9054, 4.50%, 4/1/2041 | | | | | 477,371 | | | | 520,751 | | | |
Fannie Mae, Pool #AI2468, 4.50%, 5/1/2041 | | | | | 375,878 | | | | 410,161 | | | |
Fannie Mae, Pool #AL0160, 4.50%, 5/1/2041 | | | | | 1,158,144 | | | | 1,263,761 | | | |
Fannie Mae, Pool #AI5172, 4.00%, 8/1/2041 | | | | | 1,294,088 | | | | 1,386,719 | | | |
Fannie Mae, Pool #AJ1415, 4.50%, 9/1/2041 | | | | | 266,908 | | | | 291,186 | | | |
Fannie Mae, Pool #AL1410, 4.50%, 12/1/2041 | | | | | 3,235,289 | | | | 3,529,336 | | | |
Fannie Mae, Pool #AK4940, 3.50%, 3/1/2042 | | | | | 1,402,575 | | | | 1,472,518 | | | |
Fannie Mae, Pool #AL7068, 4.50%, 9/1/2042 | | | | | 3,397,101 | | | | 3,697,267 | | | |
Fannie Mae, Pool #AL7729, 4.00%, 6/1/2043 | | | | | 1,641,052 | | | | 1,756,962 | | | |
Fannie Mae, Pool #AS1845, 4.50%, 2/1/2044 | | | | | 4,868,984 | | | | 5,321,207 | | | |
Fannie Mae, Pool #AL7767, 4.50%, 6/1/2044 | | | | | 3,263,199 | | | | 3,555,736 | | | |
Fannie Mae, Pool #AX5234, 4.50%, 11/1/2044 | | | | | 4,613,209 | | | | 5,029,006 | | | |
Fannie Mae, Pool #AZ3627, 4.00%, 11/1/2045 | | | | | 694,823 | | | | 742,662 | | | |
Fannie Mae, Pool #BA3890, 4.00%, 11/1/2045 | | | | | 955,207 | | | | 1,021,343 | | | |
Fannie Mae, Pool #BA3034, 4.00%, 12/1/2045 | | | | | 507,084 | | | | 542,309 | | | |
Fannie Mae, Pool #BA6762, 4.00%, 12/1/2045 | | | | | 899,986 | | | | 961,764 | | | |
Fannie Mae, Pool #AZ5009, 4.00%, 1/1/2046 | | | | | 764,279 | | | | 816,882 | | | |
Fannie Mae, Pool #MA2514, 4.50%, 1/1/2046 | | | | | 2,702,828 | | | | 2,954,861 | | | |
Fannie Mae, Pool #BC3490, 3.50%, 2/1/2046 | | | | | 3,289,023 | | | | 3,447,864 | | | |
Freddie Mac, Pool #G11850, 5.50%, 7/1/2020 | | | | | 222,691 | | | | 234,704 | | | |
The accompanying notes are an integral part of the financial statements.
40
Investment Portfolio - April 30, 2016
(unaudited)
| | | | | | | | |
| PRO-BLEND® MODERATE TERM SERIES | | PRINCIPAL AMOUNT 4/ SHARES | | | VALUE (NOTE 2) | |
| | |
U.S. GOVERNMENT AGENCIES (continued) | | | | | | | | |
| | |
Mortgage-Backed Securities (continued) | | | | | | | | |
Freddie Mac, Pool #G12610, 6.00%, 3/1/2022 | | | 83,757 | | | $ | 91,714 | |
Freddie Mac, Pool #G12655, 6.00%, 5/1/2022 | | | 59,474 | | | | 65,142 | |
Freddie Mac, Pool #G12988, 6.00%, 1/1/2023 | | | 44,273 | | | | 48,330 | |
Freddie Mac, Pool #G13078, 6.00%, 3/1/2023 | | | 80,014 | | | | 87,335 | |
Freddie Mac, Pool #G13331, 5.50%, 10/1/2023 | | | 34,919 | | | | 38,017 | |
Freddie Mac, Pool #C91754, 4.50%, 3/1/2034 | | | 1,179,582 | | | | 1,292,243 | |
Freddie Mac, Pool #C91762, 4.50%, 5/1/2034 | | | 1,601,430 | | | | 1,754,388 | |
Freddie Mac, Pool #C91788, 4.00%, 10/1/2034 | | | 1,488,696 | | | | 1,605,632 | |
Freddie Mac, Pool #C91850, 4.00%, 9/1/2035 | | | 2,307,011 | | | | 2,483,016 | |
Freddie Mac, Pool #C91854, 4.00%, 10/1/2035 | | | 1,717,097 | | | | 1,848,101 | |
Freddie Mac, Pool #G03332, 6.00%, 10/1/2037 | | | 103,600 | | | | 118,016 | |
Freddie Mac, Pool #G03696, 5.50%, 1/1/2038 | | | 205,004 | | | | 229,979 | |
Freddie Mac, Pool #G03781, 6.00%, 1/1/2038 | | | 402,496 | | | | 457,982 | |
Freddie Mac, Pool #G03926, 6.00%, 2/1/2038 | | | 489,886 | | | | 557,545 | |
Freddie Mac, Pool #G04264, 5.50%, 4/1/2038 | | | 880,137 | | | | 989,210 | |
Freddie Mac, Pool #G04731, 5.50%, 4/1/2038 | | | 481,687 | | | | 539,997 | |
Freddie Mac, Pool #G08273, 5.50%, 6/1/2038 | | | 581,001 | | | | 652,705 | |
Freddie Mac, Pool #G05956, 5.50%, 7/1/2038 | | | 673,398 | | | | 755,665 | |
Freddie Mac, Pool #G04587, 5.50%, 8/1/2038 | | | 1,566,833 | | | | 1,757,446 | |
Freddie Mac, Pool #G05671, 5.50%, 8/1/2038 | | | 361,270 | | | | 405,085 | |
Freddie Mac, Pool #G05409, 5.50%, 3/1/2039 | | | 667,862 | | | | 750,017 | |
Freddie Mac, Pool #A86522, 4.50%, 5/1/2039 | | | 1,492,784 | | | | 1,628,606 | |
Freddie Mac, Pool #G06021, 5.50%, 1/1/2040 | | | 271,248 | | | | 304,928 | |
Freddie Mac, Pool #G05923, 5.50%, 2/1/2040 | | | 255,160 | | | | 286,695 | |
Freddie Mac, Pool #G05900, 6.00%, 3/1/2040 | | | 408,198 | | | | 464,030 | |
Freddie Mac, Pool #G05906, 6.00%, 4/1/2040 | | | 262,359 | | | | 299,040 | |
Freddie Mac, Pool #A92889, 4.50%, 7/1/2040 | | | 3,442,495 | | | | 3,759,897 | |
Freddie Mac, Pool #G07589, 5.50%, 6/1/2041 | | | 783,737 | | | | 879,311 | |
Freddie Mac, Pool #Q17719, 3.50%, 4/1/2043 | | | 1,716,411 | | | | 1,799,610 | |
Freddie Mac, Pool #C09068, 3.50%, 11/1/2044 | | | 1,430,478 | | | | 1,499,689 | |
Freddie Mac, Pool #G60034, 4.50%, 2/1/2045 | | | 4,926,368 | | | | 5,369,113 | |
Freddie Mac, Pool #G08669, 4.00%, 9/1/2045 | | | 2,536,108 | | | | 2,707,958 | |
Freddie Mac, Pool #G08672, 4.00%, 10/1/2045 | | | 5,105,853 | | | | 5,458,287 | |
Freddie Mac, Pool #Q36985, 4.00%, 10/1/2045 | | | 1,537,103 | | | | 1,642,539 | |
Freddie Mac, Pool #Q37892, 4.00%, 12/1/2045 | | | 2,041,235 | | | | 2,183,703 | |
Freddie Mac Gold, Pool #Q37592, 4.00%, 12/1/2045 | | | 3,173,685 | | | | 3,399,137 | |
Freddie Mac Gold Pool, Pool #Q29245, 3.50%, 10/1/2044 | | | 2,790,168 | | | | 2,934,420 | |
Ginnie Mae, Pool #263096, 9.50%, 3/15/2020 | | | 862 | | | | 866 | |
| | | | | | | | |
| | |
Total Mortgage-Backed Securities | | | | | | | | |
(Identified Cost $131,177,671) | | | | | | | 133,689,252 | |
| | | | | | | | |
| | |
Other Agencies - 1.2% | | | | | | | | |
Fannie Mae, 1.75%, 9/12/2019 | | | | | | | | |
(Identified Cost $16,068,677) | | | 16,000,000 | | | | 16,345,280 | |
| | | | | | | | |
| | |
TOTAL U.S. GOVERNMENT AGENCIES | | | | | | | | |
(Identified Cost $147,246,348) | | | | | | | 150,034,532 | |
| | | | | | | | |
| | |
U.S. GOVERNMENT SECURITIES - 3.3% | | | | | | | | |
| | |
U.S. Treasury Bills - 3.3% | | | | | | | | |
U.S. Treasury Bill11, 0.28%, 6/23/2016 | | | | | | | | |
(Identified Cost $46,280,903) | | | 46,300,000 | | | | 46,290,231 | |
| | | | | | | | |
| | |
SHORT-TERM INVESTMENT - 3.4% | | | | | | | | |
| | |
Dreyfus Cash Management, Inc. - Institutional Shares12, 0.29%, | | | | | | | | |
(Identified Cost $46,481,246) | | | 46,481,246 | | | | 46,481,246 | |
| | | | | | | | |
The accompanying notes are an integral part of the financial statements.
41
Investment Portfolio - April 30, 2016
(unaudited)
| | | | | | | | |
| PRO-BLEND® MODERATE TERM SERIES | | CONTRACTS | | | VALUE (NOTE 2) | |
TOTAL INVESTMENTS - 91.1% | | | | | | | | |
(Identified Cost $1,228,196,523) | | | | | | $ | 1,260,554,597 | |
OTHER ASSETS, LESS LIABILITIES - 8.9% | | | | | | | 123,649,077 | |
| | | | | | | | |
NET ASSETS - 100% | | | | | | $ | 1,384,203,674 | |
| | | | | | | | |
| | |
PUT OPTIONS WRITTEN - 0.0%## | | | | | | | | |
| | |
Alphabet, Inc. - Class C, Strike $690, Expiring May 20, 2016, | | | 33 | | | $ | (39,699 | ) |
Apple, Inc., Strike $95, Expiring May 20, 2016, | | | 239 | | | | (79,109 | ) |
| | | | | | | | |
| | |
TOTAL PUT OPTIONS WRITTEN | | | | | | | | |
(Premiums Received $29,739) | | | | | | $ | (118,808 | ) |
| | | | | | | | |
ADR - American Depositary Receipt
AUD - Australian Dollar
CAD - Canadian Dollar
CLP - Chilean Peso
ETF - Exchange-traded fund
EUR - Euro
GBP - British Pound
IO - Interest only
JPY - Japanese Yen
KRW - South Korean Won
MXN - Mexican Peso
MYR - Malaysian Ringgit
No. - Number
NOK - Norwegian Krone
SGD - Singapore Dollar
##Less than 0.1%.
*Non-income producing security.
1A factor from a third party vendor was applied to determine the security’s fair value following the close of local trading.
2A portion of this security is designated with the broker as collateral for options contracts written. As of April 30, 2016, the total value of such securities was $16,111,252.
3Restricted securities - Investment in securities that are restricted as to public resale under the Securities Act of 1933, as amended. These securities have been sold under Rule 144A and have been determined to be liquid. These securities amount to $128,562,592 or 9.3%, of the Series’ net assets as of April 30, 2016 (see Note 2 to the financial statements).
4Amount is stated in USD unless otherwise noted.
5The coupon rate is floating and is the effective rate as of April 30, 2016.
6Security is perpetual in nature and has no stated maturity date.
7The rate shown is a fixed rate as of April 30, 2016; the rate becomes floating, based on U.S. Treasury Note (5 Year) plus a spread, in July 2016.
8The rate shown is a fixed rate as of April 30, 2016; the rate becomes floating, based on LIBOR plus a spread, in December 2024.
9The rate shown is a fixed rate as of April 30, 2016; the rate becomes floating, based on LIBOR plus a spread, in September 2022.
10Represents a Payment-In-Kind bond.
11Represents the annualized yield at time of purchase.
12Rate shown is the current yield as of April 30, 2016.
The Global Industry Classification Standard (GICS) was developed by and is the exclusive property and a service mark of MSCI Inc. (MSCI) and Standard &Poor, a division of The McGraw-Hill Companies, Inc. (S&P), and is licensed for use by Manning & Napier when referencing GICS sectors. Neither MSCI, S&P, nor any third party involved in making or compiling the GICS or any GICS classifications makes any express or implied warranties or representations with respect to such standard or classification, nor shall any such party have any liability therefrom.
The accompanying notes are an integral part of the financial statements.
42
Statement of Assets and Liabilities - Pro-Blend® Moderate Term Series
April 30, 2016 (unaudited)
| | | | |
ASSETS: | | | | |
| |
Investments, at value (identified cost $1,228,196,523) (Note 2) | | $ | 1,260,554,597 | |
Cash | | | 32,787 | |
Receivable for securities sold | | | 126,175,686 | |
Interest receivable | | | 4,114,651 | |
Dividends receivable | | | 451,195 | |
Foreign tax reclaims receivable | | | 416,176 | |
Receivable for fund shares sold | | | 287,154 | |
Prepaid expenses | | | 63,362 | |
| | | | |
| |
TOTAL ASSETS | | | 1,392,095,608 | |
| | | | |
| |
LIABILITIES: | | | | |
| |
Accrued management fees (Note 3) | | | 853,393 | |
Accrued distribution and service (Rule 12b-1) fees (Class C) (Class R) (Note 3) | | | 127,085 | |
Accrued shareholder services fees (Class S) (Note 3) | | | 116,642 | |
Accrued fund accounting and administration fees (Note 3) | | | 83,854 | |
Accrued transfer agent fees (Note 3) | | | 64,160 | |
Accrued Chief Compliance Officer service fees (Note 3) | | | 381 | |
Options written, at value (premiums received $29,739) (Note 2) | | | 118,808 | |
Accrued foreign capital gains tax (Note 2) | | | 644 | |
Payable for fund shares repurchased | | | 5,637,910 | |
Payable for securities purchased | | | 719,631 | |
Other payables and accrued expenses | | | 169,426 | |
| | | | |
| |
TOTAL LIABILITIES | | | 7,891,934 | |
| | | | |
| |
TOTAL NET ASSETS | | $ | 1,384,203,674 | |
| | | | |
| |
NET ASSETS CONSIST OF: | | | | |
| |
Capital stock | | $ | 1,247,069 | |
Additional paid-in-capital | | | 1,349,843,885 | |
Undistributed net investment income | | | 5,103,022 | |
Accumulated net realized loss on investments, foreign currency and translation of other assets and liabilities | | | (4,236,023 | ) |
Net unrealized appreciation (depreciation) on investments (net of foreign capital gains tax of $644), foreign currency and translation of other assets and liabilities | | | 32,245,721 | |
| | | | |
| |
TOTAL NET ASSETS | | $ | 1,384,203,674 | |
| | | | |
The accompanying notes are an integral part of the financial statements.
43
Statement of Assets and Liabilities - Pro-Blend® Moderate Term Series
April 30, 2016 (unaudited)
| | | | |
NET ASSET VALUE, OFFERING PRICE AND REDEMPTION PRICE PER SHARE - Class S
($566,802,489/ 43,266,781 shares) | | $ | 13.10 | |
| | | | |
| |
NET ASSET VALUE, OFFERING PRICE AND REDEMPTION PRICE PER SHARE - Class I
($647,069,762/ 64,700,629 shares) | | $ | 10.00 | |
| | | | |
| |
NET ASSET VALUE, OFFERING PRICE AND REDEMPTION PRICE PER SHARE - Class C
($135,726,193/ 13,435,731 shares) | | $ | 10.10 | |
| | | | |
| |
NET ASSET VALUE, OFFERING PRICE AND REDEMPTION PRICE PER SHARE - Class R
($34,605,230/ 3,303,783 shares) | | $ | 10.47 | |
| | | | |
The accompanying notes are an integral part of the financial statements.
44
Statement of Operations - Pro-Blend® Moderate Term Series
For the Six Months Ended April 30, 2016 (unaudited)
| | | | |
INVESTMENT INCOME: | | | | |
| |
Interest | | $ | 11,010,441 | |
Dividends (net of foreign taxes withheld, $145,885) | | | 3,825,067 | |
| | | | |
| |
Total Investment Income | | | 14,835,508 | |
| | | | |
| |
EXPENSES: | | | | |
| |
Management fees (Note 3) | | | 5,386,653 | |
Shareholder services fees (Class S) (Note 3) | | | 745,588 | |
Distribution and service (Rule 12b-1) fees (Class C) (Note 3) | | | 687,513 | |
Fund accounting and administration fees (Note 3) | | | 134,576 | |
Transfer agent fees (Note 3) | | | 96,249 | |
Distribution and service (Rule 12b-1) fees (Class R) (Note 3) | | | 94,336 | |
Directors’ fees (Note 3) | | | 27,790 | |
Chief Compliance Officer service fees (Note 3) | | | 1,258 | |
Custodian fees | | | 62,326 | |
Miscellaneous | | | 163,697 | |
| | | | |
| |
Total Expenses | | | 7,399,986 | |
| | | | |
| |
NET INVESTMENT INCOME | | | 7,435,522 | |
| | | | |
| |
REALIZED AND UNREALIZED GAIN (LOSS) ON INVESTMENTS AND FOREIGN CURRENCY: | | | | |
| |
Net realized gain (loss) on- | | | | |
Investments | | | 6,801,255 | |
Futures contracts | | | (9,912,871 | ) |
Options written | | | 115,613 | |
Foreign currency and translation of other assets and liabilities | | | (1,527,990 | ) |
| | | | |
| |
| | | (4,523,993 | ) |
| | | | |
| |
Net change in unrealized appreciation (depreciation) on- | | | | |
Investments (net of decrease in accrued foreign capital gains tax of $138) | | | (3,470,187 | ) |
Futures contracts | | | 1,250,569 | |
Options written | | | (89,069 | ) |
Foreign currency and translation of other assets and liabilities | | | 19,678 | |
| | | | |
| |
| | | (2,289,009 | ) |
| | | | |
| |
NET REALIZED AND UNREALIZED GAIN (LOSS) ON INVESTMENTS AND FOREIGN CURRENCY | | | (6,813,002 | ) |
| | | | |
| |
NET INCREASE IN NET ASSETS RESULTING FROM OPERATIONS | | $ | 622,520 | |
| | | | |
The accompanying notes are an integral part of the financial statements.
45
Statements of Changes in Net Assets - Pro-Blend® Moderate Term Series
| | | | | | | | |
| | | FOR THE SIX
MONTHS ENDED
4/30/16
(UNAUDITED) | | | FOR THE YEAR
ENDED 10/31/15 | |
INCREASE (DECREASE) IN NET ASSETS: | | | | | | | | |
| | |
OPERATIONS: | | | | | | | | |
| | |
Net investment income | | $ | 7,435,522 | | | $ | 18,743,885 | |
Net realized gain (loss) on investments and foreign currency | | | (4,523,993 | ) | | | 5,837,309 | |
Net change in unrealized appreciation (depreciation) on investments and foreign currency | | | (2,289,009 | ) | | | (57,677,527 | ) |
| | | | | | | | |
| | |
Net increase (decrease) from operations | | | 622,520 | | | | (33,096,333 | ) |
| | | | | | | | |
| | |
DISTRIBUTIONS TO SHAREHOLDERS (Note 8): | | | | | | | | |
| | |
From net investment income (Class S) | | | (3,379,165 | ) | | | (6,361,974 | ) |
From net investment income (Class I) | | | (6,589,035 | ) | | | (10,068,499 | ) |
From net investment income (Class C) | | | (391,466 | ) | | | (598,118 | ) |
From net investment income (Class R) | | | (202,115 | ) | | | (414,173 | ) |
From net realized gain on investments (Class S) | | | (1,694,581 | ) | | | (53,056,681 | ) |
From net realized gain on investments (Class I) | | | (2,549,866 | ) | | | (62,123,946 | ) |
From net realized gain on investments (Class C) | | | (484,327 | ) | | | (12,982,360 | ) |
From net realized gain on investments (Class R) | | | (125,951 | ) | | | (4,081,502 | ) |
| | | | | | | | |
| | |
Total distributions to shareholders | | | (15,416,506 | ) | | | (149,687,253 | ) |
| | | | | | | | |
| | |
CAPITAL STOCK ISSUED AND REPURCHASED: | | | | | | | | |
| | |
Net increase (decrease) from capital share transactions (Note 5) | | | (212,674,371 | ) | | | 88,498,622 | |
| | | | | | | | |
| | |
Net decrease in net assets | | | (227,468,357 | ) | | | (94,284,964 | ) |
| | |
NET ASSETS: | | | | | | | | |
| | |
Beginning of period | | | 1,611,672,031 | | | | 1,705,956,995 | |
| | | | | | | | |
| | |
End of period (including undistributed net investment income of $5,103,022 and $8,229,281, respectively) | | $ | 1,384,203,674 | | | $ | 1,611,672,031 | |
| | | | | | | | |
The accompanying notes are an integral part of the financial statements.
46
Financial Highlights - Pro-Blend® Moderate Term Series - Class S
| | | | | | | | | | | | | | | | | | | | | | | | |
| | | FOR THE SIX
MONTHS ENDED
4/30/16 | | | FOR THE YEARS ENDED | |
| | (UNAUDITED) | | | 10/31/15 | | | 10/31/14 | | | 10/31/13 | | | 10/31/12 | | | 10/31/11 | |
Per share data (for a share outstanding throughout each period): | | | | | | | | | | | | | | | | | | | | | | | | |
Net asset value - Beginning of period | | $ | 13.15 | | | $ | 14.53 | | | $ | 14.52 | | | $ | 13.28 | | | $ | 12.92 | | | $ | 12.94 | |
| | | | | | | | | | | | | | | | | | | | | | | | |
Income (loss) from investment operations: | | | | | | | | | | | | | | | | | | | | | | | | |
Net investment income1 | | | 0.06 | | | | 0.15 | | | | 0.16 | | | | 0.14 | | | | 0.17 | | | | 0.22 | |
Net realized and unrealized gain (loss) on investments | | | (0.01 | ) | | | (0.44 | ) | | | 0.59 | | | | 1.55 | | | | 0.77 | | | | 0.14 | |
| | | | | | | | | | | | | | | | | | | | | | | | |
| | | | | | |
Total from investment operations | | | 0.05 | | | | (0.29 | ) | | | 0.75 | | | | 1.69 | | | | 0.94 | | | | 0.36 | |
| | | | | | | | | | | | | | | | | | | | | | | | |
| | | | | | |
Less distributions to shareholders: | | | | | | | | | | | | | | | | | | | | | | | | |
From net investment income | | | (0.07 | ) | | | (0.12 | ) | | | (0.12 | ) | | | (0.13 | ) | | | (0.20 | ) | | | (0.19 | ) |
From net realized gain on investments | | | (0.03 | ) | | | (0.97 | ) | | | (0.62 | ) | | | (0.32 | ) | | | (0.38 | ) | | | (0.19 | ) |
| | | | | | | | | | | | | | | | | | | | | | | | |
| | | | | | |
Total distributions to shareholders | | | (0.10 | ) | | | (1.09 | ) | | | (0.74 | ) | | | (0.45 | ) | | | (0.58 | ) | | | (0.38 | ) |
| | | | | | | | | | | | | | | | | | | | | | | | |
| | | | | | |
Net asset value - End of period | | $ | 13.10 | | | $ | 13.15 | | | $ | 14.53 | | | $ | 14.52 | | | $ | 13.28 | | | $ | 12.92 | |
| | | | | | | | | | | | | | | | | | | | | | | | |
| | | | | | |
Net assets - End of period (000’s omitted) | | $ | 566,802 | | | $ | 683,089 | | | $ | 788,276 | | | $ | 793,812 | | | $ | 707,222 | | | $ | 682,409 | |
| | | | | | | | | | | | | | | | | | | | | | | | |
| | | | | | |
Total return2 | | | 0.41 | % | | | (1.99 | %) | | | 5.47 | % | | | 13.07 | % | | | 7.73 | % | | | 2.78 | % |
Ratios (to average net assets)/Supplemental Data: | | | | | | | | | | | | | | | | | | | | | | | | |
Expenses | | | 1.07 | %3 | | | 1.06 | % | | | 1.06 | % | | | 1.06 | % | | | 1.07 | % | | | 1.07 | % |
Net investment income | | | 1.00 | %3 | | | 1.08 | % | | | 1.12 | % | | | 1.04 | % | | | 1.34 | % | | | 1.68 | % |
Series portfolio turnover | | | 27 | % | | | 56 | % | | | 53 | % | | | 52 | % | | | 47 | % | | | 52 | % |
1Calculated based on average shares outstanding during the periods.
2Represents aggregate total return for the periods indicated, and assumes reinvestment of all distributions. Periods less than one year are not annualized.
3Annualized.
The accompanying notes are an integral part of the financial statements.
47
Financial Highlights - Pro-Blend® Moderate Term Series - Class I
| | | | | | | | | | | | | | | | | | | | | | | | |
| | | FOR THE SIX
MONTHS ENDED
4/30/16 | | | FOR THE YEARS ENDED | |
| | (UNAUDITED) | | | 10/31/15 | | | 10/31/14 | | | 10/31/13 | | | 10/31/12 | | | 10/31/11 | |
Per share data (for a share outstanding throughout each period): | | | | | | | | | | | | | | | | | | | | | | | | |
Net asset value - Beginning of period | | $ | 10.07 | | | $ | 11.40 | | | $ | 11.56 | | | $ | 10.67 | | | $ | 10.50 | | | $ | 10.60 | |
| | | | | | | | | | | | | | | | | | | | | | | | |
Income (loss) from investment operations: | | | | | | | | | | | | | | | | | | | | | | | | |
Net investment income1 | | | 0.06 | | | | 0.14 | | | | 0.16 | | | | 0.14 | | | | 0.16 | | | | 0.20 | |
Net realized and unrealized gain (loss) on investments | | | (0.01 | ) | | | (0.35 | ) | | | 0.46 | | | | 1.23 | | | | 0.62 | | | | 0.11 | |
| | | | | | | | | | | | | | | | | | | | | | | | |
| | | | | | |
Total from investment operations | | | 0.05 | | | | (0.21 | ) | | | 0.62 | | | | 1.37 | | | | 0.78 | | | | 0.31 | |
| | | | | | | | | | | | | | | | | | | | | | | | |
| | | | | | |
Less distributions to shareholders: | | | | | | | | | | | | | | | | | | | | | | | | |
From net investment income | | | (0.09 | ) | | | (0.15 | ) | | | (0.16 | ) | | | (0.16 | ) | | | (0.23 | ) | | | (0.22 | ) |
From net realized gain on investments | | | (0.03 | ) | | | (0.97 | ) | | | (0.62 | ) | | | (0.32 | ) | | | (0.38 | ) | | | (0.19 | ) |
| | | | | | | | | | | | | | | | | | | | | | | | |
| | | | | | |
Total distributions to shareholders | | | (0.12 | ) | | | (1.12 | ) | | | (0.78 | ) | | | (0.48 | ) | | | (0.61 | ) | | | (0.41 | ) |
| | | | | | | | | | | | | | | | | | | | | | | | |
| | | | | | |
Net asset value - End of period | | $ | 10.00 | | | $ | 10.07 | | | $ | 11.40 | | | $ | 11.56 | | | $ | 10.67 | | | $ | 10.50 | |
| | | | | | | | | | | | | | | | | | | | | | | | |
| | | | | | |
Net assets - End of period (000’s omitted) | | $ | 647,070 | | | $ | 740,524 | | | $ | 719,847 | | | $ | 614,016 | | | $ | 496,286 | | | $ | 352,611 | |
| | | | | | | | | | | | | | | | | | | | | | | | |
| | | | | | |
Total return2 | | | 0.55 | % | | | (1.76 | %) | | | 5.73 | % | | | 13.34 | % | | | 8.06 | % | | | 2.93 | % |
Ratios (to average net assets)/Supplemental Data: | | | | | | | | | | | | | | | | | | | | | | | | |
Expenses | | | 0.82 | %3 | | | 0.81 | % | | | 0.81 | % | | | 0.81 | % | | | 0.82 | % | | | 0.82 | % |
Net investment income | | | 1.25 | %3 | | | 1.33 | % | | | 1.37 | % | | | 1.28 | % | | | 1.57 | % | | | 1.93 | % |
Series portfolio turnover | | | 27 | % | | | 56 | % | | | 53 | % | | | 52 | % | | | 47 | % | | | 52 | % |
1Calculated based on average shares outstanding during the periods.
2Represents aggregate total return for the periods indicated, and assumes reinvestment of all distributions. Periods less than one year are not annualized.
3Annualized.
The accompanying notes are an integral part of the financial statements.
48
Financial Highlights - Pro-Blend® Moderate Term Series - Class C
| | | | | | | | | | | | | | | | | | | | | | | | |
| | | FOR THE SIX
MONTHS ENDED
4/30/16 | | | FOR THE YEARS ENDED | |
| | (UNAUDITED) | | | 10/31/15 | | | 10/31/14 | | | 10/31/13 | | | 10/31/12 | | | 10/31/11 | |
Per share data (for a share outstanding throughout each period): | | | | | | | | | | | | | | | | | | | | | | | | |
Net asset value - Beginning of period | | $ | 10.16 | | | $ | 11.49 | | | $ | 11.65 | | | $ | 10.75 | | | $ | 10.58 | | | $ | 10.69 | |
| | | | | | | | | | | | | | | | | | | | | | | | |
Income (loss) from investment operations: | | | | | | | | | | | | | | | | | | | | | | | | |
Net investment income1 | | | 0.01 | | | | 0.03 | | | | 0.04 | | | | 0.03 | | | | 0.06 | | | | 0.10 | |
Net realized and unrealized gain (loss) on investments | | | (0.01 | ) | | | (0.35 | ) | | | 0.47 | | | | 1.25 | | | | 0.62 | | | | 0.11 | |
| | | | | | | | | | | | | | | | | | | | | | | | |
| | | | | | |
Total from investment operations | | | — | | | | (0.32 | ) | | | 0.51 | | | | 1.28 | | | | 0.68 | | | | 0.21 | |
| | | | | | | | | | | | | | | | | | | | | | | | |
| | | | | | |
Less distributions to shareholders: | | | | | | | | | | | | | | | | | | | | | | | | |
From net investment income | | | (0.03 | ) | | | (0.04 | ) | | | (0.05 | ) | | | (0.06 | ) | | | (0.13 | ) | | | (0.13 | ) |
From net realized gain on investments | | | (0.03 | ) | | | (0.97 | ) | | | (0.62 | ) | | | (0.32 | ) | | | (0.38 | ) | | | (0.19 | ) |
| | | | | | | | | | | | | | | | | | | | | | | | |
| | | | | | |
Total distributions to shareholders | | | (0.06 | ) | | | (1.01 | ) | | | (0.67 | ) | | | (0.38 | ) | | | (0.51 | ) | | | (0.32 | ) |
| | | | | | | | | | | | | | | | | | | | | | | | |
| | | | | | |
Net asset value - End of period | | $ | 10.10 | | | $ | 10.16 | | | $ | 11.49 | | | $ | 11.65 | | | $ | 10.75 | | | $ | 10.58 | |
| | | | | | | | | | | | | | | | | | | | | | | | |
| | | | | | |
Net assets - End of period (000’s omitted) | | $ | 135,726 | | | $ | 148,143 | | | $ | 150,654 | | | $ | 112,601 | | | $ | 81,457 | | | $ | 58,316 | |
| | | | | | | | | | | | | | | | | | | | | | | | |
| | | | | | |
Total return2 | | | 0.03 | % | | | (2.77 | %) | | | 4.69 | % | | | 12.27 | % | | | 6.94 | % | | | 1.97 | % |
Ratios (to average net assets)/Supplemental Data: | | | | | | | | | | | | | | | | | | | | | | | | |
Expenses | | | 1.82 | %3 | | | 1.81 | % | | | 1.81 | % | | | 1.81 | % | | | 1.82 | % | | | 1.82 | % |
Net investment income | | | 0.26 | %3 | | | 0.33 | % | | | 0.37 | % | | | 0.29 | % | | | 0.57 | % | | | 0.92 | % |
Series portfolio turnover | | | 27 | % | | | 56 | % | | | 53 | % | | | 52 | % | | | 47 | % | | | 52 | % |
1Calculated based on average shares outstanding during the periods.
2Represents aggregate total return for the periods indicated, and assumes reinvestment of all distributions. Periods less than one year are not annualized.
3Annualized.
The accompanying notes are an integral part of the financial statements.
49
Financial Highlights - Pro-Blend® Moderate Term Series - Class R
| | | | | | | | | | | | | | | | | | | | | | | | |
| | | FOR THE SIX
MONTHS ENDED
4/30/16 | | | FOR THE YEARS ENDED | |
| | (UNAUDITED) | | | 10/31/15 | | | 10/31/14 | | | 10/31/13 | | | 10/31/12 | | | 10/31/11 | |
Per share data (for a share outstanding throughout each period): | | | | | | | | | | | | | | | | | | | | | | | | |
Net asset value - Beginning of period | | $ | 10.53 | | | $ | 11.87 | | | $ | 12.00 | | | $ | 11.06 | | | $ | 10.88 | | | $ | 10.99 | |
| | | | | | | | | | | | | | | | | | | | | | | | |
Income (loss) from investment operations: | | | | | | | | | | | | | | | | | | | | | | | | |
Net investment income1 | | | 0.04 | | | | 0.09 | | | | 0.10 | | | | 0.09 | | | | 0.11 | | | | 0.11 | |
Net realized and unrealized gain (loss) on investments | | | (0.02 | ) | | | (0.36 | ) | | | 0.49 | | | | 1.28 | | | | 0.65 | | | | 0.16 | |
| | | | | | | | | | | | | | | | | | | | | | | | |
| | | | | | |
Total from investment operations | | | 0.02 | | | | (0.27 | ) | | | 0.59 | | | | 1.37 | | | | 0.76 | | | | 0.27 | |
| | | | | | | | | | | | | | | | | | | | | | | | |
| | | | | | |
Less distributions to shareholders: | | | | | | | | | | | | | | | | | | | | | | | | |
From net investment income | | | (0.05 | ) | | | (0.10 | ) | | | (0.10 | ) | | | (0.11 | ) | | | (0.20 | ) | | | (0.19 | ) |
From net realized gain on investments | | | (0.03 | ) | | | (0.97 | ) | | | (0.62 | ) | | | (0.32 | ) | | | (0.38 | ) | | | (0.19 | ) |
| | | | | | | | | | | | | | | | | | | | | | | | |
| | | | | | |
Total distributions to shareholders | | | (0.08 | ) | | | (1.07 | ) | | | (0.72 | ) | | | (0.43 | ) | | | (0.58 | ) | | | (0.38 | ) |
| | | | | | | | | | | | | | | | | | | | | | | | |
| | | | | | |
Net asset value - End of period | | $ | 10.47 | | | $ | 10.53 | | | $ | 11.87 | | | $ | 12.00 | | | $ | 11.06 | | | $ | 10.88 | |
| | | | | | | | | | | | | | | | | | | | | | | | |
| | | | | | |
Net assets - End of period (000’s omitted) | | $ | 34,605 | | | $ | 39,917 | | | $ | 47,180 | | | $ | 50,280 | | | $ | 39,999 | | | $ | 18,554 | |
| | | | | | | | | | | | | | | | | | | | | | | | |
| | | | | | |
Total return2 | | | 0.29 | % | | | (2.30 | %) | | | 5.24 | % | | | 12.77 | % | | | 7.48 | % | | | 2.50 | % |
Ratios (to average net assets)/Supplemental Data: | | | | | | | | | | | | | | | | | | | | | | | | |
Expenses | | | 1.32 | %3 | | | 1.31 | % | | | 1.31 | % | | | 1.31 | % | | | 1.33 | % | | | 1.32 | % |
Net investment income | | | 0.75 | %3 | | | 0.83 | % | | | 0.87 | % | | | 0.80 | % | | | 1.04 | % | | | 1.05 | % |
Series portfolio turnover | | | 27 | % | | | 56 | % | | | 53 | % | | | 52 | % | | | 47 | % | | | 52 | % |
1Calculated based on average shares outstanding during the periods.
2Represents aggregate total return for the periods indicated, and assumes reinvestment of all distributions. Periods less than one year are not annualized.
3Annualized.
The accompanying notes are an integral part of the financial statements.
50
Shareholder Expense Example - Pro-Blend® Extended Term Series
(unaudited)
As a shareholder of the Series, you incur ongoing costs, including management fees, shareholder service fees and other Series expenses. This example is intended to help you understand your ongoing costs (in dollars) of investing in the Series and to compare these costs with the ongoing costs of investing in other mutual funds.
The example is based on an investment of $1,000 invested in each class at the beginning of the period and held for the entire period (November 1, 2015 to April 30, 2016).
Actual Expenses
The Actual lines of the table below provide information about actual account values and actual expenses. You may use the information in these lines, together with the amount you invested, to estimate the expenses that you paid over the period. Simply divide your account value by $1,000 (for example, an $8,600 account value divided by $1,000 = 8.6), then multiply the result by the number in the Actual line for the Class in which you have invested under the heading entitled “Expenses Paid During Period” to estimate the expenses you paid on your account during this period.
Hypothetical Example for Comparison Purposes
The Hypothetical lines of each class in the table below provide information about hypothetical account values and hypothetical expenses based on the Class’ actual expense ratio and an assumed rate of return of 5% per year before expenses, which is not the Class’ actual return. The hypothetical account values and expenses may not be used to estimate the actual ending account balance or expenses you paid during the period. You may use this information to compare the ongoing costs of investing in a class of the Series and other funds. To do so, compare this 5% hypothetical example for the Class in which you have invested with the 5% hypothetical examples that appear in the shareholder reports of the other funds.
Please note that the expenses shown in the table are meant to highlight your ongoing costs only and do not reflect any transaction costs such as sales charges (loads), redemption fees, or exchange fees that you may incur in other mutual funds. Therefore, the second line of the table is useful in comparing ongoing costs only, and will not help you determine the relative total costs of owning different funds.
| | | | | | | | |
| | | BEGINNING
ACCOUNT VALUE
11/1/15 | | ENDING
ACCOUNT VALUE
4/30/16 | | EXPENSES PAID
DURING PERIOD
11/1/15-4/30/16* | | ANNUALIZED
EXPENSE RATIO |
Class S | | | | | | | | |
Actual | | $1,000.00 | | $1,003.10 | | $5.38 | | 1.08% |
Hypothetical (5% return before expenses) | | $1,000.00 | | $1,019.49 | | $5.42 | | 1.08% |
Class I | | | | | | | | |
Actual | | $1,000.00 | | $1,004.80 | | $4.14 | | 0.83% |
Hypothetical (5% return before expenses) | | $1,000.00 | | $1,020.74 | | $4.17 | | 0.83% |
Class C | | | | | | | | |
Actual | | $1,000.00 | | $999.50 | | $9.10 | | 1.83% |
Hypothetical (5% return before expenses) | | $1,000.00 | | $1,015.76 | | $9.17 | | 1.83% |
Class R | | | | | | | | |
Actual | | $1,000.00 | | $1,000.60 | | $6.62 | | 1.33% |
Hypothetical (5% return before expenses) | | $1,000.00 | | $1,018.25 | | $6.67 | | 1.33% |
*Expenses are equal to the Class’ annualized expense ratio (for the six-month period), multiplied by the average account value over the period, multiplied by 182/366 to reflect the one-half year period.
51
Portfolio Composition - Pro-Blend® Extended Term Series
As of April 30, 2016 (unaudited)
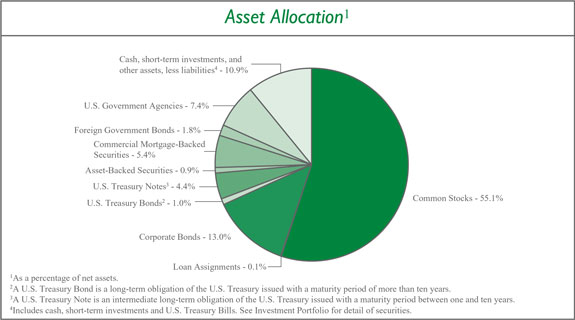
| | | | |
Sector Allocation5 | |
Information Technology | | | 17.4 | % |
Consumer Discretionary | | | 15.3 | % |
Financials | | | 9.8 | % |
Health Care | | | 7.0 | % |
Consumer Staples | | | 6.7 | % |
Materials | | | 5.2 | % |
Energy | | | 5.1 | % |
Industrials | | | 3.4 | % |
Telecommunication Services | | | 1.1 | % |
Utilities | | | 0.4 | % |
| |
| 5Including common stocks and corporate bonds, as a percentage of total investments. | |
| | | | |
| Top Ten Stock Holdings6 | |
QUALCOMM, Inc. | | | 2.0 | % |
Time Warner, Inc. | | | 2.0 | % |
MasterCard, Inc. - Class A | | | 1.9 | % |
Monsanto Co. | | | 1.8 | % |
Range Resources Corp. | | | 1.8 | % |
Medtronic plc | | | 1.6 | % |
ServiceNow, Inc. | | | 1.6 | % |
AMC Networks, Inc. - Class A | | | 1.6 | % |
Cerner Corp. | | | 1.5 | % |
Johnson & Johnson | | | 1.5 | % |
| |
| 6 As a percentage of total investments. | |
52
Investment Portfolio - April 30, 2016
(unaudited)
| | | | | | | | | | |
| PRO-BLEND® EXTENDED TERM SERIES | | SHARES | | | VALUE (NOTE 2) | | | |
| | | |
COMMON STOCKS - 55.1% | | | | | | | | | | |
| | | |
Consumer Discretionary - 13.4% | | | | | | | | | | |
Diversified Consumer Services - 0.2% | | | | | | | | | | |
Fu Shou Yuan International Group Ltd. (China)1 | | | 1,665,000 | | | $ | 1,168,150 | | | |
Houghton Mifflin Harcourt Co.* | | | 40,820 | | | | 837,218 | | | |
Kroton Educacional S.A. (Brazil) | | | 307,314 | | | | 1,145,530 | | | |
| | | | | | | | | | |
| | | |
| | | | | | | 3,150,898 | | | |
| | | | | | | | | | |
Hotels, Restaurants & Leisure - 1.1% | | | | | | | | | | |
Accor S.A. (France)1 | | | 21,680 | | | | 960,065 | | | |
Dunkin’ Brands Group, Inc. | | | 16,920 | | | | 786,780 | | | |
Yum! Brands, Inc. | | | 158,560 | | | | 12,615,034 | | | |
| | | | | | | | | | |
| | | |
| | | | | | | 14,361,879 | | | |
| | | | | | | | | | |
Internet & Catalog Retail - 2.4% | | | | | | | | | | |
ASOS plc (United Kingdom)*1 | | | 15,030 | | | | 792,929 | | | |
The Priceline Group, Inc.* | | | 13,540 | | | | 18,193,156 | | | |
Rakuten, Inc. (Japan)1 | | | 147,780 | | | | 1,606,570 | | | |
TripAdvisor, Inc.* | | | 147,440 | | | | 9,523,150 | | | |
Zalando SE (Germany)*1,2 | | | 25,560 | | | | 848,468 | | | |
| | | | | | | | | | |
| | | |
| | | | | | | 30,964,273 | | | |
| | | | | | | | | | |
Media - 7.9% | | | | | | | | | | |
AMC Networks, Inc. - Class A* | | | 295,980 | | | | 19,306,775 | | | |
Global Mediacom Tbk PT (Indonesia)1 | | | 3,486,270 | | | | 305,530 | | | |
ITV plc (United Kingdom)1 | | | 168,300 | | | | 554,762 | | | |
Liberty Global plc - Class A - ADR (United Kingdom)* | | | 270,761 | | | | 10,215,813 | | | |
Modern Times Group MTG AB - Class B (Sweden)1 | | | 6,013 | | | | 180,531 | | | |
Sinclair Broadcast Group, Inc. - Class A | | | 369,630 | | | | 11,854,034 | | | |
Surya Citra Media Tbk PT (Indonesia)1 | | | 2,233,150 | | | | 539,534 | | | |
TEGNA, Inc. | | | 179,180 | | | | 4,185,645 | | | |
Time Warner, Inc. | | | 335,780 | | | | 25,230,509 | | | |
Tribune Media Co. - Class A | | | 346,380 | | | | 13,352,949 | | | |
Twenty-First Century Fox, Inc. - Class A | | | 549,040 | | | | 16,613,950 | | | |
| | | | | | | | | | |
| | | |
| | | | | | | 102,340,032 | | | |
| | | | | | | | | | |
Specialty Retail - 0.3% | | | | | | | | | | |
Advance Auto Parts, Inc. | | | 15,600 | | | | 2,435,160 | | | |
Kingfisher plc (United Kingdom)1 | | | 100,520 | | | | 535,545 | | | |
Monro Muffler Brake, Inc. | | | 11,390 | | | | 788,416 | | | |
| | | | | | | | | | |
| | | |
| | | | | | | 3,759,121 | | | |
| | | | | | | | | | |
Textiles, Apparel & Luxury Goods - 1.5% | | | | | | | | | | |
Carter’s, Inc. | | | 7,900 | | | | 842,693 | | | |
Gildan Activewear, Inc. (Canada) | | | 27,640 | | | | 858,498 | | | |
Kering (France)1 | | | 5,390 | | | | 924,379 | | | |
lululemon athletica, Inc.* | | | 263,409 | | | | 17,266,460 | | | |
| | | | | | | | | | |
| | | |
| | | | | | | 19,892,030 | | | |
| | | | | | | | | | |
| | | |
Total Consumer Discretionary | | | | | | | 174,468,233 | | | |
| | | | | | | | | | |
Consumer Staples - 5.5% | | | | | | | | | | |
Beverages - 3.4% | | | | | | | | | | |
Ambev S.A. - ADR (Brazil) | | | 2,894,795 | | | | 16,181,904 | | | |
Anheuser-Busch InBev S.A./N.V. (Belgium)1 | | | 96,224 | | | | 11,937,022 | | | |
Cia Cervecerias Unidas S.A. - ADR (Chile) | | | 26,690 | | | | 598,390 | | | |
Diageo plc (United Kingdom)1 | | | 489,980 | | | | 13,247,192 | | | |
Fomento Economico Mexicano S.A.B. de C.V. - ADR (Mexico) | | | 2,750 | | | | 256,328 | | | |
SABMiller plc (United Kingdom)1 | | | 6,390 | | | | 391,363 | | | |
Treasury Wine Estates Ltd. (Australia)1 | | | 184,779 | | | | 1,301,077 | | | |
| | | | | | | | | | |
| | | |
| | | | | | | 43,913,276 | | | |
| | | | | | | | | | |
Food & Staples Retailing - 0.2% | | | | | | | | | | |
Dairy Farm International Holdings Ltd. (Hong Kong)1 | | | 158,120 | | | | 1,090,313 | | | |
Sprouts Farmers Market, Inc.* | | | 29,950 | | | | 840,696 | | | |
Tesco plc (United Kingdom)*1 | | | 113,362 | | | | 284,998 | | | |
| | | | | | | | | | |
| | | |
| | | | | | | 2,216,007 | | | |
| | | | | | | | | | |
Food Products - 0.6% | | | | | | | | | | |
Adecoagro S.A. (Luxembourg)* | | | 92,620 | | | | 987,329 | | | |
Danone S.A. (France)1 | | | 16,260 | | | | 1,139,236 | | | |
Grupo Bimbo S.A.B. de C.V. - Class A (Mexico) | | | 292,750 | | | | 891,455 | | | |
Nestle S.A. (Switzerland)1 | | | 19,666 | | | | 1,467,864 | | | |
Sao Martinho S.A. (Brazil) | | | 64,190 | | | | 834,839 | | | |
Suedzucker AG (Germany)1 | | | 77,246 | | | | 1,364,020 | | | |
Tiger Brands Ltd. (South Africa)1 | | | 15,590 | | | | 385,979 | | | |
Universal Robina Corp. (Philippines)1 | | | 123,850 | | | | 549,971 | | | |
The WhiteWave Foods Co.* | | | 20,350 | | | | 818,274 | | | |
| | | | | | | | | | |
| | | |
| | | | | | | 8,438,967 | | | |
| | | | | | | | | | |
Household Products - 0.0%## | | | | | | | | | | |
Pigeon Corp. (Japan)1 | | | 25,600 | | | | 672,401 | | | |
| | | | | | | | | | |
Personal Products - 1.1% | | | | | | | | | | |
Beiersdorf AG (Germany)1 | | | 2,600 | | | | 233,469 | | | |
Unilever plc - ADR (United Kingdom) | | | 309,169 | | | | 13,869,321 | | | |
| | | | | | | | | | |
| | | |
| | | | | | | 14,102,790 | | | |
| | | | | | | | | | |
The accompanying notes are an integral part of the financial statements.
53
Investment Portfolio - April 30, 2016
(unaudited)
| | | | | | | | | | |
| PRO-BLEND® EXTENDED TERM SERIES | | SHARES | | | VALUE (NOTE 2) | | | |
| | | |
COMMON STOCKS (continued) | | | | | | | | | | |
| | | |
Consumer Staples (continued) | | | | | | | | | | |
Tobacco - 0.2% | | | | | | | | | | |
Gudang Garam Tbk PT (Indonesia)1 | | | 220,720 | | | $ | 1,156,681 | | | |
Japan Tobacco, Inc. (Japan)1 | | | 19,600 | | | | 800,816 | | | |
Swedish Match AB (Sweden)1 | | | 5,918 | | | | 187,967 | | | |
| | | | | | | | | | |
| | | |
| | | | | | | 2,145,464 | | | |
| | | | | | | | | | |
| | | |
Total Consumer Staples | | | | | | | 71,488,905 | | | |
| | | | | | | | | | |
Energy - 3.0% | | | | | | | | | | |
Energy Equipment & Services - 1.1% | | | | | | | | | | |
Schlumberger Ltd. | | | 182,011 | | | | 14,622,764 | | | |
Spectrum ASA (Norway)1 | | | 59,940 | | | | 197,273 | | | |
| | | | | | | | | | |
| | | |
| | | | | | | 14,820,037 | | | |
| | | | | | | | | | |
Oil, Gas & Consumable Fuels - 1.9% | | | | | | | | | | |
Cameco Corp. (Canada) | | | 45,366 | | | | 567,529 | | | |
Cosan S.A. Industria e Comercio (Brazil) | | | 25,440 | | | | 234,632 | | | |
Galp Energia SGPS S.A. (Portugal)1 | | | 88,920 | | | | 1,221,716 | | | |
Range Resources Corp. | | | 497,650 | | | | 21,951,341 | | | |
Royal Dutch Shell plc - Class B (Netherlands)1 | | | 24,549 | | | | 644,533 | | | |
| | | | | | | | | | |
| | | |
| | | | | | | 24,619,751 | | | |
| | | | | | | | | | |
| | | |
Total Energy | | | | | | | 39,439,788 | | | |
| | | | | | | | | | |
Financials - 4.7% | | | | | | | | | | |
Banks - 0.0%## | | | | | | | | | | |
ICICI Bank Ltd. - ADR (India) | | | 47,750 | | | | 336,637 | | | |
| | | | | | | | | | |
Capital Markets - 1.0% | | | | | | | | | | |
BlackRock, Inc. | | | 37,020 | | | | 13,191,337 | | | |
| | | | | | | | | | |
Consumer Finance - 0.1% | | | | | | | | | | |
SLM Corp.* | | | 266,850 | | | | 1,806,575 | | | |
| | | | | | | | | | |
Diversified Financial Services - 0.1% | | | | | | | | | | |
JSE Ltd. (South Africa)1 | | | 53,080 | | | | 615,866 | | | |
| | | | | | | | | | |
Real Estate Investment Trusts (REITS) - 2.9% | | | | | | | | | | |
Agree Realty Corp. | | | 12,640 | | | | 490,179 | | | |
Alexandria Real Estate Equities, Inc. | | | 5,600 | | | | 520,520 | | | |
alstria office REIT AG (Germany)1 | | | 105,980 | | | | 1,488,152 | | | |
American Campus Communities, Inc. | | | 9,830 | | | | 439,893 | | | |
American Homes 4 Rent - Class A | | | 18,540 | | | | 293,303 | | | |
Apartment Investment & Management Co. - Class A | | | 14,990 | | | | 600,499 | | | |
AvalonBay Communities, Inc. | | | 4,410 | | | | 779,644 | | | |
Boston Properties, Inc. | | | 4,390 | | | | 565,695 | | | |
Brixmor Property Group, Inc. | | | 10,960 | | | | 276,740 | | | |
CatchMark Timber Trust, Inc. - Class A | | | 28,950 | | | | 307,160 | | | |
Chesapeake Lodging Trust | | | 20,460 | | | | 503,930 | | | |
Columbia Property Trust, Inc. | | | 12,620 | | | | 281,426 | | | |
Community Healthcare Trust, Inc. | | | 31,550 | | | | 574,210 | | | |
CoreSite Realty Corp. | | | 2,780 | | | | 208,305 | | | |
Crown Castle International Corp. | | | 2,940 | | | | 255,427 | | | |
CubeSmart | | | 21,650 | | | | 641,057 | | | |
DCT Industrial Trust, Inc. | | | 8,080 | | | | 326,190 | | | |
DDR Corp. | | | 23,760 | | | | 415,800 | | | |
Digital Realty Trust, Inc. | | | 3,730 | | | | 328,165 | | | |
Douglas Emmett, Inc. | | | 17,080 | | | | 554,246 | | | |
Education Realty Trust, Inc. | | | 10,596 | | | | 421,403 | | | |
Equinix, Inc. | | | 1,730 | | | | 571,506 | | | |
Equity LifeStyle Properties, Inc. | | | 4,880 | | | | 334,231 | | | |
Equity One, Inc. | | | 16,090 | | | | 455,347 | | | |
Equity Residential | | | 6,680 | | | | 454,708 | | | |
Extra Space Storage, Inc. | | | 3,700 | | | | 314,315 | | | |
Fibra Shop Portafolios Inmobiliarios S.A.P.I. de C.V. (Mexico) | | | 217,467 | | | | 209,824 | | | |
Forest City Realty Trust, Inc. - Class A | | | 28,310 | | | | 588,282 | | | |
General Growth Properties, Inc. | | | 16,380 | | | | 459,131 | | | |
HCP, Inc. | | | 7,590 | | | | 256,770 | | | |
Healthcare Realty Trust, Inc. | | | 10,710 | | | | 324,299 | | | |
Healthcare Trust of America, Inc. - Class A | | | 17,170 | | | | 496,041 | | | |
Host Hotels & Resorts, Inc. | | | 15,740 | | | | 249,007 | | | |
Kite Realty Group Trust | | | 12,312 | | | | 335,256 | | | |
Lamar Advertising Co. - Class A | | | 5,510 | | | | 341,840 | | | |
LaSalle Hotel Properties | | | 15,940 | | | | 380,966 | | | |
Mid-America Apartment Communities, Inc. | | | 8,610 | | | | 824,063 | | | |
NorthStar Realty Finance Corp. | | | 27,140 | | | | 347,121 | | | |
Outfront Media, Inc. | | | 21,225 | | | | 460,370 | | | |
Paramount Group, Inc. | | | 32,690 | | | | 545,923 | | | |
Pebblebrook Hotel Trust | | | 7,360 | | | | 203,430 | | | |
Pennsylvania Real Estate Investment Trust | | | 8,910 | | | | 204,395 | | | |
Physicians Realty Trust | | | 39,260 | | | | 711,784 | | | |
Prologis, Inc. | | | 23,350 | | | | 1,060,323 | | | |
Public Storage | | | 1,860 | | | | 455,347 | | | |
Retail Opportunity Investments Corp. | | | 22,090 | | | | 434,510 | | | |
Retail Properties of America, Inc. - Class A | | | 17,260 | | | | 275,987 | | | |
Rexford Industrial Realty, Inc. | | | 22,560 | | | | 423,451 | | | |
Simon Property Group, Inc. | | | 7,070 | | | | 1,422,272 | | | |
The accompanying notes are an integral part of the financial statements.
54
Investment Portfolio - April 30, 2016
(unaudited)
| | | | | | | | | | |
| PRO-BLEND® EXTENDED TERM SERIES | | SHARES | | | VALUE (NOTE 2) | | | |
| | | |
COMMON STOCKS (continued) | | | | | | | | | | |
| | | |
Financials (continued) | | | | | | | | | | |
Real Estate Investment Trusts (REITS) (continued) | | | | | | | | | | |
Sovran Self Storage, Inc. | | | 5,910 | | | $ | 627,760 | | | |
STORE Capital Corp. | | | 12,960 | | | | 332,683 | | | |
Tanger Factory Outlet Centers, Inc. | | | 9,150 | | | | 320,982 | | | |
Taubman Centers, Inc. | | | 4,850 | | | | 336,832 | | | |
Terreno Realty Corp. | | | 17,170 | | | | 390,961 | | | |
UDR, Inc. | | | 7,390 | | | | 258,059 | | | |
Urban Edge Properties | | | 21,170 | | | | 549,150 | | | |
Ventas, Inc. | | | 7,240 | | | | 449,749 | | | |
Vornado Realty Trust | | | 5,400 | | | | 516,942 | | | |
Welltower, Inc. | | | 6,500 | | | | 451,230 | | | |
Westfield Corp. (Australia)1 | | | 25,790 | | | | 196,975 | | | |
Weyerhaeuser Co. | | | 311,295 | | | | 9,998,795 | | | |
| | | | | | | | | | |
| | | |
| | | | | | | 37,842,561 | | | |
| | | | | | | | | | |
Real Estate Management & Development - 0.6% | | | | | | | | | | |
CBRE Group, Inc. - Class A* | | | 6,860 | | | | 203,262 | | | |
First Capital Realty, Inc. (Canada) | | | 14,240 | | | | 230,505 | | | |
Realogy Holdings Corp.* | | | 193,100 | | | | 6,901,394 | | | |
| | | | | | | | | | |
| | | |
| | | | | | | 7,335,161 | | | |
| | | | | | | | | | |
| | | |
Total Financials | | | | | | | 61,128,137 | | | |
| | | | | | | | | | |
Health Care - 6.2% | | | | | | | | | | |
Biotechnology - 0.2% | | | | | | | | | | |
Cepheid, Inc.* | | | 34,180 | | | | 975,497 | | | |
Seattle Genetics, Inc.* | | | 23,420 | | | | 830,942 | | | |
Vertex Pharmaceuticals, Inc.* | | | 10,290 | | | | 867,859 | | | |
| | | | | | | | | | |
| | | |
| | | | | | | 2,674,298 | | | |
| | | | | | | | | | |
Health Care Equipment & Supplies - 1.6% | | | | | | | | | | |
LDR Holding Corp.* | | | 23,070 | | | | 621,736 | | | |
Medtronic plc | | | 249,220 | | | | 19,725,763 | | | |
Shandong Weigao Group Medical Polymer Co. Ltd. - Class H (China)1 | | | 328,974 | | | | 197,491 | | | |
| | | | | | | | | | |
| | | |
| | | | | | | 20,544,990 | | | |
| | | | | | | | | | |
Health Care Providers & Services - 1.2% | | | | | | | | | | |
Acadia Healthcare Co., Inc.* | | | 12,520 | | | | 791,139 | | | |
Brookdale Senior Living, Inc.* | | | 8,960 | | | | 165,402 | | | |
DaVita HealthCare Partners, Inc.* | | | 27,380 | | | | 2,023,382 | | | |
Express Scripts Holding Co.* | | | 139,460 | | | | 10,282,386 | | | |
Fresenius Medical Care AG & Co. KGaA (Germany)1 | | | 9,140 | | | | 795,523 | | | |
Fresenius Medical Care AG & Co. KGaA - ADR (Germany) | | | 21,970 | | | | 958,551 | | | |
KPJ Healthcare Berhad (Malaysia)1 | | | 359,110 | | | | 388,848 | | | |
Odontoprev S.A. (Brazil) | | | 169,180 | | | | 520,932 | | | |
Siloam International Hospitals Tbk PT (Indonesia)1 | | | 529,800 | | | | 339,461 | | | |
| | | | | | | | | | |
| | | |
| | | | | | | 16,265,624 | | | |
| | | | | | | | | | |
Health Care Technology - 1.5% | | | | | | | | | | |
Cerner Corp.* | | | 340,760 | | | | 19,130,266 | | | |
| | | | | | | | | | |
Life Sciences Tools & Services - 0.0%## | | | | | | | | | | |
QIAGEN N.V.* | | | 7,950 | | | | 178,557 | | | |
QIAGEN N.V.*1 | | | 8,920 | | | | 200,617 | | | |
| | | | | | | | | | |
| | | |
| | | | | | | 379,174 | | | |
| | | | | | | | | | |
Pharmaceuticals - 1.7% | | | | | | | | | | |
AstraZeneca plc - ADR (United Kingdom) | | | 28,440 | | | | 823,622 | | | |
Genomma Lab Internacional S.A.B. de C.V. - Class B (Mexico)* | | | 605,470 | | | | 665,133 | | | |
GlaxoSmithKline plc (United Kingdom)1 | | | 14,575 | | | | 311,505 | | | |
Johnson & Johnson3 | | | 169,870 | | | | 19,039,030 | | | |
Novartis AG - ADR (Switzerland) | | | 11,910 | | | | 904,803 | | | |
Perrigo Co. plc | | | 3,200 | | | | 309,344 | | | |
| | | | | | | | | | |
| | | |
| | | | | | | 22,053,437 | | | |
| | | | | | | | | | |
| | | |
Total Health Care | | | | | | | 81,047,789 | | | |
| | | | | | | | | | |
Industrials - 1.8% | | | | | | | | | | |
Aerospace & Defense - 0.0%## | | | | | | | | | | |
Safran S.A. (France)1 | | | 3,080 | | | | 212,335 | | | |
| | | | | | | | | | |
Airlines - 0.0%## | | | | | | | | | | |
Ryanair Holdings plc - ADR (Ireland) | | | 2,676 | | | | 216,622 | | | |
| | | | | | | | | | |
Commercial Services & Supplies - 0.1% | | | | | | | | | | |
China Everbright International Ltd. (China)1 | | | 237,000 | | | | 265,328 | | | |
MiX Telematics Ltd. - ADR (South Africa) | | | 46,320 | | | | 188,986 | | | |
Stericycle, Inc.* | | | 13,260 | | | | 1,267,126 | | | |
| | | | | | | | | | |
| | | |
| | | | | | | 1,721,440 | | | |
| | | | | | | | | | |
Industrial Conglomerates - 0.2% | | | | | | | | | | |
Siemens AG (Germany)1 | | | 16,860 | | | | 1,764,378 | | | |
| | | | | | | | | | |
Machinery - 1.0% | | | | | | | | | | |
Alstom S.A. (France)*1 | | | 28,470 | | | | 727,996 | | | |
ANDRITZ AG (Austria)1 | | | 16,570 | | | | 930,114 | | | |
FANUC Corp. (Japan)1 | | | 3,550 | | | | 524,413 | | | |
Flowserve Corp. | | | 169,230 | | | | 8,260,116 | | | |
GEA Group AG (Germany)1 | | | 29,450 | | | | 1,368,535 | | | |
SMC Corp. (Japan)1 | | | 3,600 | | | | 877,895 | | | |
Sulzer AG (Switzerland)1 | | | 2,800 | | | | 255,599 | | | |
The accompanying notes are an integral part of the financial statements.
55
Investment Portfolio - April 30, 2016
(unaudited)
| | | | | | | | | | |
| PRO-BLEND® EXTENDED TERM SERIES | | SHARES | | | VALUE (NOTE 2) | | | |
| | | |
COMMON STOCKS (continued) | | | | | | | | | | |
| | | |
Industrials (continued) | | | | | | | | | | |
Machinery (continued) | | | | | | | | | | |
The Weir Group plc (United Kingdom)1 | | | 15,380 | | | $ | 270,160 | | | |
| | | | | | | | | | |
| | | |
| | | | | | | 13,214,828 | | | |
| | | | | | | | | | |
Professional Services - 0.1% | | | | | | | | | | |
Applus Services S.A. (Spain)1 | | | 57,350 | | | | 530,650 | | | |
Bureau Veritas S.A. (France)1 | | | 22,840 | | | | 541,384 | | | |
Intertek Group plc (United Kingdom)1 | | | 11,390 | | | | 543,369 | | | |
| | | | | | | | | | |
| | | |
| | | | | | | 1,615,403 | | | |
| | | | | | | | | | |
Road & Rail - 0.3% | | | | | | | | | | |
Genesee & Wyoming, Inc. - Class A* | | | 28,620 | | | | 1,863,448 | | | |
Kansas City Southern | | | 16,410 | | | | 1,554,847 | | | |
| | | | | | | | | | |
| | | |
| | | | | | | 3,418,295 | | | |
| | | | | | | | | | |
Trading Companies & Distributors - 0.1% | | | | | | | | | | |
Brenntag AG (Germany)1 | | | 10,117 | | | | 594,261 | | | |
| | | | | | | | | | |
| | | |
Total Industrials | | | | | | | 22,757,562 | | | |
| | | | | | | | | | |
Information Technology - 16.1% | | | | | | | | | | |
Electronic Equipment, Instruments & Components - 1.8% | | | | | | | | | | |
FLIR Systems, Inc. | | | 264,620 | | | | 7,994,170 | | | |
Hitachi Ltd. (Japan)1 | | | 244,000 | | | | 1,118,063 | | | |
Keyence Corp. (Japan)1 | | | 1,809 | | | | 1,084,302 | | | |
PAX Global Technology Ltd. (Hong Kong)1 | | | 1,423,000 | | | | 1,225,517 | | | |
Trimble Navigation Ltd.* | | | 56,920 | | | | 1,363,234 | | | |
VeriFone Systems, Inc.* | | | 349,850 | | | | 9,956,731 | | | |
| | | | | | | | | | |
| | | |
| | | | | | | 22,742,017 | | | |
| | | | | | | | | | |
Internet Software & Services - 3.5% | | | | | | | | | | |
Alibaba Group Holding Ltd. - ADR (China)* | | | 16,720 | | | | 1,286,437 | | | |
Alphabet, Inc. - Class A*3 | | | 16,030 | | | | 11,347,316 | | | |
Alphabet, Inc. - Class C* | | | 16,290 | | | | 11,289,133 | | | |
Baidu, Inc. - ADR (China)* | | | 7,180 | | | | 1,395,074 | | | |
Benefitfocus, Inc.* | | | 22,760 | | | | 862,604 | | | |
Envestnet, Inc.* | | | 44,760 | | | | 1,404,569 | | | |
Facebook, Inc. - Class A* | | | 116,450 | | | | 13,692,191 | | | |
Match Group, Inc.* | | | 57,430 | | | | 654,702 | | | |
MercadoLibre, Inc. (Argentina) | | | 10,140 | | | | 1,266,385 | | | |
Q2 Holdings, Inc.* | | | 42,960 | | | | 1,027,174 | | | |
Tencent Holdings Ltd. - Class H (China)1 | | | 64,600 | | | | 1,314,501 | | | |
| | | | | | | | | | |
| | | |
| | | | | | | 45,540,086 | | | |
| | | | | | | | | | |
IT Services - 4.0% | | | | | | | | | | |
Amdocs Ltd. - ADR | | | 12,600 | | | | 712,404 | | | |
FleetCor Technologies, Inc.* | | | 5,560 | | | | 860,021 | | | |
InterXion Holding N.V. - ADR (Netherlands)* | | | 14,020 | | | | 474,998 | | | |
MasterCard, Inc. - Class A | | | 242,450 | | | | 23,515,225 | | | |
PayPal Holdings, Inc.* | | | 337,020 | | | | 13,204,444 | | | |
Visa, Inc. - Class A3 | | | 167,070 | | | | 12,904,487 | | | |
| | | | | | | | | | |
| | | |
| | | | | | | 51,671,579 | | | |
| | | | | | | | | | |
Semiconductors & Semiconductor Equipment - 1.9% | | | | | | | | | | |
QUALCOMM, Inc. | | | 499,810 | | | | 25,250,401 | | | |
| | | | | | | | | | |
Software - 3.3% | | | | | | | | | | |
Electronic Arts, Inc.* | | | 302,490 | | | | 18,709,007 | | | |
Paylocity Holding Corp.* | | | 23,130 | | | | 885,185 | | | |
SAP SE (Germany)1 | | | 18,830 | | | | 1,477,429 | | | |
ServiceNow, Inc.* | | | 274,570 | | | | 19,626,264 | | | |
TOTVS S.A. (Brazil) | | | 68,248 | | | | 557,811 | | | |
The Ultimate Software Group, Inc.* | | | 6,930 | | | | 1,362,369 | | | |
| | | | | | | | | | |
| | | |
| | | | | | | 42,618,065 | | | |
| | | | | | | | | | |
Technology Hardware, Storage & Peripherals - 1.6% | | | | | | | | | | |
Apple, Inc. | | | 201,600 | | | | 18,897,984 | | | |
Samsung Electronics Co. Ltd. (South Korea)1 | | | 2,130 | | | | 2,321,341 | | | |
| | | | | | | | | | |
| | | |
| | | | | | | 21,219,325 | | | |
| | | | | | | | | | |
| | | |
Total Information Technology | | | | | | | 209,041,473 | | | |
| | | | | | | | | | |
Materials - 4.2% | | | | | | | | | | |
Chemicals - 2.9% | | | | | | | | | | |
Ashland, Inc. | | | 123,000 | | | | 13,726,800 | | | |
Givaudan S.A. (Switzerland)1 | | | 310 | | | | 611,898 | | | |
Monsanto Co. | | | 242,170 | | | | 22,686,486 | | | |
Sociedad Quimica y Minera de Chile S.A. - ADR (Chile) | | | 16,303 | | | | 339,591 | | | |
Symrise AG (Germany)1 | | | 8,220 | | | | 545,574 | | | |
| | | | | | | | | | |
| | | |
| | | | | | | 37,910,349 | | | |
| | | | | | | | | | |
Metals & Mining - 1.3% | | | | | | | | | | |
Alcoa, Inc. | | | 1,451,280 | | | | 16,210,798 | | | |
Alumina Ltd. (Australia)1 | | | 288,191 | | | | 325,430 | | | |
Norsk Hydro ASA (Norway)1 | | | 58,554 | | | | 254,767 | | | |
| | | | | | | | | | |
| | | |
| | | | | | | 16,790,995 | | | |
| | | | | | | | | | |
| | | |
Total Materials | | | | | | | 54,701,344 | | | |
| | | | | | | | | | |
Telecommunication Services - 0.2% | | | | | | | | | | |
Diversified Telecommunication Services - 0.1% | | | | | | | | | | |
Telefonica S.A. - ADR (Spain) | | | 90,606 | | | | 988,511 | | | |
| | | | | | | | | | |
The accompanying notes are an integral part of the financial statements.
56
Investment Portfolio - April 30, 2016
(unaudited)
| | | | | | | | | | |
| PRO-BLEND® EXTENDED TERM SERIES | | SHARES/
PRINCIPAL
AMOUNT4 | | | VALUE (NOTE 2) | | | |
| | | |
COMMON STOCKS (continued) | | | | | | | | | | |
| | | |
Telecommunication Services (continued) | | | | | | | | | | |
Wireless Telecommunication Services - 0.1% | | | | | | | | | | |
America Movil S.A.B. de C.V. - Class L - ADR (Mexico) | | | 83,629 | | | $ | 1,184,187 | | | |
China Mobile Ltd. - Class H (China)1 | | | 29,210 | | | | 335,353 | | | |
| | | | | | | | | | |
| | | |
| | | | | | | 1,519,540 | | | |
| | | | | | | | | | |
| | | |
Total Telecommunication Services | | | | | | | 2,508,051 | | | |
| | | | | | | | | | |
Utilities - 0.0%## | | | | | | | | | | |
Water Utilities - 0.0%## | | | | | | | | | | |
CT Environmental Group Ltd. (China)1 | | | 890,000 | | | | 259,593 | | | |
| | | | | | | | | | |
| | | |
TOTAL COMMON STOCKS
(Identified Cost $681,854,310) | | | | | | | 716,840,875 | | | |
| | | | | | | | | | |
| | | |
LOAN ASSIGNMENTS - 0.1% | | | | | | | | | | |
| | | |
Valeant Pharmaceuticals International, Inc., Series D-2, Term Loan B5, 3.75%, 2/13/2019 | | | | | | | | | | |
(Identified Cost $1,972,607) | | | 1,978,021 | | | | 1,918,680 | | | |
| | | | | | | | | | |
| | | |
CORPORATE BONDS - 13.0% | | | | | | | | | | |
| | | |
Non-Convertible Corporate Bonds - 13.0% | | | | | | | | | | |
Consumer Discretionary - 1.2% | | | | | | | | | | |
Auto Components - 0.2% | | | | | | | | | | |
Magna International, Inc. (Canada), 4.15%, 10/1/2025 | | | 1,450,000 | | | | 1,555,905 | | | |
Techniplas LLC2, 10.00%, 5/1/2020 | | | 975,000 | | | | 682,500 | | | |
| | | | | | | | | | |
| | | |
| | | | | | | 2,238,405 | | | |
| | | | | | | | | | |
Hotels, Restaurants & Leisure - 0.1% | | | | | | | | | | |
MGM Resorts International, 10.00%, 11/1/2016 | | | 795,000 | | | | 827,833 | | | |
| | | | | | | | | | |
Household Durables - 0.5% | | | | | | | | | | |
Brookfield Residential Properties, Inc. - Brookfield Residential US Corp. (Canada)2, 6.125%, 7/1/2022 | | | 1,290,000 | | | | 1,194,566 | | | |
Lennar Corp., 12.25%, 6/1/2017 | | | 740,000 | | | | 815,850 | | | |
Meritage Homes Corp., 7.15%, 4/15/2020 | | | 530,000 | | | | 564,450 | | | |
Meritage Homes Corp., 7.00%, 4/1/2022 | | | 575,000 | | | | 616,687 | | | |
NVR, Inc., 3.95%, 9/15/2022 | | | 1,700,000 | | | | 1,737,193 | | | |
TRI Pointe Group, Inc. - TRI Pointe Homes, Inc., 4.375%, 6/15/2019 | | | 885,000 | | | | 887,213 | | | |
Weekley Homes LLC - Weekley Finance Corp., 6.00%, 2/1/2023 | | | 1,130,000 | | | | 1,050,900 | | | |
| | | | | | | | | | |
| | | |
| | | | | | | 6,866,859 | | | |
| | | | | | | | | | |
Media - 0.3% | | | | | | | | | | |
CCO Holdings LLC - CCO Holdings Capital Corp.2, 5.875%, 4/1/2024 | | | 705,000 | | | | 738,488 | | | |
Columbus International, Inc. (Barbados)2, 7.375%, 3/30/2021 | | | 830,000 | | | | 881,626 | | | |
Sinclair Television Group, Inc.2, 5.625%, 8/1/2024 | | | 580,000 | | | | 595,950 | | | |
Sirius XM Radio, Inc.2, 5.375%, 4/15/2025 | | | 570,000 | | | | 582,825 | | | |
VTR Finance B.V. (Netherlands)2, 6.875%, 1/15/2024 | | | 1,180,000 | | | | 1,178,525 | | | |
WideOpenWest Finance LLC - WideOpenWest Capital Corp., 10.25%, 7/15/2019 | | | 130,000 | | | | 130,325 | | | |
| | | | | | | | | | |
| | | |
| | | | | | | 4,107,739 | | | |
| | | | | | | | | | |
Multiline Retail - 0.1% | | | | | | | | | | |
Dollar General Corp., 3.25%, 4/15/2023 | | | 1,345,000 | | | | 1,355,424 | | | |
| | | | | | | | | | |
| | | |
Total Consumer Discretionary | | | | | | | 15,396,260 | | | |
| | | | | | | | | | |
Consumer Staples - 0.9% | | | | | | | | | | |
Beverages - 0.5% | | | | | | | | | | |
Anheuser-Busch InBev Worldwide, Inc. (Belgium), 7.75%, 1/15/2019 | | | 1,050,000 | | | | 1,222,729 | | | |
Anheuser-Busch InBev Worldwide, Inc. (Belgium), 8.20%, 1/15/2039 | | | 1,770,000 | | | | 2,745,206 | | | |
PepsiCo, Inc., 3.10%, 7/17/2022 | | | 2,720,000 | | | | 2,897,213 | | | |
| | | | | | | | | | |
| | | |
| | | | | | | 6,865,148 | | | |
| | | | | | | | | | |
Food & Staples Retailing - 0.2% | | | | | | | | | | |
C&S Group Enterprises LLC2, 5.375%, 7/15/2022 | | | 965,000 | | | | 926,400 | | | |
CVS Health Corp., 3.50%, 7/20/2022 | | | 1,360,000 | | | | 1,447,875 | | | |
The Kroger Co., 2.60%, 2/1/2021 | | | 690,000 | | | | 710,207 | | | |
| | | | | | | | | | |
| | | |
| | | | | | | 3,084,482 | | | |
| | | | | | | | | | |
Food Products - 0.1% | | | | | | | | | | |
Pinnacle Operating Corp.2, 9.00%, 11/15/2020 | | | 1,285,000 | | | | 1,092,250 | | | |
| | | | | | | | | | |
Household Products - 0.1% | | | | | | | | | | |
HRG Group, Inc., 7.75%, 1/15/2022 | | | 885,000 | | | | 885,000 | | | |
| | | | | | | | | | |
| | | |
Total Consumer Staples | | | | | | | 11,926,880 | | | |
| | | | | | | | | | |
Energy - 1.9% | | | | | | | | | | |
Energy Equipment & Services - 0.6% | | | | | | | | | | |
Baker Hughes, Inc., 7.50%, 11/15/2018 | | | 935,000 | | | | 1,051,054 | | | |
Ensco plc, 5.20%, 3/15/2025 | | | 2,195,000 | | | | 1,599,606 | | | |
The accompanying notes are an integral part of the financial statements.
57
Investment Portfolio - April 30, 2016
(unaudited)
| | | | | | | | | | | | | | |
| PRO-BLEND® EXTENDED TERM SERIES | | | | | PRINCIPAL
AMOUNT4 | | | VALUE (NOTE 2) | | | |
| | | | |
CORPORATE BONDS (continued) | | | | | | | | | | | | | | |
| | | | |
Non-Convertible Corporate Bonds (continued) | | | | | | | | | | | | | | |
Energy (continued) | | | | | | | | | | | | | | |
Energy Equipment & Services (continued) | | | | | | | | | | | | | | |
FTS International, Inc., 6.25%, 5/1/2022 | | | | | | | 575,000 | | | $ | 89,413 | | | |
Pride International, Inc., 8.50%, 6/15/2019 | | | | | | | 600,000 | | | | 603,000 | | | |
Schlumberger Holdings Corp.2, 3.625%, 12/21/2022 | | | | | | | 2,830,000 | | | | 2,948,356 | | | |
TerraForm Global Operating LLC2, 9.75%, 8/15/2022 | | | | | | | 900,000 | | | | 797,625 | | | |
| | | | | | | | | | | | | | |
| | | | |
| | | | | | | | | | | 7,089,054 | | | |
| | | | | | | | | | | | | | |
Oil, Gas & Consumable Fuels - 1.3% | | | | | | | | | | | | | | |
Carrizo Oil & Gas, Inc., 6.25%, 4/15/2023 | | | | | | | 195,000 | | | | 187,200 | | | |
Chevron Corp., 1.79%, 11/16/2018 | | | | | | | 1,295,000 | | | | 1,311,494 | | | |
Columbia Pipeline Group, Inc.2, 4.50%, 6/1/2025 | | | | | | | 1,250,000 | | | | 1,289,010 | | | |
Crestwood Midstream Partners LP - Crestwood Midstream Finance Corp., 6.125%, 3/1/2022 | | | | | | | 445,000 | | | | 406,063 | | | |
Hiland Partners LP - Hiland Partners Finance Corp.2, 7.25%, 10/1/2020 | | | | | | | 2,850,000 | | | | 2,981,812 | | | |
Hilcorp Energy I LP - Hilcorp Finance Co.2, 5.75%, 10/1/2025 | | | | | | | 195,000 | | | | 183,787 | | | |
Kinder Morgan Energy Partners LP, 4.30%, 5/1/2024 | | | | | | | 1,000,000 | | | | 975,480 | | | |
Kinder Morgan, Inc.2, 5.625%, 11/15/2023 | | | | | | | 1,100,000 | | | | 1,136,945 | | | |
Oasis Petroleum, Inc., 6.875%, 1/15/2023 | | | | | | | 190,000 | | | | 170,525 | | | |
PBF Holding Co. LLC - PBF Finance Corp.2, 7.00%, 11/15/2023 | | | | | | | 605,000 | | | | 589,875 | | | |
Petrobras Global Finance B.V. (Brazil)5, 2.238%, 5/20/2016 | | | | | | | 3,642,000 | | | | 3,639,269 | | | |
Petroleos Mexicanos (Mexico), 4.50%, 1/23/2026 | | | | | | | 1,905,000 | | | | 1,812,417 | | | |
Sabine Pass Liquefaction LLC, 5.625%, 2/1/2021 | | | | | | | 1,250,000 | | | | 1,242,187 | | | |
Transocean, Inc., 3.75%, 10/15/2017 | | | | | | | 375,000 | | | | 360,000 | | | |
Weatherford International LLC, 6.35%, 6/15/2017 | | | | | | | 375,000 | | | | 380,625 | | | |
WPX Energy, Inc., 6.00%, 1/15/2022 | | | | | | | 390,000 | | | | 351,000 | | | |
| | | | | | | | | | | | | | |
| | | | |
| | | | | | | | | | | 17,017,689 | | | |
| | | | | | | | | | | | | | |
| | | | |
Total Energy | | | | | | | | | | | 24,106,743 | | | |
| | | | | | | | | | | | | | |
Financials - 4.6% | | | | | | | | | | | | | | |
Banks - 1.7% | | | | | | | | | | | | | | |
Bank of America Corp., 5.70%, 5/2/2017 | | | | | | | 910,000 | | | | 946,211 | | | |
Barclays Bank plc (United Kingdom)2, 10.179%, 6/12/2021 | | | | | | | 2,050,000 | | | | 2,608,467 | | | |
CIT Group, Inc., 4.25%, 8/15/2017 | | | | | | | 795,000 | | | | 806,428 | | | |
Citigroup, Inc., 3.875%, 3/26/2025 | | | | | | | 1,425,000 | | | | 1,415,524 | | | |
Commonwealth Bank of Australia (Australia), 5.75%, 1/25/2017 | | | AUD | | | | 380,000 | | | | 295,710 | | | |
Cooperatieve Rabobank U.A. (Netherlands)6,7, 8.375% | | | | | | | 450,000 | | | | 455,063 | | | |
Intesa Sanpaolo S.p.A. (Italy), 3.875%, 1/15/2019 | | | | | | | 1,650,000 | | | | 1,709,225 | | | |
Intesa Sanpaolo S.p.A. (Italy)2, 6.50%, 2/24/2021 | | | | | | | 1,400,000 | | | | 1,601,879 | | | |
Lloyds Bank plc (United Kingdom)2,6,8, 12.00% | | | | | | | 905,000 | | | | 1,188,944 | | | |
Lloyds Bank plc (United Kingdom)5, 9.875%, 12/16/2021 | | | | | | | 1,335,000 | | | | 1,396,610 | | | |
Lloyds Banking Group plc (United Kingdom)2, 4.582%, 12/10/2025 | | | | | | | 5,535,000 | | | | 5,549,485 | | | |
Popular, Inc., 7.00%, 7/1/2019 | | | | | | | 1,230,000 | | | | 1,199,250 | | | |
Royal Bank of Canada (Canada), 3.77%, 3/30/2018 | | | CAD | | | | 445,000 | | | | 371,283 | | | |
Santander Bank N.A., 8.75%, 5/30/2018 | | | | | | | 1,300,000 | | | | 1,457,651 | | | |
Santander Holdings USA, Inc., 2.65%, 4/17/2020 | | | | | | | 1,195,000 | | | | 1,190,752 | | | |
Westpac Banking Corp. (Australia), 5.75%, 2/6/2017 | | | AUD | | | | 400,000 | | | | 311,568 | | | |
| | | | | | | | | | | | | | |
| | | | |
| | | | | | | | | | | 22,504,050 | | | |
| | | | | | | | | | | | | | |
Capital Markets - 0.5% | | | | | | | | | | | | | | |
The Goldman Sachs Group, Inc., 5.375%, 3/15/2020 | | | | | | | 2,225,000 | | | | 2,472,990 | | | |
The Goldman Sachs Group, Inc.5, 2.236%, 11/29/2023 | | | | | | | 1,100,000 | | | | 1,097,874 | | | |
The Goldman Sachs Group, Inc., 4.25%, 10/21/2025 | | | | | | | 1,315,000 | | | | 1,342,706 | | | |
Morgan Stanley, 5.00%, 11/24/2025 | | | | | | | 1,150,000 | | | | 1,251,715 | | | |
| | | | | | | | | | | | | | |
| | | | |
| | | | | | | | | | | 6,165,285 | | | |
| | | | | | | | | | | | | | |
Consumer Finance - 0.2% | | | | | | | | | | | | | | |
Ally Financial, Inc., 2.75%, 1/30/2017 | | | | | | | 855,000 | | | | 853,931 | | | |
Ally Financial, Inc., 8.00%, 12/31/2018 | | | | | | | 15,000 | | | | 16,406 | | | |
Navient Corp., 6.00%, 1/25/2017 | | | | | | | 815,000 | | | | 828,244 | | | |
Navient Corp., 6.125%, 3/25/2024 | | | | | | | 1,185,000 | | | | 1,061,167 | | | |
| | | | | | | | | | | | | | |
| | | | |
| | | | | | | | | | | 2,759,748 | | | |
| | | | | | | | | | | | | | |
The accompanying notes are an integral part of the financial statements.
58
Investment Portfolio - April 30, 2016
(unaudited)
| | | | | | | | | | |
| PRO-BLEND® EXTENDED TERM SERIES | | PRINCIPAL
AMOUNT 4 | | | VALUE
(NOTE 2) | | | |
| | | |
CORPORATE BONDS (continued) | | | | | | | | | | |
| | | |
Non-Convertible Corporate Bonds (continued) | | | | | | | | | | |
Financials (continued) | | | | | | | | | | |
Diversified Financial Services - 0.2% | | | | | | | | | | |
ING Bank N.V. (Netherlands)5, 4.125%, 11/21/2023 | | | 1,460,000 | | | $ | 1,483,042 | | | |
Jefferies Finance LLC - JFIN Co-Issuer Corp.2, 7.375%, 4/1/2020 | | | 875,000 | | | | 807,187 | | | |
Jefferies Finance LLC - JFIN Co-Issuer Corp.2, 6.875%, 4/15/2022 | | | 560,000 | | | | 490,000 | | | |
| | | | | | | | | | |
| | | |
| | | | | | | 2,780,229 | | | |
| | | | | | | | | | |
Insurance - 1.2% | | | | | | | | | | |
Aegon N.V. (Netherlands)5,6, 1.74% | | | 2,175,000 | | | | 1,328,818 | | | |
American International Group, Inc., 4.875%, 6/1/2022 | | | 3,645,000 | | | | 4,000,883 | | | |
Assured Guaranty US Holdings, Inc., 5.00%, 7/1/2024 | | | 4,775,000 | | | | 5,081,440 | | | |
AXA S.A. (France)5,6, 1.825% | | | 2,700,000 | | | | 1,850,364 | | | |
First American Financial Corp., 4.30%, 2/1/2023 | | | 1,350,000 | | | | 1,369,189 | | | |
Prudential Financial, Inc.9, 5.875%, 9/15/2042 | | | 1,975,000 | | | | 2,134,481 | | | |
| | | | | | | | | | |
| | | |
| | | | | | | 15,765,175 | | | |
| | | | | | | | | | |
Real Estate Investment Trusts (REITS) - 0.4% | | | | | | | | | | |
Crown Castle Towers LLC2, 6.113%, 1/15/2020 | | | 1,045,000 | | | | 1,157,404 | | | |
Crown Castle Towers LLC2, 4.883%, 8/15/2020 | | | 353,000 | | | | 377,494 | | | |
Crown Castle Towers LLC2, 3.222%, 5/15/2022 | | | 960,000 | | | | 975,974 | | | |
Greystar Real Estate Partners LLC2, 8.25%, 12/1/2022 | | | 855,000 | | | | 889,200 | | | |
GTP Acquisition Partners I LLC2, 2.35%, 6/15/2020 | | | 1,150,000 | | | | 1,147,240 | | | |
Qualitytech LP - QTS Finance Corp., 5.875%, 8/1/2022 | | | 265,000 | | | | 271,625 | | | |
Welltower, Inc., 4.95%, 1/15/2021 | | | 275,000 | | | | 301,706 | | | |
| | | | | | | | | | |
| | | |
| | | | | | | 5,120,643 | | | |
| | | | | | | | | | |
Real Estate Management & Development - 0.1% | | | | | | | | | | |
Forestar USA Real Estate Group, Inc.2, 8.50%, 6/1/2022 | | | 530,000 | | | | 540,600 | | | |
| | | | | | | | | | |
Thrifts & Mortgage Finance - 0.3% | | | | | | | | | | |
Ladder Capital Finance Holdings LLLP - Ladder Capital Finance Corp., 7.375%, 10/1/2017 | | | 1,080,000 | | | | 1,082,700 | | | |
Ladder Capital Finance Holdings LLLP - Ladder Capital Finance Corp.2, 5.875%, 8/1/2021 | | | 1,395,000 | | | | 1,227,600 | | | |
Radian Group, Inc., 7.00%, 3/15/2021 | | | 565,000 | | | | 602,431 | | | |
Rialto Holdings LLC - Rialto Corp.2, 7.00%, 12/1/2018 | | | 1,505,000 | | | | 1,474,900 | | | |
| | | | | | | | | | |
| | | |
| | | | | | | 4,387,631 | | | |
| | | | | | | | | | |
| | | |
Total Financials | | | | | | | 60,023,361 | | | |
| | | | | | | | | | |
Health Care - 0.4% | | | | | | | | | | |
Biotechnology - 0.1% | | | | | | | | | | |
AMAG Pharmaceuticals, Inc.2, 7.875%, 9/1/2023 | | | 1,425,000 | | | | 1,278,938 | | | |
| | | | | | | | | | |
Health Care Providers & Services - 0.1% | | | | | | | | | | |
HCA, Inc., 7.50%, 2/15/2022 | | | 525,000 | | | | 594,563 | | | |
Tenet Healthcare Corp.2,5, 4.134%, 6/15/2020 | | | 595,000 | | | | 595,744 | | | |
Tenet Healthcare Corp., 8.125%, 4/1/2022 | | | 565,000 | | | | 586,188 | | | |
| | | | | | | | | | |
| | | |
| | | | | | | 1,776,495 | | | |
| | | | | | | | | | |
Pharmaceuticals - 0.2% | | | | | | | | | | |
Concordia Healthcare Corp. (Canada)2, 7.00%, 4/15/2023 | | | 875,000 | | | | 811,563 | | | |
Horizon Pharma Financing, Inc.2, 6.625%, 5/1/2023 | | | 860,000 | | | | 782,600 | | | |
Mallinckrodt International Finance S.A. - Mallinckrodt CB LLC2, 5.625%, 10/15/2023 | | | 885,000 | | | | 829,687 | | | |
| | | | | | | | | | |
| | | | | | | 2,423,850 | | | |
| | | | | | | | | | |
| | | |
Total Health Care | | | | | | | 5,479,283 | | | |
| | | | | | | | | | |
Industrials - 1.5% | | | | | | | | | | |
Aerospace & Defense - 0.1% | | | | | | | | | | |
DigitalGlobe, Inc.2, 5.25%, 2/1/2021 | | | 1,330,000 | | | | 1,201,987 | | | |
| | | | | | | | | | |
Air Freight & Logistics - 0.0%## | | | | | | | | | | |
Neovia Logistics Intermediate Holdings LLC - Logistics Intermediate Finance Corp.2,10, 10.00%, 2/15/2018 | | | 614,000 | | | | 323,117 | | | |
| | | | | | | | | | |
Airlines - 0.3% | | | | | | | | | | |
Allegiant Travel Co., 5.50%, 7/15/2019 | | | 860,000 | | | | 885,263 | | | |
American Airlines Pass-Through Trust, Series 2013-2, Class A, 4.95%, 1/15/2023 | | | 1,209,826 | | | | 1,299,051 | | | |
Southwest Airlines Co., 2.75%, 11/6/2019 | | | 1,555,000 | | | | 1,598,280 | | | |
The accompanying notes are an integral part of the financial statements.
59
Investment Portfolio - April 30, 2016
(unaudited)
| | | | | | | | | | |
| PRO-BLEND® EXTENDED TERM SERIES | | PRINCIPAL
AMOUNT 4 | | | VALUE
(NOTE 2) | | | |
| | | |
CORPORATE BONDS (continued) | | | | | | | | | | |
| | | |
Non-Convertible Corporate Bonds (continued) | | | | | | | | | | |
Industrials (continued) | | | | | | | | | | |
Airlines (continued) | | | | | | | | | | |
Southwest Airlines Co., 2.65%, 11/5/2020 | | | 500,000 | | | $ | 508,318 | | | |
| | | | | | | | | | |
| | | |
| | | | | | | 4,290,912 | | | |
| | | | | | | | | | |
Commercial Services & Supplies - 0.1% | | | | | | | | | | |
Constellis Holdings LLC - Constellis Finance Corp.2, 9.75%, 5/15/2020 | | | 840,000 | | | | 760,200 | | | |
Modular Space Corp.2, 10.25%, 1/31/2019 | | | 620,000 | | | | 319,300 | | | |
| | | | | | | | | | |
| | | |
| | | | | | | 1,079,500 | | | |
| | | | | | | | | | |
Industrial Conglomerates - 0.2% | | | | | | | | | | |
General Electric Co.5, 1.013%, 5/5/2026 | | | 2,295,000 | | | | 2,116,945 | | | |
| | | | | | | | | | |
Machinery - 0.1% | | | | | | | | | | |
Case New Holland Industrial, Inc. (United Kingdom), 7.875%, 12/1/2017 | | | 780,000 | | | | 830,700 | | | |
Waterjet Holdings, Inc.2, 7.625%, 2/1/2020 | | | 590,000 | | | | 589,262 | | | |
| | | | | | | | | | |
| | | |
| | | | | | | 1,419,962 | | | |
| | | | | | | | | | |
Trading Companies & Distributors - 0.7% | | | | | | | | | | |
Air Lease Corp., 3.375%, 6/1/2021 | | | 1,645,000 | | | | 1,649,113 | | | |
Aircastle Ltd., 5.50%, 2/15/2022 | | | 555,000 | | | | 590,381 | | | |
Aviation Capital Group Corp.2, 3.875%, 9/27/2016 | | | 2,100,000 | | | | 2,113,230 | | | |
Aviation Capital Group Corp.2, 2.875%, 9/17/2018 | | | 2,450,000 | | | | 2,445,664 | | | |
Fly Leasing Ltd. (Ireland), 6.375%, 10/15/2021 | | | 1,125,000 | | | | 1,102,500 | | | |
International Lease Finance Corp., 5.75%, 5/15/2016 | | | 585,000 | | | | 585,369 | | | |
International Lease Finance Corp.5, 2.584%, 6/15/2016 | | | 560,000 | | | | 560,656 | | | |
International Lease Finance Corp., 6.25%, 5/15/2019 | | | 230,000 | | | | 249,550 | | | |
| | | | | | | | | | |
| | | |
| | | | | | | 9,296,463 | | | |
| | | | | | | | | | |
| | | |
Total Industrials | | | | | | | 19,728,886 | | | |
| | | | | | | | | | |
Information Technology - 0.5% | | | | | | | | | | |
Internet Software & Services - 0.0%## | | | | | | | | | | |
VeriSign, Inc., 5.25%, 4/1/2025 | | | 345,000 | | | | 354,487 | | | |
| | | | | | | | | | |
IT Services - 0.2% | | | | | | | | | | |
Automatic Data Processing, Inc., 2.25%, 9/15/2020 | | | 1,305,000 | | | | 1,346,844 | | | |
Visa, Inc., 2.80%, 12/14/2022 | | | 1,260,000 | | | | 1,314,297 | | | |
| | | | | | | | | | |
| | | |
| | | | | | | 2,661,141 | | | |
| | | | | | | | | | |
Semiconductors & Semiconductor Equipment - 0.1% | | | | | | | | | | |
Intel Corp., 2.45%, 7/29/2020 | | | 1,415,000 | | | | 1,463,264 | | | |
| | | | | | | | | | |
Technology Hardware, Storage & Peripherals - 0.2% | | | | | | | | | | |
Diebold, Inc.2, 8.50%, 4/15/2024 | | | 615,000 | | | | 622,687 | | | |
Hewlett Packard Enterprise Co.2, 2.45%, 10/5/2017 | | | 1,415,000 | | | | 1,430,830 | | | |
Western Digital Corp.2, 10.50%, 4/1/2024 | | | 620,000 | | | | 602,950 | | | |
| | | | | | | | | | |
| | | |
| | | | | | | 2,656,467 | | | |
| | | | | | | | | | |
| | | |
Total Information Technology | | | | | | | 7,135,359 | | | |
| | | | | | | | | | |
Materials - 0.8% | | | | | | | | | | |
Chemicals - 0.4% | | | | | | | | | | |
Consolidated Energy Finance S.A. (Trinidad-Tobago)2, 6.75%, 10/15/2019 | | | 835,000 | | | | 789,075 | | | |
The Dow Chemical Co., 8.55%, 5/15/2019 | | | 2,380,000 | | | | 2,842,120 | | | |
Solvay Finance America LLC (Belgium)2, 3.40%, 12/3/2020 | | | 1,450,000 | | | | 1,501,021 | | | |
| | | | | | | | | | |
| | | |
| | | | | | | 5,132,216 | | | |
| | | | | | | | | | |
Containers & Packaging - 0.1% | | | | | | | | | | |
Ardagh Packaging Finance plc - Ardagh Holdings USA, Inc. (Ireland)2,5, 3.634%, 12/15/2019 | | | 595,000 | | | | 600,876 | | | |
| | | | | | | | | | |
Metals & Mining - 0.2% | | | | | | | | | | |
Alcoa, Inc., 5.87%, 2/23/2022 | | | 865,000 | | | | 882,300 | | | |
Anglo American Capital plc (United Kingdom)2, 3.625%, 5/14/2020 | | | 325,000 | | | | 305,500 | | | |
ArcelorMittal (Luxembourg), 10.85%, 6/1/2019 | | | 260,000 | | | | 297,700 | | | |
BP Capital Markets plc (United Kingdom), 3.535%, 11/4/2024 | | | 500,000 | | | | 521,465 | | | |
FMG Resources August 2006 Pty Ltd. (Australia)2, 6.875%, 4/1/2022 | | | 185,000 | | | | 168,350 | | | |
SunCoke Energy Partners LP - SunCoke Energy Partners Finance Corp.2, 7.375%, 2/1/2020 | | | 880,000 | | | | 673,200 | | | |
| | | | | | | | | | |
| | | |
| | | | | | | 2,848,515 | | | |
| | | | | | | | | | |
Paper & Forest Products - 0.1% | | | | | | | | | | |
Domtar Corp., 4.40%, 4/1/2022 | | | 1,470,000 | | | | 1,508,543 | | | |
| | | | | | | | | | |
| | | |
Total Materials | | | | | | | 10,090,150 | | | |
| | | | | | | | | | |
Telecommunication Services - 0.9% | | | | | | | | | | |
Diversified Telecommunication Services - 0.5% | | | | | | | | | | |
AT&T, Inc., 5.20%, 3/15/2020 | | | 1,515,000 | | | | 1,687,336 | | | |
CenturyLink, Inc., 7.50%, 4/1/2024 | | | 1,200,000 | | | | 1,203,000 | | | |
The accompanying notes are an integral part of the financial statements.
60
Investment Portfolio - April 30, 2016
(unaudited)
| | | | | | | | | | |
| PRO-BLEND® EXTENDED TERM SERIES | | PRINCIPAL
AMOUNT4/
SHARES | | | VALUE
(NOTE 2) | | | |
| | | |
CORPORATE BONDS (continued) | | | | | | | | | | |
| | | |
Non-Convertible Corporate Bonds (continued) | | | | | | | | | | |
Telecommunication Services (continued) | | | | | | | | | | |
Diversified Telecommunication Services (continued) | | | | | | | | | | |
Embarq Corp., 7.082%, 6/1/2016 | | | 855,000 | | | $ | 858,957 | | | |
Frontier Communications Corp.2, 11.00%, 9/15/2025 | | | 1,470,000 | | | | 1,484,700 | | | |
Inmarsat Finance plc (United Kingdom)2, 4.875%, 5/15/2022 | | | 1,285,000 | | | | 1,220,750 | | | |
Numericable-SFR S.A. (France)2, 6.25%, 5/15/2024 | | | 195,000 | | | | 188,662 | | | |
Numericable-SFR S.A. (France)2, 7.375%, 5/1/2026 | | | 230,000 | | | | 233,450 | | | |
| | | | | | | | | | |
| | | | | | | 6,876,855 | | | |
| | | | | | | | | | |
Wireless Telecommunication Services - 0.4% | | | | | | | | | | |
Altice Financing S.A. (Luxembourg)2, 6.625%, 2/15/2023 | | | 2,160,000 | | | | 2,135,808 | | | |
Sixsigma Networks Mexico S.A. de C.V. (Mexico)2, 8.25%, 11/7/2021 | | | 880,000 | | | | 844,800 | | | |
T-Mobile USA, Inc., 6.836%, 4/28/2023 | | | 700,000 | | | | 746,375 | | | |
Wind Acquisition Finance S.A. (Italy)2, 4.75%, 7/15/2020 | | | 790,000 | | | | 754,055 | | | |
| | | | | | | | | | |
| | | | | | | 4,481,038 | | | |
| | | | | | | | | | |
| | | |
Total Telecommunication Services | | | | | | | 11,357,893 | | | |
| | | | | | | | | | |
Utilities - 0.3% | | | | | | | | | | |
Independent Power and Renewable Electricity Producers - 0.3% | | | | | | | | | | |
Abengoa Yield plc (Spain)2, 7.00%, 11/15/2019 | | | 1,165,000 | | | | 1,106,750 | | | |
ContourGlobal Power Holdings S.A. (France)2, 7.125%, 6/1/2019 | | | 580,000 | | | | 574,200 | | | |
NRG Energy, Inc., 6.25%, 7/15/2022 | | | 625,000 | | | | 612,700 | | | |
Talen Energy Supply LLC2, 4.625%, 7/15/2019 | | | 1,185,000 | | | | 1,102,050 | | | |
TerraForm Power Operating LLC2, 6.125%, 6/15/2025 | | | 1,100,000 | | | | 946,000 | | | |
| | | | | | | | | | |
| | | |
Total Utilities | | | | | | | 4,341,700 | | | |
| | | | | | | | | | |
TOTAL CORPORATE BONDS | | | | | | | | | | |
(Identified Cost $171,925,639) | | | | | | | 169,586,515 | | | |
| | | | | | | | | | |
| | | |
MUTUAL FUND - 0.0%## | | | | | | | | | | |
iShares MSCI India ETF (Identified Cost $243,704) | | | 8,840 | | | | 239,211 | | | |
| | | | | | | | | | |
| | | |
U.S. TREASURY SECURITIES - 5.4% | | | | | | | | | | |
| | | |
U.S. Treasury Bonds - 1.0% | | | | | | | | | | |
U.S. Treasury Inflation Indexed Bond, 0.75%, 2/15/2042 (Identified Cost $11,988,537) | | | 13,116,875 | | | | 12,778,709 | | | |
| | | | | | | | | | |
U.S. Treasury Notes - 4.4% | | | | | | | | | | |
U.S. Treasury Inflation Indexed Note, 0.125%, 4/15/2017 | | | 12,175,055 | | | | 12,288,088 | | | |
U.S. Treasury Inflation Indexed Note, 0.125%, 4/15/2020 | | | 12,257,244 | | | | 12,515,479 | | | |
U.S. Treasury Inflation Indexed Note, 0.125%, 1/15/2023 | | | 12,567,787 | | | | 12,701,320 | | | |
U.S. Treasury Note, 1.375%, 4/30/2020 | | | 20,000,000 | | | | 20,171,100 | | | |
| | | | | | | | | | |
Total U.S. Treasury Notes | | | | | | | | | | |
(Identified Cost $56,487,994) | | | | | | | 57,675,987 | | | |
| | | | | | | | | | |
TOTAL U.S. TREASURY SECURITIES | | | | | | | | | | |
(Identified Cost $68,476,531) | | | | | | | 70,454,696 | | | |
| | | | | | | | | | |
| | | |
ASSET-BACKED SECURITIES - 0.9% | | | | | | | | | | |
| | | |
Cazenovia Creek Funding I LLC, Series 2015-1A, Class A2, 2.00%, 12/10/2023 | | | 1,214,091 | | | | 1,203,467 | | | |
Enterprise Fleet Financing LLC, Series 2014-2, Class A22, 1.05%, 3/20/2020 | | | 827,159 | | | | 824,279 | | | |
Enterprise Fleet Financing LLC, Series 2015-2, Class A22, 1.59%, 2/22/2021 | | | 2,716,255 | | | | 2,716,785 | | | |
FDIC Trust, Series 2011-R1, Class A2, 2.672%, 7/25/2026 | | | 606,591 | | | | 617,824 | | | |
FNA Trust, Series 2014-1A, Class A2, 1.296%, 12/10/2022 | | | 816,354 | | | | 808,445 | | | |
Home Partners of America Trust, Series 2016-1, Class A2,5, 2.086%, 3/17/2033 | | | 870,742 | | | | 867,949 | | | |
Invitation Homes Trust, Series 2015-SFR3, Class A2,5, 1.736%, 8/17/2032 | | | 1,579,073 | | | | 1,583,142 | | | |
NextGear Floorplan Master Owner Trust, Series 2014-1A, Class A2, 1.92%, 10/15/2019 | | | 1,200,000 | | | | 1,193,096 | | | |
SpringCastle America Funding LLC, Series 2014-AA, Class A2, 2.70%, 5/25/2023 | | | 859,980 | | | | 861,980 | | | |
The accompanying notes are an integral part of the financial statements.
61
Investment Portfolio - April 30, 2016
(unaudited)
| | | | | | | | | | |
| PRO-BLEND® EXTENDED TERM SERIES | | PRINCIPAL
AMOUNT 4 | | | VALUE
(NOTE 2) | | | |
| | | |
ASSET-BACKED SECURITIES (continued) | | | | | | | | | | |
| | | |
Starwood Retail Property Trust, Series 2014-STAR, Class A2,5, 1.653%, 11/15/2027 | | | 1,500,000 | | | $ | 1,483,949 | | | |
| | | | | | | | | | |
TOTAL ASSET-BACKED SECURITIES | | | | | | | | | | |
(Identified Cost $12,174,686) | | | | | | | 12,160,916 | | | |
| | | | | | | | | | |
| | | |
COMMERCIAL MORTGAGE-BACKED SECURITIES - 5.4% | | | | | | | | | | |
Americold LLC Trust, Series 2010-ARTA, Class A12, 3.847%, 1/14/2029 | | | 169,043 | | | | 175,562 | | | |
Banc of America Commercial Mortgage Trust, Series 2006-4, Class A4, 5.634%, 7/10/2046 | | | 185,080 | | | | 185,095 | | | |
Bear Stearns Commercial Mortgage Securities Trust, Series 2006-PW13, Class A4, 5.54%, 9/11/2041 | | | 385,833 | | | | 386,656 | | | |
Bear Stearns Commercial Mortgage Securities Trust, Series 2006-T24, Class AM5, 5.568%, 10/12/2041 | | | 1,180,000 | | | | 1,191,941 | | | |
BWAY Mortgage Trust, Series 2015-1740, Class A2, 2.917%, 1/13/2035 | | | 3,300,000 | | | | 3,300,228 | | | |
Commercial Mortgage Pass-Through Certificates, Series 2015-LC19, Class A4, 3.183%, 2/10/2048 | | | 3,500,000 | | | | 3,647,937 | | | |
Credit Suisse Mortgage Capital Trust, Series 2013-IVR3, Class A12,5, 2.50%, 5/25/2043 | | | 1,127,948 | | | | 1,106,138 | | | |
Credit Suisse Mortgage Capital Trust, Series 2013-TH1, Class A12,5, 2.13%, 2/25/2043 | | | 906,499 | | | | 876,960 | | | |
DB-UBS Mortgage Trust, Series 2011-LC1A, Class A12, 3.742%, 11/10/2046 | | | 6,628 | | | | 6,668 | | | |
Extended Stay America Trust, Series 2013-ESH7, Class A272, 2.958%, 12/5/2031 | | | 1,115,160 | | | | 1,119,127 | | | |
Fannie Mae Multifamily REMIC Trust, Series 2012-M13, Class ASQ2, 1.246%, 8/25/2017 | | | 730,653 | | | | 730,001 | | | |
Freddie Mac Multifamily Structured Pass-Through Certificates, Series K009,
Class X1 (IO)5, 1.43%, 8/25/2020 | | | 9,353,262 | | | | 435,654 | | | |
Freddie Mac Multifamily Structured Pass-Through Certificates, Series K014,
Class X1 (IO)5, 1.212%, 4/25/2021 | | | 9,798,658 | | | | 505,729 | | | |
Freddie Mac Multifamily Structured Pass-Through Certificates, Series K016,
Class X1 (IO)5, 1.548%, 10/25/2021 | | | 4,215,431 | | | | 288,342 | | | |
Freddie Mac Multifamily Structured Pass-Through Certificates, Series K017,
Class X1 (IO)5, 1.411%, 12/25/2021 | | | 24,436,605 | | | | 1,533,527 | | | |
Freddie Mac Multifamily Structured Pass-Through Certificates, Series K021,
Class X1 (IO)5, 1.488%, 6/25/2022 | | | 11,571,050 | | | | 847,186 | | | |
Freddie Mac Multifamily Structured Pass-Through Certificates, Series K030,
Class X1 (IO)5, 0.22%, 4/25/2023 | | | 46,471,054 | | | | 593,524 | | | |
Freddie Mac Multifamily Structured Pass-Through Certificates, Series K032,
Class X1 (IO)5, 0.119%, 5/25/2023 | | | 29,985,701 | | | | 226,788 | | | |
Freddie Mac Multifamily Structured Pass-Through Certificates, Series K706,
Class X1 (IO)5, 1.563%, 10/25/2018 | | | 5,866,371 | | | | 195,390 | | | |
Freddie Mac Multifamily Structured Pass-Through Certificates, Series K-P01,
Class A2, 1.72%, 1/25/2019 | | | 1,325,000 | | | | 1,324,854 | | | |
FREMF Mortgage Trust, Series 2011-K701, Class B2,5, 4.436%, 7/25/2048 | | | 550,000 | | | | 563,558 | | | |
FREMF Mortgage Trust, Series 2011-K702, Class B2,5, 4.931%, 4/25/2044 | | | 675,000 | | | | 701,704 | | | |
FREMF Mortgage Trust, Series 2013-K28, Class X2A (IO)2, 0.10%, 6/25/2046 | | | 83,266,326 | | | | 455,100 | | | |
FREMF Mortgage Trust, Series 2013-K712, Class B2,5, 3.484%, 5/25/2045 | | | 1,050,000 | | | | 1,066,183 | | | |
FREMF Mortgage Trust, Series 2014-K41, Class B2,5, 3.961%, 11/25/2047 | | | 1,800,000 | | | | 1,718,723 | | | |
FREMF Mortgage Trust, Series 2014-K715, Class B2,5, 4.122%, 2/25/2046 | | | 1,750,000 | | | | 1,813,628 | | | |
FREMF Mortgage Trust, Series 2014-K716, Class B2,5, 4.085%, 8/25/2047 | | | 1,900,000 | | | | 1,962,432 | | | |
GAHR Commercial Mortgage Trust, Series 2015-NRF, Class BFX2,5, 3.382%, 12/15/2019 | | | 2,100,000 | | | | 2,140,211 | | | |
The accompanying notes are an integral part of the financial statements.
62
Investment Portfolio - April 30, 2016
(unaudited)
| | | | | | | | | | |
| PRO-BLEND® EXTENDED TERM SERIES | | PRINCIPAL AMOUNT 4 | | | VALUE (NOTE 2) | | | |
| | | |
COMMERCIAL MORTGAGE-BACKED SECURITIES (continued) | | | | | | | | | | |
| | | |
GCCFC Commercial Mortgage Trust, Series 2006-GG7, Class A45, 5.921%, 7/10/2038 | | | 37,959 | | | $ | 37,950 | | | |
GS Mortgage Securities Trust, Series 2010-C2, Class A12, 3.849%, 12/10/2043 | | | 98,792 | | | | 102,461 | | | |
GS Mortgage Securities Trust, Series 2013-GC16, Class A4, 4.271%, 11/10/2046 | | | 3,000,000 | | | | 3,350,853 | | | |
JP Morgan Chase Commercial Mortgage Securities Trust, Series 2006-LDP7, Class A45, 5.981%, 4/17/2045 | | | 197,438 | | | | 197,237 | | | |
JP Morgan Chase Commercial Mortgage Securities Trust, Series 2006-LDP9, Class A3, 5.336%, 5/15/2047 | | | 3,581,502 | | | | 3,635,560 | | | |
JP Morgan Mortgage Trust, Series 2013-1, Class 1A22,5, 3.00%, 3/25/2043 | | | 697,744 | | | | 697,894 | | | |
JP Morgan Mortgage Trust, Series 2013-2, Class A22,5, 3.50%, 5/25/2043 | | | 822,343 | | | | 834,241 | | | |
JP Morgan Mortgage Trust, Series 2014-2, Class 1A12,5, 3.00%, 6/25/2029 | | | 1,256,696 | | | | 1,287,524 | | | |
LB-UBS Commercial Mortgage Trust, Series 2006-C7, Class A3, 5.347%, 11/15/2038 | | | 1,842,247 | | | | 1,855,935 | | | |
LSTAR Commercial Mortgage Trust, Series 2014-2, Class A22, 2.767%, 1/20/2041 | | | 1,212,879 | | | | 1,218,087 | | | |
Morgan Stanley Capital I Trust, Series 2006-T23, Class A45, 5.959%, 8/12/2041 | | | 614,693 | | | | 615,070 | | | |
Motel 6 Trust, Series 2015-MTL6, Class B2, 3.298%, 2/5/2030 | | | 1,220,000 | | | | 1,226,440 | | | |
New Residential Mortgage Loan Trust, Series 2014-3A, Class AFX32,5, 3.75%, 11/25/2054 | | | 1,155,800 | | | | 1,189,805 | | | |
New Residential Mortgage Loan Trust, Series 2015-2A, Class A15, 3.75%, 8/25/2055 | | | 1,538,107 | | | | 1,584,644 | | | |
OBP Depositor LLC Trust, Series 2010-OBP, Class A2, 4.646%, 7/15/2045 | | | 115,000 | | | | 126,391 | | | |
SBA Small Business Investment Companies, Series 2015-10A, Class 1, 2.517%, 3/10/2025 | | | 970,831 | | | | 992,460 | | | |
SBA Small Business Investment Companies, Series 2015-10B, Class 1, 2.829%, 9/10/2025 | | | 3,948,372 | | | | 4,046,391 | | | |
SCG Trust, Series 2013-SRP1, Class AJ2,5, 2.383%, 11/15/2026 | | | 2,600,000 | | | | 2,593,933 | | | |
Sequoia Mortgage Trust, Series 2013-2, Class A5, 1.874%, 2/25/2043 | | | 873,759 | | | | 826,723 | | | |
Sequoia Mortgage Trust, Series 2013-7, Class A25, 3.00%, 6/25/2043 | | | 680,061 | | | | 680,100 | | | |
Sequoia Mortgage Trust, Series 2013-8, Class A15, 3.00%, 6/25/2043 | | | 932,080 | | | | 928,369 | | | |
Vornado DP LLC Trust, Series 2010-VNO, Class A2FX2, 4.004%, 9/13/2028 | | | 350,000 | | | | 372,111 | | | |
Wachovia Bank Commercial Mortgage Trust, Series 2006-C26, Class A35, 6.011%, 6/15/2045 | | | 280,750 | | | | 280,376 | | | |
Wells Fargo Commercial Mortgage Trust, Series 2010-C1, Class A22, 4.393%, 11/15/2043 | | | 600,000 | | | | 653,320 | | | |
Wells Fargo Commercial Mortgage Trust, Series 2014-LC18, Class A5, 3.405%, 12/15/2047 | | | 2,700,000 | | | | 2,848,403 | | | |
Wells Fargo Commercial Mortgage Trust, Series 2015-C26, Class A4, 3.166%, 2/15/2048 | | | 3,100,000 | | | | 3,198,496 | | | |
Wells Fargo Commercial Mortgage Trust, Series 2015-C30, Class A4, 3.664%, 9/15/2058 | | | 1,500,000 | | | | 1,600,775 | | | |
WF-RBS Commercial Mortgage Trust, Series 2013-C11, Class A2, 2.029%, 3/15/2045 | | | 1,465,000 | | | | 1,474,472 | | | |
WinWater Mortgage Loan Trust, Series 2015-1, Class A12,5, 3.50%, 1/20/2045 | | | 1,248,945 | | | | 1,278,957 | | | |
WinWater Mortgage Loan Trust, Series 2015-3, Class A52,5, 3.50%, 3/20/2045 | | | 1,373,776 | | | | 1,406,769 | | | |
| | | | | | | | | | |
| | | |
TOTAL COMMERCIAL MORTGAGE-BACKED SECURITIES | | | | | | | | | | |
(Identified Cost $70,052,995) | | | | | | | 70,240,593 | | | |
| | | | | | | | | | |
| | | |
FOREIGN GOVERNMENT BONDS - 1.8% | | | | | | | | | | |
Bonos de la Tesoreria de la Republica en pesos (Chile), 6.00%, 1/1/2018 | | CLP | 805,000,000 | | | | 1,259,609 | | | |
Brazilian Government International Bond (Brazil), 8.875%, 10/14/2019 | | | 700,000 | | | | 840,000 | | | |
Bundesrepublik Deutschland (Germany), 1.50%, 9/4/2022 | | EUR | 200,000 | | | | 253,397 | | | |
Bundesrepublik Deutschland (Germany), 1.00%, 8/15/2024 | | EUR | 200,000 | | | | 246,510 | | | |
Canada Housing Trust No. 1 (Canada)2, 4.10%, 12/15/2018 | | CAD | 385,000 | | | | 331,627 | | | |
The accompanying notes are an integral part of the financial statements.
63
Investment Portfolio - April 30, 2016
(unaudited)
| | | | | | | | | | |
| PRO-BLEND® EXTENDED TERM SERIES | | PRINCIPAL
AMOUNT4 | | | VALUE
(NOTE 2) | | | |
| | | |
FOREIGN GOVERNMENT BONDS (continued) | | | | | | | | | | |
| | | |
Canadian Government Bond (Canada), 1.50%, 9/1/2017 | | CAD | 160,000 | | | $ | 128,914 | | | |
Canadian Government Bond (Canada), 2.75%, 6/1/2022 | | CAD | 460,000 | | | | 403,449 | | | |
Export-Import Bank of Korea (South Korea), 2.625%, 12/30/2020 | | | 6,425,000 | | | | 6,566,215 | | | |
Ireland Government Bond (Ireland), 5.00%, 10/18/2020 | | EUR | 295,000 | | | | 412,520 | | | |
Ireland Government Bond (Ireland), 0.80%, 3/15/2022 | | EUR | 200,000 | | | | 236,248 | | | |
Ireland Government Bond (Ireland), 3.90%, 3/20/2023 | | EUR | 50,000 | | | | 70,450 | | | |
Italy Buoni Poliennali Del Tesoro (Italy), 5.50%, 9/1/2022 | | EUR | 625,000 | | | | 920,945 | | | |
Italy Buoni Poliennali Del Tesoro (Italy), 1.45%, 9/15/2022 | | EUR | 75,000 | | | | 89,061 | | | |
Italy Buoni Poliennali Del Tesoro (Italy), 5.50%, 11/1/2022 | | EUR | 760,000 | | | | 1,123,177 | | | |
Italy Buoni Poliennali Del Tesoro (Italy), 1.50%, 6/1/2025 | | EUR | 200,000 | | | | 230,931 | | | |
Japan Government Five Year Bond (Japan), 0.30%, 12/20/2016 | | JPY | 100,300,000 | | | | 945,478 | | | |
Korea Treasury Bond (South Korea), 2.75%, 6/10/2016 | | KRW | 460,000,000 | | | | 404,297 | | | |
Korea Treasury Bond (South Korea), 2.00%, 12/10/2017 | | KRW | 470,000,000 | | | | 415,993 | | | |
Malaysia Government Bond (Malaysia), 4.262%, 9/15/2016 | | MYR | 3,275,000 | | | | 844,095 | | | |
Mexican Government Bond (Mexico), 7.25%, 12/15/2016 | | MXN | 5,945,000 | | | | 352,568 | | | |
Mexican Government Bond (Mexico), 5.00%, 6/15/2017 | | MXN | 9,500,000 | | | | 557,965 | | | |
Mexican Government Bond (Mexico), 8.00%, 6/11/2020 | | MXN | 9,400,000 | | | | 605,111 | | | |
Mexican Government Bond (Mexico), 6.50%, 6/10/2021 | | MXN | 4,000,000 | | | | 245,180 | | | |
Mexican Government Bond (Mexico), 6.50%, 6/9/2022 | | MXN | 6,500,000 | | | | 397,566 | | | |
Mexican Government Bond (Mexico), 7.75%, 5/29/2031 | | MXN | 1,250,000 | | | | 82,812 | | | |
Norway Government Bond (Norway)2, 4.25%, 5/19/2017 | | NOK | 1,600,000 | | | | 206,283 | | | |
Singapore Government Bond (Singapore), 2.50%, 6/1/2019 | | SGD | 845,000 | | | | 653,519 | | | |
Spain Government Bond (Spain), 4.50%, 1/31/2018 | | EUR | 325,000 | | | | 401,724 | | | |
Spain Government Bond (Spain)2, 4.00%, 4/30/2020 | | EUR | 510,000 | | | | 669,123 | | | |
Spain Government Bond (Spain)2, 5.40%, 1/31/2023 | | EUR | 755,000 | | | | 1,118,080 | | | |
Spain Government Bond (Spain)2, 1.60%, 4/30/2025 | | EUR | 400,000 | | | | 463,771 | | | |
United Kingdom Gilt (United Kingdom), 1.00%, 9/7/2017 | | GBP | 375,000 | | | | 551,705 | | | |
United Kingdom Gilt (United Kingdom), 5.00%, 3/7/2018 | | GBP | 475,000 | | | | 753,189 | | | |
| | | | | | | | | | |
| | | |
TOTAL FOREIGN GOVERNMENT BONDS | | | | | | | | | | |
(Identified Cost $23,911,847) | | | | | | | 22,781,512 | | | |
| | | | | | | | | | |
| | | |
U.S. GOVERNMENT AGENCIES - 7.4% | | | | | | | | | | |
| | | |
Mortgage-Backed Securities - 7.4% | | | | | | | | | | |
Fannie Mae, Pool #888468, 5.50%, 9/1/2021 | | | 488,863 | | | | 526,068 | | | |
Fannie Mae, Pool #995233, 5.50%, 10/1/2021 | | | 33,786 | | | | 35,982 | | | |
Fannie Mae, Pool #888017, 6.00%, 11/1/2021 | | | 48,027 | | | | 52,177 | | | |
Fannie Mae, Pool #995329, 5.50%, 12/1/2021 | | | 332,791 | | | | 357,355 | | | |
Fannie Mae, Pool #888136, 6.00%, 12/1/2021 | | | 59,734 | | | | 64,940 | | | |
Fannie Mae, Pool #888810, 5.50%, 11/1/2022 | | | 585,579 | | | | 629,538 | | | |
Fannie Mae, Pool #990895, 5.50%, 10/1/2023 | | | 48,016 | | | | 52,000 | | | |
Fannie Mae, Pool #AD0462, 5.50%, 10/1/2024 | | | 37,612 | | | | 41,145 | | | |
Fannie Mae, Pool #MA1834, 4.50%, 2/1/2034 | | | 1,493,479 | | | | 1,636,095 | | | |
Fannie Mae, Pool #MA1890, 4.00%, 5/1/2034 | | | 1,325,072 | | | | 1,428,914 | | | |
Fannie Mae, Pool #MA1903, 4.50%, 5/1/2034 | | | 681,862 | | | | 746,816 | | | |
Fannie Mae, Pool #AS3677, 4.00%, 10/1/2034 | | | 1,348,599 | | | | 1,453,217 | | | |
Fannie Mae, Pool #MA2177, 4.00%, 2/1/2035 | | | 1,721,932 | | | | 1,856,142 | | | |
Fannie Mae, Pool #MA2198, 3.50%, 3/1/2035 | | | 3,543,902 | | | | 3,740,743 | | | |
Fannie Mae, Pool #888021, 6.00%, 12/1/2036 | | | 82,416 | | | | 94,108 | | | |
Fannie Mae, Pool #909786, 5.50%, 3/1/2037 | | | 211,922 | | | | 237,871 | | | |
Fannie Mae, Pool #995050, 6.00%, 9/1/2037 | | | 242,384 | | | | 276,783 | | | |
Fannie Mae, Pool #AB8161, 6.00%, 12/1/2037 | | | 855,505 | | | | 977,056 | | | |
Fannie Mae, Pool #933731, 5.50%, 4/1/2038 | | | 754,921 | | | | 846,895 | | | |
Fannie Mae, Pool #889576, 6.00%, 4/1/2038 | | | 522,431 | | | | 596,592 | | | |
The accompanying notes are an integral part of the financial statements.
64
Investment Portfolio - April 30, 2016
(unaudited)
| | | | | | | | | | |
| PRO-BLEND® EXTENDED TERM SERIES | | PRINCIPAL
AMOUNT 4 | | | VALUE
(NOTE 2) | | | |
| | | |
U.S. GOVERNMENT AGENCIES (continued) | | | | | | | | | | |
| | | |
Mortgage-Backed Securities (continued) | | | | | | | | | | |
Fannie Mae, Pool #889624, 5.50%, 5/1/2038 | | | 991,095 | | | $ | 1,113,413 | | | |
Fannie Mae, Pool #889579, 6.00%, 5/1/2038 | | | 462,601 | | | | 527,643 | | | |
Fannie Mae, Pool #995196, 6.00%, 7/1/2038 | | | 26,933 | | | | 30,753 | | | |
Fannie Mae, Pool #AD0119, 6.00%, 7/1/2038 | | | 325,747 | | | | 371,407 | | | |
Fannie Mae, Pool #AD0207, 6.00%, 10/1/2038 | | | 1,553,152 | | | | 1,769,771 | | | |
Fannie Mae, Pool #AD0220, 6.00%, 10/1/2038 | | | 44,373 | | | | 50,659 | | | |
Fannie Mae, Pool #890294, 5.50%, 1/1/2039 | | | 1,760,733 | | | | 1,976,070 | | | |
Fannie Mae, Pool #AD0307, 5.50%, 1/1/2039 | | | 991,732 | | | | 1,114,980 | | | |
Fannie Mae, Pool #AD0527, 5.50%, 6/1/2039 | | | 157,609 | | | | 177,188 | | | |
Fannie Mae, Pool #MA0258, 4.50%, 12/1/2039 | | | 1,197,933 | | | | 1,306,743 | | | |
Fannie Mae, Pool #890326, 5.50%, 1/1/2040 | | | 1,390,642 | | | | 1,563,664 | | | |
Fannie Mae, Pool #AL1595, 6.00%, 1/1/2040 | | | 810,466 | | | | 925,642 | | | |
Fannie Mae, Pool #AE0061, 6.00%, 2/1/2040 | | | 886,580 | | | | 1,011,867 | | | |
Fannie Mae, Pool #AL0152, 6.00%, 6/1/2040 | | | 1,088,983 | | | | 1,242,660 | | | |
Fannie Mae, Pool #AL2581, 6.00%, 6/1/2040 | | | 695,006 | | | | 793,561 | | | |
Fannie Mae, Pool #890519, 6.00%, 10/1/2040 | | | 1,617,096 | | | | 1,845,138 | | | |
Fannie Mae, Pool #AE0951, 4.50%, 2/1/2041 | | | 740,877 | | | | 808,437 | | | |
Fannie Mae, Pool #AH9054, 4.50%, 4/1/2041 | | | 318,247 | | | | 347,167 | | | |
Fannie Mae, Pool #AI2468, 4.50%, 5/1/2041 | | | 249,129 | | | | 271,851 | | | |
Fannie Mae, Pool #AL0160, 4.50%, 5/1/2041 | | | 752,794 | | | | 821,445 | | | |
Fannie Mae, Pool #AI5172, 4.00%, 8/1/2041 | | | 1,229,198 | | | | 1,317,185 | | | |
Fannie Mae, Pool #AJ1415, 4.50%, 9/1/2041 | | | 175,917 | | | | 191,918 | | | |
Fannie Mae, Pool #AL1410, 4.50%, 12/1/2041 | | | 3,073,024 | | | | 3,352,323 | | | |
Fannie Mae, Pool #AK4940, 3.50%, 3/1/2042 | | | 850,346 | | | | 892,750 | | | |
Fannie Mae, Pool #AL7729, 4.00%, 6/1/2043 | | | 1,549,883 | | | | 1,659,353 | | | |
Fannie Mae, Pool #AL7767, 4.50%, 6/1/2044 | | | 3,099,584 | | | | 3,377,454 | | | |
Fannie Mae, Pool #AL6294, 4.50%, 11/1/2044 | | | 2,990,863 | | | | 3,263,215 | | | |
Fannie Mae, Pool #AX5234, 4.50%, 11/1/2044 | | | 2,366,501 | | | | 2,579,798 | | | |
Fannie Mae, Pool #AS4103, 4.50%, 12/1/2044 | | | 1,634,415 | | | | 1,792,730 | | | |
Fannie Mae, Pool #AZ3627, 4.00%, 11/1/2045 | | | 660,082 | | | | 705,529 | | | |
Fannie Mae, Pool #BA3890, 4.00%, 11/1/2045 | | | 909,062 | | | | 972,002 | | | |
Fannie Mae, Pool #BA6762, 4.00%, 12/1/2045 | | | 855,235 | | | | 913,941 | | | |
Fannie Mae, Pool #BC3490, 3.50%, 2/1/2046 | | | 2,990,021 | | | | 3,134,421 | | | |
Freddie Mac, Pool #G11850, 5.50%, 7/1/2020 | | | 162,398 | | | | 171,159 | | | |
Freddie Mac, Pool #G12610, 6.00%, 3/1/2022 | | | 61,078 | | | | 66,880 | | | |
Freddie Mac, Pool #G12655, 6.00%, 5/1/2022 | | | 43,379 | | | | 47,513 | | | |
Freddie Mac, Pool #G12988, 6.00%, 1/1/2023 | | | 32,286 | | | | 35,244 | | | |
Freddie Mac, Pool #G13078, 6.00%, 3/1/2023 | | | 58,334 | | | | 63,671 | | | |
Freddie Mac, Pool #G13331, 5.50%, 10/1/2023 | | | 23,664 | | | | 25,763 | | | |
Freddie Mac, Pool #C91754, 4.50%, 3/1/2034 | | | 875,958 | | | | 959,621 | | | |
Freddie Mac, Pool #C91762, 4.50%, 5/1/2034 | | | 1,139,331 | | | | 1,248,152 | | | |
Freddie Mac, Pool #C91766, 4.50%, 5/1/2034 | | | 829,859 | | | | 913,693 | | | |
Freddie Mac, Pool #C91771, 4.50%, 6/1/2034 | | | 818,578 | | | | 901,272 | | | |
Freddie Mac, Pool #C91780, 4.50%, 7/1/2034 | | | 1,006,546 | | | | 1,102,694 | | | |
Freddie Mac, Pool #K92054, 4.00%, 10/1/2034 | | | 851,725 | | | | 918,626 | | | |
Freddie Mac, Pool #C91850, 4.00%, 9/1/2035 | | | 3,025,240 | | | | 3,256,040 | | | |
Freddie Mac, Pool #G03332, 6.00%, 10/1/2037 | | | 93,240 | | | | 106,211 | | | |
Freddie Mac, Pool #G03696, 5.50%, 1/1/2038 | | | 192,349 | | | | 215,783 | | | |
Freddie Mac, Pool #G03926, 6.00%, 2/1/2038 | | | 244,943 | | | | 278,773 | | | |
Freddie Mac, Pool #G04264, 5.50%, 4/1/2038 | | | 586,591 | | | | 659,285 | | | |
The accompanying notes are an integral part of the financial statements.
65
Investment Portfolio - April 30, 2016
(unaudited)
| | | | | | | | | | |
| PRO-BLEND® EXTENDED TERM SERIES | | PRINCIPAL
AMOUNT4/ SHARES/
CONTRACTS | | | VALUE (NOTE 2) | | | |
| | | |
U.S. GOVERNMENT AGENCIES (continued) | | | | | | | | | | |
| | | |
Mortgage-Backed Securities (continued) | | | | | | | | | | |
Freddie Mac, Pool #G04731, 5.50%, 4/1/2038 | | | 363,768 | | | $ | 407,804 | | | |
Freddie Mac, Pool #G08273, 5.50%, 6/1/2038 | | | 438,769 | | | | 492,920 | | | |
Freddie Mac, Pool #G04601, 5.50%, 7/1/2038 | | | 1,228,358 | | | | 1,380,664 | | | |
Freddie Mac, Pool #G05956, 5.50%, 7/1/2038 | | | 861,395 | | | | 966,629 | | | |
Freddie Mac, Pool #G04587, 5.50%, 8/1/2038 | | | 1,299,948 | | | | 1,458,093 | | | |
Freddie Mac, Pool #G05671, 5.50%, 8/1/2038 | | | 339,346 | | | | 380,502 | | | |
Freddie Mac, Pool #G06172, 5.50%, 12/1/2038 | | | 646,884 | | | | 726,863 | | | |
Freddie Mac, Pool #G05409, 5.50%, 3/1/2039 | | | 445,114 | | | | 499,869 | | | |
Freddie Mac, Pool #A86522, 4.50%, 5/1/2039 | | | 985,527 | | | | 1,075,196 | | | |
Freddie Mac, Pool #A89760, 4.50%, 12/1/2039 | | | 176,280 | | | | 192,177 | | | |
Freddie Mac, Pool #G06021, 5.50%, 1/1/2040 | | | 206,082 | | | | 231,670 | | | |
Freddie Mac, Pool #G05923, 5.50%, 2/1/2040 | | | 127,580 | | | | 143,348 | | | |
Freddie Mac, Pool #G05900, 6.00%, 3/1/2040 | | | 368,150 | | | | 418,504 | | | |
Freddie Mac, Pool #G05906, 6.00%, 4/1/2040 | | | 242,177 | | | | 276,037 | | | |
Freddie Mac, Pool #A92889, 4.50%, 7/1/2040 | | | 3,269,076 | | | | 3,570,488 | | | |
Freddie Mac, Pool #G07589, 5.50%, 6/1/2041 | | | 2,089,046 | | | | 2,343,799 | | | |
Freddie Mac, Pool #Q17719, 3.50%, 4/1/2043 | | | 1,201,487 | | | | 1,259,727 | | | |
Freddie Mac, Pool #Q28831, 4.50%, 10/1/2044 | | | 601,752 | | | | 654,530 | | | |
Freddie Mac, Pool #C09068, 3.50%, 11/1/2044 | | | 913,964 | | | | 958,184 | | | |
Freddie Mac, Pool #G08669, 4.00%, 9/1/2045 | | | 1,816,775 | | | | 1,939,883 | | | |
Freddie Mac, Pool #G08672, 4.00%, 10/1/2045 | | | 3,710,759 | | | | 3,966,896 | | | |
Freddie Mac, Pool #Q36985, 4.00%, 10/1/2045 | | | 1,462,727 | | | | 1,563,062 | | | |
Freddie Mac, Pool #Q37892, 4.00%, 12/1/2045 | | | 1,933,802 | | | | 2,068,771 | | | |
| | | | | | | | | | |
| | | |
TOTAL U.S. GOVERNMENT AGENCIES | | | | | | | | | | |
(Identified Cost $93,999,902) | | | | | | | 95,819,111 | | | |
| | | | | | | | | | |
| | | |
U.S. GOVERNMENT SECURITIES - 2.5% | | | | | | | | | | |
| | | |
U.S. Treasury Bills - 2.5% | | | | | | | | | | |
U.S. Treasury Bill11, 0.28%, 6/23/2016 | | | | | | | | | | |
(Identified Cost $32,186,551) | | | 32,200,000 | | | | 32,193,206 | | | |
| | | | | | | | | | |
| | | |
SHORT-TERM INVESTMENT - 3.8% | | | | | | | | | | |
| | | |
Dreyfus Cash Management, Inc. - Institutional Shares12, 0.29%, | | | | | | | | | | |
(Identified Cost $49,563,185) | | | 49,563,185 | | | | 49,563,185 | | | |
| | | | | | | | | | |
TOTAL INVESTMENTS - 95.4% | | | | | | | | | | |
(Identified Cost $1,206,361,957) | | | | | | | 1,241,798,500 | | | |
OTHER ASSETS, LESS LIABILITIES - 4.6% | | | | | | | 59,821,665 | | | |
| | | | | | | | | | |
NET ASSETS - 100% | | | | | | $ | 1,301,620,165 | | | |
| | | | | | | | | | |
| | | |
PUT OPTIONS WRITTEN - 0.0%## | | | | | | | | | | |
| | | |
Alphabet, Inc. - Class C, Strike $690, Expiring May 20, 2016, | | | 42 | | | $ | (50,526 | ) | | |
Apple, Inc., Strike $95, Expiring May 20,2016, | | | 306 | | | | (101,286 | ) | | |
| | | | | | | | | | |
| | | |
TOTAL PUT OPTIONS WRITTEN | | | | | | | | | | |
(Premiums Received $37,929) | | | | | | $ | (151,812 | ) | | |
| | | | | | | | | | |
ADR - American Depositary Receipt
AUD - Australian Dollar
CAD - Canadian Dollar
CLP - Chilean Peso
ETF - Exchange-traded fund
EUR - Euro
GBP - British Pound
IO - Interest only
JPY - Japanese Yen
KRW - South Korean Won
The accompanying notes are an integral part of the financial statements.
66
Investment Portfolio - April 30, 2016
(unaudited)
MXN - Mexican Peso
MYR - Malaysian Ringgit
No. - Number
NOK - Norwegian Krone
SGD - Singapore Dollar
##Less than 0.1%.
*Non-income producing security.
1A factor from a third party vendor was applied to determine the security’s fair value following the close of local trading.
2Restricted securities - Investment in securities that are restricted as to public resale under the Securities Act of 1933, as amended. These securities have been sold under Rule 144A and have been determined to be liquid. These securities amount to $112,966,343 or 8.7%, of the Series’ net assets as of April 30, 2016 (see Note 2 to the financial statements).
3A portion of this security is designated with the broker as collateral for options contracts written. As of April 30, 2016, the total value of such securities was $19,016,161.
4Amount is stated in USD unless otherwise noted.
5The coupon rate is floating and is the effective rate as of April 30, 2016.
6Security is perpetual in nature and has no stated maturity date.
7The rate shown is a fixed rate as of April 30, 2016; the rate becomes floating, based on U.S. Treasury Note (5 Year) plus a spread, in July 2016.
8The rate shown is a fixed rate as of April 30, 2016; the rate becomes floating, based on LIBOR plus a spread, in December 2024.
9The rate shown is a fixed rate as of April 30, 2016; the rate becomes floating, based on LIBOR plus a spread, in September 2022.
10Represents a Payment-In-Kind bond.
11Represents the annualized yield at time of purchase.
12Rate shown is the current yield as of April 30, 2016.
The Global Industry Classification Standard (GICS) was developed by and is the exclusive property and a service mark of MSCI Inc. (MSCI) and Standard & Poor’s, a division of The McGraw-Hill Companies, Inc. (S&P), and is licensed for use by Manning & Napier when referencing GICS sectors. Neither MSCI, S&P, nor any third party involved in making or compiling the GICS or any GICS classifications makes any express or implied warranties or representations with respect to such standard or classification, nor shall any such party have any liability therefrom.
The accompanying notes are an integral part of the financial statements.
67
Statement of Assets and Liabilities - Pro-Blend® Extended Term Series
April 30, 2016 (unaudited)
| | | | |
ASSETS: | | | | |
| |
Investments, at value (identified cost $1,206,361,957) (Note 2) | | $ | 1,241,798,500 | |
Foreign currency (identified cost $30,726) | | | 30,726 | |
Receivable for securities sold | | | 65,898,313 | |
Interest receivable | | | 3,586,802 | |
Foreign tax reclaims receivable | | | 594,449 | |
Dividends receivable | | | 560,703 | |
Receivable for fund shares sold | | | 277,405 | |
Prepaid and other expenses | | | 9,122 | |
| | | | |
| |
TOTAL ASSETS | | | 1,312,756,020 | |
| | | | |
| |
LIABILITIES: | | | | |
| |
Accrued management fees (Note 3) | | | 806,426 | |
Accrued distribution and service (Rule 12b-1) fees (Class C) (Class R) (Note 3) | | | 143,947 | |
Accrued shareholder services fees (Class S) (Note 3) | | | 116,199 | |
Accrued fund accounting and administration fees (Note 3) | | | 78,156 | |
Accrued transfer agent fees (Note 3) | | | 77,070 | |
Accrued Chief Compliance Officer service fees (Note 3) | | | 381 | |
Options written, at value (premiums received $37,929) (Note 2) | | | 151,812 | |
Accrued foreign capital gains tax (Note 2) | | | 631 | |
Payable for fund shares repurchased | | | 9,446,301 | |
Payable for securities purchased | | | 129,397 | |
Other payables and accrued expenses | | | 185,535 | |
| | | | |
| |
TOTAL LIABILITIES | | | 11,135,855 | |
| | | | |
| |
TOTAL NET ASSETS | | $ | 1,301,620,165 | |
| | | | |
| |
NET ASSETS CONSIST OF: | | | | |
| |
Capital stock | | $ | 1,126,783 | |
Additional paid-in-capital | | | 1,265,263,903 | |
Undistributed net investment income | | | 3,792,730 | |
Accumulated net realized loss on investments, foreign currency and translation of other assets and liabilities | | | (3,862,091 | ) |
Net unrealized appreciation on investments (net of foreign capital gains tax of $631), foreign currency and translation of other assets and liabilities | | | 35,298,840 | |
| | | | |
| |
TOTAL NET ASSETS | | $ | 1,301,620,165 | |
| | | | |
The accompanying notes are an integral part of the financial statements.
68
Statement of Assets and Liabilities - Pro-Blend® Extended Term Series
April 30, 2016 (unaudited)
| | | | |
| |
NET ASSET VALUE, OFFERING PRICE AND REDEMPTION PRICE PER SHARE - Class S
($564,550,619/ 34,899,643 shares) | | $ | 16.18 | |
| | | | |
| |
NET ASSET VALUE, OFFERING PRICE AND REDEMPTION PRICE PER SHARE - Class I
($550,153,844/ 59,179,874 shares) | | $ | 9.30 | |
| | | | |
| |
NET ASSET VALUE, OFFERING PRICE AND REDEMPTION PRICE PER SHARE - Class C
($155,612,452/ 15,646,796 shares) | | $ | 9.95 | |
| | | | |
| |
NET ASSET VALUE, OFFERING PRICE AND REDEMPTION PRICE PER SHARE - Class R
($31,303,250/ 2,951,961 shares) | | $ | 10.60 | |
| | | | |
The accompanying notes are an integral part of the financial statements.
69
Statement of Operations - Pro-Blend® Extended Term Series
For the Six Months Ended April 30, 2016 (unaudited)
| | | | |
INVESTMENT INCOME: | | | | |
| |
Interest | | $ | 8,245,829 | |
Dividends (net of foreign taxes withheld, $185,282) | | | 4,721,330 | |
| | | | |
| |
Total Investment Income | | | 12,967,159 | |
| | | | |
| |
EXPENSES: | | | | |
| |
Management fees (Note 3) | | | 5,001,480 | |
Distribution and service (Rule 12b-1) fees (Class C) (Note 3) | | | 781,151 | |
Shareholder services fees (Class S) (Note 3) | | | 763,443 | |
Fund accounting and administration fees (Note 3) | | | 125,592 | |
Transfer agent fees (Note 3) | | | 117,489 | |
Distribution and service (Rule 12b-1) fees (Class R) (Note 3) | | | 94,153 | |
Directors’ fees (Note 3) | | | 27,161 | |
Chief Compliance Officer service fees (Note 3) | | | 1,258 | |
Custodian fees | | | 65,143 | |
Miscellaneous | | | 165,201 | |
| | | | |
| |
Total Expenses | | | 7,142,071 | |
| | | | |
| |
NET INVESTMENT INCOME | | | 5,825,088 | |
| | | | |
| |
REALIZED AND UNREALIZED GAIN (LOSS) ON INVESTMENTS AND FOREIGN CURRENCY: | | | | |
| |
Net realized gain (loss) on- | | | | |
Investments | | | 4,225,271 | |
Futures contracts | | | (6,570,099 | ) |
Options Written | | | 148,088 | |
Foreign currency and translation of other assets and liabilities | | | (1,515,108 | ) |
| | | | |
| |
| | | (3,711,848 | ) |
| | | | |
Net change in unrealized appreciation (depreciation) on- | | | | |
Investments (net of decrease in accrued foreign capital gains tax of $135) | | | (3,913,420 | ) |
Futures contracts | | | 838,256 | |
Options Written | | | (113,883 | ) |
Foreign currency and translation of other assets and liabilities | | | 31,885 | |
| | | | |
| |
| | | (3,157,162 | ) |
| | | | |
| |
NET REALIZED AND UNREALIZED GAIN (LOSS) ON INVESTMENTS AND FOREIGN CURRENCY | | | (6,869,010 | ) |
| | | | |
| |
NET DECREASE IN NET ASSETS RESULTING FROM OPERATIONS | | $ | (1,043,922 | ) |
| | | | |
The accompanying notes are an integral part of the financial statements.
70
Statements of Changes in Net Assets - Pro-Blend® Extended Term Series
| | | | | | | | |
| | | FOR THE SIX
MONTHS ENDED 4/30/16 (UNAUDITED) | | | FOR THE YEAR ENDED 10/31/15 | |
DECREASE IN NET ASSETS: | | | | | | | | |
| | |
OPERATIONS: | | | | | | | | |
| | |
Net investment income | | $ | 5,825,088 | | | $ | 15,880,780 | |
Net realized gain (loss) on investments and foreign currency | | | (3,711,848 | ) | | | 25,447,039 | |
Net change in unrealized appreciation (depreciation) on investments and foreign currency | | | (3,157,162 | ) | | | (74,601,726 | ) |
| | | | | | | | |
| | |
Net decrease from operations | | | (1,043,922 | ) | | | (33,273,907 | ) |
| | | | | | | | |
| | |
DISTRIBUTIONS TO SHAREHOLDERS (Note 8): | | | | | | | | |
| | |
From net investment income (Class S) | | | (2,713,832 | ) | | | (5,232,086 | ) |
From net investment income (Class I) | | | (4,984,598 | ) | | | (9,395,801 | ) |
From net investment income (Class C) | | | (498,494 | ) | | | (660,165 | ) |
From net investment income (Class R) | | | (184,670 | ) | | | (510,084 | ) |
From net realized gain on investments (Class S) | | | (9,144,432 | ) | | | (63,495,422 | ) |
From net realized gain on investments (Class I) | | | (12,085,561 | ) | | | (81,338,580 | ) |
From net realized gain on investments (Class C) | | | (3,523,556 | ) | | | (18,859,983 | ) |
From net realized gain on investments (Class R) | | | (773,618 | ) | | | (7,014,868 | ) |
| | | | | | | | |
| | |
Total distributions to shareholders | | | (33,908,761 | ) | | | (186,506,989 | ) |
| | | | | | | | |
| | |
CAPITAL STOCK ISSUED AND REPURCHASED: | | | | | | | | |
| | |
Net decrease from capital share transactions (Note 5) | | | (134,085,647 | ) | | | (70,659,450 | ) |
| | | | | | | | |
| | |
Net decrease in net assets | | �� | (169,038,330 | ) | | | (290,440,346 | ) |
| | |
NET ASSETS: | | | | | | | | |
| | |
Beginning of period | | | 1,470,658,495 | | | | 1,761,098,841 | |
| | | | | | | | |
| | |
End of period (including undistributed net investment income of $3,792,730 and $6,349,236, respectively) | | $ | 1,301,620,165 | | | $ | 1,470,658,495 | |
| | | | | | | | |
The accompanying notes are an integral part of the financial statements.
71
Financial Highlights - Pro-Blend® Extended Term Series - Class S
| | | | | | | | | | | | | | | | | | | | | | | | |
| | | FOR THE SIX
MONTHS ENDED 4/30/16 | | | FOR THE YEARS ENDED | |
| | (UNAUDITED) | | | 10/31/15 | | | 10/31/14 | | | 10/31/13 | | | 10/31/12 | | | 10/31/11 | |
Per share data (for a share outstanding throughout each period): | | | | | | | | | | | | | | | | | | | | | | | | |
Net asset value - Beginning of period | | $ | 16.42 | | | $ | 18.28 | | | $ | 18.10 | | | $ | 16.01 | | | $ | 15.46 | | | $ | 15.16 | |
| | | | | | | | | | | | | | | | | | | | | | | | |
Income (loss) from investment operations: | | | | | | | | | | | | | | | | | | | | | | | | |
Net investment income1 | | | 0.07 | | | | 0.16 | | | | 0.19 | | | | 0.17 | | | | 0.19 | | | | 0.23 | |
Net realized and unrealized gain (loss) on investments | | | (0.03 | ) | | | (0.56 | ) | | | 1.02 | | | | 2.56 | | | | 1.01 | | | | 0.26 | |
| | | | | | | | | | | | | | | | | | | | | | | | |
| | | | | | |
Total from investment operations | | | 0.04 | | | | (0.40 | ) | | | 1.21 | | | | 2.73 | | | | 1.20 | | | | 0.49 | |
| | | | | | | | | | | | | | | | | | | | | | | | |
| | | | | | |
Less distributions to shareholders: | | | | | | | | | | | | | | | | | | | | | | | | |
From net investment income | | | (0.06 | ) | | | (0.11 | ) | | | (0.13 | ) | | | (0.14 | ) | | | (0.19 | ) | | | (0.19 | ) |
From net realized gain on investments | | | (0.22 | ) | | | (1.35 | ) | | | (0.90 | ) | | | (0.50 | ) | | | (0.46 | ) | | | — | |
| | | | | | | | | | | | | | | | | | | | | | | | |
| | | | | | |
Total distributions to shareholders | | | (0.28 | ) | | | (1.46 | ) | | | (1.03 | ) | | | (0.64 | ) | | | (0.65 | ) | | | (0.19 | ) |
| | | | | | | | | | | | | | | | | | | | | | | | |
| | | | | | |
Net asset value - End of period | | $ | 16.18 | | | $ | 16.42 | | | $ | 18.28 | | | $ | 18.10 | | | $ | 16.01 | | | $ | 15.46 | |
| | | | | | | | | | | | | | | | | | | | | | | | |
| | | | | | |
Net assets - End of period (000’s omitted) | | $ | 564,551 | | | $ | 718,811 | | | $ | 872,014 | | | $ | 820,370 | | | $ | 792,804 | | | $ | 716,536 | |
| | | | | | | | | | | | | | | | | | | | | | | | |
| | | | | | |
Total return2 | | | 0.31 | % | | | (2.16 | %) | | | 7.08 | % | | | 17.56 | % | | | 8.26 | % | | | 3.26 | % |
Ratios (to average net assets)/Supplemental Data: | | | | | | | | | | | | | | | | | | | | | | | | |
Expenses | | | 1.07 | %3 | | | 1.07 | % | | | 1.06 | % | | | 1.06 | % | | | 1.07 | % | | | 1.08 | % |
Net investment income | | | 0.86 | %3 | | | 0.96 | % | | | 1.04 | % | | | 1.03 | % | | | 1.20 | % | | | 1.49 | % |
Series portfolio turnover | | | 25 | % | | | 66 | % | | | 65 | % | | | 64 | % | | | 58 | % | | | 65 | % |
1Calculated based on average shares outstanding during the periods.
2Represents aggregate total return for the periods indicated, and assumes reinvestment of all distributions. Periods less than one year are not annualized.
3Annualized.
The accompanying notes are an integral part of the financial statements.
72
Financial Highlights - Pro-Blend® Extended Term Series - Class I
| | | | | | | | | | | | | | | | | | | | | | | | |
| | | FOR THE SIX
MONTHS ENDED 4/30/16 | | | FOR THE YEARS ENDED | |
| | (UNAUDITED) | | | 10/31/15 | | | 10/31/14 | | | 10/31/13 | | | 10/31/12 | | | 10/31/11 | |
Per share data (for a share outstanding throughout each period): | | | | | | | | | | | | | | | | | | | | | | | | |
Net asset value - Beginning of period | | $ | 9.57 | | | $ | 11.30 | | | $ | 11.60 | | | $ | 10.50 | | | $ | 10.38 | | | $ | 10.26 | |
| | | | | | | | | | | | | | | | | | | | | | | | |
Income (loss) from investment operations: | | | | | | | | | | | | | | | | | | | | | | | | |
Net investment income1 | | | 0.05 | | | | 0.12 | | | | 0.15 | | | | 0.14 | | | | 0.15 | | | | 0.18 | |
Net realized and unrealized gain (loss) on investments | | | (0.01 | ) | | | (0.34 | ) | | | 0.62 | | | | 1.64 | | | | 0.66 | | | | 0.17 | |
| | | | | | | | | | | | | | | | | | | | | | | | |
| | | | | | |
Total from investment operations | | | 0.04 | | | | (0.22 | ) | | | 0.77 | | | | 1.78 | | | | 0.81 | | | | 0.35 | |
| | | | | | | | | | | | | | | | | | | | | | | | |
| | | | | | |
Less distributions to shareholders: | | | | | | | | | | | | | | | | | | | | | | | | |
From net investment income | | | (0.09 | ) | | | (0.16 | ) | | | (0.17 | ) | | | (0.18 | ) | | | (0.23 | ) | | | (0.23 | ) |
From net realized gain on investments | | | (0.22 | ) | | | (1.35 | ) | | | (0.90 | ) | | | (0.50 | ) | | | (0.46 | ) | | | — | |
| | | | | | | | | | | | | | | | | | | | | | | | |
| | | | | | |
Total distributions to shareholders | | | (0.31 | ) | | | (1.51 | ) | | | (1.07 | ) | | | (0.68 | ) | | | (0.69 | ) | | | (0.23 | ) |
| | | | | | | | | | | | | | | | | | | | | | | | |
| | | | | | |
Net asset value - End of period | | $ | 9.30 | | | $ | 9.57 | | | $ | 11.30 | | | $ | 11.60 | | | $ | 10.50 | | | $ | 10.38 | |
| | | | | | | | | | | | | | | | | | | | | | | | |
| | | | | | |
Net assets - End of period (000’s omitted) | | $ | 550,154 | | | $ | 545,570 | | | $ | 659,331 | | | $ | 547,522 | | | $ | 429,157 | | | $ | 321,632 | |
| | | | | | | | | | | | | | | | | | | | | | | | |
| | | | | | |
Total return2 | | | 0.48 | % | | | (1.91 | %) | | | 7.32 | % | | | 17.80 | % | | | 8.60 | % | | | 3.43 | % |
Ratios (to average net assets)/Supplemental Data: | | | | | | | | | | | | | | | | | | | | | | | | |
Expenses | | | 0.83 | %3 | | | 0.82 | % | | | 0.81 | % | | | 0.81 | % | | | 0.82 | % | | | 0.83 | % |
Net investment income | | | 1.12 | %3 | | | 1.22 | % | | | 1.29 | % | | | 1.27 | % | | | 1.45 | % | | | 1.74 | % |
Series portfolio turnover | | | 25 | % | | | 66 | % | | | 65 | % | | | 64 | % | | | 58 | % | | | 65 | % |
1Calculated based on average shares outstanding during the periods.
2Represents aggregate total return for the periods indicated, and assumes reinvestment of all distributions. Periods less than one year are not annualized.
3Annualized.
The accompanying notes are an integral part of the financial statements.
73
Financial Highlights - Pro-Blend® Extended Term Series - Class C
| | | | | | | | | | | | | | | | | | | | | | | | |
| | | FOR THE SIX
MONTHS ENDED | | | | |
| | | 4/30/16 | | | FOR THE YEARS ENDED | |
| | | (UNAUDITED) | | | 10/31/15 | | | 10/31/14 | | | 10/31/13 | | | 10/31/12 | | | 10/31/11 | |
Per share data (for a share outstanding throughout each period): | | | | | | | | | | | | | | | | | | | | | | | | |
Net asset value - Beginning of period | | $ | 10.21 | | | $ | 11.95 | | | $ | 12.21 | | | $ | 11.02 | | | $ | 10.86 | | | $ | 10.74 | |
| | | | | | | | | | | | | | | | | | | | | | | | |
Income (loss) from investment operations: | | | | | | | | | | | | | | | | | | | | | | | | |
Net investment income1 | | | 0.01 | | | | 0.02 | | | | 0.03 | | | | 0.03 | | | | 0.05 | | | | 0.08 | |
Net realized and unrealized gain (loss) on investments | | | (0.02 | ) | | | (0.36 | ) | | | 0.67 | | | | 1.73 | | | | 0.70 | | | | 0.19 | |
| | | | | | | | | | | | | | | | | | | | | | | | |
| | | | | | |
Total from investment operations | | | (0.01 | ) | | | (0.34 | ) | | | 0.70 | | | | 1.76 | | | | 0.75 | | | | 0.27 | |
| | | | | | | | | | | | | | | | | | | | | | | | |
| | | | | | |
Less distributions to shareholders: | | | | | | | | | | | | | | | | | | | | | | | | |
From net investment income | | | (0.03 | ) | | | (0.05 | ) | | | (0.06 | ) | | | (0.07 | ) | | | (0.13 | ) | | | (0.15 | ) |
From net realized gain on investments | | | (0.22 | ) | | | (1.35 | ) | | | (0.90 | ) | | | (0.50 | ) | | | (0.46 | ) | | | — | |
| | | | | | | | | | | | | | | | | | | | | | | | |
| | | | | | |
Total distributions to shareholders | | | (0.25 | ) | | | (1.40 | ) | | | (0.96 | ) | | | (0.57 | ) | | | (0.59 | ) | | | (0.15 | ) |
| | | | | | | | | | | | | | | | | | | | | | | | |
| | | | | | |
Net asset value - End of period | | $ | 9.95 | | | $ | 10.21 | | | $ | 11.95 | | | $ | 12.21 | | | $ | 11.02 | | | $ | 10.86 | |
| | | | | | | | | | | | | | | | | | | | | | | | |
| | | | | | |
Net assets - End of period (000’s omitted) | | $ | 155,612 | | | $ | 165,898 | | | $ | 164,191 | | | $ | 124,854 | | | $ | 85,588 | | | $ | 68,436 | |
| | | | | | | | | | | | | | | | | | | | | | | | |
| | | | | | |
Total return2 | | | (0.05 | %) | | | (2.91 | %) | | | 6.28 | % | | | 16.65 | % | | | 7.51 | % | | | 2.49 | % |
Ratios (to average net assets)/Supplemental Data: | | | | | | | | | | | | | | | | | | | | | | | | |
Expenses | | | 1.83 | %3 | | | 1.82 | % | | | 1.81 | % | | | 1.81 | % | | | 1.82 | % | | | 1.83 | % |
Net investment income | | | 0.12 | %3 | | | 0.21 | % | | | 0.29 | % | | | 0.27 | % | | | 0.44 | % | | | 0.71 | % |
Series portfolio turnover | | | 25 | % | | | 66 | % | | | 65 | % | | | 64 | % | | | 58 | % | | | 65 | % |
1Calculated based on average shares outstanding during the periods.
2Represents aggregate total return for the periods indicated, and assumes reinvestment of all distributions. Periods less than one year are not annualized.
3Annualized.
The accompanying notes are an integral part of the financial statements.
74
Financial Highlights - Pro-Blend® Extended Term Series - Class R
| | | | | | | | | | | | | | | | | | | | | | | | |
| | | FOR THE SIX
MONTHS ENDED | | | | |
| | | 4/30/16 | | | FOR THE YEARS ENDED | |
| | | (UNAUDITED) | | | 10/31/15 | | | 10/31/14 | | | 10/31/13 | | | 10/31/12 | | | 10/31/11 | |
Per share data (for a share outstanding throughout each period): | | | | | | | | | | | | | | | | | | | | | | | | |
Net asset value - Beginning of period | | $ | 10.87 | | | $ | 12.62 | | | $ | 12.83 | | | $ | 11.54 | | | $ | 11.36 | | | $ | 11.22 | |
| | | | | | | | | | | | | | | | | | | | | | | | |
Income (loss) from investment operations: | | | | | | | | | | | | | | | | | | | | | | | | |
Net investment income1 | | | 0.03 | | | | 0.08 | | | | 0.10 | | | | 0.09 | | | | 0.10 | | | | 0.11 | |
Net realized and unrealized gain (loss) on investments | | | (0.03 | ) | | | (0.38 | ) | | | 0.70 | | | | 1.82 | | | | 0.74 | | | | 0.23 | |
| | | | | | | | | | | | | | | | | | | | | | | | |
| | | | | | |
Total from investment operations | | | — | | | | (0.30 | ) | | | 0.80 | | | | 1.91 | | | | 0.84 | | | | 0.34 | |
| | | | | | | | | | | | | | | | | | | | | | | | |
| | | | | | |
Less distributions to shareholders: | | | | | | | | | | | | | | | | | | | | | | | | |
From net investment income | | | (0.05 | ) | | | (0.10 | ) | | | (0.11 | ) | | | (0.12 | ) | | | (0.20 | ) | | | (0.20 | ) |
From net realized gain on investments | | | (0.22 | ) | | | (1.35 | ) | | | (0.90 | ) | | | (0.50 | ) | | | (0.46 | ) | | | — | |
| | | | | | | | | | | | | | | | | | | | | | | | |
| | | | | | |
Total distributions to shareholders | | | (0.27 | ) | | | (1.45 | ) | | | (1.01 | ) | | | (0.62 | ) | | | (0.66 | ) | | | (0.20 | ) |
| | | | | | | | | | | | | | | | | | | | | | | | |
| | | | | | |
Net asset value - End of period | | $ | 10.60 | | | $ | 10.87 | | | $ | 12.62 | | | $ | 12.83 | | | $ | 11.54 | | | $ | 11.36 | |
| | | | | | | | | | | | | | | | | | | | | | | | |
| | | | | | |
Net assets - End of period (000’s omitted) | | $ | 31,303 | | | $ | 40,379 | | | $ | 65,563 | | | $ | 58,700 | | | $ | 38,261 | | | $ | 8,281 | |
| | | | | | | | | | | | | | | | | | | | | | | | |
| | | | | | |
Total return2 | | | 0.06 | % | | | (2.39 | %) | | | 6.81 | % | | | 17.28 | % | | | 8.03 | % | | | 3.04 | % |
Ratios (to average net assets)/Supplemental Data: | | | | | | | | | | | | | | | | | | | | | | | | |
Expenses | | | 1.33 | %3 | | | 1.32 | % | | | 1.31 | % | | | 1.31 | % | | | 1.33 | % | | | 1.33 | % |
Net investment income | | | 0.62 | %3 | | | 0.71 | % | | | 0.79 | % | | | 0.77 | % | | | 0.90 | % | | | 0.97 | % |
Series portfolio turnover | | | 25 | % | | | 66 | % | | | 65 | % | | | 64 | % | | | 58 | % | | | 65 | % |
1Calculated based on average shares outstanding during the periods.
2Represents aggregate total return for the periods indicated, and assumes reinvestment of all distributions. Periods less than one year are not annualized.
3Annualized.
The accompanying notes are an integral part of the financial statements.
75
Shareholder Expense Example - Pro-Blend® Maximum Term Series
(unaudited)
As a shareholder of the Series, you incur ongoing costs, including management fees, shareholder service fees and other Series expenses. This example is intended to help you understand your ongoing costs (in dollars) of investing in the Series and to compare these costs with the ongoing costs of investing in other mutual funds.
The example is based on an investment of $1,000 invested in each class at the beginning of the period and held for the entire period (November 1, 2015 to April 30, 2016).
Actual Expenses
The Actual lines of the table below provide information about actual account values and actual expenses. You may use the information in these lines, together with the amount you invested, to estimate the expenses that you paid over the period. Simply divide your account value by $1,000 (for example, an $8,600 account value divided by $1,000 = 8.6), then multiply the result by the number in the Actual line for the Class in which you have invested under the heading entitled “Expenses Paid During Period” to estimate the expenses you paid on your account during this period.
Hypothetical Example for Comparison Purposes
The Hypothetical lines of each class in the table below provide information about hypothetical account values and hypothetical expenses based on the Class’ actual expense ratio and an assumed rate of return of 5% per year before expenses, which is not the Class’ actual return. The hypothetical account values and expenses may not be used to estimate the actual ending account balance or expenses you paid during the period. You may use this information to compare the ongoing costs of investing in a class of the Series and other funds. To do so, compare this 5% hypothetical example for the Class in which you have invested with the 5% hypothetical examples that appear in the shareholder reports of the other funds.
Please note that the expenses shown in the table are meant to highlight your ongoing costs only and do not reflect any transaction costs such as sales charges (loads), redemption fees, or exchange fees that you may incur in other mutual funds. Therefore, the second line of the table is useful in comparing ongoing costs only, and will not help you determine the relative total costs of owning different funds.
| | | | | | | | |
| | | BEGINNING
ACCOUNT VALUE
11/1/15 | | ENDING
ACCOUNT VALUE
4/30/16 | | EXPENSES PAID
DURING PERIOD
11/1/15-4/30/16* | | ANNUALIZED
EXPENSE RATIO |
Class S | | | | | | | | |
Actual | | $1,000.00 | | $1,012.30 | | $5.45 | | 1.09% |
Hypothetical (5% return before expenses) | | $1,000.00 | | $1,019.44 | | $5.47 | | 1.09% |
Class I | | | | | | | | |
Actual | | $1,000.00 | | $1,014.40 | | $4.21 | | 0.84% |
Hypothetical (5% return before expenses) | | $1,000.00 | | $1,020.69 | | $4.22 | | 0.84% |
Class C | | | | | | | | |
Actual | | $1,000.00 | | $1,008.80 | | $9.19 | | 1.84% |
Hypothetical (5% return before expenses) | | $1,000.00 | | $1,015.71 | | $9.22 | | 1.84% |
Class R | | | | | | | | |
Actual | | $1,000.00 | | $1,011.70 | | $6.70 | | 1.34% |
Hypothetical (5% return before expenses) | | $1,000.00 | | $1,018.20 | | $6.72 | | 1.34% |
*Expenses are equal to the Class’ annualized expense ratio (for the six-month period), multiplied by the average account value over the period, multiplied by 182/366 to reflect the one-half year period.
76
Portfolio Composition - Pro-Blend® Maximum Term Series
As of April 30, 2016 (unaudited)
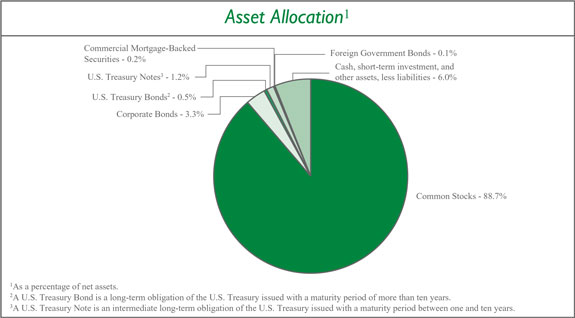
| | | | |
Sector Allocation4 | |
Information Technology | | | 22.1 | % |
Health Care | | | 19.2 | % |
Consumer Discretionary | | | 19.1 | % |
Consumer Staples | | | 10.0 | % |
Financials | | | 7.1 | % |
Industrials | | | 5.4 | % |
Materials | | | 5.2 | % |
Energy | | | 3.6 | % |
Telecommunication Services | | | 0.4 | % |
Utilities | | | 0.2 | % |
| |
| 4Including common stocks and corporate bonds, as a percentage of total investments. | |
| | | | |
Top Ten Stock Holdings5 | |
Monsanto Co. | | | 2.4 | % |
MasterCard, Inc. - Class A | | | 2.3 | % |
Facebook, Inc. - Class A | | | 2.2 | % |
The Priceline Group, Inc. | | | 2.1 | % |
Cerner Corp. | | | 2.1 | % |
Time Warner, Inc. | | | 2.1 | % |
QUALCOMM, Inc. | | | 1.9 | % |
DaVita HealthCare Partners, Inc. | | | 1.9 | % |
Twenty-First Century Fox, Inc. - Class A | | | 1.9 | % |
Apple, Inc. | | | 1.8 | % |
| | |
| 5As a percentage of total investments. | | | | |
77
Investment Portfolio - April 30, 2016
(unaudited)
| | | | | | | | | | |
| PRO-BLEND® MAXIMUM TERM SERIES | | SHARES | | | VALUE (NOTE 2) | | | |
| | | |
COMMON STOCKS - 88.7% | | | | | | | | | | |
| | | |
Consumer Discretionary - 18.5% | | | | | | | | | | |
Diversified Consumer Services - 1.4% | | | | | | | | | | |
Fu Shou Yuan International Group Ltd. (China)1 | | | 1,172,000 | | | $ | 822,265 | | | |
Houghton Mifflin Harcourt Co.* | | | 497,153 | | | | 10,196,608 | | | |
Kroton Educacional S.A. (Brazil) | | | 205,302 | | | | 765,275 | | | |
| | | | | | | | | | |
| | | |
| | | | | | | 11,784,148 | | | |
| | | | | | | | | | |
Hotels, Restaurants & Leisure - 1.5% | | | | | | | | | | |
Accor S.A. (France)1 | | | 13,450 | | | | 595,612 | | | |
Dunkin’ Brands Group, Inc. | | | 11,430 | | | | 531,495 | | | |
Yum! Brands, Inc. | | | 149,140 | | | | 11,865,578 | | | |
| | | | | | | | | | |
| | | |
| | | | | | | 12,992,685 | | | |
| | | | | | | | | | |
Internet & Catalog Retail - 4.6% | | | | | | | | | | |
Amazon.com, Inc.* | | | 14,930 | | | | 9,847,679 | | | |
ASOS plc (United Kingdom)*1 | | | 10,510 | | | | 554,470 | | | |
The Priceline Group, Inc.* | | | 13,590 | | | | 18,260,339 | | | |
Rakuten, Inc. (Japan)1 | | | 98,510 | | | | 1,070,938 | | | |
TripAdvisor, Inc.* | | | 133,910 | | | | 8,649,247 | | | |
Zalando SE (Germany)*1,2 | | | 17,320 | | | | 574,940 | | | |
| | | | | | | | | | |
| | | |
| | | | | | | 38,957,613 | | | |
| | | | | | | | | | |
Media - 9.1% | | | | | | | | | | |
AMC Networks, Inc. - Class A* | | | 170,930 | | | | 11,149,764 | | | |
Global Mediacom Tbk PT (Indonesia)1 | | | 2,506,940 | | | | 219,703 | | | |
ITV plc (United Kingdom)1 | | | 119,010 | | | | 392,289 | | | |
Liberty Global plc - Class A - ADR (United Kingdom)* | | | 214,537 | | | | 8,094,481 | | | |
Modern Times Group MTG AB - Class B (Sweden)1 | | | 3,416 | | | | 102,560 | | | |
Sinclair Broadcast Group, Inc. - Class A | | | 237,210 | | | | 7,607,325 | | | |
Surya Citra Media Tbk PT (Indonesia)1 | | | 1,500,200 | | | | 362,452 | | | |
TEGNA, Inc. | | | 97,630 | | | | 2,280,637 | | | |
Time Warner, Inc. | | | 233,970 | | | | 17,580,506 | | | |
Tribune Media Co. - Class A | | | 363,940 | | | | 14,029,887 | | | |
Twenty-First Century Fox, Inc. - Class A | | | 544,935 | | | | 16,489,733 | | | |
| | | | | | | | | | |
| | | |
| | | | | | | 78,309,337 | | | |
| | | | | | | | | | |
Specialty Retail - 0.3% | | | | | | | | | | |
Advance Auto Parts, Inc. | | | 10,440 | | | | 1,629,684 | | | |
Kingfisher plc (United Kingdom)1 | | | 58,860 | | | | 313,591 | | | |
Monro Muffler Brake, Inc. | | | 7,680 | | | | 531,610 | | | |
| | | | | | | | | | |
| | | |
| | | | | | | 2,474,885 | | | |
| | | | | | | | | | |
Textiles, Apparel & Luxury Goods - 1.6% | | | | | | | | | | |
Carter’s, Inc. | | | 5,290 | | | | 564,284 | | | |
Gildan Activewear, Inc. (Canada) | | | 18,730 | | | | 581,754 | | | |
Kering (France)1 | | | 3,595 | | | | 616,538 | | | |
lululemon athletica, Inc.* | | | 185,176 | | | | 12,138,287 | | | |
| | | | | | | | | | |
| | | |
| | | | | | | 13,900,863 | | | |
| | | | | | | | | | |
| | | |
Total Consumer Discretionary | | | | | | | 158,419,531 | | | |
| | | | | | | | | | |
Consumer Staples - 9.8% | | | | | | | | | | |
Beverages - 5.8% | | | | | | | | | | |
Ambev S.A. - ADR (Brazil) | | | 2,532,574 | | | | 14,157,089 | | | |
Anheuser-Busch InBev S.A./N.V. (Belgium)1 | | | 91,648 | | | | 11,369,348 | | | |
Cia Cervecerias Unidas S.A. - ADR (Chile) | | | 17,290 | | | | 387,642 | | | |
The Coca-Cola Co. | | | 192,880 | | | | 8,641,024 | | | |
Diageo plc (United Kingdom)1 | | | 512,160 | | | | 13,846,855 | | | |
Fomento Economico Mexicano S.A.B. de C.V. - ADR (Mexico) | | | 1,840 | | | | 171,506 | | | |
SABMiller plc (United Kingdom)1 | | | 3,960 | | | | 242,535 | | | |
Treasury Wine Estates Ltd. (Australia)1 | | | 123,599 | | | | 870,294 | | | |
| | | | | | | | | | |
| | | |
| | | | | | | 49,686,293 | | | |
| | | | | | | | | | |
Food & Staples Retailing - 0.2% | | | | | | | | | | |
Dairy Farm International Holdings Ltd. (Hong Kong)1 | | | 114,410 | | | | 788,912 | | | |
Sprouts Farmers Market, Inc.* | | | 20,430 | | | | 573,470 | | | |
Tesco plc (United Kingdom)*1 | | | 75,303 | | | | 189,315 | | | |
| | | | | | | | | | |
| | | |
| | | | | | | 1,551,697 | | | |
| | | | | | | | | | |
Food Products - 1.6% | | | | | | | | | | |
Adecoagro S.A. (Luxembourg)* | | | 62,180 | | | | 662,839 | | | |
Danone S.A. (France)1 | | | 11,223 | | | | 786,325 | | | |
Grupo Bimbo S.A.B. de C.V. - Class A (Mexico) | | | 205,290 | | | | 625,130 | | | |
Nestle S.A. (Switzerland)1 | | | 121,337 | | | | 9,056,556 | | | |
Sao Martinho S.A. (Brazil) | | | 44,390 | | | | 577,325 | | | |
Suedzucker AG (Germany)1 | | | 51,462 | | | | 908,723 | | | |
Tiger Brands Ltd. (South Africa)1 | | | 11,210 | | | | 277,539 | | | |
Universal Robina Corp. (Philippines)1 | | | 82,510 | | | | 366,396 | | | |
The WhiteWave Foods Co.* | | | 13,510 | | | | 543,237 | | | |
| | | | | | | | | | |
| | | |
| | | | | | | 13,804,070 | | | |
| | | | | | | | | | |
Household Products - 0.0%## | | | | | | | | | | |
Pigeon Corp. (Japan)1 | | | 17,000 | | | | 446,516 | | | |
| | | | | | | | | | |
Personal Products - 2.0% | | | | | | | | | | |
Beiersdorf AG (Germany)1 | | | 89,570 | | | | 8,043,005 | | | |
Unilever plc - ADR (United Kingdom) | | | 206,280 | | | | 9,253,721 | | | |
| | | | | | | | | | |
| | | |
| | | | | | | 17,296,726 | | | |
| | | | | | | | | | |
Tobacco - 0.2% | | | | | | | | | | |
Gudang Garam Tbk PT (Indonesia)1 | | | 159,240 | | | | 834,495 | | | |
Japan Tobacco, Inc. (Japan)1 | | | 13,400 | | | | 547,496 | | | |
The accompanying notes are an integral part of the financial statements.
78
Investment Portfolio - April 30, 2016
(unaudited)
| | | | | | | | | | |
| PRO-BLEND® MAXIMUM TERM SERIES | | SHARES | | | VALUE (NOTE 2) | | | |
| | | |
COMMON STOCKS (continued) | | | | | | | | | | |
| | | |
Consumer Staples (continued) | | | | | | | | | | |
Tobacco (continued) | | | | | | | | | | |
Swedish Match AB (Sweden)1 | | | 4,163 | | | $ | 132,225 | | | |
| | | | | | | | | | |
| | | |
| | | | | | | 1,514,216 | | | |
| | | | | | | | | | |
| | | |
Total Consumer Staples | | | | | | | 84,299,518 | | | |
| | | | | | | | | | |
Energy - 3.2% | | | | | | | | | | |
Energy Equipment & Services - 1.7% | | | | | | | | | | |
Schlumberger Ltd. | | | 180,048 | | | | 14,465,056 | | | |
| | | | | | | | | | |
Oil, Gas & Consumable Fuels - 1.5% | | | | | | | | | | |
Cameco Corp. (Canada) | | | 32,685 | | | | 408,889 | | | |
Cosan S.A. Industria e Comercio (Brazil) | | | 17,250 | | | | 159,096 | | | |
Galp Energia SGPS S.A. (Portugal)1 | | | 61,000 | | | | 838,109 | | | |
Range Resources Corp. | | | 249,280 | | | | 10,995,741 | | | |
Royal Dutch Shell plc - Class B (Netherlands)1 | | | 17,214 | | | | 451,953 | | | |
| | | | | | | | | | |
| | | |
| | | | | | | 12,853,788 | | | |
| | | | | | | | | | |
| | | |
Total Energy | | | | | | | 27,318,844 | | | |
| | | | | | | | | | |
Financials - 6.2% | | | | | | | | | | |
Banks - 0.0%## | | | | | | | | | | |
ICICI Bank Ltd. - ADR (India) | | | 33,350 | | | | 235,118 | | | |
| | | | | | | | | | |
Capital Markets - 1.0% | | | | | | | | | | |
BlackRock, Inc. | | | 23,950 | | | | 8,534,104 | | | |
| | | | | | | | | | |
Consumer Finance - 2.0% | | | | | | | | | | |
SLM Corp.* | | | 1,498,980 | | | | 10,148,095 | | | |
Synchrony Financial* | | | 215,490 | | | | 6,587,529 | | | |
| | | | | | | | | | |
| | | |
| | | | | | | 16,735,624 | | | |
| | | | | | | | | | |
Diversified Financial Services - 0.0%## | | | | | | | | | | |
JSE Ltd. (South Africa)1 | | | 35,430 | | | | 411,080 | | | |
| | | | | | | | | | |
Real Estate Investment Trusts (REITS) - 2.6% | | | | | | | | | | |
Agree Realty Corp. | | | 4,270 | | | | 165,591 | | | |
Alexandria Real Estate Equities, Inc. | | | 1,910 | | | | 177,535 | | | |
alstria office REIT AG (Germany)1 | | | 43,080 | | | | 604,922 | | | |
American Campus Communities, Inc. | | | 3,010 | | | | 134,698 | | | |
American Homes 4 Rent - Class A | | | 5,990 | | | | 94,762 | | | |
Apartment Investment & Management Co. - Class A | | | 4,610 | | | | 184,677 | | | |
AvalonBay Communities, Inc. | | | 1,500 | | | | 265,185 | | | |
Boston Properties, Inc. | | | 1,420 | | | | 182,981 | | | |
Brixmor Property Group, Inc. | | | 3,700 | | | | 93,425 | | | |
CatchMark Timber Trust, Inc. - Class A | | | 9,330 | | | | 98,991 | | | |
Chesapeake Lodging Trust | | | 6,910 | | | | 170,193 | | | |
Columbia Property Trust, Inc. | | | 4,110 | | | | 91,653 | | | |
Community Healthcare Trust, Inc. | | | 10,650 | | | | 193,830 | | | |
CoreSite Realty Corp. | | | 910 | | | | 68,186 | | | |
Crown Castle International Corp. | | | 990 | | | | 86,011 | | | |
CubeSmart | | | 6,800 | | | | 201,348 | | | |
DCT Industrial Trust, Inc. | | | 2,520 | | | | 101,732 | | | |
DDR Corp. | | | 8,100 | | | | 141,750 | | | |
Digital Realty Trust, Inc. | | | 1,270 | | | | 111,735 | | | |
Douglas Emmett, Inc. | | | 5,400 | | | | 175,230 | | | |
Education Realty Trust, Inc. | | | 3,316 | | | | 131,877 | | | |
Equinix, Inc. | | | 590 | | | | 194,907 | | | |
Equity LifeStyle Properties, Inc. | | | 1,550 | | | | 106,160 | | | |
Equity One, Inc. | | | 5,450 | | | | 154,235 | | | |
Equity Residential | | | 2,090 | | | | 142,266 | | | |
Extra Space Storage, Inc. | | | 1,260 | | | | 107,037 | | | |
Fibra Shop Portafolios Inmobiliarios S.A.P.I. de C.V. (Mexico) | | | 72,506 | | | | 69,958 | | | |
Forest City Realty Trust, Inc. - Class A | | | 10,620 | | | | 220,684 | | | |
General Growth Properties, Inc. | | | 5,570 | | | | 156,127 | | | |
HCP, Inc. | | | 2,580 | | | | 87,281 | | | |
Healthcare Realty Trust, Inc. | | | 3,320 | | | | 100,530 | | | |
Healthcare Trust of America, Inc. - Class A | | | 5,370 | | | | 155,139 | | | |
Host Hotels & Resorts, Inc. | | | 5,320 | | | | 84,162 | | | |
Kite Realty Group Trust | | | 3,787 | | | | 103,120 | | | |
Lamar Advertising Co. - Class A | | | 1,700 | | | | 105,468 | | | |
LaSalle Hotel Properties | | | 5,390 | | | | 128,821 | | | |
Mid-America Apartment Communities, Inc. | | | 2,700 | | | | 258,417 | | | |
NorthStar Realty Finance Corp. | | | 9,130 | | | | 116,773 | | | |
Outfront Media, Inc. | | | 6,780 | | | | 147,058 | | | |
Paramount Group, Inc. | | | 10,980 | | | | 183,366 | | | |
Pebblebrook Hotel Trust | | | 2,490 | | | | 68,824 | | | |
Pennsylvania Real Estate Investment Trust | | | 3,030 | | | | 69,508 | | | |
Physicians Realty Trust | | | 12,110 | | | | 219,554 | | | |
Prologis, Inc. | | | 7,860 | | | | 356,923 | | | |
Public Storage | | | 630 | | | | 154,230 | | | |
Retail Opportunity Investments Corp. | | | 7,480 | | | | 147,132 | | | |
Retail Properties of America, Inc. - Class A | | | 5,830 | | | | 93,222 | | | |
Rexford Industrial Realty, Inc. | | | 7,590 | | | | 142,464 | | | |
Simon Property Group, Inc. | | | 2,400 | | | | 482,808 | | | |
Sovran Self Storage, Inc. | | | 1,840 | | | | 195,445 | | | |
STORE Capital Corp. | | | 4,380 | | | | 112,435 | | | |
Tanger Factory Outlet Centers, Inc. | | | 2,890 | | | | 101,381 | | | |
Taubman Centers, Inc. | | | 1,650 | | | | 114,592 | | | |
Terreno Realty Corp. | | | 5,810 | | | | 132,294 | | | |
UDR, Inc. | | | 2,510 | | | | 87,649 | | | |
Urban Edge Properties | | | 7,170 | | | | 185,990 | | | |
Ventas, Inc. | | | 2,440 | | | | 151,573 | | | |
Vornado Realty Trust | | | 1,740 | | | | 166,570 | | | |
The accompanying notes are an integral part of the financial statements.
79
Investment Portfolio - April 30, 2016
(unaudited)
| | | | | | | | | | |
| PRO-BLEND® MAXIMUM TERM SERIES | | SHARES | | | VALUE (NOTE 2) | | | |
| | | |
COMMON STOCKS (continued) | | | | | | | | | | |
| | | |
Financials (continued) | | | | | | | | | | |
Real Estate Investment Trusts (REITS) (continued) | | | | | | | | | | |
Welltower, Inc. | | | 2,190 | | | $ | 152,030 | | | |
Westfield Corp. (Australia)1 | | | 8,770 | | | | 66,982 | | | |
Weyerhaeuser Co. | | | 399,442 | | | | 12,830,077 | | | |
| | | | | | | | | | |
| | | |
| | | | | | | 22,129,504 | | | |
| | | | | | | | | | |
Real Estate Management & Development - 0.6% | | | | | | | | | | |
CBRE Group, Inc. - Class A* | | | 2,150 | | | | 63,705 | | | |
First Capital Realty, Inc. (Canada) | | | 4,880 | | | | 78,993 | | | |
Realogy Holdings Corp.* | | | 144,010 | | | | 5,146,917 | | | |
| | | | | | | | | | |
| | | |
| | | | | | | 5,289,615 | | | |
| | | | | | | | | | |
| | | |
Total Financials | | | | | | | 53,335,045 | | | |
| | | | | | | | | | |
Health Care - 18.9% | | | | | | | | | | |
Biotechnology - 0.2% | | | | | | | | | | |
Cepheid, Inc.* | | | 26,670 | | | | 761,162 | | | |
Seattle Genetics, Inc.* | | | 15,790 | | | | 560,229 | | | |
Vertex Pharmaceuticals, Inc.* | | | 7,020 | | | | 592,067 | | | |
| | | | | | | | | | |
| | | |
| | | | | | | 1,913,458 | | | |
| | | | | | | | | | |
Health Care Equipment & Supplies - 4.9% | | | | | | | | | | |
The Cooper Companies, Inc. | | | 83,020 | | | | 12,708,702 | | | |
Intuitive Surgical, Inc.* | | | 22,890 | | | | 14,337,380 | | | |
LDR Holding Corp.* | | | 15,730 | | | | 423,924 | | | |
Medtronic plc | | | 186,460 | | | | 14,758,309 | | | |
Shandong Weigao Group Medical Polymer Co. Ltd. - Class H (China)1 | | | 232,240 | | | | 139,420 | | | |
| | | | | | | | | | |
| | | |
| | | | | | | 42,367,735 | | | |
| | | | | | | | | | |
Health Care Providers & Services - 5.0% | | | | | | | | | | |
Acadia Healthcare Co., Inc.* | | | 9,770 | | | | 617,366 | | | |
Brookdale Senior Living, Inc.* | | | 3,040 | | | | 56,118 | | | |
DaVita HealthCare Partners, Inc.* | | | 223,230 | | | | 16,496,697 | | | |
Express Scripts Holding Co.* | | | 207,170 | | | | 15,274,644 | | | |
Fresenius Medical Care AG & Co. KGaA (Germany)1 | | | 98,848 | | | | 8,603,486 | | | |
Fresenius Medical Care AG & Co. KGaA - ADR (Germany) | | | 15,410 | | | | 672,338 | | | |
KPJ Healthcare Berhad (Malaysia)1 | | | 258,230 | | | | 279,614 | | | |
Odontoprev S.A. (Brazil) | | | 113,170 | | | | 348,468 | | | |
Siloam International Hospitals Tbk PT (Indonesia)1 | | | 390,700 | | | | 250,335 | | | |
| | | | | | | | | | |
| | | |
| | | | | | | 42,599,066 | | | |
| | | | | | | | | | |
Health Care Technology - 2.1% | | | | | | | | | | |
Cerner Corp.* | | | 324,870 | | | | 18,238,202 | | | |
| | | | | | | | | | |
Life Sciences Tools & Services - 2.5% | | | | | | | | | | |
QIAGEN N.V.* | | | 397,030 | | | | 8,917,294 | | | |
QIAGEN N.V.*1 | | | 7,100 | | | | 159,684 | | | |
Thermo Fisher Scientific, Inc. | | | 85,390 | | | | 12,317,507 | | | |
| | | | | | | | | | |
| | | |
| | | | | | | 21,394,485 | | | |
| | | | | | | | | | |
Pharmaceuticals - 4.2% | | | | | | | | | | |
AstraZeneca plc - ADR (United Kingdom) | | | 20,520 | | | | 594,259 | | | |
Genomma Lab Internacional S.A.B. de C.V. - Class B (Mexico)* | | | 405,070 | | | | 444,986 | | | |
GlaxoSmithKline plc (United Kingdom)1 | | | 10,705 | | | | 228,793 | | | |
Johnson & Johnson | | | 132,610 | | | | 14,862,929 | | | |
Novartis AG - ADR (Switzerland) | | | 106,330 | | | | 8,077,890 | | | |
Perrigo Co. plc | | | 119,360 | | | | 11,538,531 | | | |
| | | | | | | | | | |
| | | |
| | | | | | | 35,747,388 | | | |
| | | | | | | | | | |
| | | |
Total Health Care | | | | | | | 162,260,334 | | | |
| | | | | | | | | | |
Industrials - 4.9% | | | | | | | | | | |
Aerospace & Defense - 0.0%## | | | | | | | | | | |
Safran S.A. (France)1 | | | 2,060 | | | | 142,016 | | | |
| | | | | | | | | | |
Airlines - 0.0%## | | | | | | | | | | |
Ryanair Holdings plc - ADR (Ireland) | | | 1,550 | | | | 125,472 | | | |
| | | | | | | | | | |
Building Products - 0.7% | | | | | | | | | | |
Masco Corp. | | | 203,190 | | | | 6,239,965 | | | |
| | | | | | | | | | |
Commercial Services & Supplies - 0.2% | | | | | | | | | | |
China Everbright International Ltd. (China)1 | | | 159,000 | | | | 178,005 | | | |
MiX Telematics Ltd. - ADR (South Africa) | | | 33,310 | | | | 135,905 | | | |
Stericycle, Inc.* | | | 9,170 | | | | 876,285 | | | |
| | | | | | | | | | |
| | | |
| | | | | | | 1,190,195 | | | |
| | | | | | | | | | |
Industrial Conglomerates - 1.6% | | | | | | | | | | |
Danaher Corp. | | | 127,490 | | | | 12,334,658 | | | |
Siemens AG (Germany)1 | | | 11,230 | | | | 1,175,206 | | | |
| | | | | | | | | | |
| | | |
| | | | | | | 13,509,864 | | | |
| | | | | | | | | | |
Machinery - 1.9% | | | | | | | | | | |
Alstom S.A. (France)*1 | | | 19,050 | | | | 487,121 | | | |
ANDRITZ AG (Austria)1 | | | 11,040 | | | | 619,702 | | | |
FANUC Corp. (Japan)1 | | | 2,491 | | | | 367,976 | | | |
Flowserve Corp. | | | 270,110 | | | | 13,184,069 | | | |
GEA Group AG (Germany)1 | | | 21,140 | | | | 982,371 | | | |
SMC Corp. (Japan)1 | | | 2,700 | | | | 658,421 | | | |
Sulzer AG (Switzerland)1 | | | 1,760 | | | | 160,662 | | | |
The Weir Group plc (United Kingdom)1 | | | 5,550 | | | | 97,490 | | | |
| | | | | | | | | | |
| | | |
| | | | | | | 16,557,812 | | | |
| | | | | | | | | | |
Professional Services - 0.1% | | | | | | | | | | |
Applus Services S.A. (Spain)1 | | | 41,180 | | | | 381,031 | | | |
The accompanying notes are an integral part of the financial statements.
80
Investment Portfolio - April 30, 2016
(unaudited)
| | | | | | | | | | |
| PRO-BLEND® MAXIMUM TERM SERIES | | SHARES | | | VALUE (NOTE 2) | | | |
| | | |
COMMON STOCKS (continued) | | | | | | | | | | |
| | | |
Industrials (continued) | | | | | | | | | | |
Professional Services (continued) | | | | | | | | | | |
Bureau Veritas S.A. (France)1 | | | 17,140 | | | $ | 406,275 | | | |
Intertek Group plc (United Kingdom)1 | | | 7,590 | | | | 362,087 | | | |
| | | | | | | | | | |
| | | |
| | | | | | | 1,149,393 | | | |
| | | | | | | | | | |
Road & Rail - 0.3% | | | | | | | | | | |
Genesee & Wyoming, Inc. - Class A* | | | 21,460 | | | | 1,397,261 | | | |
Kansas City Southern | | | 11,070 | | | | 1,048,883 | | | |
| | | | | | | | | | |
| | | |
| | | | | | | 2,446,144 | | | |
| | | | | | | | | | |
Trading Companies & Distributors - 0.1% | | | | | | | | | | |
Brenntag AG (Germany)1 | | | 6,762 | | | | 397,192 | | | |
| | | | | | | | | | |
| | | |
Total Industrials | | | | | | | 41,758,053 | | | |
| | | | | | | | | | |
Information Technology - 21.9% | | | | | | | | | | |
Electronic Equipment, Instruments & Components - 3.1% | | | | | | | | | | |
FLIR Systems, Inc. | | | 514,560 | | | | 15,544,858 | | | |
Hitachi Ltd. (Japan)1 | | | 175,000 | | | | 801,889 | | | |
Keyence Corp. (Japan)1 | | | 1,246 | | | | 746,844 | | | |
PAX Global Technology Ltd. (Hong Kong)1 | | | 1,005,000 | | | | 865,527 | | | |
Trimble Navigation Ltd.* | | | 38,490 | | | | 921,835 | | | |
VeriFone Systems, Inc.* | | | 262,540 | | | | 7,471,888 | | | |
| | | | | | | | | | |
| | | |
| | | | | | | 26,352,841 | | | |
| | | | | | | | | | |
Internet Software & Services - 5.7% | | | | | | | | | | |
Alibaba Group Holding Ltd. - ADR (China)* | | | 12,240 | | | | 941,746 | | | |
Alphabet, Inc. - Class A* | | | 10,500 | | | | 7,432,740 | | | |
Alphabet, Inc. - Class C* | | | 12,400 | | | | 8,593,324 | | | |
Baidu, Inc. - ADR (China)* | | | 5,260 | | | | 1,022,018 | | | |
Benefitfocus, Inc.* | | | 15,420 | | | | 584,418 | | | |
Envestnet, Inc.* | | | 33,850 | | | | 1,062,213 | | | |
Facebook, Inc. - Class A* | | | 158,100 | | | | 18,589,398 | | | |
Match Group, Inc.* | | | 44,370 | | | | 505,818 | | | |
MercadoLibre, Inc. (Argentina) | | | 7,840 | | | | 979,138 | | | |
Q2 Holdings, Inc.* | | | 28,590 | | | | 683,587 | | | |
Tencent Holdings Ltd. - Class H (China)1 | | | 418,900 | | | | 8,523,909 | | | |
| | | | | | | | | | |
| | | |
| | | | | | | 48,918,309 | | | |
| | | | | | | | | | |
IT Services - 5.8% | | | | | | | | | | |
Amdocs Ltd. - ADR | | | 137,765 | | | | 7,789,233 | | | |
FleetCor Technologies, Inc.* | | | 3,790 | | | | 586,237 | | | |
InterXion Holding N.V. - ADR (Netherlands)* | | | 4,430 | | | | 150,088 | | | |
MasterCard, Inc. - Class A | | | 206,010 | | | | 19,980,910 | | | |
PayPal Holdings, Inc.* | | | 300,080 | | | | 11,757,134 | | | |
Visa, Inc. - Class A | | | 120,850 | | | | 9,334,454 | | | |
| | | | | | | | | | |
| | | |
| | | | | | | 49,598,056 | | | |
| | | | | | | | | | |
Semiconductors & Semiconductor Equipment - 1.9% | | | | | | | | | | |
QUALCOMM, Inc. | | | 327,104 | | | | 16,525,294 | | | |
| | | | | | | | | | |
Software - 3.4% | | | | | | | | | | |
Aspen Technology, Inc.* | | | 174,100 | | | | 6,621,023 | | | |
Electronic Arts, Inc.* | | | 126,700 | | | | 7,836,395 | | | |
Paylocity Holding Corp.* | | | 15,780 | | | | 603,901 | | | |
SAP SE (Germany)1 | | | 14,130 | | | | 1,108,660 | | | |
ServiceNow, Inc.* | | | 166,720 | | | | 11,917,146 | | | |
TOTVS S.A. (Brazil) | | | 47,879 | | | | 391,329 | | | |
The Ultimate Software Group, Inc.* | | | 4,670 | | | | 918,075 | | | |
| | | | | | | | | | |
| | | |
| | | | | | | 29,396,529 | | | |
| | | | | | | | | | |
Technology Hardware, Storage & Peripherals - 2.0% | | | | | | | | | | |
Apple, Inc. | | | 167,620 | | | | 15,712,699 | | | |
Samsung Electronics Co. Ltd. (South Korea)1 | | | 1,440 | | | | 1,569,357 | | | |
| | | | | | | | | | |
| | | |
| | | | | | | 17,282,056 | | | |
| | | | | | | | | | |
| | | |
Total Information Technology | | | | | | | 188,073,085 | | | |
| | | | | | | | | | |
Materials - 5.1% | | | | | | | | | | |
Chemicals - 3.5% | | | | | | | | | | |
Ashland, Inc. | | | 78,670 | | | | 8,779,572 | | | |
Givaudan S.A. (Switzerland)1 | | | 220 | | | | 434,250 | | | |
Monsanto Co. | | | 215,807 | | | | 20,216,800 | | | |
Sociedad Quimica y Minera de Chile S.A. - ADR (Chile) | | | 11,878 | | | | 247,419 | | | |
Symrise AG (Germany)1 | | | 5,740 | | | | 380,972 | | | |
| | | | | | | | | | |
| | | |
| | | | | | | 30,059,013 | | | |
| | | | | | | | | | |
Metals & Mining - 1.6% | | | | | | | | | | |
Alcoa, Inc. | | | 1,191,081 | | | | 13,304,375 | | | |
Alumina Ltd. (Australia)1 | | | 94,794 | | | | 107,043 | | | |
Norsk Hydro ASA (Norway)1 | | | 41,943 | | | | 182,493 | | | |
| | | | | | | | | | |
| | | |
| | | | | | | 13,593,911 | | | |
| | | | | | | | | | |
| | | |
Total Materials | | | | | | | 43,652,924 | | | |
| | | | | | | | | | |
Telecommunication Services - 0.2% | | | | | | | | | | |
Diversified Telecommunication Services - 0.1% | | | | | | | | | | |
Telefonica S.A. - ADR (Spain) | | | 63,493 | | | | 692,709 | | | |
| | | | | | | | | | |
Wireless Telecommunication Services - 0.1% | | | | | | | | | | |
America Movil S.A.B. de C.V. - Class L - ADR (Mexico) | | | 51,290 | | | | 726,266 | | | |
China Mobile Ltd. - Class H (China)1 | | | 21,000 | | | | 241,096 | | | |
| | | | | | | | | | |
| | | |
| | | | | | | 967,362 | | | |
| | | | | | | | | | |
| | | |
Total Telecommunication Services | | | | | | | 1,660,071 | | | |
| | | | | | | | | | |
The accompanying notes are an integral part of the financial statements.
81
Investment Portfolio - April 30, 2016
(unaudited)
| | | | | | | | | | |
| PRO-BLEND® MAXIMUM TERM SERIES | | SHARES/
PRINCIPAL
AMOUNT3 | | | VALUE (NOTE 2) | | | |
| | | |
COMMON STOCKS (continued) | | | | | | | | | | |
| | | |
Utilities - 0.0%## | | | | | | | | | | |
Water Utilities - 0.0%## | | | | | | | | | | |
CT Environmental Group Ltd. (China)1 | | | 598,000 | | | $ | 174,423 | | | |
| | | | | | | | | | |
| | | |
TOTAL COMMON STOCKS | | | | | | | | | | |
(Identified Cost $723,546,678) | | | | | | | 760,951,828 | | | |
| | | | | | | | | | |
| | | |
CORPORATE BONDS - 3.3% | | | | | | | | | | |
| | | |
Non-Convertible Corporate Bonds - 3.3% | | | | | | | | | | |
Consumer Discretionary - 0.6% | | | | | | | | | | |
Auto Components - 0.1% | | | | | | | | | | |
Magna International, Inc. (Canada), 4.15%, 10/1/2025 | | | 565,000 | | | | 606,267 | | | |
Techniplas LLC2, 10.00%, 5/1/2020 | | | 220,000 | | | | 154,000 | | | |
| | | | | | | | | | |
| | | |
| | | | | | | 760,267 | | | |
| | | | | | | | | | |
Diversified Consumer Services - 0.1% | | | | | | | | | | |
Block Financial LLC, 5.50%, 11/1/2022 | | | 750,000 | | | | 809,195 | | | |
| | | | | | | | | | |
Hotels, Restaurants & Leisure - 0.0%## | | | | | | | | | | |
MGM Resorts International, 10.00%, 11/1/2016 | | | 180,000 | | | | 187,434 | | | |
| | | | | | | | | | |
Household Durables - 0.2% | | | | | | | | | | |
Brookfield Residential Properties, Inc. - Brookfield Residential US Corp. (Canada)2, 6.125%, 7/1/2022 | | | 395,000 | | | | 365,778 | | | |
Lennar Corp., 12.25%, 6/1/2017 | | | 165,000 | | | | 181,912 | | | |
Meritage Homes Corp., 7.15%, 4/15/2020 | | | 160,000 | | | | 170,400 | | | |
Meritage Homes Corp., 7.00%, 4/1/2022 | | | 165,000 | | | | 176,962 | | | |
TRI Pointe Group, Inc. - TRI Pointe Homes, Inc., 4.375%, 6/15/2019 | | | 260,000 | | | | 260,650 | | | |
Weekley Homes LLC - Weekley Finance Corp., 6.00%, 2/1/2023 | | | 425,000 | | | | 395,250 | | | |
| | | | | | | | | | |
| | | |
| | | | | | | 1,550,952 | | | |
| | | | | | | | | | |
Media - 0.2% | | | | | | | | | | |
Altice Financing S.A. (Luxembourg)2, 6.50%, 1/15/2022 | | | 190,000 | | | | 191,900 | | | |
CCO Holdings LLC - CCO Holdings Capital Corp.2, 5.875%, 4/1/2024 | | | 200,000 | | | | 209,500 | | | |
Columbus International, Inc. (Barbados)2, 7.375%, 3/30/2021 | | | 200,000 | | | | 212,440 | | | |
Sinclair Television Group, Inc.2, 5.625%, 8/1/2024 | | | 290,000 | | | | 297,975 | | | |
Sirius XM Radio, Inc.2, 5.375%, 4/15/2025 | | | 195,000 | | | | 199,387 | | | |
VTR Finance B.V. (Netherlands)2, 6.875%, 1/15/2024 | | | 410,000 | | | | 409,487 | | | |
WideOpenWest Finance LLC - WideOpenWest Capital Corp., 10.25%, 7/15/2019 | | | 30,000 | | | | 30,075 | | | |
| | | | | | | | | | |
| | | |
| | | | | | | 1,550,764 | | | |
| | | | | | | | | | |
| | | |
Total Consumer Discretionary | | | | | | | 4,858,612 | | | |
| | | | | | | | | | |
Consumer Staples - 0.2% | | | | | | | | | | |
Beverages - 0.1% | | | | | | | | | | |
Anheuser-Busch InBev Worldwide, Inc. (Belgium), 7.75%, 1/15/2019 | | | 375,000 | | | | 436,689 | | | |
| | | | | | | | | | |
Food & Staples Retailing - 0.0%## | | | | | | | | | | |
C&S Group Enterprises LLC2, 5.375%, 7/15/2022 | | | 335,000 | | | | 321,600 | | | |
| | | | | | | | | | |
Food Products - 0.1% | | | | | | | | | | |
Pinnacle Operating Corp.2, 9.00%, 11/15/2020 | | | 425,000 | | | | 361,250 | | | |
| | | | | | | | | | |
Household Products - 0.0%## | | | | | | | | | | |
HRG Group, Inc., 7.75%, 1/15/2022 | | | 285,000 | | | | 285,000 | | | |
| | | | | | | | | | |
| | | |
Total Consumer Staples | | | | | | | 1,404,539 | | | |
| | | | | | | | | | |
Energy - 0.4% | | | | | | | | | | |
Energy Equipment & Services - 0.0%## | | | | | | | | | | |
FTS International, Inc., 6.25%, 5/1/2022 | | | 160,000 | | | | 24,880 | | | |
TerraForm Global Operating LLC2, 9.75%, 8/15/2022 | | | 315,000 | | | | 279,169 | | | |
| | | | | | | | | | |
| | | |
| | | | | | | 304,049 | | | |
| | | | | | | | | | |
Oil, Gas & Consumable Fuels - 0.4% | | | | | | | | | | |
Carrizo Oil & Gas, Inc., 6.25%, 4/15/2023 | | | 40,000 | | | | 38,400 | | | |
Crestwood Midstream Partners LP - Crestwood Midstream Finance Corp., 6.125%, 3/1/2022 | | | 120,000 | | | | 109,500 | | | |
Hiland Partners LP - Hiland Partners Finance Corp.2, 7.25%, 10/1/2020 | | | 900,000 | | | | 941,625 | | | |
Hilcorp Energy I LP - Hilcorp Finance Co.2, 5.75%, 10/1/2025 | | | 40,000 | | | | 37,700 | | | |
Oasis Petroleum, Inc., 6.875%, 1/15/2023 | | | 40,000 | | | | 35,900 | | | |
PBF Holding Co. LLC - PBF Finance Corp.2, 7.00%, 11/15/2023 | | | 140,000 | | | | 136,500 | | | |
Petrobras Global Finance B.V. (Brazil)4, 2.238%, 5/20/2016 | | | 1,300,000 | | | | 1,299,025 | | | |
Sabine Pass Liquefaction LLC, 5.625%, 2/1/2021 | | | 375,000 | | | | 372,656 | | | |
Transocean, Inc., 3.75%, 10/15/2017 | | | 80,000 | | | | 76,800 | | | |
Weatherford International LLC, 6.35%, 6/15/2017 | | | 80,000 | | | | 81,200 | | | |
WPX Energy, Inc., 6.00%, 1/15/2022 | | | 85,000 | | | | 76,500 | | | |
| | | | | | | | | | |
| | | |
| | | | | | | 3,205,806 | | | |
| | | | | | | | | | |
| | | |
Total Energy | | | | | | | 3,509,855 | | | |
| | | | | | | | | | |
Financials - 0.9% | | | | | | | | | | |
Banks - 0.2% | | | | | | | | | | |
CIT Group, Inc., 4.25%, 8/15/2017 | | | 180,000 | | | | 182,588 | | | |
Intesa Sanpaolo S.p.A. (Italy), 3.875%, 1/15/2019 | | | 390,000 | | | | 403,999 | | | |
The accompanying notes are an integral part of the financial statements.
82
Investment Portfolio - April 30, 2016
(unaudited)
| | | | | | | | | | |
| PRO-BLEND® MAXIMUM TERM SERIES | | PRINCIPAL
AMOUNT 3 | | | VALUE (NOTE 2) | | | |
| | | |
CORPORATE BONDS (continued) | | | | | | | | | | |
| | | |
Non-Convertible Corporate Bonds (continued) | | | | | | | | | | |
Financials (continued) | | | | | | | | | | |
Banks (continued) | | | | | | | | | | |
Lloyds Bank plc (United Kingdom)2,5,6, 12.00%, | | | 220,000 | | | $ | 289,025 | | | |
Lloyds Banking Group plc (United Kingdom)2, 4.582%, 12/10/2025 | | | 391,000 | | | | 392,023 | | | |
Popular, Inc., 7.00%, 7/1/2019 | | | 305,000 | | | | 297,375 | | | |
| | | | | | | | | | |
| | | |
| | | | | | | 1,565,010 | | | |
| | | | | | | | | | |
Capital Markets - 0.1% | | | | | | | | | | |
The Goldman Sachs Group, Inc.4, 2.236%, 11/29/2023 | | | 380,000 | | | | 379,266 | | | |
Morgan Stanley, 2.125%, 4/25/2018 | | | 390,000 | | | | 393,473 | | | |
| | | | | | | | | | |
| | | |
| | | | | | | 772,739 | | | |
| | | | | | | | | | |
Consumer Finance - 0.1% | | | | | | | | | | |
Ally Financial, Inc., 2.75%, 1/30/2017 | | | 190,000 | | | | 189,763 | | | |
Navient Corp., 6.00%, 1/25/2017 | | | 180,000 | | | | 182,925 | | | |
Navient Corp., 6.125%, 3/25/2024 | | | 345,000 | | | | 308,947 | | | |
| | | | | | | | | | |
| | | |
| | | | | | | 681,635 | | | |
| | | | | | | | | | |
Diversified Financial Services - 0.1% | | | | | | | | | | |
Jefferies Finance LLC - JFIN Co-Issuer Corp.2, 7.375%, 4/1/2020 | | | 425,000 | | | | 392,063 | | | |
Jefferies Finance LLC - JFIN Co-Issuer Corp.2, 6.875%, 4/15/2022 | | | 200,000 | | | | 175,000 | | | |
| | | | | | | | | | |
| | | |
| | | | | | | 567,063 | | | |
| | | | | | | | | | |
Insurance - 0.3% | | | | | | | | | | |
Aegon N.V. (Netherlands)4,5, 1.74%, | | | 500,000 | | | | 305,476 | | | |
American International Group, Inc., 4.875%, 6/1/2022 | | | 700,000 | | | | 768,345 | | | |
Assured Guaranty US Holdings, Inc., 5.00%, 7/1/2024 | | | 950,000 | | | | 1,010,967 | | | |
AXA S.A. (France)4,5, 1.825%, | | | 350,000 | | | | 239,862 | | | |
| | | | | | | | | | |
| | | |
| | | | | | | 2,324,650 | | | |
| | | | | | | | | | |
Real Estate Investment Trusts (REITS) - 0.0%## | | | | | | | | | | |
Greystar Real Estate Partners LLC2, 8.25%, 12/1/2022 | | | 205,000 | | | | 213,200 | | | |
| | | | | | | | | | |
Real Estate Management & Development - 0.0%## | | | | | | | |
Forestar USA Real Estate Group, Inc.2, 8.50%, 6/1/2022 | | | 205,000 | | | | 209,100 | | | |
| | | | | | | | | | |
Thrifts & Mortgage Finance - 0.1% | | | | | | | | | | |
Ladder Capital Finance Holdings LLLP - Ladder Capital Finance Corp., 7.375%, 10/1/2017 | | | 425,000 | | | | 426,062 | | | |
Ladder Capital Finance Holdings LLLP - Ladder Capital Finance Corp.2, 5.875%, 8/1/2021 | | | 315,000 | | | | 277,200 | | | |
Radian Group, Inc., 7.00%, 3/15/2021 | | | 170,000 | | | | 181,262 | | | |
Rialto Holdings LLC - Rialto Corp.2, 7.00%, 12/1/2018 | | | 375,000 | | | | 367,500 | | | |
| | | | | | | | | | |
| | | |
| | | | | | | 1,252,024 | | | |
| | | | | | | | | | |
| | | |
Total Financials | | | | | | | 7,585,421 | | | |
| | | | | | | | | | |
Health Care - 0.2% | | | | | | | | | | |
Biotechnology - 0.0%## | | | | | | | | | | |
AMAG Pharmaceuticals, Inc.2, 7.875%, 9/1/2023 | | | 320,000 | | | | 287,200 | | | |
| | | | | | | | | | |
Health Care Providers & Services - 0.1% | | | | | | | | | | |
HCA, Inc., 7.50%, 2/15/2022 | | | 145,000 | | | | 164,213 | | | |
Tenet Healthcare Corp.2,4, 4.134%, 6/15/2020 | | | 200,000 | | | | 200,250 | | | |
Tenet Healthcare Corp., 8.125%, 4/1/2022 | | | 185,000 | | | | 191,937 | | | |
| | | | | | | | | | |
| | | |
| | | | | | | 556,400 | | | |
| | | | | | | | | | |
Pharmaceuticals - 0.1% | | | | | | | | | | |
Concordia Healthcare Corp. (Canada)2, 7.00%, 4/15/2023 | | | 260,000 | | | | 241,150 | | | |
Horizon Pharma Financing, Inc.2, 6.625%, 5/1/2023 | | | 180,000 | | | | 163,800 | | | |
Mallinckrodt International Finance S.A. - Mallinckrodt CB LLC2, 5.625%, 10/15/2023 | | | 260,000 | | | | 243,750 | | | |
| | | | | | | | | | |
| | | |
| | | | | | | 648,700 | | | |
| | | | | | | | | | |
| | | |
Total Health Care | | | | | | | 1,492,300 | | | |
| | | | | | | | | | |
Industrials - 0.5% | | | | | | | | | | |
Aerospace & Defense - 0.1% | | | | | | | | | | |
DigitalGlobe, Inc.2, 5.25%, 2/1/2021 | | | 441,000 | | | | 398,554 | | | |
| | | | | | | | | | |
Airlines - 0.0%## | | | | | | | | | | |
Allegiant Travel Co., 5.50%, 7/15/2019 | | | 285,000 | | | | 293,372 | | | |
| | | | | | | | | | |
Commercial Services & Supplies - 0.0%## | | | | | | | | | | |
Constellis Holdings LLC - Constellis Finance Corp.2, 9.75%, 5/15/2020 | | | 220,000 | | | | 199,100 | | | |
Modular Space Corp.2, 10.25%, 1/31/2019 | | | 170,000 | | | | 87,550 | | | |
| | | | | | | | | | |
| | | |
| | | | | | | 286,650 | | | |
| | | | | | | | | | |
Machinery - 0.1% | | | | | | | | | | |
Case New Holland Industrial, Inc. (United Kingdom), 7.875%, 12/1/2017 | | | 175,000 | | | | 186,375 | | | |
Waterjet Holdings, Inc.2, 7.625%, 2/1/2020 | | | 275,000 | | | | 274,656 | | | |
| | | | | | | | | | |
| | | |
| | | | | | | 461,031 | | | |
| | | | | | | | | | |
Trading Companies & Distributors - 0.3% | | | | | | | | | | |
Aircastle Ltd., 5.50%, 2/15/2022 | | | 165,000 | | | | 175,519 | | | |
The accompanying notes are an integral part of the financial statements.
83
Investment Portfolio - April 30, 2016
(unaudited)
| | | | | | | | | | |
| PRO-BLEND® MAXIMUM TERM SERIES | | PRINCIPAL
AMOUNT3/ SHARES | | | VALUE (NOTE 2) | | | |
| | | |
CORPORATE BONDS (continued) | | | | | | | | | | |
| | | |
Non-Convertible Corporate Bonds (continued) | | | | | | | | | | |
Industrials (continued) | | | | | | | | | | |
Trading Companies & Distributors (continued) | | | | | | | | | | |
Aviation Capital Group Corp.2, 3.875%, 9/27/2016 | | | 1,465,000 | | | $ | 1,474,230 | | | |
Fly Leasing Ltd. (Ireland), 6.375%, 10/15/2021 | | | 320,000 | | | | 313,600 | | | |
International Lease Finance Corp., 5.75%, 5/15/2016 | | | 560,000 | | | | 560,353 | | | |
International Lease Finance Corp.4, 2.584%, 6/15/2016 | | | 355,000 | | | | 355,416 | | | |
International Lease Finance Corp., 6.25%, 5/15/2019 | | | 50,000 | | | | 54,250 | | | |
| | | | | | | | | | |
| | | |
| | | | | | | 2,933,368 | | | |
| | | | | | | | | | |
| | | |
Total Industrials | | | | | | | 4,372,975 | | | |
| | | | | | | | | | |
Information Technology - 0.0%## | | | | | | | | | | |
Internet Software & Services - 0.0%## | | | | | | | | | | |
VeriSign, Inc., 5.25%, 4/1/2025 | | | 75,000 | | | | 77,062 | | | |
| | | | | | | | | | |
Technology Hardware, Storage & Peripherals - 0.0%## | | | | | | | | | | |
Diebold, Inc.2, 8.50%, 4/15/2024 | | | 160,000 | | | | 162,000 | | | |
Western Digital Corp.2, 10.50%, 4/1/2024 | | | 170,000 | | | | 165,325 | | | |
| | | | | | | | | | |
| | | |
| | | | | | | 327,325 | | | |
| | | | | | | | | | |
| | | |
Total Information Technology | | | | | | | 404,387 | | | |
| | | | | | | | | | |
Materials - 0.1% | | | | | | | | | | |
Chemicals - 0.0%## | | | | | | | | | | |
Consolidated Energy Finance S.A. (Trinidad-Tobago)2, 6.75%, 10/15/2019 | | | 300,000 | | | | 283,500 | | | |
| | | | | | | | | | |
Containers & Packaging - 0.0%## | | | | | | | | | | |
Ardagh Packaging Finance plc - Ardagh Holdings USA, Inc. (Ireland)2,4, 3.634%, 12/15/2019 | | | 255,000 | | | | 257,518 | | | |
| | | | | | | | | | |
Metals & Mining - 0.1% | | | | | | | | | | |
Alcoa, Inc., 5.87%, 2/23/2022 | | | 215,000 | | | | 219,300 | | | |
ArcelorMittal (Luxembourg), 10.85%, 6/1/2019 | | | 80,000 | | | | 91,600 | | | |
FMG Resources August 2006 Pty Ltd. (Australia)2, 6.875%, 4/1/2022 | | | 40,000 | | | | 36,400 | | | |
SunCoke Energy Partners LP - SunCoke Energy Partners Finance Corp.2, 7.375%, 2/1/2020 | | | 260,000 | | | | 198,900 | | | |
| | | | | | | | | | |
| | | |
| | | | | | | 546,200 | | | |
| | | | | | | | | | |
| | | |
Total Materials | | | | | | | 1,087,218 | | | |
| | | | | | | | | | |
Telecommunication Services - 0.2% | | | | | | | | | | |
Diversified Telecommunication Services - 0.1% | | | | | | | | | | |
CenturyLink, Inc., 7.50%, 4/1/2024 | | | 340,000 | | | | 340,850 | | | |
Embarq Corp., 7.082%, 6/1/2016 | | | 190,000 | | | | 190,879 | | | |
Frontier Communications Corp.2, 11.00%, 9/15/2025 | | | 465,000 | | | | 469,650 | | | |
Inmarsat Finance plc (United Kingdom)2, 4.875%, 5/15/2022 | | | 235,000 | | | | 223,250 | | | |
Numericable-SFR S.A. (France)2, 6.25%, 5/15/2024 | | | 40,000 | | | | 38,700 | | | |
| | | | | | | | | | |
| | | |
| | | | | | | 1,263,329 | | | |
| | | | | | | | | | |
Wireless Telecommunication Services - 0.1% | | | | | | | | | | |
Altice Financing S.A. (Luxembourg)2, 6.625%, 2/15/2023 | | | 235,000 | | | | 232,368 | | | |
Sixsigma Networks Mexico S.A. de C.V. (Mexico)2, 8.25%, 11/7/2021 | | | 210,000 | | | | 201,600 | | | |
T-Mobile USA, Inc., 6.836%, 4/28/2023 | | | 205,000 | | | | 218,581 | | | |
| | | | | | | | | | |
| | | |
| | | | | | | 652,549 | | | |
| | | | | | | | | | |
| | | |
Total Telecommunication Services | | | | | | | 1,915,878 | | | |
| | | | | | | | | | |
Utilities - 0.2% | | | | | | | | | | |
Independent Power and Renewable Electricity Producers - 0.2% | | | | | | | | | | |
Abengoa Yield plc (Spain)2, 7.00%, 11/15/2019 | | | 415,000 | | | | 394,250 | | | |
ContourGlobal Power Holdings S.A. (France)2, 7.125%, 6/1/2019 | | | 290,000 | | | | 287,100 | | | |
NRG Energy, Inc., 6.25%, 7/15/2022 | | | 195,000 | | | | 191,163 | | | |
Talen Energy Supply LLC2, 4.625%, 7/15/2019 | | | 350,000 | | | | 325,500 | | | |
TerraForm Power Operating LLC2, 6.125%, 6/15/2025 | | | 320,000 | | | | 275,200 | | | |
| | | | | | | | | | |
| | | |
Total Utilities | | | | | | | 1,473,213 | | | |
| | | | | | | | | | |
| | | |
TOTAL CORPORATE BONDS | | | | | | | | | | |
(Identified Cost $28,864,422) | | | | | | | 28,104,398 | | | |
| | | | | | | | | | |
| | | |
MUTUAL FUND - 0.0%## | | | | | | | | | | |
iShares MSCI India ETF | | | | | | | | | | |
(Identified Cost $183,330) | | | 6,650 | | | | 179,949 | | | |
| | | | | | | | | | |
| | | |
U.S. TREASURY SECURITIES - 1.7% | | | | | | | | | | |
| | | |
U.S. Treasury Bonds - 0.5% | | | | | | | | | | |
U.S. Treasury Inflation Indexed Bond, 0.75%, 2/15/2042 | | | | | | | | | | |
(Identified Cost $4,013,761) | | | 4,391,530 | | | | 4,278,312 | | | |
| | | | | | | | | | |
| | | |
U.S. Treasury Notes - 1.2% | | | | | | | | | | |
U.S. Treasury Floating Rate Note4, 0.418%, 10/31/2017 | | | | | | | | | | |
(Identified Cost $9,989,109) | | | 10,000,000 | | | | 10,009,230 | | | |
| | | | | | | | | | |
| | | |
TOTAL U.S. TREASURY SECURITIES | | | | | | | | | | |
(Identified Cost $14,002,870) | | | | | | | 14,287,542 | | | |
| | | | | | | | | | |
The accompanying notes are an integral part of the financial statements.
84
Investment Portfolio - April 30, 2016
(unaudited)
| | | | | | | | | | |
| PRO-BLEND® MAXIMUM TERM SERIES | | PRINCIPAL
AMOUNT3/ SHARES | | | VALUE (NOTE 2) | | | |
| | |
COMMERCIAL MORTGAGE-BACKED SECURITIES - 0.2% | | | | | | | |
| | | |
JP Morgan Chase Commercial Mortgage Securities Trust, Series 2006-CB16, Class A4, 5.552%, 5/12/2045 | | | 463,265 | | | $ | 464,294 | | | |
Wachovia Bank Commercial Mortgage Trust, Series 2006-C29, Class A4, 5.308%, 11/15/2048 | | | 1,046,858 | | | | 1,063,912 | | | |
| | | | | | | | | | |
| | | |
TOTAL COMMERCIAL MORTGAGE-BACKED SECURITIES | | | | | | | | | | |
(Identified Cost $1,645,387) | | | | | | | 1,528,206 | | | |
| | | | | | | | | | |
| | | |
FOREIGN GOVERNMENT BONDS - 0.1% | | | | | | | | | | |
| | | |
Export-Import Bank of Korea (South Korea), 2.625%, 12/30/2020 | | | | | | | | | | |
(Identified Cost $799,061) | | | 800,000 | | | | 817,583 | | | |
| | | | | | | | | | |
| | | |
SHORT-TERM INVESTMENT - 5.5% | | | | | | | | | | |
| | | |
Dreyfus Cash Management, Inc. - Institutional Shares7, 0.29%, | | | | | | | | | | |
(Identified Cost $47,543,449) | | | 47,543,449 | | | | 47,543,449 | | | |
| | | | | | | | | | |
| | | |
TOTAL INVESTMENTS - 99.5% | | | | | | | | | | |
(Identified Cost $816,585,197) | | | | | | | 853,412,955 | | | |
| | | |
OTHER ASSETS, LESS LIABILITIES - 0.5% | | | | | | | 4,327,061 | | | |
| | | | | | | | | | |
| | | |
NET ASSETS - 100% | | | | | | $ | 857,740,016 | | | |
| | | | | | | | | | |
ADR - American Depositary Receipt
ETF - Exchange-traded fund
*Non-income producing security.
##Less than 0.1%.
1A factor from a third party vendor was applied to determine the security’s fair value following the close of local trading.
2Restricted securities - Investment in securities that are restricted as to public resale under the Securities Act of 1933, as amended. These securities have been sold under Rule 144A and have been determined to be liquid. These securities amount to $14,129,863, or 1.6%, of the Series’ net assets as of April 30, 2016. (see Note 2 to the financial statements).
3Amount is stated in USD unless otherwise noted.
4The coupon rate is floating and is the effective rate as of April 30, 2016.
5Security is perpetual in nature and has no stated maturity date.
6The rate shown is a fixed rate as of April 30, 2016; the rate becomes floating, based on LIBOR plus a spread, in December 2024.
7Rate shown is the current yield as of April 30, 2016.
The Global Industry Classification Standard (GICS) was developed by and is the exclusive property and a service mark of MSCI Inc. (MSCI) and Standard & Poor’s, a division of The McGraw-Hill Companies, Inc. (S&P), and is licensed for use by Manning & Napier when referencing GICS sectors. Neither MSCI, S&P, nor any third party involved in making or compiling the GICS or any GICS classifications makes any express or implied warranties or representations with respect to such standard or classification, nor shall any such party have any liability therefrom.
The accompanying notes are an integral part of the financial statements.
85
Statement of Assets and Liabilities - Pro-Blend® Maximum Term Series
April 30, 2016 (unaudited)
| | | | |
ASSETS: | | | | |
| |
Investments, at value (identified cost $816,585,197) (Note 2) | | $ | 853,412,955 | |
Cash | | | 152 | |
Receivable for securities sold | | | 9,444,123 | |
Foreign tax reclaims receivable | | | 697,655 | |
Interest receivable | | | 471,344 | |
Dividends receivable | | | 460,943 | |
Receivable for fund shares sold | | | 348,653 | |
Prepaid expenses | | | 6,255 | |
| | | | |
| |
TOTAL ASSETS | | | 864,842,080 | |
| | | | |
| |
LIABILITIES: | | | | |
| |
Accrued management fees (Note 3) | | | 529,917 | |
Accrued shareholder services fees (Class S) (Note 3) | | | 86,178 | |
Accrued transfer agent fees (Note 3) | | | 64,423 | |
Accrued distribution and service (Rule 12b-1) fees (Class C) (Class R)(Note 3) | | | 58,665 | |
Accrued fund accounting and administration fees (Note 3) | | | 42,848 | |
Accrued Chief Compliance Officer service fees (Note 3) | | | 381 | |
Payable for fund shares repurchased | | | 4,384,225 | |
Payable for securities purchased | | | 1,781,557 | |
Other payables and accrued expenses | | | 153,870 | |
| | | | |
| |
TOTAL LIABILITIES | | | 7,102,064 | |
| | | | |
| |
TOTAL NET ASSETS | | $ | 857,740,016 | |
| | | | |
| |
NET ASSETS CONSIST OF: | | | | |
| |
Capital stock | | $ | 660,876 | |
Additional paid-in-capital | | | 819,465,823 | |
Undistributed net investment income | | | 1,097,793 | |
Accumulated net realized loss on investments, foreign currency and translation of other assets and liabilities | | | (283,379 | ) |
Net unrealized appreciation (depreciation) on investments, foreign currency and translation of other assets and liabilities | | | 36,798,903 | |
| | | | |
| |
TOTAL NET ASSETS | | $ | 857,740,016 | |
| | | | |
The accompanying notes are an integral part of the financial statements.
86
Statement of Assets and Liabilities - Pro-Blend® Maximum Term Series
April 30, 2016 (unaudited)
| | | | |
NET ASSET VALUE, OFFERING PRICE AND REDEMPTION PRICE PER SHARE - Class S
($417,680,986/ 22,796,633 shares) | | $ | 18.32 | |
| | | | |
| |
NET ASSET VALUE, OFFERING PRICE AND REDEMPTION PRICE PER SHARE - Class I
($357,541,278/ 35,770,009 shares) | | $ | 10.00 | |
| | | | |
| |
NET ASSET VALUE, OFFERING PRICE AND REDEMPTION PRICE PER SHARE - Class C
($57,217,131/ 5,451,578 shares) | | $ | 10.50 | |
| | | | |
| |
NET ASSET VALUE, OFFERING PRICE AND REDEMPTION PRICE PER SHARE - Class R
($25,300,621/ 2,069,365 shares) | | $ | 12.23 | |
| | | | |
The accompanying notes are an integral part of the financial statements.
87
Statement of Operations - Pro-Blend® Maximum Term Series
For the Six Months Ended April 30, 2016 (unaudited)
| | | | |
INVESTMENT INCOME: | | | | |
| |
Dividends (net of foreign taxes withheld, $300,720) | | $ | 4,992,497 | |
Interest | | | 1,056,911 | |
| | | | |
| |
Total Investment Income | | | 6,049,408 | |
| | | | |
| |
EXPENSES: | | | | |
| |
Management fees (Note 3) | | | 3,274,754 | |
Shareholder services fees (Class S) (Note 3) | | | 546,684 | |
Distribution and service (Rule 12b-1) fees (Class C) (Note 3) | | | 276,021 | |
Transfer agent fees (Note 3) | | | 106,888 | |
Fund accounting and administration fees (Note 3) | | | 76,397 | |
Distribution and service (Rule 12b-1) fees (Class R) (Note 3) | | | 68,744 | |
Directors’ fees (Note 3) | | | 18,179 | |
Chief Compliance Officer service fees (Note 3) | | | 1,258 | |
Custodian fees | | | 44,270 | |
Miscellaneous | | | 143,282 | |
| | | | |
| |
Total Expenses | | | 4,556,477 | |
| | | | |
| |
NET INVESTMENT INCOME | | | 1,492,931 | |
| | | | |
| |
REALIZED AND UNREALIZED GAIN (LOSS) ON INVESTMENTS AND FOREIGN CURRENCY: | | | | |
| |
Net realized gain (loss) on- | | | | |
Investments | | | 1,123,187 | |
Foreign currency and translation of other assets and liabilities | | | (5,515 | ) |
| | | | |
| |
| | | 1,117,672 | |
| | | | |
Net change in unrealized appreciation (depreciation) on- | | | | |
Investments | | | 3,276,410 | |
Foreign currency and translation of other assets and liabilities | | | 20,898 | |
| | | | |
| |
| | | 3,297,308 | |
| | | | |
| |
NET REALIZED AND UNREALIZED GAIN (LOSS) ON INVESTMENTS AND FOREIGN CURRENCY | | | 4,414,980 | |
| | | | |
| |
NET INCREASE IN NET ASSETS RESULTING FROM OPERATIONS | | $ | 5,907,911 | |
| | | | |
The accompanying notes are an integral part of the financial statements.
88
Statements of Changes in Net Assets - Pro-Blend® Maximum Term Series
| | | | | | | | |
| | | FOR THE SIX
MONTHS ENDED
4/30/16 (UNAUDITED) | | | FOR THE YEAR ENDED 10/31/15 | |
INCREASE (DECREASE) IN NET ASSETS: | | | | | | | | |
| | |
OPERATIONS: | | | | | | | | |
| | |
Net investment income | | $ | 1,492,931 | | | $ | 5,574,556 | |
Net realized gain on investments and foreign currency | | | 1,117,672 | | | | 13,402,528 | |
Net change in unrealized appreciation (depreciation) on investments and foreign currency | | | 3,297,308 | | | | (38,604,536 | ) |
| | | | | | | | |
| | |
Net increase (decrease) from operations | | | 5,907,911 | | | | (19,627,452 | ) |
| | | | | | | | |
| | |
DISTRIBUTIONS TO SHAREHOLDERS (Note 8): | | | | | | | | |
| | |
From net investment income (Class S) | | | (291,964 | ) | | | (1,565,296 | ) |
From net investment income (Class I) | | | (1,521,359 | ) | | | (4,370,824 | ) |
From net investment income (Class C) | | | — | | | | (4,395 | ) |
From net investment income (Class R) | | | — | | | | (107,400 | ) |
From net realized gain on investments (Class S) | | | (4,897,638 | ) | | | (58,346,182 | ) |
From net realized gain on investments (Class I) | | | (7,244,938 | ) | | | (85,929,472 | ) |
From net realized gain on investments (Class C) | | | (1,004,701 | ) | | | (9,020,752 | ) |
From net realized gain on investments (Class R) | | | (430,778 | ) | | | (5,307,582 | ) |
| | | | | | | | |
| | |
Total distributions to shareholders | | | (15,391,378 | ) | | | (164,651,903 | ) |
| | | | | | | | |
| | |
CAPITAL STOCK ISSUED AND REPURCHASED: | | | | | | | | |
| | |
Net decrease from capital share transactions (Note 5) | | | (116,110,170 | ) | | | (28,777,851 | ) |
| | | | | | | | |
| | |
Net decrease in net assets | | | (125,593,637 | ) | | | (213,057,206 | ) |
| | |
NET ASSETS: | | | | | | | | |
| | |
Beginning of period | | | 983,333,653 | | | | 1,196,390,859 | |
| | | | | | | | |
| | |
End of period (including undistributed net investment income of $1,097,793 and $1,418,185, respectively) | | $ | 857,740,016 | | | $ | 983,333,653 | |
| | | | | | | | |
The accompanying notes are an integral part of the financial statements.
89
Financial Highlights - Pro-Blend® Maximum Term Series - Class S
| | | | | | | | | | | | | | | | | | | | | | | | | | |
| | | FOR THE SIX MONTHS ENDED | | | FOR THE YEARS ENDED |
| | | 4/30/16 (UNAUDITED) | | | 10/31/15 | | | 10/31/14 | | | 10/31/13 | | | 10/31/12 | | | 10/31/11 |
Per share data (for a share outstanding throughout each period): | | | | | | | | | | | | | | | | | | | | | | | | | | |
Net asset value - Beginning of period | | $ | 18.30 | | | $ | 20.86 | | | $ | 21.01 | | | $ | 17.00 | | | $ | 15.66 | | | $ | 15.59 | | | |
| | | | | | | | | | | | | | | | | | | | | | | | | | |
Income (loss) from investment operations: | | | | | | | | | | | | | | | | | | | | | | | | | | |
Net investment income1 | | | 0.03 | | | | 0.09 | | | | 0.09 | | | | 0.08 | | | | 0.06 | | | | 0.10 | | | |
Net realized and unrealized gain (loss) on investments | | | 0.19 | | | | (0.54 | ) | | | 1.60 | | | | 4.29 | | | | 1.35 | | | | 0.05 | | | |
| | | | | | | | | | | | | | | | | | | | | | | | | | |
| | | | | | | |
Total from investment operations | | | 0.22 | | | | (0.45 | ) | | | 1.69 | | | | 4.37 | | | | 1.41 | | | | 0.15 | | | |
| | | | | | | | | | | | | | | | | | | | | | | | | | |
| | | | | | | |
Less distributions to shareholders: | | | | | | | | | | | | | | | | | | | | | | | | | | |
From net investment income | | | (0.01 | ) | | | (0.05 | ) | | | (0.04 | ) | | | (0.04 | ) | | | (0.07 | ) | | | (0.08 | ) | | |
From net realized gain on investments | | | (0.19 | ) | | | (2.06 | ) | | | (1.80 | ) | | | (0.32 | ) | | | — | | | | — | | | |
| | | | | | | | | | | | | | | | | | | | | | | | | | |
| | | | | | | |
Total distributions to shareholders | | | (0.20 | ) | | | (2.11 | ) | | | (1.84 | ) | | | (0.36 | ) | | | (0.07 | ) | | | (0.08 | ) | | |
| | | | | | | | | | | | | | | | | | | | | | | | | | |
| | | | | | | |
Net asset value - End of period | | $ | 18.32 | | | $ | 18.30 | | | $ | 20.86 | | | $ | 21.01 | | | $ | 17.00 | | | $ | 15.66 | | | |
| | | | | | | | | | | | | | | | | | | | | | | | | | |
| | | | | | | |
Net assets - End of period (000’s omitted) | | $ | 417,681 | | | $ | 503,378 | | | $ | 597,578 | | | $ | 530,510 | | | $ | 467,244 | | | $ | 512,215 | | | |
| | | | | | | | | | | | | | | | | | | | | | | | | | |
| | | | | | | |
Total return2 | | | 1.23 | % | | | (2.03 | %) | | | 8.80 | % | | | 26.13 | % | | | 9.04 | % | | | 0.94 | % | | |
Ratios (to average net assets)/Supplemental Data: | | | | | | | | | | | | | | | | | | | | | | | | | | |
Expenses | | | 1.09 | %3 | | | 1.08 | % | | | 1.07 | % | | | 1.07 | % | | | 1.09 | % | | | 1.09 | % | | |
Net investment income | | | 0.30 | %3 | | | 0.45 | % | | | 0.45 | % | | | 0.43 | % | | | 0.36 | % | | | 0.59 | % | | |
Series portfolio turnover | | | 25 | % | | | 59 | % | | | 74 | % | | | 67 | % | | | 64 | % | | | 65 | % | | |
1Calculated based on average shares outstanding during the periods.
2Represents aggregate total return for the periods indicated, and assumes reinvestment of all distributions. Periods less than one year are not annualized.
3Annualized.
The accompanying notes are an integral part of the financial statements.
90
Financial Highlights - Pro-Blend® Maximum Term Series - Class I
| | | | | | | | | | | | | | | | | | | | | | | | | | |
| | | FOR THE SIX MONTHS ENDED | | | FOR THE YEARS ENDED |
| | | 4/30/16 (UNAUDITED) | | | 10/31/15 | | | 10/31/14 | | | 10/31/13 | | | 10/31/12 | | | 10/31/11 |
Per share data (for a share outstanding throughout each period): | | | | | | | | | | | | | | | | | | | | | | | | | | |
Net asset value - Beginning of period | | $ | 10.09 | | | $ | 12.51 | | | $ | 13.35 | | | $ | 10.95 | | | $ | 10.12 | | | $ | 10.12 | | | |
| | | | | | | | | | | | | | | | | | | | | | | | | | |
Income (loss) from investment operations: | | | | | | | | | | | | | | | | | | | | | | | | | | |
Net investment income1 | | | 0.03 | | | | 0.08 | | | | 0.09 | | | | 0.08 | | | | 0.06 | | | | 0.09 | | | |
Net realized and unrealized gain (loss) on investments | | | 0.11 | | | | (0.33 | ) | | | 0.96 | | | | 2.72 | | | | 0.88 | | | | 0.03 | | | |
| | | | | | | | | | | | | | | | | | | | | | | | | | |
| | | | | | | |
Total from investment operations | | | 0.14 | | | | (0.25 | ) | | | 1.05 | | | | 2.80 | | | | 0.94 | | | | 0.12 | | | |
| | | | | | | | | | | | | | | | | | | | | | | | | | |
| | | | | | | |
Less distributions to shareholders: | | | | | | | | | | | | | | | | | | | | | | | | | | |
From net investment income | | | (0.04 | ) | | | (0.11 | ) | | | (0.09 | ) | | | (0.08 | ) | | | (0.11 | ) | | | (0.12 | ) | | |
From net realized gain on investments | | | (0.19 | ) | | | (2.06 | ) | | | (1.80 | ) | | | (0.32 | ) | | | — | | | | — | | | |
| | | | | | | | | | | | | | | | | | | | | | | | | | |
| | | | | | | |
Total distributions to shareholders | | | (0.23 | ) | | | (2.17 | ) | | | (1.89 | ) | | | (0.40 | ) | | | (0.11 | ) | | | (0.12 | ) | | |
| | | | | | | | | | | | | | | | | | | | | | | | | | |
| | | | | | | |
Net asset value - End of period | | $ | 10.00 | | | $ | 10.09 | | | $ | 12.51 | | | $ | 13.35 | | | $ | 10.95 | | | $ | 10.12 | | | |
| | | | | | | | | | | | | | | | | | | | | | | | | | |
| | | | | | | |
Net assets - End of period (000’s omitted) | | $ | 357,541 | | | $ | 390,931 | | | $ | 504,866 | | | $ | 418,785 | | | $ | 320,999 | | | $ | 210,597 | | | |
| | | | | | | | | | | | | | | | | | | | | | | | | | |
| | | | | | | |
Total return2 | | | 1.44 | % | | | (1.82 | %) | | | 9.10 | % | | | 26.35 | % | | | 9.42 | % | | | 1.14 | % | | |
Ratios (to average net assets)/Supplemental Data: | | | | | | | | | | | | | | | | | | | | | | | | | | |
Expenses | | | 0.84 | %3 | | | 0.83 | % | | | 0.82 | % | | | 0.82 | % | | | 0.84 | % | | | 0.84 | % | | |
Net investment income | | | 0.55 | %3 | | | 0.71 | % | | | 0.70 | % | | | 0.66 | % | | | 0.57 | % | | | 0.83 | % | | |
Series portfolio turnover | | | 25 | % | | | 59 | % | | | 74 | % | | | 67 | % | | | 64 | % | | | 65 | % | | |
1Calculated based on average shares outstanding during the periods.
2Represents aggregate total return for the periods indicated, and assumes reinvestment of all distributions. Periods less than one year are not annualized.
3Annualized.
The accompanying notes are an integral part of the financial statements.
91
Financial Highlights - Pro-Blend® Maximum Term Series - Class C
| | | | | | | | | | | | | | | | | | | | | | | | | | |
| | | FOR THE SIX
MONTHS ENDED | | | FOR THE YEARS ENDED |
| | | 4/30/16
(UNAUDITED) | | | 10/31/15 | | | 10/31/14 | | | 10/31/13 | | | 10/31/12 | | | 10/31/11 |
Per share data (for a share outstanding throughout each period): | | | | | | | | | | | | | | | | | | | | | | | | | | |
Net asset value - Beginning of period | | $ | 10.60 | | | $ | 13.03 | | | $ | 13.86 | | | $ | 11.38 | | | $ | 10.52 | | | $ | 10.54 | | | |
| | | | | | | | | | | | | | | | | | | | | | | | | | |
Income (loss) from investment operations: | | | | | | | | | | | | | | | | | | | | | | | | | | |
Net investment loss1 | | | (0.02 | ) | | | (0.03 | ) | | | (0.04 | ) | | | (0.04 | ) | | | (0.04 | ) | | | (0.02 | ) | | |
Net realized and unrealized gain (loss) on investments | | | 0.11 | | | | (0.34 | ) | | | 1.01 | | | | 2.84 | | | | 0.91 | | | | 0.04 | | | |
| | | | | | | | | | | | | | | | | | | | | | | | | | |
| | | | | | | |
Total from investment operations | | | 0.09 | | | | (0.37 | ) | | | 0.97 | | | | 2.80 | | | | 0.87 | | | | 0.02 | | | |
| | | | | | | | | | | | | | | | | | | | | | | | | | |
| | | | | | | |
Less distributions to shareholders: | | | | | | | | | | | | | | | | | | | | | | | | | | |
From net investment income | | | — | | | | (0.00 | )2 | | | (0.00 | )2 | | | — | | | | (0.01 | ) | | | (0.04 | ) | | |
From net realized gain on investments | | | (0.19 | ) | | | (2.06 | ) | | | (1.80 | ) | | | (0.32 | ) | | | — | | | | — | | | |
| | | | | | | | | | | | | | | | | | | | | | | | | | |
| | | | | | | |
Total distributions to shareholders | | | (0.19 | ) | | | (2.06 | ) | | | (1.80 | ) | | | (0.32 | ) | | | (0.01 | ) | | | (0.04 | ) | | |
| | | | | | | | | | | | | | | | | | | | | | | | | | |
| | | | | | | |
Net asset value - End of period | | $ | 10.50 | | | $ | 10.60 | | | $ | 13.03 | | | $ | 13.86 | | | $ | 11.38 | | | $ | 10.52 | | | |
| | | | | | | | | | | | | | | | | | | | | | | | | | |
| | | | | | | |
Net assets - End of period (000’s omitted) | | $ | 57,217 | | | $ | 57,507 | | | $ | 55,781 | | | $ | 36,989 | | | $ | 23,045 | | | $ | 18,102 | | | |
| | | | | | | | | | | | | | | | | | | | | | | | | | |
| | | | | | | |
Total return3 | | | 0.88 | % | | | (2.76 | %) | | | 8.06 | % | | | 25.17 | % | | | 8.27 | % | | | 0.15 | % | | |
Ratios (to average net assets)/Supplemental Data: | | | | | | | | | | | | | | | | | | | | | | | | | | |
Expenses | | | 1.84 | %4 | | | 1.83 | % | | | 1.82 | % | | | 1.82 | % | | | 1.84 | % | | | 1.84 | % | | |
Net investment loss | | | (0.45 | %)4 | | | (0.30 | %) | | | (0.30 | %) | | | (0.35 | %) | | | (0.40 | %) | | | (0.15 | %) | | |
Series portfolio turnover | | | 25 | % | | | 59 | % | | | 74 | % | | | 67 | % | | | 64 | % | | | 65 | % | | |
1Calculated based on average shares outstanding during the periods.
2Less than $0.01.
3Represents aggregate total return for the periods indicated, and assumes reinvestment of all distributions. Periods less than one year are not annualized.
4Annualized.
The accompanying notes are an integral part of the financial statements.
92
Financial Highlights - Pro-Blend® Maximum Term Series - Class R
| | | | | | | | | | | | | | | | | | | | | | | | | | |
| | | FOR THE SIX MONTHS ENDED | | | FOR THE YEARS ENDED |
| | | 4/30/16 (UNAUDITED) | | | 10/31/15 | | | 10/31/14 | | | 10/31/13 | | | 10/31/12 | | | 10/31/11 |
Per share data (for a share outstanding throughout each period): | | | | | | | | | | | | | | | | | | | | | | | | | | |
Net asset value - Beginning of period | | $ | 12.28 | | | $ | 14.73 | | | $ | 15.39 | | | $ | 12.56 | | | $ | 11.63 | | | $ | 11.64 | | | |
| | | | | | | | | | | | | | | | | | | | | | | | | | |
Income (loss) from investment operations: | | | | | | | | | | | | | | | | | | | | | | | | | | |
Net investment income1 | | | 0.00 | 2 | | | 0.03 | | | | 0.03 | | | | 0.02 | | | | 0.00 | 2 | | | 0.00 | 2 | | |
Net realized and unrealized gain (loss) on investments | | | 0.14 | | | | (0.38 | ) | | | 1.13 | | | | 3.15 | | | | 1.00 | | | | 0.09 | | | |
| | | | | | | | | | | | | | | | | | | | | | | | | | |
| | | | | | | |
Total from investment operations | | | 0.14 | | | | (0.35 | ) | | | 1.16 | | | | 3.17 | | | | 1.00 | | | | 0.09 | | | |
| | | | | | | | | | | | | | | | | | | | | | | | | | |
| | | | | | | |
Less distributions to shareholders: | | | | | | | | | | | | | | | | | | | | | | | | | | |
From net investment income | | | — | | | | (0.04 | ) | | | (0.02 | ) | | | (0.02 | ) | | | (0.07 | ) | | | (0.10 | ) | | |
From net realized gain on investments | | | (0.19 | ) | | | (2.06 | ) | | | (1.80 | ) | | | (0.32 | ) | | | — | | | | — | | | |
| | | | | | | | | | | | | | | | | | | | | | | | | | |
| | | | | | | |
Total distributions to shareholders | | | (0.19 | ) | | | (2.10 | ) | | | (1.82 | ) | | | (0.34 | ) | | | (0.07 | ) | | | (0.10 | ) | | |
| | | | | | | | | | | | | | | | | | | | | | | | | | |
| | | | | | | |
Net asset value - End of period | | $ | 12.23 | | | $ | 12.28 | | | $ | 14.73 | | | $ | 15.39 | | | $ | 12.56 | | | $ | 11.63 | | | |
| | | | | | | | | | | | | | | | | | | | | | | | | | |
| | | | | | | |
Net assets - End of period (000’s omitted) | | $ | 25,301 | | | $ | 31,517 | | | $ | 38,166 | | | $ | 33,162 | | | $ | 17,520 | | | $ | 3,418 | | | |
| | | | | | | | | | | | | | | | | | | | | | | | | | |
| | | | | | | |
Total return3 | | | 1.17 | % | | | (2.28 | %) | | | 8.53 | % | | | 25.81 | % | | | 8.72 | % | | | 0.71 | % | | |
Ratios (to average net assets)/Supplemental Data: | | | | | | | | | | | | | | | | | | | | | | | | | | |
Expenses | | | 1.34 | %4 | | | 1.33 | % | | | 1.32 | % | | | 1.32 | % | | | 1.34 | % | | | 1.34 | % | | |
Net investment income | | | 0.05 | %4 | | | 0.20 | % | | | 0.20 | % | | | 0.14 | % | | | 0.02 | % | | | 0.04 | % | | |
Series portfolio turnover | | | 25 | % | | | 59 | % | | | 74 | % | | | 67 | % | | | 64 | % | | | 65 | % | | |
1Calculated based on average shares outstanding during the periods.
2Less than $0.01.
3Represents aggregate total return for the periods indicated, and assumes reinvestment of all distributions. Periods less than one year are not annualized.
4Annualized.
The accompanying notes are an integral part of the financial statements.
93
Notes to Financial Statements
(unaudited)
Pro-Blend® Conservative Term Series, Pro-Blend® Moderate Term Series, Pro-Blend® Extended Term Series and Pro-Blend® Maximum Term Series (each the “Series”) are no-load diversified series of Manning & Napier Fund, Inc. (the “Fund”). The Fund is organized in Maryland and is registered under the Investment Company Act of 1940 (the “1940 Act”), as amended, as an open-end management investment company.
The Series are asset allocation funds. Each invests in a combination of stocks, bonds and cash and is managed according to specific objectives. The objectives are as follows: Pro-Blend® Conservative Term Series - primary objective is preservation of capital; secondary objective is to provide income and long-term growth of capital. Pro-Blend® Moderate Term Series - equal emphasis on long-term growth of capital and preservation of capital. Pro-Blend® Extended Term Series - primary objective is long-term growth of capital; secondary objective is preservation of capital. Pro-Blend® Maximum Term Series - primary objective is long-term growth of capital.
Each Series is authorized to issue four classes of shares (Class C, R, I and S). Each class of shares is substantially the same, except that class-specific distribution and shareholder servicing expenses are borne by the specific class of shares to which they relate.
The Fund’s Advisor is Manning & Napier Advisors, LLC (the “Advisor”). Shares of each Series are offered to investors and employees of the Advisor and its affiliates. The total authorized capital stock of the Fund consists of 15 billion shares of common stock each having a par value of $0.01. As of April 30, 2016, 10.5 billion shares have been designated in total among 40 series, of which 162.5 million have been designated as Pro-Blend® Conservative Term Series Class S common stock, 75 million have been designated as Pro-Blend® Conservative Term Series Class I common stock, 125 million each have been designated as Class S common stock and Class I common stock for Pro-Blend® Moderate Term Series, 125 million each have been designated as Class S common stock for Pro-Blend® Extended Term Series and Pro-Blend® Maximum Term Series, 200 million each have been designated as Class I common stock for Pro-Blend® Extended Term Series and Pro-Blend® Maximum Term Series, 25 million each have been designated as Class C common stock for Pro-Blend® Conservative Term Series, Pro-Blend® Moderate Term Series, Pro-Blend® Extended Term Series and Pro-Blend® Maximum Term Series and 52.5 million each have been designated as Class R common stock for Pro-Blend® Conservative Term Series, Pro-Blend® Moderate Term Series, Pro-Blend® Extended Term Series and Pro-Blend® Maximum Term Series.
| 2. | Significant Accounting Policies |
The following is a summary of significant accounting policies followed by the Series. Each Series is an investment company and, accordingly, follows the investment company accounting and reporting guidance of the Financial Accounting Standards Board Accounting Standards Codification Topic 946 - Investment Companies, which is part of accounting principles generally accepted in the United States of America (“GAAP”).
Security Valuation
Portfolio securities, including domestic equities, foreign equities, warrants and options, listed on an exchange other than the NASDAQ Stock Market are valued at the latest quoted sales price of the exchange on which the security is primarily traded. Securities not traded on valuation date or securities not listed on an exchange are valued at the latest quoted bid price provided by the Fund’s pricing service. Securities listed on the NASDAQ Stock Market are valued in accordance with the NASDAQ Official Closing Price.
Debt securities, including government bonds, foreign bonds, asset-backed securities, structured notes, supranational obligations, sovereign bonds, corporate bonds and mortgage-backed securities will normally be valued on the basis of evaluated bid prices provided directly by an independent pricing service. The pricing services use multiple valuation techniques to determine fair value. In instances where sufficient market activity exists, the pricing services may utilize a market-based approach through which quotes from market makers are used to determine fair value. In instances where sufficient market activity may not exist or is limited, the pricing services also utilize proprietary valuation models which may consider market characteristics such as benchmark yield curves, option-adjusted spreads, credit spreads, estimated defaulted rates, coupon rates, anticipated timing of principal repayments, underlying collateral and other unique security features in order to estimate the relevant cash flows,
94
Notes to Financial Statements (continued)
(unaudited)
| 2. | Significant Accounting Policies (continued) |
Security Valuation (continued)
which are then discounted to calculate the fair value. Certain investments in securities held by the Series may be valued on a basis of a price provided directly by a principal market maker. These prices may differ from the value that would have been used had a broader market for securities existed.
The fair value of loan assignments is estimated using recently executed transactions, market price quotations, credit/market events, and cross-asset pricing. Inputs are generally observable market inputs obtained from independent sources. Loan assignments are generally categorized in Level 2 of the fair value hierarchy, unless key inputs are unobservable, in which case they would be categorized in Level 3.
Short-term investments that mature in sixty days or less may be valued at amortized cost, which approximates fair value. Investments in open-end investment companies are valued at their net asset value per share on valuation date.
Volume and level of activity in established markets for an asset or liability are evaluated to determine whether recent transactions and quoted prices are determinative of fair value. Where there have been significant decreases in volume and level of activity, further analysis and adjustment may be necessary to estimate fair value. The Series measure fair value in these instances by the use of inputs and valuation techniques which may be based upon current market prices of securities that are comparable in coupon, rating, maturity and industry and/or expectation of future cash flows. As a result of trading in relatively thin markets and/or markets that experience significant volatility, the prices used by the Series to value these securities may differ from the value that would be realized if these securities were sold, and the differences could be material.
Securities for which representative valuations or prices are not available from the Series’ pricing service may be valued at fair value as determined in good faith by the Advisor under procedures approved by and under the general supervision and responsibility of the Fund’s Board of Directors (the “Board”). Due to the inherent uncertainty of valuations of such securities, the fair value may differ significantly from the values that would have been used had a ready market for such securities existed. If trading or events occurring after the close of the principal market in which securities are traded are expected to materially affect the value of those securities, then they may be valued at their fair value, taking this trading or these events into account. In accordance with the procedures approved by the Board, the values of certain securities trading outside the U.S. were adjusted following the close of local trading using a factor from a third party vendor. The third party vendor uses statistical analyses and quantitative models, which consider among other things subsequent movement and changes in the prices of indices, securities and exchange rates in other markets, to determine the factors which are used to adjust local market prices. The value of securities used for net asset value calculation under these procedures may differ from published prices for the same securities. It is the Fund’s policy to classify each foreign equity security where a factor from a third party vendor is provided as a Level 2 security.
Various inputs are used in determining the value of the Series’ assets or liabilities carried at fair value. These inputs are summarized in three broad levels. Level 1 includes quoted prices in active markets for identical assets and liabilities. Level 2 includes other significant observable inputs (including quoted prices for similar securities, interest rates, prepayment speeds, credit risk, etc.). Level 3 includes significant unobservable inputs (including the Series’ own assumptions in determining the fair value of investments). A financial instruments’ level within the fair value hierarchy is based on the lowest level of any input both individually and in aggregate that is significant to their fair value measure. The inputs or methodology used for valuing securities are not necessarily an indication of the risk associated with investing in those securities.
95
Notes to Financial Statements (continued)
(unaudited)
| 2. | Significant Accounting Policies (continued) |
Security Valuation (continued)
The following is a summary of the valuation levels used for major security types as of April 30, 2016 in valuing the Series’ assets or liabilities carried at fair value:
| | | | | | | | | | | | | | | | |
| | | PRO-BLEND® CONSERVATIVE TERM SERIES | |
| DESCRIPTION | | TOTAL | | | LEVEL 1 | | | LEVEL 2 | | | LEVEL 3 | |
Assets: | | | | | | | | | | | | | | | | |
Equity securities: | | | | | | | | | | | | | | | | |
Consumer Discretionary | | $ | 75,558,756 | | | $ | 75,327,596 | | | $ | 231,160 | | | $ | — | |
Consumer Staples | | | 38,008,478 | | | | 27,116,349 | | | | 10,892,129 | | | | — | |
Energy | | | 25,978,841 | | | | 25,119,643 | | | | 859,198 | | | | — | |
Financials | | | 60,083,575 | | | | 59,549,130 | | | | 534,445 | | | | — | |
Health Care | | | 47,708,397 | | | | 45,979,350 | | | | 1,729,047 | | | | — | |
Industrials | | | 28,404,780 | | | | 28,404,780 | | | | — | | | | — | |
Information Technology | | | 101,628,272 | | | | 101,628,272 | | | | — | | | | — | |
Materials | | | 33,904,933 | | | | 33,904,933 | | | | — | | | | — | |
Telecommunication Services | | | 1,484,302 | | | | 1,484,302 | | | | — | | | | — | |
Utilities | | | 1,725,033 | | | | 1,725,033 | | | | — | | | | — | |
Debt securities: | | | | | | | | | | | | | | | | |
U.S. Treasury and other U.S. Government agencies | | | 237,161,698 | | | | — | | | | 237,161,698 | | | | — | |
Corporate debt: | | | | | | | | | | | | | | | | |
Consumer Discretionary | | | 21,575,305 | | | | — | | | | 21,575,305 | | | | — | |
Consumer Staples | | | 13,811,600 | | | | — | | | | 13,811,600 | | | | — | |
Energy | | | 27,944,822 | | | | — | | | | 27,944,822 | | | | — | |
Financials | | | 89,931,663 | | | | — | | | | 89,931,663 | | | | — | |
Health Care | | | 5,597,292 | | | | — | | | | 5,597,292 | | | | — | |
Industrials | | | 26,268,463 | | | | — | | | | 26,268,463 | | | | — | |
Information Technology | | | 8,036,488 | | | | — | | | | 8,036,488 | | | | — | |
Materials | | | 13,252,274 | | | | — | | | | 13,252,274 | | | | — | |
Telecommunication Services | | | 15,531,654 | | | | — | | | | 15,531,654 | | | | — | |
Utilities | | | 4,786,724 | | | | — | | | | 4,786,724 | | | | — | |
Asset-backed securities | | | 19,792,169 | | | | — | | | | 19,792,169 | | | | — | |
Commercial mortgage-backed securities | | | 97,607,793 | | | | — | | | | 97,607,793 | | | | — | |
Foreign government bonds | | | 25,451,588 | | | | — | | | | 25,451,588 | | | | — | |
Mutual funds | | | 52,075,130 | | | | 52,075,130 | | | | — | | | | — | |
| | | | | | | | | | | | | | | | |
Total assets | | | 1,073,310,030 | | | | 452,314,518 | | | | 620,995,512 | | | | — | |
| | | | | | | | | | | | | | | | |
Liabilities: | | | | | | | | | | | | | | | | |
Other financial instruments*: | | | | | | | | | | | | | | | | |
Equity contracts | | | (63,150 | ) | | | (63,150 | ) | | | — | | | | — | |
| | | | | | | | | | | | | | | | |
Total liabilities | | | (63,150 | ) | | | (63,150 | ) | | | — | | | | — | |
| | | | | | | | | | | | | | | | |
Total | | $ | 1,073,246,880 | | | $ | 452,251,368 | | | $ | 620,995,512 | | | $ | — | |
| | | | | | | | | | | | | | | | |
| | | | | | | | | | | | | | | | |
| | | PRO-BLEND® MODERATE TERM SERIES | |
| DESCRIPTION | | TOTAL | | | LEVEL 1 | | | LEVEL 2 | | | LEVEL 3 | |
Assets: | | | | | | | | | | | | | | | | |
Equity securities: | | | | | | | | | | | | | | | | |
Consumer Discretionary | | $ | 138,488,596 | | | $ | 131,793,225 | | | $ | 6,695,371 | | | $ | — | |
Consumer Staples | | | 57,198,085 | | | | 28,746,430 | | | | 28,451,655 | | | | — | |
Energy | | | 31,387,062 | | | | 29,871,505 | | | | 1,515,557 | | | | — | |
Financials | | | 50,291,586 | | | | 48,539,633 | | | | 1,751,953 | | | | — | |
Health Care | | | 64,584,095 | | | | 62,714,245 | | | | 1,869,850 | | | | — | |
Industrials | | | 18,389,998 | | | | 10,926,645 | | | | 7,463,353 | | | | — | |
96
Notes to Financial Statements (continued)
(unaudited)
| 2. | Significant Accounting Policies (continued) |
Security Valuation (continued)
| | | | | | | | | | | | | | | | |
| | | PRO-BLEND® MODERATE TERM SERIES | |
| DESCRIPTION | | TOTAL | | | LEVEL 1 | | | LEVEL 2 | | | LEVEL 3 | |
Information Technology | | $ | 164,981,924 | | | $ | 158,157,543 | | | $ | 6,824,381 | | | $ | — | |
Materials | | | 45,775,079 | | | | 44,533,077 | | | | 1,242,002 | | | | — | |
Telecommunication Services | | | 1,781,497 | | | | 1,519,506 | | | | 261,991 | | | | — | |
Utilities | | | 208,258 | | | | — | | | | 208,258 | | | | — | |
Debt securities: | | | | | | | | | | | | | | | | |
U.S. Treasury and other U.S. Government agencies | | | 289,837,021 | | | | — | | | | 289,837,021 | | | | — | |
Corporate debt: | | | | | | | | | | | | | | | | |
Consumer Discretionary | | | 19,632,918 | | | | — | | | | 19,632,918 | | | | — | |
Consumer Staples | | | 13,016,629 | | | | — | | | | 13,016,629 | | | | — | |
Energy | | | 24,409,886 | | | | — | | | | 24,409,886 | | | | — | |
Financials | | | 78,393,148 | | | | — | | | | 78,393,148 | | | | — | |
Health Care | | | 5,830,957 | | | | — | | | | 5,830,957 | | | | — | |
Industrials | | | 27,133,126 | | | | — | | | | 27,133,126 | | | | — | |
Information Technology | | | 7,648,198 | | | | — | | | | 7,648,198 | | | | — | |
Materials | | | 12,242,869 | | | | — | | | | 12,242,869 | | | | — | |
Telecommunication Services | | | 13,276,549 | | | | — | | | | 13,276,549 | | | | — | |
Utilities | | | 4,773,857 | | | | — | | | | 4,773,857 | | | | — | |
Asset-backed securities | | | 17,530,642 | | | | — | | | | 17,530,642 | | | | — | |
Commercial mortgage-backed securities | | | 100,959,283 | | | | — | | | | 100,959,283 | | | | — | |
Foreign government bonds | | | 26,103,468 | | | | — | | | | 26,103,468 | | | | — | |
Mutual funds | | | 46,679,866 | | | | 46,679,866 | | | | — | | | | — | |
| | | | | | | | | | | | | | | | |
Total assets | | | 1,260,554,597 | | | | 563,481,675 | | | | 697,072,922 | | | | — | |
| | | | | | | | | | | | | | | | |
Liabilities: | | | | | | | | | | | | | | | | |
Other financial instruments*: | | | | | | | | | | | | | | | | |
Equity contracts | | | (118,808 | ) | | | (118,808 | ) | | | — | | | | — | |
| | | | | | | | | | | | | | | | |
Total liabilities | | | (118,808 | ) | | | (118,808 | ) | | | — | | | | — | |
| | | | | | | | | | | | | | | | |
Total | | $ | 1,260,435,789 | | | $ | 563,362,867 | | | $ | 697,072,922 | | | $ | — | |
| | | | | | | | | | | | | | | | |
| | | | | | | | | | | | | | | | |
| | | PRO-BLEND® EXTENDED TERM SERIES | |
| DESCRIPTION | | TOTAL | | | LEVEL 1 | | | LEVEL 2 | | | LEVEL 3 | |
Assets: | | | | | | | | | | | | | | | | |
Equity securities: | | | | | | | | | | | | | | | | |
Consumer Discretionary | | $ | 174,468,233 | | | $ | 166,051,770 | | | $ | 8,416,463 | | | $ | — | |
Consumer Staples | | | 71,488,905 | | | | 35,278,536 | | | | 36,210,369 | | | | — | |
Energy | | | 39,439,788 | | | | 37,376,266 | | | | 2,063,522 | | | | — | |
Financials | | | 61,128,137 | | | | 58,827,144 | | | | 2,300,993 | | | | — | |
Health Care | | | 81,047,789 | | | | 78,814,344 | | | | 2,233,445 | | | | — | |
Industrials | | | 22,757,562 | | | | 13,351,145 | | | | 9,406,417 | | | | — | |
Information Technology | | | 209,041,473 | | | | 200,500,320 | | | | 8,541,153 | | | | — | |
Materials | | | 54,701,344 | | | | 52,963,675 | | | | 1,737,669 | | | | — | |
Telecommunication Services | | | 2,508,051 | | | | 2,172,698 | | | | 335,353 | | | | — | |
Utilities | | | 259,593 | | | | — | | | | 259,593 | | | | — | |
Debt securities: | | | | | | | | | | | | | | | | |
Loan assignments | | | 1,918,680 | | | | — | | | | 1,918,680 | | | | — | |
U.S. Treasury and other U.S. Government agencies | | | 198,467,013 | | | | — | | | | 198,467,013 | | | | — | |
Corporate debt: | | | | | | | | | | | | | | | | |
Consumer Discretionary | | | 15,396,260 | | | | — | | | | 15,396,260 | | | | — | |
Consumer Staples | | | 11,926,880 | | | | — | | | | 11,926,880 | | | | — | |
97
Notes to Financial Statements (continued)
(unaudited)
| 2. | Significant Accounting Policies (continued) |
Security Valuation (continued)
| | | | | | | | | | | | | | | | |
| | | PRO-BLEND® EXTENDED TERM SERIES | |
| DESCRIPTION | | TOTAL | | | LEVEL 1 | | | LEVEL 2 | | | LEVEL 3 | |
Energy | | $ | 24,106,743 | | | $ | — | | | $ | 24,106,743 | | | $ | — | |
Financials | | | 60,023,361 | | | | — | | | | 60,023,361 | | | | — | |
Health Care | | | 5,479,283 | | | | — | | | | 5,479,283 | | | | — | |
Industrials | | | 19,728,886 | | | | — | | | | 19,728,886 | | | | — | |
Information Technology | | | 7,135,359 | | | | — | | | | 7,135,359 | | | | — | |
Materials | | | 10,090,150 | | | | — | | | | 10,090,150 | | | | — | |
Telecommunication Services | | | 11,357,893 | | | | — | | | | 11,357,893 | | | | — | |
Utilities | | | 4,341,700 | | | | — | | | | 4,341,700 | | | | — | |
Asset-backed securities | | | 12,160,916 | | | | — | | | | 12,160,916 | | | | — | |
Commercial mortgage-backed securities | | | 70,240,593 | | | | — | | | | 70,240,593 | | | | — | |
Foreign government bonds | | | 22,781,512 | | | | — | | | | 22,781,512 | | | | — | |
Mutual funds | | | 49,802,396 | | | | 49,802,396 | | | | — | | | | — | |
| | | | | | | | | | | | | | | | |
Total assets | | | 1,241,798,500 | | | | 695,138,294 | | | | 546,660,206 | | | | — | |
| | | | | | | | | | | | | | | | |
Liabilities: | | | | | | | | | | | | | | | | |
Other financial instruments* | | | | | | | | | | | | | | | | |
Equity contracts | | | (151,812 | ) | | | (151,812 | ) | | | — | | | | — | |
| | | | | | | | | | | | | | | | |
Total liabilities | | | (151,812 | ) | | | (151,812 | ) | | | — | | | | — | |
| | | | | | | | | | | | | | | | |
Total | | $ | 1,241,646,688 | | | $ | 694,986,482 | | | $ | 546,660,206 | | | $ | — | |
| | | | | | | | | | | | | | | | |
| | | | | | | | | | | | | | | | |
| | | PRO-BLEND® MAXIMUM TERM SERIES | |
| DESCRIPTION | | TOTAL | | | LEVEL 1 | | | LEVEL 2 | | | LEVEL 3 | |
Assets: | | | | | | | | | | | | | | | | |
Equity securities: | | | | | | | | | | | | | | | | |
Consumer Discretionary | | $ | 158,419,531 | | | $ | 152,794,173 | | | $ | 5,625,358 | | | $ | — | |
Consumer Staples | | | 84,299,518 | | | | 35,592,983 | | | | 48,706,535 | | | | — | |
Energy | | | 27,318,844 | | | | 26,028,782 | | | | 1,290,062 | | | | — | |
Financials | | | 53,335,045 | | | | 52,252,061 | | | | 1,082,984 | | | | — | |
Health Care | | | 162,260,334 | | | | 152,599,002 | | | | 9,661,332 | | | | — | |
Industrials | | | 41,758,053 | | | | 35,342,498 | | | | 6,415,555 | | | | — | |
Information Technology | | | 188,073,085 | | | | 174,456,899 | | | | 13,616,186 | | | | — | |
Materials | | | 43,652,924 | | | | 42,548,166 | | | | 1,104,758 | | | | — | |
Telecommunication Services | | | 1,660,071 | | | | 1,418,975 | | | | 241,096 | | | | — | |
Utilities | | | 174,423 | | | | — | | | | 174,423 | | | | — | |
Debt securities: | | | | | | | | | | | | | | | | |
U.S. Treasury and other U.S. Government agencies | | | 14,287,542 | | | | — | | | | 14,287,542 | | | | — | |
Corporate debt: | | | | | | | | | | | | | | | | |
Consumer Discretionary | | | 4,858,612 | | | | — | | | | 4,858,612 | | | | — | |
Consumer Staples | | | 1,404,539 | | | | — | | | | 1,404,539 | | | | — | |
Energy | | | 3,509,855 | | | | — | | | | 3,509,855 | | | | — | |
Financials | | | 7,585,421 | | | | — | | | | 7,585,421 | | | | — | |
Health Care | | | 1,492,300 | | | | — | | | | 1,492,300 | | | | — | |
Industrials | | | 4,372,975 | | | | — | | | | 4,372,975 | | | | — | |
Information Technology | | | 404,387 | | | | — | | | | 404,387 | | | | — | |
Materials | | | 1,087,218 | | | | — | | | | 1,087,218 | | | | — | |
Telecommunication Services | | | 1,915,878 | | | | — | | | | 1,915,878 | | | | — | |
Utilities | | | 1,473,213 | | | | — | | | | 1,473,213 | | | | — | |
98
Notes to Financial Statements (continued)
(unaudited)
| 2. | Significant Accounting Policies (continued) |
Security Valuation (continued)
| | | | | | | | | | | | | | | | |
| | | PRO-BLEND® MAXIMUM TERM SERIES | |
| DESCRIPTION | | TOTAL | | | LEVEL 1 | | | LEVEL 2 | | | LEVEL 3 | |
Commercial mortgage-backed securities | | $ | 1,528,206 | | | $ | — | | | $ | 1,528,206 | | | $ | — | |
Foreign government bonds | | | 817,583 | | | | — | | | | 817,583 | | | | — | |
Mutual funds | | | 47,723,398 | | | | 47,723,398 | | | | — | | | | — | |
| | | | | | | | | | | | | | | | |
Total assets | | $ | 853,412,955 | | | $ | 720,756,937 | | | $ | 132,656,018 | | | $ | — | |
| | | | | | | | | | | | | | | | |
Please see the Investment Portfolio for each of the Series for foreign securities where a factor from a third party vendor was applied to determine the securities’ fair value following the close of local trading. Such securities are included in Level 2 in the table above.
There were no Level 3 securities held by any of the Pro-Blend® Series as of October 31, 2015 or April 30, 2016.
*Other financial instruments are exchange traded options (Level 1).
The Fund’s policy is to recognize transfers in and transfers out of the valuation levels as of the beginning of the reporting period. There were no significant transfers between Level 1 and Level 2 during the six months ended April 30, 2016.
Security Transactions, Investment Income and Expenses
Security transactions are accounted for on trade date. Dividend income is recorded on the ex-dividend date, except that if the ex-dividend date has passed, certain dividends from foreign securities are recorded as soon as the Series is informed of the ex-dividend date. Non-cash dividends, if any, are recorded at the fair value of the securities received. Interest income, including amortization of premium and accretion of discounts using the effective interest method, is earned from settlement date and accrued daily.
Expenses are recorded on an accrual basis. Most expenses of the Fund can be attributed to a specific series. Expenses which cannot be directly attributed are apportioned among the series in the Fund in such a manner as deemed equitable by the Fund’s Board, taking into consideration, among other things, the nature and type of expense.
Income, expenses (other than class specific expenses), and realized and unrealized gains and losses are prorated among the classes based on the relative net assets of each class. Class specific expenses are directly charged to that Class.
The Series use the identified cost method for determining realized gain or loss on investments for both financial statement and federal income tax reporting purposes.
Foreign Currency Translation
The books and records of the Series are maintained in U.S. dollars. Foreign currencies, investments and other assets and liabilities are translated into U.S. dollars at the current exchange rates. Purchases and sales of investment securities and income and expenses are translated on the respective dates of such transactions. The Series do not isolate realized and unrealized gains and losses attributable to changes in the exchange rates from gains and losses that arise from changes in the fair value of investments. Such fluctuations are included with net realized and unrealized gain or loss on investments. Net realized foreign currency gains and losses represent foreign currency gains and losses between trade date and settlement date on securities transactions, gains and losses on disposition of foreign currencies and the difference between the amount of income and foreign withholding taxes recorded on the books of the Series and the amounts actually received or paid.
Option Contracts
The Series may write (sell) or buy call or put options on securities and other financial instruments. When a Series writes a call, the Series gives the purchaser the right to buy the underlying security from the Series at the price specified in the option contract (the “exercise price”) at any time during the option period. When a Series writes a put option, the Series gives the
99
Notes to Financial Statements (continued)
(unaudited)
| 2. | Significant Accounting Policies (continued) |
Option Contracts (continued)
purchaser the right to sell to the Series the underlying security at the exercise price at any time during the option period. The Series will only write options on a “covered basis.” This means that the Series will own the underlying security when the Series writes a call or the Series will put aside cash, U.S. Government securities, or other liquid assets in an amount not less than the exercise price at all times the put option is outstanding.
When a Series writes an option, an amount equal to the premium received is reflected as a liability and is subsequently marked-to-market to reflect the current market value of the option. The Series, as a writer of an option, has no control over whether the underlying security or financial instrument may be sold (call) or purchased (put) and, as a result, bears the market risk of an unfavorable change in the price of the security or financial instrument underlying the written option. There is a risk that the Series may not be able to enter into a closing transaction because of an illiquid market.
Each Series may also purchase options in an attempt to hedge against fluctuations in the value of its portfolio and to protect against declines in the value of the securities. The premium paid by a Series for the purchase of an option is reflected as an investment and subsequently marked-to-market to reflect the current market value of the option. The risk associated with purchasing options is limited to the premium paid.
When a security is purchased or sold through an exercise of an option, the related premium paid (or received) is added to (or deducted from) the basis of the security acquired or deducted from (or added to) the proceeds of the security sold. When an option expires (or a Series enters into a closing transaction), the Series realizes a gain or loss on the option to the extent of the premium received or paid (or gain or loss to the extent the cost of the closing transaction exceeds the premium paid or received).
Futures
Each Series may purchase or sell exchange-traded futures contracts, which are contracts that obligate the Series to make or take delivery of a financial instrument or the cash value of a security index at a specified future date at a specified price. The Series may use futures contracts to manage exposure to the stock and bond markets or changes in interest rates and currency values, or for gaining exposure to markets. Risks of entering into futures contracts include the possibility that there may be an illiquid market at the time the Adviser to the Series may be attempting to sell some or all the Series holdings or that a change in the value of the contract may not correlate with changes in the value of the underlying securities. Upon entering into a futures contract, a Series is required to deposit either cash or securities (initial margin). Subsequent payments (variation margin) are made or received by the Series, generally on a daily basis. The variation margin payments are equal to the daily changes in the contract value and are recorded as unrealized gains or losses. The Series recognize a realized gain or loss when the contract is closed or expires.
Futures transactions involve minimal counterparty risk since futures contracts are guaranteed against default by the exchange on which they trade. The Series’ futures contracts are not subject to master netting arrangements (the right to close out all transactions traded with a counterparty, and net amounts owed or due across transactions).
100
Notes to Financial Statements (continued)
(unaudited)
| 2. | Significant Accounting Policies (continued) |
The following table presents the present value of derivatives held at April 30, 2016 as reflected on the Statement of Assets and Liabilities, and the effect of the derivative instruments on the Statement of Operations:
| | | | | | |
| PRO-BLEND® CONSERVATIVE TERM SERIES | |
| STATEMENT OF ASSETS AND LIABILITIES | | | | | |
Derivative | | Liabilities Location | | | | |
Equity contracts | | Options written, at value | | $ | (63,150 | ) |
| | | | | | |
| STATEMENT OF OPERATIONS | | | | | |
Derivative | | Location of Gain or (Loss) on Derivatives | |
| Realized Gain
(Loss) on
Derivatives |
|
Interest rate contracts | | Net realized gain (loss) on futures contracts | | $ | (10,954,642 | ) |
Equity contracts | | Net realized gain (loss) on options written | | $ | 63,569 | |
Derivative | | Location of Appreciation (Depreciation) on Derivatives | |
| Unrealized
Appreciation
(Depreciation)
on Derivatives |
|
Interest rate contracts | | Net change in unrealized appreciation (depreciation) on futures contracts | | $ | 1,416,619 | |
Equity contracts | | Net change in unrealized appreciation (depreciation) on options written | | $ | (47,574 | ) |
| | | | | | |
| PRO-BLEND® MODERATE TERM SERIES | |
| STATEMENT OF ASSETS AND LIABILITIES | | | | | |
Derivative | | Liabilities Location | | | | |
Equity contracts | | Options written, at value | | $ | (118,808 | ) |
| | | | | | |
| STATEMENT OF OPERATIONS | | | | | |
Derivative | | Location of Gain or (Loss) on Derivatives | |
| Realized Gain
(Loss) on
Derivatives |
|
Interest rate contracts | | Net realized gain (loss) on futures contracts | | $ | (9,912,871 | ) |
Equity contracts | | Net realized gain (loss) on options written | | $ | 115,613 | |
Derivative | | Location of Appreciation (Depreciation) on Derivatives | |
| Unrealized
Appreciation
(Depreciation)
on Derivatives |
|
Interest rate contracts | | Net change in unrealized appreciation (depreciation) on futures contracts | | $ | 1,250,569 | |
Equity contracts | | Net change in unrealized appreciation (depreciation) on options written | | $ | (89,069 | ) |
| | | | | | |
| PRO-BLEND® EXTENDED TERM SERIES | |
| STATEMENT OF ASSETS AND LIABILITIES | | | | | |
Derivative | | Liabilities Location | | | | |
Equity contracts | | Options written, at value | | $ | (151,812 | ) |
101
Notes to Financial Statements (continued)
(unaudited)
| 2. | Significant Accounting Policies (continued) |
| | | | | | |
| STATEMENT OF OPERATIONS | | | | | |
Derivative | | Location of Gain or (Loss) on Derivatives | |
| Realized Gain
(Loss) on
Derivatives |
|
Interest rate contracts | | Net realized gain (loss) on futures contracts | | | $ (6,570,097) | |
Equity contracts | | Net realized gain (loss) on options written | | | $ 148,088 | |
Derivative | | Location of Appreciation (Depreciation) on Derivatives | |
| Unrealized
Appreciation
(Depreciation)
on Derivatives |
|
Interest rate contracts | | Net change in unrealized appreciation (depreciation) on futures contracts | | | $ 838,256 | |
Equity contracts | | Net change in unrealized appreciation (depreciation) on options written | | | $ (113,883) | |
The average month-end balances for the six months ended April 30, 2016, the period in which such derivatives were outstanding, were as follows:
| | | | | | | | | | | | |
| | | PRO-BLEND®
CONSERVATIVE
TERM SERIES | | | PRO-BLEND®
MODERATE
TERM SERIES | | | PRO-BLEND®
EXTENDED
TERM SERIES | |
Futures Contracts: | | | | | | | | | |
Average number of contracts purchased | | | 2,234 | | | | 2,037 | | | | 1,337 | |
Average number of contracts sold | | | 5,737 | | | | 5,227 | | | | 3,432 | |
Average notional value of contracts purchased | | $ | 506,559,600 | | | $ | 461,899,120 | | | $ | 303,249,277 | |
Average notional value of contracts sold | | $ | 1,231,984,883 | | | $ | 1,122,388,267 | | | $ | 737,056,224 | |
Options: | | | | | | | | | | | | |
Average number of option contracts written | | | 380 | | | | 739 | | | | 905 | |
Average notional value of option contracts written | | $ | 4,264,250 | | | $ | 8,303,750 | | | $ | 10,212,500 | |
Written Option Rollforward
Transactions in options written for the six months ended April 30, 2016, were as follows:
| | | | | | | | | | | | | | | | |
PRO-BLEND® CONSERVATIVE TERM SERIES: | | CALLS | | | PUTS | |
| | CONTRACTS | | | PREMIUMS
RECEIVED | | | CONTRACTS | | | PREMIUMS
RECEIVED | |
Outstanding options, beginning of period | | | — | | | | — | | | | — | | | | — | |
Options written | | | 2,191 | | | $ | 173,421 | | | | 1,557 | | | $ | 147,872 | |
Options exercised | | | (2,160 | ) | | | (158,695 | ) | | | (613 | ) | | | (42,197 | ) |
Options expired | | | — | | | | — | | | | (120 | ) | | | (11,806 | ) |
Options closed | | | (31 | ) | | | (14,726 | ) | | | (678 | ) | | | (78,293 | ) |
| | | | | | | | | | | | | | | | |
Outstanding options, end of period | | | — | | | | — | | | | 146 | | | $ | 15,576 | |
| | | | | | | | | | | | | | | | |
102
Notes to Financial Statements (continued)
(unaudited)
| 2. | Significant Accounting Policies (continued) |
Written Option Rollforward (continued)
| | | | | | | | | | | | | | | | |
PRO-BLEND® MODERATE TERM SERIES: | | CALLS | | | PUTS | |
| | CONTRACTS | | | PREMIUMS
RECEIVED | | | CONTRACTS | | | PREMIUMS
RECEIVED | |
Outstanding options, beginning of period | | | — | | | | — | | | | — | | | | — | |
Options written | | | 4,123 | | | $ | 326,206 | | | | 2,913 | | | $ | 274,654 | |
Options exercised | | | (4,065 | ) | | | (298,655 | ) | | | (1,206 | ) | | | (83,017 | ) |
Options expired | | | — | | | | — | | | | (223 | ) | | | (21,941 | ) |
Options closed | | | (58 | ) | | | (27,551 | ) | | | (1,212 | ) | | | (139,957 | ) |
| | | | | | | | | | | | | | | | |
Outstanding options, end of period | | | — | | | | — | | | | 272 | | | $ | 29,739 | |
| | | | | | | | | | | | | | | | |
| | | | | | | | | | | | | | | | |
PRO-BLEND® EXTENDED TERM SERIES: | | CALLS | | | PUTS | |
| | CONTRACTS | | | PREMIUMS
RECEIVED | | | CONTRACTS | | | PREMIUMS
RECEIVED | |
Outstanding options, beginning of period | | | — | | | | — | | | | — | | | | — | |
Options written | | | 5,149 | | | $ | 408,413 | | | | 3,643 | | | $ | 345,367 | |
Options exercised | | | (5,074 | ) | | | (372,786 | ) | | | (1,462 | ) | | | (100,640 | ) |
Options expired | | | — | | | | — | | | | (285 | ) | | | (28,041 | ) |
Options closed | | | (75 | ) | | | (35,627 | ) | | | (1,548 | ) | | | (178,757 | ) |
| | | | | | | | | | | | | | | | |
Outstanding options, end of period | | | — | | | | — | | | | 348 | | | $ | 37,929 | |
| | | | | | | | | | | | | | | | |
Inflation-Indexed Bonds
Each Series may invest in inflation-indexed bonds. Inflation-indexed bonds are fixed income securities whose principal value is periodically adjusted according to the rate of inflation. If the index measuring inflation rises or falls, the principal value of inflation-indexed bonds will be adjusted upward or downward, and consequently the interest payable on these securities (calculated with respect to a larger or smaller principal amount) will be increased or reduced, respectively. Any upward or downward adjustment in the principal amount of an inflation-indexed bond will be included as interest income in the Statements of Operations, even though investors do not receive their principal until maturity. Repayment of the original bond principal upon maturity (as adjusted for inflation) is guaranteed in the case of U.S. Treasury inflation-indexed bonds. For bonds that do not provide a similar guarantee, the adjusted principal value of the bond repaid at maturity may be less than the original principal.
Securities Purchased on a When-Issued Basis or Forward Commitment
Each Series may purchase securities on a when-issued basis or forward commitment. These transactions involve a commitment by the Fund to purchase securities for a predetermined price with payment and delivery taking place beyond the customary settlement period. When such purchases are outstanding, the Fund will designate liquid assets in an amount sufficient to meet the purchase price. When purchasing a security on a delayed delivery basis, the Fund assumes the rights and risks of ownership of the security, including the risk of price and yield fluctuations, and take such fluctuations into account when determining their net asset value. The Fund may sell the when-issued securities before they are delivered, which may result in a capital gain or loss.
In connection with their ability to purchase or sell securities on a forward commitment basis, the Fund may enter into forward roll transactions principally using To Be Announced (TBA) securities. Forward roll transactions require the sale of securities for delivery in the current month, and a simultaneous agreement to repurchase substantially similar (same type, coupon and maturity) securities on a specified future date. Risks of entering into forward roll transactions include the potential inability of the counterparty to meet the terms of the agreement; the potential of the Fund to receive inferior securities at redelivery as compared to the securities sold to the counterparty; counterparty credit risk; and the potential pay down speed variance between the mortgage-backed pools. During the roll period, the Fund forgoes principal and interest paid on the securities. The Fund accounts for such dollar rolls as purchases and sales. No such investments were held by the Fund on April 30, 2016.
103
Notes to Financial Statements (continued)
(unaudited)
| 2. | Significant Accounting Policies (continued) |
Interest Only Securities
The Series may invest in stripped mortgage-backed securities issued by the U.S. government, its agencies and instrumentalities. Stripped mortgage-backed securities are usually structured with two classes that receive different proportions of the interest and principal distributions on a pool of mortgage assets. In certain cases, one class will receive all of the interest (the interest-only or “IO” class), while the other class will receive all of the principal (the principal-only or “PO” class). The yield to maturity on IOs is sensitive to the rate of principal repayments (including prepayments) on the related underlying mortgage assets, and principal payments may have a material effect on yield to maturity. If the underlying mortgage assets experience greater than anticipated prepayments of principal, a Series may not fully recoup its initial investment in IOs.
Restricted Securities
Restricted securities are purchased in private placement transactions, are not registered under the Securities Act of 1933, as amended, and may have contractual restrictions on resale. Information regarding restricted securities is included at the end of each applicable Series’ Investment Portfolio.
Federal Taxes
Each Series’ policy is to comply with the provisions of the Internal Revenue Code applicable to regulated investment companies. The Series are not subject to federal income tax or excise tax to the extent that each Series distributes to shareholders each year its taxable income, including any net realized gains on investments, in accordance with requirements of the Internal Revenue Code. Accordingly, no provision for federal income tax or excise tax has been made in the financial statements.
Management evaluates its tax positions to determine if the tax positions taken meet the minimum recognition threshold in connection with accounting for uncertainties in income tax positions taken or expected to be taken for the purposes of measuring and recognizing tax liabilities in the financial statements. Recognition of tax benefits of an uncertain tax position is required only when the position is “more likely than not” to be sustained assuming examination by taxing authorities. At April 30, 2016, the Series have recorded no liability for net unrecognized tax benefits relating to uncertain income tax positions taken or expected to be taken in future tax returns.
The Series file income tax returns in the U.S. federal jurisdiction, various states and foreign jurisdictions, as required. No income tax returns are currently under investigation. The statute of limitations on the Series’ tax returns remains open for the years ended October 31, 2012 through October 31, 2015. The Fund is not aware of any tax positions for which it is reasonably possible that the total amounts of unrecognized tax benefits will significantly change in the next twelve months.
Foreign Taxes
Based on the Series’ understanding of the tax rules and rates related to income, gains and currency purchase/repatriation transactions for foreign jurisdictions in which they invest, the Series will provide for foreign taxes, and where appropriate, deferred foreign tax.
Distributions of Income and Gains
Distributions to shareholders of net investment income are made semi-annually. Distributions of net realized gains are made annually. An additional distribution may be necessary to avoid taxation of a Series. Distributions are recorded on the ex-dividend date.
Indemnifications
The Fund’s organizational documents provide former and current directors and officers with a limited indemnification against liabilities arising in connection with the performance of their duties to the Fund. In the normal course of business, the Fund may also enter into contracts that provide general indemnifications. The Fund’s maximum exposure under these arrangements is unknown as this would be dependent on future claims that may be made against the Fund. The risk of material loss from such claims is considered remote.
Other
The preparation of financial statements in conformity with GAAP requires management to make estimates and assumptions that affect the reported amounts of assets and liabilities and the disclosure of contingent assets and liabilities at the date of the
104
Notes to Financial Statements (continued)
(unaudited)
| 2. | Significant Accounting Policies (continued) |
Other (continued)
financial statements and the reported amounts of income and expenses during the reporting period. Actual results could differ from those estimates.
| 3. | Transactions with Affiliates |
The Fund has an Investment Advisory Agreement (the “Agreement”) with the Advisor, for which each Series pays a fee, computed daily and payable monthly, at an annual rate of 0.60% for Pro-Blend® Conservative Term Series and 0.75% for Pro-Blend® Moderate Term Series, Pro-Blend® Extended Term Series and Pro-Blend® Maximum Term Series, of the Series’ average daily net assets.
Under the Agreement, personnel of the Advisor provide the Series with advice and assistance in the choice of investments and the execution of securities transactions, and otherwise maintain the Series’ organization. The Advisor also provides the Fund with necessary office space and fund administration and support services. The salaries of all officers of the Fund (except a percentage of the Fund’s Chief Compliance Officer’s salary, which is paid by the Fund), and of all Directors who are “affiliated persons” of the Fund, or of the Advisor, and all personnel of the Fund, or of the Advisor, performing services relating to research, statistical and investment activities, are paid by the Advisor. Each “non-affiliated” Director receives an annual stipend, which is allocated among all the active series of the Fund. In addition, these Directors also receive a fee per Board meeting attended plus a fee for each committee meeting attended and are reimbursed for travel and other out-of-pocket expenses incurred by them in connection with attending such meetings. The Fund also has an Audit Committee Chair, who receives an additional annual stipend for this role.
Class S shares of each Series are subject to a shareholder services fee in accordance with a shareholder services plan adopted by the Fund’s Board. The shareholder services fee is intended to compensate financial intermediaries, including affiliates of the Fund, in connection with the provision of direct client service, personal services, maintenance of shareholder accounts and reporting services. For these services, Class S of each Series pays a fee, computed daily and payable monthly, at an annual rate of 0.20% for Pro-Blend® Conservative Term Series Class S and 0.25% for Pro-Blend® Moderate Term Series Class S, Pro-Blend® Extended Term Series Class S and Pro-Blend® Maximum Term Series Class S, of the Class’ average daily net assets. The Fund has a Shareholder Services Agreement with the Advisor, for which the Advisor receives the shareholder services fee as stated above.
The Advisor has contractually agreed, until at least February 28, 2017, to waive its management fee and, if necessary, pay other operating expenses of the Series in order to maintain total direct annual fund operating expenses for the Series, exclusive of shareholder services fees and distribution and service fees (12b-1), at no more than the amounts presented in the following table, of average daily net assets each year.
| | | | |
| SERIES/CLASS | | EXPENSE LIMIT | |
Pro-Blend® Conservative Term Series | | | 0.70 | % |
Pro-Blend® Moderate Term Series | | | 0.85 | % |
Pro-Blend® Extended Term Series | | | 0.85 | % |
Pro-Blend® Maximum Term Series | | | 0.85 | % |
The Advisor is not eligible to recoup any expenses that have been waived or reimbursed in prior years.
Manning & Napier Investor Services, Inc., a registered broker-dealer affiliate of the Advisor, acts as distributor for the Fund’s shares. Each Series compensates the distributor for distributing and servicing the Series’ Class C and Class R shares pursuant to a distribution plan adopted under Rule 12b-1 of the 1940 Act, regardless of expenses actually incurred. Under the agreement, each Series pays distribution and services fees to the distributor at an annual rate of 1.00% of average daily net assets attributable to Class C shares and an annual rate of 0.50% of daily net assets attributable to Class R shares. There are no distribution and services fees on the Class S or Class I shares of each Series. The fees are accrued daily and paid monthly.
105
Notes to Financial Statements (continued)
(unaudited)
| 3. | Transactions with Affiliates (continued) |
Pursuant to a master services agreement dated November 1, 2014, the Fund pays the Advisor an annual fee related to fund accounting and administration of 0.0085% on the first $25 billion of average daily net assets (excluding Target Series and Strategic Income Series); 0.0075% on the next $15 billion of average daily net assets (excluding Target Series and Strategic Income Series); and 0.0065% of the average daily net assets in excess of $40 billion (excluding Target Series and Strategic Income Series); plus a base fee of $30,400 per series. Transfer agent fees are charged to the Fund on a per account basis. Additionally, certain transaction and out-of-pocket expenses, including charges for reporting relating to the Fund’s compliance program, are charged. The Advisor has agreements with BNY Mellon Investment Servicing (U.S.) Inc. (“BNY”) under which BNY serves as sub-accountant services agent and sub-transfer agent.
Expenses not directly attributable to a series are allocated based on each series’ relative net assets or number of accounts, depending on the expense.
| 4. | Purchases and Sales of Securities |
For the six months ended April 30, 2016, purchases and sales of securities, other than short-term securities, were as follows:
| | | | | | | | | | | | | | | | |
| SERIES | | PURCHASES
OTHER
ISSUERS | | | GOVERNMENT | | | SALES
OTHER
ISSUERS | | | GOVERNMENT | |
Pro-Blend® Conservative Term Series | | $ | 144,108,472 | | | $ | 91,924,883 | | | $ | 495,783,015 | | | $ | 61,559,455 | |
Pro-Blend® Moderate Term Series | | | 217,184,152 | | | | 145,868,267 | | | | 498,631,577 | | | | 166,106,042 | |
Pro-Blend® Extended Term Series | | | 208,379,001 | | | | 112,767,781 | | | | 421,183,934 | | | | 99,758,539 | |
Pro-Blend® Maximum Term Series | | | 185,759,004 | | | | 29,959,944 | | | | 334,978,094 | | | | 19,983,400 | |
| 5. | Capital Stock Transactions |
Transactions in Class S, Class I, Class C and Class R shares:
| | | | | | | | | | | | | | | | |
| PRO-BLEND® CONSERVATIVE | | FOR THE SIX MONTHS ENDED 4/30/16 | | | FOR THE YEAR ENDED 10/31/15 | |
| TERM SERIES CLASS S: | | SHARES | | | AMOUNT | | | SHARES | | | AMOUNT | |
Sold | | | 5,284,061 | | | $ | 67,671,059 | | | | 18,315,666 | | | $ | 248,325,020 | |
Reinvested | | | 657,844 | | | | 8,400,657 | | | | 4,681,003 | | | | 61,749,359 | |
Repurchased | | | (14,529,727 | ) | | | (186,216,032 | ) | | | (33,267,040 | ) | | | (444,599,445 | ) |
| | | | | | | | | | | | | | | | |
Total | | | (8,587,822 | ) | | $ | (110,144,316 | ) | | | (10,270,371 | ) | | $ | (134,525,066 | ) |
| | | | | | | | | | | | | | | | |
| | | | | | | | | | | | | | | | |
| PRO-BLEND® CONSERVATIVE | | FOR THE SIX MONTHS ENDED 4/30/16 | | | FOR THE YEAR ENDED 10/31/15 | |
| TERM SERIES CLASS I: | | SHARES | | | AMOUNT | | | SHARES | | | AMOUNT | |
Sold | | | 4,369,516 | | | $ | 43,311,272 | | | | 17,143,856 | | | $ | 177,419,658 | |
Reinvested | | | 299,638 | | | | 2,960,418 | | | | 1,644,746 | | | | 16,875,127 | |
Repurchased | | | (5,528,386 | ) | | | (54,626,382 | ) | | | (18,583,815 | ) | | | (191,941,015 | ) |
| | | | | | | | | | | | | | | | |
Total | | | (859,232 | ) | | $ | (8,354,692 | ) | | | 204,787 | | | $ | 2,353,770 | |
| | | | | | | | | | | | | | | | |
| | | | | | | | | | | | | | | | |
| PRO-BLEND® CONSERVATIVE | | FOR THE SIX MONTHS ENDED 4/30/16 | | | FOR THE YEAR ENDED 10/31/15 | |
| TERM SERIES CLASS C: | | SHARES | | | AMOUNT | | | SHARES | | | AMOUNT | |
Sold | | | 1,284,569 | | | $ | 12,276,993 | | | | 3,722,908 | | | $ | 37,470,118 | |
Reinvested | | | 125,527 | | | | 1,195,013 | | | | 942,738 | | | | 9,318,432 | |
Repurchased | | | (1,821,558 | ) | | | (17,408,728 | ) | | | (3,585,928 | ) | | | (35,861,902 | ) |
| | | | | | | | | | | | | | | | |
Total | | | (411,462 | ) | | $ | (3,936,722 | ) | | | 1,079,718 | | | $ | 10,926,648 | |
| | | | | | | | | | | | | | | | |
106
Notes to Financial Statements (continued)
(unaudited)
| 5. | Capital Stock Transactions (continued) |
| | | | | | | | | | | | | | | | |
| PRO-BLEND® CONSERVATIVE | | FOR THE SIX MONTHS ENDED 4/30/16 | | | FOR THE YEAR ENDED 10/31/15 | |
| TERM SERIES CLASS R: | | SHARES | | | AMOUNT | | | SHARES | | | AMOUNT | |
Sold | | | 272,462 | | | $ | 2,608,601 | | | | 1,906,014 | | | $ | 19,558,088 | |
Reinvested | | | 65,705 | | | | 624,200 | | | | 460,981 | | | | 4,548,790 | |
Repurchased | | | (3,555,438 | ) | | | (33,712,589 | ) | | | (2,225,645 | ) | | | (22,250,689 | ) |
| | | | | | | | | | | | | | | | |
Total | | | (3,217,271 | ) | | $ | (30,479,788 | ) | | | 141,350 | | | $ | 1,856,189 | |
| | | | | | | | | | | | | | | | |
| | | | | | | | | | | | | | | | |
| PRO-BLEND® MODERATE | | FOR THE SIX MONTHS ENDED 4/30/16 | | | FOR THE YEAR ENDED 10/31/15 | |
| TERM SERIES CLASS S: | | SHARES | | | AMOUNT | | | SHARES | | | AMOUNT | |
Sold | | | 9,647,087 | | | $ | 119,523,989 | | | | 9,841,016 | | | $ | 133,659,387 | |
Reinvested | | | 391,641 | | | | 4,989,500 | | | | 4,436,588 | | | | 58,393,337 | |
Repurchased | | | (18,730,458 | ) | | | (235,234,300 | ) | | | (16,561,522 | ) | | | (222,988,894 | ) |
| | | | | | | | | | | | | | | | |
Total | | | (8,691,730 | ) | | $ | (110,720,811 | ) | | | (2,283,918 | ) | | $ | (30,936,170 | ) |
| | | | | | | | | | | | | | | | |
| | | | | | | | | | | | | | | | |
| PRO-BLEND® MODERATE | | FOR THE SIX MONTHS ENDED 4/30/16 | | | FOR THE YEAR ENDED 10/31/15 | |
| TERM SERIES CLASS I: | | SHARES | | | AMOUNT | | | SHARES | | | AMOUNT | |
Sold | | | 9,440,383 | | | $ | 92,387,586 | | | | 22,942,326 | | | $ | 236,826,733 | |
Reinvested | | | 773,394 | | | | 7,517,392 | | | | 5,791,706 | | | | 58,397,631 | |
Repurchased | | | (19,061,402 | ) | | | (185,458,081 | ) | | | (18,328,886 | ) | | | (189,315,552 | ) |
| | | | | | | | | | | | | | | | |
Total | | | (8,847,625 | ) | | $ | (85,553,103 | ) | | | 10,405,146 | | | $ | 105,908,812 | |
| | | | | | | | | | | | | | | | |
| | | | | | | | | | | | | | | | |
| PRO-BLEND® MODERATE | | FOR THE SIX MONTHS ENDED 4/30/16 | | | FOR THE YEAR ENDED 10/31/15 | |
| TERM SERIES CLASS C: | | SHARES | | | AMOUNT | | | SHARES | | | AMOUNT | |
Sold | | | 844,594 | | | $ | 8,288,985 | | | | 3,438,701 | | | $ | 36,255,557 | |
Reinvested | | | 88,058 | | | | 867,379 | | | | 1,314,238 | | | | 13,421,637 | |
Repurchased | | | (2,080,479 | ) | | | (20,522,831 | ) | | | (3,283,675 | ) | | | (34,368,725 | ) |
| | | | | | | | | | | | | | | | |
Total | | | (1,147,827 | ) | | $ | (11,366,467 | ) | | | 1,469,264 | | | $ | 15,308,469 | |
| | | | | | | | | | | | | | | | |
| | | | | | | | | | | | | | | | |
| PRO-BLEND® MODERATE | | FOR THE SIX MONTHS ENDED 4/30/16 | | | FOR THE YEAR ENDED 10/31/15 | |
| TERM SERIES CLASS R: | | SHARES | | | AMOUNT | | | SHARES | | | AMOUNT | |
Sold | | | 292,151 | | | $ | 2,973,978 | | | | 1,147,914 | | | $ | 12,691,399 | |
Reinvested | | | 32,044 | | | | 326,848 | | | | 425,292 | | | | 4,494,502 | |
Repurchased | | | (810,315 | ) | | | (8,334,816 | ) | | | (1,757,868 | ) | | | (18,968,390 | ) |
| | | | | | | | | | | | | | | | |
Total | | | (486,120 | ) | | $ | (5,033,990 | ) | | | (184,662 | ) | | $ | (1,782,489 | ) |
| | | | | | | | | | | | | | | | |
| | | | | | | | | | | | | | | | |
| PRO-BLEND® EXTENDED | | FOR THE SIX MONTHS ENDED 4/30/16 | | | FOR THE YEAR ENDED 10/31/15 | |
| TERM SERIES CLASS S: | | SHARES | | | AMOUNT | | | SHARES | | | AMOUNT | |
Sold | | | 2,073,669 | | | $ | 32,508,537 | | | | 7,974,818 | | | $ | 135,252,614 | |
Reinvested | | | 747,971 | | | | 11,735,642 | | | | 4,108,042 | | | | 67,311,568 | |
Repurchased | | | (11,696,854 | ) | | | (182,063,679 | ) | | | (16,011,485 | ) | | | (271,259,879 | ) |
| | | | | | | | | | | | | | | | |
Total | | | (8,875,214 | ) | | $ | (137,819,500 | ) | | | (3,928,625 | ) | | $ | (68,695,697 | ) |
| | | | | | | | | | | | | | | | |
107
Notes to Financial Statements (continued)
(unaudited)
| 5. | Capital Stock Transactions (continued) |
| | | | | | | | | | | | | | | | |
| PRO-BLEND® EXTENDED | | FOR THE SIX MONTHS ENDED 4/30/16 | | | FOR THE YEAR ENDED 10/31/15 | |
| TERM SERIES CLASS I: | | SHARES | | | AMOUNT | | | SHARES | | | AMOUNT | |
Sold | | | 12,358,285 | | | $ | 109,341,733 | | | | 21,641,197 | | | $ | 215,491,078 | |
Reinvested | | | 1,065,874 | | | | 9,603,521 | | | | 5,366,866 | | | | 51,371,465 | |
Repurchased | | | (11,227,348 | ) | | | (101,258,479 | ) | | | (28,360,442 | ) | | | (278,327,588 | ) |
| | | | | | | | | | | | | | | | |
Total | | | 2,196,811 | | | $ | 17,686,775 | | | | (1,352,379 | ) | | $ | (11,465,045 | ) |
| | | | | | | | | | | | | | | | |
| | | | | | | | | | | | | | | | |
| PRO-BLEND® EXTENDED | | FOR THE SIX MONTHS ENDED 4/30/16 | | | FOR THE YEAR ENDED 10/31/15 | |
| TERM SERIES CLASS C: | | SHARES | | | AMOUNT | | | SHARES | | | AMOUNT | |
Sold | | | 1,115,647 | | | $ | 10,854,150 | | | | 3,680,325 | | | $ | 39,002,273 | |
Reinvested | | | 412,824 | | | | 3,996,140 | | | | 1,889,213 | | | | 19,333,856 | |
Repurchased | | | (2,131,321 | ) | | | (20,671,982 | ) | | | (3,063,806 | ) | | | (32,280,717 | ) |
| | | | | | | | | | | | | | | | |
Total | | | (602,850 | ) | | $ | (5,821,692 | ) | | | 2,505,732 | | | $ | 26,055,412 | |
| | | | | | | | | | | | | | | | |
| | | | | | | | | | | | | | | | |
| PRO-BLEND® EXTENDED | | FOR THE SIX MONTHS ENDED 4/30/16 | | | FOR THE YEAR ENDED 10/31/15 | |
| TERM SERIES CLASS R: | | SHARES | | | AMOUNT | | | SHARES | | | AMOUNT | |
Sold | | | 336,942 | | | $ | 3,466,454 | | | | 867,631 | | | $ | 9,809,946 | |
Reinvested | | | 92,746 | | | | 955,278 | | | | 691,037 | | | | 7,510,814 | |
Repurchased | | | (1,194,165 | ) | | | (12,552,962 | ) | | | (3,038,935 | ) | | | (33,874,880 | ) |
| | | | | | | | | | | | | | | | |
Total | | | (764,477 | ) | | $ | (8,131,230 | ) | | | (1,480,267 | ) | | $ | (16,554,120 | ) |
| | | | | | | | | | | | | | | | |
| | | | | | | | | | | | | | | | |
| PRO-BLEND® MAXIMUM | | FOR THE SIX MONTHS ENDED 4/30/16 | | | FOR THE YEAR ENDED 10/31/15 | |
| TERM SERIES CLASS S: | | SHARES | | | AMOUNT | | | SHARES | | | AMOUNT | |
Sold | | | 1,242,990 | | | $ | 21,560,453 | | | | 4,819,223 | | | $ | 91,999,830 | |
Reinvested | | | 291,242 | | | | 5,125,869 | | | | 3,256,309 | | | | 58,952,533 | |
Repurchased | | | (6,249,201 | ) | | | (109,292,469 | ) | | | (9,214,146 | ) | | | (174,772,430 | ) |
| | | | | | | | | | | | | | | | |
Total | | | (4,714,969 | ) | | $ | (82,606,147 | ) | | | (1,138,614 | ) | | $ | (23,820,067 | ) |
| | | | | | | | | | | | | | | | |
| | | | | | | | | | | | | | | | |
| PRO-BLEND® MAXIMUM | | FOR THE SIX MONTHS ENDED 4/30/16 | | | FOR THE YEAR ENDED 10/31/15 | |
| TERM SERIES CLASS I: | | SHARES | | | AMOUNT | | | SHARES | | | AMOUNT | |
Sold | | | 4,885,918 | | | $ | 46,936,561 | | | | 16,974,904 | | | $ | 179,969,886 | |
Reinvested | | | 502,044 | | | | 4,814,606 | | | | 4,503,671 | | | | 45,052,153 | |
Repurchased | | | (8,360,059 | ) | | | (79,320,974 | ) | | | (23,099,621 | ) | | | (241,883,377 | ) |
| | | | | | | | | | | | | | | | |
Total | | | (2,972,097 | ) | | $ | (27,569,807 | ) | | | (1,621,046 | ) | | $ | (16,861,338 | ) |
| | | | | | | | | | | | | | | | |
| | | | | | | | | | | | | | | | |
| PRO-BLEND® MAXIMUM | | FOR THE SIX MONTHS ENDED 4/30/16 | | | FOR THE YEAR ENDED 10/31/15 | |
| TERM SERIES CLASS C: | | SHARES | | | AMOUNT | | | SHARES | | | AMOUNT | |
Sold | | | 525,468 | | | $ | 5,274,688 | | | | 1,365,586 | | | $ | 15,240,945 | |
Reinvested | | | 98,919 | | | | 1,000,075 | | | | 842,671 | | | | 8,874,715 | |
Repurchased | | | (600,408 | ) | | | (6,104,757 | ) | | | (1,062,866 | ) | | | (11,715,030 | ) |
| | | | | | | | | | | | | | | | |
Total | | | 23,979 | | | $ | 170,006 | | | | 1,145,391 | | | $ | 12,400,630 | |
| | | | | | | | | | | | | | | | |
108
Notes to Financial Statements (continued)
(unaudited)
| 5. | Capital Stock Transactions (continued) |
| | | | | | | | | | | | | | | | |
| PRO-BLEND® MAXIMUM | | FOR THE SIX MONTHS ENDED 4/30/16 | | | FOR THE YEAR ENDED 10/31/15 | |
| TERM SERIES CLASS R: | | SHARES | | | AMOUNT | | | SHARES | | | AMOUNT | |
Sold | | | 218,511 | | | $ | 2,556,320 | | | | 775,959 | | | $ | 9,983,439 | |
Reinvested | | | 36,639 | | | | 430,504 | | | | 443,767 | | | | 5,404,603 | |
Repurchased | | | (752,023 | ) | | | (9,091,046 | ) | | | (1,244,285 | ) | | | (15,885,118 | ) |
| | | | | | | | | | | | | | | | |
Total | | | (496,873 | ) | | $ | (6,104,222 | ) | | | (24,559 | ) | | $ | (497,076 | ) |
| | | | | | | | | | | | | | | | |
At April 30, 2016, one shareholder owned 17,328,259 shares of Pro-Blend® Moderate Term Series (12.5% of shares outstanding) valued at $173,282,593. The Target 2030 Series, another series of the Fund, owned 14,222,047 shares of Pro-Blend Extended® Term Series (10.2% of shares outstanding) valued at $132,265,040. Investment activities of this shareholder may have a material effect on the Series.
| 6. | Financial Instruments and Loan Assignments |
The Series may trade in instruments including written and purchased options, forward foreign currency exchange contracts and futures contracts and other derivatives in the normal course of investing activities to assist in managing exposure to various market risks. The Series may be subject to various elements of risk which may involve, to a varying degree, elements of risk in excess of the amounts recognized for financial statement purposes. These risks include: the risk that changes in the value of a derivative may not correlate perfectly with the underlying asset, rate or index; counterparty credit risk related to over the counter derivative counterparties’ failure to perform under contract terms; liquidity risk related to the lack of a liquid market for these contracts allowing the fund to close out its position(s); and documentation risk relating to disagreement over contract terms. At April 30, 2016, Pro-Blend® Conservative Term Series, Pro-Blend® Moderate Term Series and Pro-Blend® Extended Term Series invested in options contracts (equity risk).
The Series may invest in a loan assignment of all or a portion of the loans. The Series has direct rights against the borrower on a loan when it purchases an assignment; however, the Series’ rights may be more limited than the lender from which it acquired the assignment and the Series may be able to enforce its rights only through an administrative agent. Loan assignments are vulnerable to market conditions and may become illiquid due to economic conditions or other events may reduce the demand for loan assignments and certain loan assignments which were liquid when purchased may become illiquid. Loan assignment investments held by the Series as of April 30, 2016 are disclosed in the Investment Portfolios.
Investing in securities of foreign companies and foreign governments involves special risks and considerations not typically associated with investing in securities of domestic companies and the U.S. Government. These risks include revaluation of currencies and future adverse political and economic developments. Moreover, securities of foreign companies and foreign governments and their markets may be less liquid and their prices more volatile than those of comparable domestic companies and the U.S. Government.
| 8. | Federal Income Tax Information |
The amount and characterization of certain income and capital gains to be distributed are determined in accordance with federal income tax regulations, which may differ from GAAP. Each Series may periodically make reclassifications among its capital accounts to reflect income and gains available for distribution (or available capital loss carryovers) under income tax regulations, without impacting the Series’ net asset value. Any such reclassifications are not reflected in the financial highlights.
109
Notes to Financial Statements (continued)
(unaudited)
| 8. | Federal Income Tax Information (continued) |
The final determination of the tax character of current year distributions will be made at the conclusion of the fiscal year. The tax character of distributions paid for the year ended October 31, 2015 were as follows:
| | | | | | | | | | | | | | | | |
| | | PRO-BLEND®
CONSERVATIVE
TERM SERIES | | | PRO-BLEND®
MODERATE
TERM SERIES | | | PRO-BLEND®
EXTENDED
TERM SERIES | | | PRO-BLEND®
MAXIMUM
TERM SERIES | |
Ordinary income | | $ | 38,358,300 | | | $ | 35,643,078 | | | $ | 44,669,202 | | | $ | 52,054,188 | |
Long-term capital gains | | | 67,058,671 | | | | 114,044,175 | | | | 141,837,787 | | | | 112,597,715 | |
At April 30, 2016, the identified cost of investments for federal income tax purposes, the resulting gross unrealized appreciation and depreciation, and the net unrealized appreciation were as follows:
| | | | | | | | | | | | | | | | |
| | | PRO-BLEND®
CONSERVATIVE
TERM SERIES | | | PRO-BLEND®
MODERATE
TERM SERIES | | | PRO-BLEND®
EXTENDED
TERM SERIES | | | PRO-BLEND®
MAXIMUM
TERM SERIES | |
Cost for federal income tax purposes | | $ | 1,052,638,570 | | | $ | 1,229,406,836 | | | $ | 1,207,435,846 | | | $ | 818,674,954 | |
Unrealized appreciation | | | 46,603,421 | | | | 66,849,455 | | | | 78,193,164 | | | | 74,671,863 | |
Unrealized depreciation | | | (25,931,961 | ) | | | (35,701,694 | ) | | | (43,830,510 | ) | | | (39,933,862 | ) |
| | | | | | | | | | | | | | | | |
Net unrealized appreciation | | $ | 20,671,460 | | | $ | 31,147,761 | | | $ | 34,362,654 | | | $ | 34,738,001 | |
At October 31, 2015, Pro-Blend® Conservative Term Series had net short-term capital loss carryforwards of $7,446,262, which may be carried forward indefinitely.
110
Renewal of Investment Advisory Agreement
(unaudited)
At the Manning & Napier Fund, Inc. (the “Fund”) Board of Directors’ (the “Board”) meeting, held on November 17, 2015, the Investment Advisory Agreement (the “Agreement”) between the Fund and Manning & Napier Advisors, LLC (the “Advisor”) was considered by the Board for renewal. In connection with the decision whether to renew the Agreement, a variety of material was prepared for and considered by the Board.
Representatives of the Advisor attended the meeting and presented additional oral and written information to the Board to assist the Board in its considerations. The discussion immediately below outlines the materials and information presented to the Board in connection with the Board’s 2015 Annual consideration of the Agreement and the conclusions made by the Directors when determining to continue the Agreement.
| | • | | The Board considered the services provided by the Advisor under the Agreement including, among others: deciding what securities to purchase and sell for each Series; arranging for the purchase and sale of such securities by placing orders with broker-dealers; administering the affairs of the Fund (including the books and records of the Fund not maintained by third party service providers such as the custodian or sub-transfer agent); arranging for the insurance coverage for the Fund; and supervising the preparation of tax returns, SEC filings (including registration statements) and reports to shareholders for the Fund. The Board also considered the nature and quality of such services provided under the Agreement in light of the Advisor’s services provided to the Fund for 29 years. The Board discussed the quality of these services with representatives from the Advisor and concluded that the Advisor was performing its services to the Fund required under the Agreement in a reasonable manner. |
| | • | | The Board considered the performance of each Series since its inception, as well as performance over multiple time periods. Performance for one or more of the following time periods was considered as applicable to the Series’ inception date: inception, three year, five year, ten year, and current market cycle. A market cycle includes periods of both rising and falling markets. Returns for established benchmark indices for each Series were provided. In addition, the Board considered a number of other factors relevant to performance at the meeting (and considers on a quarterly basis) including: a peer group performance analysis consisting of Morningstar universes of mutual funds with similar investment objectives, investment performance of core products, product offerings, performance on an aggregate basis vs. performance over reasonable time periods and the Advisor’s investment process. The Directors acknowledged the challenging performance and discussed the investment process of the Advisor. The Directors confirmed that qualitative factors such as the Advisor’s investment process, including recent enhancements, were an important subset to be considered as part of their consideration of performance. The Board discussed the performance with representatives from the Advisor and concluded that the investment performance of each of the Fund’s Series was reasonable based on the Series’ actual performance and comparative performance, especially for those series with performance over the current market cycle. |
| | • | | The Board considered the costs of the Advisor’s services and the profits of the Advisor as they relate to the Advisor’s services to the Fund under the Agreement. In reviewing the Advisor’s costs and profits, the Board discussed the Advisor’s revenues generated from the Fund (on both an actual and adjusted basis) and its expenses associated with providing the services under the Agreement. In addition, the Board reviewed the Advisor’s expenses associated with Fund activities outside of the Agreement (such as expense reimbursements pursuant to expense caps and payments made by the Advisor to third party platforms on which shares of the Fund are available for purchase). It was noted by representatives of the Advisor that 22 of the 36 active Series of the Fund are currently experiencing expenses above the capped expense ratios, and thus the Advisor is incurring those expenses over the cap. After discussing the above costs and profits, the Board concluded that the Advisor’s profitability relating to its services provided under the Agreement was reasonable. |
| | • | | The Board considered the fees and expenses of the various Series of the Fund. The Advisor presented the advisory fees and total expenses for each Series, including the advisory fee adjusted for any expense waivers or reimbursements (either contractual or voluntary) paid by the Advisor. The advisory fees and expense ratios of each Series were compared to an average (on both a mean and median basis) of similar funds as disclosed on the Morningstar database. Representatives of the Advisor discussed with the Board the levels of its advisory fee for each Series of the Fund and as compared to the median and mean advisory fees for similar funds as listed on Morningstar. Expense ratios for every Series, except the Tax Managed Series, Equity Income Class S, High Yield Bond Class S, Pro-Blend Series Classes C and R, and Target Series’ Classes R and K, are lower than, or substantially similar to the Morningstar mean and median reported total expense ratio. |
111
Renewal of Investment Advisory Agreement
(unaudited)
| | The higher than mean and median total expense ratios for Classes C and R reflect higher distribution, marketing and shareholder service fees payable to broker-dealers through a 100bp 12b-1 fee for Class C and a 50bp 12b-1 fee for Class R. Based on their review of the information provided, the Board concluded that the fees and expenses of each Series of the Fund were reasonable on a comparative basis. |
| | • | | The Board also considered the other benefits the Advisor derives from its relationship with the Fund. Such other benefits include certain research services provided by soft dollars. The Board reviewed the broker-dealers who provided research to the Advisor and the products and services paid for, in whole or in part, using soft dollar commissions. Given the level of soft dollar transactions involving the Fund, the Board concluded that these additional benefits to the Advisor were reasonable. |
| | • | | In addition to the factors described above, the Board considered the Advisor’s personnel, investment strategies, policies and procedures relating to compliance with personal securities transactions, reputation, expertise and resources in domestic and foreign financial markets. The Board concluded that these factors support the conclusion that the Advisor performs its services in a reasonable manner. |
| | • | | The Board then considered economies of scale and concluded that the current fee schedule to the advisory agreement remained reasonable given the multiple uses of the Fund (for the Advisor’s discretionary investment account clients in addition to direct investors), the current profitability of the Advisor’s services to the Fund under the Agreement, the number of newly established series of the Fund and the overall size of the Fund complex. |
Based on the Board’s deliberations and their evaluation of the information described above, the Board, including a majority of Directors that are not “interested persons” as defined in the Investment Company Act of 1940, concluded that the compensation under the Agreement was fair and reasonable in light of the services and expenses and such other matters as the Directors considered to be relevant in the exercise of their reasonable judgment. Accordingly, the Board approved the renewal of the Agreement. In the course of their deliberations, the Directors did not identify any particular information that was all important or controlling.
112
{This page intentionally left blank}
113
Literature Requests
(unaudited)
Proxy Voting Policies and Procedures
A description of the policies and procedures that the Fund uses to determine how to vote proxies relating to portfolio securities is available, without charge, upon request:
| | | | |
| By phone | | 1-800-466-3863 | | |
| On the Securities and Exchange | | | | |
| Commission’s (SEC) web site | | http://www.sec.gov | | |
Proxy Voting Record
Information regarding how the Fund voted proxies relating to portfolio securities during the most recent 12-month period ended June 30th is available, without charge, upon request:
| | | | |
| By phone | | 1-800-466-3863 | | |
| On the SEC’s web site | | http://www.sec.gov | | |
Quarterly Portfolio Holdings
The Series’ complete schedule of portfolio holdings for the 1st and 3rd quarters of each fiscal year are provided on Form N-Q, and are available, without charge, upon request:
| | | | |
| By phone | | 1-800-466-3863 | | |
| On the SEC’s web site | | http://www.sec.gov | | |
The Series’ Form N-Q may be reviewed and copied at the SEC’s Public Reference Room in Washington, D.C. Information on the operation of the Public Reference Room may be obtained by calling 1-800-SEC-0330.
Prospectus and Statement of Additional Information (SAI)
For more information about any of the Manning & Napier Fund, Inc. Series, you may obtain a prospectus and SAI at www.manning-napier.com or by calling (800) 466-3863. Before investing, carefully consider the objectives, risks, charges and expenses of the investment and read the prospectus carefully as it contains this and other information about the investment company. In addition, this information can be found on the SEC’s web site, http://www.sec.gov.
Additional information available at www.manning-napier.com
1. Fund Holdings - Month-End
2. Fund Holdings - Quarter-End
3. Shareholder Report - Annual
4. Shareholder Report - Semi-Annual
The Fund also offers electronic notification or “e-delivery” when certain documents are available on-line to be downloaded or reviewed. Direct shareholders can elect to receive electronic notification when shareholder reports, prospectus updates, and/or quarterly statements are available. If you do not currently have on-line access to your account, you can establish access by going to www.manning-napier.com, click on “Login” in the top corner of the page, and follow the prompts to self-enroll. Once enrolled, you can set your electronic notification preferences by clicking on the Account Options tab located within the green toolbar and then select E-Delivery Option. Should you have any questions on either how to establish on-line access or how to update your account settings, please contact Investor Services at 1-800-466-3863.
The Manning & Napier Fund, Inc. is managed by Manning & Napier Advisors, LLC. Manning & Napier Investor Services, Inc., an affiliate of Manning & Napier Advisors, LLC, is the distributor of the Fund shares.
MNPRO-04/16-SAR

Quality Equity Series
Shareholder Expense Example
(unaudited)
As a shareholder of the Series, you incur ongoing costs, including management fees, shareholder service fees and other Series expenses. This example is intended to help you understand your ongoing costs (in dollars) of investing in the Series and to compare these costs with the ongoing costs of investing in other mutual funds.
The example is based on an investment of $1,000 invested at the beginning of the period and held for the entire period (November 1, 2015 to April 30, 2016).
Actual Expenses
The Actual lines of the table below provide information about actual account values and actual expenses. You may use the information in this line, together with the amount you invested, to estimate the expenses that you paid over the period. Simply divide your account value by $1,000 (for example, an $8,600 account value divided by $1,000 = 8.6), then multiply the result by the number in the Actual line for the Class in which you have invested under the heading entitled “Expenses Paid During Period” to estimate the expenses you paid on your account during this period.
Hypothetical Example for Comparison Purposes
The Hypothetical lines of each Class in the table below provide information about hypothetical account values and hypothetical expenses based on the Class’ actual expense ratio and an assumed rate of return of 5% per year before expenses, which is not the Class’ actual return. The hypothetical account values and expenses may not be used to estimate the actual ending account balance or expenses you paid during the period. You may use this information to compare the ongoing costs of investing in the Series and other funds. To do so, compare this 5% hypothetical example for the class in which you have invested with the 5% hypothetical examples that appear in the shareholder reports of the other funds.
Please note that the expenses shown in the table are meant to highlight your ongoing costs only and do not reflect any transaction costs, such as sales charges (loads), redemptions fees, or exchange fees that you may incur in other mutual funds. Therefore, the second line of the table is useful in comparing ongoing costs only, and will not help you determine the relative total costs of owning different funds.
| | | | | | | | |
| | | BEGINNING
ACCOUNT VALUE
11/1/15 | | ENDING
ACCOUNT VALUE
4/30/16 | | EXPENSES PAID
DURING PERIOD
11/1/15-4/30/16* | | ANNUALIZED
EXPENSE RATIO |
Class S | | | | | | | | |
Actual | | $1,000.00 | | $1,001.10 | | $4.73 | | 0.95% |
Hypothetical (5% return before expenses) | | $1,000.00 | | $1,020.14 | | $4.77 | | 0.95% |
Class I | | | | | | | | |
Actual | | $1,000.00 | | $1,002.50 | | $3.49 | | 0.70% |
Hypothetical (5% return before expenses) | | $1,000.00 | | $1,021.38 | | $3.52 | | 0.70% |
*Expenses are equal to the Class’ annualized expense ratio (for the six-month period), multiplied by the average account value over the period, multiplied by 182/366 to reflect the one-half year period. The Class’ total return would have been lower had certain expenses not been waived during the period.
1
Quality Equity Series
Portfolio Composition as of April 30, 2016
(unaudited)
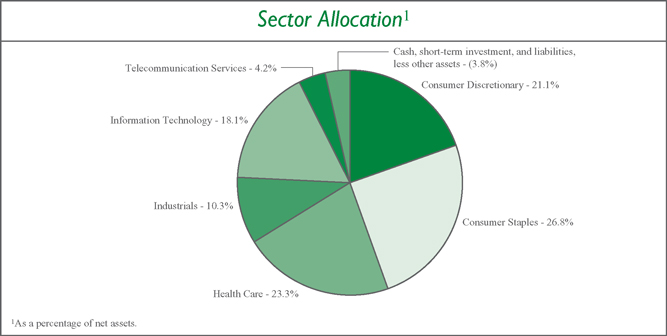
2
Quality Equity Series
Investment Portfolio - April 30, 2016
(unaudited)
| | | | | | | | |
| | | SHARES | | | VALUE
(NOTE 2) | |
| | |
COMMON STOCKS - 103.8% | | | | | | | | |
| | |
Consumer Discretionary - 21.1% | | | | | | | | |
Internet & Catalog Retail - 2.9% | | | | | | | | |
The Priceline Group, Inc.* | | | 30 | | | $ | 40,310 | |
| | | | | | | | |
Media - 5.8% | | | | | | | | |
Discovery Communications, Inc. - Class A* | | | 1,880 | | | | 51,343 | |
WPP plc (United Kingdom)1 | | | 1,230 | | | | 28,736 | |
| | | | | | | | |
| | |
| | | | | | | 80,079 | |
| | | | | | | | |
Multiline Retail - 3.2% | | | | | | | | |
Dollar General Corp. | | | 550 | | | | 45,050 | |
| | | | | | | | |
Specialty Retail - 2.8% | | | | | | | | |
Kingfisher plc (United Kingdom)1 | | | 7,230 | | | | 38,520 | |
| | | | | | | | |
Textiles, Apparel & Luxury Goods - 6.4% | | | | | | | | |
Kering (France)1 | | | 270 | | | | 46,305 | |
LVMH Moet Hennessy Louis Vuitton SE (France)1 | | | 260 | | | | 43,319 | |
| | | | | | | | |
| | |
| | | | | | | 89,624 | |
| | | | | | | | |
| | |
Total Consumer Discretionary | | | | | | | 293,583 | |
| | | | | | | | |
| | |
Consumer Staples - 26.8% | | | | | | | | |
Beverages - 10.1% | | | | | | | | |
The Coca-Cola Co. | | | 680 | | | | 30,464 | |
Diageo plc (United Kingdom)1 | | | 1,620 | | | | 43,799 | |
PepsiCo, Inc. | | | 370 | | | | 38,095 | |
Pernod Ricard S.A. (France)1 | | | 260 | | | | 28,084 | |
| | | | | | | | |
| | |
| | | | | | | 140,442 | |
| | | | | | | | |
Food & Staples Retailing - 3.4% | | | | | | | | |
CVS Health Corp. | | | 480 | | | | 48,240 | |
| | | | | | | | |
Food Products - 7.1% | | | | | | | | |
The Hershey Co. | | | 490 | | | | 45,624 | |
Mead Johnson Nutrition Co. | | | 450 | | | | 39,217 | |
Nestle S.A. (Switzerland)1 | | | 200 | | | | 14,928 | |
| | | | | | | | |
| | |
| | | | | | | 99,769 | |
| | | | | | | | |
Personal Products - 6.2% | | | | | | | | |
Beiersdorf AG (Germany)1 | | | 320 | | | | 28,735 | |
L’Oreal S.A. (France)1 | | | 240 | | | | 43,595 | |
Unilever N.V. (United Kingdom)1 | | | 310 | | | | 13,618 | |
| | | | | | | | |
| | |
| | | | | | | 85,948 | |
| | | | | | | | |
| | |
Total Consumer Staples | | | | | | | 374,399 | |
| | | | | | | | |
Health Care - 23.3% | | | | | | | | |
Health Care Equipment & Supplies - 4.9% | | | | | | | | |
Baxter International, Inc. | | | 510 | | | | 22,552 | |
The accompanying notes are an integral part of the financial statements.
3
Quality Equity Series
Investment Portfolio - April 30, 2016
(unaudited)
| | | | | | | | |
| | | | | | VALUE | |
| | | SHARES | | | (NOTE 2) | |
| | |
COMMON STOCKS (continued) | | | | | | | | |
| | |
Health Care (continued) | | | | | | | | |
Health Care Equipment & Supplies (continued) | | | | | | | | |
Medtronic plc | | | 580 | | | $ | 45,907 | |
| | | | | | | | |
| | |
| | | | | | | 68,459 | |
| | | | | | | | |
Health Care Providers & Services - 6.8% | | | | | | | | |
Express Scripts Holding Co.* | | | 780 | | | | 57,509 | |
McKesson Corp. | | | 220 | | | | 36,921 | |
| | | | | | | | |
| | |
| | | | | | | 94,430 | |
| | | | | | | | |
Pharmaceuticals - 11.6% | | | | | | | | |
Bayer AG (Germany)1 | | | 190 | | | | 21,958 | |
Johnson & Johnson | | | 330 | | | | 36,986 | |
Merck & Co., Inc. | | | 270 | | | | 14,807 | |
Novartis AG (Switzerland)1 | | | 590 | | | | 44,900 | |
Roche Holding AG (Switzerland)1 | | | 170 | | | | 43,011 | |
| | | | | | | | |
| | |
| | | | | | | 161,662 | |
| | | | | | | | |
| | |
Total Health Care | | | | | | | 324,551 | |
| | | | | | | | |
Industrials - 10.3% | | | | | | | | |
Machinery - 3.4% | | | | | | | | |
Flowserve Corp. | | | 970 | | | | 47,346 | |
| | | | | | | | |
Professional Services - 6.9% | | | | | | | | |
Experian plc (Ireland)1 | | | 2,440 | | | | 44,713 | |
Nielsen Holdings plc | | | 1,000 | | | | 52,140 | |
| | | | | | | | |
| | |
| | | | | | | 96,853 | |
| | | | | | | | |
| | |
Total Industrials | | | | | | | 144,199 | |
| | | | | | | | |
Information Technology - 18.1% | | | | | | | | |
Communications Equipment - 2.6% | | | | | | | | |
Cisco Systems, Inc. | | | 1,320 | | | | 36,287 | |
| | | | | | | | |
IT Services - 4.8% | | | | | | | | |
MasterCard, Inc. - Class A | | | 350 | | | | 33,946 | |
Visa, Inc. - Class A | | | 420 | | | | 32,441 | |
| | | | | | | | |
| | |
| | | | | | | 66,387 | |
| | | | | | | | |
Semiconductors & Semiconductor Equipment - 4.2% | | | | | | | | |
QUALCOMM, Inc. | | | 1,160 | | | | 58,603 | |
| | | | | | | | |
Software - 6.5% | | | | | | | | |
Microsoft Corp. | | | 810 | | | | 40,395 | |
Oracle Corp. | | | 1,280 | | | | 51,021 | |
| | | | | | | | |
| | |
| | | | | | | 91,416 | |
| | | | | | | | |
| | |
Total Information Technology | | | | | | | 252,693 | |
| | | | | | | | |
The accompanying notes are an integral part of the financial statements.
4
Quality Equity Series
Investment Portfolio - April 30, 2016
(unaudited)
| | | | | | | | |
| | | | | | VALUE | |
| | | SHARES | | | (NOTE 2) | |
| | |
COMMON STOCKS (continued) | | | | | | | | |
| | |
Telecommunication Services - 4.2% | | | | | | | | |
Diversified Telecommunication Services - 4.2% | | | | | | | | |
Singapore Telecommunications Ltd.1 | | | 10,140 | | | $ | 29,004 | |
Telenor ASA (Norway)1 | | | 1,720 | | | | 29,595 | |
| | | | | | | | |
Total Telecommunication Services | | | | | | | 58,599 | |
| | | | | | | | |
TOTAL COMMON STOCKS | | | | | | | | |
(Identified Cost $1,435,395) | | | | | | | 1,448,024 | |
| | | | | | | | |
| | |
SHORT-TERM INVESTMENT - 2.6% | | | | | | | | |
Dreyfus Cash Management, Inc. - Institutional Shares2, 0.29% | | | | | | | | |
(Identified Cost $36,004) | | | 36,004 | | | | 36,004 | |
| | | | | | | | |
TOTAL INVESTMENTS - 106.4% | | | | | | | | |
(Identified Cost $1,471,399) | | | | | | | 1,484,028 | |
LIABILITIES, LESS OTHER ASSETS - (6.4%) | | | | | | | (89,425 | ) |
| | | | | | | | |
| | |
NET ASSETS - 100% | | | | | | $ | 1,394,603 | |
| | | | | | | | |
*Non-income producing security.
1A factor from a third party vendor was applied to determine the security’s fair value following the close of local trading.
2Rate shown is the current yield as of April 30, 2016.
The Global Industry Classification Standard (GICS) was developed by and is the exclusive property and a service mark of MSCI Inc. (MSCI) and Standard & Poor’s, a division of The McGraw-Hill Companies, Inc. (S&P), and is licensed for use by Manning & Napier when referencing GICS sectors. Neither MSCI, S&P, nor any third party involved in making or compiling the GICS or any GICS classifications makes any express or implied warranties or representations with respect to such standard or classification, nor shall any such party have any liability therefrom.
The accompanying notes are an integral part of the financial statements.
5
Quality Equity Series
Statement of Assets & Liabilities
April 30, 2016 (unaudited)
| | | | |
ASSETS: | | | | |
| |
Investments, at value (identified cost $1,471,399) (Note 2) | | $ | 1,484,028 | |
Dividends receivable | | | 1,072 | |
Foreign tax reclaims receivable | | | 658 | |
| | | | |
| |
TOTAL ASSETS | | | 1,485,758 | |
| | | | |
| |
LIABILITIES: | | | | |
| |
Due to investment advisor | | | 55,806 | |
Accrued fund accounting and administration fees (Note 3) | | | 13,182 | |
Accrued Chief Compliance Officer service fees (Note 3) | | | 381 | |
Accrued shareholder services fees (Class S) (Note 3) | | | 178 | |
Accrued transfer agent fees (Note 3) | | | 100 | |
Audit fees payable | | | 18,116 | |
Other payables and accrued expenses | | | 3,392 | |
| | | | |
| |
TOTAL LIABILITIES | | | 91,155 | |
| | | | |
| |
TOTAL NET ASSETS | | $ | 1,394,603 | |
| | | | |
| |
NET ASSETS CONSIST OF: | | | | |
| |
Capital stock | | $ | 915 | |
Additional paid-in-capital | | | 1,401,471 | |
Undistributed net investment income | | | 5,750 | |
Accumulated net realized loss on investments, foreign currency and translation of other assets and liabilities | | | (26,185 | ) |
Net unrealized appreciation on investments, foreign currency and translation of other assets and liabilities | | | 12,652 | |
| | | | |
| |
TOTAL NET ASSETS | | $ | 1,394,603 | |
| | | | |
NET ASSET VALUE, OFFERING PRICE AND REDEMPTION PRICE PER SHARE - Class S | | | | |
($899,530/91,524 shares) | | $ | 9.83 | |
| | | | |
NET ASSET VALUE, OFFERING PRICE AND REDEMPTION PRICE PER SHARE - Class I | | | | |
($495,073/50,326 shares) | | $ | 9.84 | |
| | | | |
The accompanying notes are an integral part of the financial statements.
6
Quality Equity Series
Statement of Operations
For the Six Months Ended April 30, 2016 (unaudited)
| | | | |
INVESTMENT INCOME: | | | | |
| |
Dividends (net of foreign taxes withheld, $1,183) | | $ | 13,435 | |
| | | | |
| |
EXPENSES: | | | | |
| |
Fund accounting and administration fees (Note 3) | | | 20,500 | |
Management fees (Note 3) | | | 3,358 | |
Chief Compliance Officer service fees (Note 3) | | | 1,258 | |
Shareholder services fees (Class S)(Note 3) | | | 934 | |
Transfer agent fees (Note 3) | | | 187 | |
Directors’ fees (Note 3) | | | 51 | |
Audit fees | | | 15,708 | |
Registration fees | | | 3,574 | |
Custodian fees | | | 3,001 | |
Printing and postage fees | | | 3,843 | |
Miscellaneous | | | 2,194 | |
| | | | |
| |
Total Expenses | | | 54,608 | |
Less reduction of expenses (Note 3) | | | (49,400 | ) |
| | | | |
| |
Net Expenses | | | 5,208 | |
| | | | |
| |
NET INVESTMENT INCOME | | | 8,227 | |
| | | | |
| |
REALIZED AND UNREALIZED GAIN (LOSS) ON INVESTMENTS AND FOREIGN CURRENCY: | | | | |
| |
Net realized loss on- | | | | |
Investments | | | (12,656 | ) |
Foreign currency and translation of other assets and liabilities | | | (35 | ) |
| | | | |
| |
| | | (12,691 | ) |
| | | | |
Net change in unrealized appreciation (depreciation) on- | | | | |
Investments | | | 10,472 | |
Foreign currency and translation of other assets and liabilities | | | 17 | |
| | | | |
| |
| | | 10,489 | |
| | | | |
| |
NET REALIZED AND UNREALIZED GAIN (LOSS) ON INVESTMENTS AND FOREIGN CURRENCY | | | (2,202 | ) |
| | | | |
| |
NET INCREASE IN NET ASSETS RESULTING FROM OPERATIONS | | $ | 6,025 | |
| | | | |
The accompanying notes are an integral part of the financial statements.
7
Quality Equity Series
Statement of Changes in Net Assets
| | | | | | | | |
| | | FOR THE SIX
MONTHS ENDED
4/30/16
(UNAUDITED) | | | FOR THE
PERIOD 6/1/15*
TO 10/31/15 | |
INCREASE (DECREASE) IN NET ASSETS: | | | | | | | | |
| | |
OPERATIONS: | | | | | | | | |
Net investment income | | $ | 8,227 | | | $ | 4,306 | |
Net realized gain (loss) on investments and foreign currency | | | (12,691 | ) | | | (13,523 | ) |
Net change in unrealized appreciation (depreciation) on investments and foreign currency | | | 10,489 | | | | 2,163 | |
| | | | | | | | |
| | |
Net decrease from operations | | | 6,025 | | | | (7,054 | ) |
| | | | | | | | |
| | |
DISTRIBUTIONS TO SHAREHOLDERS (Note 8): | | | | | | | | |
| | |
From net investment income (Class S) | | | (3,654 | ) | | | — | |
From net investment income (Class I) | | | (3,100 | ) | | | — | |
| | | | | | | | |
| | |
Total distributions to shareholders | | | (6,754 | ) | | | — | |
| | | | | | | | |
| | |
CAPITAL STOCK ISSUED AND REPURCHASED: | | | | | | | | |
| | |
Net increase from capital share transactions (Note 5) | | | 167,987 | | | | 1,234,399 | |
| | | | | | | | |
| | |
Net increase in net assets | | | 167,258 | | | | 1,227,345 | |
| | |
NET ASSETS: | | | | | | | | |
| | |
Beginning of period | | | 1,227,345 | | | | — | |
| | | | | | | | |
| | |
End of period (including undistributed net investment income of $5,750 and $4,277, respectively) | | $ | 1,394,603 | | | $ | 1,227,345 | |
| | | | | | | | |
*Commencement of operations.
The accompanying notes are an integral part of the financial statements.
8
Quality Equity Series
Financial Highlights - Class S
| | | | | | | | |
| | | FOR THE SIX
MONTHS
ENDED
4/30/16
(UNAUDITED) | | | FOR THE PERIOD
6/01/151 TO
10/31/15 | |
Per share data (for a share outstanding throughout the period): | | | | | | | | |
Net asset value - Beginning of period | | $ | 9.87 | | | $ | 10.00 | |
| | | | | | | | |
Income (loss) from investment operations: | | | | | | | | |
Net investment income2 | | | 0.06 | | | | 0.03 | |
Net realized and unrealized loss on investments | | | (0.05 | ) | | | (0.16 | ) |
| | | | | | | | |
| | |
Total from investment operations | | | 0.01 | | | | (0.13 | ) |
| | | | | | | | |
| | |
Less distributions to shareholders: | | | | | | | | |
From net investment income | | | (0.05 | ) | | | — | |
| | | | | | | | |
| | |
Net asset value - End of period | | $ | 9.83 | | | $ | 9.87 | |
| | | | | | | | |
| | |
Net assets - End of period (000’s omitted) | | $ | 900 | | | $ | 733 | |
| | | | | | | | |
| | |
Total return3 | | | 0.11 | % | | | (1.30 | %) |
Ratios (to average net assets)/Supplemental Data: | | | | | | | | |
Expenses* | | | 0.95 | %4 | | | 0.95 | %4 |
Net investment income | | | 1.25 | %4 | | | 0.81 | %4 |
Portfolio turnover | | | 22 | % | | | 26 | % |
|
| *The investment advisor did not impose all or a portion of its management and/or other fees, and in some periods may have paid a portion of the Series’ expenses. If these expenses had been incurred by the Class, the expense ratio (to average net assets) would have increased by the following amount: | |
| | | 7.31 | %4 | | | 14.21 | %4 |
1Commencement of operations.
2Calculated based on average shares outstanding during the periods.
3Represents aggregate total return for the period indicated, and assumes reinvestment of all distributions. Periods less than one year are not annualized.
4Annualized.
The accompanying notes are an integral part of the financial statements.
9
Quality Equity Series
Financial Highlights - Class I
| | | | | | | | |
| | | FOR THE SIX
MONTHS
ENDED
4/30/16
(UNAUDITED) | | | FOR THE PERIOD
6/01/151 TO
10/31/15 | |
Per share data (for a share outstanding throughout the period): | | | | | | | | |
Net asset value - Beginning of period | | $ | 9.88 | | | $ | 10.00 | |
| | | | | | | | |
Income (loss) from investment operations: | | | | | | | | |
Net investment income2 | | | 0.07 | | | | 0.04 | |
Net realized and unrealized loss on investments | | | (0.05 | ) | | | (0.16 | ) |
| | | | | | | | |
| | |
Total from investment operations | | | 0.02 | | | | (0.12 | ) |
| | | | | | | | |
| | |
Less distributions to shareholders: | | | | | | | | |
From net investment income | | | (0.06 | ) | | | — | |
| | | | | | | | |
| | |
Net asset value - End of period | | $ | 9.84 | | | $ | 9.88 | |
| | | | | | | | |
| | |
Net assets - End of period (000’s omitted) | | $ | 495 | | | $ | 494 | |
| | | | | | | | |
| | |
Total return3 | | | 0.25 | % | | | (1.20 | %) |
Ratios (to average net assets)/Supplemental Data: | | | | | | | | |
Expenses* | | | 0.70 | %4 | | | 0.70 | %4 |
Net investment income | | | 1.50 | %4 | | | 1.07 | %4 |
Portfolio turnover | | | 22 | % | | | 26 | % |
|
| *The investment advisor did not impose all or a portion of its management and/or other fees, and in some periods may have paid a portion of the Series’ expenses. If these expenses had been incurred by the Class, the expense ratio (to average net assets) would have increased by the following amount: | |
| | | 9.32 | %4 | | | 14.21 | %4 |
1Commencement of operations.
2Calculated based on average shares outstanding during the periods.
3Represents aggregate total return for the period indicated, and assumes reinvestment of all distributions. Periods less than one year are not annualized.
4Annualized.
The accompanying notes are an integral part of the financial statements.
10
Quality Equity Series
Notes to Financial Statements
(unaudited)
Quality Equity Series (the “Series”) is a no-load diversified series of Manning & Napier Fund, Inc. (the “Fund”). The Fund is organized in Maryland and is registered under the Investment Company Act of 1940, as amended, as an open-end management investment company.
The Series’ primary investment objective is to provide long-term growth.
The Fund’s advisor is Manning & Napier Advisors, LLC (the “Advisor”). Shares of the Series are offered to investors, clients and employees of the Advisor and its affiliates. The Series is authorized to issue two classes of shares (Class S and Class I). Each class of shares is substantially the same, except that Class S shares bear shareholder services fees. The total authorized capital stock of the Fund consists of 15 billion shares of common stock each having a par value of $0.01. As of April 30, 2016, 10.5 billion shares have been designated in total among 40 series, of which 100 million have been designated as Quality Equity Series Class S common stock, and 100 million have been designated as Quality Equity Series Class I common stock.
| 2. | Significant Accounting Policies |
The following is a summary of significant accounting policies followed by the Series. The Series is an investment company and, accordingly, follows the investment company accounting and reporting guidance of the Financial Accounting Standards Board Accounting Standards Codification Topic 946 - Investment Companies, which is part of accounting principles generally accepted in the United States of America (“GAAP”).
Security Valuation
Portfolio securities, including domestic equities, foreign equities, warrants and options, listed on an exchange other than the NASDAQ Stock Market are valued at the latest quoted sales price of the exchange on which the security is primarily traded. Securities not traded on valuation date or securities not listed on an exchange are valued at the latest quoted bid price provided by the Fund’s pricing service. Securities listed on the NASDAQ Stock Market are valued in accordance with the NASDAQ Official Closing Price.
Short-term investments that mature in sixty days or less may be valued at amortized cost, which approximates fair value. Investments in open-end investment companies are valued at their net asset value per share on valuation date.
Volume and level of activity in established markets for an asset or liability are evaluated to determine whether recent transactions and quoted prices are determinative of fair value. Where there have been significant decreases in volume and level of activity, further analysis and adjustment may be necessary to estimate fair value. The Series measures fair value in these instances by the use of inputs and valuation techniques which may be based upon current market prices of securities that are comparable in coupon, rating, maturity and industry and/or expectation of future cash flows. As a result of trading in relatively thin markets and/or markets that experience significant volatility, the prices used by the Series to value these securities may differ from the value that would be realized if these securities were sold, and the differences could be material.
Securities for which representative valuations or prices are not available from the Series’ pricing service may be valued at fair value as determined in good faith by the Advisor under procedures approved by and under the general supervision and responsibility of the Fund’s Board of Directors (the “Board”). Due to the inherent uncertainty of valuations of such securities, the fair value may differ significantly from the values that would have been used had a ready market for such securities existed. If trading or events occurring after the close of the principal market in which securities are traded are expected to materially affect the value of those securities, then they may be valued at their fair value, taking this trading or these events into account. In accordance with the procedures approved by the Board, the values of certain securities trading outside the U.S. were adjusted following the close of local trading using a factor from a third party vendor. The third party vendor uses statistical analyses and quantitative models, which consider among other things subsequent movement and changes in the prices of indices, securities and exchange rates in other markets, to determine the factors which are used to adjust local market prices. The value of securities used for net asset value calculation under these procedures may differ from published prices for the same securities. It is the Fund’s policy to classify each foreign equity security where a factor from a third party vendor is provided as a Level 2 security.
11
Quality Equity Series
Notes to Financial Statements (continued)
(unaudited)
| 2. | Significant Accounting Policies (continued) |
Security Valuation (continued)
Various inputs are used in determining the value of the Series’ assets or liabilities carried at fair value. These inputs are summarized in three broad levels. Level 1 includes quoted prices in active markets for identical assets and liabilities. Level 2 includes other significant observable inputs (including quoted prices for similar securities, interest rates, prepayment speeds, credit risk, etc.). Level 3 includes significant unobservable inputs (including the Series’ own assumptions in determining the fair value of investments). A financial instrument’s level within the fair value hierarchy is based on the lowest level of any input both individually and in aggregate that is significant to the fair value measurement. The inputs or methodology used for valuing securities are not necessarily an indication of the risk associated with investing in those securities.
The following is a summary of the valuation levels used for major security types as of April 30, 2016 in valuing the Series’ assets or liabilities carried at fair value:
| | | | | | | | | | | | | | | | |
| DESCRIPTION | | TOTAL | | | LEVEL 1 | | | LEVEL 2 | | | LEVEL 3 | |
Assets: | | | | | | | | | | | | | | | | |
Equity securities: | | | | | | | | | | | | | | | | |
Consumer Discretionary | | $ | 293,583 | | | $ | 136,703 | | | $ | 156,880 | | | $ | — | |
Consumer Staples | | | 374,399 | | | | 201,640 | | | | 172,759 | | | | — | |
Health Care | | | 324,551 | | | | 214,682 | | | | 109,869 | | | | — | |
Industrials | | | 144,199 | | | | 99,486 | | | | 44,713 | | | | — | |
Information Technology | | | 252,693 | | | | 252,693 | | | | — | | | | — | |
Telecommunication Services | | | 58,599 | | | | — | | | | 58,599 | | | | — | |
Mutual fund | | | 36,004 | | | | 36,004 | | | | — | | | | — | |
| | | | | | | | | | | | | | | | |
Total assets | | $ | 1,484,028 | | | $ | 941,208 | | | $ | 542,820 | | | $ | — | |
| | | | | | | | | | | | | | | | |
Please see the Investment Portfolio for foreign securities where a factor from a third party vendor was applied to determine the securities’ fair value following the close of local trading. Such securities are included in Level 2 in the table above.
There were no Level 3 securities held by the Series as of October 31, 2015 or April 30, 2016.
The Fund’s policy is to recognize transfers in and transfers out of the valuation levels as of the beginning of the reporting period. There were no transfers between Level 1 and Level 2 during the six months ended April 30, 2016.
Security Transactions, Investment Income and Expenses
Security transactions are accounted for on trade date. Dividend income is recorded on the ex-dividend date, except that if the ex-dividend date has passed, certain dividends from foreign securities are recorded as soon as the Series is informed of the ex-dividend date. Non-cash dividends, if any, are recorded at the fair value of the securities received. Interest income, including amortization of premium and accretion of discounts using the effective interest method, is earned from settlement date and accrued daily.
Expenses are recorded on an accrual basis. Most expenses of the Fund can be attributed to a specific series. Expenses which cannot be directly attributed are apportioned among the series in the Fund in such a manner as deemed equitable by the Fund’s Board, taking into consideration, among other things, the nature and type of expense. Income, expenses (other than shareholder services fees), and realized and unrealized gains and losses are prorated among the classes based on the relative net assets of each class. Class specific expenses are directly charged to that class.
The Series uses the identified cost method for determining realized gain or loss on investments for both financial statement and federal income tax reporting purposes.
Foreign Currency Translation
The books and records of the Series are maintained in U.S. dollars. Foreign currencies, investments and other assets and liabilities are translated into U.S. dollars at the current exchange rates. Purchases and sales of investment securities and income and expenses are translated on the respective dates of such transactions. The Series does not isolate realized and
12
Quality Equity Series
Notes to Financial Statements (continued)
(unaudited)
| 2. | Significant Accounting Policies (continued) |
Foreign Currency Translation (continued)
unrealized gains and losses attributable to changes in the exchange rates from gains and losses that arise from changes in the fair value of investments. Such fluctuations are included with net realized and unrealized gain or loss on investments. Net realized foreign currency gains and losses represent foreign currency gains and losses between trade date and settlement date on securities transactions, gains and losses on disposition of foreign currencies and the difference between the amount of income and foreign withholding taxes recorded on the books of the Series and the amounts actually received or paid.
Federal Taxes
The Series’ policy is to comply with the provisions of the Internal Revenue Code applicable to regulated investment companies. The Series is not subject to federal income tax or excise tax to the extent that the Series distributes to shareholders each year its taxable income, including any net realized gains on investments, in accordance with requirements of the Internal Revenue Code. Accordingly, no provision for federal income tax or excise tax has been made in the financial statements.
Management evaluates its tax positions to determine if the tax positions taken meet the minimum recognition threshold in connection with accounting for uncertainties in income tax positions taken or expected to be taken for the purposes of measuring and recognizing tax liabilities in the financial statements. Recognition of tax benefits of an uncertain tax position is required only when the position is “more likely than not” to be sustained assuming examination by taxing authorities. At April 30, 2016, the Series has recorded no liability for net unrecognized tax benefits relating to uncertain income tax positions taken or expected to be taken in future tax returns.
The Series files income tax returns in the U.S. federal jurisdiction, various states and foreign jurisdictions, as required. No income tax returns are currently under investigation. The statute of limitations on the Series’ tax returns remains open for the period ended October 31, 2015. The Series is not aware of any tax positions for which it is reasonably possible that the total amounts of unrecognized tax benefits will significantly change in the next twelve months.
Foreign Taxes
Based on the Series’ understanding of the tax rules and rates related to income, gains and currency purchase/repatriation transactions for foreign jurisdictions in which it invests, the Series will provide for foreign taxes, and where appropriate, deferred foreign tax.
Distributions of Income and Gains
Distributions to shareholders of net investment income and net realized gains are made annually. An additional distribution may be necessary to avoid taxation of the Series. Distributions are recorded on the ex-dividend date.
Indemnifications
The Fund’s organizational documents provide former and current directors and officers with a limited indemnification against liabilities arising in connection with the performance of their duties to the Fund. In the normal course of business, the Fund may also enter into contracts that provide general indemnifications. The Fund’s maximum exposure under these arrangements is unknown as this would be dependent on future claims that may be made against the Fund. The risk of material loss from such claims is considered remote.
Other
The preparation of financial statements in conformity with GAAP requires management to make estimates and assumptions that affect the reported amounts of assets and liabilities and the disclosure of contingent assets and liabilities at the date of the financial statements and the reported amounts of income and expenses during the reporting period. Actual results could differ from those estimates.
| 3. | Transactions with Affiliates |
The Fund has an Investment Advisory Agreement (the “Agreement”) with the Advisor for which the Series pays a fee, computed daily and payable monthly, at an annual rate of 0.55% of the Series’ average daily net assets.
13
Quality Equity Series
Notes to Financial Statements (continued)
(unaudited)
| 3. | Transactions with Affiliates (continued) |
Under the Agreement, personnel of the Advisor provide the Series with advice and assistance in the choice of investments and the execution of securities transactions, and otherwise maintain the Series’ organization. The Advisor also provides the Fund with necessary office space and fund administration and support services. The salaries of all officers of the Fund (except a percentage of the Fund’s Chief Compliance Officer’s salary, which is paid by the Fund), and of all Directors who are “affiliated persons” of the Fund, or of the Advisor, and all personnel of the Fund, or of the Advisor, performing services relating to research, statistical and investment activities, are paid by the Advisor. Each “non-affiliated” Director receives an annual stipend, which is allocated among all the active series of the Fund. In addition, these Directors also receive a fee per Board meeting attended plus a fee for each committee meeting attended and are reimbursed for travel and other out-of-pocket expenses incurred by them in connection with attending such meetings. The Fund also has an Audit Committee Chair, who receives an additional annual stipend for this role.
The Class S shares of the Series are subject to a shareholder services fee in accordance with a shareholder services plan adopted by the Fund’s Board. The shareholder services fee is intended to compensate financial intermediaries, including affiliates of the Fund, in connection with the provision of direct client service, personal services, maintenance of shareholder accounts and reporting services. For these services, Class S of the Series pays a fee, computed daily and payable monthly, at an annual rate of 0.25% of the average daily net assets of Class S. The Fund has a Shareholder Services Agreement with the Advisor, for which the Advisor receives the shareholder services fee as stated above.
The Advisor has contractually agreed, until at least February 28, 2017, to waive its fee and, if necessary, pay other operating expenses of the Series in order to maintain total direct annual fund operating expenses for the Series exclusive of each share class’ shareholder services fee, at no more than 0.70% of average daily net assets. Accordingly, the Advisor waived fees of $49,400 for the six months ended April 30, 2016, which is included as a reduction of expenses on the Statement of Operations. The Advisor is not eligible to recoup any expenses that have been waived or reimbursed in prior years.
Manning & Napier Investor Services, Inc., a registered broker-dealer affiliate of the Advisor, acts as distributor for the Fund’s shares. The services of Manning & Napier Investor Services, Inc. are provided at no additional cost to the Series.
Pursuant to a master services agreement dated November 1, 2014, the Fund pays the Advisor an annual fee related to fund accounting and administration of 0.0085% on the first $25 billion of average daily net assets (excluding Target Series and Strategic Income Series); 0.0075% on the next $15 billion of average daily net assets (excluding Target Series and Strategic Income Series); and 0.0065% of the average daily net assets in excess of $40 billion (excluding Target Series and Strategic Income Series); plus a base fee of $30,400 per series. Transfer agent fees are charged to the Fund on a per account basis. Additionally, certain transaction and out-of-pocket expenses, including charges for reporting relating to the Fund’s compliance program, are charged. The Advisor has agreements with BNY Mellon Investment Servicing (U.S.) Inc. (“BNY”) under which BNY serves as sub-accountant services agent and sub-transfer agent.
Expenses not directly attributable to a series are allocated based on each series’ relative net assets or number of accounts, depending on the expense.
| 4. | Purchases and Sales of Securities |
For the six months ended April 30, 2016, purchases and sales of securities, other than U.S. Government securities and short-term securities, were $513,747 and $284,057, respectively. There were no purchases or sales of U.S. Government securities.
14
Quality Equity Series
Notes to Financial Statements (continued)
(unaudited)
| 5. | Capital Stock Transactions |
Transactions in shares of Class S and Class I of Quality Equity Series were:
| | | | | | | | | | | | | | | | |
| CLASS S: | | FOR THE SIX MONTHS ENDED 4/30/16 | | | FOR THE PERIOD 6/1/15* TO 10/31/15 | |
| | | SHARES | | | AMOUNT | | | SHARES | | | AMOUNT | |
Sold | | | 24,875 | | | $ | 238,528 | | | | 74,251 | | | $ | 734,399 | |
Reinvested | | | 127 | | | | 1,204 | | | | — | | | | — | |
Repurchased | | | (7,729 | ) | | | (74,845 | ) | | | — | | | | — | |
| | | | | | | | | | | | | | | | |
Total | | | 17,273 | | | $ | 164,887 | | | | 74,251 | | | $ | 734,399 | |
| | | | | | | | | | | | | | | | |
| | | | | | | | | | | | | | | | |
| CLASS I: | | FOR THE SIX MONTHS ENDED 4/30/16 | | | FOR THE PERIOD 6/1/15* TO 10/31/15 | |
| | | SHARES | | | AMOUNT | | | SHARES | | | AMOUNT | |
Sold | | | 326 | | | $ | 3,100 | | | | 50,000 | | | $ | 500,000 | |
Reinvested | | | — | | | | — | | | | — | | | | — | |
Repurchased | | | — | | | | — | | | | — | | | | — | |
| | | | | | | | | | | | | | | | |
Total | | | 326 | | | $ | 3,100 | | | | 50,000 | | | $ | 500,000 | |
| | | | | | | | | | | | | | | | |
*Commencement of operations.
At April 30, 2016, one shareholder account owned 14,418 shares of the Series (10.2% of shares outstanding) valued at $141,726. Substantially all of the Series’ shares represent investments by fiduciary accounts over which the Advisor has sole investment discretion.
The Series may trade in instruments including written and purchased options, forward foreign currency exchange contracts and futures contracts and other derivatives in the normal course of investing activities to assist in managing exposure to various market risks. The Series may be subject to various elements of risk, which may involve, to a varying degree, elements of risk in excess of the amounts recognized for financial statement purposes. These risks include: the risk that changes in the value of a derivative may not correlate perfectly with the underlying asset, rate or index; counterparty credit risk related to over the counter derivative counterparties’ failure to perform under contract terms; liquidity risk related to the lack of a liquid market for these contracts allowing the fund to close out its position(s); and documentation risk relating to disagreement over contract terms. No such investments were held by the Series as of April 30, 2016.
Investing in securities of foreign companies and foreign governments involves special risks and considerations not typically associated with investing in securities of domestic companies and the U.S. Government. These risks include revaluation of currencies and future adverse political and economic developments. Moreover, securities of foreign companies and foreign governments and their markets may be less liquid and their prices more volatile than those of comparable domestic companies and the U.S. Government.
| 8. | Federal Income Tax Information |
The amount and characterization of certain income and capital gains to be distributed are determined in accordance with federal income tax regulations, which may differ from GAAP. The Series may periodically make reclassifications among its capital accounts to reflect income and gains available for distribution (or available capital loss carryovers) under income tax regulations, without impacting the Series’ net asset value. Any such reclassifications are not reflected in the financial highlights.
15
Quality Equity Series
Notes to Financial Statements (continued)
(unaudited)
| 8. | Federal Income Tax Information (continued) |
There were no distributions for the period ended October 31, 2015.
At April 30, 2016, the identified cost of investments for federal income tax purposes, the resulting gross unrealized appreciation and depreciation, and the net unrealized depreciation were as follows:
| | | | |
Cost for federal income tax purposes | | $ | 1,485,901 | |
Unrealized appreciation | | | 50,222 | |
Unrealized depreciation | | | (52,095 | ) |
| | | | |
Net unrealized depreciation | | $ | (1,873 | ) |
| | | | |
16
Quality Equity Series
Renewal of Investment Advisory Agreement
(unaudited)
At the Manning & Napier Fund, Inc. (the “Fund”) Board of Directors’ (the “Board”) meeting, held on November 17, 2015, the Investment Advisory Agreement (the “Agreement”) between the Fund and Manning & Napier Advisors, LLC (the “Advisor”) was considered by the Board for renewal. In connection with the decision whether to renew the Agreement, a variety of material was prepared for and considered by the Board.
Representatives of the Advisor attended the meeting and presented additional oral and written information to the Board to assist the Board in its considerations. The discussion immediately below outlines the materials and information presented to the Board in connection with the Board’s 2015 Annual consideration of the Agreement and the conclusions made by the Directors when determining to continue the Agreement.
| | • | | The Board considered the services provided by the Advisor under the Agreement including, among others: deciding what securities to purchase and sell for each Series; arranging for the purchase and sale of such securities by placing orders with broker-dealers; administering the affairs of the Fund (including the books and records of the Fund not maintained by third party service providers such as the custodian or sub-transfer agent); arranging for the insurance coverage for the Fund; and supervising the preparation of tax returns, SEC filings (including registration statements) and reports to shareholders for the Fund. The Board also considered the nature and quality of such services provided under the Agreement in light of the Advisor’s services provided to the Fund for 29 years. The Board discussed the quality of these services with representatives from the Advisor and concluded that the Advisor was performing its services to the Fund required under the Agreement in a reasonable manner. |
| | • | | The Board considered the performance of each Series since its inception, as well as performance over multiple time periods. Performance for one or more of the following time periods was considered as applicable to the Series’ inception date: inception, three year, five year, ten year, and current market cycle. A market cycle includes periods of both rising and falling markets. Returns for established benchmark indices for each Series were provided. In addition, the Board considered a number of other factors relevant to performance at the meeting (and considers on a quarterly basis) including: a peer group performance analysis consisting of Morningstar universes of mutual funds with similar investment objectives, investment performance of core products, product offerings, performance on an aggregate basis vs. performance over reasonable time periods and the Advisor’s investment process. The Directors acknowledged the challenging performance and discussed the investment process of the Advisor. The Directors confirmed that qualitative factors such as the Advisor’s investment process, including recent enhancements, were an important subset to be considered as part of their consideration of performance. The Board discussed the performance with representatives from the Advisor and concluded that the investment performance of each of the Fund’s Series was reasonable based on the Series’ actual performance and comparative performance, especially for those series with performance over the current market cycle. |
| | • | | The Board considered the costs of the Advisor’s services and the profits of the Advisor as they relate to the Advisor’s services to the Fund under the Agreement. In reviewing the Advisor’s costs and profits, the Board discussed the Advisor’s revenues generated from the Fund (on both an actual and adjusted basis) and its expenses associated with providing the services under the Agreement. In addition, the Board reviewed the Advisor’s expenses associated with Fund activities outside of the Agreement (such as expense reimbursements pursuant to expense caps and payments made by the Advisor to third party platforms on which shares of the Fund are available for purchase). It was noted by representatives of the Advisor that 22 of the 36 active Series of the Fund are currently experiencing expenses above the capped expense ratios, and thus the Advisor is incurring those expenses over the cap. After discussing the above costs and profits, the Board concluded that the Advisor’s profitability relating to its services provided under the Agreement was reasonable. |
| | • | | The Board considered the fees and expenses of the various Series of the Fund. The Advisor presented the advisory fees and total expenses for each Series, including the advisory fee adjusted for any expense waivers or reimbursements (either contractual or voluntary) paid by the Advisor. The advisory fees and expense ratios of each Series were compared to an average (on both a mean and median basis) of similar funds as disclosed on the Morningstar database. Representatives of the Advisor discussed with the Board the levels of its advisory fee for each Series of the Fund and as compared to the median and mean advisory fees for similar funds as listed on Morningstar. Expense ratios for every Series, except the Tax Managed Series, Equity Income Class S, High Yield Bond Class S, Pro-Blend Series Classes C and R, and Target Series’ Classes R and K, are lower than, or substantially similar to the Morningstar mean and median reported total expense ratio. |
17
Quality Equity Series
Renewal of Investment Advisory Agreement
(unaudited)
| | The higher than mean and median total expense ratios for Classes C and R reflect higher distribution, marketing and shareholder service fees payable to broker-dealers through a 100bp 12b-1 fee for Class C and a 50bp 12b-1 fee for Class R. Based on their review of the information provided, the Board concluded that the fees and expenses of each Series of the Fund were reasonable on a comparative basis. |
| | • | | The Board also considered the other benefits the Advisor derives from its relationship with the Fund. Such other benefits include certain research services provided by soft dollars. The Board reviewed the broker-dealers who provided research to the Advisor and the products and services paid for, in whole or in part, using soft dollar commissions. Given the level of soft dollar transactions involving the Fund, the Board concluded that these additional benefits to the Advisor were reasonable. |
| | • | | In addition to the factors described above, the Board considered the Advisor’s personnel, investment strategies, policies and procedures relating to compliance with personal securities transactions, reputation, expertise and resources in domestic and foreign financial markets. The Board concluded that these factors support the conclusion that the Advisor performs its services in a reasonable manner. |
| | • | | The Board then considered economies of scale and concluded that the current fee schedule to the advisory agreement remained reasonable given the multiple uses of the Fund (for the Advisor’s discretionary investment account clients in addition to direct investors), the current profitability of the Advisor’s services to the Fund under the Agreement, the number of newly established series of the Fund and the overall size of the Fund complex. |
Based on the Board’s deliberations and their evaluation of the information described above, the Board, including a majority of Directors that are not “interested persons” as defined in the Investment Company Act of 1940, concluded that the compensation under the Agreement was fair and reasonable in light of the services and expenses and such other matters as the Directors considered to be relevant in the exercise of their reasonable judgment. Accordingly, the Board approved the renewal of the Agreement. In the course of their deliberations, the Directors did not identify any particular information that was all important or controlling.
18
Quality Equity Series
Literature Requests
(unaudited)
| Proxy Voting Policies and Procedures | |
A description of the policies and procedures that the Fund uses to determine how to vote proxies relating to portfolio securities is available, without charge, upon request:
| | | | |
| By phone | | 1-800-466-3863 | | |
| On the Securities and Exchange | | | | |
| Commission’s (SEC) web site | | http://www.sec.gov | | |
Information regarding how the Fund voted proxies relating to portfolio securities during the most recent 12-month period ended June 30th is available, without charge, upon request:
| | | | |
| By phone | | 1-800-466-3863 | | |
| On the SEC’s web site | | http://www.sec.gov | | |
| Quarterly | Portfolio Holdings |
The Series’ complete schedule of portfolio holdings for the 1st and 3rd quarters of each fiscal year are provided on Form N-Q, and are available, without charge, upon request:
| | | | |
| By phone | | 1-800-466-3863 | | |
| On the SEC’s web site | | http://www.sec.gov | | |
The Series’ Form N-Q may be reviewed and copied at the SEC’s Public Reference Room in Washington, D.C. Information on the operation of the Public Reference Room may be obtained by calling 1-800-SEC-0330.
| Prospectus and Statement of Additional Information (SAI) | |
For more information about any of the Manning & Napier Fund, Inc. Series, you may obtain a prospectus and SAI at www.manning-napier.com or by calling (800) 466-3863. Before investing, carefully consider the objectives, risks, charges and expenses of the investment and read the prospectus carefully as it contains this and other information about the investment company. In addition, this information can be found on the SEC’s web site, http://www.sec.gov.
| Additional information available at www.manning-napier.com | |
1. Fund Holdings - Month-End
2. Fund Holdings - Quarter-End
3. Shareholder Report - Annual
4. Shareholder Report - Semi-Annual
The Fund also offers electronic notification or “e-delivery” when certain documents are available on-line to be downloaded or reviewed. Direct shareholders can elect to receive electronic notification when shareholder reports, prospectus updates, and/or statements are available. If you do not currently have on-line access to your account, you can establish access by going to www.manning-napier.com, click on “Login” in the top corner of the page, and follow the prompts to self-enroll. Once enrolled, you can set your electronic notification preferences by clicking on the Account Options tab located within the green toolbar and then select E-Delivery Option. Should you have any questions on either how to establish on-line access or how to update your account settings, please contact Investor Services at 1-800-466-3863.
The Manning & Napier Fund, Inc. is managed by Manning & Napier Advisors, LLC. Manning & Napier Investor Services, Inc., an affiliate of Manning & Napier Advisors, LLC, is the distributor of the Fund shares.
MNQEQ-4/16-SAR
ITEM 2: CODE OF ETHICS
Not applicable for Semi-Annual Reports.
ITEM 3: AUDIT COMMITTEE FINANCIAL EXPERT
Not applicable for Semi-Annual Reports.
ITEM 4: PRINCIPAL ACCOUNTANT FEES AND SERVICES
Not applicable for Semi-Annual Reports.
ITEM 5: AUDIT COMMITTEE OF LISTED REGISTRANTS
Not applicable.
ITEM 6: INVESTMENTS
| (a) | See Investment Portfolios under Item 1 on this Form N-CSR. |
| ITEM 7: | DISCLOSURE OF PROXY VOTING POLICIES AND PROCEDURES FOR CLOSED-END MANAGEMENT INVESTMENT COMPANIES |
Not applicable.
ITEM 8: PORTFOLIO MANAGERS OF CLOSED-END MANAGEMENT INVESTMENT COMPANIES
Not applicable.
| ITEM 9: | PURCHASES OF EQUITY SECURITIES BY CLOSED-END MANAGEMENT INVESTMENT COMPANY AND AFFILIATED PURCHASERS |
Not applicable.
ITEM 10: SUBMISSION OF MATTERS TO A VOTE OF SECURITY HOLDERS
There have been no material changes to the procedure by which shareholders may recommend nominees to the registrant’s board of directors.
ITEM 11: CONTROLS AND PROCEDURES
(a) Based on their evaluation of the Funds’ disclosure controls and procedures, as of a date within 90 days of the filing date, the Funds’ Principal Executive Officer and Principal Financial Officer have concluded that the Funds’ disclosure controls and procedures are: (i) reasonably designed to ensure that information required to be disclosed in this report is appropriately communicated to the Funds’ officers to allow timely decisions regarding disclosures required in this report; (ii) reasonably designed to ensure that information required to be disclosed in this report is recorded, processed, summarized and reported in a timely manner; and (iii) are effective in achieving the goals described in (i) and (ii) above.
(b) During the second fiscal quarter of the period covered by this report, there have been no changes in the Funds’ internal control over financial reporting that the above officers believe to have materially affected, or to be reasonably likely to materially affect, the Funds’ internal control over financial reporting.
ITEM 12: EXHIBITS
| (a)(1) | Not applicable for Semi-Annual Reports. |
| (a)(2) | Separate certifications for the Registrant’s principal executive officer and principal financial officer, as required by Section 302 of the Sarbanes-Oxley Act of 2002 and Rule 30a-2(a) under the Investment Company Act of 1940, are attached as EX-99.CERT. |
| (b) | A certification of the Registrant’s principal executive officer and principal financial officer, as required by 18 U.S.C Section 1350, as adopted pursuant to Section 906 of the Sarbanes-Oxley Act of 2002, and Rule 30a-2(b) under the Investment Company Act of 1940, is attached as EX-99.906CERT. The certification furnished pursuant to this paragraph is not deemed to be “filed” for purposes of Section 18 of the Securities Exchange Act of 1934, or otherwise subject to the liability of that section. Such certification is not deemed to be incorporated by reference into any filing under the Securities Act of 1933 or the Securities Exchange Act of 1934, except to the extent that the Registrant specifically incorporates them by reference. |
SIGNATURES
Pursuant to the requirements of the Securities Exchange Act of 1934 and the Investment Company Act of 1940, the registrant has duly caused this report to be signed on its behalf by the undersigned, thereunto duly authorized.
Manning & Napier Fund, Inc.
| | |
/s/ James Mikolaichik | | |
| James Mikolaichik | | |
| President & Principal Executive Officer of Manning & Napier Fund, Inc. |
| Date: 6/20/16 | | |
Pursuant to the requirements of the Securities Exchange Act of 1934 and the Investment Company Act of 1940, this report has been signed below by the following persons on behalf of the registrant and in the capacities and on the dates indicated.
| | |
/s/ James Mikolaichik | | |
| James Mikolaichik | | |
| President & Principal Executive Officer of Manning & Napier Fund, Inc. |
| Date: 6/20/16 | | |
| |
/s/ Christine Glavin | | |
| Christine Glavin | | |
| Chief Financial Officer & Principal Financial Officer of Manning & Napier Fund, Inc. |
| Date: 6/20/16 | | |